Uncertainty Analysis of the NASA Glenn 8×6 Supersonic … · Uncertainty Analysis of the NASA...
280
Julia Stephens HX5 Sierra, LLC, Cleveland, Ohio Erin Hubbard Jacobs Technology Inc., Cleveland, Ohio Joel Walter Jacobs Technology Inc., Bingham Farms, Michigan Tyler McElroy Jacobs Technology Inc., Tullahoma, Tennessee Uncertainty Analysis of the NASA Glenn 8×6 Supersonic Wind Tunnel NASA/CR—2016-219411 November 2016 https://ntrs.nasa.gov/search.jsp?R=20160013865 2018-07-21T22:04:34+00:00Z
Transcript of Uncertainty Analysis of the NASA Glenn 8×6 Supersonic … · Uncertainty Analysis of the NASA...
Julia StephensHX5 Sierra, LLC, Cleveland, Ohio
Erin HubbardJacobs Technology Inc., Cleveland, Ohio
Joel WalterJacobs Technology Inc., Bingham Farms, Michigan
Tyler McElroyJacobs Technology Inc., Tullahoma, Tennessee
Uncertainty Analysis of the NASA Glenn 8×6 Supersonic Wind Tunnel
NASA/CR—2016-219411
November 2016
https://ntrs.nasa.gov/search.jsp?R=20160013865 2018-07-21T22:04:34+00:00Z

NASA STI Program . . . in Profi le
Since its founding, NASA has been dedicated to the advancement of aeronautics and space science. The NASA Scientifi c and Technical Information (STI) Program plays a key part in helping NASA maintain this important role.
The NASA STI Program operates under the auspices of the Agency Chief Information Offi cer. It collects, organizes, provides for archiving, and disseminates NASA’s STI. The NASA STI Program provides access to the NASA Technical Report Server—Registered (NTRS Reg) and NASA Technical Report Server—Public (NTRS) thus providing one of the largest collections of aeronautical and space science STI in the world. Results are published in both non-NASA channels and by NASA in the NASA STI Report Series, which includes the following report types: • TECHNICAL PUBLICATION. Reports of
completed research or a major signifi cant phase of research that present the results of NASA programs and include extensive data or theoretical analysis. Includes compilations of signifi cant scientifi c and technical data and information deemed to be of continuing reference value. NASA counter-part of peer-reviewed formal professional papers, but has less stringent limitations on manuscript length and extent of graphic presentations.
• TECHNICAL MEMORANDUM. Scientifi c
and technical fi ndings that are preliminary or of specialized interest, e.g., “quick-release” reports, working papers, and bibliographies that contain minimal annotation. Does not contain extensive analysis.
• CONTRACTOR REPORT. Scientifi c and technical fi ndings by NASA-sponsored contractors and grantees.
• CONFERENCE PUBLICATION. Collected papers from scientifi c and technical conferences, symposia, seminars, or other meetings sponsored or co-sponsored by NASA.
• SPECIAL PUBLICATION. Scientifi c,
technical, or historical information from NASA programs, projects, and missions, often concerned with subjects having substantial public interest.
• TECHNICAL TRANSLATION. English-
language translations of foreign scientifi c and technical material pertinent to NASA’s mission.
For more information about the NASA STI program, see the following:
• Access the NASA STI program home page at http://www.sti.nasa.gov
• E-mail your question to [email protected] • Fax your question to the NASA STI
Information Desk at 757-864-6500
• Telephone the NASA STI Information Desk at 757-864-9658 • Write to:
NASA STI Program Mail Stop 148 NASA Langley Research Center Hampton, VA 23681-2199
Julia StephensHX5 Sierra, LLC, Cleveland, Ohio
Erin HubbardJacobs Technology Inc., Cleveland, Ohio
Joel WalterJacobs Technology Inc., Bingham Farms, Michigan
Tyler McElroyJacobs Technology Inc., Tullahoma, Tennessee
Uncertainty Analysis of the NASA Glenn 8×6 Supersonic Wind Tunnel
NASA/CR—2016-219411
November 2016
National Aeronautics andSpace Administration
Glenn Research CenterCleveland, Ohio 44135
Prepared under Contract NNC15BA02B
Available from
Trade names and trademarks are used in this report for identifi cation only. Their usage does not constitute an offi cial endorsement, either expressed or implied, by the National Aeronautics and
Space Administration.
Level of Review: This material has been technically reviewed by NASA technical management OR expert reviewer(s).
NASA STI ProgramMail Stop 148NASA Langley Research CenterHampton, VA 23681-2199
National Technical Information Service5285 Port Royal RoadSpringfi eld, VA 22161
703-605-6000
This report is available in electronic form at http://www.sti.nasa.gov/ and http://ntrs.nasa.gov/
Contents
List of Figures . . . . . . . . . . . . . . . . . . . . . . . . . . . . . . . . . . . . . . ivList of Tables . . . . . . . . . . . . . . . . . . . . . . . . . . . . . . . . . . . . . . vii1 Abstract . . . . . . . . . . . . . . . . . . . . . . . . . . . . . . . . . . . . . . 12 Introduction . . . . . . . . . . . . . . . . . . . . . . . . . . . . . . . . . . . . 53 Background Information . . . . . . . . . . . . . . . . . . . . . . . . . . . . . 6
3.1 Description of 8- by 6-foot Supersonic Wind Tunnel . . . . . . . . . . 63.2 Calibration Procedure . . . . . . . . . . . . . . . . . . . . . . . . . . 6
3.2.1 Calibration Instrumentation . . . . . . . . . . . . . . . . . . 93.2.2 Calibration Curves . . . . . . . . . . . . . . . . . . . . . . . 12
3.3 Data Reduction . . . . . . . . . . . . . . . . . . . . . . . . . . . . . . 134 Measurement Uncertainty Analysis Overview . . . . . . . . . . . . . . . . . . 16
4.1 Random and Systematic Errors . . . . . . . . . . . . . . . . . . . . . 164.2 Uncertainty Propagation . . . . . . . . . . . . . . . . . . . . . . . . . 174.3 Uncertainty Models . . . . . . . . . . . . . . . . . . . . . . . . . . . . 25
5 Results . . . . . . . . . . . . . . . . . . . . . . . . . . . . . . . . . . . . . . . 295.1 Random Uncertainty Results . . . . . . . . . . . . . . . . . . . . . . . 30
5.1.1 Mach Number . . . . . . . . . . . . . . . . . . . . . . . . . 305.1.2 Static Pressure . . . . . . . . . . . . . . . . . . . . . . . . . 315.1.3 Total Pressure . . . . . . . . . . . . . . . . . . . . . . . . . 335.1.4 Dynamic Pressure . . . . . . . . . . . . . . . . . . . . . . . 355.1.5 Total Temperature . . . . . . . . . . . . . . . . . . . . . . . 365.1.6 Static Temperature . . . . . . . . . . . . . . . . . . . . . . . 385.1.7 Reynolds Number . . . . . . . . . . . . . . . . . . . . . . . 405.1.8 Air Speed . . . . . . . . . . . . . . . . . . . . . . . . . . . . 41
5.2 Systematic Uncertainty Results . . . . . . . . . . . . . . . . . . . . . 435.2.1 Mach Number . . . . . . . . . . . . . . . . . . . . . . . . . 435.2.2 Static Pressure . . . . . . . . . . . . . . . . . . . . . . . . . 455.2.3 Total Pressure . . . . . . . . . . . . . . . . . . . . . . . . . 465.2.4 Dynamic Pressure . . . . . . . . . . . . . . . . . . . . . . . 485.2.5 Total Temperature . . . . . . . . . . . . . . . . . . . . . . . 505.2.6 Static Temperature . . . . . . . . . . . . . . . . . . . . . . . 515.2.7 Reynolds Number . . . . . . . . . . . . . . . . . . . . . . . 555.2.8 Air Speed . . . . . . . . . . . . . . . . . . . . . . . . . . . . 57
5.3 Total Uncertainty Results . . . . . . . . . . . . . . . . . . . . . . . . 595.3.1 Mach Number . . . . . . . . . . . . . . . . . . . . . . . . . 595.3.2 Static Pressure . . . . . . . . . . . . . . . . . . . . . . . . . 605.3.3 Total Pressure . . . . . . . . . . . . . . . . . . . . . . . . . 635.3.4 Dynamic Pressure . . . . . . . . . . . . . . . . . . . . . . . 645.3.5 Static Temperature . . . . . . . . . . . . . . . . . . . . . . . 655.3.6 Total Temperature . . . . . . . . . . . . . . . . . . . . . . . 685.3.7 Reynolds Number . . . . . . . . . . . . . . . . . . . . . . . 695.3.8 Air Speed . . . . . . . . . . . . . . . . . . . . . . . . . . . . 70
NASA/CR—2016-219411 i
6 Analysis . . . . . . . . . . . . . . . . . . . . . . . . . . . . . . . . . . . . . . 736.1 Elemental Uncertainty Estimates . . . . . . . . . . . . . . . . . . . . 73
6.1.1 Instrumentation Level Uncertainty . . . . . . . . . . . . . . 736.1.2 Uncertainty due to Calibrations of Free Stream Quantities . 776.1.3 Random Uncertainty in Test Section Calibration Measurements 776.1.4 Random Uncertainty in Facility Measured Values . . . . . . 806.1.5 Spatial Uniformity Uncertainty . . . . . . . . . . . . . . . . 846.1.6 Regression Uncertainty . . . . . . . . . . . . . . . . . . . . . 87
6.2 Monte Carlo Simulation . . . . . . . . . . . . . . . . . . . . . . . . . 896.2.1 Populating Errors due to Random, Systematic, and Corre-
lated Systematic Uncertainty . . . . . . . . . . . . . . . . . 926.2.2 Comparing Simulation Results with Direct Calculations . . 98
6.3 Analysis Limitations . . . . . . . . . . . . . . . . . . . . . . . . . . . 987 What-If Scenarios . . . . . . . . . . . . . . . . . . . . . . . . . . . . . . . . . 99
7.1 Splitting the Static Pressure Calibration Curve by Flow Regime . . . 997.2 Obtaining More Repeat Data During Static Pressure Calibration or
Use of a Look-up Table . . . . . . . . . . . . . . . . . . . . . . . . . . 1017.3 Using Static Pressure Calibration Data From Different Sources (Tran-
sonic Array vs. Cone-Cylinder) . . . . . . . . . . . . . . . . . . . . . 1037.4 Replacing Current Pressure Instrumentation with Higher Accuracy In-
strumentation . . . . . . . . . . . . . . . . . . . . . . . . . . . . . . . 1057.5 Replacing Current Temperature Instrumentation with Higher Accu-
racy Instrumentation . . . . . . . . . . . . . . . . . . . . . . . . . . . 1058 Conclusions . . . . . . . . . . . . . . . . . . . . . . . . . . . . . . . . . . . . 1099 References . . . . . . . . . . . . . . . . . . . . . . . . . . . . . . . . . . . . . 113Appendices . . . . . . . . . . . . . . . . . . . . . . . . . . . . . . . . . . . . . . . 115List of Figures in Appendices . . . . . . . . . . . . . . . . . . . . . . . . . . . . . 115List of Tables in Appendices . . . . . . . . . . . . . . . . . . . . . . . . . . . . . . 117Appendix A: Uncertainty Contributions to Calibrations . . . . . . . . . . . . . . . 121
A.1 Static Pressure Calibration . . . . . . . . . . . . . . . . . . . . . . . . 121A.2 Total Pressure Calibration . . . . . . . . . . . . . . . . . . . . . . . . 127A.3 Total Temperature Calibration . . . . . . . . . . . . . . . . . . . . . 134
Appendix B: Mach Number Uncertainty . . . . . . . . . . . . . . . . . . . . . . . 140B.1 Random Uncertainty Results for Configurations 2-6 . . . . . . . . . . 143B.2 Systematic Uncertainty Results for Configurations 2-6 . . . . . . . . . 148B.3 Total Uncertainty Results for Configurations 2-6 . . . . . . . . . . . . 153
Appendix C: Static Pressure Uncertainty . . . . . . . . . . . . . . . . . . . . . . . 157C.1 Random Uncertainty Results for Configurations 2-6 . . . . . . . . . . 159C.2 Systematic Uncertainty Results for Configurations 2-6 . . . . . . . . . 164C.3 Total Uncertainty Results for Configurations 2-6 . . . . . . . . . . . . 164
Appendix D: Total Pressure Uncertainty . . . . . . . . . . . . . . . . . . . . . . . 172D.1 Random Uncertainty Results for Configurations 2-6 . . . . . . . . . . 174D.2 Systematic Uncertainty Results for Configurations 2-6 . . . . . . . . . 179D.3 Total Uncertainty Results for Configurations 2-6 . . . . . . . . . . . . 184
Appendix E: Dynamic Pressure Uncertainty . . . . . . . . . . . . . . . . . . . . . 188
NASA/CR—2016-219411 ii
E.1 Random Uncertainty Results for Configurations 2-6 . . . . . . . . . . 188E.2 Systematic Uncertainty Results for Configurations 2-6 . . . . . . . . . 194E.3 Total Uncertainty Results for Configurations 2-6 . . . . . . . . . . . . 199
Appendix F: Total Temperature Uncertainty . . . . . . . . . . . . . . . . . . . . . 203F.1 Random Uncertainty Results for Configurations 2-6 . . . . . . . . . . 203F.2 Systematic Uncertainty Results for Configurations 2-6 . . . . . . . . . 208F.3 Total Uncertainty Results for Configurations 2-6 . . . . . . . . . . . . 212
Appendix G: Static Temperature Uncertainty . . . . . . . . . . . . . . . . . . . . 216G.1 Random Uncertainty Results for Configurations 2-6 . . . . . . . . . . 216G.2 Systematic Uncertainty Results for Configurations 2-6 . . . . . . . . . 222G.3 Total Uncertainty Results for Configurations 2-6 . . . . . . . . . . . . 227
Appendix H: Reynolds Number Uncertainty . . . . . . . . . . . . . . . . . . . . . 231H.1 Random Uncertainty Results for Configurations 2-6 . . . . . . . . . . 231H.2 Systematic Uncertainty Results for Configurations 2-6 . . . . . . . . . 237H.3 Total Uncertainty Results for Configurations 2-6 . . . . . . . . . . . . 242
Appendix I: Free Stream Air Speed Uncertainty . . . . . . . . . . . . . . . . . . . 246I.1 Random Uncertainty Results for Configurations 2-6 . . . . . . . . . . 246I.2 Systematic Uncertainty Results for Configurations 2-6 . . . . . . . . . 252I.3 Total Uncertainty Results for Configurations 2-6 . . . . . . . . . . . . 257
Appendix J: Spatial Uniformity Considerations . . . . . . . . . . . . . . . . . . . 261Appendix K: Instrumentation Uncertainty Breakdown . . . . . . . . . . . . . . . 265
K.1 Pressure Instrumentation System . . . . . . . . . . . . . . . . . . . . 265K.2 Temperature Instrumentation System . . . . . . . . . . . . . . . . . . 265
NASA/CR—2016-219411 iii
List of Figures
Figure 1 – Overview of 8- by 6-foot Supersonic Wind Tunnel. . . . . . . . . . 7Figure 2 – Schematic 8- by 6-foot test section. . . . . . . . . . . . . . . . . . . 8Figure 3 – Rakes as installed in the bellmouth. . . . . . . . . . . . . . . . . . 8Figure 4 – Calibration instrumentation: Cone-cylinder . . . . . . . . . . . . . 9Figure 5 – Calibration instrumentation: Transonic array . . . . . . . . . . . . 10Figure 6 – Schematic of transonic array mounting . . . . . . . . . . . . . . . . 11Figure 7 – Schematic of transonic array axial placements . . . . . . . . . . . . 11Figure 8 – Mach number data flow chart, subsonic flow range . . . . . . . . . 14Figure 9 – Mach number data flow chart, supersonic flow range . . . . . . . . 15Figure 10 – Systematic vs. random errors . . . . . . . . . . . . . . . . . . . . . 16Figure 11 – Total pressure calibration uncertainty flow chart, subsonic flow range 19Figure 12 – Total pressure calibration uncertainty flow chart, supersonic flow
range . . . . . . . . . . . . . . . . . . . . . . . . . . . . . . . . . . 20Figure 13 – Static pressure calibration uncertainty flow chart . . . . . . . . . . 21Figure 14 – Mach number uncertainty flow chart, subsonic flow range . . . . . 22Figure 15 – Mach number uncertainty flow chart, supersonic flow range . . . . 23Figure 16 – Total temperature calibration uncertainty flow chart . . . . . . . . 24Figure 17 – Monte Carlo simulation pseudo-code showing error population and
propagation . . . . . . . . . . . . . . . . . . . . . . . . . . . . . . . 28Figure 18 – Random uncertainty in Mts, configuration 1 . . . . . . . . . . . . . 30Figure 19 – Random UPC for Mts, configuration 1 . . . . . . . . . . . . . . . . 31Figure 20 – Random uncertainty in PS,ts, configuration 1 . . . . . . . . . . . . 32Figure 21 – Random UPC for PS,ts, configuration 1 . . . . . . . . . . . . . . . 32Figure 22 – Random uncertainty in PT,ts, configuration 1 . . . . . . . . . . . . 34Figure 23 – Random UPC for PT,ts, configuration 1 . . . . . . . . . . . . . . . 34Figure 24 – Random uncertainty of qts, configuration 1 . . . . . . . . . . . . . 35Figure 25 – Random UPC for qts, configuration 1 . . . . . . . . . . . . . . . . . 36Figure 26 – Random uncertainty in TT,ts, configuration 1 . . . . . . . . . . . . 37Figure 27 – Random UPC for TT,ts, configuration 1 . . . . . . . . . . . . . . . . 37Figure 28 – Random uncertainty in TS,ts, configuration 1 . . . . . . . . . . . . 39Figure 29 – Random UPC for TS,ts, configuration 1 . . . . . . . . . . . . . . . . 39Figure 30 – Random uncertainty in Rets, configuration 1 . . . . . . . . . . . . 40Figure 31 – Random UPC for Rets, configuration 1 . . . . . . . . . . . . . . . . 41Figure 32 – Random uncertainty of Uts, configuration 1 . . . . . . . . . . . . . 42Figure 33 – Random uncertainty for Uts, configuration 1 . . . . . . . . . . . . . 42Figure 34 – Systematic uncertainty in Mts, configuration 1 . . . . . . . . . . . 44Figure 35 – Systematic UPC for Mts, configuration 1 . . . . . . . . . . . . . . . 44Figure 36 – Systematic uncertainty in PS,ts, configuration 1 . . . . . . . . . . . 45Figure 37 – Systematic UPC for PS,ts, configuration 1 . . . . . . . . . . . . . . 46Figure 38 – Systematic uncertainty of PT,ts, configuration 1 . . . . . . . . . . . 47Figure 39 – Systematic UPC for PT,ts, configuration 1 . . . . . . . . . . . . . . 47Figure 40 – Systematic uncertainty of qts, configuration 1 . . . . . . . . . . . . 48
NASA/CR—2016-219411 iv
Figure 41 – Systematic UPC for qts, configuration 1 . . . . . . . . . . . . . . . 49Figure 42 – Systematic uncertainty in TT,ts, configuration 1 . . . . . . . . . . . 50Figure 43 – Systematic UPC for TT,ts, configuration 1 . . . . . . . . . . . . . . 51Figure 44 – Systematic uncertainty in TS,ts, configuration 1 . . . . . . . . . . . 52Figure 45 – Systematic UPC for TS,ts, configuration 1 . . . . . . . . . . . . . . 53Figure 46 – Systematic uncertainty of Rets, configuration 1 . . . . . . . . . . . 55Figure 47 – Systematic UPC for Rets, configuration 1 . . . . . . . . . . . . . . 56Figure 48 – Systematic uncertainty of Uts, configuration 1 . . . . . . . . . . . . 57Figure 49 – Systematic UPC for Uts, configuration 1 . . . . . . . . . . . . . . . 58Figure 50 – Total uncertainty in Mts, configuration 1 . . . . . . . . . . . . . . . 59Figure 51 – UPC in Mts, configuration 1 . . . . . . . . . . . . . . . . . . . . . 60Figure 52 – Total uncertainty in PS,ts, configuration 1 . . . . . . . . . . . . . . 61Figure 53 – UPC in PS,ts, configuration 1 . . . . . . . . . . . . . . . . . . . . . 61Figure 54 – Total uncertainty of PT,ts, configuration 1 . . . . . . . . . . . . . . 63Figure 55 – UPC in PT,ts, configuration 1 . . . . . . . . . . . . . . . . . . . . . 63Figure 56 – Total uncertainty in qts, configuration 1 . . . . . . . . . . . . . . . 64Figure 57 – UPC in qts, configuration 1 . . . . . . . . . . . . . . . . . . . . . . 65Figure 58 – Total uncertainty in TS,ts, configuration 1 . . . . . . . . . . . . . . 66Figure 59 – UPC in TS,ts, configuration 1 . . . . . . . . . . . . . . . . . . . . . 66Figure 60 – Total uncertainty of TT,ts, configuration 1 . . . . . . . . . . . . . . 68Figure 61 – UPC in TT,ts, configuration 1 . . . . . . . . . . . . . . . . . . . . . 68Figure 62 – Total uncertainty in Rets, configuration 1 . . . . . . . . . . . . . . 69Figure 63 – UPC in Rts, configuration 1 . . . . . . . . . . . . . . . . . . . . . . 70Figure 64 – Total uncertainty in Uts, configuration 1 . . . . . . . . . . . . . . . 71Figure 65 – UPC in Uts, configuration 1 . . . . . . . . . . . . . . . . . . . . . . 71Figure 66 – Instrumentation level uncertainty analysis flow. . . . . . . . . . . . 74Figure 67 – Systematic standard uncertainty of a pressure measurement . . . . 74Figure 68 – Systematic standard uncertainty of Pbar measurement. . . . . . . . 75Figure 69 – Systematic uncertainty of a temperature measurement (Type E) . 75Figure 70 – Correlated systematic uncertainty of a temperature measurement . 76Figure 71 – Systematic uncertainty of a temperature measurement (Type K) . 76Figure 72 – Correlated systematic uncertainty of a temperature measurement . 76Figure 73 – Standard deviations of transonic array pressures, configuration 1 . 79Figure 74 – Random standard uncertainty in test section static and total pressure 79Figure 75 – Random standard uncertainty in TT,arr . . . . . . . . . . . . . . . . 80Figure 76 – Standard deviation of TT,bm,
◦R, configuration 1. . . . . . . . . . . 80Figure 77 – Random standard uncertainty of TT,bm in ◦R for configuration 1. . 81Figure 78 – Standard deviations of PT,bm and PS,bal for configuration 1. . . . . . 81Figure 79 – Relationship between PS,bal and PT,bm, configuration 1 . . . . . . . 82Figure 80 – Standard deviations of PT,bm and PS,bal using residuals . . . . . . . 83Figure 81 – Random standard uncertainty of Φ for configuration 1 . . . . . . . 83Figure 82 – Random standard uncertainty of facility pressures for configuration 1 84Figure 83 – Static pressure spatial uniformity standard uncertainty estimate for
configuration 1 . . . . . . . . . . . . . . . . . . . . . . . . . . . . . 85Figure 84 – Spatial uniformity standard uncertainty in PT,arr for configuration 1 86
NASA/CR—2016-219411 v
Figure 85 – Corrected temperature spatial uniformity standard uncertainty . . 87Figure 86 – Overview of Monte Carlo Simulation for Uncertainty Analysis . . . 91Figure 87 – Overview of error population for different uncertainty types . . . . 92Figure 88 – Current static pressure calibration curve . . . . . . . . . . . . . . . 100Figure 89 – Proposed static pressure calibration curves . . . . . . . . . . . . . 100Figure 90 – Systematic uncertainty in Mach: Split static pressure calibration
curve . . . . . . . . . . . . . . . . . . . . . . . . . . . . . . . . . . 101Figure 91 – Systematic uncertainty in Mach: Add repeat data to static pressure
calibration . . . . . . . . . . . . . . . . . . . . . . . . . . . . . . . 102Figure 92 – Systematic uncertainty in Mach: Combine Scenarios 1 and 2 or use
look-up table . . . . . . . . . . . . . . . . . . . . . . . . . . . . . . 103Figure 93 – Array static pressure calibration curve . . . . . . . . . . . . . . . . 104Figure 94 – Mach uncertainty: Effect of different static pressure data sources . 105Figure 95 – Mach uncertainty: Effect of improving instrumentation . . . . . . . 106Figure 96 – Total Temperature uncertainty: Effect of improving instrumentation 107Figure 97 – Total Temperature uncertainty: Original UPC . . . . . . . . . . . 107Figure 98 – Total Temperature uncertainty: New UPC showing effect of improv-
ing instrumentation . . . . . . . . . . . . . . . . . . . . . . . . . . 108
NASA/CR—2016-219411 vi
List of Tables
Table 1 – Summary of Random Uncertainty . . . . . . . . . . . . . . . . . . 2Table 2 – Summary of Systematic Uncertainty . . . . . . . . . . . . . . . . . 2Table 3 – Test section configuration descriptions . . . . . . . . . . . . . . . . 6Table 4 – Mach Number, Random Unc., Configuration 1 . . . . . . . . . . . 31Table 5 – Static Pressure, Random Unc., Configuration 1 . . . . . . . . . . . 33Table 6 – Total Pressure, Random Unc., Configuration 1 . . . . . . . . . . . 35Table 7 – Dynamic Pressure, Random Unc., Configuration 1 . . . . . . . . . 36Table 8 – Total Temperature, Random Unc., Configuration 1 . . . . . . . . . 38Table 9 – Static Temperature, Random Unc., Configuration 1 . . . . . . . . . 40Table 10 – Reynolds Number, Random Unc., Configuration 1 . . . . . . . . . 41Table 11 – Free stream Air Speed, Random Unc., Configuration 1 . . . . . . . 43Table 12 – Mach Number, Systematic Unc., Configuration 1 . . . . . . . . . . 45Table 13 – Static Pressure, Systematic Unc., Configuration 1 . . . . . . . . . . 46Table 14 – Total Pressure, Systematic Unc., Configuration 1 . . . . . . . . . . 48Table 15 – Dynamic Pressure, Systematic Unc., Configuration 1 . . . . . . . . 49Table 16 – Total Temperature, Systematic Unc., Configuration 1 . . . . . . . . 51Table 17 – Static Temperature, Systematic Unc., Configuration 1 . . . . . . . 54Table 18 – Reynolds Number, Systematic Unc., Configuration 1 . . . . . . . . 56Table 19 – Free stream Air Speed, Systematic Unc., Configuration 1 . . . . . . 58Table 20 – Mach Number, Total Unc., Configuration 1 . . . . . . . . . . . . . 60Table 21 – Static Pressure, Total Unc., Configuration 1 . . . . . . . . . . . . . 62Table 22 – Total Pressure, Total Unc., Configuration 1 . . . . . . . . . . . . . 64Table 23 – Dynamic Pressure, Total Unc., Configuration 1 . . . . . . . . . . . 65Table 24 – Static Temperature, Total Unc., Configuration 1 . . . . . . . . . . 67Table 25 – Total Temperature, Total Unc., Configuration 1 . . . . . . . . . . . 69Table 26 – Reynolds Number, Total Unc., Configuration 1 . . . . . . . . . . . 70Table 27 – Free stream Air Speed, Total Unc., Configuration 1 . . . . . . . . . 72Table 28 – Values for statistical estimation factor d2(n) for n samples . . . . . 78Table 29 – Random uncertainty error population example . . . . . . . . . . . 93Table 30 – Systematic uncertainty error population example . . . . . . . . . . 94Table 31 – Correlated systematic uncertainty error population example . . . . 96Table 32 – Correlated systematic uncertainty error population example . . . . 97Table 33 – Summary of Random Uncertainty and Primary Contributors . . . 110Table 34 – Summary of Systematic Uncertainty and Primary Contributors . . 110Table 35 – Summary of What-If Scenarios . . . . . . . . . . . . . . . . . . . . 111Table 36 – Summary of uncertainty mitigation factors . . . . . . . . . . . . . . 112
NASA/CR—2016-219411 vii
1 Abstract
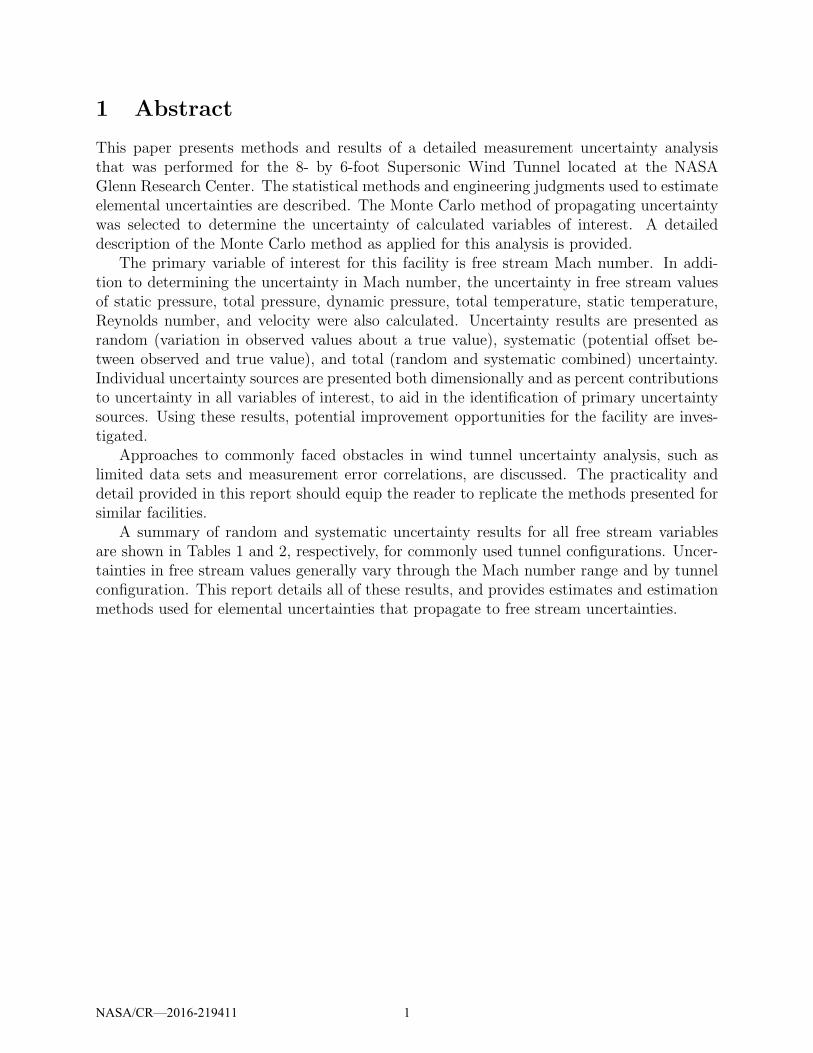
This paper presents methods and results of a detailed measurement uncertainty analysisthat was performed for the 8- by 6-foot Supersonic Wind Tunnel located at the NASAGlenn Research Center. The statistical methods and engineering judgments used to estimateelemental uncertainties are described. The Monte Carlo method of propagating uncertaintywas selected to determine the uncertainty of calculated variables of interest. A detaileddescription of the Monte Carlo method as applied for this analysis is provided.
The primary variable of interest for this facility is free stream Mach number. In addi-tion to determining the uncertainty in Mach number, the uncertainty in free stream valuesof static pressure, total pressure, dynamic pressure, total temperature, static temperature,Reynolds number, and velocity were also calculated. Uncertainty results are presented asrandom (variation in observed values about a true value), systematic (potential offset be-tween observed and true value), and total (random and systematic combined) uncertainty.Individual uncertainty sources are presented both dimensionally and as percent contributionsto uncertainty in all variables of interest, to aid in the identification of primary uncertaintysources. Using these results, potential improvement opportunities for the facility are inves-tigated.
Approaches to commonly faced obstacles in wind tunnel uncertainty analysis, such aslimited data sets and measurement error correlations, are discussed. The practicality anddetail provided in this report should equip the reader to replicate the methods presented forsimilar facilities.
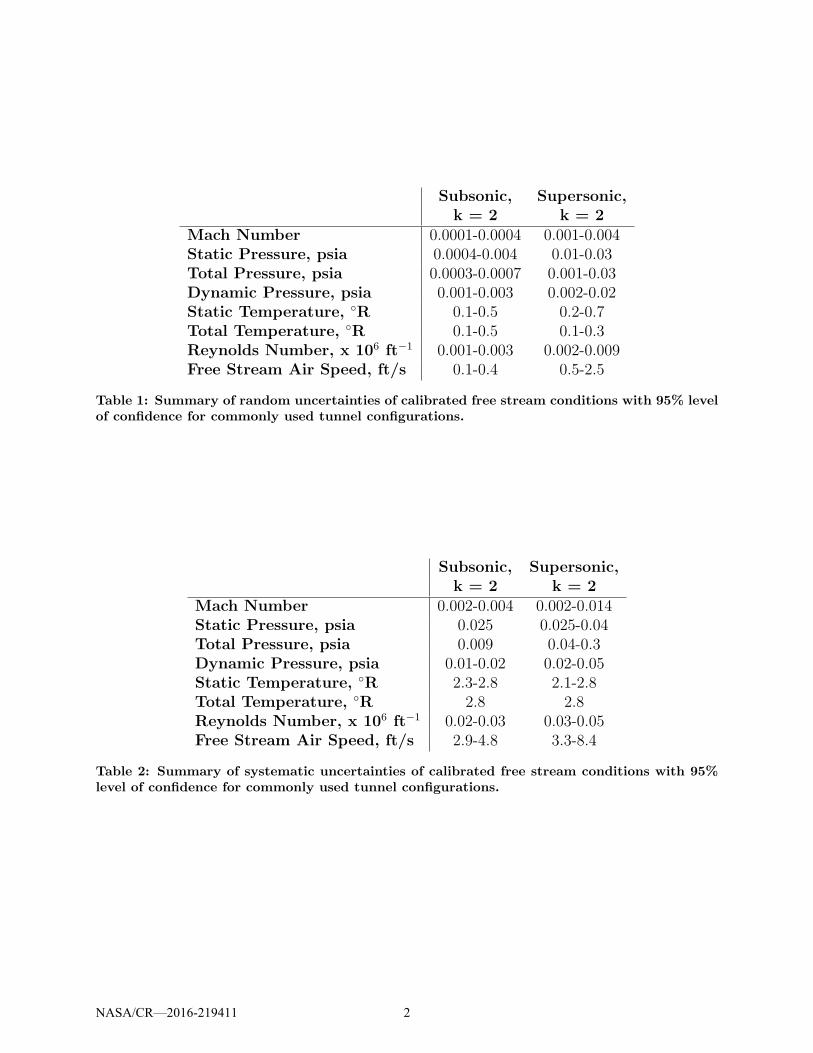
A summary of random and systematic uncertainty results for all free stream variablesare shown in Tables 1 and 2, respectively, for commonly used tunnel configurations. Uncer-tainties in free stream values generally vary through the Mach number range and by tunnelconfiguration. This report details all of these results, and provides estimates and estimationmethods used for elemental uncertainties that propagate to free stream uncertainties.
NASA/CR—2016-219411 1
Subsonic, Supersonic,k = 2 k = 2
Mach Number 0.0001-0.0004 0.001-0.004Static Pressure, psia 0.0004-0.004 0.01-0.03Total Pressure, psia 0.0003-0.0007 0.001-0.03Dynamic Pressure, psia 0.001-0.003 0.002-0.02Static Temperature, ◦R 0.1-0.5 0.2-0.7Total Temperature, ◦R 0.1-0.5 0.1-0.3Reynolds Number, x 106 ft−1 0.001-0.003 0.002-0.009Free Stream Air Speed, ft/s 0.1-0.4 0.5-2.5
Table 1: Summary of random uncertainties of calibrated free stream conditions with 95% levelof confidence for commonly used tunnel configurations.
Subsonic, Supersonic,k = 2 k = 2
Mach Number 0.002-0.004 0.002-0.014Static Pressure, psia 0.025 0.025-0.04Total Pressure, psia 0.009 0.04-0.3Dynamic Pressure, psia 0.01-0.02 0.02-0.05Static Temperature, ◦R 2.3-2.8 2.1-2.8Total Temperature, ◦R 2.8 2.8Reynolds Number, x 106 ft−1 0.02-0.03 0.03-0.05Free Stream Air Speed, ft/s 2.9-4.8 3.3-8.4
Table 2: Summary of systematic uncertainties of calibrated free stream conditions with 95%level of confidence for commonly used tunnel configurations.
NASA/CR—2016-219411 2
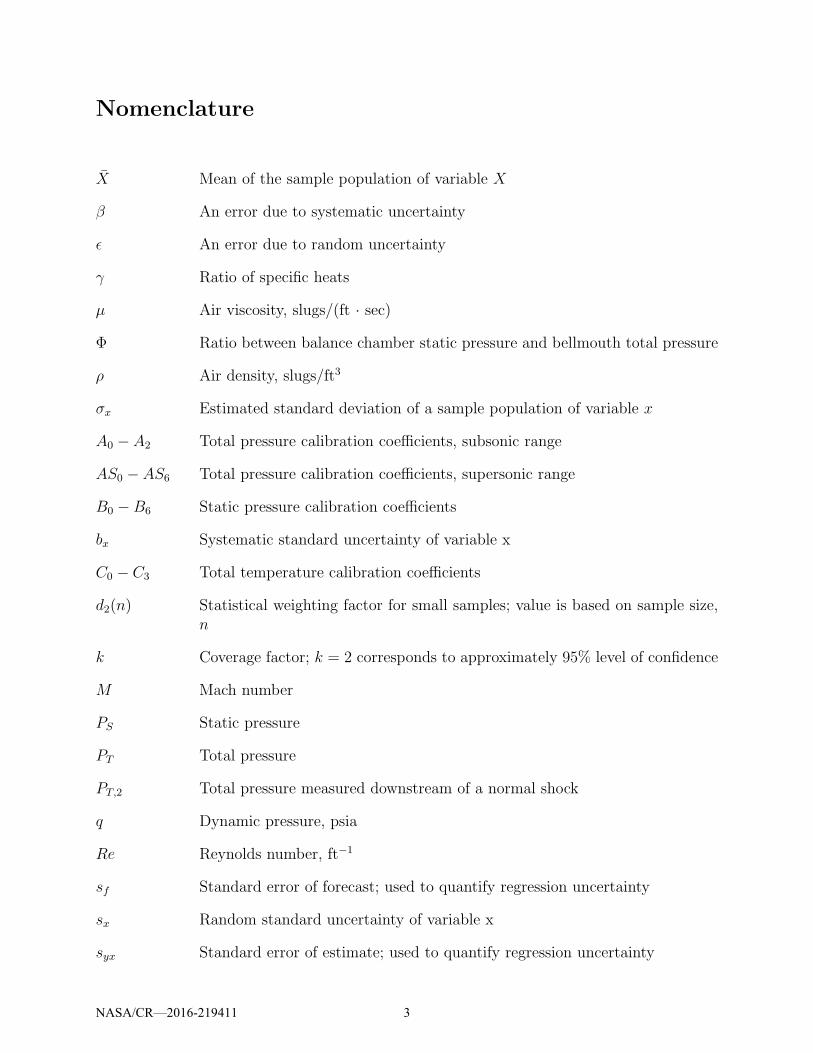
Nomenclature
X Mean of the sample population of variable X
β An error due to systematic uncertainty
ǫ An error due to random uncertainty
γ Ratio of specific heats
µ Air viscosity, slugs/(ft · sec)
Φ Ratio between balance chamber static pressure and bellmouth total pressure
ρ Air density, slugs/ft3
σx Estimated standard deviation of a sample population of variable x
A0 − A2 Total pressure calibration coefficients, subsonic range
AS0 − AS6 Total pressure calibration coefficients, supersonic range
B0 −B6 Static pressure calibration coefficients
bx Systematic standard uncertainty of variable x
C0 − C3 Total temperature calibration coefficients
d2(n) Statistical weighting factor for small samples; value is based on sample size,n
k Coverage factor; k = 2 corresponds to approximately 95% level of confidence
M Mach number
PS Static pressure
PT Total pressure
PT,2 Total pressure measured downstream of a normal shock
q Dynamic pressure, psia
Re Reynolds number, ft−1
sf Standard error of forecast; used to quantify regression uncertainty
sx Random standard uncertainty of variable x
syx Standard error of estimate; used to quantify regression uncertainty
NASA/CR—2016-219411 3
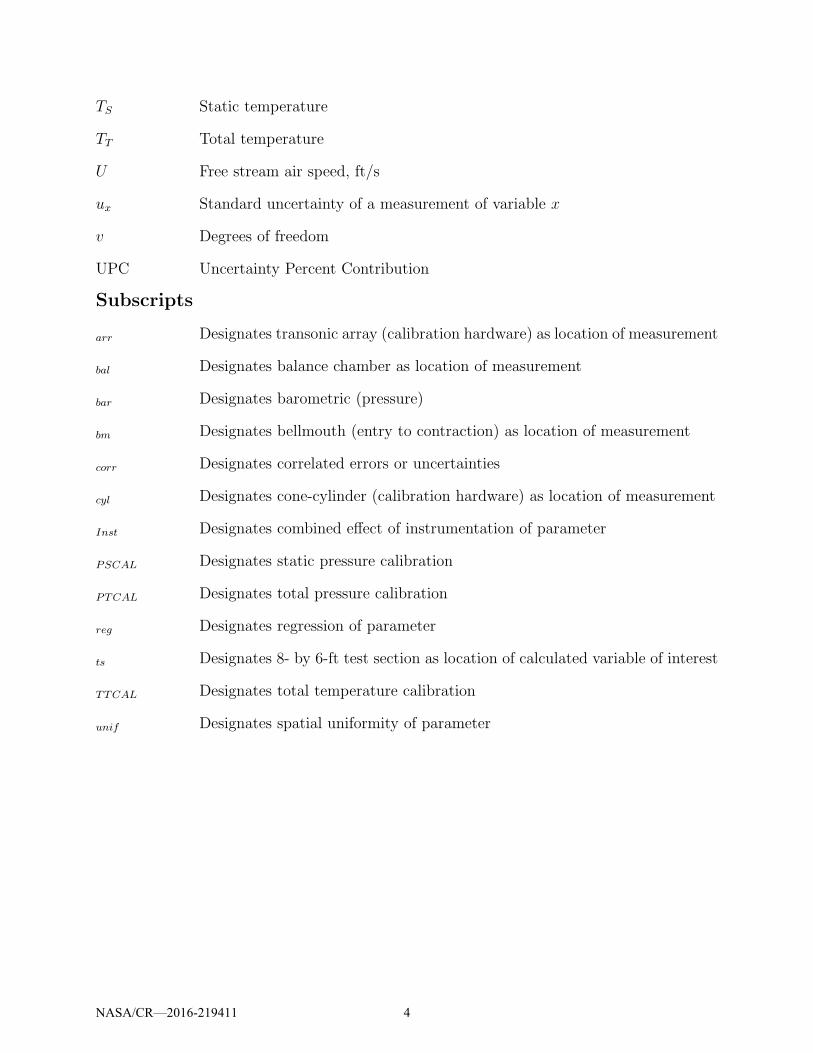
TS Static temperature
TT Total temperature
U Free stream air speed, ft/s
ux Standard uncertainty of a measurement of variable x
v Degrees of freedom
UPC Uncertainty Percent Contribution
Subscripts
arr Designates transonic array (calibration hardware) as location of measurement
bal Designates balance chamber as location of measurement
bar Designates barometric (pressure)
bm Designates bellmouth (entry to contraction) as location of measurement
corr Designates correlated errors or uncertainties
cyl Designates cone-cylinder (calibration hardware) as location of measurement
Inst Designates combined effect of instrumentation of parameter
PSCAL Designates static pressure calibration
PTCAL Designates total pressure calibration
reg Designates regression of parameter
ts Designates 8- by 6-ft test section as location of calculated variable of interest
TTCAL Designates total temperature calibration
unif Designates spatial uniformity of parameter
NASA/CR—2016-219411 4
2 Introduction
As advancements in science and engineering continue, the measurable desired improvementsto technology become smaller. For example, an aircraft engine company may hope to achievea 1% increase in efficiency with design changes. To measure such improvements, it is criticalthat the actual value of measurements are known to within these small boundaries.
Researchers continue to inquire about the uncertainties of measurements and calculationsprovided by facilities in which they perform tests. Depending on the type of test being per-formed, different aspects of uncertainty may be of interest. For example, researchers wishingto compare test results with CFD results will care about facility bias, while researcherslooking for small measurement changes corresponding to design modifications may be moreconcerned with facility repeatability. Due to this desire by researchers to understand facilityuncertainties, an effort is underway at the NASA Glenn Research Center to quantify andcharacterize the uncertainties of variables of interest at facilities within the testing division.
Uncertainty analysis is a continually evolving field. As interest in the analysis processgrows and computational processing improves, the practice continues to be refined. Recom-mended practices for uncertainty analysis include ASME’s Test Uncertainty Standard [1],AIAA’s Standard for Wind Tunnel Test Uncertainty [2], ISO’s Guide to the Expression ofUncertainty in Measurement [3], and NASA’s Measurement Uncertainty Analysis Principlesand Methods Handbook [4]. These are all useful resources when exploring uncertainty andwere used heavily to develop this analysis.
This paper details the measurement uncertainty analysis performed for the NASA Glenn8- by 6-foot Supersonic Wind Tunnel (SWT). Data used for this analysis was obtainedduring a calibration in 1996-1997 [5]. The uncertainty analysis was performed in 2014-2015.The objective was to determine the uncertainty in the free stream Mach number, as wellas uncertainties in other free stream variables of interest (static pressure, total pressure,dynamic pressure, static temperature, total temperature, Reynolds number, and velocity).In addition to determining the overall uncertainties, the elemental contributors that drivethese uncertainties were also identified. These broken down results were ultimately used todevelop scenarios to improve the free stream Mach number uncertainty.
The document begins by providing background information on the facility. This includesa brief description of the facility and how it operates, as well as the calibration procedureused to define the free stream conditions. Next, the uncertainty sources considered in thisanalysis are defined, and a description of the ways in which these uncertainties propagate isgiven. A summary of the results is presented and discussed, followed by a detailed descriptionof the analysis process. A discussion of the findings and ways to improve the uncertaintiesis then presented before conclusions are summarized. More details on the analysis processand results are provided in the appendices for interested readers.
NASA/CR—2016-219411 5
3 Background Information
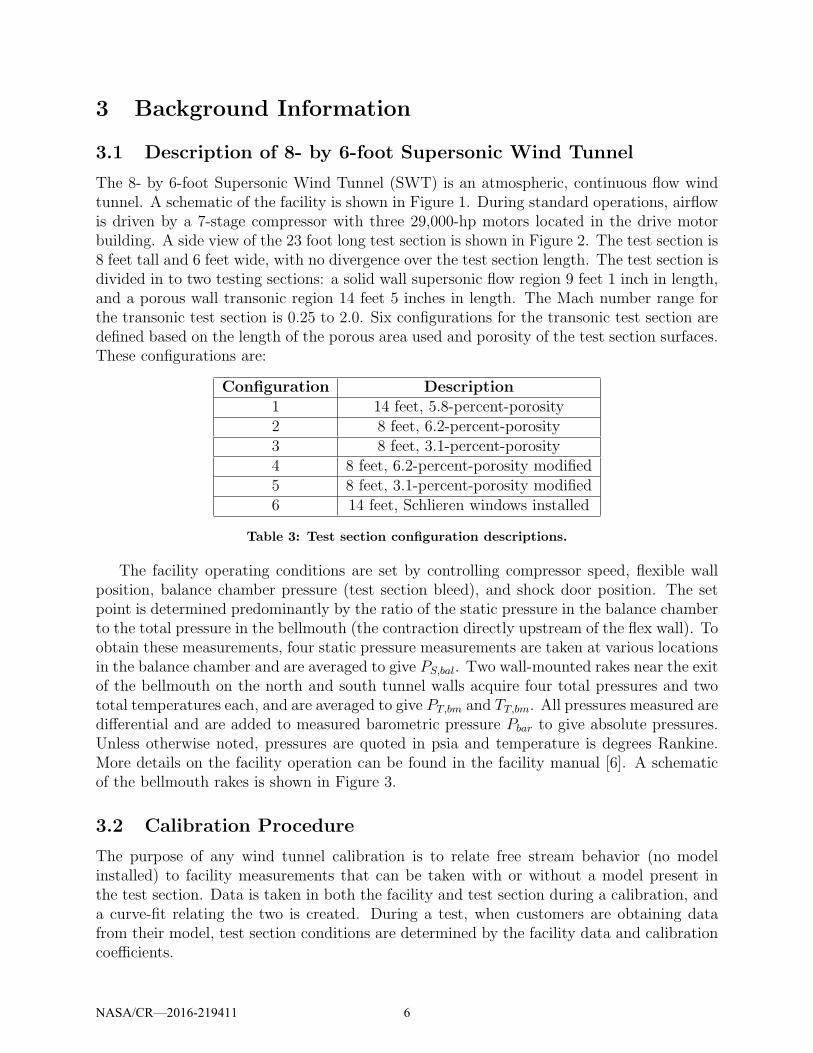
3.1 Description of 8- by 6-foot Supersonic Wind Tunnel
The 8- by 6-foot Supersonic Wind Tunnel (SWT) is an atmospheric, continuous flow windtunnel. A schematic of the facility is shown in Figure 1. During standard operations, airflowis driven by a 7-stage compressor with three 29,000-hp motors located in the drive motorbuilding. A side view of the 23 foot long test section is shown in Figure 2. The test section is8 feet tall and 6 feet wide, with no divergence over the test section length. The test section isdivided in to two testing sections: a solid wall supersonic flow region 9 feet 1 inch in length,and a porous wall transonic region 14 feet 5 inches in length. The Mach number range forthe transonic test section is 0.25 to 2.0. Six configurations for the transonic test section aredefined based on the length of the porous area used and porosity of the test section surfaces.These configurations are:
Configuration Description1 14 feet, 5.8-percent-porosity2 8 feet, 6.2-percent-porosity3 8 feet, 3.1-percent-porosity4 8 feet, 6.2-percent-porosity modified5 8 feet, 3.1-percent-porosity modified6 14 feet, Schlieren windows installed
Table 3: Test section configuration descriptions.
The facility operating conditions are set by controlling compressor speed, flexible wallposition, balance chamber pressure (test section bleed), and shock door position. The setpoint is determined predominantly by the ratio of the static pressure in the balance chamberto the total pressure in the bellmouth (the contraction directly upstream of the flex wall). Toobtain these measurements, four static pressure measurements are taken at various locationsin the balance chamber and are averaged to give PS,bal. Two wall-mounted rakes near the exitof the bellmouth on the north and south tunnel walls acquire four total pressures and twototal temperatures each, and are averaged to give PT,bm and TT,bm. All pressures measured aredifferential and are added to measured barometric pressure Pbar to give absolute pressures.Unless otherwise noted, pressures are quoted in psia and temperature is degrees Rankine.More details on the facility operation can be found in the facility manual [6]. A schematicof the bellmouth rakes is shown in Figure 3.
3.2 Calibration Procedure
The purpose of any wind tunnel calibration is to relate free stream behavior (no modelinstalled) to facility measurements that can be taken with or without a model present inthe test section. Data is taken in both the facility and test section during a calibration, anda curve-fit relating the two is created. During a test, when customers are obtaining datafrom their model, test section conditions are determined by the facility data and calibrationcoefficients.
NASA/CR—2016-219411 6
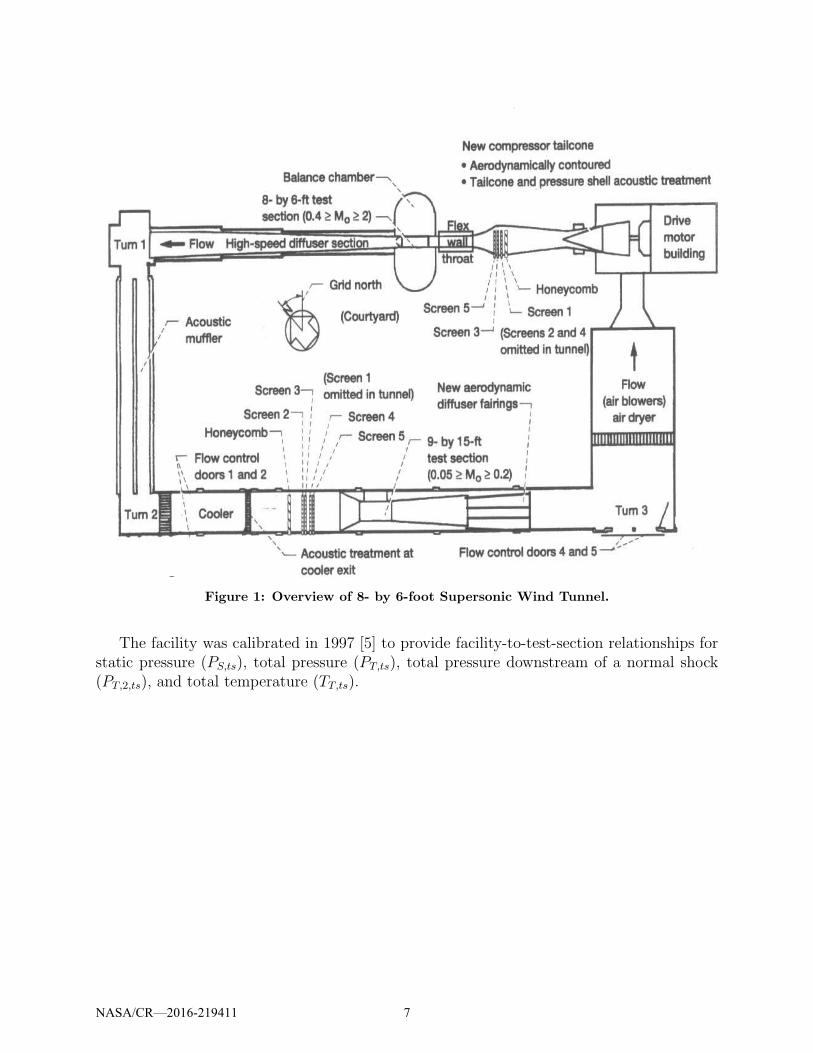
Figure 1: Overview of 8- by 6-foot Supersonic Wind Tunnel.
The facility was calibrated in 1997 [5] to provide facility-to-test-section relationships forstatic pressure (PS,ts), total pressure (PT,ts), total pressure downstream of a normal shock(PT,2,ts), and total temperature (TT,ts).
NASA/CR—2016-219411 7
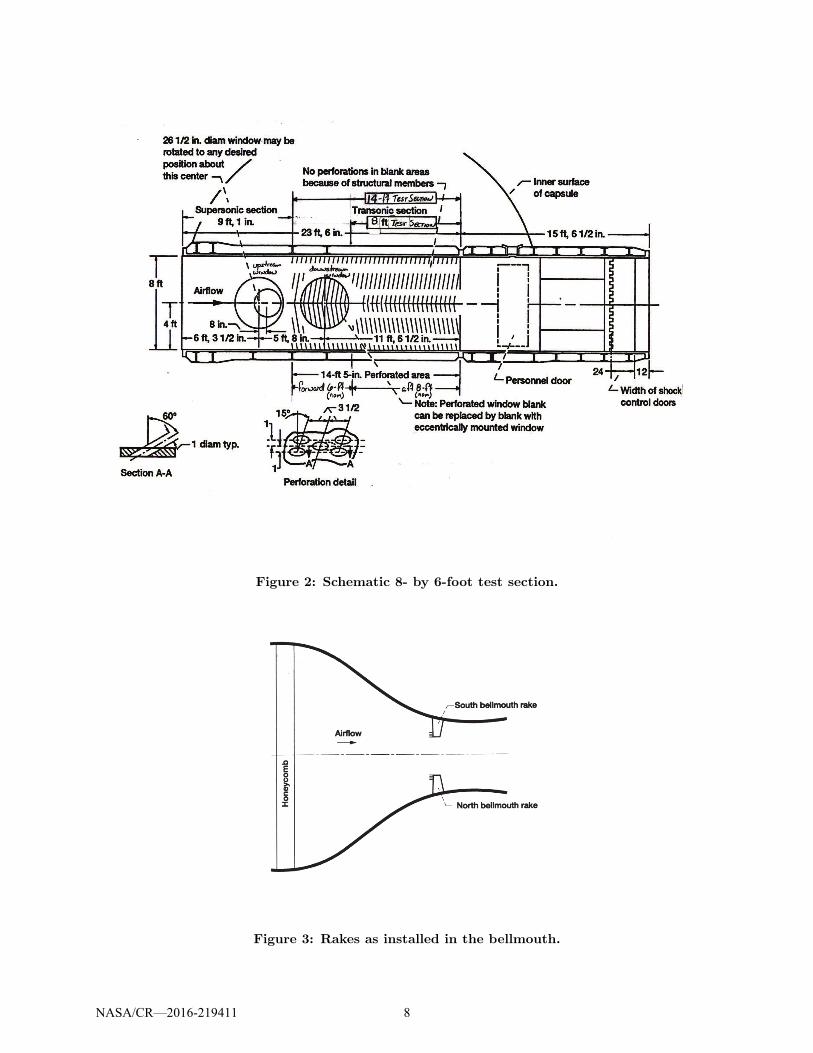
Figure 2: Schematic 8- by 6-foot test section.
Figure 3: Rakes as installed in the bellmouth.
NASA/CR—2016-219411 8
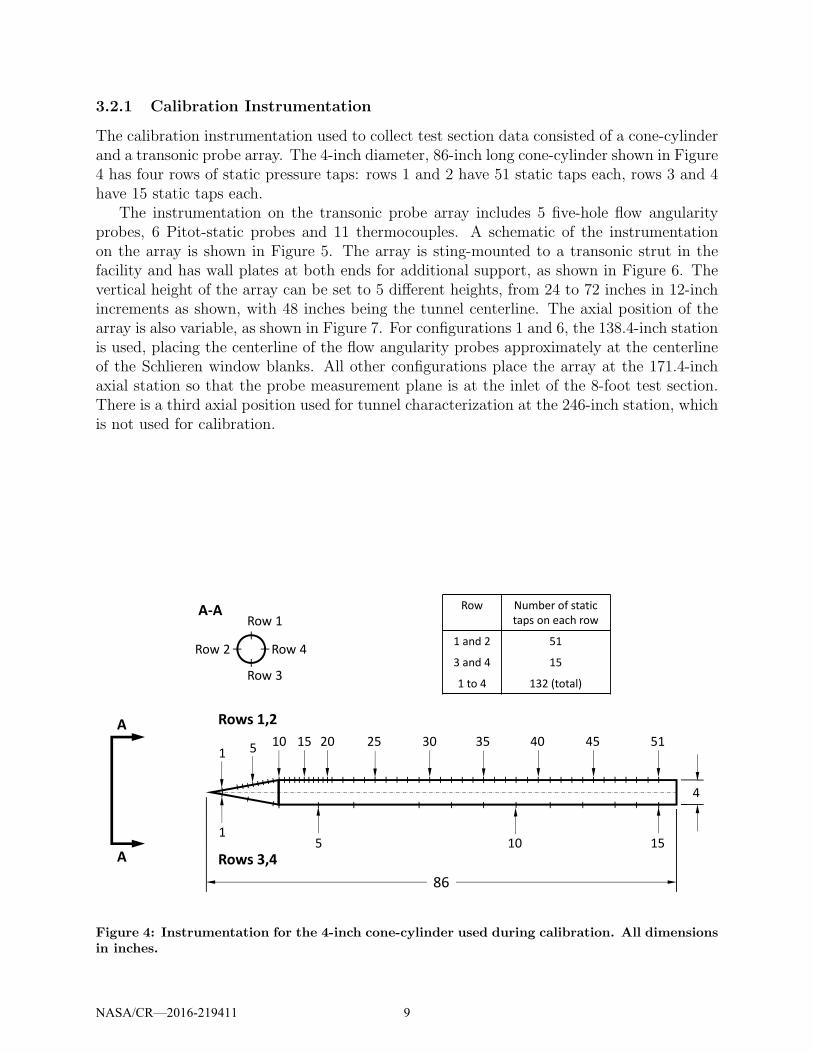
3.2.1 Calibration Instrumentation
The calibration instrumentation used to collect test section data consisted of a cone-cylinderand a transonic probe array. The 4-inch diameter, 86-inch long cone-cylinder shown in Figure4 has four rows of static pressure taps: rows 1 and 2 have 51 static taps each, rows 3 and 4have 15 static taps each.
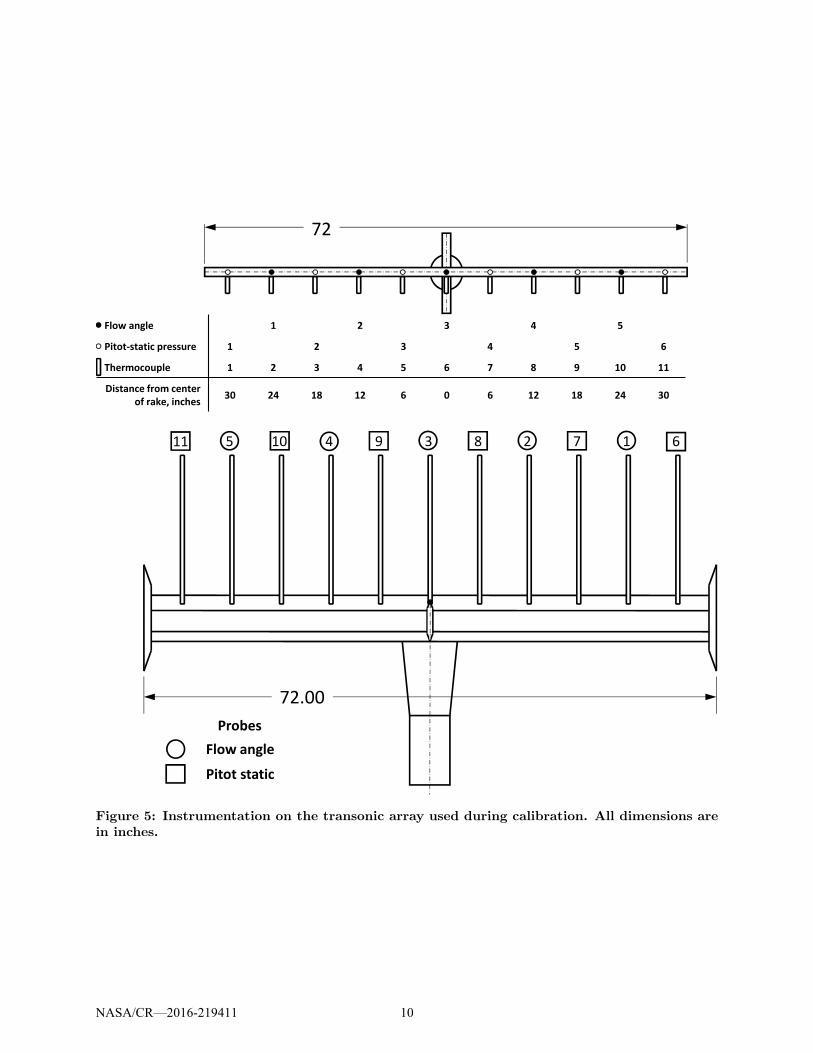
The instrumentation on the transonic probe array includes 5 five-hole flow angularityprobes, 6 Pitot-static probes and 11 thermocouples. A schematic of the instrumentationon the array is shown in Figure 5. The array is sting-mounted to a transonic strut in thefacility and has wall plates at both ends for additional support, as shown in Figure 6. Thevertical height of the array can be set to 5 different heights, from 24 to 72 inches in 12-inchincrements as shown, with 48 inches being the tunnel centerline. The axial position of thearray is also variable, as shown in Figure 7. For configurations 1 and 6, the 138.4-inch stationis used, placing the centerline of the flow angularity probes approximately at the centerlineof the Schlieren window blanks. All other configurations place the array at the 171.4-inchaxial station so that the probe measurement plane is at the inlet of the 8-foot test section.There is a third axial position used for tunnel characterization at the 246-inch station, whichis not used for calibration.
86
A
A
A-ARow 1
Row 4
Row 3
Row 2
4
1 510 15 20 25 30 35 40 45 51
5 10 15
Rows 1,2
Rows 3,4
1
Row Number of static
taps on each row
1 and 2 51
3 and 4 15
1 to 4 132 (total)
Figure 4: Instrumentation for the 4-inch cone-cylinder used during calibration. All dimensionsin inches.
NASA/CR—2016-219411 9
72.00
11 5 10 4 9 3 8 2 7 1 6
Probes
Flow angle
Pitot static
Flow angle 1 2 3 4 5
Pitot-static pressure 1 2 3 4 5 6
Thermocouple 1 2 3 4 5 6 7 8 9 10 11
Distance from center
of rake, inches30 24 18 12 6 0 6 12 18 24 30
72
Figure 5: Instrumentation on the transonic array used during calibration. All dimensions arein inches.
NASA/CR—2016-219411 10

Figure 6: Schematic of transonic array as sting-mounted in the test section for calibration.All dimensions are in inches.
Figure 7: Side view of the tunnel indicating placement of the transonic array in the 8- by6-foot test section for calibration. All dimensions are in inches.
NASA/CR—2016-219411 11
3.2.2 Calibration Curves
When operating the tunnel, nominal conditions for compressor speed, flexible wall position,and shock door positions are set. The ratio of the balance chamber static to bellmouthtotal pressures is also set to a nominal value based on the tables in the facility operationsmanual [6]. This ratio is defined as
Φ =PS,bal
PT,bm
, (1)
which is achieved and maintained via active control of a bleed valve in the balance chamber.The static pressure calibration relates the facility ratio Φ to test section static pressure.
To develop this relationship, the average of the 54 static pressures measured over the aft halfof the cone-cylinder (see Figure 4), defined as PS,cyl, was used to represent the mean testsection static pressure PS,ts during calibration. The equation for test section static pressureis given by
PS,ts = PT,bm · (B0 + B1 · Φ + B2 · Φ2 + B3 · Φ
3 + B4 · Φ4 + B5 · Φ
5 + B6 · Φ6). (2)
These coefficients are used to define test section conditions for the entire operating range ofthe tunnel.
The total pressure calibration relates facility parameters PT,bm and Φ to test section totalpressure for subsonic and supersonic flow ranges, respectively. The average of the innermostseven total pressure readings taken at the centerline vertical array height by the transonicarray (see Figure 5), defined as PT,arr, was used to represent test section total pressure PT,ts
during calibration. Note that in supersonic flow, the measurement observed by a probe isthe total pressure downstream of the normal shock produced by the probe, denoted by PT,2.
The equation for the calibrated total pressure in the subsonic operating range (Φ > 0.533)is given by
PT,ts = A0 + A1 · PT,bm + A2 · P2
T,bm, (3)
and for the supersonic operating range (Φ ≤ 0.533) is given by
PT,2,ts = PT,bm · (AS0 +AS1 ·Φ+AS2 ·Φ2 +AS3 ·Φ
3 +AS4 ·Φ4 +AS5 ·Φ
5 +AS6 ·Φ6). (4)
Likewise, the total temperature calibration relates facility temperature TT,bm to test sec-tion temperature. An average of the seven innermost total temperature readings taken atthe centerline vertical array height, defined as TT,arr, was used to represent test section totaltemperature TT,ts. The equation for test section total temperature is
TT,ts = (C0 + C1 · TT,bm + C2 · T2
T,bm + C3 · T4
T,bm) + 459.6, (5)
where TT,bm is in ◦F and TT,ts is in◦R.
All coefficients determined by these calibrations for all tunnel configurations as well asadditional calibration information can be found in Reference [5].
NASA/CR—2016-219411 12
3.3 Data Reduction
Using test-time facility measurements and the calibrated values for PS,ts, PT,ts, and PT,2,ts
as well as γ (the ratio of specific heats, assumed here to be a constant 1.4), the test sectionMach number is calculated in the subsonic range by
Mts =
√
√
√
√
2
γ − 1
[
(
PS,ts
PT,ts
)− γ−1
γ
− 1
]
, (6)
and is solved for iteratively in the supersonic range using the Rayleigh Pitot formula (Equa-tion 100 from Reference [7])
PT,2,ts
PS,ts
=
[
(γ + 1)M2ts
2
]
γγ−1
[
γ + 1
2γM2ts − (γ − 1)
]1
γ−1
. (7)
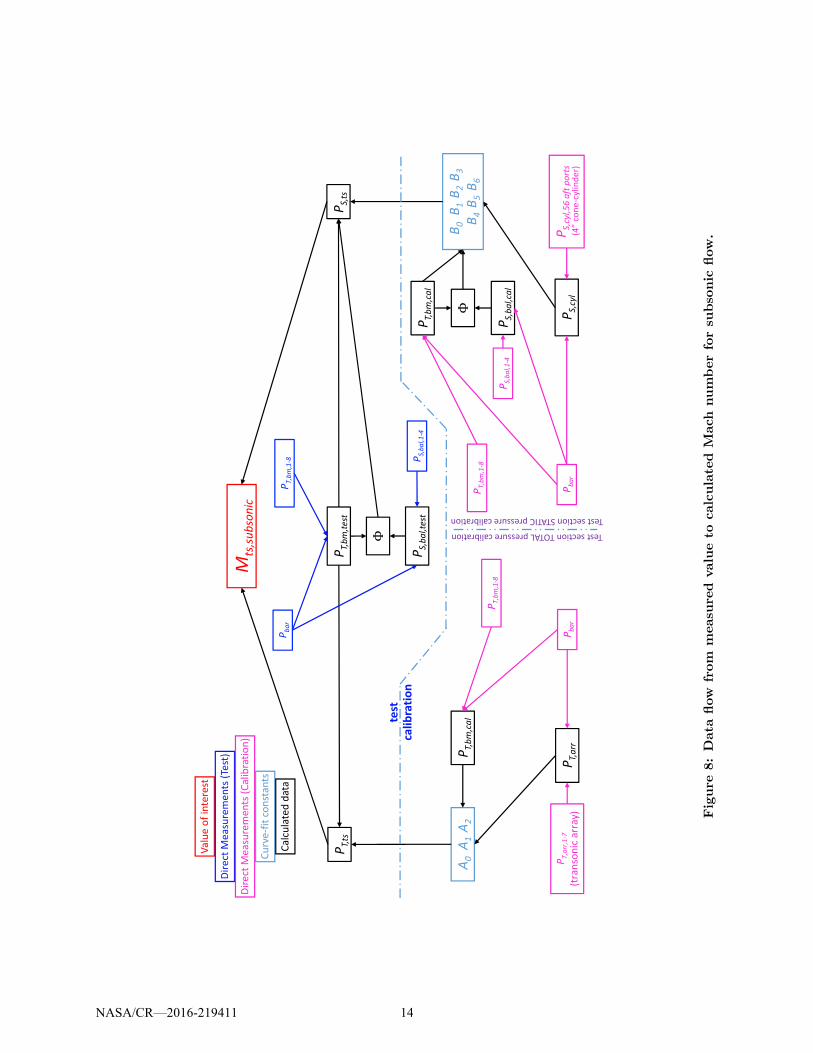
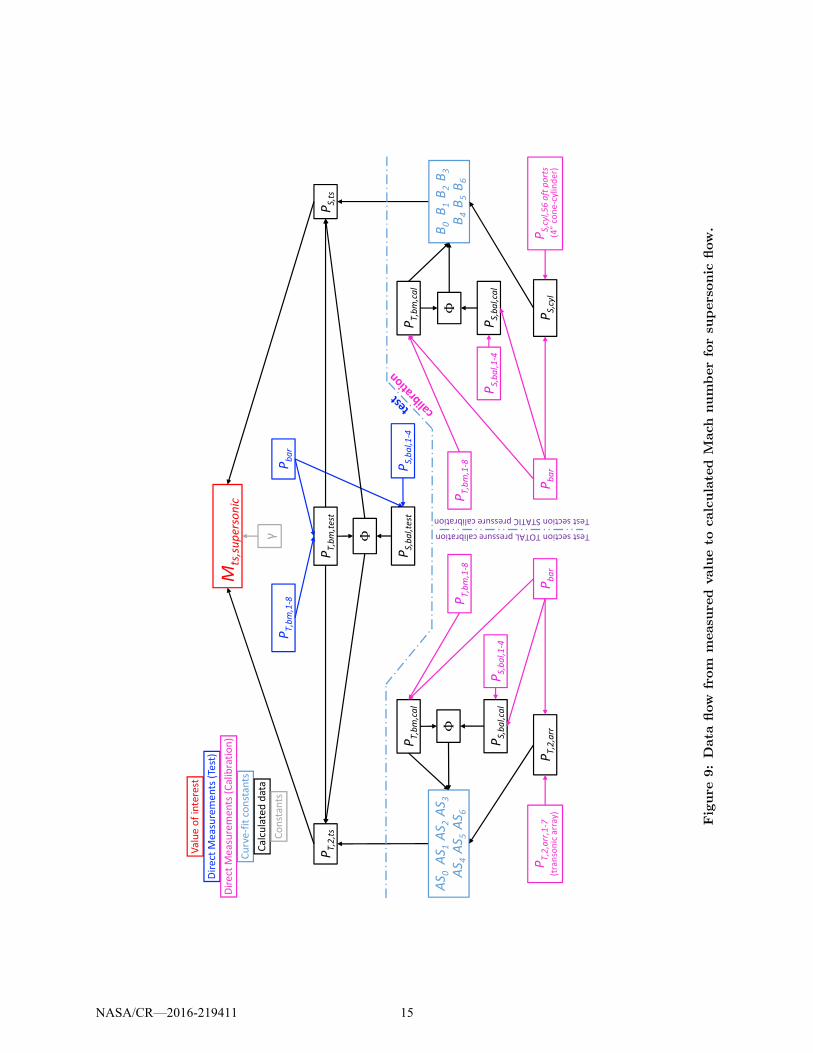
The data flow from measured values to Mach number is presented in Figure 8 for subsonicflow, and in Figure 9 for supersonic flow. The supersonic test section total pressure can thenbe calculated using Equation 99 from Reference [7]
PT,2,ts
PT,ts
=
[
(γ + 1)M2ts
(γ − 1)M2ts + 2
]
γγ−1
[
γ + 1
2γM2ts − (γ − 1)
]1
γ−1
. (8)
Test section static temperature is defined as
TS,ts =TT,ts
1 + γ−1
2M2
ts
. (9)
Test section free stream airspeed is defined as
Uts = Mts
√
γ ·R · TS,ts. (10)
Test section air density is calculated as
ρts =PS,ts
R · TS,ts
, (11)
and test section air viscosity (slugs/(ft · sec)) is
µts = 2.270T 1.5S,ts
TS,ts + 198.6· 10−8 (12)
for TS,ts in◦R. Test section Reynolds number per unit length is calculated as
Rets =ρtsUts
µts
, (13)
and the test section dynamic pressure is
qts = PT,ts ·γ
2M2
ts
(
1 +γ − 1
2M2
ts
)− γγ−1
. (14)
NASA/CR—2016-219411 13
Mts,subsonic
PT,arr
PT,bm,cal
PS,bal,cal
PS,cyl
A0A1A2
B0B1B2B3
B4B5B6
PT,bm,test
PS,bal,test
Φ
PS,ts
PT,ts
Φ
Valueofinterest
DirectMeasurements(Test)
DirectMeasurements(Calibration)
Curve-fitconstants
Calculateddata
calibration
test
PT,bm,cal
TestsectionSTATICpressurecalibration
TestsectionTOTALpressurecalibration
PT,bm,1-8
Pbar
Pbar
PT,bm,1-8
PS,bal,1-4
PT,arr,1-7
(transonicarray)
PS,bal,1-4
PT,bm,1-8
Pbar
PS,cyl,56aftports
(4”cone-cylinder)
Figure
8:Data
flow
from
measu
red
valueto
calculated
Mach
numberforsu
bso
nic
flow.
NASA/CR—2016-219411 14
PT,2,ts
Valueofinterest
DirectMeasurements(Test)
DirectMeasurements(Calibration)
Curve-fitconstants
Calculateddata
Constants
PT,2,arr
AS0AS1AS2AS3
AS4AS5AS6
PT,2,arr,1-7
(transonicarray)
PT,bm,cal
PS,bal,cal
Φ
TestsectionTOTALpressurecalibration
Pbar
PT,bm,1-8
PS,bal,1-4
Mts,supersonic
PT,bm,cal
PS,bal,cal
PS,cyl
B0B1B2B3
B4B5B6
PT,bm,test
PS,bal,test
γ Φ
PS,ts
ΦPT,bm,1-8
PS,bal,1-4
PS,cyl,56aftports
(4”cone-cylinder)
PS,bal,1-4
TestsectionSTATICpressurecalibration
Pbar
PT,bm,1-8
Pbar
Figure
9:Data
flow
from
measu
red
valueto
calculated
Mach
numberforsu
personic
flow.
NASA/CR—2016-219411 15

4 Measurement Uncertainty Analysis Overview
This section briefly describes measurement uncertainty and the general approach followed forthis analysis. The objective is to highlight the overall process, as well as the general procedurefollowed, for all elemental error sources considered. For more detail and quantified elementaluncertainty estimates, refer to Section 6.
4.1 Random and Systematic Errors
The most basic error sources are called elemental errors. All uncertainty texts begin bydefining these elemental error types, and grouping them for ease of investigation. The ISOGuide to the Expression of Uncertainty in Measurement [3] classifies uncertainties as TypeA and Type B. Type A estimates are based on direct observation and statistical analysis,while Type B estimates are based on operator experience, manufacturer documentation, orother means.
Other texts (References [1], [2], [4], [8]) classify uncertainties as random and systematic.Systematic errors create an offset from the actual value (Xtrue) to the nominal value (Xnom),while random errors cause a random variation, typically following a Gaussian distribution,about the nominal value. Figure 10 shows the effect each of these error types has on ameasured value.
Xtrue Xnom
systematic
random
Figure 10: Comparison of the effects of systematicand random errors on a measurement.
The uncertainty of a measurement isdefined by Coleman and Steele [8] as anestimate of the range within which theactual value of an unknown error is be-lieved to fall. They further define thestandard uncertainty of a measurement,u, as “an estimate of the standard devia-tion of the parent population from whicha particular elemental error originates.”
Random uncertainty characterizesthe inability to exactly replicate a mea-surement of variable x. A population ofrandom errors of measurement x with aGaussian distribution has a standard de-viation of sx, known as the random stan-dard uncertainty. This non-repeatabilityis a result of many unquantifiable factors
and, depending on the time scale between repeated data points, can include random ANDsystematic errors which contribute to observed random variation. Due to the nature of ran-dom errors, increasing sampling time and/or number of discrete repeats in the test matrixreduces the effect of random uncertainty on test data.
Systematic standard uncertainty, bx, characterizes the potential for bias in the measure-ment of variable x. Examples of systematic error sources can include instrumentation calibra-tion and installation, operator interaction, facility behavior such as spatial non-uniformity,
NASA/CR—2016-219411 16
and math models. Tunnel calibrations, comprised of both random and systematic uncertain-ties when calibration tests are performed, become fossilized [9] as a systematic uncertaintywhen a customer uses the resultant calibration curves for test-time analysis.
Correlated errors can occur when there is some type of link between two or more measure-ments. One example of a random correlated error would be two total pressure probes in closeproximity taking measurements in a slightly unsteady flow, where test section conditions maychange on a time basis; that variability would appear in all probes experiencing the samephenomena, and would be present in any simultaneous measurements of the probes. Anexample of systematic correlated errors would be measurements from multiple instrumentsthat are calibrated by the same process and instrumentation; any offset due to calibrationwould appear in all measurements from these instruments within a given calibration cycle.
While the ISO Guide [3] generally recommends against it because “such categorizationof components of uncertainty can be ambiguous when generally applied,” distinguishingbetween uncertainty sources as random and systematic can be useful in determining whichchanges have the potential to reduce a facility’s uncertainty. Additionally, categorizinguncertainties in this manner may help researchers understand how the uncertainties willaffect their data. For example, a researcher conducting a test to compare observed resultswith CFD models requires low systematic uncertainty but may not be bothered by highrandom uncertainty, while a researcher examining small changes in results due to modelmodification requires low random uncertainty but may not be concerned with an offset inhis or her data.
4.2 Uncertainty Propagation
Mach number is considered the primary variable of interest in the 8- by 6-foot SWT. Thissection uses Mach number to illustrate how uncertainties propagate through from measure-ment uncertainty to the calculated result. The same approach can be used for any selectedvariable of interest.
Variables from the data reduction that determine the free stream Mach number in thisfacility are the calibrated test section static pressure, PS,ts, total pressure in the subsonicrange, PT,ts, and total pressure downstream of a normal shock in the supersonic range, PT,2,ts
(see Equations 6 and 7). These calibrated values are calculated during a customer testusing facility measurements of average total pressure in the bellmouth, PT,bm, average staticpressure in the balance chamber, PS,bal, and total and static pressure calibration regressioncoefficients, as shown in Figures 8 and 9 and Equations 2, 3, and 4. All measured pressuresare differential and referenced to barometric pressure, Pbar, to produce absolute pressures.
Contributors to uncertainty in the test section Mach number are, therefore, random andsystematic uncertainties in the measured pressures PT,bm and PS,bal, systematic uncertaintyin the reference pressure Pbar (random uncertainty is assumed to be negligible), and fossilizedsystematic uncertainty from the calibration curves used to determine values of PS,ts, PT,ts,and PT,2,ts. This fossilized uncertainty includes a regression uncertainty, sreg, that accountsfor the uncertainty due to the math model used to define the calibration relationship curves.
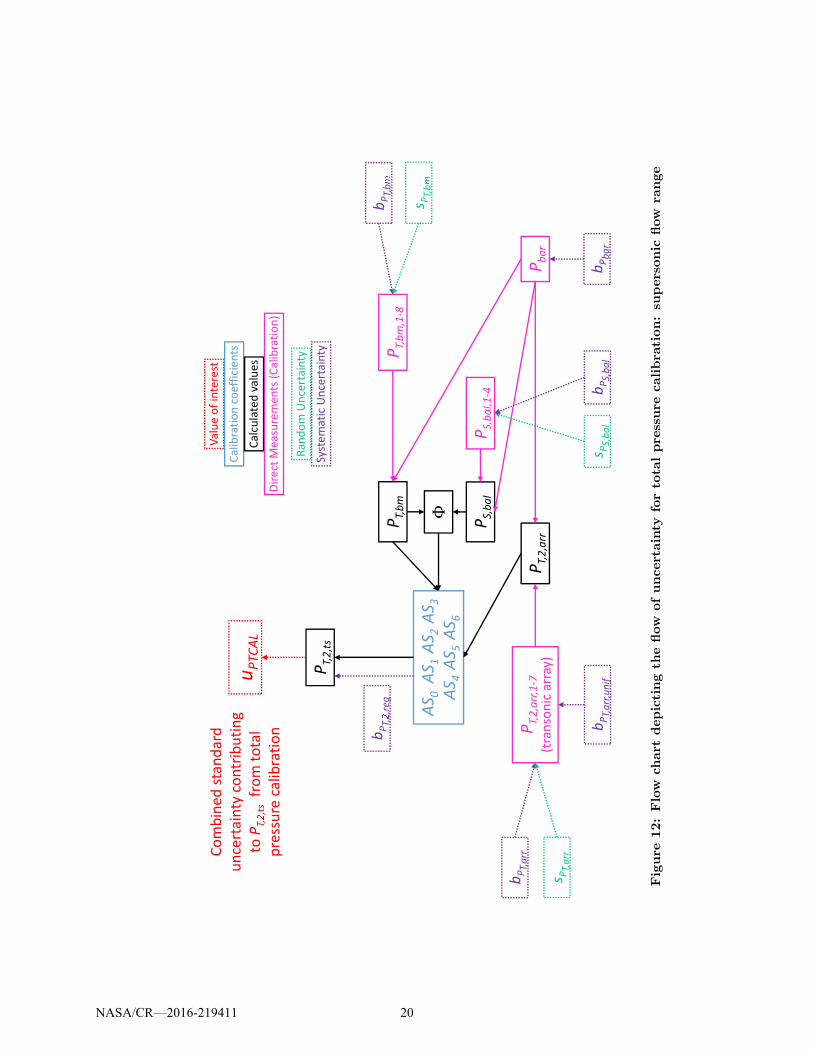
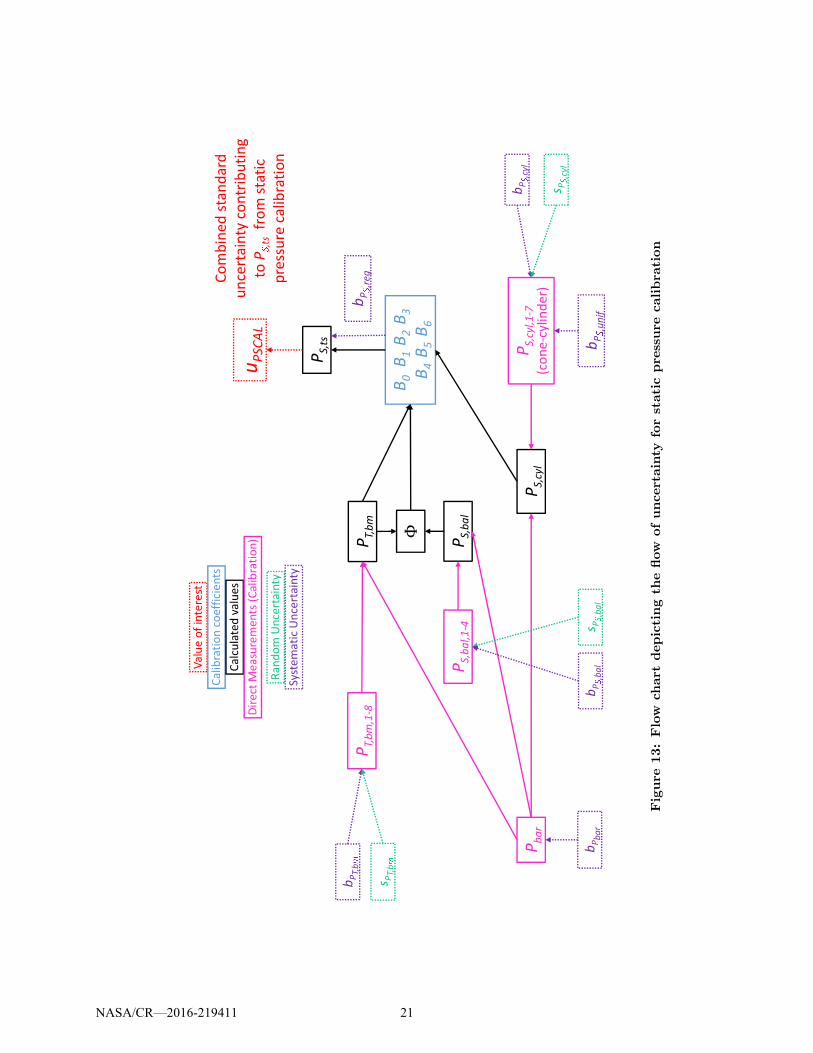
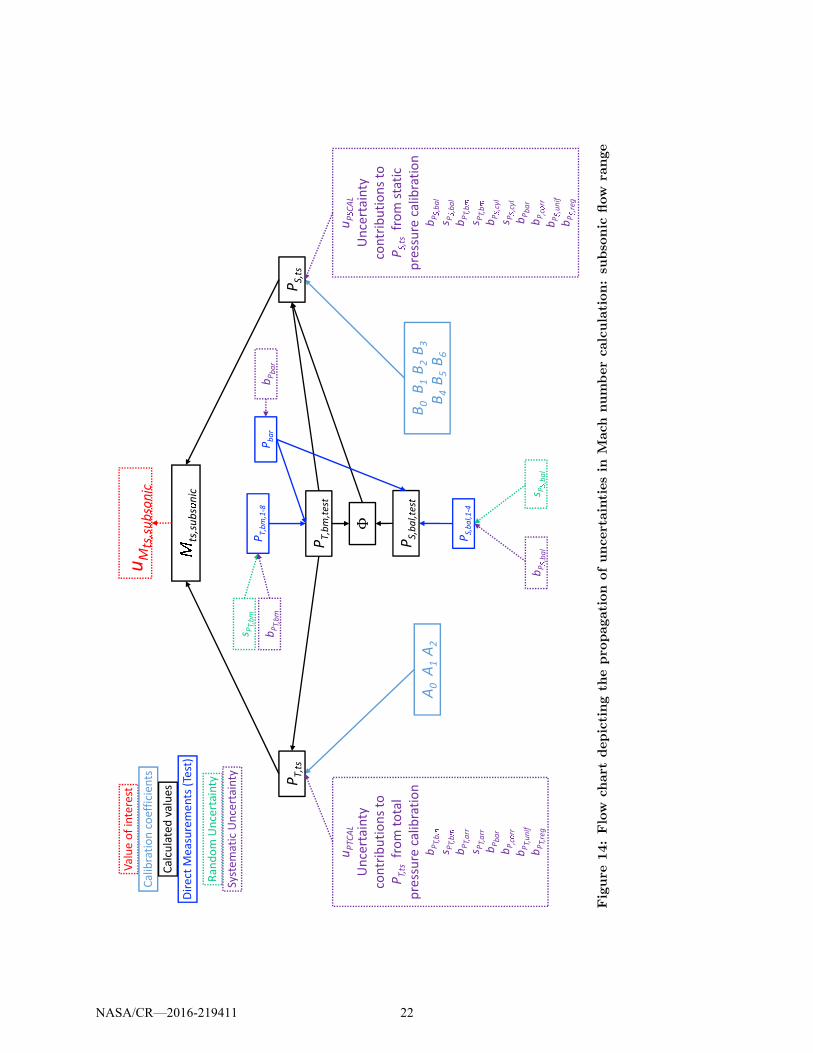
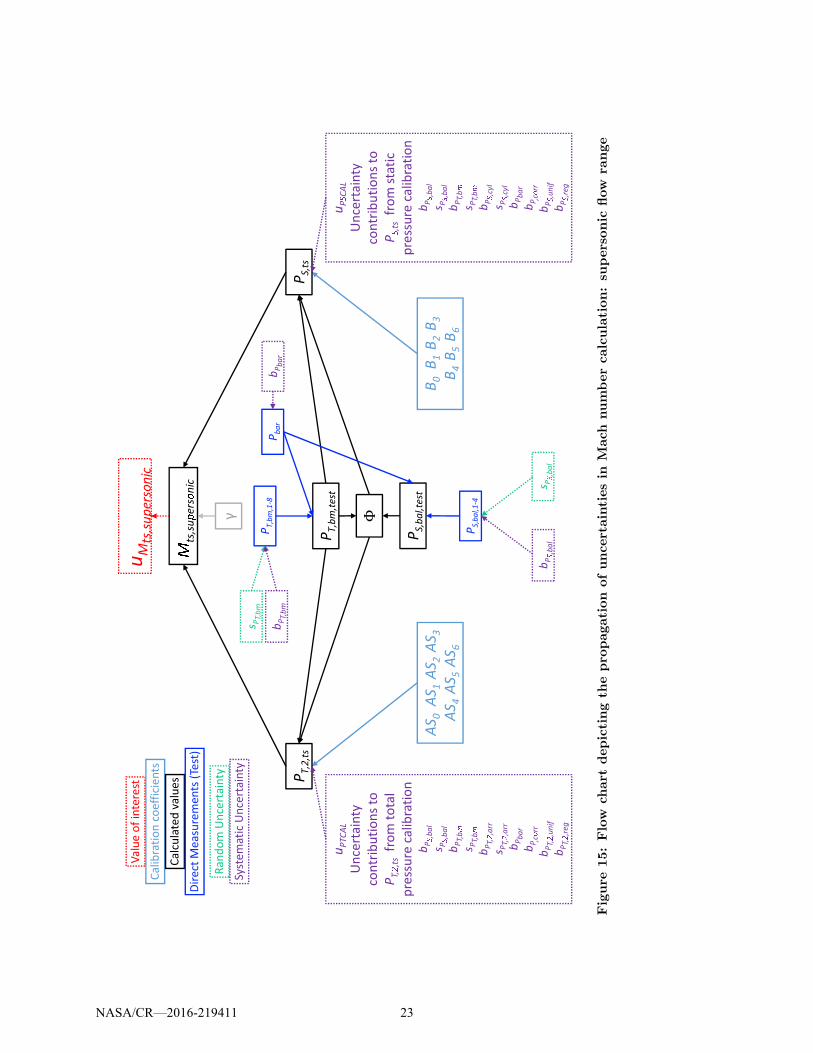
Figures 11-13 depict the uncertainty propagation through the data reduction for subsonictotal pressure, supersonic total pressure, and static pressure calibrations. The uncertaintiesin the test-time measured values and calibrations propagate through to the Mach number
NASA/CR—2016-219411 17
calculation as shown in Figures 14 and 15. Each of the elemental uncertainties shown inthese figures must be quantified with an estimate to gain an understanding of the combineduncertainty in the calculated Mach number.
It should also be noted from Figures 14 and 15 that the calibrations of PS,ts, PT,ts andPT,2,ts contribute only systematic errors to the Mach number uncertainty, since randomand systematic uncertainty introduced during the calibration tests are fossilized into thecalibration regressions as combined systematic uncertainties uPSCAL and uPTCAL.
Using the same general approach, uncertainty analyses are also performed for free streamstatic and total pressure, Reynolds number, total and static temperature, air speed, and dy-namic pressure by propagating the uncertainties through each variable’s respective datareduction. The combined uncertainty of these variables includes the elemental pressure un-certainties discussed above, and some variables additionally include random and systematicuncertainty contributions from the bellmouth total temperature measurement, TT,bm, andfossilized systematic uncertainty from the calibration curve used to determine values of TT,ts
(see Figure 16). Data and uncertainty flow charts for all variables of interest can be foundin their respective appendices.
NASA/CR—2016-219411 18

PT,arr
A0A1A2
PT,arr,1-7
(transonicarray)
PT,bm
Pbar
PT,bm,1-8
PT,ts
bPT,arr
bPbar
bPT,bm
s PT,bm
uPTCAL
bPT,unif
Valueofinterest
Calibrationcoefficients
Calculatedvalues
DirectMeasurements(Calibration)
Random
Un
cert
ain
ty
Syst
em
ati
cU
nce
rta
inty
s PT,arr
Co
mb
ine
dst
an
da
rd
un
cert
ain
tyco
ntr
ibu
tin
g
toPT,ts
fro
mto
tal
pre
ssu
reca
lib
rati
on bPT,reg
Figure
11:Flow
chart
depictingth
eflow
ofuncertainty
forto
talpressure
calibra
tion:su
bso
nic
flow
range
NASA/CR—2016-219411 19
PT,2,arr
AS0AS1AS2AS3
AS4AS5AS6
PT,2,arr,1-7
(transonicarray)
PT,bm
PS,bal
Φ
Pbar
PT,bm,1-8
PS,bal,1-4
PT,2,ts
bPbar
s PS,bal
bPS,bal
uPTCAL
Valueofinterest
Calibrationcoefficients
Calculatedvalues
DirectMeasurements(Calibration)
Random
Un
cert
ain
ty
Syst
em
ati
cU
nce
rta
inty
bPT,b
m
s PT,b
m
bPT,arr
s PT,arr
bPT,arr,unif
Co
mb
ine
dst
an
da
rd
un
cert
ain
tyco
ntr
ibu
tin
g
toPT,
2
,ts
fro
mto
tal
pre
ssu
reca
lib
rati
on bPT,
2
,reg
Figure
12:Flow
chart
depictingth
eflow
ofuncertainty
forto
talpressure
calibra
tion:su
personic
flow
range
NASA/CR—2016-219411 20
PT,bm
PS,bal
PS,cyl
B0B1B2B3
B4B5B6
PS,ts
Φ
PT,bm,1-8
PS,bal,1-4
PS,cyl,1-7
(cone-cylinder)
Pbar
uPSCAL
bPT,b
�
s PT,b
�
bPbar
bP
S
,cyl
s P
S
,cyl
bP
�
,unif
s P
S
,bal
bP
S
,balValueofinterest
Calibrationcoefficients
Calculatedvalues
DirectMeasurements(Calibration)
Random
Un
cert
ain
ty
Syst
em
ati
cU
nce
rta
inty
Co
mb
ine
dst
an
da
rd
un
cert
ain
tyco
ntr
ibu
tin
g
toP
�
,ts
fro
mst
ati
c
pre
ssu
reca
lib
rati
on
bP
�
,reg
Figure
13:Flow
chart
depictingth
eflow
ofuncertainty
forstaticpre
ssure
calibra
tion
NASA/CR—2016-219411 21
A0A1A2
PT,ts
PS,ts
B0B1B2B3
B4B5B6
uMts,subsonic
PT,bm,test
PS,bal,test
Φ
PS,bal,1-4
PT,bm,1-8
Pbar
s PT,bm
bPT,bm
bPbar
Valueofinterest
Calibrationcoefficients
Calculatedvalues
DirectMeasurements(Test)
Random
Un
cert
ain
ty
Syst
em
ati
cU
nce
rta
inty
uPTCAL
Un
cert
ain
ty
con
trib
uti
on
sto
PT,ts
fro
mto
tal
pre
ssu
reca
lib
rati
on
bPT,b
�
s PT,b
�
bPT,arr
s PT,arr
bPbar
bP ,co
rr
bPT,unif
bPT,reg
uP
�
CAL
Un
cert
ain
ty
con
trib
uti
on
sto
P
�
,ts
fro
mst
ati
c
pre
ssu
reca
lib
rati
on
bP
� ,bal
s P
� ,bal
bPT,b
�
s PT,b
�
bP
�,cyl
s P
� ,cyl
bPbar
bP ,c o
rr
bP
� ,unif
bP
�,reg
s P
� ,bal
bP
� ,bal
ts,subsnic
Figure
14:Flow
chart
depictingth
epro
pagation
ofuncertaintiesin
Mach
numbercalculation:su
bso
nic
flow
range
NASA/CR—2016-219411 22
AS0AS1AS2AS3
AS4AS5AS6
PT,2,ts
PS,ts
B0B1B2B3
B4B5B6
uMts,supersonic
PT,bm,test
PS,bal,test
γ Φ
PS,bal,1-4
PT,bm,1-8
Pbar
s PT,bm
bPT,bm
bPbar
Valueofinterest
Calibrationcoefficients
Calculatedvalues
DirectMeasurements(Test)
Random
Un
cert
ain
ty
Syst
em
ati
cU
nce
rta
inty
uPTCAL
Un
cert
ain
ty
con
trib
uti
on
sto
PT,
�
,ts
fro
mto
tal
pre
ssu
reca
lib
rati
on
bP
� ,bal
s P
� ,bal
bPT,b
�
s PT,b
�
bPT,
�
,arr
s PT,
�
,arr
bPbar
bP ,c
rr
bPT,
�
,unif
bPT,
�
,reg
uP
CAL
Un
cert
ain
ty
con
trib
uti
on
sto
P
,ts
fro
mst
ati
c
pre
ssu
reca
lib
rati
on
bP
� ,bal
s P
� ,bal
bPT,b
�
s PT,b
�
bP
� ,cyl
s P
� ,cyl
bPbar
bP ,c
rr
bP
� ,unif
bP
� ,reg
s P
� ,bal
bP
� ,balts,su
ers
nic
Figure
15:Flow
chart
depictingth
epro
pagation
ofuncertaintiesin
Mach
numbercalculation:su
personic
flow
range
NASA/CR—2016-219411 23

uTTCAL
TT,arr
TT,b
C0
CC2
C3C
Valueofinterest
DirectMeasurement(Calibration)
Curve-fitcoefficients
CalculatedValue
Random
Un
cert
ain
ty
Syst
em
ati
cU
nce
rta
inty
TT,b
,TT,arr,
bTT,b
�
s TT,b
�
bTT,unif
s TT,arr
bTT,arr
TT,ts
Co
mb
ine
dst
an
da
rd
un
cert
ain
tyco
ntr
ibu
tin
g
toTT,ts
fro
mto
tal
tem
pe
ratu
reca
lib
rati
on
bTT,reg
Figure
16:Flow
chart
depictingth
epro
pagation
ofuncertaintiesforto
taltempera
ture
calibra
tion.
NASA/CR—2016-219411 24
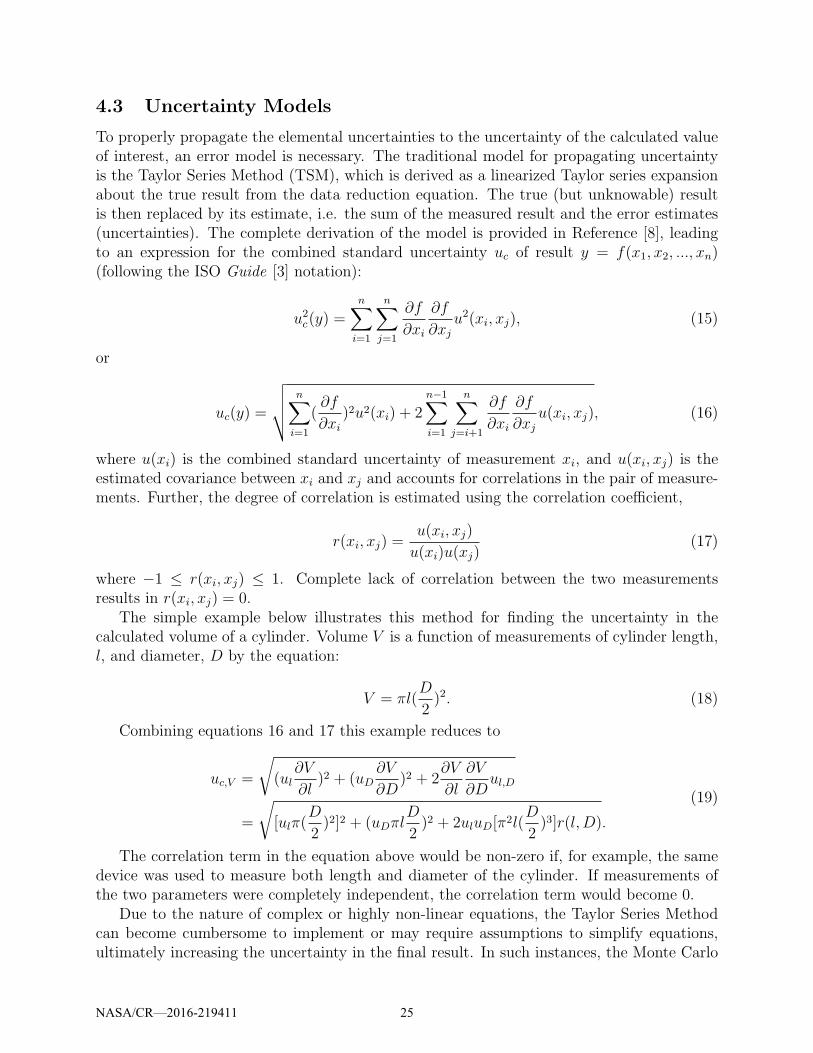
4.3 Uncertainty Models
To properly propagate the elemental uncertainties to the uncertainty of the calculated valueof interest, an error model is necessary. The traditional model for propagating uncertaintyis the Taylor Series Method (TSM), which is derived as a linearized Taylor series expansionabout the true result from the data reduction equation. The true (but unknowable) resultis then replaced by its estimate, i.e. the sum of the measured result and the error estimates(uncertainties). The complete derivation of the model is provided in Reference [8], leadingto an expression for the combined standard uncertainty uc of result y = f(x1, x2, ..., xn)(following the ISO Guide [3] notation):
u2
c(y) =n
∑
i=1
n∑
j=1
∂f
∂xi
∂f
∂xj
u2(xi, xj), (15)
or
uc(y) =
√
√
√
√
n∑
i=1
(∂f
∂xi
)2u2(xi) + 2n−1∑
i=1
n∑
j=i+1
∂f
∂xi
∂f
∂xj
u(xi, xj), (16)
where u(xi) is the combined standard uncertainty of measurement xi, and u(xi, xj) is theestimated covariance between xi and xj and accounts for correlations in the pair of measure-ments. Further, the degree of correlation is estimated using the correlation coefficient,
r(xi, xj) =u(xi, xj)
u(xi)u(xj)(17)
where −1 ≤ r(xi, xj) ≤ 1. Complete lack of correlation between the two measurementsresults in r(xi, xj) = 0.
The simple example below illustrates this method for finding the uncertainty in thecalculated volume of a cylinder. Volume V is a function of measurements of cylinder length,l, and diameter, D by the equation:
V = πl(D
2)2. (18)
Combining equations 16 and 17 this example reduces to
uc,V =
√
(ul
∂V
∂l)2 + (uD
∂V
∂D)2 + 2
∂V
∂l
∂V
∂Dul,D
=
√
[ulπ(D
2)2]2 + (uDπl
D
2)2 + 2uluD[π2l(
D
2)3]r(l, D).
(19)
The correlation term in the equation above would be non-zero if, for example, the samedevice was used to measure both length and diameter of the cylinder. If measurements ofthe two parameters were completely independent, the correlation term would become 0.
Due to the nature of complex or highly non-linear equations, the Taylor Series Methodcan become cumbersome to implement or may require assumptions to simplify equations,ultimately increasing the uncertainty in the final result. In such instances, the Monte Carlo
NASA/CR—2016-219411 25
Method (MCM) is very useful as an uncertainty propagation technique. Standards for usingthe MCM are detailed by Coleman and Steele [8], and the method is included in the ISOGuide’s supplement [10].
A Monte Carlo simulation begins with a data set representative of a typical test. A pop-ulation of i synthetic data sets are produced by perturbing each representative measurementin the data set by errors that are populated based on elemental uncertainty estimates andassumed error distrubtions for each uncertainty source considered, and for each measure-ment [11]. Each of the i perturbed data sets are sent through the data reduction sequence,producing i calculations of any values of interest. Finally, the standard uncertainty of thecalculated values are determined by taking the standard deviation of the perturbed results.
A simplified example of pseudo-code for a Monte Carlo error propagation simulationcalculating uncertainty in the volume of a cylinder V as a function of length L and diameterD (as described in Section 4.3) is shown in Figure 17. The code provides examples of howto populate the random, systematic, and correlated systematic errors as described in thissection.
Given the iterative calculations required to obtain the free stream Mach number in thisfacility, the MCM of uncertainty propagation was selected for this analysis. Further detailson the method as implemented in this analysis can be found in Section 6.2.
NASA/CR—2016-219411 26
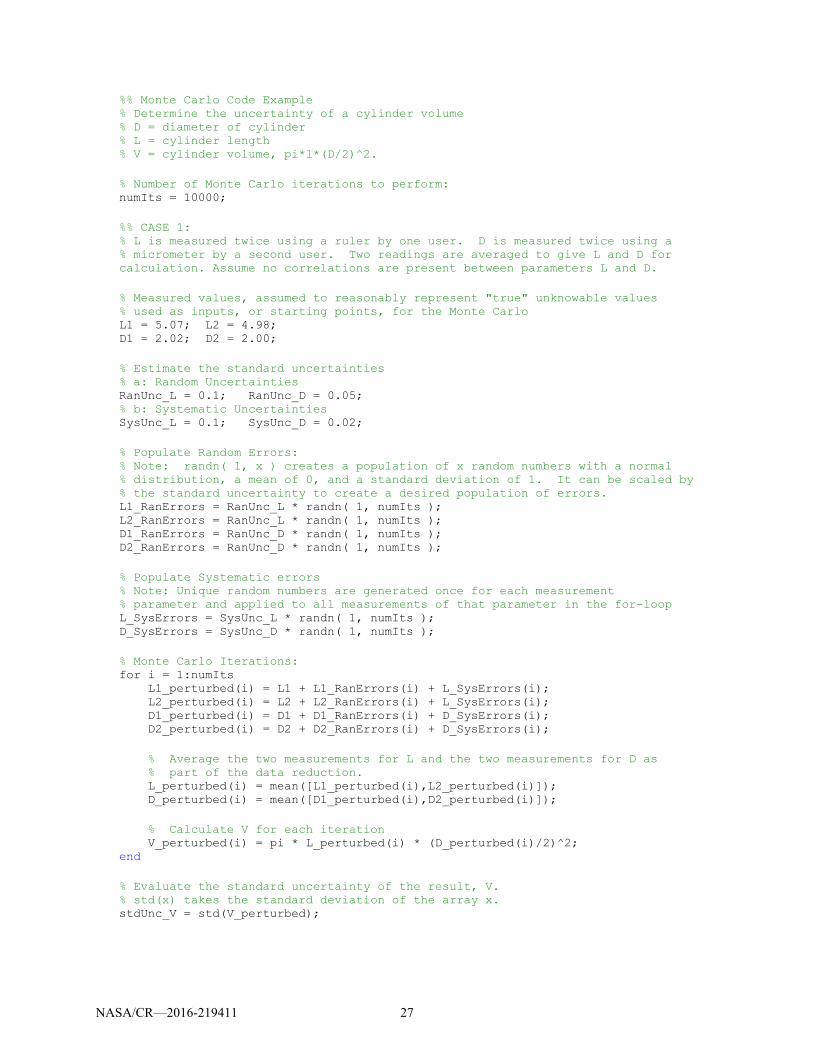
%% Monte Carlo Code Example% Determine the uncertainty of a cylinder volume% D = diameter of cylinder% L = cylinder length% V = cylinder volume, pi*l*(D/2)^2.
% Number of Monte Carlo iterations to perform:numIts = 10000;
%% CASE 1:% L is measured twice using a ruler by one user. D is measured twice using a% micrometer by a second user. Two readings are averaged to give L and D forcalculation. Assume no correlations are present between parameters L and D.
% Measured values, assumed to reasonably represent "true" unknowable values% used as inputs, or starting points, for the Monte CarloL1 = 5.07; L2 = 4.98;D1 = 2.02; D2 = 2.00;
% Estimate the standard uncertainties% a: Random UncertaintiesRanUnc_L = 0.1; RanUnc_D = 0.05;% b: Systematic UncertaintiesSysUnc_L = 0.1; SysUnc_D = 0.02;
% Populate Random Errors:% Note: randn( 1, x ) creates a population of x random numbers with a normal% distribution, a mean of 0, and a standard deviation of 1. It can be scaled by% the standard uncertainty to create a desired population of errors.L1_RanErrors = RanUnc_L * randn( 1, numIts );L2_RanErrors = RanUnc_L * randn( 1, numIts );D1_RanErrors = RanUnc_D * randn( 1, numIts );D2_RanErrors = RanUnc_D * randn( 1, numIts );
% Populate Systematic errors% Note: Unique random numbers are generated once for each measurement% parameter and applied to all measurements of that parameter in the for-loopL_SysErrors = SysUnc_L * randn( 1, numIts );D_SysErrors = SysUnc_D * randn( 1, numIts );
% Monte Carlo Iterations:for i = 1:numIts
L1_perturbed(i) = L1 + L1_RanErrors(i) + L_SysErrors(i);L2_perturbed(i) = L2 + L2_RanErrors(i) + L_SysErrors(i);D1_perturbed(i) = D1 + D1_RanErrors(i) + D_SysErrors(i);D2_perturbed(i) = D2 + D2_RanErrors(i) + D_SysErrors(i);
% Average the two measurements for L and the two measurements for D as% part of the data reduction.L_perturbed(i) = mean([L1_perturbed(i),L2_perturbed(i)]);D_perturbed(i) = mean([D1_perturbed(i),D2_perturbed(i)]);
% Calculate V for each iterationV_perturbed(i) = pi * L_perturbed(i) * (D_perturbed(i)/2)^2;
end
% Evaluate the standard uncertainty of the result, V.% std(x) takes the standard deviation of the array x.stdUnc_V = std(V_perturbed);
NASA/CR—2016-219411 27
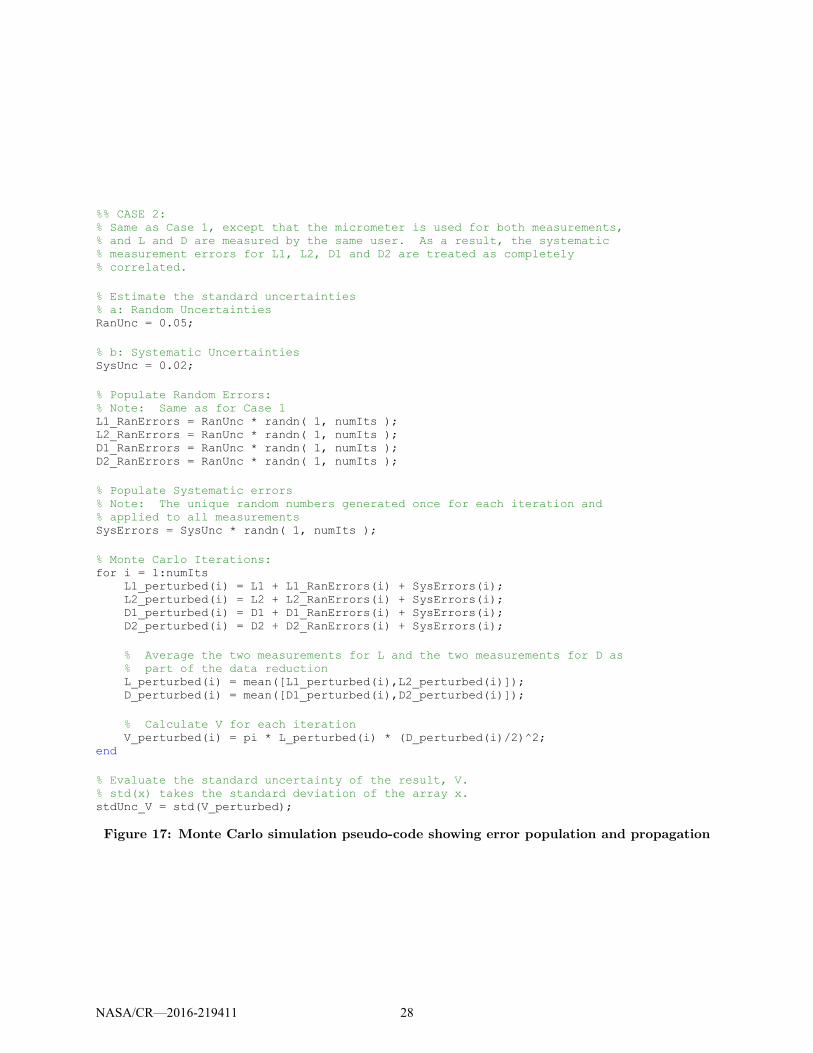
%% CASE 2:% Same as Case 1, except that the micrometer is used for both measurements,% and L and D are measured by the same user. As a result, the systematic% measurement errors for L1, L2, D1 and D2 are treated as completely% correlated.
% Estimate the standard uncertainties% a: Random UncertaintiesRanUnc = 0.05;
% b: Systematic UncertaintiesSysUnc = 0.02;
% Populate Random Errors:% Note: Same as for Case 1L1_RanErrors = RanUnc * randn( 1, numIts );L2_RanErrors = RanUnc * randn( 1, numIts );D1_RanErrors = RanUnc * randn( 1, numIts );D2_RanErrors = RanUnc * randn( 1, numIts );
% Populate Systematic errors% Note: The unique random numbers generated once for each iteration and% applied to all measurementsSysErrors = SysUnc * randn( 1, numIts );
% Monte Carlo Iterations:for i = 1:numIts
L1_perturbed(i) = L1 + L1_RanErrors(i) + SysErrors(i);L2_perturbed(i) = L2 + L2_RanErrors(i) + SysErrors(i);D1_perturbed(i) = D1 + D1_RanErrors(i) + SysErrors(i);D2_perturbed(i) = D2 + D2_RanErrors(i) + SysErrors(i);
% Average the two measurements for L and the two measurements for D as% part of the data reductionL_perturbed(i) = mean([L1_perturbed(i),L2_perturbed(i)]);D_perturbed(i) = mean([D1_perturbed(i),D2_perturbed(i)]);
% Calculate V for each iterationV_perturbed(i) = pi * L_perturbed(i) * (D_perturbed(i)/2)^2;
end
% Evaluate the standard uncertainty of the result, V.% std(x) takes the standard deviation of the array x.stdUnc_V = std(V_perturbed);
Figure 17: Monte Carlo simulation pseudo-code showing error population and propagation
NASA/CR—2016-219411 28

5 Results
The results of the uncertainty analysis for tunnel configuration 1 are presented in this sec-tion. Details on the analysis process (including descriptions of the elemental uncertainties,estimation methods, and how various obstacles in the analysis were handled) are discussedin Section 6. All results are presented in this section with an appropriate coverage factorto obtain a 95% level of confidence in the quoted uncertainty1. For each variable of interestthe random, systematic and total uncertainties are presented with a break down of howeach elemental uncertainty described in Section 4.2 contributes as an uncertainty percentcontribution (UPC) to each variables of interest. UPC results are determined by:
UPCi =u2i
u2total
× 100, (20)
where ui is the uncertainty contribution to the variable of interest due to elemental uncer-tainty i, and utotal is the total uncertainty of the variable of interest.
Dimensional and UPC results are presented separately for random and systematic uncer-tainty, then are presented as total uncertainty (simply a root sum square of the random andsystematic results). Random and systematic uncertainty results in isolation are frequentlyof more interest to test customers than the overall combined uncertainty. Separating resultsalso allows researchers to focus on the uncertainties that pertain to their test type, and allowsfacility personnel to determine the best use of time and money for facility improvements.
UPC results are presented such that all contributors add to 100% of the total of theuncertainty type being considered. Take random uncertainty for example; all random un-certainty sources add up to 100% of the total random uncertainty, modifying Equation 20with ui = ui,random and utotal = utotal,random. The same is done for systematic and totaluncertainty.
All quoted uncertainties for each variable of interest should be considered calibrationpoint uncertainties, centered on the tunnel’s x and y axes and axially defined by the con-figuration’s nominal axial station (see Table 3 and Section 3.1 and the table in Figure 7).Results do not include uncertainties due to test time factors such as blockage effects orspatial non-uniformity, since those can change significantly model-to-model. (Note that spa-tial uniformity uncertainty is, however, considered for its impact on the calibration of eachparameter.)
The uncertainty results determined for each variable of interest for tunnel configuration1 are discussed in this section. Results for other configurations can be found in AppendicesB - I.
1There are limited data points resulting in very low degrees of freedom in random uncertainty estimates.Use of the d2 statistic to un-bias the data results in a large enough effective degree of freedom from thesmall sample size such that once all the uncertainties combine through data reduction, the effective degreesof freedom of the system is adequate for k = 2 to obtain the 95% confidence level [2].
NASA/CR—2016-219411 29
5.1 Random Uncertainty Results
As described in Section 4.2, random uncertainty characterizes the variation of a measurementabout its mean. This type of uncertainty may be of interest to researchers looking for smallchanges due to model modifications. These results provide an understanding of the facility’stest-to-test variation.
5.1.1 Mach Number
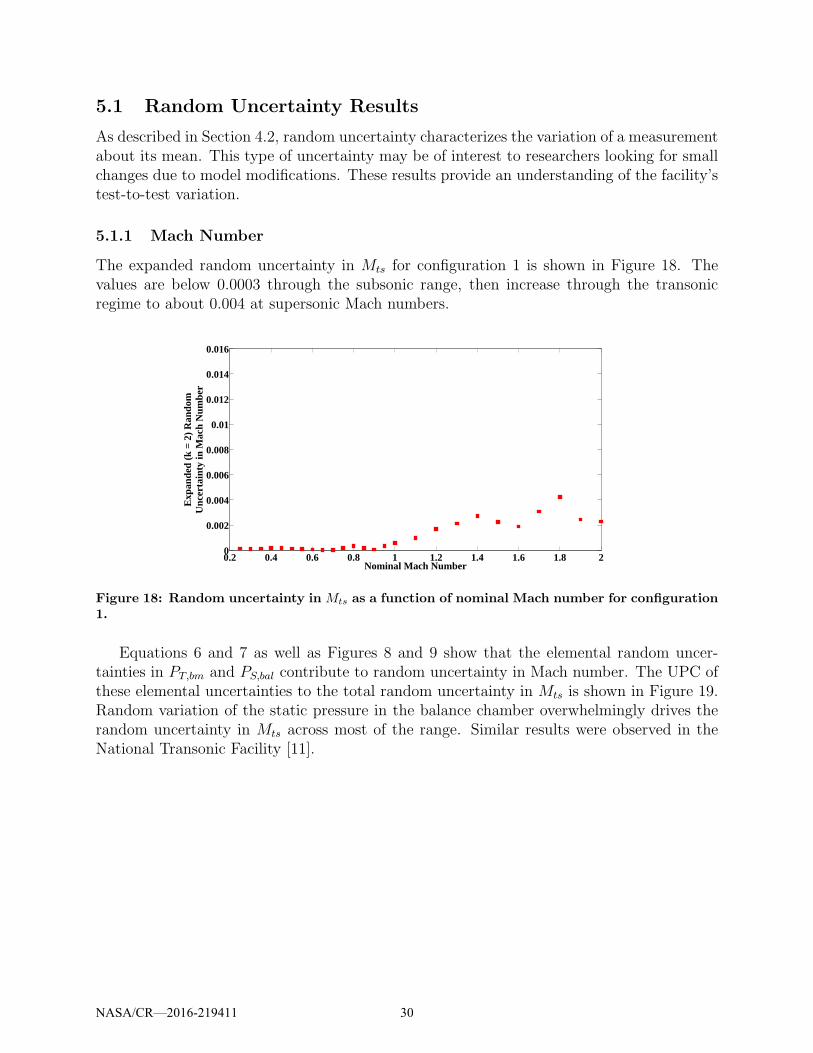
The expanded random uncertainty in Mts for configuration 1 is shown in Figure 18. Thevalues are below 0.0003 through the subsonic range, then increase through the transonicregime to about 0.004 at supersonic Mach numbers.
0.2 0.4 0.6 0.8 1 1.2 1.4 1.6 1.8 20
0.002
0.004
0.006
0.008
0.01
0.012
0.014
0.016
Nominal Mach Number
Exp
ande
d (k
= 2
) R
ando
mU
ncer
tain
ty in
Mac
h N
umbe
r
Figure 18: Random uncertainty in Mts as a function of nominal Mach number for configuration1.
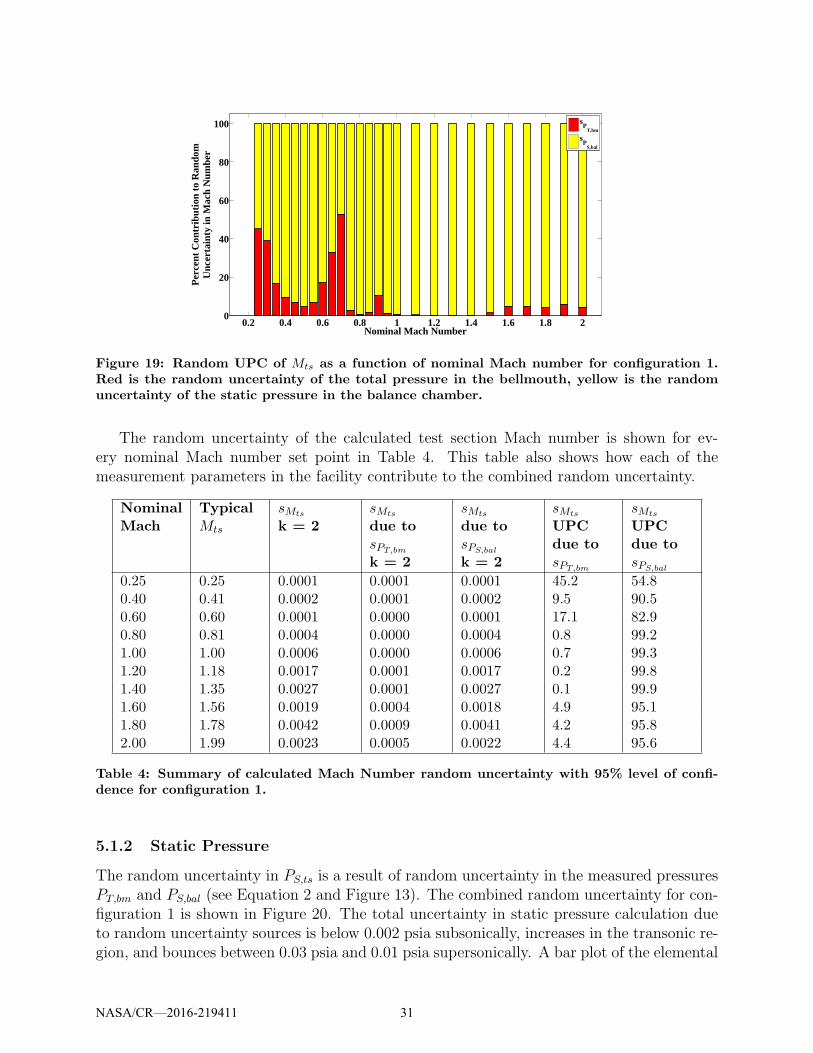
Equations 6 and 7 as well as Figures 8 and 9 show that the elemental random uncer-tainties in PT,bm and PS,bal contribute to random uncertainty in Mach number. The UPC ofthese elemental uncertainties to the total random uncertainty in Mts is shown in Figure 19.Random variation of the static pressure in the balance chamber overwhelmingly drives therandom uncertainty in Mts across most of the range. Similar results were observed in theNational Transonic Facility [11].
NASA/CR—2016-219411 30
0.2 0.4 0.6 0.8 1 1.2 1.4 1.6 1.8 20
20
40
60
80
100
Nominal Mach Number
Per
cent
Con
trib
utio
n to
Ran
dom
Unc
erta
inty
in M
ach
Num
ber
sP
T,bm
sP
S,bal
Figure 19: Random UPC of Mts as a function of nominal Mach number for configuration 1.Red is the random uncertainty of the total pressure in the bellmouth, yellow is the randomuncertainty of the static pressure in the balance chamber.
The random uncertainty of the calculated test section Mach number is shown for ev-ery nominal Mach number set point in Table 4. This table also shows how each of themeasurement parameters in the facility contribute to the combined random uncertainty.
NominalMach
TypicalMts
sMts
k = 2sMts
due tosPT,bm
k = 2
sMts
due tosPS,bal
k = 2
sMts
UPCdue tosPT,bm
sMts
UPCdue tosPS,bal
0.25 0.25 0.0001 0.0001 0.0001 45.2 54.80.40 0.41 0.0002 0.0001 0.0002 9.5 90.50.60 0.60 0.0001 0.0000 0.0001 17.1 82.90.80 0.81 0.0004 0.0000 0.0004 0.8 99.21.00 1.00 0.0006 0.0000 0.0006 0.7 99.31.20 1.18 0.0017 0.0001 0.0017 0.2 99.81.40 1.35 0.0027 0.0001 0.0027 0.1 99.91.60 1.56 0.0019 0.0004 0.0018 4.9 95.11.80 1.78 0.0042 0.0009 0.0041 4.2 95.82.00 1.99 0.0023 0.0005 0.0022 4.4 95.6
Table 4: Summary of calculated Mach Number random uncertainty with 95% level of confi-dence for configuration 1.
5.1.2 Static Pressure
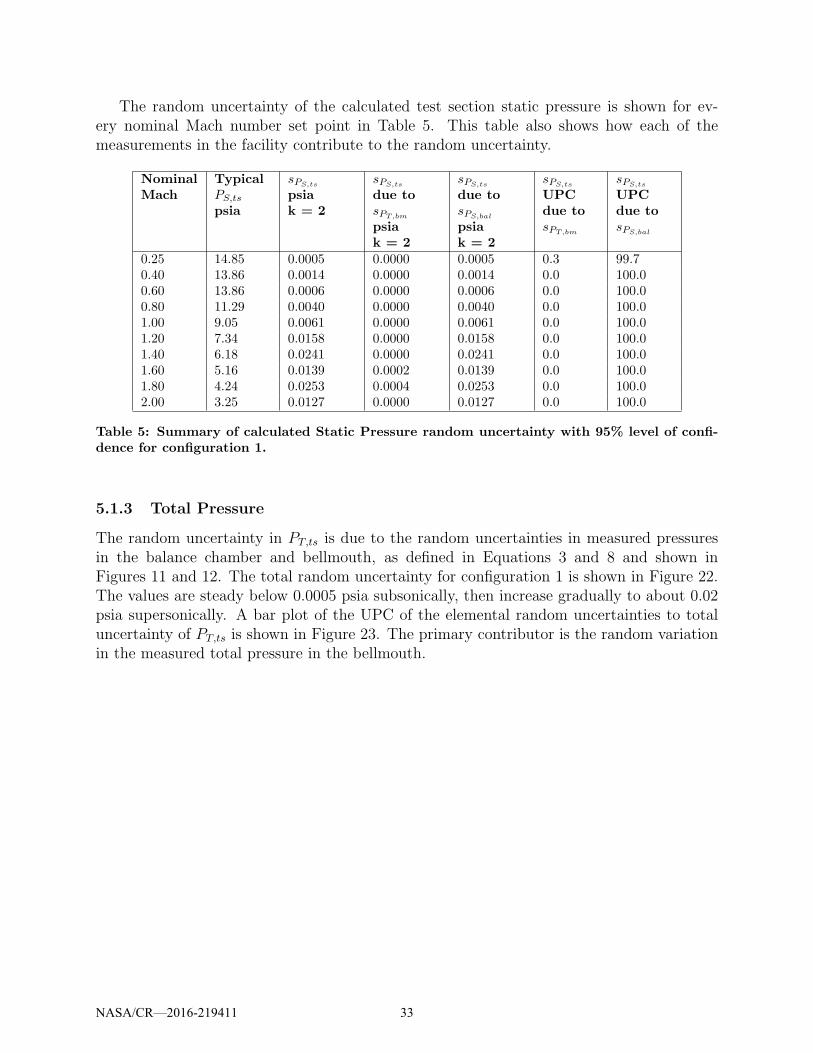
The random uncertainty in PS,ts is a result of random uncertainty in the measured pressuresPT,bm and PS,bal (see Equation 2 and Figure 13). The combined random uncertainty for con-figuration 1 is shown in Figure 20. The total uncertainty in static pressure calculation dueto random uncertainty sources is below 0.002 psia subsonically, increases in the transonic re-gion, and bounces between 0.03 psia and 0.01 psia supersonically. A bar plot of the elemental
NASA/CR—2016-219411 31
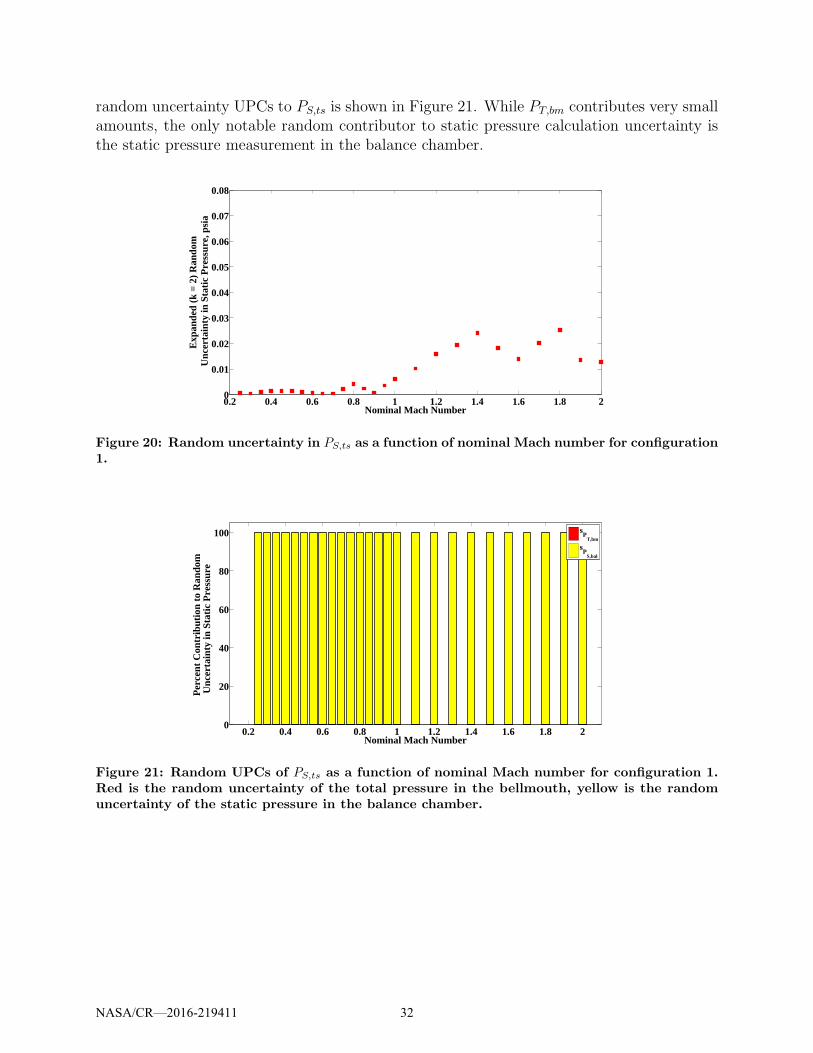
random uncertainty UPCs to PS,ts is shown in Figure 21. While PT,bm contributes very smallamounts, the only notable random contributor to static pressure calculation uncertainty isthe static pressure measurement in the balance chamber.
0.2 0.4 0.6 0.8 1 1.2 1.4 1.6 1.8 20
0.01
0.02
0.03
0.04
0.05
0.06
0.07
0.08
Nominal Mach Number
Exp
ande
d (k
= 2
) R
ando
m U
ncer
tain
ty in
Sta
tic P
ress
ure,
psi
a
Figure 20: Random uncertainty in PS,ts as a function of nominal Mach number for configuration1.
0.2 0.4 0.6 0.8 1 1.2 1.4 1.6 1.8 20
20
40
60
80
100
Nominal Mach Number
Per
cent
Con
trib
utio
n to
Ran
dom
U
ncer
tain
ty in
Sta
tic P
ress
ure
sP
T,bm
sP
S,bal
Figure 21: Random UPCs of PS,ts as a function of nominal Mach number for configuration 1.Red is the random uncertainty of the total pressure in the bellmouth, yellow is the randomuncertainty of the static pressure in the balance chamber.
NASA/CR—2016-219411 32
The random uncertainty of the calculated test section static pressure is shown for ev-ery nominal Mach number set point in Table 5. This table also shows how each of themeasurements in the facility contribute to the random uncertainty.
NominalMach
TypicalPS,ts
psia
sPS,ts
psiak = 2
sPS,ts
due tosPT,bm
psiak = 2
sPS,ts
due tosPS,bal
psiak = 2
sPS,ts
UPCdue tosPT,bm
sPS,ts
UPCdue tosPS,bal
0.25 14.85 0.0005 0.0000 0.0005 0.3 99.70.40 13.86 0.0014 0.0000 0.0014 0.0 100.00.60 13.86 0.0006 0.0000 0.0006 0.0 100.00.80 11.29 0.0040 0.0000 0.0040 0.0 100.01.00 9.05 0.0061 0.0000 0.0061 0.0 100.01.20 7.34 0.0158 0.0000 0.0158 0.0 100.01.40 6.18 0.0241 0.0000 0.0241 0.0 100.01.60 5.16 0.0139 0.0002 0.0139 0.0 100.01.80 4.24 0.0253 0.0004 0.0253 0.0 100.02.00 3.25 0.0127 0.0000 0.0127 0.0 100.0
Table 5: Summary of calculated Static Pressure random uncertainty with 95% level of confi-dence for configuration 1.
5.1.3 Total Pressure
The random uncertainty in PT,ts is due to the random uncertainties in measured pressuresin the balance chamber and bellmouth, as defined in Equations 3 and 8 and shown inFigures 11 and 12. The total random uncertainty for configuration 1 is shown in Figure 22.The values are steady below 0.0005 psia subsonically, then increase gradually to about 0.02psia supersonically. A bar plot of the UPC of the elemental random uncertainties to totaluncertainty of PT,ts is shown in Figure 23. The primary contributor is the random variationin the measured total pressure in the bellmouth.
NASA/CR—2016-219411 33

0.2 0.4 0.6 0.8 1 1.2 1.4 1.6 1.8 20
0.02
0.04
0.06
0.08
0.1
0.12
Nominal Mach Number
Exp
ande
d (k
= 2
) R
ando
mU
ncer
tain
ty in
Tot
al P
ress
ure,
psi
a
Figure 22: Random uncertainty of PT,ts as a function of nominal Mach number for configuration1.
0.2 0.4 0.6 0.8 1 1.2 1.4 1.6 1.8 20
20
40
60
80
100
Nominal Mach Number
Per
cent
Con
trib
utio
n to
Ran
dom
U
ncer
tain
ty in
Tot
al P
ress
ure
sP
T,bm
sP
S,bal
Figure 23: Random UPC for PT,ts as a function of nominal Mach number for configuration1. Red is the random uncertainty of the total pressure in the bellmouth, and yellow is therandom uncertainty of the static pressure in the balance chamber.
The random uncertainty of the calculated test section total pressure for configuration 1is shown for every nominal Mach number set point in Table 6. This table also shows howeach of the measurements in the facility contribute to the random uncertainty.
NASA/CR—2016-219411 34
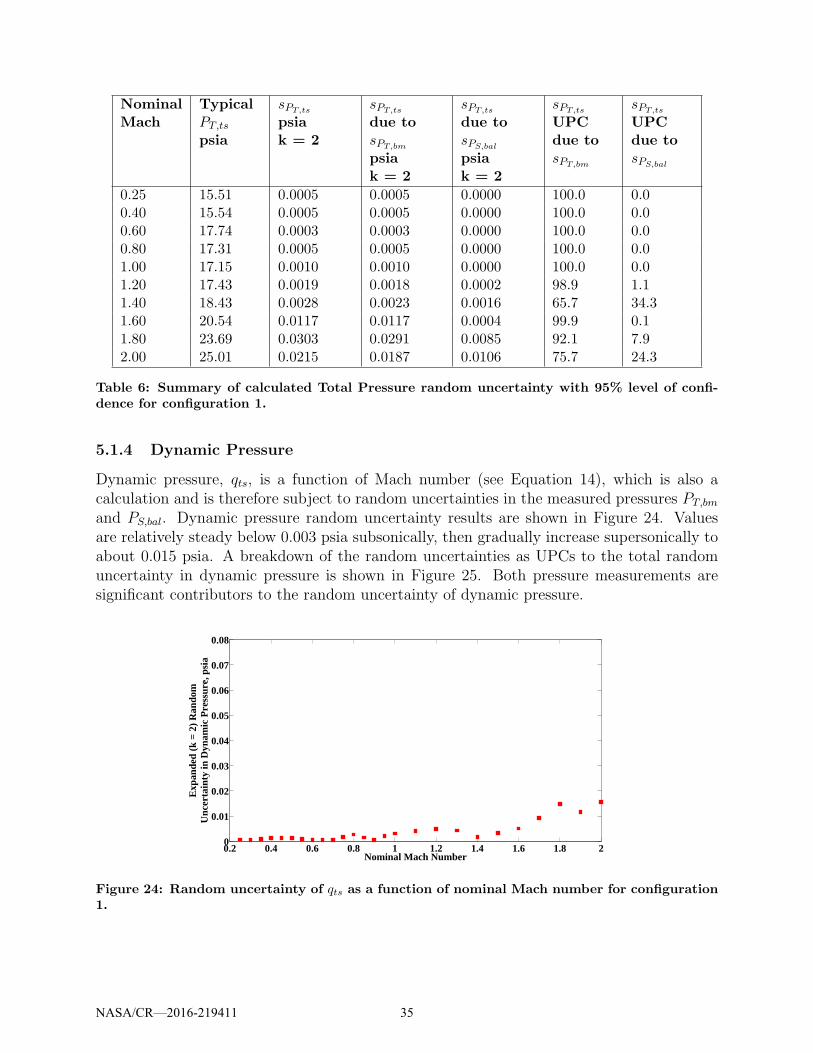
NominalMach
TypicalPT,ts
psia
sPT,ts
psiak = 2
sPT,ts
due tosPT,bm
psiak = 2
sPT,ts
due tosPS,bal
psiak = 2
sPT,ts
UPCdue tosPT,bm
sPT,ts
UPCdue tosPS,bal
0.25 15.51 0.0005 0.0005 0.0000 100.0 0.00.40 15.54 0.0005 0.0005 0.0000 100.0 0.00.60 17.74 0.0003 0.0003 0.0000 100.0 0.00.80 17.31 0.0005 0.0005 0.0000 100.0 0.01.00 17.15 0.0010 0.0010 0.0000 100.0 0.01.20 17.43 0.0019 0.0018 0.0002 98.9 1.11.40 18.43 0.0028 0.0023 0.0016 65.7 34.31.60 20.54 0.0117 0.0117 0.0004 99.9 0.11.80 23.69 0.0303 0.0291 0.0085 92.1 7.92.00 25.01 0.0215 0.0187 0.0106 75.7 24.3
Table 6: Summary of calculated Total Pressure random uncertainty with 95% level of confi-dence for configuration 1.
5.1.4 Dynamic Pressure
Dynamic pressure, qts, is a function of Mach number (see Equation 14), which is also acalculation and is therefore subject to random uncertainties in the measured pressures PT,bm
and PS,bal. Dynamic pressure random uncertainty results are shown in Figure 24. Valuesare relatively steady below 0.003 psia subsonically, then gradually increase supersonically toabout 0.015 psia. A breakdown of the random uncertainties as UPCs to the total randomuncertainty in dynamic pressure is shown in Figure 25. Both pressure measurements aresignificant contributors to the random uncertainty of dynamic pressure.
0.2 0.4 0.6 0.8 1 1.2 1.4 1.6 1.8 20
0.01
0.02
0.03
0.04
0.05
0.06
0.07
0.08
Nominal Mach Number
Exp
ande
d (k
= 2
) R
ando
mU
ncer
tain
ty in
Dyn
amic
Pre
ssur
e, p
sia
Figure 24: Random uncertainty of qts as a function of nominal Mach number for configuration1.
NASA/CR—2016-219411 35
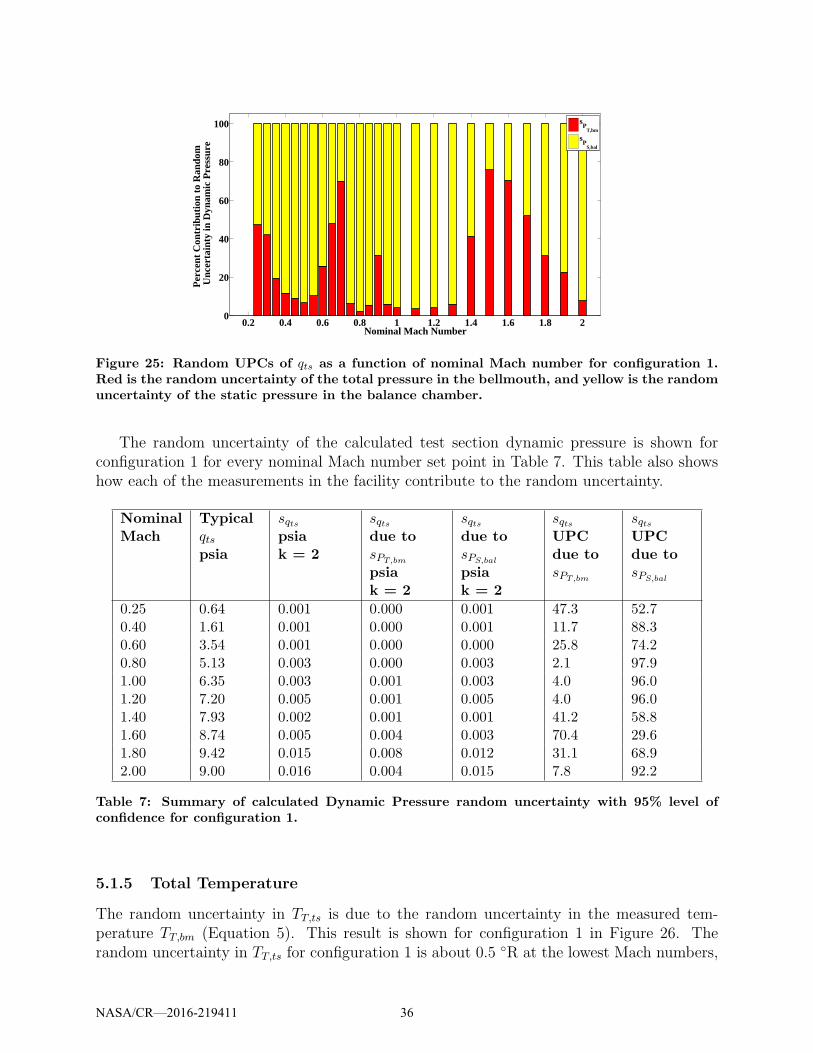
0.2 0.4 0.6 0.8 1 1.2 1.4 1.6 1.8 20
20
40
60
80
100
Nominal Mach Number
Per
cent
Con
trib
utio
n to
Ran
dom
U
ncer
tain
ty in
Dyn
amic
Pre
ssur
e
sP
T,bm
sP
S,bal
Figure 25: Random UPCs of qts as a function of nominal Mach number for configuration 1.Red is the random uncertainty of the total pressure in the bellmouth, and yellow is the randomuncertainty of the static pressure in the balance chamber.
The random uncertainty of the calculated test section dynamic pressure is shown forconfiguration 1 for every nominal Mach number set point in Table 7. This table also showshow each of the measurements in the facility contribute to the random uncertainty.
NominalMach
Typicalqtspsia
sqtspsiak = 2
sqtsdue tosPT,bm
psiak = 2
sqtsdue tosPS,bal
psiak = 2
sqtsUPCdue tosPT,bm
sqtsUPCdue tosPS,bal
0.25 0.64 0.001 0.000 0.001 47.3 52.70.40 1.61 0.001 0.000 0.001 11.7 88.30.60 3.54 0.001 0.000 0.000 25.8 74.20.80 5.13 0.003 0.000 0.003 2.1 97.91.00 6.35 0.003 0.001 0.003 4.0 96.01.20 7.20 0.005 0.001 0.005 4.0 96.01.40 7.93 0.002 0.001 0.001 41.2 58.81.60 8.74 0.005 0.004 0.003 70.4 29.61.80 9.42 0.015 0.008 0.012 31.1 68.92.00 9.00 0.016 0.004 0.015 7.8 92.2
Table 7: Summary of calculated Dynamic Pressure random uncertainty with 95% level ofconfidence for configuration 1.
5.1.5 Total Temperature
The random uncertainty in TT,ts is due to the random uncertainty in the measured tem-perature TT,bm (Equation 5). This result is shown for configuration 1 in Figure 26. Therandom uncertainty in TT,ts for configuration 1 is about 0.5 ◦R at the lowest Mach numbers,
NASA/CR—2016-219411 36
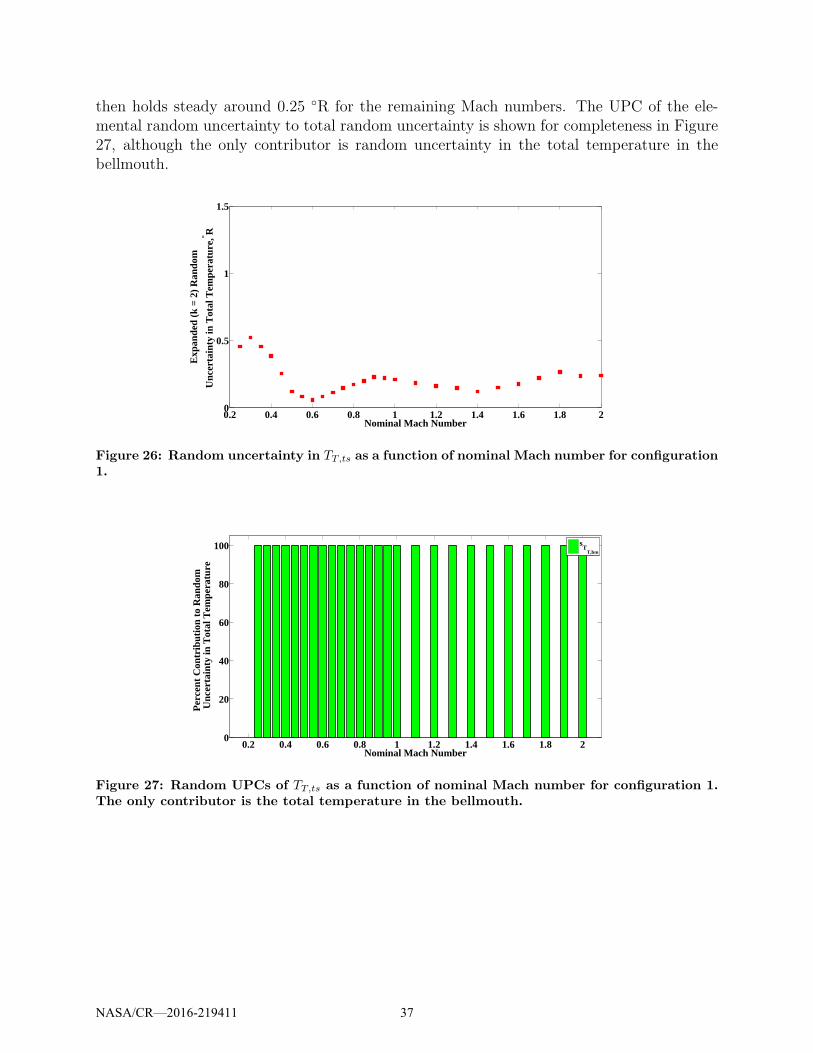
then holds steady around 0.25 ◦R for the remaining Mach numbers. The UPC of the ele-mental random uncertainty to total random uncertainty is shown for completeness in Figure27, although the only contributor is random uncertainty in the total temperature in thebellmouth.
0.2 0.4 0.6 0.8 1 1.2 1.4 1.6 1.8 20
0.5
1
1.5
Nominal Mach Number
Exp
ande
d (k
= 2
) R
ando
m
Unc
erta
inty
in T
otal
Tem
pera
ture
, ° R
Figure 26: Random uncertainty in TT,ts as a function of nominal Mach number for configuration1.
0.2 0.4 0.6 0.8 1 1.2 1.4 1.6 1.8 20
20
40
60
80
100
Nominal Mach Number
Per
cent
Con
trib
utio
n to
Ran
dom
U
ncer
tain
ty in
Tot
al T
empe
ratu
re
sT
T,bm
Figure 27: Random UPCs of TT,ts as a function of nominal Mach number for configuration 1.The only contributor is the total temperature in the bellmouth.
NASA/CR—2016-219411 37
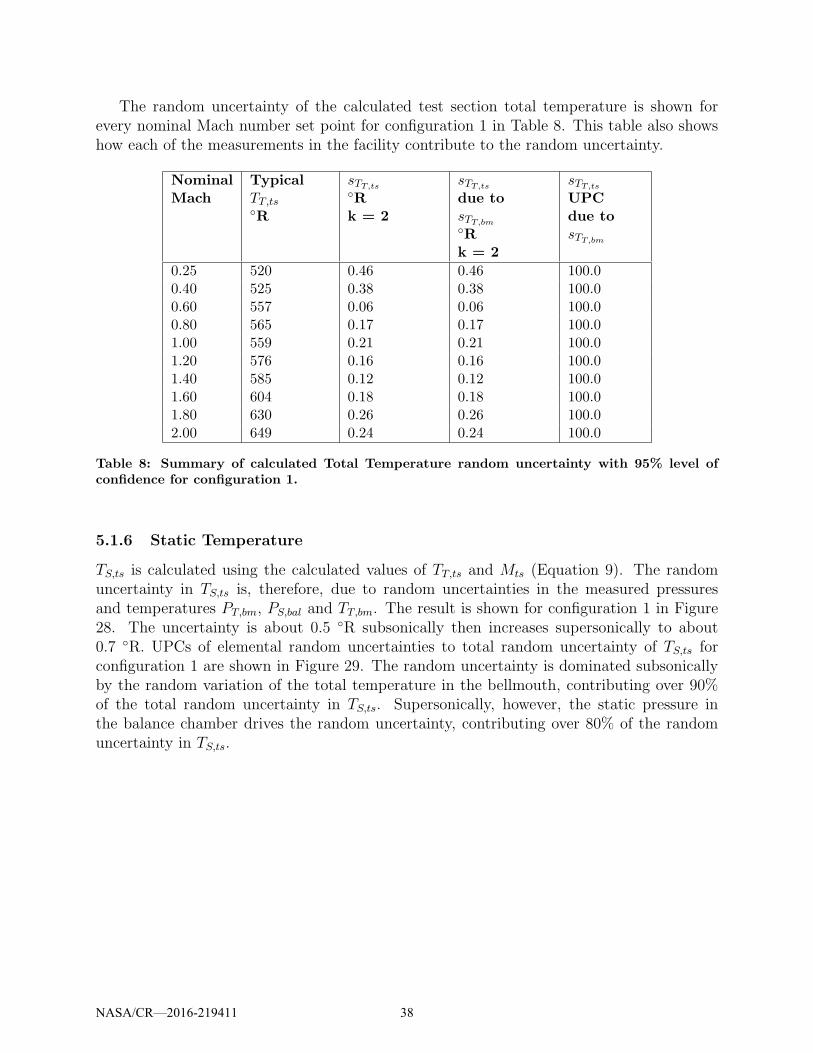
The random uncertainty of the calculated test section total temperature is shown forevery nominal Mach number set point for configuration 1 in Table 8. This table also showshow each of the measurements in the facility contribute to the random uncertainty.
NominalMach
TypicalTT,ts◦R
sTT,ts◦Rk = 2
sTT,ts
due tosTT,bm◦Rk = 2
sTT,ts
UPCdue tosTT,bm
0.25 520 0.46 0.46 100.00.40 525 0.38 0.38 100.00.60 557 0.06 0.06 100.00.80 565 0.17 0.17 100.01.00 559 0.21 0.21 100.01.20 576 0.16 0.16 100.01.40 585 0.12 0.12 100.01.60 604 0.18 0.18 100.01.80 630 0.26 0.26 100.02.00 649 0.24 0.24 100.0
Table 8: Summary of calculated Total Temperature random uncertainty with 95% level ofconfidence for configuration 1.
5.1.6 Static Temperature
TS,ts is calculated using the calculated values of TT,ts and Mts (Equation 9). The randomuncertainty in TS,ts is, therefore, due to random uncertainties in the measured pressuresand temperatures PT,bm, PS,bal and TT,bm. The result is shown for configuration 1 in Figure28. The uncertainty is about 0.5 ◦R subsonically then increases supersonically to about0.7 ◦R. UPCs of elemental random uncertainties to total random uncertainty of TS,ts forconfiguration 1 are shown in Figure 29. The random uncertainty is dominated subsonicallyby the random variation of the total temperature in the bellmouth, contributing over 90%of the total random uncertainty in TS,ts. Supersonically, however, the static pressure inthe balance chamber drives the random uncertainty, contributing over 80% of the randomuncertainty in TS,ts.
NASA/CR—2016-219411 38
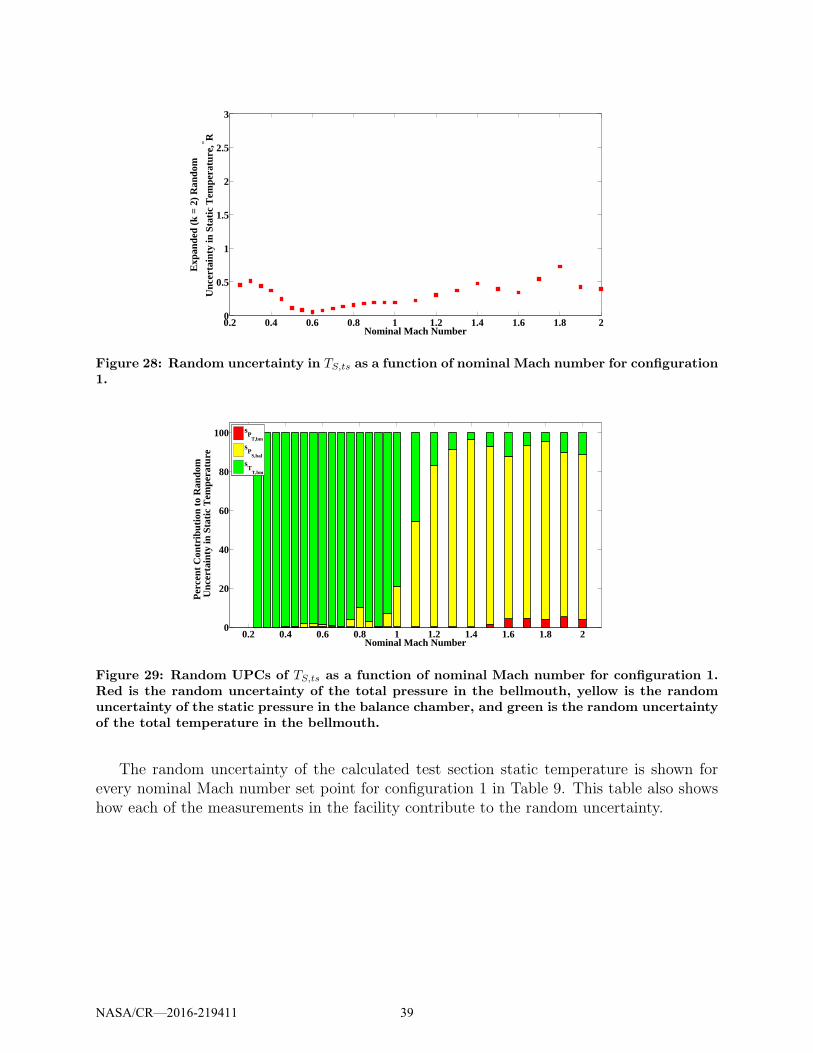
0.2 0.4 0.6 0.8 1 1.2 1.4 1.6 1.8 20
0.5
1
1.5
2
2.5
3
Nominal Mach Number
Exp
ande
d (k
= 2
) R
ando
m
Unc
erta
inty
in S
tatic
Tem
pera
ture
, ° R
Figure 28: Random uncertainty in TS,ts as a function of nominal Mach number for configuration1.
0.2 0.4 0.6 0.8 1 1.2 1.4 1.6 1.8 20
20
40
60
80
100
Nominal Mach Number
Per
cent
Con
trib
utio
n to
Ran
dom
U
ncer
tain
ty in
Sta
tic T
empe
ratu
re
sP
T,bm
sP
S,bal
sT
T,bm
Figure 29: Random UPCs of TS,ts as a function of nominal Mach number for configuration 1.Red is the random uncertainty of the total pressure in the bellmouth, yellow is the randomuncertainty of the static pressure in the balance chamber, and green is the random uncertaintyof the total temperature in the bellmouth.
The random uncertainty of the calculated test section static temperature is shown forevery nominal Mach number set point for configuration 1 in Table 9. This table also showshow each of the measurements in the facility contribute to the random uncertainty.
NASA/CR—2016-219411 39
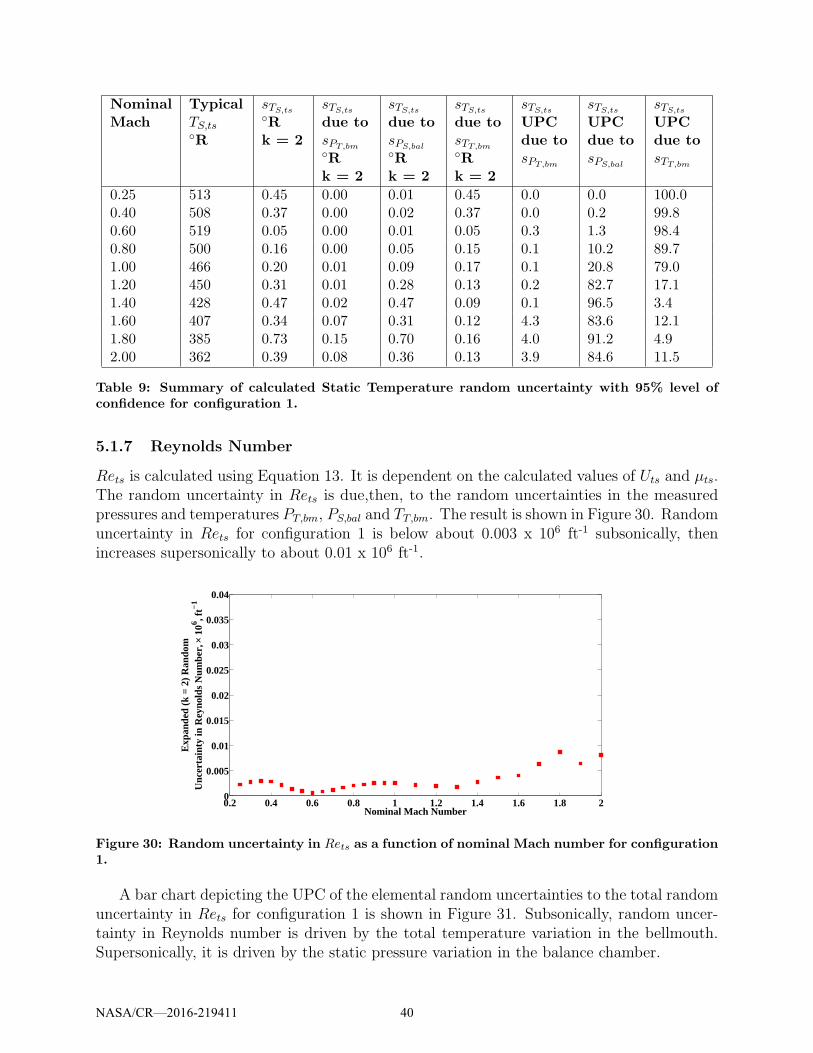
NominalMach
TypicalTS,ts◦R
sTS,ts◦Rk = 2
sTS,ts
due tosPT,bm◦Rk = 2
sTS,ts
due tosPS,bal◦Rk = 2
sTS,ts
due tosTT,bm◦Rk = 2
sTS,ts
UPCdue tosPT,bm
sTS,ts
UPCdue tosPS,bal
sTS,ts
UPCdue tosTT,bm
0.25 513 0.45 0.00 0.01 0.45 0.0 0.0 100.00.40 508 0.37 0.00 0.02 0.37 0.0 0.2 99.80.60 519 0.05 0.00 0.01 0.05 0.3 1.3 98.40.80 500 0.16 0.00 0.05 0.15 0.1 10.2 89.71.00 466 0.20 0.01 0.09 0.17 0.1 20.8 79.01.20 450 0.31 0.01 0.28 0.13 0.2 82.7 17.11.40 428 0.47 0.02 0.47 0.09 0.1 96.5 3.41.60 407 0.34 0.07 0.31 0.12 4.3 83.6 12.11.80 385 0.73 0.15 0.70 0.16 4.0 91.2 4.92.00 362 0.39 0.08 0.36 0.13 3.9 84.6 11.5
Table 9: Summary of calculated Static Temperature random uncertainty with 95% level ofconfidence for configuration 1.
5.1.7 Reynolds Number
Rets is calculated using Equation 13. It is dependent on the calculated values of Uts and µts.The random uncertainty in Rets is due,then, to the random uncertainties in the measuredpressures and temperatures PT,bm, PS,bal and TT,bm. The result is shown in Figure 30. Randomuncertainty in Rets for configuration 1 is below about 0.003 x 106 ft-1 subsonically, thenincreases supersonically to about 0.01 x 106 ft-1.
0.2 0.4 0.6 0.8 1 1.2 1.4 1.6 1.8 20
0.005
0.01
0.015
0.02
0.025
0.03
0.035
0.04
Nominal Mach Number
Exp
ande
d (k
= 2
) R
ando
mU
ncer
tain
ty in
Rey
nold
s N
umbe
r, ×
106 , f
t−1
Figure 30: Random uncertainty in Rets as a function of nominal Mach number for configuration1.
A bar chart depicting the UPC of the elemental random uncertainties to the total randomuncertainty in Rets for configuration 1 is shown in Figure 31. Subsonically, random uncer-tainty in Reynolds number is driven by the total temperature variation in the bellmouth.Supersonically, it is driven by the static pressure variation in the balance chamber.
NASA/CR—2016-219411 40
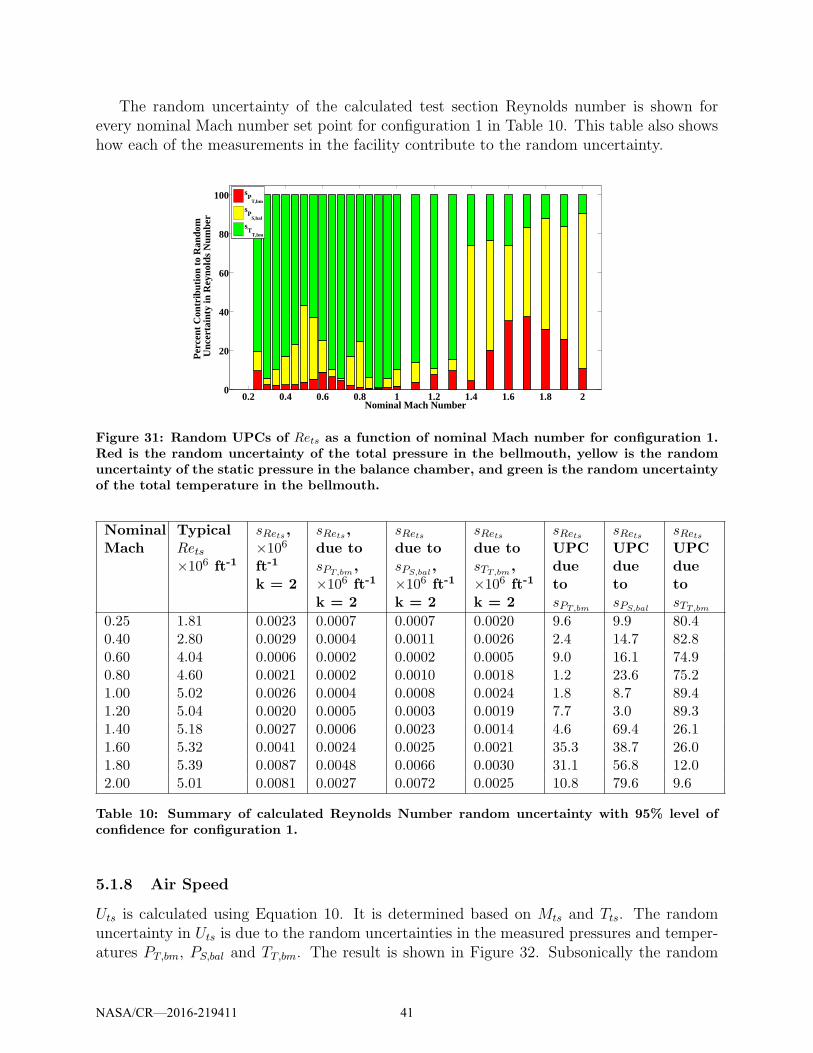
The random uncertainty of the calculated test section Reynolds number is shown forevery nominal Mach number set point for configuration 1 in Table 10. This table also showshow each of the measurements in the facility contribute to the random uncertainty.
0.2 0.4 0.6 0.8 1 1.2 1.4 1.6 1.8 20
20
40
60
80
100
Nominal Mach Number
Per
cent
Con
trib
utio
n to
Ran
dom
U
ncer
tain
ty in
Rey
nold
s N
umbe
r
sP
T,bm
sP
S,bal
sT
T,bm
Figure 31: Random UPCs of Rets as a function of nominal Mach number for configuration 1.Red is the random uncertainty of the total pressure in the bellmouth, yellow is the randomuncertainty of the static pressure in the balance chamber, and green is the random uncertaintyof the total temperature in the bellmouth.
NominalMach
TypicalRets×106 ft-1
sRets,×106
ft-1
k = 2
sRets,due tosPT,bm
,×106 ft-1
k = 2
sRets
due tosPS,bal
,×106 ft-1
k = 2
sRets
due tosTT,bm
,×106 ft-1
k = 2
sRets
UPCduetosPT,bm
sRets
UPCduetosPS,bal
sRets
UPCduetosTT,bm
0.25 1.81 0.0023 0.0007 0.0007 0.0020 9.6 9.9 80.40.40 2.80 0.0029 0.0004 0.0011 0.0026 2.4 14.7 82.80.60 4.04 0.0006 0.0002 0.0002 0.0005 9.0 16.1 74.90.80 4.60 0.0021 0.0002 0.0010 0.0018 1.2 23.6 75.21.00 5.02 0.0026 0.0004 0.0008 0.0024 1.8 8.7 89.41.20 5.04 0.0020 0.0005 0.0003 0.0019 7.7 3.0 89.31.40 5.18 0.0027 0.0006 0.0023 0.0014 4.6 69.4 26.11.60 5.32 0.0041 0.0024 0.0025 0.0021 35.3 38.7 26.01.80 5.39 0.0087 0.0048 0.0066 0.0030 31.1 56.8 12.02.00 5.01 0.0081 0.0027 0.0072 0.0025 10.8 79.6 9.6
Table 10: Summary of calculated Reynolds Number random uncertainty with 95% level ofconfidence for configuration 1.
5.1.8 Air Speed
Uts is calculated using Equation 10. It is determined based on Mts and Tts. The randomuncertainty in Uts is due to the random uncertainties in the measured pressures and temper-atures PT,bm, PS,bal and TT,bm. The result is shown in Figure 32. Subsonically the random
NASA/CR—2016-219411 41
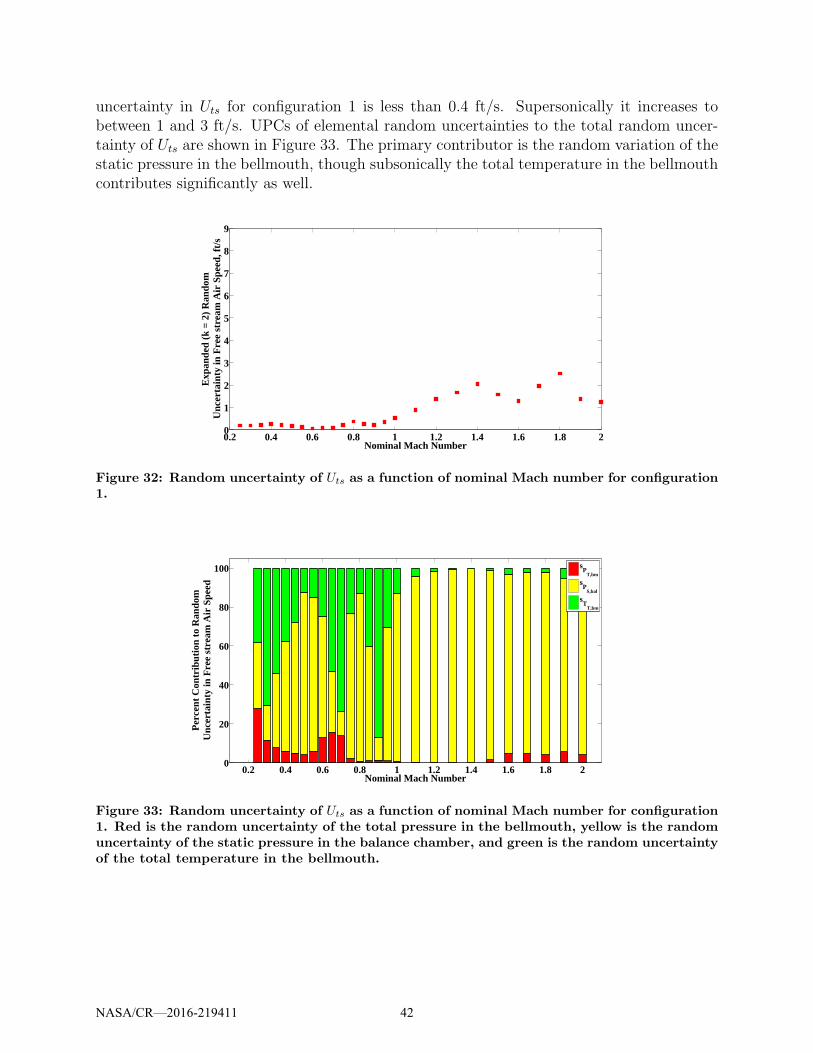
uncertainty in Uts for configuration 1 is less than 0.4 ft/s. Supersonically it increases tobetween 1 and 3 ft/s. UPCs of elemental random uncertainties to the total random uncer-tainty of Uts are shown in Figure 33. The primary contributor is the random variation of thestatic pressure in the bellmouth, though subsonically the total temperature in the bellmouthcontributes significantly as well.
0.2 0.4 0.6 0.8 1 1.2 1.4 1.6 1.8 20
1
2
3
4
5
6
7
8
9
Nominal Mach Number
Exp
ande
d (k
= 2
) R
ando
mU
ncer
tain
ty in
Fre
e st
ream
Air
Spe
ed, f
t/s
Figure 32: Random uncertainty of Uts as a function of nominal Mach number for configuration1.
0.2 0.4 0.6 0.8 1 1.2 1.4 1.6 1.8 20
20
40
60
80
100
Nominal Mach Number
Per
cent
Con
trib
utio
n to
Ran
dom
Unc
erta
inty
in F
ree
stre
am A
ir S
peed
sP
T,bm
sP
S,bal
sT
T,bm
Figure 33: Random uncertainty of Uts as a function of nominal Mach number for configuration1. Red is the random uncertainty of the total pressure in the bellmouth, yellow is the randomuncertainty of the static pressure in the balance chamber, and green is the random uncertaintyof the total temperature in the bellmouth.
NASA/CR—2016-219411 42
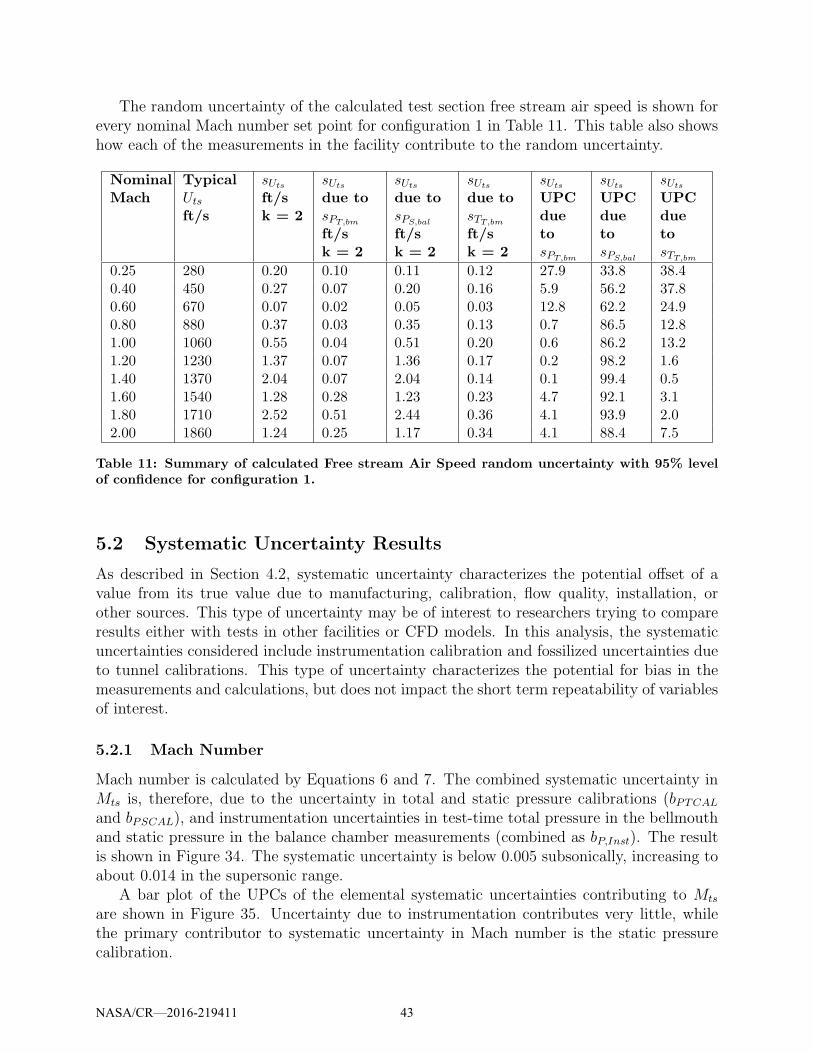
The random uncertainty of the calculated test section free stream air speed is shown forevery nominal Mach number set point for configuration 1 in Table 11. This table also showshow each of the measurements in the facility contribute to the random uncertainty.
NominalMach
TypicalUts
ft/s
sUts
ft/sk = 2
sUts
due tosPT,bm
ft/sk = 2
sUts
due tosPS,bal
ft/sk = 2
sUts
due tosTT,bm
ft/sk = 2
sUts
UPCduetosPT,bm
sUts
UPCduetosPS,bal
sUts
UPCduetosTT,bm
0.25 280 0.20 0.10 0.11 0.12 27.9 33.8 38.40.40 450 0.27 0.07 0.20 0.16 5.9 56.2 37.80.60 670 0.07 0.02 0.05 0.03 12.8 62.2 24.90.80 880 0.37 0.03 0.35 0.13 0.7 86.5 12.81.00 1060 0.55 0.04 0.51 0.20 0.6 86.2 13.21.20 1230 1.37 0.07 1.36 0.17 0.2 98.2 1.61.40 1370 2.04 0.07 2.04 0.14 0.1 99.4 0.51.60 1540 1.28 0.28 1.23 0.23 4.7 92.1 3.11.80 1710 2.52 0.51 2.44 0.36 4.1 93.9 2.02.00 1860 1.24 0.25 1.17 0.34 4.1 88.4 7.5
Table 11: Summary of calculated Free stream Air Speed random uncertainty with 95% levelof confidence for configuration 1.
5.2 Systematic Uncertainty Results
As described in Section 4.2, systematic uncertainty characterizes the potential offset of avalue from its true value due to manufacturing, calibration, flow quality, installation, orother sources. This type of uncertainty may be of interest to researchers trying to compareresults either with tests in other facilities or CFD models. In this analysis, the systematicuncertainties considered include instrumentation calibration and fossilized uncertainties dueto tunnel calibrations. This type of uncertainty characterizes the potential for bias in themeasurements and calculations, but does not impact the short term repeatability of variablesof interest.
5.2.1 Mach Number
Mach number is calculated by Equations 6 and 7. The combined systematic uncertainty inMts is, therefore, due to the uncertainty in total and static pressure calibrations (bPTCAL
and bPSCAL), and instrumentation uncertainties in test-time total pressure in the bellmouthand static pressure in the balance chamber measurements (combined as bP,Inst). The resultis shown in Figure 34. The systematic uncertainty is below 0.005 subsonically, increasing toabout 0.014 in the supersonic range.
A bar plot of the UPCs of the elemental systematic uncertainties contributing to Mts
are shown in Figure 35. Uncertainty due to instrumentation contributes very little, whilethe primary contributor to systematic uncertainty in Mach number is the static pressurecalibration.
NASA/CR—2016-219411 43
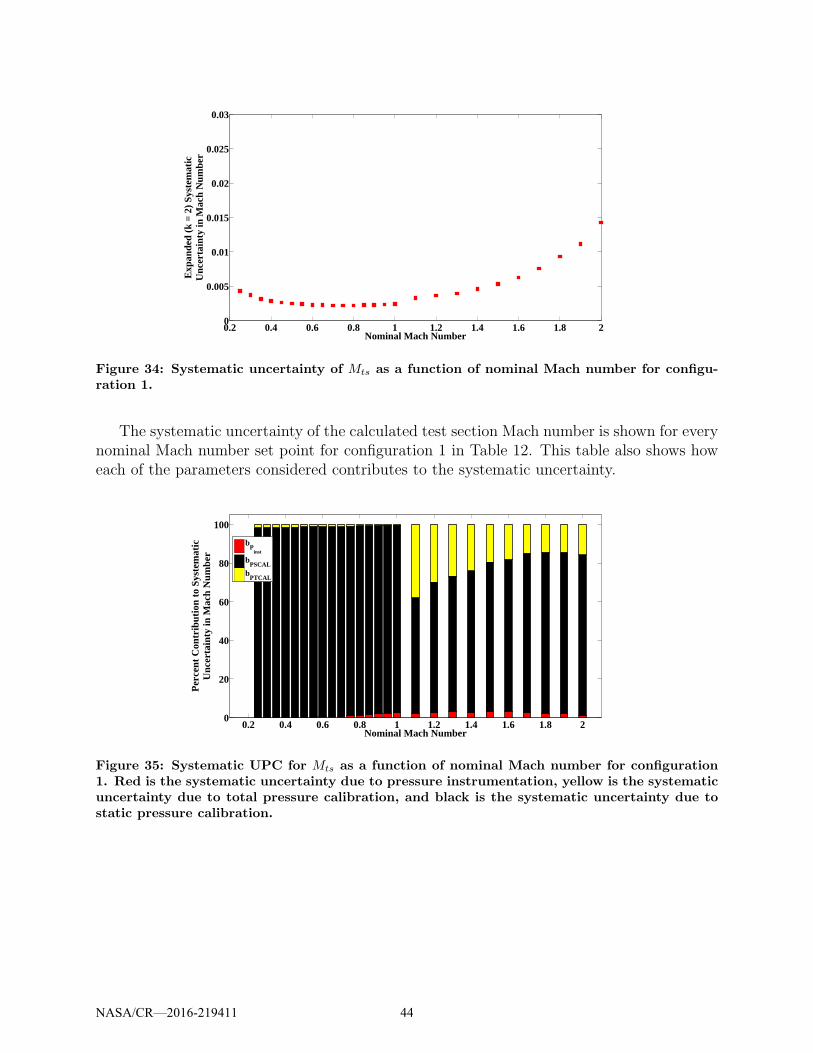
0.2 0.4 0.6 0.8 1 1.2 1.4 1.6 1.8 20
0.005
0.01
0.015
0.02
0.025
0.03
Nominal Mach Number
Exp
ande
d (k
= 2
) S
yste
mat
icU
ncer
tain
ty in
Mac
h N
umbe
r
Figure 34: Systematic uncertainty of Mts as a function of nominal Mach number for configu-ration 1.
The systematic uncertainty of the calculated test section Mach number is shown for everynominal Mach number set point for configuration 1 in Table 12. This table also shows howeach of the parameters considered contributes to the systematic uncertainty.
0.2 0.4 0.6 0.8 1 1.2 1.4 1.6 1.8 20
20
40
60
80
100
Nominal Mach Number
Per
cent
Con
trib
utio
n to
Sys
tem
atic
Unc
erta
inty
in M
ach
Num
ber
bP
inst
bPSCAL
bPTCAL
Figure 35: Systematic UPC for Mts as a function of nominal Mach number for configuration1. Red is the systematic uncertainty due to pressure instrumentation, yellow is the systematicuncertainty due to total pressure calibration, and black is the systematic uncertainty due tostatic pressure calibration.
NASA/CR—2016-219411 44
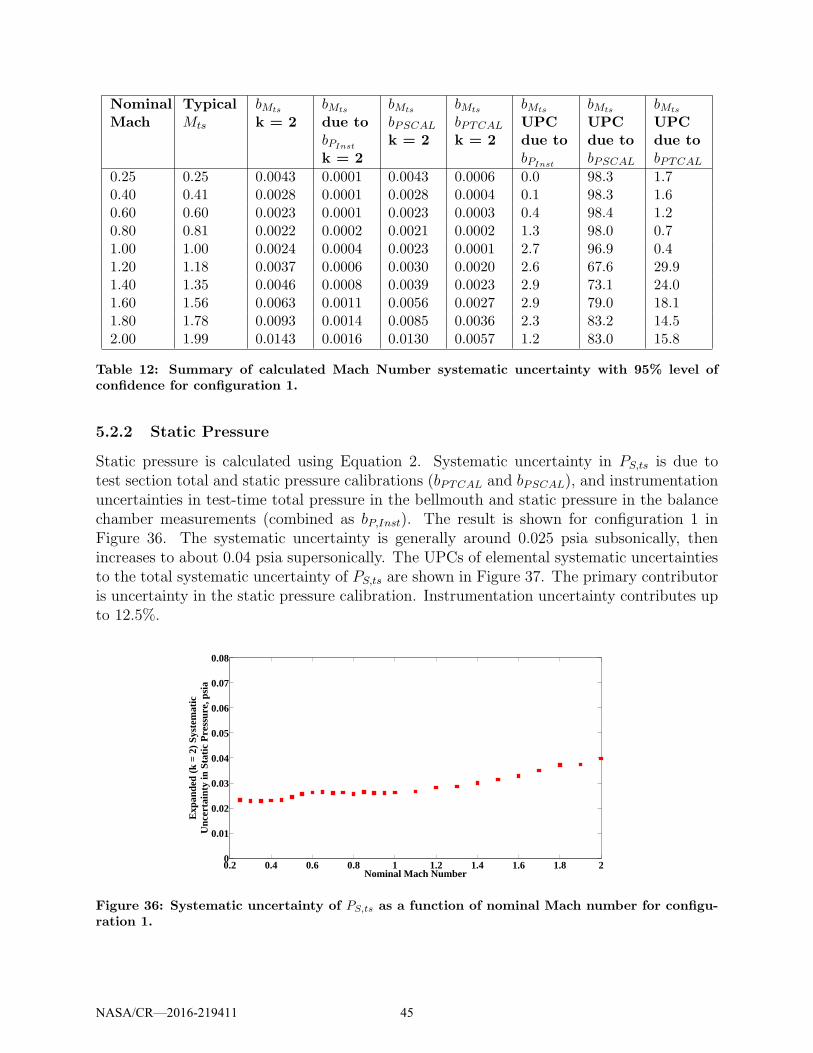
NominalMach
TypicalMts
bMts
k = 2bMts
due tobPInst
k = 2
bMts
bPSCAL
k = 2
bMts
bPTCAL
k = 2
bMts
UPCdue tobPInst
bMts
UPCdue tobPSCAL
bMts
UPCdue tobPTCAL
0.25 0.25 0.0043 0.0001 0.0043 0.0006 0.0 98.3 1.70.40 0.41 0.0028 0.0001 0.0028 0.0004 0.1 98.3 1.60.60 0.60 0.0023 0.0001 0.0023 0.0003 0.4 98.4 1.20.80 0.81 0.0022 0.0002 0.0021 0.0002 1.3 98.0 0.71.00 1.00 0.0024 0.0004 0.0023 0.0001 2.7 96.9 0.41.20 1.18 0.0037 0.0006 0.0030 0.0020 2.6 67.6 29.91.40 1.35 0.0046 0.0008 0.0039 0.0023 2.9 73.1 24.01.60 1.56 0.0063 0.0011 0.0056 0.0027 2.9 79.0 18.11.80 1.78 0.0093 0.0014 0.0085 0.0036 2.3 83.2 14.52.00 1.99 0.0143 0.0016 0.0130 0.0057 1.2 83.0 15.8
Table 12: Summary of calculated Mach Number systematic uncertainty with 95% level ofconfidence for configuration 1.
5.2.2 Static Pressure
Static pressure is calculated using Equation 2. Systematic uncertainty in PS,ts is due totest section total and static pressure calibrations (bPTCAL and bPSCAL), and instrumentationuncertainties in test-time total pressure in the bellmouth and static pressure in the balancechamber measurements (combined as bP,Inst). The result is shown for configuration 1 inFigure 36. The systematic uncertainty is generally around 0.025 psia subsonically, thenincreases to about 0.04 psia supersonically. The UPCs of elemental systematic uncertaintiesto the total systematic uncertainty of PS,ts are shown in Figure 37. The primary contributoris uncertainty in the static pressure calibration. Instrumentation uncertainty contributes upto 12.5%.
0.2 0.4 0.6 0.8 1 1.2 1.4 1.6 1.8 20
0.01
0.02
0.03
0.04
0.05
0.06
0.07
0.08
Nominal Mach Number
Exp
ande
d (k
= 2
) S
yste
mat
icU
ncer
tain
ty in
Sta
tic P
ress
ure,
psi
a
Figure 36: Systematic uncertainty of PS,ts as a function of nominal Mach number for configu-ration 1.
NASA/CR—2016-219411 45
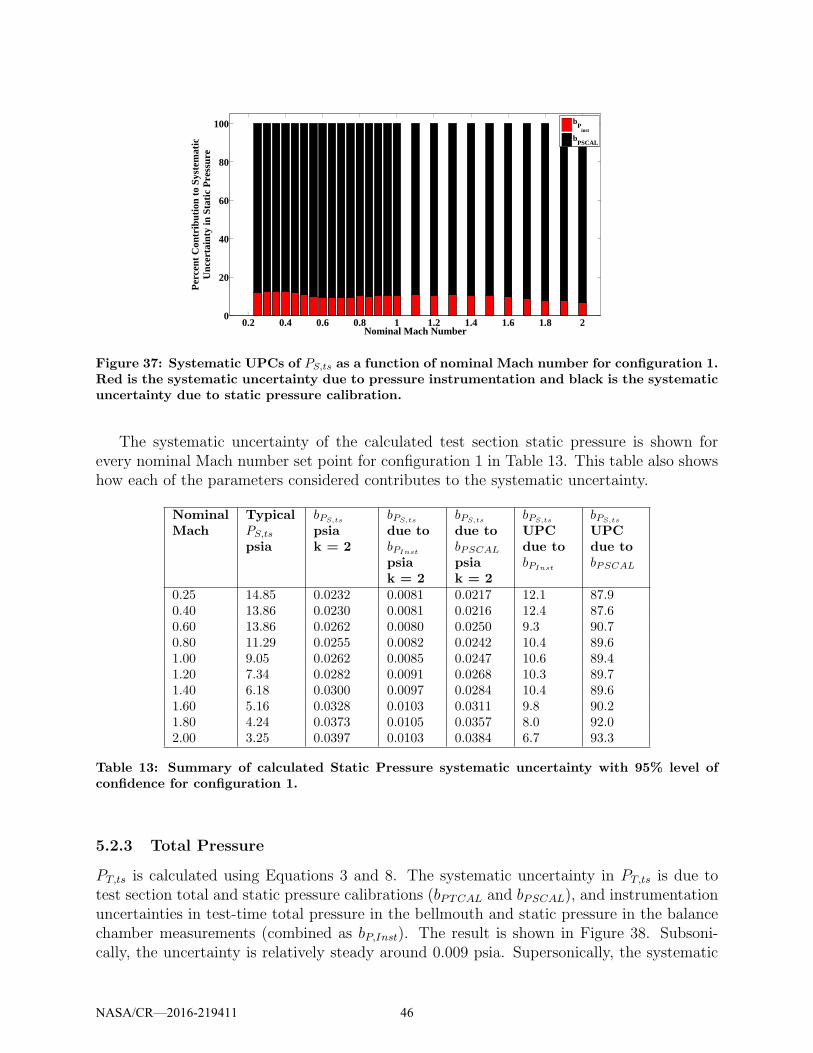
0.2 0.4 0.6 0.8 1 1.2 1.4 1.6 1.8 20
20
40
60
80
100
Nominal Mach Number
Per
cent
Con
trib
utio
n to
Sys
tem
atic
Unc
erta
inty
in S
tatic
Pre
ssur
e
b
Pinst
bPSCAL
Figure 37: Systematic UPCs of PS,ts as a function of nominal Mach number for configuration 1.Red is the systematic uncertainty due to pressure instrumentation and black is the systematicuncertainty due to static pressure calibration.
The systematic uncertainty of the calculated test section static pressure is shown forevery nominal Mach number set point for configuration 1 in Table 13. This table also showshow each of the parameters considered contributes to the systematic uncertainty.
NominalMach
TypicalPS,ts
psia
bPS,ts
psiak = 2
bPS,ts
due tobPInst
psiak = 2
bPS,ts
due tobPSCAL
psiak = 2
bPS,ts
UPCdue tobPInst
bPS,ts
UPCdue tobPSCAL
0.25 14.85 0.0232 0.0081 0.0217 12.1 87.90.40 13.86 0.0230 0.0081 0.0216 12.4 87.60.60 13.86 0.0262 0.0080 0.0250 9.3 90.70.80 11.29 0.0255 0.0082 0.0242 10.4 89.61.00 9.05 0.0262 0.0085 0.0247 10.6 89.41.20 7.34 0.0282 0.0091 0.0268 10.3 89.71.40 6.18 0.0300 0.0097 0.0284 10.4 89.61.60 5.16 0.0328 0.0103 0.0311 9.8 90.21.80 4.24 0.0373 0.0105 0.0357 8.0 92.02.00 3.25 0.0397 0.0103 0.0384 6.7 93.3
Table 13: Summary of calculated Static Pressure systematic uncertainty with 95% level ofconfidence for configuration 1.
5.2.3 Total Pressure
PT,ts is calculated using Equations 3 and 8. The systematic uncertainty in PT,ts is due totest section total and static pressure calibrations (bPTCAL and bPSCAL), and instrumentationuncertainties in test-time total pressure in the bellmouth and static pressure in the balancechamber measurements (combined as bP,Inst). The result is shown in Figure 38. Subsoni-cally, the uncertainty is relatively steady around 0.009 psia. Supersonically, the systematic
NASA/CR—2016-219411 46
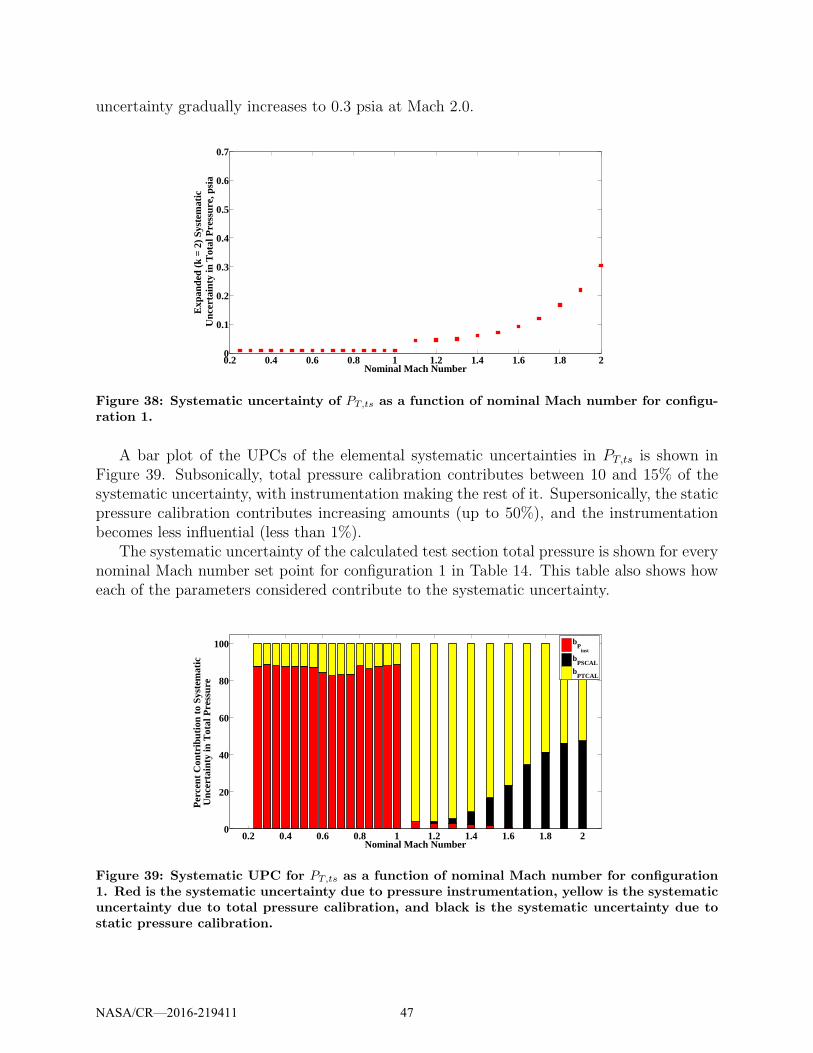
uncertainty gradually increases to 0.3 psia at Mach 2.0.
0.2 0.4 0.6 0.8 1 1.2 1.4 1.6 1.8 20
0.1
0.2
0.3
0.4
0.5
0.6
0.7
Nominal Mach Number
Exp
ande
d (k
= 2
) S
yste
mat
icU
ncer
tain
ty in
Tot
al P
ress
ure,
psi
a
Figure 38: Systematic uncertainty of PT,ts as a function of nominal Mach number for configu-ration 1.
A bar plot of the UPCs of the elemental systematic uncertainties in PT,ts is shown inFigure 39. Subsonically, total pressure calibration contributes between 10 and 15% of thesystematic uncertainty, with instrumentation making the rest of it. Supersonically, the staticpressure calibration contributes increasing amounts (up to 50%), and the instrumentationbecomes less influential (less than 1%).
The systematic uncertainty of the calculated test section total pressure is shown for everynominal Mach number set point for configuration 1 in Table 14. This table also shows howeach of the parameters considered contribute to the systematic uncertainty.
0.2 0.4 0.6 0.8 1 1.2 1.4 1.6 1.8 20
20
40
60
80
100
Nominal Mach Number
Per
cent
Con
trib
utio
n to
Sys
tem
atic
U
ncer
tain
ty in
Tot
al P
ress
ure
b
Pinst
bPSCAL
bPTCAL
Figure 39: Systematic UPC for PT,ts as a function of nominal Mach number for configuration1. Red is the systematic uncertainty due to pressure instrumentation, yellow is the systematicuncertainty due to total pressure calibration, and black is the systematic uncertainty due tostatic pressure calibration.
NASA/CR—2016-219411 47
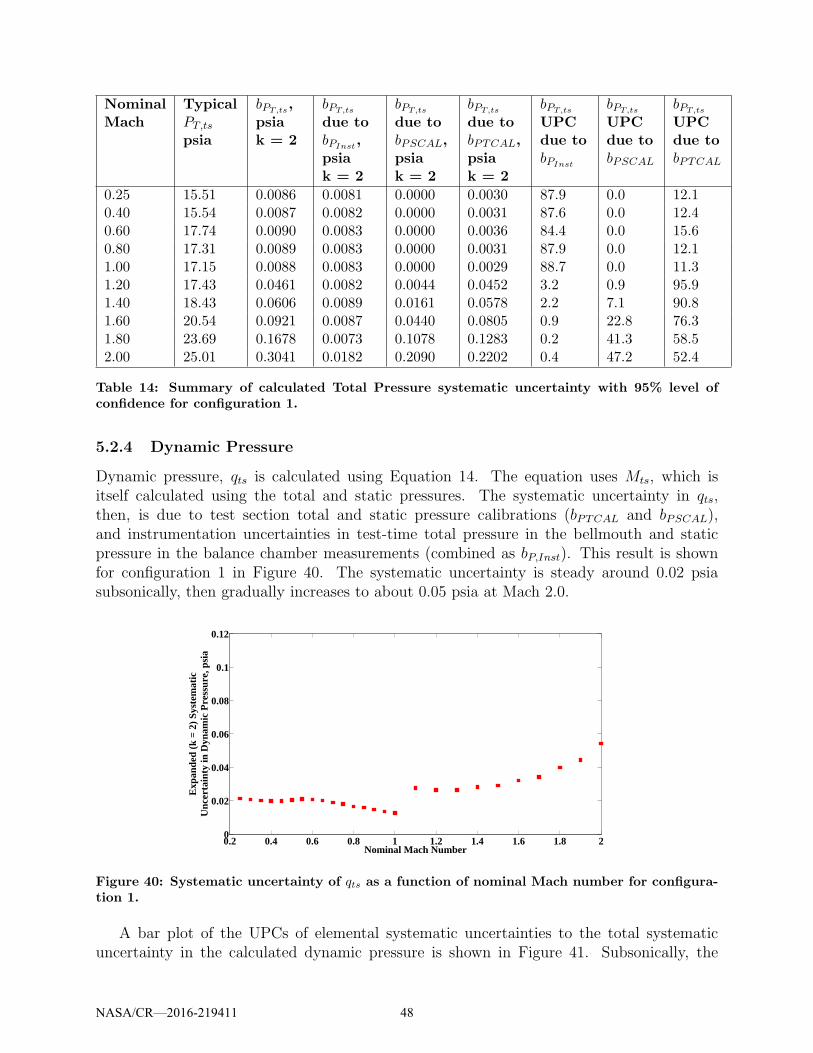
NominalMach
TypicalPT,ts
psia
bPT,ts,
psiak = 2
bPT,ts
due tobPInst
,psiak = 2
bPT,ts
due tobPSCAL,psiak = 2
bPT,ts
due tobPTCAL,psiak = 2
bPT,ts
UPCdue tobPInst
bPT,ts
UPCdue tobPSCAL
bPT,ts
UPCdue tobPTCAL
0.25 15.51 0.0086 0.0081 0.0000 0.0030 87.9 0.0 12.10.40 15.54 0.0087 0.0082 0.0000 0.0031 87.6 0.0 12.40.60 17.74 0.0090 0.0083 0.0000 0.0036 84.4 0.0 15.60.80 17.31 0.0089 0.0083 0.0000 0.0031 87.9 0.0 12.11.00 17.15 0.0088 0.0083 0.0000 0.0029 88.7 0.0 11.31.20 17.43 0.0461 0.0082 0.0044 0.0452 3.2 0.9 95.91.40 18.43 0.0606 0.0089 0.0161 0.0578 2.2 7.1 90.81.60 20.54 0.0921 0.0087 0.0440 0.0805 0.9 22.8 76.31.80 23.69 0.1678 0.0073 0.1078 0.1283 0.2 41.3 58.52.00 25.01 0.3041 0.0182 0.2090 0.2202 0.4 47.2 52.4
Table 14: Summary of calculated Total Pressure systematic uncertainty with 95% level ofconfidence for configuration 1.
5.2.4 Dynamic Pressure
Dynamic pressure, qts is calculated using Equation 14. The equation uses Mts, which isitself calculated using the total and static pressures. The systematic uncertainty in qts,then, is due to test section total and static pressure calibrations (bPTCAL and bPSCAL),and instrumentation uncertainties in test-time total pressure in the bellmouth and staticpressure in the balance chamber measurements (combined as bP,Inst). This result is shownfor configuration 1 in Figure 40. The systematic uncertainty is steady around 0.02 psiasubsonically, then gradually increases to about 0.05 psia at Mach 2.0.
0.2 0.4 0.6 0.8 1 1.2 1.4 1.6 1.8 20
0.02
0.04
0.06
0.08
0.1
0.12
Nominal Mach Number
Exp
ande
d (k
= 2
) S
yste
mat
icU
ncer
tain
ty in
Dyn
amic
Pre
ssur
e, p
sia
Figure 40: Systematic uncertainty of qts as a function of nominal Mach number for configura-tion 1.
A bar plot of the UPCs of elemental systematic uncertainties to the total systematicuncertainty in the calculated dynamic pressure is shown in Figure 41. Subsonically, the
NASA/CR—2016-219411 48
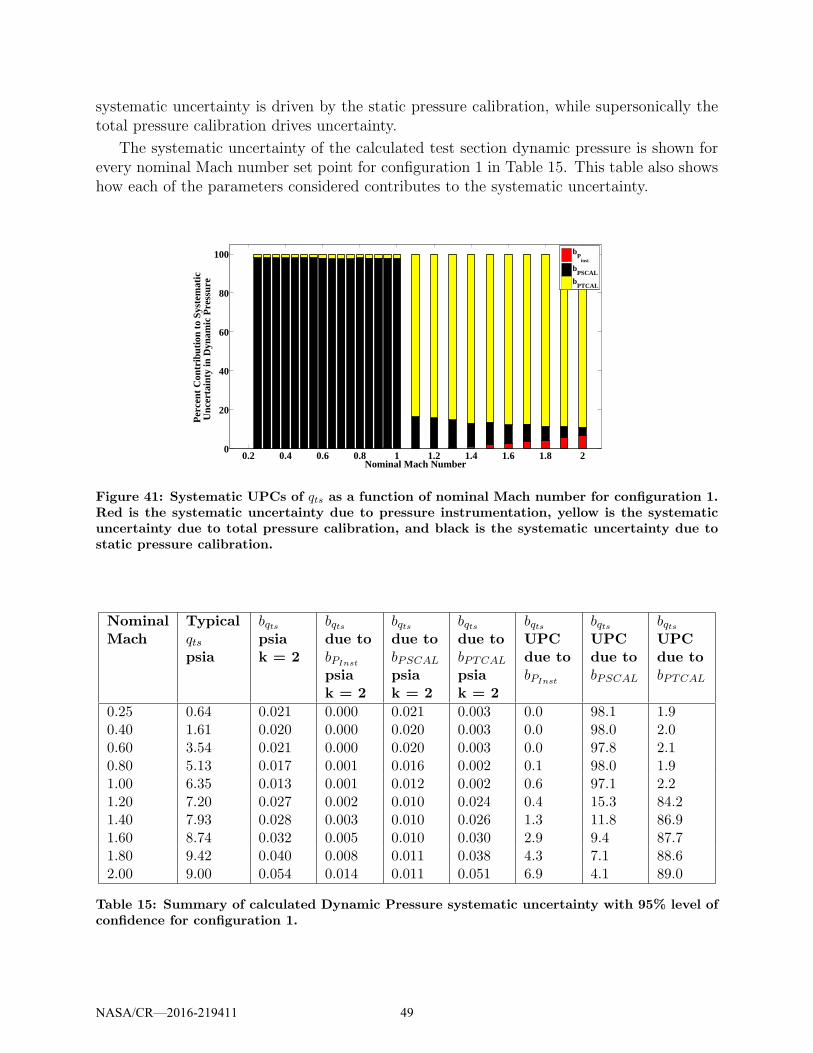
systematic uncertainty is driven by the static pressure calibration, while supersonically thetotal pressure calibration drives uncertainty.
The systematic uncertainty of the calculated test section dynamic pressure is shown forevery nominal Mach number set point for configuration 1 in Table 15. This table also showshow each of the parameters considered contributes to the systematic uncertainty.
0.2 0.4 0.6 0.8 1 1.2 1.4 1.6 1.8 20
20
40
60
80
100
Nominal Mach Number
Per
cent
Con
trib
utio
n to
Sys
tem
atic
U
ncer
tain
ty in
Dyn
amic
Pre
ssur
e
b
Pinst
bPSCAL
bPTCAL
Figure 41: Systematic UPCs of qts as a function of nominal Mach number for configuration 1.Red is the systematic uncertainty due to pressure instrumentation, yellow is the systematicuncertainty due to total pressure calibration, and black is the systematic uncertainty due tostatic pressure calibration.
NominalMach
Typicalqtspsia
bqtspsiak = 2
bqtsdue tobPInst
psiak = 2
bqtsdue tobPSCAL
psiak = 2
bqtsdue tobPTCAL
psiak = 2
bqtsUPCdue tobPInst
bqtsUPCdue tobPSCAL
bqtsUPCdue tobPTCAL
0.25 0.64 0.021 0.000 0.021 0.003 0.0 98.1 1.90.40 1.61 0.020 0.000 0.020 0.003 0.0 98.0 2.00.60 3.54 0.021 0.000 0.020 0.003 0.0 97.8 2.10.80 5.13 0.017 0.001 0.016 0.002 0.1 98.0 1.91.00 6.35 0.013 0.001 0.012 0.002 0.6 97.1 2.21.20 7.20 0.027 0.002 0.010 0.024 0.4 15.3 84.21.40 7.93 0.028 0.003 0.010 0.026 1.3 11.8 86.91.60 8.74 0.032 0.005 0.010 0.030 2.9 9.4 87.71.80 9.42 0.040 0.008 0.011 0.038 4.3 7.1 88.62.00 9.00 0.054 0.014 0.011 0.051 6.9 4.1 89.0
Table 15: Summary of calculated Dynamic Pressure systematic uncertainty with 95% level ofconfidence for configuration 1.
NASA/CR—2016-219411 49
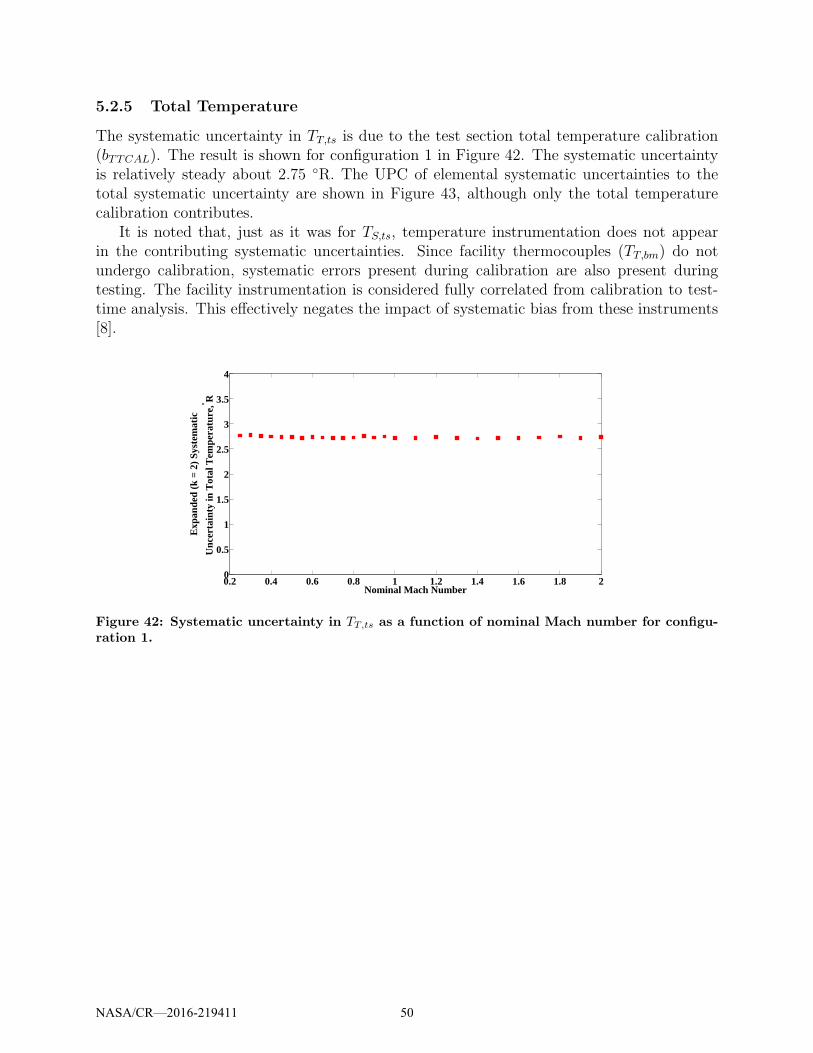
5.2.5 Total Temperature
The systematic uncertainty in TT,ts is due to the test section total temperature calibration(bTTCAL). The result is shown for configuration 1 in Figure 42. The systematic uncertaintyis relatively steady about 2.75 ◦R. The UPC of elemental systematic uncertainties to thetotal systematic uncertainty are shown in Figure 43, although only the total temperaturecalibration contributes.
It is noted that, just as it was for TS,ts, temperature instrumentation does not appearin the contributing systematic uncertainties. Since facility thermocouples (TT,bm) do notundergo calibration, systematic errors present during calibration are also present duringtesting. The facility instrumentation is considered fully correlated from calibration to test-time analysis. This effectively negates the impact of systematic bias from these instruments[8].
0.2 0.4 0.6 0.8 1 1.2 1.4 1.6 1.8 20
0.5
1
1.5
2
2.5
3
3.5
4
Nominal Mach Number
Exp
ande
d (k
= 2
) S
yste
mat
ic
Unc
erta
inty
in T
otal
Tem
pera
ture
, ° R
Figure 42: Systematic uncertainty in TT,ts as a function of nominal Mach number for configu-ration 1.
NASA/CR—2016-219411 50
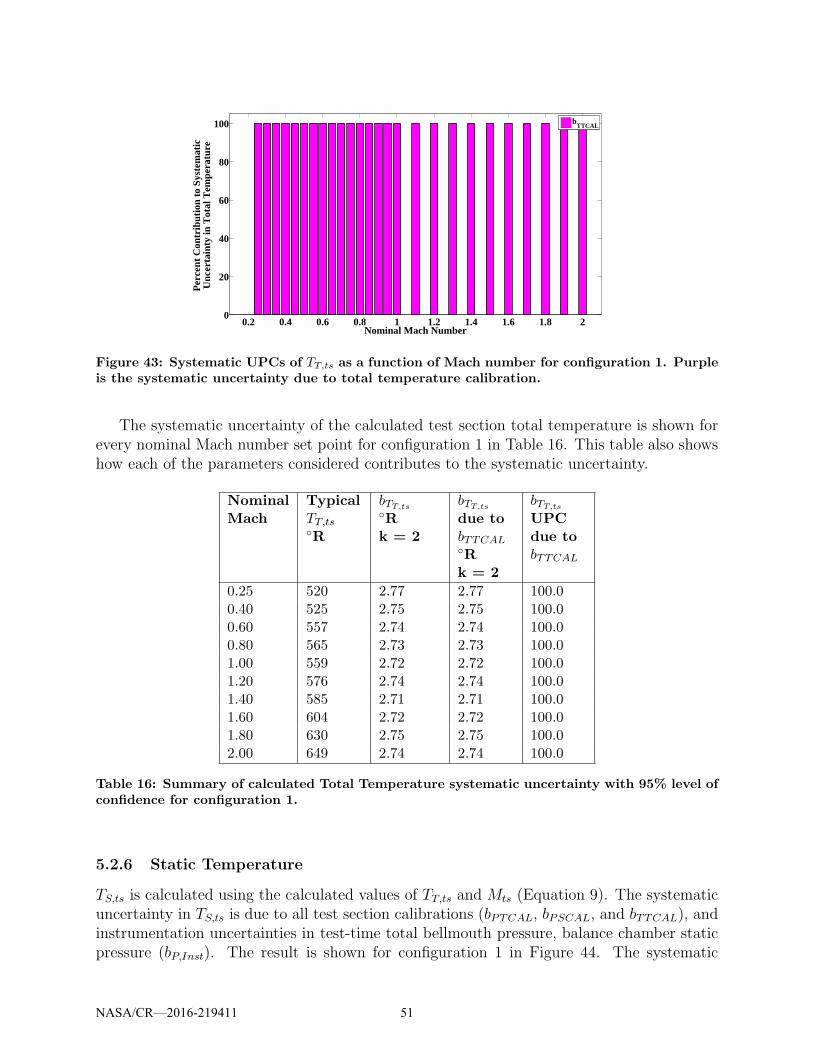
0.2 0.4 0.6 0.8 1 1.2 1.4 1.6 1.8 20
20
40
60
80
100
Nominal Mach Number
Per
cent
Con
trib
utio
n to
Sys
tem
atic
U
ncer
tain
ty in
Tot
al T
empe
ratu
re
b
TTCAL
Figure 43: Systematic UPCs of TT,ts as a function of Mach number for configuration 1. Purpleis the systematic uncertainty due to total temperature calibration.
The systematic uncertainty of the calculated test section total temperature is shown forevery nominal Mach number set point for configuration 1 in Table 16. This table also showshow each of the parameters considered contributes to the systematic uncertainty.
NominalMach
TypicalTT,ts◦R
bTT,ts◦Rk = 2
bTT,ts
due tobTTCAL◦Rk = 2
bTT,ts
UPCdue tobTTCAL
0.25 520 2.77 2.77 100.00.40 525 2.75 2.75 100.00.60 557 2.74 2.74 100.00.80 565 2.73 2.73 100.01.00 559 2.72 2.72 100.01.20 576 2.74 2.74 100.01.40 585 2.71 2.71 100.01.60 604 2.72 2.72 100.01.80 630 2.75 2.75 100.02.00 649 2.74 2.74 100.0
Table 16: Summary of calculated Total Temperature systematic uncertainty with 95% level ofconfidence for configuration 1.
5.2.6 Static Temperature
TS,ts is calculated using the calculated values of TT,ts and Mts (Equation 9). The systematicuncertainty in TS,ts is due to all test section calibrations (bPTCAL, bPSCAL, and bTTCAL), andinstrumentation uncertainties in test-time total bellmouth pressure, balance chamber staticpressure (bP,Inst). The result is shown for configuration 1 in Figure 44. The systematic
NASA/CR—2016-219411 51
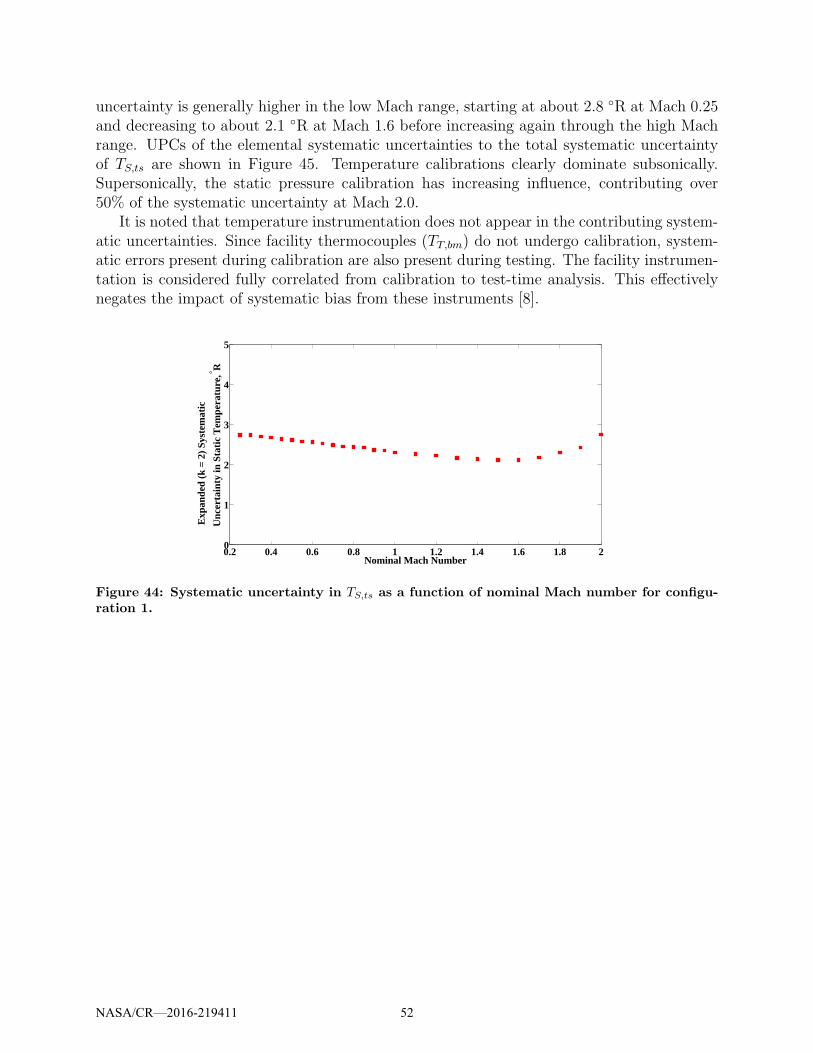
uncertainty is generally higher in the low Mach range, starting at about 2.8 ◦R at Mach 0.25and decreasing to about 2.1 ◦R at Mach 1.6 before increasing again through the high Machrange. UPCs of the elemental systematic uncertainties to the total systematic uncertaintyof TS,ts are shown in Figure 45. Temperature calibrations clearly dominate subsonically.Supersonically, the static pressure calibration has increasing influence, contributing over50% of the systematic uncertainty at Mach 2.0.
It is noted that temperature instrumentation does not appear in the contributing system-atic uncertainties. Since facility thermocouples (TT,bm) do not undergo calibration, system-atic errors present during calibration are also present during testing. The facility instrumen-tation is considered fully correlated from calibration to test-time analysis. This effectivelynegates the impact of systematic bias from these instruments [8].
0.2 0.4 0.6 0.8 1 1.2 1.4 1.6 1.8 20
1
2
3
4
5
Nominal Mach Number
Exp
ande
d (k
= 2
) S
yste
mat
ic
Unc
erta
inty
in S
tatic
Tem
pera
ture
, ° R
Figure 44: Systematic uncertainty in TS,ts as a function of nominal Mach number for configu-ration 1.
NASA/CR—2016-219411 52
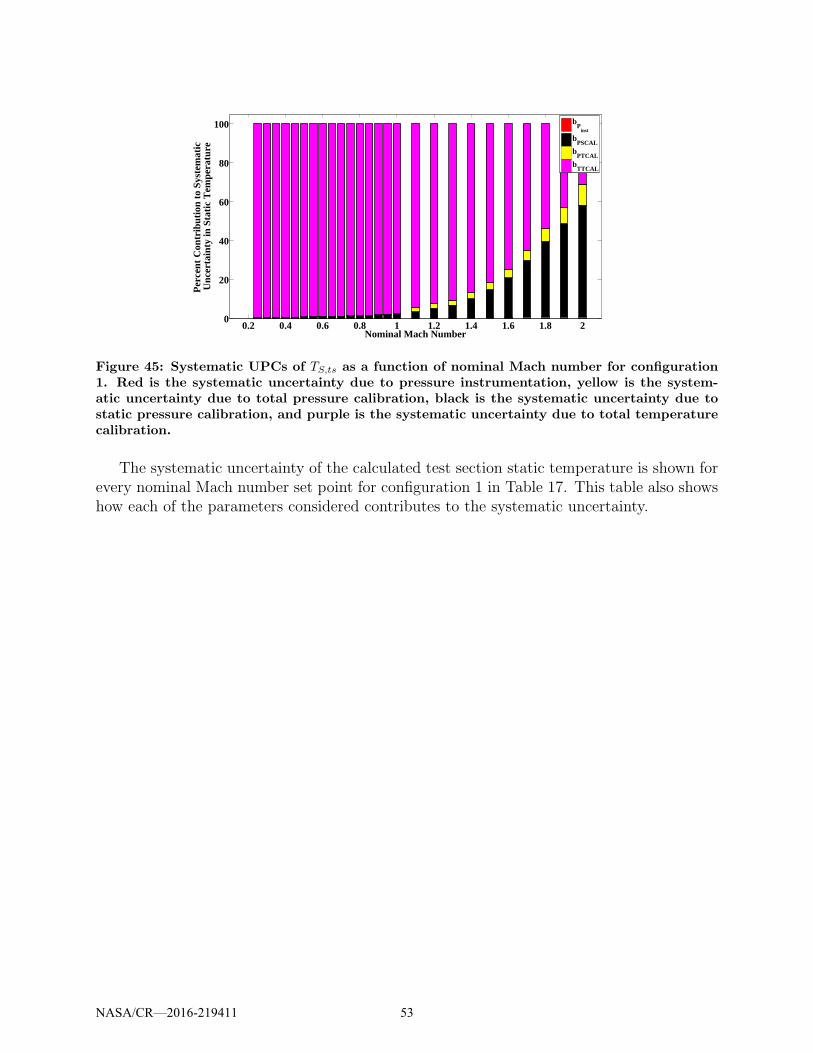
0.2 0.4 0.6 0.8 1 1.2 1.4 1.6 1.8 20
20
40
60
80
100
Nominal Mach Number
Per
cent
Con
trib
utio
n to
Sys
tem
atic
U
ncer
tain
ty in
Sta
tic T
empe
ratu
re
b
Pinst
bPSCAL
bPTCAL
bTTCAL
Figure 45: Systematic UPCs of TS,ts as a function of nominal Mach number for configuration1. Red is the systematic uncertainty due to pressure instrumentation, yellow is the system-atic uncertainty due to total pressure calibration, black is the systematic uncertainty due tostatic pressure calibration, and purple is the systematic uncertainty due to total temperaturecalibration.
The systematic uncertainty of the calculated test section static temperature is shown forevery nominal Mach number set point for configuration 1 in Table 17. This table also showshow each of the parameters considered contributes to the systematic uncertainty.
NASA/CR—2016-219411 53
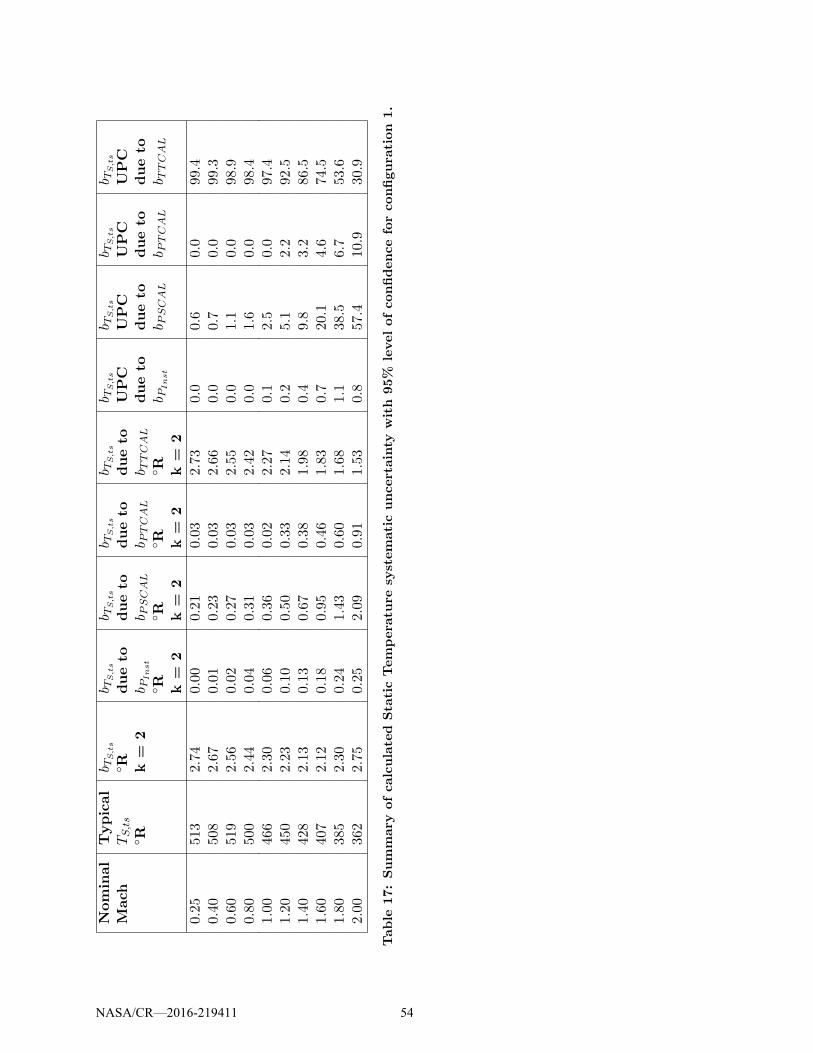
Nominal
Mach
Typical
TS,ts
◦R
b TS,ts
◦R k=
2
b TS,ts
dueto
b PInst
◦R k=
2
b TS,ts
dueto
b PSCAL
◦R k=
2
b TS,ts
dueto
b PTCAL
◦R k=
2
b TS,ts
dueto
b TTCAL
◦R k=
2
b TS,ts
UPC
dueto
b PInst
b TS,ts
UPC
dueto
b PSCAL
b TS,ts
UPC
dueto
b PTCAL
b TS,ts
UPC
dueto
b TTCAL
0.25
513
2.74
0.00
0.21
0.03
2.73
0.0
0.6
0.0
99.4
0.40
508
2.67
0.01
0.23
0.03
2.66
0.0
0.7
0.0
99.3
0.60
519
2.56
0.02
0.27
0.03
2.55
0.0
1.1
0.0
98.9
0.80
500
2.44
0.04
0.31
0.03
2.42
0.0
1.6
0.0
98.4
1.00
466
2.30
0.06
0.36
0.02
2.27
0.1
2.5
0.0
97.4
1.20
450
2.23
0.10
0.50
0.33
2.14
0.2
5.1
2.2
92.5
1.40
428
2.13
0.13
0.67
0.38
1.98
0.4
9.8
3.2
86.5
1.60
407
2.12
0.18
0.95
0.46
1.83
0.7
20.1
4.6
74.5
1.80
385
2.30
0.24
1.43
0.60
1.68
1.1
38.5
6.7
53.6
2.00
362
2.75
0.25
2.09
0.91
1.53
0.8
57.4
10.9
30.9
Table
17:Summary
ofcalculated
Sta
ticTempera
ture
systematicuncertainty
with
95%
levelofconfidenceforconfigura
tion
1.
NASA/CR—2016-219411 54
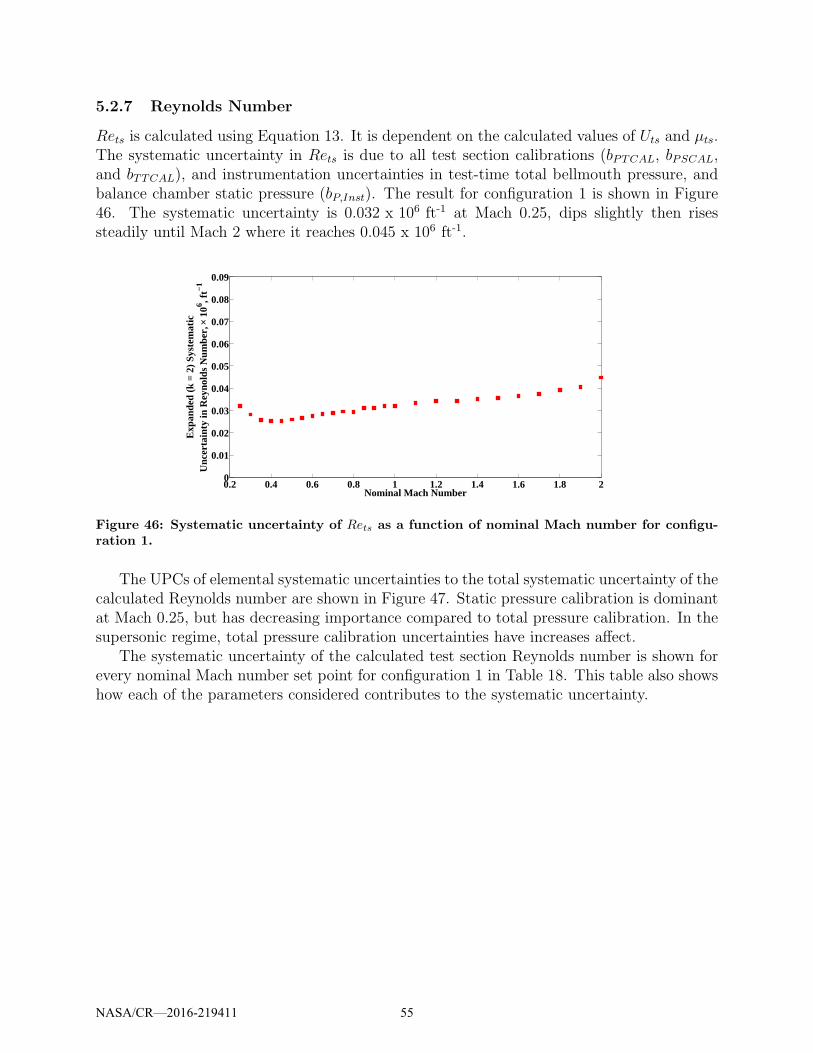
5.2.7 Reynolds Number
Rets is calculated using Equation 13. It is dependent on the calculated values of Uts and µts.The systematic uncertainty in Rets is due to all test section calibrations (bPTCAL, bPSCAL,and bTTCAL), and instrumentation uncertainties in test-time total bellmouth pressure, andbalance chamber static pressure (bP,Inst). The result for configuration 1 is shown in Figure46. The systematic uncertainty is 0.032 x 106 ft-1 at Mach 0.25, dips slightly then risessteadily until Mach 2 where it reaches 0.045 x 106 ft-1.
0.2 0.4 0.6 0.8 1 1.2 1.4 1.6 1.8 20
0.01
0.02
0.03
0.04
0.05
0.06
0.07
0.08
0.09
Nominal Mach Number
Exp
ande
d (k
= 2
) S
yste
mat
icU
ncer
tain
ty in
Rey
nold
s N
umbe
r, ×
106 , f
t−1
Figure 46: Systematic uncertainty of Rets as a function of nominal Mach number for configu-ration 1.
The UPCs of elemental systematic uncertainties to the total systematic uncertainty of thecalculated Reynolds number are shown in Figure 47. Static pressure calibration is dominantat Mach 0.25, but has decreasing importance compared to total pressure calibration. In thesupersonic regime, total pressure calibration uncertainties have increases affect.
The systematic uncertainty of the calculated test section Reynolds number is shown forevery nominal Mach number set point for configuration 1 in Table 18. This table also showshow each of the parameters considered contributes to the systematic uncertainty.
NASA/CR—2016-219411 55
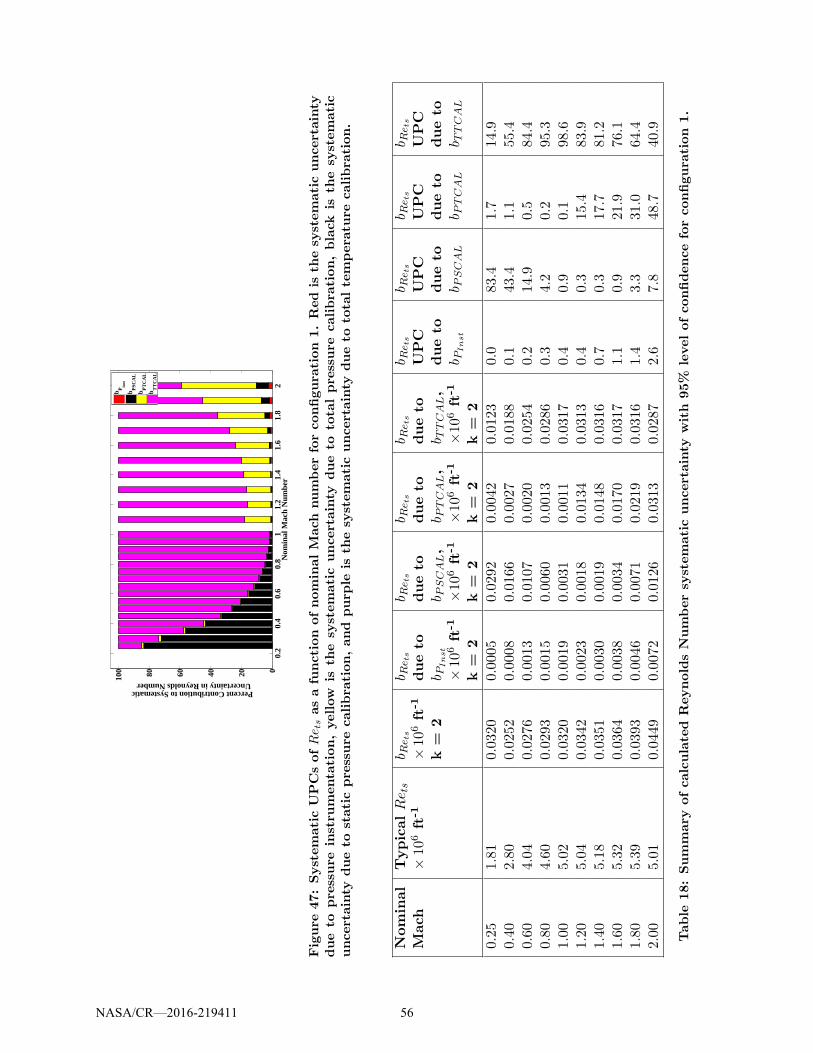
0.2
0.4
0.6
0.8
11.
21.
41.
61.
82
020406080100
Nom
inal
Mac
h N
umbe
r
Percent Contribution to Systematic Uncertainty in Reynolds Number
b P
inst
b PS
CA
Lb P
TC
AL
b TT
CA
L
Figure
47:SystematicUPCsofRets
asafunctionofnominalM
ach
numberforconfigura
tion1.Redis
thesy
stematicuncertainty
dueto
pre
ssure
instru
menta
tion,yellow
isth
esy
stematicuncertainty
dueto
tota
lpre
ssure
calibra
tion,black
isth
esy
stematic
uncertainty
dueto
staticpressure
calibra
tion,and
purp
leis
thesy
stematicuncertainty
dueto
tota
ltempera
ture
calibra
tion.
Nominal
Mach
TypicalRets
×10
6ft
-1
b Rets
×10
6ft
-1
k=
2
b Rets
dueto
b PInst
×10
6ft
-1
k=
2
b Rets
dueto
b PSCAL,
×10
6ft
-1
k=
2
b Rets
dueto
b PTCAL,
×10
6ft
-1
k=
2
b Rets
dueto
b TTCAL,
×10
6ft
-1
k=
2
b Rets
UPC
dueto
b PInst
b Rets
UPC
dueto
b PSCAL
b Rets
UPC
dueto
b PTCAL
b Rets
UPC
dueto
b TTCAL
0.25
1.81
0.0320
0.0005
0.0292
0.0042
0.0123
0.0
83.4
1.7
14.9
0.40
2.80
0.0252
0.0008
0.0166
0.0027
0.0188
0.1
43.4
1.1
55.4
0.60
4.04
0.0276
0.0013
0.0107
0.0020
0.0254
0.2
14.9
0.5
84.4
0.80
4.60
0.0293
0.0015
0.0060
0.0013
0.0286
0.3
4.2
0.2
95.3
1.00
5.02
0.0320
0.0019
0.0031
0.0011
0.0317
0.4
0.9
0.1
98.6
1.20
5.04
0.0342
0.0023
0.0018
0.0134
0.0313
0.4
0.3
15.4
83.9
1.40
5.18
0.0351
0.0030
0.0019
0.0148
0.0316
0.7
0.3
17.7
81.2
1.60
5.32
0.0364
0.0038
0.0034
0.0170
0.0317
1.1
0.9
21.9
76.1
1.80
5.39
0.0393
0.0046
0.0071
0.0219
0.0316
1.4
3.3
31.0
64.4
2.00
5.01
0.0449
0.0072
0.0126
0.0313
0.0287
2.6
7.8
48.7
40.9
Table
18:Summary
ofcalculated
ReynoldsNumbersy
stematicuncertainty
with
95%
levelofconfidenceforconfigura
tion
1.
NASA/CR—2016-219411 56
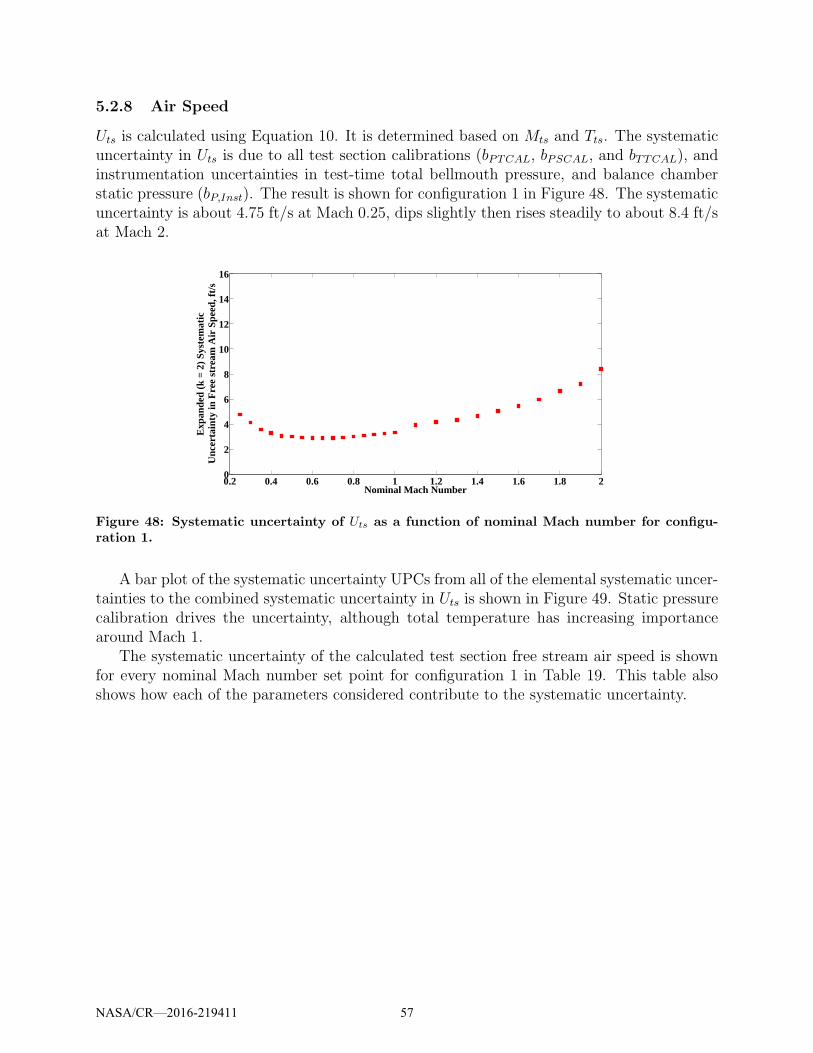
5.2.8 Air Speed
Uts is calculated using Equation 10. It is determined based on Mts and Tts. The systematicuncertainty in Uts is due to all test section calibrations (bPTCAL, bPSCAL, and bTTCAL), andinstrumentation uncertainties in test-time total bellmouth pressure, and balance chamberstatic pressure (bP,Inst). The result is shown for configuration 1 in Figure 48. The systematicuncertainty is about 4.75 ft/s at Mach 0.25, dips slightly then rises steadily to about 8.4 ft/sat Mach 2.
0.2 0.4 0.6 0.8 1 1.2 1.4 1.6 1.8 20
2
4
6
8
10
12
14
16
Nominal Mach Number
Exp
ande
d (k
= 2
) S
yste
mat
icU
ncer
tain
ty in
Fre
e st
ream
Air
Spe
ed, f
t/s
Figure 48: Systematic uncertainty of Uts as a function of nominal Mach number for configu-ration 1.
A bar plot of the systematic uncertainty UPCs from all of the elemental systematic uncer-tainties to the combined systematic uncertainty in Uts is shown in Figure 49. Static pressurecalibration drives the uncertainty, although total temperature has increasing importancearound Mach 1.
The systematic uncertainty of the calculated test section free stream air speed is shownfor every nominal Mach number set point for configuration 1 in Table 19. This table alsoshows how each of the parameters considered contribute to the systematic uncertainty.
NASA/CR—2016-219411 57
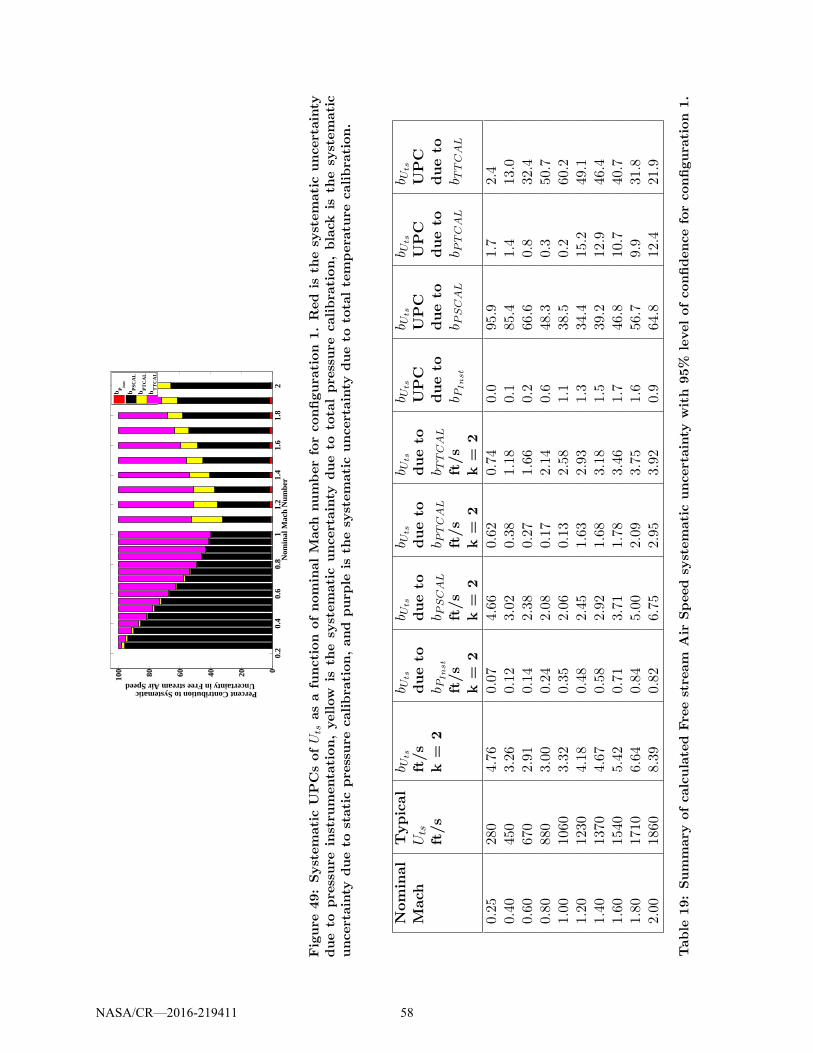
0.2
0.4
0.6
0.8
11.
21.
41.
61.
82
020406080100
Nom
inal
Mac
h N
umbe
r
Percent Contribution to Systematic Uncertainty in Free stream Air Speed
b P
inst
b PS
CA
Lb P
TC
AL
b TT
CA
L
Figure
49:SystematicUPCsofUts
asafunction
ofnominalM
ach
numberforconfigura
tion
1.Red
isth
esy
stematicuncertainty
dueto
pre
ssure
instru
menta
tion,yellow
isth
esy
stematicuncertainty
dueto
tota
lpressure
calibra
tion,black
isth
esy
stematic
uncertainty
dueto
staticpressure
calibra
tion,and
purp
leis
thesy
stematicuncertainty
dueto
tota
ltempera
ture
calibra
tion.
Nominal
Mach
Typical
Uts
ft/s
b Uts
ft/s
k=
2
b Uts
dueto
b PInst
ft/s
k=
2
b Uts
dueto
b PSCAL
ft/s
k=
2
b Uts
dueto
b PTCAL
ft/s
k=
2
b Uts
dueto
b TTCAL
ft/s
k=
2
b Uts
UPC
dueto
b PInst
b Uts
UPC
dueto
b PSCAL
b Uts
UPC
dueto
b PTCAL
b Uts
UPC
dueto
b TTCAL
0.25
280
4.76
0.07
4.66
0.62
0.74
0.0
95.9
1.7
2.4
0.40
450
3.26
0.12
3.02
0.38
1.18
0.1
85.4
1.4
13.0
0.60
670
2.91
0.14
2.38
0.27
1.66
0.2
66.6
0.8
32.4
0.80
880
3.00
0.24
2.08
0.17
2.14
0.6
48.3
0.3
50.7
1.00
1060
3.32
0.35
2.06
0.13
2.58
1.1
38.5
0.2
60.2
1.20
1230
4.18
0.48
2.45
1.63
2.93
1.3
34.4
15.2
49.1
1.40
1370
4.67
0.58
2.92
1.68
3.18
1.5
39.2
12.9
46.4
1.60
1540
5.42
0.71
3.71
1.78
3.46
1.7
46.8
10.7
40.7
1.80
1710
6.64
0.84
5.00
2.09
3.75
1.6
56.7
9.9
31.8
2.00
1860
8.39
0.82
6.75
2.95
3.92
0.9
64.8
12.4
21.9
Table
19:Summary
ofcalculated
Freestream
Air
Speed
systematicuncertainty
with
95%
levelofconfidenceforconfigura
tion
1.
NASA/CR—2016-219411 58
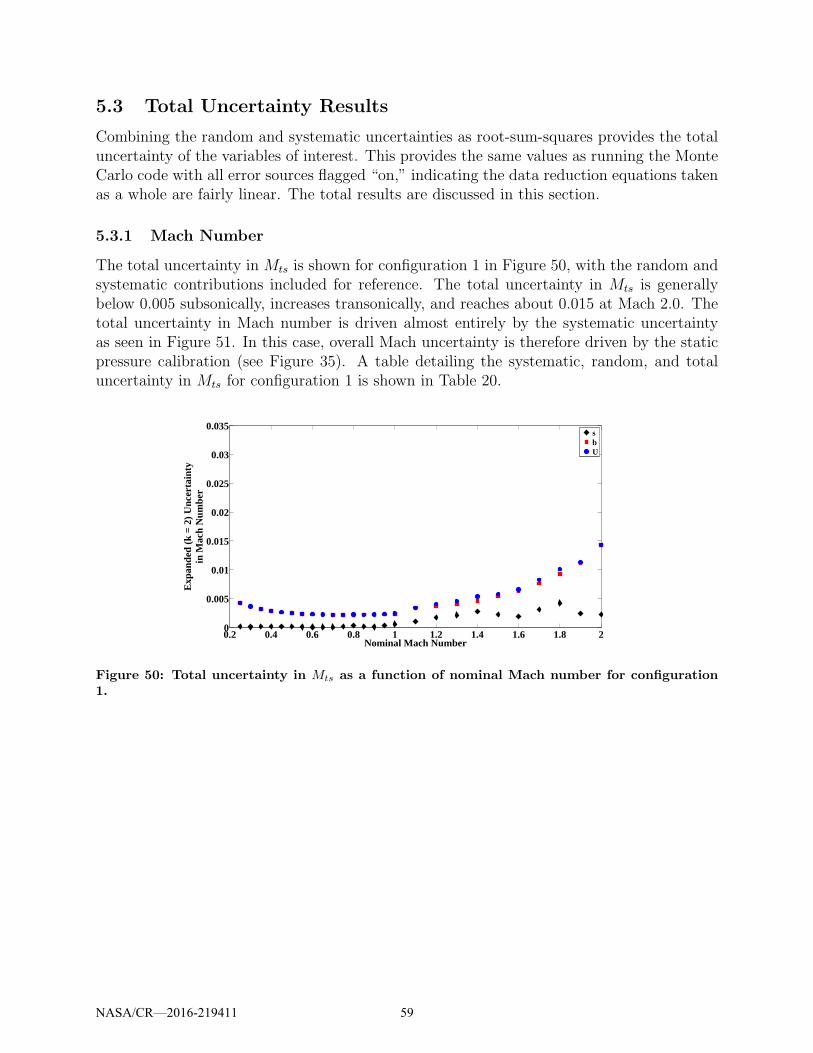
5.3 Total Uncertainty Results
Combining the random and systematic uncertainties as root-sum-squares provides the totaluncertainty of the variables of interest. This provides the same values as running the MonteCarlo code with all error sources flagged “on,” indicating the data reduction equations takenas a whole are fairly linear. The total results are discussed in this section.
5.3.1 Mach Number
The total uncertainty in Mts is shown for configuration 1 in Figure 50, with the random andsystematic contributions included for reference. The total uncertainty in Mts is generallybelow 0.005 subsonically, increases transonically, and reaches about 0.015 at Mach 2.0. Thetotal uncertainty in Mach number is driven almost entirely by the systematic uncertaintyas seen in Figure 51. In this case, overall Mach uncertainty is therefore driven by the staticpressure calibration (see Figure 35). A table detailing the systematic, random, and totaluncertainty in Mts for configuration 1 is shown in Table 20.
0.2 0.4 0.6 0.8 1 1.2 1.4 1.6 1.8 20
0.005
0.01
0.015
0.02
0.025
0.03
0.035
Nominal Mach Number
Exp
ande
d (k
= 2
) U
ncer
tain
tyin
Mac
h N
umbe
r
sbU
Figure 50: Total uncertainty in Mts as a function of nominal Mach number for configuration1.
NASA/CR—2016-219411 59

0.2 0.4 0.6 0.8 1 1.2 1.4 1.6 1.8 20
20
40
60
80
100
Nominal Mach Number
Per
cent
Con
trib
utio
n to
Unc
erta
inty
in C
alcu
late
d M
ach
Num
ber
bs
Figure 51: UPCs contributing to total uncertainty in Mts as a function of nominal Machnumber for configuration 1.
NominalMach
TypicalMts
sMts
k = 2bMts
k = 2uMts
k = 2sMts
UPCbMts
UPC
0.25 0.25 0.0001 0.0043 0.0043 0.1 99.90.40 0.41 0.0002 0.0028 0.0029 0.5 99.50.60 0.60 0.0001 0.0023 0.0023 0.1 99.90.80 0.81 0.0004 0.0022 0.0022 2.7 97.31.00 1.00 0.0006 0.0024 0.0024 5.6 94.41.20 1.18 0.0017 0.0037 0.0040 17.3 82.71.40 1.35 0.0027 0.0046 0.0054 26.2 73.81.60 1.56 0.0019 0.0063 0.0066 8.3 91.71.80 1.78 0.0042 0.0093 0.0101 17.1 82.92.00 1.99 0.0023 0.0143 0.0143 2.5 97.5
Table 20: Summary of calculated Mach Number uncertainty with 95% level of confidence forconfiguration 1.
5.3.2 Static Pressure
The combined uncertainty in PS,ts for configuration 1 is shown in Figure 52 with the randomand systematic contributions included for reference. The total uncertainty in PS,ts is rela-tively stable around 0.025 psia subsonically. It increases transonically, peaks around 0.045psia at Mach 1.8. The total uncertainty is driven by the systematic uncertainty, as confirmedby the bar plot of UPCs in Figure 53. Random, systematic and total uncertainty are detailedin table 21.
NASA/CR—2016-219411 60

0.2 0.4 0.6 0.8 1 1.2 1.4 1.6 1.8 20
0.02
0.04
0.06
0.08
0.1
0.12
Nominal Mach Number
Exp
ande
d (k
= 2
) U
ncer
tain
tyin
Sta
tic P
ress
ure,
psi
a
sbU
Figure 52: Total uncertainty of PS,ts as a function of nominal Mach number for configuration1.
0.2 0.4 0.6 0.8 1 1.2 1.4 1.6 1.8 20
20
40
60
80
100
Nominal Mach Number
Per
cent
Con
trib
utio
n to
Unc
erta
inty
in C
alcu
late
d S
tatic
Pre
ssur
e
bs
Figure 53: UPCs contributing to total uncertainty in PS,ts as a function of nominal Machnumber for configuration 1.
NASA/CR—2016-219411 61
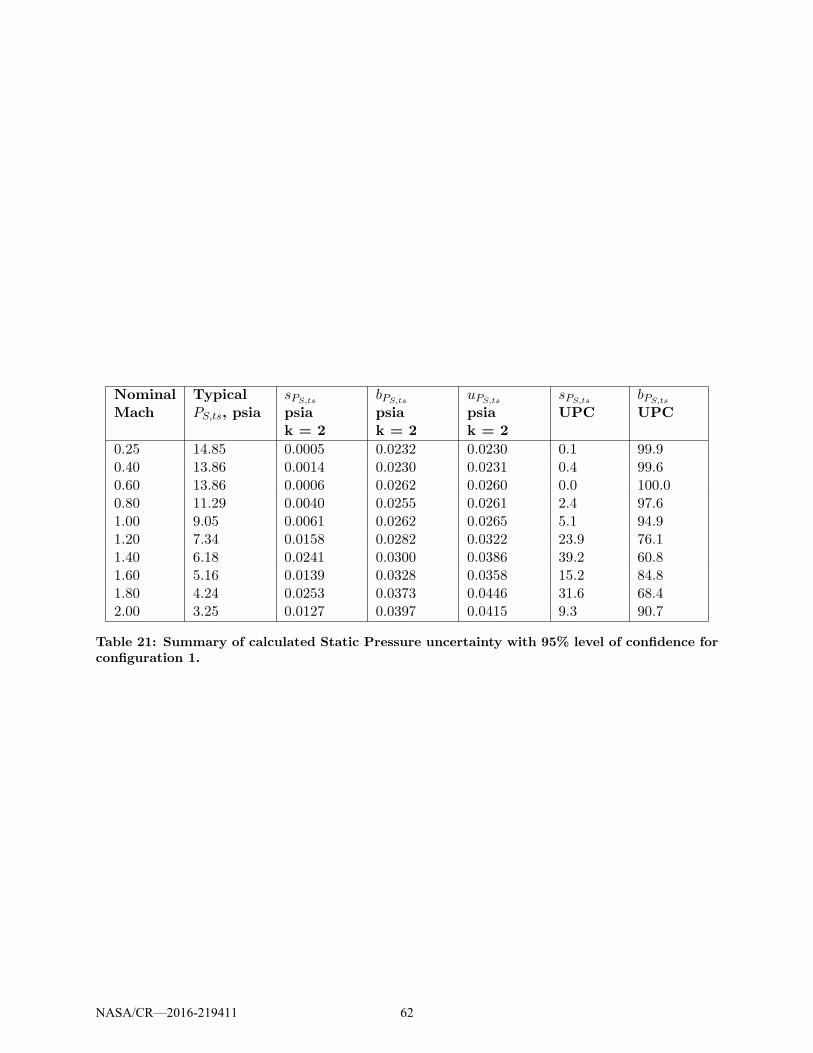
NominalMach
TypicalPS,ts, psia
sPS,ts
psiak = 2
bPS,ts
psiak = 2
uPS,ts
psiak = 2
sPS,ts
UPCbPS,ts
UPC
0.25 14.85 0.0005 0.0232 0.0230 0.1 99.90.40 13.86 0.0014 0.0230 0.0231 0.4 99.60.60 13.86 0.0006 0.0262 0.0260 0.0 100.00.80 11.29 0.0040 0.0255 0.0261 2.4 97.61.00 9.05 0.0061 0.0262 0.0265 5.1 94.91.20 7.34 0.0158 0.0282 0.0322 23.9 76.11.40 6.18 0.0241 0.0300 0.0386 39.2 60.81.60 5.16 0.0139 0.0328 0.0358 15.2 84.81.80 4.24 0.0253 0.0373 0.0446 31.6 68.42.00 3.25 0.0127 0.0397 0.0415 9.3 90.7
Table 21: Summary of calculated Static Pressure uncertainty with 95% level of confidence forconfiguration 1.
NASA/CR—2016-219411 62

5.3.3 Total Pressure
The total uncertainty in PT,ts is shown in Figure 54 with the random and systematic contribu-tions included for reference. The total uncertainty in test section total pressure is relativelysteady around 0.009 psia at subsonic Mach numbers. It then gradually increases throughoutthe supersonic regime to about 0.30 psia at Mach 2.0. The total uncertainty is driven almostentirely by the systematic uncertainty. This is confirmed by the UPCs, shown in Figure 55.A table detailing the random, systematic, and overall uncertainty of PT,ts for configuration1 is shown in Table 22.
0.2 0.4 0.6 0.8 1 1.2 1.4 1.6 1.8 20
0.1
0.2
0.3
0.4
0.5
0.6
0.7
Nominal Mach Number
Exp
ande
d (k
= 2
) U
ncer
tain
tyin
Tot
al P
ress
ure,
psi
a
sbU
Figure 54: Total uncertainty of PT,ts as a function of nominal Mach number for configuration1.
0.2 0.4 0.6 0.8 1 1.2 1.4 1.6 1.8 20
20
40
60
80
100
Nominal Mach Number
Per
cent
Con
trib
utio
n to
Unc
erta
inty
in
Cal
cula
ted
Tot
al P
ress
ure
bs
Figure 55: UPCs contributing to total uncertainty in PT,ts as a function of nominal Machnumber for configuration 1.
NASA/CR—2016-219411 63
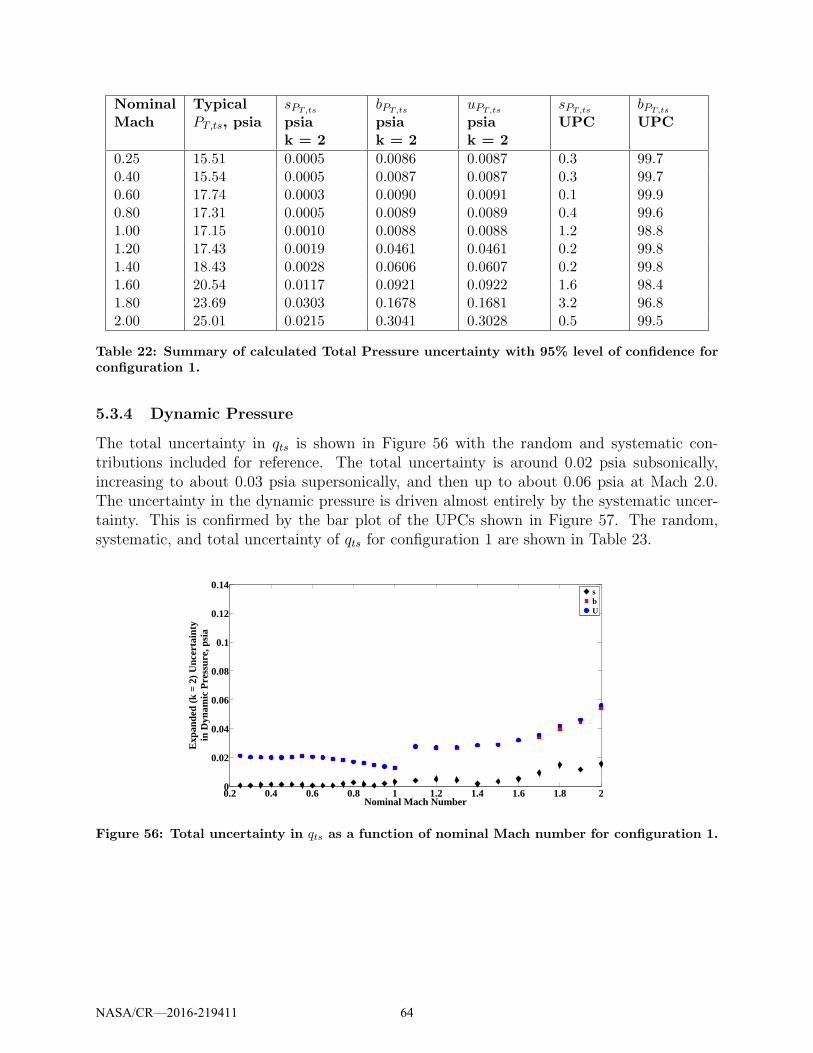
NominalMach
TypicalPT,ts, psia
sPT,ts
psiak = 2
bPT,ts
psiak = 2
uPT,ts
psiak = 2
sPT,ts
UPCbPT,ts
UPC
0.25 15.51 0.0005 0.0086 0.0087 0.3 99.70.40 15.54 0.0005 0.0087 0.0087 0.3 99.70.60 17.74 0.0003 0.0090 0.0091 0.1 99.90.80 17.31 0.0005 0.0089 0.0089 0.4 99.61.00 17.15 0.0010 0.0088 0.0088 1.2 98.81.20 17.43 0.0019 0.0461 0.0461 0.2 99.81.40 18.43 0.0028 0.0606 0.0607 0.2 99.81.60 20.54 0.0117 0.0921 0.0922 1.6 98.41.80 23.69 0.0303 0.1678 0.1681 3.2 96.82.00 25.01 0.0215 0.3041 0.3028 0.5 99.5
Table 22: Summary of calculated Total Pressure uncertainty with 95% level of confidence forconfiguration 1.
5.3.4 Dynamic Pressure
The total uncertainty in qts is shown in Figure 56 with the random and systematic con-tributions included for reference. The total uncertainty is around 0.02 psia subsonically,increasing to about 0.03 psia supersonically, and then up to about 0.06 psia at Mach 2.0.The uncertainty in the dynamic pressure is driven almost entirely by the systematic uncer-tainty. This is confirmed by the bar plot of the UPCs shown in Figure 57. The random,systematic, and total uncertainty of qts for configuration 1 are shown in Table 23.
0.2 0.4 0.6 0.8 1 1.2 1.4 1.6 1.8 20
0.02
0.04
0.06
0.08
0.1
0.12
0.14
Nominal Mach Number
Exp
ande
d (k
= 2
) U
ncer
tain
tyin
Dyn
amic
Pre
ssur
e, p
sia
sbU
Figure 56: Total uncertainty in qts as a function of nominal Mach number for configuration 1.
NASA/CR—2016-219411 64
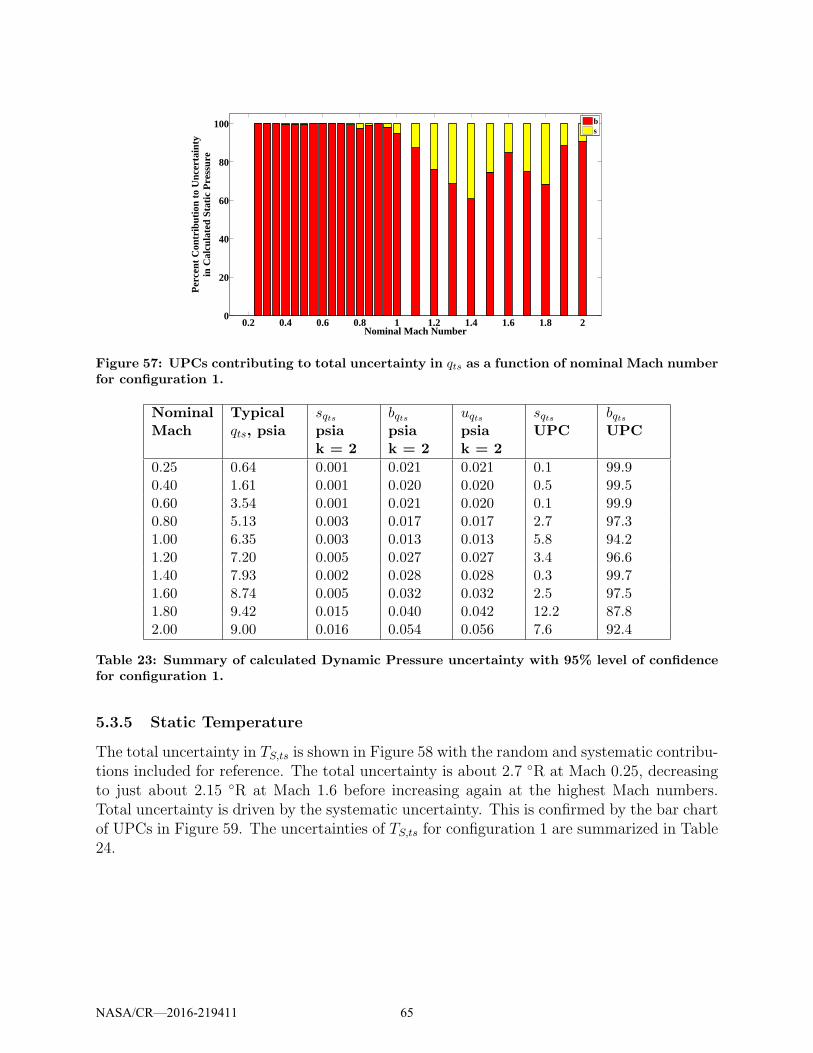
0.2 0.4 0.6 0.8 1 1.2 1.4 1.6 1.8 20
20
40
60
80
100
Nominal Mach Number
Per
cent
Con
trib
utio
n to
Unc
erta
inty
in C
alcu
late
d S
tatic
Pre
ssur
e
bs
Figure 57: UPCs contributing to total uncertainty in qts as a function of nominal Mach numberfor configuration 1.
NominalMach
Typicalqts, psia
sqtspsiak = 2
bqtspsiak = 2
uqtspsiak = 2
sqtsUPC
bqtsUPC
0.25 0.64 0.001 0.021 0.021 0.1 99.90.40 1.61 0.001 0.020 0.020 0.5 99.50.60 3.54 0.001 0.021 0.020 0.1 99.90.80 5.13 0.003 0.017 0.017 2.7 97.31.00 6.35 0.003 0.013 0.013 5.8 94.21.20 7.20 0.005 0.027 0.027 3.4 96.61.40 7.93 0.002 0.028 0.028 0.3 99.71.60 8.74 0.005 0.032 0.032 2.5 97.51.80 9.42 0.015 0.040 0.042 12.2 87.82.00 9.00 0.016 0.054 0.056 7.6 92.4
Table 23: Summary of calculated Dynamic Pressure uncertainty with 95% level of confidencefor configuration 1.
5.3.5 Static Temperature
The total uncertainty in TS,ts is shown in Figure 58 with the random and systematic contribu-tions included for reference. The total uncertainty is about 2.7 ◦R at Mach 0.25, decreasingto just about 2.15 ◦R at Mach 1.6 before increasing again at the highest Mach numbers.Total uncertainty is driven by the systematic uncertainty. This is confirmed by the bar chartof UPCs in Figure 59. The uncertainties of TS,ts for configuration 1 are summarized in Table24.
NASA/CR—2016-219411 65

0.2 0.4 0.6 0.8 1 1.2 1.4 1.6 1.8 20
1
2
3
4
5
Nominal Mach Number
Exp
ande
d (k
= 2
) U
ncer
tain
ty
in S
tatic
Tem
pera
ture
, ° R
sbU
Figure 58: Total uncertainty in TS,ts as a function of nominal Mach number for configuration1.
0.2 0.4 0.6 0.8 1 1.2 1.4 1.6 1.8 20
20
40
60
80
100
Nominal Mach Number
Per
cent
Con
trib
utio
n to
Unc
erta
inty
in
Cal
cula
ted
Sta
tic T
empe
ratu
re
bs
Figure 59: UPCs contributing to total uncertainty in TS,ts as a function of nominal Machnumber for configuration 1.
NASA/CR—2016-219411 66
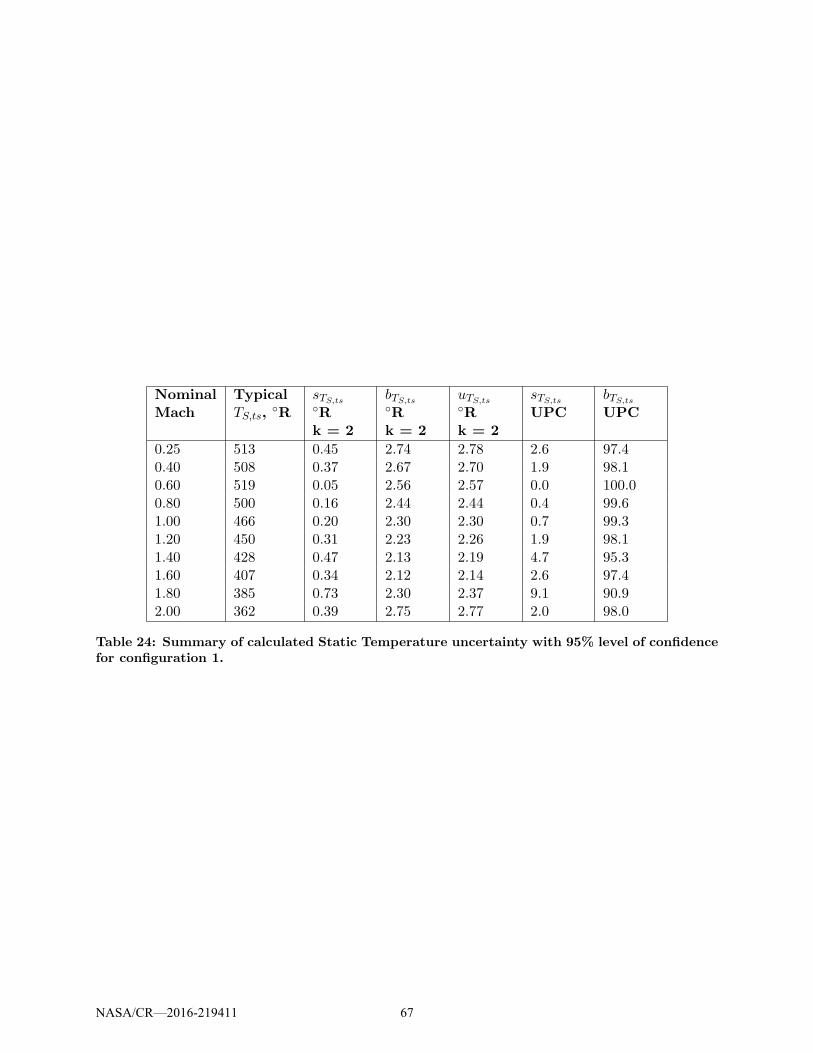
NominalMach
TypicalTS,ts,
◦RsTS,ts◦Rk = 2
bTS,ts◦Rk = 2
uTS,ts◦Rk = 2
sTS,ts
UPCbTS,ts
UPC
0.25 513 0.45 2.74 2.78 2.6 97.40.40 508 0.37 2.67 2.70 1.9 98.10.60 519 0.05 2.56 2.57 0.0 100.00.80 500 0.16 2.44 2.44 0.4 99.61.00 466 0.20 2.30 2.30 0.7 99.31.20 450 0.31 2.23 2.26 1.9 98.11.40 428 0.47 2.13 2.19 4.7 95.31.60 407 0.34 2.12 2.14 2.6 97.41.80 385 0.73 2.30 2.37 9.1 90.92.00 362 0.39 2.75 2.77 2.0 98.0
Table 24: Summary of calculated Static Temperature uncertainty with 95% level of confidencefor configuration 1.
NASA/CR—2016-219411 67
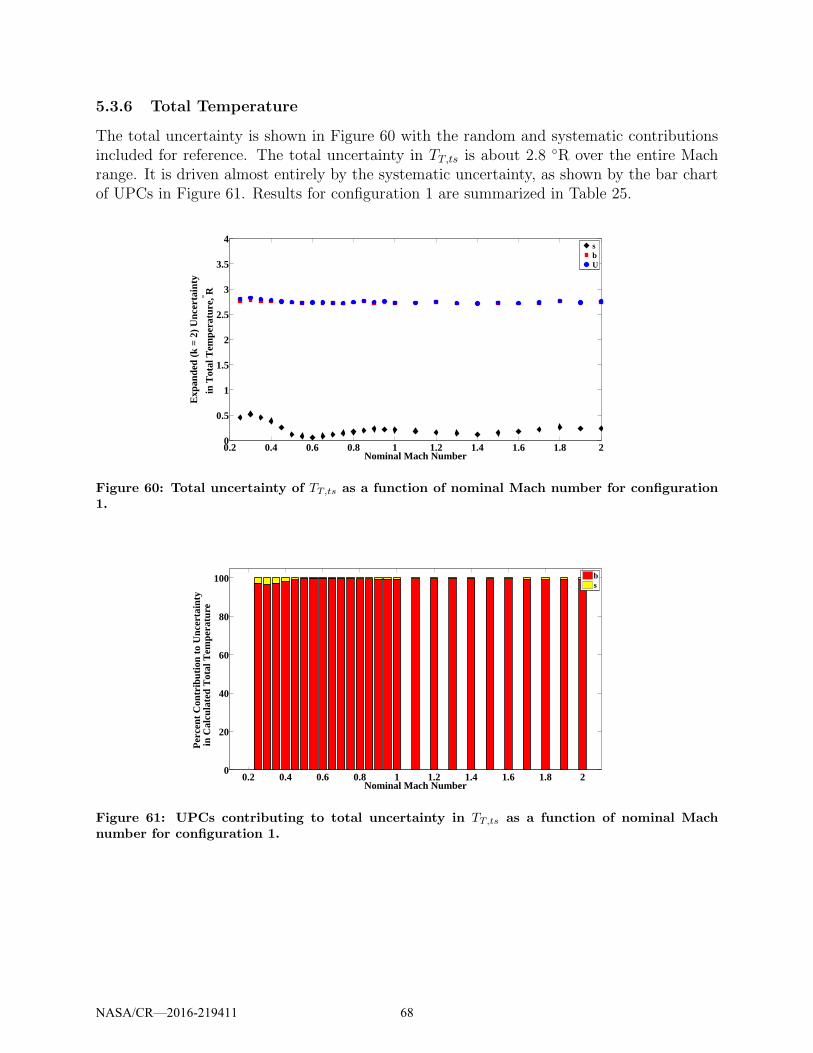
5.3.6 Total Temperature
The total uncertainty is shown in Figure 60 with the random and systematic contributionsincluded for reference. The total uncertainty in TT,ts is about 2.8 ◦R over the entire Machrange. It is driven almost entirely by the systematic uncertainty, as shown by the bar chartof UPCs in Figure 61. Results for configuration 1 are summarized in Table 25.
0.2 0.4 0.6 0.8 1 1.2 1.4 1.6 1.8 20
0.5
1
1.5
2
2.5
3
3.5
4
Nominal Mach Number
Exp
ande
d (k
= 2
) U
ncer
tain
ty
in T
otal
Tem
pera
ture
, ° R
sbU
Figure 60: Total uncertainty of TT,ts as a function of nominal Mach number for configuration1.
0.2 0.4 0.6 0.8 1 1.2 1.4 1.6 1.8 20
20
40
60
80
100
Nominal Mach Number
Per
cent
Con
trib
utio
n to
Unc
erta
inty
in
Cal
cula
ted
Tot
al T
empe
ratu
re
bs
Figure 61: UPCs contributing to total uncertainty in TT,ts as a function of nominal Machnumber for configuration 1.
NASA/CR—2016-219411 68
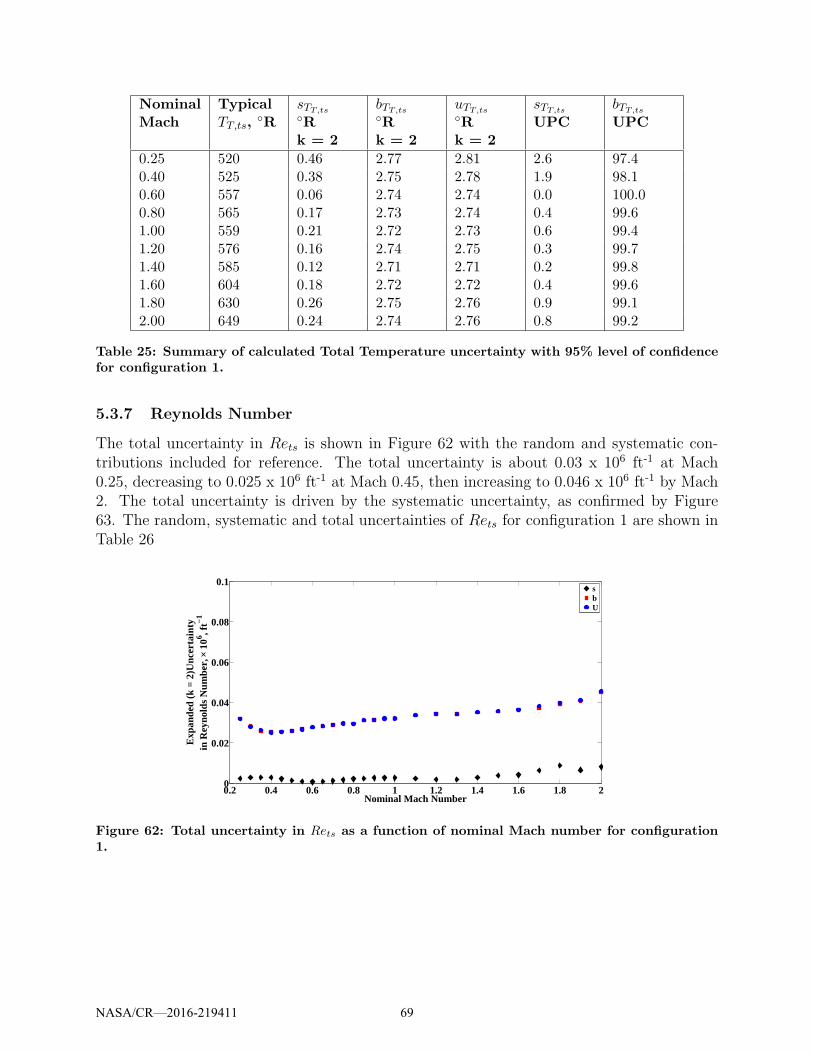
NominalMach
TypicalTT,ts,
◦RsTT,ts◦Rk = 2
bTT,ts◦Rk = 2
uTT,ts◦Rk = 2
sTT,ts
UPCbTT,ts
UPC
0.25 520 0.46 2.77 2.81 2.6 97.40.40 525 0.38 2.75 2.78 1.9 98.10.60 557 0.06 2.74 2.74 0.0 100.00.80 565 0.17 2.73 2.74 0.4 99.61.00 559 0.21 2.72 2.73 0.6 99.41.20 576 0.16 2.74 2.75 0.3 99.71.40 585 0.12 2.71 2.71 0.2 99.81.60 604 0.18 2.72 2.72 0.4 99.61.80 630 0.26 2.75 2.76 0.9 99.12.00 649 0.24 2.74 2.76 0.8 99.2
Table 25: Summary of calculated Total Temperature uncertainty with 95% level of confidencefor configuration 1.
5.3.7 Reynolds Number
The total uncertainty in Rets is shown in Figure 62 with the random and systematic con-tributions included for reference. The total uncertainty is about 0.03 x 106 ft-1 at Mach0.25, decreasing to 0.025 x 106 ft-1 at Mach 0.45, then increasing to 0.046 x 106 ft-1 by Mach2. The total uncertainty is driven by the systematic uncertainty, as confirmed by Figure63. The random, systematic and total uncertainties of Rets for configuration 1 are shown inTable 26
0.2 0.4 0.6 0.8 1 1.2 1.4 1.6 1.8 20
0.02
0.04
0.06
0.08
0.1
Nominal Mach Number
Exp
ande
d (k
= 2
)Unc
erta
inty
in R
eyno
lds
Num
ber,
× 10
6 , ft−
1
sbU
Figure 62: Total uncertainty in Rets as a function of nominal Mach number for configuration1.
NASA/CR—2016-219411 69
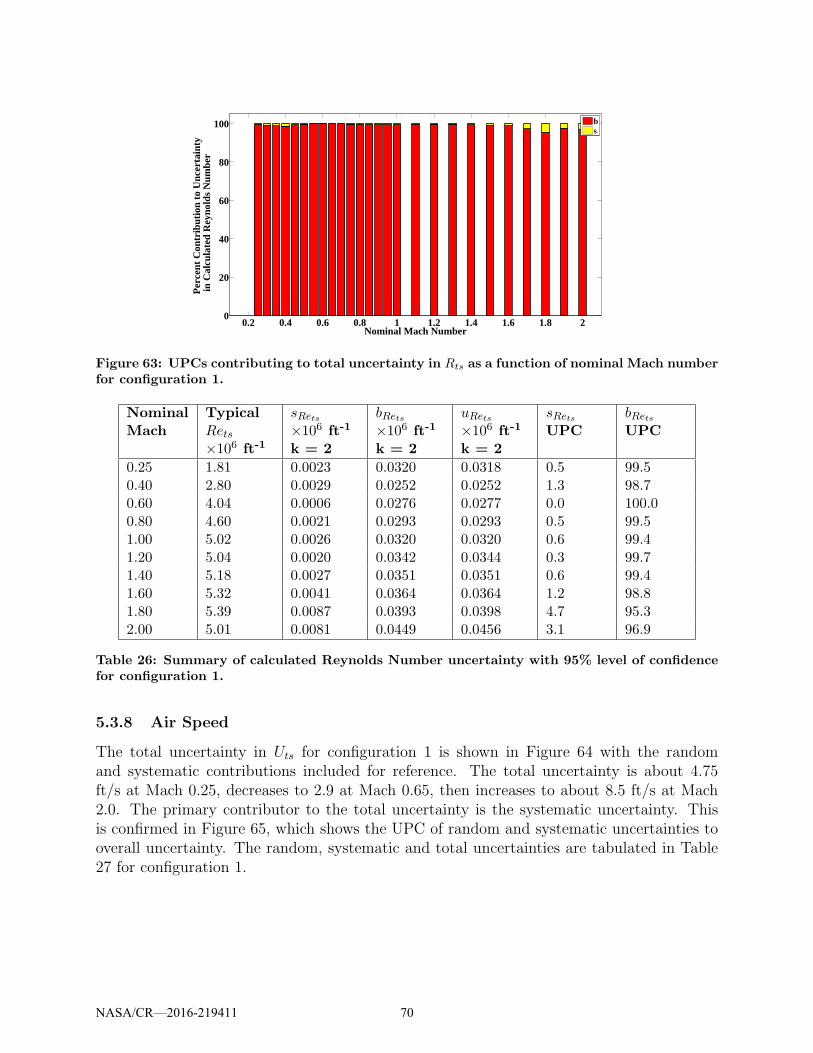
0.2 0.4 0.6 0.8 1 1.2 1.4 1.6 1.8 20
20
40
60
80
100
Nominal Mach Number
Per
cent
Con
trib
utio
n to
Unc
erta
inty
in
Cal
cula
ted
Rey
nold
s N
umbe
r
bs
Figure 63: UPCs contributing to total uncertainty in Rts as a function of nominal Mach numberfor configuration 1.
NominalMach
TypicalRets×106 ft-1
sRets
×106 ft-1
k = 2
bRets
×106 ft-1
k = 2
uRets
×106 ft-1
k = 2
sRets
UPCbRets
UPC
0.25 1.81 0.0023 0.0320 0.0318 0.5 99.50.40 2.80 0.0029 0.0252 0.0252 1.3 98.70.60 4.04 0.0006 0.0276 0.0277 0.0 100.00.80 4.60 0.0021 0.0293 0.0293 0.5 99.51.00 5.02 0.0026 0.0320 0.0320 0.6 99.41.20 5.04 0.0020 0.0342 0.0344 0.3 99.71.40 5.18 0.0027 0.0351 0.0351 0.6 99.41.60 5.32 0.0041 0.0364 0.0364 1.2 98.81.80 5.39 0.0087 0.0393 0.0398 4.7 95.32.00 5.01 0.0081 0.0449 0.0456 3.1 96.9
Table 26: Summary of calculated Reynolds Number uncertainty with 95% level of confidencefor configuration 1.
5.3.8 Air Speed
The total uncertainty in Uts for configuration 1 is shown in Figure 64 with the randomand systematic contributions included for reference. The total uncertainty is about 4.75ft/s at Mach 0.25, decreases to 2.9 at Mach 0.65, then increases to about 8.5 ft/s at Mach2.0. The primary contributor to the total uncertainty is the systematic uncertainty. Thisis confirmed in Figure 65, which shows the UPC of random and systematic uncertainties tooverall uncertainty. The random, systematic and total uncertainties are tabulated in Table27 for configuration 1.
NASA/CR—2016-219411 70
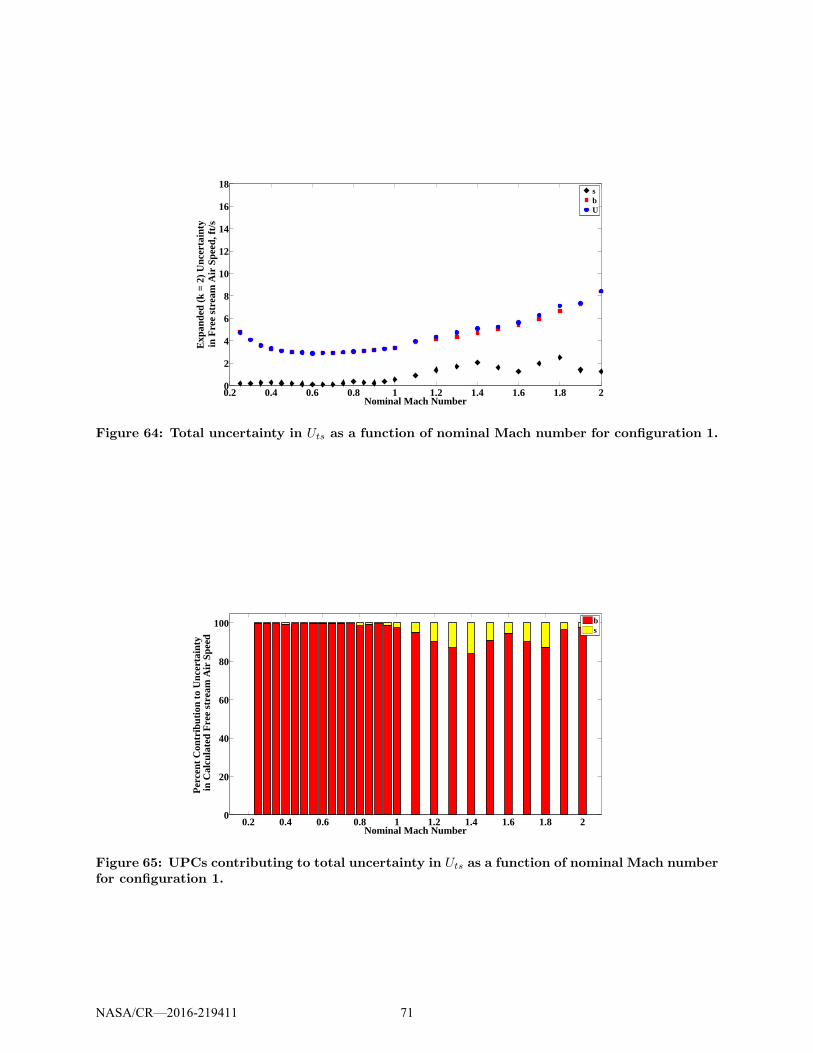
0.2 0.4 0.6 0.8 1 1.2 1.4 1.6 1.8 20
2
4
6
8
10
12
14
16
18
Nominal Mach Number
Exp
ande
d (k
= 2
) U
ncer
tain
tyin
Fre
e st
ream
Air
Spe
ed, f
t/s
sbU
Figure 64: Total uncertainty in Uts as a function of nominal Mach number for configuration 1.
0.2 0.4 0.6 0.8 1 1.2 1.4 1.6 1.8 20
20
40
60
80
100
Nominal Mach Number
Per
cent
Con
trib
utio
n to
Unc
erta
inty
in
Cal
cula
ted
Fre
e st
ream
Air
Spe
ed
bs
Figure 65: UPCs contributing to total uncertainty in Uts as a function of nominal Mach numberfor configuration 1.
NASA/CR—2016-219411 71
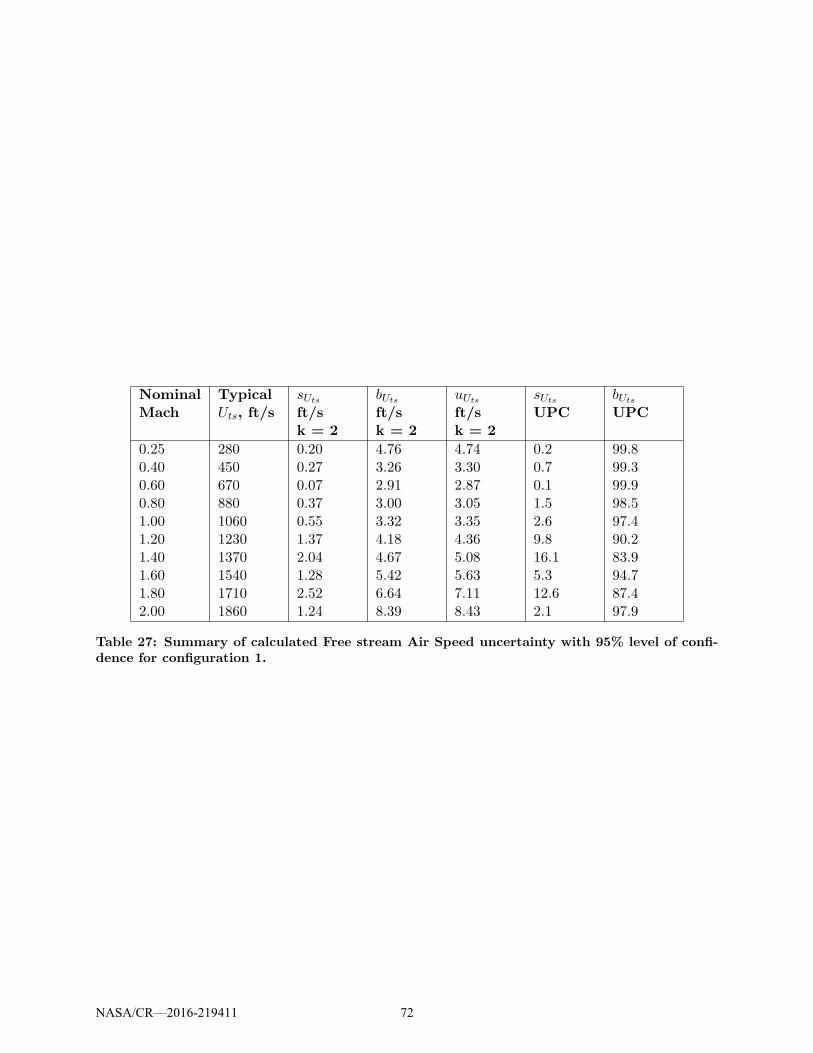
NominalMach
TypicalUts, ft/s
sUts
ft/sk = 2
bUts
ft/sk = 2
uUts
ft/sk = 2
sUts
UPCbUts
UPC
0.25 280 0.20 4.76 4.74 0.2 99.80.40 450 0.27 3.26 3.30 0.7 99.30.60 670 0.07 2.91 2.87 0.1 99.90.80 880 0.37 3.00 3.05 1.5 98.51.00 1060 0.55 3.32 3.35 2.6 97.41.20 1230 1.37 4.18 4.36 9.8 90.21.40 1370 2.04 4.67 5.08 16.1 83.91.60 1540 1.28 5.42 5.63 5.3 94.71.80 1710 2.52 6.64 7.11 12.6 87.42.00 1860 1.24 8.39 8.43 2.1 97.9
Table 27: Summary of calculated Free stream Air Speed uncertainty with 95% level of confi-dence for configuration 1.
NASA/CR—2016-219411 72
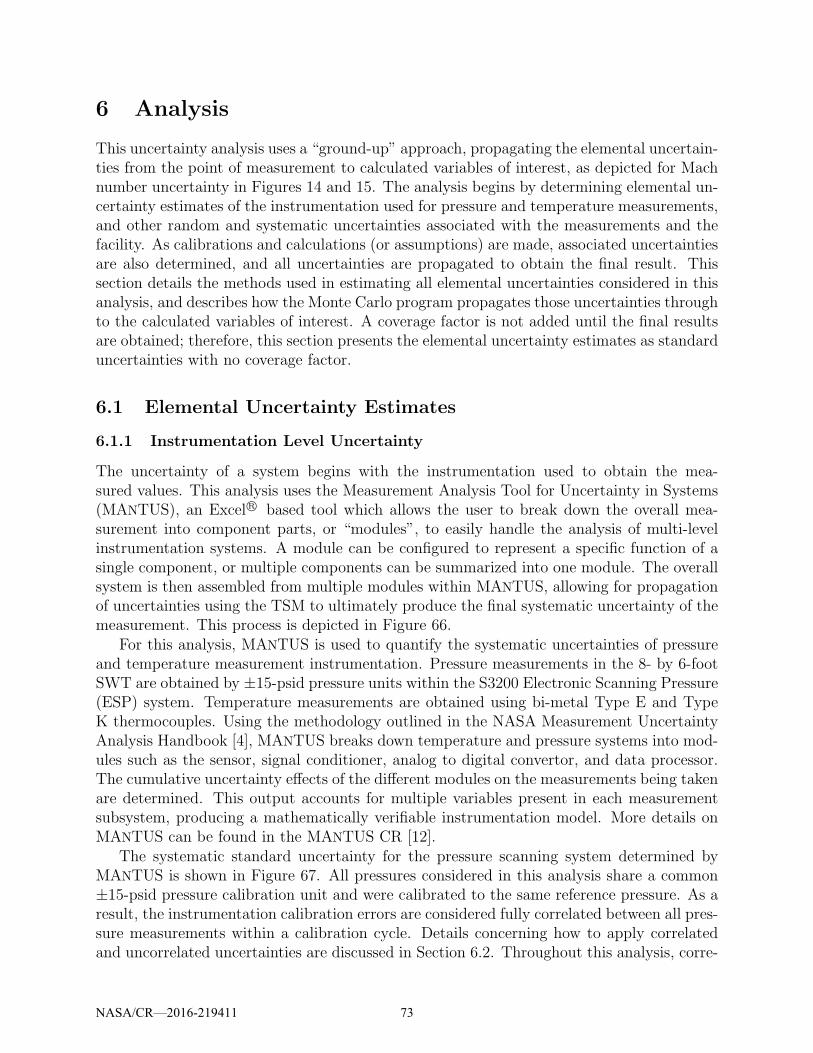
6 Analysis
This uncertainty analysis uses a “ground-up” approach, propagating the elemental uncertain-ties from the point of measurement to calculated variables of interest, as depicted for Machnumber uncertainty in Figures 14 and 15. The analysis begins by determining elemental un-certainty estimates of the instrumentation used for pressure and temperature measurements,and other random and systematic uncertainties associated with the measurements and thefacility. As calibrations and calculations (or assumptions) are made, associated uncertaintiesare also determined, and all uncertainties are propagated to obtain the final result. Thissection details the methods used in estimating all elemental uncertainties considered in thisanalysis, and describes how the Monte Carlo program propagates those uncertainties throughto the calculated variables of interest. A coverage factor is not added until the final resultsare obtained; therefore, this section presents the elemental uncertainty estimates as standarduncertainties with no coverage factor.
6.1 Elemental Uncertainty Estimates
6.1.1 Instrumentation Level Uncertainty
The uncertainty of a system begins with the instrumentation used to obtain the mea-sured values. This analysis uses the Measurement Analysis Tool for Uncertainty in Systems(MANTUS), an Excel R© based tool which allows the user to break down the overall mea-surement into component parts, or “modules”, to easily handle the analysis of multi-levelinstrumentation systems. A module can be configured to represent a specific function of asingle component, or multiple components can be summarized into one module. The overallsystem is then assembled from multiple modules within MANTUS, allowing for propagationof uncertainties using the TSM to ultimately produce the final systematic uncertainty of themeasurement. This process is depicted in Figure 66.
For this analysis, MANTUS is used to quantify the systematic uncertainties of pressureand temperature measurement instrumentation. Pressure measurements in the 8- by 6-footSWT are obtained by ±15-psid pressure units within the S3200 Electronic Scanning Pressure(ESP) system. Temperature measurements are obtained using bi-metal Type E and TypeK thermocouples. Using the methodology outlined in the NASA Measurement UncertaintyAnalysis Handbook [4], MANTUS breaks down temperature and pressure systems into mod-ules such as the sensor, signal conditioner, analog to digital convertor, and data processor.The cumulative uncertainty effects of the different modules on the measurements being takenare determined. This output accounts for multiple variables present in each measurementsubsystem, producing a mathematically verifiable instrumentation model. More details onMANTUS can be found in the MANTUS CR [12].
The systematic standard uncertainty for the pressure scanning system determined byMANTUS is shown in Figure 67. All pressures considered in this analysis share a common±15-psid pressure calibration unit and were calibrated to the same reference pressure. As aresult, the instrumentation calibration errors are considered fully correlated between all pres-sure measurements within a calibration cycle. Details concerning how to apply correlatedand uncorrelated uncertainties are discussed in Section 6.2. Throughout this analysis, corre-
NASA/CR—2016-219411 73

System
Module 2 Module 3Module 1 Module 4
Input
Output valueCombined standard
uncertainty
Expanded
uncertainty
Degrees of freedom
Figure 66: Instrumentation level uncertainty analysis flow.
lated uncertainties from pressure and temperature instrumentation are considered as a unit(bP,corr or bT,corr), rather than separated into each specific variable’s correlated contribution(i.e. bPS,bal,corr
or bTT,bm,corr).
-20 -15 -10 -5 0 5 10 15 20
Pressure Measurement, psid
3
4
5
6
7
8
Syst
emati
c S
tan
dard
Un
cert
ain
ty
of
a P
ress
ure
Mea
sure
men
t, p
si
×10-3
Figure 67: Systematic standard uncertainty of a pressure measurement taken by ±15-psidpressure scanning module.
Although the barometric pressure is not directly shown in any of the calculations forthe variables of interest (see Section 3.3), it is present in the data reduction and chain ofuncertainty propagation since it is added to the measured differential pressures to produceabsolute pressures. The barometric pressure is measured by a high accuracy transducerthat is part of the pressure calibration unit for the ESP system. Uncertainty results fromMANTUS for Pbar as measured by the ESP are shown in Figure 68.
NASA/CR—2016-219411 74
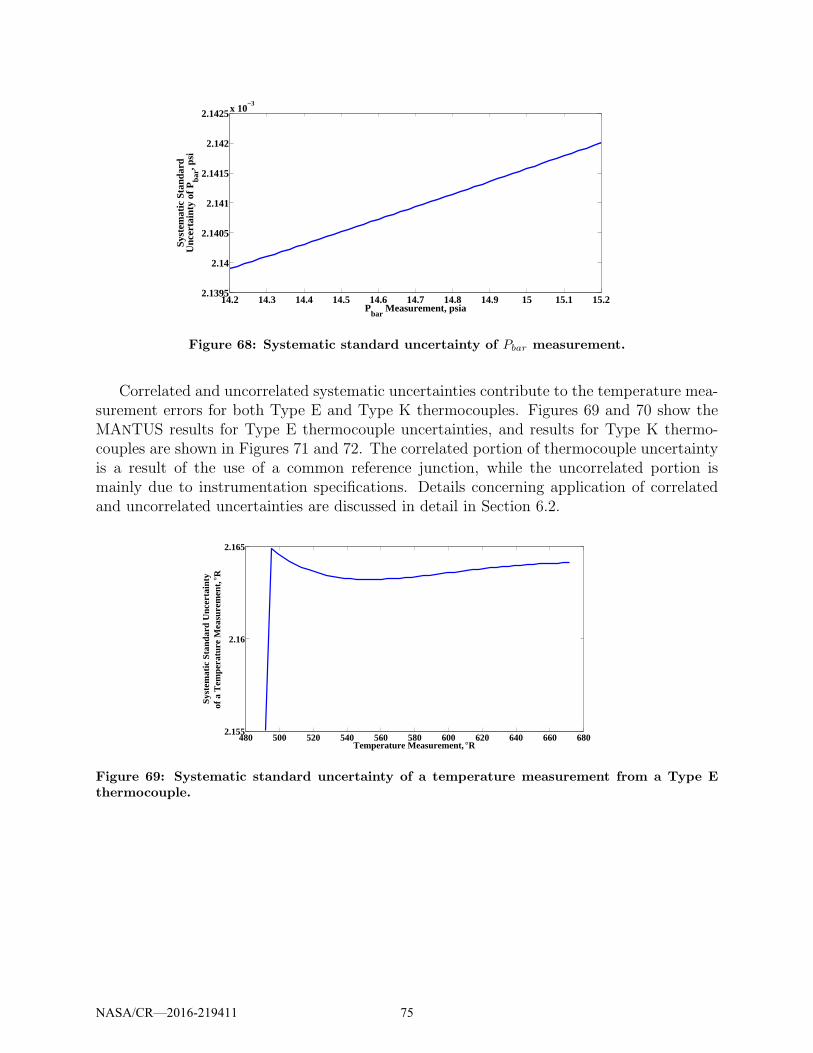
14.2 14.3 14.4 14.5 14.6 14.7 14.8 14.9 15 15.1 15.22.1395
2.14
2.1405
2.141
2.1415
2.142
2.1425x 10⁻³
Pbar
Measurement, psia
Sys
tem
atic
Sta
ndar
dU
ncer
tain
ty o
f Pba
r, psi
Figure 68: Systematic standard uncertainty of Pbar measurement.
Correlated and uncorrelated systematic uncertainties contribute to the temperature mea-surement errors for both Type E and Type K thermocouples. Figures 69 and 70 show theMANTUS results for Type E thermocouple uncertainties, and results for Type K thermo-couples are shown in Figures 71 and 72. The correlated portion of thermocouple uncertaintyis a result of the use of a common reference junction, while the uncorrelated portion ismainly due to instrumentation specifications. Details concerning application of correlatedand uncorrelated uncertainties are discussed in detail in Section 6.2.
480 500 520 540 560 580 600 620 640 660 6802.155
2.16
2.165
Temperature Measurement, °R
Sys
tem
atic
Sta
ndar
d U
ncer
tain
tyof
a T
empe
ratu
re M
easu
rem
ent, °R
Figure 69: Systematic standard uncertainty of a temperature measurement from a Type Ethermocouple.
NASA/CR—2016-219411 75
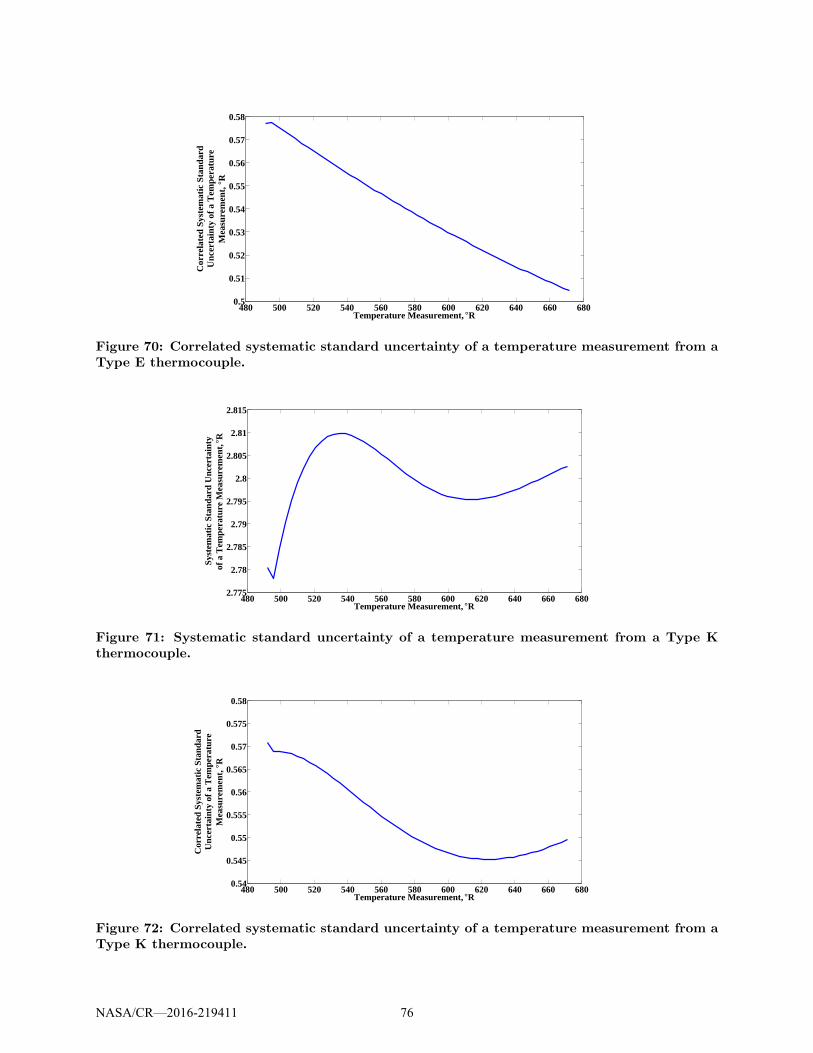
480 500 520 540 560 580 600 620 640 660 6800.5
0.51
0.52
0.53
0.54
0.55
0.56
0.57
0.58
Temperature Measurement, °R
Cor
rela
ted
Sys
tem
atic
Sta
ndar
dU
ncer
tain
ty o
f a T
empe
ratu
reM
easu
rem
ent, °
R
Figure 70: Correlated systematic standard uncertainty of a temperature measurement from aType E thermocouple.
480 500 520 540 560 580 600 620 640 660 6802.775
2.78
2.785
2.79
2.795
2.8
2.805
2.81
2.815
Temperature Measurement, °R
Sys
tem
atic
Sta
ndar
d U
ncer
tain
tyof
a T
empe
ratu
re M
easu
rem
ent, °R
Figure 71: Systematic standard uncertainty of a temperature measurement from a Type Kthermocouple.
480 500 520 540 560 580 600 620 640 660 6800.54
0.545
0.55
0.555
0.56
0.565
0.57
0.575
0.58
Cor
rela
ted
Sys
tem
atic
Sta
ndar
dU
ncer
tain
ty o
f a T
empe
ratu
reM
easu
rem
ent, °
R
Temperature Measurement, °R
Figure 72: Correlated systematic standard uncertainty of a temperature measurement from aType K thermocouple.
NASA/CR—2016-219411 76
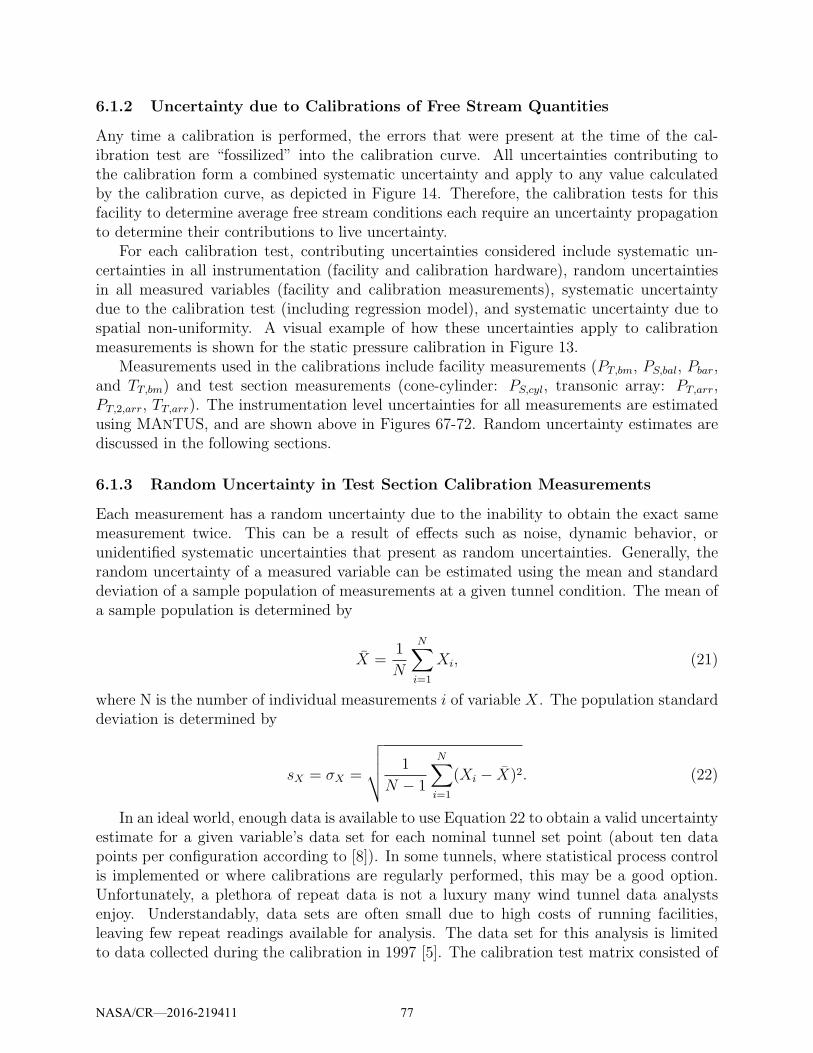
6.1.2 Uncertainty due to Calibrations of Free Stream Quantities
Any time a calibration is performed, the errors that were present at the time of the cal-ibration test are “fossilized” into the calibration curve. All uncertainties contributing tothe calibration form a combined systematic uncertainty and apply to any value calculatedby the calibration curve, as depicted in Figure 14. Therefore, the calibration tests for thisfacility to determine average free stream conditions each require an uncertainty propagationto determine their contributions to live uncertainty.
For each calibration test, contributing uncertainties considered include systematic un-certainties in all instrumentation (facility and calibration hardware), random uncertaintiesin all measured variables (facility and calibration measurements), systematic uncertaintydue to the calibration test (including regression model), and systematic uncertainty due tospatial non-uniformity. A visual example of how these uncertainties apply to calibrationmeasurements is shown for the static pressure calibration in Figure 13.
Measurements used in the calibrations include facility measurements (PT,bm, PS,bal, Pbar,and TT,bm) and test section measurements (cone-cylinder: PS,cyl, transonic array: PT,arr,PT,2,arr, TT,arr). The instrumentation level uncertainties for all measurements are estimatedusing MANTUS, and are shown above in Figures 67-72. Random uncertainty estimates arediscussed in the following sections.
6.1.3 Random Uncertainty in Test Section Calibration Measurements
Each measurement has a random uncertainty due to the inability to obtain the exact samemeasurement twice. This can be a result of effects such as noise, dynamic behavior, orunidentified systematic uncertainties that present as random uncertainties. Generally, therandom uncertainty of a measured variable can be estimated using the mean and standarddeviation of a sample population of measurements at a given tunnel condition. The mean ofa sample population is determined by
X =1
N
N∑
i=1
Xi, (21)
where N is the number of individual measurements i of variable X. The population standarddeviation is determined by
sX = σX =
√
√
√
√
1
N − 1
N∑
i=1
(Xi − X)2. (22)
In an ideal world, enough data is available to use Equation 22 to obtain a valid uncertaintyestimate for a given variable’s data set for each nominal tunnel set point (about ten datapoints per configuration according to [8]). In some tunnels, where statistical process controlis implemented or where calibrations are regularly performed, this may be a good option.Unfortunately, a plethora of repeat data is not a luxury many wind tunnel data analystsenjoy. Understandably, data sets are often small due to high costs of running facilities,leaving few repeat readings available for analysis. The data set for this analysis is limitedto data collected during the calibration in 1997 [5]. The calibration test matrix consisted of
NASA/CR—2016-219411 77

only one or occasionally two Mach range sweeps for any given hardware setup, providing verylimited repeat data points at any given tunnel set condition. While two to three back-to-back, time-averaged data points are available for each Mach range sweep, these are averagedand considered a single reading to assure the time scale is representative of factors that havesignificant influence on random uncertainty in the data. [8]
When an insufficient number of distinct repeat data points are available to use Equation22, the standard deviation can be estimated by converting the range of the available datafrom a biased to an unbiased estimator of the standard deviation [13]:
sX = σX ≈Xmax −Xmin
d2(n), (23)
where Xmax is the maximum value in the sample, Xmin is the minimum value, and d2 canbe derived as a function of n, the number of readings in the sample, assuming a normalprobability distribution. Values of d2 for small sample sizes are provided in Table 28.
n 2 3 4 5 6 7 8 9d2(n) 1.128 1.639 2.059 2.326 2.534 2.704 2.847 2.970
Table 28: Values for statistical estimation factor d2(n) for n samples
During calibration, the transonic array obtained two distinct repeated data samples forapproximately half of the tunnel’s set points distributed across the Mach range at differenttimes during the test. When Equation 23 is applied to static and total pressure measurementsfrom the array, the results shown in Figure 73 are obtained. The two results show verysimilar behavior, likely indicating a random correlation between these variables, particularlyin the subsonic range where peaks and valleys of the “random” behavior suspiciously match.The presence of these correlations inflates the uncertainty estimates of these variables. Thecorrelation effect is believed to be a product of setting the tunnel condition to pressureratio Φ. This naturally (and intentionally!) affects the relationship between static and totalpressure within the test section. Total and static pressure may vary upward and downwardtogether, perhaps following changes in barometric pressure, even as Φ remains constant.
To remove the effects of this correlation, random uncertainty in array total and staticpressure is estimated by calculating an “expected” test section pressure based on facilitymeasurements and calibration curves for PS,ts, PT,ts, and PT,2,ts for each of the two availabledata points. The differences between the measured and expected test section values (theresiduals) are evaluated at each tunnel set point. When the d2 factor is applied to thoseresults, modified estimates of random standard uncertainty for PT,arr, PT,2,arr, and PS,arr areobtained. These are shown in Figure 74.
The same method described for estimating random uncertainty in static and total arraypressure is used to estimate random uncertainty in array total temperature, the results ofwhich are shown in Figure 75. Examining the difference between the expected (calibrated)and measured values assures that variations due to lack of temperature control in the facilitydoes not influence the random uncertainty estimate for TT,arr.
Only one sweep through the Mach range was performed with the cone-cylinder in placefor each tunnel configuration during the static pressure calibration test. Therefore, no repeat
NASA/CR—2016-219411 78

0 0.2 0.4 0.6 0.8 1 1.2 1.4 1.6 1.8 2
Nominal Mach Number
0
0.05
0.1
0.15
0.2
Sta
nd
ard
Dev
iati
on
s
in T
est
Sec
tion
Pre
ssu
res,
psi
a
PT,arr
and PT,2,arr
PS,arr
Figure 73: Standard deviations of transonic array pressures, configuration 1
0 0.2 0.4 0.6 0.8 1 1.2 1.4 1.6 1.8 2
Nominal Mach Number
0
0.05
0.1
0.15
0.2
Ran
dom
Sta
nd
ard
Un
cert
ain
ty
in T
est
Sec
tion
Pre
ssu
res,
psi
a
PT,arr
and PT,2,arr
PS,arr
Figure 74: Random standard uncertainty in PT,arr, PT,2,arr, and PS,arr for configuration 1, withrandom correlation effect removed
data points were acquired for cylinder static pressure PS,cyl. Since static pressure data wasacquired by the transonic array with similar pressure probes in similar locations and tunnelconditions, an engineering judgment was made to estimate the random uncertainty in staticpressure measured by the cylinder using the available array data, PS,arr. If more repeat datais obtained with the cylinder in future tests, the random uncertainty should be estimatedusing cylinder data.
NASA/CR—2016-219411 79
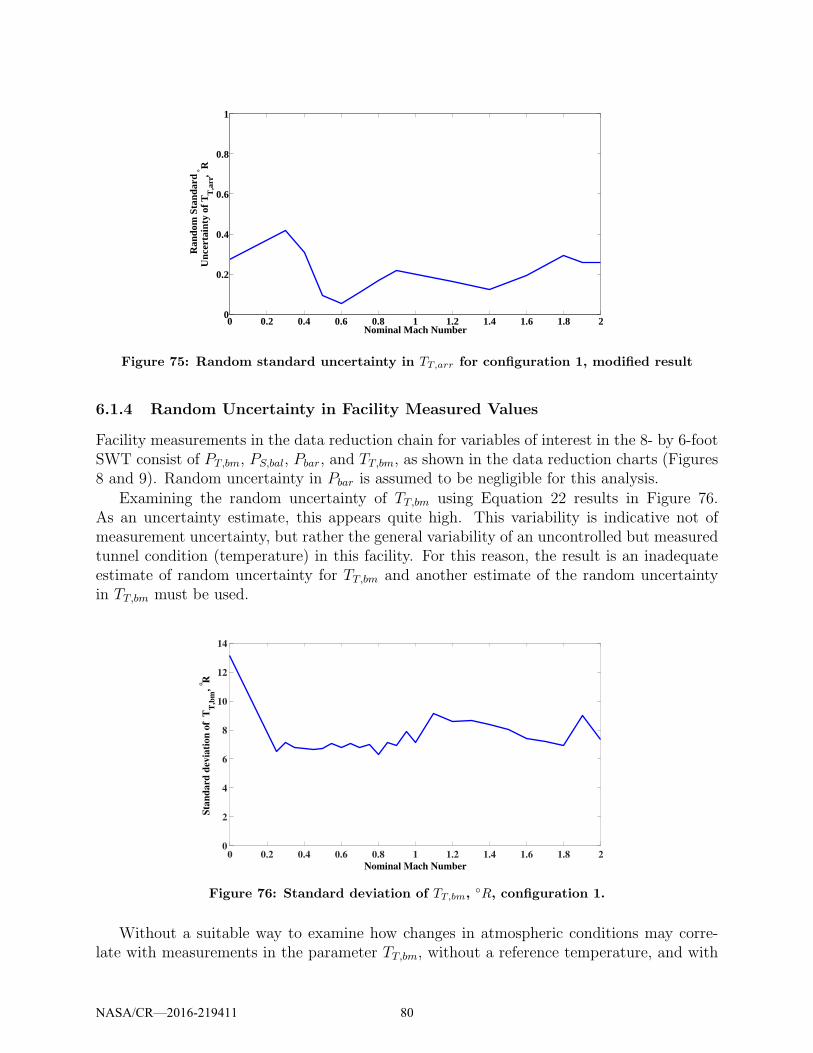
0 0.2 0.4 0.6 0.8 1 1.2 1.4 1.6 1.8 20
0.2
0.4
0.6
0.8
1
Nominal Mach Number
Ran
dom
Sta
ndar
dU
ncer
tain
ty o
f TT
,arr
, ° R
Figure 75: Random standard uncertainty in TT,arr for configuration 1, modified result
6.1.4 Random Uncertainty in Facility Measured Values
Facility measurements in the data reduction chain for variables of interest in the 8- by 6-footSWT consist of PT,bm, PS,bal, Pbar, and TT,bm, as shown in the data reduction charts (Figures8 and 9). Random uncertainty in Pbar is assumed to be negligible for this analysis.
Examining the random uncertainty of TT,bm using Equation 22 results in Figure 76.As an uncertainty estimate, this appears quite high. This variability is indicative not ofmeasurement uncertainty, but rather the general variability of an uncontrolled but measuredtunnel condition (temperature) in this facility. For this reason, the result is an inadequateestimate of random uncertainty for TT,bm and another estimate of the random uncertaintyin TT,bm must be used.
0 0.2 0.4 0.6 0.8 1 1.2 1.4 1.6 1.8 2
Nominal Mach Number
0
2
4
6
8
10
12
14
Sta
nd
ard
dev
iati
on
of
TT
,bm
, ° R
Figure 76: Standard deviation of TT,bm, ◦R, configuration 1.
Without a suitable way to examine how changes in atmospheric conditions may corre-late with measurements in the parameter TT,bm, without a reference temperature, and with
NASA/CR—2016-219411 80
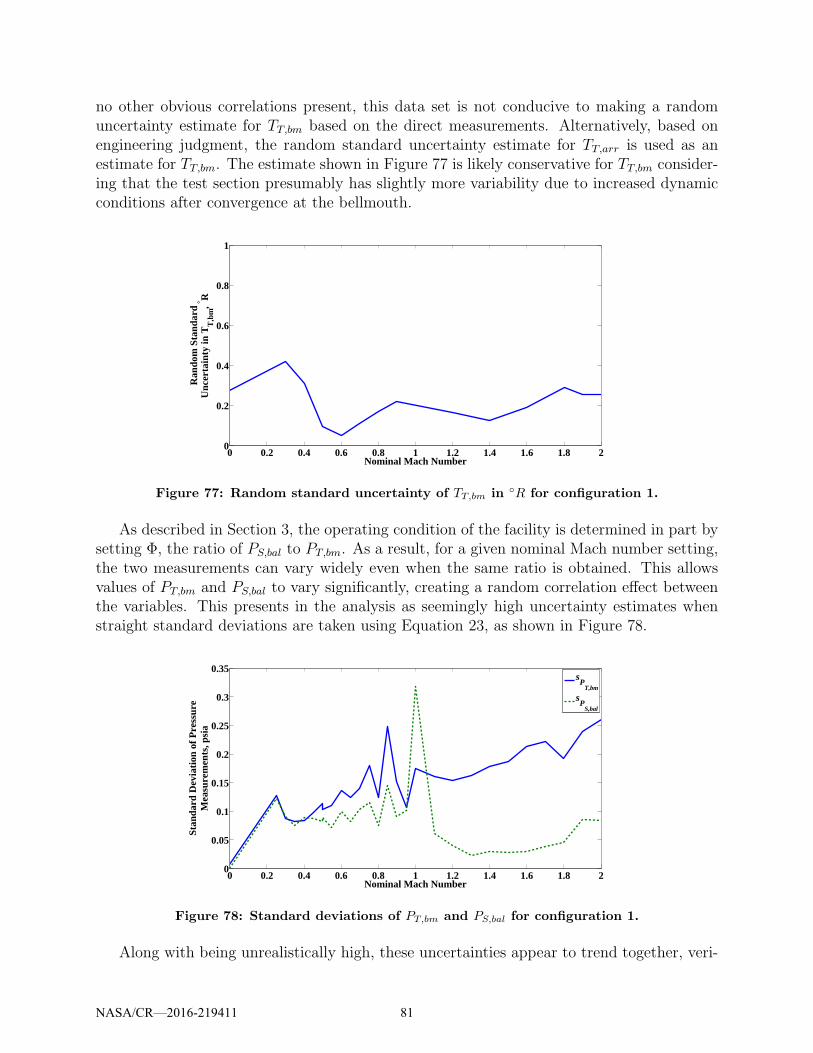
no other obvious correlations present, this data set is not conducive to making a randomuncertainty estimate for TT,bm based on the direct measurements. Alternatively, based onengineering judgment, the random standard uncertainty estimate for TT,arr is used as anestimate for TT,bm. The estimate shown in Figure 77 is likely conservative for TT,bm consider-ing that the test section presumably has slightly more variability due to increased dynamicconditions after convergence at the bellmouth.
0 0.2 0.4 0.6 0.8 1 1.2 1.4 1.6 1.8 20
0.2
0.4
0.6
0.8
1
Nominal Mach Number
Ran
dom
Sta
ndar
dU
ncer
tain
ty in
TT
,bm
, ° R
Figure 77: Random standard uncertainty of TT,bm in ◦R for configuration 1.
As described in Section 3, the operating condition of the facility is determined in part bysetting Φ, the ratio of PS,bal to PT,bm. As a result, for a given nominal Mach number setting,the two measurements can vary widely even when the same ratio is obtained. This allowsvalues of PT,bm and PS,bal to vary significantly, creating a random correlation effect betweenthe variables. This presents in the analysis as seemingly high uncertainty estimates whenstraight standard deviations are taken using Equation 23, as shown in Figure 78.
0 0.2 0.4 0.6 0.8 1 1.2 1.4 1.6 1.8 20
0.05
0.1
0.15
0.2
0.25
0.3
0.35
Nominal Mach Number
Sta
ndar
d D
evia
tion
of P
ress
ure
Mea
sure
men
ts, p
sia
sP
T,bm
sP
S,bal
Figure 78: Standard deviations of PT,bm and PS,bal for configuration 1.
Along with being unrealistically high, these uncertainties appear to trend together, veri-
NASA/CR—2016-219411 81
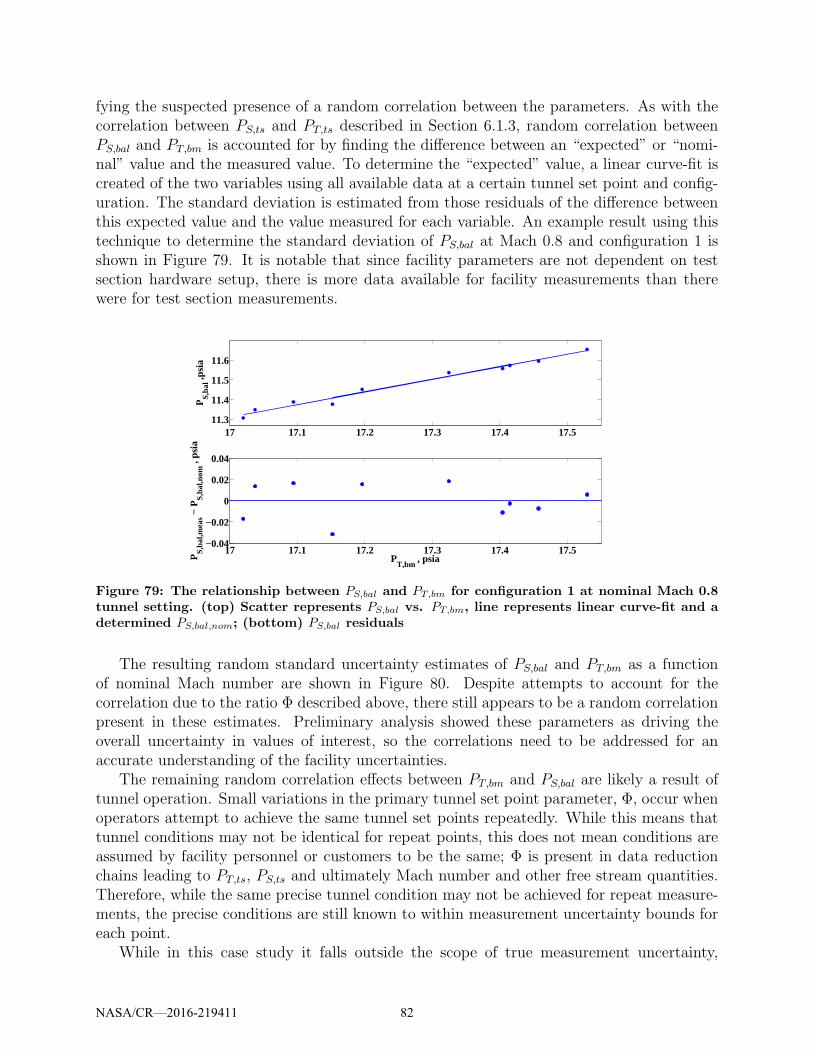
fying the suspected presence of a random correlation between the parameters. As with thecorrelation between PS,ts and PT,ts described in Section 6.1.3, random correlation betweenPS,bal and PT,bm is accounted for by finding the difference between an “expected” or “nomi-nal” value and the measured value. To determine the “expected” value, a linear curve-fit iscreated of the two variables using all available data at a certain tunnel set point and config-uration. The standard deviation is estimated from those residuals of the difference betweenthis expected value and the value measured for each variable. An example result using thistechnique to determine the standard deviation of PS,bal at Mach 0.8 and configuration 1 isshown in Figure 79. It is notable that since facility parameters are not dependent on testsection hardware setup, there is more data available for facility measurements than therewere for test section measurements.
17 17.1 17.2 17.3 17.4 17.511.3
11.4
11.5
11.6
PS
,bal ,p
sia
17 17.1 17.2 17.3 17.4 17.5−0.04
−0.02
0
0.02
0.04
PT,bm
, psiaPS
,bal
,mea
s − P
S,b
al,n
om ,
psia
Figure 79: The relationship between PS,bal and PT,bm for configuration 1 at nominal Mach 0.8tunnel setting. (top) Scatter represents PS,bal vs. PT,bm, line represents linear curve-fit and adetermined PS,bal,nom; (bottom) PS,bal residuals
The resulting random standard uncertainty estimates of PS,bal and PT,bm as a functionof nominal Mach number are shown in Figure 80. Despite attempts to account for thecorrelation due to the ratio Φ described above, there still appears to be a random correlationpresent in these estimates. Preliminary analysis showed these parameters as driving theoverall uncertainty in values of interest, so the correlations need to be addressed for anaccurate understanding of the facility uncertainties.
The remaining random correlation effects between PT,bm and PS,bal are likely a result oftunnel operation. Small variations in the primary tunnel set point parameter, Φ, occur whenoperators attempt to achieve the same tunnel set points repeatedly. While this means thattunnel conditions may not be identical for repeat points, this does not mean conditions areassumed by facility personnel or customers to be the same; Φ is present in data reductionchains leading to PT,ts, PS,ts and ultimately Mach number and other free stream quantities.Therefore, while the same precise tunnel condition may not be achieved for repeat measure-ments, the precise conditions are still known to within measurement uncertainty bounds foreach point.
While in this case study it falls outside the scope of true measurement uncertainty,
NASA/CR—2016-219411 82
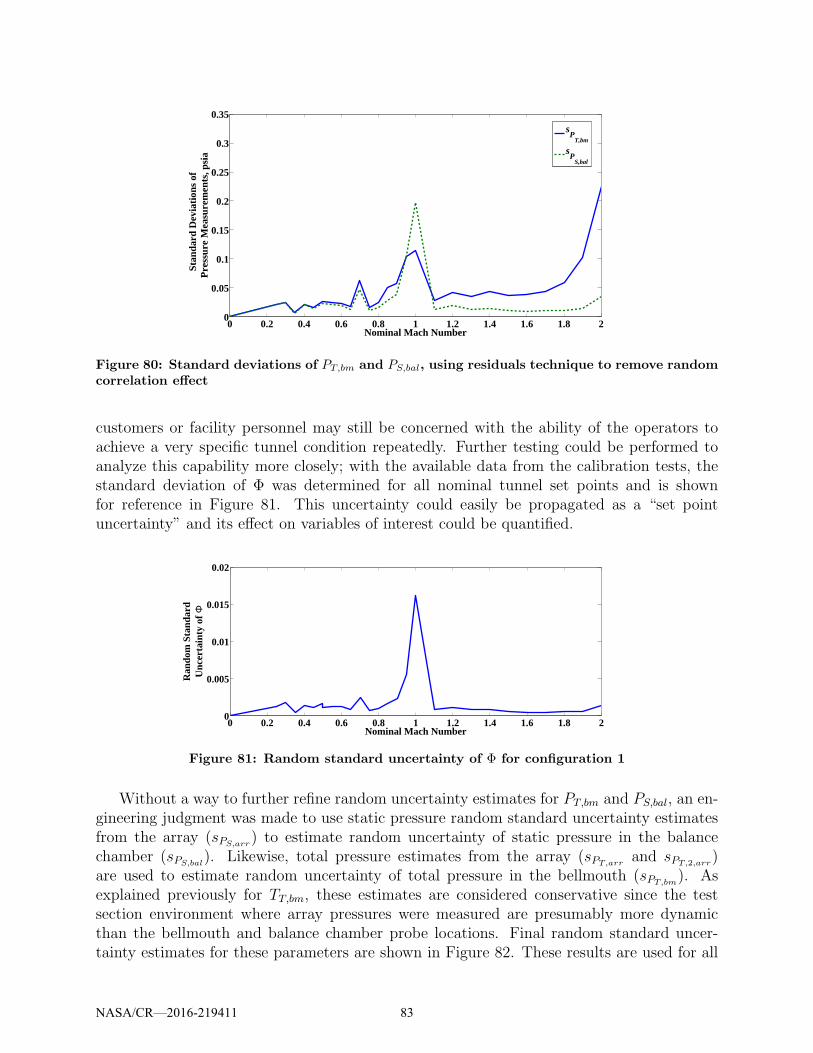
0 0.2 0.4 0.6 0.8 1 1.2 1.4 1.6 1.8 20
0.05
0.1
0.15
0.2
0.25
0.3
0.35
Nominal Mach Number
Sta
ndar
d D
evia
tions
of
P
ress
ure
Mea
sure
men
ts, p
sia
sP
T,bm
sP
S,bal
Figure 80: Standard deviations of PT,bm and PS,bal, using residuals technique to remove randomcorrelation effect
customers or facility personnel may still be concerned with the ability of the operators toachieve a very specific tunnel condition repeatedly. Further testing could be performed toanalyze this capability more closely; with the available data from the calibration tests, thestandard deviation of Φ was determined for all nominal tunnel set points and is shownfor reference in Figure 81. This uncertainty could easily be propagated as a “set pointuncertainty” and its effect on variables of interest could be quantified.
0 0.2 0.4 0.6 0.8 1 1.2 1.4 1.6 1.8 20
0.005
0.01
0.015
0.02
Nominal Mach Number
Ran
dom
Sta
ndar
dU
ncer
tain
ty o
f Φ
Figure 81: Random standard uncertainty of Φ for configuration 1
Without a way to further refine random uncertainty estimates for PT,bm and PS,bal, an en-gineering judgment was made to use static pressure random standard uncertainty estimatesfrom the array (sPS,arr
) to estimate random uncertainty of static pressure in the balancechamber (sPS,bal
). Likewise, total pressure estimates from the array (sPT,arrand sPT,2,arr
)are used to estimate random uncertainty of total pressure in the bellmouth (sPT,bm
). Asexplained previously for TT,bm, these estimates are considered conservative since the testsection environment where array pressures were measured are presumably more dynamicthan the bellmouth and balance chamber probe locations. Final random standard uncer-tainty estimates for these parameters are shown in Figure 82. These results are used for all
NASA/CR—2016-219411 83
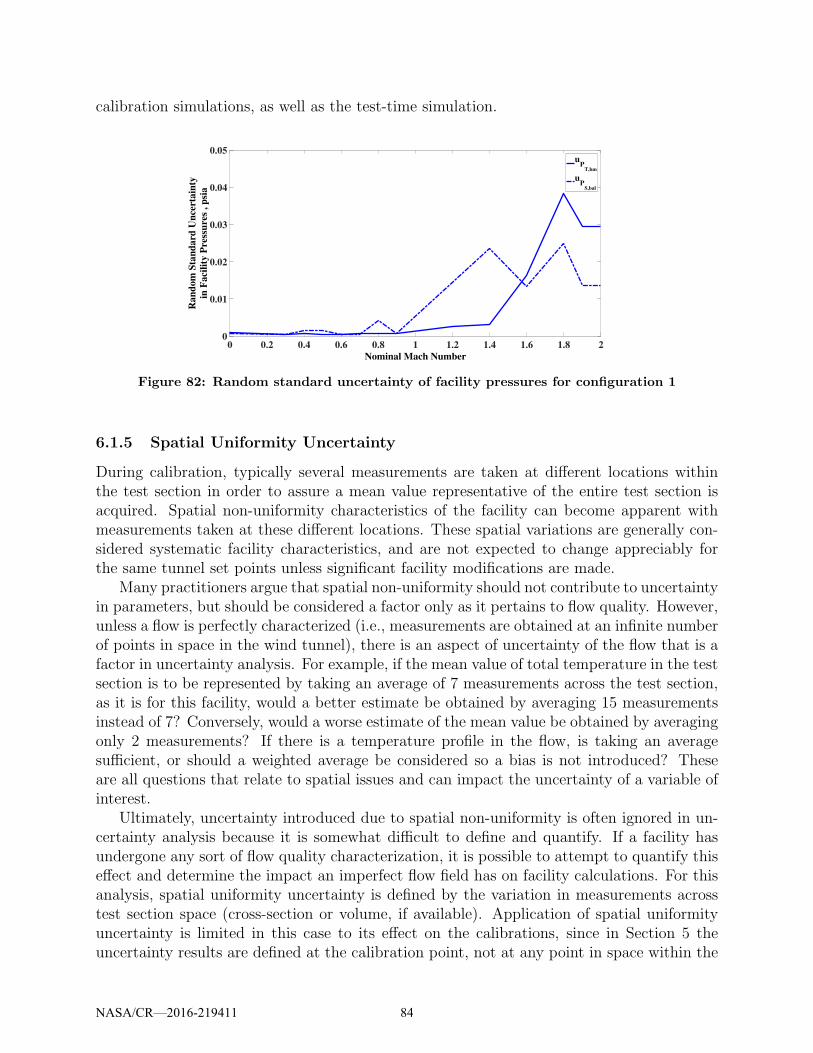
calibration simulations, as well as the test-time simulation.
0 0.2 0.4 0.6 0.8 1 1.2 1.4 1.6 1.8 2
Nominal Mach Number
0
0.01
0.02
0.03
0.04
0.05
Ran
dom
Sta
nd
ard
Un
cert
ain
ty
in F
aci
lity
Pre
ssu
res
, p
sia
uP
T,bm
uP
S,bal
Figure 82: Random standard uncertainty of facility pressures for configuration 1
6.1.5 Spatial Uniformity Uncertainty
During calibration, typically several measurements are taken at different locations withinthe test section in order to assure a mean value representative of the entire test section isacquired. Spatial non-uniformity characteristics of the facility can become apparent withmeasurements taken at these different locations. These spatial variations are generally con-sidered systematic facility characteristics, and are not expected to change appreciably forthe same tunnel set points unless significant facility modifications are made.
Many practitioners argue that spatial non-uniformity should not contribute to uncertaintyin parameters, but should be considered a factor only as it pertains to flow quality. However,unless a flow is perfectly characterized (i.e., measurements are obtained at an infinite numberof points in space in the wind tunnel), there is an aspect of uncertainty of the flow that is afactor in uncertainty analysis. For example, if the mean value of total temperature in the testsection is to be represented by taking an average of 7 measurements across the test section,as it is for this facility, would a better estimate be obtained by averaging 15 measurementsinstead of 7? Conversely, would a worse estimate of the mean value be obtained by averagingonly 2 measurements? If there is a temperature profile in the flow, is taking an averagesufficient, or should a weighted average be considered so a bias is not introduced? Theseare all questions that relate to spatial issues and can impact the uncertainty of a variable ofinterest.
Ultimately, uncertainty introduced due to spatial non-uniformity is often ignored in un-certainty analysis because it is somewhat difficult to define and quantify. If a facility hasundergone any sort of flow quality characterization, it is possible to attempt to quantify thiseffect and determine the impact an imperfect flow field has on facility calculations. For thisanalysis, spatial uniformity uncertainty is defined by the variation in measurements acrosstest section space (cross-section or volume, if available). Application of spatial uniformityuncertainty is limited in this case to its effect on the calibrations, since in Section 5 theuncertainty results are defined at the calibration point, not at any point in space within the
NASA/CR—2016-219411 84

test section. Test-time variations in spatial uniformity are dependent on the model, and areimpossible to account for within this analysis.
Uncertainty due to spatial uniformity is initially examined by taking the standard devi-ation of the measurements across all ports used for the representative average test sectionmeasurement during calibration. For the static pressure calibration, this consists of 56 mea-surements along the aft portion of the cone-cylinder. Variations are found to be very highalong the cylinder in the transonic and supersonic regimes, presumably due to the prop-agation of shocks axially through the test section at these tunnel speeds (see Figure 83).Because these variations are likely induced by the test hardware itself, measurements madeby the transonic array are alternatively considered for static pressure uniformity analysis.Array measurements from data obtained at five rake heights in the cross section of the testsection entrance are used. Further analysis to isolate spatial effects, detailed in Appendix J,yields a static pressure spatial uniformity estimate shown in Figure 83. The interpolationshown is performed to eliminate the effect of suspected shock interactions introduced byarray probes.
0 0.2 0.4 0.6 0.8 1 1.2 1.4 1.6 1.8 20
0.05
0.1
0.15
0.2
0.25
0.3
0.35
0.4
Nominal Mach Number
Sta
tic P
ress
ure
Spa
tial
Uni
form
ity U
ncer
tain
ty, p
sia
bP
S,unifcyl
bP
S,unifarray
Interpolation
Figure 83: Static pressure spatial uniformity standard uncertainty estimate for configuration1. The red line indicates the estimate from the cone-cylinder data; the blue line indicates theestimate from the transonic array, with an interpolation performed to reduce shock interactionsfrom calibration instrumentation.
For total pressure and total temperature uniformity, data obtained by the transonic ar-ray at five rake heights at the test section entrance is analyzed. Since data was obtainedon different days and under different atmospheric conditions (which have a direct impacton temperature and pressure levels in this atmospheric tunnel), a straight standard devia-tion of these measurements across space is not valid to assess variation of total pressure ortotal temperature. Attempts to isolate spatial effects of these two variables are detailed inAppendix J. Results for total pressure spatial uniformity are shown in Figure 84.
Generally, when considering uncertainty due to spatial uniformity, it is important toverify that other error sources (instrumentation, random) are not also contributing to theobserved results, and that the spatial uniformity errors are isolated. Systematic uncertaintyin temperature instrumentation is particular cause for concern, as systematic errors are
NASA/CR—2016-219411 85

0 0.2 0.4 0.6 0.8 1 1.2 1.4 1.6 1.8 20
0.02
0.04
0.06
0.08
0.1
Spa
tial U
nifo
rmity
U
ncer
tain
ty in
PT
,arr
ay, p
sia
Nominal Mach Number
Figure 84: Spatial uniformity standard uncertainty in PT,arr for configuration 1
large and can create offsets in probe measurements, requiring some additional uncertaintyaccounting. The random uncertainty contribution (Figure 75) to temperature measurementsis likely negligible, but will be considered for completeness.
A small Monte Carlo side-analysis is performed to find the contributions of random anduncorrelated systematic uncertainty to the thermocouple probes and subsequent calculationof uniformity, so that a true spatial uniformity uncertainty can be isolated. Note that thecorrelated portion of uncertainty is not considered, since it would effect all probes equallyand thus there would be no impact to the standard deviation calculation. Uncertaintycontributions to the spatial uniformity calculation from uncorrelated systematic uncertainty(notated bTT,arr,unifinst
) and from random uncertainty (sTT,arr,unifran) as deduced from the side-
analysis subtract as root-sum-squares from the observed uniformity (bTT,arr,unifobs), and are
accounted for by
bTT,arr,uniftrue=
√
b2TT,arr,unifobs− b2TT,arr,unifinst
− s2TT,arr,unifran(24)
where bTT,arr,uniftrueis the isolated systematic uncertainty in array total temperature due
to spatial uniformity. Equation 24 simply assumes that the uniformity, instrumentationand random errors are independent, and therefore combine as root-sum-squares. Spatialuniformity of the total temperature after accounting for this can be seen in Figure 85 forconfiguration 1.
NASA/CR—2016-219411 86
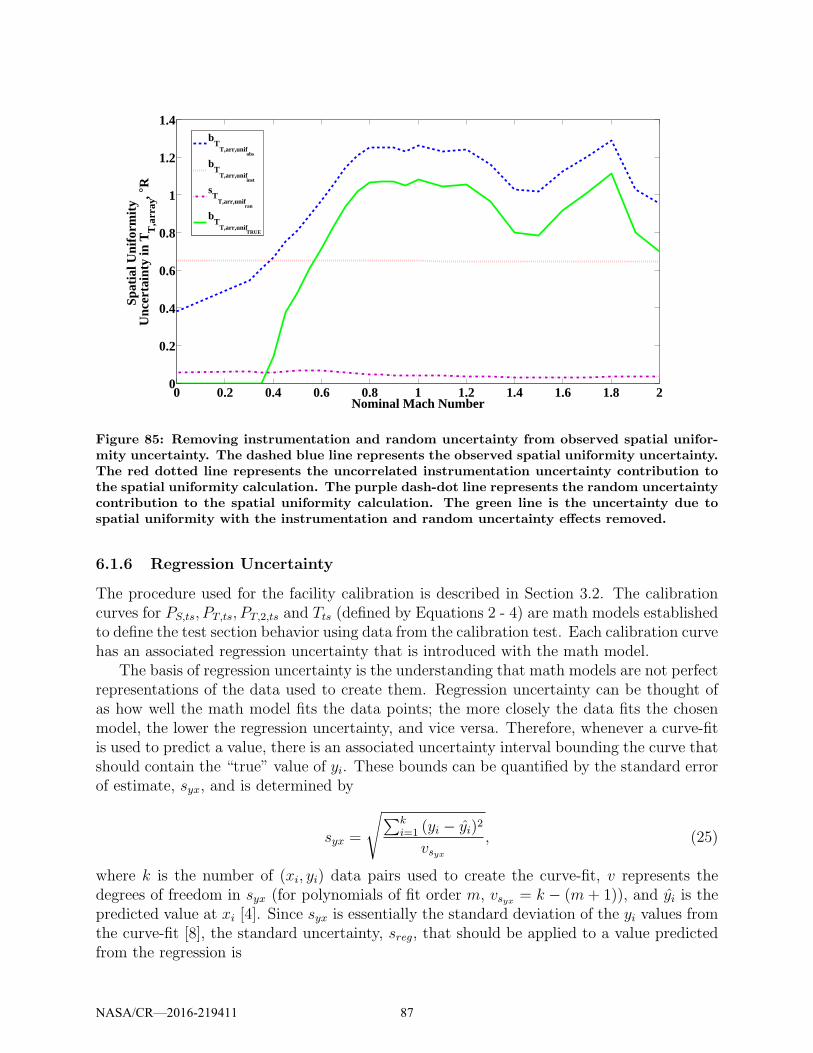
0 0.2 0.4 0.6 0.8 1 1.2 1.4 1.6 1.8 20
0.2
0.4
0.6
0.8
1
1.2
1.4S
patia
l Uni
form
ity
Unc
erta
inty
in T
T,a
rray
, °R
Nominal Mach Number
b
TT,arr,unif
obs
bT
T,arr,unifinst
sT
T,arr,unifran
bT
T,arr,unifTRUE
Figure 85: Removing instrumentation and random uncertainty from observed spatial unifor-mity uncertainty. The dashed blue line represents the observed spatial uniformity uncertainty.The red dotted line represents the uncorrelated instrumentation uncertainty contribution tothe spatial uniformity calculation. The purple dash-dot line represents the random uncertaintycontribution to the spatial uniformity calculation. The green line is the uncertainty due tospatial uniformity with the instrumentation and random uncertainty effects removed.
6.1.6 Regression Uncertainty
The procedure used for the facility calibration is described in Section 3.2. The calibrationcurves for PS,ts, PT,ts, PT,2,ts and Tts (defined by Equations 2 - 4) are math models establishedto define the test section behavior using data from the calibration test. Each calibration curvehas an associated regression uncertainty that is introduced with the math model.
The basis of regression uncertainty is the understanding that math models are not perfectrepresentations of the data used to create them. Regression uncertainty can be thought ofas how well the math model fits the data points; the more closely the data fits the chosenmodel, the lower the regression uncertainty, and vice versa. Therefore, whenever a curve-fitis used to predict a value, there is an associated uncertainty interval bounding the curve thatshould contain the “true” value of yi. These bounds can be quantified by the standard errorof estimate, syx, and is determined by
syx =
√
∑k
i=1(yi − yi)2
vsyx, (25)
where k is the number of (xi, yi) data pairs used to create the curve-fit, v represents thedegrees of freedom in syx (for polynomials of fit order m, vsyx = k − (m+ 1)), and yi is thepredicted value at xi [4]. Since syx is essentially the standard deviation of the yi values fromthe curve-fit [8], the standard uncertainty, sreg, that should be applied to a value predictedfrom the regression is
NASA/CR—2016-219411 87

sreg = syx. (26)
This methodology is applied to quantify regression uncertainty for all four calibrationcurves in this analysis. Regression uncertainty is applied as stated above whenever a cali-bration curve is used to calculate a predicted value in the data reduction sequence, based onthe determined sreg for each curve.
The standard error of forecast, sf , is used in some situations to quantify uncertaintythat is applied to a regression. On top of the standard uncertainty calculated by syx, sfadditionally accounts for the dispersion in xi values present in the calibration data sample.In other words, it can account for high or low areas of data density in xi collected duringcalibration; uncertainty in y may be higher in areas of low data density and vice versa. Aprediction interval about the curve-fit for a future determination of y as a function of x0 fora polynomial curve-fit is computed by [14]
sf = syx√
1 + x′(X ′X)−1x (27)
where syx is determined from Equation 25, X is determined by
X =
1 x1 x21 . . . xk
1
1 x2 x22 . . . xk
2
......
.... . .
...1 xk x2
k . . . xmk
,
using xi values from the total number of calibration data points k, m is the order of fit, andx is determined by
x =
1x0
x20
...xm0
.
X ′ and x′ are the transpose of X and x, respectively, and x0 is the independent variable ofinterest.
Assumptions of Equation 27 are that no random uncertainty is present in xi or x0, randomuncertainty in yi is constant across the calibrated range, and the distribution of yi data aboutthe curve-fit is purely an artifact of random uncertainty with no uncertainty contributionfrom the selected math model. If the latter assumption held true, the expectation would bethat several repeat data points obtained would show yi data distributed normally about thecalibration curve. The standard error of forecast accounts for the fact that the regressionwas generated from a select data set, and that if different sets of data were collected (withrandom errors in yi present in each), different regression curves would be formed [4].
The assumptions for Equation 27 are almost always violated in actual tests, and thiscalibration test is no exception. For all four facility calibration curves, random uncertaintyis present in x, random uncertainty in y is not constant across the calibrated range, andaccording to facility personnel, it is believed that offsets from the curve-fits are primarily
NASA/CR—2016-219411 88
due to math model errors, not random uncertainty (repeat readings would be expected to beclustered around the collected (xi, yi) data points, not spread about the calibration curves).These violations make it undesirable to use Equation 27 to determine regression uncertaintyin this context; doing so would inflate the calculated uncertainty. Additionally, the impactof data density in x on uncertainty in y is inherently accounted for within the Monte Carloerror propagation when appropriate standard uncertainty estimates are applied to xi and yi(or to the measured parameters used to calculate these variables).
It should also be noted that the standard error of forecast and standard error of estimateare often quite similar if data is well dispersed across the calibrated range and a large numberof data points are included in the regression. In such an instance, if the Monte Carlo methodis not being used and the aforementioned assumptions can be made to calculate sf , it maybe simpler to use syx to approximate the regression standard uncertainty estimate.
6.2 Monte Carlo Simulation
For this uncertainty analysis, an offline data reduction program replicates the actual datareduction script run within the ESCORT data acquisition system. MATLAB is used be-cause of its specialty in performing array calculations, which works well for a Monte Carlosimulation where thousands of iterations are often desired.
After estimating all considered random and systematic uncertainties of all measuredvalues (discussed in Sections 6.1 and 6.1.6), a Monte Carlo simulation is used to propagatethose uncertainties through the data reduction to calculate the estimated uncertainty of thecalculated values of interest. An overview of this method of uncertainty propagation can befound in Section 4.3 with further details provided by Coleman and Steele [8].
The simulation begins by randomly generating numbers along an appropriate probabilitydistribution and scaling them by the random and systematic uncertainties of each variable.These populations of errors are applied to the measurements in an appropriate manner(discussed below) across all readings, ports, and i synthetic iterations of the test. Thisanalysis uses i = 10, 000 for the calibrations and “test-time” simulations calculating finaluncertainties in all variables of interest.
Once errors are applied to all measured values for each iteration (or synthetic realization)of the test, the variables of interest are calculated using the synthetic data (e.g. Mach andReynolds number). This results in i calculations of any variable of interest. The standarddeviation provides the desired overall uncertainty of the variable of interest. This process isdepicted in Figure 86 as it applies to the subsonic total pressure calibration.
When possible, it is preferable to construct a Monte Carlo simulation program thatfollows an actual test as closely as possible. This approach usually makes it easier to followthe flow of data and introduce elemental errors in the appropriate places. To that end, MonteCarlo simulations are run for each of the calibration tests (static pressure, total pressure, andtotal temperature). The results of each of these simulations provide the fossilized systematicuncertainties to be applied in the subsequent simulation of a customer test, where all variablesof interest and their uncertainties are calculated. Finally, a coverage factor is applied tocalculate the expanded uncertainties as presented in Section 5.
The code is written in such a way that elemental uncertainties can be flagged on or off.The flags allow one elemental uncertainty to be propagated at a time so that the effect of
NASA/CR—2016-219411 89

that particular uncertainty on the total uncertainty of a variable can be calculated. Theseindividual contributions sum as root sum squares to the total uncertainty of a variable (whichis confirmed by performing the analysis with all uncertainties flagged on). Using these results,the percent contribution of each elemental uncertainty (or group of uncertainties, such as allinstrumentation) to the overall uncertainty of the value of interest is observed (see Equation20 and Section 4.2).
NASA/CR—2016-219411 90

Figure
86:Overv
iew
ofM
onte
CarloSim
ulationforUncertainty
Analysis:
Depicts
analysisofto
talpre
ssure
calibra
tionin
subso
nic
range.Based
on
themeth
od
described
byColeman
and
Steel[8]page72,Figure
3.4.
NASA/CR—2016-219411 91
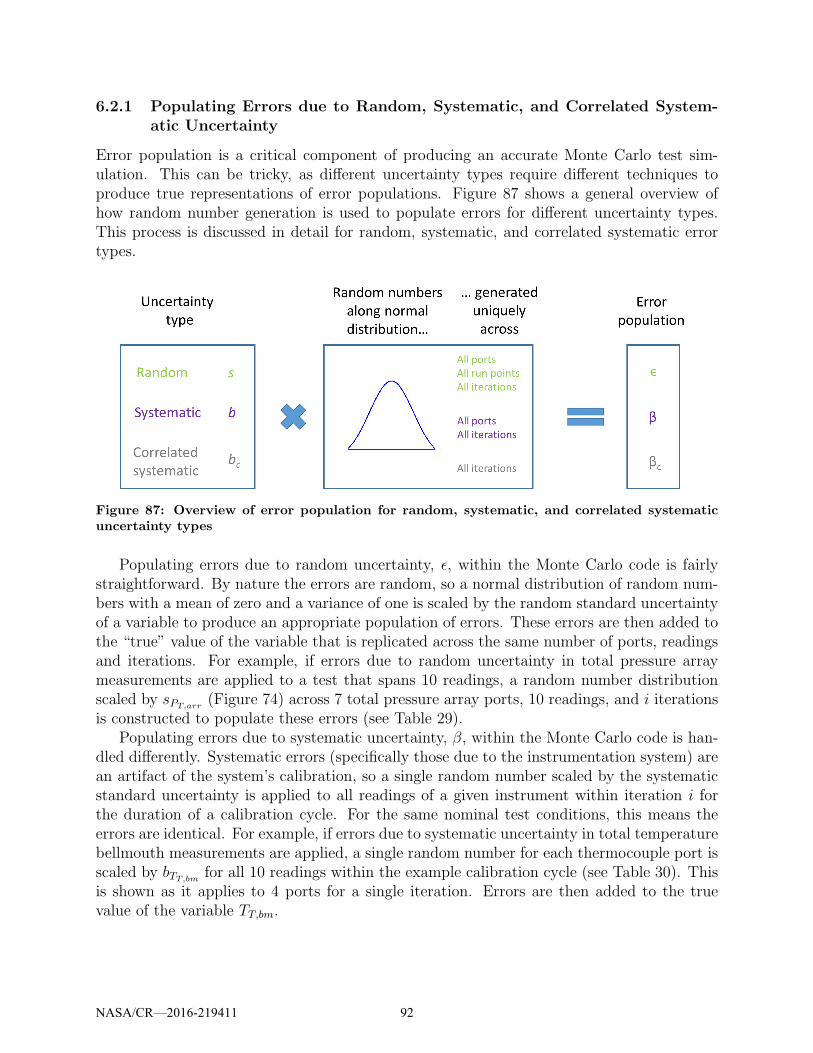
6.2.1 Populating Errors due to Random, Systematic, and Correlated System-atic Uncertainty
Error population is a critical component of producing an accurate Monte Carlo test sim-ulation. This can be tricky, as different uncertainty types require different techniques toproduce true representations of error populations. Figure 87 shows a general overview ofhow random number generation is used to populate errors for different uncertainty types.This process is discussed in detail for random, systematic, and correlated systematic errortypes.
Figure 87: Overview of error population for random, systematic, and correlated systematicuncertainty types
Populating errors due to random uncertainty, ǫ, within the Monte Carlo code is fairlystraightforward. By nature the errors are random, so a normal distribution of random num-bers with a mean of zero and a variance of one is scaled by the random standard uncertaintyof a variable to produce an appropriate population of errors. These errors are then added tothe “true” value of the variable that is replicated across the same number of ports, readingsand iterations. For example, if errors due to random uncertainty in total pressure arraymeasurements are applied to a test that spans 10 readings, a random number distributionscaled by sPT,arr
(Figure 74) across 7 total pressure array ports, 10 readings, and i iterationsis constructed to populate these errors (see Table 29).
Populating errors due to systematic uncertainty, β, within the Monte Carlo code is han-dled differently. Systematic errors (specifically those due to the instrumentation system) arean artifact of the system’s calibration, so a single random number scaled by the systematicstandard uncertainty is applied to all readings of a given instrument within iteration i forthe duration of a calibration cycle. For the same nominal test conditions, this means theerrors are identical. For example, if errors due to systematic uncertainty in total temperaturebellmouth measurements are applied, a single random number for each thermocouple port isscaled by bTT,bm
for all 10 readings within the example calibration cycle (see Table 30). Thisis shown as it applies to 4 ports for a single iteration. Errors are then added to the truevalue of the variable TT,bm.
NASA/CR—2016-219411 92
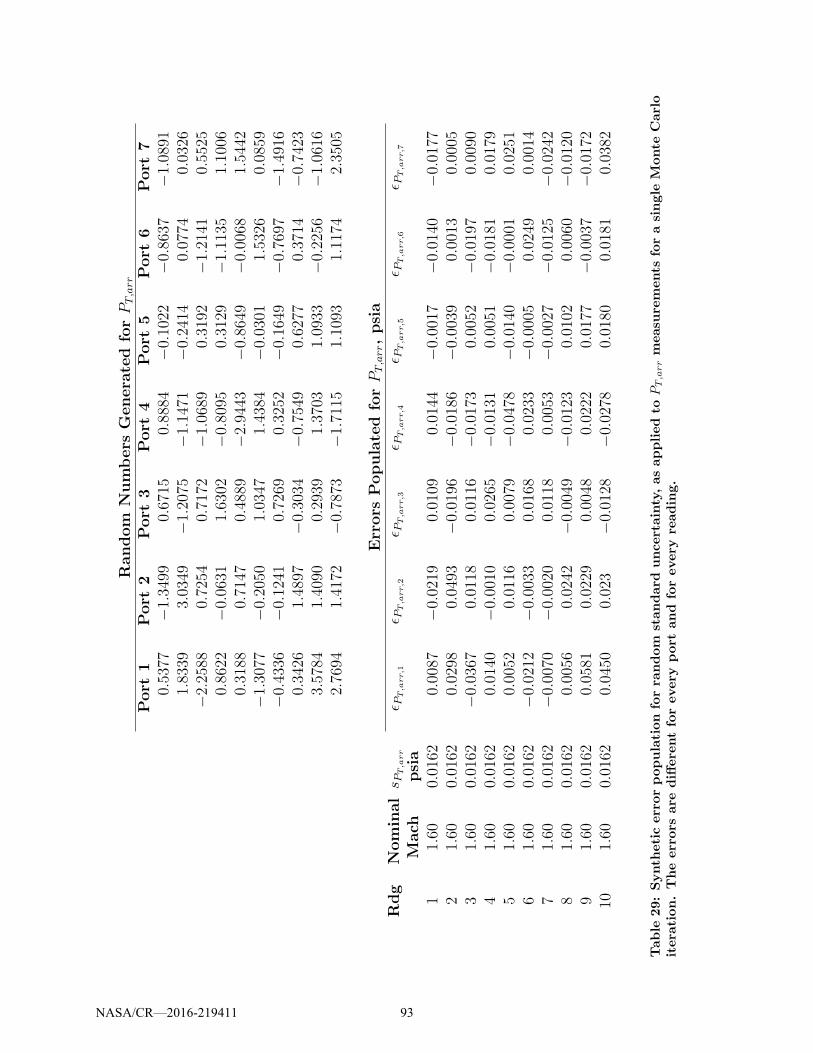
Random
Numbers
Genera
ted
forPT,arr
Port
1Port
2Port
3Port
4Port
5Port
6Port
70.5377
−1.3499
0.6715
0.8884
−0.1022
−0.8637
−1.0891
1.8339
3.0349
−1.2075
−1.1471
−0.2414
0.0774
0.0326
−2.2588
0.7254
0.7172
−1.0689
0.3192
−1.2141
0.5525
0.8622
−0.0631
1.6302
−0.8095
0.3129
−1.1135
1.1006
0.3188
0.7147
0.4889
−2.9443
−0.8649
−0.0068
1.5442
−1.3077
−0.2050
1.0347
1.4384
−0.0301
1.5326
0.0859
−0.4336
−0.1241
0.7269
0.3252
−0.1649
−0.7697
−1.4916
0.3426
1.4897
−0.3034
−0.7549
0.6277
0.3714
−0.7423
3.5784
1.4090
0.2939
1.3703
1.0933
−0.2256
−1.0616
2.7694
1.4172
−0.7873
−1.7115
1.1093
1.1174
2.3505
Errors
Populated
forPT,arr,psia
Rdg
Nominal
Mach
s PT,a
rr
psia
ǫ PT,a
rr,1
ǫ PT,a
rr,2
ǫ PT,a
rr,3
ǫ PT,a
rr,4
ǫ PT,a
rr,5
ǫ PT,a
rr,6
ǫ PT,a
rr,7
11.60
0.0162
0.0087
−0.0219
0.0109
0.0144
−0.0017
−0.0140
−0.0177
21.60
0.0162
0.0298
0.0493
−0.0196
−0.0186
−0.0039
0.0013
0.0005
31.60
0.0162
−0.0367
0.0118
0.0116
−0.0173
0.0052
−0.0197
0.0090
41.60
0.0162
0.0140
−0.0010
0.0265
−0.0131
0.0051
−0.0181
0.0179
51.60
0.0162
0.0052
0.0116
0.0079
−0.0478
−0.0140
−0.0001
0.0251
61.60
0.0162
−0.0212
−0.0033
0.0168
0.0233
−0.0005
0.0249
0.0014
71.60
0.0162
−0.0070
−0.0020
0.0118
0.0053
−0.0027
−0.0125
−0.0242
81.60
0.0162
0.0056
0.0242
−0.0049
−0.0123
0.0102
0.0060
−0.0120
91.60
0.0162
0.0581
0.0229
0.0048
0.0222
0.0177
−0.0037
−0.0172
101.60
0.0162
0.0450
0.023
−0.0128
−0.0278
0.0180
0.0181
0.0382
Table
29:Synth
eticerrorpopulationforra
ndom
standard
uncertainty,asappliedto
PT,arrmeasu
rements
forasingle
Monte
Carlo
itera
tion.Theerrors
are
differentforevery
port
and
forevery
reading.
NASA/CR—2016-219411 93
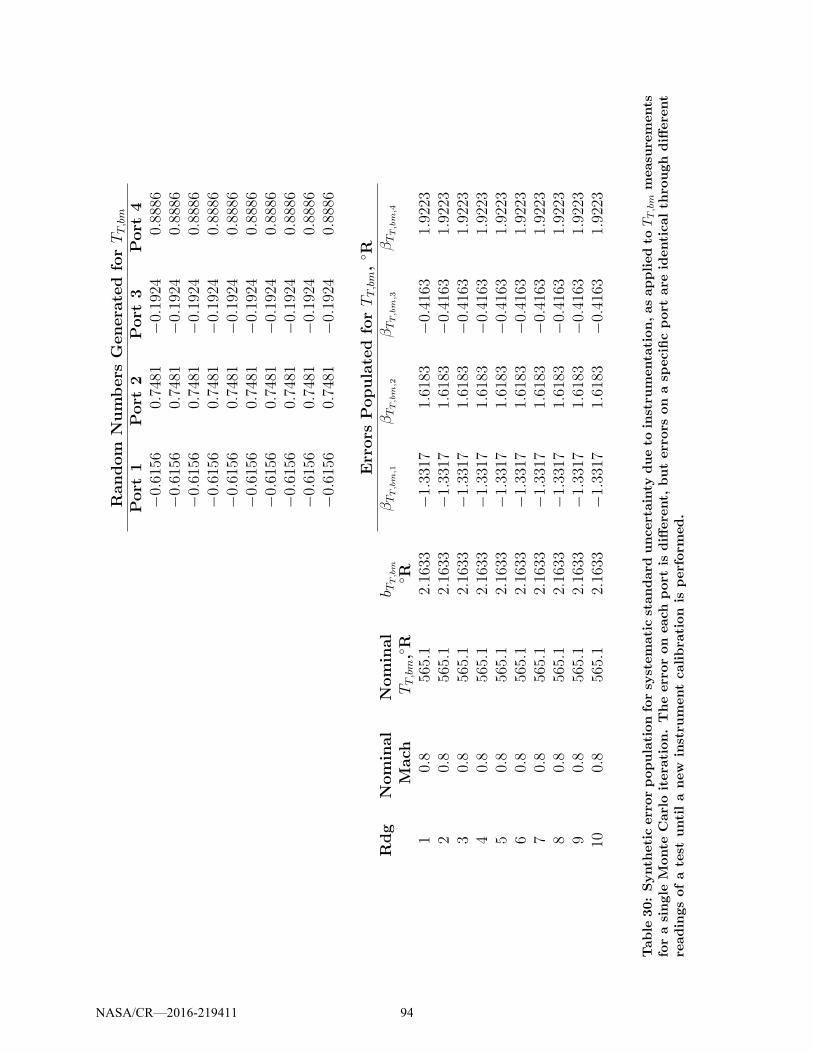
Random
Numbers
Genera
ted
forTT,bm
Port
1Port
2Port
3Port
4−0.6156
0.7481
−0.1924
0.8886
−0.6156
0.7481
−0.1924
0.8886
−0.6156
0.7481
−0.1924
0.8886
−0.6156
0.7481
−0.1924
0.8886
−0.6156
0.7481
−0.1924
0.8886
−0.6156
0.7481
−0.1924
0.8886
−0.6156
0.7481
−0.1924
0.8886
−0.6156
0.7481
−0.1924
0.8886
−0.6156
0.7481
−0.1924
0.8886
−0.6156
0.7481
−0.1924
0.8886
Errors
Populated
forTT,bm,
◦R
Rdg
Nominal
Mach
Nominal
TT,bm,◦R
b TT,bm
◦R
βTT,bm
,1βTT,bm
,2βTT,bm
,3βTT,bm
,4
10.8
565.1
2.1633
−1.3317
1.6183
−0.4163
1.9223
20.8
565.1
2.1633
−1.3317
1.6183
−0.4163
1.9223
30.8
565.1
2.1633
−1.3317
1.6183
−0.4163
1.9223
40.8
565.1
2.1633
−1.3317
1.6183
−0.4163
1.9223
50.8
565.1
2.1633
−1.3317
1.6183
−0.4163
1.9223
60.8
565.1
2.1633
−1.3317
1.6183
−0.4163
1.9223
70.8
565.1
2.1633
−1.3317
1.6183
−0.4163
1.9223
80.8
565.1
2.1633
−1.3317
1.6183
−0.4163
1.9223
90.8
565.1
2.1633
−1.3317
1.6183
−0.4163
1.9223
100.8
565.1
2.1633
−1.3317
1.6183
−0.4163
1.9223
Table
30:Synth
eticerrorpopulationforsy
stematicstandard
uncertainty
dueto
instru
menta
tion,asappliedto
TT,bm
measu
rements
forasingle
Monte
Carloitera
tion.Theerroroneach
port
isdifferent,
buterrors
onasp
ecificport
are
identicalth
roughdiffere
nt
readingsofatest
untilanew
instru
mentcalibra
tion
isperform
ed.
NASA/CR—2016-219411 94
Correlated systematic errors are populated in the simulation in a different manner. Forthis facility, all pressures that share the same Pressure Calibration Unit (PCU) are consideredto have correlated systematic errors. Therefore, for any given iteration of the simulation,a single random number scaled by the systematic standard uncertainty applies not only toall readings of a single port, but to all readings of all ports of all correlated measurementswithin a calibration cycle. For example, since all PT,bm ports are found to be correlated, anderrors due to correlated systematic uncertainty in total pressure bellmouth measurementsare applied, a single random number is scaled by bPcorr
as it applies to “true” values of PT,bm
for all 10 readings and across all 8 ports (see Table 31). Errors are populated in this mannerfor each of the i iterations. Furthermore, any pressure measurement obtained that sharesthe same PCU and is also considered correlated applies the same random number scaled bybPcorr
as it relates to that variable’s “true” value (see Table 32 for how the correlated erroralso applies to PS,bal). Once errors are populated, they are added to the true value of thevariable.
NASA/CR—2016-219411 95
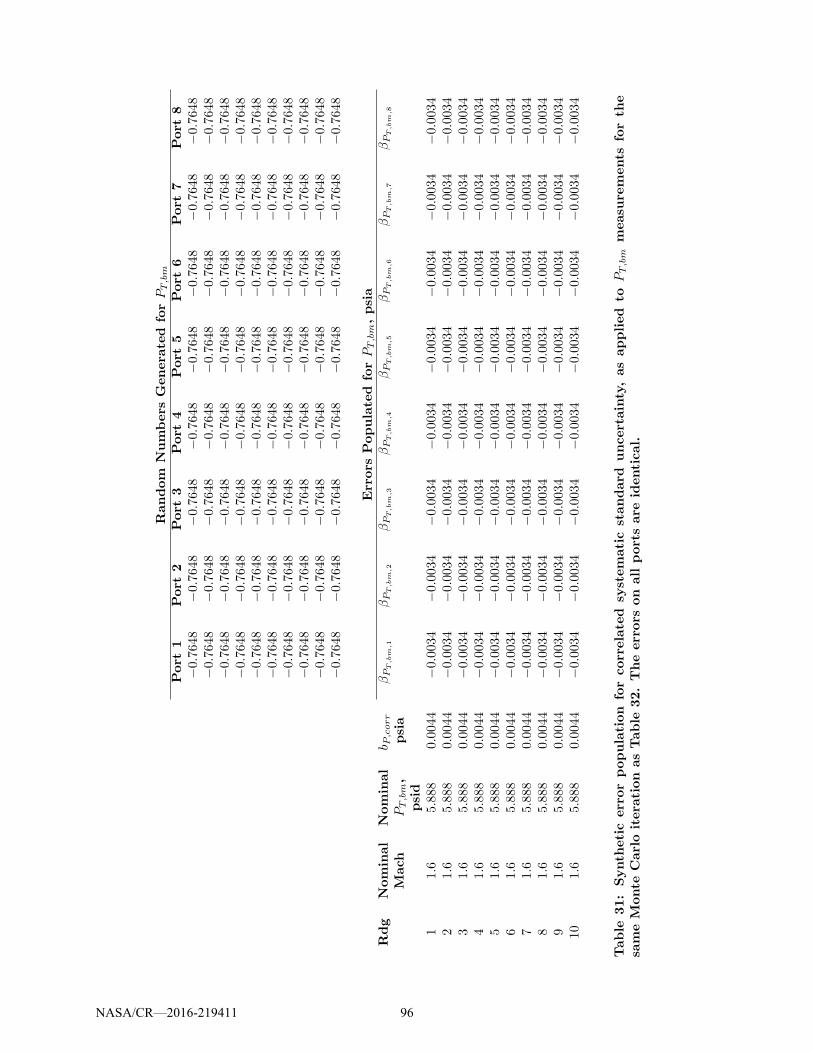
Random
Numbers
Genera
ted
forPT,bm
Port
1Port
2Port
3Port
4Port
5Port
6Port
7Port
8−0.76
48−0.76
48−0.76
48−0.76
48−0.76
48−0.76
48−0.76
48−0.7648
−0.76
48−0.76
48−0.76
48−0.76
48−0.76
48−0.76
48−0.76
48−0.7648
−0.76
48−0.76
48−0.76
48−0.76
48−0.76
48−0.76
48−0.76
48−0.7648
−0.76
48−0.76
48−0.76
48−0.76
48−0.76
48−0.76
48−0.76
48−0.7648
−0.76
48−0.76
48−0.76
48−0.76
48−0.76
48−0.76
48−0.76
48−0.7648
−0.76
48−0.76
48−0.76
48−0.76
48−0.76
48−0.76
48−0.76
48−0.7648
−0.76
48−0.76
48−0.76
48−0.76
48−0.76
48−0.76
48−0.76
48−0.7648
−0.76
48−0.76
48−0.76
48−0.76
48−0.76
48−0.76
48−0.76
48−0.7648
−0.76
48−0.76
48−0.76
48−0.76
48−0.76
48−0.76
48−0.76
48−0.7648
−0.76
48−0.76
48−0.76
48−0.76
48−0.76
48−0.76
48−0.76
48−0.7648
Errors
Populated
forPT,bm,psia
Rdg
Nominal
Mach
Nominal
PT,bm,
psid
b P,corr
psia
βP
T,bm
,1
βP
T,bm
,2
βP
T,bm
,3
βP
T,bm
,4
βP
T,bm
,5
βP
T,bm
,6
βP
T,bm
,7
βP
T,bm
,8
11.6
5.88
80.004
4−0.00
34−0.00
34−0.00
34−0.00
34−0.00
34−0.00
34−0.00
34−0.0034
21.6
5.888
0.00
44−0.00
34−0.00
34−0.00
34−0.00
34−0.00
34−0.00
34−0.00
34−0.0034
31.6
5.88
80.004
4−0.00
34−0.00
34−0.00
34−0.00
34−0.00
34−0.00
34−0.00
34−0.0034
41.6
5.888
0.00
44−0.00
34−0.00
34−0.00
34−0.00
34−0.00
34−0.00
34−0.00
34−0.0034
51.6
5.88
80.004
4−0.00
34−0.00
34−0.00
34−0.00
34−0.00
34−0.00
34−0.00
34−0.0034
61.6
5.888
0.00
44−0.00
34−0.00
34−0.00
34−0.00
34−0.00
34−0.00
34−0.00
34−0.0034
71.6
5.88
80.004
4−0.00
34−0.00
34−0.00
34−0.00
34−0.00
34−0.00
34−0.00
34−0.0034
81.6
5.888
0.00
44−0.00
34−0.00
34−0.00
34−0.00
34−0.00
34−0.00
34−0.00
34−0.0034
91.6
5.88
80.004
4−0.00
34−0.00
34−0.00
34−0.00
34−0.00
34−0.00
34−0.00
34−0.0034
101.6
5.88
80.00
44−0.00
34−0.00
34−0.00
34−0.00
34−0.00
34−0.00
34−0.00
34−0.0034
Table
31:
Synth
eticerrorpopulation
forcorrelated
systematicstandard
uncertainty,asapplied
toPT,bm
measu
rements
forth
esa
meM
onte
Carloitera
tion
asTable
32.Theerrors
on
all
portsare
identical.
NASA/CR—2016-219411 96

Random
Numbers
Genera
ted
forPS,bal
Port
1Port
2Port
3Port
4−0.7648
−0.7648
−0.7648
−0.7648
−0.7648
−0.7648
−0.7648
−0.7648
−0.7648
−0.7648
−0.7648
−0.7648
−0.7648
−0.7648
−0.7648
−0.7648
−0.7648
−0.7648
−0.7648
−0.7648
−0.7648
−0.7648
−0.7648
−0.7648
−0.7648
−0.7648
−0.7648
−0.7648
−0.7648
−0.7648
−0.7648
−0.7648
−0.7648
−0.7648
−0.7648
−0.7648
−0.7648
−0.7648
−0.7648
−0.7648
Errors
Populated
forPS,bal,psia
Rdg
Nominal
Mach
Nominal
PS,bal,psid
b P,corr
psia
βPS,bal,1
βPS,bal,2
βPS,bal,3
βPS,bal,4
11.6
-9.048
0.0045
−0.0035
−0.0035
−0.0035
−0.0035
21.6
-9.048
0.0045
−0.0035
−0.0035
−0.0035
−0.0035
31.6
-9.048
0.0045
−0.0035
−0.0035
−0.0035
−0.0035
41.6
-9.048
0.0045
−0.0035
−0.0035
−0.0035
−0.0035
51.6
-9.048
0.0045
−0.0035
−0.0035
−0.0035
−0.0035
61.6
-9.048
0.0045
−0.0035
−0.0035
−0.0035
−0.0035
71.6
-9.048
0.0045
−0.0035
−0.0035
−0.0035
−0.0035
81.6
-9.048
0.0045
−0.0035
−0.0035
−0.0035
−0.0035
91.6
-9.048
0.0045
−0.0035
−0.0035
−0.0035
−0.0035
101.6
-9.048
0.0045
−0.0035
−0.0035
−0.0035
−0.0035
Table
32:
Synth
eticerrorpopulation
forcorrelated
systematicstandard
uncertainty,asapplied
toPS,balmeasu
rements
forth
esa
meM
onte
Carloitera
tion
asTable
31.Theerrors
on
all
portsare
identical.
Itis
thesa
meerrorso
urceasin
Table
31,butis
aslightlydifferentmagnitudesinceth
enominalpressure
readingis
different.
NASA/CR—2016-219411 97
In this analysis, Gaussian distributions are used for all variables, including MANTUSproduced systematic uncertainties. While elemental inputs to MANTUS for any given in-strumentation system’s analysis vary and include different error distributions, the combinedoutput is an uncertainty assumed to have a near-Gaussian distribution based on the Cen-tral Limit Theorem, since there are multiple error sources (and a high number of degrees offreedom) contributing to the measurement system [3].
6.2.2 Comparing Simulation Results with Direct Calculations
Ideally, there would be a large sample of repeat test section data over representative timeperiods from which Mach variability (and variability of other variables of interest) could belocally calculated. Such data could provide end-to-end statistical process analysis figuresthat could be compared to the simulated random uncertainty results, and also could be usedto refine random uncertainty estimates. Processes to obtain this data have yet to be designedor implemented in this facility, so there is a limit to verification of the simulated results thatcan be performed at this time.
6.3 Analysis Limitations
Uncertainty results are only as good as the elemental uncertainty estimates that are propa-gated. The more pertinent data that is available for random, systematic, and spatial unifor-mity uncertainty estimates, the better the results of the analysis. This particular analysisis somewhat limited by its data set, which was designed to assess the mean behavior of thefacility rather than its dispersive behavior. Random uncertainty estimates are difficult tomake due to a lack of repeat data over the appropriate time scales, and correlations be-tween variables during normal operation have been observed but are difficult to account forwith the existing data set. Additional runs during a calibration entry or perhaps a speciallydesigned test would be required to refine the random uncertainty estimates.
NASA/CR—2016-219411 98
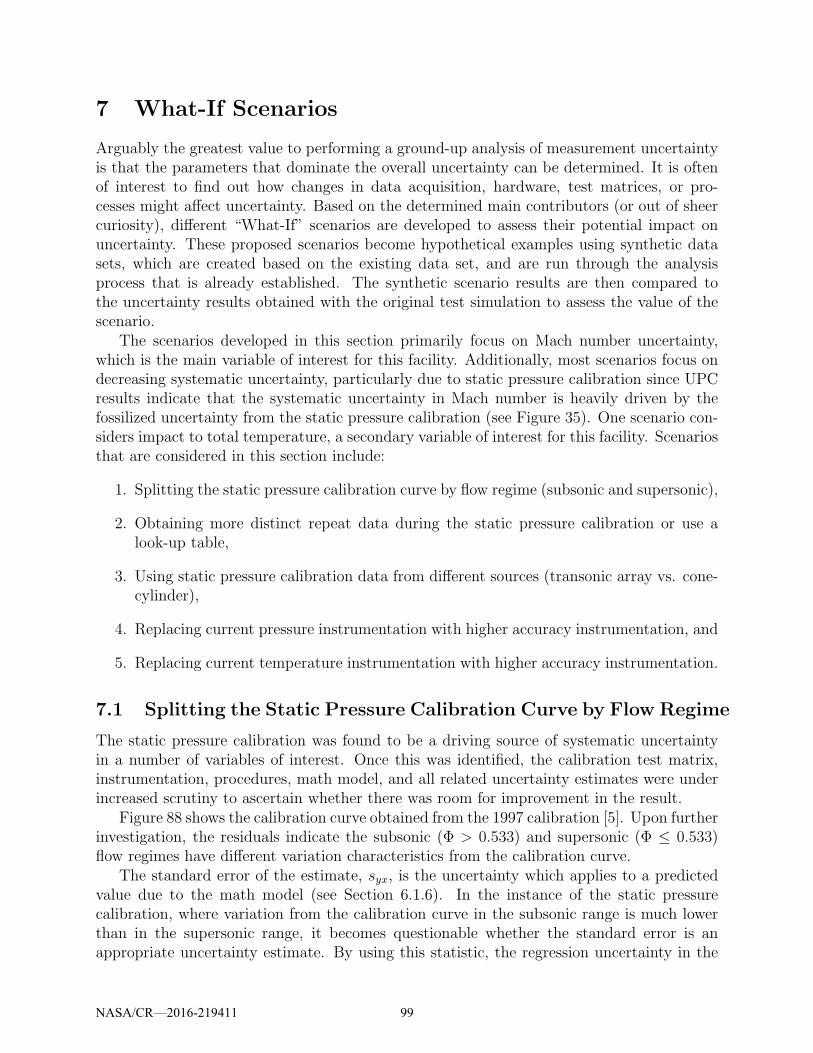
7 What-If Scenarios
Arguably the greatest value to performing a ground-up analysis of measurement uncertaintyis that the parameters that dominate the overall uncertainty can be determined. It is oftenof interest to find out how changes in data acquisition, hardware, test matrices, or pro-cesses might affect uncertainty. Based on the determined main contributors (or out of sheercuriosity), different “What-If” scenarios are developed to assess their potential impact onuncertainty. These proposed scenarios become hypothetical examples using synthetic datasets, which are created based on the existing data set, and are run through the analysisprocess that is already established. The synthetic scenario results are then compared tothe uncertainty results obtained with the original test simulation to assess the value of thescenario.
The scenarios developed in this section primarily focus on Mach number uncertainty,which is the main variable of interest for this facility. Additionally, most scenarios focus ondecreasing systematic uncertainty, particularly due to static pressure calibration since UPCresults indicate that the systematic uncertainty in Mach number is heavily driven by thefossilized uncertainty from the static pressure calibration (see Figure 35). One scenario con-siders impact to total temperature, a secondary variable of interest for this facility. Scenariosthat are considered in this section include:
1. Splitting the static pressure calibration curve by flow regime (subsonic and supersonic),
2. Obtaining more distinct repeat data during the static pressure calibration or use alook-up table,
3. Using static pressure calibration data from different sources (transonic array vs. cone-cylinder),
4. Replacing current pressure instrumentation with higher accuracy instrumentation, and
5. Replacing current temperature instrumentation with higher accuracy instrumentation.
7.1 Splitting the Static Pressure Calibration Curve by Flow Regime
The static pressure calibration was found to be a driving source of systematic uncertaintyin a number of variables of interest. Once this was identified, the calibration test matrix,instrumentation, procedures, math model, and all related uncertainty estimates were underincreased scrutiny to ascertain whether there was room for improvement in the result.
Figure 88 shows the calibration curve obtained from the 1997 calibration [5]. Upon furtherinvestigation, the residuals indicate the subsonic (Φ > 0.533) and supersonic (Φ ≤ 0.533)flow regimes have different variation characteristics from the calibration curve.
The standard error of the estimate, syx, is the uncertainty which applies to a predictedvalue due to the math model (see Section 6.1.6). In the instance of the static pressurecalibration, where variation from the calibration curve in the subsonic range is much lowerthan in the supersonic range, it becomes questionable whether the standard error is anappropriate uncertainty estimate. By using this statistic, the regression uncertainty in the
NASA/CR—2016-219411 99
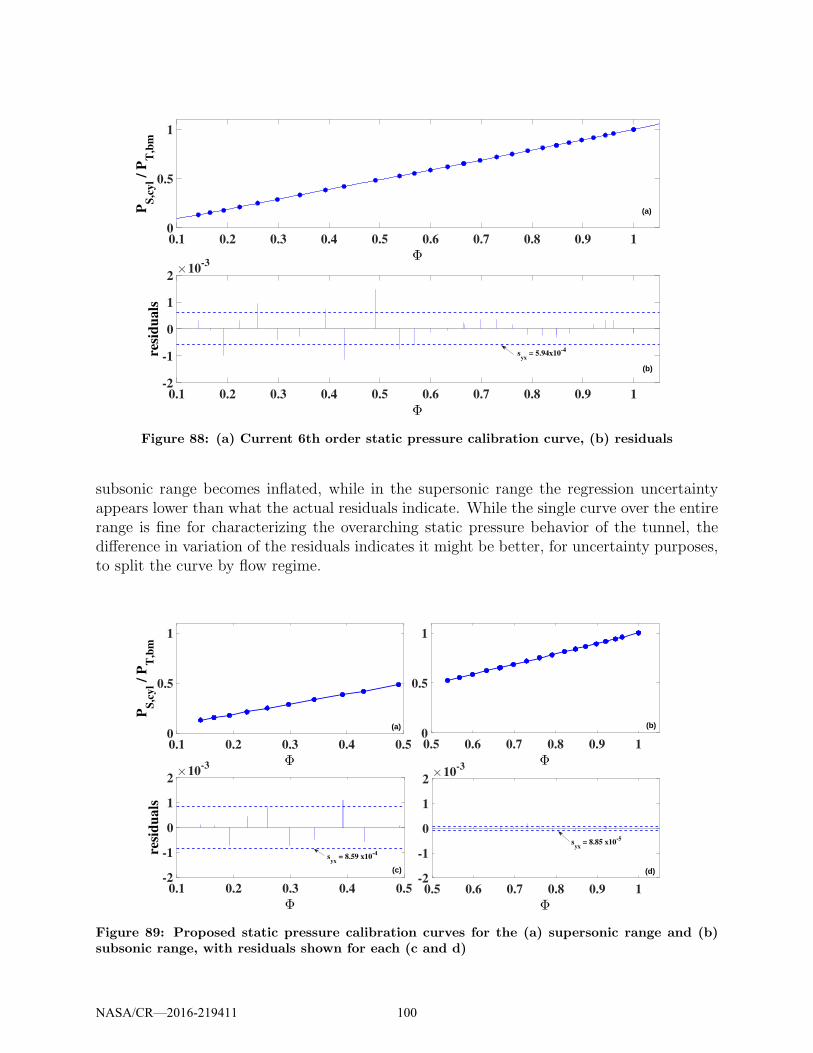
0.1 0.2 0.3 0.4 0.5 0.6 0.7 0.8 0.9 1
Φ
0
0.5
1P
S,c
yl /
PT
,bm
0.1 0.2 0.3 0.4 0.5 0.6 0.7 0.8 0.9 1
Φ
-2
-1
0
1
2
resi
du
als
×10-3
syx
= 5.94x10⁻⁴
(a)
(b)
Figure 88: (a) Current 6th order static pressure calibration curve, (b) residuals
subsonic range becomes inflated, while in the supersonic range the regression uncertaintyappears lower than what the actual residuals indicate. While the single curve over the entirerange is fine for characterizing the overarching static pressure behavior of the tunnel, thedifference in variation of the residuals indicates it might be better, for uncertainty purposes,to split the curve by flow regime.
0.1 0.2 0.3 0.4 0.5
Φ
0
0.5
1
PS
,cy
l / P
T,b
m
0.1 0.2 0.3 0.4 0.5
Φ
-2
-1
0
1
2
resi
du
als
×10-3
0.5 0.6 0.7 0.8 0.9 1
Φ
0
0.5
1
0.5 0.6 0.7 0.8 0.9 1
Φ
-2
-1
0
1
2×10
-3
syx
= 8.59 x10⁻⁴
syx
= 8.85 x10⁻⁵
(d)
(a) (b)
(c)
Figure 89: Proposed static pressure calibration curves for the (a) supersonic range and (b)subsonic range, with residuals shown for each (c and d)
NASA/CR—2016-219411 100
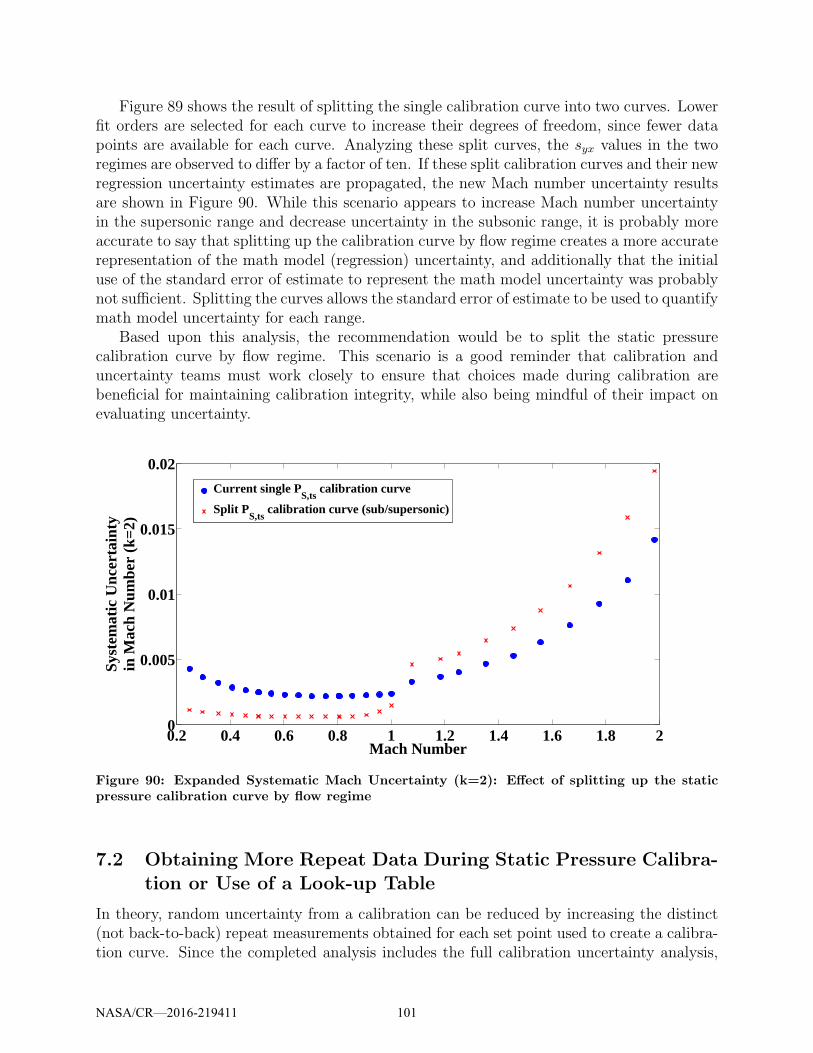
Figure 89 shows the result of splitting the single calibration curve into two curves. Lowerfit orders are selected for each curve to increase their degrees of freedom, since fewer datapoints are available for each curve. Analyzing these split curves, the syx values in the tworegimes are observed to differ by a factor of ten. If these split calibration curves and their newregression uncertainty estimates are propagated, the new Mach number uncertainty resultsare shown in Figure 90. While this scenario appears to increase Mach number uncertaintyin the supersonic range and decrease uncertainty in the subsonic range, it is probably moreaccurate to say that splitting up the calibration curve by flow regime creates a more accuraterepresentation of the math model (regression) uncertainty, and additionally that the initialuse of the standard error of estimate to represent the math model uncertainty was probablynot sufficient. Splitting the curves allows the standard error of estimate to be used to quantifymath model uncertainty for each range.
Based upon this analysis, the recommendation would be to split the static pressurecalibration curve by flow regime. This scenario is a good reminder that calibration anduncertainty teams must work closely to ensure that choices made during calibration arebeneficial for maintaining calibration integrity, while also being mindful of their impact onevaluating uncertainty.
0.2 0.4 0.6 0.8 1 1.2 1.4 1.6 1.8 20
0.005
0.01
0.015
0.02
Mach Number
Sys
tem
atic
Unc
erta
inty
in M
ach
Num
ber
(k=
2)
Current single PS,ts
calibration curve
Split PS,ts
calibration curve (sub/supersonic)
Figure 90: Expanded Systematic Mach Uncertainty (k=2): Effect of splitting up the staticpressure calibration curve by flow regime
7.2 Obtaining More Repeat Data During Static Pressure Calibra-tion or Use of a Look-up Table
In theory, random uncertainty from a calibration can be reduced by increasing the distinct(not back-to-back) repeat measurements obtained for each set point used to create a calibra-tion curve. Since the completed analysis includes the full calibration uncertainty analysis,
NASA/CR—2016-219411 101
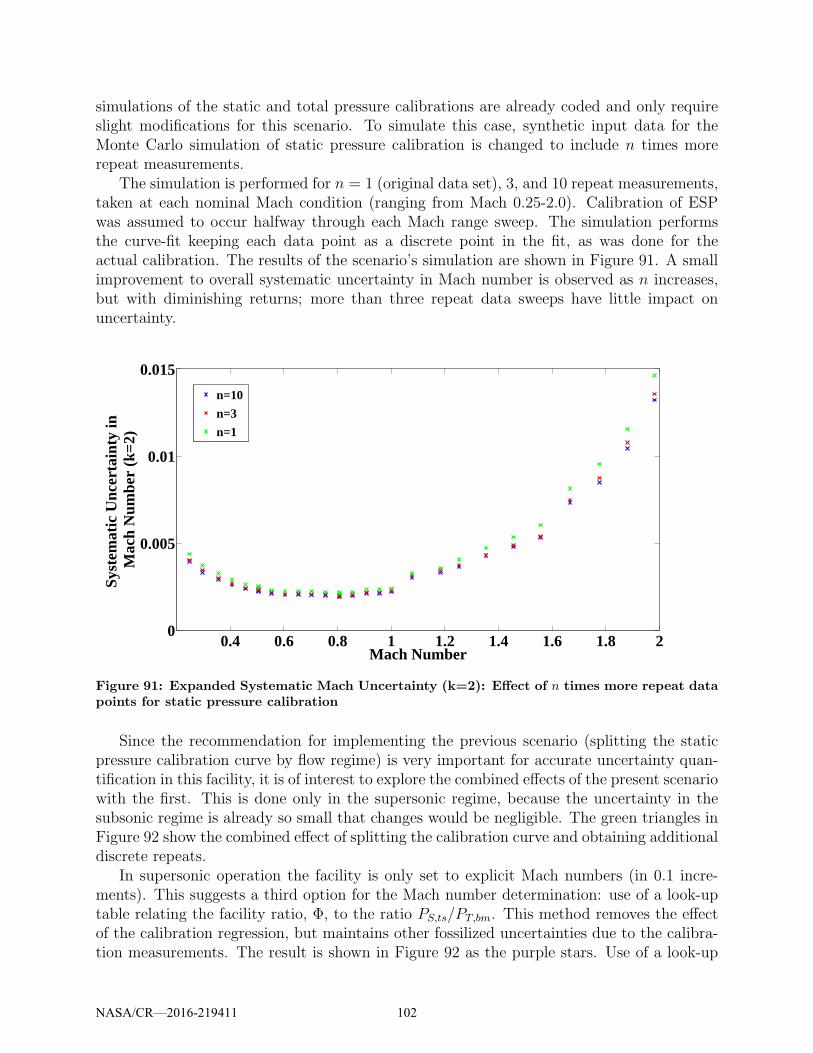
simulations of the static and total pressure calibrations are already coded and only requireslight modifications for this scenario. To simulate this case, synthetic input data for theMonte Carlo simulation of static pressure calibration is changed to include n times morerepeat measurements.
The simulation is performed for n = 1 (original data set), 3, and 10 repeat measurements,taken at each nominal Mach condition (ranging from Mach 0.25-2.0). Calibration of ESPwas assumed to occur halfway through each Mach range sweep. The simulation performsthe curve-fit keeping each data point as a discrete point in the fit, as was done for theactual calibration. The results of the scenario’s simulation are shown in Figure 91. A smallimprovement to overall systematic uncertainty in Mach number is observed as n increases,but with diminishing returns; more than three repeat data sweeps have little impact onuncertainty.
0.4 0.6 0.8 1 1.2 1.4 1.6 1.8 20
0.005
0.01
0.015
Mach Number
Sys
tem
atic
Unc
erta
inty
in
Mac
h N
umbe
r (k
=2)
n=10
n=3
n=1
Figure 91: Expanded Systematic Mach Uncertainty (k=2): Effect of n times more repeat datapoints for static pressure calibration
Since the recommendation for implementing the previous scenario (splitting the staticpressure calibration curve by flow regime) is very important for accurate uncertainty quan-tification in this facility, it is of interest to explore the combined effects of the present scenariowith the first. This is done only in the supersonic regime, because the uncertainty in thesubsonic regime is already so small that changes would be negligible. The green triangles inFigure 92 show the combined effect of splitting the calibration curve and obtaining additionaldiscrete repeats.
In supersonic operation the facility is only set to explicit Mach numbers (in 0.1 incre-ments). This suggests a third option for the Mach number determination: use of a look-uptable relating the facility ratio, Φ, to the ratio PS,ts/PT,bm. This method removes the effectof the calibration regression, but maintains other fossilized uncertainties due to the calibra-tion measurements. The result is shown in Figure 92 as the purple stars. Use of a look-up
NASA/CR—2016-219411 102
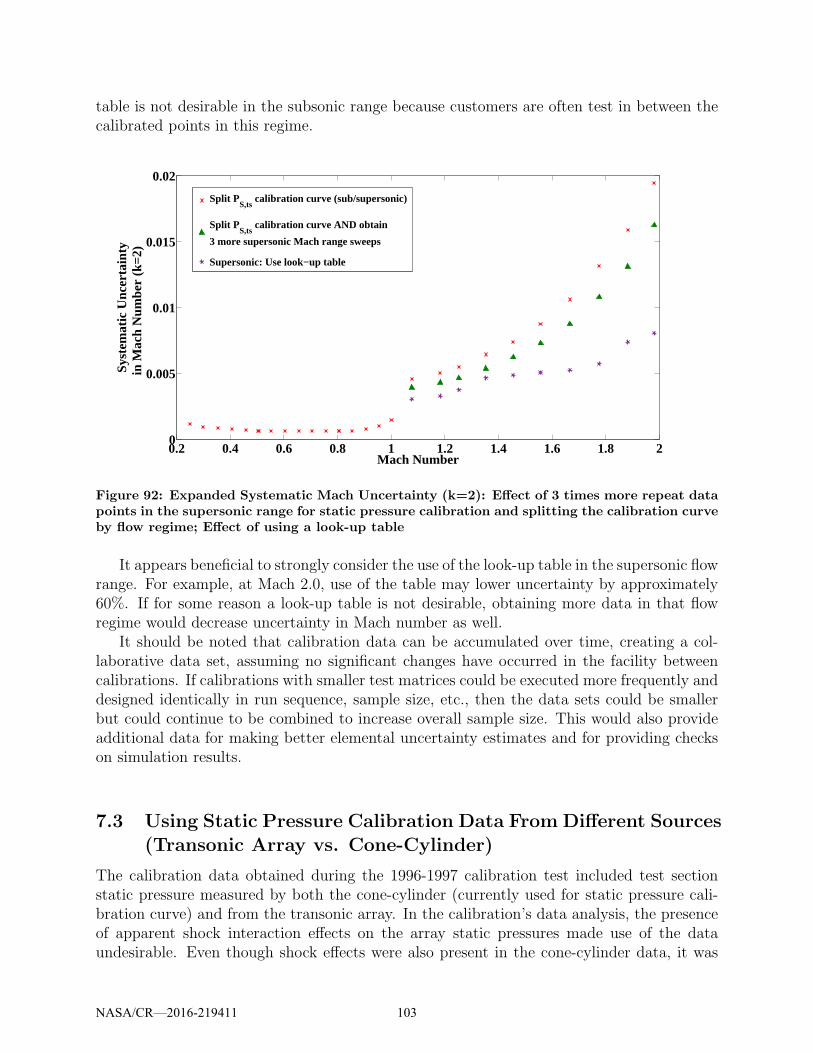
table is not desirable in the subsonic range because customers are often test in between thecalibrated points in this regime.
0.2 0.4 0.6 0.8 1 1.2 1.4 1.6 1.8 20
0.005
0.01
0.015
0.02
Mach Number
Sys
tem
atic
Unc
erta
inty
in M
ach
Num
ber
(k=
2)
Split PS,ts
calibration curve (sub/supersonic)
Split PS,ts
calibration curve AND obtain
3 more supersonic Mach range sweeps
Supersonic: Use look−up table
Figure 92: Expanded Systematic Mach Uncertainty (k=2): Effect of 3 times more repeat datapoints in the supersonic range for static pressure calibration and splitting the calibration curveby flow regime; Effect of using a look-up table
It appears beneficial to strongly consider the use of the look-up table in the supersonic flowrange. For example, at Mach 2.0, use of the table may lower uncertainty by approximately60%. If for some reason a look-up table is not desirable, obtaining more data in that flowregime would decrease uncertainty in Mach number as well.
It should be noted that calibration data can be accumulated over time, creating a col-laborative data set, assuming no significant changes have occurred in the facility betweencalibrations. If calibrations with smaller test matrices could be executed more frequently anddesigned identically in run sequence, sample size, etc., then the data sets could be smallerbut could continue to be combined to increase overall sample size. This would also provideadditional data for making better elemental uncertainty estimates and for providing checkson simulation results.
7.3 Using Static Pressure Calibration Data From Different Sources(Transonic Array vs. Cone-Cylinder)
The calibration data obtained during the 1996-1997 calibration test included test sectionstatic pressure measured by both the cone-cylinder (currently used for static pressure cali-bration curve) and from the transonic array. In the calibration’s data analysis, the presenceof apparent shock interaction effects on the array static pressures made use of the dataundesirable. Even though shock effects were also present in the cone-cylinder data, it was
NASA/CR—2016-219411 103
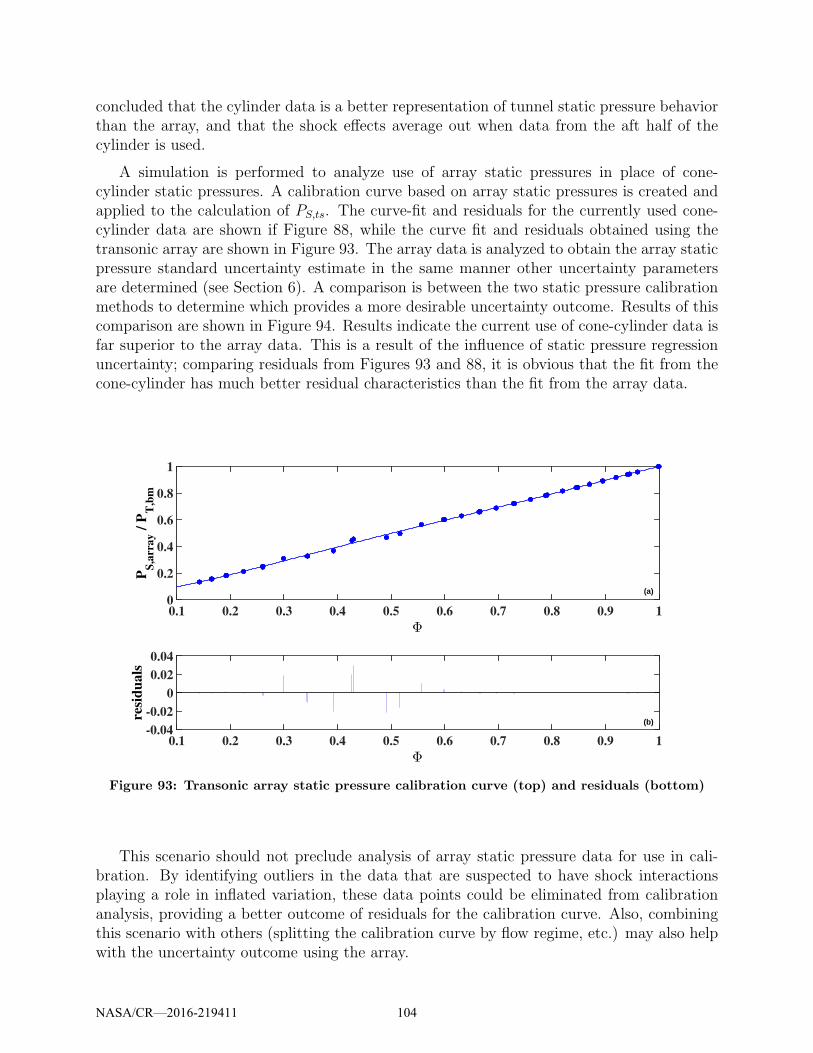
concluded that the cylinder data is a better representation of tunnel static pressure behaviorthan the array, and that the shock effects average out when data from the aft half of thecylinder is used.
A simulation is performed to analyze use of array static pressures in place of cone-cylinder static pressures. A calibration curve based on array static pressures is created andapplied to the calculation of PS,ts. The curve-fit and residuals for the currently used cone-cylinder data are shown if Figure 88, while the curve fit and residuals obtained using thetransonic array are shown in Figure 93. The array data is analyzed to obtain the array staticpressure standard uncertainty estimate in the same manner other uncertainty parametersare determined (see Section 6). A comparison is between the two static pressure calibrationmethods to determine which provides a more desirable uncertainty outcome. Results of thiscomparison are shown in Figure 94. Results indicate the current use of cone-cylinder data isfar superior to the array data. This is a result of the influence of static pressure regressionuncertainty; comparing residuals from Figures 93 and 88, it is obvious that the fit from thecone-cylinder has much better residual characteristics than the fit from the array data.
0.1 0.2 0.3 0.4 0.5 0.6 0.7 0.8 0.9 1
Φ
-0.04
-0.02
0
0.02
0.04
resi
du
als
0.1 0.2 0.3 0.4 0.5 0.6 0.7 0.8 0.9 1
Φ
0
0.2
0.4
0.6
0.8
1
PS
,arr
ay /
PT
,bm
(a)
(b)
Figure 93: Transonic array static pressure calibration curve (top) and residuals (bottom)
This scenario should not preclude analysis of array static pressure data for use in cali-bration. By identifying outliers in the data that are suspected to have shock interactionsplaying a role in inflated variation, these data points could be eliminated from calibrationanalysis, providing a better outcome of residuals for the calibration curve. Also, combiningthis scenario with others (splitting the calibration curve by flow regime, etc.) may also helpwith the uncertainty outcome using the array.
NASA/CR—2016-219411 104
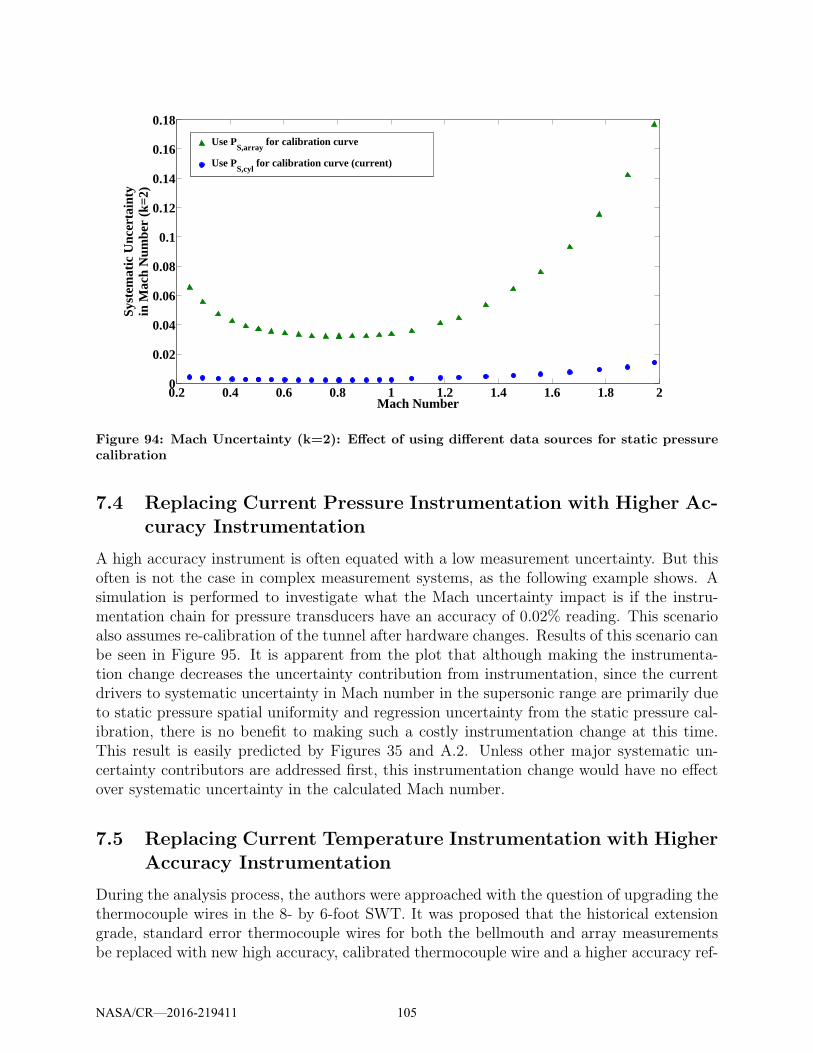
0.2 0.4 0.6 0.8 1 1.2 1.4 1.6 1.8 20
0.02
0.04
0.06
0.08
0.1
0.12
0.14
0.16
0.18
Mach Number
Sys
tem
atic
Unc
erta
inty
in M
ach
Num
ber
(k=
2)
Use PS,array
for calibration curve
Use PS,cyl
for calibration curve (current)
Figure 94: Mach Uncertainty (k=2): Effect of using different data sources for static pressurecalibration
7.4 Replacing Current Pressure Instrumentation with Higher Ac-curacy Instrumentation
A high accuracy instrument is often equated with a low measurement uncertainty. But thisoften is not the case in complex measurement systems, as the following example shows. Asimulation is performed to investigate what the Mach uncertainty impact is if the instru-mentation chain for pressure transducers have an accuracy of 0.02% reading. This scenarioalso assumes re-calibration of the tunnel after hardware changes. Results of this scenario canbe seen in Figure 95. It is apparent from the plot that although making the instrumenta-tion change decreases the uncertainty contribution from instrumentation, since the currentdrivers to systematic uncertainty in Mach number in the supersonic range are primarily dueto static pressure spatial uniformity and regression uncertainty from the static pressure cal-ibration, there is no benefit to making such a costly instrumentation change at this time.This result is easily predicted by Figures 35 and A.2. Unless other major systematic un-certainty contributors are addressed first, this instrumentation change would have no effectover systematic uncertainty in the calculated Mach number.
7.5 Replacing Current Temperature Instrumentation with HigherAccuracy Instrumentation
During the analysis process, the authors were approached with the question of upgrading thethermocouple wires in the 8- by 6-foot SWT. It was proposed that the historical extensiongrade, standard error thermocouple wires for both the bellmouth and array measurementsbe replaced with new high accuracy, calibrated thermocouple wire and a higher accuracy ref-
NASA/CR—2016-219411 105
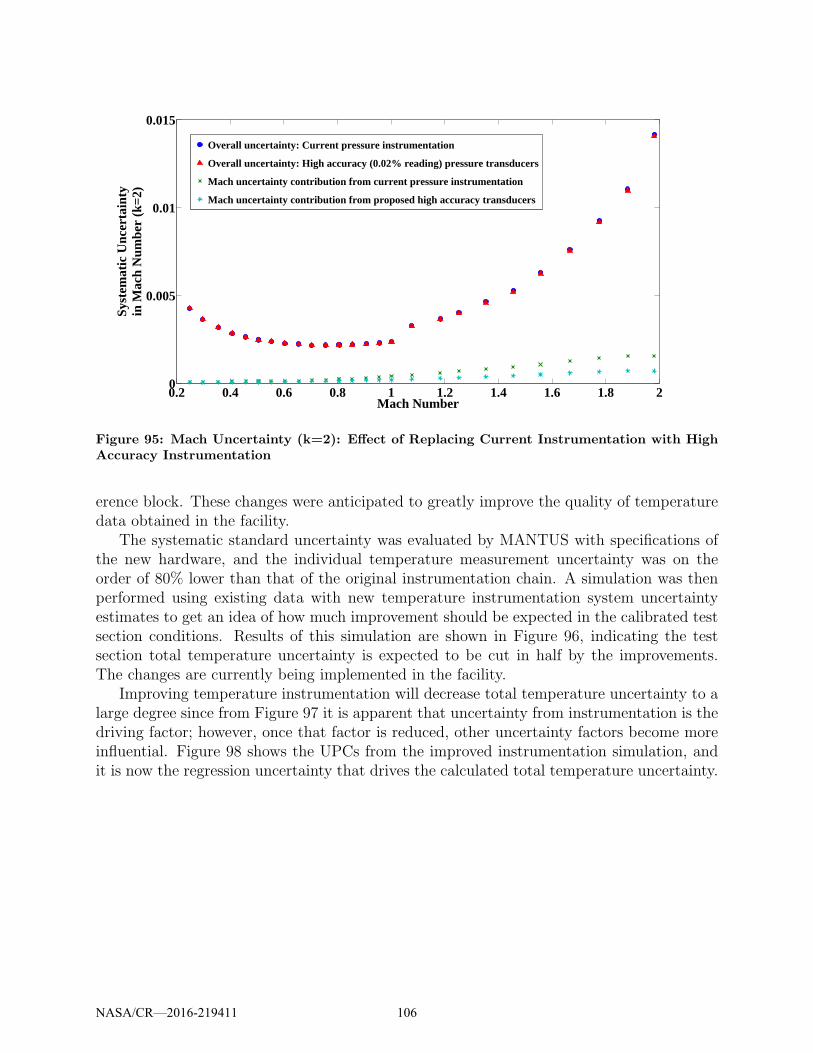
0.2 0.4 0.6 0.8 1 1.2 1.4 1.6 1.8 20
0.005
0.01
0.015
Mach Number
Sys
tem
atic
Unc
erta
inty
in M
ach
Num
ber
(k=
2)
Overall uncertainty: Current pressure instrumentation
Overall uncertainty: High accuracy (0.02% reading) pressure transducers
Mach uncertainty contribution from current pressure instrumentation
Mach uncertainty contribution from proposed high accuracy transducers
Figure 95: Mach Uncertainty (k=2): Effect of Replacing Current Instrumentation with HighAccuracy Instrumentation
erence block. These changes were anticipated to greatly improve the quality of temperaturedata obtained in the facility.
The systematic standard uncertainty was evaluated by MANTUS with specifications ofthe new hardware, and the individual temperature measurement uncertainty was on theorder of 80% lower than that of the original instrumentation chain. A simulation was thenperformed using existing data with new temperature instrumentation system uncertaintyestimates to get an idea of how much improvement should be expected in the calibrated testsection conditions. Results of this simulation are shown in Figure 96, indicating the testsection total temperature uncertainty is expected to be cut in half by the improvements.The changes are currently being implemented in the facility.
Improving temperature instrumentation will decrease total temperature uncertainty to alarge degree since from Figure 97 it is apparent that uncertainty from instrumentation is thedriving factor; however, once that factor is reduced, other uncertainty factors become moreinfluential. Figure 98 shows the UPCs from the improved instrumentation simulation, andit is now the regression uncertainty that drives the calculated total temperature uncertainty.
NASA/CR—2016-219411 106
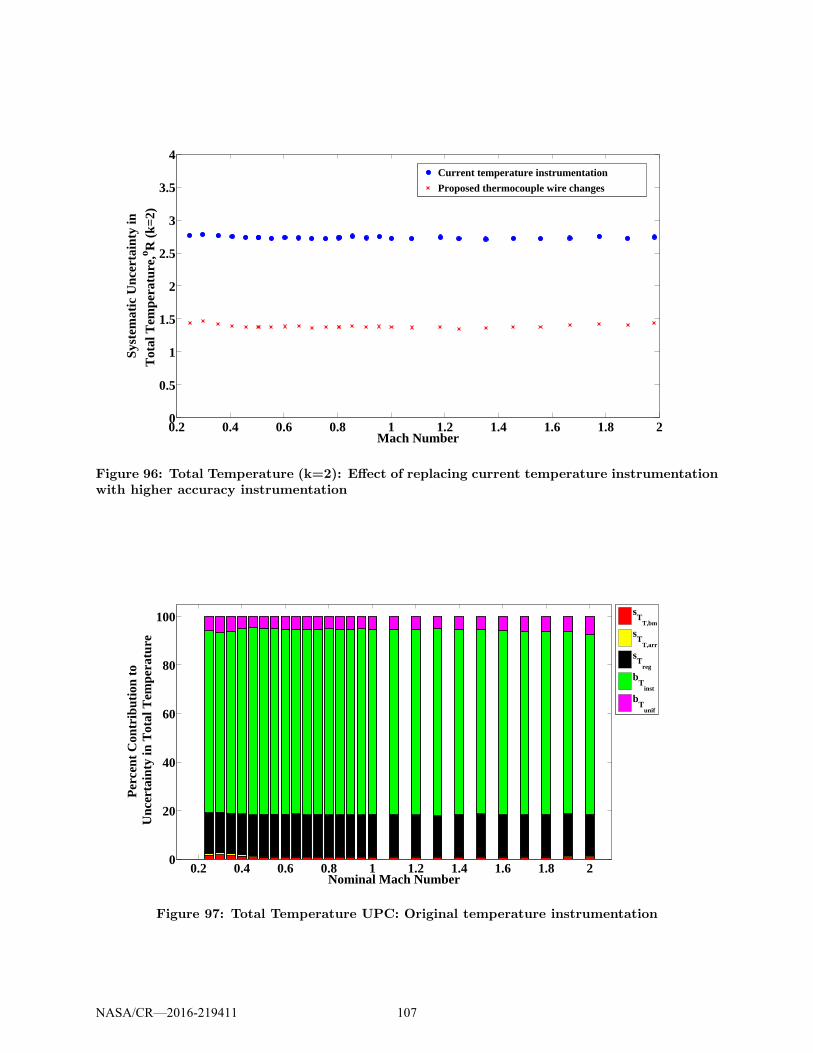
0.2 0.4 0.6 0.8 1 1.2 1.4 1.6 1.8 20
0.5
1
1.5
2
2.5
3
3.5
4
Mach Number
Sys
tem
atic
Unc
erta
inty
inT
otal
Tem
pera
ture
, o R (
k=2)
Current temperature instrumentation
Proposed thermocouple wire changes
Figure 96: Total Temperature (k=2): Effect of replacing current temperature instrumentationwith higher accuracy instrumentation
0.2 0.4 0.6 0.8 1 1.2 1.4 1.6 1.8 20
20
40
60
80
100
Nominal Mach Number
Per
cent
Con
trib
utio
n to
Unc
erta
inty
in T
otal
Tem
pera
ture
sT
T,bm
sT
T,arr
sT
reg
bT
inst
bT
unif
Figure 97: Total Temperature UPC: Original temperature instrumentation
NASA/CR—2016-219411 107
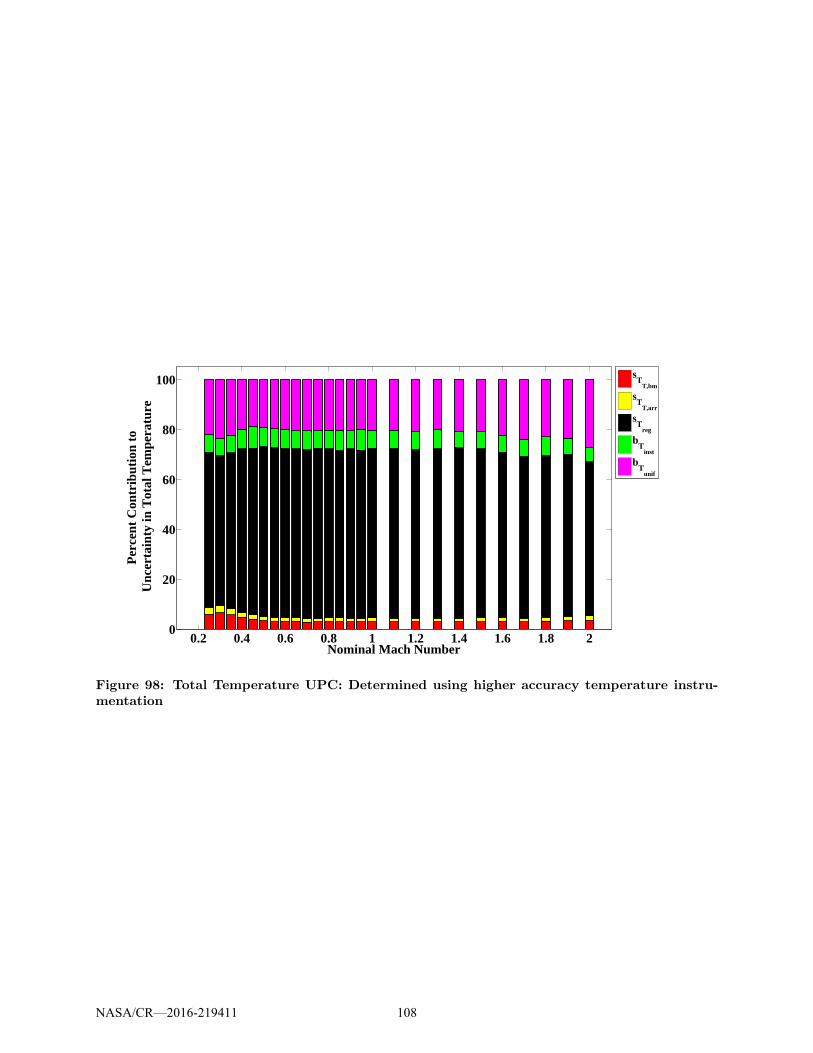
0.2 0.4 0.6 0.8 1 1.2 1.4 1.6 1.8 20
20
40
60
80
100
Nominal Mach Number
Per
cent
Con
trib
utio
n to
Unc
erta
inty
in T
otal
Tem
pera
ture
sT
T,bm
sT
T,arr
sT
reg
bT
inst
bT
unif
Figure 98: Total Temperature UPC: Determined using higher accuracy temperature instru-mentation
NASA/CR—2016-219411 108
8 Conclusions
An uncertainty analysis was performed on the 8- by 6-foot Supersonic Wind Tunnel atNASA Glenn Research Center. The complexity of the data reduction process made a faithfulreplication of it impractical using traditional Taylor series error propagation techniques. Asa result, the Monte Carlo method of propagating uncertainty was selected. The generalprocess for each of these method was described in this document.
Throughout this document, uncertainties were classified as random (variability about themean value) and systematic (offset of average measured value from the true value) to aidusers in determining which uncertainties are of interest for specific tests. Uncertainty sourceswere determined and elemental uncertainty estimates were made for all considered sources.Instrumentation uncertainties were estimated using MANTUS [12], an Excel R© based tooltailored for modularized instrument systems to determine the combined uncertainty of aninstrument. Random uncertainties and spatial uniformity uncertainty were estimated usingdata from the most recent tunnel calibration [5]. All uncertainties considered in the analysiswere propagated from the point of measurement through the instrumentation, data system,tunnel calibrations and finally data reduction to arrive at uncertainties for several variablesof interest. Results were analyzed and broken down at every step so that a comprehensiveunderstanding of driving uncertainty sources could be determined.
Correlation effects and a small repeat data set were two challenges faced in this analysis.Measurements were correlated due to the instrumentation and/or operation of the facility.For example, the facility set point was based on the ratio of PS,bal to PT,bm. As a result,there was a seemingly wide variation in each of these parameters, while the ratio stayedfairly constant at any given set point. This translated to an unrealistically large randomuncertainty estimate when the correlation was not properly accounted for. The statisticalanalyses, engineering judgments made to account for correlations, and other challenges facedwere detailed in this document.
A summary of typical uncertainties for subsonic and supersonic regimes for all variablesis shown for random uncertainties in Table 33, and for systematic uncertainties in Table 34.The primary contributor to the uncertainty is also shown, although it should be noted thatdriving contributors sometimes varied through the specified range.
Scenarios were developed and simulated to deduce their potential impact on uncertainty.Table 35 summarizes the notable results of the scenarios explored. These scenarios andconclusions enable facility personnel to make educated improvements such as those presentedin Table 36 as they consider facility upgrades and plan future calibration tests.
NASA/CR—2016-219411 109

Subsonic, Supersonic, Primaryk = 2 k = 2 Contributor
Mach Number 0.0001-0.0004 0.001-0.004 sPS,bal
Static Pressure, psia 0.0004-0.004 0.01-0.03 sPS,bal
Total Pressure, psia 0.0003-0.0007 0.001-0.03 sPT,bm
Dynamic Pressure, psia 0.001-0.003 0.002-0.02 sPS,bal
Static Temperature, ◦R 0.1-0.5 0.2-0.7 sTT,bm| sPS,bal
Total Temperature, ◦R 0.1-0.5 0.1-0.3 sTT,bm
Reynolds Number, x 106 ft−1 0.001-0.003 0.002-0.009 sTT,bm| sPS,bal
Free Stream Air Speed, ft/s 0.1-0.4 0.5-2.5 sPS,bal
Table 33: Summary of random uncertainties of average free stream conditions with 95% levelof confidence for commonly used tunnel configurations.
Subsonic, Supersonic, Primaryk = 2 k = 2 Contributor
Mach Number 0.002-0.004 0.002-0.014 bPSCAL
Static Pressure, psia 0.025 0.025-0.04 bPSCAL
Total Pressure, psia 0.009 0.04-0.3 bPinst| bPTCAL
Dynamic Pressure, psia 0.01-0.02 0.02-0.05 bPSCAL | bPTCAL
Static Temperature, ◦R 2.3-2.8 2.1-2.8 bTTCAL
Total Temperature, ◦R 2.8 2.8 bTTCAL
Reynolds Number, x 106 ft−1 0.02-0.03 0.03-0.05 bTTCAL
Free Stream Air Speed, ft/s 2.9-4.8 3.3-8.4 bPSCAL
Table 34: Summary of systematic uncertainties of average free stream conditions with 95%level of confidence for commonly used tunnel configurations.
NASA/CR—2016-219411 110
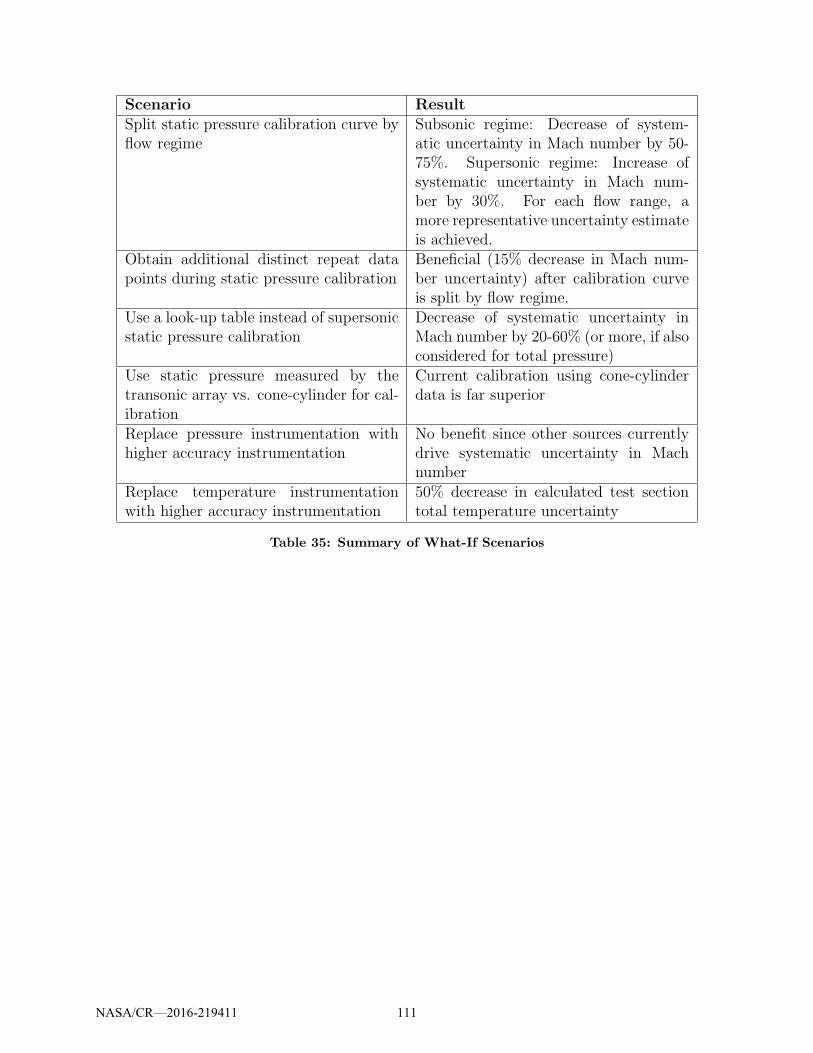
Scenario ResultSplit static pressure calibration curve byflow regime
Subsonic regime: Decrease of system-atic uncertainty in Mach number by 50-75%. Supersonic regime: Increase ofsystematic uncertainty in Mach num-ber by 30%. For each flow range, amore representative uncertainty estimateis achieved.
Obtain additional distinct repeat datapoints during static pressure calibration
Beneficial (15% decrease in Mach num-ber uncertainty) after calibration curveis split by flow regime.
Use a look-up table instead of supersonicstatic pressure calibration
Decrease of systematic uncertainty inMach number by 20-60% (or more, if alsoconsidered for total pressure)
Use static pressure measured by thetransonic array vs. cone-cylinder for cal-ibration
Current calibration using cone-cylinderdata is far superior
Replace pressure instrumentation withhigher accuracy instrumentation
No benefit since other sources currentlydrive systematic uncertainty in Machnumber
Replace temperature instrumentationwith higher accuracy instrumentation
50% decrease in calculated test sectiontotal temperature uncertainty
Table 35: Summary of What-If Scenarios
NASA/CR—2016-219411 111
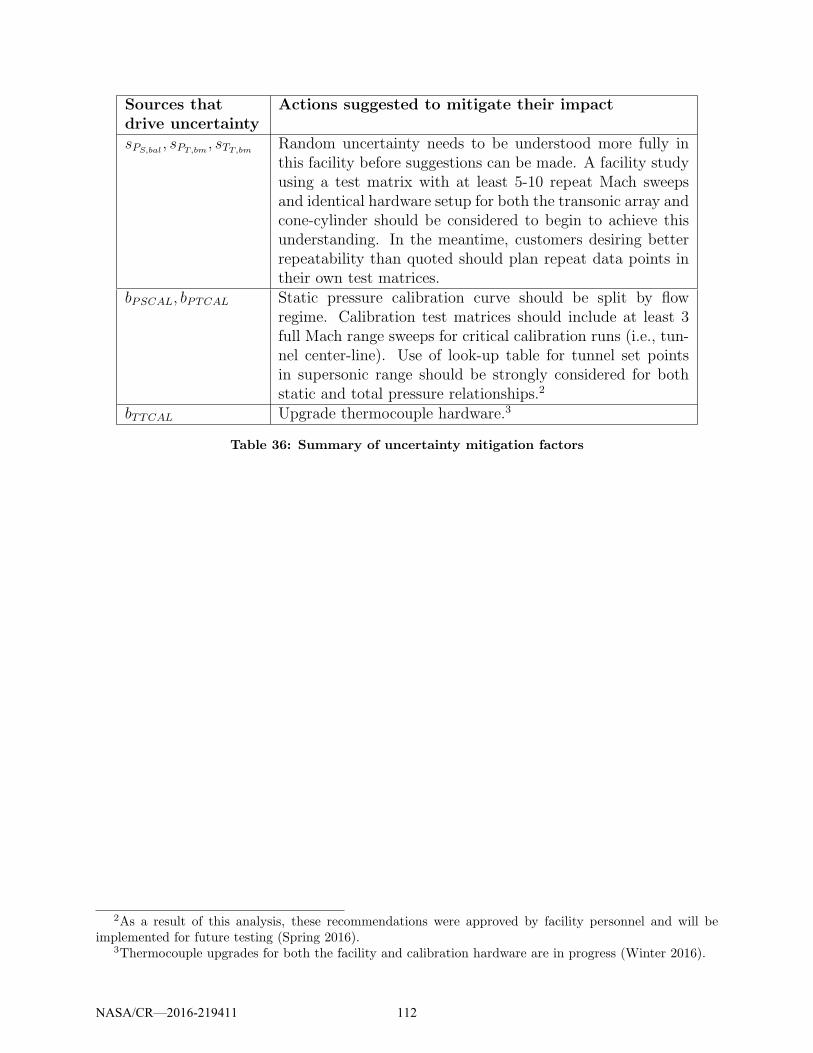
Sources thatdrive uncertainty
Actions suggested to mitigate their impact
sPS,bal, sPT,bm
, sTT,bmRandom uncertainty needs to be understood more fully inthis facility before suggestions can be made. A facility studyusing a test matrix with at least 5-10 repeat Mach sweepsand identical hardware setup for both the transonic array andcone-cylinder should be considered to begin to achieve thisunderstanding. In the meantime, customers desiring betterrepeatability than quoted should plan repeat data points intheir own test matrices.
bPSCAL, bPTCAL Static pressure calibration curve should be split by flowregime. Calibration test matrices should include at least 3full Mach range sweeps for critical calibration runs (i.e., tun-nel center-line). Use of look-up table for tunnel set pointsin supersonic range should be strongly considered for bothstatic and total pressure relationships.2
bTTCAL Upgrade thermocouple hardware.3
Table 36: Summary of uncertainty mitigation factors
2As a result of this analysis, these recommendations were approved by facility personnel and will beimplemented for future testing (Spring 2016).
3Thermocouple upgrades for both the facility and calibration hardware are in progress (Winter 2016).
NASA/CR—2016-219411 112
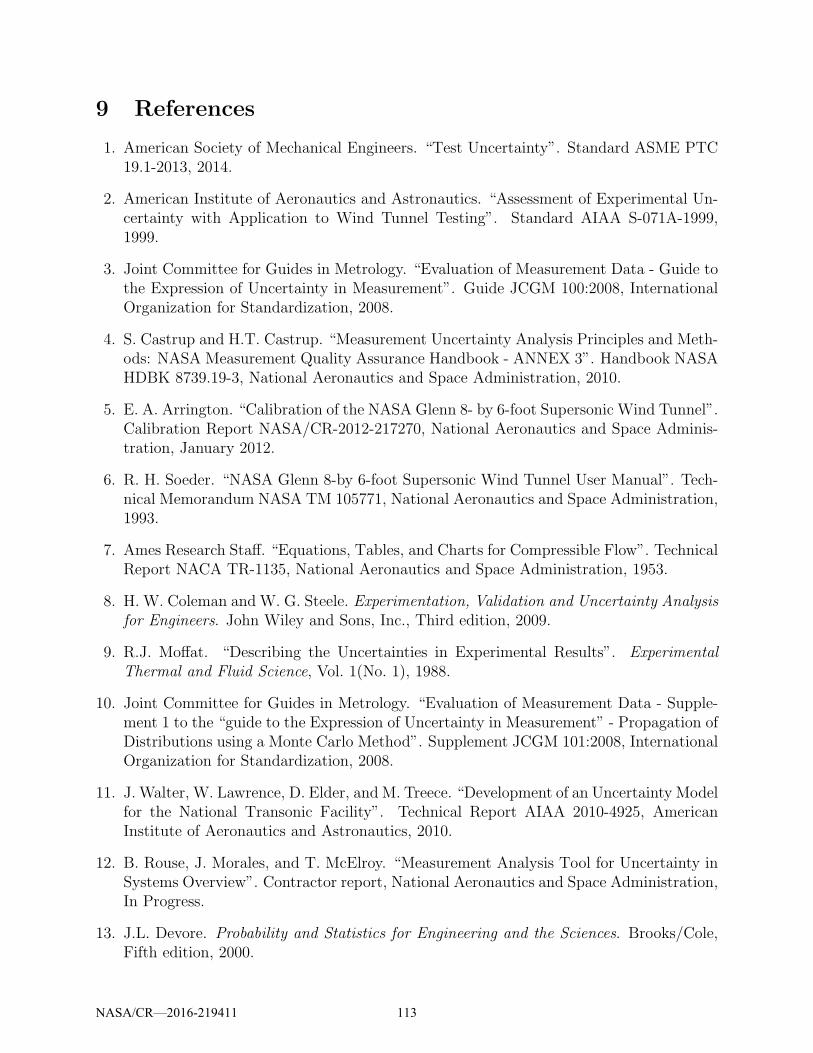
9 References
1. American Society of Mechanical Engineers. “Test Uncertainty”. Standard ASME PTC19.1-2013, 2014.
2. American Institute of Aeronautics and Astronautics. “Assessment of Experimental Un-certainty with Application to Wind Tunnel Testing”. Standard AIAA S-071A-1999,1999.
3. Joint Committee for Guides in Metrology. “Evaluation of Measurement Data - Guide tothe Expression of Uncertainty in Measurement”. Guide JCGM 100:2008, InternationalOrganization for Standardization, 2008.
4. S. Castrup and H.T. Castrup. “Measurement Uncertainty Analysis Principles and Meth-ods: NASA Measurement Quality Assurance Handbook - ANNEX 3”. Handbook NASAHDBK 8739.19-3, National Aeronautics and Space Administration, 2010.
5. E. A. Arrington. “Calibration of the NASA Glenn 8- by 6-foot Supersonic Wind Tunnel”.Calibration Report NASA/CR-2012-217270, National Aeronautics and Space Adminis-tration, January 2012.
6. R. H. Soeder. “NASA Glenn 8-by 6-foot Supersonic Wind Tunnel User Manual”. Tech-nical Memorandum NASA TM 105771, National Aeronautics and Space Administration,1993.
7. Ames Research Staff. “Equations, Tables, and Charts for Compressible Flow”. TechnicalReport NACA TR-1135, National Aeronautics and Space Administration, 1953.
8. H. W. Coleman and W. G. Steele. Experimentation, Validation and Uncertainty Analysis
for Engineers. John Wiley and Sons, Inc., Third edition, 2009.
9. R.J. Moffat. “Describing the Uncertainties in Experimental Results”. Experimental
Thermal and Fluid Science, Vol. 1(No. 1), 1988.
10. Joint Committee for Guides in Metrology. “Evaluation of Measurement Data - Supple-ment 1 to the “guide to the Expression of Uncertainty in Measurement” - Propagation ofDistributions using a Monte Carlo Method”. Supplement JCGM 101:2008, InternationalOrganization for Standardization, 2008.
11. J. Walter, W. Lawrence, D. Elder, and M. Treece. “Development of an Uncertainty Modelfor the National Transonic Facility”. Technical Report AIAA 2010-4925, AmericanInstitute of Aeronautics and Astronautics, 2010.
12. B. Rouse, J. Morales, and T. McElroy. “Measurement Analysis Tool for Uncertainty inSystems Overview”. Contractor report, National Aeronautics and Space Administration,In Progress.
13. J.L. Devore. Probability and Statistics for Engineering and the Sciences. Brooks/Cole,Fifth edition, 2000.
NASA/CR—2016-219411 113

14. R.A. Wahls, J.B. Adcock, D.P. Witkowski, and F.L. Wright. “A Longitudinal Aerody-namic Data Repeatability Study for a Commercial Transport Model Test in the NationalTransonic Facility”. Technical Paper NASA TP 3522, National Aeronautics and SpaceAdministration, August 1995.
NASA/CR—2016-219411 114
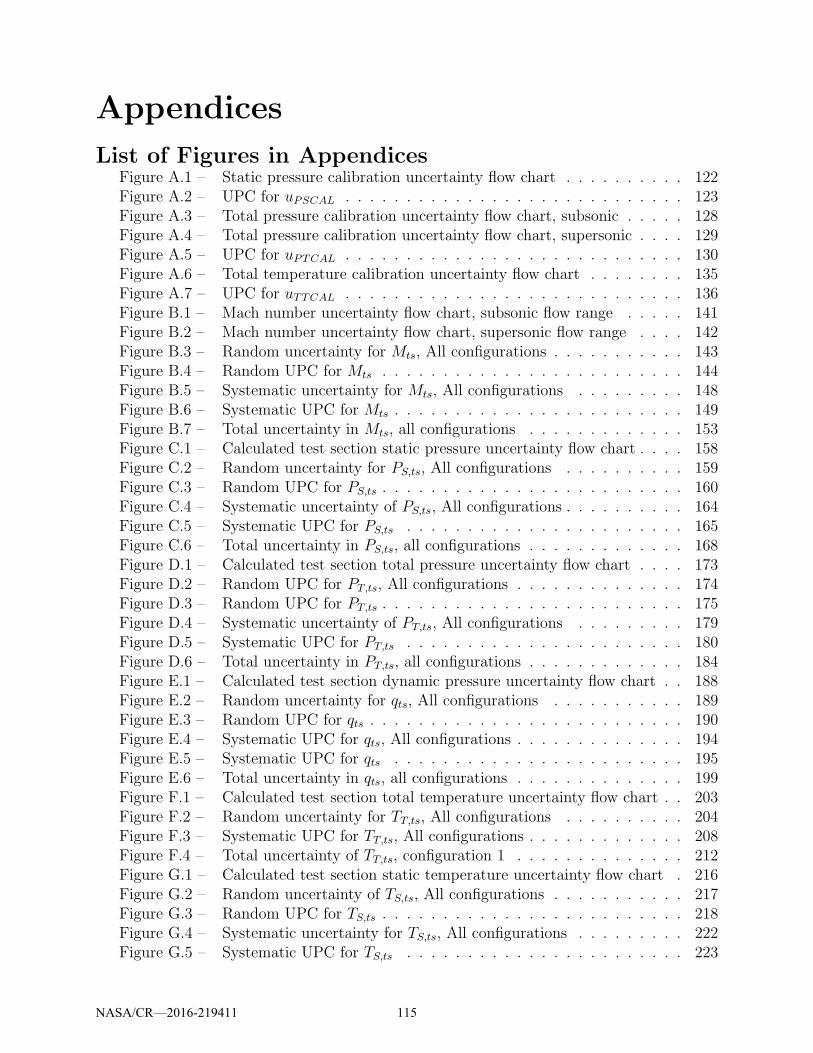
Appendices
List of Figures in AppendicesFigure A.1 – Static pressure calibration uncertainty flow chart . . . . . . . . . . 122Figure A.2 – UPC for uPSCAL . . . . . . . . . . . . . . . . . . . . . . . . . . . . 123Figure A.3 – Total pressure calibration uncertainty flow chart, subsonic . . . . . 128Figure A.4 – Total pressure calibration uncertainty flow chart, supersonic . . . . 129Figure A.5 – UPC for uPTCAL . . . . . . . . . . . . . . . . . . . . . . . . . . . . 130Figure A.6 – Total temperature calibration uncertainty flow chart . . . . . . . . 135Figure A.7 – UPC for uTTCAL . . . . . . . . . . . . . . . . . . . . . . . . . . . . 136Figure B.1 – Mach number uncertainty flow chart, subsonic flow range . . . . . 141Figure B.2 – Mach number uncertainty flow chart, supersonic flow range . . . . 142Figure B.3 – Random uncertainty for Mts, All configurations . . . . . . . . . . . 143Figure B.4 – Random UPC for Mts . . . . . . . . . . . . . . . . . . . . . . . . . 144Figure B.5 – Systematic uncertainty for Mts, All configurations . . . . . . . . . 148Figure B.6 – Systematic UPC for Mts . . . . . . . . . . . . . . . . . . . . . . . . 149Figure B.7 – Total uncertainty in Mts, all configurations . . . . . . . . . . . . . 153Figure C.1 – Calculated test section static pressure uncertainty flow chart . . . . 158Figure C.2 – Random uncertainty for PS,ts, All configurations . . . . . . . . . . 159Figure C.3 – Random UPC for PS,ts . . . . . . . . . . . . . . . . . . . . . . . . . 160Figure C.4 – Systematic uncertainty of PS,ts, All configurations . . . . . . . . . . 164Figure C.5 – Systematic UPC for PS,ts . . . . . . . . . . . . . . . . . . . . . . . 165Figure C.6 – Total uncertainty in PS,ts, all configurations . . . . . . . . . . . . . 168Figure D.1 – Calculated test section total pressure uncertainty flow chart . . . . 173Figure D.2 – Random UPC for PT,ts, All configurations . . . . . . . . . . . . . . 174Figure D.3 – Random UPC for PT,ts . . . . . . . . . . . . . . . . . . . . . . . . . 175Figure D.4 – Systematic uncertainty of PT,ts, All configurations . . . . . . . . . 179Figure D.5 – Systematic UPC for PT,ts . . . . . . . . . . . . . . . . . . . . . . . 180Figure D.6 – Total uncertainty in PT,ts, all configurations . . . . . . . . . . . . . 184Figure E.1 – Calculated test section dynamic pressure uncertainty flow chart . . 188Figure E.2 – Random uncertainty for qts, All configurations . . . . . . . . . . . 189Figure E.3 – Random UPC for qts . . . . . . . . . . . . . . . . . . . . . . . . . . 190Figure E.4 – Systematic UPC for qts, All configurations . . . . . . . . . . . . . . 194Figure E.5 – Systematic UPC for qts . . . . . . . . . . . . . . . . . . . . . . . . 195Figure E.6 – Total uncertainty in qts, all configurations . . . . . . . . . . . . . . 199Figure F.1 – Calculated test section total temperature uncertainty flow chart . . 203Figure F.2 – Random uncertainty for TT,ts, All configurations . . . . . . . . . . 204Figure F.3 – Systematic UPC for TT,ts, All configurations . . . . . . . . . . . . . 208Figure F.4 – Total uncertainty of TT,ts, configuration 1 . . . . . . . . . . . . . . 212Figure G.1 – Calculated test section static temperature uncertainty flow chart . 216Figure G.2 – Random uncertainty of TS,ts, All configurations . . . . . . . . . . . 217Figure G.3 – Random UPC for TS,ts . . . . . . . . . . . . . . . . . . . . . . . . . 218Figure G.4 – Systematic uncertainty for TS,ts, All configurations . . . . . . . . . 222Figure G.5 – Systematic UPC for TS,ts . . . . . . . . . . . . . . . . . . . . . . . 223
NASA/CR—2016-219411 115

Figure G.6 – Total uncertainty of TS,ts, all configurations . . . . . . . . . . . . . 227Figure H.1 – Calculated test section Reynolds number uncertainty flow chart . . 231Figure H.2 – Random uncertainty of qts, All configurations . . . . . . . . . . . . 232Figure H.3 – Random UPC for Rets . . . . . . . . . . . . . . . . . . . . . . . . . 233Figure H.4 – Systematic uncertainty for Rets, All configurations . . . . . . . . . 237Figure H.5 – Systematic UPC for Rets . . . . . . . . . . . . . . . . . . . . . . . 238Figure H.6 – Total uncertainty in Rets, all configurations . . . . . . . . . . . . . 242Figure I.1 – Calculated test section free stream air speed uncertainty flow chart 246Figure I.2 – Random uncertainty of Uts, All configurations . . . . . . . . . . . . 247Figure I.3 – Random UPC for Uts . . . . . . . . . . . . . . . . . . . . . . . . . 248Figure I.4 – Systematic uncertainty for Uts, All configurations . . . . . . . . . . 252Figure I.5 – Systematic UPC for Uts . . . . . . . . . . . . . . . . . . . . . . . . 253Figure I.6 – Total uncertainty in Uts, all configurations . . . . . . . . . . . . . . 257Figure J.1 – Isolating static pressure spatial uniformity uncertainty . . . . . . . 262Figure J.2 – Static pressure profile . . . . . . . . . . . . . . . . . . . . . . . . . 262Figure J.3 – Removing biases from raw data measurements . . . . . . . . . . . 263Figure J.4 – Isolating total pressure spatial uniformity uncertainty . . . . . . . 264Figure J.5 – Isolating total temperature spatial uniformity uncertainty . . . . . 264Figure K.1 – Pressure instrumentation uncertainty flow in MANTUS . . . . . . 265Figure K.2 – UPC to Pressure Instrumentation . . . . . . . . . . . . . . . . . . 266Figure K.3 – TC instrumentation uncertainty flow in MANTUS . . . . . . . . . 267Figure K.4 – UPC for Temperature Instrumentation . . . . . . . . . . . . . . . . 267
NASA/CR—2016-219411 116
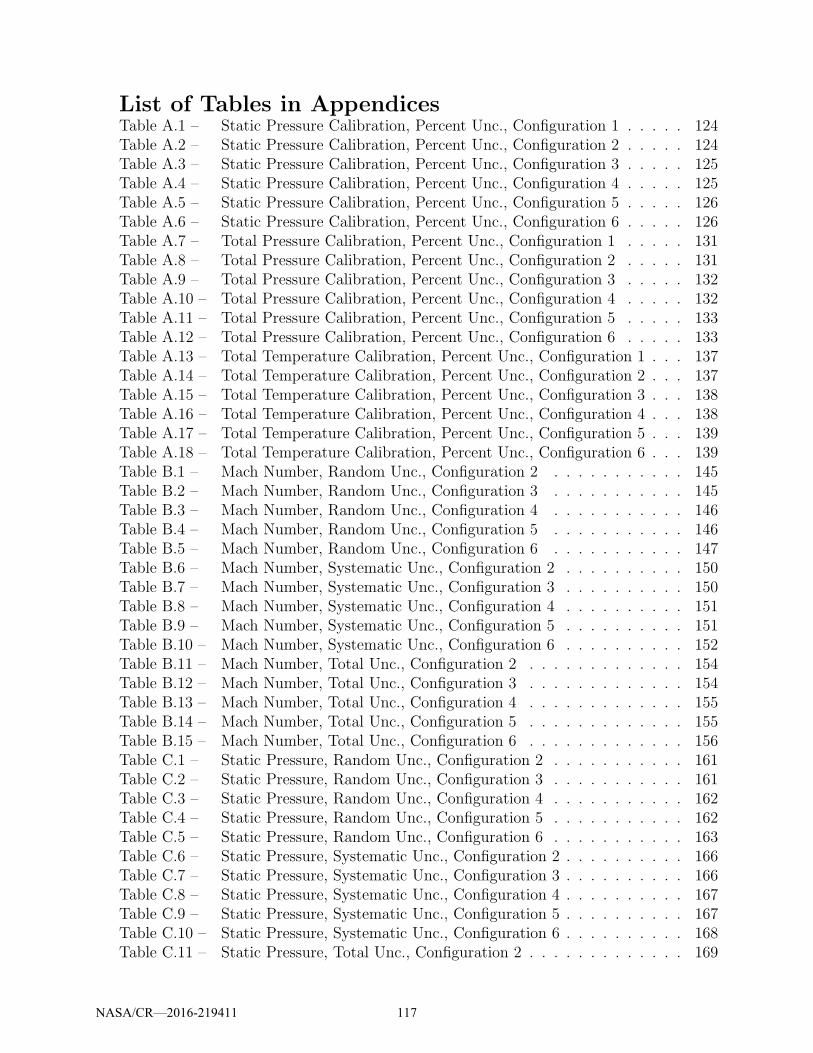
List of Tables in AppendicesTable A.1 – Static Pressure Calibration, Percent Unc., Configuration 1 . . . . . 124Table A.2 – Static Pressure Calibration, Percent Unc., Configuration 2 . . . . . 124Table A.3 – Static Pressure Calibration, Percent Unc., Configuration 3 . . . . . 125Table A.4 – Static Pressure Calibration, Percent Unc., Configuration 4 . . . . . 125Table A.5 – Static Pressure Calibration, Percent Unc., Configuration 5 . . . . . 126Table A.6 – Static Pressure Calibration, Percent Unc., Configuration 6 . . . . . 126Table A.7 – Total Pressure Calibration, Percent Unc., Configuration 1 . . . . . 131Table A.8 – Total Pressure Calibration, Percent Unc., Configuration 2 . . . . . 131Table A.9 – Total Pressure Calibration, Percent Unc., Configuration 3 . . . . . 132Table A.10 – Total Pressure Calibration, Percent Unc., Configuration 4 . . . . . 132Table A.11 – Total Pressure Calibration, Percent Unc., Configuration 5 . . . . . 133Table A.12 – Total Pressure Calibration, Percent Unc., Configuration 6 . . . . . 133Table A.13 – Total Temperature Calibration, Percent Unc., Configuration 1 . . . 137Table A.14 – Total Temperature Calibration, Percent Unc., Configuration 2 . . . 137Table A.15 – Total Temperature Calibration, Percent Unc., Configuration 3 . . . 138Table A.16 – Total Temperature Calibration, Percent Unc., Configuration 4 . . . 138Table A.17 – Total Temperature Calibration, Percent Unc., Configuration 5 . . . 139Table A.18 – Total Temperature Calibration, Percent Unc., Configuration 6 . . . 139Table B.1 – Mach Number, Random Unc., Configuration 2 . . . . . . . . . . . 145Table B.2 – Mach Number, Random Unc., Configuration 3 . . . . . . . . . . . 145Table B.3 – Mach Number, Random Unc., Configuration 4 . . . . . . . . . . . 146Table B.4 – Mach Number, Random Unc., Configuration 5 . . . . . . . . . . . 146Table B.5 – Mach Number, Random Unc., Configuration 6 . . . . . . . . . . . 147Table B.6 – Mach Number, Systematic Unc., Configuration 2 . . . . . . . . . . 150Table B.7 – Mach Number, Systematic Unc., Configuration 3 . . . . . . . . . . 150Table B.8 – Mach Number, Systematic Unc., Configuration 4 . . . . . . . . . . 151Table B.9 – Mach Number, Systematic Unc., Configuration 5 . . . . . . . . . . 151Table B.10 – Mach Number, Systematic Unc., Configuration 6 . . . . . . . . . . 152Table B.11 – Mach Number, Total Unc., Configuration 2 . . . . . . . . . . . . . 154Table B.12 – Mach Number, Total Unc., Configuration 3 . . . . . . . . . . . . . 154Table B.13 – Mach Number, Total Unc., Configuration 4 . . . . . . . . . . . . . 155Table B.14 – Mach Number, Total Unc., Configuration 5 . . . . . . . . . . . . . 155Table B.15 – Mach Number, Total Unc., Configuration 6 . . . . . . . . . . . . . 156Table C.1 – Static Pressure, Random Unc., Configuration 2 . . . . . . . . . . . 161Table C.2 – Static Pressure, Random Unc., Configuration 3 . . . . . . . . . . . 161Table C.3 – Static Pressure, Random Unc., Configuration 4 . . . . . . . . . . . 162Table C.4 – Static Pressure, Random Unc., Configuration 5 . . . . . . . . . . . 162Table C.5 – Static Pressure, Random Unc., Configuration 6 . . . . . . . . . . . 163Table C.6 – Static Pressure, Systematic Unc., Configuration 2 . . . . . . . . . . 166Table C.7 – Static Pressure, Systematic Unc., Configuration 3 . . . . . . . . . . 166Table C.8 – Static Pressure, Systematic Unc., Configuration 4 . . . . . . . . . . 167Table C.9 – Static Pressure, Systematic Unc., Configuration 5 . . . . . . . . . . 167Table C.10 – Static Pressure, Systematic Unc., Configuration 6 . . . . . . . . . . 168Table C.11 – Static Pressure, Total Unc., Configuration 2 . . . . . . . . . . . . . 169
NASA/CR—2016-219411 117
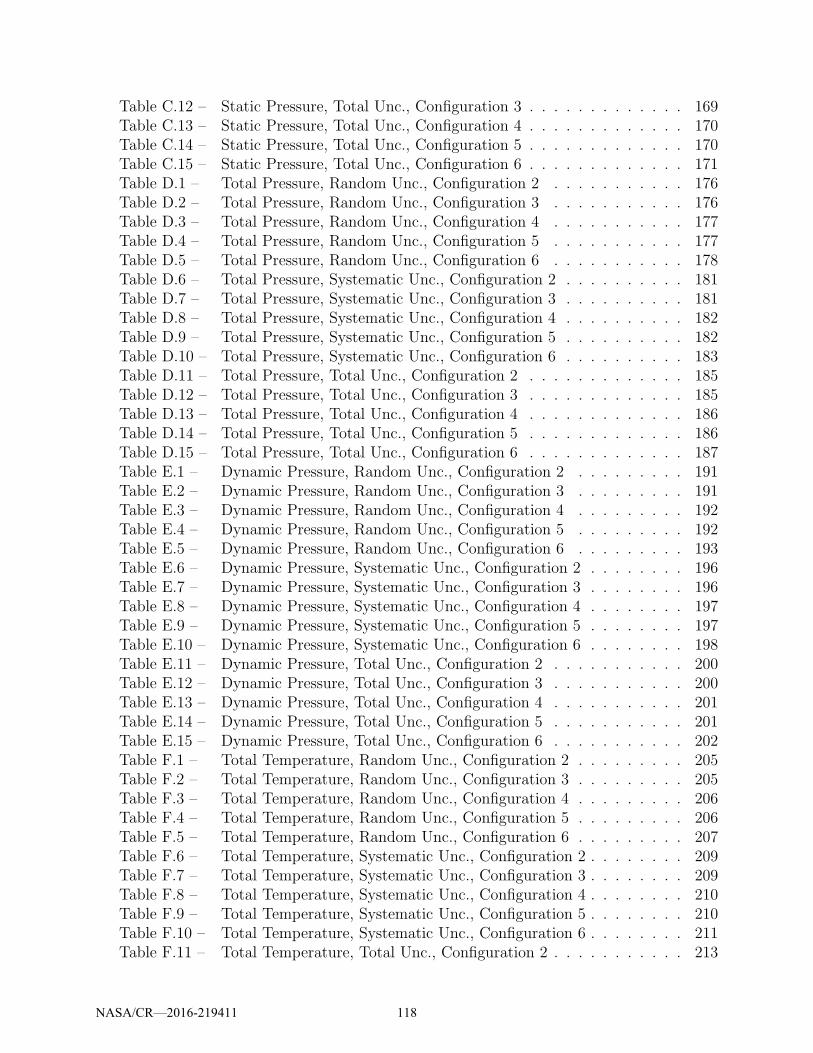
Table C.12 – Static Pressure, Total Unc., Configuration 3 . . . . . . . . . . . . . 169Table C.13 – Static Pressure, Total Unc., Configuration 4 . . . . . . . . . . . . . 170Table C.14 – Static Pressure, Total Unc., Configuration 5 . . . . . . . . . . . . . 170Table C.15 – Static Pressure, Total Unc., Configuration 6 . . . . . . . . . . . . . 171Table D.1 – Total Pressure, Random Unc., Configuration 2 . . . . . . . . . . . 176Table D.2 – Total Pressure, Random Unc., Configuration 3 . . . . . . . . . . . 176Table D.3 – Total Pressure, Random Unc., Configuration 4 . . . . . . . . . . . 177Table D.4 – Total Pressure, Random Unc., Configuration 5 . . . . . . . . . . . 177Table D.5 – Total Pressure, Random Unc., Configuration 6 . . . . . . . . . . . 178Table D.6 – Total Pressure, Systematic Unc., Configuration 2 . . . . . . . . . . 181Table D.7 – Total Pressure, Systematic Unc., Configuration 3 . . . . . . . . . . 181Table D.8 – Total Pressure, Systematic Unc., Configuration 4 . . . . . . . . . . 182Table D.9 – Total Pressure, Systematic Unc., Configuration 5 . . . . . . . . . . 182Table D.10 – Total Pressure, Systematic Unc., Configuration 6 . . . . . . . . . . 183Table D.11 – Total Pressure, Total Unc., Configuration 2 . . . . . . . . . . . . . 185Table D.12 – Total Pressure, Total Unc., Configuration 3 . . . . . . . . . . . . . 185Table D.13 – Total Pressure, Total Unc., Configuration 4 . . . . . . . . . . . . . 186Table D.14 – Total Pressure, Total Unc., Configuration 5 . . . . . . . . . . . . . 186Table D.15 – Total Pressure, Total Unc., Configuration 6 . . . . . . . . . . . . . 187Table E.1 – Dynamic Pressure, Random Unc., Configuration 2 . . . . . . . . . 191Table E.2 – Dynamic Pressure, Random Unc., Configuration 3 . . . . . . . . . 191Table E.3 – Dynamic Pressure, Random Unc., Configuration 4 . . . . . . . . . 192Table E.4 – Dynamic Pressure, Random Unc., Configuration 5 . . . . . . . . . 192Table E.5 – Dynamic Pressure, Random Unc., Configuration 6 . . . . . . . . . 193Table E.6 – Dynamic Pressure, Systematic Unc., Configuration 2 . . . . . . . . 196Table E.7 – Dynamic Pressure, Systematic Unc., Configuration 3 . . . . . . . . 196Table E.8 – Dynamic Pressure, Systematic Unc., Configuration 4 . . . . . . . . 197Table E.9 – Dynamic Pressure, Systematic Unc., Configuration 5 . . . . . . . . 197Table E.10 – Dynamic Pressure, Systematic Unc., Configuration 6 . . . . . . . . 198Table E.11 – Dynamic Pressure, Total Unc., Configuration 2 . . . . . . . . . . . 200Table E.12 – Dynamic Pressure, Total Unc., Configuration 3 . . . . . . . . . . . 200Table E.13 – Dynamic Pressure, Total Unc., Configuration 4 . . . . . . . . . . . 201Table E.14 – Dynamic Pressure, Total Unc., Configuration 5 . . . . . . . . . . . 201Table E.15 – Dynamic Pressure, Total Unc., Configuration 6 . . . . . . . . . . . 202Table F.1 – Total Temperature, Random Unc., Configuration 2 . . . . . . . . . 205Table F.2 – Total Temperature, Random Unc., Configuration 3 . . . . . . . . . 205Table F.3 – Total Temperature, Random Unc., Configuration 4 . . . . . . . . . 206Table F.4 – Total Temperature, Random Unc., Configuration 5 . . . . . . . . . 206Table F.5 – Total Temperature, Random Unc., Configuration 6 . . . . . . . . . 207Table F.6 – Total Temperature, Systematic Unc., Configuration 2 . . . . . . . . 209Table F.7 – Total Temperature, Systematic Unc., Configuration 3 . . . . . . . . 209Table F.8 – Total Temperature, Systematic Unc., Configuration 4 . . . . . . . . 210Table F.9 – Total Temperature, Systematic Unc., Configuration 5 . . . . . . . . 210Table F.10 – Total Temperature, Systematic Unc., Configuration 6 . . . . . . . . 211Table F.11 – Total Temperature, Total Unc., Configuration 2 . . . . . . . . . . . 213
NASA/CR—2016-219411 118
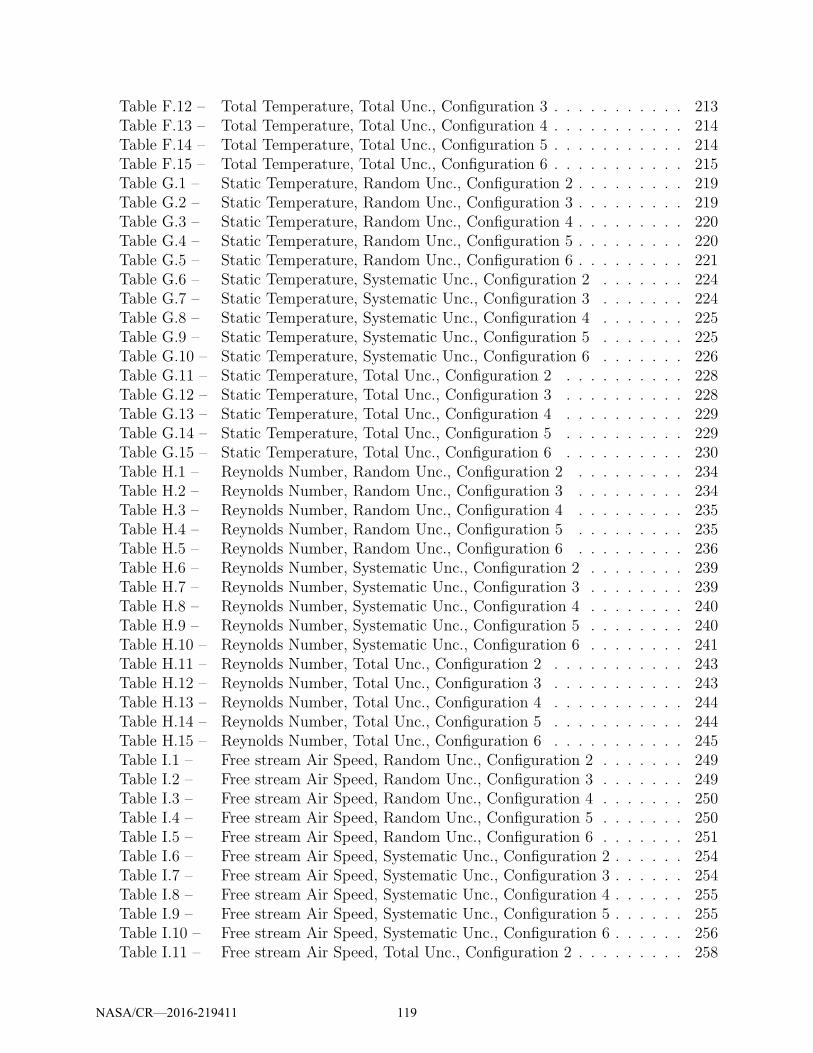
Table F.12 – Total Temperature, Total Unc., Configuration 3 . . . . . . . . . . . 213Table F.13 – Total Temperature, Total Unc., Configuration 4 . . . . . . . . . . . 214Table F.14 – Total Temperature, Total Unc., Configuration 5 . . . . . . . . . . . 214Table F.15 – Total Temperature, Total Unc., Configuration 6 . . . . . . . . . . . 215Table G.1 – Static Temperature, Random Unc., Configuration 2 . . . . . . . . . 219Table G.2 – Static Temperature, Random Unc., Configuration 3 . . . . . . . . . 219Table G.3 – Static Temperature, Random Unc., Configuration 4 . . . . . . . . . 220Table G.4 – Static Temperature, Random Unc., Configuration 5 . . . . . . . . . 220Table G.5 – Static Temperature, Random Unc., Configuration 6 . . . . . . . . . 221Table G.6 – Static Temperature, Systematic Unc., Configuration 2 . . . . . . . 224Table G.7 – Static Temperature, Systematic Unc., Configuration 3 . . . . . . . 224Table G.8 – Static Temperature, Systematic Unc., Configuration 4 . . . . . . . 225Table G.9 – Static Temperature, Systematic Unc., Configuration 5 . . . . . . . 225Table G.10 – Static Temperature, Systematic Unc., Configuration 6 . . . . . . . 226Table G.11 – Static Temperature, Total Unc., Configuration 2 . . . . . . . . . . 228Table G.12 – Static Temperature, Total Unc., Configuration 3 . . . . . . . . . . 228Table G.13 – Static Temperature, Total Unc., Configuration 4 . . . . . . . . . . 229Table G.14 – Static Temperature, Total Unc., Configuration 5 . . . . . . . . . . 229Table G.15 – Static Temperature, Total Unc., Configuration 6 . . . . . . . . . . 230Table H.1 – Reynolds Number, Random Unc., Configuration 2 . . . . . . . . . 234Table H.2 – Reynolds Number, Random Unc., Configuration 3 . . . . . . . . . 234Table H.3 – Reynolds Number, Random Unc., Configuration 4 . . . . . . . . . 235Table H.4 – Reynolds Number, Random Unc., Configuration 5 . . . . . . . . . 235Table H.5 – Reynolds Number, Random Unc., Configuration 6 . . . . . . . . . 236Table H.6 – Reynolds Number, Systematic Unc., Configuration 2 . . . . . . . . 239Table H.7 – Reynolds Number, Systematic Unc., Configuration 3 . . . . . . . . 239Table H.8 – Reynolds Number, Systematic Unc., Configuration 4 . . . . . . . . 240Table H.9 – Reynolds Number, Systematic Unc., Configuration 5 . . . . . . . . 240Table H.10 – Reynolds Number, Systematic Unc., Configuration 6 . . . . . . . . 241Table H.11 – Reynolds Number, Total Unc., Configuration 2 . . . . . . . . . . . 243Table H.12 – Reynolds Number, Total Unc., Configuration 3 . . . . . . . . . . . 243Table H.13 – Reynolds Number, Total Unc., Configuration 4 . . . . . . . . . . . 244Table H.14 – Reynolds Number, Total Unc., Configuration 5 . . . . . . . . . . . 244Table H.15 – Reynolds Number, Total Unc., Configuration 6 . . . . . . . . . . . 245Table I.1 – Free stream Air Speed, Random Unc., Configuration 2 . . . . . . . 249Table I.2 – Free stream Air Speed, Random Unc., Configuration 3 . . . . . . . 249Table I.3 – Free stream Air Speed, Random Unc., Configuration 4 . . . . . . . 250Table I.4 – Free stream Air Speed, Random Unc., Configuration 5 . . . . . . . 250Table I.5 – Free stream Air Speed, Random Unc., Configuration 6 . . . . . . . 251Table I.6 – Free stream Air Speed, Systematic Unc., Configuration 2 . . . . . . 254Table I.7 – Free stream Air Speed, Systematic Unc., Configuration 3 . . . . . . 254Table I.8 – Free stream Air Speed, Systematic Unc., Configuration 4 . . . . . . 255Table I.9 – Free stream Air Speed, Systematic Unc., Configuration 5 . . . . . . 255Table I.10 – Free stream Air Speed, Systematic Unc., Configuration 6 . . . . . . 256Table I.11 – Free stream Air Speed, Total Unc., Configuration 2 . . . . . . . . . 258
NASA/CR—2016-219411 119
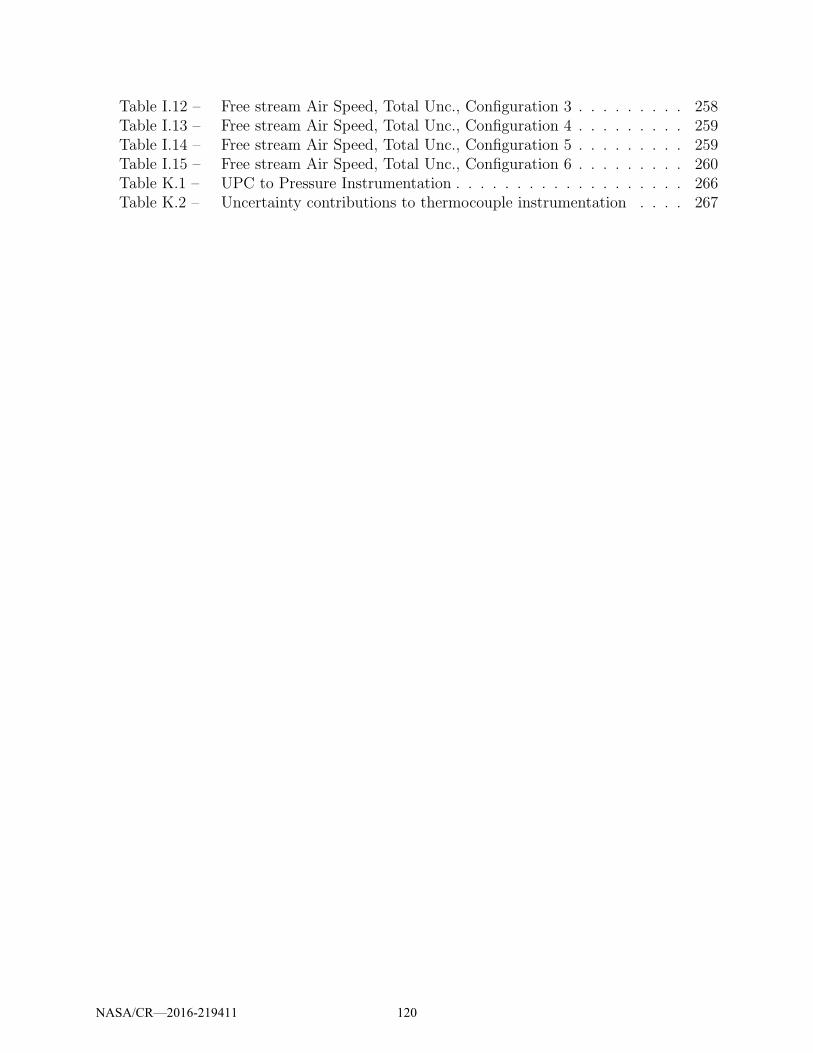
Table I.12 – Free stream Air Speed, Total Unc., Configuration 3 . . . . . . . . . 258Table I.13 – Free stream Air Speed, Total Unc., Configuration 4 . . . . . . . . . 259Table I.14 – Free stream Air Speed, Total Unc., Configuration 5 . . . . . . . . . 259Table I.15 – Free stream Air Speed, Total Unc., Configuration 6 . . . . . . . . . 260Table K.1 – UPC to Pressure Instrumentation . . . . . . . . . . . . . . . . . . . 266Table K.2 – Uncertainty contributions to thermocouple instrumentation . . . . 267
NASA/CR—2016-219411 120
Appendix A: Uncertainty Contributions to Calibrations
In Section 5, the random, systematic and total uncertainties were presented for every vari-able of interest. Combined systematic uncertainties of those variables are influenced by thesystematic uncertainty from tunnel calibrations (static pressure, total pressure, and totaltemperature). Random measurement errors, systematic instrumentation errors, and system-atic errors due to uniformity of the flow contribute to the uncertainty of these calibrations.While comprised of both random and systematic components, these errors are fossilized andcontribute as a combined systematic uncertainty for test-time analysis (bPSCAL, bPTCAL, andbTTCAL). This Appendix breaks down the contributions of elemental uncertainties for eachcalibration. Details of the calibration procedure are provided in Section 3.
A.1 Static Pressure Calibration
Uncertainties present during the static pressure calibration include the random uncertain-ties from total pressure in the bellmouth, static pressure in the balance chamber and staticpressure on the cylinder (sPT,bm
, sPs,bal, and sPs,cyl
), random uncertainty in the calibrationregression (sPS,reg
), systematic uncertainty in pressure measurement instrumentation (com-bined as bPinst
), and systematic uncertainty due to static pressure uniformity (bPS,unif).
The uncertainty flow chart is shown in Figure A.1. Uncertainty results are presented aspercent contributions as bar charts in Figure A.2 and tabular form in Tables A.1 - A.6 forall configurations. The static pressure calibration uncertainty is driven by the uncertaintydue to the regression.
NASA/CR—2016-219411 121
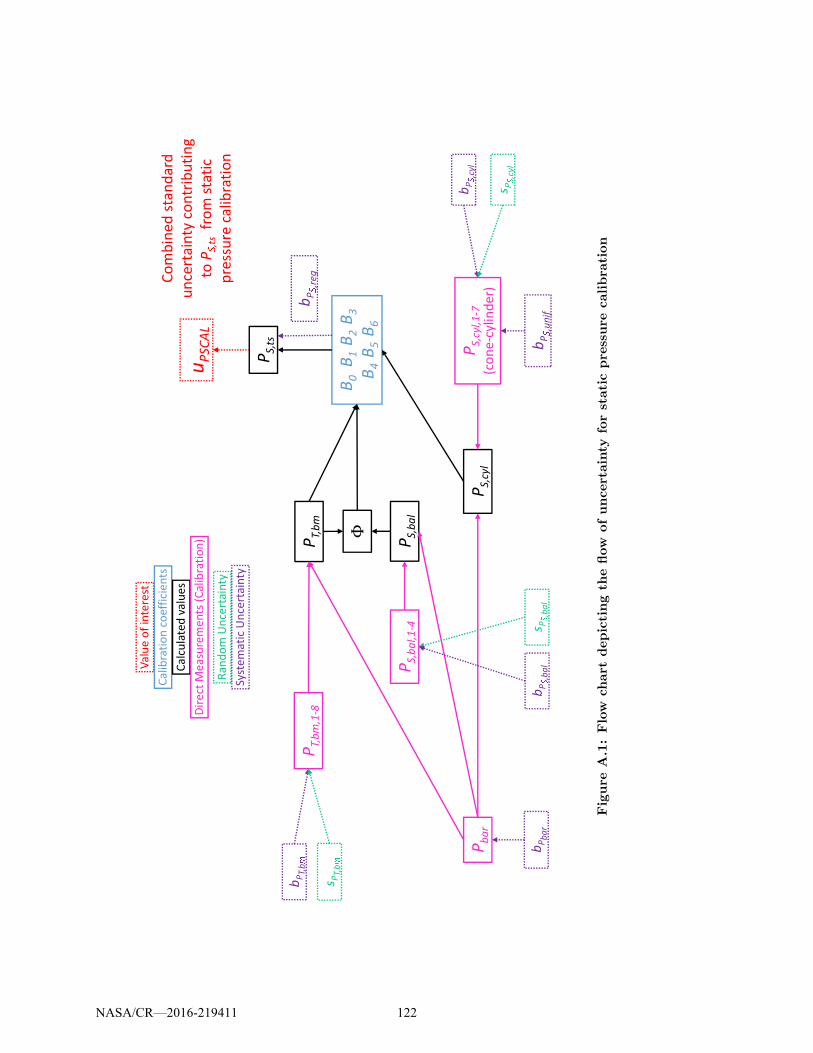
PT,bm
PS,bal
PS,cyl
B0B1B2B3
B4B5B6
PS,ts
Φ
PT,bm,1-8
PS,bal,1-4
PS,cyl,1-7
(cone-cylinder)
Pbar
uPSCAL
bPT,b
�
s PT,b
�
bPbar
bP
,cyl
s P
,cyl
bP
�
,unif
s P
,bal
bP
,balValueofinterest
Calibrationcoefficients
Calculatedvalues
DirectMeasurements(Calibration)
Random
Un
cert
ain
ty
Syst
em
ati
cU
nce
rta
inty
Co
mb
ine
dst
an
da
rd
un
cert
ain
tyco
ntr
ibu
tin
g
toP
�
,ts
fro
mst
ati
c
pre
ssu
reca
lib
rati
on
bP
�
,reg
Figure
A.1:Flow
chart
depictingth
eflow
ofuncertainty
forstaticpre
ssure
calibra
tion
NASA/CR—2016-219411 122
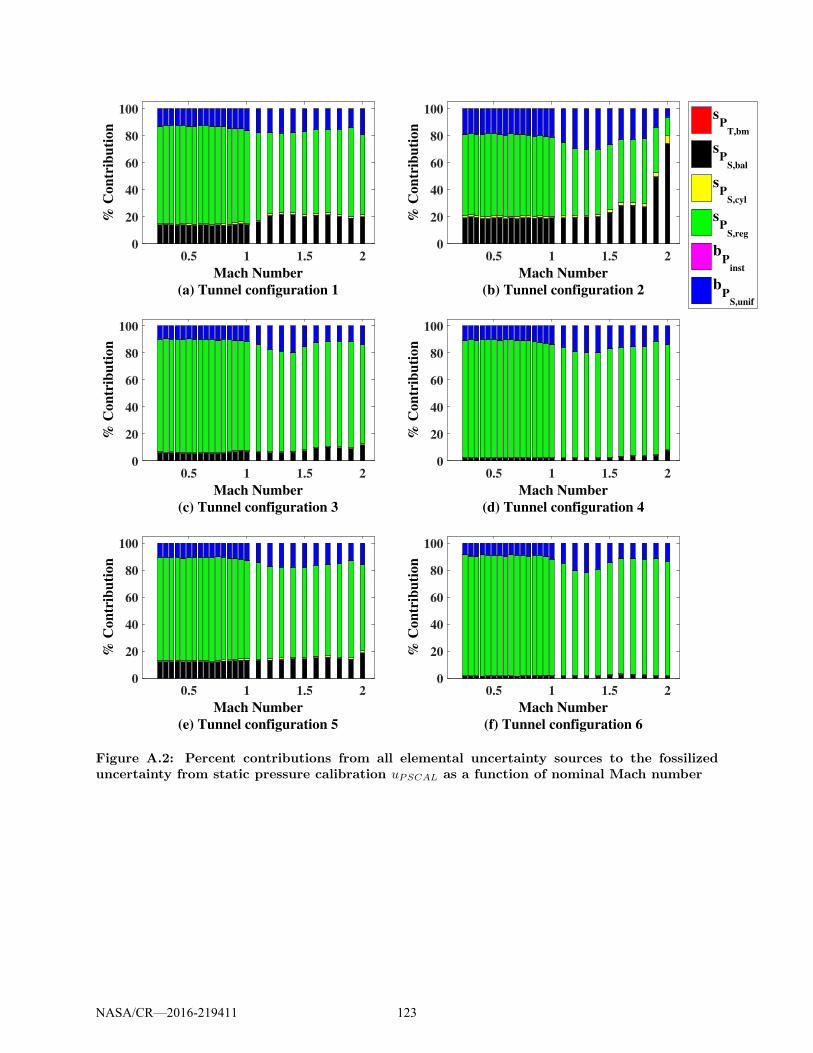
0.5 1 1.5 2
Mach Number
(a) Tunnel configuration 1
0
20
40
60
80
100%
Co
ntr
ibu
tio
n
0.5 1 1.5 2
Mach Number
(b) Tunnel configuration 2
0
20
40
60
80
100
% C
on
trib
uti
on
0.5 1 1.5 2
Mach Number
(c) Tunnel configuration 3
0
20
40
60
80
100
% C
on
trib
uti
on
0.5 1 1.5 2
Mach Number
(d) Tunnel configuration 4
0
20
40
60
80
100
% C
on
trib
uti
on
0.5 1 1.5 2
Mach Number
(e) Tunnel configuration 5
0
20
40
60
80
100
% C
on
trib
uti
on
0.5 1 1.5 2
Mach Number
(f) Tunnel configuration 6
0
20
40
60
80
100
% C
on
trib
uti
on
sP
T,bm
sP
S,bal
sP
S,cyl
sP
S,reg
bP
inst
bP
S,unif
Figure A.2: Percent contributions from all elemental uncertainty sources to the fossilizeduncertainty from static pressure calibration uPSCAL as a function of nominal Mach number
NASA/CR—2016-219411 123
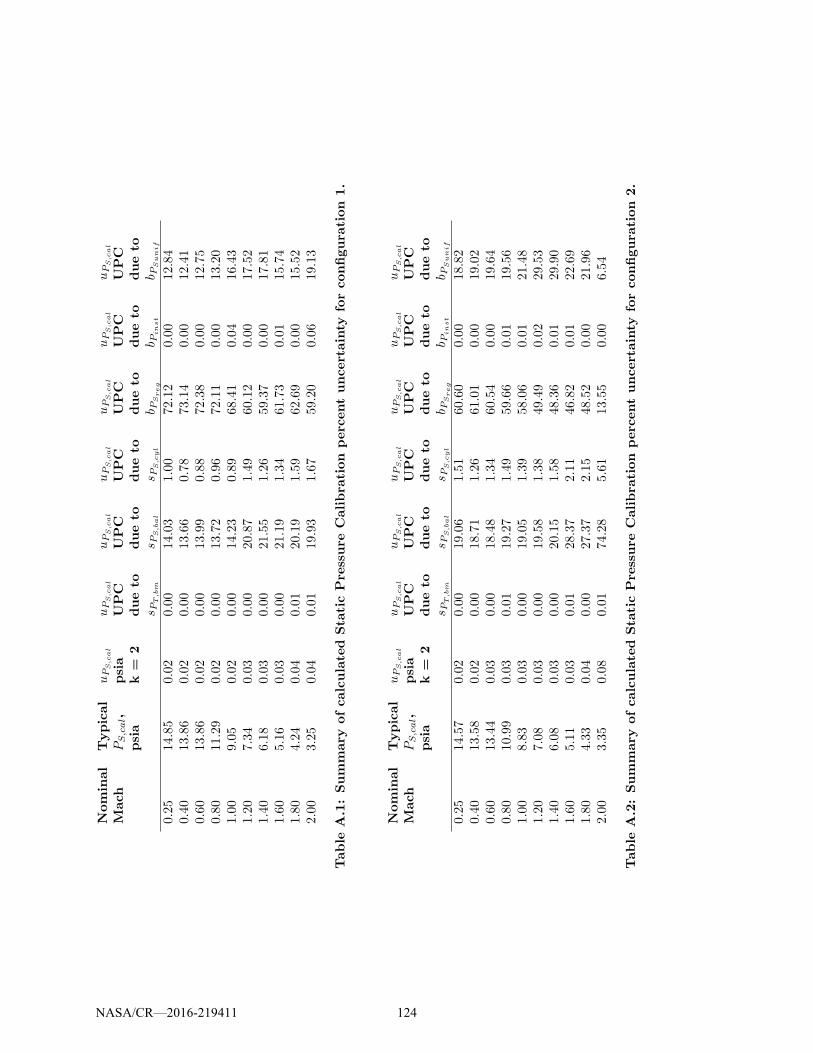
Nominal
Mach
Typical
PS,cal,
psia
uP
S,cal
psia
k=
2
uP
S,cal
UPC
dueto
sP
T,bm
uP
S,cal
UPC
dueto
sP
S,bal
uP
S,cal
UPC
dueto
sP
S,cyl
uP
S,cal
UPC
dueto
b PSreg
uP
S,cal
UPC
dueto
b Pinst
uP
S,cal
UPC
dueto
b PSunif
0.25
14.85
0.02
0.00
14.03
1.00
72.12
0.00
12.84
0.40
13.86
0.02
0.00
13.66
0.78
73.14
0.00
12.41
0.60
13.86
0.02
0.00
13.99
0.88
72.38
0.00
12.75
0.80
11.29
0.02
0.00
13.72
0.96
72.11
0.00
13.20
1.00
9.05
0.02
0.00
14.23
0.89
68.41
0.04
16.43
1.20
7.34
0.03
0.00
20.87
1.49
60.12
0.00
17.52
1.40
6.18
0.03
0.00
21.55
1.26
59.37
0.00
17.81
1.60
5.16
0.03
0.00
21.19
1.34
61.73
0.01
15.74
1.80
4.24
0.04
0.01
20.19
1.59
62.69
0.00
15.52
2.00
3.25
0.04
0.01
19.93
1.67
59.20
0.06
19.13
Table
A.1:Summary
ofcalculated
Sta
ticPressure
Calibra
tion
percentuncertainty
forconfigura
tion
1.
Nominal
Mach
Typical
PS,cal,
psia
uP
S,cal
psia
k=
2
uP
S,cal
UPC
dueto
sP
T,bm
uP
S,cal
UPC
dueto
sP
S,bal
uP
S,cal
UPC
dueto
sP
S,cyl
uP
S,cal
UPC
dueto
b PSreg
uP
S,cal
UPC
dueto
b Pinst
uP
S,cal
UPC
dueto
b PSunif
0.25
14.57
0.02
0.00
19.06
1.51
60.60
0.00
18.82
0.40
13.58
0.02
0.00
18.71
1.26
61.01
0.00
19.02
0.60
13.44
0.03
0.00
18.48
1.34
60.54
0.00
19.64
0.80
10.99
0.03
0.01
19.27
1.49
59.66
0.01
19.56
1.00
8.83
0.03
0.00
19.05
1.39
58.06
0.01
21.48
1.20
7.08
0.03
0.00
19.58
1.38
49.49
0.02
29.53
1.40
6.08
0.03
0.00
20.15
1.58
48.36
0.01
29.90
1.60
5.11
0.03
0.01
28.37
2.11
46.82
0.01
22.69
1.80
4.33
0.04
0.00
27.37
2.15
48.52
0.00
21.96
2.00
3.35
0.08
0.01
74.28
5.61
13.55
0.00
6.54
Table
A.2:Summary
ofcalculated
Sta
ticPressure
Calibra
tion
percentuncertainty
forconfigura
tion
2.
NASA/CR—2016-219411 124
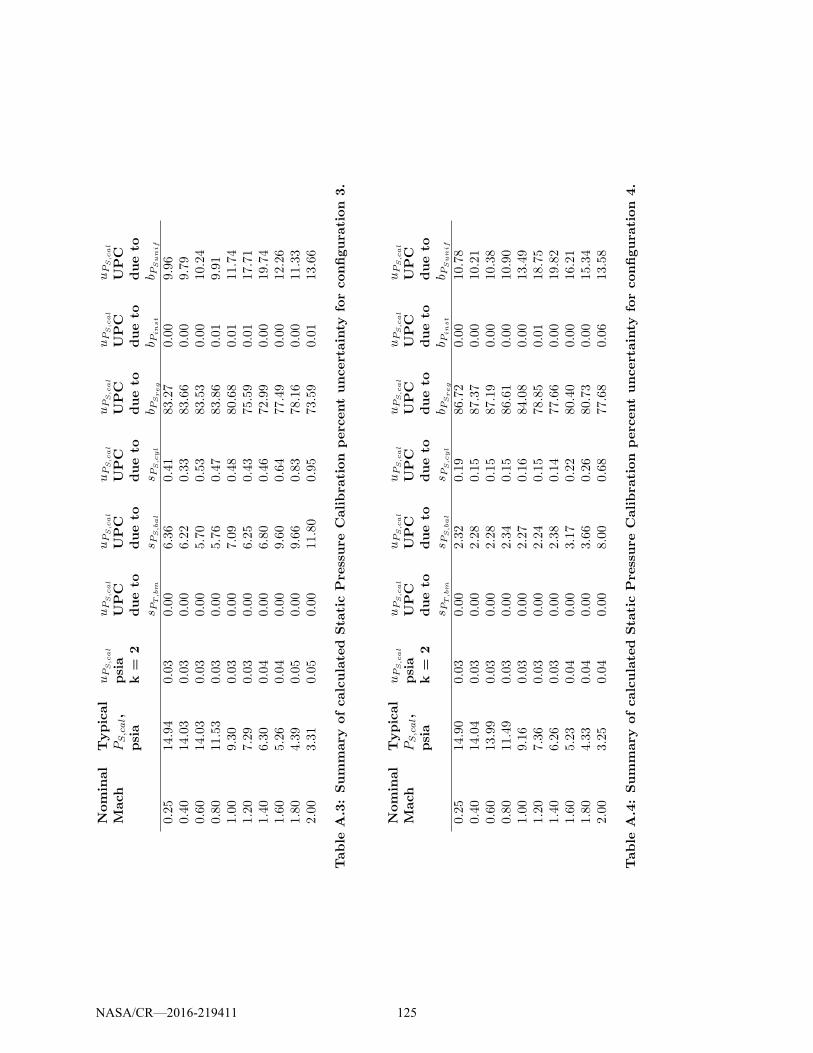
Nominal
Mach
Typical
PS,cal,
psia
uP
S,cal
psia
k=
2
uP
S,cal
UPC
dueto
sP
T,bm
uP
S,cal
UPC
dueto
sP
S,bal
uP
S,cal
UPC
dueto
sP
S,cyl
uP
S,cal
UPC
dueto
b PSreg
uP
S,cal
UPC
dueto
b Pinst
uP
S,cal
UPC
dueto
b PSunif
0.25
14.94
0.03
0.00
6.36
0.41
83.27
0.00
9.96
0.40
14.03
0.03
0.00
6.22
0.33
83.66
0.00
9.79
0.60
14.03
0.03
0.00
5.70
0.53
83.53
0.00
10.24
0.80
11.53
0.03
0.00
5.76
0.47
83.86
0.01
9.91
1.00
9.30
0.03
0.00
7.09
0.48
80.68
0.01
11.74
1.20
7.29
0.03
0.00
6.25
0.43
75.59
0.01
17.71
1.40
6.30
0.04
0.00
6.80
0.46
72.99
0.00
19.74
1.60
5.26
0.04
0.00
9.60
0.64
77.49
0.00
12.26
1.80
4.39
0.05
0.00
9.66
0.83
78.16
0.00
11.33
2.00
3.31
0.05
0.00
11.80
0.95
73.59
0.01
13.66
Table
A.3:Summary
ofcalculated
Sta
ticPressure
Calibra
tion
percentuncertainty
forconfigura
tion
3.
Nominal
Mach
Typical
PS,cal,
psia
uP
S,cal
psia
k=
2
uP
S,cal
UPC
dueto
sP
T,bm
uP
S,cal
UPC
dueto
sP
S,bal
uP
S,cal
UPC
dueto
sP
S,cyl
uP
S,cal
UPC
dueto
b PSreg
uP
S,cal
UPC
dueto
b Pinst
uP
S,cal
UPC
dueto
b PSunif
0.25
14.90
0.03
0.00
2.32
0.19
86.72
0.00
10.78
0.40
14.04
0.03
0.00
2.28
0.15
87.37
0.00
10.21
0.60
13.99
0.03
0.00
2.28
0.15
87.19
0.00
10.38
0.80
11.49
0.03
0.00
2.34
0.15
86.61
0.00
10.90
1.00
9.16
0.03
0.00
2.27
0.16
84.08
0.00
13.49
1.20
7.36
0.03
0.00
2.24
0.15
78.85
0.01
18.75
1.40
6.26
0.03
0.00
2.38
0.14
77.66
0.00
19.82
1.60
5.23
0.04
0.00
3.17
0.22
80.40
0.00
16.21
1.80
4.33
0.04
0.00
3.66
0.26
80.73
0.00
15.34
2.00
3.25
0.04
0.00
8.00
0.68
77.68
0.06
13.58
Table
A.4:Summary
ofcalculated
Sta
ticPressure
Calibra
tion
percentuncertainty
forconfigura
tion
4.
NASA/CR—2016-219411 125
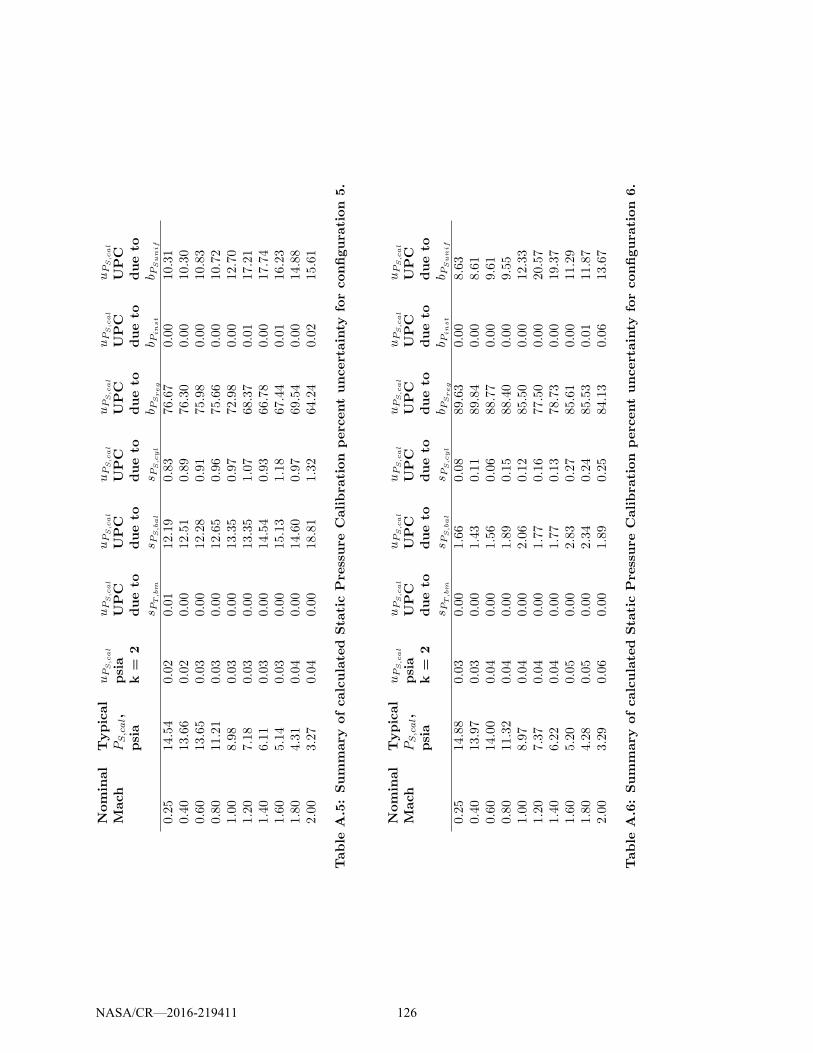
Nominal
Mach
Typical
PS,cal,
psia
uP
S,cal
psia
k=
2
uP
S,cal
UPC
dueto
sP
T,bm
uP
S,cal
UPC
dueto
sP
S,bal
uP
S,cal
UPC
dueto
sP
S,cyl
uP
S,cal
UPC
dueto
b PSreg
uP
S,cal
UPC
dueto
b Pinst
uP
S,cal
UPC
dueto
b PSunif
0.25
14.54
0.02
0.01
12.19
0.83
76.67
0.00
10.31
0.40
13.66
0.02
0.00
12.51
0.89
76.30
0.00
10.30
0.60
13.65
0.03
0.00
12.28
0.91
75.98
0.00
10.83
0.80
11.21
0.03
0.00
12.65
0.96
75.66
0.00
10.72
1.00
8.98
0.03
0.00
13.35
0.97
72.98
0.00
12.70
1.20
7.18
0.03
0.00
13.35
1.07
68.37
0.01
17.21
1.40
6.11
0.03
0.00
14.54
0.93
66.78
0.00
17.74
1.60
5.14
0.03
0.00
15.13
1.18
67.44
0.01
16.23
1.80
4.31
0.04
0.00
14.60
0.97
69.54
0.00
14.88
2.00
3.27
0.04
0.00
18.81
1.32
64.24
0.02
15.61
Table
A.5:Summary
ofcalculated
Sta
ticPressure
Calibra
tion
percentuncertainty
forconfigura
tion
5.
Nominal
Mach
Typical
PS,cal,
psia
uP
S,cal
psia
k=
2
uP
S,cal
UPC
dueto
sP
T,bm
uP
S,cal
UPC
dueto
sP
S,bal
uP
S,cal
UPC
dueto
sP
S,cyl
uP
S,cal
UPC
dueto
b PSreg
uP
S,cal
UPC
dueto
b Pinst
uP
S,cal
UPC
dueto
b PSunif
0.25
14.88
0.03
0.00
1.66
0.08
89.63
0.00
8.63
0.40
13.97
0.03
0.00
1.43
0.11
89.84
0.00
8.61
0.60
14.00
0.04
0.00
1.56
0.06
88.77
0.00
9.61
0.80
11.32
0.04
0.00
1.89
0.15
88.40
0.00
9.55
1.00
8.97
0.04
0.00
2.06
0.12
85.50
0.00
12.33
1.20
7.37
0.04
0.00
1.77
0.16
77.50
0.00
20.57
1.40
6.22
0.04
0.00
1.77
0.13
78.73
0.00
19.37
1.60
5.20
0.05
0.00
2.83
0.27
85.61
0.00
11.29
1.80
4.28
0.05
0.00
2.34
0.24
85.53
0.01
11.87
2.00
3.29
0.06
0.00
1.89
0.25
84.13
0.06
13.67
Table
A.6:Summary
ofcalculated
Sta
ticPressure
Calibra
tion
percentuncertainty
forconfigura
tion
6.
NASA/CR—2016-219411 126
A.2 Total Pressure Calibration
Uncertainties that contributed during total pressure calibration include the random uncer-tainties of the total pressure in the bellmouth, static pressure in the balance chamber andtotal pressure on the array (sPT,bm
, sPS,bal, and sPT,arr
), random uncertainty in the total pres-sure calibration regression (sPT,reg
), systematic uncertainty in pressure measurement instru-mentation (combined as bPinst
), and systematic uncertainty due to total pressure uniformity(bPT,unif
).The uncertainty flow chart for total pressure for subsonic and supersonic ranges are shown
in Figures A.3 and A.4. Uncertainty results are presented as percent contributions as barcharts in Figure A.5 and in tabular form in Tables A.7 - A.12 for all configurations. Notethat in the supersonic range, the total pressure downstream of a normal shock is measuredby the array (PT,2,arr). For simplicity, throughout this section PT,2,arr will be referred to asPT,arr and PT,2,ts will be referred to as PT,ts, and results are shown on a single chart. Totalpressure uniformity drives the total pressure calibration uncertainty, although the regressionuncertainty has greater impact in the supersonic regime.
NASA/CR—2016-219411 127
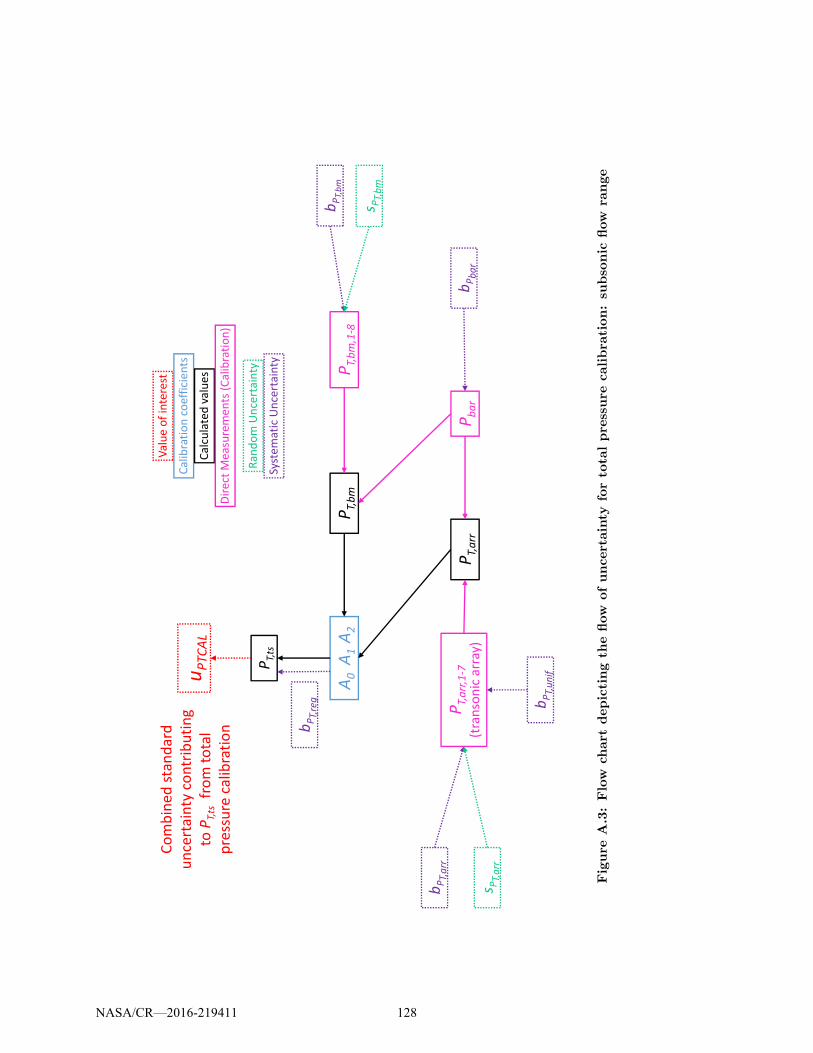
PT,arr
A0A1A2
PT,arr,1-7
(transonicarray)
PT,bm
Pbar
PT,bm,1-8
PT,ts
bPT,arr
bPbar
bPT,bm
s PT,bm
uPTCAL
bPT,unif
Valueofinterest
Calibrationcoefficients
Calculatedvalues
DirectMeasurements(Calibration)
Random
Un
cert
ain
ty
Syst
em
ati
cU
nce
rta
inty
s PT,arr
Co
mb
ine
dst
an
da
rd
un
cert
ain
tyco
ntr
ibu
tin
g
toPT,ts
fro
mto
tal
pre
ssu
reca
lib
rati
on bPT,reg
Figure
A.3:Flow
chart
depictingth
eflow
ofuncertainty
forto
talpressure
calibra
tion:su
bso
nic
flow
range
NASA/CR—2016-219411 128

PT,2,arr
AS0AS1AS2AS3
AS4AS5AS6
PT,2,arr,1-7
(transonicarray)
PT,bm
PS,bal
Φ
Pbar
PT,bm,1-8
PS,bal,1-4
PT,2,ts
bPbar
s PS,bal
bPS,bal
uPTCAL
Valueofinterest
Calibrationcoefficients
Calculatedvalues
DirectMeasurements(Calibration)
Random
Un
cert
ain
ty
Syst
em
ati
cU
nce
rta
inty
bPT,b
�
s PT,b
�
bPT,arr
s PT,arr
bPT,arr,unif
Co
mb
ine
dst
an
da
rd
un
cert
ain
tyco
ntr
ibu
tin
g
toPT,2,ts
fro
mto
tal
pre
ssu
reca
lib
rati
on bPT,2,reg
Figure
A.4:Flow
chart
depictingth
eflow
ofuncertainty
forto
talpressure
calibra
tion:su
personic
flow
range
NASA/CR—2016-219411 129

0.5 1 1.5 2
Mach Number
(a) Tunnel configuration 1
0
20
40
60
80
100%
Co
ntr
ibu
tio
n
0.5 1 1.5 2
Mach Number
(b) Tunnel configuration 2
0
20
40
60
80
100
% C
on
trib
uti
on
0.5 1 1.5 2
Mach Number
(c) Tunnel configuration 3
0
20
40
60
80
100
% C
on
trib
uti
on
0.5 1 1.5 2
Mach Number
(d) Tunnel configuration 4
0
20
40
60
80
100
% C
on
trib
uti
on
0.5 1 1.5 2
Mach Number
(e) Tunnel configuration 5
0
20
40
60
80
100
% C
on
trib
uti
on
0.5 1 1.5 2
Mach Number
(f) Tunnel configuration 6
0
20
40
60
80
100
% C
on
trib
uti
on
sP
T,bm
sP
S,bal
sP
T,arr
sP
T,reg
bP
inst
bP
T,unif
Figure A.5: Percent contributions from all elemental uncertainty sources to the combineduncertainty of the total pressure calibration, as a function of nominal Mach number
NASA/CR—2016-219411 130
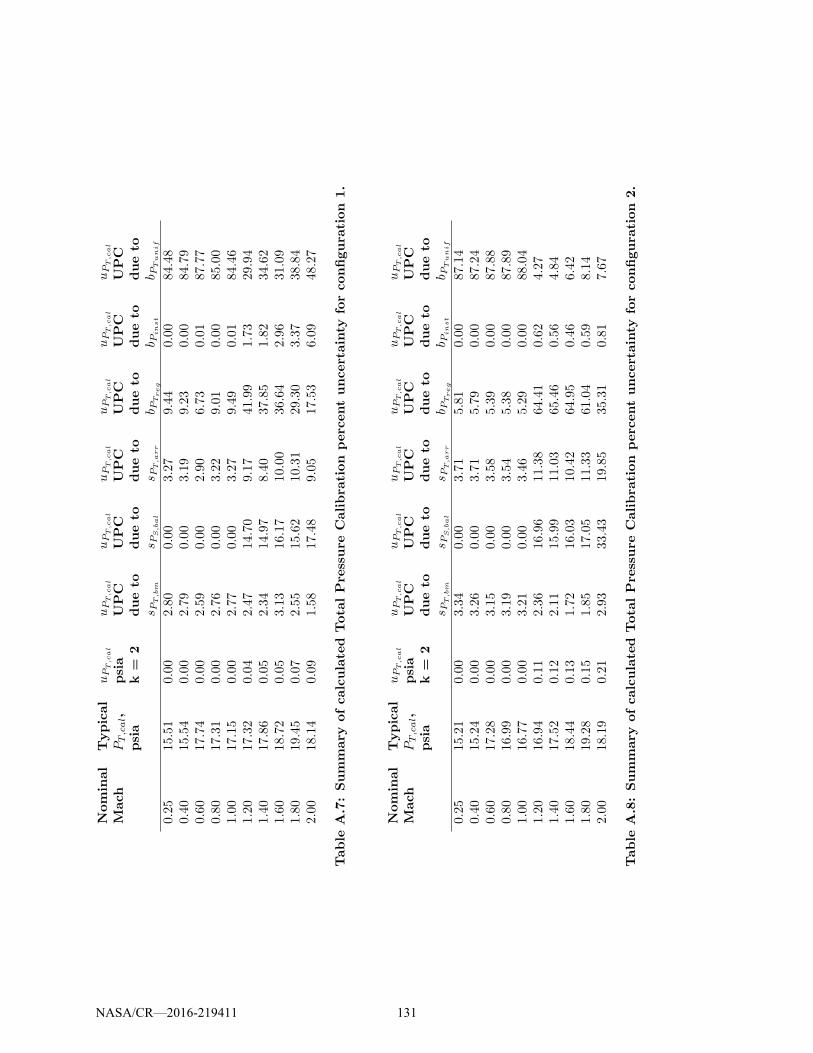
Nominal
Mach
Typical
PT,cal,
psia
uP
T,cal
psia
k=
2
uP
T,cal
UPC
dueto
sP
T,bm
uP
T,cal
UPC
dueto
sP
S,bal
uP
T,cal
UPC
dueto
sP
T,arr
uP
T,cal
UPC
dueto
b PTreg
uP
T,cal
UPC
dueto
b Pinst
uP
T,cal
UPC
dueto
b PT
unif
0.25
15.51
0.00
2.80
0.00
3.27
9.44
0.00
84.48
0.40
15.54
0.00
2.79
0.00
3.19
9.23
0.00
84.79
0.60
17.74
0.00
2.59
0.00
2.90
6.73
0.01
87.77
0.80
17.31
0.00
2.76
0.00
3.22
9.01
0.00
85.00
1.00
17.15
0.00
2.77
0.00
3.27
9.49
0.01
84.46
1.20
17.32
0.04
2.47
14.70
9.17
41.99
1.73
29.94
1.40
17.86
0.05
2.34
14.97
8.40
37.85
1.82
34.62
1.60
18.72
0.05
3.13
16.17
10.00
36.64
2.96
31.09
1.80
19.45
0.07
2.55
15.62
10.31
29.30
3.37
38.84
2.00
18.14
0.09
1.58
17.48
9.05
17.53
6.09
48.27
Table
A.7:Summary
ofcalculated
Tota
lPressure
Calibra
tion
percentuncertainty
forconfigura
tion
1.
Nominal
Mach
Typical
PT,cal,
psia
uP
T,cal
psia
k=
2
uP
T,cal
UPC
dueto
sP
T,bm
uP
T,cal
UPC
dueto
sP
S,bal
uP
T,cal
UPC
dueto
sP
T,arr
uP
T,cal
UPC
dueto
b PTreg
uP
T,cal
UPC
dueto
b Pinst
uP
T,cal
UPC
dueto
b PT
unif
0.25
15.21
0.00
3.34
0.00
3.71
5.81
0.00
87.14
0.40
15.24
0.00
3.26
0.00
3.71
5.79
0.00
87.24
0.60
17.28
0.00
3.15
0.00
3.58
5.39
0.00
87.88
0.80
16.99
0.00
3.19
0.00
3.54
5.38
0.00
87.89
1.00
16.77
0.00
3.21
0.00
3.46
5.29
0.00
88.04
1.20
16.94
0.11
2.36
16.96
11.38
64.41
0.62
4.27
1.40
17.52
0.12
2.11
15.99
11.03
65.46
0.56
4.84
1.60
18.44
0.13
1.72
16.03
10.42
64.95
0.46
6.42
1.80
19.28
0.15
1.85
17.05
11.33
61.04
0.59
8.14
2.00
18.19
0.21
2.93
33.43
19.85
35.31
0.81
7.67
Table
A.8:Summary
ofcalculated
Tota
lPressure
Calibra
tion
percentuncertainty
forconfigura
tion
2.
NASA/CR—2016-219411 131

Nominal
Mach
Typical
PT,cal,
psia
uP
T,cal
psia
k=
2
uP
T,cal
UPC
dueto
sP
T,bm
uP
T,cal
UPC
dueto
sP
S,bal
uP
T,cal
UPC
dueto
sP
T,arr
uP
T,cal
UPC
dueto
b PTreg
uP
T,cal
UPC
dueto
b Pinst
uP
T,cal
UPC
dueto
b PT
unif
0.25
15.58
0.00
3.03
0.00
3.50
9.19
0.00
84.28
0.40
15.74
0.00
3.02
0.00
3.39
9.16
0.00
84.43
0.60
17.98
0.00
2.61
0.00
3.05
7.84
0.00
86.50
0.80
17.66
0.00
2.67
0.00
3.11
8.59
0.00
85.62
1.00
17.39
0.00
2.82
0.00
3.34
9.04
0.00
84.80
1.20
17.58
0.06
1.38
6.82
5.61
66.32
1.68
18.20
1.40
18.19
0.06
1.31
7.14
6.01
65.82
1.61
18.11
1.60
19.13
0.08
1.55
7.78
5.66
60.66
1.40
22.95
1.80
19.91
0.10
1.62
7.63
6.70
46.64
1.66
35.74
2.00
18.16
0.11
1.36
11.12
7.98
37.61
3.86
38.08
Table
A.9:Summary
ofcalculated
Tota
lPressure
Calibra
tion
percentuncertainty
forconfigura
tion
3.
Nominal
Mach
Typical
PT,cal,
psia
uP
T,cal
psia
k=
2
uP
T,cal
UPC
dueto
sP
T,bm
uP
T,cal
UPC
dueto
sP
S,bal
uP
T,cal
UPC
dueto
sP
T,arr
uP
T,cal
UPC
dueto
b PTreg
uP
T,cal
UPC
dueto
b Pinst
uP
T,cal
UPC
dueto
b PT
unif
0.25
15.56
0.00
1.77
0.00
2.01
8.32
0.00
87.90
0.40
15.74
0.00
1.78
0.00
2.01
8.19
0.00
88.02
0.60
17.94
0.00
1.62
0.00
1.88
7.43
0.01
89.06
0.80
17.64
0.00
1.69
0.00
1.93
8.05
0.00
88.32
1.00
17.35
0.00
1.66
0.00
1.96
8.09
0.00
88.29
1.20
17.52
0.05
0.81
7.60
4.48
54.67
2.15
30.29
1.40
18.08
0.06
0.87
7.33
3.91
53.13
2.21
32.55
1.60
19.07
0.07
0.75
7.46
4.07
49.58
2.64
35.50
1.80
19.82
0.08
0.77
6.74
3.82
41.02
2.92
44.72
2.00
18.23
0.10
1.27
13.26
7.79
29.68
3.96
44.04
Table
A.10:Summary
ofcalculated
Tota
lPressure
Calibra
tion
percentuncertainty
forconfigura
tion
4.
NASA/CR—2016-219411 132
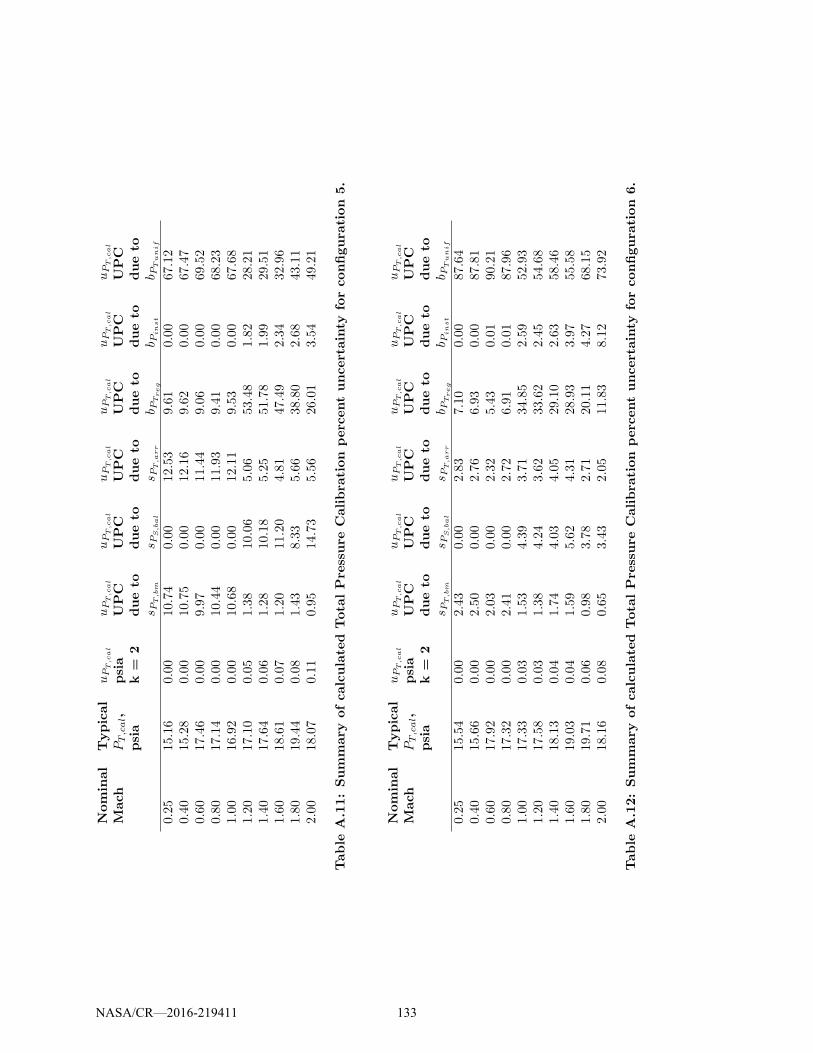
Nominal
Mach
Typical
PT,cal,
psia
uP
T,cal
psia
k=
2
uP
T,cal
UPC
dueto
sP
T,bm
uP
T,cal
UPC
dueto
sP
S,bal
uP
T,cal
UPC
dueto
sP
T,arr
uP
T,cal
UPC
dueto
b PTreg
uP
T,cal
UPC
dueto
b Pinst
uP
T,cal
UPC
dueto
b PT
unif
0.25
15.16
0.00
10.74
0.00
12.53
9.61
0.00
67.12
0.40
15.28
0.00
10.75
0.00
12.16
9.62
0.00
67.47
0.60
17.46
0.00
9.97
0.00
11.44
9.06
0.00
69.52
0.80
17.14
0.00
10.44
0.00
11.93
9.41
0.00
68.23
1.00
16.92
0.00
10.68
0.00
12.11
9.53
0.00
67.68
1.20
17.10
0.05
1.38
10.06
5.06
53.48
1.82
28.21
1.40
17.64
0.06
1.28
10.18
5.25
51.78
1.99
29.51
1.60
18.61
0.07
1.20
11.20
4.81
47.49
2.34
32.96
1.80
19.44
0.08
1.43
8.33
5.66
38.80
2.68
43.11
2.00
18.07
0.11
0.95
14.73
5.56
26.01
3.54
49.21
Table
A.11:Summary
ofcalculated
Tota
lPressure
Calibra
tion
percentuncertainty
forconfigura
tion
5.
Nominal
Mach
Typical
PT,cal,
psia
uP
T,cal
psia
k=
2
uP
T,cal
UPC
dueto
sP
T,bm
uP
T,cal
UPC
dueto
sP
S,bal
uP
T,cal
UPC
dueto
sP
T,arr
uP
T,cal
UPC
dueto
b PTreg
uP
T,cal
UPC
dueto
b Pinst
uP
T,cal
UPC
dueto
b PT
unif
0.25
15.54
0.00
2.43
0.00
2.83
7.10
0.00
87.64
0.40
15.66
0.00
2.50
0.00
2.76
6.93
0.00
87.81
0.60
17.92
0.00
2.03
0.00
2.32
5.43
0.01
90.21
0.80
17.32
0.00
2.41
0.00
2.72
6.91
0.01
87.96
1.00
17.33
0.03
1.53
4.39
3.71
34.85
2.59
52.93
1.20
17.58
0.03
1.38
4.24
3.62
33.62
2.45
54.68
1.40
18.13
0.04
1.74
4.03
4.05
29.10
2.63
58.46
1.60
19.03
0.04
1.59
5.62
4.31
28.93
3.97
55.58
1.80
19.71
0.06
0.98
3.78
2.71
20.11
4.27
68.15
2.00
18.16
0.08
0.65
3.43
2.05
11.83
8.12
73.92
Table
A.12:Summary
ofcalculated
Tota
lPressure
Calibra
tion
percentuncertainty
forconfigura
tion
6.
NASA/CR—2016-219411 133
A.3 Total Temperature Calibration
Uncertainties that contributed during total temperature calibration include the random un-certainty of the total temperature in the bellmouth (sTT,bm
), the random uncertainty of thetotal temperature on the array (sTT,arr
), random uncertainty in the total temperature calibra-tion regression (sTreg
), systematic uncertainty due to instrumentation (bTinst), and systematic
uncertainty due to total temperature uniformity (bTT,unif). During the temperature calibra-
tion, the thermocouple measurements include individual instrumentation errors as well ascorrelated errors due to their common reference.
The uncertainty flow chart is shown in Figure A.6. Uncertainty results are presented aspercent contributions as bar charts in Figure A.7 and in tabular form in Tables A.13 - A.18for all configurations. The uncertainty of the total temperature calibration is dominated bythe instrumentation uncertainty.
NASA/CR—2016-219411 134
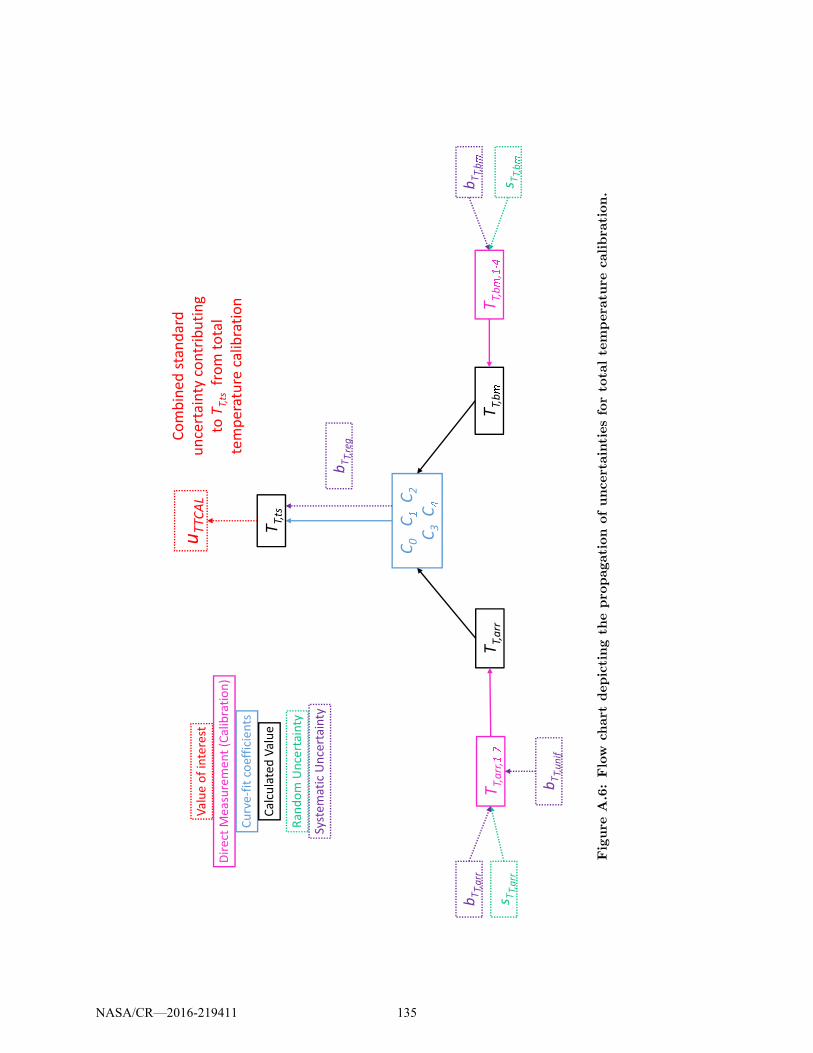
uTTCAL
TT,arr
TT,b
C0
CC2
C3C
Valueofinterest
DirectMeasurement(Calibration)
Curve-fitcoefficients
CalculatedValue
Random
Un
cert
ain
ty
Syst
em
ati
cU
nce
rta
inty
TT,b
,TT,arr,
bTT,b
�
s TT,b
�
bTT,unif
s TT,arr
bTT,arr
TT,ts
Co
mb
ine
dst
an
da
rd
un
cert
ain
tyco
ntr
ibu
tin
g
toTT,ts
fro
mto
tal
tem
pe
ratu
reca
lib
rati
on
bTT,reg
Figure
A.6:Flow
chart
depictingth
epro
pagation
ofuncertaintiesforto
taltempera
ture
calibra
tion.
NASA/CR—2016-219411 135

0.5 1 1.5 2
Mach Number
(a) Tunnel configuration 1
0
20
40
60
80
100%
Co
ntr
ibu
tio
n
0.5 1 1.5 2
Mach Number
(b) Tunnel configuration 2
0
20
40
60
80
100
% C
on
trib
uti
on
0.5 1 1.5 2
Mach Number
(c) Tunnel configuration 3
0
20
40
60
80
100
% C
on
trib
uti
on
0.5 1 1.5 2
Mach Number
(d) Tunnel configuration 4
0
20
40
60
80
100
% C
on
trib
uti
on
0.5 1 1.5 2
Mach Number
(e) Tunnel configuration 5
0
20
40
60
80
100
% C
on
trib
uti
on
0.5 1 1.5 2
Mach Number
(f) Tunnel configuration 6
0
20
40
60
80
100
% C
on
trib
uti
on
sT
T,bm
sT
T,arr
sT
reg
bT
inst
bT
unif
Figure A.7: Percent contributions from all elemental uncertainty sources to the combineduncertainty of the total temperature calibration, as a function of nominal Mach number
NASA/CR—2016-219411 136
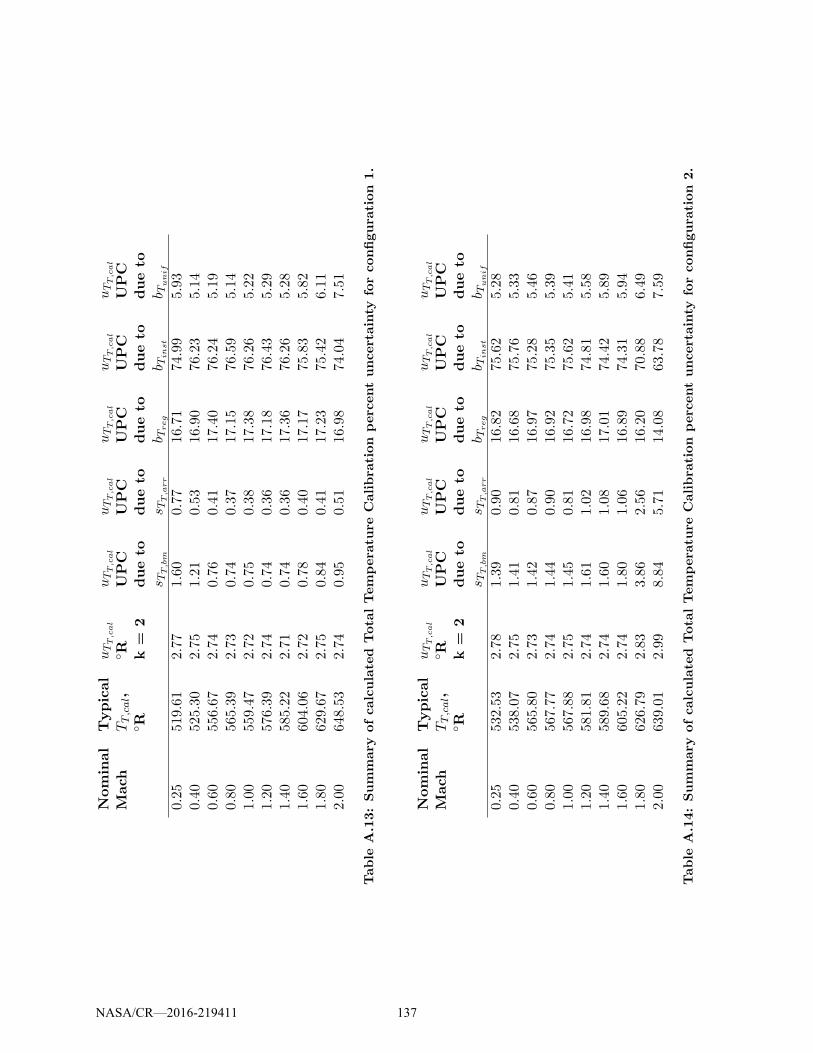
Nominal
Mach
Typical
TT,cal,
◦R
uTT,cal
◦R k=
2
uTT,cal
UPC
dueto
sTT,bm
uTT,cal
UPC
dueto
sTT,a
rr
uTT,cal
UPC
dueto
b Treg
uTT,cal
UPC
dueto
b Tin
st
uTT,cal
UPC
dueto
b Tunif
0.25
519.61
2.77
1.60
0.77
16.71
74.99
5.93
0.40
525.30
2.75
1.21
0.53
16.90
76.23
5.14
0.60
556.67
2.74
0.76
0.41
17.40
76.24
5.19
0.80
565.39
2.73
0.74
0.37
17.15
76.59
5.14
1.00
559.47
2.72
0.75
0.38
17.38
76.26
5.22
1.20
576.39
2.74
0.74
0.36
17.18
76.43
5.29
1.40
585.22
2.71
0.74
0.36
17.36
76.26
5.28
1.60
604.06
2.72
0.78
0.40
17.17
75.83
5.82
1.80
629.67
2.75
0.84
0.41
17.23
75.42
6.11
2.00
648.53
2.74
0.95
0.51
16.98
74.04
7.51
Table
A.13:Summary
ofcalculated
Tota
lTempera
ture
Calibra
tion
percentuncertainty
forconfigura
tion
1.
Nominal
Mach
Typical
TT,cal,
◦R
uTT,cal
◦R k=
2
uTT,cal
UPC
dueto
sTT,bm
uTT,cal
UPC
dueto
sTT,a
rr
uTT,cal
UPC
dueto
b Treg
uTT,cal
UPC
dueto
b Tin
st
uTT,cal
UPC
dueto
b Tunif
0.25
532.53
2.78
1.39
0.90
16.82
75.62
5.28
0.40
538.07
2.75
1.41
0.81
16.68
75.76
5.33
0.60
565.80
2.73
1.42
0.87
16.97
75.28
5.46
0.80
567.77
2.74
1.44
0.90
16.92
75.35
5.39
1.00
567.88
2.75
1.45
0.81
16.72
75.62
5.41
1.20
581.81
2.74
1.61
1.02
16.98
74.81
5.58
1.40
589.68
2.74
1.60
1.08
17.01
74.42
5.89
1.60
605.22
2.74
1.80
1.06
16.89
74.31
5.94
1.80
626.79
2.83
3.86
2.56
16.20
70.88
6.49
2.00
639.01
2.99
8.84
5.71
14.08
63.78
7.59
Table
A.14:Summary
ofcalculated
Tota
lTempera
ture
Calibra
tion
percentuncertainty
forconfigura
tion
2.
NASA/CR—2016-219411 137
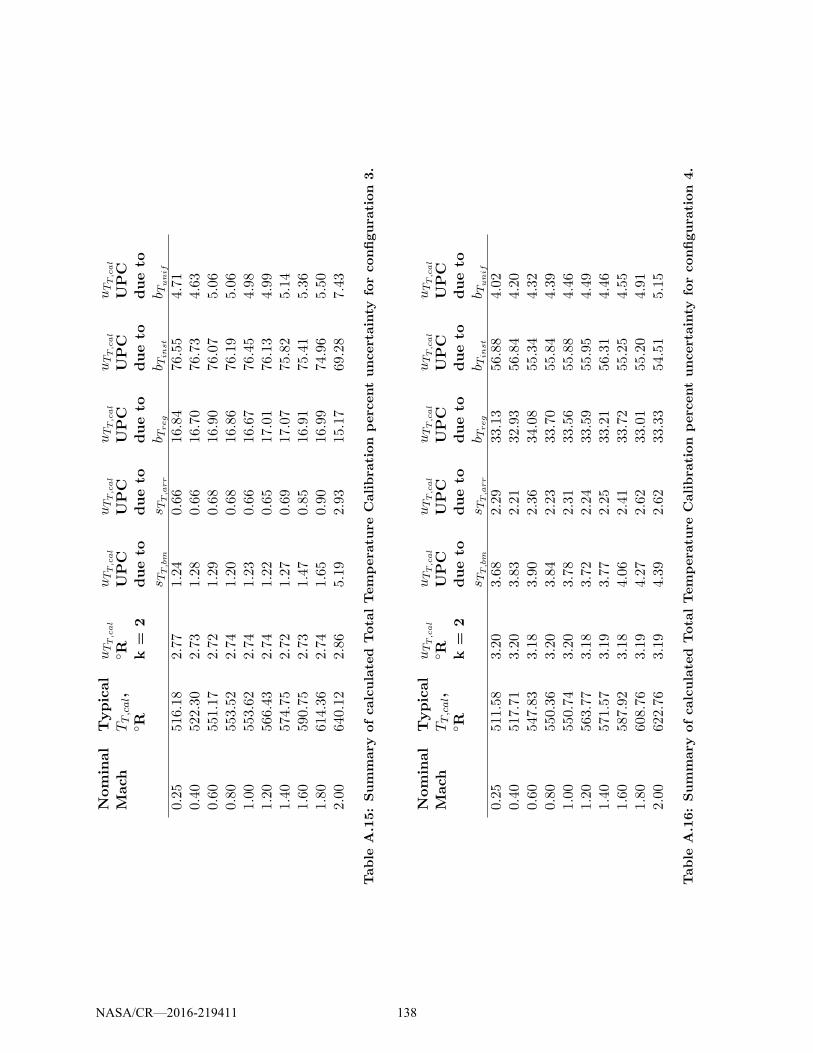
Nominal
Mach
Typical
TT,cal,
◦R
uTT,cal
◦R k=
2
uTT,cal
UPC
dueto
sTT,bm
uTT,cal
UPC
dueto
sTT,a
rr
uTT,cal
UPC
dueto
b Treg
uTT,cal
UPC
dueto
b Tin
st
uTT,cal
UPC
dueto
b Tunif
0.25
516.18
2.77
1.24
0.66
16.84
76.55
4.71
0.40
522.30
2.73
1.28
0.66
16.70
76.73
4.63
0.60
551.17
2.72
1.29
0.68
16.90
76.07
5.06
0.80
553.52
2.74
1.20
0.68
16.86
76.19
5.06
1.00
553.62
2.74
1.23
0.66
16.67
76.45
4.98
1.20
566.43
2.74
1.22
0.65
17.01
76.13
4.99
1.40
574.75
2.72
1.27
0.69
17.07
75.82
5.14
1.60
590.75
2.73
1.47
0.85
16.91
75.41
5.36
1.80
614.36
2.74
1.65
0.90
16.99
74.96
5.50
2.00
640.12
2.86
5.19
2.93
15.17
69.28
7.43
Table
A.15:Summary
ofcalculated
Tota
lTempera
ture
Calibra
tion
percentuncertainty
forconfigura
tion
3.
Nominal
Mach
Typical
TT,cal,
◦R
uTT,cal
◦R k=
2
uTT,cal
UPC
dueto
sTT,bm
uTT,cal
UPC
dueto
sTT,a
rr
uTT,cal
UPC
dueto
b Treg
uTT,cal
UPC
dueto
b Tin
st
uTT,cal
UPC
dueto
b Tunif
0.25
511.58
3.20
3.68
2.29
33.13
56.88
4.02
0.40
517.71
3.20
3.83
2.21
32.93
56.84
4.20
0.60
547.83
3.18
3.90
2.36
34.08
55.34
4.32
0.80
550.36
3.20
3.84
2.23
33.70
55.84
4.39
1.00
550.74
3.20
3.78
2.31
33.56
55.88
4.46
1.20
563.77
3.18
3.72
2.24
33.59
55.95
4.49
1.40
571.57
3.19
3.77
2.25
33.21
56.31
4.46
1.60
587.92
3.18
4.06
2.41
33.72
55.25
4.55
1.80
608.76
3.19
4.27
2.62
33.01
55.20
4.91
2.00
622.76
3.19
4.39
2.62
33.33
54.51
5.15
Table
A.16:Summary
ofcalculated
Tota
lTempera
ture
Calibra
tion
percentuncertainty
forconfigura
tion
4.
NASA/CR—2016-219411 138
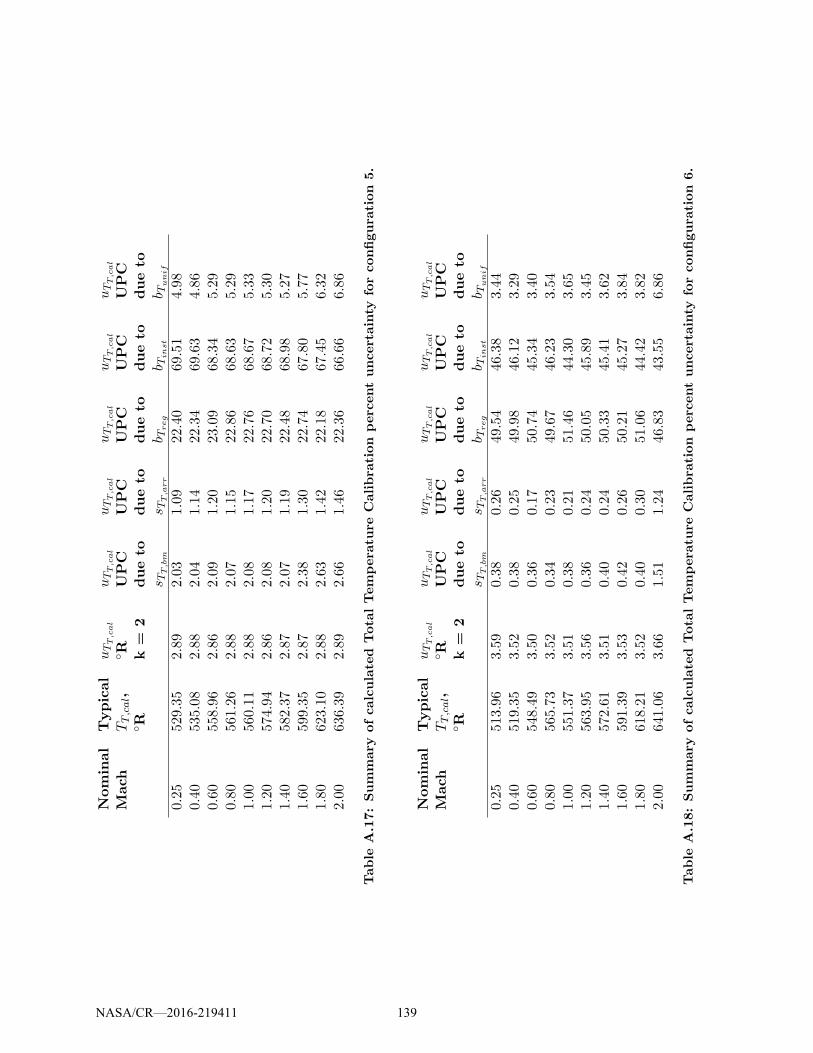
Nominal
Mach
Typical
TT,cal,
◦R
uTT,cal
◦R k=
2
uTT,cal
UPC
dueto
sTT,bm
uTT,cal
UPC
dueto
sTT,a
rr
uTT,cal
UPC
dueto
b Treg
uTT,cal
UPC
dueto
b Tin
st
uTT,cal
UPC
dueto
b Tunif
0.25
529.35
2.89
2.03
1.09
22.40
69.51
4.98
0.40
535.08
2.88
2.04
1.14
22.34
69.63
4.86
0.60
558.96
2.86
2.09
1.20
23.09
68.34
5.29
0.80
561.26
2.88
2.07
1.15
22.86
68.63
5.29
1.00
560.11
2.88
2.08
1.17
22.76
68.67
5.33
1.20
574.94
2.86
2.08
1.20
22.70
68.72
5.30
1.40
582.37
2.87
2.07
1.19
22.48
68.98
5.27
1.60
599.35
2.87
2.38
1.30
22.74
67.80
5.77
1.80
623.10
2.88
2.63
1.42
22.18
67.45
6.32
2.00
636.39
2.89
2.66
1.46
22.36
66.66
6.86
Table
A.17:Summary
ofcalculated
Tota
lTempera
ture
Calibra
tion
percentuncertainty
forconfigura
tion
5.
Nominal
Mach
Typical
TT,cal,
◦R
uTT,cal
◦R k=
2
uTT,cal
UPC
dueto
sTT,bm
uTT,cal
UPC
dueto
sTT,a
rr
uTT,cal
UPC
dueto
b Treg
uTT,cal
UPC
dueto
b Tin
st
uTT,cal
UPC
dueto
b Tunif
0.25
513.96
3.59
0.38
0.26
49.54
46.38
3.44
0.40
519.35
3.52
0.38
0.25
49.98
46.12
3.29
0.60
548.49
3.50
0.36
0.17
50.74
45.34
3.40
0.80
565.73
3.52
0.34
0.23
49.67
46.23
3.54
1.00
551.37
3.51
0.38
0.21
51.46
44.30
3.65
1.20
563.95
3.56
0.36
0.24
50.05
45.89
3.45
1.40
572.61
3.51
0.40
0.24
50.33
45.41
3.62
1.60
591.39
3.53
0.42
0.26
50.21
45.27
3.84
1.80
618.21
3.52
0.40
0.30
51.06
44.42
3.82
2.00
641.06
3.66
1.51
1.24
46.83
43.55
6.86
Table
A.18:Summary
ofcalculated
Tota
lTempera
ture
Calibra
tion
percentuncertainty
forconfigura
tion
6.
NASA/CR—2016-219411 139

Appendix B: Mach Number Uncertainty
Recall from Section 4.2 that the uncertainty in test section Mach number propagates as shownin Figures B.1 and B.2. Results for uncertainty in Mach number for configuration 1 werepresented in Section 5. Results for configurations 2-6 are presented in this Appendix. Barcharts depicting the percent contributions are shown, followed by tabulated results detailingdimensional and percent contributions for random, systematic, and total uncertainty.
NASA/CR—2016-219411 140

A0A1A2
PT,ts
PS,ts
B0B1B2B3
B4B5B6
uMts,subsonic
PT,bm,test
PS,bal,test
Φ
PS,bal,1-4
PT,bm,1-8
Pbar
s PT,bm
bPT,bm
bPbar
Valueofinterest
Calibrationcoefficients
Calculatedvalues
DirectMeasurements(Test)
Random
Un
cert
ain
ty
Syst
em
ati
cU
nce
rta
inty
uPTCAL
Un
cert
ain
ty
con
trib
uti
on
sto
PT,ts
fro
mto
tal
pre
ssu
reca
lib
rati
on
bPT,b
�
s PT,b
�
bPT,arr
s PT,arr
bPbar
bP ,c�
rr
bPT,unif
bPT,reg
uP
�
CAL
Un
cert
ain
ty
con
trib
uti
on
sto
P
�
,ts
fro
mst
ati
c
pre
ssu
reca
lib
rati
on
bP
� ,bal
s P
� ,bal
bPT,b
�
s PT,b
�
bP
�,cyl
s P
� ,cyl
bPbar
bP ,c �
rr
bP
� ,unif
bP
�,reg
s P
� ,bal
bP
� ,bal
ts,subsnic
Figure
B.1:Flow
chart
depictingth
epro
pagation
ofuncertaintiesin
Mach
numbercalculation:su
bso
nic
flow
range
NASA/CR—2016-219411 141
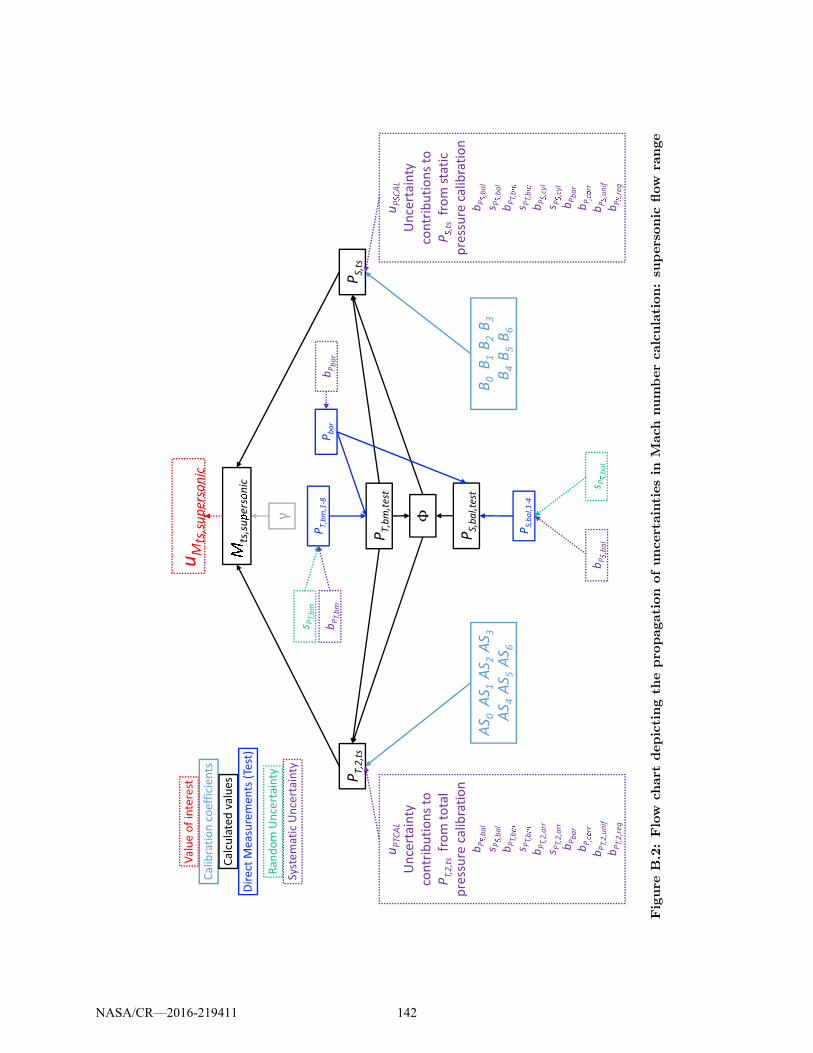
AS0AS1AS2AS3
AS4AS5AS6
PT,2,ts
PS,ts
B0B1B2B3
B4B5B6
uMts,supersonic
PT,bm,test
PS,bal,test
γ Φ
PS,bal,1-4
PT,bm,1-8
Pbar
s PT,bm
bPT,bm
bPbar
Valueofinterest
Calibrationcoefficients
Calculatedvalues
DirectMeasurements(Test)
Random
Un
cert
ain
ty
Syst
em
ati
cU
nce
rta
inty
uPTCAL
Un
cert
ain
ty
con
trib
uti
on
sto
PT,2,ts
fro
mto
tal
pre
ssu
reca
lib
rati
on
bP
� ,bal
s P
�,bal
bPT,b
�
s PT,b
�
bPT,2,arr
s PT,2,arr
bPbar
bP ,c�
rr
bPT,2,unif
bPT,2,reg
uP
�
CAL
Un
cert
ain
ty
con
trib
uti
on
sto
P
�
,ts
fro
mst
ati
c
pre
ssu
reca
lib
rati
on
bP
� ,bal
s P
�,bal
bPT,b
�
s PT,b
�
bP
�,cyl
s P
� ,cyl
bPbar
bP ,c�
rr
bP
� ,unif
bP
�,reg
s P
� ,bal
bP
� ,balts,su
ers
nic
Figure
B.2:Flow
chart
depictingth
epro
pagation
ofuncertaintiesin
Mach
numbercalculation:su
personic
flow
range
NASA/CR—2016-219411 142
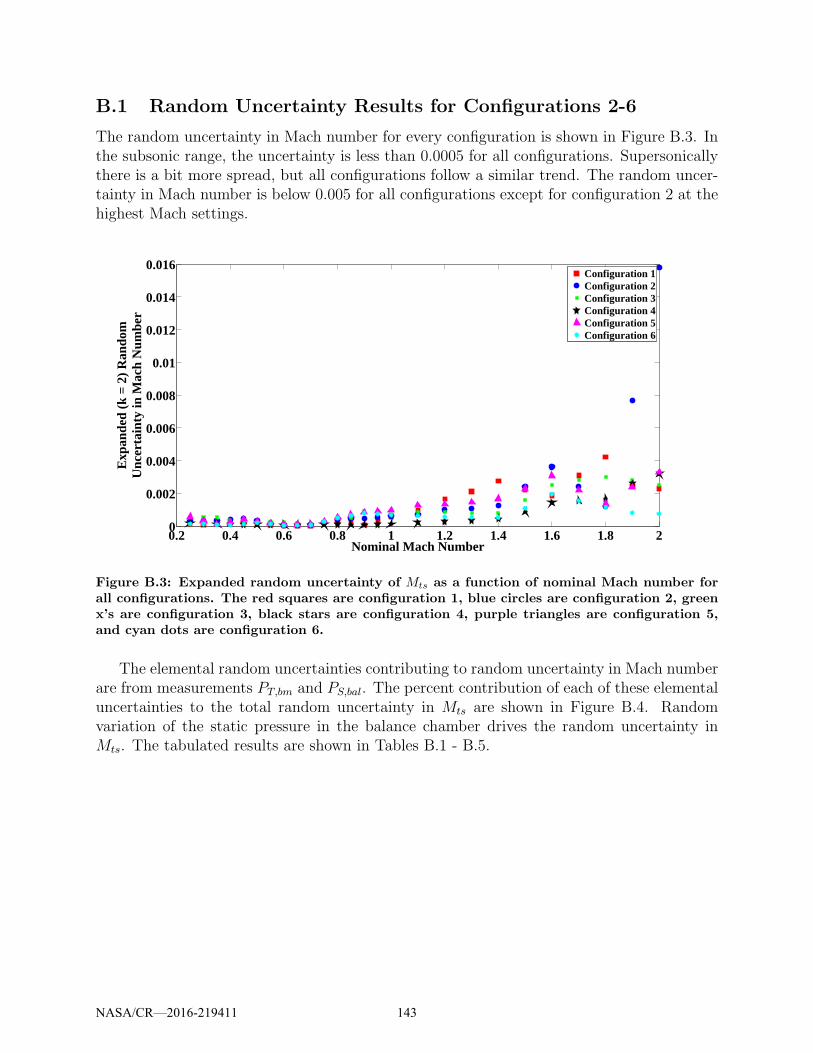
B.1 Random Uncertainty Results for Configurations 2-6
The random uncertainty in Mach number for every configuration is shown in Figure B.3. Inthe subsonic range, the uncertainty is less than 0.0005 for all configurations. Supersonicallythere is a bit more spread, but all configurations follow a similar trend. The random uncer-tainty in Mach number is below 0.005 for all configurations except for configuration 2 at thehighest Mach settings.
0.2 0.4 0.6 0.8 1 1.2 1.4 1.6 1.8 20
0.002
0.004
0.006
0.008
0.01
0.012
0.014
0.016
Nominal Mach Number
Exp
ande
d (k
= 2
) R
ando
mU
ncer
tain
ty in
Mac
h N
umbe
r
Configuration 1Configuration 2Configuration 3Configuration 4Configuration 5Configuration 6
Figure B.3: Expanded random uncertainty of Mts as a function of nominal Mach number forall configurations. The red squares are configuration 1, blue circles are configuration 2, greenx’s are configuration 3, black stars are configuration 4, purple triangles are configuration 5,and cyan dots are configuration 6.
The elemental random uncertainties contributing to random uncertainty in Mach numberare from measurements PT,bm and PS,bal. The percent contribution of each of these elementaluncertainties to the total random uncertainty in Mts are shown in Figure B.4. Randomvariation of the static pressure in the balance chamber drives the random uncertainty inMts. The tabulated results are shown in Tables B.1 - B.5.
NASA/CR—2016-219411 143
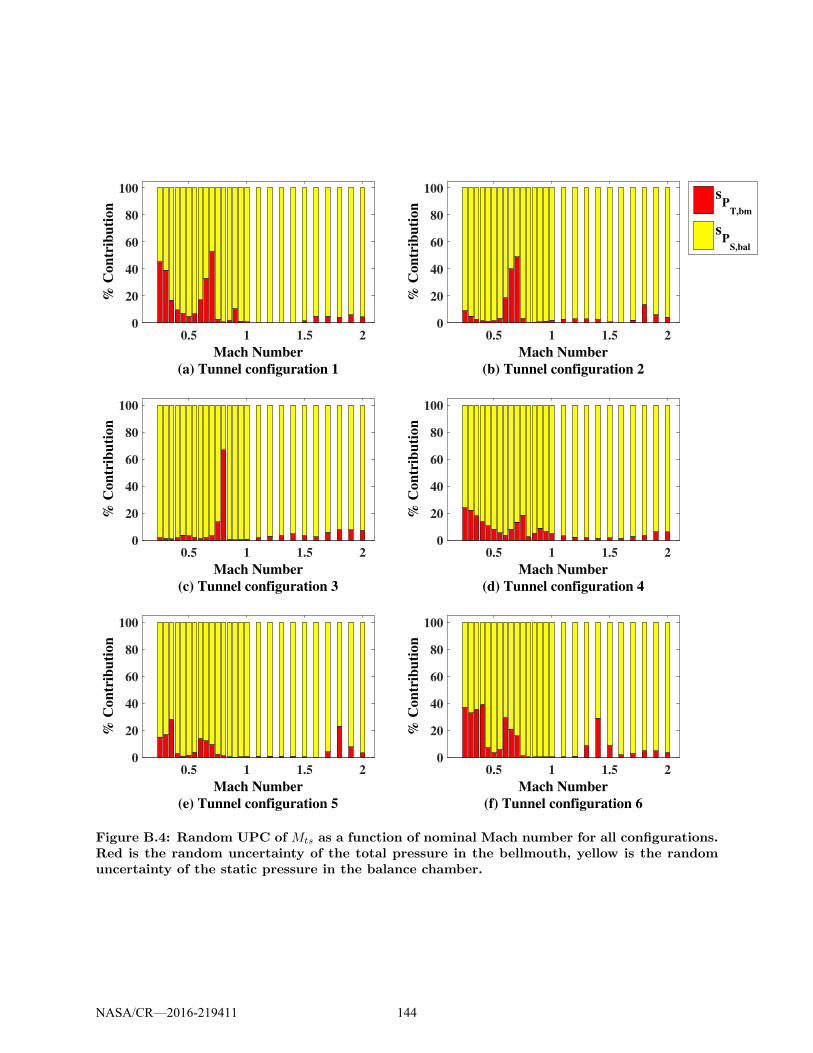
0.5 1 1.5 2
Mach Number
(a) Tunnel configuration 1
0
20
40
60
80
100
% C
on
trib
uti
on
0.5 1 1.5 2
Mach Number
(b) Tunnel configuration 2
0
20
40
60
80
100
% C
on
trib
uti
on
0.5 1 1.5 2
Mach Number
(c) Tunnel configuration 3
0
20
40
60
80
100
% C
on
trib
uti
on
0.5 1 1.5 2
Mach Number
(d) Tunnel configuration 4
0
20
40
60
80
100%
Con
trib
uti
on
0.5 1 1.5 2
Mach Number
(e) Tunnel configuration 5
0
20
40
60
80
100
% C
on
trib
uti
on
0.5 1 1.5 2
Mach Number
(f) Tunnel configuration 6
0
20
40
60
80
100
% C
on
trib
uti
on
sP
T,bm
sP
S,bal
Figure B.4: Random UPC of Mts as a function of nominal Mach number for all configurations.Red is the random uncertainty of the total pressure in the bellmouth, yellow is the randomuncertainty of the static pressure in the balance chamber.
NASA/CR—2016-219411 144
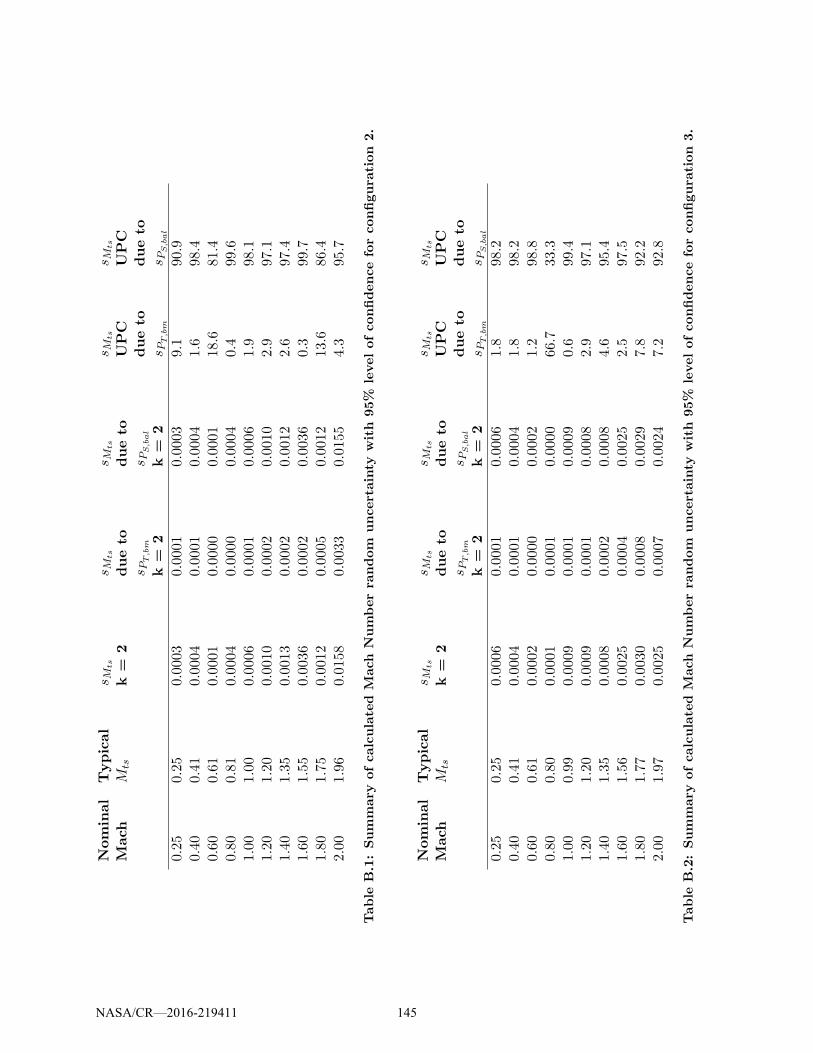
Nominal
Mach
Typical
Mts
sM
ts
k=
2sM
ts
dueto
sPT,bm
k=
2
sM
ts
dueto
sPS,bal
k=
2
sM
ts
UPC
dueto
sPT,bm
sM
ts
UPC
dueto
sPS,bal
0.25
0.25
0.0003
0.0001
0.0003
9.1
90.9
0.40
0.41
0.0004
0.0001
0.0004
1.6
98.4
0.60
0.61
0.0001
0.0000
0.0001
18.6
81.4
0.80
0.81
0.0004
0.0000
0.0004
0.4
99.6
1.00
1.00
0.0006
0.0001
0.0006
1.9
98.1
1.20
1.20
0.0010
0.0002
0.0010
2.9
97.1
1.40
1.35
0.0013
0.0002
0.0012
2.6
97.4
1.60
1.55
0.0036
0.0002
0.0036
0.3
99.7
1.80
1.75
0.0012
0.0005
0.0012
13.6
86.4
2.00
1.96
0.0158
0.0033
0.0155
4.3
95.7
Table
B.1:Summary
ofcalculated
Mach
Numberra
ndom
uncertainty
with
95%
levelofconfidenceforconfigura
tion
2.
Nominal
Mach
Typical
Mts
sM
ts
k=
2sM
ts
dueto
sPT,bm
k=
2
sM
ts
dueto
sPS,bal
k=
2
sM
ts
UPC
dueto
sPT,bm
sM
ts
UPC
dueto
sPS,bal
0.25
0.25
0.0006
0.0001
0.0006
1.8
98.2
0.40
0.41
0.0004
0.0001
0.0004
1.8
98.2
0.60
0.61
0.0002
0.0000
0.0002
1.2
98.8
0.80
0.80
0.0001
0.0001
0.0000
66.7
33.3
1.00
0.99
0.0009
0.0001
0.0009
0.6
99.4
1.20
1.20
0.0009
0.0001
0.0008
2.9
97.1
1.40
1.35
0.0008
0.0002
0.0008
4.6
95.4
1.60
1.56
0.0025
0.0004
0.0025
2.5
97.5
1.80
1.77
0.0030
0.0008
0.0029
7.8
92.2
2.00
1.97
0.0025
0.0007
0.0024
7.2
92.8
Table
B.2:Summary
ofcalculated
Mach
Numberra
ndom
uncertainty
with
95%
levelofconfidenceforconfigura
tion
3.
NASA/CR—2016-219411 145

Nominal
Mach
Typical
Mts
sM
ts
k=
2sM
ts
dueto
sPT,bm
k=
2
sM
ts
dueto
sPS,bal
k=
2
sM
ts
UPC
dueto
sPT,bm
sM
ts
UPC
dueto
sPS,bal
0.25
0.25
0.0002
0.0001
0.0002
24.0
76.0
0.40
0.41
0.0001
0.0000
0.0001
13.8
86.2
0.60
0.61
0.0001
0.0000
0.0001
3.6
96.4
0.80
0.81
0.0001
0.0000
0.0001
2.6
97.4
1.00
1.00
0.0001
0.0000
0.0001
4.9
95.1
1.20
1.19
0.0003
0.0000
0.0003
2.3
97.7
1.40
1.35
0.0004
0.0001
0.0004
1.4
98.6
1.60
1.56
0.0014
0.0002
0.0014
1.3
98.7
1.80
1.78
0.0017
0.0003
0.0017
3.5
96.5
2.00
1.99
0.0032
0.0008
0.0031
6.0
94.0
Table
B.3:Summary
ofcalculated
Mach
Numberra
ndom
uncertainty
with
95%
levelofconfidenceforconfigura
tion
4.
Nominal
Mach
Typical
Mts
sM
ts
k=
2sM
ts
dueto
sPT,bm
k=
2
sM
ts
dueto
sPS,bal
k=
2
sM
ts
UPC
dueto
sPT,bm
sM
ts
UPC
dueto
sPS,bal
0.25
0.25
0.0006
0.0002
0.0005
14.8
85.2
0.40
0.40
0.0003
0.0000
0.0003
2.9
97.1
0.60
0.60
0.0001
0.0000
0.0001
13.9
86.1
0.80
0.80
0.0006
0.0001
0.0005
1.3
98.7
1.00
1.00
0.0010
0.0001
0.0010
0.6
99.4
1.20
1.19
0.0013
0.0001
0.0013
0.9
99.1
1.40
1.35
0.0017
0.0002
0.0017
0.9
99.1
1.60
1.55
0.0031
0.0001
0.0031
0.2
99.8
1.80
1.77
0.0014
0.0007
0.0012
23.1
76.9
2.00
1.98
0.0033
0.0006
0.0033
3.3
96.7
Table
B.4:Summary
ofcalculated
Mach
Numberra
ndom
uncertainty
with
95%
levelofconfidenceforconfigura
tion
5.
NASA/CR—2016-219411 146
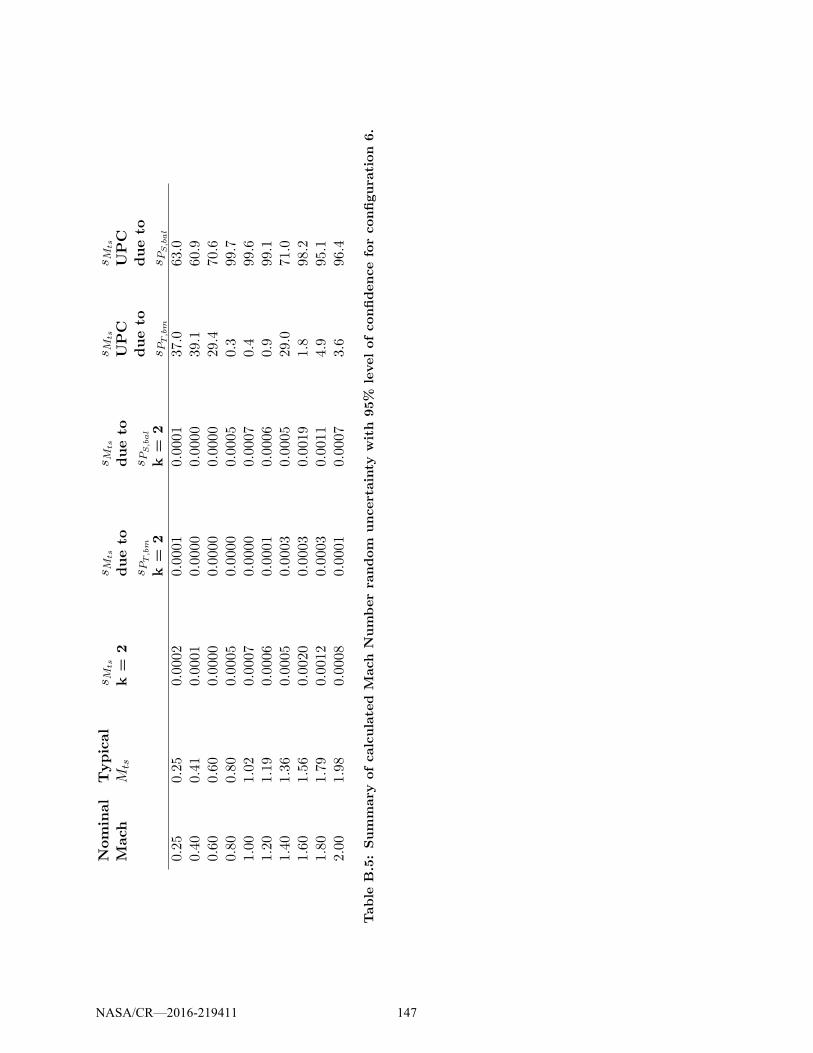
Nominal
Mach
Typical
Mts
sM
ts
k=
2sM
ts
dueto
sPT,bm
k=
2
sM
ts
dueto
sPS,bal
k=
2
sM
ts
UPC
dueto
sPT,bm
sM
ts
UPC
dueto
sPS,bal
0.25
0.25
0.0002
0.0001
0.0001
37.0
63.0
0.40
0.41
0.0001
0.0000
0.0000
39.1
60.9
0.60
0.60
0.0000
0.0000
0.0000
29.4
70.6
0.80
0.80
0.0005
0.0000
0.0005
0.3
99.7
1.00
1.02
0.0007
0.0000
0.0007
0.4
99.6
1.20
1.19
0.0006
0.0001
0.0006
0.9
99.1
1.40
1.36
0.0005
0.0003
0.0005
29.0
71.0
1.60
1.56
0.0020
0.0003
0.0019
1.8
98.2
1.80
1.79
0.0012
0.0003
0.0011
4.9
95.1
2.00
1.98
0.0008
0.0001
0.0007
3.6
96.4
Table
B.5:Summary
ofcalculated
Mach
Numberra
ndom
uncertainty
with
95%
levelofconfidenceforconfigura
tion
6.
NASA/CR—2016-219411 147
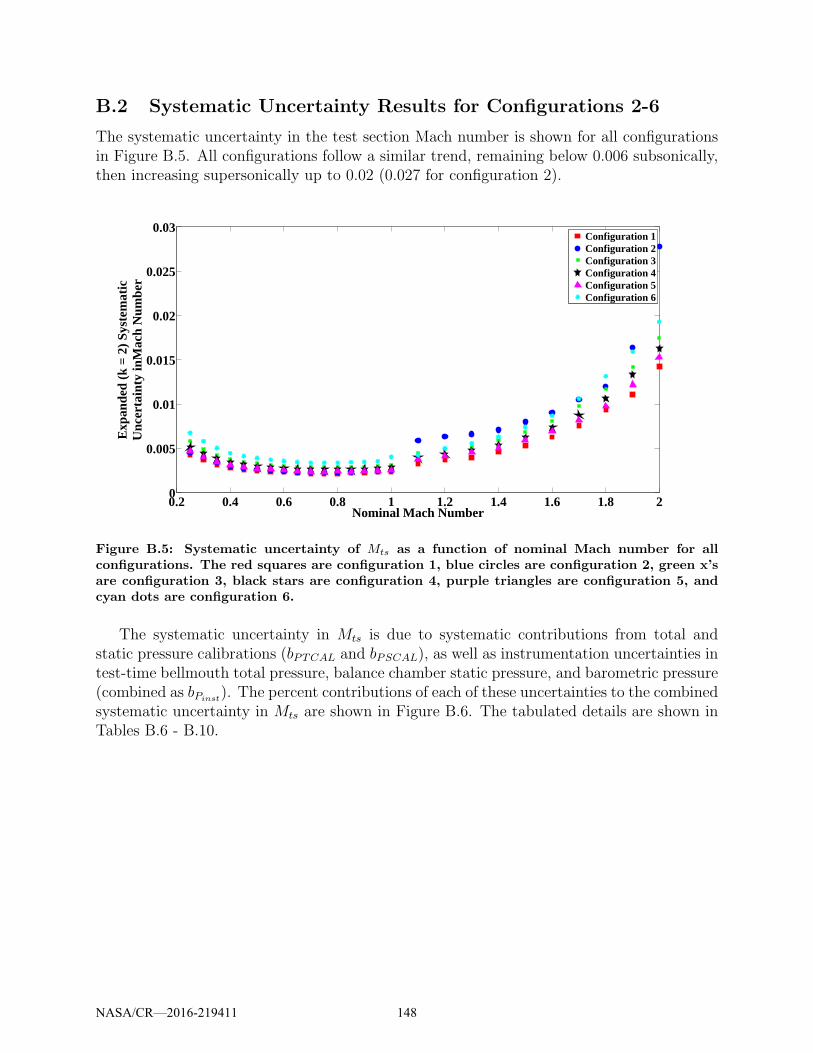
B.2 Systematic Uncertainty Results for Configurations 2-6
The systematic uncertainty in the test section Mach number is shown for all configurationsin Figure B.5. All configurations follow a similar trend, remaining below 0.006 subsonically,then increasing supersonically up to 0.02 (0.027 for configuration 2).
0.2 0.4 0.6 0.8 1 1.2 1.4 1.6 1.8 20
0.005
0.01
0.015
0.02
0.025
0.03
Nominal Mach Number
Exp
ande
d (k
= 2
) S
yste
mat
icU
ncer
tain
ty in
Mac
h N
umbe
r
Configuration 1Configuration 2Configuration 3Configuration 4Configuration 5Configuration 6
Figure B.5: Systematic uncertainty of Mts as a function of nominal Mach number for allconfigurations. The red squares are configuration 1, blue circles are configuration 2, green x’sare configuration 3, black stars are configuration 4, purple triangles are configuration 5, andcyan dots are configuration 6.
The systematic uncertainty in Mts is due to systematic contributions from total andstatic pressure calibrations (bPTCAL and bPSCAL), as well as instrumentation uncertainties intest-time bellmouth total pressure, balance chamber static pressure, and barometric pressure(combined as bPinst
). The percent contributions of each of these uncertainties to the combinedsystematic uncertainty in Mts are shown in Figure B.6. The tabulated details are shown inTables B.6 - B.10.
NASA/CR—2016-219411 148

0.5 1 1.5 2
Mach Number
(a) Tunnel configuration 1
0
20
40
60
80
100
% C
on
trib
uti
on
0.5 1 1.5 2
Mach Number
(b) Tunnel configuration 2
0
20
40
60
80
100
% C
on
trib
uti
on
0.5 1 1.5 2
Mach Number
(c) Tunnel configuration 3
0
20
40
60
80
100
% C
on
trib
uti
on
0.5 1 1.5 2
Mach Number
(d) Tunnel configuration 4
0
20
40
60
80
100
% C
on
trib
uti
on
0.5 1 1.5 2
Mach Number
(e) Tunnel configuration 5
0
20
40
60
80
100
% C
on
trib
uti
on
0.5 1 1.5 2
Mach Number
(f) Tunnel configuration 6
0
20
40
60
80
100
% C
on
trib
uti
on
bP
inst
bPSCAL
bPTCAL
Figure B.6: Systematic UPC of Mts as a function of nominal Mach number for all config-urations. Red is the systematic uncertainty due to pressure instrumentation, yellow is thesystematic uncertainty due to total pressure calibration, and black is the systematic uncer-tainty due to static pressure calibration.
NASA/CR—2016-219411 149

Nominal
Mach
Typical
Mts
b Mts
k=
2b M
ts
dueto
b PInst
k=
2
b Mts
b PSCAL
k=
2
b Mts
b PTCAL
k=
2
b Mts
UPC
dueto
b PInst
b Mts
UPC
dueto
b PSCAL
b Mts
UPC
dueto
b PTCAL
0.25
0.25
0.0046
0.0001
0.0045
0.0007
0.0
97.5
2.5
0.40
0.41
0.0030
0.0001
0.0030
0.0004
0.1
97.6
2.2
0.60
0.61
0.0024
0.0001
0.0024
0.0003
0.4
98.2
1.4
0.80
0.81
0.0023
0.0003
0.0023
0.0002
1.2
97.8
1.0
1.00
1.00
0.0025
0.0004
0.0024
0.0002
2.7
96.7
0.6
1.20
1.20
0.0064
0.0006
0.0033
0.0054
0.9
26.4
72.6
1.40
1.35
0.0071
0.0008
0.0042
0.0056
1.2
35.5
63.4
1.60
1.55
0.0090
0.0010
0.0061
0.0066
1.3
46.2
52.5
1.80
1.75
0.0120
0.0013
0.0089
0.0080
1.2
54.8
44.0
2.00
1.96
0.0278
0.0018
0.0247
0.0126
0.4
78.9
20.6
Table
B.6:Summary
ofcalculated
Mach
Numbersy
stematicuncertainty
with
95%
levelofconfidenceforconfigura
tion
2.
Nominal
Mach
Typical
Mts
b Mts
k=
2b M
ts
dueto
b PInst
k=
2
b Mts
b PSCAL
k=
2
b Mts
b PTCAL
k=
2
b Mts
UPC
dueto
b PInst
b Mts
UPC
dueto
b PSCAL
b Mts
UPC
dueto
b PTCAL
0.25
0.25
0.0058
0.0001
0.0058
0.0007
0.0
98.4
1.6
0.40
0.41
0.0038
0.0001
0.0037
0.0004
0.1
98.5
1.4
0.60
0.61
0.0030
0.0001
0.0030
0.0003
0.2
98.9
0.9
0.80
0.80
0.0029
0.0002
0.0028
0.0002
0.7
98.7
0.6
1.00
0.99
0.0031
0.0004
0.0030
0.0002
1.6
98.0
0.4
1.20
1.20
0.0049
0.0006
0.0039
0.0029
1.5
63.9
34.6
1.40
1.35
0.0060
0.0008
0.0051
0.0030
1.6
72.6
25.9
1.60
1.56
0.0081
0.0010
0.0071
0.0037
1.6
77.6
20.8
1.80
1.77
0.0118
0.0013
0.0106
0.0050
1.3
80.9
17.8
2.00
1.97
0.0175
0.0015
0.0161
0.0068
0.7
84.4
14.9
Table
B.7:Summary
ofcalculated
Mach
Numbersy
stematicuncertainty
with
95%
levelofconfidenceforconfigura
tion
3.
NASA/CR—2016-219411 150
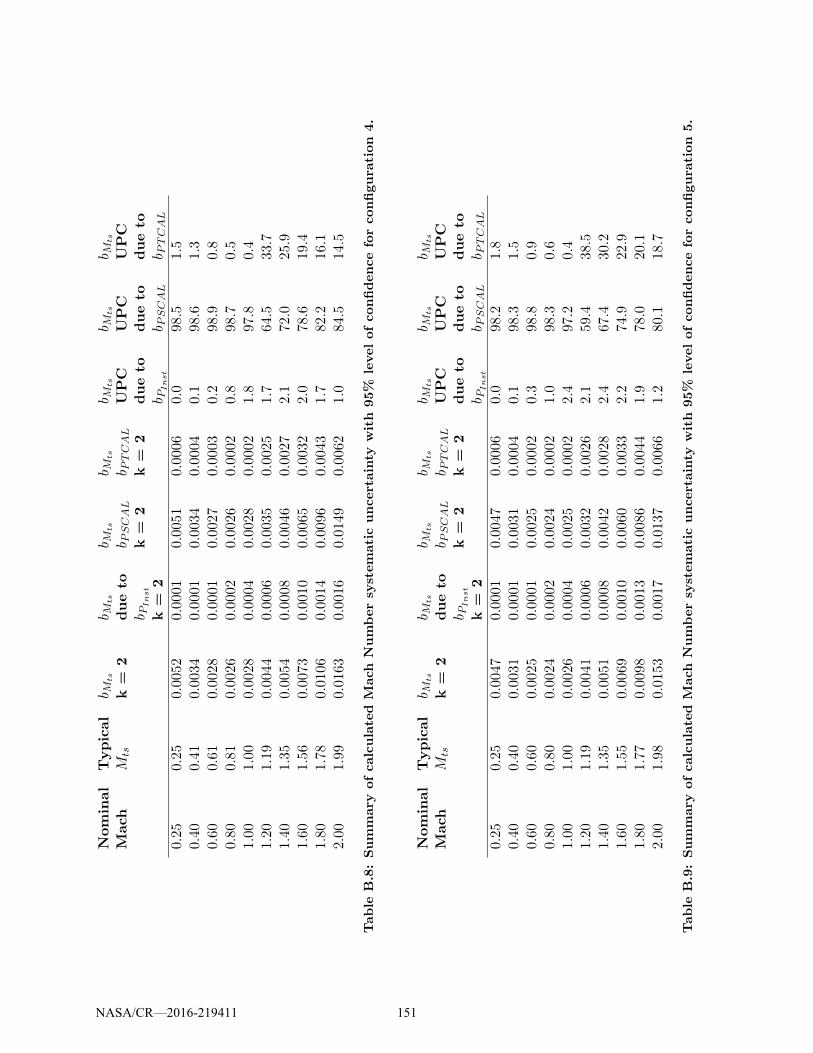
Nominal
Mach
Typical
Mts
b Mts
k=
2b M
ts
dueto
b PInst
k=
2
b Mts
b PSCAL
k=
2
b Mts
b PTCAL
k=
2
b Mts
UPC
dueto
b PInst
b Mts
UPC
dueto
b PSCAL
b Mts
UPC
dueto
b PTCAL
0.25
0.25
0.0052
0.0001
0.0051
0.0006
0.0
98.5
1.5
0.40
0.41
0.0034
0.0001
0.0034
0.0004
0.1
98.6
1.3
0.60
0.61
0.0028
0.0001
0.0027
0.0003
0.2
98.9
0.8
0.80
0.81
0.0026
0.0002
0.0026
0.0002
0.8
98.7
0.5
1.00
1.00
0.0028
0.0004
0.0028
0.0002
1.8
97.8
0.4
1.20
1.19
0.0044
0.0006
0.0035
0.0025
1.7
64.5
33.7
1.40
1.35
0.0054
0.0008
0.0046
0.0027
2.1
72.0
25.9
1.60
1.56
0.0073
0.0010
0.0065
0.0032
2.0
78.6
19.4
1.80
1.78
0.0106
0.0014
0.0096
0.0043
1.7
82.2
16.1
2.00
1.99
0.0163
0.0016
0.0149
0.0062
1.0
84.5
14.5
Table
B.8:Summary
ofcalculated
Mach
Numbersy
stematicuncertainty
with
95%
levelofconfidenceforconfigura
tion
4.
Nominal
Mach
Typical
Mts
b Mts
k=
2b M
ts
dueto
b PInst
k=
2
b Mts
b PSCAL
k=
2
b Mts
b PTCAL
k=
2
b Mts
UPC
dueto
b PInst
b Mts
UPC
dueto
b PSCAL
b Mts
UPC
dueto
b PTCAL
0.25
0.25
0.0047
0.0001
0.0047
0.0006
0.0
98.2
1.8
0.40
0.40
0.0031
0.0001
0.0031
0.0004
0.1
98.3
1.5
0.60
0.60
0.0025
0.0001
0.0025
0.0002
0.3
98.8
0.9
0.80
0.80
0.0024
0.0002
0.0024
0.0002
1.0
98.3
0.6
1.00
1.00
0.0026
0.0004
0.0025
0.0002
2.4
97.2
0.4
1.20
1.19
0.0041
0.0006
0.0032
0.0026
2.1
59.4
38.5
1.40
1.35
0.0051
0.0008
0.0042
0.0028
2.4
67.4
30.2
1.60
1.55
0.0069
0.0010
0.0060
0.0033
2.2
74.9
22.9
1.80
1.77
0.0098
0.0013
0.0086
0.0044
1.9
78.0
20.1
2.00
1.98
0.0153
0.0017
0.0137
0.0066
1.2
80.1
18.7
Table
B.9:Summary
ofcalculated
Mach
Numbersy
stematicuncertainty
with
95%
levelofconfidenceforconfigura
tion
5.
NASA/CR—2016-219411 151
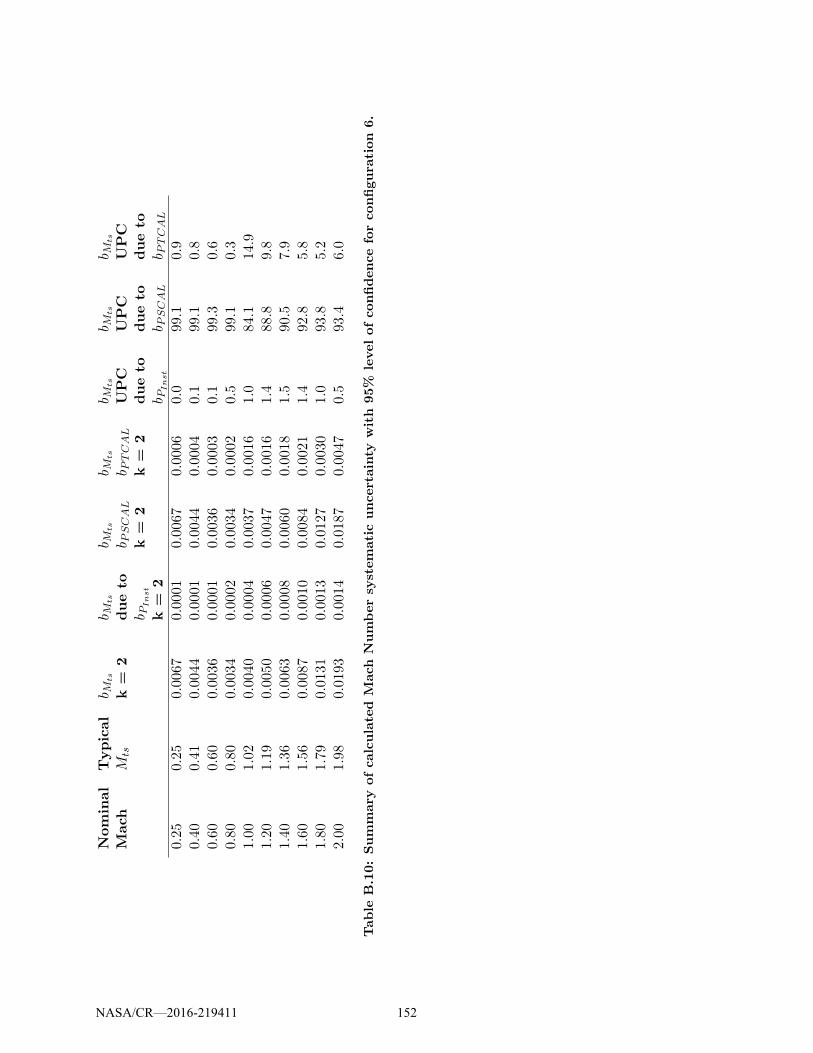
Nominal
Mach
Typical
Mts
b Mts
k=
2b M
ts
dueto
b PInst
k=
2
b Mts
b PSCAL
k=
2
b Mts
b PTCAL
k=
2
b Mts
UPC
dueto
b PInst
b Mts
UPC
dueto
b PSCAL
b Mts
UPC
dueto
b PTCAL
0.25
0.25
0.0067
0.0001
0.0067
0.0006
0.0
99.1
0.9
0.40
0.41
0.0044
0.0001
0.0044
0.0004
0.1
99.1
0.8
0.60
0.60
0.0036
0.0001
0.0036
0.0003
0.1
99.3
0.6
0.80
0.80
0.0034
0.0002
0.0034
0.0002
0.5
99.1
0.3
1.00
1.02
0.0040
0.0004
0.0037
0.0016
1.0
84.1
14.9
1.20
1.19
0.0050
0.0006
0.0047
0.0016
1.4
88.8
9.8
1.40
1.36
0.0063
0.0008
0.0060
0.0018
1.5
90.5
7.9
1.60
1.56
0.0087
0.0010
0.0084
0.0021
1.4
92.8
5.8
1.80
1.79
0.0131
0.0013
0.0127
0.0030
1.0
93.8
5.2
2.00
1.98
0.0193
0.0014
0.0187
0.0047
0.5
93.4
6.0
Table
B.10:Summary
ofcalculated
Mach
Numbersy
stematicuncertainty
with
95%
levelofconfidenceforconfigura
tion
6.
NASA/CR—2016-219411 152
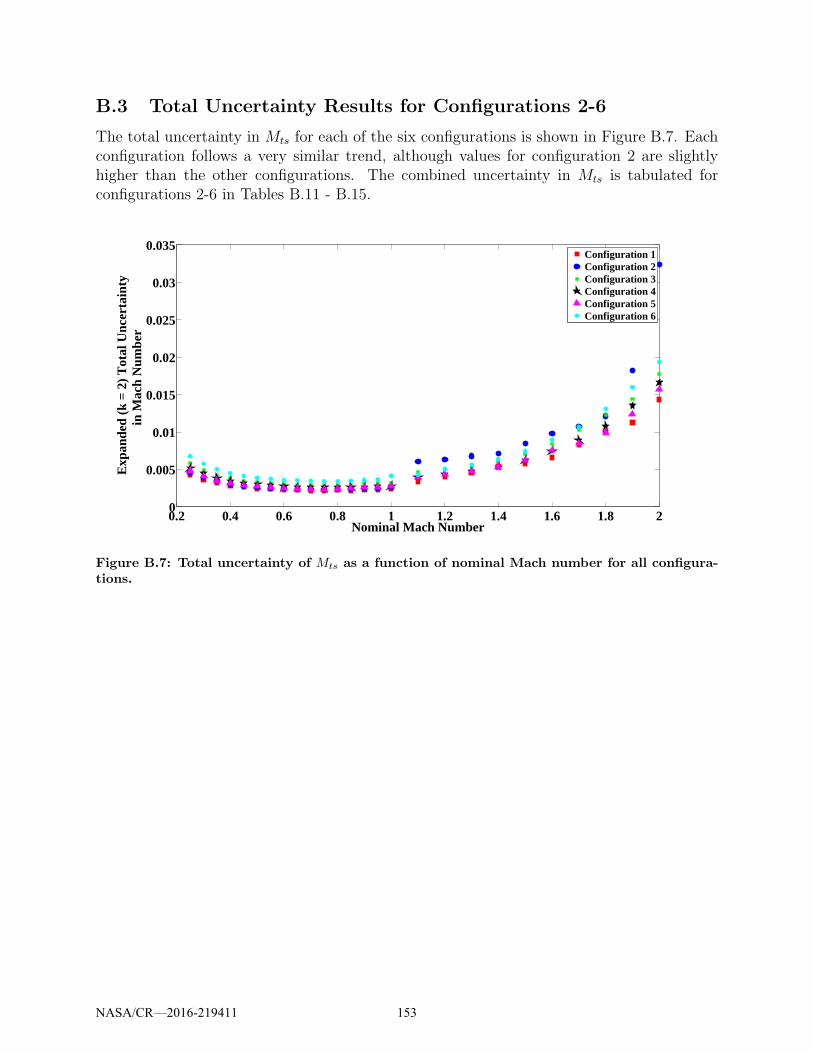
B.3 Total Uncertainty Results for Configurations 2-6
The total uncertainty in Mts for each of the six configurations is shown in Figure B.7. Eachconfiguration follows a very similar trend, although values for configuration 2 are slightlyhigher than the other configurations. The combined uncertainty in Mts is tabulated forconfigurations 2-6 in Tables B.11 - B.15.
0.2 0.4 0.6 0.8 1 1.2 1.4 1.6 1.8 20
0.005
0.01
0.015
0.02
0.025
0.03
0.035
Nominal Mach Number
Exp
ande
d (k
= 2
) T
otal
Unc
erta
inty
in M
ach
Num
ber
Configuration 1Configuration 2Configuration 3Configuration 4Configuration 5Configuration 6
Figure B.7: Total uncertainty of Mts as a function of nominal Mach number for all configura-tions.
NASA/CR—2016-219411 153
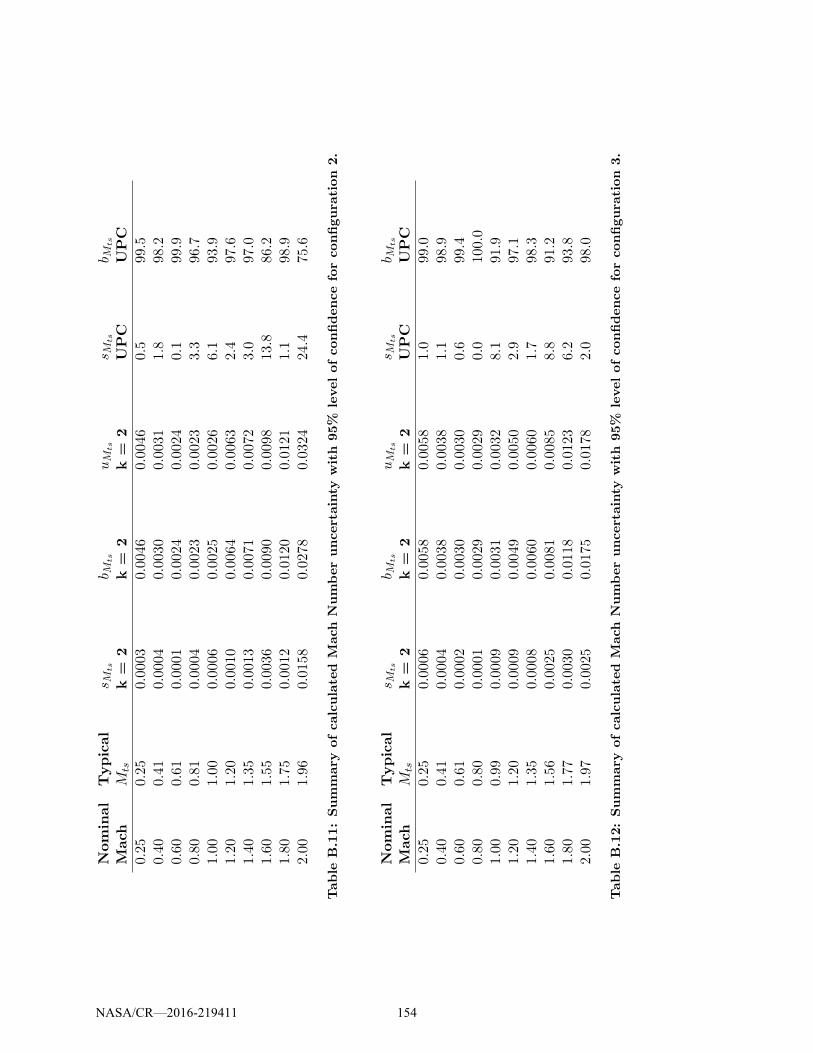
Nominal
Mach
Typical
Mts
sM
ts
k=
2b M
ts
k=
2uM
ts
k=
2sM
ts
UPC
b Mts
UPC
0.25
0.25
0.0003
0.0046
0.0046
0.5
99.5
0.40
0.41
0.0004
0.0030
0.0031
1.8
98.2
0.60
0.61
0.0001
0.0024
0.0024
0.1
99.9
0.80
0.81
0.0004
0.0023
0.0023
3.3
96.7
1.00
1.00
0.0006
0.0025
0.0026
6.1
93.9
1.20
1.20
0.0010
0.0064
0.0063
2.4
97.6
1.40
1.35
0.0013
0.0071
0.0072
3.0
97.0
1.60
1.55
0.0036
0.0090
0.0098
13.8
86.2
1.80
1.75
0.0012
0.0120
0.0121
1.1
98.9
2.00
1.96
0.0158
0.0278
0.0324
24.4
75.6
Table
B.11:Summary
ofcalculated
Mach
Numberuncertainty
with
95%
levelofconfidenceforconfigura
tion
2.
Nominal
Mach
Typical
Mts
sM
ts
k=
2b M
ts
k=
2uM
ts
k=
2sM
ts
UPC
b Mts
UPC
0.25
0.25
0.0006
0.0058
0.0058
1.0
99.0
0.40
0.41
0.0004
0.0038
0.0038
1.1
98.9
0.60
0.61
0.0002
0.0030
0.0030
0.6
99.4
0.80
0.80
0.0001
0.0029
0.0029
0.0
100.0
1.00
0.99
0.0009
0.0031
0.0032
8.1
91.9
1.20
1.20
0.0009
0.0049
0.0050
2.9
97.1
1.40
1.35
0.0008
0.0060
0.0060
1.7
98.3
1.60
1.56
0.0025
0.0081
0.0085
8.8
91.2
1.80
1.77
0.0030
0.0118
0.0123
6.2
93.8
2.00
1.97
0.0025
0.0175
0.0178
2.0
98.0
Table
B.12:Summary
ofcalculated
Mach
Numberuncertainty
with
95%
levelofconfidenceforconfigura
tion
3.
NASA/CR—2016-219411 154

Nominal
Mach
Typical
Mts
sM
ts
k=
2b M
ts
k=
2uM
ts
k=
2sM
ts
UPC
b Mts
UPC
0.25
0.25
0.0002
0.0052
0.0052
0.1
99.9
0.40
0.41
0.0001
0.0034
0.0034
0.1
99.9
0.60
0.61
0.0001
0.0028
0.0027
0.1
99.9
0.80
0.81
0.0001
0.0026
0.0026
0.2
99.8
1.00
1.00
0.0001
0.0028
0.0028
0.3
99.7
1.20
1.19
0.0003
0.0044
0.0044
0.4
99.6
1.40
1.35
0.0004
0.0054
0.0054
0.7
99.3
1.60
1.56
0.0014
0.0073
0.0075
3.7
96.3
1.80
1.78
0.0017
0.0106
0.0108
2.4
97.6
2.00
1.99
0.0032
0.0163
0.0166
3.8
96.2
Table
B.13:Summary
ofcalculated
Mach
Numberuncertainty
with
95%
levelofconfidenceforconfigura
tion
4.
Nominal
Mach
Typical
Mts
sM
ts
k=
2b M
ts
k=
2uM
ts
k=
2sM
ts
UPC
b Mts
UPC
0.25
0.25
0.0006
0.0047
0.0048
1.5
98.5
0.40
0.40
0.0003
0.0031
0.0031
0.7
99.3
0.60
0.60
0.0001
0.0025
0.0025
0.2
99.8
0.80
0.80
0.0006
0.0024
0.0024
5.0
95.0
1.00
1.00
0.0010
0.0026
0.0027
13.0
87.0
1.20
1.19
0.0013
0.0041
0.0044
9.5
90.5
1.40
1.35
0.0017
0.0051
0.0054
9.9
90.1
1.60
1.55
0.0031
0.0069
0.0076
16.5
83.5
1.80
1.77
0.0014
0.0098
0.0099
1.9
98.1
2.00
1.98
0.0033
0.0153
0.0157
4.5
95.5
Table
B.14:Summary
ofcalculated
Mach
Numberuncertainty
with
95%
levelofconfidenceforconfigura
tion
5.
NASA/CR—2016-219411 155
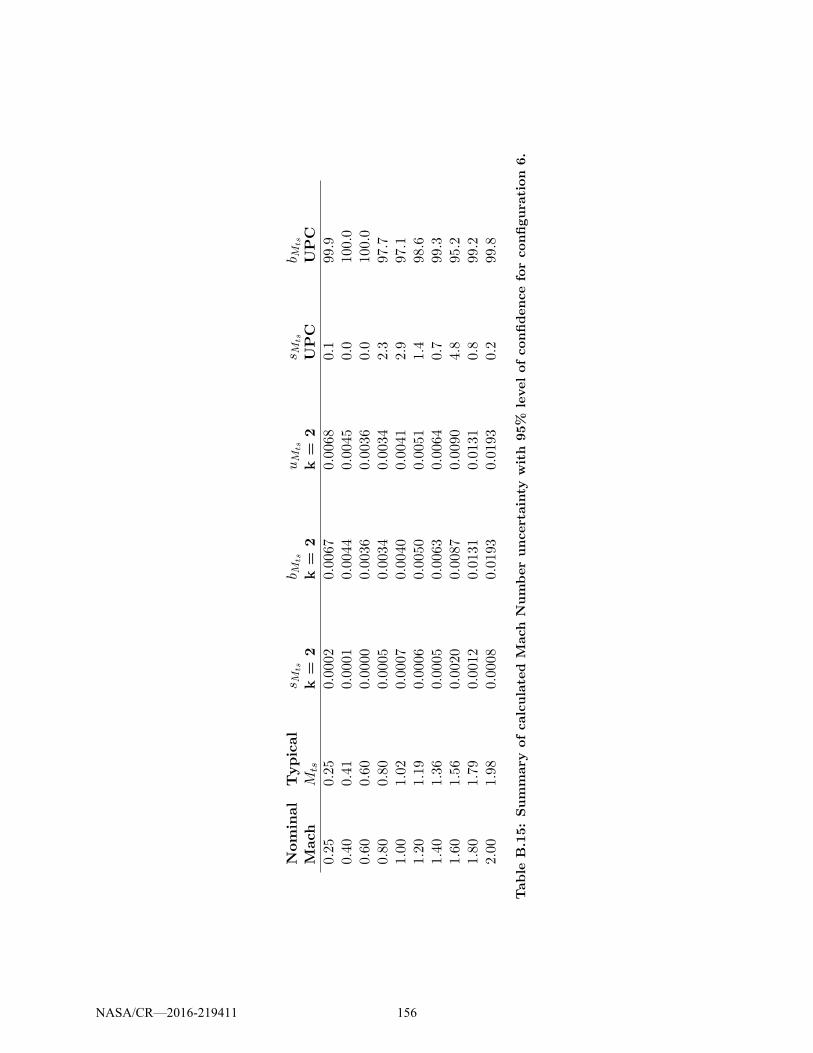
Nominal
Mach
Typical
Mts
sM
ts
k=
2b M
ts
k=
2uM
ts
k=
2sM
ts
UPC
b Mts
UPC
0.25
0.25
0.0002
0.0067
0.0068
0.1
99.9
0.40
0.41
0.0001
0.0044
0.0045
0.0
100.0
0.60
0.60
0.0000
0.0036
0.0036
0.0
100.0
0.80
0.80
0.0005
0.0034
0.0034
2.3
97.7
1.00
1.02
0.0007
0.0040
0.0041
2.9
97.1
1.20
1.19
0.0006
0.0050
0.0051
1.4
98.6
1.40
1.36
0.0005
0.0063
0.0064
0.7
99.3
1.60
1.56
0.0020
0.0087
0.0090
4.8
95.2
1.80
1.79
0.0012
0.0131
0.0131
0.8
99.2
2.00
1.98
0.0008
0.0193
0.0193
0.2
99.8
Table
B.15:Summary
ofcalculated
Mach
Numberuncertainty
with
95%
levelofconfidenceforconfigura
tion
6.
NASA/CR—2016-219411 156

Appendix C: Static Pressure Uncertainty
The uncertainty from measured values to test section static pressure propagates as shown inFigure C.1. Results for uncertainty in test section static pressure for configuration 1 werepresented in Section 5. Results for configurations 2-6 are presented in this Appendix. Barcharts depicting the percent contributions are shown, followed by tabulated results detailingdimensional and percent contributions for random, systematic, and total uncertainty.
NASA/CR—2016-219411 157
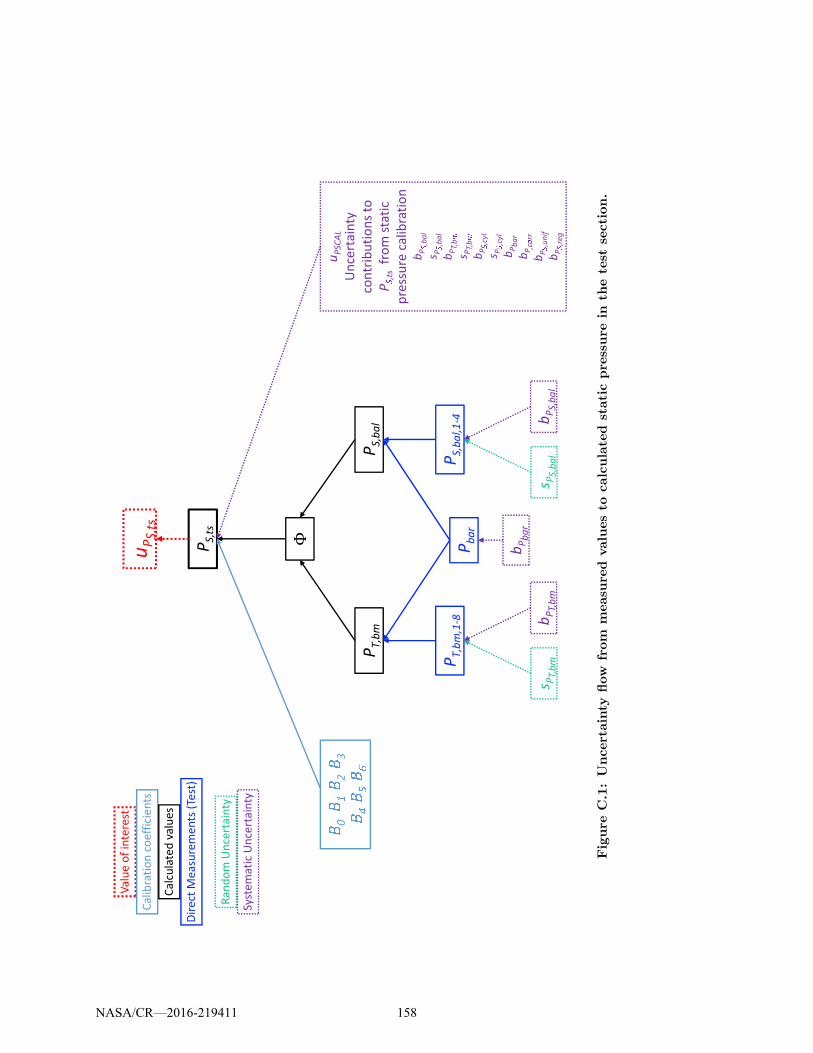
uPS,ts
Valueofinterest
Calibrationcoefficients
Calculatedvalues
DirectMeasurements(Test)
Random
Un
cert
ain
ty
Syst
em
ati
cU
nce
rta
inty
PT,bm
PT,bm,1-8
Pbar
s PT,bm
bPT,bm
bPbar
PS,ts
PS,bal
PS,bal,1-4
s PS,bal
bPS,bal
uPSCAL
Un
cert
ain
ty
con
trib
uti
on
sto
P
�
,ts
fro
mst
ati
c
pre
ssu
reca
lib
rati
on
bP
� ,bal
s P
�,bal
bPT,b
�
s PT,b
�
bP
�,cyl
s P
� ,cyl
bPbar
bP ,c�
rr
bP
� ,unif
bP
�,reg
Φ
02
3
Figure
C.1:Uncertainty
flow
from
measu
red
valuesto
calculated
staticpre
ssure
inth
etest
section.
NASA/CR—2016-219411 158
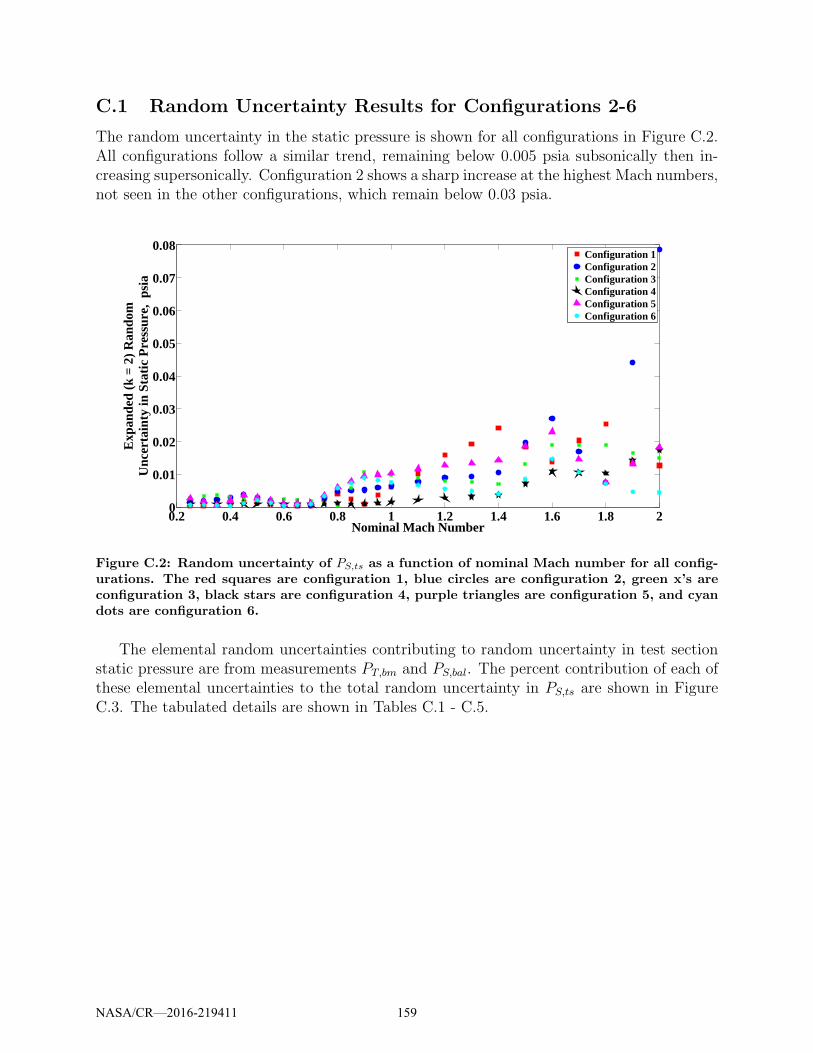
C.1 Random Uncertainty Results for Configurations 2-6
The random uncertainty in the static pressure is shown for all configurations in Figure C.2.All configurations follow a similar trend, remaining below 0.005 psia subsonically then in-creasing supersonically. Configuration 2 shows a sharp increase at the highest Mach numbers,not seen in the other configurations, which remain below 0.03 psia.
0.2 0.4 0.6 0.8 1 1.2 1.4 1.6 1.8 20
0.01
0.02
0.03
0.04
0.05
0.06
0.07
0.08
Nominal Mach Number
Exp
ande
d (k
= 2
) R
ando
mU
ncer
tain
ty in
Sta
tic P
ress
ure,
psi
a
Configuration 1Configuration 2Configuration 3Configuration 4Configuration 5Configuration 6
Figure C.2: Random uncertainty of PS,ts as a function of nominal Mach number for all config-urations. The red squares are configuration 1, blue circles are configuration 2, green x’s areconfiguration 3, black stars are configuration 4, purple triangles are configuration 5, and cyandots are configuration 6.
The elemental random uncertainties contributing to random uncertainty in test sectionstatic pressure are from measurements PT,bm and PS,bal. The percent contribution of each ofthese elemental uncertainties to the total random uncertainty in PS,ts are shown in FigureC.3. The tabulated details are shown in Tables C.1 - C.5.
NASA/CR—2016-219411 159

0.5 1 1.5 2
Mach Number
(a) Tunnel configuration 1
0
20
40
60
80
100
% C
on
trib
uti
on
0.5 1 1.5 2
Mach Number
(b) Tunnel configuration 2
0
20
40
60
80
100
% C
on
trib
uti
on
0.5 1 1.5 2
Mach Number
(c) Tunnel configuration 3
0
20
40
60
80
100
% C
on
trib
uti
on
0.5 1 1.5 2
Mach Number
(d) Tunnel configuration 4
0
20
40
60
80
100%
Con
trib
uti
on
0.5 1 1.5 2
Mach Number
(e) Tunnel configuration 5
0
20
40
60
80
100
% C
on
trib
uti
on
0.5 1 1.5 2
Mach Number
(f) Tunnel configuration 6
0
20
40
60
80
100
% C
on
trib
uti
on
sP
T,bm
sP
S,bal
Figure C.3: Random UPC of PS,ts as a function of nominal Mach number for all configurations.Red is the random uncertainty of the total pressure in the bellmouth, yellow is the randomuncertainty of the static pressure in the balance chamber.
NASA/CR—2016-219411 160

Nominal
Mach
Typical
PS,ts
psia
sP
S,ts
psia
k=
2
sP
S,ts
dueto
sP
T,bm
psia
k=
2
sP
S,ts
dueto
sP
S,bal
psia
k=
2
sP
S,ts
UPC
dueto
sP
T,bm
sP
S,ts
UPC
dueto
sP
S,bal
0.25
14.57
0.00
150.00
000.00
150.0
100.0
0.40
13.58
0.00
300.00
000.00
300.0
100.0
0.60
13.44
0.00
070.00
000.00
070.1
99.9
0.80
10.99
0.00
470.00
000.00
470.0
100.0
1.00
8.83
0.00
650.00
000.00
650.0
100.0
1.20
7.08
0.00
890.00
000.00
890.0
100.0
1.40
6.08
0.01
060.00
000.01
060.0
100.0
1.60
5.11
0.02
710.00
000.02
710.0
100.0
1.80
4.33
0.00
760.00
010.00
760.0
100.0
2.00
3.35
0.07
860.00
080.07
860.0
100.0
Table
C.1:Summary
ofcalculated
Sta
ticPressure
random
uncertainty
with
95%
levelofconfidenceforconfigura
tion
2.
Nominal
Mach
Typical
PS,ts
psia
sP
S,ts
psia
k=
2
sP
S,ts
dueto
sP
T,bm
psia
k=
2
sP
S,ts
dueto
sP
S,bal
psia
k=
2
sP
S,ts
UPC
dueto
sP
T,bm
sP
S,ts
UPC
dueto
sP
S,bal
0.25
14.94
0.00
290.00
000.00
290.0
100.0
0.40
14.03
0.00
310.00
000.00
310.0
100.0
0.60
14.03
0.00
250.00
000.00
250.0
100.0
0.80
11.53
0.00
040.00
000.00
040.1
99.9
1.00
9.30
0.00
980.00
000.00
980.0
100.0
1.20
7.29
0.00
800.00
000.00
800.0
100.0
1.40
6.30
0.00
700.00
000.00
700.0
100.0
1.60
5.26
0.01
880.00
010.01
880.0
100.0
1.80
4.39
0.01
880.00
020.01
880.0
100.0
2.00
3.31
0.01
480.00
010.01
480.0
100.0
Table
C.2:Summary
ofcalculated
Sta
ticPressure
random
uncertainty
with
95%
levelofconfidenceforconfigura
tion
3.
NASA/CR—2016-219411 161

Nominal
Mach
Typical
PS,ts
psia
sP
S,ts
psia
k=
2
sP
S,ts
dueto
sP
T,bm
psia
k=
2
sP
S,ts
dueto
sP
S,bal
psia
k=
2
sP
S,ts
UPC
dueto
sP
T,bm
sP
S,ts
UPC
dueto
sP
S,bal
0.25
14.90
0.00
090.00
000.00
090.1
99.9
0.40
14.04
0.00
090.00
000.00
090.1
99.9
0.60
13.99
0.00
090.00
000.00
090.0
100.0
0.80
11.49
0.00
120.00
000.00
120.0
100.0
1.00
9.16
0.00
150.00
000.00
150.0
100.0
1.20
7.36
0.00
280.00
000.00
280.0
100.0
1.40
6.26
0.00
380.00
000.00
380.0
100.0
1.60
5.23
0.01
080.00
010.01
080.0
100.0
1.80
4.33
0.01
030.00
010.01
030.0
100.0
2.00
3.25
0.01
740.00
010.01
740.0
100.0
Table
C.3:Summary
ofcalculated
Sta
ticPressure
random
uncertainty
with
95%
levelofconfidenceforconfigura
tion
4.
Nominal
Mach
Typical
PS,ts
psia
sP
S,ts
psia
k=
2
sP
S,ts
dueto
sP
T,bm
psia
k=
2
sP
S,ts
dueto
sP
S,bal
psia
k=
2
sP
S,ts
UPC
dueto
sP
T,bm
sP
S,ts
UPC
dueto
sP
S,bal
0.25
14.54
0.00
260.00
010.00
260.1
99.9
0.40
13.66
0.00
200.00
000.00
200.0
100.0
0.60
13.65
0.00
110.00
000.00
110.0
100.0
0.80
11.21
0.00
610.00
000.00
610.0
100.0
1.00
8.98
0.01
040.00
000.01
040.0
100.0
1.20
7.18
0.01
270.00
000.01
270.0
100.0
1.40
6.11
0.01
420.00
000.01
420.0
100.0
1.60
5.14
0.02
300.00
000.02
300.0
100.0
1.80
4.31
0.00
760.00
020.00
760.0
100.0
2.00
3.27
0.01
830.00
020.01
830.0
100.0
Table
C.4:Summary
ofcalculated
Sta
ticPressure
random
uncertainty
with
95%
levelofconfidenceforconfigura
tion
5.
NASA/CR—2016-219411 162

Nominal
Mach
Typical
PS,ts
psia
sP
S,ts
psia
k=
2
sP
S,ts
dueto
sP
T,bm
psia
k=
2
sP
S,ts
dueto
sP
S,bal
psia
k=
2
sP
S,ts
UPC
dueto
sP
T,bm
sP
S,ts
UPC
dueto
sP
S,bal
0.25
14.88
0.00
060.00
000.00
060.2
99.8
0.40
13.97
0.00
030.00
000.00
030.2
99.8
0.60
14.00
0.00
040.00
000.00
040.1
99.9
0.80
11.32
0.00
580.00
000.00
580.0
100.0
1.00
8.97
0.00
750.00
000.00
750.0
100.0
1.20
7.37
0.00
550.00
000.00
550.0
100.0
1.40
6.22
0.00
400.00
010.00
400.1
99.9
1.60
5.20
0.01
470.00
010.01
470.0
100.0
1.80
4.28
0.00
720.00
010.00
720.0
100.0
2.00
3.29
0.00
440.00
000.00
440.0
100.0
Table
C.5:Summary
ofcalculated
Sta
ticPressure
random
uncertainty
with
95%
levelofconfidenceforconfigura
tion
6.
NASA/CR—2016-219411 163

C.2 Systematic Uncertainty Results for Configurations 2-6
The systematic uncertainty in the test section static pressure is shown for all configurationsin Figure C.4. All configurations follow a similar trend, although configuration 6 is notablyhigher at all Mach numbers.
0.2 0.4 0.6 0.8 1 1.2 1.4 1.6 1.8 20
0.01
0.02
0.03
0.04
0.05
0.06
0.07
0.08
Nominal Mach Number
Exp
ande
d (k
= 2
) S
yste
mat
ic
Unc
erta
inty
inS
tatic
Pre
ssur
e, p
sia
Configuration 1Configuration 2Configuration 3Configuration 4Configuration 5Configuration 6
Figure C.4: Systematic uncertainty of PS,ts as a function of nominal Mach number for allconfigurations. The red squares are configuration 1, blue circles are configuration 2, green x’sare configuration 3, black stars are configuration 4, purple triangles are configuration 5, andcyan dots are configuration 6.
The systematic uncertainty in PS,ts is due to systematic contributions from static pressurecalibration (bPSCAL) and instrumentation uncertainties in test-time bellmouth total pressure,balance chamber static pressure, and barometric pressure (combined as bPinst
). The percentcontributions of each of these uncertainties to the combined systematic uncertainty in PS,ts
are shown in Figure C.5. The tabulated details are shown in Tables C.6 - C.10.
C.3 Total Uncertainty Results for Configurations 2-6
The overall uncertainty in PS,ts for all configurations is shown in Figure C.6. The plotsfollow a general trend, especially subsonically, although there is a noticeable difference inmagnitude particularly for configuration 6. The overall uncertainty in PS,ts is presented forconfigurations 2-6 in Tables C.11 - C.15.
NASA/CR—2016-219411 164

0.5 1 1.5 2
Mach Number
(a) Tunnel configuration 1
0
20
40
60
80
100
% C
on
trib
uti
on
0.5 1 1.5 2
Mach Number
(b) Tunnel configuration 2
0
20
40
60
80
100
% C
on
trib
uti
on
0.5 1 1.5 2
Mach Number
(c) Tunnel configuration 3
0
20
40
60
80
100
% C
on
trib
uti
on
0.5 1 1.5 2
Mach Number
(d) Tunnel configuration 4
0
20
40
60
80
100%
Con
trib
uti
on
0.5 1 1.5 2
Mach Number
(e) Tunnel configuration 5
0
20
40
60
80
100
% C
on
trib
uti
on
0.5 1 1.5 2
Mach Number
(f) Tunnel configuration 6
0
20
40
60
80
100
% C
on
trib
uti
on
bP
inst
bPSCAL
Figure C.5: Systematic UPC of PS,ts as a function of nominal Mach number for all configu-rations. Red is the systematic uncertainty due to pressure instrumentation and black is thesystematic uncertainty due to static pressure calibration.
NASA/CR—2016-219411 165
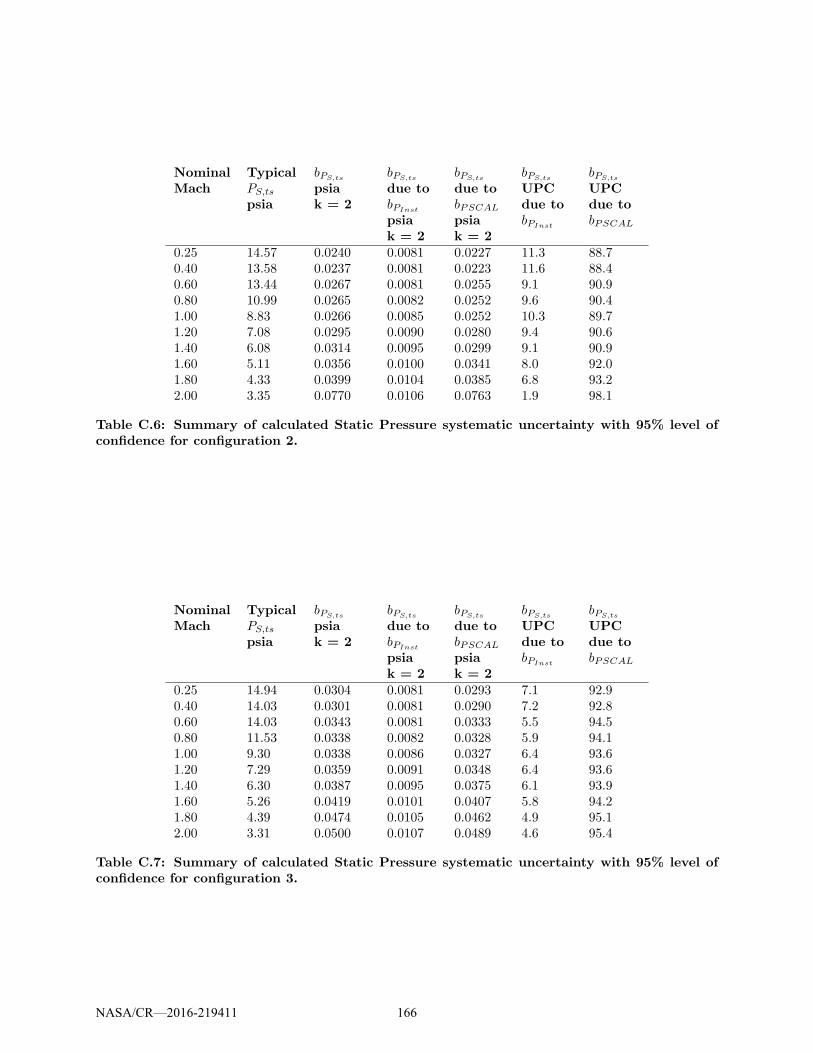
NominalMach
TypicalPS,ts
psia
bPS,ts
psiak = 2
bPS,ts
due tobPInst
psiak = 2
bPS,ts
due tobPSCAL
psiak = 2
bPS,ts
UPCdue tobPInst
bPS,ts
UPCdue tobPSCAL
0.25 14.57 0.0240 0.0081 0.0227 11.3 88.70.40 13.58 0.0237 0.0081 0.0223 11.6 88.40.60 13.44 0.0267 0.0081 0.0255 9.1 90.90.80 10.99 0.0265 0.0082 0.0252 9.6 90.41.00 8.83 0.0266 0.0085 0.0252 10.3 89.71.20 7.08 0.0295 0.0090 0.0280 9.4 90.61.40 6.08 0.0314 0.0095 0.0299 9.1 90.91.60 5.11 0.0356 0.0100 0.0341 8.0 92.01.80 4.33 0.0399 0.0104 0.0385 6.8 93.22.00 3.35 0.0770 0.0106 0.0763 1.9 98.1
Table C.6: Summary of calculated Static Pressure systematic uncertainty with 95% level ofconfidence for configuration 2.
NominalMach
TypicalPS,ts
psia
bPS,ts
psiak = 2
bPS,ts
due tobPInst
psiak = 2
bPS,ts
due tobPSCAL
psiak = 2
bPS,ts
UPCdue tobPInst
bPS,ts
UPCdue tobPSCAL
0.25 14.94 0.0304 0.0081 0.0293 7.1 92.90.40 14.03 0.0301 0.0081 0.0290 7.2 92.80.60 14.03 0.0343 0.0081 0.0333 5.5 94.50.80 11.53 0.0338 0.0082 0.0328 5.9 94.11.00 9.30 0.0338 0.0086 0.0327 6.4 93.61.20 7.29 0.0359 0.0091 0.0348 6.4 93.61.40 6.30 0.0387 0.0095 0.0375 6.1 93.91.60 5.26 0.0419 0.0101 0.0407 5.8 94.21.80 4.39 0.0474 0.0105 0.0462 4.9 95.12.00 3.31 0.0500 0.0107 0.0489 4.6 95.4
Table C.7: Summary of calculated Static Pressure systematic uncertainty with 95% level ofconfidence for configuration 3.
NASA/CR—2016-219411 166
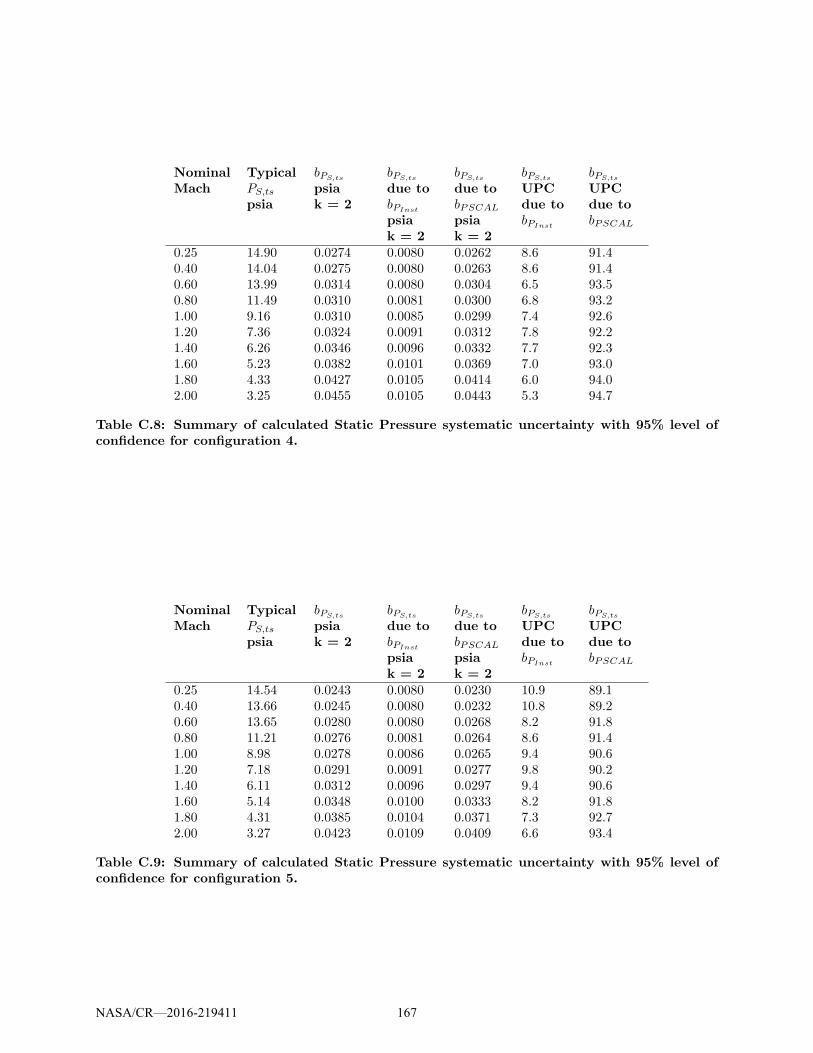
NominalMach
TypicalPS,ts
psia
bPS,ts
psiak = 2
bPS,ts
due tobPInst
psiak = 2
bPS,ts
due tobPSCAL
psiak = 2
bPS,ts
UPCdue tobPInst
bPS,ts
UPCdue tobPSCAL
0.25 14.90 0.0274 0.0080 0.0262 8.6 91.40.40 14.04 0.0275 0.0080 0.0263 8.6 91.40.60 13.99 0.0314 0.0080 0.0304 6.5 93.50.80 11.49 0.0310 0.0081 0.0300 6.8 93.21.00 9.16 0.0310 0.0085 0.0299 7.4 92.61.20 7.36 0.0324 0.0091 0.0312 7.8 92.21.40 6.26 0.0346 0.0096 0.0332 7.7 92.31.60 5.23 0.0382 0.0101 0.0369 7.0 93.01.80 4.33 0.0427 0.0105 0.0414 6.0 94.02.00 3.25 0.0455 0.0105 0.0443 5.3 94.7
Table C.8: Summary of calculated Static Pressure systematic uncertainty with 95% level ofconfidence for configuration 4.
NominalMach
TypicalPS,ts
psia
bPS,ts
psiak = 2
bPS,ts
due tobPInst
psiak = 2
bPS,ts
due tobPSCAL
psiak = 2
bPS,ts
UPCdue tobPInst
bPS,ts
UPCdue tobPSCAL
0.25 14.54 0.0243 0.0080 0.0230 10.9 89.10.40 13.66 0.0245 0.0080 0.0232 10.8 89.20.60 13.65 0.0280 0.0080 0.0268 8.2 91.80.80 11.21 0.0276 0.0081 0.0264 8.6 91.41.00 8.98 0.0278 0.0086 0.0265 9.4 90.61.20 7.18 0.0291 0.0091 0.0277 9.8 90.21.40 6.11 0.0312 0.0096 0.0297 9.4 90.61.60 5.14 0.0348 0.0100 0.0333 8.2 91.81.80 4.31 0.0385 0.0104 0.0371 7.3 92.72.00 3.27 0.0423 0.0109 0.0409 6.6 93.4
Table C.9: Summary of calculated Static Pressure systematic uncertainty with 95% level ofconfidence for configuration 5.
NASA/CR—2016-219411 167
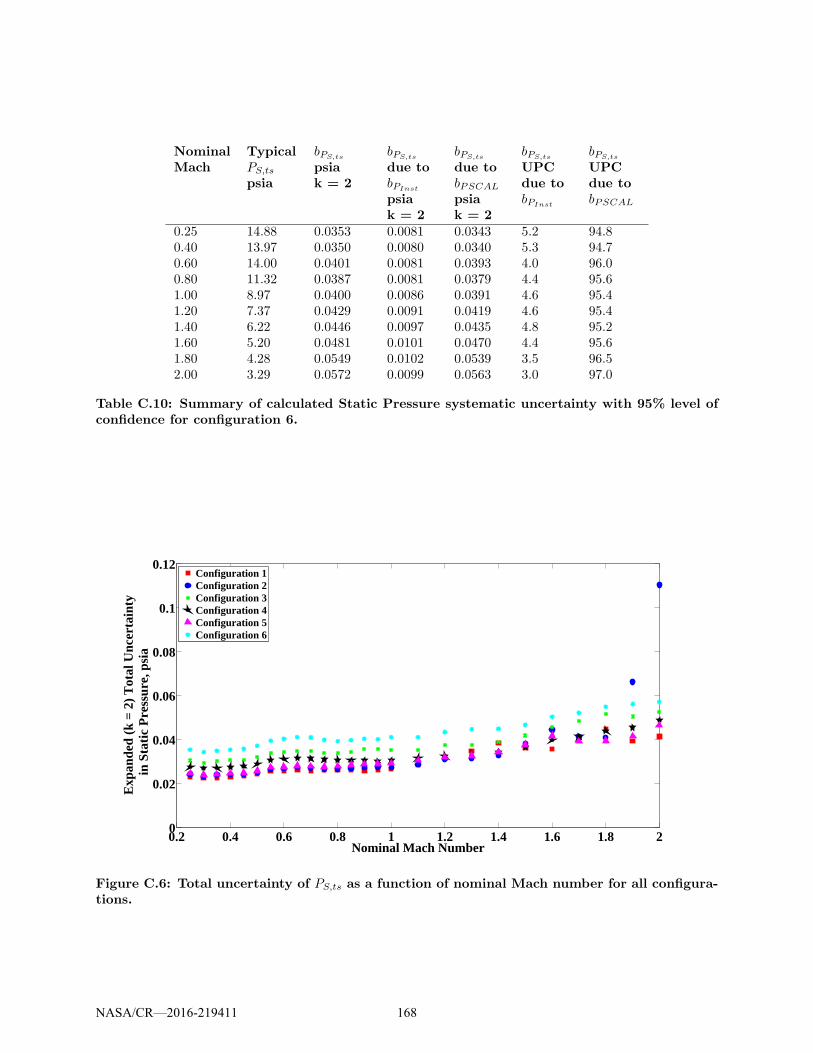
NominalMach
TypicalPS,ts
psia
bPS,ts
psiak = 2
bPS,ts
due tobPInst
psiak = 2
bPS,ts
due tobPSCAL
psiak = 2
bPS,ts
UPCdue tobPInst
bPS,ts
UPCdue tobPSCAL
0.25 14.88 0.0353 0.0081 0.0343 5.2 94.80.40 13.97 0.0350 0.0080 0.0340 5.3 94.70.60 14.00 0.0401 0.0081 0.0393 4.0 96.00.80 11.32 0.0387 0.0081 0.0379 4.4 95.61.00 8.97 0.0400 0.0086 0.0391 4.6 95.41.20 7.37 0.0429 0.0091 0.0419 4.6 95.41.40 6.22 0.0446 0.0097 0.0435 4.8 95.21.60 5.20 0.0481 0.0101 0.0470 4.4 95.61.80 4.28 0.0549 0.0102 0.0539 3.5 96.52.00 3.29 0.0572 0.0099 0.0563 3.0 97.0
Table C.10: Summary of calculated Static Pressure systematic uncertainty with 95% level ofconfidence for configuration 6.
0.2 0.4 0.6 0.8 1 1.2 1.4 1.6 1.8 20
0.02
0.04
0.06
0.08
0.1
0.12
Nominal Mach Number
Exp
ande
d (k
= 2
) T
otal
Unc
erta
inty
in S
tatic
Pre
ssur
e, p
sia
Configuration 1Configuration 2Configuration 3Configuration 4Configuration 5Configuration 6
Figure C.6: Total uncertainty of PS,ts as a function of nominal Mach number for all configura-tions.
NASA/CR—2016-219411 168
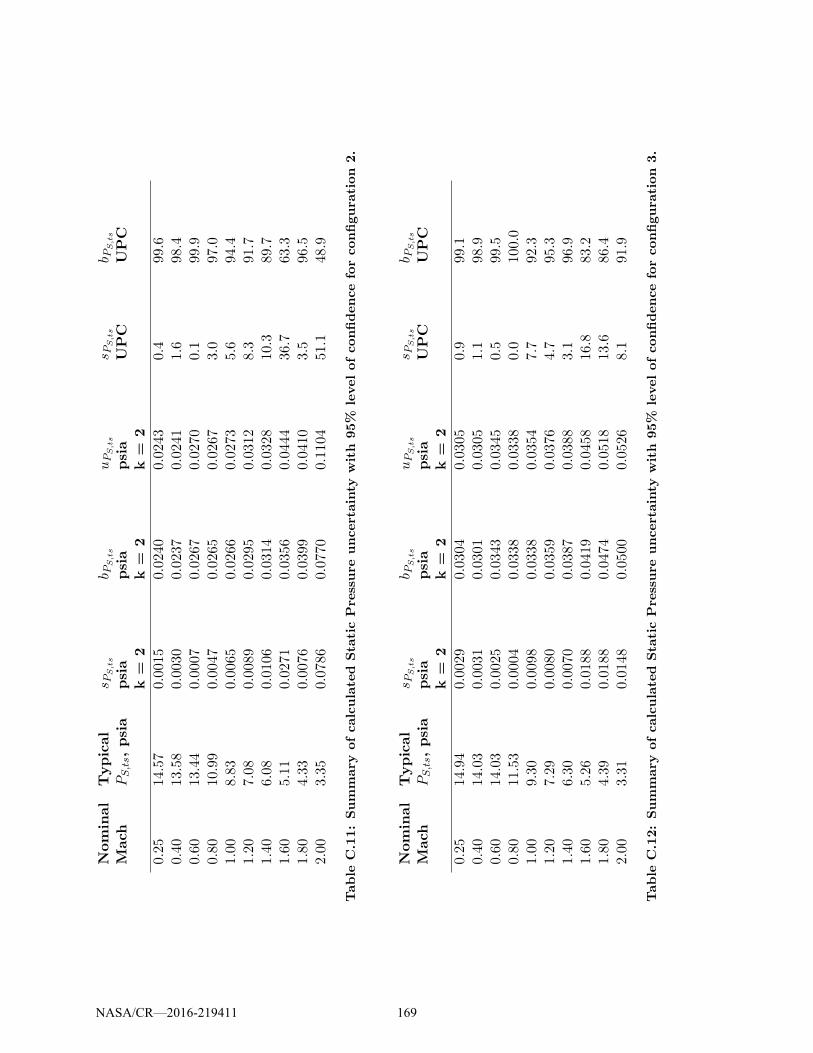
Nominal
Mach
Typical
PS,ts,psia
sPS,ts
psia
k=
2
b PS,ts
psia
k=
2
uPS,ts
psia
k=
2
sPS,ts
UPC
b PS,ts
UPC
0.25
14.57
0.0015
0.0240
0.0243
0.4
99.6
0.40
13.58
0.0030
0.0237
0.0241
1.6
98.4
0.60
13.44
0.0007
0.0267
0.0270
0.1
99.9
0.80
10.99
0.0047
0.0265
0.0267
3.0
97.0
1.00
8.83
0.0065
0.0266
0.0273
5.6
94.4
1.20
7.08
0.0089
0.0295
0.0312
8.3
91.7
1.40
6.08
0.0106
0.0314
0.0328
10.3
89.7
1.60
5.11
0.0271
0.0356
0.0444
36.7
63.3
1.80
4.33
0.0076
0.0399
0.0410
3.5
96.5
2.00
3.35
0.0786
0.0770
0.1104
51.1
48.9
Table
C.11:Summary
ofcalculated
Sta
ticPressure
uncertainty
with
95%
levelofconfidenceforconfigura
tion
2.
Nominal
Mach
Typical
PS,ts,psia
sPS,ts
psia
k=
2
b PS,ts
psia
k=
2
uPS,ts
psia
k=
2
sPS,ts
UPC
b PS,ts
UPC
0.25
14.94
0.0029
0.0304
0.0305
0.9
99.1
0.40
14.03
0.0031
0.0301
0.0305
1.1
98.9
0.60
14.03
0.0025
0.0343
0.0345
0.5
99.5
0.80
11.53
0.0004
0.0338
0.0338
0.0
100.0
1.00
9.30
0.0098
0.0338
0.0354
7.7
92.3
1.20
7.29
0.0080
0.0359
0.0376
4.7
95.3
1.40
6.30
0.0070
0.0387
0.0388
3.1
96.9
1.60
5.26
0.0188
0.0419
0.0458
16.8
83.2
1.80
4.39
0.0188
0.0474
0.0518
13.6
86.4
2.00
3.31
0.0148
0.0500
0.0526
8.1
91.9
Table
C.12:Summary
ofcalculated
Sta
ticPressure
uncertainty
with
95%
levelofconfidenceforconfigura
tion
3.
NASA/CR—2016-219411 169
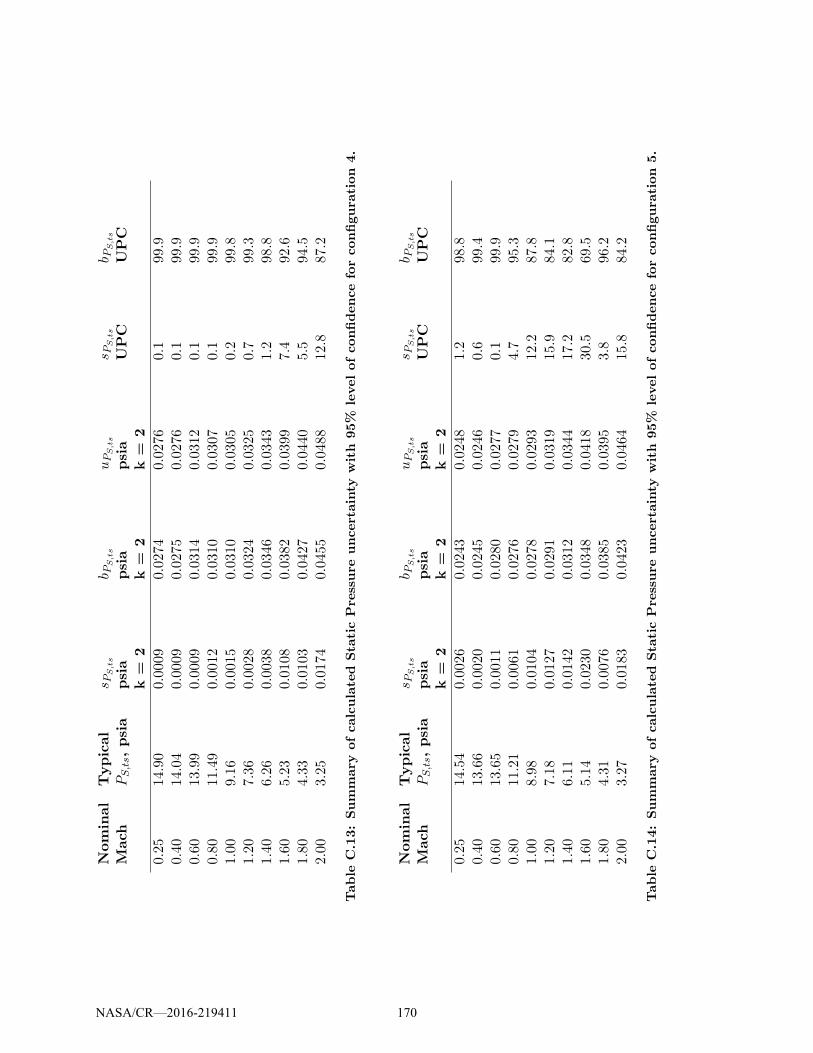
Nominal
Mach
Typical
PS,ts,psia
sPS,ts
psia
k=
2
b PS,ts
psia
k=
2
uPS,ts
psia
k=
2
sPS,ts
UPC
b PS,ts
UPC
0.25
14.90
0.0009
0.0274
0.0276
0.1
99.9
0.40
14.04
0.0009
0.0275
0.0276
0.1
99.9
0.60
13.99
0.0009
0.0314
0.0312
0.1
99.9
0.80
11.49
0.0012
0.0310
0.0307
0.1
99.9
1.00
9.16
0.0015
0.0310
0.0305
0.2
99.8
1.20
7.36
0.0028
0.0324
0.0325
0.7
99.3
1.40
6.26
0.0038
0.0346
0.0343
1.2
98.8
1.60
5.23
0.0108
0.0382
0.0399
7.4
92.6
1.80
4.33
0.0103
0.0427
0.0440
5.5
94.5
2.00
3.25
0.0174
0.0455
0.0488
12.8
87.2
Table
C.13:Summary
ofcalculated
Sta
ticPressure
uncertainty
with
95%
levelofconfidenceforconfigura
tion
4.
Nominal
Mach
Typical
PS,ts,psia
sPS,ts
psia
k=
2
b PS,ts
psia
k=
2
uPS,ts
psia
k=
2
sPS,ts
UPC
b PS,ts
UPC
0.25
14.54
0.0026
0.0243
0.0248
1.2
98.8
0.40
13.66
0.0020
0.0245
0.0246
0.6
99.4
0.60
13.65
0.0011
0.0280
0.0277
0.1
99.9
0.80
11.21
0.0061
0.0276
0.0279
4.7
95.3
1.00
8.98
0.0104
0.0278
0.0293
12.2
87.8
1.20
7.18
0.0127
0.0291
0.0319
15.9
84.1
1.40
6.11
0.0142
0.0312
0.0344
17.2
82.8
1.60
5.14
0.0230
0.0348
0.0418
30.5
69.5
1.80
4.31
0.0076
0.0385
0.0395
3.8
96.2
2.00
3.27
0.0183
0.0423
0.0464
15.8
84.2
Table
C.14:Summary
ofcalculated
Sta
ticPressure
uncertainty
with
95%
levelofconfidenceforconfigura
tion
5.
NASA/CR—2016-219411 170
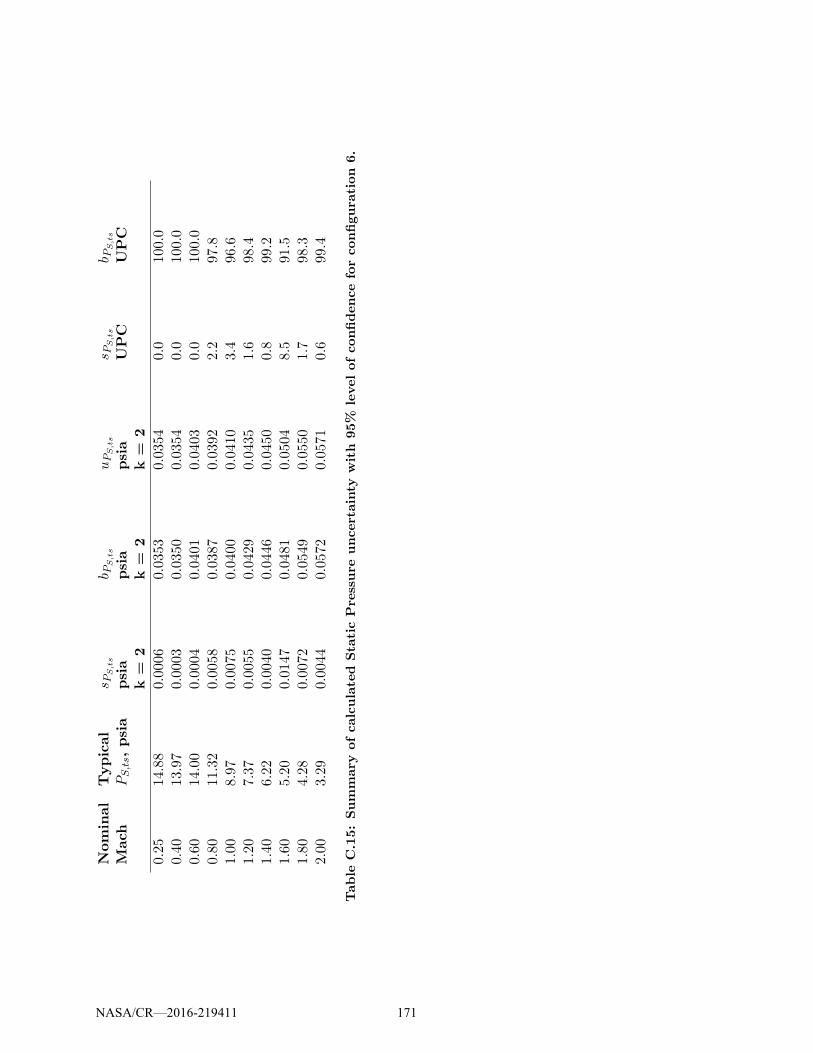
Nominal
Mach
Typical
PS,ts,psia
sPS,ts
psia
k=
2
b PS,ts
psia
k=
2
uPS,ts
psia
k=
2
sPS,ts
UPC
b PS,ts
UPC
0.25
14.88
0.0006
0.0353
0.0354
0.0
100.0
0.40
13.97
0.0003
0.0350
0.0354
0.0
100.0
0.60
14.00
0.0004
0.0401
0.0403
0.0
100.0
0.80
11.32
0.0058
0.0387
0.0392
2.2
97.8
1.00
8.97
0.0075
0.0400
0.0410
3.4
96.6
1.20
7.37
0.0055
0.0429
0.0435
1.6
98.4
1.40
6.22
0.0040
0.0446
0.0450
0.8
99.2
1.60
5.20
0.0147
0.0481
0.0504
8.5
91.5
1.80
4.28
0.0072
0.0549
0.0550
1.7
98.3
2.00
3.29
0.0044
0.0572
0.0571
0.6
99.4
Table
C.15:Summary
ofcalculated
Sta
ticPressure
uncertainty
with
95%
levelofconfidenceforconfigura
tion
6.
NASA/CR—2016-219411 171

Appendix D: Total Pressure Uncertainty
The uncertainty from measured values to test section total pressure propagates as shown inFigure D.1. Results for uncertainty in test section total pressure for configuration 1 werepresented in Section 5. Results for configurations 2-6 are presented in this Appendix. Barcharts depicting the percent contributions are shown, followed by tabulated results detailingdimensional and percent contributions for random, systematic, and total uncertainty.
NASA/CR—2016-219411 172
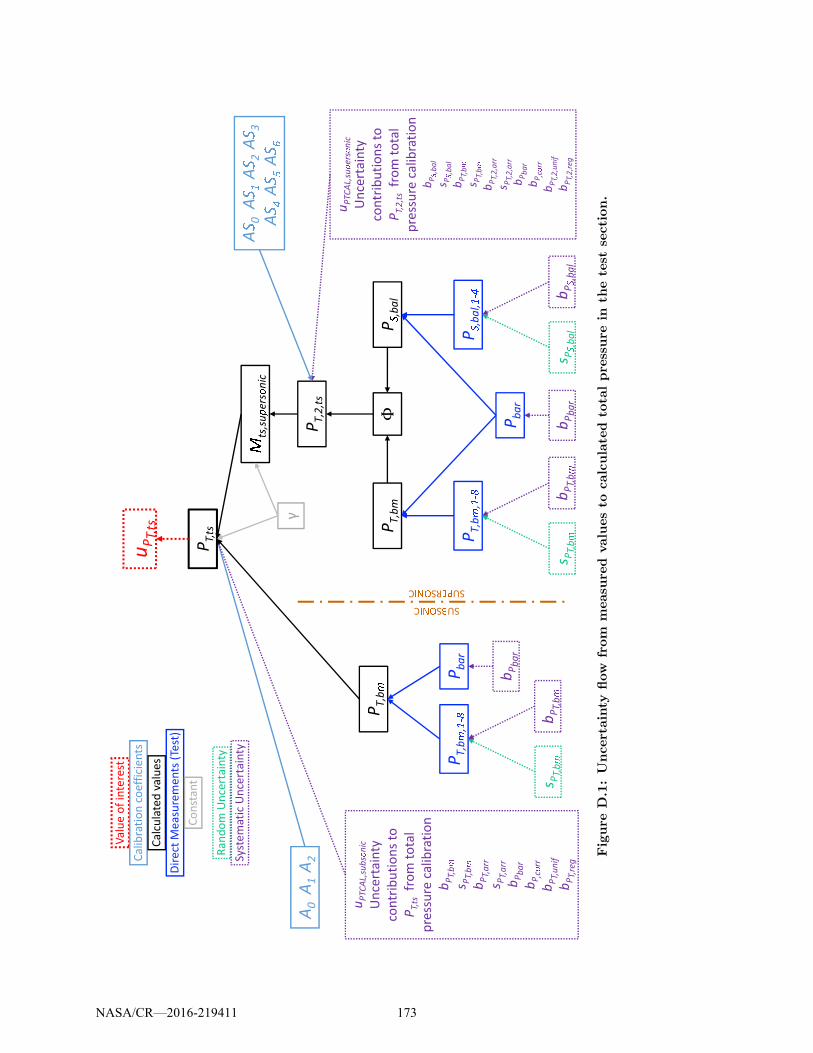
uPT,ts
Valueofinterest
Calibrationcoefficients
Calculatedvalues
DirectMeasurements(Test)
Constant
Random
Un
cert
ain
ty
Syst
em
ati
cU
nce
rta
inty
A0A1A2
PT,bm
uPTCAL,subs�
nic
Un
cert
ain
ty
con
trib
uti
on
sto
PT,ts
fro
mto
tal
pre
ssu
reca
lib
rati
on
bPT,b
�
s PT,b
�
bPT,arr
s PT,arr
bPbar
bP ,c�
rr
bPT,unif
bPT,reg
PT,b
,
Pbar
s PT,b
�
bPT,b
�
bPbar
PT,ts
P,bal
P,bal,
s P
,bal
bP
,bal
uPTCAL,su
p
ers
�
nic
Un
cert
ain
ty
con
trib
uti
on
sto
PT,2,ts
fro
mto
tal
pre
ssu
reca
lib
rati
on
bP
! ,bal
s P
!,bal
bPT,b
"
s PT,b
"
bPT,2,arr
s PT,2,arr
bPbar
bP ,c#
rr
bPT,2,unif
bPT,2,reg
A0A
A2A
3
AA
A
PT,2,ts
ΦPT,b
PT,b
,
s PT,b
�
bPT,b
�
Pbar
bPbar
ts,su
ers
nic
γ
SUP$RSONIC
SUBSONIC
Figure
D.1:Uncertainty
flow
from
measu
red
valuesto
calculated
tota
lpressure
inth
etest
section.
NASA/CR—2016-219411 173
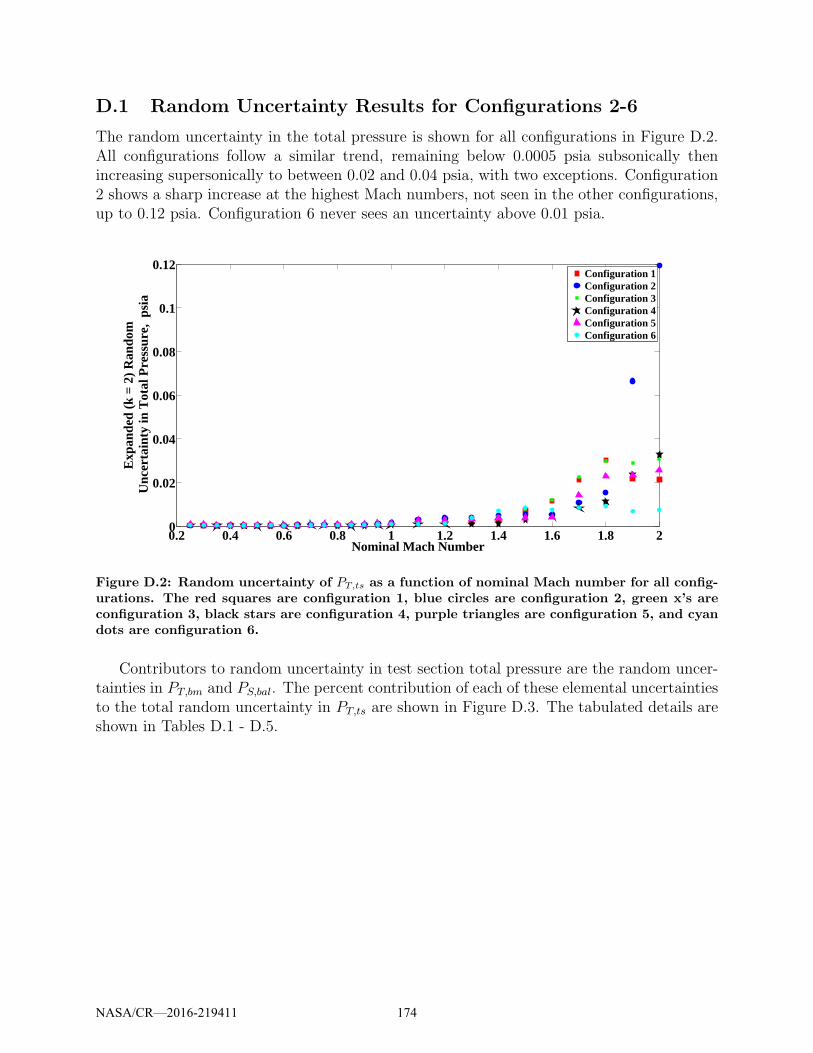
D.1 Random Uncertainty Results for Configurations 2-6
The random uncertainty in the total pressure is shown for all configurations in Figure D.2.All configurations follow a similar trend, remaining below 0.0005 psia subsonically thenincreasing supersonically to between 0.02 and 0.04 psia, with two exceptions. Configuration2 shows a sharp increase at the highest Mach numbers, not seen in the other configurations,up to 0.12 psia. Configuration 6 never sees an uncertainty above 0.01 psia.
0.2 0.4 0.6 0.8 1 1.2 1.4 1.6 1.8 20
0.02
0.04
0.06
0.08
0.1
0.12
Nominal Mach Number
Exp
ande
d (k
= 2
) R
ando
mU
ncer
tain
ty in
Tot
al P
ress
ure,
psi
a
Configuration 1Configuration 2Configuration 3Configuration 4Configuration 5Configuration 6
Figure D.2: Random uncertainty of PT,ts as a function of nominal Mach number for all config-urations. The red squares are configuration 1, blue circles are configuration 2, green x’s areconfiguration 3, black stars are configuration 4, purple triangles are configuration 5, and cyandots are configuration 6.
Contributors to random uncertainty in test section total pressure are the random uncer-tainties in PT,bm and PS,bal. The percent contribution of each of these elemental uncertaintiesto the total random uncertainty in PT,ts are shown in Figure D.3. The tabulated details areshown in Tables D.1 - D.5.
NASA/CR—2016-219411 174
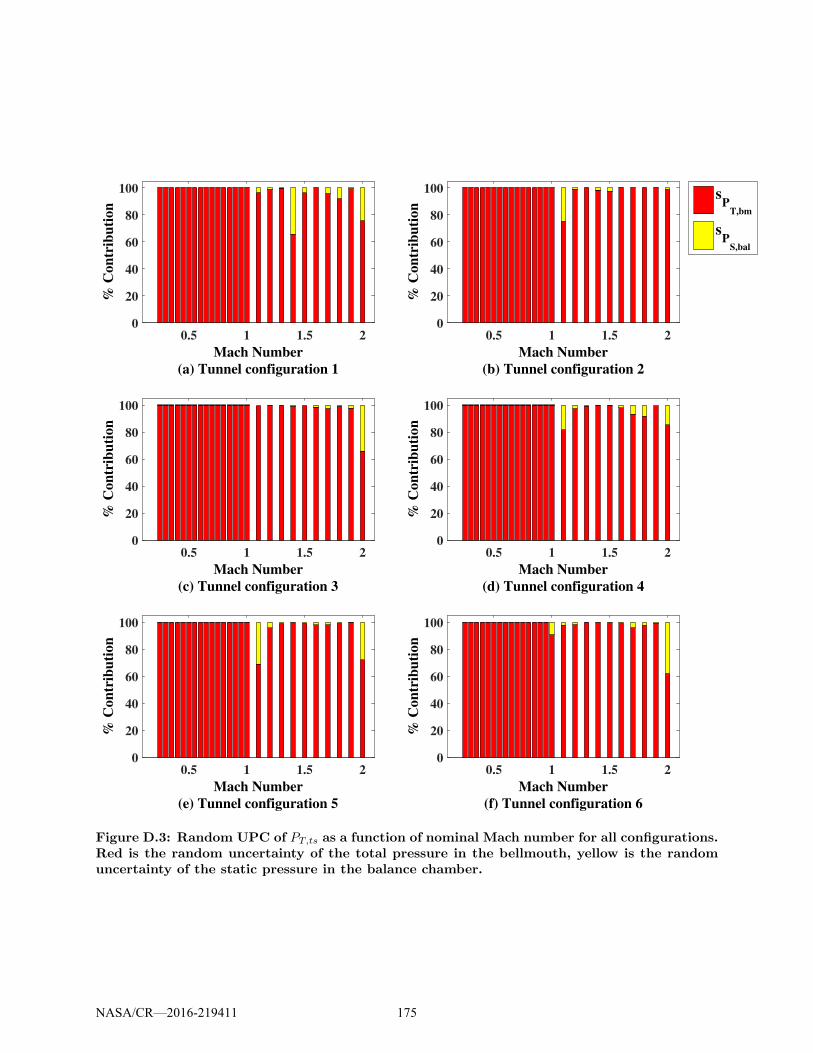
0.5 1 1.5 2
Mach Number
(a) Tunnel configuration 1
0
20
40
60
80
100
% C
on
trib
uti
on
0.5 1 1.5 2
Mach Number
(b) Tunnel configuration 2
0
20
40
60
80
100
% C
on
trib
uti
on
0.5 1 1.5 2
Mach Number
(c) Tunnel configuration 3
0
20
40
60
80
100
% C
on
trib
uti
on
0.5 1 1.5 2
Mach Number
(d) Tunnel configuration 4
0
20
40
60
80
100%
Con
trib
uti
on
0.5 1 1.5 2
Mach Number
(e) Tunnel configuration 5
0
20
40
60
80
100
% C
on
trib
uti
on
0.5 1 1.5 2
Mach Number
(f) Tunnel configuration 6
0
20
40
60
80
100
% C
on
trib
uti
on
sP
T,bm
sP
S,bal
Figure D.3: Random UPC of PT,ts as a function of nominal Mach number for all configurations.Red is the random uncertainty of the total pressure in the bellmouth, yellow is the randomuncertainty of the static pressure in the balance chamber.
NASA/CR—2016-219411 175
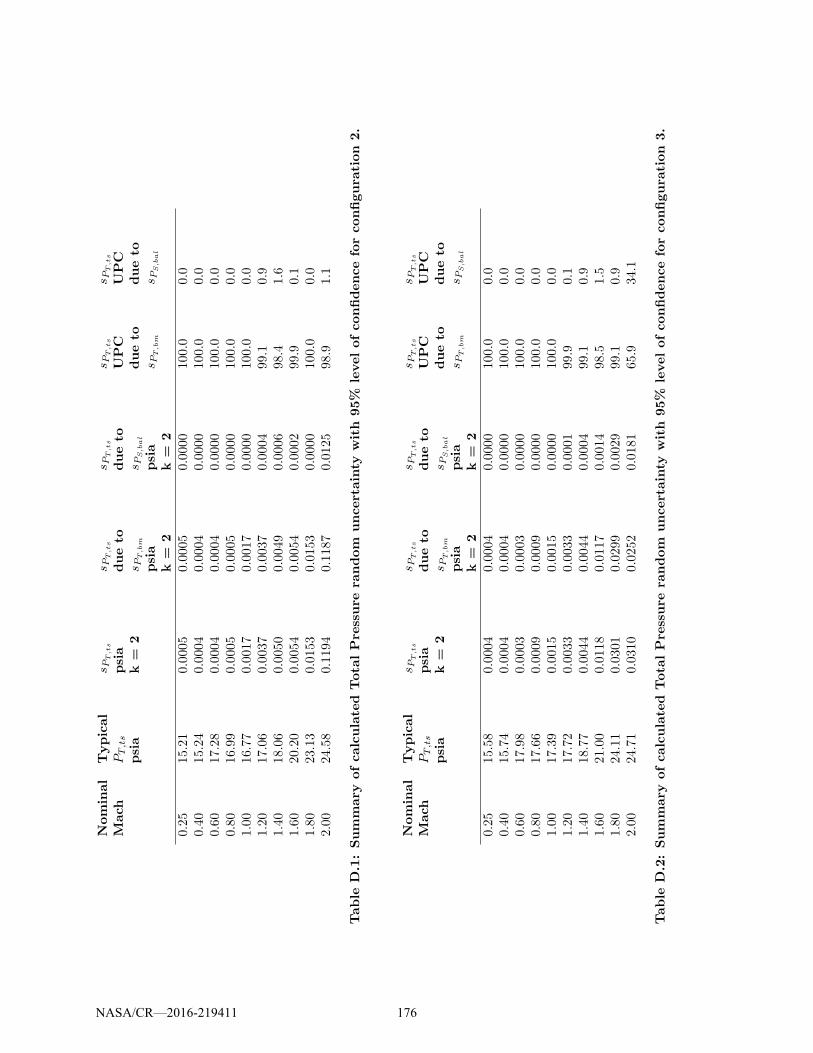
Nominal
Mach
Typical
PT,ts
psia
sP
T,ts
psia
k=
2
sP
T,ts
dueto
sP
T,bm
psia
k=
2
sP
T,ts
dueto
sP
S,bal
psia
k=
2
sP
T,ts
UPC
dueto
sP
T,bm
sP
T,ts
UPC
dueto
sP
S,bal
0.25
15.21
0.00
050.00
050.00
0010
0.0
0.0
0.40
15.24
0.00
040.00
040.00
0010
0.0
0.0
0.60
17.28
0.00
040.00
040.00
0010
0.0
0.0
0.80
16.99
0.00
050.00
050.00
0010
0.0
0.0
1.00
16.77
0.00
170.00
170.00
0010
0.0
0.0
1.20
17.06
0.00
370.00
370.00
0499
.10.9
1.40
18.06
0.00
500.00
490.00
0698
.41.6
1.60
20.20
0.00
540.00
540.00
0299
.90.1
1.80
23.13
0.01
530.01
530.00
0010
0.0
0.0
2.00
24.58
0.11
940.11
870.01
2598
.91.1
Table
D.1:Summary
ofcalculated
Tota
lPressure
random
uncertainty
with
95%
levelofconfidenceforconfigura
tion
2.
Nominal
Mach
Typical
PT,ts
psia
sP
T,ts
psia
k=
2
sP
T,ts
dueto
sP
T,bm
psia
k=
2
sP
T,ts
dueto
sP
S,bal
psia
k=
2
sP
T,ts
UPC
dueto
sP
T,bm
sP
T,ts
UPC
dueto
sP
S,bal
0.25
15.58
0.00
040.00
040.00
0010
0.0
0.0
0.40
15.74
0.00
040.00
040.00
0010
0.0
0.0
0.60
17.98
0.00
030.00
030.00
0010
0.0
0.0
0.80
17.66
0.00
090.00
090.00
0010
0.0
0.0
1.00
17.39
0.00
150.00
150.00
0010
0.0
0.0
1.20
17.72
0.00
330.00
330.00
0199
.90.1
1.40
18.77
0.00
440.00
440.00
0499
.10.9
1.60
21.00
0.01
180.01
170.00
1498
.51.5
1.80
24.11
0.03
010.02
990.00
2999
.10.9
2.00
24.71
0.03
100.02
520.01
8165
.934
.1
Table
D.2:Summary
ofcalculated
Tota
lPressure
random
uncertainty
with
95%
levelofconfidenceforconfigura
tion
3.
NASA/CR—2016-219411 176

Nominal
Mach
Typical
PT,ts
psia
sP
T,ts
psia
k=
2
sP
T,ts
dueto
sP
T,bm
psia
k=
2
sP
T,ts
dueto
sP
S,bal
psia
k=
2
sP
T,ts
UPC
dueto
sP
T,bm
sP
T,ts
UPC
dueto
sP
S,bal
0.25
15.56
0.00
050.00
050.00
0010
0.0
0.0
0.40
15.74
0.00
040.00
040.00
0010
0.0
0.0
0.60
17.94
0.00
020.00
020.00
0010
0.0
0.0
0.80
17.64
0.00
030.00
030.00
0010
0.0
0.0
1.00
17.35
0.00
070.00
070.00
0010
0.0
0.0
1.20
17.64
0.00
100.00
100.00
0297
.32.7
1.40
18.65
0.00
130.00
130.00
0010
0.0
0.0
1.60
20.96
0.00
480.00
480.00
0797
.92.1
1.80
24.13
0.01
140.01
100.00
3391
.88.2
2.00
25.17
0.03
290.03
040.01
2685
.414
.6
Table
D.3:Summary
ofcalculated
Tota
lPressure
random
uncertainty
with
95%
levelofconfidenceforconfigura
tion
4.
Nominal
Mach
Typical
PT,ts
psia
sP
T,ts
psia
k=
2
sP
T,ts
dueto
sP
T,bm
psia
k=
2
sP
T,ts
dueto
sP
S,bal
psia
k=
2
sP
T,ts
UPC
dueto
sP
T,bm
sP
T,ts
UPC
dueto
sP
S,bal
0.25
15.16
0.00
110.00
110.00
0010
0.0
0.0
0.40
15.28
0.00
040.00
040.00
0010
0.0
0.0
0.60
17.46
0.00
050.00
050.00
0010
0.0
0.0
0.80
17.14
0.00
100.00
100.00
0010
0.0
0.0
1.00
16.92
0.00
150.00
150.00
0010
0.0
0.0
1.20
17.21
0.00
290.00
280.00
0695
.84.2
1.40
18.20
0.00
380.00
380.00
0199
.80.2
1.60
20.41
0.00
400.00
400.00
0698
.02.0
1.80
23.48
0.02
280.02
270.00
1599
.60.4
2.00
24.68
0.02
560.02
180.01
3572
.327
.7
Table
D.4:Summary
ofcalculated
Tota
lPressure
random
uncertainty
with
95%
levelofconfidenceforconfigura
tion
5.
NASA/CR—2016-219411 177
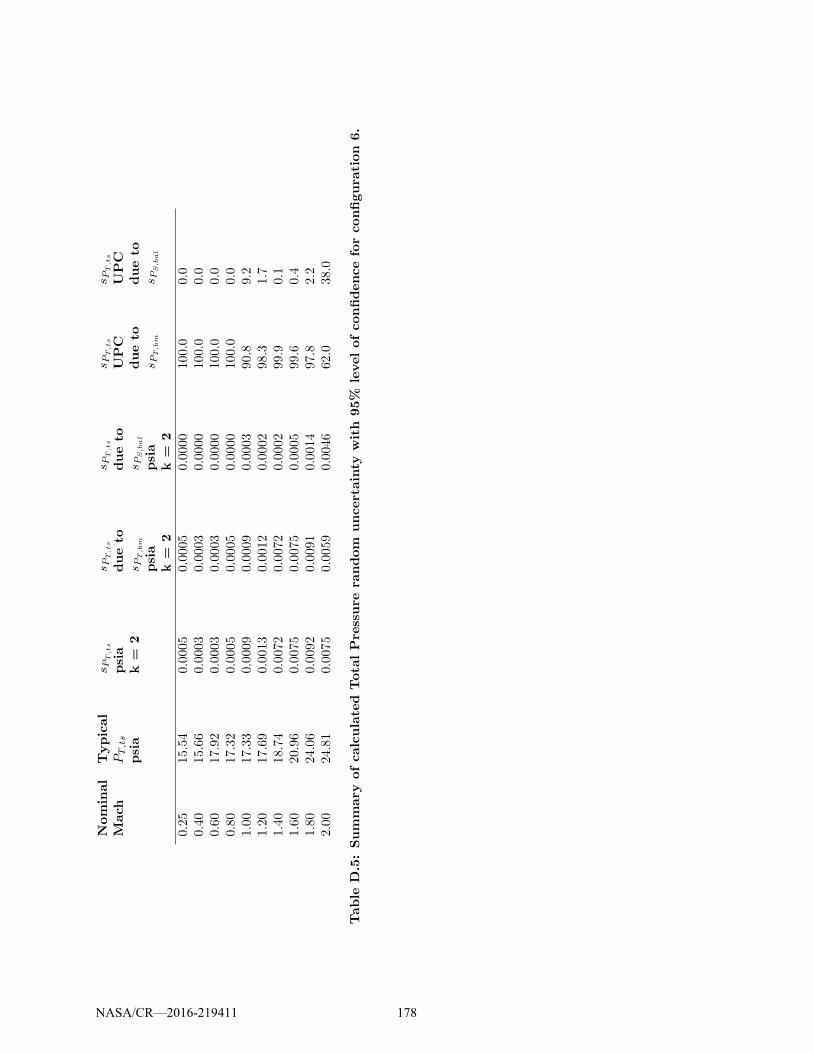
Nominal
Mach
Typical
PT,ts
psia
sP
T,ts
psia
k=
2
sP
T,ts
dueto
sP
T,bm
psia
k=
2
sP
T,ts
dueto
sP
S,bal
psia
k=
2
sP
T,ts
UPC
dueto
sP
T,bm
sP
T,ts
UPC
dueto
sP
S,bal
0.25
15.54
0.00
050.00
050.00
0010
0.0
0.0
0.40
15.66
0.00
030.00
030.00
0010
0.0
0.0
0.60
17.92
0.00
030.00
030.00
0010
0.0
0.0
0.80
17.32
0.00
050.00
050.00
0010
0.0
0.0
1.00
17.33
0.00
090.00
090.00
0390
.89.2
1.20
17.69
0.00
130.00
120.00
0298
.31.7
1.40
18.74
0.00
720.00
720.00
0299
.90.1
1.60
20.96
0.00
750.00
750.00
0599
.60.4
1.80
24.06
0.00
920.00
910.00
1497
.82.2
2.00
24.81
0.00
750.00
590.00
4662
.038
.0
Table
D.5:Summary
ofcalculated
Tota
lPressure
random
uncertainty
with
95%
levelofconfidenceforconfigura
tion
6.
NASA/CR—2016-219411 178
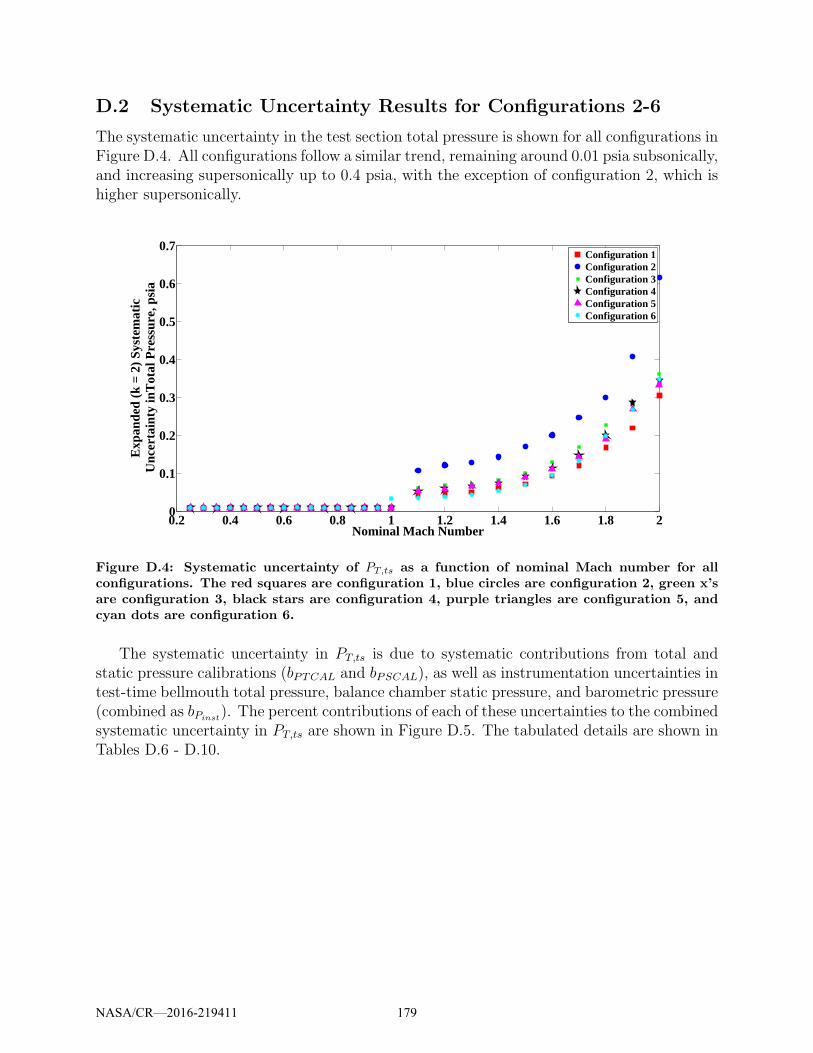
D.2 Systematic Uncertainty Results for Configurations 2-6
The systematic uncertainty in the test section total pressure is shown for all configurations inFigure D.4. All configurations follow a similar trend, remaining around 0.01 psia subsonically,and increasing supersonically up to 0.4 psia, with the exception of configuration 2, which ishigher supersonically.
0.2 0.4 0.6 0.8 1 1.2 1.4 1.6 1.8 20
0.1
0.2
0.3
0.4
0.5
0.6
0.7
Nominal Mach Number
Exp
ande
d (k
= 2
) S
yste
mat
icU
ncer
tain
ty in
Tot
al P
ress
ure,
psi
a
Configuration 1Configuration 2Configuration 3Configuration 4Configuration 5Configuration 6
Figure D.4: Systematic uncertainty of PT,ts as a function of nominal Mach number for allconfigurations. The red squares are configuration 1, blue circles are configuration 2, green x’sare configuration 3, black stars are configuration 4, purple triangles are configuration 5, andcyan dots are configuration 6.
The systematic uncertainty in PT,ts is due to systematic contributions from total andstatic pressure calibrations (bPTCAL and bPSCAL), as well as instrumentation uncertainties intest-time bellmouth total pressure, balance chamber static pressure, and barometric pressure(combined as bPinst
). The percent contributions of each of these uncertainties to the combinedsystematic uncertainty in PT,ts are shown in Figure D.5. The tabulated details are shown inTables D.6 - D.10.
NASA/CR—2016-219411 179
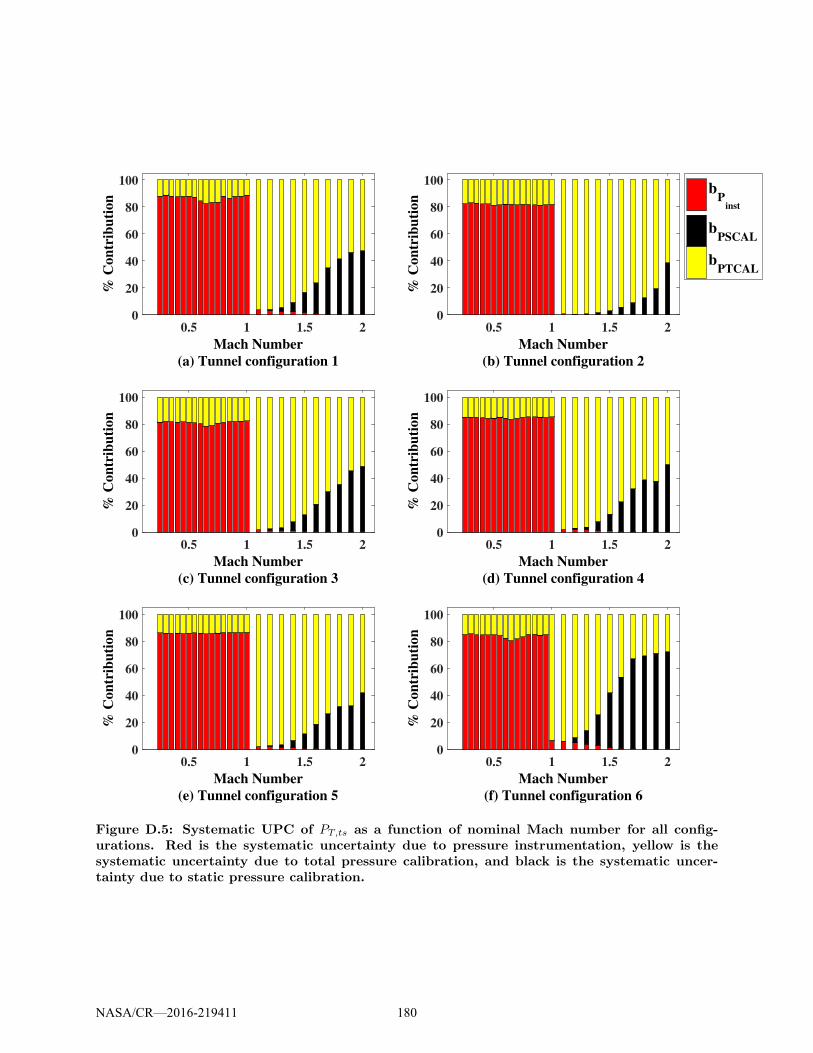
0.5 1 1.5 2
Mach Number
(a) Tunnel configuration 1
0
20
40
60
80
100
% C
on
trib
uti
on
0.5 1 1.5 2
Mach Number
(b) Tunnel configuration 2
0
20
40
60
80
100
% C
on
trib
uti
on
0.5 1 1.5 2
Mach Number
(c) Tunnel configuration 3
0
20
40
60
80
100
% C
on
trib
uti
on
0.5 1 1.5 2
Mach Number
(d) Tunnel configuration 4
0
20
40
60
80
100
% C
on
trib
uti
on
0.5 1 1.5 2
Mach Number
(e) Tunnel configuration 5
0
20
40
60
80
100
% C
on
trib
uti
on
0.5 1 1.5 2
Mach Number
(f) Tunnel configuration 6
0
20
40
60
80
100
% C
on
trib
uti
on
bP
inst
bPSCAL
bPTCAL
Figure D.5: Systematic UPC of PT,ts as a function of nominal Mach number for all config-urations. Red is the systematic uncertainty due to pressure instrumentation, yellow is thesystematic uncertainty due to total pressure calibration, and black is the systematic uncer-tainty due to static pressure calibration.
NASA/CR—2016-219411 180

Nominal
Mach
Typical
PT,ts
psia
b PT,ts,
psia
k=
2
b PT,ts
dueto
b PInst,
psia
k=
2
b PT,ts
b PSCAL,
psia
k=
2
b PT,ts
b PTCAL,
psia
k=
2
b PT,ts
UPC
dueto
b PInst
b PT,ts
UPC
dueto
b PSCAL
b PT,ts
UPC
dueto
b PTCAL
0.25
15.21
0.00
890.00
810.00
000.00
3882
.30.0
17.7
0.40
15.24
0.00
890.00
810.00
000.00
3882
.20.0
17.8
0.60
17.28
0.00
920.00
840.00
000.00
3982
.10.0
17.9
0.80
16.99
0.00
920.00
830.00
000.00
3981
.80.0
18.2
1.00
16.77
0.00
910.00
820.00
000.00
3981
.80.0
18.2
1.20
17.06
0.12
100.00
800.00
520.12
060.4
0.2
99.4
1.40
18.06
0.14
240.00
880.01
670.14
110.4
1.4
98.2
1.60
20.20
0.20
000.00
890.04
710.19
420.2
5.6
94.2
1.80
23.13
0.29
940.01
010.10
640.27
960.1
12.6
87.2
2.00
24.58
0.61
530.00
910.38
290.48
150.0
38.7
61.2
Table
D.6:Summary
ofcalculated
Tota
lPressure
systematicuncertainty
with
95%
levelofconfidenceforconfigura
tion
2.
Nominal
Mach
Typical
PT,ts
psia
b PT,ts,
psia
k=
2
b PT,ts
dueto
b PInst,
psia
k=
2
b PT,ts
b PSCAL,
psia
k=
2
b PT,ts
b PTCAL,
psia
k=
2
b PT,ts
UPC
dueto
b PInst
b PT,ts
UPC
dueto
b PSCAL
b PT,ts
UPC
dueto
b PTCAL
0.25
15.58
0.00
900.00
810.00
000.00
3981
.50.0
18.5
0.40
15.74
0.00
900.00
810.00
000.00
3981
.40.0
18.6
0.60
17.98
0.00
940.00
840.00
000.00
4280
.30.0
19.7
0.80
17.66
0.00
930.00
840.00
000.00
4081
.30.0
18.7
1.00
17.39
0.00
910.00
830.00
000.00
3882
.30.0
17.7
1.20
17.72
0.06
810.00
820.00
680.06
721.5
1.0
97.5
1.40
18.77
0.08
260.00
890.02
120.07
931.2
6.6
92.3
1.60
21.00
0.12
800.00
860.05
760.11
390.4
20.3
79.3
1.80
24.11
0.22
680.00
910.13
480.18
220.2
35.3
64.5
2.00
24.71
0.36
200.02
180.25
190.25
900.4
48.4
51.2
Table
D.7:Summary
ofcalculated
Tota
lPressure
systematicuncertainty
with
95%
levelofconfidenceforconfigura
tion
3.
NASA/CR—2016-219411 181
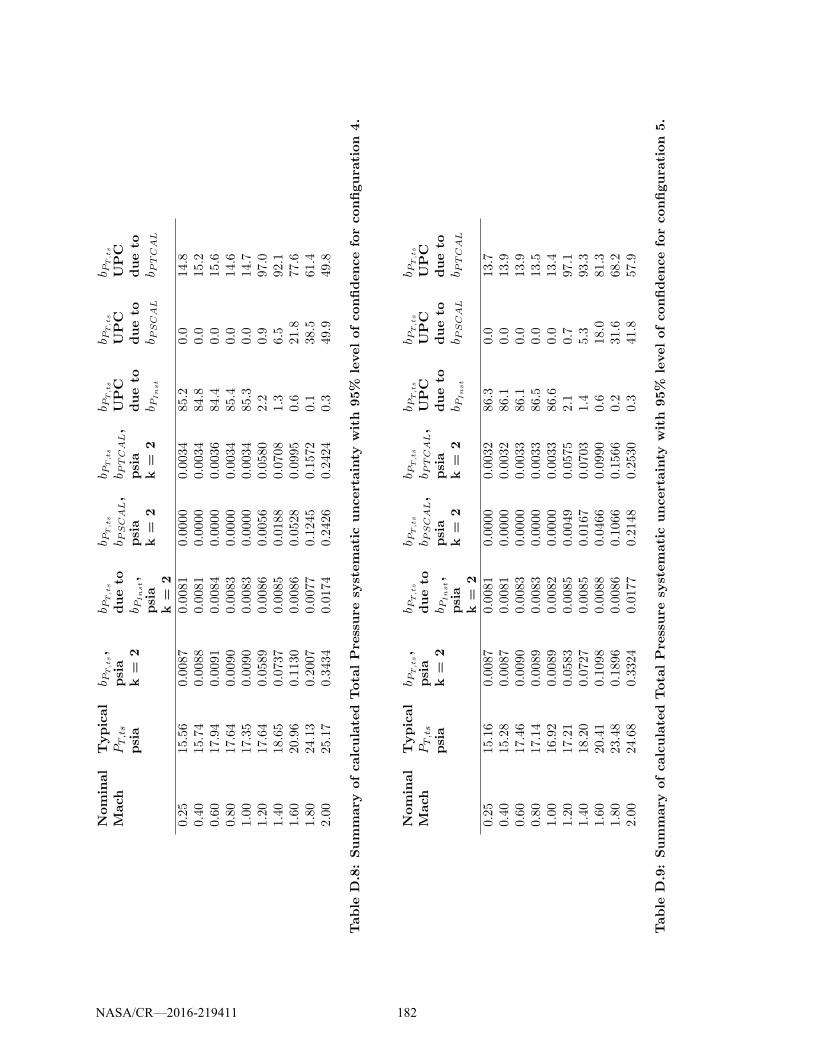
Nominal
Mach
Typical
PT,ts
psia
b PT,ts,
psia
k=
2
b PT,ts
dueto
b PInst,
psia
k=
2
b PT,ts
b PSCAL,
psia
k=
2
b PT,ts
b PTCAL,
psia
k=
2
b PT,ts
UPC
dueto
b PInst
b PT,ts
UPC
dueto
b PSCAL
b PT,ts
UPC
dueto
b PTCAL
0.25
15.56
0.00
870.00
810.00
000.00
3485
.20.0
14.8
0.40
15.74
0.00
880.00
810.00
000.00
3484
.80.0
15.2
0.60
17.94
0.00
910.00
840.00
000.00
3684
.40.0
15.6
0.80
17.64
0.00
900.00
830.00
000.00
3485
.40.0
14.6
1.00
17.35
0.00
900.00
830.00
000.00
3485
.30.0
14.7
1.20
17.64
0.05
890.00
860.00
560.05
802.2
0.9
97.0
1.40
18.65
0.07
370.00
850.01
880.07
081.3
6.5
92.1
1.60
20.96
0.11
300.00
860.05
280.09
950.6
21.8
77.6
1.80
24.13
0.20
070.00
770.12
450.15
720.1
38.5
61.4
2.00
25.17
0.34
340.01
740.24
260.24
240.3
49.9
49.8
Table
D.8:Summary
ofcalculated
Tota
lPressure
systematicuncertainty
with
95%
levelofconfidenceforconfigura
tion
4.
Nominal
Mach
Typical
PT,ts
psia
b PT,ts,
psia
k=
2
b PT,ts
dueto
b PInst,
psia
k=
2
b PT,ts
b PSCAL,
psia
k=
2
b PT,ts
b PTCAL,
psia
k=
2
b PT,ts
UPC
dueto
b PInst
b PT,ts
UPC
dueto
b PSCAL
b PT,ts
UPC
dueto
b PTCAL
0.25
15.16
0.00
870.00
810.00
000.00
3286
.30.0
13.7
0.40
15.28
0.00
870.00
810.00
000.00
3286
.10.0
13.9
0.60
17.46
0.00
900.00
830.00
000.00
3386
.10.0
13.9
0.80
17.14
0.00
890.00
830.00
000.00
3386
.50.0
13.5
1.00
16.92
0.00
890.00
820.00
000.00
3386
.60.0
13.4
1.20
17.21
0.05
830.00
850.00
490.05
752.1
0.7
97.1
1.40
18.20
0.07
270.00
850.01
670.07
031.4
5.3
93.3
1.60
20.41
0.10
980.00
880.04
660.09
900.6
18.0
81.3
1.80
23.48
0.18
960.00
860.10
660.15
660.2
31.6
68.2
2.00
24.68
0.33
240.01
770.21
480.25
300.3
41.8
57.9
Table
D.9:Summary
ofcalculated
Tota
lPressure
systematicuncertainty
with
95%
levelofconfidenceforconfigura
tion
5.
NASA/CR—2016-219411 182
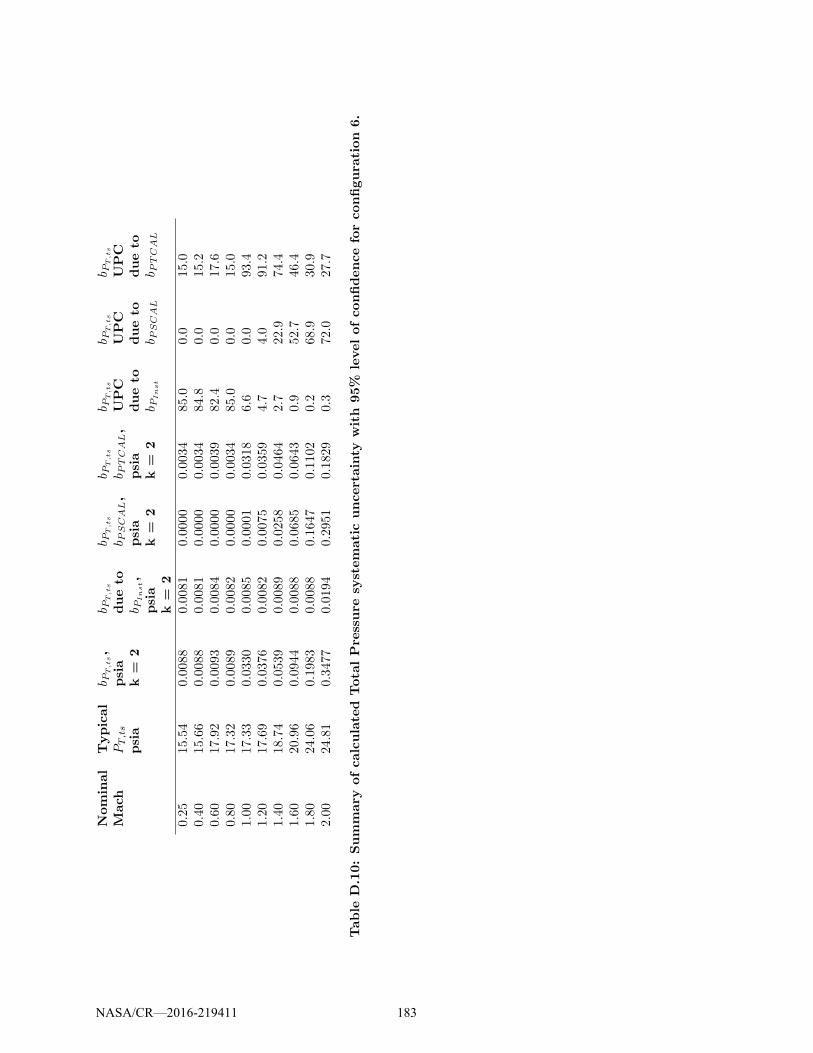
Nominal
Mach
Typical
PT,ts
psia
b PT,ts,
psia
k=
2
b PT,ts
dueto
b PInst,
psia
k=
2
b PT,ts
b PSCAL,
psia
k=
2
b PT,ts
b PTCAL,
psia
k=
2
b PT,ts
UPC
dueto
b PInst
b PT,ts
UPC
dueto
b PSCAL
b PT,ts
UPC
dueto
b PTCAL
0.25
15.54
0.00
880.00
810.00
000.00
3485
.00.0
15.0
0.40
15.66
0.00
880.00
810.00
000.00
3484
.80.0
15.2
0.60
17.92
0.00
930.00
840.00
000.00
3982
.40.0
17.6
0.80
17.32
0.00
890.00
820.00
000.00
3485
.00.0
15.0
1.00
17.33
0.03
300.00
850.00
010.03
186.6
0.0
93.4
1.20
17.69
0.03
760.00
820.00
750.03
594.7
4.0
91.2
1.40
18.74
0.05
390.00
890.02
580.04
642.7
22.9
74.4
1.60
20.96
0.09
440.00
880.06
850.06
430.9
52.7
46.4
1.80
24.06
0.19
830.00
880.16
470.11
020.2
68.9
30.9
2.00
24.81
0.34
770.01
940.29
510.18
290.3
72.0
27.7
Table
D.10:Summary
ofcalculated
Tota
lPressure
systematicuncertainty
with
95%
levelofconfidenceforconfigura
tion
6.
NASA/CR—2016-219411 183

D.3 Total Uncertainty Results for Configurations 2-6
Total uncertainty in PT,ts for all six configurations are shown in Figure D.6. Each configu-ration follows the same trend, although supersonically configuration 2 is noticeably higher.The combined uncertainty in PT,ts is presented for configurations 2-6 in Tables D.11 - D.15.
0.2 0.4 0.6 0.8 1 1.2 1.4 1.6 1.8 20
0.1
0.2
0.3
0.4
0.5
0.6
0.7
Nominal Mach Number
Exp
ande
d (k
= 2
) T
otal
Unc
erta
inty
in T
otal
Pre
ssur
e, p
sia
Configuration 1Configuration 2Configuration 3Configuration 4Configuration 5Configuration 6
Figure D.6: Total uncertainty of PT,ts as a function of nominal Mach number for all configu-rations.
NASA/CR—2016-219411 184

Nominal
Mach
Typical
PT,ts,psia
sPT,ts
psia
k=
2
b PT,ts
psia
k=
2
uPT,ts
psia
k=
2
sPT,ts
UPC
b PT,ts
UPC
0.25
15.21
0.0005
0.0089
0.0090
0.3
99.7
0.40
15.24
0.0004
0.0089
0.0090
0.2
99.8
0.60
17.28
0.0004
0.0092
0.0092
0.2
99.8
0.80
16.99
0.0005
0.0092
0.0092
0.2
99.8
1.00
16.77
0.0017
0.0091
0.0093
3.4
96.6
1.20
17.06
0.0037
0.1210
0.1174
0.1
99.9
1.40
18.06
0.0050
0.1424
0.1424
0.1
99.9
1.60
20.20
0.0054
0.2000
0.2032
0.1
99.9
1.80
23.13
0.0153
0.2994
0.3008
0.3
99.7
2.00
24.58
0.1194
0.6153
0.6350
3.6
96.4
Table
D.11:Summary
ofcalculated
Tota
lPressure
uncertainty
with
95%
levelofconfidenceforconfigura
tion
2.
Nominal
Mach
Typical
PT,ts,psia
sPT,ts
psia
k=
2
b PT,ts
psia
k=
2
uPT,ts
psia
k=
2
sPT,ts
UPC
b PT,ts
UPC
0.25
15.58
0.0004
0.0090
0.0090
0.2
99.8
0.40
15.74
0.0004
0.0090
0.0091
0.2
99.8
0.60
17.98
0.0003
0.0094
0.0094
0.1
99.9
0.80
17.66
0.0009
0.0093
0.0093
0.9
99.1
1.00
17.39
0.0015
0.0091
0.0093
2.5
97.5
1.20
17.72
0.0033
0.0681
0.0668
0.2
99.8
1.40
18.77
0.0044
0.0826
0.0833
0.3
99.7
1.60
21.00
0.0118
0.1280
0.1286
0.8
99.2
1.80
24.11
0.0301
0.2268
0.2287
1.7
98.3
2.00
24.71
0.0310
0.3620
0.3648
0.7
99.3
Table
D.12:Summary
ofcalculated
Tota
lPressure
uncertainty
with
95%
levelofconfidenceforconfigura
tion
3.
NASA/CR—2016-219411 185
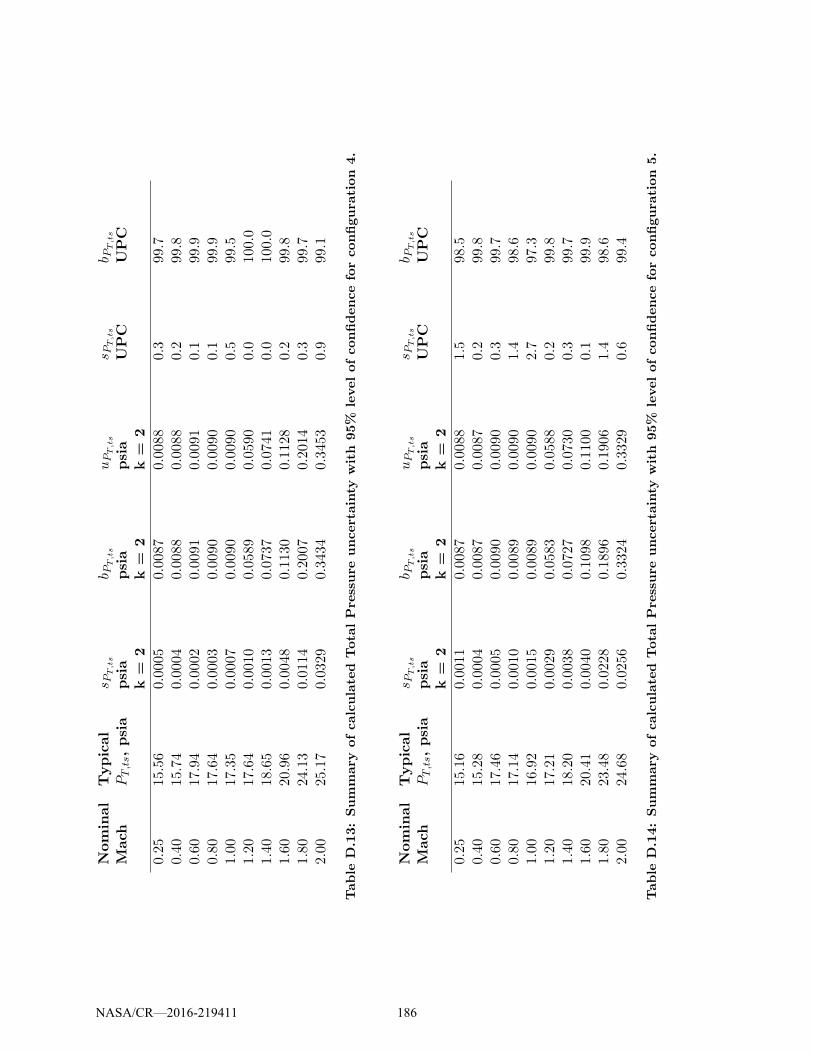
Nominal
Mach
Typical
PT,ts,psia
sPT,ts
psia
k=
2
b PT,ts
psia
k=
2
uPT,ts
psia
k=
2
sPT,ts
UPC
b PT,ts
UPC
0.25
15.56
0.0005
0.0087
0.0088
0.3
99.7
0.40
15.74
0.0004
0.0088
0.0088
0.2
99.8
0.60
17.94
0.0002
0.0091
0.0091
0.1
99.9
0.80
17.64
0.0003
0.0090
0.0090
0.1
99.9
1.00
17.35
0.0007
0.0090
0.0090
0.5
99.5
1.20
17.64
0.0010
0.0589
0.0590
0.0
100.0
1.40
18.65
0.0013
0.0737
0.0741
0.0
100.0
1.60
20.96
0.0048
0.1130
0.1128
0.2
99.8
1.80
24.13
0.0114
0.2007
0.2014
0.3
99.7
2.00
25.17
0.0329
0.3434
0.3453
0.9
99.1
Table
D.13:Summary
ofcalculated
Tota
lPressure
uncertainty
with
95%
levelofconfidenceforconfigura
tion
4.
Nominal
Mach
Typical
PT,ts,psia
sPT,ts
psia
k=
2
b PT,ts
psia
k=
2
uPT,ts
psia
k=
2
sPT,ts
UPC
b PT,ts
UPC
0.25
15.16
0.0011
0.0087
0.0088
1.5
98.5
0.40
15.28
0.0004
0.0087
0.0087
0.2
99.8
0.60
17.46
0.0005
0.0090
0.0090
0.3
99.7
0.80
17.14
0.0010
0.0089
0.0090
1.4
98.6
1.00
16.92
0.0015
0.0089
0.0090
2.7
97.3
1.20
17.21
0.0029
0.0583
0.0588
0.2
99.8
1.40
18.20
0.0038
0.0727
0.0730
0.3
99.7
1.60
20.41
0.0040
0.1098
0.1100
0.1
99.9
1.80
23.48
0.0228
0.1896
0.1906
1.4
98.6
2.00
24.68
0.0256
0.3324
0.3329
0.6
99.4
Table
D.14:Summary
ofcalculated
Tota
lPressure
uncertainty
with
95%
levelofconfidenceforconfigura
tion
5.
NASA/CR—2016-219411 186
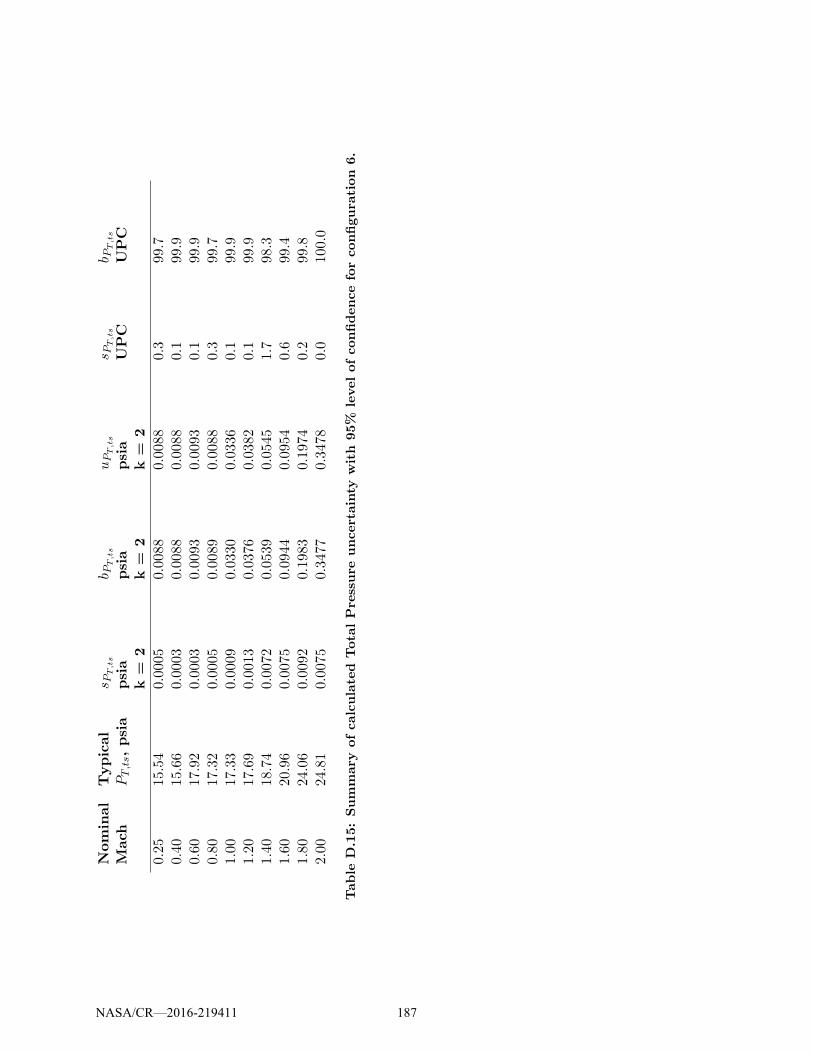
Nominal
Mach
Typical
PT,ts,psia
sPT,ts
psia
k=
2
b PT,ts
psia
k=
2
uPT,ts
psia
k=
2
sPT,ts
UPC
b PT,ts
UPC
0.25
15.54
0.0005
0.0088
0.0088
0.3
99.7
0.40
15.66
0.0003
0.0088
0.0088
0.1
99.9
0.60
17.92
0.0003
0.0093
0.0093
0.1
99.9
0.80
17.32
0.0005
0.0089
0.0088
0.3
99.7
1.00
17.33
0.0009
0.0330
0.0336
0.1
99.9
1.20
17.69
0.0013
0.0376
0.0382
0.1
99.9
1.40
18.74
0.0072
0.0539
0.0545
1.7
98.3
1.60
20.96
0.0075
0.0944
0.0954
0.6
99.4
1.80
24.06
0.0092
0.1983
0.1974
0.2
99.8
2.00
24.81
0.0075
0.3477
0.3478
0.0
100.0
Table
D.15:Summary
ofcalculated
Tota
lPressure
uncertainty
with
95%
levelofconfidenceforconfigura
tion
6.
NASA/CR—2016-219411 187
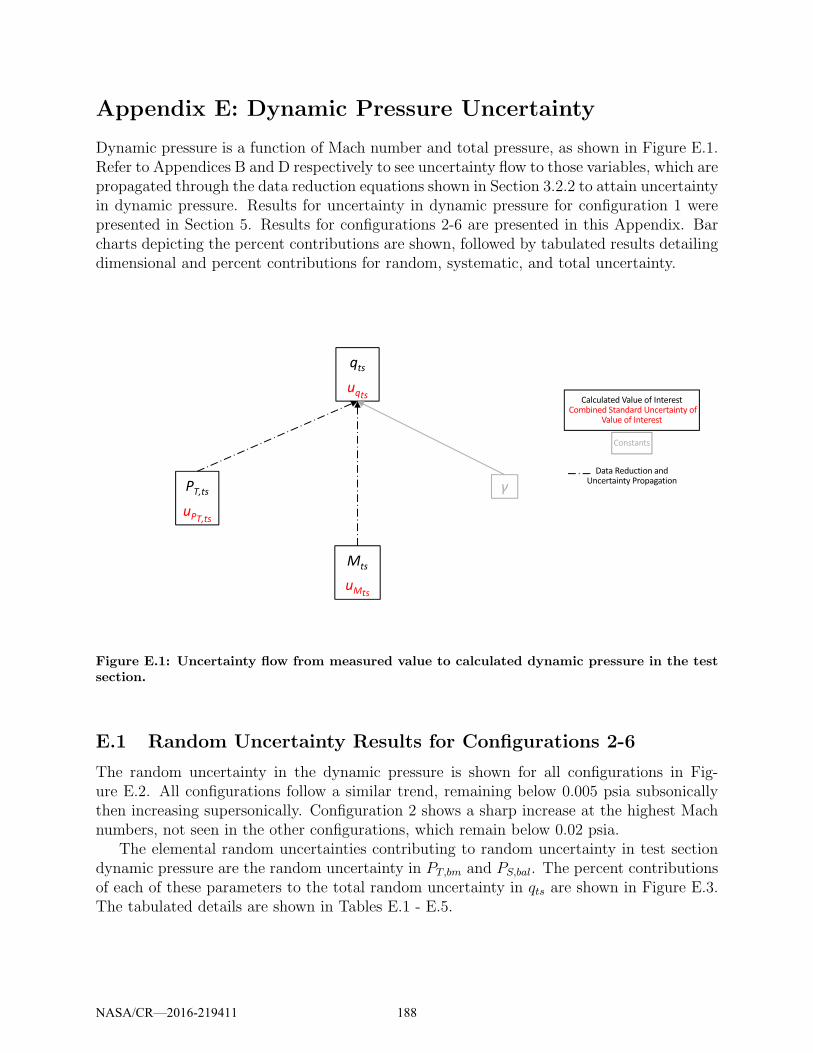
Appendix E: Dynamic Pressure Uncertainty
Dynamic pressure is a function of Mach number and total pressure, as shown in Figure E.1.Refer to Appendices B and D respectively to see uncertainty flow to those variables, which arepropagated through the data reduction equations shown in Section 3.2.2 to attain uncertaintyin dynamic pressure. Results for uncertainty in dynamic pressure for configuration 1 werepresented in Section 5. Results for configurations 2-6 are presented in this Appendix. Barcharts depicting the percent contributions are shown, followed by tabulated results detailingdimensional and percent contributions for random, systematic, and total uncertainty.
Figure E.1: Uncertainty flow from measured value to calculated dynamic pressure in the testsection.
E.1 Random Uncertainty Results for Configurations 2-6
The random uncertainty in the dynamic pressure is shown for all configurations in Fig-ure E.2. All configurations follow a similar trend, remaining below 0.005 psia subsonicallythen increasing supersonically. Configuration 2 shows a sharp increase at the highest Machnumbers, not seen in the other configurations, which remain below 0.02 psia.
The elemental random uncertainties contributing to random uncertainty in test sectiondynamic pressure are the random uncertainty in PT,bm and PS,bal. The percent contributionsof each of these parameters to the total random uncertainty in qts are shown in Figure E.3.The tabulated details are shown in Tables E.1 - E.5.
NASA/CR—2016-219411 188
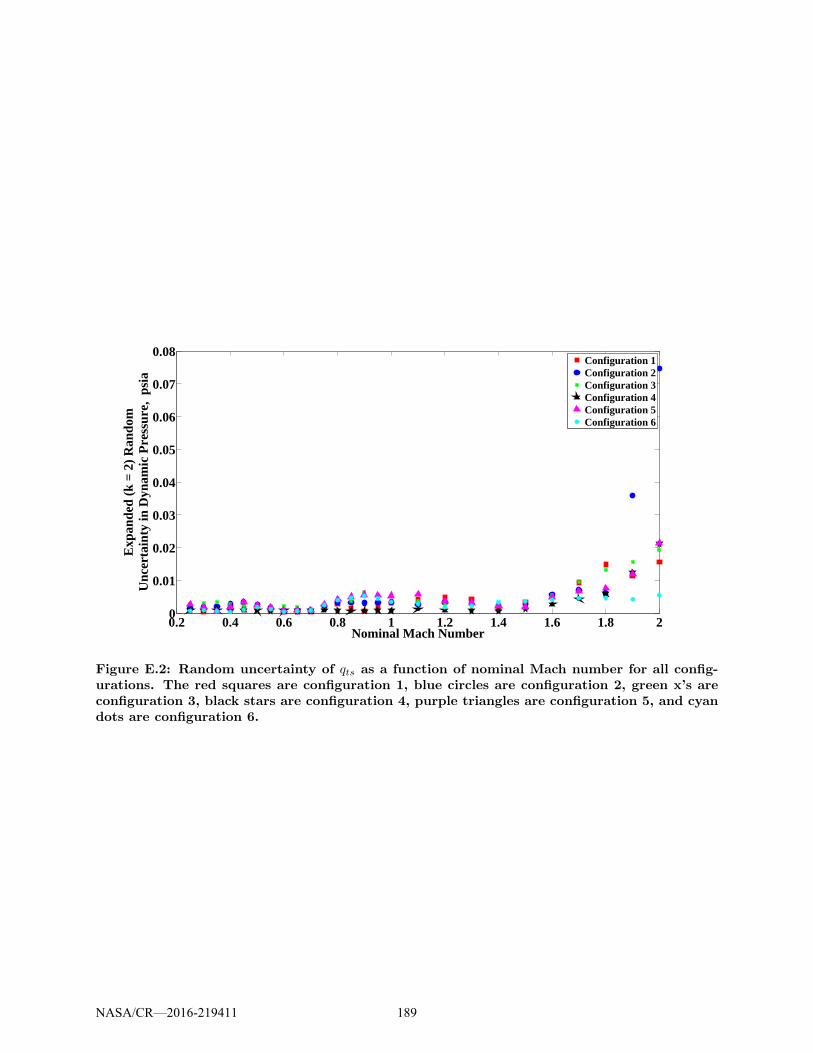
0.2 0.4 0.6 0.8 1 1.2 1.4 1.6 1.8 20
0.01
0.02
0.03
0.04
0.05
0.06
0.07
0.08
Nominal Mach Number
Exp
ande
d (k
= 2
) R
ando
mU
ncer
tain
ty in
Dyn
amic
Pre
ssur
e, p
sia
Configuration 1Configuration 2Configuration 3Configuration 4Configuration 5Configuration 6
Figure E.2: Random uncertainty of qts as a function of nominal Mach number for all config-urations. The red squares are configuration 1, blue circles are configuration 2, green x’s areconfiguration 3, black stars are configuration 4, purple triangles are configuration 5, and cyandots are configuration 6.
NASA/CR—2016-219411 189

0.5 1 1.5 2
Mach Number
(a) Tunnel configuration 1
0
20
40
60
80
100
% C
on
trib
uti
on
0.5 1 1.5 2
Mach Number
(b) Tunnel configuration 2
0
20
40
60
80
100
% C
on
trib
uti
on
0.5 1 1.5 2
Mach Number
(c) Tunnel configuration 3
0
20
40
60
80
100
% C
on
trib
uti
on
0.5 1 1.5 2
Mach Number
(d) Tunnel configuration 4
0
20
40
60
80
100%
Con
trib
uti
on
0.5 1 1.5 2
Mach Number
(e) Tunnel configuration 5
0
20
40
60
80
100
% C
on
trib
uti
on
0.5 1 1.5 2
Mach Number
(f) Tunnel configuration 6
0
20
40
60
80
100
% C
on
trib
uti
on
sP
T,bm
sP
S,bal
Figure E.3: Random UPC of qts as a function of nominal Mach number for all configurations.Red is the random uncertainty of the total pressure in the bellmouth, yellow is the randomuncertainty of the static pressure in the balance chamber.
NASA/CR—2016-219411 190
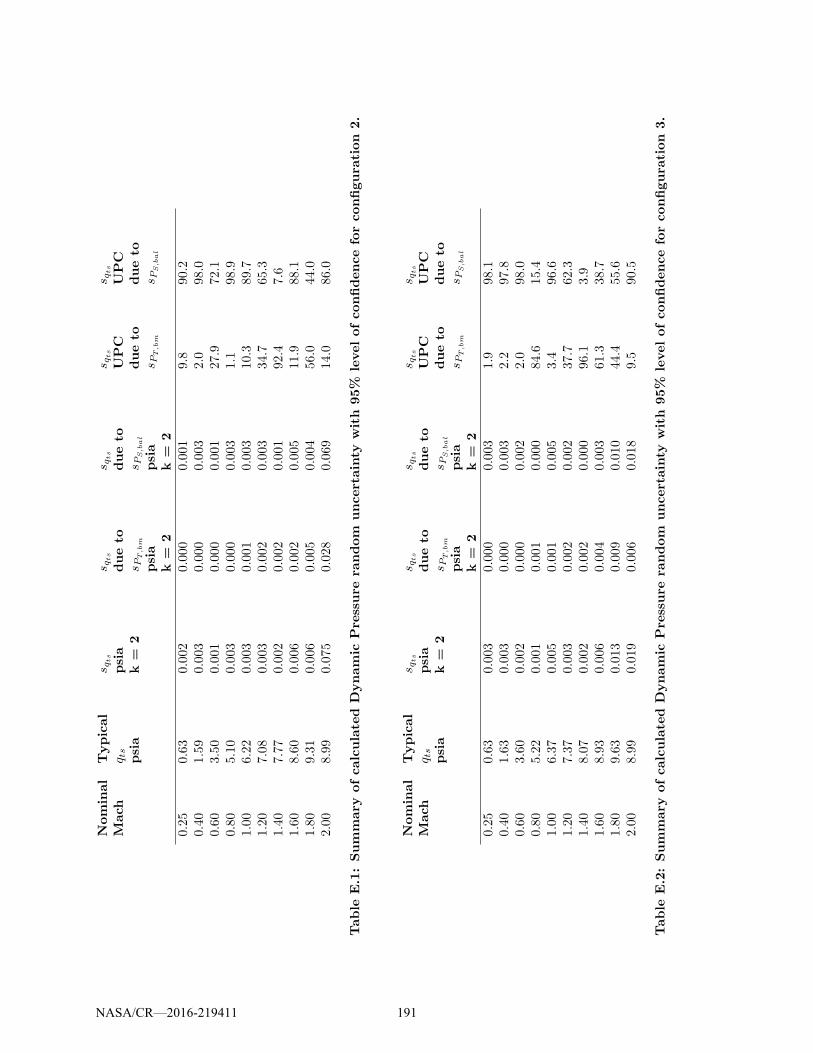
Nominal
Mach
Typical
q ts
psia
sqts
psia
k=
2
sqts
dueto
sP
T,bm
psia
k=
2
sqts
dueto
sP
S,bal
psia
k=
2
sqts
UPC
dueto
sP
T,bm
sqts
UPC
dueto
sP
S,bal
0.25
0.63
0.00
20.00
00.00
19.8
90.2
0.40
1.59
0.00
30.00
00.00
32.0
98.0
0.60
3.50
0.00
10.00
00.00
127
.972
.10.80
5.10
0.00
30.00
00.00
31.1
98.9
1.00
6.22
0.00
30.00
10.00
310
.389
.71.20
7.08
0.00
30.00
20.00
334
.765
.31.40
7.77
0.00
20.00
20.00
192
.47.6
1.60
8.60
0.00
60.00
20.00
511
.988
.11.80
9.31
0.00
60.00
50.00
456
.044
.02.00
8.99
0.07
50.02
80.06
914
.086
.0
Table
E.1:Summary
ofcalculated
Dynamic
Pressure
random
uncertainty
with
95%
levelofconfidenceforconfigura
tion
2.
Nominal
Mach
Typical
q ts
psia
sqts
psia
k=
2
sqts
dueto
sP
T,bm
psia
k=
2
sqts
dueto
sP
S,bal
psia
k=
2
sqts
UPC
dueto
sP
T,bm
sqts
UPC
dueto
sP
S,bal
0.25
0.63
0.00
30.00
00.00
31.9
98.1
0.40
1.63
0.00
30.00
00.00
32.2
97.8
0.60
3.60
0.00
20.00
00.00
22.0
98.0
0.80
5.22
0.00
10.00
10.00
084
.615
.41.00
6.37
0.00
50.00
10.00
53.4
96.6
1.20
7.37
0.00
30.00
20.00
237
.762
.31.40
8.07
0.00
20.00
20.00
096
.13.9
1.60
8.93
0.00
60.00
40.00
361
.338
.71.80
9.63
0.01
30.00
90.01
044
.455
.62.00
8.99
0.01
90.00
60.01
89.5
90.5
Table
E.2:Summary
ofcalculated
Dynamic
Pressure
random
uncertainty
with
95%
levelofconfidenceforconfigura
tion
3.
NASA/CR—2016-219411 191
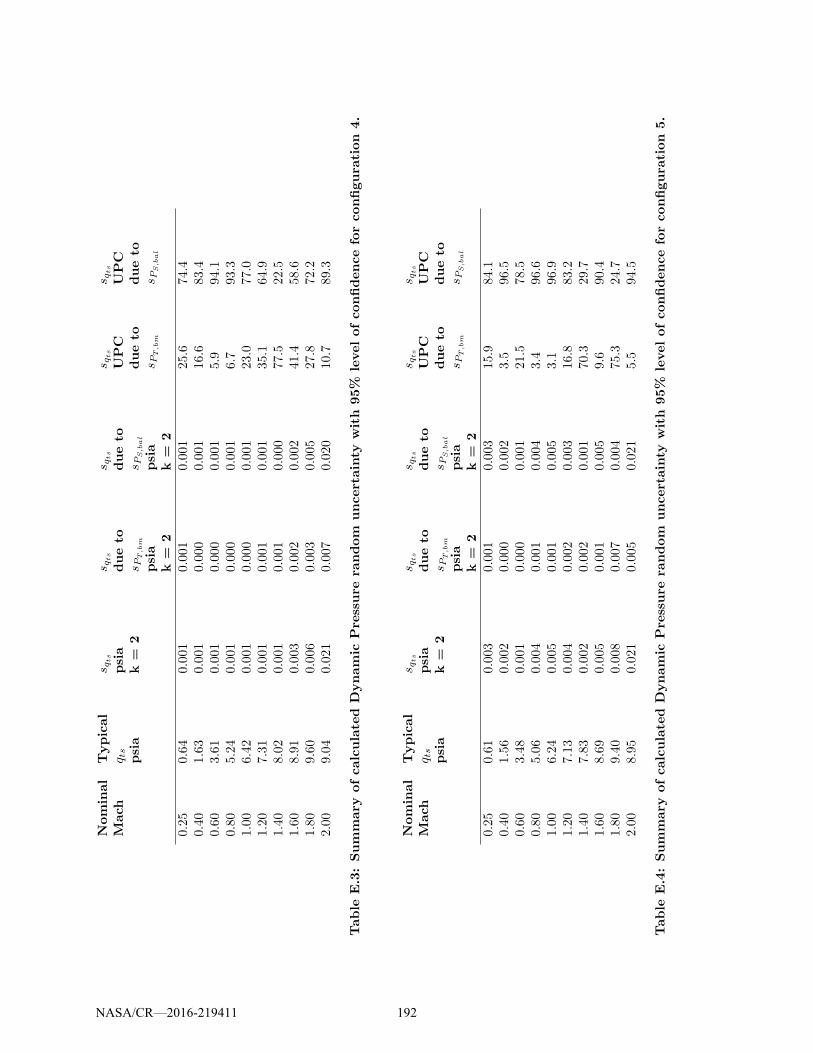
Nominal
Mach
Typical
q ts
psia
sqts
psia
k=
2
sqts
dueto
sP
T,bm
psia
k=
2
sqts
dueto
sP
S,bal
psia
k=
2
sqts
UPC
dueto
sP
T,bm
sqts
UPC
dueto
sP
S,bal
0.25
0.64
0.00
10.00
10.00
125
.674
.40.40
1.63
0.00
10.00
00.00
116
.683
.40.60
3.61
0.00
10.00
00.00
15.9
94.1
0.80
5.24
0.00
10.00
00.00
16.7
93.3
1.00
6.42
0.00
10.00
00.00
123
.077
.01.20
7.31
0.00
10.00
10.00
135
.164
.91.40
8.02
0.00
10.00
10.00
077
.522
.51.60
8.91
0.00
30.00
20.00
241
.458
.61.80
9.60
0.00
60.00
30.00
527
.872
.22.00
9.04
0.02
10.00
70.02
010
.789
.3
Table
E.3:Summary
ofcalculated
Dynamic
Pressure
random
uncertainty
with
95%
levelofconfidenceforconfigura
tion
4.
Nominal
Mach
Typical
q ts
psia
sqts
psia
k=
2
sqts
dueto
sP
T,bm
psia
k=
2
sqts
dueto
sP
S,bal
psia
k=
2
sqts
UPC
dueto
sP
T,bm
sqts
UPC
dueto
sP
S,bal
0.25
0.61
0.00
30.00
10.00
315
.984
.10.40
1.56
0.00
20.00
00.00
23.5
96.5
0.60
3.48
0.00
10.00
00.00
121
.578
.50.80
5.06
0.00
40.00
10.00
43.4
96.6
1.00
6.24
0.00
50.00
10.00
53.1
96.9
1.20
7.13
0.00
40.00
20.00
316
.883
.21.40
7.83
0.00
20.00
20.00
170
.329
.71.60
8.69
0.00
50.00
10.00
59.6
90.4
1.80
9.40
0.00
80.00
70.00
475
.324
.72.00
8.95
0.02
10.00
50.02
15.5
94.5
Table
E.4:Summary
ofcalculated
Dynamic
Pressure
random
uncertainty
with
95%
levelofconfidenceforconfigura
tion
5.
NASA/CR—2016-219411 192
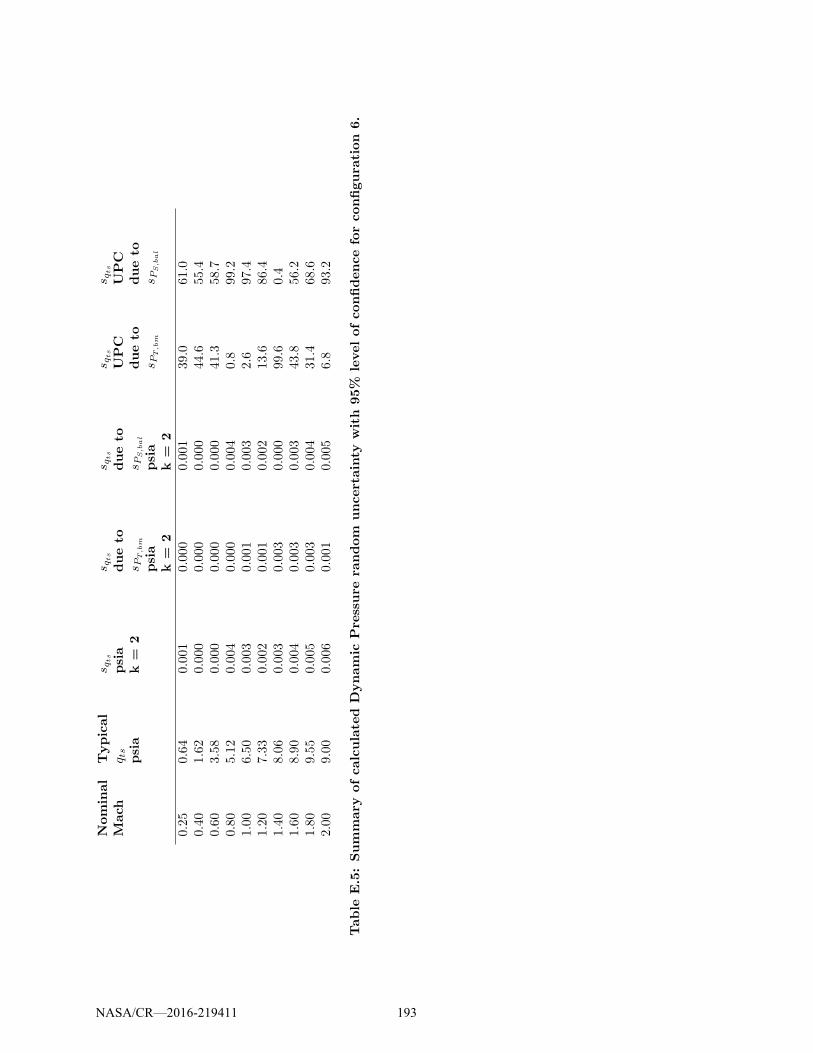
Nominal
Mach
Typical
q ts
psia
sqts
psia
k=
2
sqts
dueto
sP
T,bm
psia
k=
2
sqts
dueto
sP
S,bal
psia
k=
2
sqts
UPC
dueto
sP
T,bm
sqts
UPC
dueto
sP
S,bal
0.25
0.64
0.00
10.00
00.00
139
.061
.00.40
1.62
0.00
00.00
00.00
044
.655
.40.60
3.58
0.00
00.00
00.00
041
.358
.70.80
5.12
0.00
40.00
00.00
40.8
99.2
1.00
6.50
0.00
30.00
10.00
32.6
97.4
1.20
7.33
0.00
20.00
10.00
213
.686
.41.40
8.06
0.00
30.00
30.00
099
.60.4
1.60
8.90
0.00
40.00
30.00
343
.856
.21.80
9.55
0.00
50.00
30.00
431
.468
.62.00
9.00
0.00
60.00
10.00
56.8
93.2
Table
E.5:Summary
ofcalculated
Dynamic
Pressure
random
uncertainty
with
95%
levelofconfidenceforconfigura
tion
6.
NASA/CR—2016-219411 193
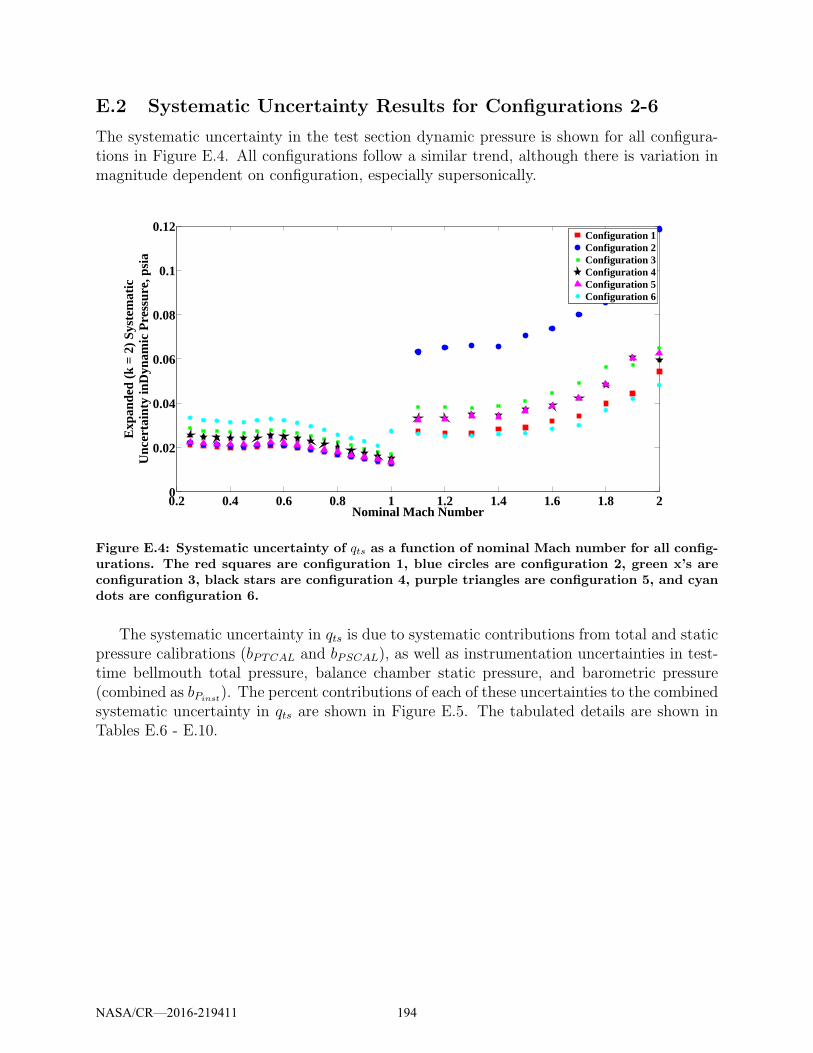
E.2 Systematic Uncertainty Results for Configurations 2-6
The systematic uncertainty in the test section dynamic pressure is shown for all configura-tions in Figure E.4. All configurations follow a similar trend, although there is variation inmagnitude dependent on configuration, especially supersonically.
0.2 0.4 0.6 0.8 1 1.2 1.4 1.6 1.8 20
0.02
0.04
0.06
0.08
0.1
0.12
Nominal Mach Number
Exp
ande
d (k
= 2
) S
yste
mat
icU
ncer
tain
ty in
Dyn
amic
Pre
ssur
e, p
sia
Configuration 1Configuration 2Configuration 3Configuration 4Configuration 5Configuration 6
Figure E.4: Systematic uncertainty of qts as a function of nominal Mach number for all config-urations. The red squares are configuration 1, blue circles are configuration 2, green x’s areconfiguration 3, black stars are configuration 4, purple triangles are configuration 5, and cyandots are configuration 6.
The systematic uncertainty in qts is due to systematic contributions from total and staticpressure calibrations (bPTCAL and bPSCAL), as well as instrumentation uncertainties in test-time bellmouth total pressure, balance chamber static pressure, and barometric pressure(combined as bPinst
). The percent contributions of each of these uncertainties to the combinedsystematic uncertainty in qts are shown in Figure E.5. The tabulated details are shown inTables E.6 - E.10.
NASA/CR—2016-219411 194
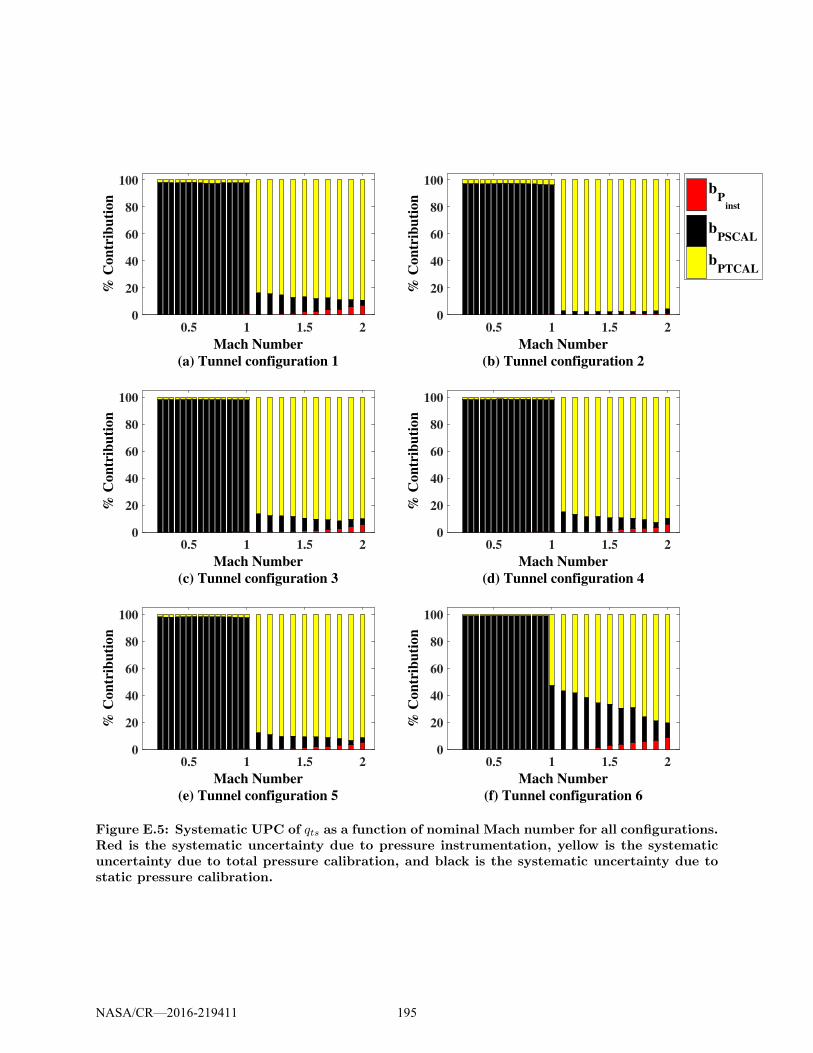
0.5 1 1.5 2
Mach Number
(a) Tunnel configuration 1
0
20
40
60
80
100
% C
on
trib
uti
on
0.5 1 1.5 2
Mach Number
(b) Tunnel configuration 2
0
20
40
60
80
100
% C
on
trib
uti
on
0.5 1 1.5 2
Mach Number
(c) Tunnel configuration 3
0
20
40
60
80
100
% C
on
trib
uti
on
0.5 1 1.5 2
Mach Number
(d) Tunnel configuration 4
0
20
40
60
80
100
% C
on
trib
uti
on
0.5 1 1.5 2
Mach Number
(e) Tunnel configuration 5
0
20
40
60
80
100
% C
on
trib
uti
on
0.5 1 1.5 2
Mach Number
(f) Tunnel configuration 6
0
20
40
60
80
100
% C
on
trib
uti
on
bP
inst
bPSCAL
bPTCAL
Figure E.5: Systematic UPC of qts as a function of nominal Mach number for all configurations.Red is the systematic uncertainty due to pressure instrumentation, yellow is the systematicuncertainty due to total pressure calibration, and black is the systematic uncertainty due tostatic pressure calibration.
NASA/CR—2016-219411 195

Nominal
Mach
Typical
q ts
psia
b qts
psia
k=
2
b qts
dueto
b PInst
psia
k=
2
b qts
dueto
b PSCAL
psia
k=
2
b qts
dueto
b PTCAL
psia
k=
2
b qts
UPC
dueto
b PInst
b qts
UPC
dueto
b PSCAL
b qts
UPC
dueto
b PTCAL
0.25
0.63
0.02
20.00
00.02
20.00
40.0
97.3
2.7
0.40
1.59
0.02
10.00
00.02
00.00
30.0
97.2
2.8
0.60
3.50
0.02
10.00
00.02
10.00
30.0
97.5
2.4
0.80
5.10
0.01
70.00
10.01
70.00
30.1
97.1
2.8
1.00
6.22
0.01
30.00
10.01
30.00
20.6
95.7
3.7
1.20
7.08
0.06
50.00
20.01
10.06
40.1
2.7
97.2
1.40
7.77
0.06
60.00
30.01
00.06
50.2
2.5
97.3
1.60
8.60
0.07
40.00
50.01
10.07
30.5
2.1
97.3
1.80
9.31
0.08
60.00
90.01
20.08
41.0
1.8
97.2
2.00
8.99
0.11
90.01
20.02
20.11
61.0
3.4
95.6
Table
E.6:Summary
ofcalculated
Dynamic
Pressure
systematicuncertainty
with
95%
levelofconfidenceforconfigura
tion
2.
Nominal
Mach
Typical
q ts
psia
b qts
psia
k=
2
b qts
dueto
b PInst
psia
k=
2
b qts
dueto
b PSCAL
psia
k=
2
b qts
dueto
b PTCAL
psia
k=
2
b qts
UPC
dueto
b PInst
b qts
UPC
dueto
b PSCAL
b qts
UPC
dueto
b PTCAL
0.25
0.63
0.02
90.00
00.02
80.00
40.0
98.3
1.7
0.40
1.63
0.02
70.00
00.02
70.00
40.0
98.2
1.8
0.60
3.60
0.02
70.00
10.02
70.00
30.0
98.3
1.6
0.80
5.22
0.02
20.00
10.02
20.00
30.1
98.2
1.8
1.00
6.37
0.01
70.00
10.01
70.00
20.3
97.6
2.1
1.20
7.37
0.03
80.00
20.01
30.03
60.2
12.2
87.6
1.40
8.07
0.03
90.00
30.01
30.03
60.7
11.1
88.2
1.60
8.93
0.04
50.00
50.01
30.04
21.4
8.2
90.3
1.80
9.63
0.05
60.00
90.01
40.05
42.4
5.9
91.7
2.00
8.99
0.06
50.01
50.01
40.06
25.5
4.6
89.9
Table
E.7:Summary
ofcalculated
Dynamic
Pressure
systematicuncertainty
with
95%
levelofconfidenceforconfigura
tion
3.
NASA/CR—2016-219411 196
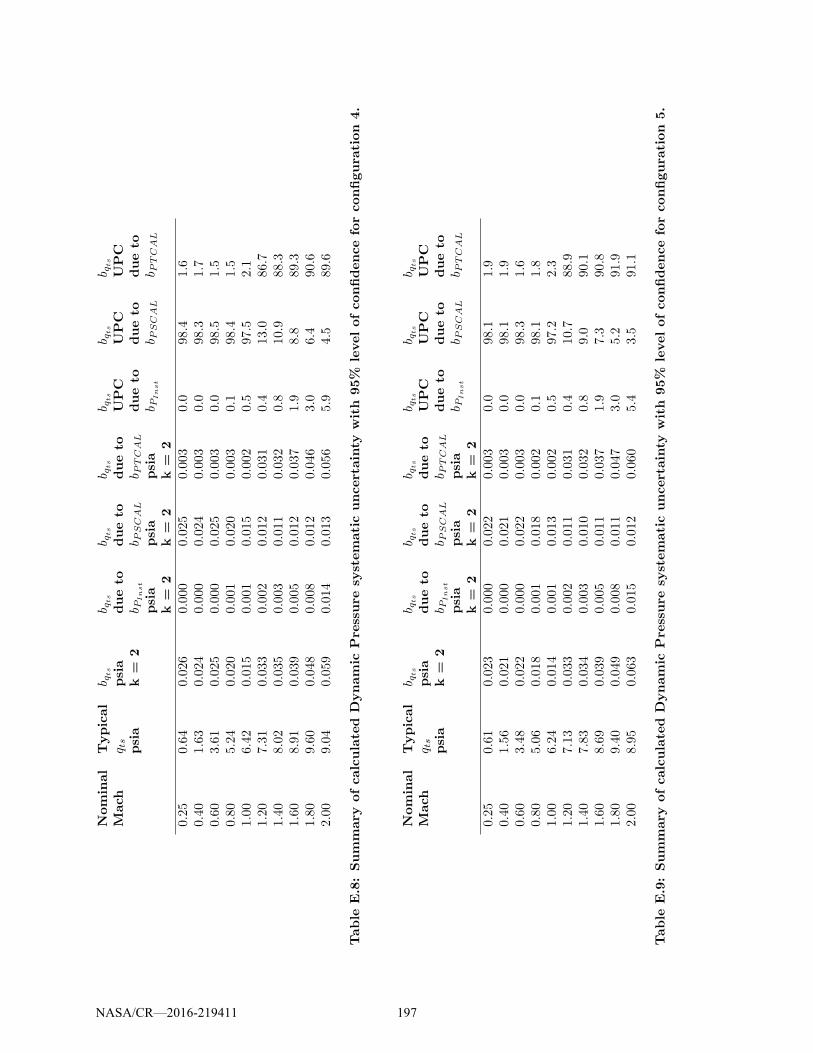
Nominal
Mach
Typical
q ts
psia
b qts
psia
k=
2
b qts
dueto
b PInst
psia
k=
2
b qts
dueto
b PSCAL
psia
k=
2
b qts
dueto
b PTCAL
psia
k=
2
b qts
UPC
dueto
b PInst
b qts
UPC
dueto
b PSCAL
b qts
UPC
dueto
b PTCAL
0.25
0.64
0.02
60.00
00.02
50.00
30.0
98.4
1.6
0.40
1.63
0.02
40.00
00.02
40.00
30.0
98.3
1.7
0.60
3.61
0.02
50.00
00.02
50.00
30.0
98.5
1.5
0.80
5.24
0.02
00.00
10.02
00.00
30.1
98.4
1.5
1.00
6.42
0.01
50.00
10.01
50.00
20.5
97.5
2.1
1.20
7.31
0.03
30.00
20.01
20.03
10.4
13.0
86.7
1.40
8.02
0.03
50.00
30.01
10.03
20.8
10.9
88.3
1.60
8.91
0.03
90.00
50.01
20.03
71.9
8.8
89.3
1.80
9.60
0.04
80.00
80.01
20.04
63.0
6.4
90.6
2.00
9.04
0.05
90.01
40.01
30.05
65.9
4.5
89.6
Table
E.8:Summary
ofcalculated
Dynamic
Pressure
systematicuncertainty
with
95%
levelofconfidenceforconfigura
tion
4.
Nominal
Mach
Typical
q ts
psia
b qts
psia
k=
2
b qts
dueto
b PInst
psia
k=
2
b qts
dueto
b PSCAL
psia
k=
2
b qts
dueto
b PTCAL
psia
k=
2
b qts
UPC
dueto
b PInst
b qts
UPC
dueto
b PSCAL
b qts
UPC
dueto
b PTCAL
0.25
0.61
0.02
30.00
00.02
20.00
30.0
98.1
1.9
0.40
1.56
0.02
10.00
00.02
10.00
30.0
98.1
1.9
0.60
3.48
0.02
20.00
00.02
20.00
30.0
98.3
1.6
0.80
5.06
0.01
80.00
10.01
80.00
20.1
98.1
1.8
1.00
6.24
0.01
40.00
10.01
30.00
20.5
97.2
2.3
1.20
7.13
0.03
30.00
20.01
10.03
10.4
10.7
88.9
1.40
7.83
0.03
40.00
30.01
00.03
20.8
9.0
90.1
1.60
8.69
0.03
90.00
50.01
10.03
71.9
7.3
90.8
1.80
9.40
0.04
90.00
80.01
10.04
73.0
5.2
91.9
2.00
8.95
0.06
30.01
50.01
20.06
05.4
3.5
91.1
Table
E.9:Summary
ofcalculated
Dynamic
Pressure
systematicuncertainty
with
95%
levelofconfidenceforconfigura
tion
5.
NASA/CR—2016-219411 197
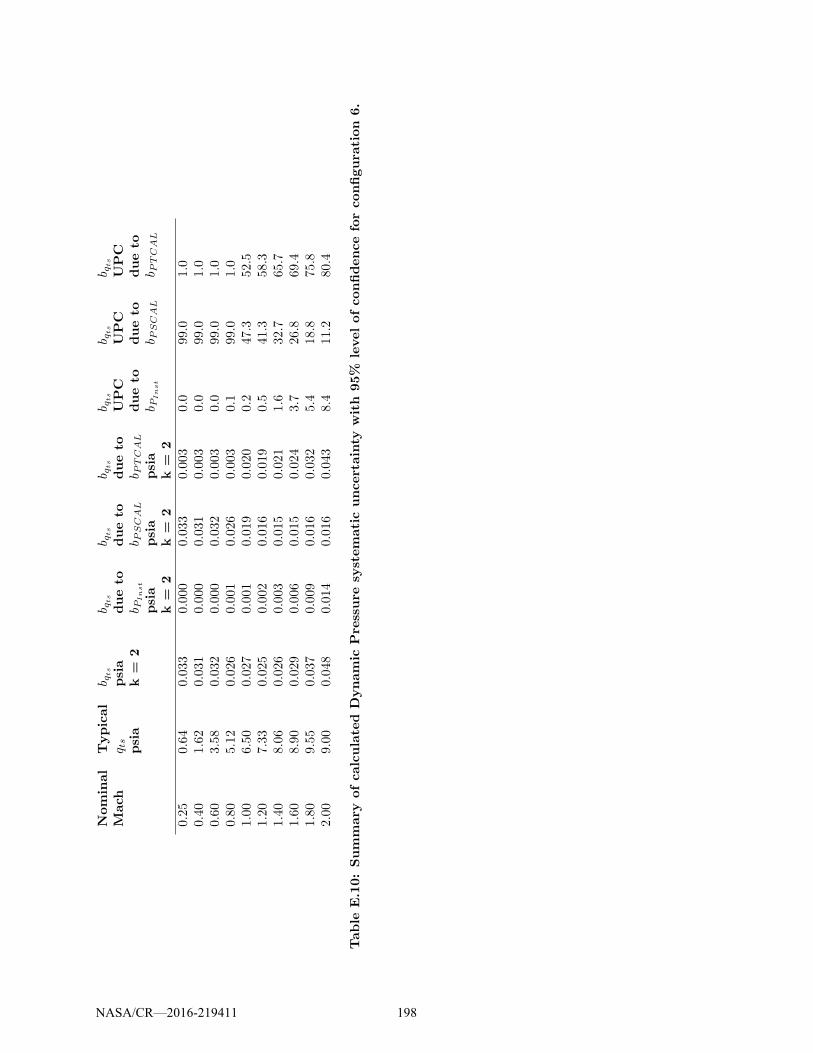
Nominal
Mach
Typical
q ts
psia
b qts
psia
k=
2
b qts
dueto
b PInst
psia
k=
2
b qts
dueto
b PSCAL
psia
k=
2
b qts
dueto
b PTCAL
psia
k=
2
b qts
UPC
dueto
b PInst
b qts
UPC
dueto
b PSCAL
b qts
UPC
dueto
b PTCAL
0.25
0.64
0.03
30.00
00.03
30.00
30.0
99.0
1.0
0.40
1.62
0.03
10.00
00.03
10.00
30.0
99.0
1.0
0.60
3.58
0.03
20.00
00.03
20.00
30.0
99.0
1.0
0.80
5.12
0.02
60.00
10.02
60.00
30.1
99.0
1.0
1.00
6.50
0.02
70.00
10.01
90.02
00.2
47.3
52.5
1.20
7.33
0.02
50.00
20.01
60.01
90.5
41.3
58.3
1.40
8.06
0.02
60.00
30.01
50.02
11.6
32.7
65.7
1.60
8.90
0.02
90.00
60.01
50.02
43.7
26.8
69.4
1.80
9.55
0.03
70.00
90.01
60.03
25.4
18.8
75.8
2.00
9.00
0.04
80.01
40.01
60.04
38.4
11.2
80.4
Table
E.10:Summary
ofcalculated
Dynamic
Pressure
systematicuncertainty
with
95%
levelofconfidenceforconfigura
tion
6.
NASA/CR—2016-219411 198
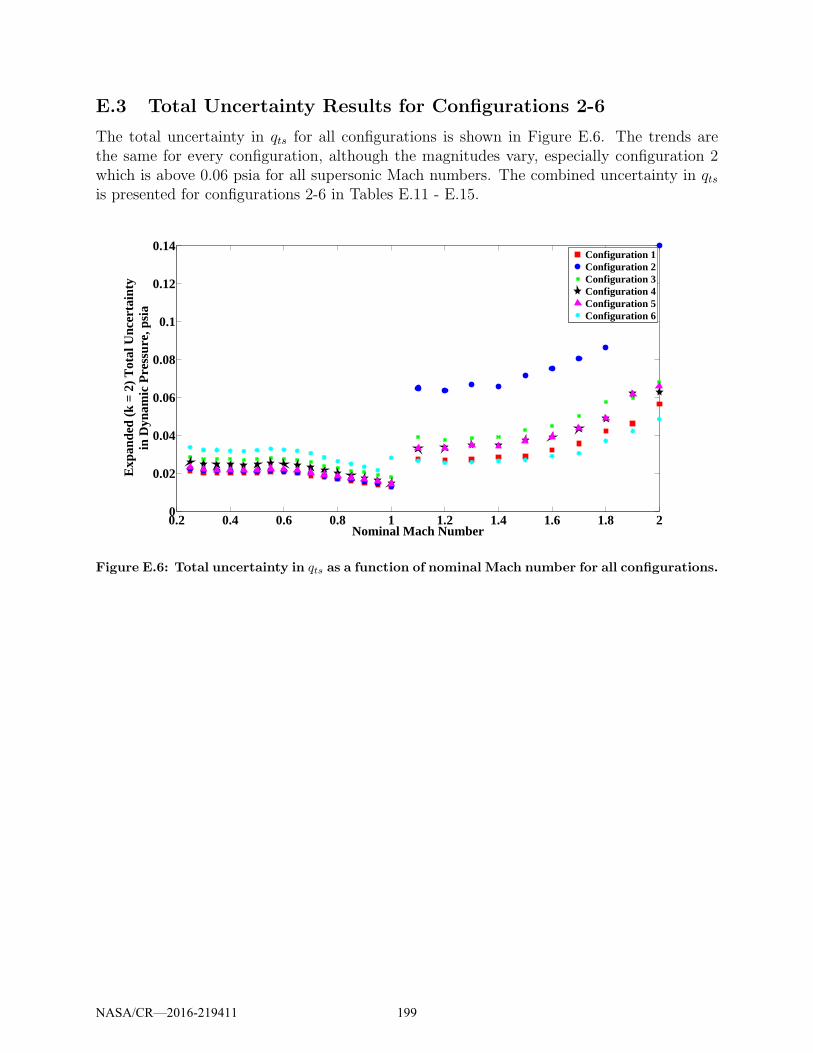
E.3 Total Uncertainty Results for Configurations 2-6
The total uncertainty in qts for all configurations is shown in Figure E.6. The trends arethe same for every configuration, although the magnitudes vary, especially configuration 2which is above 0.06 psia for all supersonic Mach numbers. The combined uncertainty in qtsis presented for configurations 2-6 in Tables E.11 - E.15.
0.2 0.4 0.6 0.8 1 1.2 1.4 1.6 1.8 20
0.02
0.04
0.06
0.08
0.1
0.12
0.14
Nominal Mach Number
Exp
ande
d (k
= 2
) T
otal
Unc
erta
inty
in D
ynam
ic P
ress
ure,
psi
a
Configuration 1Configuration 2Configuration 3Configuration 4Configuration 5Configuration 6
Figure E.6: Total uncertainty in qts as a function of nominal Mach number for all configurations.
NASA/CR—2016-219411 199
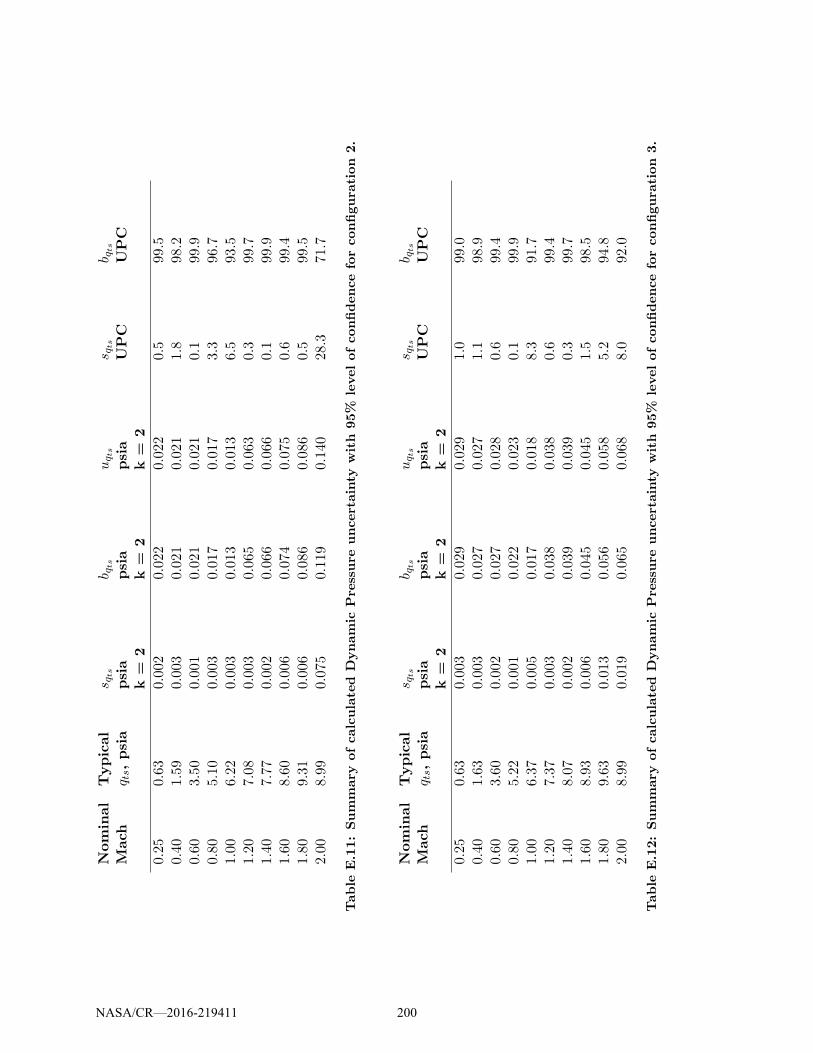
Nominal
Mach
Typical
q ts,psia
sqts
psia
k=
2
b qts
psia
k=
2
uqts
psia
k=
2
sqts
UPC
b qts
UPC
0.25
0.63
0.002
0.022
0.022
0.5
99.5
0.40
1.59
0.003
0.021
0.021
1.8
98.2
0.60
3.50
0.001
0.021
0.021
0.1
99.9
0.80
5.10
0.003
0.017
0.017
3.3
96.7
1.00
6.22
0.003
0.013
0.013
6.5
93.5
1.20
7.08
0.003
0.065
0.063
0.3
99.7
1.40
7.77
0.002
0.066
0.066
0.1
99.9
1.60
8.60
0.006
0.074
0.075
0.6
99.4
1.80
9.31
0.006
0.086
0.086
0.5
99.5
2.00
8.99
0.075
0.119
0.140
28.3
71.7
Table
E.11:Summary
ofcalculated
Dynamic
Pressure
uncertainty
with
95%
levelofconfidenceforconfigura
tion
2.
Nominal
Mach
Typical
q ts,psia
sqts
psia
k=
2
b qts
psia
k=
2
uqts
psia
k=
2
sqts
UPC
b qts
UPC
0.25
0.63
0.003
0.029
0.029
1.0
99.0
0.40
1.63
0.003
0.027
0.027
1.1
98.9
0.60
3.60
0.002
0.027
0.028
0.6
99.4
0.80
5.22
0.001
0.022
0.023
0.1
99.9
1.00
6.37
0.005
0.017
0.018
8.3
91.7
1.20
7.37
0.003
0.038
0.038
0.6
99.4
1.40
8.07
0.002
0.039
0.039
0.3
99.7
1.60
8.93
0.006
0.045
0.045
1.5
98.5
1.80
9.63
0.013
0.056
0.058
5.2
94.8
2.00
8.99
0.019
0.065
0.068
8.0
92.0
Table
E.12:Summary
ofcalculated
Dynamic
Pressure
uncertainty
with
95%
levelofconfidenceforconfigura
tion
3.
NASA/CR—2016-219411 200
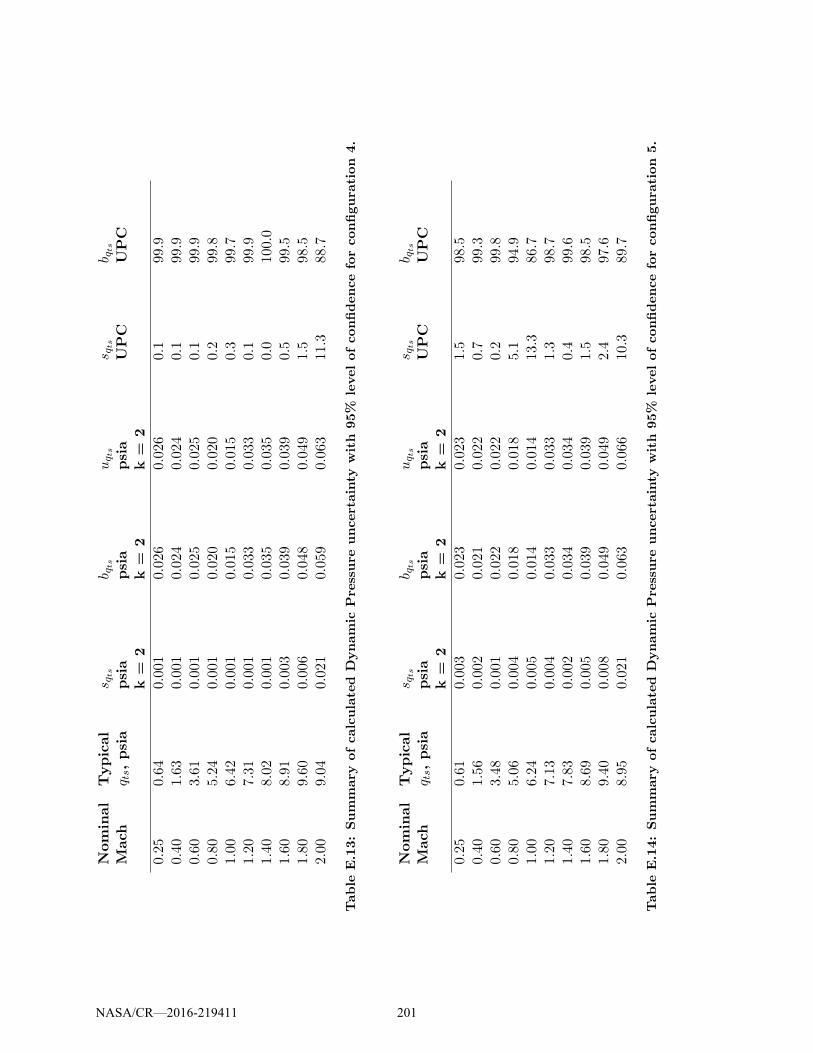
Nominal
Mach
Typical
q ts,psia
sqts
psia
k=
2
b qts
psia
k=
2
uqts
psia
k=
2
sqts
UPC
b qts
UPC
0.25
0.64
0.001
0.026
0.026
0.1
99.9
0.40
1.63
0.001
0.024
0.024
0.1
99.9
0.60
3.61
0.001
0.025
0.025
0.1
99.9
0.80
5.24
0.001
0.020
0.020
0.2
99.8
1.00
6.42
0.001
0.015
0.015
0.3
99.7
1.20
7.31
0.001
0.033
0.033
0.1
99.9
1.40
8.02
0.001
0.035
0.035
0.0
100.0
1.60
8.91
0.003
0.039
0.039
0.5
99.5
1.80
9.60
0.006
0.048
0.049
1.5
98.5
2.00
9.04
0.021
0.059
0.063
11.3
88.7
Table
E.13:Summary
ofcalculated
Dynamic
Pressure
uncertainty
with
95%
levelofconfidenceforconfigura
tion
4.
Nominal
Mach
Typical
q ts,psia
sqts
psia
k=
2
b qts
psia
k=
2
uqts
psia
k=
2
sqts
UPC
b qts
UPC
0.25
0.61
0.003
0.023
0.023
1.5
98.5
0.40
1.56
0.002
0.021
0.022
0.7
99.3
0.60
3.48
0.001
0.022
0.022
0.2
99.8
0.80
5.06
0.004
0.018
0.018
5.1
94.9
1.00
6.24
0.005
0.014
0.014
13.3
86.7
1.20
7.13
0.004
0.033
0.033
1.3
98.7
1.40
7.83
0.002
0.034
0.034
0.4
99.6
1.60
8.69
0.005
0.039
0.039
1.5
98.5
1.80
9.40
0.008
0.049
0.049
2.4
97.6
2.00
8.95
0.021
0.063
0.066
10.3
89.7
Table
E.14:Summary
ofcalculated
Dynamic
Pressure
uncertainty
with
95%
levelofconfidenceforconfigura
tion
5.
NASA/CR—2016-219411 201
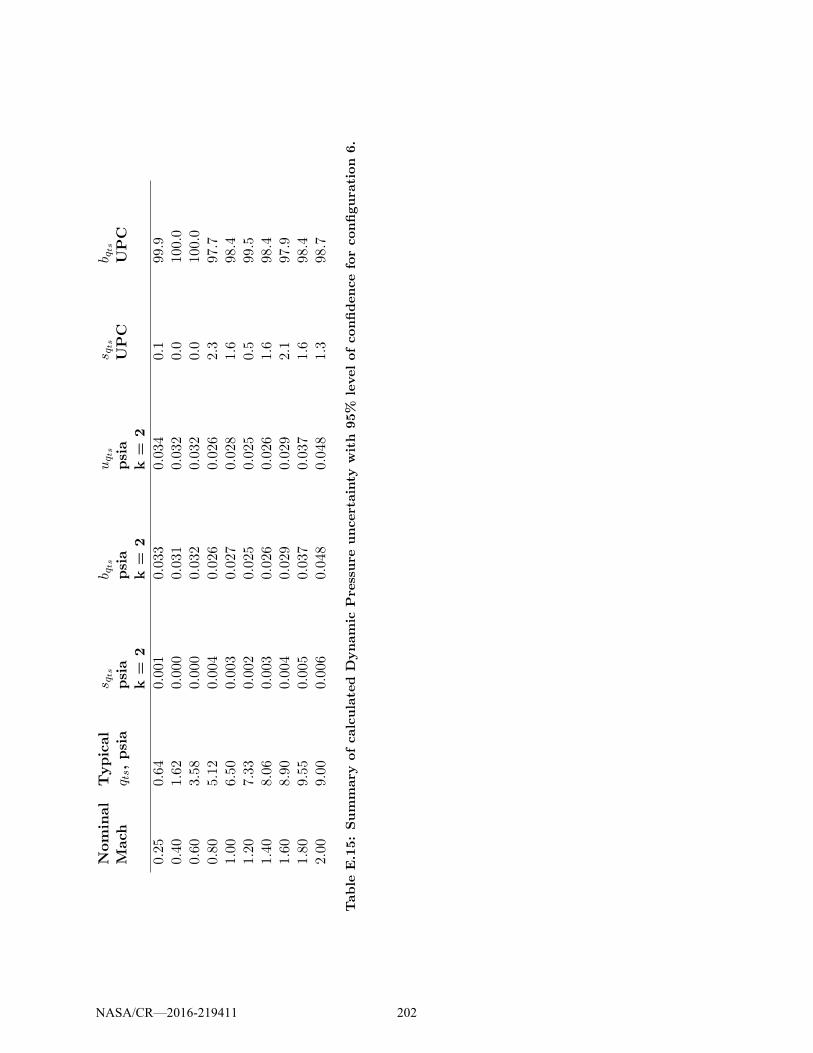
Nominal
Mach
Typical
q ts,psia
sqts
psia
k=
2
b qts
psia
k=
2
uqts
psia
k=
2
sqts
UPC
b qts
UPC
0.25
0.64
0.001
0.033
0.034
0.1
99.9
0.40
1.62
0.000
0.031
0.032
0.0
100.0
0.60
3.58
0.000
0.032
0.032
0.0
100.0
0.80
5.12
0.004
0.026
0.026
2.3
97.7
1.00
6.50
0.003
0.027
0.028
1.6
98.4
1.20
7.33
0.002
0.025
0.025
0.5
99.5
1.40
8.06
0.003
0.026
0.026
1.6
98.4
1.60
8.90
0.004
0.029
0.029
2.1
97.9
1.80
9.55
0.005
0.037
0.037
1.6
98.4
2.00
9.00
0.006
0.048
0.048
1.3
98.7
Table
E.15:Summary
ofcalculated
Dynamic
Pressure
uncertainty
with
95%
levelofconfidenceforconfigura
tion
6.
NASA/CR—2016-219411 202
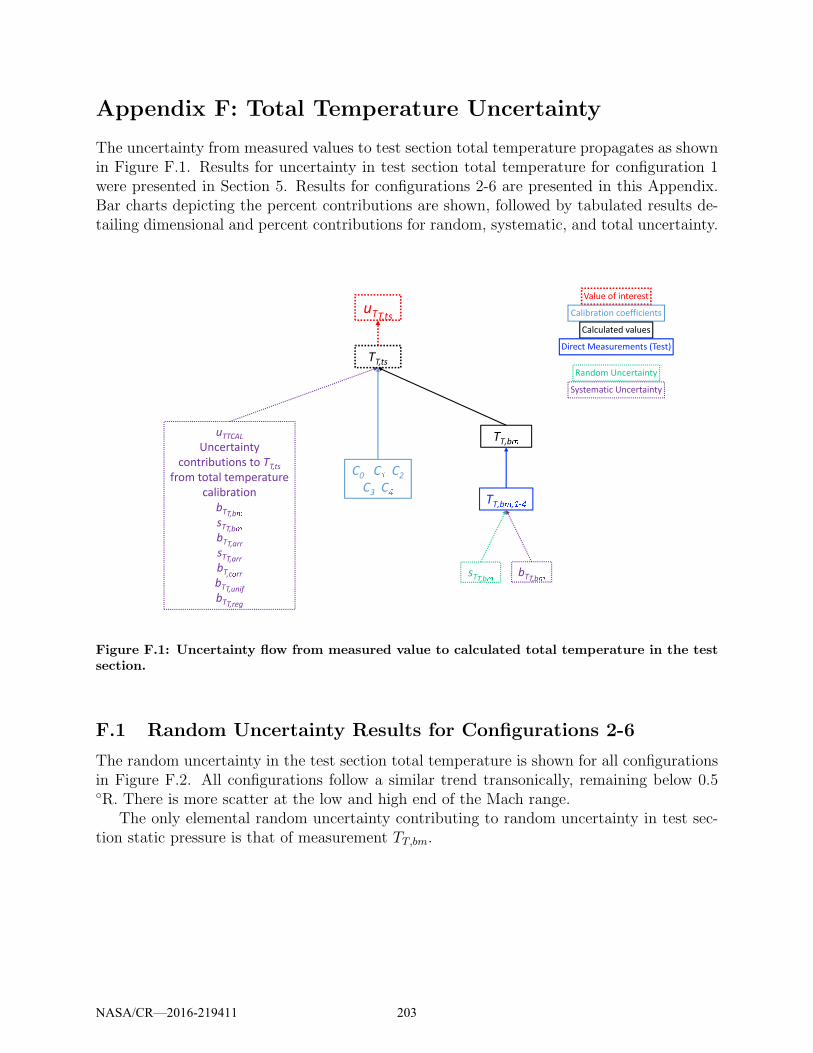
Appendix F: Total Temperature Uncertainty
The uncertainty from measured values to test section total temperature propagates as shownin Figure F.1. Results for uncertainty in test section total temperature for configuration 1were presented in Section 5. Results for configurations 2-6 are presented in this Appendix.Bar charts depicting the percent contributions are shown, followed by tabulated results de-tailing dimensional and percent contributions for random, systematic, and total uncertainty.
uTT,ts
Value of interest
Calibration coefficients
Calculated values
Direct Measurements (Test)
Random Uncertainty
Systematic Uncertainty
C0 C1 C2C3 C4
TT,b%uTTCAL
Uncertainty
contributions to TT,tsfrom total temperature
calibration
bTT,b&sTT,b&bTT,arrsTT,arrbT,c'rrbTT,unifbTT,reg
TT,b%,1-4
sTT,b& bTT,b&
TT,ts
Figure F.1: Uncertainty flow from measured value to calculated total temperature in the testsection.
F.1 Random Uncertainty Results for Configurations 2-6
The random uncertainty in the test section total temperature is shown for all configurationsin Figure F.2. All configurations follow a similar trend transonically, remaining below 0.5◦R. There is more scatter at the low and high end of the Mach range.
The only elemental random uncertainty contributing to random uncertainty in test sec-tion static pressure is that of measurement TT,bm.
NASA/CR—2016-219411 203

0.2 0.4 0.6 0.8 1 1.2 1.4 1.6 1.8 20
0.5
1
1.5
Nominal Mach Number
Exp
ande
d (k
= 2
) R
ando
m
Unc
erta
inty
in T
otal
Tem
pera
ture
, ° R
Configuration 1Configuration 2Configuration 3Configuration 4Configuration 5Configuration 6
Figure F.2: Random uncertainty of TT,ts as a function of nominal Mach number for all config-urations. The red squares are configuration 1, blue circles are configuration 2, green x’s areconfiguration 3, black stars are configuration 4, purple triangles are configuration 5, and cyandots are configuration 6.
NASA/CR—2016-219411 204
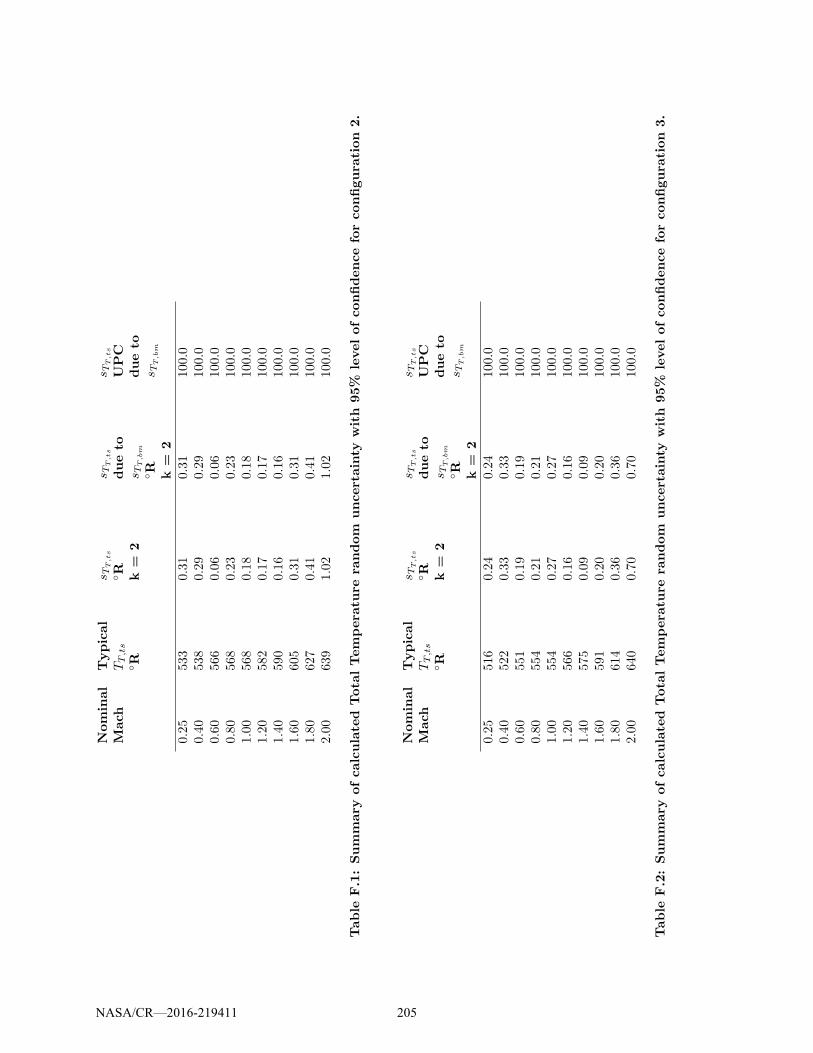
Nominal
Mach
Typical
TT,ts
◦R
sTT,ts
◦R k=
2
sTT,ts
dueto
sTT,bm
◦R k=
2
sTT,ts
UPC
dueto
sTT,bm
0.25
533
0.31
0.31
100.0
0.40
538
0.29
0.29
100.0
0.60
566
0.06
0.06
100.0
0.80
568
0.23
0.23
100.0
1.00
568
0.18
0.18
100.0
1.20
582
0.17
0.17
100.0
1.40
590
0.16
0.16
100.0
1.60
605
0.31
0.31
100.0
1.80
627
0.41
0.41
100.0
2.00
639
1.02
1.02
100.0
Table
F.1:Summary
ofcalculated
Tota
lTempera
ture
random
uncertainty
with
95%
levelofconfidenceforconfigura
tion
2.
Nominal
Mach
Typical
TT,ts
◦R
sTT,ts
◦R k=
2
sTT,ts
dueto
sTT,bm
◦R k=
2
sTT,ts
UPC
dueto
sTT,bm
0.25
516
0.24
0.24
100.0
0.40
522
0.33
0.33
100.0
0.60
551
0.19
0.19
100.0
0.80
554
0.21
0.21
100.0
1.00
554
0.27
0.27
100.0
1.20
566
0.16
0.16
100.0
1.40
575
0.09
0.09
100.0
1.60
591
0.20
0.20
100.0
1.80
614
0.36
0.36
100.0
2.00
640
0.70
0.70
100.0
Table
F.2:Summary
ofcalculated
Tota
lTempera
ture
random
uncertainty
with
95%
levelofconfidenceforconfigura
tion
3.
NASA/CR—2016-219411 205
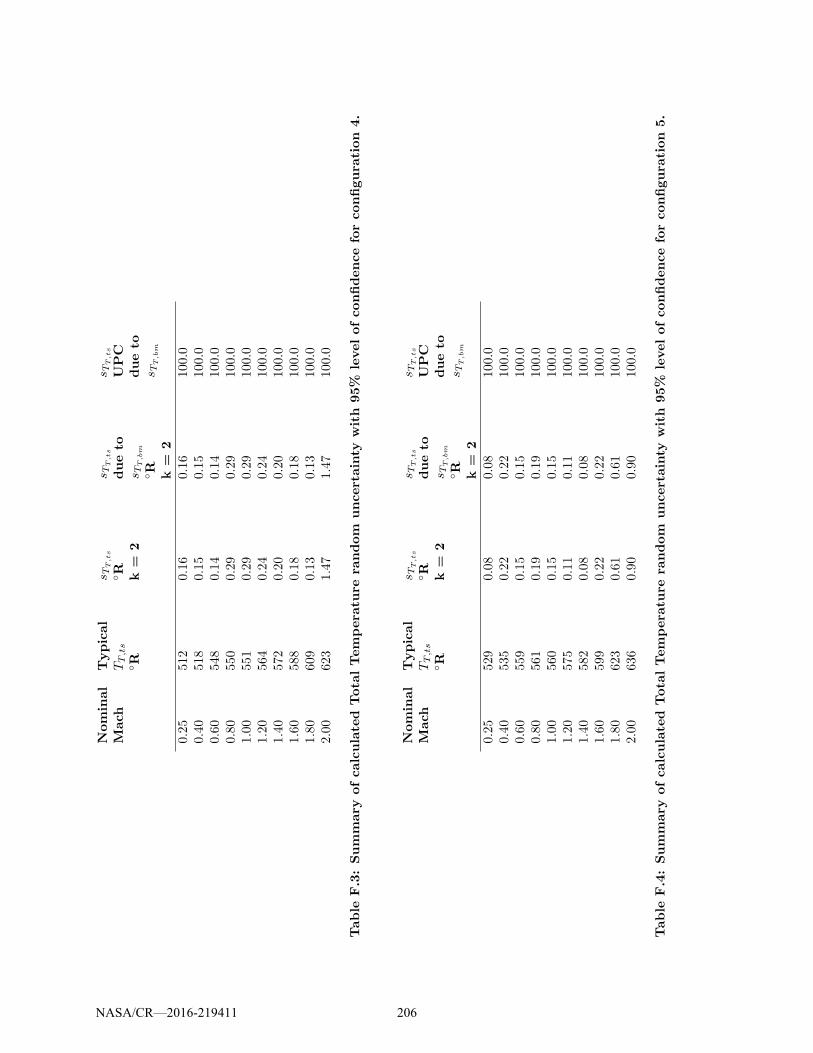
Nominal
Mach
Typical
TT,ts
◦R
sTT,ts
◦R k=
2
sTT,ts
dueto
sTT,bm
◦R k=
2
sTT,ts
UPC
dueto
sTT,bm
0.25
512
0.16
0.16
100.0
0.40
518
0.15
0.15
100.0
0.60
548
0.14
0.14
100.0
0.80
550
0.29
0.29
100.0
1.00
551
0.29
0.29
100.0
1.20
564
0.24
0.24
100.0
1.40
572
0.20
0.20
100.0
1.60
588
0.18
0.18
100.0
1.80
609
0.13
0.13
100.0
2.00
623
1.47
1.47
100.0
Table
F.3:Summary
ofcalculated
Tota
lTempera
ture
random
uncertainty
with
95%
levelofconfidenceforconfigura
tion
4.
Nominal
Mach
Typical
TT,ts
◦R
sTT,ts
◦R k=
2
sTT,ts
dueto
sTT,bm
◦R k=
2
sTT,ts
UPC
dueto
sTT,bm
0.25
529
0.08
0.08
100.0
0.40
535
0.22
0.22
100.0
0.60
559
0.15
0.15
100.0
0.80
561
0.19
0.19
100.0
1.00
560
0.15
0.15
100.0
1.20
575
0.11
0.11
100.0
1.40
582
0.08
0.08
100.0
1.60
599
0.22
0.22
100.0
1.80
623
0.61
0.61
100.0
2.00
636
0.90
0.90
100.0
Table
F.4:Summary
ofcalculated
Tota
lTempera
ture
random
uncertainty
with
95%
levelofconfidenceforconfigura
tion
5.
NASA/CR—2016-219411 206

Nominal
Mach
Typical
TT,ts
◦R
sTT,ts
◦R k=
2
sTT,ts
dueto
sTT,bm
◦R k=
2
sTT,ts
UPC
dueto
sTT,bm
0.25
514
0.15
0.15
100.0
0.40
519
0.19
0.19
100.0
0.60
548
0.06
0.06
100.0
0.80
566
0.16
0.16
100.0
1.00
551
0.24
0.24
100.0
1.20
564
0.17
0.17
100.0
1.40
573
0.18
0.18
100.0
1.60
591
0.25
0.25
100.0
1.80
618
0.28
0.28
100.0
2.00
641
0.46
0.46
100.0
Table
F.5:Summary
ofcalculated
Tota
lTempera
ture
random
uncertainty
with
95%
levelofconfidenceforconfigura
tion
6.
NASA/CR—2016-219411 207
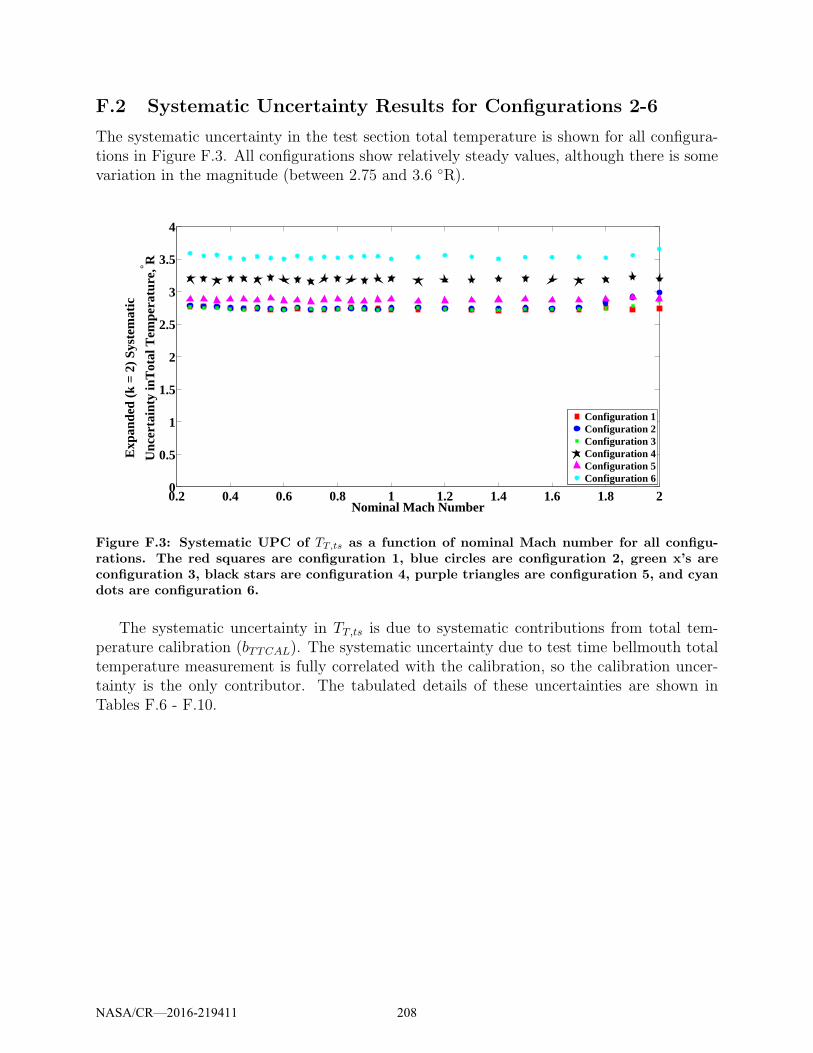
F.2 Systematic Uncertainty Results for Configurations 2-6
The systematic uncertainty in the test section total temperature is shown for all configura-tions in Figure F.3. All configurations show relatively steady values, although there is somevariation in the magnitude (between 2.75 and 3.6 ◦R).
0.2 0.4 0.6 0.8 1 1.2 1.4 1.6 1.8 20
0.5
1
1.5
2
2.5
3
3.5
4
Nominal Mach Number
Exp
ande
d (k
= 2
) S
yste
mat
ic
Unc
erta
inty
inT
otal
Tem
pera
ture
, ° R
Configuration 1Configuration 2Configuration 3Configuration 4Configuration 5Configuration 6
Figure F.3: Systematic UPC of TT,ts as a function of nominal Mach number for all configu-rations. The red squares are configuration 1, blue circles are configuration 2, green x’s areconfiguration 3, black stars are configuration 4, purple triangles are configuration 5, and cyandots are configuration 6.
The systematic uncertainty in TT,ts is due to systematic contributions from total tem-perature calibration (bTTCAL). The systematic uncertainty due to test time bellmouth totaltemperature measurement is fully correlated with the calibration, so the calibration uncer-tainty is the only contributor. The tabulated details of these uncertainties are shown inTables F.6 - F.10.
NASA/CR—2016-219411 208
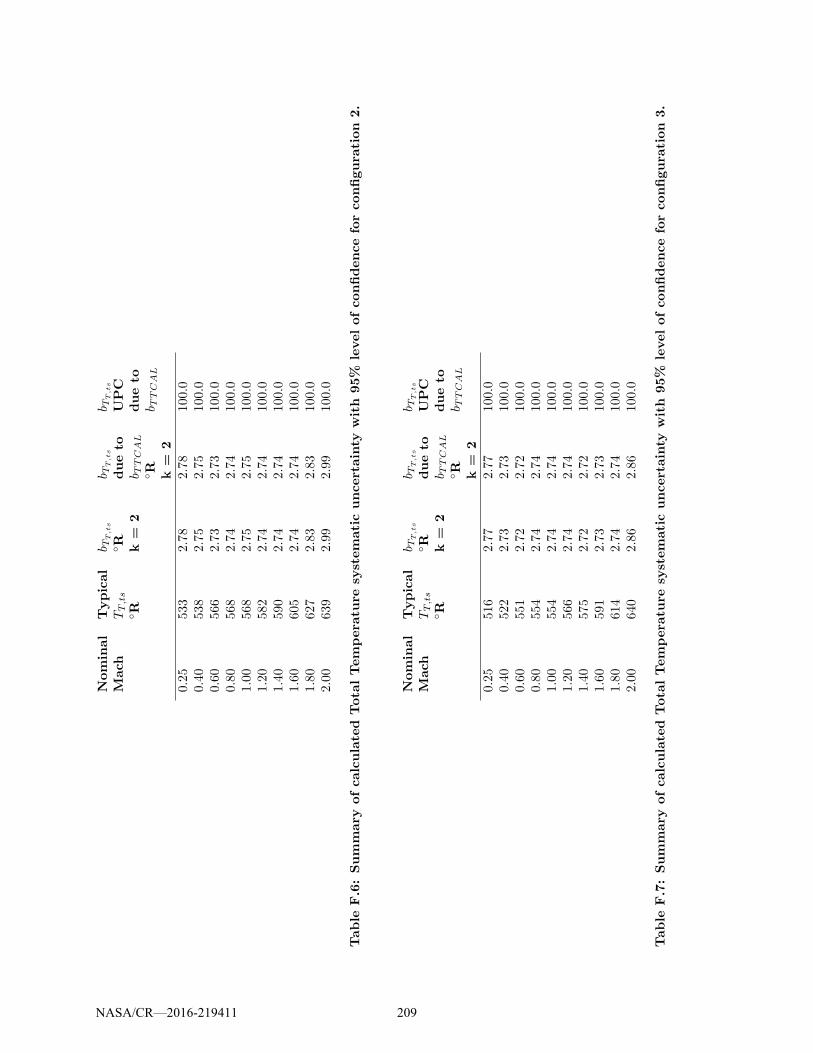
Nominal
Mach
Typical
TT,ts
◦R
b TT,ts
◦R k=
2
b TT,ts
dueto
b TTCAL
◦R k=
2
b TT,ts
UPC
dueto
b TTCAL
0.25
533
2.78
2.78
100.0
0.40
538
2.75
2.75
100.0
0.60
566
2.73
2.73
100.0
0.80
568
2.74
2.74
100.0
1.00
568
2.75
2.75
100.0
1.20
582
2.74
2.74
100.0
1.40
590
2.74
2.74
100.0
1.60
605
2.74
2.74
100.0
1.80
627
2.83
2.83
100.0
2.00
639
2.99
2.99
100.0
Table
F.6:Summary
ofcalculated
Tota
lTempera
ture
systematicuncertainty
with
95%
levelofconfidenceforconfigura
tion
2.
Nominal
Mach
Typical
TT,ts
◦R
b TT,ts
◦R k=
2
b TT,ts
dueto
b TTCAL
◦R k=
2
b TT,ts
UPC
dueto
b TTCAL
0.25
516
2.77
2.77
100.0
0.40
522
2.73
2.73
100.0
0.60
551
2.72
2.72
100.0
0.80
554
2.74
2.74
100.0
1.00
554
2.74
2.74
100.0
1.20
566
2.74
2.74
100.0
1.40
575
2.72
2.72
100.0
1.60
591
2.73
2.73
100.0
1.80
614
2.74
2.74
100.0
2.00
640
2.86
2.86
100.0
Table
F.7:Summary
ofcalculated
Tota
lTempera
ture
systematicuncertainty
with
95%
levelofconfidenceforconfigura
tion
3.
NASA/CR—2016-219411 209

Nominal
Mach
Typical
TT,ts
◦R
b TT,ts
◦R k=
2
b TT,ts
dueto
b TTCAL
◦R k=
2
b TT,ts
UPC
dueto
b TTCAL
0.25
512
3.20
3.20
100.0
0.40
518
3.20
3.20
100.0
0.60
548
3.18
3.18
100.0
0.80
550
3.20
3.20
100.0
1.00
551
3.20
3.20
100.0
1.20
564
3.18
3.18
100.0
1.40
572
3.19
3.19
100.0
1.60
588
3.18
3.18
100.0
1.80
609
3.19
3.19
100.0
2.00
623
3.19
3.19
100.0
Table
F.8:Summary
ofcalculated
Tota
lTempera
ture
systematicuncertainty
with
95%
levelofconfidenceforconfigura
tion
4.
Nominal
Mach
Typical
TT,ts
◦R
b TT,ts
◦R k=
2
b TT,ts
dueto
b TTCAL
◦R k=
2
b TT,ts
UPC
dueto
b TTCAL
0.25
529
2.89
2.89
100.0
0.40
535
2.88
2.88
100.0
0.60
559
2.86
2.86
100.0
0.80
561
2.88
2.88
100.0
1.00
560
2.88
2.88
100.0
1.20
575
2.86
2.86
100.0
1.40
582
2.87
2.87
100.0
1.60
599
2.87
2.87
100.0
1.80
623
2.88
2.88
100.0
2.00
636
2.89
2.89
100.0
Table
F.9:Summary
ofcalculated
Tota
lTempera
ture
systematicuncertainty
with
95%
levelofconfidenceforconfigura
tion
5.
NASA/CR—2016-219411 210

Nominal
Mach
Typical
TT,ts
◦R
b TT,ts
◦R k=
2
b TT,ts
dueto
b TTCAL
◦R k=
2
b TT,ts
UPC
dueto
b TTCAL
0.25
514
3.59
3.59
100.0
0.40
519
3.52
3.52
100.0
0.60
548
3.50
3.50
100.0
0.80
566
3.52
3.52
100.0
1.00
551
3.51
3.51
100.0
1.20
564
3.56
3.56
100.0
1.40
573
3.51
3.51
100.0
1.60
591
3.53
3.53
100.0
1.80
618
3.52
3.52
100.0
2.00
641
3.66
3.66
100.0
Table
F.10:Summary
ofcalculated
Tota
lTempera
ture
systematicuncertainty
with
95%
levelofconfidenceforconfigura
tion
6.
NASA/CR—2016-219411 211
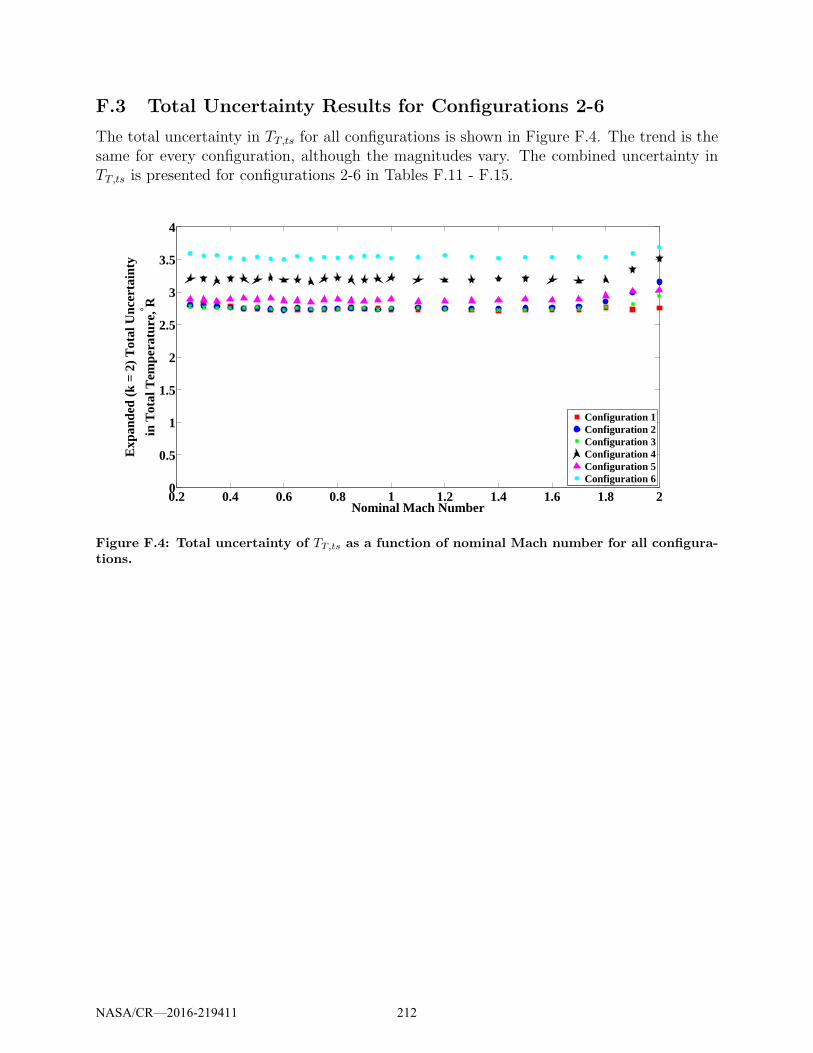
F.3 Total Uncertainty Results for Configurations 2-6
The total uncertainty in TT,ts for all configurations is shown in Figure F.4. The trend is thesame for every configuration, although the magnitudes vary. The combined uncertainty inTT,ts is presented for configurations 2-6 in Tables F.11 - F.15.
0.2 0.4 0.6 0.8 1 1.2 1.4 1.6 1.8 20
0.5
1
1.5
2
2.5
3
3.5
4
Nominal Mach Number
Exp
ande
d (k
= 2
) T
otal
Unc
erta
inty
in T
otal
Tem
pera
ture
, ° R
Configuration 1Configuration 2Configuration 3Configuration 4Configuration 5Configuration 6
Figure F.4: Total uncertainty of TT,ts as a function of nominal Mach number for all configura-tions.
NASA/CR—2016-219411 212

Nominal
Mach
Typical
TT,ts,◦R
sTT,ts
◦R k=
2
b TT,ts
◦R k=
2
uTT,ts
◦R k=
2
sTT,ts
UPC
b TT,ts
UPC
0.25
533
0.31
2.78
2.80
1.2
98.8
0.40
538
0.29
2.75
2.77
1.1
98.9
0.60
566
0.06
2.73
2.73
0.1
99.9
0.80
568
0.23
2.74
2.75
0.7
99.3
1.00
568
0.18
2.75
2.75
0.4
99.6
1.20
582
0.17
2.74
2.75
0.4
99.6
1.40
590
0.16
2.74
2.75
0.3
99.7
1.60
605
0.31
2.74
2.76
1.3
98.7
1.80
627
0.41
2.83
2.86
2.1
97.9
2.00
639
1.02
2.99
3.16
10.4
89.6
Table
F.11:Summary
ofcalculated
Tota
lTempera
ture
uncertainty
with
95%
levelofconfidenceforconfigura
tion
2.
Nominal
Mach
Typical
TT,ts,◦R
sTT,ts
◦R k=
2
b TT,ts
◦R k=
2
uTT,ts
◦R k=
2
sTT,ts
UPC
b TT,ts
UPC
0.25
516
0.24
2.77
2.78
0.7
99.3
0.40
522
0.33
2.73
2.76
1.5
98.5
0.60
551
0.19
2.72
2.73
0.5
99.5
0.80
554
0.21
2.74
2.74
0.6
99.4
1.00
554
0.27
2.74
2.75
0.9
99.1
1.20
566
0.16
2.74
2.74
0.3
99.7
1.40
575
0.09
2.72
2.73
0.1
99.9
1.60
591
0.20
2.73
2.74
0.5
99.5
1.80
614
0.36
2.74
2.77
1.7
98.3
2.00
640
0.70
2.86
2.94
5.6
94.4
Table
F.12:Summary
ofcalculated
Tota
lTempera
ture
uncertainty
with
95%
levelofconfidenceforconfigura
tion
3.
NASA/CR—2016-219411 213
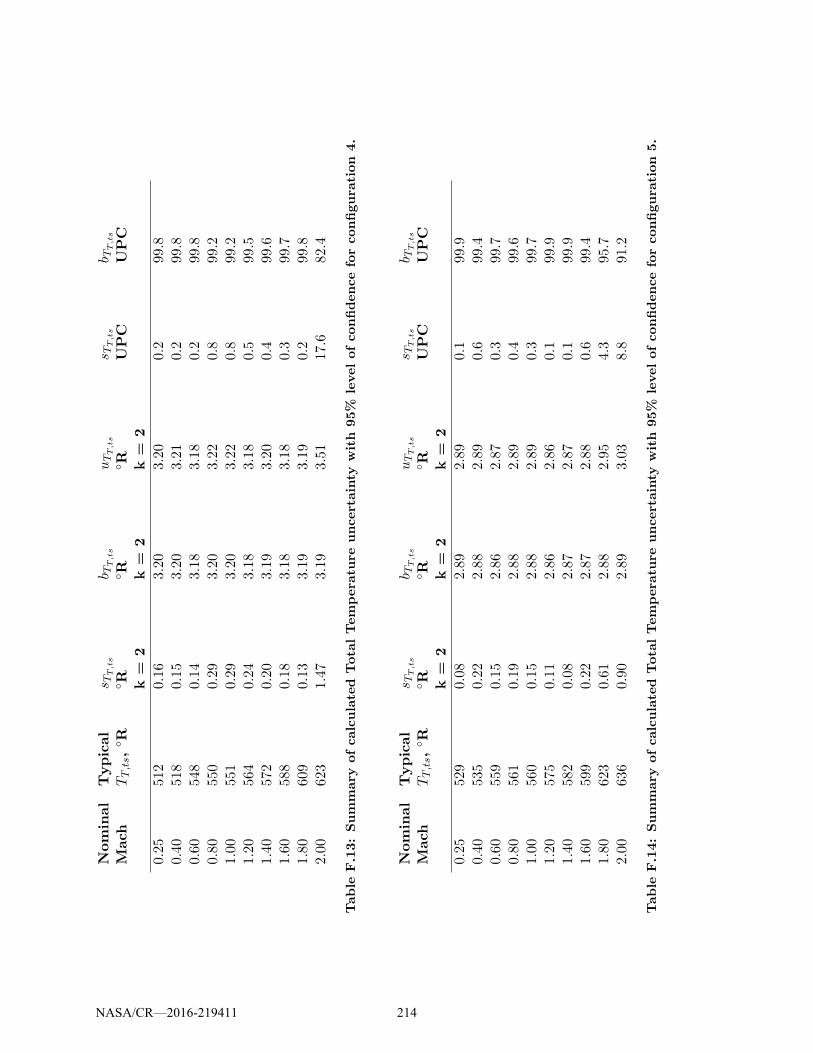
Nominal
Mach
Typical
TT,ts,◦R
sTT,ts
◦R k=
2
b TT,ts
◦R k=
2
uTT,ts
◦R k=
2
sTT,ts
UPC
b TT,ts
UPC
0.25
512
0.16
3.20
3.20
0.2
99.8
0.40
518
0.15
3.20
3.21
0.2
99.8
0.60
548
0.14
3.18
3.18
0.2
99.8
0.80
550
0.29
3.20
3.22
0.8
99.2
1.00
551
0.29
3.20
3.22
0.8
99.2
1.20
564
0.24
3.18
3.18
0.5
99.5
1.40
572
0.20
3.19
3.20
0.4
99.6
1.60
588
0.18
3.18
3.18
0.3
99.7
1.80
609
0.13
3.19
3.19
0.2
99.8
2.00
623
1.47
3.19
3.51
17.6
82.4
Table
F.13:Summary
ofcalculated
Tota
lTempera
ture
uncertainty
with
95%
levelofconfidenceforconfigura
tion
4.
Nominal
Mach
Typical
TT,ts,◦R
sTT,ts
◦R k=
2
b TT,ts
◦R k=
2
uTT,ts
◦R k=
2
sTT,ts
UPC
b TT,ts
UPC
0.25
529
0.08
2.89
2.89
0.1
99.9
0.40
535
0.22
2.88
2.89
0.6
99.4
0.60
559
0.15
2.86
2.87
0.3
99.7
0.80
561
0.19
2.88
2.89
0.4
99.6
1.00
560
0.15
2.88
2.89
0.3
99.7
1.20
575
0.11
2.86
2.86
0.1
99.9
1.40
582
0.08
2.87
2.87
0.1
99.9
1.60
599
0.22
2.87
2.88
0.6
99.4
1.80
623
0.61
2.88
2.95
4.3
95.7
2.00
636
0.90
2.89
3.03
8.8
91.2
Table
F.14:Summary
ofcalculated
Tota
lTempera
ture
uncertainty
with
95%
levelofconfidenceforconfigura
tion
5.
NASA/CR—2016-219411 214
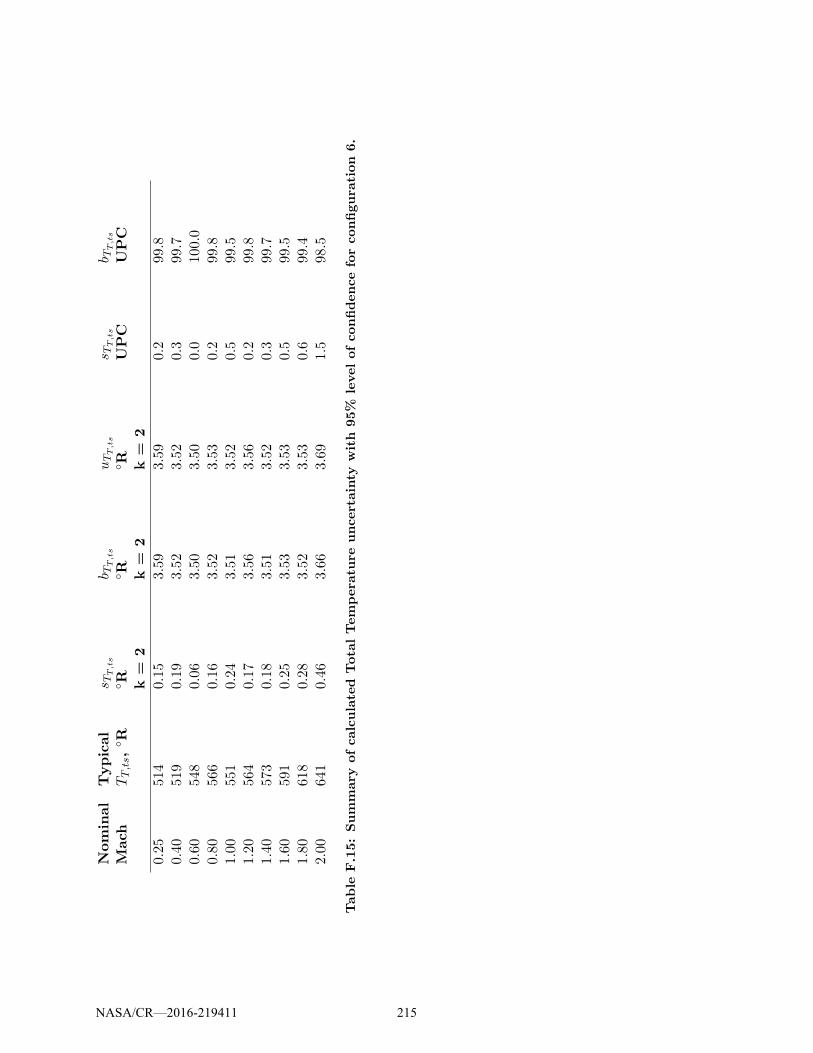
Nominal
Mach
Typical
TT,ts,◦R
sTT,ts
◦R k=
2
b TT,ts
◦R k=
2
uTT,ts
◦R k=
2
sTT,ts
UPC
b TT,ts
UPC
0.25
514
0.15
3.59
3.59
0.2
99.8
0.40
519
0.19
3.52
3.52
0.3
99.7
0.60
548
0.06
3.50
3.50
0.0
100.0
0.80
566
0.16
3.52
3.53
0.2
99.8
1.00
551
0.24
3.51
3.52
0.5
99.5
1.20
564
0.17
3.56
3.56
0.2
99.8
1.40
573
0.18
3.51
3.52
0.3
99.7
1.60
591
0.25
3.53
3.53
0.5
99.5
1.80
618
0.28
3.52
3.53
0.6
99.4
2.00
641
0.46
3.66
3.69
1.5
98.5
Table
F.15:Summary
ofcalculated
Tota
lTempera
ture
uncertainty
with
95%
levelofconfidenceforconfigura
tion
6.
NASA/CR—2016-219411 215
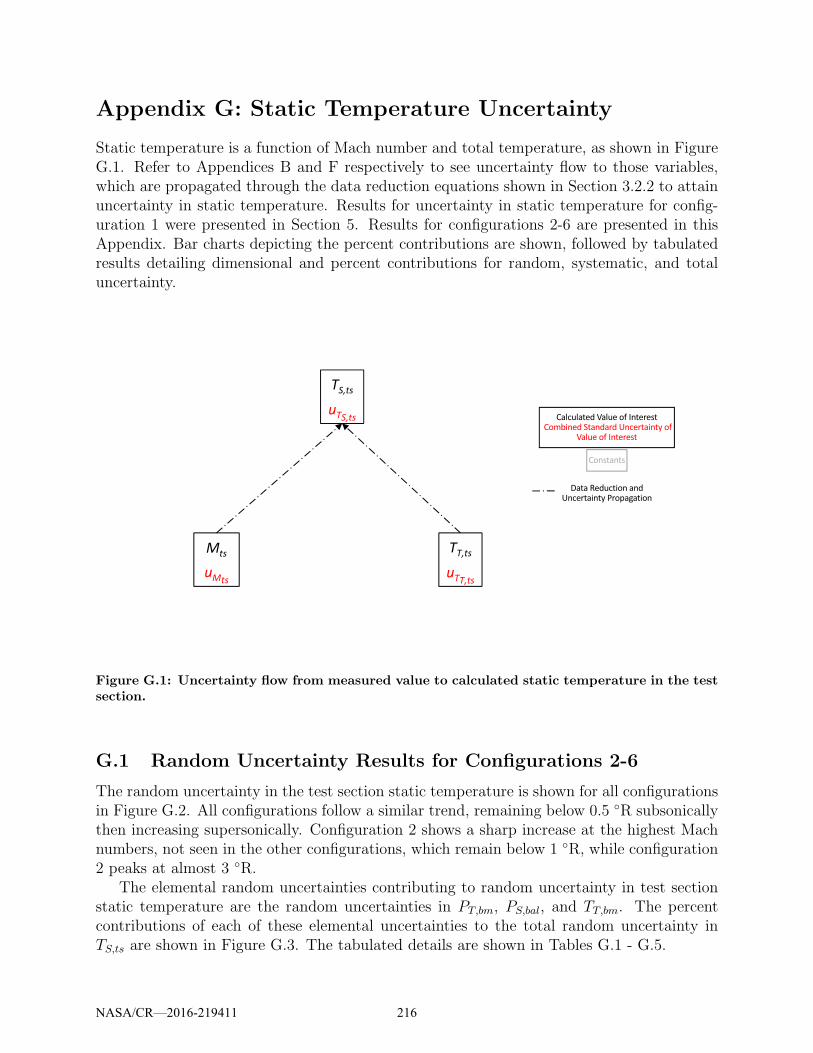
Appendix G: Static Temperature Uncertainty
Static temperature is a function of Mach number and total temperature, as shown in FigureG.1. Refer to Appendices B and F respectively to see uncertainty flow to those variables,which are propagated through the data reduction equations shown in Section 3.2.2 to attainuncertainty in static temperature. Results for uncertainty in static temperature for config-uration 1 were presented in Section 5. Results for configurations 2-6 are presented in thisAppendix. Bar charts depicting the percent contributions are shown, followed by tabulatedresults detailing dimensional and percent contributions for random, systematic, and totaluncertainty.
Figure G.1: Uncertainty flow from measured value to calculated static temperature in the testsection.
G.1 Random Uncertainty Results for Configurations 2-6
The random uncertainty in the test section static temperature is shown for all configurationsin Figure G.2. All configurations follow a similar trend, remaining below 0.5 ◦R subsonicallythen increasing supersonically. Configuration 2 shows a sharp increase at the highest Machnumbers, not seen in the other configurations, which remain below 1 ◦R, while configuration2 peaks at almost 3 ◦R.
The elemental random uncertainties contributing to random uncertainty in test sectionstatic temperature are the random uncertainties in PT,bm, PS,bal, and TT,bm. The percentcontributions of each of these elemental uncertainties to the total random uncertainty inTS,ts are shown in Figure G.3. The tabulated details are shown in Tables G.1 - G.5.
NASA/CR—2016-219411 216
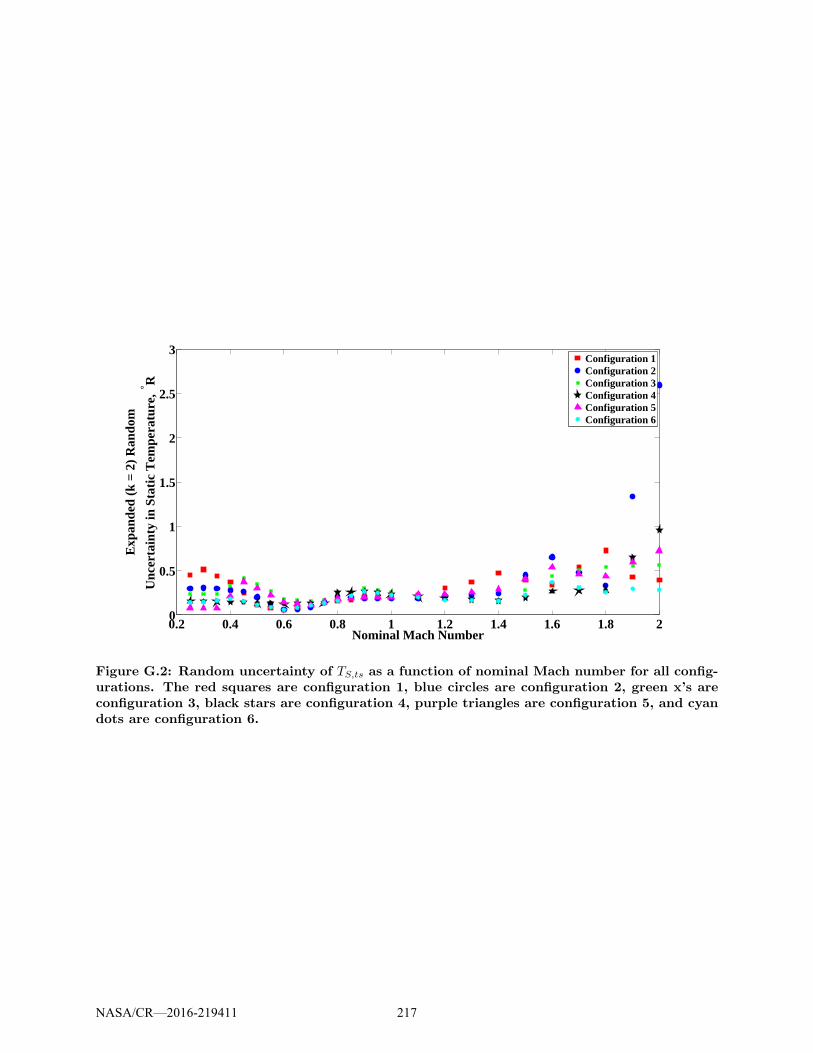
0.2 0.4 0.6 0.8 1 1.2 1.4 1.6 1.8 20
0.5
1
1.5
2
2.5
3
Nominal Mach Number
Exp
ande
d (k
= 2
) R
ando
m
Unc
erta
inty
in S
tatic
Tem
pera
ture
, ° R
Configuration 1Configuration 2Configuration 3Configuration 4Configuration 5Configuration 6
Figure G.2: Random uncertainty of TS,ts as a function of nominal Mach number for all config-urations. The red squares are configuration 1, blue circles are configuration 2, green x’s areconfiguration 3, black stars are configuration 4, purple triangles are configuration 5, and cyandots are configuration 6.
NASA/CR—2016-219411 217
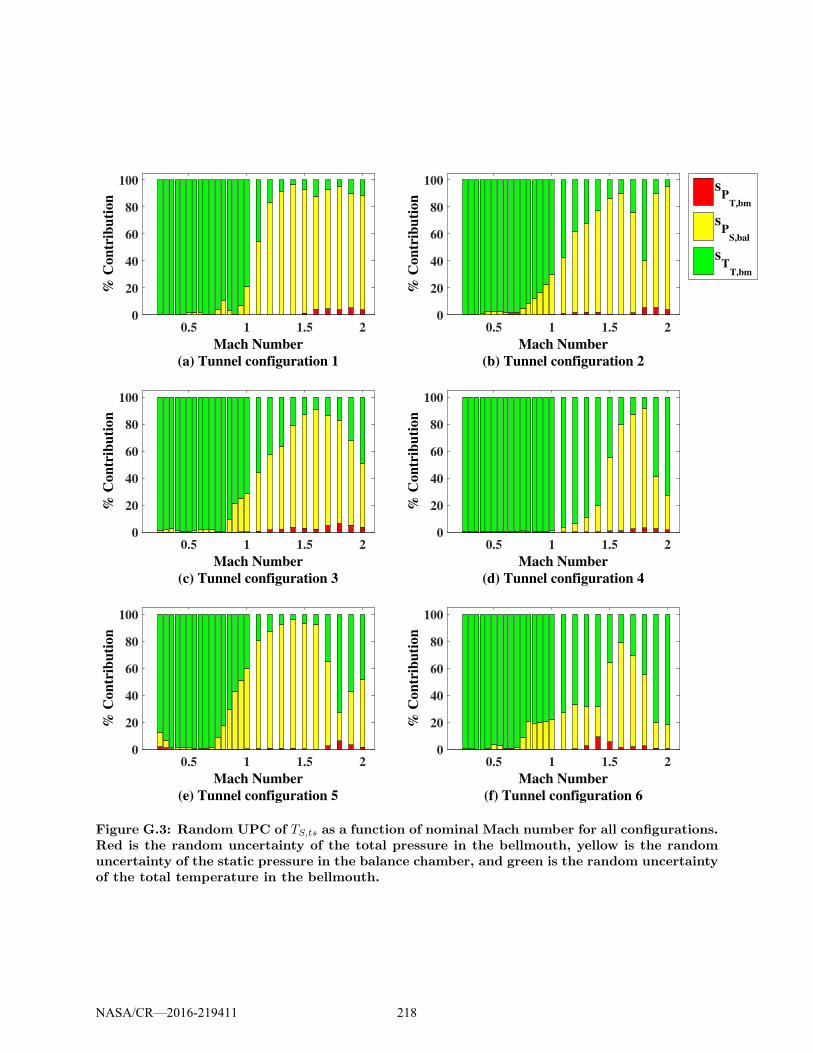
0.5 1 1.5 2
Mach Number
(a) Tunnel configuration 1
0
20
40
60
80
100
% C
on
trib
uti
on
0.5 1 1.5 2
Mach Number
(b) Tunnel configuration 2
0
20
40
60
80
100
% C
on
trib
uti
on
0.5 1 1.5 2
Mach Number
(c) Tunnel configuration 3
0
20
40
60
80
100
% C
on
trib
uti
on
0.5 1 1.5 2
Mach Number
(d) Tunnel configuration 4
0
20
40
60
80
100
% C
on
trib
uti
on
0.5 1 1.5 2
Mach Number
(e) Tunnel configuration 5
0
20
40
60
80
100
% C
on
trib
uti
on
0.5 1 1.5 2
Mach Number
(f) Tunnel configuration 6
0
20
40
60
80
100
% C
on
trib
uti
on
sP
T,bm
sP
S,bal
sT
T,bm
Figure G.3: Random UPC of TS,ts as a function of nominal Mach number for all configurations.Red is the random uncertainty of the total pressure in the bellmouth, yellow is the randomuncertainty of the static pressure in the balance chamber, and green is the random uncertaintyof the total temperature in the bellmouth.
NASA/CR—2016-219411 218
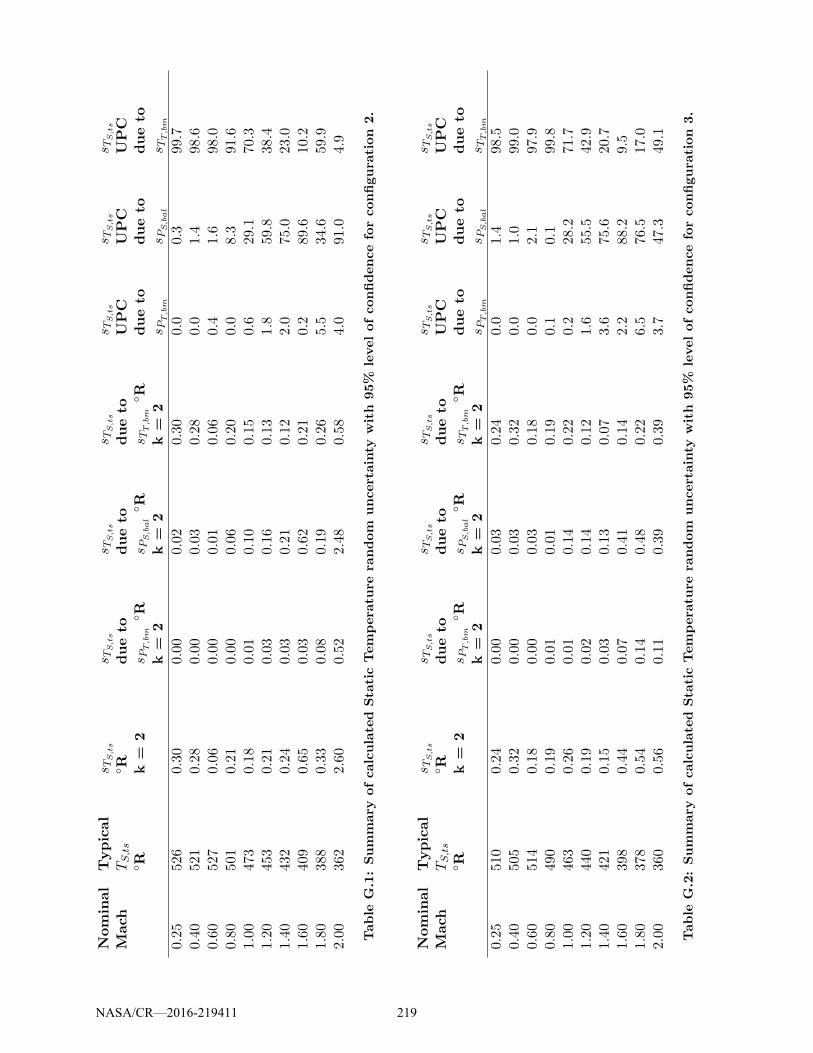
Nominal
Mach
Typical
TS,ts
◦R
sTS,ts
◦R k=
2
sTS,ts
dueto
sPT,bm
◦R
k=
2
sTS,ts
dueto
sPS,bal
◦R
k=
2
sTS,ts
dueto
sTT,bm
◦R
k=
2
sTS,ts
UPC
dueto
sPT,bm
sTS,ts
UPC
dueto
sPS,bal
sTS,ts
UPC
dueto
sTT,bm
0.25
526
0.30
0.00
0.02
0.30
0.0
0.3
99.7
0.40
521
0.28
0.00
0.03
0.28
0.0
1.4
98.6
0.60
527
0.06
0.00
0.01
0.06
0.4
1.6
98.0
0.80
501
0.21
0.00
0.06
0.20
0.0
8.3
91.6
1.00
473
0.18
0.01
0.10
0.15
0.6
29.1
70.3
1.20
453
0.21
0.03
0.16
0.13
1.8
59.8
38.4
1.40
432
0.24
0.03
0.21
0.12
2.0
75.0
23.0
1.60
409
0.65
0.03
0.62
0.21
0.2
89.6
10.2
1.80
388
0.33
0.08
0.19
0.26
5.5
34.6
59.9
2.00
362
2.60
0.52
2.48
0.58
4.0
91.0
4.9
Table
G.1:Summary
ofcalculated
Sta
ticTempera
ture
random
uncertainty
with
95%
levelofconfidenceforconfigura
tion
2.
Nominal
Mach
Typical
TS,ts
◦R
sTS,ts
◦R k=
2
sTS,ts
dueto
sPT,bm
◦R
k=
2
sTS,ts
dueto
sPS,bal
◦R
k=
2
sTS,ts
dueto
sTT,bm
◦R
k=
2
sTS,ts
UPC
dueto
sPT,bm
sTS,ts
UPC
dueto
sPS,bal
sTS,ts
UPC
dueto
sTT,bm
0.25
510
0.24
0.00
0.03
0.24
0.0
1.4
98.5
0.40
505
0.32
0.00
0.03
0.32
0.0
1.0
99.0
0.60
514
0.18
0.00
0.03
0.18
0.0
2.1
97.9
0.80
490
0.19
0.01
0.01
0.19
0.1
0.1
99.8
1.00
463
0.26
0.01
0.14
0.22
0.2
28.2
71.7
1.20
440
0.19
0.02
0.14
0.12
1.6
55.5
42.9
1.40
421
0.15
0.03
0.13
0.07
3.6
75.6
20.7
1.60
398
0.44
0.07
0.41
0.14
2.2
88.2
9.5
1.80
378
0.54
0.14
0.48
0.22
6.5
76.5
17.0
2.00
360
0.56
0.11
0.39
0.39
3.7
47.3
49.1
Table
G.2:Summary
ofcalculated
Sta
ticTempera
ture
random
uncertainty
with
95%
levelofconfidenceforconfigura
tion
3.
NASA/CR—2016-219411 219
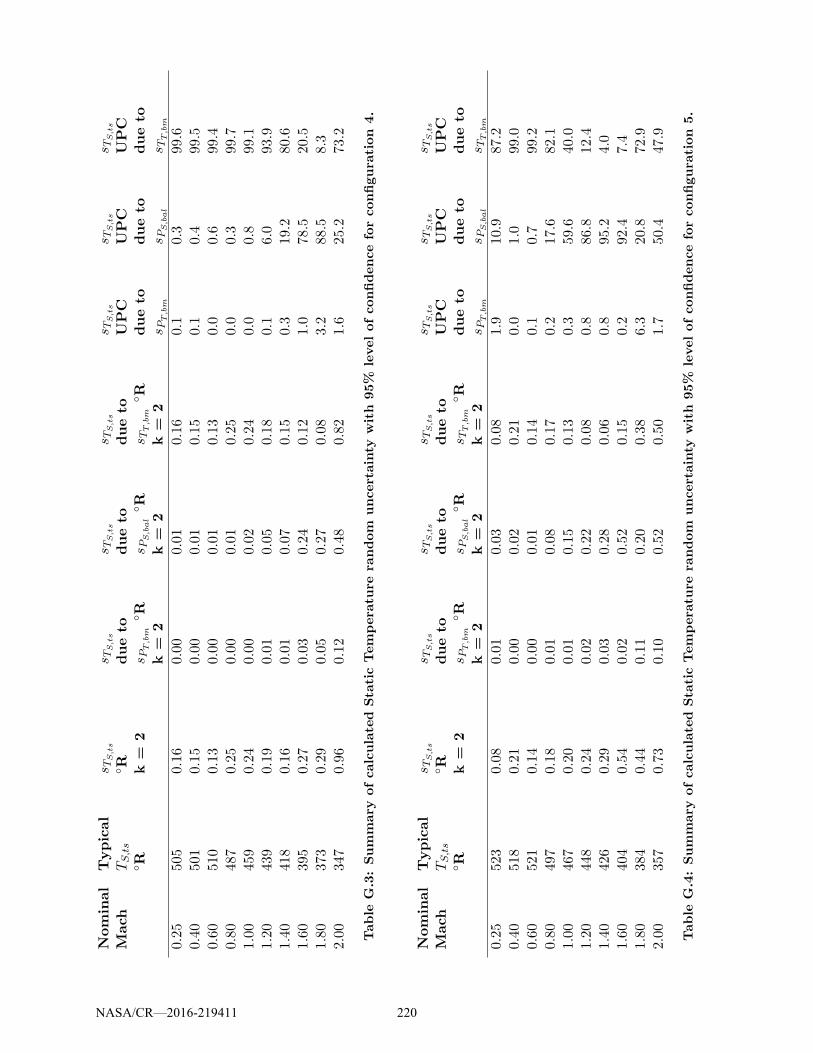
Nominal
Mach
Typical
TS,ts
◦R
sTS,ts
◦R k=
2
sTS,ts
dueto
sPT,bm
◦R
k=
2
sTS,ts
dueto
sPS,bal
◦R
k=
2
sTS,ts
dueto
sTT,bm
◦R
k=
2
sTS,ts
UPC
dueto
sPT,bm
sTS,ts
UPC
dueto
sPS,bal
sTS,ts
UPC
dueto
sTT,bm
0.25
505
0.16
0.00
0.01
0.16
0.1
0.3
99.6
0.40
501
0.15
0.00
0.01
0.15
0.1
0.4
99.5
0.60
510
0.13
0.00
0.01
0.13
0.0
0.6
99.4
0.80
487
0.25
0.00
0.01
0.25
0.0
0.3
99.7
1.00
459
0.24
0.00
0.02
0.24
0.0
0.8
99.1
1.20
439
0.19
0.01
0.05
0.18
0.1
6.0
93.9
1.40
418
0.16
0.01
0.07
0.15
0.3
19.2
80.6
1.60
395
0.27
0.03
0.24
0.12
1.0
78.5
20.5
1.80
373
0.29
0.05
0.27
0.08
3.2
88.5
8.3
2.00
347
0.96
0.12
0.48
0.82
1.6
25.2
73.2
Table
G.3:Summary
ofcalculated
Sta
ticTempera
ture
random
uncertainty
with
95%
levelofconfidenceforconfigura
tion
4.
Nominal
Mach
Typical
TS,ts
◦R
sTS,ts
◦R k=
2
sTS,ts
dueto
sPT,bm
◦R
k=
2
sTS,ts
dueto
sPS,bal
◦R
k=
2
sTS,ts
dueto
sTT,bm
◦R
k=
2
sTS,ts
UPC
dueto
sPT,bm
sTS,ts
UPC
dueto
sPS,bal
sTS,ts
UPC
dueto
sTT,bm
0.25
523
0.08
0.01
0.03
0.08
1.9
10.9
87.2
0.40
518
0.21
0.00
0.02
0.21
0.0
1.0
99.0
0.60
521
0.14
0.00
0.01
0.14
0.1
0.7
99.2
0.80
497
0.18
0.01
0.08
0.17
0.2
17.6
82.1
1.00
467
0.20
0.01
0.15
0.13
0.3
59.6
40.0
1.20
448
0.24
0.02
0.22
0.08
0.8
86.8
12.4
1.40
426
0.29
0.03
0.28
0.06
0.8
95.2
4.0
1.60
404
0.54
0.02
0.52
0.15
0.2
92.4
7.4
1.80
384
0.44
0.11
0.20
0.38
6.3
20.8
72.9
2.00
357
0.73
0.10
0.52
0.50
1.7
50.4
47.9
Table
G.4:Summary
ofcalculated
Sta
ticTempera
ture
random
uncertainty
with
95%
levelofconfidenceforconfigura
tion
5.
NASA/CR—2016-219411 220
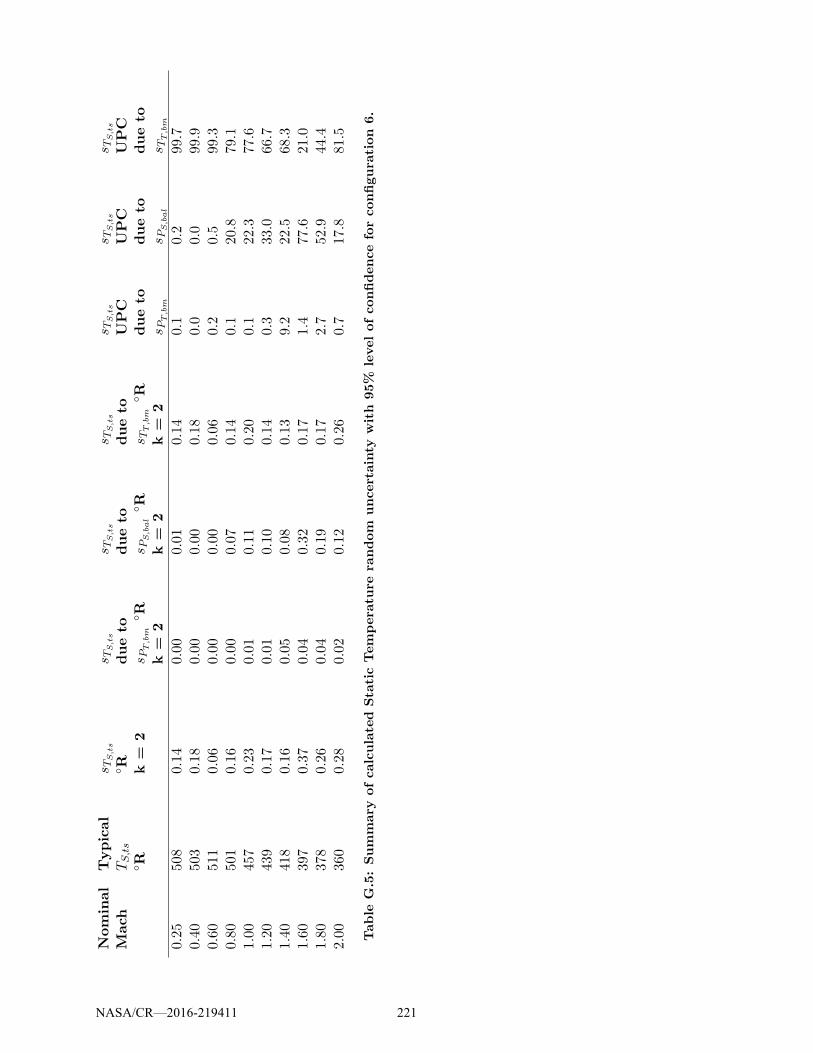
Nominal
Mach
Typical
TS,ts
◦R
sTS,ts
◦R k=
2
sTS,ts
dueto
sPT,bm
◦R
k=
2
sTS,ts
dueto
sPS,bal
◦R
k=
2
sTS,ts
dueto
sTT,bm
◦R
k=
2
sTS,ts
UPC
dueto
sPT,bm
sTS,ts
UPC
dueto
sPS,bal
sTS,ts
UPC
dueto
sTT,bm
0.25
508
0.14
0.00
0.01
0.14
0.1
0.2
99.7
0.40
503
0.18
0.00
0.00
0.18
0.0
0.0
99.9
0.60
511
0.06
0.00
0.00
0.06
0.2
0.5
99.3
0.80
501
0.16
0.00
0.07
0.14
0.1
20.8
79.1
1.00
457
0.23
0.01
0.11
0.20
0.1
22.3
77.6
1.20
439
0.17
0.01
0.10
0.14
0.3
33.0
66.7
1.40
418
0.16
0.05
0.08
0.13
9.2
22.5
68.3
1.60
397
0.37
0.04
0.32
0.17
1.4
77.6
21.0
1.80
378
0.26
0.04
0.19
0.17
2.7
52.9
44.4
2.00
360
0.28
0.02
0.12
0.26
0.7
17.8
81.5
Table
G.5:Summary
ofcalculated
Sta
ticTempera
ture
random
uncertainty
with
95%
levelofconfidenceforconfigura
tion
6.
NASA/CR—2016-219411 221
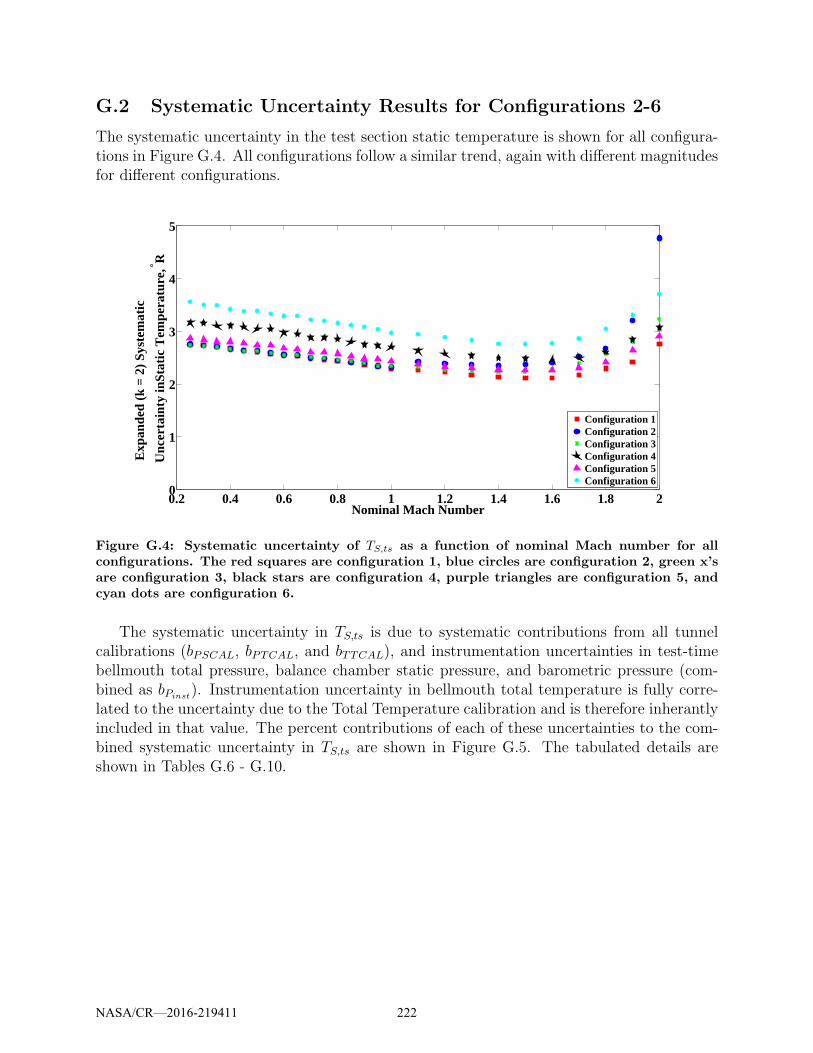
G.2 Systematic Uncertainty Results for Configurations 2-6
The systematic uncertainty in the test section static temperature is shown for all configura-tions in Figure G.4. All configurations follow a similar trend, again with different magnitudesfor different configurations.
0.2 0.4 0.6 0.8 1 1.2 1.4 1.6 1.8 20
1
2
3
4
5
Nominal Mach Number
Exp
ande
d (k
= 2
) S
yste
mat
ic
Unc
erta
inty
inS
tatic
Tem
pera
ture
, ° R
Configuration 1Configuration 2Configuration 3Configuration 4Configuration 5Configuration 6
Figure G.4: Systematic uncertainty of TS,ts as a function of nominal Mach number for allconfigurations. The red squares are configuration 1, blue circles are configuration 2, green x’sare configuration 3, black stars are configuration 4, purple triangles are configuration 5, andcyan dots are configuration 6.
The systematic uncertainty in TS,ts is due to systematic contributions from all tunnelcalibrations (bPSCAL, bPTCAL, and bTTCAL), and instrumentation uncertainties in test-timebellmouth total pressure, balance chamber static pressure, and barometric pressure (com-bined as bPinst
). Instrumentation uncertainty in bellmouth total temperature is fully corre-lated to the uncertainty due to the Total Temperature calibration and is therefore inherantlyincluded in that value. The percent contributions of each of these uncertainties to the com-bined systematic uncertainty in TS,ts are shown in Figure G.5. The tabulated details areshown in Tables G.6 - G.10.
NASA/CR—2016-219411 222
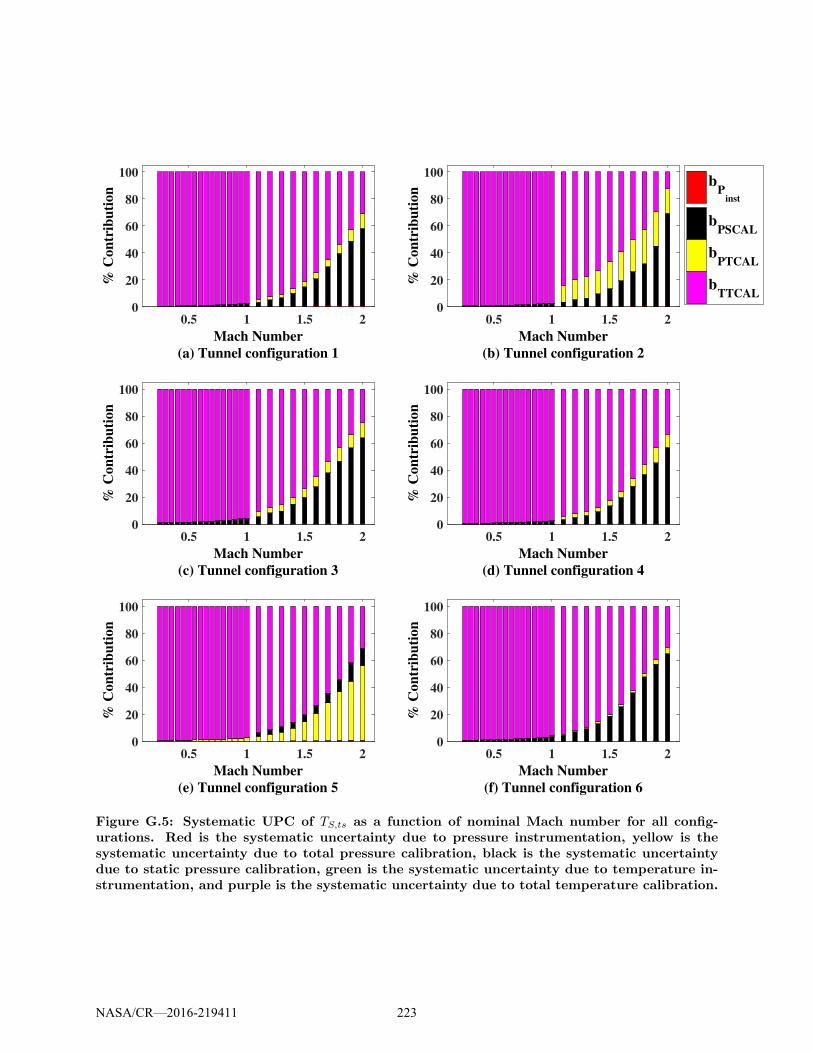
0.5 1 1.5 2
Mach Number
(a) Tunnel configuration 1
0
20
40
60
80
100
% C
on
trib
uti
on
0.5 1 1.5 2
Mach Number
(b) Tunnel configuration 2
0
20
40
60
80
100
% C
on
trib
uti
on
0.5 1 1.5 2
Mach Number
(c) Tunnel configuration 3
0
20
40
60
80
100
% C
on
trib
uti
on
0.5 1 1.5 2
Mach Number
(d) Tunnel configuration 4
0
20
40
60
80
100
% C
on
trib
uti
on
0.5 1 1.5 2
Mach Number
(e) Tunnel configuration 5
0
20
40
60
80
100
% C
on
trib
uti
on
0.5 1 1.5 2
Mach Number
(f) Tunnel configuration 6
0
20
40
60
80
100
% C
on
trib
uti
on
bP
inst
bPSCAL
bPTCAL
bTTCAL
Figure G.5: Systematic UPC of TS,ts as a function of nominal Mach number for all config-urations. Red is the systematic uncertainty due to pressure instrumentation, yellow is thesystematic uncertainty due to total pressure calibration, black is the systematic uncertaintydue to static pressure calibration, green is the systematic uncertainty due to temperature in-strumentation, and purple is the systematic uncertainty due to total temperature calibration.
NASA/CR—2016-219411 223
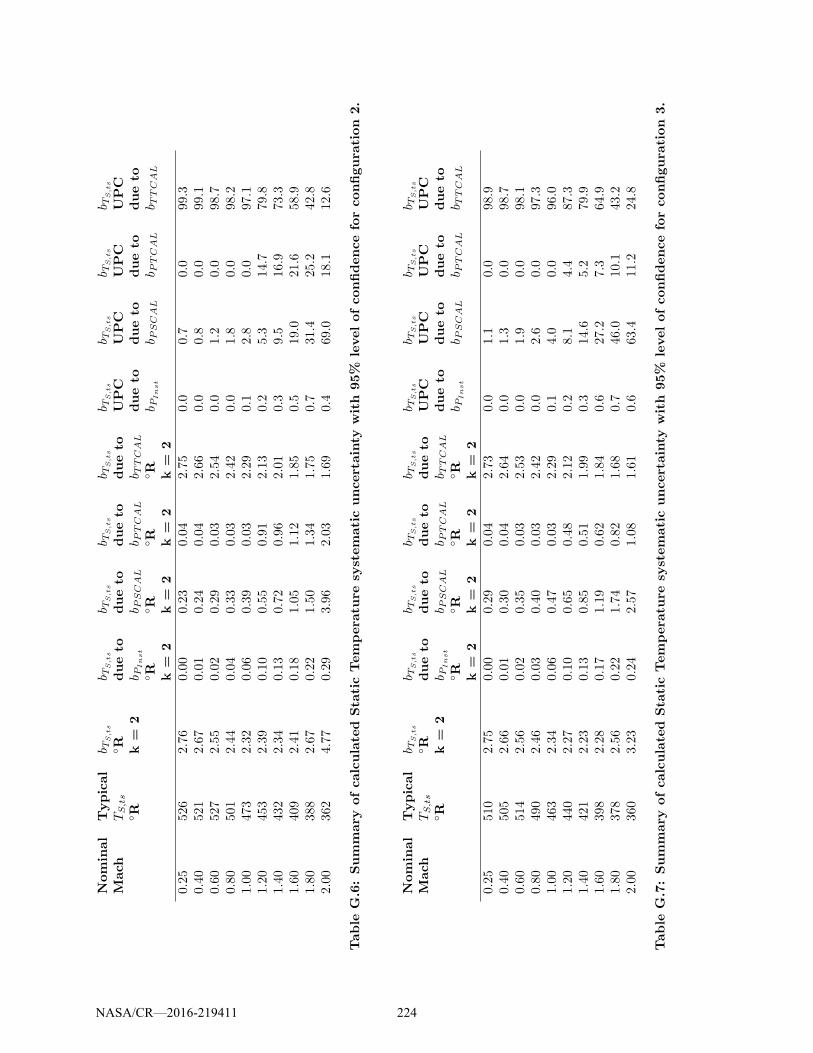
Nominal
Mach
Typical
TS,ts
◦R
b TS,ts
◦R k=
2
b TS,ts
dueto
b PInst
◦R k=
2
b TS,ts
dueto
b PSCAL
◦R k=
2
b TS,ts
dueto
b PTCAL
◦R k=
2
b TS,ts
dueto
b TTCAL
◦R k=
2
b TS,ts
UPC
dueto
b PInst
b TS,ts
UPC
dueto
b PSCAL
b TS,ts
UPC
dueto
b PTCAL
b TS,ts
UPC
dueto
b TTCAL
0.25
526
2.76
0.00
0.23
0.04
2.75
0.0
0.7
0.0
99.3
0.40
521
2.67
0.01
0.24
0.04
2.66
0.0
0.8
0.0
99.1
0.60
527
2.55
0.02
0.29
0.03
2.54
0.0
1.2
0.0
98.7
0.80
501
2.44
0.04
0.33
0.03
2.42
0.0
1.8
0.0
98.2
1.00
473
2.32
0.06
0.39
0.03
2.29
0.1
2.8
0.0
97.1
1.20
453
2.39
0.10
0.55
0.91
2.13
0.2
5.3
14.7
79.8
1.40
432
2.34
0.13
0.72
0.96
2.01
0.3
9.5
16.9
73.3
1.60
409
2.41
0.18
1.05
1.12
1.85
0.5
19.0
21.6
58.9
1.80
388
2.67
0.22
1.50
1.34
1.75
0.7
31.4
25.2
42.8
2.00
362
4.77
0.29
3.96
2.03
1.69
0.4
69.0
18.1
12.6
Table
G.6:Summary
ofcalculated
Sta
ticTempera
ture
systematicuncertainty
with
95%
levelofconfidenceforconfigura
tion
2.
Nominal
Mach
Typical
TS,ts
◦R
b TS,ts
◦R k=
2
b TS,ts
dueto
b PInst
◦R k=
2
b TS,ts
dueto
b PSCAL
◦R k=
2
b TS,ts
dueto
b PTCAL
◦R k=
2
b TS,ts
dueto
b TTCAL
◦R k=
2
b TS,ts
UPC
dueto
b PInst
b TS,ts
UPC
dueto
b PSCAL
b TS,ts
UPC
dueto
b PTCAL
b TS,ts
UPC
dueto
b TTCAL
0.25
510
2.75
0.00
0.29
0.04
2.73
0.0
1.1
0.0
98.9
0.40
505
2.66
0.01
0.30
0.04
2.64
0.0
1.3
0.0
98.7
0.60
514
2.56
0.02
0.35
0.03
2.53
0.0
1.9
0.0
98.1
0.80
490
2.46
0.03
0.40
0.03
2.42
0.0
2.6
0.0
97.3
1.00
463
2.34
0.06
0.47
0.03
2.29
0.1
4.0
0.0
96.0
1.20
440
2.27
0.10
0.65
0.48
2.12
0.2
8.1
4.4
87.3
1.40
421
2.23
0.13
0.85
0.51
1.99
0.3
14.6
5.2
79.9
1.60
398
2.28
0.17
1.19
0.62
1.84
0.6
27.2
7.3
64.9
1.80
378
2.56
0.22
1.74
0.82
1.68
0.7
46.0
10.1
43.2
2.00
360
3.23
0.24
2.57
1.08
1.61
0.6
63.4
11.2
24.8
Table
G.7:Summary
ofcalculated
Sta
ticTempera
ture
systematicuncertainty
with
95%
levelofconfidenceforconfigura
tion
3.
NASA/CR—2016-219411 224

Nominal
Mach
Typical
TS,ts
◦R
b TS,ts
◦R k=
2
b TS,ts
dueto
b PInst
◦R k=
2
b TS,ts
dueto
b PSCAL
◦R k=
2
b TS,ts
dueto
b PTCAL
◦R k=
2
b TS,ts
dueto
b TTCAL
◦R k=
2
b TS,ts
UPC
dueto
b PInst
b TS,ts
UPC
dueto
b PSCAL
b TS,ts
UPC
dueto
b PTCAL
b TS,ts
UPC
dueto
b TTCAL
0.25
505
3.17
0.00
0.25
0.03
3.16
0.0
0.6
0.0
99.4
0.40
501
3.11
0.01
0.27
0.03
3.10
0.0
0.7
0.0
99.2
0.60
510
2.98
0.02
0.32
0.03
2.96
0.0
1.1
0.0
98.9
0.80
487
2.86
0.03
0.36
0.03
2.83
0.0
1.6
0.0
98.4
1.00
459
2.70
0.06
0.43
0.03
2.67
0.0
2.5
0.0
97.4
1.20
439
2.57
0.09
0.57
0.41
2.47
0.1
4.9
2.6
92.4
1.40
418
2.50
0.13
0.76
0.45
2.34
0.3
9.1
3.3
87.3
1.60
395
2.46
0.17
1.08
0.54
2.14
0.5
19.3
4.7
75.5
1.80
373
2.61
0.22
1.57
0.69
1.95
0.7
36.2
7.1
56.0
2.00
347
3.07
0.25
2.31
0.96
1.78
0.7
56.2
9.7
33.5
Table
G.8:Summary
ofcalculated
Sta
ticTempera
ture
systematicuncertainty
with
95%
levelofconfidenceforconfigura
tion
4.
Nominal
Mach
Typical
TS,ts
◦R
b TS,ts
◦R k=
2
b TS,ts
dueto
b PInst
◦R k=
2
b TS,ts
dueto
b PSCAL
◦R k=
2
b TS,ts
dueto
b PTCAL
◦R k=
2
b TS,ts
dueto
b TTCAL
◦R k=
2
b TS,ts
UPC
dueto
b PInst
b TS,ts
UPC
dueto
b PSCAL
b TS,ts
UPC
dueto
b PTCAL
b TS,ts
UPC
dueto
b TTCAL
0.25
523
2.86
0.00
0.24
0.03
2.85
0.0
0.7
0.0
99.3
0.40
518
2.80
0.01
0.25
0.03
2.79
0.0
0.8
0.0
99.2
0.60
521
2.68
0.02
0.29
0.03
2.67
0.0
1.2
0.0
98.8
0.80
497
2.57
0.03
0.33
0.03
2.55
0.0
1.7
0.0
98.3
1.00
467
2.44
0.06
0.39
0.03
2.40
0.1
2.6
0.0
97.3
1.20
448
2.33
0.10
0.53
0.43
2.23
0.2
5.2
3.4
91.3
1.40
426
2.27
0.13
0.70
0.47
2.10
0.3
9.6
4.3
85.8
1.60
404
2.26
0.17
1.01
0.56
1.94
0.6
20.0
6.1
73.2
1.80
384
2.41
0.22
1.44
0.73
1.77
0.9
35.8
9.2
54.2
2.00
357
2.91
0.27
2.17
1.05
1.62
0.8
55.2
12.9
31.0
Table
G.9:Summary
ofcalculated
Sta
ticTempera
ture
systematicuncertainty
with
95%
levelofconfidenceforconfigura
tion
5.
NASA/CR—2016-219411 225
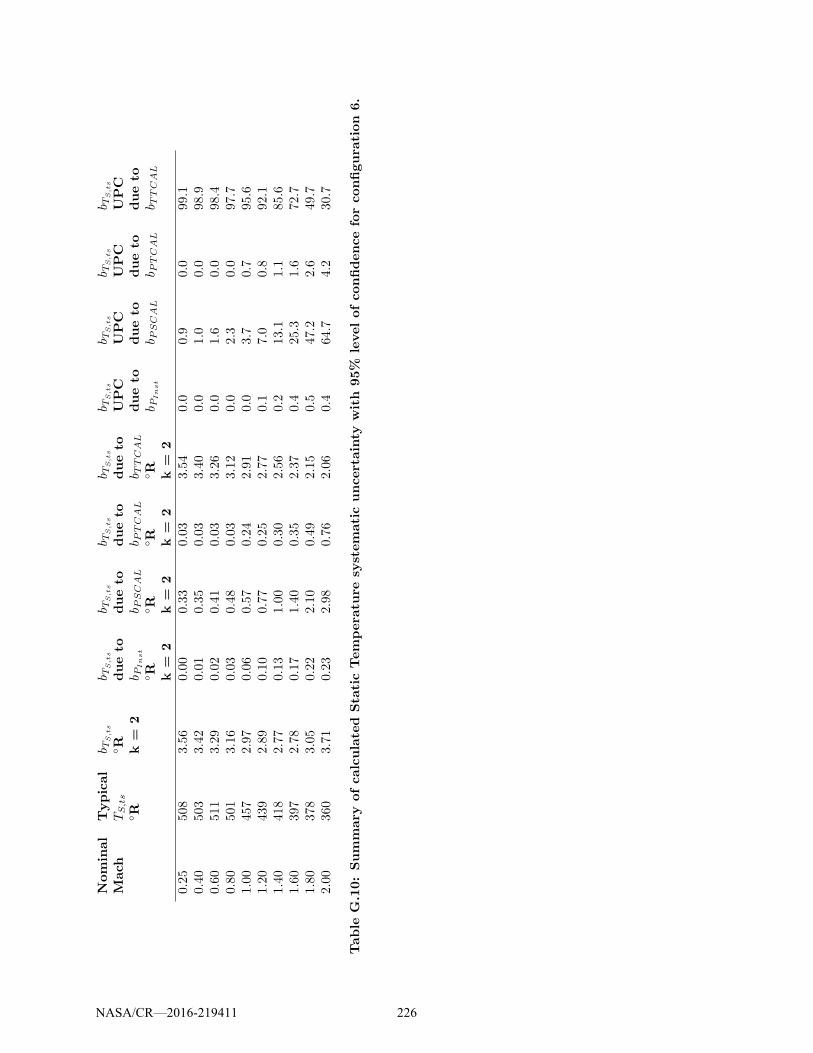
Nominal
Mach
Typical
TS,ts
◦R
b TS,ts
◦R k=
2
b TS,ts
dueto
b PInst
◦R k=
2
b TS,ts
dueto
b PSCAL
◦R k=
2
b TS,ts
dueto
b PTCAL
◦R k=
2
b TS,ts
dueto
b TTCAL
◦R k=
2
b TS,ts
UPC
dueto
b PInst
b TS,ts
UPC
dueto
b PSCAL
b TS,ts
UPC
dueto
b PTCAL
b TS,ts
UPC
dueto
b TTCAL
0.25
508
3.56
0.00
0.33
0.03
3.54
0.0
0.9
0.0
99.1
0.40
503
3.42
0.01
0.35
0.03
3.40
0.0
1.0
0.0
98.9
0.60
511
3.29
0.02
0.41
0.03
3.26
0.0
1.6
0.0
98.4
0.80
501
3.16
0.03
0.48
0.03
3.12
0.0
2.3
0.0
97.7
1.00
457
2.97
0.06
0.57
0.24
2.91
0.0
3.7
0.7
95.6
1.20
439
2.89
0.10
0.77
0.25
2.77
0.1
7.0
0.8
92.1
1.40
418
2.77
0.13
1.00
0.30
2.56
0.2
13.1
1.1
85.6
1.60
397
2.78
0.17
1.40
0.35
2.37
0.4
25.3
1.6
72.7
1.80
378
3.05
0.22
2.10
0.49
2.15
0.5
47.2
2.6
49.7
2.00
360
3.71
0.23
2.98
0.76
2.06
0.4
64.7
4.2
30.7
Table
G.10:Summary
ofcalculated
Sta
ticTempera
ture
systematicuncertainty
with
95%
levelofconfidenceforconfigura
tion
6.
NASA/CR—2016-219411 226
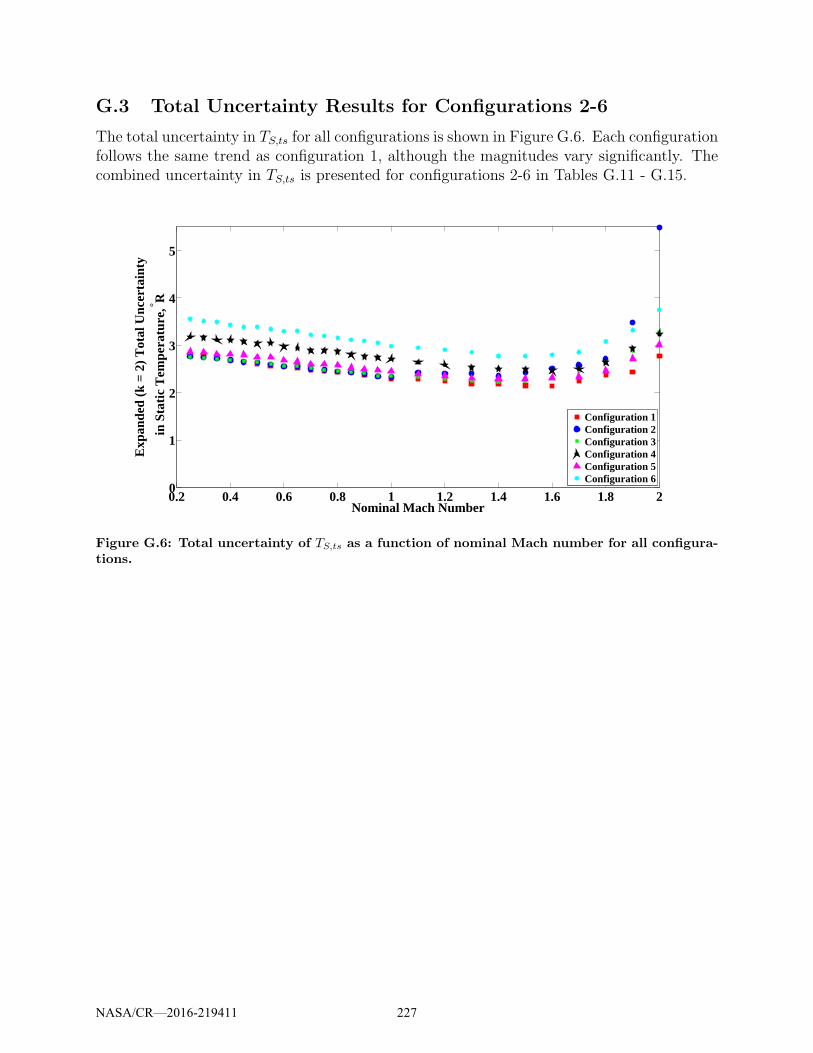
G.3 Total Uncertainty Results for Configurations 2-6
The total uncertainty in TS,ts for all configurations is shown in Figure G.6. Each configurationfollows the same trend as configuration 1, although the magnitudes vary significantly. Thecombined uncertainty in TS,ts is presented for configurations 2-6 in Tables G.11 - G.15.
0.2 0.4 0.6 0.8 1 1.2 1.4 1.6 1.8 20
1
2
3
4
5
Nominal Mach Number
Exp
ande
d (k
= 2
) T
otal
Unc
erta
inty
in S
tatic
Tem
pera
ture
, ° R
Configuration 1Configuration 2Configuration 3Configuration 4Configuration 5Configuration 6
Figure G.6: Total uncertainty of TS,ts as a function of nominal Mach number for all configura-tions.
NASA/CR—2016-219411 227

Nominal
Mach
Typical
TS,ts,◦R
sTS,ts
◦R k=
2
b TS,ts
◦R k=
2
uTS,ts
◦R k=
2
sTS,ts
UPC
b TS,ts
UPC
0.25
526
0.30
2.76
2.77
1.2
98.8
0.40
521
0.28
2.67
2.69
1.1
98.9
0.60
527
0.06
2.55
2.56
0.1
99.9
0.80
501
0.21
2.44
2.45
0.7
99.3
1.00
473
0.18
2.32
2.33
0.6
99.4
1.20
453
0.21
2.39
2.40
0.8
99.2
1.40
432
0.24
2.34
2.35
1.1
98.9
1.60
409
0.65
2.41
2.51
6.8
93.2
1.80
388
0.33
2.67
2.71
1.5
98.5
2.00
362
2.60
4.77
5.48
22.9
77.1
Table
G.11:Summary
ofcalculated
Sta
ticTempera
ture
uncertainty
with
95%
levelofconfidenceforconfigura
tion
2.
Nominal
Mach
Typical
TS,ts,◦R
sTS,ts
◦R k=
2
b TS,ts
◦R k=
2
uTS,ts
◦R k=
2
sTS,ts
UPC
b TS,ts
UPC
0.25
510
0.24
2.75
2.75
0.7
99.3
0.40
505
0.32
2.66
2.68
1.5
98.5
0.60
514
0.18
2.56
2.57
0.5
99.5
0.80
490
0.19
2.46
2.45
0.6
99.4
1.00
463
0.26
2.34
2.36
1.2
98.8
1.20
440
0.19
2.27
2.29
0.7
99.3
1.40
421
0.15
2.23
2.23
0.4
99.6
1.60
398
0.44
2.28
2.31
3.6
96.4
1.80
378
0.54
2.56
2.64
4.3
95.7
2.00
360
0.56
3.23
3.29
2.9
97.1
Table
G.12:Summary
ofcalculated
Sta
ticTempera
ture
uncertainty
with
95%
levelofconfidenceforconfigura
tion
3.
NASA/CR—2016-219411 228
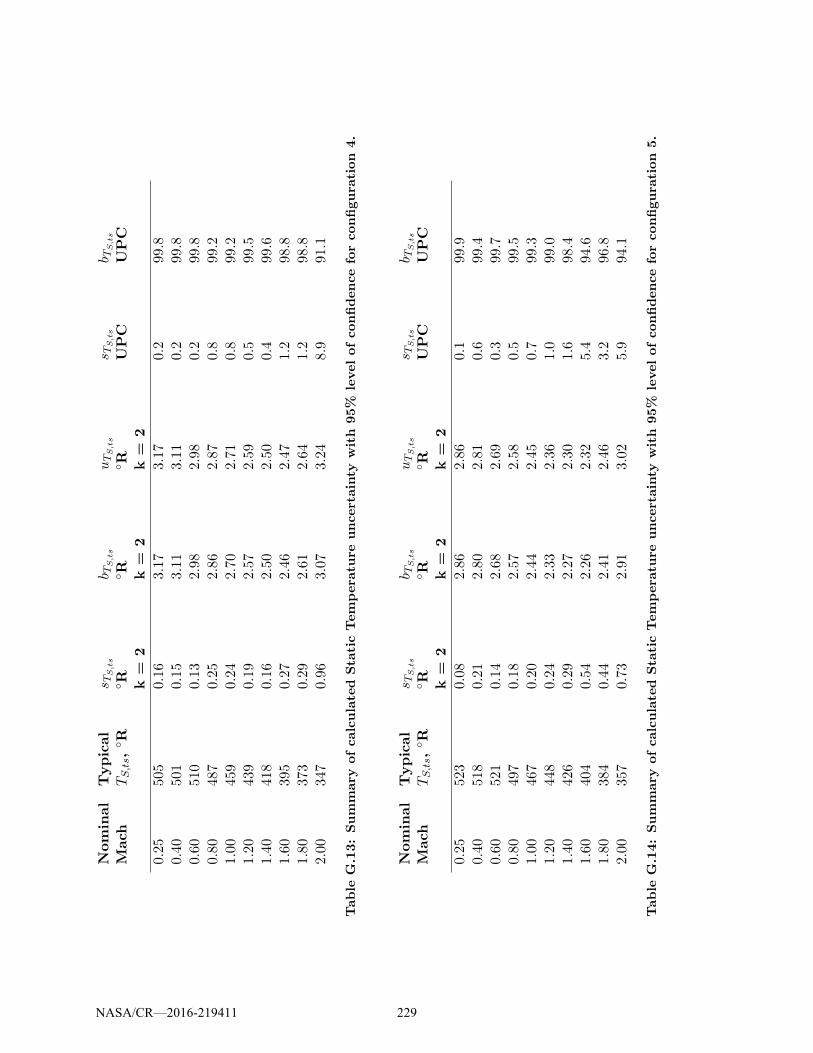
Nominal
Mach
Typical
TS,ts,◦R
sTS,ts
◦R k=
2
b TS,ts
◦R k=
2
uTS,ts
◦R k=
2
sTS,ts
UPC
b TS,ts
UPC
0.25
505
0.16
3.17
3.17
0.2
99.8
0.40
501
0.15
3.11
3.11
0.2
99.8
0.60
510
0.13
2.98
2.98
0.2
99.8
0.80
487
0.25
2.86
2.87
0.8
99.2
1.00
459
0.24
2.70
2.71
0.8
99.2
1.20
439
0.19
2.57
2.59
0.5
99.5
1.40
418
0.16
2.50
2.50
0.4
99.6
1.60
395
0.27
2.46
2.47
1.2
98.8
1.80
373
0.29
2.61
2.64
1.2
98.8
2.00
347
0.96
3.07
3.24
8.9
91.1
Table
G.13:Summary
ofcalculated
Sta
ticTempera
ture
uncertainty
with
95%
levelofconfidenceforconfigura
tion
4.
Nominal
Mach
Typical
TS,ts,◦R
sTS,ts
◦R k=
2
b TS,ts
◦R k=
2
uTS,ts
◦R k=
2
sTS,ts
UPC
b TS,ts
UPC
0.25
523
0.08
2.86
2.86
0.1
99.9
0.40
518
0.21
2.80
2.81
0.6
99.4
0.60
521
0.14
2.68
2.69
0.3
99.7
0.80
497
0.18
2.57
2.58
0.5
99.5
1.00
467
0.20
2.44
2.45
0.7
99.3
1.20
448
0.24
2.33
2.36
1.0
99.0
1.40
426
0.29
2.27
2.30
1.6
98.4
1.60
404
0.54
2.26
2.32
5.4
94.6
1.80
384
0.44
2.41
2.46
3.2
96.8
2.00
357
0.73
2.91
3.02
5.9
94.1
Table
G.14:Summary
ofcalculated
Sta
ticTempera
ture
uncertainty
with
95%
levelofconfidenceforconfigura
tion
5.
NASA/CR—2016-219411 229
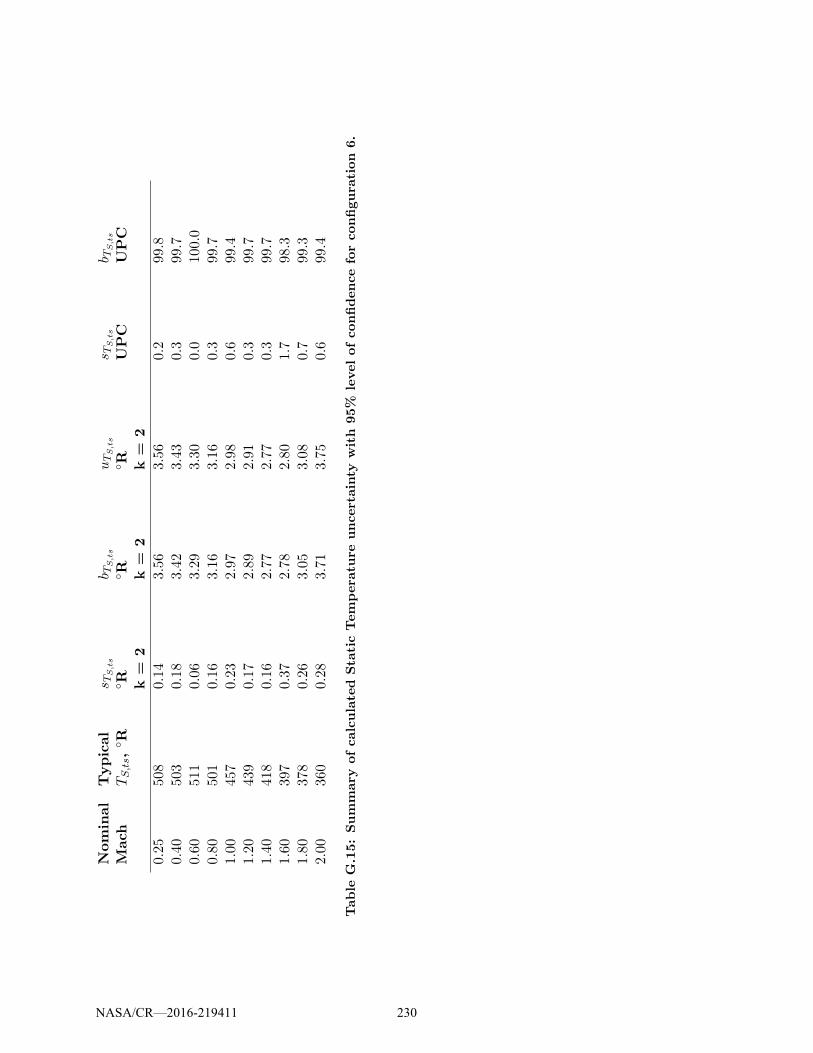
Nominal
Mach
Typical
TS,ts,◦R
sTS,ts
◦R k=
2
b TS,ts
◦R k=
2
uTS,ts
◦R k=
2
sTS,ts
UPC
b TS,ts
UPC
0.25
508
0.14
3.56
3.56
0.2
99.8
0.40
503
0.18
3.42
3.43
0.3
99.7
0.60
511
0.06
3.29
3.30
0.0
100.0
0.80
501
0.16
3.16
3.16
0.3
99.7
1.00
457
0.23
2.97
2.98
0.6
99.4
1.20
439
0.17
2.89
2.91
0.3
99.7
1.40
418
0.16
2.77
2.77
0.3
99.7
1.60
397
0.37
2.78
2.80
1.7
98.3
1.80
378
0.26
3.05
3.08
0.7
99.3
2.00
360
0.28
3.71
3.75
0.6
99.4
Table
G.15:Summary
ofcalculated
Sta
ticTempera
ture
uncertainty
with
95%
levelofconfidenceforconfigura
tion
6.
NASA/CR—2016-219411 230

Appendix H: Reynolds Number Uncertainty
Reynolds number is a function of Mach number, static pressure, and total temperature asshown in Figure H.1. Refer to Appendices B, C and F respectively to see uncertainty flowfrom measured values to those variables, which are propagated through the data reductionequations shown in Section 3.2.2 to attain uncertainty in Reynolds number. Results foruncertainty in Reynolds number for configuration 1 were presented in Section 5. Resultsfor configurations 2-6 are presented in this Appendix. Bar charts depicting the percentcontributions are shown, followed by tabulated results detailing dimensional and percentcontributions for random, systematic, and total uncertainty.
Figure H.1: Uncertainty flow from measured value to calculated Reynolds number in the testsection.
H.1 Random Uncertainty Results for Configurations 2-6
The random uncertainty in the Reynolds number is shown for all configurations in FigureH.2. All configurations follow a similar trend, remaining below 0.005 x 106 ft-1 subsonicallythen increasing supersonically. Configuration 2 shows a sharp increase at the highest Machnumbers, not seen in the other configurations, which remain below 0.02 x 106 ft-1.
The elemental random uncertainties contributing to random uncertainty in test sectionReynolds number are the random uncertainty in PT,bm and PS,bal. The percent contributionof each of these elemental uncertainties to the total random uncertainty in Rets are shownin Figure H.3. The tabulated details are shown in Tables H.1 - H.5.
NASA/CR—2016-219411 231
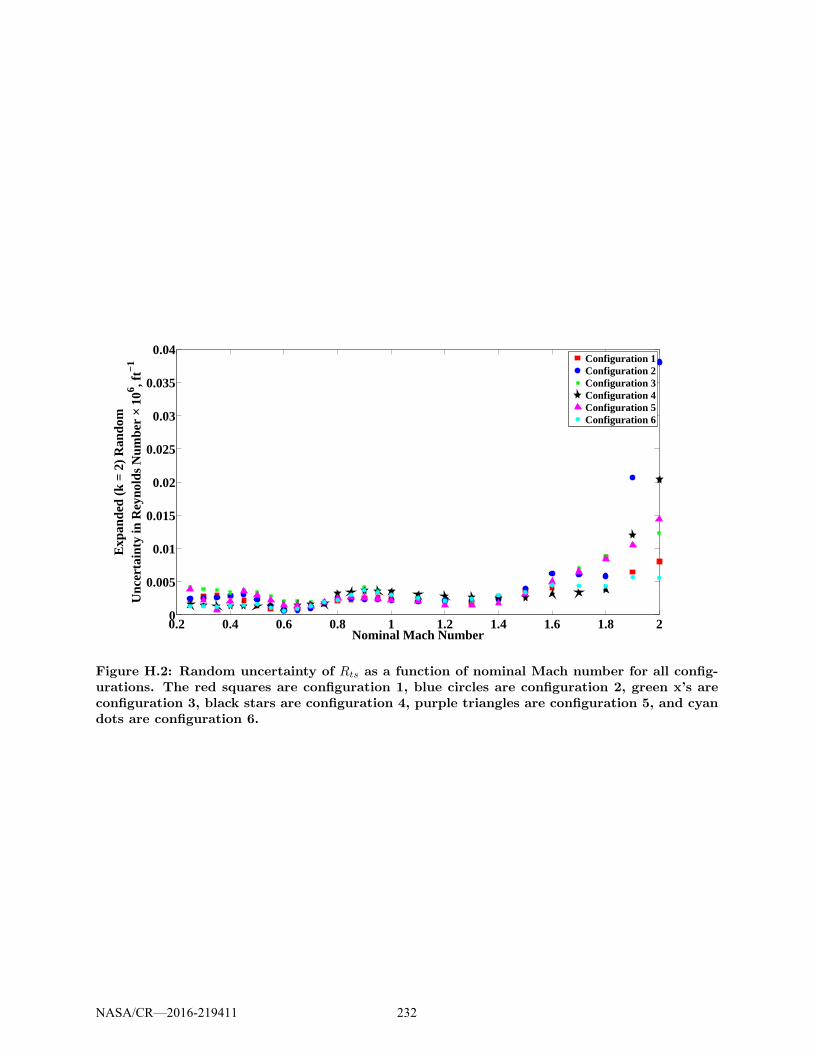
0.2 0.4 0.6 0.8 1 1.2 1.4 1.6 1.8 20
0.005
0.01
0.015
0.02
0.025
0.03
0.035
0.04
Nominal Mach Number
Exp
ande
d (k
= 2
) R
ando
mU
ncer
tain
ty in
Rey
nold
s N
umbe
r × 1
06 , ft−
1
Configuration 1Configuration 2Configuration 3Configuration 4Configuration 5Configuration 6
Figure H.2: Random uncertainty of Rts as a function of nominal Mach number for all config-urations. The red squares are configuration 1, blue circles are configuration 2, green x’s areconfiguration 3, black stars are configuration 4, purple triangles are configuration 5, and cyandots are configuration 6.
NASA/CR—2016-219411 232
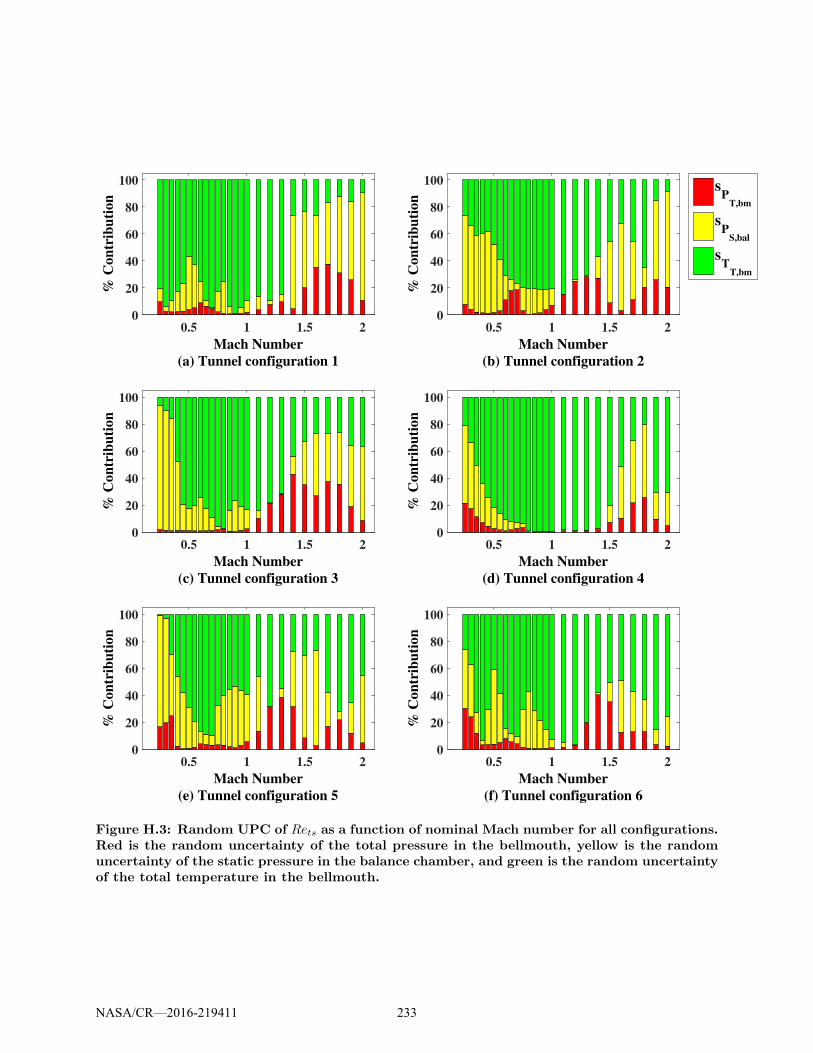
0.5 1 1.5 2
Mach Number
(a) Tunnel configuration 1
0
20
40
60
80
100
% C
on
trib
uti
on
0.5 1 1.5 2
Mach Number
(b) Tunnel configuration 2
0
20
40
60
80
100
% C
on
trib
uti
on
0.5 1 1.5 2
Mach Number
(c) Tunnel configuration 3
0
20
40
60
80
100
% C
on
trib
uti
on
0.5 1 1.5 2
Mach Number
(d) Tunnel configuration 4
0
20
40
60
80
100
% C
on
trib
uti
on
0.5 1 1.5 2
Mach Number
(e) Tunnel configuration 5
0
20
40
60
80
100
% C
on
trib
uti
on
0.5 1 1.5 2
Mach Number
(f) Tunnel configuration 6
0
20
40
60
80
100
% C
on
trib
uti
on
sP
T,bm
sP
S,bal
sT
T,bm
Figure H.3: Random UPC of Rets as a function of nominal Mach number for all configurations.Red is the random uncertainty of the total pressure in the bellmouth, yellow is the randomuncertainty of the static pressure in the balance chamber, and green is the random uncertaintyof the total temperature in the bellmouth.
NASA/CR—2016-219411 233
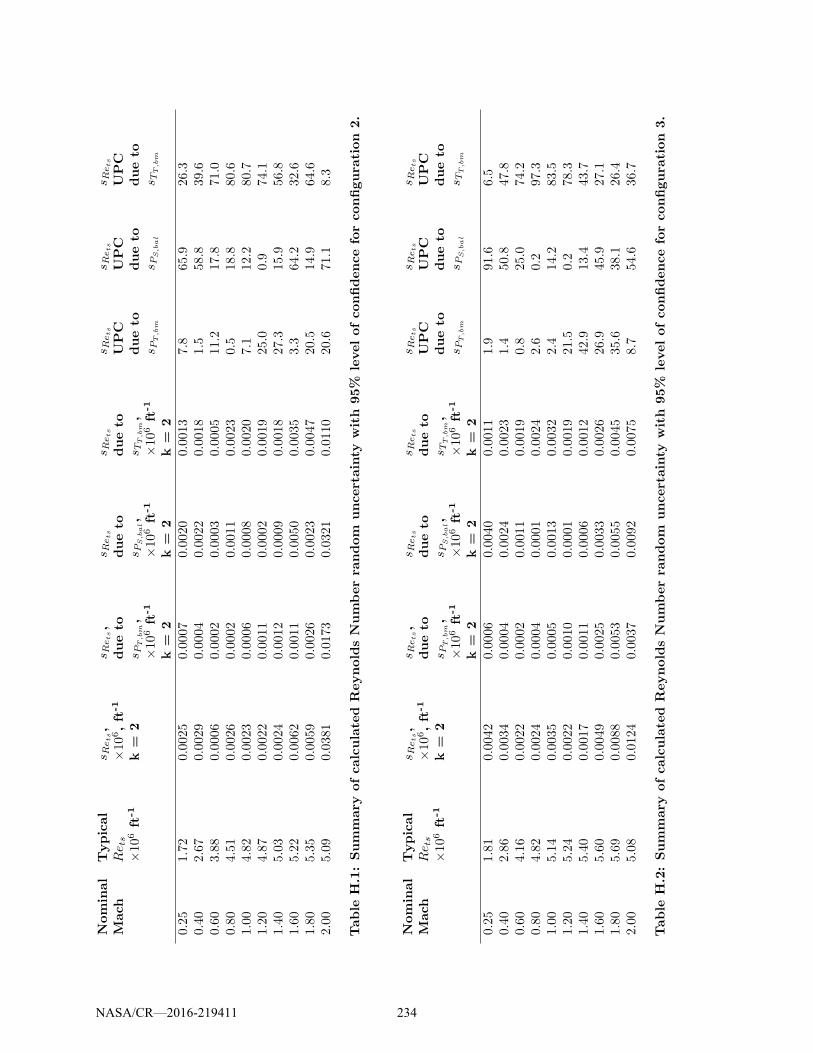
Nominal
Mach
Typical
Rets
×10
6ft
-1
sRets,
×10
6,ft
-1
k=
2
sRets,
dueto
sP
T,bm,
×10
6ft
-1
k=
2
sRets
dueto
sP
S,bal,
×10
6ft
-1
k=
2
sRets
dueto
sTT,bm,
×10
6ft
-1
k=
2
sRets
UPC
dueto
sP
T,bm
sRets
UPC
dueto
sP
S,bal
sRets
UPC
dueto
sTT,bm
0.25
1.72
0.00
250.00
070.00
200.00
137.8
65.9
26.3
0.40
2.67
0.00
290.00
040.00
220.00
181.5
58.8
39.6
0.60
3.88
0.00
060.00
020.00
030.00
0511
.217
.871
.00.80
4.51
0.00
260.00
020.00
110.00
230.5
18.8
80.6
1.00
4.82
0.00
230.00
060.00
080.00
207.1
12.2
80.7
1.20
4.87
0.00
220.00
110.00
020.00
1925
.00.9
74.1
1.40
5.03
0.002
40.00
120.00
090.00
1827
.315
.956
.81.60
5.22
0.006
20.00
110.00
500.00
353.3
64.2
32.6
1.80
5.35
0.00
590.00
260.00
230.00
4720
.514
.964
.62.00
5.09
0.03
810.01
730.03
210.01
1020
.671
.18.3
Table
H.1:Summary
ofcalculated
ReynoldsNumberra
ndom
uncertainty
with
95%
levelofconfidenceforconfigura
tion
2.
Nominal
Mach
Typical
Rets
×10
6ft
-1
sRets,
×10
6,ft
-1
k=
2
sRets,
dueto
sP
T,bm,
×10
6ft
-1
k=
2
sRets
dueto
sP
S,bal,
×10
6ft
-1
k=
2
sRets
dueto
sTT,bm,
×10
6ft
-1
k=
2
sRets
UPC
dueto
sP
T,bm
sRets
UPC
dueto
sP
S,bal
sRets
UPC
dueto
sTT,bm
0.25
1.81
0.00
420.00
060.00
400.00
111.9
91.6
6.5
0.40
2.86
0.00
340.00
040.00
240.00
231.4
50.8
47.8
0.60
4.16
0.00
220.00
020.00
110.00
190.8
25.0
74.2
0.80
4.82
0.00
240.00
040.00
010.00
242.6
0.2
97.3
1.00
5.14
0.003
50.00
050.00
130.00
322.4
14.2
83.5
1.20
5.24
0.00
220.00
100.00
010.00
1921
.50.2
78.3
1.40
5.40
0.001
70.00
110.00
060.00
1242
.913
.443
.71.60
5.60
0.004
90.00
250.00
330.00
2626
.945
.927
.11.80
5.69
0.008
80.00
530.00
550.00
4535
.638
.126
.42.00
5.08
0.012
40.00
370.00
920.00
758.7
54.6
36.7
Table
H.2:Summary
ofcalculated
ReynoldsNumberra
ndom
uncertainty
with
95%
levelofconfidenceforconfigura
tion
3.
NASA/CR—2016-219411 234

Nominal
Mach
Typical
Rets
×10
6ft
-1
sRets,
×10
6,ft
-1
k=
2
sRets,
dueto
sP
T,bm,
×10
6ft
-1
k=
2
sRets
dueto
sP
S,bal,
×10
6ft
-1
k=
2
sRets
dueto
sTT,bm,
×10
6ft
-1
k=
2
sRets
UPC
dueto
sP
T,bm
sRets
UPC
dueto
sP
S,bal
sRets
UPC
dueto
sTT,bm
0.25
1.85
0.00
160.00
070.00
120.00
0721
.557
.620
.90.40
2.88
0.00
140.00
040.00
070.00
117.1
28.8
64.0
0.60
4.19
0.00
140.00
010.00
040.00
130.9
8.6
90.5
0.80
4.86
0.003
30.00
010.00
030.00
320.2
0.8
99.0
1.00
5.19
0.003
50.00
020.00
020.00
350.5
0.3
99.2
1.20
5.25
0.002
90.00
030.00
000.00
291.1
0.0
98.9
1.40
5.41
0.002
60.00
030.00
030.00
251.7
1.3
97.0
1.60
5.62
0.003
20.00
100.00
200.00
2310
.437
.951
.71.80
5.74
0.003
80.00
190.00
280.00
1725
.854
.020
.22.00
5.33
0.020
40.00
450.01
010.01
724.9
24.4
70.7
Table
H.3:Summary
ofcalculated
ReynoldsNumberra
ndom
uncertainty
with
95%
levelofconfidenceforconfigura
tion
4.
Nominal
Mach
Typical
Rets
×10
6ft
-1
sRets,
×10
6,ft
-1
k=
2
sRets,
dueto
sP
T,bm,
×10
6ft
-1
k=
2
sRets
dueto
sP
S,bal,
×10
6ft
-1
k=
2
sRets
dueto
sTT,bm,
×10
6ft
-1
k=
2
sRets
UPC
dueto
sP
T,bm
sRets
UPC
dueto
sP
S,bal
sRets
UPC
dueto
sTT,bm
0.25
1.70
0.00
390.00
160.00
350.00
0316
.882
.50.7
0.40
2.67
0.00
210.00
030.00
150.00
142.4
51.8
45.8
0.60
3.96
0.00
150.00
030.00
050.00
144.1
9.2
86.7
0.80
4.59
0.002
60.00
050.00
150.00
203.2
36.6
60.2
1.00
4.94
0.00
230.00
050.00
130.00
175.6
35.1
59.4
1.20
4.99
0.00
150.00
080.00
000.00
1231
.80.0
68.2
1.40
5.15
0.001
70.00
100.00
110.00
0931
.840
.827
.51.60
5.34
0.005
00.00
090.00
420.00
262.9
70.6
26.5
1.80
5.45
0.00
840.00
390.00
210.00
7221
.86.2
72.0
2.00
5.11
0.014
40.00
310.01
020.00
984.7
49.6
45.6
Table
H.4:Summary
ofcalculated
ReynoldsNumberra
ndom
uncertainty
with
95%
levelofconfidenceforconfigura
tion
5.
NASA/CR—2016-219411 235
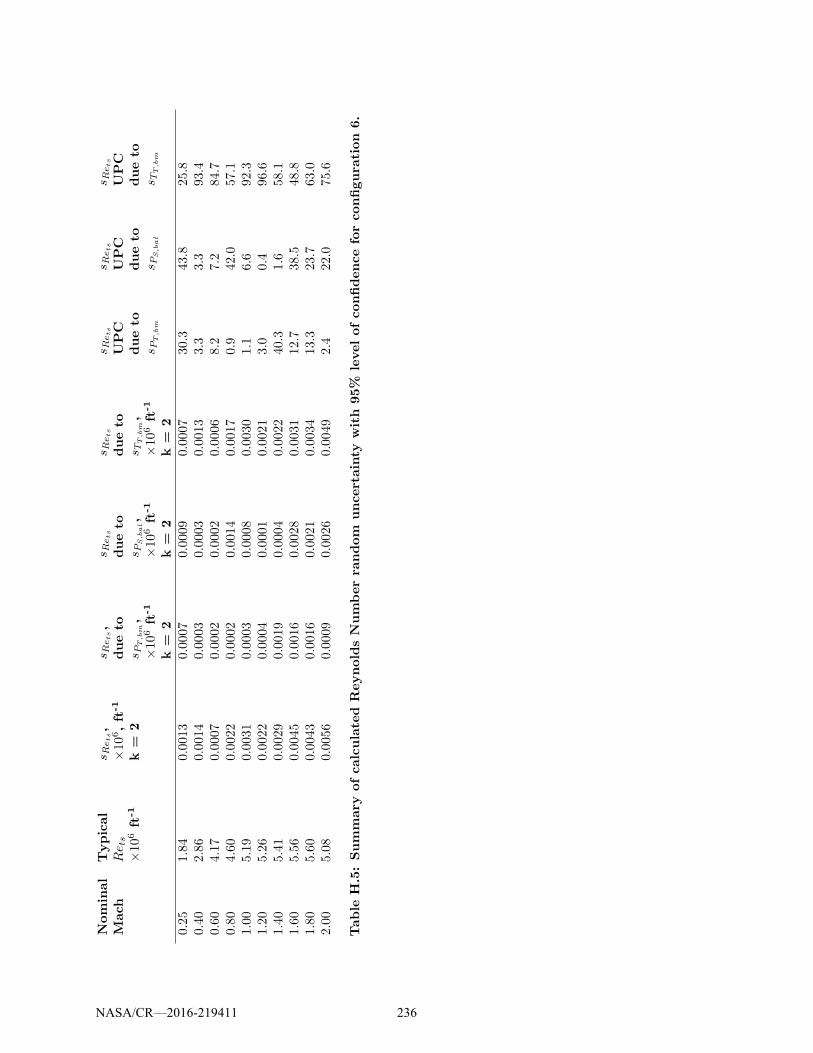
Nominal
Mach
Typical
Rets
×10
6ft
-1
sRets,
×10
6,ft
-1
k=
2
sRets,
dueto
sP
T,bm,
×10
6ft
-1
k=
2
sRets
dueto
sP
S,bal,
×10
6ft
-1
k=
2
sRets
dueto
sTT,bm,
×10
6ft
-1
k=
2
sRets
UPC
dueto
sP
T,bm
sRets
UPC
dueto
sP
S,bal
sRets
UPC
dueto
sTT,bm
0.25
1.84
0.00
130.00
070.00
090.00
0730
.343
.825
.80.40
2.86
0.00
140.00
030.00
030.00
133.3
3.3
93.4
0.60
4.17
0.000
70.00
020.00
020.00
068.2
7.2
84.7
0.80
4.60
0.002
20.00
020.00
140.00
170.9
42.0
57.1
1.00
5.19
0.00
310.00
030.00
080.00
301.1
6.6
92.3
1.20
5.26
0.002
20.00
040.00
010.00
213.0
0.4
96.6
1.40
5.41
0.002
90.00
190.00
040.00
2240
.31.6
58.1
1.60
5.56
0.004
50.00
160.00
280.00
3112
.738
.548
.81.80
5.60
0.004
30.00
160.00
210.00
3413
.323
.763
.02.00
5.08
0.005
60.00
090.00
260.00
492.4
22.0
75.6
Table
H.5:Summary
ofcalculated
ReynoldsNumberra
ndom
uncertainty
with
95%
levelofconfidenceforconfigura
tion
6.
NASA/CR—2016-219411 236

H.2 Systematic Uncertainty Results for Configurations 2-6
The systematic uncertainty in the test section Reynolds number is shown for all configura-tions in Figure H.4. All configurations follow a similar trend with varying magnitudes.
0.2 0.4 0.6 0.8 1 1.2 1.4 1.6 1.8 20
0.01
0.02
0.03
0.04
0.05
0.06
0.07
0.08
0.09
Nominal Mach Number
Exp
ande
d (k
= 2
) S
yste
mat
ic
Unc
erta
inty
inR
eyno
lds
Num
ber ×
106 , f
t−1 ,
Configuration 1Configuration 2Configuration 3Configuration 4Configuration 5Configuration 6
Figure H.4: Systematic uncertainty of Rets as a function of nominal Mach number for allconfigurations. The red squares are configuration 1, blue circles are configuration 2, green x’sare configuration 3, black stars are configuration 4, purple triangles are configuration 5, andcyan dots are configuration 6.
The systematic uncertainty in Rets is due to systematic contributions from all tunnelcalibrations (bPSCAL, bPTCAL, and bTTCAL), instrumentation uncertainties in test-time bell-mouth total pressure, balance chamber static pressure, and barometric pressure (combinedas bPinst
). The percent contributions of each of these uncertainties to the combined system-atic uncertainty in Rets are shown in Figure H.5. The tabulated details are shown in TablesH.6 - H.10.
NASA/CR—2016-219411 237
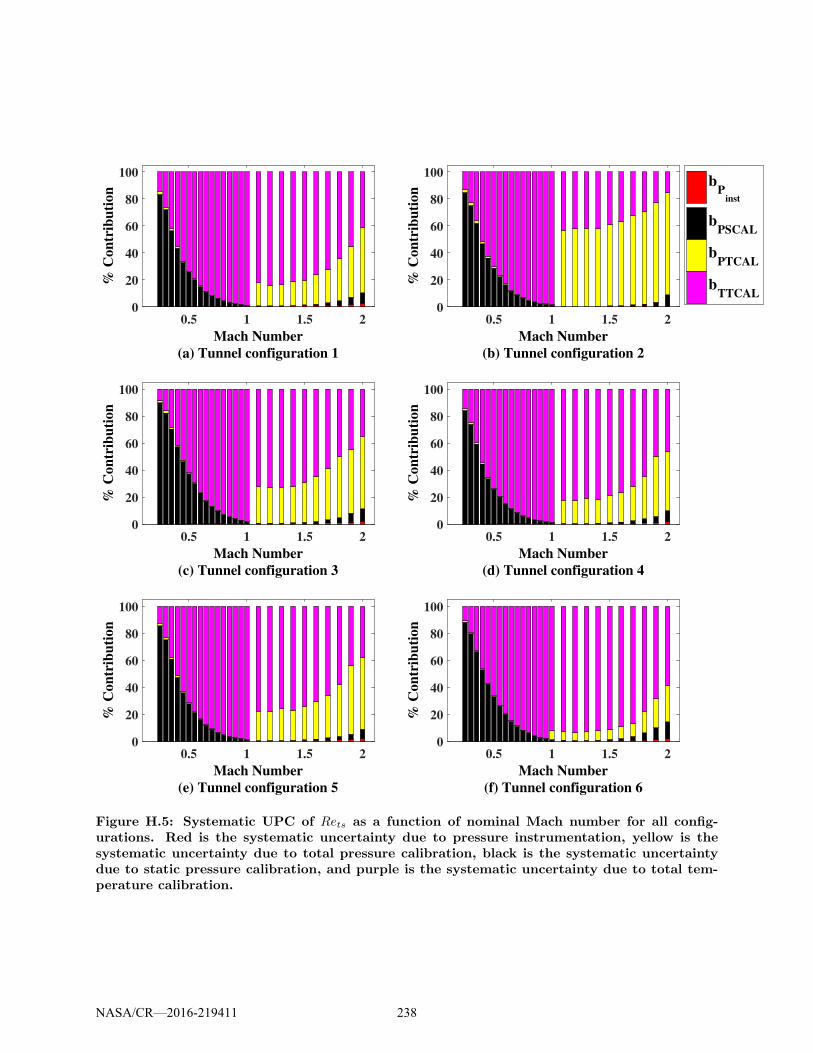
0.5 1 1.5 2
Mach Number
(a) Tunnel configuration 1
0
20
40
60
80
100
% C
on
trib
uti
on
0.5 1 1.5 2
Mach Number
(b) Tunnel configuration 2
0
20
40
60
80
100
% C
on
trib
uti
on
0.5 1 1.5 2
Mach Number
(c) Tunnel configuration 3
0
20
40
60
80
100
% C
on
trib
uti
on
0.5 1 1.5 2
Mach Number
(d) Tunnel configuration 4
0
20
40
60
80
100
% C
on
trib
uti
on
0.5 1 1.5 2
Mach Number
(e) Tunnel configuration 5
0
20
40
60
80
100
% C
on
trib
uti
on
0.5 1 1.5 2
Mach Number
(f) Tunnel configuration 6
0
20
40
60
80
100
% C
on
trib
uti
on
bP
inst
bPSCAL
bPTCAL
bTTCAL
Figure H.5: Systematic UPC of Rets as a function of nominal Mach number for all config-urations. Red is the systematic uncertainty due to pressure instrumentation, yellow is thesystematic uncertainty due to total pressure calibration, black is the systematic uncertaintydue to static pressure calibration, and purple is the systematic uncertainty due to total tem-perature calibration.
NASA/CR—2016-219411 238

Nominal
Mach
Typical
Rets
×10
6ft
-1
b Rets
×10
6
ft-1
k=
2
b Rets
dueto
b PInst
×10
6ft
-1
k=
2
b Rets
dueto
b PSCAL,
×10
6ft
-1
k=
2
b Rets
dueto
b PTCAL,
×10
6ft
-1
k=
2
b Rets
dueto
b TTCAL,
×10
6ft
-1
k=
2
b Rets
UPC
dueto
b PInst
b Rets
UPC
dueto
b PSCAL
b Rets
UPC
dueto
b PTCAL
b Rets
UPC
dueto
b TTCAL
0.25
1.72
0.03
210.00
050.02
950.00
510.01
140.0
84.7
2.5
12.7
0.40
2.67
0.02
420.00
080.01
650.00
320.01
740.1
46.6
1.7
51.6
0.60
3.88
0.02
620.00
120.01
050.00
210.02
380.2
16.1
0.7
83.0
0.80
4.51
0.02
870.00
150.00
610.00
170.02
800.3
4.5
0.3
94.9
1.00
4.82
0.03
050.00
190.00
310.00
140.03
020.4
1.0
0.2
98.4
1.20
4.87
0.04
620.00
220.00
180.03
500.03
000.2
0.2
57.4
42.2
1.40
5.03
0.04
730.00
290.00
200.03
580.03
070.4
0.2
57.2
42.2
1.60
5.22
0.05
200.00
370.00
370.04
110.03
140.5
0.5
62.5
36.5
1.80
5.35
0.05
930.00
490.00
710.04
900.03
230.7
1.4
68.3
29.6
2.00
5.09
0.08
210.00
590.02
380.07
150.03
230.5
8.4
75.7
15.4
Table
H.6:Summary
ofcalculated
ReynoldsNumbersy
stematicuncertainty
with
95%
levelofconfidenceforconfigura
tion
2.
Nominal
Mach
Typical
Rets
×10
6ft
-1
b Rets
×10
6
ft-1
k=
2
b Rets
dueto
b PInst
×10
6ft
-1
k=
2
b Rets
dueto
b PSCAL,
×10
6ft
-1
k=
2
b Rets
dueto
b PTCAL,
×10
6ft
-1
k=
2
b Rets
dueto
b TTCAL,
×10
6ft
-1
k=
2
b Rets
UPC
dueto
b PInst
b Rets
UPC
dueto
b PSCAL
b Rets
UPC
dueto
b PTCAL
b Rets
UPC
dueto
b TTCAL
0.25
1.81
0.04
260.00
050.04
030.00
550.01
240.0
89.8
1.7
8.5
0.40
2.86
0.02
970.00
080.02
250.00
340.01
910.1
57.2
1.3
41.4
0.60
4.16
0.03
000.00
130.01
440.00
240.02
620.2
22.9
0.6
76.3
0.80
4.82
0.03
190.00
160.00
840.00
180.03
070.2
7.0
0.3
92.5
1.00
5.14
0.03
350.00
190.00
440.00
140.03
310.3
1.7
0.2
97.8
1.20
5.24
0.03
900.00
240.00
240.02
010.03
320.4
0.4
26.7
72.6
1.40
5.40
0.03
990.00
310.00
270.02
080.03
380.6
0.4
27.2
71.8
1.60
5.60
0.04
290.00
380.00
470.02
480.03
450.8
1.2
33.5
64.5
1.80
5.69
0.04
830.00
500.00
930.03
250.03
411.1
3.7
45.2
50.0
2.00
5.08
0.05
190.00
790.01
560.03
810.03
072.3
9.0
53.7
35.0
Table
H.7:Summary
ofcalculated
ReynoldsNumbersy
stematicuncertainty
with
95%
levelofconfidenceforconfigura
tion
3.
NASA/CR—2016-219411 239
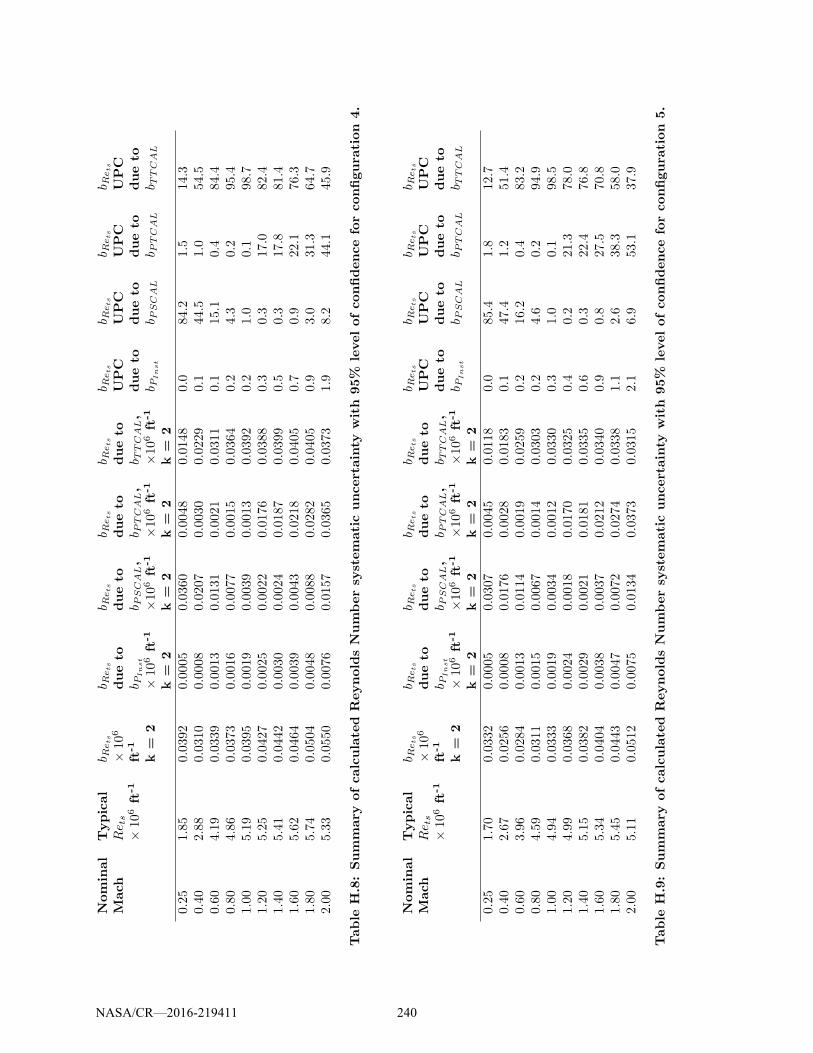
Nominal
Mach
Typical
Rets
×10
6ft
-1
b Rets
×10
6
ft-1
k=
2
b Rets
dueto
b PInst
×10
6ft
-1
k=
2
b Rets
dueto
b PSCAL,
×10
6ft
-1
k=
2
b Rets
dueto
b PTCAL,
×10
6ft
-1
k=
2
b Rets
dueto
b TTCAL,
×10
6ft
-1
k=
2
b Rets
UPC
dueto
b PInst
b Rets
UPC
dueto
b PSCAL
b Rets
UPC
dueto
b PTCAL
b Rets
UPC
dueto
b TTCAL
0.25
1.85
0.03
920.00
050.03
600.00
480.01
480.0
84.2
1.5
14.3
0.40
2.88
0.03
100.00
080.02
070.00
300.02
290.1
44.5
1.0
54.5
0.60
4.19
0.03
390.00
130.01
310.00
210.03
110.1
15.1
0.4
84.4
0.80
4.86
0.03
730.00
160.00
770.00
150.03
640.2
4.3
0.2
95.4
1.00
5.19
0.03
950.00
190.00
390.00
130.03
920.2
1.0
0.1
98.7
1.20
5.25
0.04
270.00
250.00
220.01
760.03
880.3
0.3
17.0
82.4
1.40
5.41
0.04
420.00
300.00
240.01
870.03
990.5
0.3
17.8
81.4
1.60
5.62
0.04
640.00
390.00
430.02
180.04
050.7
0.9
22.1
76.3
1.80
5.74
0.05
040.00
480.00
880.02
820.04
050.9
3.0
31.3
64.7
2.00
5.33
0.05
500.00
760.01
570.03
650.03
731.9
8.2
44.1
45.9
Table
H.8:Summary
ofcalculated
ReynoldsNumbersy
stematicuncertainty
with
95%
levelofconfidenceforconfigura
tion
4.
Nominal
Mach
Typical
Rets
×10
6ft
-1
b Rets
×10
6
ft-1
k=
2
b Rets
dueto
b PInst
×10
6ft
-1
k=
2
b Rets
dueto
b PSCAL,
×10
6ft
-1
k=
2
b Rets
dueto
b PTCAL,
×10
6ft
-1
k=
2
b Rets
dueto
b TTCAL,
×10
6ft
-1
k=
2
b Rets
UPC
dueto
b PInst
b Rets
UPC
dueto
b PSCAL
b Rets
UPC
dueto
b PTCAL
b Rets
UPC
dueto
b TTCAL
0.25
1.70
0.03
320.00
050.03
070.00
450.01
180.0
85.4
1.8
12.7
0.40
2.67
0.02
560.00
080.01
760.00
280.01
830.1
47.4
1.2
51.4
0.60
3.96
0.02
840.00
130.01
140.00
190.02
590.2
16.2
0.4
83.2
0.80
4.59
0.03
110.00
150.00
670.00
140.03
030.2
4.6
0.2
94.9
1.00
4.94
0.03
330.00
190.00
340.00
120.03
300.3
1.0
0.1
98.5
1.20
4.99
0.03
680.00
240.00
180.01
700.03
250.4
0.2
21.3
78.0
1.40
5.15
0.03
820.00
290.00
210.01
810.03
350.6
0.3
22.4
76.8
1.60
5.34
0.04
040.00
380.00
370.02
120.03
400.9
0.8
27.5
70.8
1.80
5.45
0.04
430.00
470.00
720.02
740.03
381.1
2.6
38.3
58.0
2.00
5.11
0.05
120.00
750.01
340.03
730.03
152.1
6.9
53.1
37.9
Table
H.9:Summary
ofcalculated
ReynoldsNumbersy
stematicuncertainty
with
95%
levelofconfidenceforconfigura
tion
5.
NASA/CR—2016-219411 240
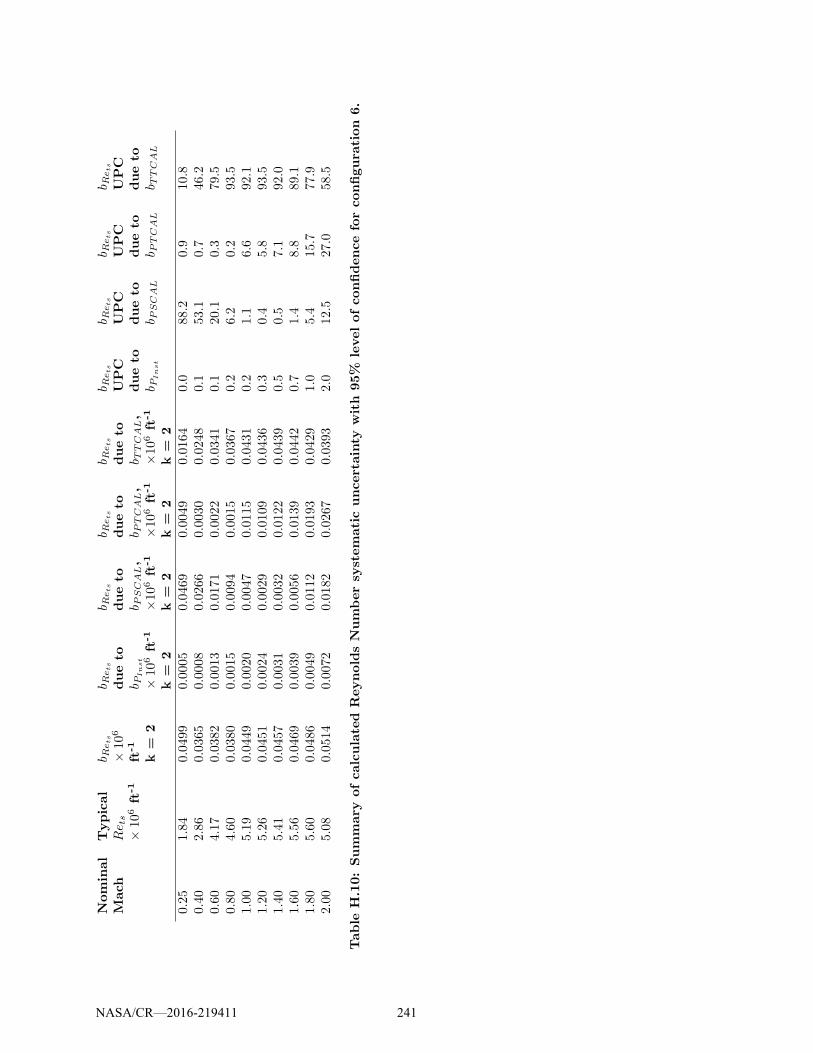
Nominal
Mach
Typical
Rets
×10
6ft
-1
b Rets
×10
6
ft-1
k=
2
b Rets
dueto
b PInst
×10
6ft
-1
k=
2
b Rets
dueto
b PSCAL,
×10
6ft
-1
k=
2
b Rets
dueto
b PTCAL,
×10
6ft
-1
k=
2
b Rets
dueto
b TTCAL,
×10
6ft
-1
k=
2
b Rets
UPC
dueto
b PInst
b Rets
UPC
dueto
b PSCAL
b Rets
UPC
dueto
b PTCAL
b Rets
UPC
dueto
b TTCAL
0.25
1.84
0.04
990.00
050.04
690.00
490.01
640.0
88.2
0.9
10.8
0.40
2.86
0.03
650.00
080.02
660.00
300.02
480.1
53.1
0.7
46.2
0.60
4.17
0.03
820.00
130.01
710.00
220.03
410.1
20.1
0.3
79.5
0.80
4.60
0.03
800.00
150.00
940.00
150.03
670.2
6.2
0.2
93.5
1.00
5.19
0.04
490.00
200.00
470.01
150.04
310.2
1.1
6.6
92.1
1.20
5.26
0.04
510.00
240.00
290.01
090.04
360.3
0.4
5.8
93.5
1.40
5.41
0.04
570.00
310.00
320.01
220.04
390.5
0.5
7.1
92.0
1.60
5.56
0.04
690.00
390.00
560.01
390.04
420.7
1.4
8.8
89.1
1.80
5.60
0.04
860.00
490.01
120.01
930.04
291.0
5.4
15.7
77.9
2.00
5.08
0.05
140.00
720.01
820.02
670.03
932.0
12.5
27.0
58.5
Table
H.10:Summary
ofcalculated
ReynoldsNumbersy
stematicuncertainty
with
95%
levelofconfidenceforconfigura
tion
6.
NASA/CR—2016-219411 241
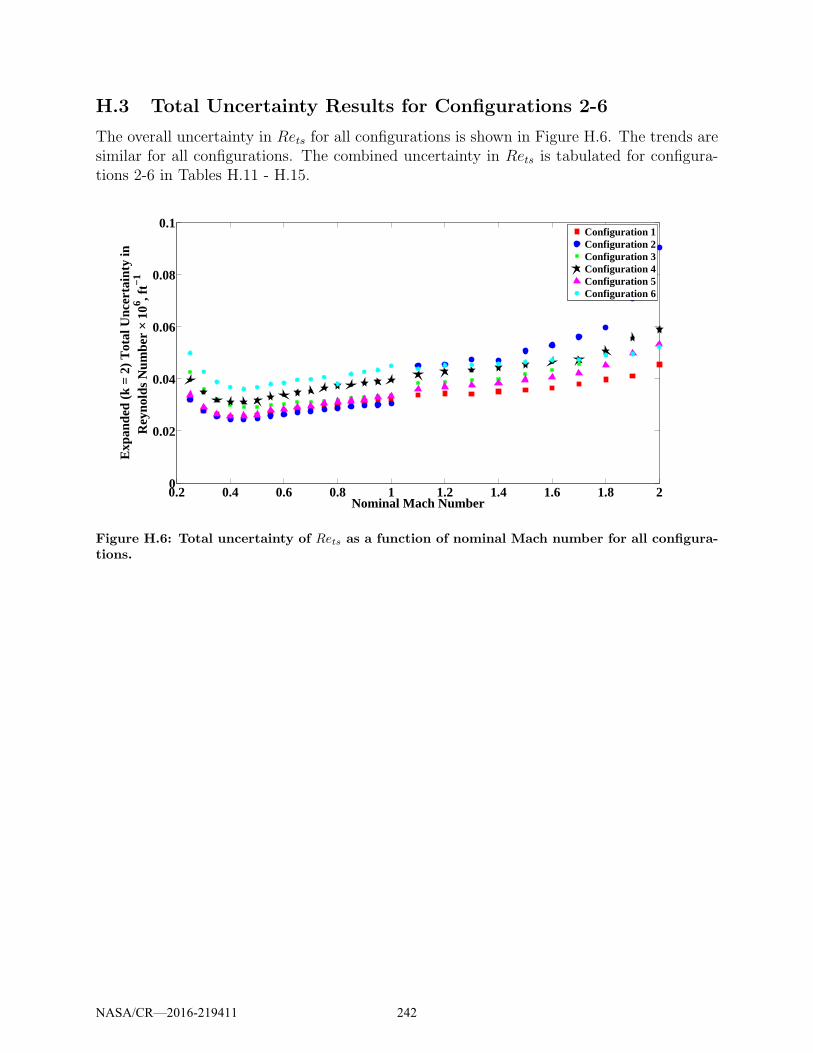
H.3 Total Uncertainty Results for Configurations 2-6
The overall uncertainty in Rets for all configurations is shown in Figure H.6. The trends aresimilar for all configurations. The combined uncertainty in Rets is tabulated for configura-tions 2-6 in Tables H.11 - H.15.
0.2 0.4 0.6 0.8 1 1.2 1.4 1.6 1.8 20
0.02
0.04
0.06
0.08
0.1
Nominal Mach Number
Exp
ande
d (k
= 2
) T
otal
Unc
erta
inty
inR
eyno
lds
Num
ber
× 106 , f
t−1
Configuration 1Configuration 2Configuration 3Configuration 4Configuration 5Configuration 6
Figure H.6: Total uncertainty of Rets as a function of nominal Mach number for all configura-tions.
NASA/CR—2016-219411 242
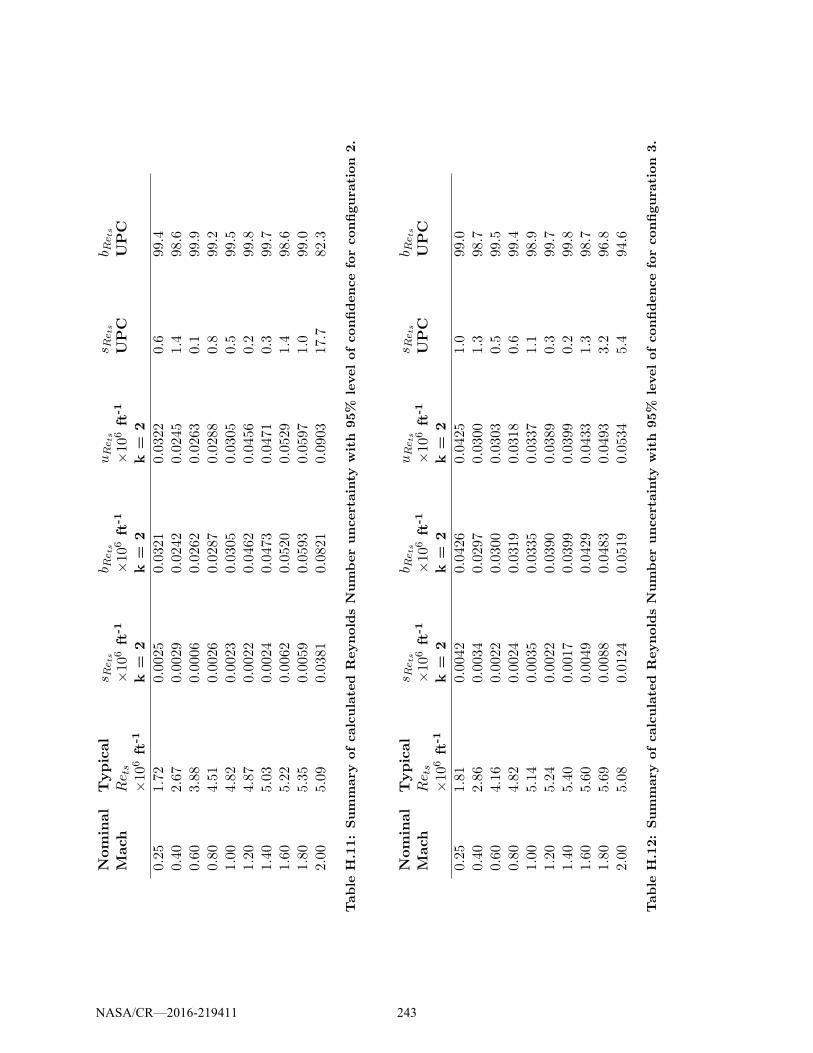
Nominal
Mach
Typical
Rets
×10
6ft
-1
sRets
×10
6ft
-1
k=
2
b Rets
×10
6ft
-1
k=
2
uRets
×10
6ft
-1
k=
2
sRets
UPC
b Rets
UPC
0.25
1.72
0.0025
0.0321
0.0322
0.6
99.4
0.40
2.67
0.0029
0.0242
0.0245
1.4
98.6
0.60
3.88
0.0006
0.0262
0.0263
0.1
99.9
0.80
4.51
0.0026
0.0287
0.0288
0.8
99.2
1.00
4.82
0.0023
0.0305
0.0305
0.5
99.5
1.20
4.87
0.0022
0.0462
0.0456
0.2
99.8
1.40
5.03
0.0024
0.0473
0.0471
0.3
99.7
1.60
5.22
0.0062
0.0520
0.0529
1.4
98.6
1.80
5.35
0.0059
0.0593
0.0597
1.0
99.0
2.00
5.09
0.0381
0.0821
0.0903
17.7
82.3
Table
H.11:Summary
ofcalculated
ReynoldsNumberuncertainty
with
95%
levelofconfidenceforconfigura
tion
2.
Nominal
Mach
Typical
Rets
×10
6ft
-1
sRets
×10
6ft
-1
k=
2
b Rets
×10
6ft
-1
k=
2
uRets
×10
6ft
-1
k=
2
sRets
UPC
b Rets
UPC
0.25
1.81
0.0042
0.0426
0.0425
1.0
99.0
0.40
2.86
0.0034
0.0297
0.0300
1.3
98.7
0.60
4.16
0.0022
0.0300
0.0303
0.5
99.5
0.80
4.82
0.0024
0.0319
0.0318
0.6
99.4
1.00
5.14
0.0035
0.0335
0.0337
1.1
98.9
1.20
5.24
0.0022
0.0390
0.0389
0.3
99.7
1.40
5.40
0.0017
0.0399
0.0399
0.2
99.8
1.60
5.60
0.0049
0.0429
0.0433
1.3
98.7
1.80
5.69
0.0088
0.0483
0.0493
3.2
96.8
2.00
5.08
0.0124
0.0519
0.0534
5.4
94.6
Table
H.12:Summary
ofcalculated
ReynoldsNumberuncertainty
with
95%
levelofconfidenceforconfigura
tion
3.
NASA/CR—2016-219411 243

Nominal
Mach
Typical
Rets
×10
6ft
-1
sRets
×10
6ft
-1
k=
2
b Rets
×10
6ft
-1
k=
2
uRets
×10
6ft
-1
k=
2
sRets
UPC
b Rets
UPC
0.25
1.85
0.0016
0.0392
0.0396
0.2
99.8
0.40
2.88
0.0014
0.0310
0.0311
0.2
99.8
0.60
4.19
0.0014
0.0339
0.0338
0.2
99.8
0.80
4.86
0.0033
0.0373
0.0375
0.8
99.2
1.00
5.19
0.0035
0.0395
0.0396
0.8
99.2
1.20
5.25
0.0029
0.0427
0.0428
0.5
99.5
1.40
5.41
0.0026
0.0442
0.0443
0.3
99.7
1.60
5.62
0.0032
0.0464
0.0464
0.5
99.5
1.80
5.74
0.0038
0.0504
0.0506
0.6
99.4
2.00
5.33
0.0204
0.0550
0.0589
12.1
87.9
Table
H.13:Summary
ofcalculated
ReynoldsNumberuncertainty
with
95%
levelofconfidenceforconfigura
tion
4.
Nominal
Mach
Typical
Rets
×10
6ft
-1
sRets
×10
6ft
-1
k=
2
b Rets
×10
6ft
-1
k=
2
uRets
×10
6ft
-1
k=
2
sRets
UPC
b Rets
UPC
0.25
1.70
0.0039
0.0332
0.0339
1.3
98.7
0.40
2.67
0.0021
0.0256
0.0257
0.7
99.3
0.60
3.96
0.0015
0.0284
0.0283
0.3
99.7
0.80
4.59
0.0026
0.0311
0.0312
0.7
99.3
1.00
4.94
0.0023
0.0333
0.0333
0.5
99.5
1.20
4.99
0.0015
0.0368
0.0369
0.2
99.8
1.40
5.15
0.0017
0.0382
0.0383
0.2
99.8
1.60
5.34
0.0050
0.0404
0.0407
1.5
98.5
1.80
5.45
0.0084
0.0443
0.0451
3.5
96.5
2.00
5.11
0.0144
0.0512
0.0533
7.4
92.6
Table
H.14:Summary
ofcalculated
ReynoldsNumberuncertainty
with
95%
levelofconfidenceforconfigura
tion
5.
NASA/CR—2016-219411 244

Nominal
Mach
Typical
Rets
×10
6ft
-1
sRets
×10
6ft
-1
k=
2
b Rets
×10
6ft
-1
k=
2
uRets
×10
6ft
-1
k=
2
sRets
UPC
b Rets
UPC
0.25
1.84
0.0013
0.0499
0.0498
0.1
99.9
0.40
2.86
0.0014
0.0365
0.0368
0.1
99.9
0.60
4.17
0.0007
0.0382
0.0384
0.0
100.0
0.80
4.60
0.0022
0.0380
0.0381
0.3
99.7
1.00
5.19
0.0031
0.0449
0.0450
0.5
99.5
1.20
5.26
0.0022
0.0451
0.0452
0.2
99.8
1.40
5.41
0.0029
0.0457
0.0457
0.4
99.6
1.60
5.56
0.0045
0.0469
0.0472
0.9
99.1
1.80
5.60
0.0043
0.0486
0.0491
0.8
99.2
2.00
5.08
0.0056
0.0514
0.0522
1.2
98.8
Table
H.15:Summary
ofcalculated
ReynoldsNumberuncertainty
with
95%
levelofconfidenceforconfigura
tion
6.
NASA/CR—2016-219411 245
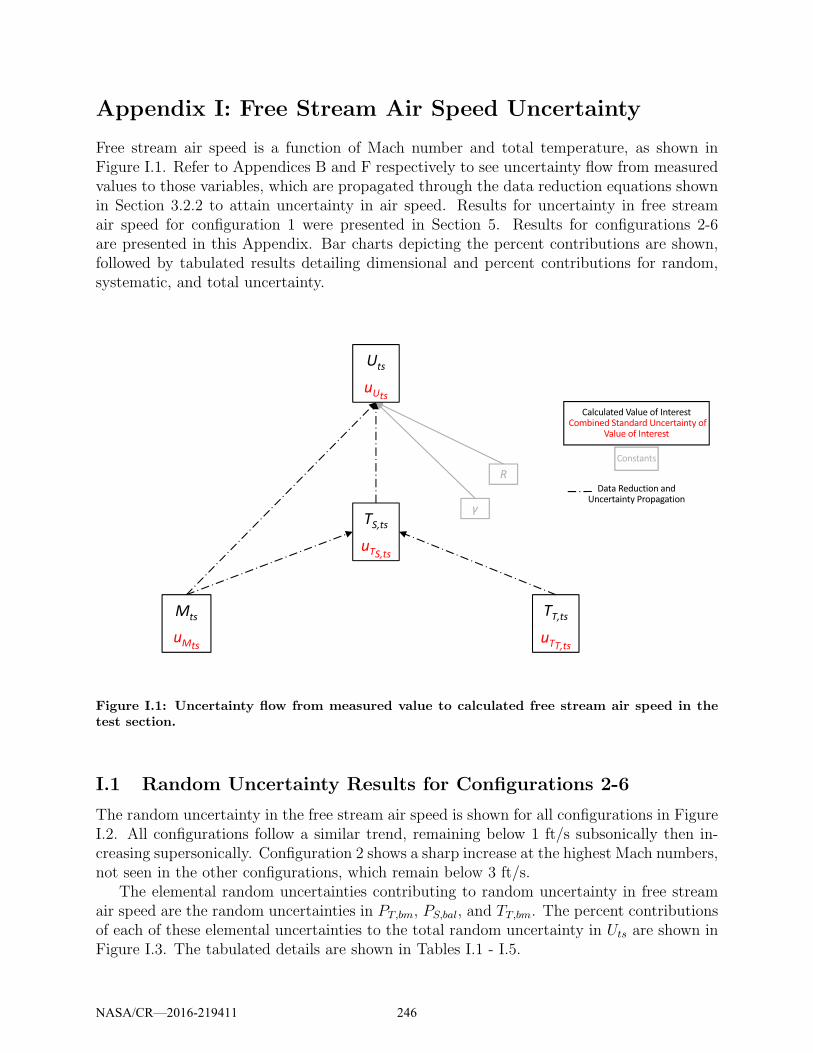
Appendix I: Free Stream Air Speed Uncertainty
Free stream air speed is a function of Mach number and total temperature, as shown inFigure I.1. Refer to Appendices B and F respectively to see uncertainty flow from measuredvalues to those variables, which are propagated through the data reduction equations shownin Section 3.2.2 to attain uncertainty in air speed. Results for uncertainty in free streamair speed for configuration 1 were presented in Section 5. Results for configurations 2-6are presented in this Appendix. Bar charts depicting the percent contributions are shown,followed by tabulated results detailing dimensional and percent contributions for random,systematic, and total uncertainty.
Figure I.1: Uncertainty flow from measured value to calculated free stream air speed in thetest section.
I.1 Random Uncertainty Results for Configurations 2-6
The random uncertainty in the free stream air speed is shown for all configurations in FigureI.2. All configurations follow a similar trend, remaining below 1 ft/s subsonically then in-creasing supersonically. Configuration 2 shows a sharp increase at the highest Mach numbers,not seen in the other configurations, which remain below 3 ft/s.
The elemental random uncertainties contributing to random uncertainty in free streamair speed are the random uncertainties in PT,bm, PS,bal, and TT,bm. The percent contributionsof each of these elemental uncertainties to the total random uncertainty in Uts are shown inFigure I.3. The tabulated details are shown in Tables I.1 - I.5.
NASA/CR—2016-219411 246
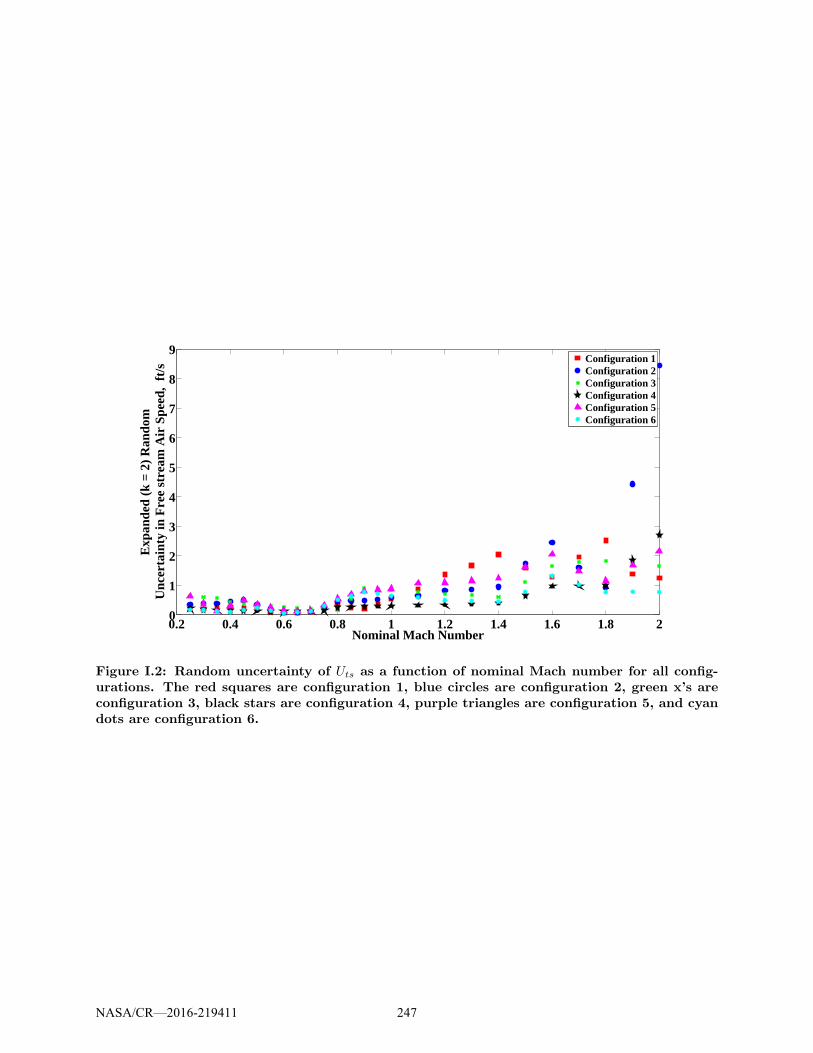
0.2 0.4 0.6 0.8 1 1.2 1.4 1.6 1.8 20
1
2
3
4
5
6
7
8
9
Nominal Mach Number
Exp
ande
d (k
= 2
) R
ando
mU
ncer
tain
ty in
Fre
e st
ream
Air
Spe
ed,
ft/s
Configuration 1Configuration 2Configuration 3Configuration 4Configuration 5Configuration 6
Figure I.2: Random uncertainty of Uts as a function of nominal Mach number for all config-urations. The red squares are configuration 1, blue circles are configuration 2, green x’s areconfiguration 3, black stars are configuration 4, purple triangles are configuration 5, and cyandots are configuration 6.
NASA/CR—2016-219411 247
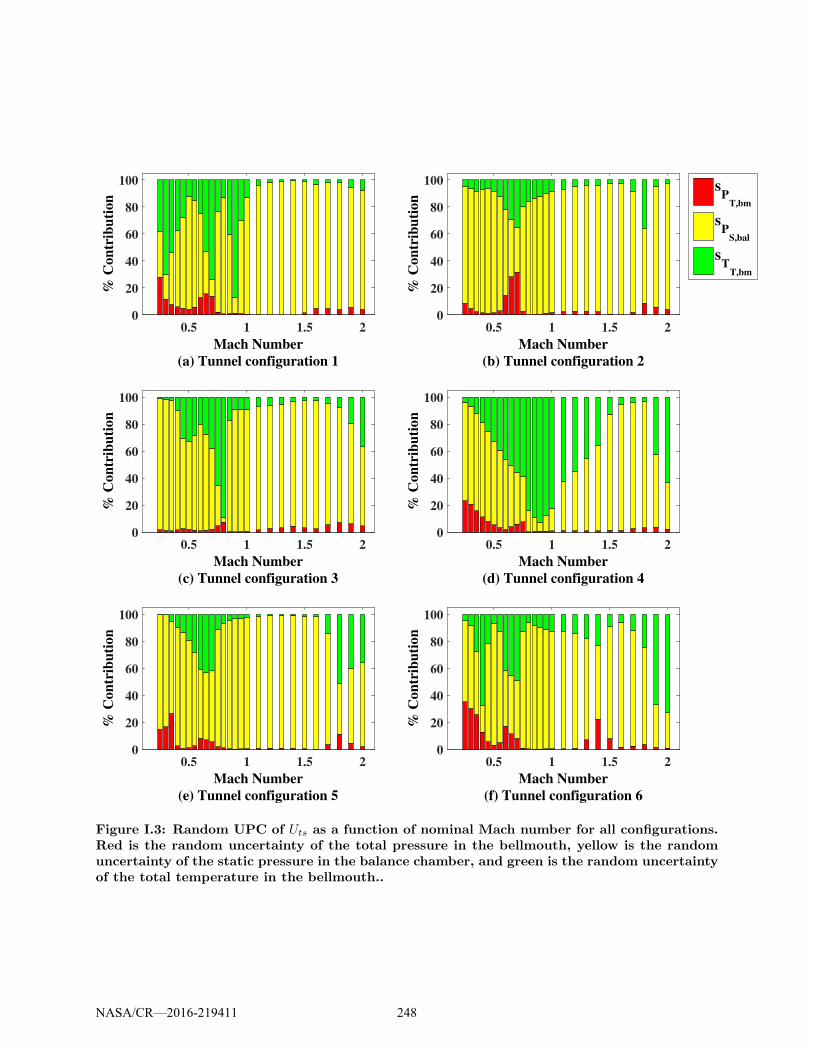
0.5 1 1.5 2
Mach Number
(a) Tunnel configuration 1
0
20
40
60
80
100
% C
on
trib
uti
on
0.5 1 1.5 2
Mach Number
(b) Tunnel configuration 2
0
20
40
60
80
100
% C
on
trib
uti
on
0.5 1 1.5 2
Mach Number
(c) Tunnel configuration 3
0
20
40
60
80
100
% C
on
trib
uti
on
0.5 1 1.5 2
Mach Number
(d) Tunnel configuration 4
0
20
40
60
80
100
% C
on
trib
uti
on
0.5 1 1.5 2
Mach Number
(e) Tunnel configuration 5
0
20
40
60
80
100
% C
on
trib
uti
on
0.5 1 1.5 2
Mach Number
(f) Tunnel configuration 6
0
20
40
60
80
100
% C
on
trib
uti
on
sP
T,bm
sP
S,bal
sT
T,bm
Figure I.3: Random UPC of Uts as a function of nominal Mach number for all configurations.Red is the random uncertainty of the total pressure in the bellmouth, yellow is the randomuncertainty of the static pressure in the balance chamber, and green is the random uncertaintyof the total temperature in the bellmouth..
NASA/CR—2016-219411 248
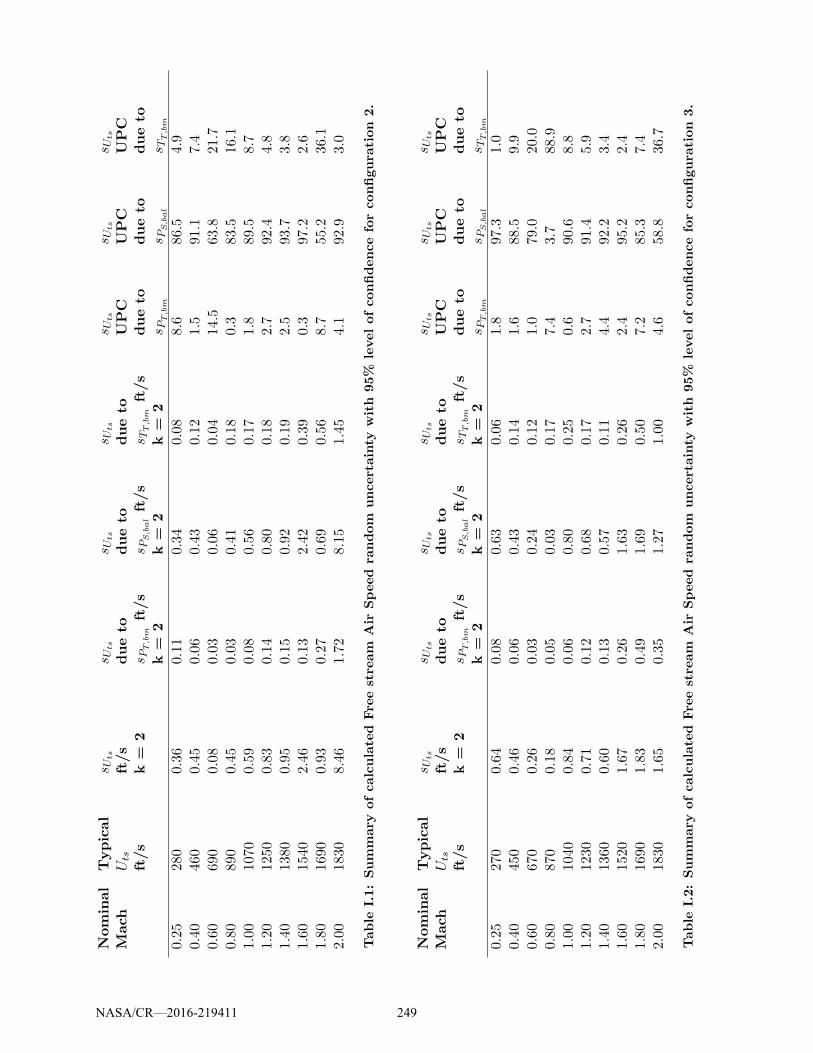
Nominal
Mach
Typical
Uts
ft/s
sUts
ft/s
k=
2
sUts
dueto
sPT,bm
ft/s
k=
2
sUts
dueto
sPS,balft/s
k=
2
sUts
dueto
sTT,bm
ft/s
k=
2
sUts
UPC
dueto
sPT,bm
sUts
UPC
dueto
sPS,bal
sUts
UPC
dueto
sTT,bm
0.25
280
0.36
0.11
0.34
0.08
8.6
86.5
4.9
0.40
460
0.45
0.06
0.43
0.12
1.5
91.1
7.4
0.60
690
0.08
0.03
0.06
0.04
14.5
63.8
21.7
0.80
890
0.45
0.03
0.41
0.18
0.3
83.5
16.1
1.00
1070
0.59
0.08
0.56
0.17
1.8
89.5
8.7
1.20
1250
0.83
0.14
0.80
0.18
2.7
92.4
4.8
1.40
1380
0.95
0.15
0.92
0.19
2.5
93.7
3.8
1.60
1540
2.46
0.13
2.42
0.39
0.3
97.2
2.6
1.80
1690
0.93
0.27
0.69
0.56
8.7
55.2
36.1
2.00
1830
8.46
1.72
8.15
1.45
4.1
92.9
3.0
Table
I.1:Summary
ofcalculated
Freestream
Air
Speed
random
uncertainty
with
95%
levelofconfidenceforconfigura
tion
2.
Nominal
Mach
Typical
Uts
ft/s
sUts
ft/s
k=
2
sUts
dueto
sPT,bm
ft/s
k=
2
sUts
dueto
sPS,balft/s
k=
2
sUts
dueto
sTT,bm
ft/s
k=
2
sUts
UPC
dueto
sPT,bm
sUts
UPC
dueto
sPS,bal
sUts
UPC
dueto
sTT,bm
0.25
270
0.64
0.08
0.63
0.06
1.8
97.3
1.0
0.40
450
0.46
0.06
0.43
0.14
1.6
88.5
9.9
0.60
670
0.26
0.03
0.24
0.12
1.0
79.0
20.0
0.80
870
0.18
0.05
0.03
0.17
7.4
3.7
88.9
1.00
1040
0.84
0.06
0.80
0.25
0.6
90.6
8.8
1.20
1230
0.71
0.12
0.68
0.17
2.7
91.4
5.9
1.40
1360
0.60
0.13
0.57
0.11
4.4
92.2
3.4
1.60
1520
1.67
0.26
1.63
0.26
2.4
95.2
2.4
1.80
1690
1.83
0.49
1.69
0.50
7.2
85.3
7.4
2.00
1830
1.65
0.35
1.27
1.00
4.6
58.8
36.7
Table
I.2:Summary
ofcalculated
Freestream
Air
Speed
random
uncertainty
with
95%
levelofconfidenceforconfigura
tion
3.
NASA/CR—2016-219411 249
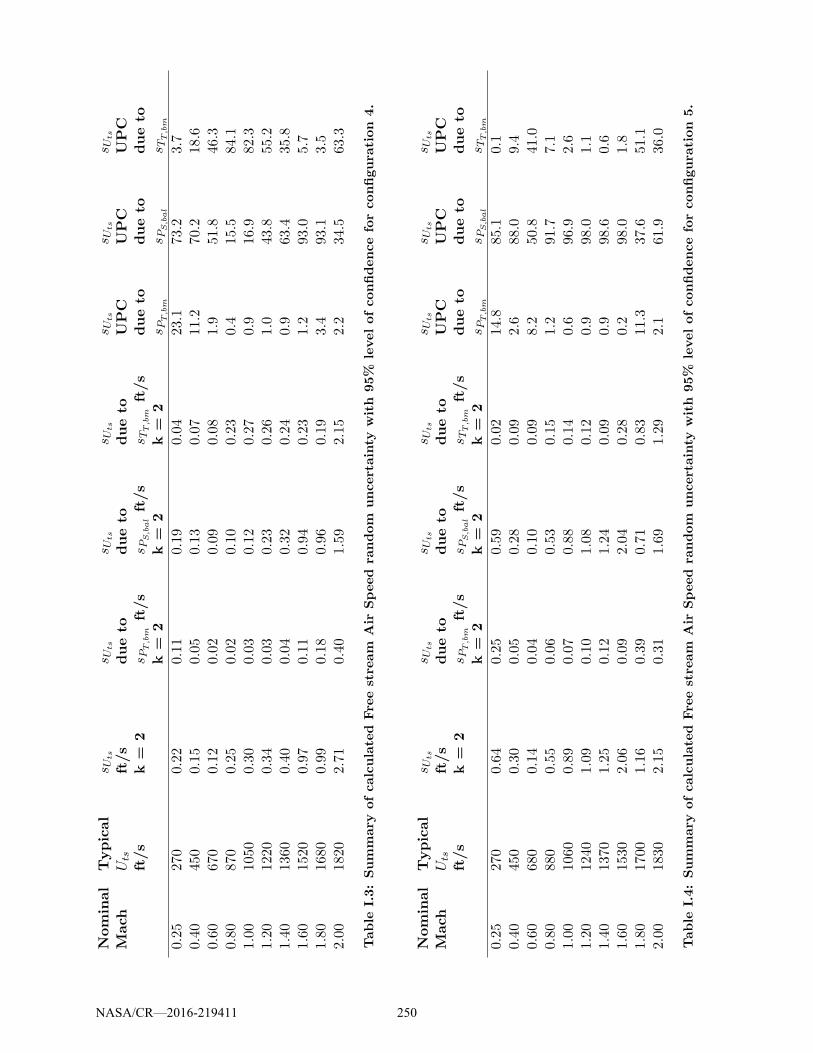
Nominal
Mach
Typical
Uts
ft/s
sUts
ft/s
k=
2
sUts
dueto
sPT,bm
ft/s
k=
2
sUts
dueto
sPS,balft/s
k=
2
sUts
dueto
sTT,bm
ft/s
k=
2
sUts
UPC
dueto
sPT,bm
sUts
UPC
dueto
sPS,bal
sUts
UPC
dueto
sTT,bm
0.25
270
0.22
0.11
0.19
0.04
23.1
73.2
3.7
0.40
450
0.15
0.05
0.13
0.07
11.2
70.2
18.6
0.60
670
0.12
0.02
0.09
0.08
1.9
51.8
46.3
0.80
870
0.25
0.02
0.10
0.23
0.4
15.5
84.1
1.00
1050
0.30
0.03
0.12
0.27
0.9
16.9
82.3
1.20
1220
0.34
0.03
0.23
0.26
1.0
43.8
55.2
1.40
1360
0.40
0.04
0.32
0.24
0.9
63.4
35.8
1.60
1520
0.97
0.11
0.94
0.23
1.2
93.0
5.7
1.80
1680
0.99
0.18
0.96
0.19
3.4
93.1
3.5
2.00
1820
2.71
0.40
1.59
2.15
2.2
34.5
63.3
Table
I.3:Summary
ofcalculated
Freestream
Air
Speed
random
uncertainty
with
95%
levelofconfidenceforconfigura
tion
4.
Nominal
Mach
Typical
Uts
ft/s
sUts
ft/s
k=
2
sUts
dueto
sPT,bm
ft/s
k=
2
sUts
dueto
sPS,balft/s
k=
2
sUts
dueto
sTT,bm
ft/s
k=
2
sUts
UPC
dueto
sPT,bm
sUts
UPC
dueto
sPS,bal
sUts
UPC
dueto
sTT,bm
0.25
270
0.64
0.25
0.59
0.02
14.8
85.1
0.1
0.40
450
0.30
0.05
0.28
0.09
2.6
88.0
9.4
0.60
680
0.14
0.04
0.10
0.09
8.2
50.8
41.0
0.80
880
0.55
0.06
0.53
0.15
1.2
91.7
7.1
1.00
1060
0.89
0.07
0.88
0.14
0.6
96.9
2.6
1.20
1240
1.09
0.10
1.08
0.12
0.9
98.0
1.1
1.40
1370
1.25
0.12
1.24
0.09
0.9
98.6
0.6
1.60
1530
2.06
0.09
2.04
0.28
0.2
98.0
1.8
1.80
1700
1.16
0.39
0.71
0.83
11.3
37.6
51.1
2.00
1830
2.15
0.31
1.69
1.29
2.1
61.9
36.0
Table
I.4:Summary
ofcalculated
Freestream
Air
Speed
random
uncertainty
with
95%
levelofconfidenceforconfigura
tion
5.
NASA/CR—2016-219411 250
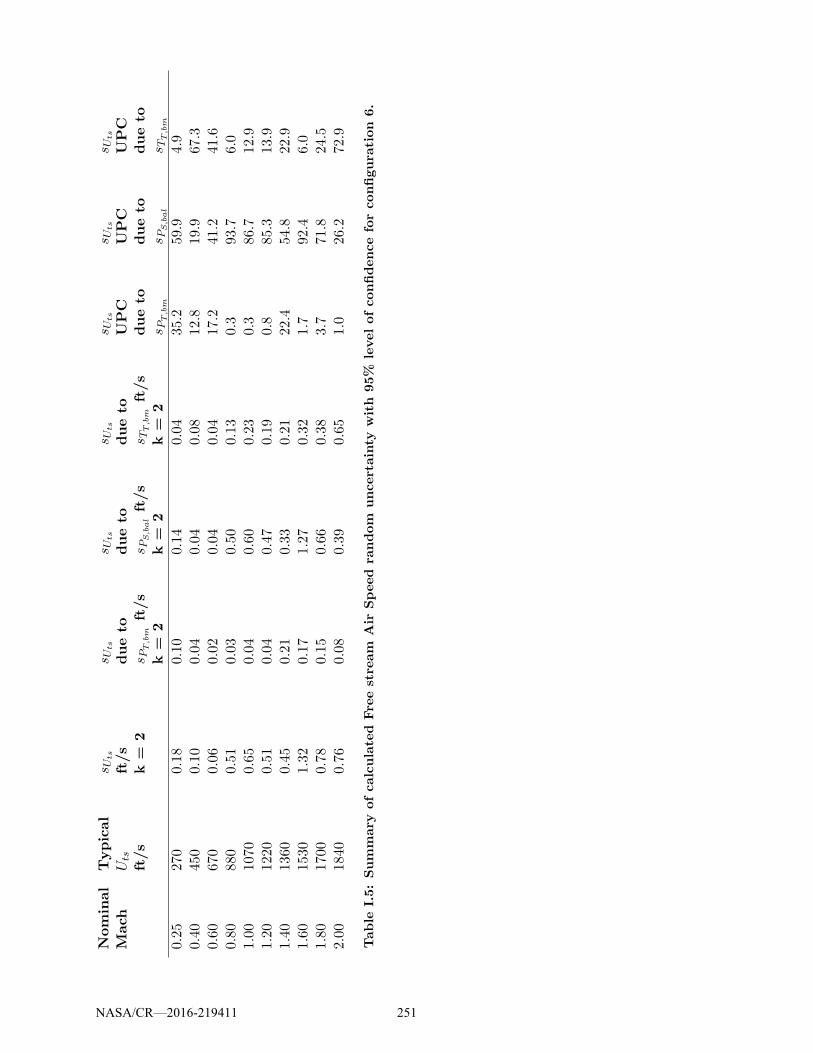
Nominal
Mach
Typical
Uts
ft/s
sUts
ft/s
k=
2
sUts
dueto
sPT,bm
ft/s
k=
2
sUts
dueto
sPS,balft/s
k=
2
sUts
dueto
sTT,bm
ft/s
k=
2
sUts
UPC
dueto
sPT,bm
sUts
UPC
dueto
sPS,bal
sUts
UPC
dueto
sTT,bm
0.25
270
0.18
0.10
0.14
0.04
35.2
59.9
4.9
0.40
450
0.10
0.04
0.04
0.08
12.8
19.9
67.3
0.60
670
0.06
0.02
0.04
0.04
17.2
41.2
41.6
0.80
880
0.51
0.03
0.50
0.13
0.3
93.7
6.0
1.00
1070
0.65
0.04
0.60
0.23
0.3
86.7
12.9
1.20
1220
0.51
0.04
0.47
0.19
0.8
85.3
13.9
1.40
1360
0.45
0.21
0.33
0.21
22.4
54.8
22.9
1.60
1530
1.32
0.17
1.27
0.32
1.7
92.4
6.0
1.80
1700
0.78
0.15
0.66
0.38
3.7
71.8
24.5
2.00
1840
0.76
0.08
0.39
0.65
1.0
26.2
72.9
Table
I.5:Summary
ofcalculated
Freestream
Air
Speed
random
uncertainty
with
95%
levelofconfidenceforconfigura
tion
6.
NASA/CR—2016-219411 251
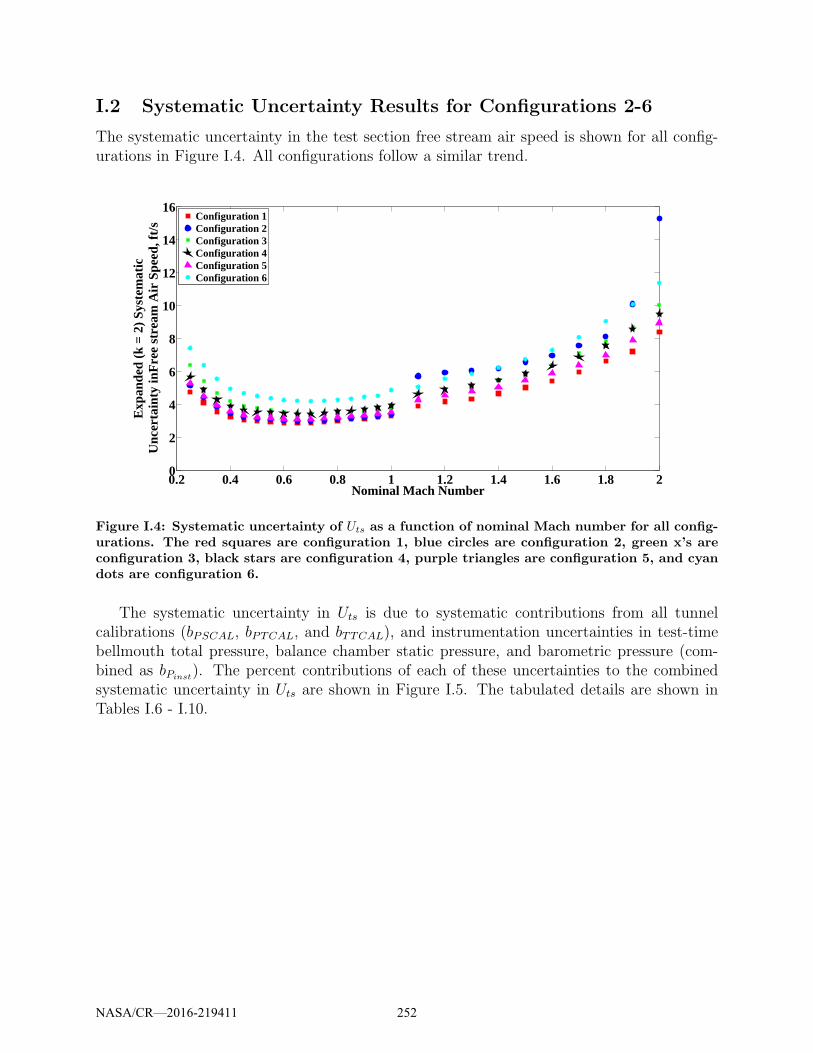
I.2 Systematic Uncertainty Results for Configurations 2-6
The systematic uncertainty in the test section free stream air speed is shown for all config-urations in Figure I.4. All configurations follow a similar trend.
0.2 0.4 0.6 0.8 1 1.2 1.4 1.6 1.8 20
2
4
6
8
10
12
14
16
Nominal Mach Number
Exp
ande
d (k
= 2
) S
yste
mat
icU
ncer
tain
ty in
Fre
e st
ream
Air
Spe
ed, f
t/s
Configuration 1Configuration 2Configuration 3Configuration 4Configuration 5Configuration 6
Figure I.4: Systematic uncertainty of Uts as a function of nominal Mach number for all config-urations. The red squares are configuration 1, blue circles are configuration 2, green x’s areconfiguration 3, black stars are configuration 4, purple triangles are configuration 5, and cyandots are configuration 6.
The systematic uncertainty in Uts is due to systematic contributions from all tunnelcalibrations (bPSCAL, bPTCAL, and bTTCAL), and instrumentation uncertainties in test-timebellmouth total pressure, balance chamber static pressure, and barometric pressure (com-bined as bPinst
). The percent contributions of each of these uncertainties to the combinedsystematic uncertainty in Uts are shown in Figure I.5. The tabulated details are shown inTables I.6 - I.10.
NASA/CR—2016-219411 252
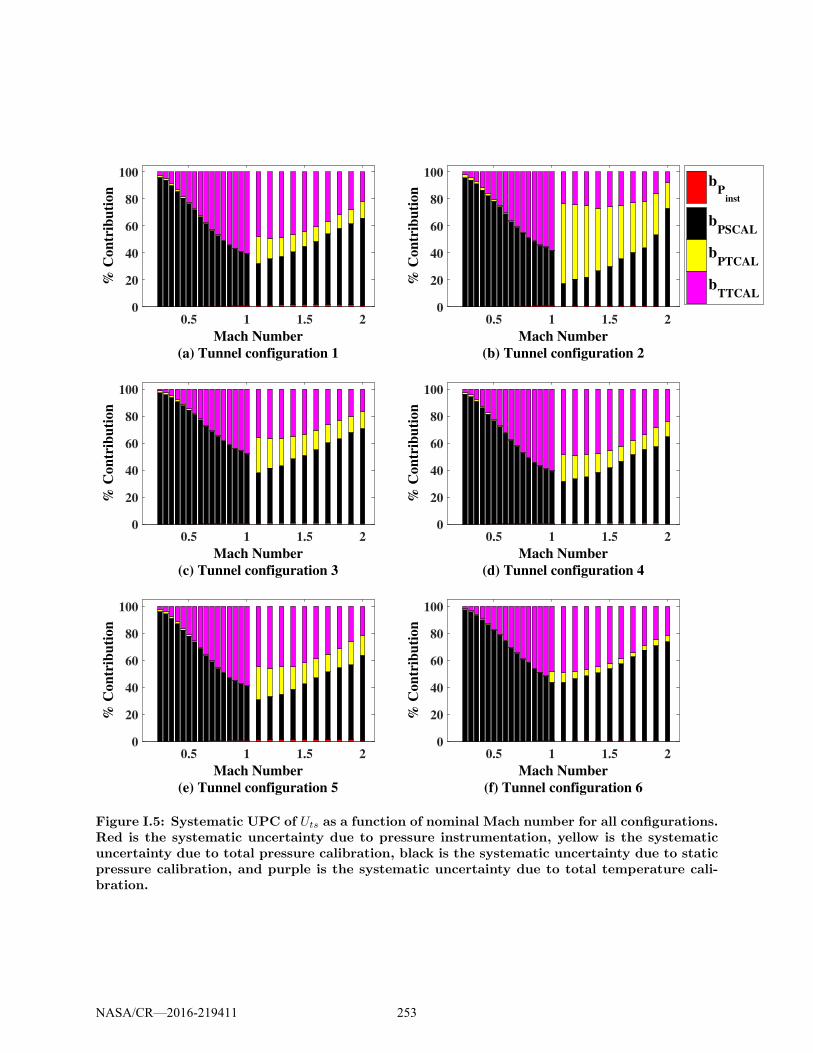
0.5 1 1.5 2
Mach Number
(a) Tunnel configuration 1
0
20
40
60
80
100
% C
on
trib
uti
on
0.5 1 1.5 2
Mach Number
(b) Tunnel configuration 2
0
20
40
60
80
100
% C
on
trib
uti
on
0.5 1 1.5 2
Mach Number
(c) Tunnel configuration 3
0
20
40
60
80
100
% C
on
trib
uti
on
0.5 1 1.5 2
Mach Number
(d) Tunnel configuration 4
0
20
40
60
80
100
% C
on
trib
uti
on
0.5 1 1.5 2
Mach Number
(e) Tunnel configuration 5
0
20
40
60
80
100
% C
on
trib
uti
on
0.5 1 1.5 2
Mach Number
(f) Tunnel configuration 6
0
20
40
60
80
100
% C
on
trib
uti
on
bP
inst
bPSCAL
bPTCAL
bTTCAL
Figure I.5: Systematic UPC of Uts as a function of nominal Mach number for all configurations.Red is the systematic uncertainty due to pressure instrumentation, yellow is the systematicuncertainty due to total pressure calibration, black is the systematic uncertainty due to staticpressure calibration, and purple is the systematic uncertainty due to total temperature cali-bration.
NASA/CR—2016-219411 253

Nominal
Mach
Typical
Uts
ft/s
b Uts
ft/s
k=
2
b Uts
dueto
b PInst
ft/s
k=
2
b Uts
dueto
b PSCAL
ft/s
k=
2
b Uts
dueto
b PTCAL
ft/s
k=
2
b Uts
dueto
b TTCAL
ft/s
k=
2
b Uts
UPC
dueto
b PInst
b Uts
UPC
dueto
b PSCAL
b Uts
UPC
dueto
b PTCAL
b Uts
UPC
dueto
b TTCAL
0.25
280
5.14
0.07
5.02
0.80
0.73
0.0
95.5
2.4
2.0
0.40
460
3.44
0.12
3.20
0.48
1.17
0.1
86.4
2.0
11.5
0.60
690
3.01
0.15
2.50
0.30
1.65
0.3
68.7
1.0
30.1
0.80
890
3.11
0.25
2.21
0.22
2.16
0.6
50.6
0.5
48.2
1.00
1070
3.40
0.36
2.17
0.18
2.59
1.1
40.7
0.3
57.9
1.20
1250
5.95
0.50
2.66
4.41
2.94
0.7
20.0
54.9
24.4
1.40
1380
6.18
0.58
3.15
4.21
3.20
0.9
26.0
46.4
26.7
1.60
1540
6.98
0.69
4.11
4.39
3.48
1.0
34.7
39.4
24.9
1.80
1690
8.13
0.78
5.32
4.76
3.82
0.9
42.8
34.3
22.0
2.00
1830
15.27
0.95
13.03
6.67
4.27
0.4
72.7
19.1
7.8
Table
I.6:Summary
ofcalculated
Freestream
Air
Speed
systematicuncertainty
with
95%
levelofconfidenceforconfigura
tion
2.
Nominal
Mach
Typical
Uts
ft/s
b Uts
ft/s
k=
2
b Uts
dueto
b PInst
ft/s
k=
2
b Uts
dueto
b PSCAL
ft/s
k=
2
b Uts
dueto
b PTCAL
ft/s
k=
2
b Uts
dueto
b TTCAL
ft/s
k=
2
b Uts
UPC
dueto
b PInst
b Uts
UPC
dueto
b PSCAL
b Uts
UPC
dueto
b PTCAL
b Uts
UPC
dueto
b TTCAL
0.25
270
6.41
0.07
6.31
0.80
0.73
0.0
97.1
1.6
1.3
0.40
450
4.19
0.11
3.99
0.47
1.17
0.1
90.8
1.3
7.8
0.60
670
3.54
0.14
3.11
0.30
1.66
0.2
77.1
0.7
22.0
0.80
870
3.50
0.23
2.74
0.22
2.16
0.4
61.2
0.4
38.0
1.00
1040
3.74
0.34
2.68
0.17
2.58
0.8
51.4
0.2
47.6
1.20
1230
4.94
0.48
3.15
2.32
2.98
1.0
40.6
22.0
36.4
1.40
1360
5.46
0.55
3.76
2.24
3.22
1.0
47.3
16.9
34.8
1.60
1520
6.39
0.68
4.70
2.43
3.52
1.1
54.1
14.5
30.3
1.80
1690
7.84
0.78
6.19
2.91
3.76
1.0
62.3
13.7
23.0
2.00
1830
10.04
0.79
8.42
3.54
4.09
0.6
70.4
12.4
16.6
Table
I.7:Summary
ofcalculated
Freestream
Air
Speed
systematicuncertainty
with
95%
levelofconfidenceforconfigura
tion
3.
NASA/CR—2016-219411 254
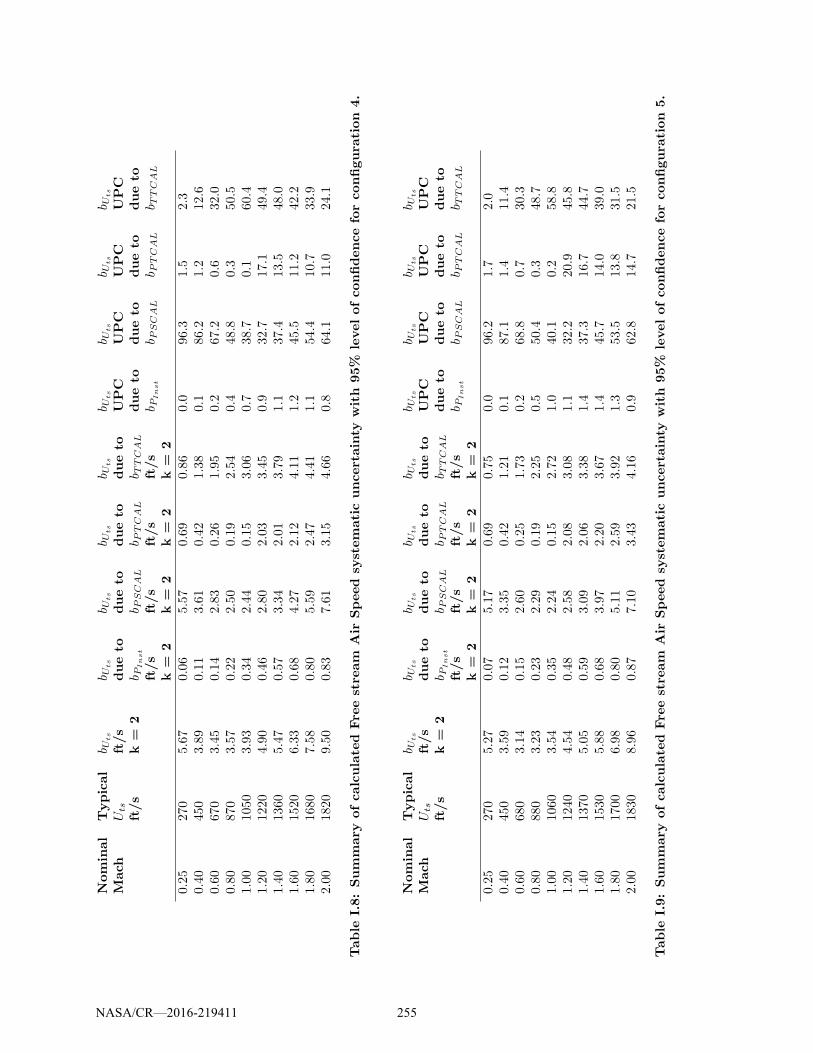
Nominal
Mach
Typical
Uts
ft/s
b Uts
ft/s
k=
2
b Uts
dueto
b PInst
ft/s
k=
2
b Uts
dueto
b PSCAL
ft/s
k=
2
b Uts
dueto
b PTCAL
ft/s
k=
2
b Uts
dueto
b TTCAL
ft/s
k=
2
b Uts
UPC
dueto
b PInst
b Uts
UPC
dueto
b PSCAL
b Uts
UPC
dueto
b PTCAL
b Uts
UPC
dueto
b TTCAL
0.25
270
5.67
0.06
5.57
0.69
0.86
0.0
96.3
1.5
2.3
0.40
450
3.89
0.11
3.61
0.42
1.38
0.1
86.2
1.2
12.6
0.60
670
3.45
0.14
2.83
0.26
1.95
0.2
67.2
0.6
32.0
0.80
870
3.57
0.22
2.50
0.19
2.54
0.4
48.8
0.3
50.5
1.00
1050
3.93
0.34
2.44
0.15
3.06
0.7
38.7
0.1
60.4
1.20
1220
4.90
0.46
2.80
2.03
3.45
0.9
32.7
17.1
49.4
1.40
1360
5.47
0.57
3.34
2.01
3.79
1.1
37.4
13.5
48.0
1.60
1520
6.33
0.68
4.27
2.12
4.11
1.2
45.5
11.2
42.2
1.80
1680
7.58
0.80
5.59
2.47
4.41
1.1
54.4
10.7
33.9
2.00
1820
9.50
0.83
7.61
3.15
4.66
0.8
64.1
11.0
24.1
Table
I.8:Summary
ofcalculated
Freestream
Air
Speed
systematicuncertainty
with
95%
levelofconfidenceforconfigura
tion
4.
Nominal
Mach
Typical
Uts
ft/s
b Uts
ft/s
k=
2
b Uts
dueto
b PInst
ft/s
k=
2
b Uts
dueto
b PSCAL
ft/s
k=
2
b Uts
dueto
b PTCAL
ft/s
k=
2
b Uts
dueto
b TTCAL
ft/s
k=
2
b Uts
UPC
dueto
b PInst
b Uts
UPC
dueto
b PSCAL
b Uts
UPC
dueto
b PTCAL
b Uts
UPC
dueto
b TTCAL
0.25
270
5.27
0.07
5.17
0.69
0.75
0.0
96.2
1.7
2.0
0.40
450
3.59
0.12
3.35
0.42
1.21
0.1
87.1
1.4
11.4
0.60
680
3.14
0.15
2.60
0.25
1.73
0.2
68.8
0.7
30.3
0.80
880
3.23
0.23
2.29
0.19
2.25
0.5
50.4
0.3
48.7
1.00
1060
3.54
0.35
2.24
0.15
2.72
1.0
40.1
0.2
58.8
1.20
1240
4.54
0.48
2.58
2.08
3.08
1.1
32.2
20.9
45.8
1.40
1370
5.05
0.59
3.09
2.06
3.38
1.4
37.3
16.7
44.7
1.60
1530
5.88
0.68
3.97
2.20
3.67
1.4
45.7
14.0
39.0
1.80
1700
6.98
0.80
5.11
2.59
3.92
1.3
53.5
13.8
31.5
2.00
1830
8.96
0.87
7.10
3.43
4.16
0.9
62.8
14.7
21.5
Table
I.9:Summary
ofcalculated
Freestream
Air
Speed
systematicuncertainty
with
95%
levelofconfidenceforconfigura
tion
5.
NASA/CR—2016-219411 255
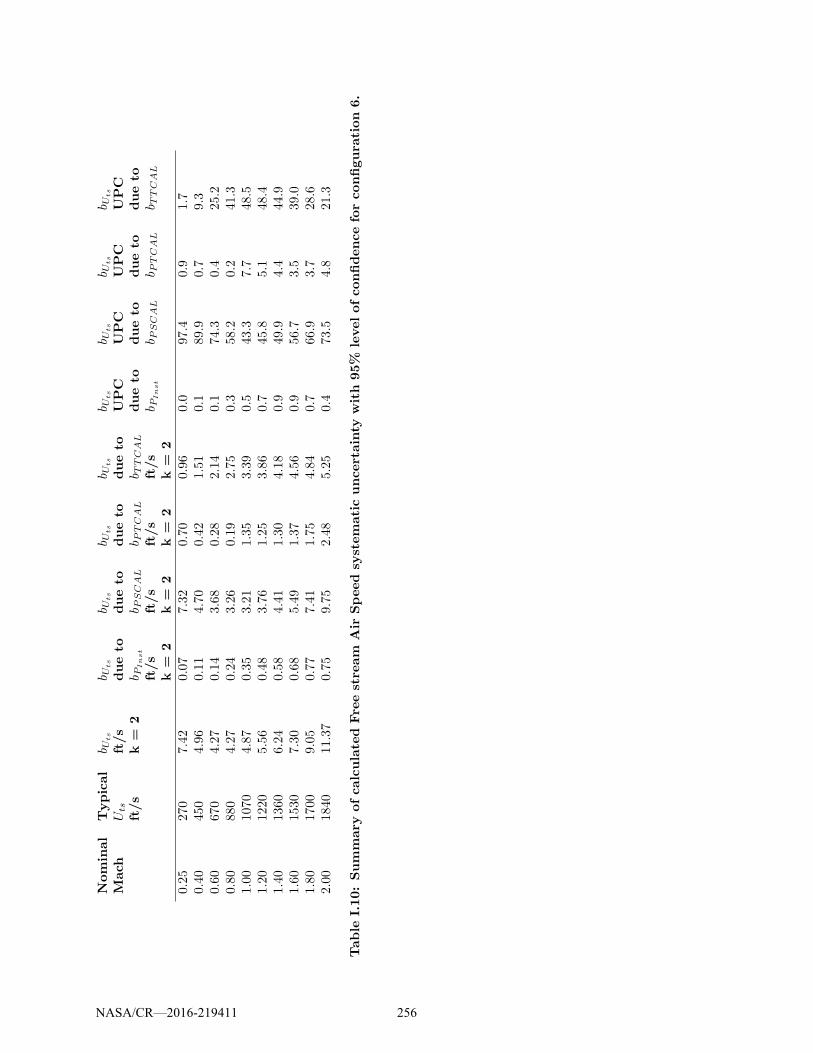
Nominal
Mach
Typical
Uts
ft/s
b Uts
ft/s
k=
2
b Uts
dueto
b PInst
ft/s
k=
2
b Uts
dueto
b PSCAL
ft/s
k=
2
b Uts
dueto
b PTCAL
ft/s
k=
2
b Uts
dueto
b TTCAL
ft/s
k=
2
b Uts
UPC
dueto
b PInst
b Uts
UPC
dueto
b PSCAL
b Uts
UPC
dueto
b PTCAL
b Uts
UPC
dueto
b TTCAL
0.25
270
7.42
0.07
7.32
0.70
0.96
0.0
97.4
0.9
1.7
0.40
450
4.96
0.11
4.70
0.42
1.51
0.1
89.9
0.7
9.3
0.60
670
4.27
0.14
3.68
0.28
2.14
0.1
74.3
0.4
25.2
0.80
880
4.27
0.24
3.26
0.19
2.75
0.3
58.2
0.2
41.3
1.00
1070
4.87
0.35
3.21
1.35
3.39
0.5
43.3
7.7
48.5
1.20
1220
5.56
0.48
3.76
1.25
3.86
0.7
45.8
5.1
48.4
1.40
1360
6.24
0.58
4.41
1.30
4.18
0.9
49.9
4.4
44.9
1.60
1530
7.30
0.68
5.49
1.37
4.56
0.9
56.7
3.5
39.0
1.80
1700
9.05
0.77
7.41
1.75
4.84
0.7
66.9
3.7
28.6
2.00
1840
11.37
0.75
9.75
2.48
5.25
0.4
73.5
4.8
21.3
Table
I.10:Summary
ofcalculatedFreestream
Air
Speedsy
stematicuncertainty
with95%
levelofconfidenceforconfigura
tion6.
NASA/CR—2016-219411 256
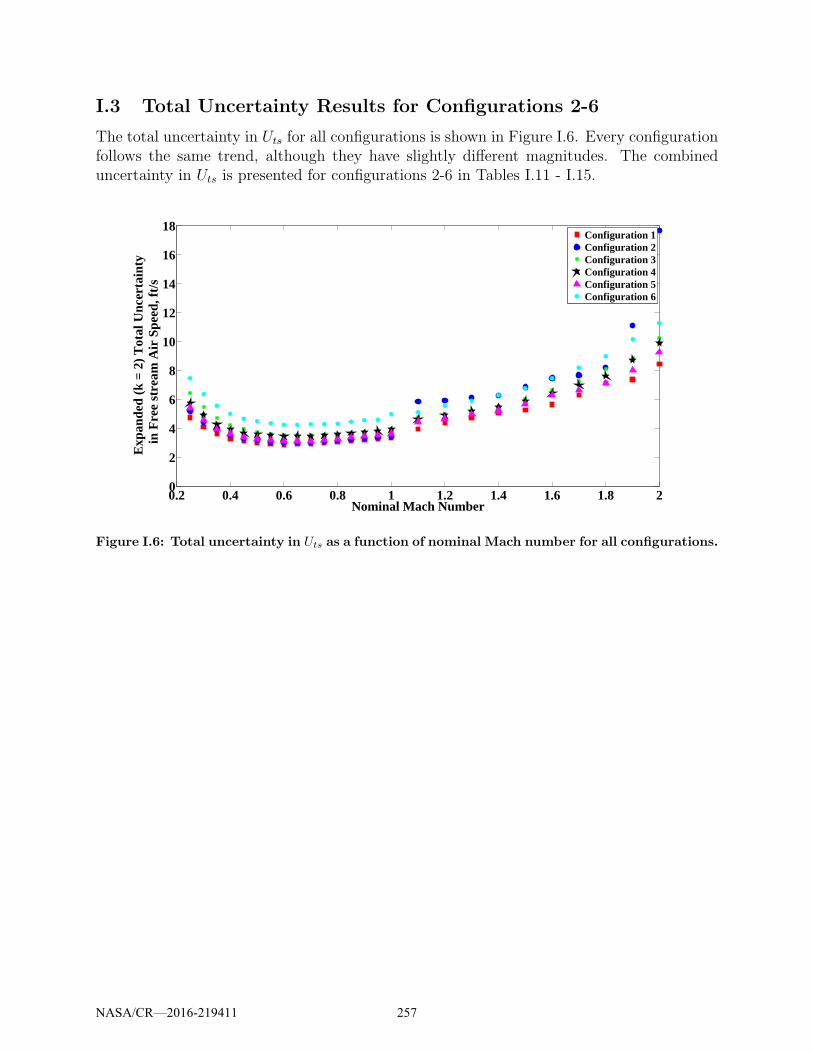
I.3 Total Uncertainty Results for Configurations 2-6
The total uncertainty in Uts for all configurations is shown in Figure I.6. Every configurationfollows the same trend, although they have slightly different magnitudes. The combineduncertainty in Uts is presented for configurations 2-6 in Tables I.11 - I.15.
0.2 0.4 0.6 0.8 1 1.2 1.4 1.6 1.8 20
2
4
6
8
10
12
14
16
18
Nominal Mach Number
Exp
ande
d (k
= 2
) T
otal
Unc
erta
inty
in F
ree
stre
am A
ir S
peed
, ft/s
Configuration 1Configuration 2Configuration 3Configuration 4Configuration 5Configuration 6
Figure I.6: Total uncertainty in Uts as a function of nominal Mach number for all configurations.
NASA/CR—2016-219411 257
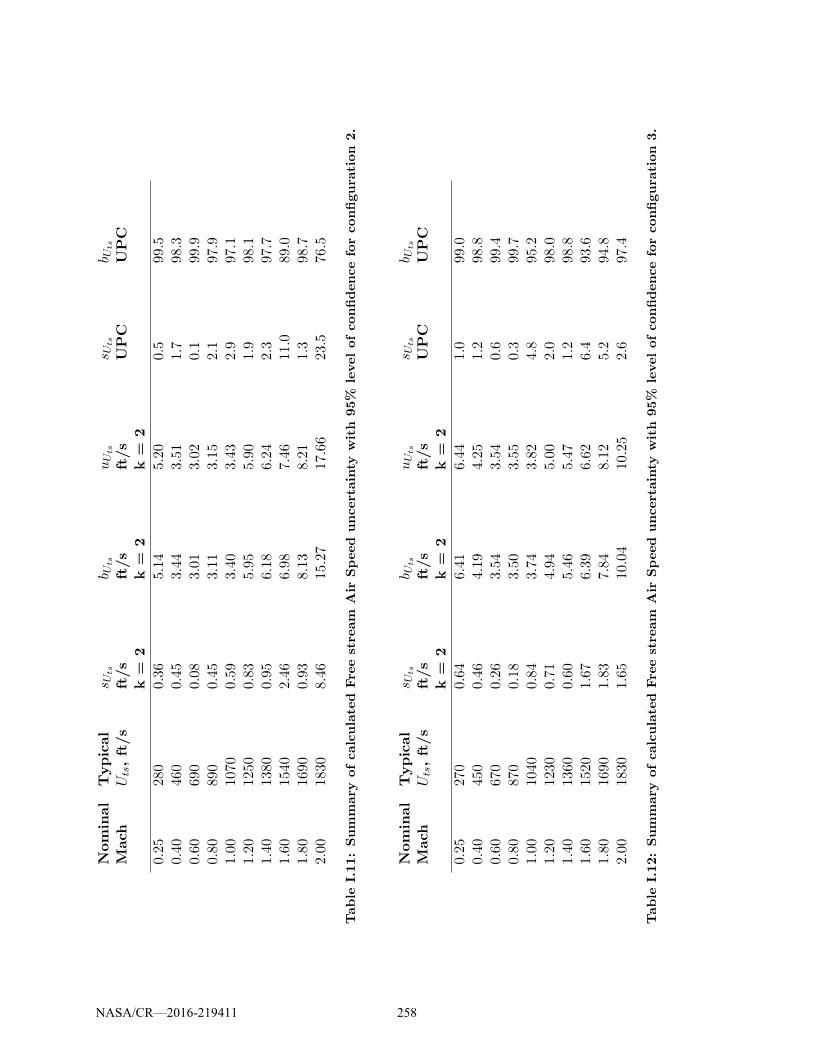
Nominal
Mach
Typical
Uts,ft/s
sUts
ft/s
k=
2
b Uts
ft/s
k=
2
uUts
ft/s
k=
2
sUts
UPC
b Uts
UPC
0.25
280
0.36
5.14
5.20
0.5
99.5
0.40
460
0.45
3.44
3.51
1.7
98.3
0.60
690
0.08
3.01
3.02
0.1
99.9
0.80
890
0.45
3.11
3.15
2.1
97.9
1.00
1070
0.59
3.40
3.43
2.9
97.1
1.20
1250
0.83
5.95
5.90
1.9
98.1
1.40
1380
0.95
6.18
6.24
2.3
97.7
1.60
1540
2.46
6.98
7.46
11.0
89.0
1.80
1690
0.93
8.13
8.21
1.3
98.7
2.00
1830
8.46
15.27
17.66
23.5
76.5
Table
I.11:Summary
ofcalculated
Freestream
Air
Speed
uncertainty
with
95%
levelofconfidenceforconfigura
tion
2.
Nominal
Mach
Typical
Uts,ft/s
sUts
ft/s
k=
2
b Uts
ft/s
k=
2
uUts
ft/s
k=
2
sUts
UPC
b Uts
UPC
0.25
270
0.64
6.41
6.44
1.0
99.0
0.40
450
0.46
4.19
4.25
1.2
98.8
0.60
670
0.26
3.54
3.54
0.6
99.4
0.80
870
0.18
3.50
3.55
0.3
99.7
1.00
1040
0.84
3.74
3.82
4.8
95.2
1.20
1230
0.71
4.94
5.00
2.0
98.0
1.40
1360
0.60
5.46
5.47
1.2
98.8
1.60
1520
1.67
6.39
6.62
6.4
93.6
1.80
1690
1.83
7.84
8.12
5.2
94.8
2.00
1830
1.65
10.04
10.25
2.6
97.4
Table
I.12:Summary
ofcalculated
Freestream
Air
Speed
uncertainty
with
95%
levelofconfidenceforconfigura
tion
3.
NASA/CR—2016-219411 258
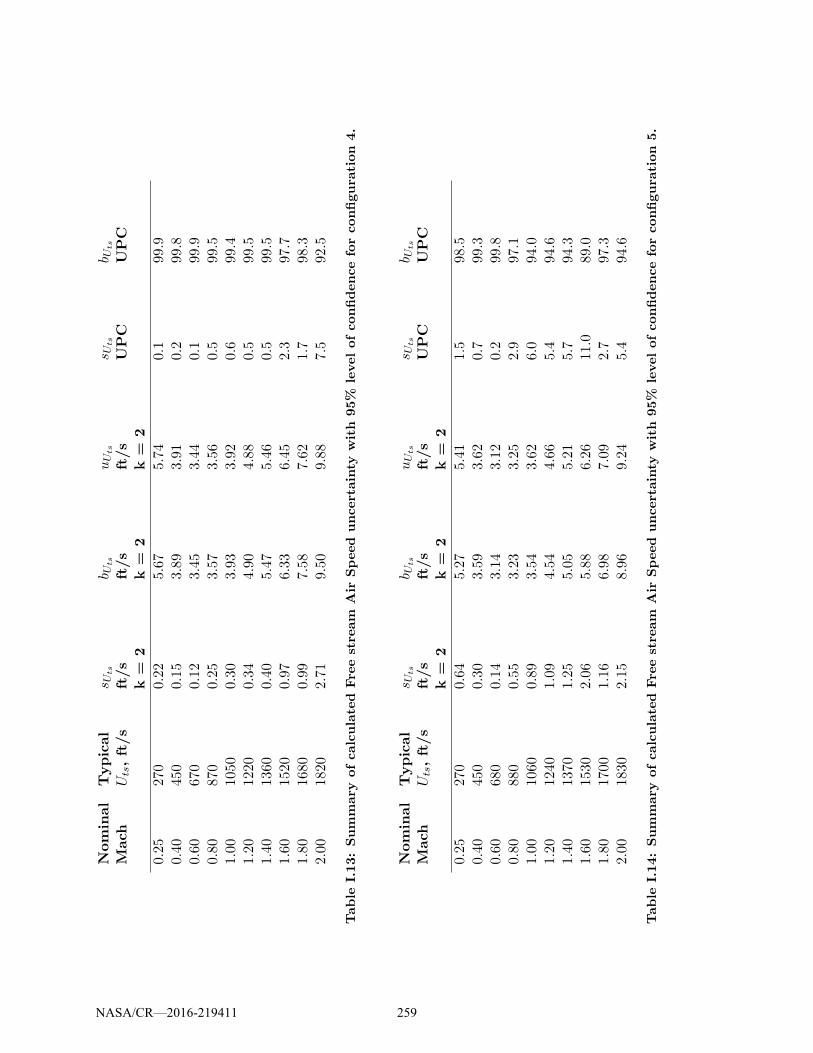
Nominal
Mach
Typical
Uts,ft/s
sUts
ft/s
k=
2
b Uts
ft/s
k=
2
uUts
ft/s
k=
2
sUts
UPC
b Uts
UPC
0.25
270
0.22
5.67
5.74
0.1
99.9
0.40
450
0.15
3.89
3.91
0.2
99.8
0.60
670
0.12
3.45
3.44
0.1
99.9
0.80
870
0.25
3.57
3.56
0.5
99.5
1.00
1050
0.30
3.93
3.92
0.6
99.4
1.20
1220
0.34
4.90
4.88
0.5
99.5
1.40
1360
0.40
5.47
5.46
0.5
99.5
1.60
1520
0.97
6.33
6.45
2.3
97.7
1.80
1680
0.99
7.58
7.62
1.7
98.3
2.00
1820
2.71
9.50
9.88
7.5
92.5
Table
I.13:Summary
ofcalculated
Freestream
Air
Speed
uncertainty
with
95%
levelofconfidenceforconfigura
tion
4.
Nominal
Mach
Typical
Uts,ft/s
sUts
ft/s
k=
2
b Uts
ft/s
k=
2
uUts
ft/s
k=
2
sUts
UPC
b Uts
UPC
0.25
270
0.64
5.27
5.41
1.5
98.5
0.40
450
0.30
3.59
3.62
0.7
99.3
0.60
680
0.14
3.14
3.12
0.2
99.8
0.80
880
0.55
3.23
3.25
2.9
97.1
1.00
1060
0.89
3.54
3.62
6.0
94.0
1.20
1240
1.09
4.54
4.66
5.4
94.6
1.40
1370
1.25
5.05
5.21
5.7
94.3
1.60
1530
2.06
5.88
6.26
11.0
89.0
1.80
1700
1.16
6.98
7.09
2.7
97.3
2.00
1830
2.15
8.96
9.24
5.4
94.6
Table
I.14:Summary
ofcalculated
Freestream
Air
Speed
uncertainty
with
95%
levelofconfidenceforconfigura
tion
5.
NASA/CR—2016-219411 259
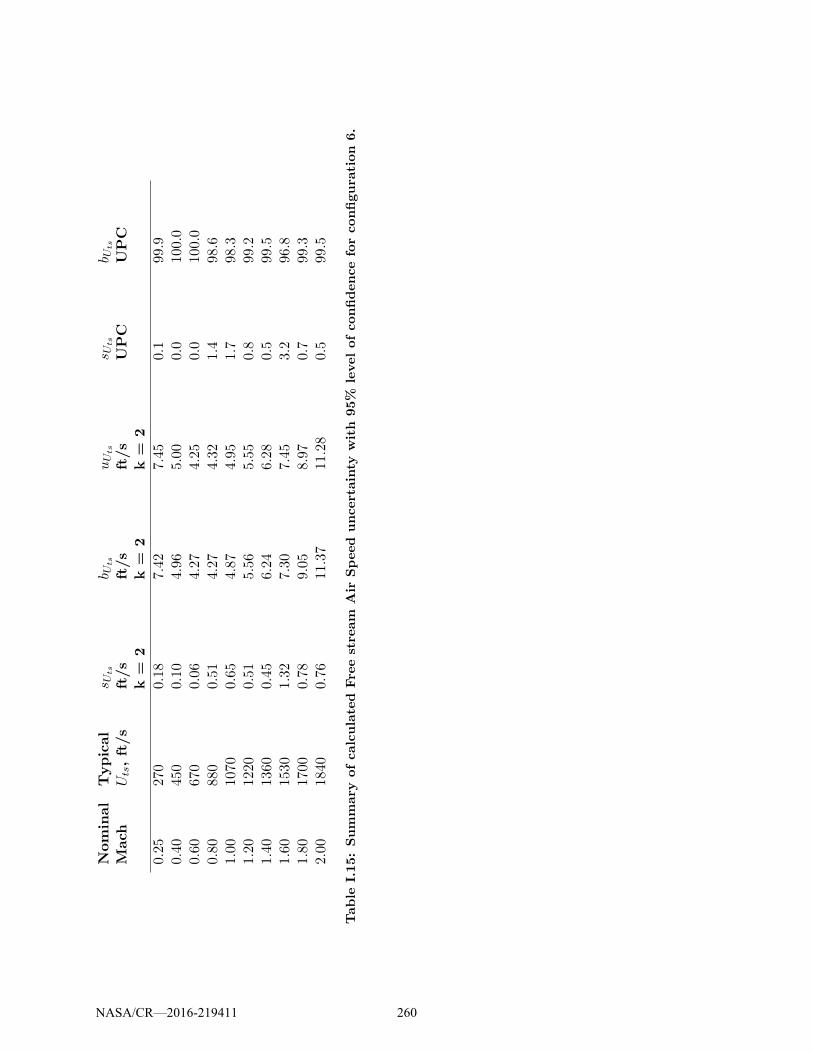
Nominal
Mach
Typical
Uts,ft/s
sUts
ft/s
k=
2
b Uts
ft/s
k=
2
uUts
ft/s
k=
2
sUts
UPC
b Uts
UPC
0.25
270
0.18
7.42
7.45
0.1
99.9
0.40
450
0.10
4.96
5.00
0.0
100.0
0.60
670
0.06
4.27
4.25
0.0
100.0
0.80
880
0.51
4.27
4.32
1.4
98.6
1.00
1070
0.65
4.87
4.95
1.7
98.3
1.20
1220
0.51
5.56
5.55
0.8
99.2
1.40
1360
0.45
6.24
6.28
0.5
99.5
1.60
1530
1.32
7.30
7.45
3.2
96.8
1.80
1700
0.78
9.05
8.97
0.7
99.3
2.00
1840
0.76
11.37
11.28
0.5
99.5
Table
I.15:Summary
ofcalculated
Freestream
Air
Speed
uncertainty
with
95%
levelofconfidenceforconfigura
tion
6.
NASA/CR—2016-219411 260

Appendix J: Spatial Uniformity Considerations
For the 8- by 6-foot SWT uncertainty study, estimating and applying uncertainty in spatialuniformity of total temperature, total pressure and static pressure was limited to the effect ofuniformity on the calibration tests, described in Section 6.1.5. If the uncertainty of a variableof interest as it applies to a randomly selected point on a cross-sectional plane or volumeof the test section is desired, spatial uniformity uncertainty would be applied additionallywithin the test-time analysis.
Section 6.1.5 describes initial spatial uniformity uncertainty estimation attempts. Thecone-cylinder was analyzed, but data indicated static pressure variations, suspected to bedue to the presence of shock effects. This effect averages out for calibration purposes, butthe variation is undesirable as an uncertainty estimate since the shocks are an artifact of thecalibration hardware.
Alternatively, static pressure measured by the transonic array is considered. Flow qualitydata was obtained at a total of five rake heights in the tunnel, providing 35 test-sectionrepresentative static pressure port locations (data from the outer two probes on each endof the array are omitted to exclude boundary layer effects, leaving the 7 center pressureprobes). This cross-sectional data provides a good spatial picture of what is happening withstatic pressure behavior at the test section entrance.
A standard deviation across those 35 data points measured by the array can provide anestimate of spatial uniformity standard uncertainty using Equation 22 (see the resulting blueline “Raw data” in Figure J.1). When this is done outright on the raw data, however, theestimate appears quite high, and a problem becomes apparent: due to the fact that the tunnelis set to the pressure ratio PS,bal/PT,bm, static and total pressure can vary independently fora nominal Mach setting, so long as the ratio does not vary. Therefore, data taken at differentrake heights (likely on different test days with different atmospheric conditions, which directlyimpact this atmospheric tunnel) can have large random variation, as seen and explained inmore detail in Section 6.1.3. Techniques must be explored to eliminate unwanted variationswhile preserving spatial uniformity characteristics.
Two methods were used to visually explore spatial uniformity data in attempts to isolateits uncertainty from other potential contributors (i.e. instrumentation, random). FigureJ.2 shows raw differential static pressure data measured by the transonic array at all fiverake height settings at two different tunnel set points. The same data is displayed in pres-sure distribution “blob plots” (top) and line plots (bottom). Both plot types are useful indetermining data trends. For example, in the blob plots there is a magnitude trend thatis obvious across different rake heights, clearly displaying the variation due to different at-mospheric conditions, discussed above. In the line plots, a probe-type bias becomes veryapparent, with a clear up-down “W” pattern where probes located at 24”, 36” and 48” are5-hole probes and measure a slightly lower pressure, while probes located at 18”, 30”, 42”and 54” are Pitot-static probes and measure a slightly higher pressure.
One way to “normalize” the five rake heights (while maintaining dimensionality) to isolatespatial uniformity uncertainty from changing atmospheric conditions is to average pressurereadings horizontally across the 7 probes at each rake height, and subtract the averagefrom each individual measurement on the rake at that height. Spatial visualization results
NASA/CR—2016-219411 261
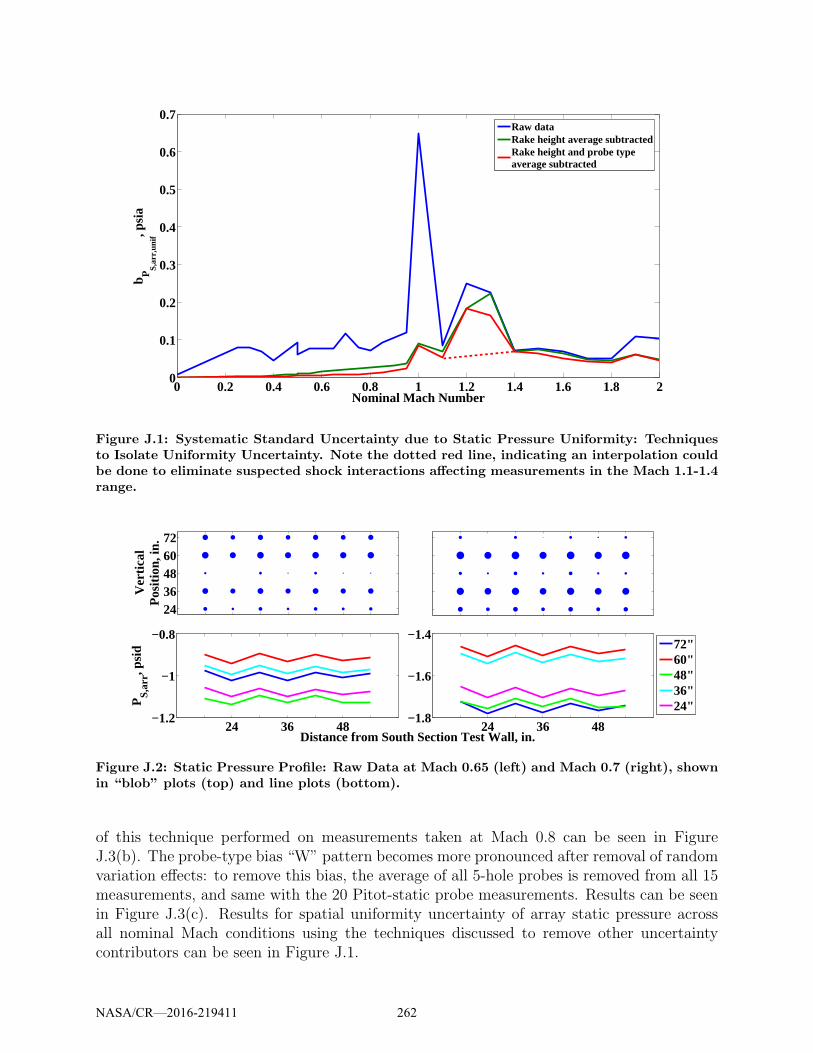
0 0.2 0.4 0.6 0.8 1 1.2 1.4 1.6 1.8 20
0.1
0.2
0.3
0.4
0.5
0.6
0.7
Nominal Mach Number
b PS
,arr
,uni
f, psi
a
Raw dataRake height average subtractedRake height and probe typeaverage subtracted
Figure J.1: Systematic Standard Uncertainty due to Static Pressure Uniformity: Techniquesto Isolate Uniformity Uncertainty. Note the dotted red line, indicating an interpolation couldbe done to eliminate suspected shock interactions affecting measurements in the Mach 1.1-1.4range.
24 36 48−1.2
−1
−0.8
Distance from South Section Test Wall, in.
PS
,arr, p
sid
24 36 48−1.8
−1.6
−1.4
72"60"48"36"24"
2436486072
Ver
tical
Pos
ition
, in.
Figure J.2: Static Pressure Profile: Raw Data at Mach 0.65 (left) and Mach 0.7 (right), shownin “blob” plots (top) and line plots (bottom).
of this technique performed on measurements taken at Mach 0.8 can be seen in FigureJ.3(b). The probe-type bias “W” pattern becomes more pronounced after removal of randomvariation effects: to remove this bias, the average of all 5-hole probes is removed from all 15measurements, and same with the 20 Pitot-static probe measurements. Results can be seenin Figure J.3(c). Results for spatial uniformity uncertainty of array static pressure acrossall nominal Mach conditions using the techniques discussed to remove other uncertaintycontributors can be seen in Figure J.1.
NASA/CR—2016-219411 262
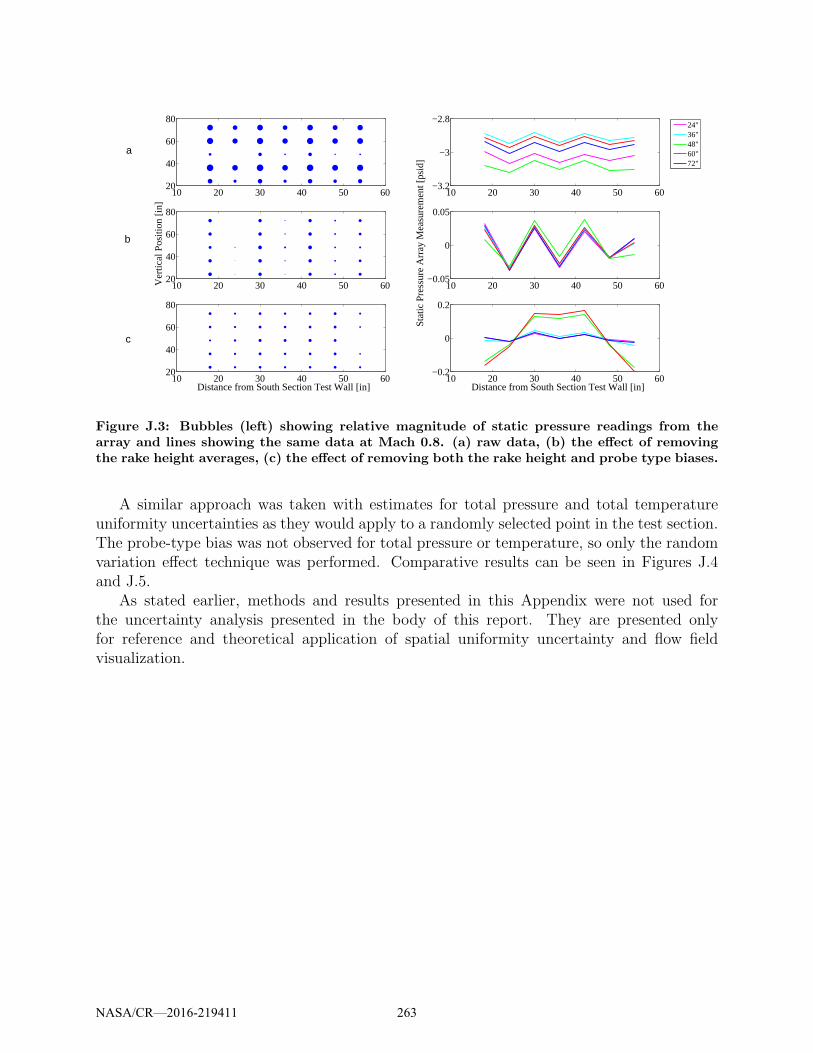
10 20 30 40 50 6020
40
60
80
10 20 30 40 50 6020
40
60
80
Ver
tical
Pos
ition
[in]
10 20 30 40 50 60−0.05
0
0.05
Sta
tic P
ress
ure
Arr
ay M
easu
rem
ent [
psid
]
10 20 30 40 50 6020
40
60
80
Distance from South Section Test Wall [in]10 20 30 40 50 60
−0.2
0
0.2
Distance from South Section Test Wall [in]
10 20 30 40 50 60−3.2
−3
−2.824"36"48"60"72"
a
b
c
Figure J.3: Bubbles (left) showing relative magnitude of static pressure readings from thearray and lines showing the same data at Mach 0.8. (a) raw data, (b) the effect of removingthe rake height averages, (c) the effect of removing both the rake height and probe type biases.
A similar approach was taken with estimates for total pressure and total temperatureuniformity uncertainties as they would apply to a randomly selected point in the test section.The probe-type bias was not observed for total pressure or temperature, so only the randomvariation effect technique was performed. Comparative results can be seen in Figures J.4and J.5.
As stated earlier, methods and results presented in this Appendix were not used forthe uncertainty analysis presented in the body of this report. They are presented onlyfor reference and theoretical application of spatial uniformity uncertainty and flow fieldvisualization.
NASA/CR—2016-219411 263

0 0.2 0.4 0.6 0.8 1 1.2 1.4 1.6 1.8 20
0.05
0.1
0.15
0.2
0.25
0.3
0.35
Nominal Mach Number
b PT
,arr
,uni
f,psi
a
Raw dataRake height average subtracted
Figure J.4: Systematic Standard Uncertainty due to Total Pressure Uniformity: Technique toIsolate Uniformity Uncertainty
0 0.2 0.4 0.6 0.8 1 1.2 1.4 1.6 1.8 20
2
4
6
8
10
12
Nominal Mach Number
b TT
,arr
,uni
f,°R
Raw dataRake height average subtracted
Figure J.5: Systematic Standard Uncertainty due to Total Temperature Uniformity: Techniqueto Isolate Uniformity Uncertainty
NASA/CR—2016-219411 264
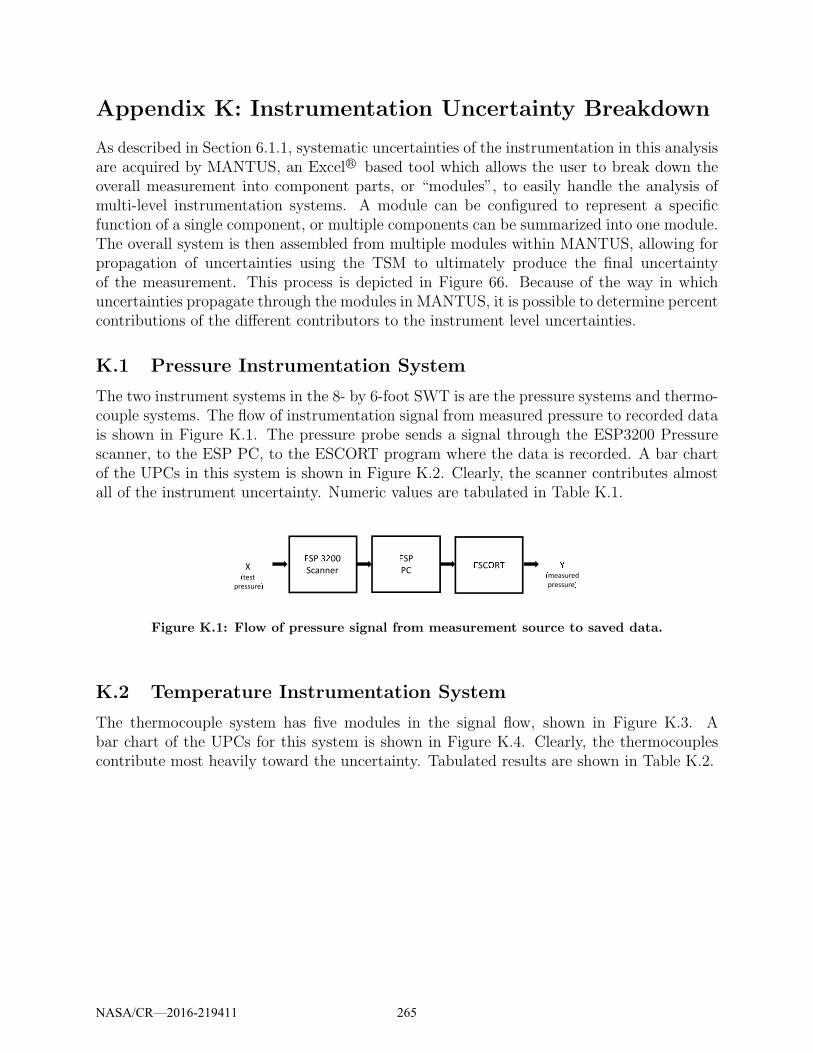
Appendix K: Instrumentation Uncertainty Breakdown
As described in Section 6.1.1, systematic uncertainties of the instrumentation in this analysisare acquired by MANTUS, an Excel R© based tool which allows the user to break down theoverall measurement into component parts, or “modules”, to easily handle the analysis ofmulti-level instrumentation systems. A module can be configured to represent a specificfunction of a single component, or multiple components can be summarized into one module.The overall system is then assembled from multiple modules within MANTUS, allowing forpropagation of uncertainties using the TSM to ultimately produce the final uncertaintyof the measurement. This process is depicted in Figure 66. Because of the way in whichuncertainties propagate through the modules in MANTUS, it is possible to determine percentcontributions of the different contributors to the instrument level uncertainties.
K.1 Pressure Instrumentation System
The two instrument systems in the 8- by 6-foot SWT is are the pressure systems and thermo-couple systems. The flow of instrumentation signal from measured pressure to recorded datais shown in Figure K.1. The pressure probe sends a signal through the ESP3200 Pressurescanner, to the ESP PC, to the ESCORT program where the data is recorded. A bar chartof the UPCs in this system is shown in Figure K.2. Clearly, the scanner contributes almostall of the instrument uncertainty. Numeric values are tabulated in Table K.1.
X(test
pressure)
*SP
PC*SC+RT
*SP 3,00
ScannerY
(measured
pressure)
Figure K.1: Flow of pressure signal from measurement source to saved data.
K.2 Temperature Instrumentation System
The thermocouple system has five modules in the signal flow, shown in Figure K.3. Abar chart of the UPCs for this system is shown in Figure K.4. Clearly, the thermocouplescontribute most heavily toward the uncertainty. Tabulated results are shown in Table K.2.
NASA/CR—2016-219411 265
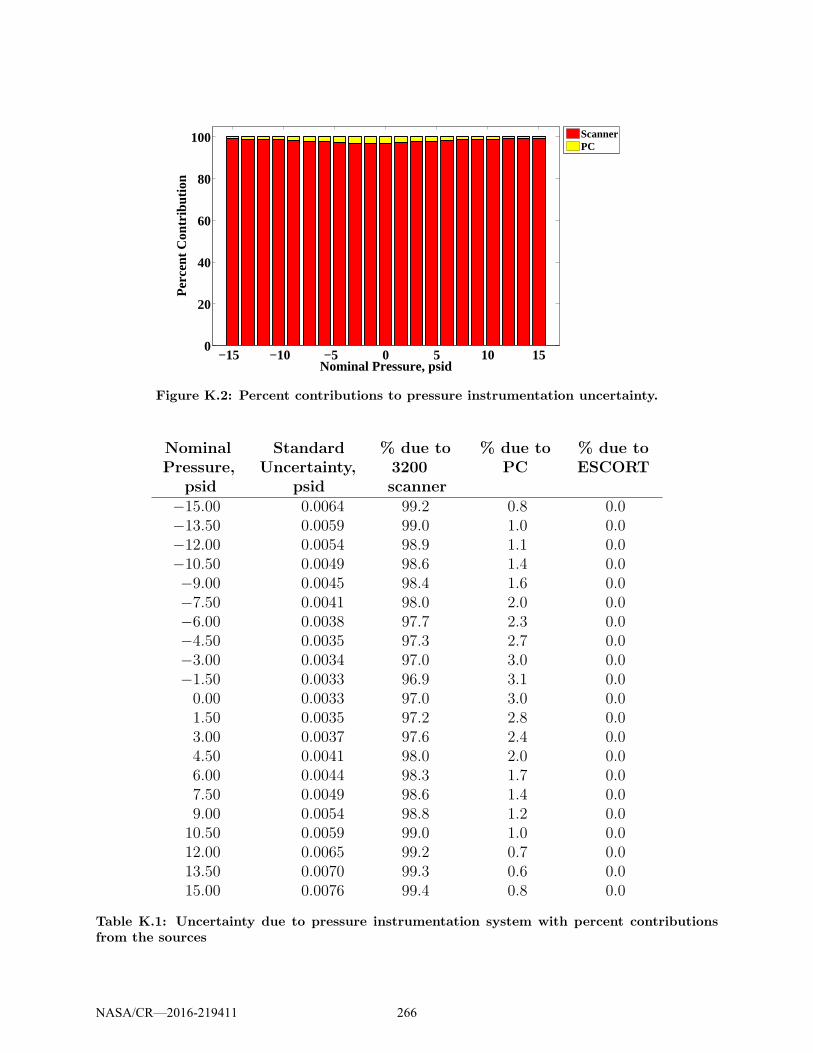
−15 −10 −5 0 5 10 150
20
40
60
80
100
Nominal Pressure, psid
Per
cent
Con
trib
utio
n
ScannerPC
Figure K.2: Percent contributions to pressure instrumentation uncertainty.
NominalPressure,
psid
StandardUncertainty,
psid
% due to3200scanner
% due toPC
% due toESCORT
−15.00 0.0064 99.2 0.8 0.0−13.50 0.0059 99.0 1.0 0.0−12.00 0.0054 98.9 1.1 0.0−10.50 0.0049 98.6 1.4 0.0−9.00 0.0045 98.4 1.6 0.0−7.50 0.0041 98.0 2.0 0.0−6.00 0.0038 97.7 2.3 0.0−4.50 0.0035 97.3 2.7 0.0−3.00 0.0034 97.0 3.0 0.0−1.50 0.0033 96.9 3.1 0.00.00 0.0033 97.0 3.0 0.01.50 0.0035 97.2 2.8 0.03.00 0.0037 97.6 2.4 0.04.50 0.0041 98.0 2.0 0.06.00 0.0044 98.3 1.7 0.07.50 0.0049 98.6 1.4 0.09.00 0.0054 98.8 1.2 0.010.50 0.0059 99.0 1.0 0.012.00 0.0065 99.2 0.7 0.013.50 0.0070 99.3 0.6 0.015.00 0.0076 99.4 0.8 0.0
Table K.1: Uncertainty due to pressure instrumentation system with percent contributionsfrom the sources
NASA/CR—2016-219411 266
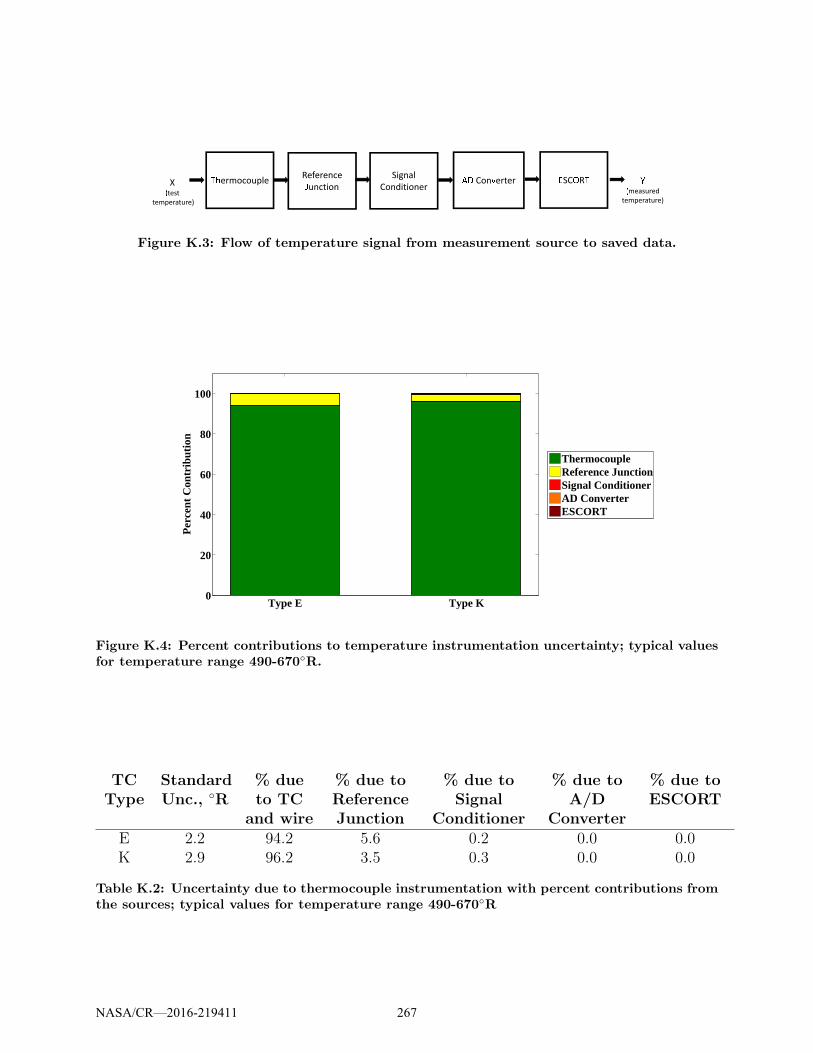
X.test
temperature)
Reference
Junction
Signal
ConditionerA/ Converter 0SC5R66hermocouple 7
.measured
temperature)
Figure K.3: Flow of temperature signal from measurement source to saved data.
Type E Type K0
20
40
60
80
100
Per
cent
Con
trib
utio
n
ThermocoupleReference JunctionSignal ConditionerAD ConverterESCORT
Figure K.4: Percent contributions to temperature instrumentation uncertainty; typical valuesfor temperature range 490-670◦R.
TCType
StandardUnc., ◦R
% dueto TC
and wire
% due toReferenceJunction
% due toSignal
Conditioner
% due toA/D
Converter
% due toESCORT
E 2.2 94.2 5.6 0.2 0.0 0.0K 2.9 96.2 3.5 0.3 0.0 0.0
Table K.2: Uncertainty due to thermocouple instrumentation with percent contributions fromthe sources; typical values for temperature range 490-670◦R
NASA/CR—2016-219411 267