UNAUDITED INTERIM RESULTS - Rainbow Rare...
23
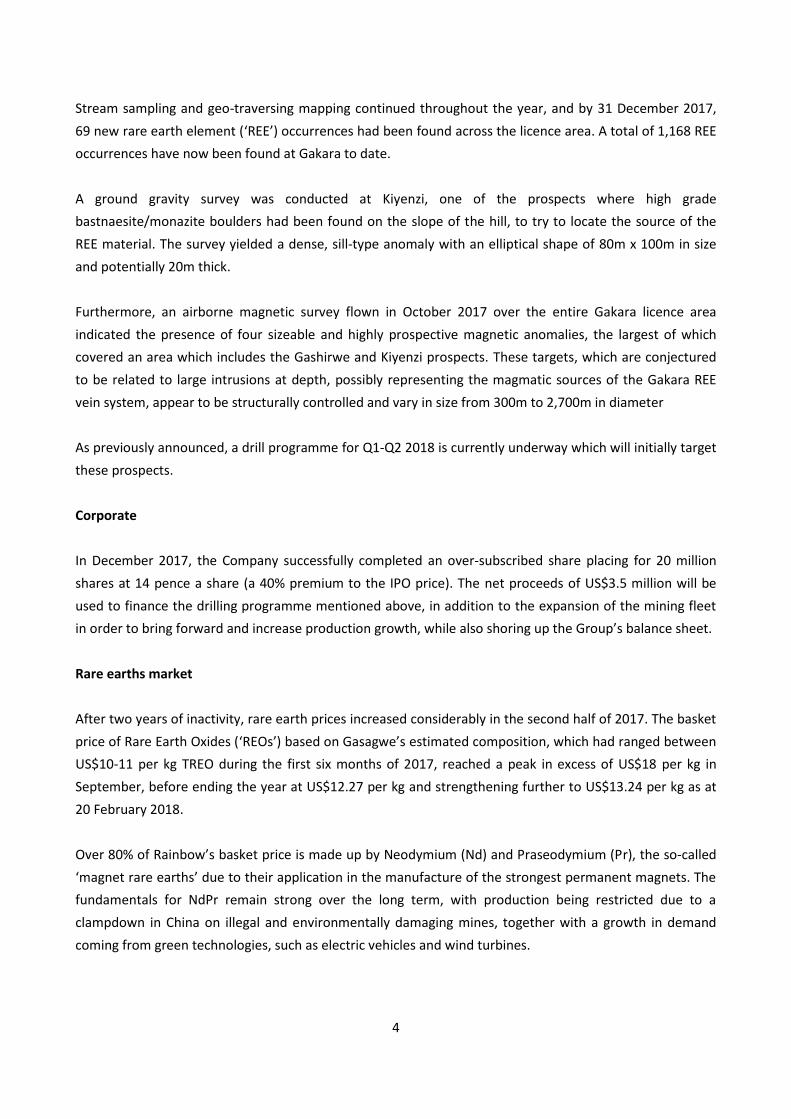
UNAUDITED INTERIM RESULTS for the six months ended 31 December 2017
Transcript of UNAUDITED INTERIM RESULTS - Rainbow Rare...
UNAUDITED INTERIM RESULTSfor the six months ended 31 December 2017


1
21 February 2018
Rainbow Rare Earths Ltd ('Rainbow' or 'the Company') (LSE: RBW)
Interim Results
Rainbow, the high grade rare earth concentrate producer, announces its unaudited results for the six
months ended 31 December 2017.
Highlights
Commenced production and first shipment of rare earth concentrate completed on schedule in Q4
2017
Processing plant commissioning well advanced at period end, and now completed
Ground gravity and airborne radiometric surveys identified highly prospective anomalies which are
being drilled in Q1 2018
Successful completion of share placing in December 2017 raising net US$3.5 million to finance first
drilling campaign as well as mine fleet expansion
Cash balance of US$2.7 million at 31 December 2017
Loss for the six months ended 31 December 2017 of US$1.1 million (31 December 2016: US$0.4m),
reflecting increase in pre-production administrative activity
Enquiries:
Rainbow Rare Earths Ltd Martin Eales +44 (0) 20 3910 4550
Arden Partners plc Paul Shackleton
Benjamin Cryer
+44 (0) 20 7614 5900
Hannam & Partners (Advisory) LLP Neil Passmore
Ben Newman-Sanders
+44 (0) 20 7907 8500
St Brides Partners Ltd Lottie Wadham
Susie Geliher
+44 (0) 20 7236 1177

2
CEO Statement
Following Rainbow’s IPO at the beginning of 2017, the six months to 31 December 2017 was a busy and
highly productive period for Rainbow, during which we commenced production of rare earth concentrate
from one of the highest grade projects globally on schedule and on budget.
During the period, the initial mine at Gasagwe developed from an area which had undergone manual pre-
stripping work only, to an operational mine site. At the same time, the plant site at Kabezi went from being
an area which had been cleared and levelled, to the site of an operating plant which had, by the end of
2017, completed the first two exportations of mineral concentrate.
Rare earth prices also strengthened over the period, buoyed by growing demand from green technologies
such as hybrid and electric vehicles. As owners of Africa’s only producing rare earth mine, and one of only a
few outside China, the Company is well placed to take advantage of the burgeoning rare earth market.
Although the focus was on constructing the plant and commencing production during 2017, ground gravity
and airborne radiometric surveys undertaken during the period identified some highly prospective, and
large, anomalies within Rainbow’s licence area.
In December, the Company successfully completed a share placing which raised net proceeds of US$3.5
million in order to finance an exploration programme to investigate these exciting anomalies, as well as to
accelerate production growth through expanding the mining fleet.
Gakara mine – from development to production
The first six months of 2017 were focussed on assembling the teams and sourcing the equipment and
suppliers needed to bring the mine into production by the target date for first shipment in Q4 2017 and we
were delighted that, thanks to the hard work by our team on the ground at Gakara, we were able to
achieve this goal on schedule.
At Gasagwe, the project’s first mining area, manual site preparation work had commenced in April
following the recruitment of a team of local workers. Waste stripping continued for the rest of the year,
exposing the main vein of ore as well as additional subsidiary veins in the process.
By the end of June 2017, site clearance and initial preparation work had also begun at the plant site at
Kabezi, 13km south of Bujumbura.
On 21 July 2017, the mine was pleased to host His Excellency President Pierre Nkurunziza, who conducted
an inauguration ceremony followed by traditional celebrations at the nearby town of Mutambu. The
ceremony was very well attended and included a speech by Burundi’s Minister for Mines and Energy, Come

3
Manirakiza, echoing the support that Rainbow has received from the Government of Burundi and the local
population.
Between July and December 2017, construction of the processing plant at Kabezi was in full swing. Bulk
earthworks were completed by July, followed by civils between August and November. Pre-assembled
plant parts began to arrive in containers in August, and construction of the plant itself took place between
September and December. Commissioning of the plant began on 5 December 2017, and the first shipment
of 25 tonnes of rare earth concentrate was also announced on that date. By 31 December 2017, a second
25 tonne shipment had been completed, and a further 25 tonnes of production had been bagged at the
plant site. The first two shipments were then sold together as a batch of 50 tonnes to thyssenkrupp Raw
Materials (‘TK’) in January 2018, with title transferring at the port of Mombasa in Kenya.
Some 270 tonnes of material had been manually mined by the end of December following the
commencement of mining of ore in earnest in September. Commissioning is now complete and final
handover of the plant later in February 2018 will allow the rate of ore mining to increase considerably, as
the separation of waste from ore will be handled by the plant itself.
Safety, health and community
During December 2017, the milestone of 500,000 man hours without a Lost Time Injury (‘LTI’) was passed.
The Company is rightly proud of this achievement, and places great importance on the attention paid to
safety practices at all levels of the organisation.
The Gakara project is the only non-artisanal producing mine currently operating in Burundi. As such, it is
extremely important not only to local communities, but also to the nation of Burundi as a whole. We are
therefore delighted that as at period-end, Rainbow’s local operating entity employed 177 workers, and a
further 208 as subcontractors, in an area of high unemployment.
In addition, the taxes and royalties generated by the mine will boost the government treasury, while
exports will bring much-needed foreign currency into the country, much of which is spent with local
suppliers.
Exploration
With the focus on mining operations and construction at Kabezi, exploration activity was limited during the
six months to 31 December 2017. However, the work undertaken yielded some exciting results.
4
Stream sampling and geo-traversing mapping continued throughout the year, and by 31 December 2017,
69 new rare earth element (‘REE’) occurrences had been found across the licence area. A total of 1,168 REE
occurrences have now been found at Gakara to date.
A ground gravity survey was conducted at Kiyenzi, one of the prospects where high grade
bastnaesite/monazite boulders had been found on the slope of the hill, to try to locate the source of the
REE material. The survey yielded a dense, sill-type anomaly with an elliptical shape of 80m x 100m in size
and potentially 20m thick.
Furthermore, an airborne magnetic survey flown in October 2017 over the entire Gakara licence area
indicated the presence of four sizeable and highly prospective magnetic anomalies, the largest of which
covered an area which includes the Gashirwe and Kiyenzi prospects. These targets, which are conjectured
to be related to large intrusions at depth, possibly representing the magmatic sources of the Gakara REE
vein system, appear to be structurally controlled and vary in size from 300m to 2,700m in diameter
As previously announced, a drill programme for Q1-Q2 2018 is currently underway which will initially target
these prospects.
Corporate
In December 2017, the Company successfully completed an over-subscribed share placing for 20 million
shares at 14 pence a share (a 40% premium to the IPO price). The net proceeds of US$3.5 million will be
used to finance the drilling programme mentioned above, in addition to the expansion of the mining fleet
in order to bring forward and increase production growth, while also shoring up the Group’s balance sheet.
Rare earths market
After two years of inactivity, rare earth prices increased considerably in the second half of 2017. The basket
price of Rare Earth Oxides (‘REOs’) based on Gasagwe’s estimated composition, which had ranged between
US$10-11 per kg TREO during the first six months of 2017, reached a peak in excess of US$18 per kg in
September, before ending the year at US$12.27 per kg and strengthening further to US$13.24 per kg as at
20 February 2018.
Over 80% of Rainbow’s basket price is made up by Neodymium (Nd) and Praseodymium (Pr), the so-called
‘magnet rare earths’ due to their application in the manufacture of the strongest permanent magnets. The
fundamentals for NdPr remain strong over the long term, with production being restricted due to a
clampdown in China on illegal and environmentally damaging mines, together with a growth in demand
coming from green technologies, such as electric vehicles and wind turbines.

5
The Gakara mine is one of the world’s few rare earth mines in production outside China. Many of the rare
earth projects currently in development require significant funding in order to be built, and in many cases
rely on long term rare earth prices higher than current levels in order to be economically viable. It is
therefore considered unlikely that further increases in rare earth prices will lead to an increase in market
supply for a number of years.
During 2017, the Chinese government announced measures to reduce pollution from its rare earth mines,
as well as to tackle illegal mining. In addition, according to Argus Media, Chinese authorities set an overall
target to reduce total rare earth output to 140,000t REOs by 2020-21, a drop of around 20-25% from
current production levels. As approximately 85% of global rare earths production comes from China, this
represents a significant reduction, which is unlikely to be met by increased output from non-Chinese
sources, and is therefore likely to drive rare earth prices upwards, particularly those such as NdPr for which
demand is growing over the same period.
Outlook
Rainbow has two priorities over the coming six months: to ramp up production at Gakara as quickly as
possible; and to complete the first phase of a drilling programme designed to understand the anomalies
identified in 2017.
Commissioning of the plant continued into 2018, with modification work undertaken on the jig and shaking
tables to cater for a range of differences in ore feed. Some delays were experienced particularly in respect
of the importation of certain parts and services necessary to complete required adjustments, which pushed
the final completion of commissioning into early February, but the plant is now successfully running as
designed.
Exports of concentrates increased from 50 tonnes in December 2017 to 75 tonnes in January 2018, and
February’s export figure is due to be higher still. These levels will ramp-up quickly over the coming months
following completion of plant commissioning, and the increased rate of mining.
The second half of 2018 will be focussed on reaching the stated run-rate production target of 5,000 tpa by
the end of the calendar year.
If the initial results of drilling, which are anticipated in April 2018, are successful, the Company expects to
progress to a second phase drilling campaign, and to announce a maiden JORC resource during H2 2018.

6
Financial Review
Overview
As the Gakara mine had only begun production at the end of the six months ended 31 December 2017, the
Group’s financial results largely reflect the capitalised costs of mine construction and development, as well
as its financing activities (notably the equity placing in December).
Income statement
No revenue was recognised in the period as although two shipments of concentrate were completed prior
to 31 December 2017, the transfer of title (the point at which the risks and rewards of ownership are
deemed to transfer to the buyer, TK), did not take place until January 2018. In addition, the Company will
continue to capitalise both sales and mining expenses until commercial production has been achieved,
which is expected to be some time during Q2 2018.
Operating expenses included US$0.6 million of administration costs (six months to 31 December 2016:
US$0.2 million). These included corporate costs, support staff salaries, Directors’ remuneration,
professional and advisors’ fees, and other office and administrative functions, which were not capitalised in
the period. Direct costs of construction and mining operations were capitalised as mining development
costs, without any allocation of overheads.
The increase compared with the equivalent period to 31 December 2016 reflected the increased activity
associated with the construction of the Gakara mine – activity during the months prior to the IPO in January
2017 had, by comparison, been deliberately low level.
Share based payment costs of US$0.5 million (31 December 2016: US$ nil) related to share options which
were awarded during 2017, including 2.5 million options awarded to Board members on 23 August 2017 at
an exercise price of 15 pence per share (a 35% premium to the market price at the date of award).
Finance costs were less than US$10k during the period, compared with US$0.3 million for the six months to
31 December 2016, and related primarily to interest on the Finbank overdraft drawn in the period. In the
comparative period to 31 December 2016, the Company incurred interest and other finance costs
associated with the US$1.5 million Pala loan and the US$0.25 million loan from Alpha Future Investments
Limited (both of which were settled in January 2017).
The Total Loss after Tax and Comprehensive Expense of US$1.1 million (31 December 2016: loss of US$0.4
million) primarily reflects the total of administrative expenses incurred during the period plus finance costs.

7
Balance sheet
The Company’s fixed assets increased to US$8.7 million by 31 December 2017 (30 June 2017: US$6.0
million). This related to the capitalised construction and exploration costs, together with plant, equipment,
and vehicles acquired in respect of the Gakara project.
The increase in the period reflected the activity in the six months to 31 December 2017, during which the
Kabezi plant was acquired and assembled, the plant and mining sites pre-stripped and prepared, and
mining operations commenced.
As a result of these mining activities, approximately 270 tonnes of unprocessed run of mine (‘RoM’) ore and
unsold concentrate was produced by 31 December 2017, which has been included on the balance sheet at
its cost of US$0.4 million.
At 31 December 2017, outstanding subscriptions from the equity placement in December 2017 amounted
to US$0.3 million, recorded under other receivables. These amounts were received in early January 2018.
Trade and other payables of US$0.4 million (30 June 2017: US$0.4 million) related primarily to trade
creditors and accrued expenses in respect of the Company’s operations in Burundi.
Short-term borrowings as at 31 December 2017 were US$0.3 million (30 June 2017: US$20k), which
consisted primarily of the Company’s Burundian Franc (BIF) overdraft with Finbank Limited.
Cash flow statement
At 31 December 2017, the Group’s cash position was US$2.7 million, or US$2.4 million net of borrowings.
This represented a net cash outflow of US$0.5 million compared with the opening cash balance of US$3.2
million at 30 June 2017 (six months to 31 December 2016: net cash outflow of US$0.1 million).
Cash expenditure in the period related primarily to operating costs and capex in respect of the Gakara
project.
Net cash outflow from operating activities of US$1.1 million (six months to 31 December 2016: US$0.1
million) primarily reflected the US$0.6 million of administrative expenses and US$0.4 million capitalised
mining costs related to the ore stockpiles.
US$2.8 million of net cash used in investing activities related to the cost of constructing the Gakara mine, in
particular the civils and earthworks at Kabezi and Gasagwe (such access roads, groundworks, and concrete
foundations), and the cost of importing and assembling the processing plant. Activity during the six months
8
to 31 December 2016 predated the commencement of construction and mining operations, and only
US$0.1 million of capitalised costs were incurred during that period.
Net cash generated by financing activities amounted to US$3.5 million (31 December 2016: US$0.2 million).
In addition to US$0.3 million of borrowing related to the Finbank Ltd BIF overdraft drawn in the period, the
Company also successfully completed an equity placing in December 2017 for net proceeds of US$3.5
million (of which US$0.3 million was received shortly after the period end).
Commitments
On 10 March 2017, the Company entered into an agreement with Obsideo Consulting Pty Ltd for the
design, supply, and installation of a rare earths concentrator plant, for a total of ZAR 23.3 million (US$1.8
million). As at 31 December 2017, a total of US$1.5 million had been incurred under this contract, therefore
US$0.3 million should be considered a capital commitment at the period end.
Treasury
The Group continually monitors its exposure to currency risk. It maintains a portfolio of cash and cash
equivalent balances mainly in pounds sterling and US dollars, which it holds primarily in Guernsey in call
deposits.
Under Burundian law, the Company is required to repatriate the proceeds of its exports of concentrate,
which are sold in US dollars, into Burundi. These funds will be used to settle ongoing operating costs in
Burundi and abroad, and under the terms of the Mining Convention signed with the Government of
Burundi in 2015, the Group’s legal entity in Burundi (Rainbow Mining Burundi SM) has the right to use its
foreign currencies for all legitimate purposes, including settlement of invoices, intragroup loans,
management fees, and dividends.
The Company does not therefore expect to hold significant balances of unused BIF or foreign currency in
Burundi.
Going concern
The Directors have a reasonable expectation that the Company and the Group have adequate resources to
continue in operational existence for the foreseeable future. Accordingly, they continue to adopt the going
concern basis in preparing the Condensed Consolidated and Company Financial Statements. For further
detail refer to the detailed discussion of the assumptions outlined in note 2(a) to the Condensed
Consolidated Financial Statements.
9
Cautionary Statement:
The business review and certain other sections of this Half Yearly Report contain forward looking statements
that have been made by the Directors in good faith based on the information available to them up to the
time of their approval of this report. However they should be treated with caution due to inherent
uncertainties, including both economic and business risk factors, underlying any such forward-looking
information and no statement should be construed as a profit forecast.
Risks and uncertainties
There are a number of potential risks and uncertainties inherent in the mining sector which could have a
material impact on the long-term performance of the Company and which could cause the actual results to
differ materially from expected and historical results. The Company has taken reasonable steps to mitigate
these where possible. Full details are disclosed on page 25 of the Annual Report for the year ended 30 June
2017. There have been no significant changes to the risk profile during the first half of the year. The risks
and uncertainties are summarised below:
Ramp up of the Kabezi plant
Ramping up of production involves increasing the throughput of ore, and during this period it
remains possible that issues will arise that will require remedial actions. In addition, construction
work elsewhere on the plant site, such as warehouse and offices, continues.
Production
The process of mining and crushing/separating rare earth mineral concentrate at Gakara remains
exposed to a number of risks including mechanical outages, supply issues, interruptions due to
weather. These risks are higher during the early stages of production, when the processes are less
well established
Civil unrest
The risk of civil unrest exists in Burundi, which has experienced disturbances in the past
Rare earth prices
Rainbow’s sales price for its mineral concentrate is derived from a basket price for the individual
REOs it contains, less a deduction as negotiated with each customer. The ultimate selling price may
therefore go up or down depending on market conditions
Geological risk
The scale and grade of the mineral deposit at Gakara cannot be stated with certainty, particularly as
the Company has not yet declared a JORC-compliant Mineral Resource
Financing risk
Any substantial delays in production or adverse pricing may result in the requirement for short-
term financing. At present the Company does not anticipate such a requirement, however this
possibility remains a risk
10
Currency controls
All sales proceeds from mineral exports will be repatriated into Burundi. The Company is therefore
exposed to the risk that access to its funds may be restricted either as a result of currency
shortages, governmental policy changes, or international banking restrictions imposed on Burundi
by banks or governmental bodies
Directors’ Responsibility Statement
We confirm that to the best of our knowledge:
a) the Condensed set of Interim Financial Statements has been prepared in accordance with IAS 34
‘Interim Financial Reporting’;
b) the interim management report includes a fair review of the information required by DTR 4.2.7R
(indication of important events during the first six months and description of principal risks and
uncertainties for the remaining six months of the year);
c) the interim management report includes a fair review of the information required by DTR
4.2.8R (disclosure of related parties’ transactions and changes therein); and
d) the condensed set of interim financial statements, which has been prepared in accordance with the
applicable set of accounting standards, gives a true and fair view of the assets, liabilities, financial
position and profit or loss of the issuer, or the undertakings included in the consolidation as a whole as
required by DTR 4.2.4R.
This Half Yearly Report consisting of pages 1 to 21 has been approved by the Board and signed on its behalf
by:
Martin Eales
Chief Executive Officer
20 February 2018

11
Condensed Consolidated Statement of Comprehensive Income Six months ended 31 December 2017
6 months to 31 December
2017
6 months to 31 December
2016
12 months to 30 June
2017
Notes
US$’000 Unaudited
US$’000 Unaudited
US$’000 Audited
Operating expenses:
Administration expenses (601)
(148)
(842)
Exploration expenditure 4 -
(20)
(95)
Share based payments (461) - (494)
Total operating expenses (1,062)
(168)
(1,431)
Loss from operating activities (1,062) (168)
(1,431)
Finance income - - 185
Finance costs (9) (255)
(156)
Loss before tax (1,071) (423)
(1,402)
Income tax expense - - -
Total loss after tax and comprehensive expense for the period
(1,071)
(423)
(1,402)
Total loss after tax and comprehensive expense for the period is attributable to:
Non-controlling interest (28) (4) (13)
Owners of parent (1,043) (419) (1,389)
(1,071)
(423)
(1,402)
The results of each period are derived from continuing operations.
Loss per share (cents) Basic 3 (0.67)
(0.51)*
(1.24)*
Diluted 3 (0.67) (0.51)* (1.24)*
* Adjusted for share consolidation in January 2017
12
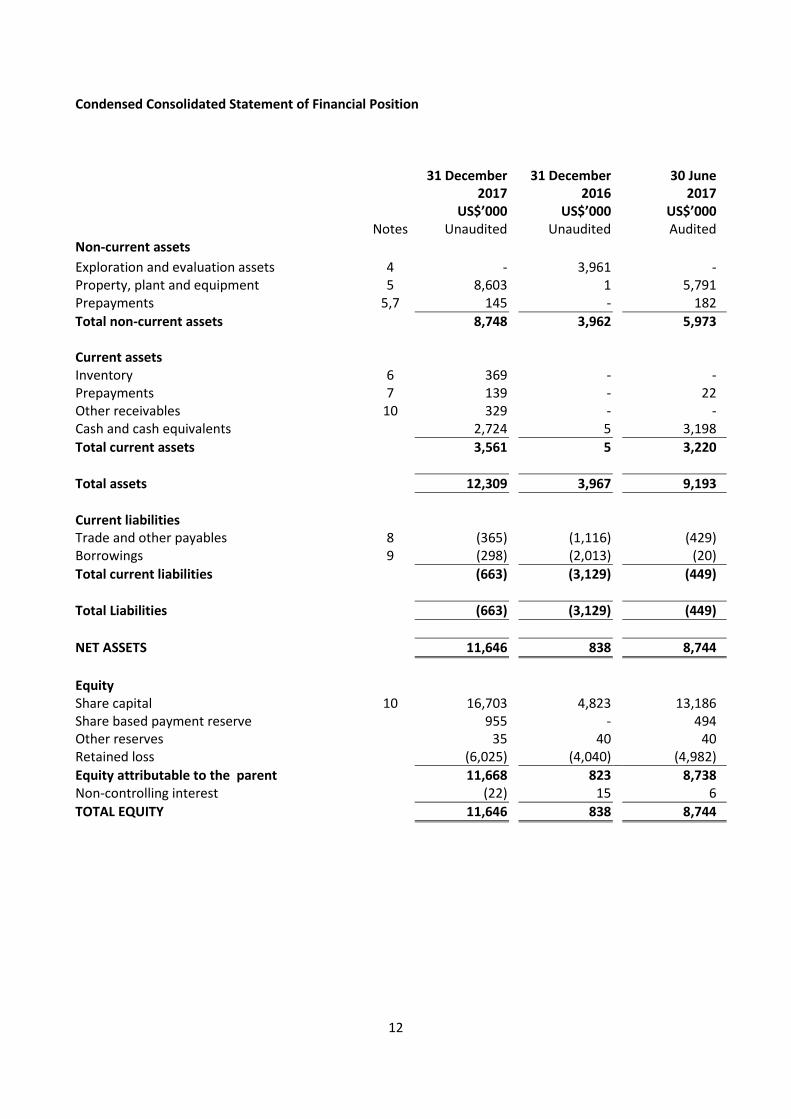
Condensed Consolidated Statement of Financial Position
31 December 2017
31 December 2016
30 June 2017
Notes
US$’000 Unaudited
US$’000 Unaudited
US$’000 Audited
Non-current assets
Exploration and evaluation assets 4 - 3,961 -
Property, plant and equipment 5 8,603 1 5,791 Prepayments 5,7 145 - 182
Total non-current assets
8,748 3,962 5,973
Current assets
Inventory 6 369 - -
Prepayments 7 139 - 22 Other receivables 10 329 - - Cash and cash equivalents
2,724 5 3,198
Total current assets
3,561 5 3,220
Total assets
12,309 3,967 9,193
Current liabilities Trade and other payables 8 (365) (1,116) (429) Borrowings 9 (298) (2,013) (20)
Total current liabilities (663) (3,129) (449)
Total Liabilities (663) (3,129) (449)
NET ASSETS 11,646 838 8,744
Equity
Share capital 10 16,703 4,823 13,186
Share based payment reserve 955 - 494 Other reserves
35 40 40
Retained loss
(6,025) (4,040) (4,982)
Equity attributable to the parent 11,668 823 8,738 Non-controlling interest
(22) 15 6
TOTAL EQUITY
11,646 838 8,744

13
Condensed Consolidated Cash Flow Statement Six months ended 31 December 2017
6 months to 31 December
2017
6 months to 31 December
2016
12 months to 30 June
2017
Notes
US$’000 Unaudited
US$’000 Unaudited
US$’000 Audited
Cash flow from operating activities
Loss after tax for the period (1,071) (423) (1,402) Share based payment charge 461 - 494 Finance income - - (185) Finance costs 9 255 156 Net increase in inventory 6 (369) - - Net decrease/(increase) in other receivables 65 - (16) Net (decrease)/increase in other payables (221) 65 109
Net cash flow from operating activities (1,126) (103) (844)
Cash flow from investing activities
Purchase of exploration and evaluation assets
- (123) (769)
Purchase of property, plant and equipment (2,812) - (1,363)
Net cash used in investing activities (2,812) (123) (2,132)
Cash flow from financing activities
Net proceeds of new borrowings 268 247 250 Repayment of borrowings - - (1,700) Proceeds from the issuance of ordinary shares 10 3,421 - 7,854 Costs of issuing new shares 10 (222) (86) (444)
Net cash generated by financing activities 3,467 161 5,960
Net (decrease)/increase in cash and cash equivalents
(471) (65) 2,984
Cash & cash equivalents at the beginning of the period
3,198 70 70
Foreign exchange (loss)/gain on cash & cash equivalents
(3) - 144
Cash & cash equivalents at the end of the period
2,724 5 3,198

14
Condensed Consolidated Statement of Changes in Equity Six months ended 31 December 2017 US$’000 Share
capital Share based
payment reserve
Other reserves
Retained Earnings
Attributable to the
parent
Non- controlling
interest
Total
Balance at 1 July 2016 5,042 - 40 (3,621) 1,461 19 1,480
Total comprehensive expense Total comprehensive loss - - - (419) (419) (4) (423) IPO Transaction costs (219) - - - (219) - (219)
Balance at 31 December 2016 (unaudited) 4,823 - 40 (4,040) 823 15 838
Total comprehensive expense Total comprehensive loss - - - (970) (970) (9) (979) Transactions with owners Extinguishment of convertible loan - - - 28 28 - 28 IPO transaction costs (559) - - - (559) - (559) Share based payment reserve - 494 - - 494 - 494 Issue of shares during the period 8,922 - - - 8,922 - 8,922
Balance at 1 July 2017 13,186 494 40 (4,982) 8,738 6 8,744
Total comprehensive expense Total comprehensive loss - - - (1,043) (1,043) (28) (1,071) Transactions with owners Issue of shares during the period 3,750 - - - 3,750 - 3,750 Share placing transaction costs (233) - - - (233) - (233) Share based payment reserve - 461 - - 461 - 461 FX on translation - - (5) - (5) - (5)
Balance at 31 December 2017 (unaudited) 16,703 955 35 (6,025) 11,668 (22) 11,646

15
Notes to the Condensed Financial Statements Six months ended 31 December 2017 1. General information Rainbow Rare Earths Limited (the ‘Company’, together with its subsidiaries the ‘Group’), is incorporated in Guernsey as a non-cellular company limited by shares. The address of the registered office is c/o Trafalgar Court, Admiral Park, St Peter Port, Guernsey GY1 3EL. The nature of the Group’s operations and its principal activities are set out in the CEO Statement, Operations Review and the Financial Review on pages 2 to 10. The financial information for the year ended 30 June 2017 does not constitute the audited statutory accounts, but has been extracted from those accounts. The report did not include reference to matters to which the auditors drew attention by way of emphasis. This Half Yearly Report has not been audited or reviewed. A copy of this Half Yearly Report has been published and may be found on the Company’s website at www.rainbowrareearths.com 2. Basis of preparation The annual financial statements of the Group are prepared in accordance with International Financial Reporting Standards (‘IFRS’) as issued by the International Accounting Standards Board (‘IASB’) and as adopted by the European Union (‘EU’). These Condensed Financial Statements have been prepared in accordance with IAS 34 Interim Financial Reporting. The same accounting policies and methods of computation are followed in the condensed interim financial statements as were followed in the most recent annual financial statements of the Group, which were published on 19 October 2017. However the Company has adopted a policy for accounting for inventory stockpiles of ore and concentrate, as set out in f) below. No inventory of ore or concentrate existed during prior periods, and therefore no policy was required. The value of the stockpiles is described in note 6. In addition, the Company has adopted a policy for the recognition of revenue. Although no revenue was recognised during the period, two exportations of concentrate were completed by the period end, and it was therefore considered appropriate to set out the policy for recognising exports as revenue. This policy is set out in b) below. The Group has not early adopted any amendment, standard or interpretation that has been issued but is not yet effective. It is expected that where applicable, these standards and amendments will be adopted on each respective effective date. The Group has adopted the standards, amendments and interpretations effective for annual periods beginning on or after 1 January 2017. The adoption of these standards and amendments did not have a material effect on the financial statements of the Group.

16
(a) Going concern The Directors have continued to use the going concern basis in preparing these condensed financial statements. The Group's business activities, together with the factors likely to affect future development, performance and position are set out in the Operations Review. The financial position of the Group, its cash flow and liquidity position are described in the Financial Review. The Group’s cash balance at 31 December 2017 was US$2.7 million (30 June 2017: US$3.2 million). On 5 December 2017, the Company announced that it had commenced the commissioning of the processing plant at Kabezi, and had successfully exported its first shipment of rare earth concentrate. Over the coming months, management expect production, and sales, to ramp up steadily, with a target run rate production of 5,000 tpa by the end of 2018. According to management forecasts, once sales reach 250 tonnes per month, the Company will generate positive operating cashflows, and will only need to draw down on its funding reserves for discretionary investment activities (such as drilling programmes or expansion of the mining fleet). In December 2017, the Company closed an over-subscribed equity placing for 20 million shares at 14 pence each, for net proceeds of US$3.5 million (of which US$3.2 million had been received at 31 December 2017). These funds were raised with the intention of accelerating a programme of drilling and production growth through expanding the mining fleet, as well as providing additional working capital. Forecasts indicate that funds will be sufficient to cover these investment activities. However, even in the event that unfavourable circumstances arise, such as lower than expected production or sales prices, the Company is satisfied that it could either find short term funding to bridge the shortfall, or defer, or even cancel, these investment plans at short notice in order to conserve cash. After considering the scenarios described above, the Directors have a reasonable expectation that the Company and the Group have adequate resources to continue in operational existence for a period not less than 12 months from the date of this report and consider the going concern basis of accounting to be appropriate and, thus, they continue to adopt the going concern basis of accounting in preparing the financial statements. (b) Revenue recognition The Company produces and sells rare earth concentrate from its Gakara project in Burundi. Revenue is recognised when the risks and rewards of ownership of this concentrate are passed to the buyer. The Company currently has a 10-year offtake agreement with TK which commenced in January 2018, and under which all production up to 10,000 tonnes per annum will be sold. The sale of concentrate is deemed to have taken place when the title for a shipment is transferred to TK, normally at a port in East Africa. The date of this transaction is the date of the transfer of title, while the price is established in accordance with the terms of the offtake agreement, by reference to the market price and quantities of rare earth oxides in each shipment.

17
(c) Foreign currencies The consolidated financial statements are presented in US dollars, which is also the functional currency of the company and its subsidiaries, with the exception of Rainbow Rare Earths UK Limited, whose functional currency is GBP. Transactions in foreign currencies are translated to the functional currency of the Group entity at the rates of exchange prevailing on the dates of the transactions. At each reporting date, monetary assets and liabilities that are denominated in foreign currencies are retranslated to the functional currency at the rates prevailing on the reporting date. Exchange gains and losses on short-term borrowings and deposits are included within finance costs. Exchange differences on all other transactions are recognised within the operating loss. (d) Dividend The Directors do not recommend the payment of a dividend for the period (31 December 2016: US$nil; 30 June 2017: US$nil). (e) Segment Reporting Operating segments are reported in a manner consistent with internal reporting provided to the chief operating decision-maker. The chief operating decision-maker has been identified as the Chief Executive Officer (“CEO”). It is considered that there is only one segment of the Group being the exploration and production of rare earths. (f) Inventory Stockpiles Stockpiles of ore (whether Run of Mine ‘RoM’ ore, concentrate stockpiles pre-shipment, or concentrate in transit but not yet sold) are valued at the lower of historic cost and net realisable value. Historic cost is based on an allocation of mining costs and (in the case of concentrates) processing costs incurred in bringing the stockpiles to their finished condition for transportation at the period end (including plant running costs, haulage costs from the mine site to the plant, and transportation costs to the port of sale). Realisable value is based on an estimate of selling price less shipment costs, royalties, and other fees to be incurred in the course of the sales process. Inventory stockpile costs do not include an allocation of support costs. Inventory spares (including tools, parts for equipment, and stocks of consumables) are also valued at the lower of historic cost and realisable value. Spares are reviewed at each period end for obsolescence, with provisions applied to those stock lines whose value in use and re-sale value is uncertain. 3. Loss per ordinary share Loss per ordinary share is calculated by dividing the net loss for the period attributable to Ordinary equity holders of the parent by the weighted average number of Ordinary shares outstanding during the period. The calculation of the basic loss per share is based on the following data:

18
Six months to 31 December 2017
Six months to 31 December 2016
12 months to 30 June 2017
Unaudited Unaudited Audited Loss attributable to the owners of the Company US$’000 US$’000 US$’000 The loss for the period attributable to ordinary equity holders of the parent company (1,043) (419) (1,389) Number Number Number Number of Shares ‘000 ‘000 ‘000 Weighted average number of Ordinary shares for the purposes of basic and diluted loss per share 155,938 *81,862 112,136
Loss per Ordinary share Cents Cents Cents
Basic (0.67) (0.51) (1.24)
Diluted (0.67) (0.51) (1.24) The weighted average number of shares for the six months to 31 December 2016 has been adjusted for the effect of the share sub-division in January 2017. The previously presented weighted average number of ordinary shares in the six months to 31 December 2016 was 1,221,826, equivalent to 81,862,342 if the share consolidation had taken place at the start of that period. At 31 December 2017, there were 12,620,324 (30 June 2017: 10,120,324) potentially dilutive shares in issue through warrants and options. However, potentially dilutive shares are only treated as dilutive if their effect would be to decrease the earnings per share, or increase the loss per share. In all periods shown above, the effect would have been to reduce the loss per share. 4. Capitalised exploration and evaluation expenditure At 30 June 2017, the total value of exploration costs previously capitalised as intangible assets in respect of the Gakara project were transferred to plant, property and equipment, in accordance with the Company’s accounting policies. All exploration expenditure during the six months to 31 December 2017 related to the Gakara mining permit, and has been capitalised as part of mine development costs within plant, property and equipment.

19
5. Property, plant, and equipment
Mine development
costs
Plant and machinery
Vehicles
Office equipment
Total
US$’000 US$’000 US$’000 US$’000 US$’000
Cost
At 1 July 2017 4,603 1,016 169 3 5,791
Additions 1,285 1,204 305 18 2,812
At 31 December 2017 5,888 2,220 474 21 8,603
Depreciation
At 1 July 2017 – – – – –
Charge for year – – – – –
At 31 December 2017 – – – – –
Net Book Value at 31 December 2017
5,888 2,220 474 21 8,603
Net Book Value at 30 June 2017 4,603 1,016 169 3 5,791
Net Book Value at 30 June 2016 – – – 1 1
No depreciation charge was applied during the year, as the Gakara project had not yet reached commercial production. Assets will be depreciated over their useful economic lives, in accordance with the Company’s accounting policies, once commercial production is achieved (depending on the rate of ramp-up, expected to be in Q2 2018). 6. Inventory Inventory at 31 December 2017 consisted of approximately 270 tonnes of RoM ore and concentrate in transit (which had not been sold at period end). Inventory was valued at the lower of cost and net realisable value. The cost of the material was calculated by reference to the cost of mining activity from the commencement of ore mining in September, and (in respect of concentrate) from the cost of operating the plant from December. 7. Prepayments US$’000
Balance at 31 December 2017
Balance at 31 December 2016
Balance at 30 June 2017
Unaudited Unaudited Audited
Non-current prepayments 145 - 182 Current prepayments 139 - 22
Total prepayments 274 - 204 Non-current prepayments relate to advance payments on equipment for the Gakara project.

20
8. Trade and other payables US$’000
Balance at 31 December 2017
Balance at 31 December 2016
Balance at 30 June 2017
Unaudited Unaudited Audited
Trade payable 285 149 61 Accrued expenses 68 266 64 Payroll and other taxes 7 23 17 Amounts due to staff and management 4 472 135 Pension contributions - - 10 Amounts owed to shareholders - 190 126 Other payables 1 16 16
Total trade and other payables 365 1,116 429 During the six months to 31 December 2017, a number of amounts due to staff and shareholders, which had been incurred during the early stages of the Group’s development, were settled (see note 11). 9. Short-term borrowings Short-term borrowings of US$0.3 million (31 December 2016: US$2.0 million) included a US$278k overdraft with Finbank Ltd, the Company’s bankers in Burundi. This short-term facility is denominated in Burundian Francs (BIF), and is secured over the mining and plant assets of the Gakara project. Interest on this facility is charged at 14%. Borrowings at 31 December 2016 consisted of a loan facility from Pala Investments Limited of US$1.50 million (principal) plus a further unsecured loan facility of US$0.25 million from Alpha Future Investments Limited. Both these facilities were repaid in full following the IPO in January 2017. 10. Share capital In December 2017, the Company allotted 20 million new ordinary shares at a price of 14 pence per share, raising gross proceeds of £2.8 million (US$3.75 million). Subscription proceeds of US$0.3 million were received early in January 2018, and were recorded under Other Receivables at 31 December 2017. Transaction costs and commission on this placement amounted to approximately US$0.2 million.

21
11. Related party transactions
6 months to
31 December 2017 6 months to
31 December 2016 12 months to 30
June 2017
US$’000
Charged in period
Paid in period
Balance as at 31
December
Charged in period
Paid in period
Balance as at 31
December
Charged in year
Balance as at 30
June
Related party
Description
Artemis Trustees Limited
13 (89) - 24 - 144 56 76 R Sinclair Company secretarial services to the Group
Alexander Lowrie - - - - - - 88 - A Lowrie Shares allotted as underwriting discount at IPO
Arc Securities - - 20 - - 20 - 20 A Pouroulis Advance to the Company
Atul Bali - - - - - - 42 - A Bali Shares allotted for equity raised at IPO
Gilbert Midende 24 (22) 4 48 (37) 115 34 2 G Midende Rental for staff accommodation and land
Martin Eales - (122) - - - 125 - 122 M Eales Settlement for waiver of profit-share agreement
Pella Resources Limited
- (43) - 3 - 40 20 43 A Pouroulis London office rental
Uvumbuzi Resources Limited
52 (60) - 23 (22) 71 54 8 C Morelli Exploration activity at Gakara
Benzu Minerals - - - 21 (33) 12 12 - C Morelli Exploration activity
89 (336) 24 119 (92) 527 306 271
The above table does not include remuneration of Directors and senior management
The historic balances owing to Martin Eales, and Pella Resources Limited were settled in cash the period. Artemis Trustees Limited, in which R Sinclair holds an interest, provided company secretarial services, which were settled in cash, together with balances due in respect of historic invoices, during the period. G Midende provided accommodation for staff as well as land at Kabezi for the plant site. Uvumbuzi Resources Limited, in which C Morelli holds an interest, provided exploration activities to the Company during the period of US$52k. These services were settled in cash during the year. All of the balances due to related parties at the period end are intended to be settled in cash. All amounts due to related parties are unsecured. 12. Post balance sheet events There were no post balance sheet events. 13. Capital commitments On 10 March 2017, the Company entered into an agreement with Obsideo Consulting Pty Ltd for the design, supply, and installation of a rare earths concentrator plant, for a total of ZAR 23.3 million (US$1.8 million). As at 31 December 2017, a total of US$1.5 million had been incurred under this contract, therefore US$0.3 million should be considered a capital commitment at the period end. 14. Contingent liabilities There were no contingent liabilities at 31 December 2017 (30 June 2017: nil).