Interim Unaudited Financial Statements with Management ...
38
ABOITIZ POWER CORPORATION Interim Unaudited Financial Statements with Management Discussion and Analysis for the First Quarter of 2015
Transcript of Interim Unaudited Financial Statements with Management ...

ABOITIZ POWER CORPORATION
Interim Unaudited Financial Statements with Management Discussion and Analysis
for the First Quarter of 2015
2
PART I--FINANCIAL INFORMATION
Item 1. Financial Statements. Please refer to the financial statements and schedules attached herewith. Management's Discussion and Analysis of Financial Condition and Results of Operations. The following discussion and analysis of Aboitiz Power Corporation’s (AboitizPower or the Company) consolidated financial condition and results of operations should be read in conjunction with the consolidated financial statements and accompanying schedules and disclosures set forth elsewhere in this report.
Key Performance Indicators Management uses the following indicators to evaluate the performance of the Company and its subsidiaries (the Company and its subsidiaries are hereinafter collectively referred to as the “Group”):
1. Share in Net Earnings of Associates. Share in net earnings (losses) of associates represents the Group's share in the undistributed earnings or losses of its investees for each reporting period subsequent to acquisition of said investment. Share in Net Earnings of Associates indicates profitability of the investment and investees' contribution to the Group's net income.
Manner of Computation:
Investee's Net Income (Loss) x Investor's % ownership - Goodwill Impairment Cost
2. Earnings before Interest, Taxes, Depreciation and Amortization (EBITDA). The Company computes EBITDA as earnings before extra-ordinary items, net finance expense, income tax provision, depreciation and amortization. It provides management and investors with a tool for determining the ability of the Group to generate cash from operations to cover financial charges and income taxes. It is also a measure to evaluate the Group’s ability to service its debts.
3. Cash Flow Generated. Using the Statement of Cash Flows, management determines
the sources and usage of funds for the period and analyzes how the Group manages its profit and uses its internal and external sources of capital. This aids management in identifying the impact on cash flow when the Group's activities are in a state of growth or decline, and in evaluating management's efforts to control the impact.
4. Current Ratio. Current ratio is a measurement of liquidity, calculated by dividing total
current assets by total current liabilities. It is an indicator of the Group's short-term debt paying ability. The higher the ratio, the more liquid the Group.
5. Debt–to–Equity Ratio. Debt-to-Equity ratio gives an indication of how leveraged the
Group is. It compares assets provided by creditors to assets provided by shareholders. It is determined by dividing total debt by stockholders' equity.
3
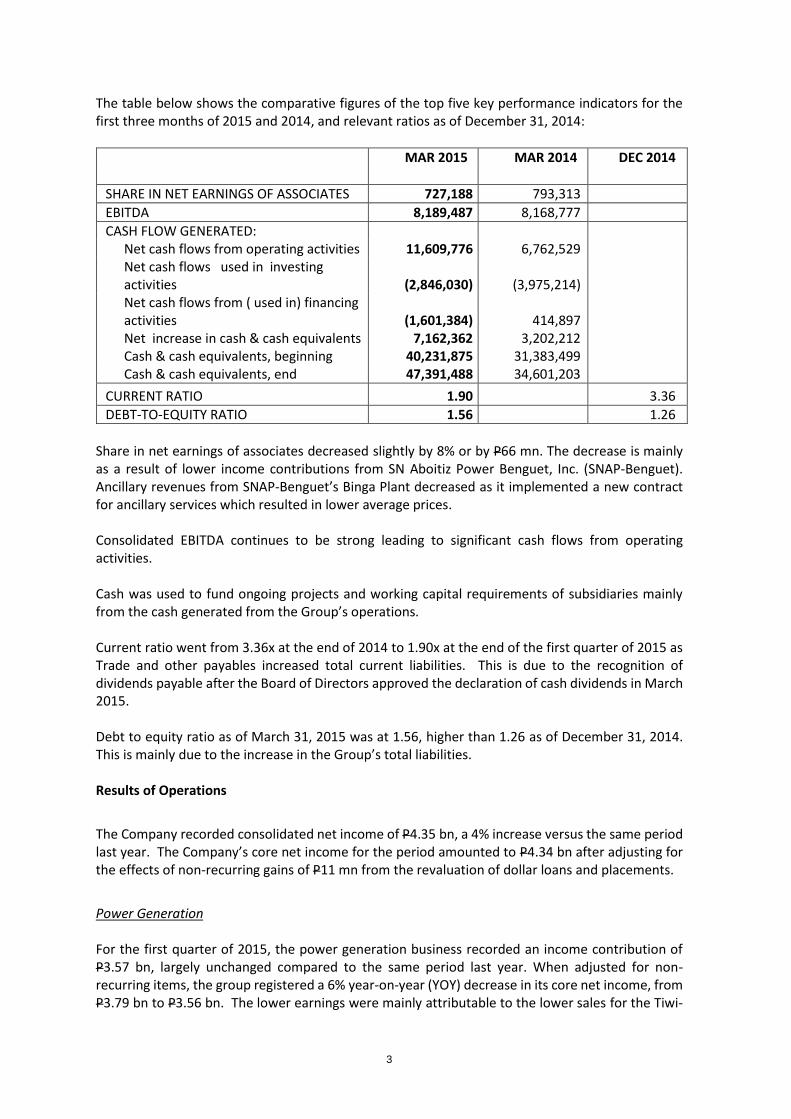
The table below shows the comparative figures of the top five key performance indicators for the first three months of 2015 and 2014, and relevant ratios as of December 31, 2014:
MAR 2015 MAR 2014 DEC 2014
SHARE IN NET EARNINGS OF ASSOCIATES 727,188 793,313
EBITDA 8,189,487 8,168,777
CASH FLOW GENERATED: Net cash flows from operating activities 11,609,776 6,762,529 Net cash flows used in investing
activities (2,846,030) (3,975,214) Net cash flows from ( used in) financing
activities (1,601,384) 414,897 Net increase in cash & cash equivalents 7,162,362 3,202,212 Cash & cash equivalents, beginning 40,231,875 31,383,499 Cash & cash equivalents, end 47,391,488 34,601,203
CURRENT RATIO 1.90 3.36
DEBT-TO-EQUITY RATIO 1.56 1.26
Share in net earnings of associates decreased slightly by 8% or by P66 mn. The decrease is mainly as a result of lower income contributions from SN Aboitiz Power Benguet, Inc. (SNAP-Benguet). Ancillary revenues from SNAP-Benguet’s Binga Plant decreased as it implemented a new contract for ancillary services which resulted in lower average prices.
Consolidated EBITDA continues to be strong leading to significant cash flows from operating activities. Cash was used to fund ongoing projects and working capital requirements of subsidiaries mainly from the cash generated from the Group’s operations. Current ratio went from 3.36x at the end of 2014 to 1.90x at the end of the first quarter of 2015 as Trade and other payables increased total current liabilities. This is due to the recognition of dividends payable after the Board of Directors approved the declaration of cash dividends in March 2015. Debt to equity ratio as of March 31, 2015 was at 1.56, higher than 1.26 as of December 31, 2014. This is mainly due to the increase in the Group’s total liabilities. Results of Operations
The Company recorded consolidated net income of P4.35 bn, a 4% increase versus the same period last year. The Company’s core net income for the period amounted to P4.34 bn after adjusting for the effects of non-recurring gains of P11 mn from the revaluation of dollar loans and placements.
Power Generation For the first quarter of 2015, the power generation business recorded an income contribution of P3.57 bn, largely unchanged compared to the same period last year. When adjusted for non-recurring items, the group registered a 6% year-on-year (YOY) decrease in its core net income, from P3.79 bn to P3.56 bn. The lower earnings were mainly attributable to the lower sales for the Tiwi-
4
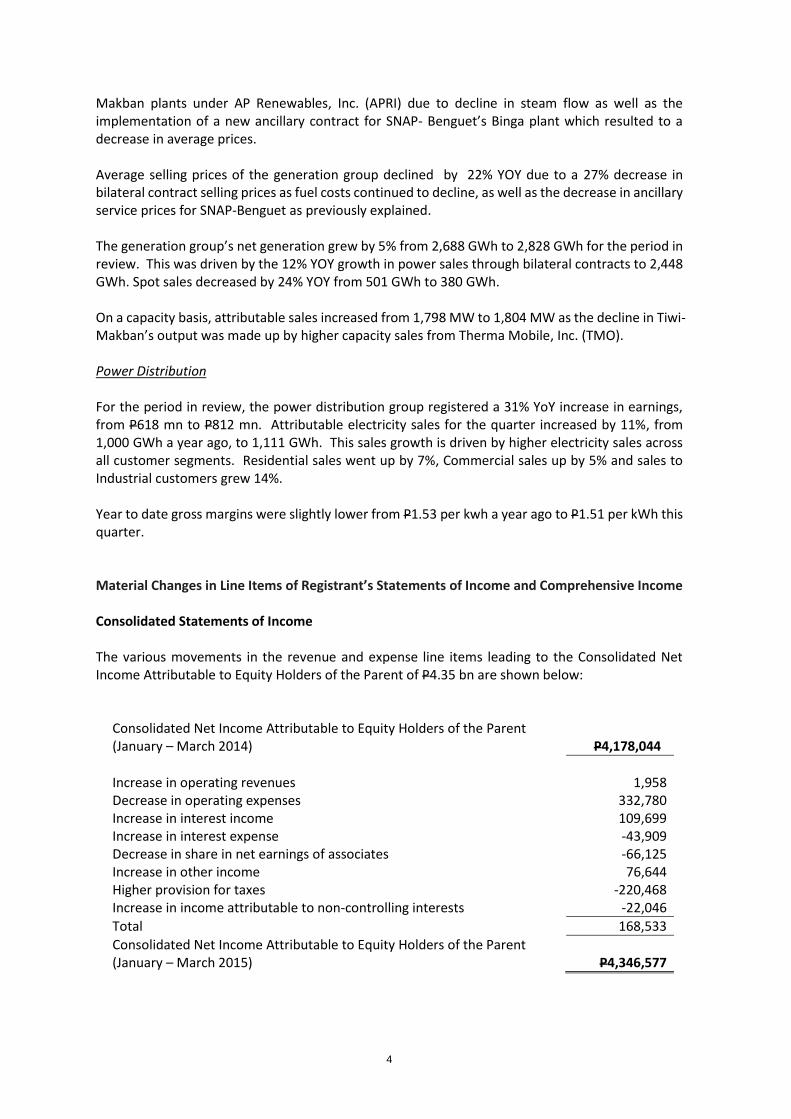
Makban plants under AP Renewables, Inc. (APRI) due to decline in steam flow as well as the implementation of a new ancillary contract for SNAP- Benguet’s Binga plant which resulted to a decrease in average prices. Average selling prices of the generation group declined by 22% YOY due to a 27% decrease in bilateral contract selling prices as fuel costs continued to decline, as well as the decrease in ancillary service prices for SNAP-Benguet as previously explained. The generation group’s net generation grew by 5% from 2,688 GWh to 2,828 GWh for the period in review. This was driven by the 12% YOY growth in power sales through bilateral contracts to 2,448 GWh. Spot sales decreased by 24% YOY from 501 GWh to 380 GWh. On a capacity basis, attributable sales increased from 1,798 MW to 1,804 MW as the decline in Tiwi-Makban’s output was made up by higher capacity sales from Therma Mobile, Inc. (TMO). Power Distribution For the period in review, the power distribution group registered a 31% YoY increase in earnings, from P618 mn to P812 mn. Attributable electricity sales for the quarter increased by 11%, from 1,000 GWh a year ago, to 1,111 GWh. This sales growth is driven by higher electricity sales across all customer segments. Residential sales went up by 7%, Commercial sales up by 5% and sales to Industrial customers grew 14%. Year to date gross margins were slightly lower from P1.53 per kwh a year ago to P1.51 per kWh this quarter. Material Changes in Line Items of Registrant’s Statements of Income and Comprehensive Income Consolidated Statements of Income The various movements in the revenue and expense line items leading to the Consolidated Net Income Attributable to Equity Holders of the Parent of P4.35 bn are shown below:
Consolidated Net Income Attributable to Equity Holders of the Parent (January – March 2014) P4,178,044
Increase in operating revenues 1,958 Decrease in operating expenses 332,780 Increase in interest income 109,699 Increase in interest expense -43,909 Decrease in share in net earnings of associates -66,125 Increase in other income 76,644 Higher provision for taxes -220,468 Increase in income attributable to non-controlling interests -22,046
Total 168,533
Consolidated Net Income Attributable to Equity Holders of the Parent (January – March 2015) P4,346,577
5
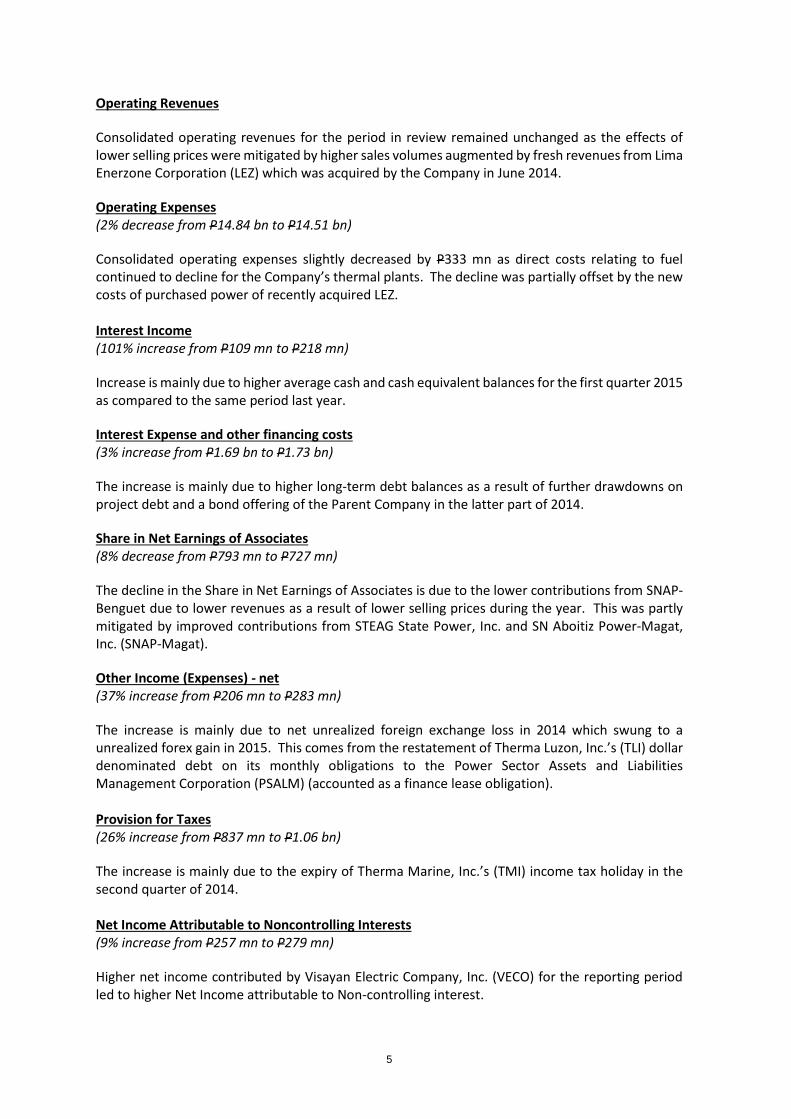
Operating Revenues
Consolidated operating revenues for the period in review remained unchanged as the effects of lower selling prices were mitigated by higher sales volumes augmented by fresh revenues from Lima Enerzone Corporation (LEZ) which was acquired by the Company in June 2014.
Operating Expenses (2% decrease from P14.84 bn to P14.51 bn)
Consolidated operating expenses slightly decreased by P333 mn as direct costs relating to fuel continued to decline for the Company’s thermal plants. The decline was partially offset by the new costs of purchased power of recently acquired LEZ. Interest Income (101% increase from P109 mn to P218 mn)
Increase is mainly due to higher average cash and cash equivalent balances for the first quarter 2015 as compared to the same period last year.
Interest Expense and other financing costs (3% increase from P1.69 bn to P1.73 bn)
The increase is mainly due to higher long-term debt balances as a result of further drawdowns on project debt and a bond offering of the Parent Company in the latter part of 2014.
Share in Net Earnings of Associates (8% decrease from P793 mn to P727 mn)
The decline in the Share in Net Earnings of Associates is due to the lower contributions from SNAP-Benguet due to lower revenues as a result of lower selling prices during the year. This was partly mitigated by improved contributions from STEAG State Power, Inc. and SN Aboitiz Power-Magat, Inc. (SNAP-Magat).
Other Income (Expenses) - net (37% increase from P206 mn to P283 mn)
The increase is mainly due to net unrealized foreign exchange loss in 2014 which swung to a unrealized forex gain in 2015. This comes from the restatement of Therma Luzon, Inc.’s (TLI) dollar denominated debt on its monthly obligations to the Power Sector Assets and Liabilities Management Corporation (PSALM) (accounted as a finance lease obligation). Provision for Taxes (26% increase from P837 mn to P1.06 bn)
The increase is mainly due to the expiry of Therma Marine, Inc.’s (TMI) income tax holiday in the second quarter of 2014. Net Income Attributable to Noncontrolling Interests (9% increase from P257 mn to P279 mn)
Higher net income contributed by Visayan Electric Company, Inc. (VECO) for the reporting period led to higher Net Income attributable to Non-controlling interest.
6
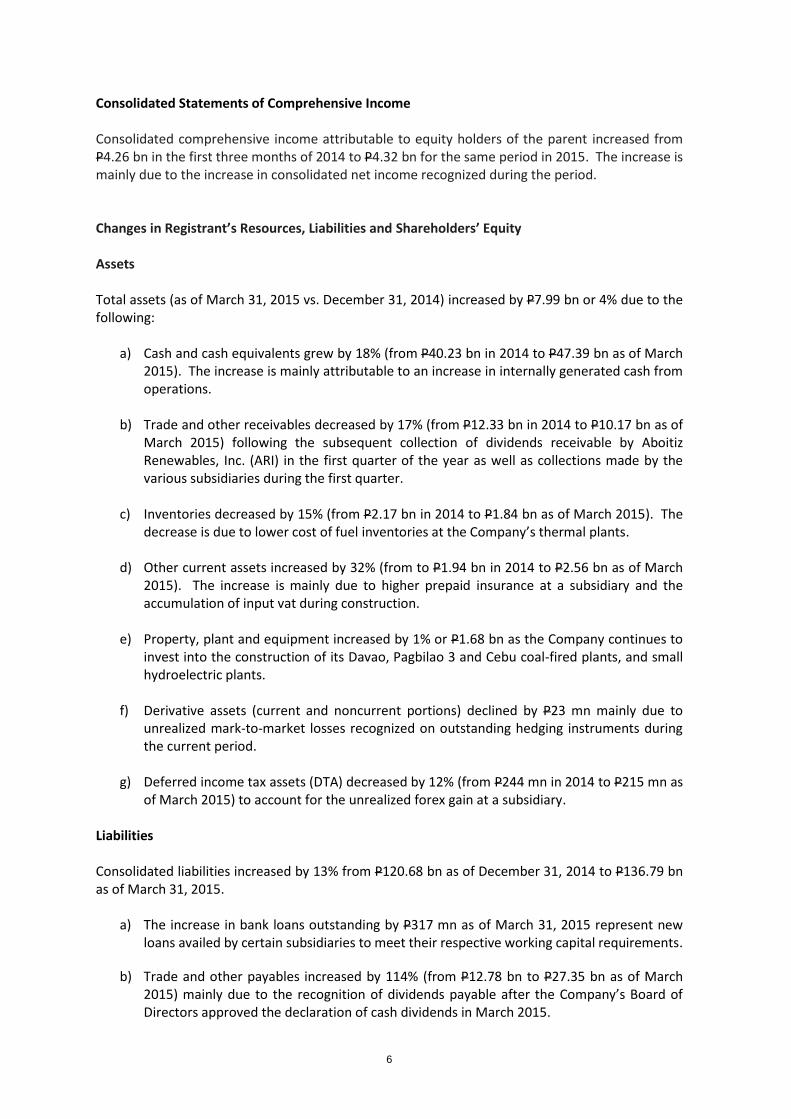
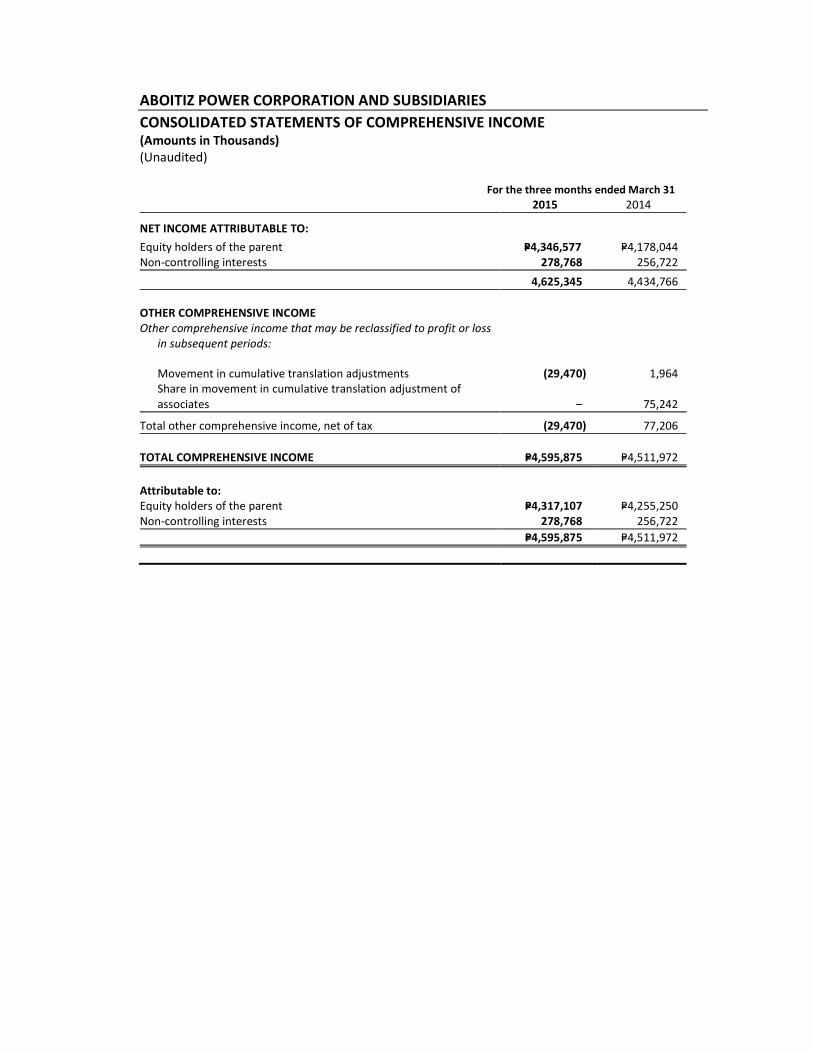
Consolidated Statements of Comprehensive Income Consolidated comprehensive income attributable to equity holders of the parent increased from P4.26 bn in the first three months of 2014 to P4.32 bn for the same period in 2015. The increase is mainly due to the increase in consolidated net income recognized during the period. Changes in Registrant’s Resources, Liabilities and Shareholders’ Equity Assets Total assets (as of March 31, 2015 vs. December 31, 2014) increased by P7.99 bn or 4% due to the following:
a) Cash and cash equivalents grew by 18% (from P40.23 bn in 2014 to P47.39 bn as of March 2015). The increase is mainly attributable to an increase in internally generated cash from operations.
b) Trade and other receivables decreased by 17% (from P12.33 bn in 2014 to P10.17 bn as of
March 2015) following the subsequent collection of dividends receivable by Aboitiz Renewables, Inc. (ARI) in the first quarter of the year as well as collections made by the various subsidiaries during the first quarter.
c) Inventories decreased by 15% (from P2.17 bn in 2014 to P1.84 bn as of March 2015). The decrease is due to lower cost of fuel inventories at the Company’s thermal plants.
d) Other current assets increased by 32% (from to P1.94 bn in 2014 to P2.56 bn as of March
2015). The increase is mainly due to higher prepaid insurance at a subsidiary and the accumulation of input vat during construction.
e) Property, plant and equipment increased by 1% or P1.68 bn as the Company continues to
invest into the construction of its Davao, Pagbilao 3 and Cebu coal-fired plants, and small hydroelectric plants.
f) Derivative assets (current and noncurrent portions) declined by P23 mn mainly due to
unrealized mark-to-market losses recognized on outstanding hedging instruments during the current period.
g) Deferred income tax assets (DTA) decreased by 12% (from P244 mn in 2014 to P215 mn as
of March 2015) to account for the unrealized forex gain at a subsidiary. Liabilities Consolidated liabilities increased by 13% from P120.68 bn as of December 31, 2014 to P136.79 bn as of March 31, 2015.
a) The increase in bank loans outstanding by P317 mn as of March 31, 2015 represent new loans availed by certain subsidiaries to meet their respective working capital requirements.
b) Trade and other payables increased by 114% (from P12.78 bn to P27.35 bn as of March 2015) mainly due to the recognition of dividends payable after the Company’s Board of Directors approved the declaration of cash dividends in March 2015.
7
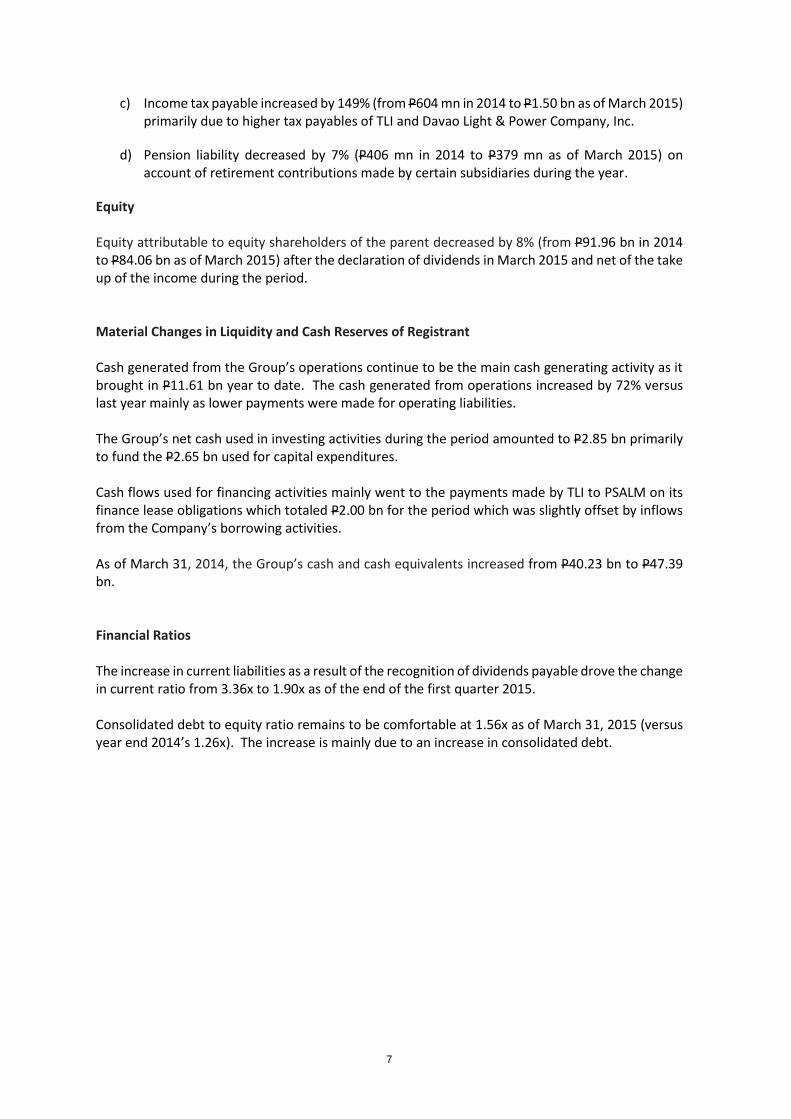
c) Income tax payable increased by 149% (from P604 mn in 2014 to P1.50 bn as of March 2015) primarily due to higher tax payables of TLI and Davao Light & Power Company, Inc.
d) Pension liability decreased by 7% (P406 mn in 2014 to P379 mn as of March 2015) on account of retirement contributions made by certain subsidiaries during the year.
Equity Equity attributable to equity shareholders of the parent decreased by 8% (from P91.96 bn in 2014 to P84.06 bn as of March 2015) after the declaration of dividends in March 2015 and net of the take up of the income during the period. Material Changes in Liquidity and Cash Reserves of Registrant Cash generated from the Group’s operations continue to be the main cash generating activity as it brought in P11.61 bn year to date. The cash generated from operations increased by 72% versus last year mainly as lower payments were made for operating liabilities. The Group’s net cash used in investing activities during the period amounted to P2.85 bn primarily to fund the P2.65 bn used for capital expenditures. Cash flows used for financing activities mainly went to the payments made by TLI to PSALM on its finance lease obligations which totaled P2.00 bn for the period which was slightly offset by inflows from the Company’s borrowing activities. As of March 31, 2014, the Group’s cash and cash equivalents increased from P40.23 bn to P47.39 bn. Financial Ratios The increase in current liabilities as a result of the recognition of dividends payable drove the change in current ratio from 3.36x to 1.90x as of the end of the first quarter 2015. Consolidated debt to equity ratio remains to be comfortable at 1.56x as of March 31, 2015 (versus year end 2014’s 1.26x). The increase is mainly due to an increase in consolidated debt.

Aboitiz Power Corporation and Subsidiaries
Unaudited Consolidated Financial Statements
As of March 31, 2015 (with Comparative Figures as of December 31, 2014) and
For the Three-Month Period Ended March 31, 2015 and 2014

ABOITIZ POWER CORPORATION AND SUBSIDIARIES
CONSOLIDATED BALANCE SHEETS (Amounts in Thousands)
March 31, 2015
(Unaudited)
December 31, 2014
(Audited)
ASSETS
Current Assets
Cash and cash equivalents P=47,391,488 P=40,231,875
Trade and other receivables 10,174,980 12,332,513
Derivative assets 48,935 53,500
Inventories 1,841,584 2,168,832
Other current assets 2,559,122 1,939,369
Total Current Assets 62,016,109 56,726,089
Noncurrent Assets
Investments in and advances to associates 25,507,501 24,816,278
Property, plant and equipment 121,331,405 119,646,640
Intangible asset - service concession rights 3,383,160 3,400,354
Derivative asset - noncurrent portion 40,197 59,044
Investment property 28,300 28,300
Available-for-sale (AFS) investments - net of impairment of P=5,254 3,620 3,620
Goodwill 1,094,687 1,094,687
Net pension assets 79,000 79,000
Deferred income tax assets 215,043 243,756
Other noncurrent assets 11,053,457 10,663,253
Total Noncurrent Assets 162,736,370 160,034,932
TOTAL ASSETS P=224,752,479 P=216,761,021
LIABILITIES AND EQUITY
Current Liabilities
Current portions of:
Long-term debts P=1,386,870 P=1,388,991
Finance lease obligation 1,971,739 1,971,739
Long-term obligation on power distribution system 40,000 40,000
Bank loans 420,000 103,000
Trade and other payables 27,349,873 12,778,001
Derivative liabilities 10,277 -
Income tax payable 1,504,643 604,158
Total Current Liabilities 32,683,402 16,885,889
(Forward)

- 2 -
March 31, 2015
(Unaudited)
December 31, 2014
(Audited)
Noncurrent Liabilities
Noncurrent portions of:
Long-term debts P=42,129,437 P=41,394,084
Finance lease obligation 51,963,342 52,489,282
Long-term obligation on power distribution system 223,807 216,015
Customers’ deposits 5,766,127 5,686,490
Asset retirement obligation 2,378,881 2,353,250
Net pension liabilities 378,790 405,854
Deferred income tax liabilities 1,266,877 1,249,717
Total Noncurrent Liabilities 104,107,261 103,794,692
Total Liabilities 136,790,663 120,680,581
Equity Attributable to Equity Holders of the Parent
Capital stock 7,358,604 7,358,604
Additional paid-in capital 12,588,894 12,588,894
Share in net unrealized valuation gains on AFS
investments of an associate 119,087 119,087
Cumulative translation adjustments 8,621 38,091
Share in cumulative translation adjustments of associates (375,489) (375,489)
Actuarial losses on defined benefit plans (519,854) (519,854)
Share in actuarial losses on defined benefit plans of associates (48,589) (48,589)
Acquisition of non-controlling interests (259,147) (259,147)
Excess of cost over net assets of investments (421,260) (421,260)
Retained earnings
Appropriated 20,900,000 20,900,000
Unappropriated 44,713,049 52,581,755
84,063,916 91,962,092
Non-controlling Interests 3,897,900 4,118,348
Total Equity 87,961,816 96,080,440
TOTAL LIABILITIES AND EQUITY P=224,752,479 P=216,761,021

ABOITIZ POWER CORPORATION AND SUBSIDIARIES
CONSOLIDATED STATEMENTS OF INCOME (Amounts in Thousands, Except Earnings Per Share Amounts)
(Unaudited)
For the three months ended March 31
2015 2014
OPERATING REVENUES P=20,701,643 P=20,699,685
OPERATING EXPENSES 14,512,177 14,844,957
FINANCIAL INCOME (EXPENSES)
Interest income 218,262 108,563
Interest expense and other financing costs (1,734,877) (1,690,968)
(1,516,615) (1,582,405)
OTHER INCOME (EXPENSES)
Share in net earnings of associates 727,188 793,313
Others - net 283,130 206,486
1,010,318 999,799
INCOME BEFORE INCOME TAX 5,683,169 5,272,122
PROVISION FOR INCOME TAX 1,057,824 837,356
NET INCOME P=4,625,345 P=4,434,766
Attributable to:
Equity holders of the parent P=4,346,577 P=4,178,044
Non-controlling interests 278,768 256,722
P=4,625,345 P=4,434,766
EARNINGS PER COMMON SHARE
Basic and diluted, income for the period attributable to ordinary
equity holders
of the parent P=0.59 P=0.57
See Disclosure I for the computation of Earnings per Common Share.
ABOITIZ POWER CORPORATION AND SUBSIDIARIES
CONSOLIDATED STATEMENTS OF COMPREHENSIVE INCOME (Amounts in Thousands)
(Unaudited)
For the three months ended March 31
2015 2014
NET INCOME ATTRIBUTABLE TO:
Equity holders of the parent P=4,346,577 P=4,178,044
Non-controlling interests 278,768 256,722
4,625,345 4,434,766
OTHER COMPREHENSIVE INCOME
Other comprehensive income that may be reclassified to profit or loss
in subsequent periods:
Movement in cumulative translation adjustments (29,470) 1,964
Share in movement in cumulative translation adjustment of
associates – 75,242
Total other comprehensive income, net of tax (29,470) 77,206
TOTAL COMPREHENSIVE INCOME P=4,595,875 P=4,511,972
Attributable to:
Equity holders of the parent P=4,317,107 P=4,255,250
Non-controlling interests 278,768 256,722
P=4,595,875 P=4,511,972
*SGVFS004072*
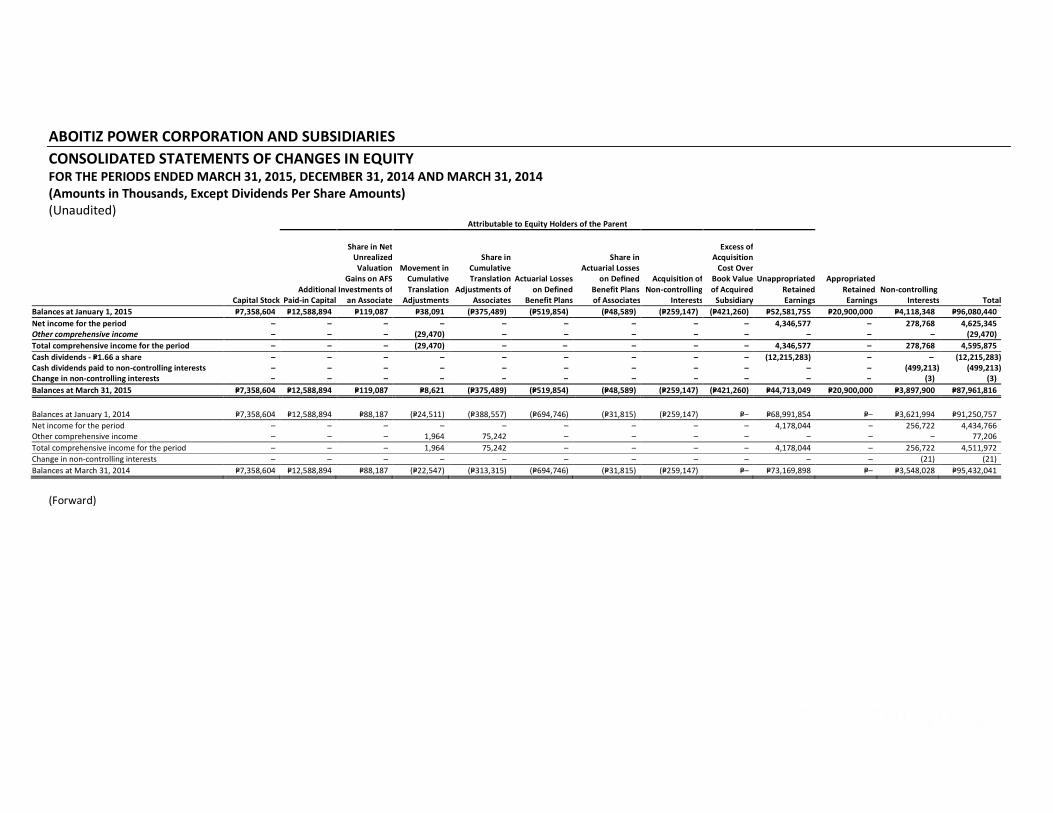
ABOITIZ POWER CORPORATION AND SUBSIDIARIES
CONSOLIDATED STATEMENTS OF CHANGES IN EQUITY FOR THE PERIODS ENDED MARCH 31, 2015, DECEMBER 31, 2014 AND MARCH 31, 2014
(Amounts in Thousands, Except Dividends Per Share Amounts)
(Unaudited) Attributable to Equity Holders of the Parent
Capital Stock
Additional
Paid-in Capital
Share in Net
Unrealized
Valuation
Gains on AFS
Investments of
an Associate
Movement in
Cumulative
Translation
Adjustments
Share in
Cumulative
Translation
Adjustments of
Associates
Actuarial Losses
on Defined
Benefit Plans
Share in
Actuarial Losses
on Defined
Benefit Plans
of Associates
Acquisition of
Non-controlling
Interests
Excess of
Acquisition
Cost Over
Book Value
of Acquired
Subsidiary
Unappropriated
Retained
Earnings
Appropriated
Retained
Earnings
Non-controlling
Interests Total
Balances at January 1, 2015 P=7,358,604 P=12,588,894 P=119,087 P=38,091 (P=375,489) (P=519,854) (P=48,589) (P=259,147) (P=421,260) P=52,581,755 P=20,900,000 P=4,118,348 P=96,080,440
Net income for the period – – – – – – – – – 4,346,577 – 278,768 4,625,345
Other comprehensive income – – – (29,470) – – – – – – – – (29,470)
Total comprehensive income for the period – – – (29,470) – – – – – 4,346,577 – 278,768 4,595,875
Cash dividends - P=1.66 a share – – – – – – – – – (12,215,283) – – (12,215,283)
Cash dividends paid to non-controlling interests – – – – – – – – – – – (499,213) (499,213)
Change in non-controlling interests – – – – – – – – – – – (3) (3)
Balances at March 31, 2015 P=7,358,604 P=12,588,894 P=119,087 P=8,621 (P=375,489) (P=519,854) (P=48,589) (P=259,147) (P=421,260) P=44,713,049 P=20,900,000 P=3,897,900 P=87,961,816
Balances at January 1, 2014 P=7,358,604 P=12,588,894 P=88,187 (P=24,511) (P=388,557) (P=694,746) (P=31,815) (P=259,147) P=– P=68,991,854 P=– P=3,621,994 P=91,250,757
Net income for the period – – – – – – – – – 4,178,044 – 256,722 4,434,766
Other comprehensive income – – – 1,964 75,242 – – – – – – – 77,206
Total comprehensive income for the period – – – 1,964 75,242 – – – – 4,178,044 – 256,722 4,511,972
Change in non-controlling interests – – – – – – – – – – – (21) (21)
Balances at March 31, 2014 P=7,358,604 P=12,588,894 P=88,187 (P=22,547) (P=313,315) (P=694,746) (P=31,815) (P=259,147) P=– P=73,169,898 P=– P=3,548,028 P=95,432,041
(Forward)

*SGVFS004072*
- 2 -
Attributable to Equity Holders of the Parent
Capital Stock
Additional
Paid-in
Capital
Share in Net
Unrealized Valuation
Gains on AFS
Investments of an
Associate
Movement in
Cumulative
Translation
Adjustments
Share in
Cumulative
Translation
Adjustments of
Associates
Actuarial
Losses on
Defined Benefit
Plans
Share in
Actuarial Losses
on Defined
Benefit Plans of
Associates
Acquisition of
Non-controlling
Interests
Excess of
Acquisition Cost
Over Book Value
of Acquired
Subsidiary
Unappropriated
Retained
Earnings
Appropriated
Retained
Earnings
Non-controlling
Interests
Total
Balances at January 1, 2014 P=7,358,604 P=12,588,894 P=88,187 (P=24,511) (P=388,557) (P=694,746) (P=31,815) (P=259,147) P=– P=68,991,854 P=– P=3,621,994 P=91,250,757
Net income for the year – – – – – – – – – 16,705,184 – 1,300,717 18,005,901
Other comprehensive income(loss) – – 30,900 62,602 13,068 174,892 (16,774) – – – – (4,648) 260,040
Total comprehensive income (loss)for the year – – 30,900 62,602 13,068 174,892 (16,774) – – 16,705,184 – 1,296,069 18,265,941
Acquisition of subsidiary – – – – – – – – (421,260) – – – (421,260)
Cash dividends - P=1.66 a share – – – – – – – – – (12,215,283) – – (12,215,283)
Cash dividends paid to non-controlling
interests – – – – – – – – – – – (1,141,673) (1,141,673)
Appropriation during the year – – – – – – – – – (20,900,000) 20,900,000 – –
Change in non-controlling interests – – – – – – – – – – – 341,958 341,958
Balances at December 31, 2014 P=7,358,604 P=12,588,894 P=119,087 P=38,091 (P=375,489) (P=519,854) (P=48,589) (P=259,147) (P=421,260) P=52,581,755 P=20,900,000 P=4,118,348 P=96,080,440

*SGVFS004072*
ABOITIZ POWER CORPORATION AND SUBSIDIARIES
CONSOLIDATED STATEMENTS OF CASH FLOWS (Amounts in Thousands)
(Unaudited) For the three months ended March 31
2015 2014
CASH FLOWS FROM OPERATING ACTIVITIES
Income before income tax P=5,683,169 P=5,272,122
Adjustments for:
Interest expense and other financing costs 1,734,877 1,690,968
Depreciation and amortization 1,005,154 1,058,421
Net unrealized foreign exchange losses (gains) (12,123) 248,498
Amortization of software 2,443 5,151
Write-off of project costs and others 228 –
Unrealized fair valuation loss (gain) on derivatives – 257
Gain on sale of property, plant and equipment 181 234
Interest income (218,262) (108,563)
Share in net earnings of associates (727,188) (793,313)
Operating income before working capital changes 7,468,479 7,373,775
Increase in operating assets 1,911,962 505,035
Increase in operating liabilities 2,376,880 (1,197,213)
Cash provided by operations 11,757,321 6,681,597
Income and final taxes paid (147,545) 80,932
Net cash flows from operating activities 11,609,776 6,762,529
CASH FLOWS FROM INVESTING ACTIVITIES
Cash dividends received 35,965 941,874
Interest received 148,324 112,173
Additions to property, plant and equipment (2,645,341) (4,237,651)
Additions to intangible assets – service concession rights (6,795) (5,730)
Increase in other noncurrent assets (378,183) (785,880)
Net cash flows used in investing activities (2,846,030) (3,975,214)
CASH FLOWS FROM FINANCING ACTIVITIES
Net proceeds (payment) of bank loans 317,000 –
Net proceeds (payment) of long-term debt 723,000 2,679,482
Payments of finance lease obligation (1,996,232) (1,728,343)
Changes in non-controlling interests (499,213) (330,667)
Interest paid (145,939) (205,575)
Net cash flows from (used in) financing activities (1,601,384) 414,897
NET INCREASE (DECREASE) IN CASH AND CASH EQUIVALENTS 7,162,362 3,202,212
EFFECT OF EXCHANGE RATE CHANGES ON CASH AND CASH EQUIVALENTS (2,749) 15,492
CASH AND CASH EQUIVALENTS AT BEGINNING OF THE PERIOD 40,231,875 31,383,499
CASH AND CASH EQUIVALENTS ATEND OF THE PERIOD P=47,391,488 P=34,601,203

- 9 -
*SGVFS004072*
ABOITIZ POWER CORPORATION AND SUBSIDIARIES
CONSOLIDATED FINANCIAL STATEMENTS SCHEDULES AND DISCLOSURES (Amounts in Thousands, Except Earnings per Share and Exchange Rate Data and When Otherwise Indicated)
A. Components of Other Comprehensive Income
Jan-Mar
2015
Jan-Mar
2014
Share in movement in cumulative translation adjustments of associates P=– P=75,242
Movement in cumulative translation adjustments (29,470) 1,964
Other comprehensive income (loss) for the period – net of tax (P=29,470) P=77,206
B. Tax Effects Relating to Each Component of Other Comprehensive Income
Jan-Mar 2015
Before-Tax Tax (Expense) Net-of-Tax
Amount Benefit Amount
Share in movement in cumulative translation adjustments of
associates P=– P=– P=–
Movement in cumulative translation adjustments (29,470) – (29,470)
Other comprehensive income (loss) for the period (P=29,470) P=– (P=29,470)
Jan-Mar 2014
Before-Tax Tax (Expense) Net-of-Tax
Amount Benefit Amount
Share in movement in cumulative translation adjustments of
associates P=75,242 P=– P=75,242
Movement in cumulative translation adjustments 1,964 – 1,964
Other comprehensive income (loss) for the period P=77,206 P=– P=77,206
C. Investments in and Advances to Associates
March31, 2015 December 31, 2014
Acquisition cost:
Balance at beginning of the year P=18,118,354 P=18,142,549
Additions during the year – 2,500
Disposals during the year – (26,695)
Balance at end of year 18,118,354 18,118,354
Accumulated equity in net earnings:
Balance at beginning of the year 7,253,461 7,668,703
Share in net earnings 727,188 4,009,488
Dividends received or receivable (35,965) (4,424,730)
Balance at end of year 7,944,684 7,253,461
Share in cumulative translation adjustments of associates (375,489) (375,489)
Share in actuarial losses of associates (48,589) (48,589)
Share in unrealized valuation gain on AFS investment of an associate 119,087 119,087
25,758,047 25,066,824
Less allowance for impairment loss 568,125 568,125
Investments in associates at equity 25,189,922 24,498,699
Advances to associates 317,579 317,579
P=25,507,501 P=24,816,278

- 10 -
*SGVFS004072*
The Group’s associates and the corresponding equity ownership are as follows:
% Ownership
Nature of Business March 31, 2015
MORE Holding company 83.33
SN Aboitiz Power-Magat, Inc. Power generation 50.00
SN Aboitiz Power-Benguet, Inc. Power generation 50.00
East Asia Utilities Corporation Power generation 50.00
Hijos de F. Escaño, Inc. Holding company 46.73
San Fernando Electric Light & Power Co., Inc. Power distribution 43.78
Pampanga Energy Ventures, Inc. Holding company 42.84
STEAG State Power, Inc. Power generation 34.00
AEV Aviation, Inc. Service 26.69
Cebu Energy Development Corp. Power generation 26.40
Redondo Peninsula Energy, Inc. Power generation 25.00
Southern Philippines Power Corporation Power generation 20.00
Western Mindanao Power Corporation Power generation 20.00
D. Joint Operations
Percentage of
Ownership
Name of Joint Operation Nature of Business March 31, 2015
Pagbilao Energy Corporation (PEC) Power generation 50.00
* PEC’s principal place of business and country of incorporation is the Philippines;
No commercial operations as of March 31, 2015.
The Group’s share of assets, liabilities, revenue, expenses and cash flows of joint operations are
included in the consolidated financial statements on a line-by-line basis.
E. Trade and Other Payables
March 31, 2015 December 31, 2014
Trade payables P=7,832,450 P=5,445,210
Dividends payable 12,215,283 33,363
Others 7,302,140 7,299,428
P=27,349,873 P=12,778,001
Trade payables are non-interest bearing and generally on 30-day terms.
Others include nontrade payables, accrued taxes and fees, withholding taxes and other accrued
expenses and are generally payable within 12 months from the balance sheet date.
F. Bank Loans
Interest Rate March 31, 2015
December 31, 2014
Peso loans – financial institutions - unsecured 2.50% P=420,000 P=–
Peso loans – financial institutions - unsecured 1.90% – 103,000
P=420,000 P=103,000
- 11 -
*SGVFS004072*
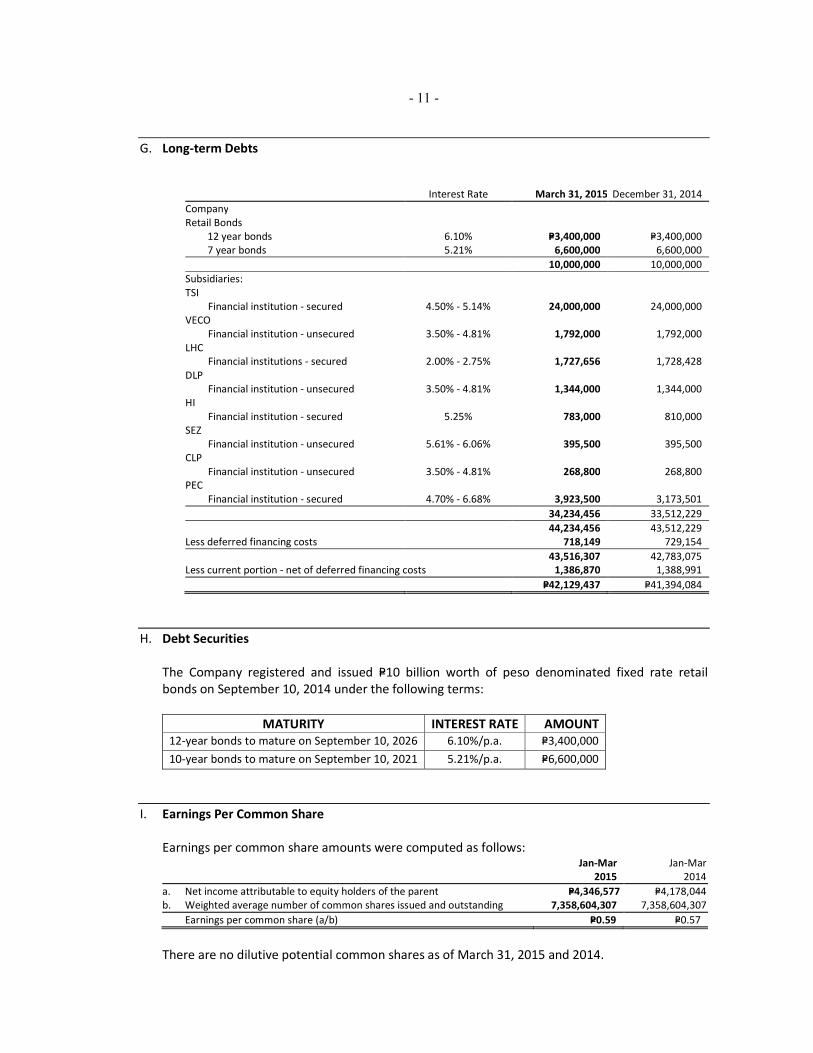
G. Long-term Debts
Interest Rate March 31, 2015
December 31, 2014
Company
Retail Bonds
12 year bonds 6.10% P=3,400,000 P=3,400,000
7 year bonds 5.21% 6,600,000 6,600,000
10,000,000 10,000,000
Subsidiaries:
TSI
Financial institution - secured 4.50% - 5.14% 24,000,000 24,000,000
VECO
Financial institution - unsecured 3.50% - 4.81% 1,792,000 1,792,000
LHC
Financial institutions - secured 2.00% - 2.75% 1,727,656 1,728,428
DLP
Financial institution - unsecured 3.50% - 4.81% 1,344,000 1,344,000
HI
Financial institution - secured 5.25% 783,000 810,000
SEZ
Financial institution - unsecured 5.61% - 6.06% 395,500 395,500
CLP
Financial institution - unsecured 3.50% - 4.81% 268,800 268,800
PEC
Financial institution - secured 4.70% - 6.68% 3,923,500 3,173,501
34,234,456 33,512,229
44,234,456 43,512,229
Less deferred financing costs 718,149 729,154
43,516,307 42,783,075
Less current portion - net of deferred financing costs 1,386,870 1,388,991
P=42,129,437 P=41,394,084
H. Debt Securities
The Company registered and issued P=10 billion worth of peso denominated fixed rate retail
bonds on September 10, 2014 under the following terms:
MATURITY INTEREST RATE AMOUNT
12-year bonds to mature on September 10, 2026 6.10%/p.a. P=3,400,000
10-year bonds to mature on September 10, 2021 5.21%/p.a. P=6,600,000
I. Earnings Per Common Share
Earnings per common share amounts were computed as follows:
Jan-Mar
2015
Jan-Mar
2014
a. Net income attributable to equity holders of the parent P=4,346,577 P=4,178,044
b. Weighted average number of common shares issued and outstanding 7,358,604,307 7,358,604,307
Earnings per common share (a/b) P=0.59 P=0.57
There are no dilutive potential common shares as of March 31, 2015 and 2014.
- 12 -
*SGVFS004072*
J. Operating Segment Information
Operating segments are components of the Group that engage in business activities from which
they may earn revenues and incur expenses, whose operating results are regularly reviewed by
the Group’s Chief Operating Decision Maker (CODM) to make decisions about how resources are
to be allocated to the segment and assess their performances, and for which discrete financial
information is available.
For purposes of management reporting, the Group’s operating businesses are organized and
managed separately according to services provided, with each segment representing a strategic
business segment. The Group’s identified operating segments, which are consistent with the
segments reported to the Board of Directors (BOD), which is the Group’s CODM, are as follows:
• “Power Generation” segment, which is engaged in the generation and supply of power to
various customers under power supply contracts, ancillary service procurement agreements
and for trading in WESM;
• “Power Distribution” segment, which is engaged in the distribution and sale of electricity to
the end-users; and
• “Parent Company and Others”, which includes the operations of the Company, retail
electricity sales to various off takers that are considered to be eligible contestable customers
and electricity related services of the Group such as installation of electrical equipment.
The Group has only one geographical segment as all of its assets are located in the Philippines.
The Group operates and derives principally all of its revenue from domestic operations. Thus,
geographical business information is not required.
Management monitors the operating results of its segments separately for the purpose of
making decisions about resource allocation and performance assessment. Segment revenue and
segment expenses are measured in accordance with PFRS. The presentation and classification of
segment revenue and segment expenses are consistent with the consolidated statement of
income. Interest expense and financing charges, depreciation and amortization expense and
income taxes are managed on a per segment basis.
The Group has inter-segment revenues in the form of management fees as well as inter-segment
sales of electricity which are eliminated in consolidation. The transfers are accounted for at
competitive market prices on an arm’s-length transaction basis.
Segment assets do not include deferred income tax assets, pension asset and other noncurrent
assets. Segment liabilities do not include deferred income tax liabilities, income tax payable and
pension liability. Adjustments as shown below include items not presented as part of segment
assets and liabilities.
Revenue is recognized to the extent that it is probable that economic benefits will flow to the
Group, and that the revenue can be reliably measured.
Financial information on the operations of the various business segments are summarized as
follows:

- 13 -
*SGVFS004072*
March 31, 2015
Power
Generation
Power
Distribution
Parent
Company/
Others
Eliminations and
Adjustments Consolidated
REVENUE
External P=8,434,974 P=9,704,724 P=2,561,945 P=– P=20,701,643
Inter-segment 3,047,241 – 595,932 (3,643,173) –
Total Revenue P=11,482,215 P=9,704,724 P=3,157,877 (3,643,173) P=20,701,643
Segment Results P=5,036,378 P=1,065,313 P=87,775 P=– P=6,189,466
Unallocated corporate income - net 92,255 192,868 (1,993) – 283,130
INCOME FROM OPERATIONS 5,128,633 1,258,181 85,782 – 6,472,596
Interest expense (1,539,735) (54,193) (140,949) – (1,734,877)
Interest income 74,272 6,569 137,421 – 218,262
Share in net earnings of associates 708,034 19,218 4,384,730 (4,384,794) 727,188
Provision for income tax (682,445) (320,279) (55,100) – (1,057,824)
NET INCOME P=3,688,759 P=909,496 P=4,411,884 (P=4,384,794) P=4,625,345
OTHER INFORMATION
Investments in Associates P=24,000,670 P=840,850 P=96,160,232 (P=95,811,830) P=25,189,922
Segment Assets P=179,558,732 P=20,635,255 P=122,437,218 (P=97,878,726) P=224,752,479
Segment Liabilities P=94,965,962 P=14,495,376 P=39,247,112 (P=11,917,787) P=136,790,663
Depreciation and Amortization P=817,913 P=157,731 P=5,674 P=– P=1,007,597
March 31, 2014
Power
Generation
Power
Distribution
Parent
Company/
Others
Eliminations and
Adjustments Consolidated
REVENUE
External P=9,437,034 P=8,737,653 P=2,524,998 P=– P=20,699,685
Inter-segment 2,479,862 – 61,342 (2,541,204) –
Total Revenue P=11,916,896 P=8,737,653 P=2,586,340 (P=2,541,204) P=20,699,685
Segment Results P=5,002,786 P=827,565 P=24,377 P=– P=5,854,728
Unallocated corporate income - net 37,855 155,958 12,673 – 206,486
INCOME FROM OPERATIONS 5,040,641 983,523 37,050 – 6,061,214
Interest expense (1,627,371) (58,870) (4,727) – (1,690,968)
Interest income 40,645 8,793 59,125 – 108,563
Share in net earnings of associates 768,993 24,750 4,166,995 (4,167,425) 793,313
Provision for income tax (543,789) (262,469) (31,098) – (837,356)
NET INCOME P=3,679,119 P=695,727 P=4,227,345 (P=4,167,425) P=4,434,766
OTHER INFORMATION
Investments in Associates P=23,699,031 P=765,019 P=87,349,263 (P=86,975,690) P=24,837,623
Segment Assets P=165,453,043 P=18,811,380 P=106,836,357 (P=90,907,662) P=200,193,118
Segment Liabilities P=86,817,740 P=14,127,722 P=15,127,029 (P=11,311,414) P=104,761,077
Depreciation and Amortization P=791,804 P=247,673 P=4,774 P=– P=1,063,572

- 14 -
*SGVFS004072*
K. Financial Risk Management Objectives and Policies
The Group’s principal financial instruments comprise cash and cash equivalents and long-term
debts. The main purpose of these financial instruments is to raise finances for the Group’s
operations. The Group has various other financial instruments such as trade and other
receivables, AFS investments, bank loans, trade and other payables, finance lease obligation,
long-term obligation on power distribution system and customers’ deposits, which generally
arise directly from its operations.
The Group also enters into derivative transactions, particularly foreign currency forwards, to
economically hedge its foreign currency risk from foreign currency denominated liabilities and
purchases.
Risk Management Structure
The BOD is mainly responsible for the overall risk management approach and for the approval of
risk strategies and principles of the Group.
Financial risk committee
The Financial Risk Committee has the overall responsibility for the development of risk strategies,
principles, frameworks, policies and limits. It establishes a forum of discussion of the Group’s
approach to risk issues in order to make relevant decisions.
Treasury service group
The Treasury Service Group is responsible for the comprehensive monitoring, evaluating and
analyzing of the Group’s risks in line with the policies and limits.
The main risks arising from the Group’s financial instruments are interest rate risk resulting from
movements in interest rates that may have an impact on outstanding long-term debt; credit risk
involving possible exposure to counter-party default on its cash and cash equivalents, AFS
investments and trade and other receivables; liquidity risk in terms of the proper matching of the
type of financing required for specific investments; and foreign exchange risk in terms of foreign
exchange fluctuations that may significantly affect its foreign currency denominated placements
and borrowings.
Liquidity risk
Liquidity risk is the risk of not meeting obligations as they become due because of the inability to
liquidate assets or obtain adequate funding.The Group maintains sufficient cash and cash
equivalents to finance its operations. Any excess cash is invested in short-term money market
placements. These placements are maintained to meet maturing obligations and pay any
dividend declarations.
In managing its long-term financial requirements, the Group’s policy is that not more than 25% of
long-term borrowings should mature in any twelve-month period. 3.25% of the Group’s debt will
mature in less than one year as of March 31, 2015 (December 31, 2014: 3.27%). For its short-
term funding, the Group’s policy is to ensure that there are sufficient working capital inflows to
match repayments of short-term debt.
The financial assets that will be principally used to settle the financial liabilities presented in the
following table are from cash and cash equivalents and trade and other receivables. Cash and
- 15 -
*SGVFS004072*
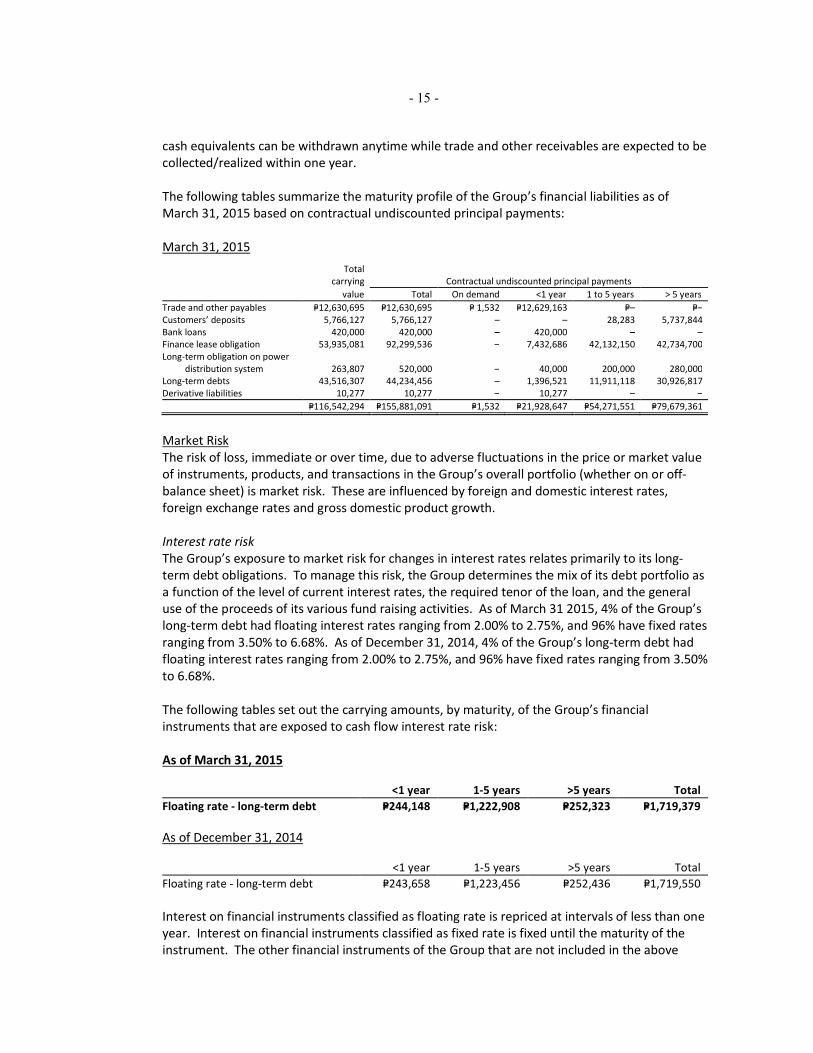
cash equivalents can be withdrawn anytime while trade and other receivables are expected to be
collected/realized within one year.
The following tables summarize the maturity profile of the Group’s financial liabilities as of
March 31, 2015 based on contractual undiscounted principal payments:
March 31, 2015
Total
carrying Contractual undiscounted principal payments
value Total On demand <1 year 1 to 5 years > 5 years
Trade and other payables P=12,630,695 P=12,630,695 P= 1,532 P=12,629,163 P=– P=–
Customers’ deposits 5,766,127 5,766,127 – – 28,283 5,737,844
Bank loans 420,000 420,000 – 420,000 – –
Finance lease obligation 53,935,081 92,299,536 – 7,432,686 42,132,150 42,734,700
Long-term obligation on power
distribution system 263,807 520,000 – 40,000 200,000 280,000
Long-term debts 43,516,307 44,234,456 – 1,396,521 11,911,118 30,926,817
Derivative liabilities 10,277 10,277 – 10,277 – –
P=116,542,294 P=155,881,091 P=1,532 P=21,928,647 P=54,271,551 P=79,679,361
Market Risk
The risk of loss, immediate or over time, due to adverse fluctuations in the price or market value
of instruments, products, and transactions in the Group’s overall portfolio (whether on or off-
balance sheet) is market risk. These are influenced by foreign and domestic interest rates,
foreign exchange rates and gross domestic product growth.
Interest rate risk
The Group’s exposure to market risk for changes in interest rates relates primarily to its long-
term debt obligations. To manage this risk, the Group determines the mix of its debt portfolio as
a function of the level of current interest rates, the required tenor of the loan, and the general
use of the proceeds of its various fund raising activities. As of March 31 2015, 4% of the Group’s
long-term debt had floating interest rates ranging from 2.00% to 2.75%, and 96% have fixed rates
ranging from 3.50% to 6.68%. As of December 31, 2014, 4% of the Group’s long-term debt had
floating interest rates ranging from 2.00% to 2.75%, and 96% have fixed rates ranging from 3.50%
to 6.68%.
The following tables set out the carrying amounts, by maturity, of the Group’s financial
instruments that are exposed to cash flow interest rate risk:
As of March 31, 2015
<1 year 1-5 years >5 years Total
Floating rate - long-term debt P=244,148 P=1,222,908 P=252,323 P=1,719,379
As of December 31, 2014
<1 year 1-5 years >5 years Total
Floating rate - long-term debt P=243,658 P=1,223,456 P=252,436 P=1,719,550
Interest on financial instruments classified as floating rate is repriced at intervals of less than one
year. Interest on financial instruments classified as fixed rate is fixed until the maturity of the
instrument. The other financial instruments of the Group that are not included in the above

- 16 -
*SGVFS004072*
tables are non-interest-bearing and are therefore not subject to interest rate risk. The Group’s
derivative assets and liabilities are subject to fair value interest rate risk.
The following table demonstrates the sensitivity to a reasonably possible change in interest
rates, with all other variables held constant, of the Group’s income before tax (through the
impact on floating rate borrowings):
Increase
(decrease) in
basis points
Effect
on income
before tax
March 31, 2015 200 (P=34,388)
(100) 17,194
March 31, 2014 200 (P=39,719)
(100) 19,860
The Group’s sensitivity to an increase/decrease in interest rates pertaining to derivative
instruments is expected to be insignificant due to their short-term maturities and immateriality
relative to the total assets and liabilities of the Group.
There is no other impact on the Group’s equity other than those already affecting the
consolidated statements of income.
Theinterest expense and other finance charges recognized according to source are as follows:
Jan-Mar
2015
Jan-Mar
2014
Finance lease obligation P=1,485,164 P=1,570,381
Bank loans and long-term debt 214,967 82,043
Customers’ deposits 1,323 715
Other long-term obligations 33,423 37,829
P=1,734,877 P=1,690,968
Foreign exchange risk
The foreign exchange risk of the Group pertains significantly to its foreign currency denominated
obligations. To manage its foreign exchange risk, stabilize cash flows and improve investment
and cash flow planning, the Group enters into foreign currency forward contracts aimed at
reducing and/or managing the adverse impact of changes in foreign exchange rates on financial
performance and cash flows. Foreign currency denominated borrowings account for 30% of total
consolidated borrowings as of March 31, 2015 and December 31, 2014.
Presented below are the Group’s foreign currency denominated financial assets and liabilities as
of March 31, 2015 and December 31, 2014, translated to Philippine Peso:
March 31, 2015 December 31, 2014
US Dollar
Philippine Peso
equivalent1 US Dollar
Philippine Peso
equivalent2
Loans and receivables:
Cash and cash equivalents $116,451 P=5,205,360 $37,065 P=1,657,547
Trade and other receivables 1,635 73,070 469 20,967
Total financial assets 118,086 5,278,430 37,534 1,678,514

- 17 -
*SGVFS004072*
March 31, 2015 December 31, 2014
US Dollar
Philippine Peso
equivalent1 US Dollar
Philippine Peso
equivalent2
Other financial liabilities:
Trade and other payables 253 11,297 5,252 234,860
Long-term debt 38,650 1,727,656 38,650 1,728,428
Finance lease obligation 608,319 27,191,859 614,635 27,486,477
Total financial liabilities 647,222 28,930,812 658,537 29,449,765
Total net financial liabilities ($529,136) (P=23,652,382) ($621,003) (P=27,771,251) 1$1 = P=44.70
2$1 = P=44.72
The following table demonstrates the sensitivity to a reasonably possible change in the US dollar
exchange rates, with all other variables held constant, of the Group’s income before tax as of
March 31, 2015:
Increase/ (decrease)
in US Dollar
Effect on income
before tax
US Dollar denominated accounts US Dollar strengthens by 5% (P=1,182,619)
US Dollar denominated accounts US Dollar weakens by 5% 1,182,619
The increase in US Dollar rate represents the depreciation of the Philippine Peso while the
decrease in US Dollar rate represents appreciation of the Philippine Peso.
The Group’s sensitivity to an increase/decrease in foreign currency pertaining to derivative
instruments is expected to be insignificant due to their short-term maturities and immateriality
relative to the total assets and liabilities of the Group.
There is no other impact on the Group’s equity other than those already affecting the
consolidated statements of income.
Credit risk
For its cash investments (including restricted portion), AFS investments and receivables, the
Group’s credit risk pertains to possible default by the counterparty, with a maximum exposure
equal to the carrying amount of these investments. With respect to cash investments and AFS
investments, the risk is mitigated by the short-term and/or liquid nature of its cash investments
mainly in bank deposits and placements, which are placed with financial institutions and entities
of high credit standing. With respect to receivables, credit risk is controlled by the application of
credit approval, limit and monitoring procedures. It is the Group’s policy to only enter into
transactions with credit-worthy parties to mitigate any significant concentration of credit risk.
The Group ensures that sales are made to customers with appropriate credit history and it has
internal mechanisms to monitor the granting of credit and management of credit exposures.
Concentration Risk
Credit risk concentration of the Group’s receivables according to the customer category as of
March 31, 2015 and December 31, 2014 is summarized in the following table:

- 18 -
*SGVFS004072*
March 31, 2015 December 31, 2014
Power distribution:
Industrial P=2,777,755 P=2,968,690
Residential 1,030,577 1,218,810
Commercial 424,306 547,802
City street lighting 11,866 15,630
Power generation:
Power supply contracts 3,667,850 4,652,728
Spot market 1,753,795 1,685,598
P=9,666,149 P=11,089,258
Capital Management
Capital includes equity attributable to the equity holders of the parent. The primary objective of
the Group’s capital management is to ensure that it maintains a strong credit rating and healthy
capital ratios in order to support its business and maximize shareholder value.
The Group manages its capital structure and makes adjustments to it, in light of changes in
economic conditions. To maintain or adjust the capital structure, the Group may adjust the
dividend payment to shareholders, return capital to shareholders or issue new shares.
The Group monitors capital using a gearing ratio, which is net debt divided by equity plus net
debt. The Group’s policy is to keep the gearing ratio at 70% or below. The Group determines net
debt as the sum of interest-bearing short-term and long-term loans (comprising long-term debt,
finance lease obligation and payable to a preferred shareholder of a subsidiary) less cash and
short-term deposits.
Gearing ratios of the Group as of March 31, 2015 and December 31, 2014 are as follows:
March 31, 2015 December 31, 2014
Bank loans P=420,000 P=103,000
Long-term debt 97,451,388 97,244,096
Cash and cash equivalents (47,391,488) (40,231,875)
Net debt (a) 50,479,900 57,115,221
Equity 87,961,816 96,080,440
Equity and net debt (b) P=138,441,716 P=153,195,661
Gearing ratio (a/b) 36.46% 37.28%
No changes were made in the objectives, policies or processes during the period ended March
31, 2015 and December 31, 2014.
L. Financial Instruments
Fair Value of Financial Instruments
Fair value is defined as the amount at which the financial instrument could be sold in a current
transaction between knowledgeable willing parties in an arm’s length transaction, other than in a
forced liquidation or sale. Fair values are obtained from quoted market prices, discounted cash
flow models and option pricing models, as appropriate.

- 19 -
*SGVFS004072*
A financial instrument is regarded as quoted in an active market if quoted prices are readily
available from an exchange, dealer, broker, pricing services or regulatory agency and those prices
represent actual and regularly occurring market transactions on an arm’s length basis. For a
financial instrument with an active market, the quoted market price is used as its fair value. On
the other hand, if transactions are no longer regularly occurring even if prices might be available
and the only observed transactions are forced transactions or distressed sales, then the market is
considered inactive. For a financial instrument with no active market, its fair value is determined
using a valuation technique (e.g. discounted cash flow approach) that incorporates all factors
that market participants would consider in setting a price.
Set out below is a comparison by category of carrying amounts and fair values of the Group’s
financial instruments whose fair values are different from their carrying amounts.
March 31, 2015 December 31, 2014
Carrying
Amounts
Fair
Values
Carrying
Amounts
Fair
Values
Financial Liabilities
Finance lease obligation P=53,935,081 P=58,865,232 P=54,461,021 P=67,425,952
Long-term debt - fixed rate 41,796,928 42,099,909 41,063,525 41,804,240
Long-term obligation on power
distribution system 263,807 420,143 256,015 415,314
P=95,995,816 P=101,385,284 P=95,780,561 P=109,645,506
The following methods and assumptions are used to estimate the fair value of each class of
financial instruments:
Cash and cash equivalents, trade and other receivables, bank loans and trade and other
payables.The carrying amounts of cash and cash equivalents,trade and other receivables, bank
loans and trade and other payables approximate fair value due to the relatively short-term
maturity of these financial instruments.
Fixed-rate borrowings. The fair value of fixed rate interest-bearing loans is based on the
discounted value of future cash flows using the applicable rates for similar types of loans.
Floating-rate borrowings. Since repricing of the variable-rate interest bearing loan is done on a
quarterly basis, the carrying value approximates the fair value.
Finance lease obligation. The fair value of the finance lease obligation was calculated by
discounting future cash flows using applicable interest rates.
Long-term obligation on PDS.The fair value of the long-term obligations on power distribution
system is calculated by discounting expected future cash flows at prevailing market rates.
Customers’ deposits.The fair value of bill deposits approximates the carrying values as these
deposits earn interest at the prevailing market interest rate in accordance with regulatory
guidelines. The timing and related amounts of future cash flows relating to transformer and lines
and poles deposits cannot be reasonably and reliably estimated for purposes of establishing their
fair values using an alternative valuation technique.
- 20 -
*SGVFS004072*
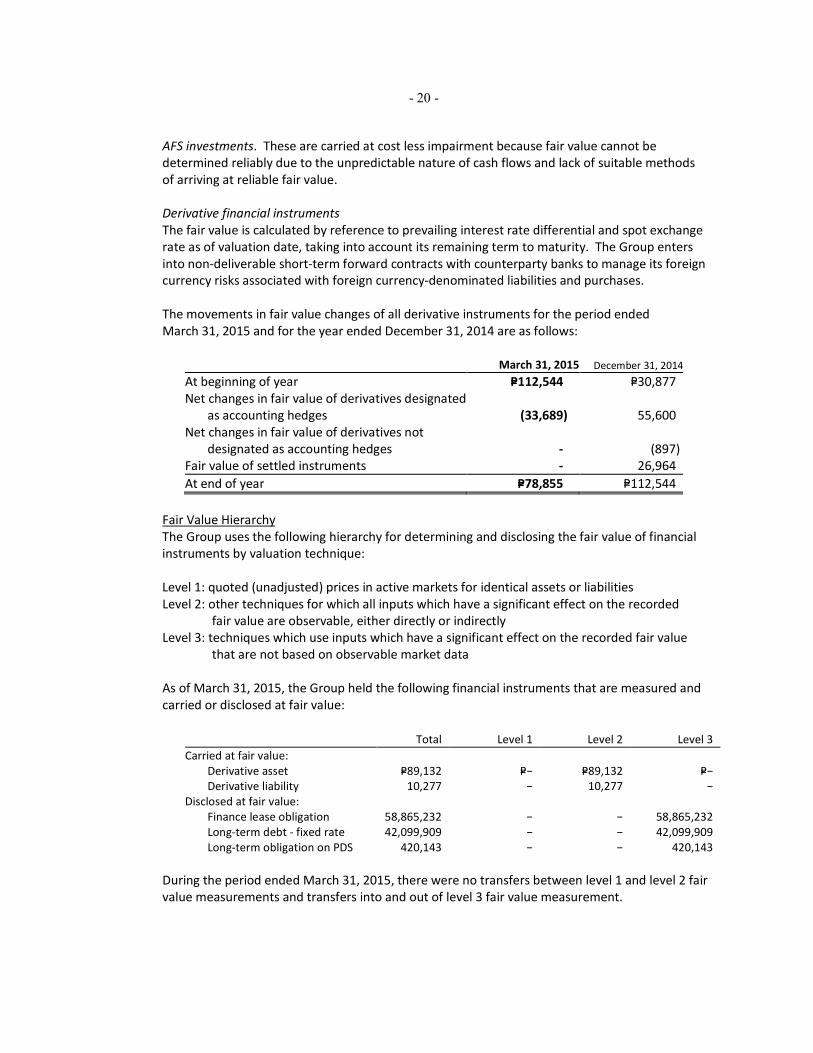
AFS investments. These are carried at cost less impairment because fair value cannot be
determined reliably due to the unpredictable nature of cash flows and lack of suitable methods
of arriving at reliable fair value.
Derivative financial instruments
The fair value is calculated by reference to prevailing interest rate differential and spot exchange
rate as of valuation date, taking into account its remaining term to maturity. The Group enters
into non-deliverable short-term forward contracts with counterparty banks to manage its foreign
currency risks associated with foreign currency-denominated liabilities and purchases.
The movements in fair value changes of all derivative instruments for the period ended
March 31, 2015 and for the year ended December 31, 2014 are as follows:
March 31, 2015 December 31, 2014
At beginning of year P=112,544 P=30,877
Net changes in fair value of derivatives designated
as accounting hedges (33,689) 55,600
Net changes in fair value of derivatives not
designated as accounting hedges - (897)
Fair value of settled instruments - 26,964
At end of year P=78,855 P=112,544
Fair Value Hierarchy
The Group uses the following hierarchy for determining and disclosing the fair value of financial
instruments by valuation technique:
Level 1: quoted (unadjusted) prices in active markets for identical assets or liabilities
Level 2: other techniques for which all inputs which have a significant effect on the recorded
fair value are observable, either directly or indirectly
Level 3: techniques which use inputs which have a significant effect on the recorded fair value
that are not based on observable market data
As of March 31, 2015, the Group held the following financial instruments that are measured and
carried or disclosed at fair value:
Total Level 1 Level 2 Level 3
Carried at fair value:
Derivative asset P=89,132 P=− P=89,132 P=−
Derivative liability 10,277 − 10,277 −
Disclosed at fair value:
Finance lease obligation 58,865,232 − − 58,865,232
Long-term debt - fixed rate 42,099,909 − − 42,099,909
Long-term obligation on PDS 420,143 − − 420,143
During the period ended March 31, 2015, there were no transfers between level 1 and level 2 fair
value measurements and transfers into and out of level 3 fair value measurement.

- 21 -
*SGVFS004072*
M. Disclosures
1. Corporate Information
Aboitiz Power Corporation (the Company) was incorporated in the Philippines and registered
with the Securities and Exchange Commission on February 13, 1998. The Company is a
publicly-listed holding company of the entities engaged in power generation and power
distribution in the Aboitiz Group. As of March 31, 2015, Aboitiz Equity Ventures, Inc. (AEV,
also incorporated in the Philippines) owns 76.88% of the Company. The ultimate parent of
the Company is Aboitiz & Company, Inc. (ACO).
The registered office address of the Company is 32nd street, Bonifacio Global City, Taguig
City, Metro Manila.
2. Group Information
The consolidated financial statements comprise the financial statements of the Company,
subsidiaries controlled by the Company and joint operation that are subject to joint control
(collectively referred to as “the Group”). The following are the subsidiaries as of March 31,
2015 and December 31, 2014:
Percentage Ownership
March 31, 2015 December 31, 2014
Nature of Business Direct Indirect Direct Indirect
Aboitiz Renewables, Inc. and Subsidiaries Power generation 100.00 – 100.00 –
AP Renewables, Inc. Power generation – 100.00 – 100.00
Hedcor, Inc. (HI) Power generation – 100.00 – 100.00
Hedcor Sibulan, Inc. (HSI) Power generation – 100.00 – 100.00
Hedcor Tudaya, Inc. (HTI) Power generation – 100.00 – 100.00
Luzon Hydro Corporation (LHC) Power generation – 100.00 – 100.00
AP Solar Tiwi, Inc.* Power generation – 100.00 – 100.00
Bakun Power Line Corporation* Power generation – 100.00 – 100.00
Cleanergy, Inc.* Power generation – 100.00 – 100.00
Cordillera Hydro Corporation* Power generation – 100.00 – 100.00
Hedcor Benguet, Inc.* Power generation – 100.00 – 100.00
Hedcor Bukidnon, Inc.* Power generation – 100.00 – 100.00
Hedcor Cordillera, Inc.* Power generation – 100.00 – 100.00
Hedcor Ifugao, Inc.* Power generation – 100.00 – 100.00
Hedcor Kalinga, Inc.* Power generation – 100.00 – 100.00
Hedcor Itogon Inc.* Power generation – 100.00 – 100.00
Hedcor Manolo Fortich, Inc.* Power generation – 100.00 – 100.00
Hedcor Mt. Province, Inc.* Power generation – 100.00 – 100.00
Hedcor Sabangan, Inc.* Power generation – 100.00 – 100.00
Hedcor Tamugan, Inc.* Power generation – 100.00 – 100.00
Kookaburra Equity Ventures, Inc. Holding company – 100.00 – 100.00
Mt. Apo Geopower, Inc.* Power generation – 100.00 – 100.00
Negron Cuadrado Geopower, Inc.* Power generation – 100.00 – 100.00
Tagoloan Hydro Corporation* Power generation – 100.00 – 100.00
Hydro Electric Development Corporation Power generation – 99.97 – 99.97
Therma Power, Inc. and Subsidiaries Power generation 100.00 – 100.00 –
Therma Luzon, Inc. Power generation – 100.00 – 100.00
Therma Marine, Inc. Power generation – 100.00 – 100.00
Therma Mobile, Inc. Power generation – 100.00 – 100.00
Therma South, Inc.*(TSI) Power generation – 100.00 – 100.00
Therma Power-Visayas,* Power generation – 100.00 – 100.00
Therma Central Visayas, Inc.* Power generation – 100.00 – 100.00
Therma Southern Mindanao, Inc.* Power generation – 100.00 – 100.00
Therma Subic, Inc.* Power generation – 100.00 – 100.00
Therma Visayas, Inc.* (TVI) Power generation – 80.00 – 100.00
Abovant Holdings, Inc. Holding company – 60.00 – 60.00
Aboitiz Energy Solutions, Inc. Retail electricity supplier 100.00 – 100.00 –
Adventenergy, Inc. Retail electricity supplier 100.00 – 100.00 –
Balamban Enerzone Corporation Power distribution 100.00 – 100.00 –

- 22 -
*SGVFS004072*
Percentage Ownership
March 31, 2015 December 31, 2014
Nature of Business Direct Indirect Direct Indirect
LiMa Enerzone Corporation Power distribution 100.00 – 100.00 –
Mactan Enerzone Corporation Power distribution 100.00 – 100.00 –
Cotabato Light and Power Company (CLP) Power distribution 99.94 – 99.94 –
Cotabato Ice Plant, Inc. Manufacturing – 100.00 – 100.00
Davao Light & Power Co., Inc. (DLP) Power distribution 99.93 – 99.93 –
Subic Enerzone Corporation (SEZ) Power distribution 65.00 34.98 65.00 34.98
Cebu Private Power Corporation Power generation 60.00 – 60.00 –
Prism Energy, Inc. * Retail electricity supplier 60.00 – 60.00 –
Visayan Electric Company (VECO) Power distribution 55.26 – 55.26 –
* No commercial operations as of March 31, 2015.
3. Basis of Financial Statement Preparation and Changes in Accounting Policies
Basis of Financial Statement Preparation
The accompanying unaudited condensed consolidated financial statements have been
prepared in accordance with Philippine Accounting Standard (PAS) 34, Interim Financial
Reporting. Accordingly, the unaudited condensed consolidated financial statements do not
include all of the information and disclosures required in the December 31, 2014 annual
audited consolidated financial statements, and should be read in conjunction with the
Group’s consolidated financial statements as of and for the year ended December 31, 2014.
The preparation of the financial statements in compliance with Philippine Financial Reporting
Standards (PFRS) requires management to make estimates and assumptions that affect the
amounts reported in the financial statements and accompanying notes. The estimates and
assumptions used in the accompanying unaudited condensed consolidated financial
statements are based upon management’s evaluation of relevant facts and circumstances as
of the date of the unaudited condensed consolidated financial statements. Actual results
could differ from such estimates.
The unaudited condensed consolidated financial statements of the Group are presented in
Philippine peso, the Group’s functional currency, and rounded to the nearest thousands
except for earnings per share and exchange rates and when otherwise indicated.
On May 7, 2015, the Audit Committee of the Board of Directors approved and authorized the
release of the accompanying unaudited condensed consolidated financial statements of the
Group.
Changes in Accounting Policies
The accounting policies adopted are consistent with those of the previous financial year
except for the new and revised PFRS and Philippine Interpretations which the Group has
adopted starting January 1, 2015. Except as otherwise indicated, adoption of these new and
revised standards and interpretations did not have any significant impact on the Group’s
financial statements:
• PAS 19, Employee Benefits - Defined Benefit Plans: Employee Contributions (Amendments)
Amendment to PAS 19 requires an entity to consider contributions from employees or third
parties when accounting for defined benefit plans. Where the contributions are linked to
service, they should be attributed to periods of service as a negative benefit. It clarifies that,
if the amount of the contributions is independent of the number of years of service, an entity

- 23 -
*SGVFS004072*
is permitted to recognize such contributions as a reduction in the service cost in the period in
which the service is rendered, instead of allocating the contributions to the periods of
service. This amendment, which becomes effective starting January 1, 2015, is not applicable
to the Group since the entities in the Group have defined benefit plans which do not require
contributions from employees or third parties.
Annual Improvements to PFRSs (2010-2012 cycle)
The Annual Improvements to PFRSs (2010-2012 cycle) are effective for annual periods beginning
on or after January 1, 2015 and are not expected to have a material impact on the Group. They
include:
• PFRS 2, Share-based Payment - Definition of Vesting Condition
This improvement is applied prospectively and clarifies various issues relating to the
definitions of performance and service conditions which are vesting conditions, including:
a. A performance condition must contain a service condition
b. A performance target must be met while the counterparty is rendering service
c. A performance target may relate to the operations or activities of an entity, or to
those of another entity in the same group
d. A performance condition may be a market or non-market condition
e. If the counterparty, regardless of the reason, ceases to provide service during the
vesting period, the service condition is not satisfied.
• PFRS 3, Business Combinations - Accounting for Contingent Consideration in a Business
Combination
The amendment is applied prospectively for business combinations for which the acquisition
date is on or after July 1, 2014. It clarifies that a contingent consideration that is not
classified as equity is subsequently measured at fair value through profit or loss whether or
not it falls within the scope of PAS 39 (or PFRS 9, Financial Instruments, if early adopted).
The Group shall consider this amendment for future business combinations.
• PFRS 8, Operating Segments - Aggregation of Operating Segments and Reconciliation of the
Total of the Reportable Segments’ Assets to the Entity’s Assets
The amendments are applied retrospectively and clarify that:
a. An entity must disclose the judgments made by management in applying the
aggregation criteria in the standard, including a brief description of operating
segments that have been aggregated and the economic characteristics (e.g., sales
and gross margins) used to assess whether the segments are ‘similar’.
b. The reconciliation of segment assets to total assets is only required to be disclosed if
the reconciliation is reported to the chief operating decision maker, similar to the
required disclosure for segment liabilities.
• PAS 16, Property, Plant and Equipment, and PAS 38, Intangible Assets - Revaluation Method -
Proportionate Restatement of Accumulated Depreciation and Amortization
The amendment is applied retrospectively and clarifies in PAS 16 and PAS 38 that the asset
may be revalued by reference to the observable data on either the gross or the net carrying
amount. In addition, the accumulated depreciation or amortization is the difference
between the gross and carrying amounts of the asset.

- 24 -
*SGVFS004072*
• PAS 24, Related Party Disclosures - Key Management Personnel Services
The amendment is applied retrospectively and clarifies that a management entity, which is
an entity that provides key management personnel services, is a related party subject to the
related party disclosures. In addition, an entity that uses a management entity is required to
disclose the expenses incurred for management services.
Annual Improvements to PFRSs (2011-2013 cycle)
The Annual Improvements to PFRSs (2011-2013 cycle) are effective for annual periods beginning
on or after January 1, 2015 and are not expected to have any material impact on the Group.
They include:
• PFRS 3, Business Combinations - Scope Exceptions for Joint Arrangements
The amendment is applied prospectively and clarifies the following regarding the scope
exceptions within PFRS 3:
a. Joint arrangements, not just joint ventures, are outside the scope of PFRS 3.
b. This scope exception applies only to the accounting in the financial statements of the
joint arrangement itself.
• PFRS 13, Fair Value Measurement - Portfolio Exception
The amendment is applied prospectively and clarifies that the portfolio exception in PFRS 13
can be applied not only to financial assets and financial liabilities, but also to other contracts
within the scope of PAS 39.
• PAS 40, Investment Property
The amendment is applied prospectively and clarifies that PFRS 3, and not the description of
ancillary services in PAS 40, is used to determine if the transaction is the purchase of an asset
or business combination. The description of ancillary services in PAS 40 only differentiates
between investment property and owner-occupied property (i.e., property, plant and
equipment).
New Accounting Standards, Interpretations, and Amendments to Existing Standards Not Yet
Effective as of January 1, 2015
The Group will adopt the standards and interpretations enumerated below when these
become effective. Except as otherwise indicated, the Group does not expect the adoption of
these new and amended PFRS and Philippine Interpretations to have significant impact on its
financial statements.
• PAS 27, Separate Financial Statements - Equity Method in Separate Financial Statements
(Amendments)
The amendments will allow entities to use the equity method to account for investments in
subsidiaries, joint ventures and associates in their separate financial statements. Entities
already applying PFRS and electing to change to the equity method in its separate financial
statements will have to apply that change retrospectively. For first-time adopters of PFRS
electing to use the equity method in its separate financial statements, they will be required
to apply this method from the date of transition to PFRS. The amendments are effective for
annual periods beginning on or after January 1, 2016, with early adoption permitted. These
amendments will not have any impact on the Group’s consolidated financial statements.

- 25 -
*SGVFS004072*
• PFRS 10, Consolidated Financial Statements and PAS 28, Investments in Associates and Joint
Ventures - Sale or Contribution of Assets between an Investor and its Associate or Joint
Venture
These amendments address an acknowledged inconsistency between the requirements in
PFRS 10 and those in PAS 28 (2011) in dealing with the sale or contribution of assets between
an investor and its associate or joint venture. The amendments require that a full gain or
loss is recognized when a transaction involves a business (whether it is housed in a subsidiary
or not). A partial gain or loss is recognized when a transaction involves assets that do not
constitute a business, even if these assets are housed in a subsidiary. These amendments are
effective from annual periods beginning on or after January 1, 2016.
• PFRS 11, Joint Arrangements - Accounting for Acquisitions of Interests in Joint Operations
(Amendments)
The amendments to PFRS 11 require that a joint operator accounting for the acquisition of an
interest in a joint operation, in which the activity of the joint operation constitutes a business
must apply the relevant PFRS 3 principles for business combinations accounting. The
amendments also clarify that a previously held interest in a joint operation is not remeasured
on the acquisition of an additional interest in the same joint operation while joint control is
retained. In addition, a scope exclusion has been added to PFRS 11 to specify that the
amendments do not apply when the parties sharing joint control, including the reporting
entity, are under common control of the same ultimate controlling party.
The amendments apply to both the acquisition of the initial interest in a joint operation and
the acquisition of any additional interests in the same joint operation and are prospectively
effective for annual periods beginning on or after January 1, 2016, with early adoption
permitted. The Group shall consider these amendments if it enters into this type of
arrangement in the future.
• PFRS 14, Regulatory Deferral Accounts
PFRS 14 is an optional standard that allows an entity, whose activities are subject to rate-
regulation, to continue applying most of its existing accounting policies for regulatory
deferral account balances upon its first-time adoption of PFRS. Entities that adopt PFRS 14
must present the regulatory deferral accounts as separate line items on the statement of
financial position and present movements in these account balances as separate line items in
the statement of profit or loss and other comprehensive income. The standard requires
disclosures on the nature of, and risks associated with, the entity’s rate-regulation and the
effects of that rate-regulation on its financial statements. PFRS 14 is effective for annual
periods beginning on or after January 1, 2016. This standard is not applicable since the
Group is an existing PFRS preparer.
Annual Improvements to PFRSs (2012-2014 cycle)
The Annual Improvements to PFRSs (2011-2013 cycle) are effective for annual periods beginning
on or after January 1, 2016 and are not expected to have any material impact on the Group.
They include:

- 26 -
*SGVFS004072*
• PFRS 5, Non-current Assets Held for Sale and Discontinued Operations - Changes in Methods
of Disposal
The amendment is applied prospectively and clarifies that changing from a disposal through
sale to a disposal through distribution to owners and vice-versa should not be considered to
be a new plan of disposal, rather it is a continuation of the original plan. There is, therefore,
no interruption of the application of the requirements in PFRS 5. The amendment also
clarifies that changing the disposal method does not change the date of classification.
• PFRS 7, Financial Instruments: Disclosures - Servicing Contracts
PFRS 7 requires an entity to provide disclosures for any continuing involvement in a
transferred asset that is derecognized in its entirety. The amendment clarifies that a
servicing contract that includes a fee can constitute continuing involvement in a financial
asset. An entity must assess the nature of the fee and arrangement against the guidance in
PFRS 7 in order to assess whether the disclosures are required. The amendment is to be
applied such that the assessment of which servicing contracts constitute continuing
involvement will need to be done retrospectively. However, comparative disclosures are not
required to be provided for any period beginning before the annual period in which the
entity first applies the amendments.
• PFRS 7 - Applicability of the Amendments to PFRS 7 to Condensed Interim Financial
Statements
This amendment is applied retrospectively and clarifies that the disclosures on offsetting of
financial assets and financial liabilities are not required in the condensed interim financial
report unless they provide a significant update to the information reported in the most
recent annual report.
• PAS 19, Employee Benefits - Regional Market Issue Regarding Discount Rate
This amendment is applied prospectively and clarifies that market depth of high quality
corporate bonds is assessed based on the currency in which the obligation is denominated,
rather than the country where the obligation is located. When there is no deep market for
high quality corporate bonds in that currency, government bond rates must be used.
• PAS 34, Interim Financial Reporting - Disclosure of Information ‘Elsewhere in the Interim
Financial Report’
The amendment is applied retrospectively and clarifies that the required interim disclosures
must either be in the interim financial statements or incorporated by cross-reference
between the interim financial statements and wherever they are included within the greater
interim financial report (e.g., in the management commentary or risk report).
• PFRS 9, Financial Instruments - Hedge Accounting and amendments to PFRS 9, PFRS 7 and
PAS 39 (2013 version)
PFRS 9 (2013 version) already includes the third phase of the project to replace PAS 39 which
pertains to hedge accounting. This version of PFRS 9 replaces the rules-based hedge
accounting model of PAS 39 with a more principles-based approach. Changes include
replacing the rules-based hedge effectiveness test with an objectives-based test that focuses
on the economic relationship between the hedged item and the hedging instrument, and the
effect of credit risk on that economic relationship; allowing risk components to be
designated as the hedged item, not only for financial items but also for non-financial items,

- 27 -
*SGVFS004072*
provided that the risk component is separately identifiable and reliably measurable; and
allowing the time value of an option, the forward element of a forward contract and any
foreign currency basis spread to be excluded from the designation of a derivative instrument
as the hedging instrument and accounted for as costs of hedging. PFRS 9 also requires more
extensive disclosures for hedge accounting. PFRS 9 (2013 version) has no mandatory
effective date. The mandatory effective date of January 1, 2018 was eventually set when the
final version of PFRS 9 was adopted by the FRSC. The adoption of the final version of PFRS 9,
however, is still for approval by BOA.
• PFRS 9, Financial Instruments (2014 or final version)
In July 2014, the final version of PFRS 9, Financial Instruments, was issued. PFRS 9 reflects all
phases of the financial instruments project and replaces PAS 39 and all previous versions of
PFRS 9. The standard introduces new requirements for classification and measurement,
impairment, and hedge accounting. PFRS 9 is effective for annual periods beginning on or
after January 1, 2018, with early application permitted. Retrospective application is
required, but comparative information is not compulsory. Early application of previous
versions of PFRS 9 is permitted if the date of initial application is before February 1, 2015.
The adoption of PFRS 9 will have an effect on the classification and measurement of and
impairment methodology for the Group’s financial assets, and on its application of hedge
accounting. However, it will have no impact on the classification and measurement of its
financial liabilities.
After evaluating the impact of PFRS 9 and considering that it will not have any significant
effect on the Group’s operating results or financial condition, management has decided not
to early adopt the said standard. It will be implemented only when it becomes effective on
January 1, 2018. Thus, the consolidated financial statements do not reflect the impact of this
standard.
The following new standard issued by the IASB has not yet been adopted by the FRSC:
• IFRS 15, Revenue from Contracts with Customers
IFRS 15 was issued in May 2014 and establishes a new five-step model that will apply to
revenue arising from contracts with customers. Under IFRS 15 revenue is recognised at an
amount that reflects the consideration to which an entity expects to be entitled in exchange
for transferring goods or services to a customer. The principles in IFRS 15 provide a more
structured approach to measuring and recognising revenue. The new revenue standard is
applicable to all entities and will supersede all current revenue recognition requirements
under IFRS. Either a full or modified retrospective application is required for annual periods
beginning on or after January 1, 2017 with early adoption permitted. The Group is currently
assessing the impact of IFRS 15 and plans to adopt the new standard on the required
effective date once adopted locally.
4. Seasonality of Interim Operations
Operations of hydropower plants are generally affected by climatic seasonality. Seasonality
and location have a direct effect on the level of precipitation. In Luzon where rainy and
summer seasons are more pronounced, higher rainfall is normally experienced in the months
of June to September. As such, the hydropower plants located in Luzon operate at their

- 28 -
*SGVFS004072*
maximum capacity during this period. In contrast, the hydropower plants in Mindanao
experience a well-distributed rainfall throughout the year, with a slightly better precipitation
during the months of December to April. This precipitation seasonality greatly affects
subsidiary companies HI, HSI, HTI and LHC, which operate ‘run-of-river’ hydropower plants
since these plants do not have any means to impound water.
Any unexpected change in the seasonal aspects will have no material effect on the Group's
financial condition or results of operations.
5. Property, Plant and Equipment
During the three months ended March 31, 2015, the Group’s additions to property, plant and
equipment amounted to P=2.65 billion, including acquisition of distribution assets amounting
to P=405.7 million, and costs relating to the construction of power plant facilities.
A significant portion of the Group’s property, plant and equipment relates to various projects
under “Construction in progress” as of March 31, 2015, as shown below:
Project Company
Estimated cost to
complete
(in millions) % of completion
TVI 37,647 3%
PEC 18,646 16%
Hedcor Bukidnon, Inc. 11,307 0%
TSI 5,256 84%
Hedcor Sabangan, Inc. 532 72%
For the period, construction costs for the various projects amounted to P=2.13 billion, which
includes capitalized borrowing costs amounting to P=331.1 million.
6. Material Events and Changes
a) Dividend declaration
On March 10, 2015, the BOD approved the declaration of cash dividends of P=1.14 a share
(P=8.39 billion) and special cash dividends of P=0.52 a share (P=3.83 billion) to all stockholders of
record as of March 24, 2015. The cash dividends are payable on April 20, 2015.
Except for the above developments and as disclosed in some other portions of this report, no
other significant event occurred that would have a material impact on the registrant and its
subsidiaries, and no other known trend, event or uncertainty came about that had or were
reasonably expected to have a material favorable or unfavorable impact on revenues or
income from continuing operations, since the end of the most recently completed fiscal year.
There were also no significant elements of income or loss that did not arise from the
continuing operations of the registrant and its subsidiaries.

- 29 -
*SGVFS004072*
Other than those disclosed above, no material off-balance sheet transactions, arrangements,
obligations (including contingent obligations), and other relationships with unconsolidated
entities or other persons entities or other persons were created during the interim period.
There were also no events that would trigger substantial direct or contingent financial
obligations or cause any default or acceleration of an existing obligation.
Likewise, there were no other material changes made in such items as: accounting principles
and practices, estimates inherent in the preparation of financial statements, status of long-
term contracts, changes in the composition of the issuer, and reporting entity resulting from
business combinations or dispositions.
Lastly, there were no changes in estimates of amounts reported in prior interim period and
financial year that would have a material effect in the current interim period.
7. Material Adjustments
There were no material, non-recurring adjustments made during period that would require
appropriate disclosures. All other adjustments are of a normal recurring nature.
8. Contingencies
The Group is a party to certain proceedings and legal cases with other parties in the normal
course of business. The ultimate outcome of these proceedings and legal cases cannot be
presently determined. Management, in consultation with its legal counsels, believes that it
has substantial legal and factual bases for its positions and is currently of the opinion that the
likely outcome of these proceedings and legal cases will not have a material adverse effect
on the Group’s financial position and operating results. It is possible, however, that the
future results of operations could be materially affected by changes in estimates or in the
effectiveness of the strategies relating to these proceedings and legal cases.
The Company obtained Standby Letters of Credit and is acting as surety for the benefit of
certain associates and a subsidiary in connection with loans and credit accommodations.
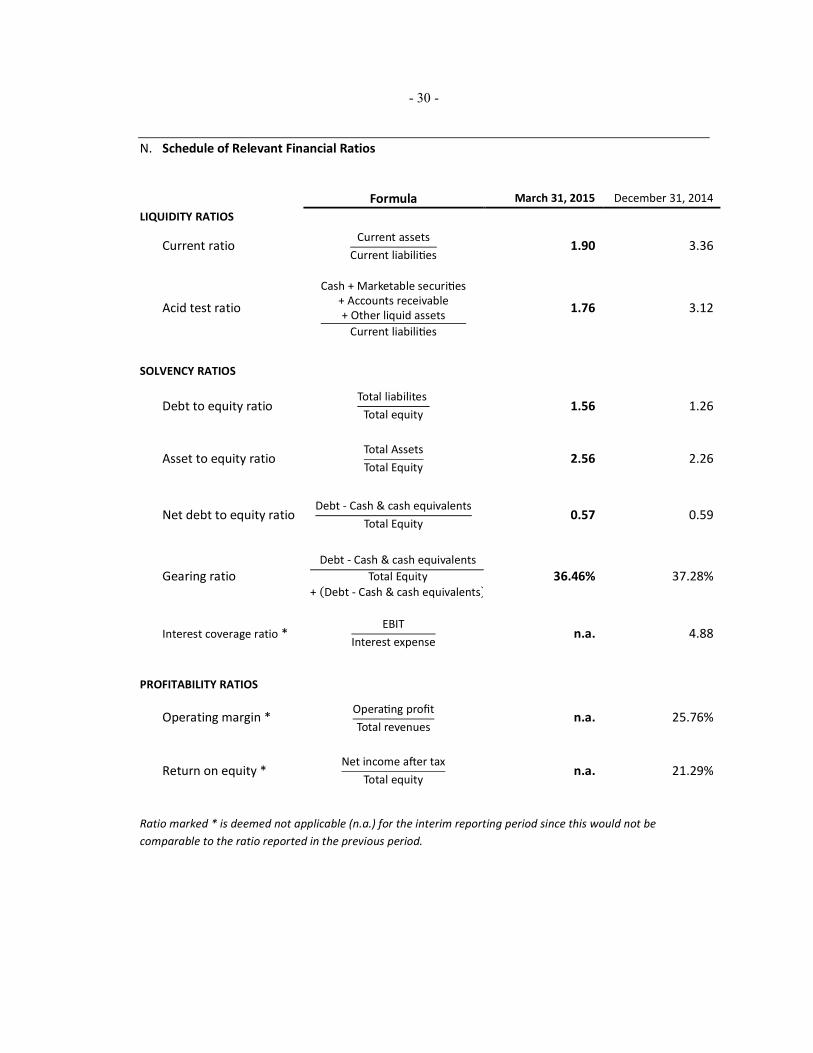
- 30 -
*SGVFS004072*
N. Schedule of Relevant Financial Ratios
Formula March 31, 2015 December 31, 2014
LIQUIDITY RATIOS
Current ratio Current assets
Current liabiliTes 1.90 3.36
Acid test ratio
Cash + Marketable securiTes
+ Accounts receivable
+ Other liquid assets
Current liabiliTes
1.76 3.12
SOLVENCY RATIOS
Debt to equity ratio Total liabilites
Total equity 1.56 1.26
Asset to equity ratio Total Assets
Total Equity 2.56 2.26
Net debt to equity ratio Debt - Cash & cash equivalents
Total Equity 0.57 0.59
Gearing ratio
Debt - Cash & cash equivalents
Total Equity
+ �Debt - Cash & cash equivalents�
36.46% 37.28%
Interest coverage ratio * EBIT
Interest expense n.a. 4.88
PROFITABILITY RATIOS
Operating margin * OperaTng profit
Total revenues n.a. 25.76%
Return on equity * Net income aXer tax
Total equity n.a. 21.29%
Ratio marked * is deemed not applicable (n.a.) for the interim reporting period since this would not be
comparable to the ratio reported in the previous period.
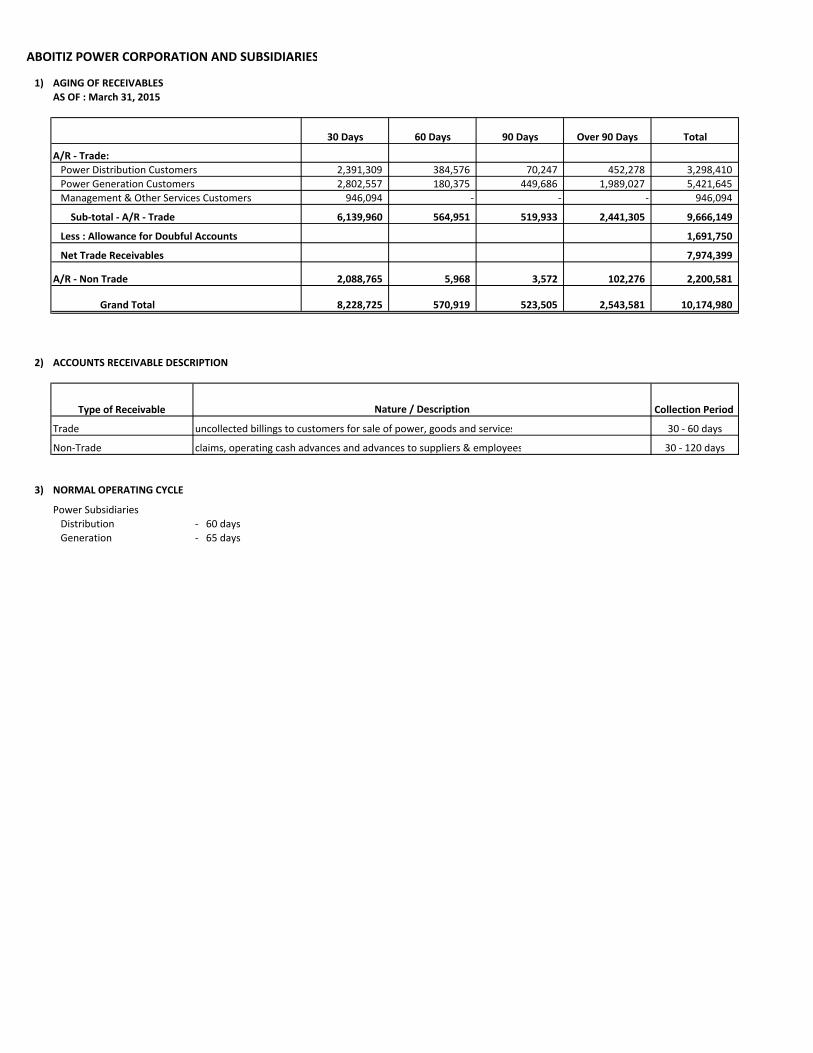
ABOITIZ POWER CORPORATION AND SUBSIDIARIES
1) AGING OF RECEIVABLES
AS OF : March 31, 2015
30 Days 60 Days 90 Days Over 90 Days Total
A/R - Trade:
Power Distribution Customers 2,391,309 384,576 70,247 452,278 3,298,410
Power Generation Customers 2,802,557 180,375 449,686 1,989,027 5,421,645
Management & Other Services Customers 946,094 - - - 946,094
Sub-total - A/R - Trade 6,139,960 564,951 519,933 2,441,305 9,666,149
Less : Allowance for Doubful Accounts 1,691,750
Net Trade Receivables 7,974,399
A/R - Non Trade 2,088,765 5,968 3,572 102,276 2,200,581
Grand Total 8,228,725 570,919 523,505 2,543,581 10,174,980
2) ACCOUNTS RECEIVABLE DESCRIPTION
Type of Receivable Collection Period
Trade uncollected billings to customers for sale of power, goods and services 30 - 60 days
Non-Trade claims, operating cash advances and advances to suppliers & employees 30 - 120 days
3) NORMAL OPERATING CYCLE
Power Subsidiaries
Distribution - 60 days
Generation - 65 days
Nature / Description


![Interim report and unaudited financial statements · 2020. 5. 5. · Interim report and unaudited financial statements [5] Purchases and Sales A detailed list of investments purchased](https://static.fdocuments.in/doc/165x107/6019709842eedc773372c408/interim-report-and-unaudited-financial-statements-2020-5-5-interim-report-and.jpg)