Unaudited interim report and accounts
484
Unaudited interim report and accounts BNY MELLON GLOBAL FUNDS, PLC FOR THE FINANCIAL PERIOD ENDED 30 JUNE 2020 03613-1A.indd 1 19/08/2020 19:00
Transcript of Unaudited interim report and accounts

Unaudited interim report and accountsBNY MELLON GLOBAL FUNDS, PLCFOR THE FINANCIAL PERIOD ENDED 30 JUNE 2020
T9029_Interim_R&A_covers.indd 2 27/07/2020 17:2303613-1A.indd 1 19/08/2020 19:00

03613-1A.indd 2 19/08/2020 19:00
CONTENTS
BACKGROUND TO THE COMPANY 4
INVESTMENT MANAGERS’ REPORTS 6
GLOSSARY OF FINANCE TERMS 40
HALF YEARLY MANAGEMENT REVIEW 43
SCHEDULE OF INVESTMENTS 45
STATEMENT OF COMPREHENSIVE INCOME 278
STATEMENT OF FINANCIAL POSITION 294
STATEMENT OF CHANGES IN NET ASSETS ATTRIBUTABLE TO REDEEMABLE PARTICIPATING SHAREHOLDERS 310
NOTES TO THE FINANCIAL STATEMENTS 318
SIGNIFICANT PORTFOLIO MOVEMENTS 434
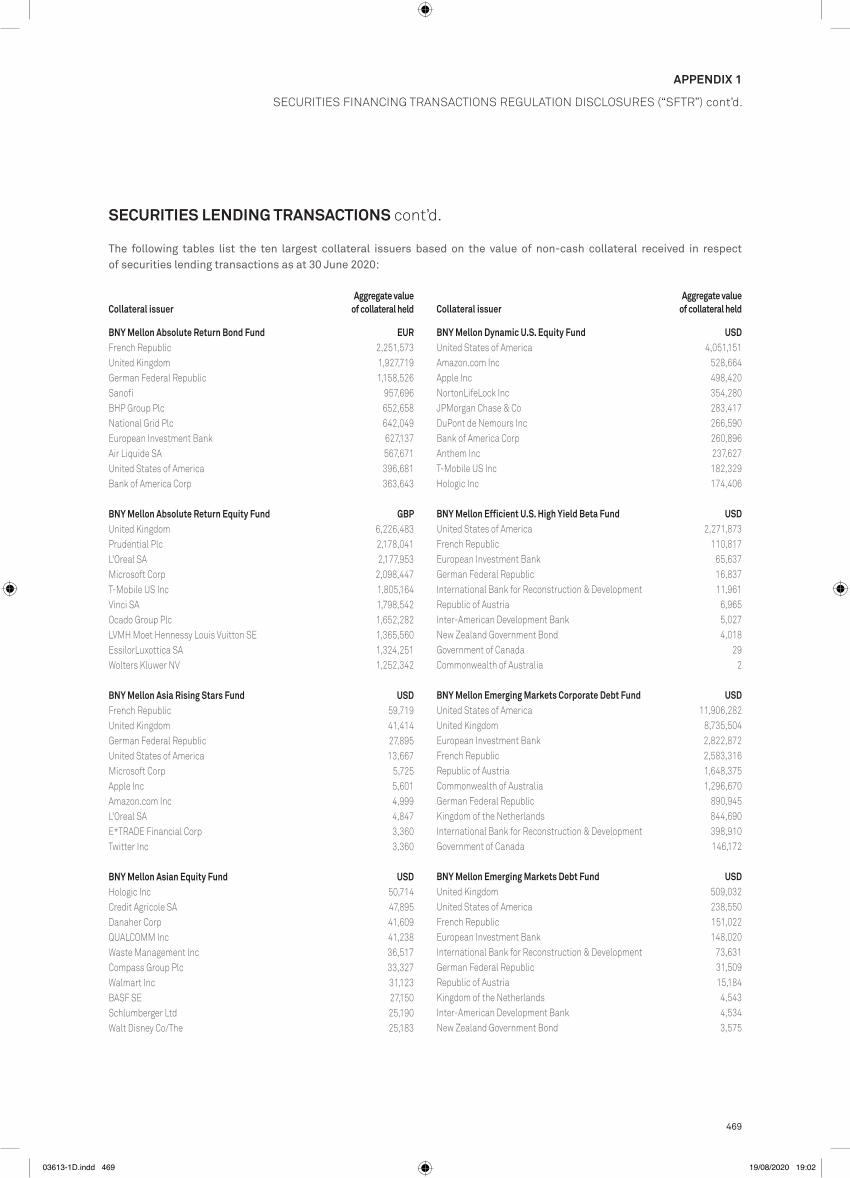
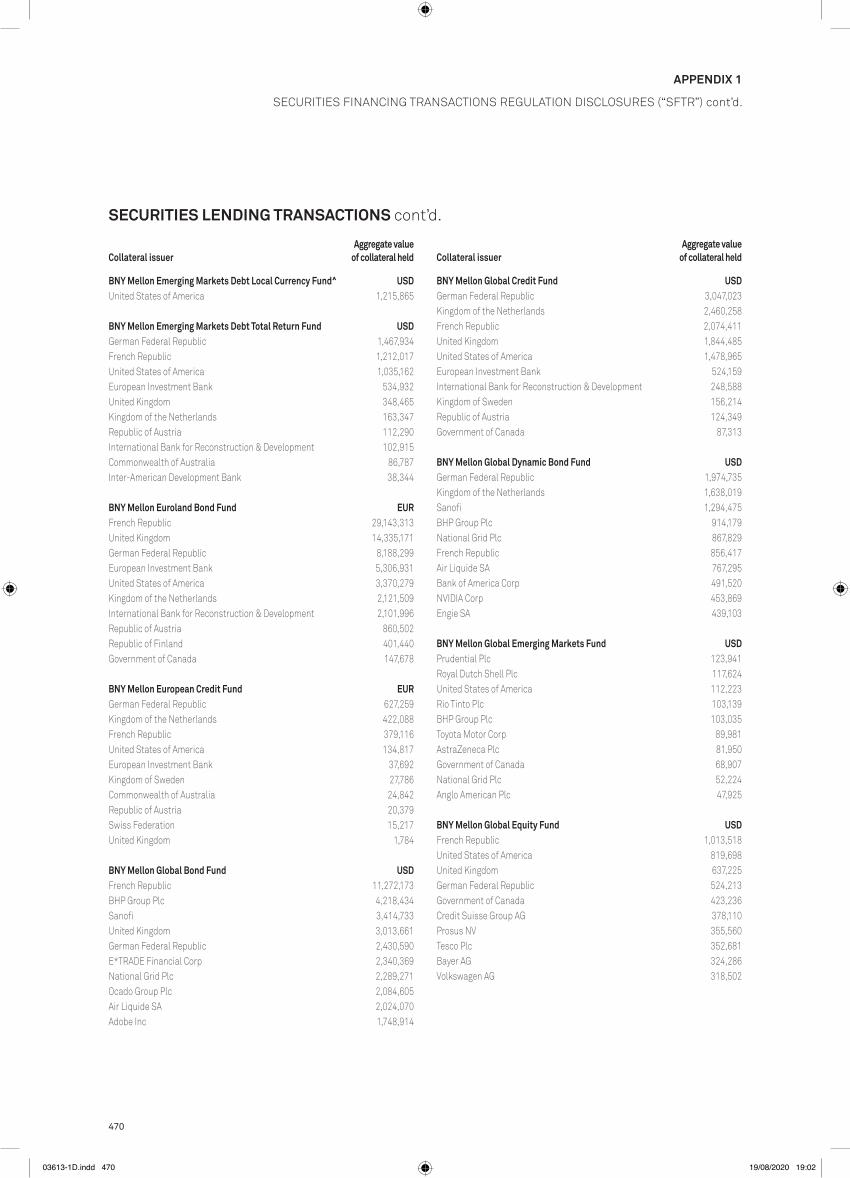
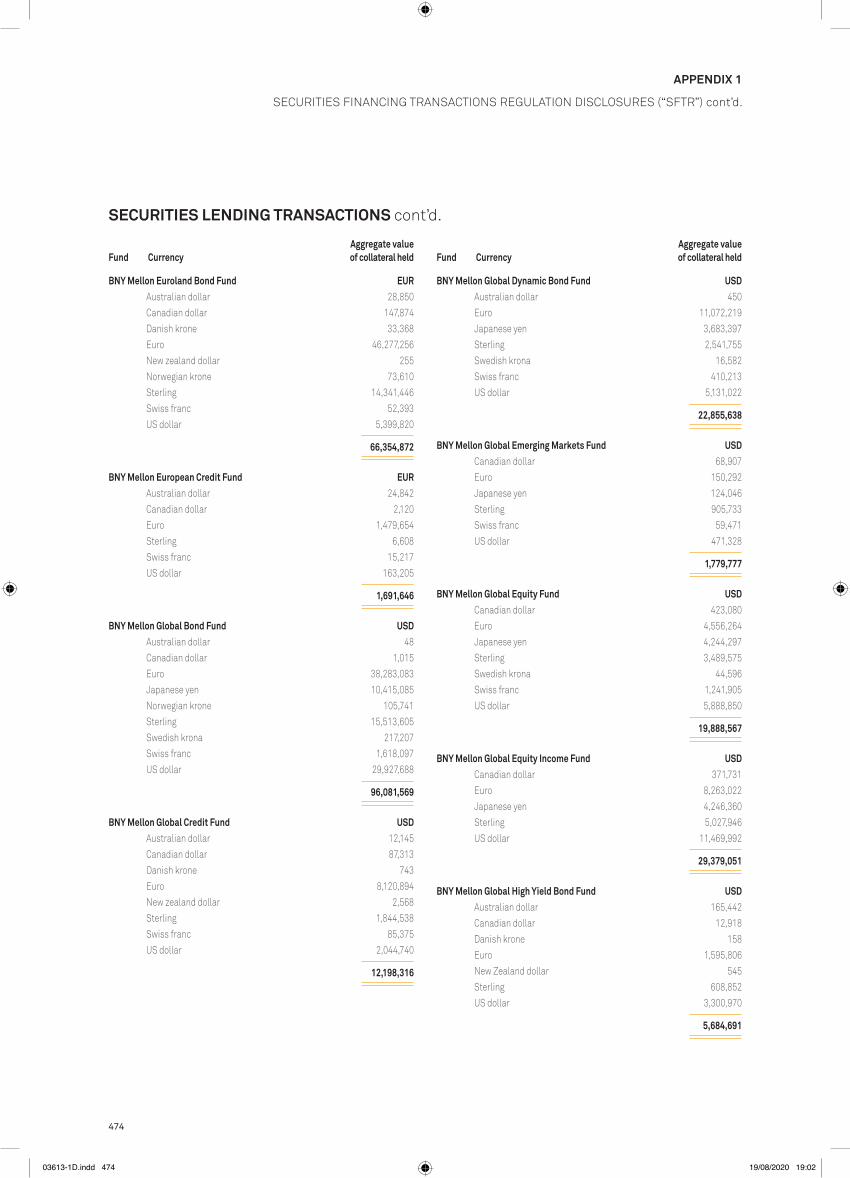
APPENDIX 1: SECURITIES FINANCING TRANSACTIONS REGULATION DISCLOSURES (“SFTR”) 464
APPENDIX 2: FINANCIAL INDICES 480
MANAGER AND OTHER INFORMATION 481
IMPORTANT INFORMATION 482
03613-1A.indd 3 19/08/2020 19:00

4
BNY MelloN GloBal FuNds, plc
of Ireland, with segregated liability between sub-funds, individually referred to as the “Fund” and collectively the “Funds”. The Company qualifies and is authorised in Ireland by the Central Bank of Ireland (the “Central Bank”) as an undertaking for collective investment in transferable securities pursuant to the European Communities (Undertakings for Collective Investment in Transferable Securities) Regulations, 2011 (as amended) (the “UCITS Regulations”). The Company currently comprises of 46 active Funds as at 30 June 2020 (31 December 2019: 44).
The history of the Funds within the Company as at the date of approval of this report and accounts is as follows:
The following information is derived from and should be read in conjunction with the full text and definitions section in the prospectus.
STRUCTUREBNY Mellon Global Funds, plc (the “Company”) was incorporated in the Republic of Ireland as a public limited company on 27 November 2000 with registration number 335837 under the Companies Act 2014. The Company changed its name from Mellon Global Funds, plc to BNY Mellon Global Funds, plc, effective 3 June 2008.
The Company is an open-ended umbrella type investment company with variable capital organised under the laws
BACkGRoUND To ThE CoMpANY
Fund Investment Manager Launch Date
BNY Mellon Absolute Insight Fund1 Insight Investment Management (Global) Limited 30 June 2014BNY Mellon Absolute Return Bond Fund Insight Investment Management (Global) Limited 9 March 2012BNY Mellon Absolute Return Equity Fund Insight Investment Management (Global) Limited 31 January 2011BNY Mellon Absolute Return Global Convertible Fund Insight Investment Management (Global) Limited 31 May 2019BNY Mellon Asia Rising Stars Fund BNY Mellon Asset Management Japan Limited 10 January 2017BNY Mellon Asian Bond Fund2 Mellon Investments Corporation 25 July 2014BNY Mellon Asian Equity Fund Newton Investment Management Limited 10 December 2001BNY Mellon Asian Income Fund Newton Investment Management Limited 9 May 2014BNY Mellon Brazil Equity Fund ARX Investimentos Ltda 31 August 2007BNY Mellon Digital Assets Fund Mellon Investments Corporation 19 February 2019BNY Mellon Dynamic Total Return Fund Mellon Investments Corporation 15 May 2015BNY Mellon Dynamic U.S. Equity Fund Mellon Investments Corporation 3 November 2017BNY Mellon Efficient EM Debt Local Currency Beta Fund^ Mellon Investments Corporation –BNY Mellon Efficient Global IG Corporate Beta Fund Mellon Investments Corporation 10 March 2020BNY Mellon Efficient U.S. high Yield Beta Fund Mellon Investments Corporation 26 September 2017BNY Mellon Emerging Markets Corporate Debt Fund Insight Investment Management (Global) Limited 31 January 2012BNY Mellon Emerging Markets Debt Fund Mellon Investments Corporation 10 May 2005BNY Mellon Emerging Markets Debt Local Currency Fund Mellon Investments Corporation 28 April 2006BNY Mellon Emerging Markets Debt opportunistic Fund Mellon Investments Corporation 27 September 2013BNY Mellon Emerging Markets Debt Total Return Fund Insight Investment Management (Global) Limited 11 December 2017BNY Mellon Euroland Bond Fund Mellon Investments Corporation 28 April 2003BNY Mellon European Credit Fund Insight Investment Management (Global) Limited 12 February 2013BNY Mellon Floating Rate Credit Rate Fund^ Alcentra Limited –BNY Mellon Global Bond Fund Newton Investment Management Limited 10 December 2001BNY Mellon Global Credit Fund Insight Investment Management (Global) Limited 29 February 2016BNY Mellon Global Dynamic Bond Fund Newton Investment Management Limited 5 August 2010BNY Mellon Global Emerging Markets Equity Value Fund3 Mellon Investments Corporation 17 July 2002BNY Mellon Global Emerging Markets Fund Newton Investment Management Limited 13 November 2012BNY Mellon Global Equity Fund Newton Investment Management Limited 10 December 2001BNY Mellon Global Equity Income Fund Newton Investment Management Limited 29 July 2010BNY Mellon Global high Yield Bond Fund Alcentra NY, LLC 11 February 2004 BNY Mellon Global Infrastructure Income Fund Mellon Investments Corporation 13 August 2018BNY Mellon Global Leaders Fund Walter Scott & partners Limited 7 December 2016BNY Mellon Global Multi-Asset Income Fund Newton Investment Management Limited 10 July 2018BNY Mellon Global opportunistic Bond Fund4 Mellon Investments Corporation 29 october 2010BNY Mellon Global opportunities Fund Newton Investment Management Limited 10 December 2001BNY Mellon Global property Securities Fund5 CenterSquare Investment Management, Inc 23 April 2008BNY Mellon Global Real Return Fund (EUR) Newton Investment Management Limited 8 March 2010BNY Mellon Global Real Return Fund (GBp) Newton Investment Management Limited 14 June 2012
03613-1A.indd 4 19/08/2020 19:00

55
BNY MelloN GloBal FuNds, plc
BACKGROUND TO THE COMPANY cont’d.
Fund Investment Manager Launch Date
BNY Mellon Global Real Return Fund (USD) Newton Investment Management Limited 30 June 2009BNY Mellon Global Short-Dated high Yield Bond Fund Insight Investment Management (Global) Limited 30 November 2016BNY Mellon Global Unconstrained Fund Newton Investment Management Limited 6 December 2017BNY Mellon Japan All Cap Equity Fund6 BNY Mellon Asset Management Japan Limited 10 December 2013BNY Mellon Japan REIT Alpha Fund6 BNY Mellon Asset Management Japan Limited 13 December 2016BNY Mellon Japan Small Cap Equity Focus Fund BNY Mellon Asset Management Japan Limited 12 December 2013BNY Mellon Long-Term Global Equity Fund Walter Scott & partners Limited 4 April 2008BNY Mellon Mobility Innovation Fund Mellon Investments Corporation 1 August 2018BNY Mellon Multi-Asset high Income Fund7 Mellon Investments Corporation 10 January 2018BNY Mellon pan European Equity Fund8 Newton Investment Management Limited 10 December 2001BNY Mellon S&p 500® Index Tracker Mellon Investments Corporation 23 March 2001BNY Mellon Small Cap Euroland Fund Mellon Investments Corporation 28 April 2003BNY Mellon Sustainable Global Dynamic Bond Fund Newton Investment Management Limited 25 February 2019BNY Mellon Sustainable Global Real Return Fund (EUR) Newton Investment Management Limited 6 February 2020BNY Mellon Targeted Return Bond Fund Mellon Investments Corporation 16 November 2015BNY Mellon U.S. Dynamic Value Fund Mellon Investments Corporation 18 September 2002BNY Mellon U.S. Equity Income Fund Mellon Investments Corporation 17 January 2017BNY Mellon U.S. Municipal Infrastructure Debt Fund Mellon Investments Corporation 19 April 2017BNY Mellon U.S. opportunistic Alpha Fund9 Newton Investment Management Limited 7 December 2018BNY Mellon U.S. Credit Select Income Fund^ Insight Investment Management (Global) Limited –BNY Mellon US opportunities Fund10 Mellon Investments Corporation 16 June 2014
1 This Fund was closed on 1 December 2017 and is pending application to the Central Bank to revoke the Fund’s registration and hence removal from the prospectus. 2 This Fund was closed on 31 May 2017 and is pending application to the Central Bank to revoke the Fund’s registration and hence removal from the prospectus. 3 This Fund was closed on 26 February 2016 and is pending application to the Central Bank to revoke the Fund’s registration and hence removal from the prospectus. 4 This Fund was closed on 7 March 2019 and is pending application to the Central Bank to revoke the Fund’s registration and hence removal from the prospectus. 5 This Fund was closed on 30 August 2017 and is pending application to the Central Bank to revoke the Fund’s registration and hence removal from the prospectus. 6 These Funds were closed on 15 February 2019 and are pending application to the Central Bank to revoke the Funds’ registration and hence removal from the prospectus. 7 This Fund was closed on 28 August 2018 and is pending application to the Central Bank to revoke the Fund’s registration and hence removal from the prospectus. 8 This Fund was closed on 9 March 2017 and is pending application to the Central Bank to revoke the Fund’s registration and hence removal from the prospectus. 9 This Fund was closed on 27 September 2019 and is pending application to the Central Bank to revoke the Fund’s registration and hence removal from the prospectus.10 This Fund was closed on 29 August 2019 and is pending application to the Central Bank to revoke the Fund’s registration and hence removal from the prospectus.^ This Fund was approved by the Central Bank but has not yet launched.
A separate pool of assets (a “portfolio”) is maintained for each Fund, each being invested in accordance with the investment objective applicable to the Fund to which the portfolio relates.
The Funds of the Company are listed on Euronext Dublin.
INVESTMENT OBJECTIVEThe assets of each Fund are invested separately in accordance with the investment objectives and policies of the relevant Fund, which are set out in the relevant supplements to the prospectus.
OTHER RELEVANT INFORMATIONAudited annual reports and financial statements and unaudited semi-annual reports are available to the public at the registered office of the Company or on www.bnymellonim.com. They can also be sent to shareholders at their registered address.
03613-1A.indd 5 19/08/2020 19:00
66
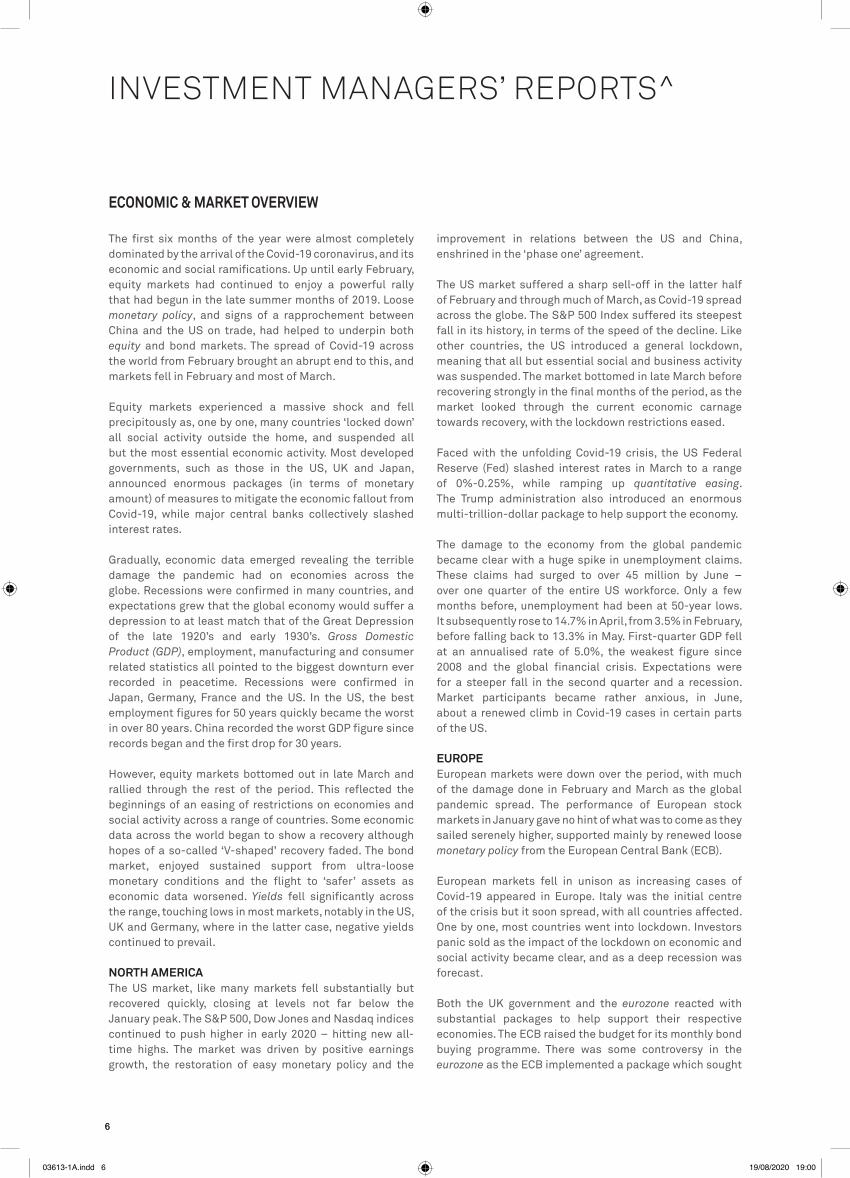
ECONOMIC & MARKET OVERVIEW
The first six months of the year were almost completely dominated by the arrival of the Covid-19 coronavirus, and its economic and social ramifications. Up until early February, equity markets had continued to enjoy a powerful rally that had begun in the late summer months of 2019. Loose monetary policy, and signs of a rapprochement between China and the US on trade, had helped to underpin both equity and bond markets. The spread of Covid-19 across the world from February brought an abrupt end to this, and markets fell in February and most of March.
Equity markets experienced a massive shock and fell precipitously as, one by one, many countries ‘locked down’ all social activity outside the home, and suspended all but the most essential economic activity. Most developed governments, such as those in the US, Uk and Japan, announced enormous packages (in terms of monetary amount) of measures to mitigate the economic fallout from Covid-19, while major central banks collectively slashed interest rates.
Gradually, economic data emerged revealing the terrible damage the pandemic had on economies across the globe. Recessions were confirmed in many countries, and expectations grew that the global economy would suffer a depression to at least match that of the Great Depression of the late 1920’s and early 1930’s. Gross Domestic Product (GDP), employment, manufacturing and consumer related statistics all pointed to the biggest downturn ever recorded in peacetime. Recessions were confirmed in Japan, Germany, France and the US. In the US, the best employment figures for 50 years quickly became the worst in over 80 years. China recorded the worst GDp figure since records began and the first drop for 30 years.
however, equity markets bottomed out in late March and rallied through the rest of the period. This reflected the beginnings of an easing of restrictions on economies and social activity across a range of countries. Some economic data across the world began to show a recovery although hopes of a so-called ‘V-shaped’ recovery faded. The bond market, enjoyed sustained support from ultra-loose monetary conditions and the flight to ‘safer’ assets as economic data worsened. Yields fell significantly across the range, touching lows in most markets, notably in the US, Uk and Germany, where in the latter case, negative yields continued to prevail.
NORTH AMERICAThe US market, like many markets fell substantially but recovered quickly, closing at levels not far below the January peak. The S&p 500, Dow Jones and Nasdaq indices continued to push higher in early 2020 – hitting new all-time highs. The market was driven by positive earnings growth, the restoration of easy monetary policy and the
improvement in relations between the US and China, enshrined in the ‘phase one’ agreement.
The US market suffered a sharp sell-off in the latter half of February and through much of March, as Covid-19 spread across the globe. The S&p 500 Index suffered its steepest fall in its history, in terms of the speed of the decline. Like other countries, the US introduced a general lockdown, meaning that all but essential social and business activity was suspended. The market bottomed in late March before recovering strongly in the final months of the period, as the market looked through the current economic carnage towards recovery, with the lockdown restrictions eased.
Faced with the unfolding Covid-19 crisis, the US Federal Reserve (Fed) slashed interest rates in March to a range of 0%-0.25%, while ramping up quantitative easing. The Trump administration also introduced an enormous multi-trillion-dollar package to help support the economy.
The damage to the economy from the global pandemic became clear with a huge spike in unemployment claims. These claims had surged to over 45 million by June – over one quarter of the entire US workforce. only a few months before, unemployment had been at 50-year lows. It subsequently rose to 14.7% in April, from 3.5% in February, before falling back to 13.3% in May. First-quarter GDp fell at an annualised rate of 5.0%, the weakest figure since 2008 and the global financial crisis. Expectations were for a steeper fall in the second quarter and a recession. Market participants became rather anxious, in June, about a renewed climb in Covid-19 cases in certain parts of the US.
EUROpEEuropean markets were down over the period, with much of the damage done in February and March as the global pandemic spread. The performance of European stock markets in January gave no hint of what was to come as they sailed serenely higher, supported mainly by renewed loose monetary policy from the European Central Bank (ECB).
European markets fell in unison as increasing cases of Covid-19 appeared in Europe. Italy was the initial centre of the crisis but it soon spread, with all countries affected. one by one, most countries went into lockdown. Investors panic sold as the impact of the lockdown on economic and social activity became clear, and as a deep recession was forecast.
Both the Uk government and the eurozone reacted with substantial packages to help support their respective economies. The ECB raised the budget for its monthly bond buying programme. There was some controversy in the eurozone as the ECB implemented a package which sought
INVESTMENT MANAGERS’ REPORTS^
03613-1A.indd 6 19/08/2020 19:00

77
BNY MelloN GloBal FuNds, plc
INVESTMENT MANAGERS’ REPORTS cont’d.
ECONOMIC & MARKET OVERVIEW cont’d.
Most major Asian central banks, including those in India and Thailand among others, were active in slashing interest rates, in an effort to support their respective economies.
In Japan, economic data remained lacklustre through the period. Data from the quarterly tankan survey (a survey of business managers’ outlook in Japan) continued to worsen, falling to the lowest reading in seven years, in the first quarter. GDp fell 7.2%, on an annualised basis, in the final quarter of 2019 (announced in 2020) largely due to the impact of an increase in the sales tax in october 2019. A recession was confirmed when GDp fell a further 2.2%, on an annualised basis, in the first quarter of 2020. Inflation remained subdued, however, and a long way below the mid to long-term official target of the Bank of Japan (BoJ) of 2.0%. For April and May it grew by just 0.1%.
FIxED INCOMEBond markets benefited from the massive monetary policy stimulus by global central banks and by a ‘flight to safety’ triggered by Covid-19, as investors sold off riskier assets, favouring the perceived relative safety of fixed income stocks. This was a strong period for bond markets in aggregate, with nearly all sectors enjoying positive returns. This was particularly the case with government and corporate bond markets, while emerging and high yield bonds noticeably lagged. Increasing signs of the fragility in global economic growth and muted inflation rates across developed nations produced a favourable environment for bond markets. Bond yields dropped dramatically, with many countries, such as the US and the Uk, experiencing all-time low yields. The 10-year US Treasury yield fell below 0.5% in March at the height of the crisis. The final quarter of the period saw yields rise gently as a greater risk-taking approach caused some investors to switch away from the safest bond holdings.
The period saw interest rates cut substantially across the globe. As Covid-19 arrived, central banks were quick to slash interest rates, in an effort to support their economies. In March, in a matter of days, the Fed cut twice by a total of 1.5%, taking the Fed fund rate down to a range of 0%-0.25%. The Bank of England also cut interest rates twice in quick succession to 0.1%.
other major government bond markets were also strong. The yield on Uk 10-year Gilts fell from approximately 0.8% at the beginning of January, to below 0.2% in March, as a result of the pandemic. Swiss and German government bond yields remained deep in negative territory. The German 10-year government bond yield fell from approximately -0.25%, at the turn of the year, to below -0.8% in March, the lowest level ever recorded, before recovering somewhat by the end of the period.
to purchase large amounts of Italian bonds, an action challenged in the German courts and opposed by other northern European countries.
The onset of Covid-19 caused European economies, already fragile, to crash. Germany, France and Italy were three of the major European economies to fall into recession. Eurozone GDp fell by 3.6% in the first quarter of 2020, on an annualised basis – the steepest fall ever recorded.
In the Uk, GDp was flat in the fourth quarter of 2019 but then fell 2.2% over the quarter in the first quarter of 2020, the worst figure since 1979, with a recession all but guaranteed as the second quarter coincided with much of the lockdown. The employment participation rate had risen to an all-time high in the Uk in the early months of 2019. Unemployment remained low (April’s level was 3.9%) even as the pandemic emerged, as many workers were furloughed under the Uk government’s scheme.
While the uncertainties around whether the Uk would leave the EU ended in January, when the Uk duly left, negotiations between the two sides continued regarding a new trading relationship although the more immediate concerns of the pandemic dominated attention.
ASIAAsian markets experienced a similar pattern to other world markets, enjoying a strong first five to six weeks of 2020 before falling substantially as Covid-19 spread. China was the strongest performing major Asian market.
Markets were buoyed in January by the signing of the ‘phase one’ agreement between China and the US. Markets then collapsed in February due to Covid-19, before recovering from late March. Due to Asian countries’ previous experience with SARS (Severe Acute Respiratory Syndrome) in 2002-2004, and the consequent quick lockdown procedures in the face of Covid-19, most major Asian countries suffered relatively lightly compared to western nations.
Chinese economic growth continued to slow. GDp growth of 6.1% in 2019 was the weakest for almost 30 years. The first quarter of 2020 saw GDp fall 6.8% as a result of the economic damage from Covid-19 and associated shutdowns of economic activity. The people’s Bank of China was active, cutting short and medium-term interest rates, and cutting commercial banks’ reserve requirement rates. The recession in hong kong worsened, as the impact of both the pro-democracy demonstrations, as well as Covid-19 took its toll. China’s threat to implement tough national security legislation added to hong kong’s woes and provoked overseas condemnation, not least from the US, which threatened to suspend hong kong’s favoured trading nation status.
03613-1A.indd 7 19/08/2020 19:00

88
BNY MelloN GloBal FuNds, plc
INVESTMENT MANAGERS’ REPORTS cont’d.
ECONOMIC & MARKET OVERVIEW cont’d. Japanese government bond yields remained at lowly levels as the BoJ retained its ultra-low interest rate policy, although this enduring policy continued to fail to spark the economy.
Corporate and high yield bonds took their cue from government bonds and also performed well, despite the low level of interest rates and yields encouraging a high level of issuance.
CURRENCy AND COMMODITIESThe US dollar was marginally higher over the period, enduring some marked volatility, as Covid-19 expanded across the globe, first falling as equity markets fell, then recovering as markets rallied before weakening off in late May and June. The dollar’s relative ‘safe-haven’ status helped it higher.
Sterling was volatile but was ultimately lower as concerns around the Uk economy prevailed.
The euro continued to rally against other currencies, a trend in place since the beginning of 2019. The euro index rose steeply over the period and attained new six-year highs. Traders looked through the current economic malaise and began to discount economic recovery.
The yen strengthened against other currencies in aggregate, and was stronger against the US over the period, benefiting from some ‘flight to safety’.
Commodities suffered a marked downturn, in aggregate, during the period, as Covid-19 spread across the world. oil prices collapsed dramatically in February and March before spiking even lower in April. West Texas Intermediate fell into negative territory as traders discounted rising storage rates, at a time when demand had totally dried up and supply was still abundant. opEC and non-opEC production cuts, amounting to approximately 10 million barrels per day, steadied the market and allowed crude oil prices to recover a little into the end of the period. Most other major industrial metals, such as iron ore and zinc, experienced similar dramatic falls, as a result of Covid-19. Copper did relatively better than most.
Gold was the key exception due to its status as a perceived ‘safe haven’, continuing a trend dating back almost two years. The economic uncertainty encouraged investors to invest in gold. By the end of the period, the gold price had moved close to an eight-year high.
All performance data is from 1 January 2020 to 30 June 2020, total return
in local currency terms unless otherwise indicated, sourced from Lipper
Hindsight and Bloomberg.
ABSOLUTE RETURN, ALTERNATIVE & MULTI-ASSET
BNy MELLON ABSOLUTE RETURN BOND FUNDover the six-month period under review, the Fund’s Euro S share class returned -1.74%, compared with a return of -0.18% for 3 Month EURIBoR (the Cash Benchmark used as a target against which to measure the Fund’s performance on a rolling 12 month basis after fees), and 1.32% for the Cash Benchmark +3% per annum (used as a target against which to measure the Fund’s performance on a rolling annualised 3 year basis before fees), all in euro terms.
The Fund generated a negative return and underperformed the Cash Benchmark.
Despite huge fiscal policy stimulus, government bond yields fell over the period as the US Federal Reserve (Fed) slashed the Fed funds rate to a range of 0 to 0.25% and announced unlimited asset purchases; the European Central Bank (ECB) kept its main refinancing rate at 0% but now has a €1.35 trillion pandemic Emergency purchase programme (pEpp). The US economy has been particularly hard hit by Covid-19, with a presidential election looming. In Europe, Brexit remains the key risk. Investment grade and high yield credit both started the year strongly, sold off sharply in March, then rebounded. ‘Safe haven’ flows supported the US dollar before it sold off as investor risk appetite returned (helping emerging market currencies).
The Fund generated a negative return over the period, as a negative contribution from its interest rate strategies outweighed a positive effect from its credit strategies.
In terms of interest rates, the largest negative effect came from our 30-year US inflation trade long position, as US inflation expectations fell sharply in March. The Fund’s country allocation positions also detracted from returns, as the long positions in German government bonds and Uk Gilts generated steep losses in March. The yield curve positions generated a small negative return. however, duration and the small currency exposures both had small positive effects.
on the credit side, investment grade and high yield bonds fared particularly well as spreads tightened following their widening in March. however, the positions in asset-backed securities, emerging market bonds, and loans registered small losses.
The manager adjusted the Fund’s positioning across its various strategies. on the interest rates side, the country allocation positions were adjusted, with two new long positions in 30-year US Treasury Inflation-Protected Securities. The long US inflation position was closed at the end of the quarter, after good performance. Also, the long duration position was increased and the Italian and US yield curve flattener trades closed. on the credit side, corporate credit exposure was reduced to neutral in February but
03613-1A.indd 8 19/08/2020 19:00

99
BNY MelloN GloBal FuNds, plc
INVESTMENT MANAGERS’ REPORTS cont’d.
Economic data releases showed an unprecedented collapse in economic activity, but as time passed, market sentiment was boosted by policy announcements, flattening infection curves and tentative steps towards re-opening economies. Equity markets rebounded from their lows in March and there was a sharp rotation within the equity market as cyclicals assumed leadership. however, a subsequent pick-up in US virus cases, together with concerns over job cuts as job support schemes around the world began to taper off, tempered optimism that a ‘V-shaped’ recovery to prior levels of growth and corporate profits would happen.
The Fund navigated the period relatively well, dynamically managing exposure to help contain the potential drawdown during February and March, and subsequently stepping into new opportunities that emerged. During the first quarter sell-off the manager observed that technical factors appeared to have caused dislocations between different share classes of the same companies: the Fund took advantage of a number of these opportunities which generally worked well. A number of other positions benefited from relative share price moves responding to differences in fundamental developments.
The largest contributor to positive performance over the period, and an example of fundamentals driving performance, was the Fund’s long position in the Italian financial services group Fineco, which generated a positive contribution and has performed strongly this year. Its share trading platform has more than doubled its revenue year on year, helped by the increase in market volatility. on the banking side, it was far less affected than rivals by the Covid-19 lockdown and subsequent recession. This is part of a wider pair which also includes a long position in Italian wealth manager, Banca Generali. The Fund’s hedges were a combination of the Italian market and a custom basket of traditional Italian banks. The Banca Generali position was sold after reports which raised governance-related concerns. The Fund may re-enter the position if those concerns are assuaged.
The market environment also led to some positions detracting from returns as the economic shutdown had unprecedented implications for particular companies and sectors. For example, the long position in media company Time out was driven by expected growth in its ‘Markets’ concept, in which different restaurants feature in one location. Recent openings had been trading well, with further openings in the pipeline. The nature of the business meant it was particularly exposed to measures to contain the coronavirus, which hurt the shares early in the period, with the Fund’s hedges in the Uk market and a Uk hospitality provider only providing a partial offset. The manager did not believe Time out’s balance sheet was sufficient to support it through extended disruption and so closed the position.
BNy MELLON ABSOLUTE RETURN BOND FUND cont’d.then some risk was added, with a focus on US long maturity investment grade bonds. however, the corporate credit exposure was then reduced, cutting the long position in investment grade bonds and moving to a short position in high yield. The manager added to the long emerging markets local rates duration exposure and maintained the defensive currency positioning.
The Fed has said that rates are on hold until at least the end of 2022. The Fed’s current guidance is that rates will not rise until it achieves its employment and inflation objectives, which seems unlikely before the end of 2022. Near-term risks remain to the downside, but negative rates seem unlikely, in the manager’s view. however, the Fed is considering yield curve control, likely focusing on maturities up to five years. The manager expects rates to remain stable for an extended period, then gradually normalise from late 2024.
With growth slowing, the ECB announced at its June meeting that it is increasing the size of the pEpp by €600bn to €1.35 trillion, with purchases under the programme continuing until at least June 2021; it will reinvest maturing securities until at least the end of 2022. The pEpp has become the ECB’s main policy tool in response to the crisis. The programme’s timescale, asset classes and jurisdictions will all remain under review, but the manager expects few changes through the end of the year.
Insight Investment Management (Global) Limited July 2020
BNy MELLON ABSOLUTE RETURN EQUITy FUNDover the six-month period under review, the Fund’s Sterling R (Acc.) share class returned -0.19% compared with a return of 0.18% for 1 Month GBp LIBoR (the Cash Benchmark used as a target against which to measure the Fund’s performance on a rolling 12 month basis after fees) and 3.18% for Cash Benchmark +6% per annum (used as a target against which to measure the Fund’s performance on a rolling annualised 5 year basis before fees), all in sterling terms.
The first six months of 2020 were characterised by extraordinary turbulence with the severe economic impact of the Covid-19 coronavirus being met with an unprecedented global policy response.
The emergence and global spread of the coronavirus led fear and distress to reverberate through equity markets from late February and particularly March. Distortions that have previously been observed, caused by central bank action and investor complacency, as well as algorithmic trading, were suddenly put into sharp focus.
ABSOLUTE RETURN, ALTERNATIVE & MULTI-ASSET cont’d.
03613-1A.indd 9 19/08/2020 19:00

1010
BNY MelloN GloBal FuNds, plc
INVESTMENT MANAGERS’ REPORTS cont’d.
ABSOLUTE RETURN, ALTERNATIVE & MULTI-ASSET cont’d.
albeit in smaller size. Given elevated market volatility, single-name exposures remained tightly hedged. over the second quarter, as sentiment and markets broadly recovered the manager methodically increased exposure through the addition of cyclical coronavirus rebound plays alongside companies that could thrive in the new world order coming out of global lockdowns. The manager continued to increase exposure as new opportunities presented themselves.
performance benefited from several trades, including Sika, Booking holdings and pioneer Natural Resources. Covid-19 theme-related trades such as DocuSign, Coupa Software, Winnebago and Sea Ltd also helped returns. Short-term tactical trades contributed positively, with positions focusing on Slack Technologies and Carnival Cruises.
Looking ahead, elevated bouts of volatility – as seen in the last week in June – argue for more diligence. The Fund is balanced with robust credit and shorter-maturity profiles together with core thematic positions the manager believes work best in a Covid-19 news flow environment.
The combined impact of unprecedented global monetary and fiscal policy easing should ensure the long-term stability of global economies, but risk assets will continue to be influenced over the short-term by Covid-19 and earnings-related announcements. The Fund continues to be positioned with an aim to preserve capital and generate positive returns as markets continue to improve. Additionally, the manager is focusing on mitigating the day to day volatility that could endure for the foreseeable future.
Insight Investment Management (Global) Limited July 2020
BNy MELLON DyNAMIC TOTAL RETURN FUNDover the six-month period under review, the Fund’s USD A (Acc.) share class returned -6.11% in US dollar terms.
The Fund declined over the period due to losses from growth and diversifying assets. The spread of Covid-19 led to an acute deterioration in sentiment as markets priced in the threat of a global recession. Efforts to slow the pandemic effectively shut down the global economy with many countries restricting their borders and ordering citizens to shelter in place. Risk assets tumbled, with equities falling the most since 2008. Equities recovered much of their gains in the second quarter. Long positions in Japanese, Uk and eurozone equities cost the most return among growth assets. A long position in US equities and high yield bonds reduced the loss.
Among diversifying assets, the sharp rise in volatility early in the period caused a loss. Currency allocations reduced the loss. Short positions in the Australian dollar and
Looking ahead, the manager sees a conducive environment for the Fund. Equity valuations appear to rely on a swift recovery back to prior levels of activity and corporate profits, which seems far from assured. however, the backdrop of policy support could support elevated valuations for some time. As we move forward, sentiment will likely oscillate around data releases, virus dynamics and policy announcements. Taken together, the manager believes this argues for conservative exposure and tight hedging of factor risks, while maintaining emphasis on stock selection risk.
Insight Investment Management (Global) Limited July 2020
BNy MELLON ABSOLUTE RETURN GLOBAL CONVERTIBLE FUNDover the six-month period under review, the Fund’s Euro U (Acc.) share class returned 1.06%, compared with a return of -0.23% for 1 Month EURIBoR, both in euro terms.
The first six months of 2020 were characterised by extraordinary turbulence with the severe economic impact of Covid-19 being met with an unprecedented global policy response.
The emergence and global spread of the Covid-19 coronavirus led fear and distress to reverberate through markets from late February and particularly March. Economic data releases showed an unprecedented collapse in economic activity, but as time passed, market sentiment was boosted by policy announcements, flattening infection curves and tentative steps towards re-opening economies. Markets rebounded from their lows in March, but a subsequent pick-up in US virus cases, together with concerns over job cuts as job support schemes around the world began to taper off, tempered optimism that a ‘V-shaped’ recovery to prior levels of growth and corporate profits would eventuate.
The Fund navigated the period well, containing potential downside through the turmoil early in the period and repositioning to capture subsequent opportunities. A key feature was the active management of individual positions and overall strategy exposures.
The Fund rapidly reduced risk exposure from mid-February. The managers closed around half of the positions in the portfolio. The managers monitored the spread of the virus, as well as the unfolding global policy response: markets had been somewhat disorderly in March, but central bank debt-purchase programmes started to improve market functionality.
pockets of value then emerged in the investment grade markets, which the Fund began to move into selectively,
BNy MELLON ABSOLUTE RETURN EQUITy FUND cont’d.
03613-1A.indd 10 19/08/2020 19:00

1111
BNY MelloN GloBal FuNds, plc
INVESTMENT MANAGERS’ REPORTS cont’d.
ABSOLUTE RETURN, ALTERNATIVE & MULTI-ASSET cont’d.
similar credit, duration, and maturity characteristics as found in the Bloomberg Barclays Global Aggregate Corporate Index, while seeking to mitigate and minimise credit rating downgrade risk and transaction costs associated with traditional sample and replication approaches.
Mellon Investments Corporation July 2020
BNy MELLON GLOBAL MULTI-ASSET INCOME FUNDover the six-month period under review, the Fund’s Euro A (Inc.) share class returned -11.32% against a return of -1.72% from the MSCI AC World NR Index/ICE BofAML Global Broad Market EUR hedged Index (60:40), both in euro terms.
The Fund produced a negative return and was behind the benchmark. Markets were very volatile because of the Covid-19 pandemic.
In the first quarter of 2020, the Fund was negatively impacted by indiscriminate selling across all asset classes, as the global pandemic spread. Within equities, it was the financials and consumer services sectors where the Fund saw the biggest detractors to performance, at that time, as lockdowns put pressure on consumer spending habits. Among other large detractors were Indian toll-road provider IRB Invit and aircraft-leasing company Doric Nimrod Air Two, as traffic on roads fell and airlines globally grounded their fleets. The Fund recovered in the second quarter of 2020 but much of the damage was already done. The Fund did benefit from positioning in the technology, consumer goods and industrials sectors within equities, and strong performance within alternatives from a rebound in economic infrastructure and renewables. Within bonds, emerging market and sub-investment grade bonds performed best.
In terms of activity, prior to the market rout, a position in ping An Insurance, China’s leading life insurer, was bought. The growth opportunity for protection products in China is the largest in the world, and margins are the highest in Asia. A position in European tyre manufacturer Continental was made. The company is undergoing a corporate restructure, spinning off its troubled power-train business which could lead to a better return on investment capital and cash-flow returns for the remaining business. A position in Germany’s Bayer, a global leader in crop chemicals and seeds, was also taken.
Within alternatives, the manager added to several names including Gresham house Energy Storage which raised equity to fund the purchase of an operational asset and expand battery operations at one of its sites. Sales included asset manager M&G while reductions were made in renewable energy stocks Greencoat Uk Wind and octopus Renewables.
Canadian dollar drove the positive return from currency allocations. The US dollar rose early in the year as it was a beneficiary of ‘safe haven’ demand. Commodity and growth currencies were sharply lower as commodity prices, and specifically energy, tumbled early in the year.
Defensive assets added to performance due to a long position in US bonds. The heightened risk aversion and historic policy stimulus from the US Federal Reserve drove Treasury yields to historic lows. The yield on the US 10-year Treasury note fell 126 basis points to 0.66%, helping the Fund’s long Treasury position gain. The manager added a corporate bond position during late March that also contributed return after spreads narrowed later in the period.
As uncertainty grew and fundamentals underwent substantial changes, the manager significantly de-risked the Fund. A key element to the risk reduction was the change in the equity risk premium. higher nominal yields across all credit sectors reduced the expected risk premium of stocks relative to bonds. In conjunction, equity analysts had been writing down future earnings expectations, with the manager’s models signalling that more write-downs were likely as the growth shock becomes more evident. Further, the Fund’s risk modelling factored in a more sustained level of uncertainty for future fundamental expectations. Later in the period, as risk indicators improved some growth asset exposure was added back to the Fund, finishing the period with a moderately defensive allocation.
Mellon Investments Corporation July 2020
BNy MELLON EFFICIENT GLOBAL IG CORpORATE BETA FUNDThe Fund was launched on 10 March 2020.
over the reporting period since its inception, the Fund’s USD W (Acc.) share class returned 2.16% compared with a return of 1.54% for the Bloomberg Barclays Global Aggregate Corporate TR Index (USD hedged), both in US dollar terms.
After sharply lower performance in March as the spread of Covid-19 led to an acute deterioration in sentiment, corporate bonds recovered during the second quarter as central banks responded with unprecedented fiscal and monetary policy stimulus and Covid-19 lockdowns eased, boosting optimism for recovery. New issuance rose to record levels in both the US and Europe and investors continued their search for yield after spreads widened considerably early in the year and sovereign yields fell sharply.
The fund is positioned to provide diversified exposure to global investment grade corporate bond securities with
BNy MELLON DyNAMIC TOTAL RETURN FUND cont’d.
03613-1A.indd 11 19/08/2020 19:00

1212
BNY MelloN GloBal FuNds, plc
INVESTMENT MANAGERS’ REPORTS cont’d.
ABSOLUTE RETURN, ALTERNATIVE & MULTI-ASSET cont’d.
More positively, electric vehicle battery manufacturer Samsung SDI was a standout performer, benefiting from South korean and European Commission green energy initiatives. M3, the Japanese provider of internet medical services, was a beneficiary of the Covid-19 pandemic, as medical consultations increasingly moved online due to social distancing restrictions. Meanwhile, Microsoft also performed well, as positive results drove upgrades to analyst forecasts. The coronavirus and working from home trends have accelerated adoption for services like cloud computing.
The continuing Covid-19 pandemic will significantly affect the short-term earnings outlook for the global economy. A balance between the health risk of easing lockdown restrictions prior to the development of a successful vaccine and the risk to the health of the global economy with continued closures will need to be found. Second wave outbreaks and localised lockdowns seem likely, preventing a return to ‘normal’ over the short-term.
Looking ahead, focus remains on the key investment themes that, in the manager’s view, could drive earnings growth and positive returns over the long term. The Fund’s unconstrained approach allows the manager to focus on only those stocks demonstrating sustainable competitive advantages, high returns on capital and conservative balance sheets. This should allow the manager to unearth a range of ideas and to construct a balanced portfolio comprising a variety of diverse investment cases.
Newton Investment Management Limited January 2020
BNy MELLON GLOBAL REAL RETURN FUND (EUR)over the six-month period under review, the Fund’s Euro A share class returned -2.64%, compared with a return of 1.77% for 1 Month EURIBoR + 4% per annum, both in euro terms.
The Fund generated a negative return and ended the period behind the benchmark. Market conditions were volatile, primarily as a result of the repercussions of the Covid-19 pandemic, although they did subsequently recover, largely erasing their losses.
Return-seeking assets detracted from returns over the period. Synthetic exposure was a significant detractor, largely due to written put options on equity indices, designed to gain further upside exposure at more attractive levels, which suffered from the sudden, sharp fall in markets. The Fund’s equity holdings also contributed negatively to returns. Negative contributions came from aerospace and defence (General Electric and Thales) and the oil and gas sector (Royal Dutch Shell and Total), where investors anticipated a more protracted recovery. on the positive side
The manager’s outlook remains cautious, believing that investors should position themselves in those business models with the strength to survive the crisis and emerge structurally intact or stronger, while being mindful of valuations in all asset classes.
While there has been significant market volatility, alongside a great number of dividend cuts in equity markets over the course of the year, the Fund has still been able to deliver a stable income during a period that has been particularly challenging for income investors. This is testament to the structure and philosophy of the Fund, which ensures that the manager focuses on the characteristics of the individual securities that are required to meet the income objective, rather than on arbitrary benchmarks that may not meet the outcome that the Fund requires.
Newton Investments Management Limited July 2020
BNy MELLON GLOBAL UNCONSTRAINED FUNDover the six-month review period, the Fund’s USD W (Acc.) share class returned -2.00%, compared with a return of -0.87% for the benchmark, comprising 60% MSCI AC World NR Index and 40% Jp Morgan Global GBI Unhedged TR Index, and -4.50% for the Lipper Global – Mixed Asset USD Balanced-Global sector average, all in US dollar terms.
The Fund produced a negative return and was behind the benchmark but performed better than its sector average.
Equity markets began 2020 in the way 2019 ended – in rally mode. however, the spread of Covid-19 led to sharp market declines during the first quarter before unprecedented monetary and fiscal policy measures helped markets to recover. Stock selection was a positive factor behind relative returns, with both equity and commodity holdings contributing. however, asset allocation detracted, with the overweight positions in equities and underweight in bonds detrimental.
Laureate Education was a key detractor as the company reported a lower than expected student enrolment for its educational courses. In banking, Citigroup also negatively affected returns, as investors continued to fret about the impact of the lower for longer interest rate environment on profitability and the prospect of coronavirus-related increases in bad loans. Suncor Energy was weak, subdued by the oil demand shock caused by Covid-19 amid ongoing oversupply in the industry. While the oil price recovered and various nations initiated production cuts, the outlook for future pricing dynamics is distinctly cloudy.
BNy MELLON GLOBAL MULTI-ASSET INCOME FUND cont’d.
03613-1A.indd 12 19/08/2020 19:00

1313
BNY MelloN GloBal FuNds, plc
INVESTMENT MANAGERS’ REPORTS cont’d.
ABSOLUTE RETURN, ALTERNATIVE & MULTI-ASSET cont’d.
BNy MELLON GLOBAL REAL RETURN FUND (GBp)over the six-month period under review, the Fund’s Sterling C (Inc.) share class returned -2.50%, compared with a return of 2.18% for 1 Month GBp LIBoR + 4% per annum, both in sterling terms.
The Fund generated a negative return and ended the period behind the benchmark. Market conditions were volatile, primarily as a result of the repercussions of the Covid-19 pandemic, although they did subsequently recover, largely erasing their losses.
Return-seeking assets detracted from returns over the period. Synthetic exposure was a significant detractor, largely due to written put options on equity indices, designed to gain further upside exposure at more attractive levels, which suffered from the sudden, sharp fall in markets. Emerging market debt, which was reduced over the period, was also weaker. The Fund’s equity holdings contributed positively to returns. The Fund’s technology stocks such as Microsoft, ASML and SAp benefited from strong performance as demand for digital and online products surged during the lockdown, reinforcing their solid market position. Contributing negatively were aerospace and defence holdings (General Electric and Thales) and oil and gas sector stocks (Royal Dutch Shell and Total), where investors anticipated a more protracted recovery. Corporate bonds, supported by central bank buying, and to a lesser extent, alternatives, were both positive contributors to returns.
Stabilising assets and hedging positions had a positive impact on Fund returns. precious metals, specifically gold, and government bonds performed strongly. The gold price rose towards an eight-year high while government yields dropped to all-time lows in many cases. Both asset classes benefited from the economic turmoil and quantitative easing, driving investors towards relative ‘safe havens’. Derivative instruments also contributed positively. however, currency hedging was a negative factor, as a number of foreign currencies appreciated versus sterling over the period.
In terms of activity, the manager purchased index put options and added to the Fund’s gold position, early in the period, as concerns around Covid-19 rose. In the second quarter of 2020, the key activity involved increasing the magnitude of the Fund’s return-seeking core following the first quarter’s correction. Net equity exposure was raised through a combination of individual security purchases, taking advantage of attractive valuations, and by paring back equity protection in favour of indirect protection. The manager also increased exposure to corporate debt in order to take advantage of the wider spread in yields over government bonds. Exposure to US Treasuries was taken sharply higher through the purchase of both 10-year and 30-year futures, although more recently the manager
were technology stocks such as Microsoft, SAp and ASML which benefited from strong performance as demand for digital and online products surged during the lockdown, reinforcing their solid market position. Emerging market debt, alternatives and corporate bonds were also negative contributors to returns.
Stabilising assets and hedging positions had a positive impact on Fund returns. precious metals, specifically gold, performed strongly, with the gold price rising towards an eight-year high. Government bonds also provided positive returns as yields dropped to all-time lows in many cases. Both asset classes benefited from the economic turmoil and quantitative easing, driving investors towards relative ‘safe havens’. Derivative instruments also contributed positively while currency hedging was a notable positive factor, as the euro strengthened over the period.
In terms of activity, the manager purchased index put options and added to the Fund’s gold position, early in the period, as concerns around Covid-19 rose. In the second quarter of 2020, the key activity involved increasing the magnitude of the Fund’s return-seeking core following the first quarter’s correction. Net equity exposure was raised through a combination of individual security purchases, taking advantage of attractive valuations, and by paring back equity protection in favour of indirect protection. The manager also increased exposure to corporate debt in order to take advantage of the wider spread in yields over government bonds. Exposure to US Treasuries was taken sharply higher through the purchase of both 10-year and 30-year futures, although more recently the manager consolidated the position in the 10-year maturity owing to concerns about potential yield curve steepening due to the potentially inflationary consequences of ballooning government spending.
Despite having a more constructive view of risk assets since they reached their lows in late March, the manager remains vigilant of the manifold risks, including economic deterioration, hugely increasing debt levels from a potent combination of monetary and fiscal policy, and a potential second wave of the Covid-19 pandemic. While exposure to risk assets is now higher than at the end of the previous quarter, this is set against greater commitments to stabilising assets, principally US Treasury bonds and gold, both of which can act as hedges for the Fund in a range of scenarios. Furthermore, the Fund’s asset allocation remains dynamic in nature and, as has been shown over time, the manager is prepared to materially adjust this as the evolving outlook necessitates.
Newton Investment Management Limited July 2020
BNy MELLON GLOBAL REAL RETURN FUND (EUR) cont’d.
03613-1A.indd 13 19/08/2020 19:00

1414
BNY MelloN GloBal FuNds, plc
INVESTMENT MANAGERS’ REPORTS cont’d.
an eight-year high. Government bonds also provided positive returns as yields dropped to all-time lows in many cases. Both asset classes benefited from the economic turmoil and quantitative easing, driving investors towards relative ‘safe havens’. Derivative instruments also contributed positively while currency hedging was a notable positive factor, as the US dollar strengthened over the period.
In terms of activity, the manager purchased index put options and added to the Fund’s gold position, early in the period, as concerns around Covid-19 rose. In the second quarter of 2020, the key activity involved increasing the magnitude of the Fund’s return-seeking core following the first quarter’s correction. Net equity exposure was raised through a combination of individual security purchases, taking advantage of attractive valuations, and by paring back equity protection in favour of indirect protection. The manager also increased exposure to corporate debt in order to take advantage of the wider spread in yields over government bonds. Exposure to US Treasuries was taken sharply higher through the purchase of both 10-year and 30-year futures, although more recently the manager consolidated the position in the 10-year maturity owing to concerns about potential yield curve steepening due to the potentially inflationary consequences of ballooning government spending.
Despite having a more constructive view of risk assets since they reached their lows in late March, the manager remains vigilant of the manifold risks, including economic deterioration, hugely increasing debt levels from a potent combination of monetary and fiscal policy, and a potential second wave of the Covid-19 pandemic. While exposure to risk assets is now higher than at the end of the previous quarter, this is set against greater commitments to stabilising assets, principally US Treasury bonds and gold, both of which can act as hedges for the Fund in a range of scenarios. Furthermore, the Fund’s asset allocation remains dynamic in nature and, as has been shown over time, the manager is prepared to materially adjust this as the evolving outlook necessitates.
Newton Investment Management Limited July 2020
BNy MELLON SUSTAINABLE GLOBAL REAL RETURN FUND (EUR)The Fund was launched on 6 February 2020.
over the reporting period since its inception, the Fund’s Euro W (Acc.) share class returned -2.85%, compared with a return of 1.41% for 1 EURIBoR month +4% per annum, both in euro terms.
The Fund produced a negative return and was behind the benchmark.
consolidated the position in the 10-year maturity owing to concerns about potential yield curve steepening due to the potentially inflationary consequences of ballooning government spending.
Despite having a more constructive view of risk assets since they reached their lows in late March, the manager remains vigilant of the manifold risks, including economic deterioration, hugely increasing debt levels from a potent combination of monetary and fiscal policy, and a potential second wave of the Covid-19 pandemic. While exposure to risk assets is now higher than at the end of the previous quarter, this is set against greater commitments to stabilising assets, principally US Treasury bonds and gold, both of which can act as hedges for the Fund in a range of scenarios. Furthermore, the Fund’s asset allocation remains dynamic in nature and, as has been shown over time, the manager is prepared to materially adjust this as the evolving outlook necessitates.
Newton Investment Management Limited July 2020
BNy MELLON GLOBAL REAL RETURN FUND (USD)over the six-month period under review, the Fund’s USD A share class returned -2.01%, compared with a return of 2.44% for 1 Month USD LIBoR + 4% per annum, both in US dollar terms.
The Fund generated a negative return and ended the period behind the benchmark. Market conditions were volatile, primarily as a result of the repercussions of the Covid-19 pandemic, although they did subsequently recover, largely erasing their losses.
Return-seeking assets detracted from returns over the period. Synthetic exposure was a significant detractor, largely due to written put options on equity indices, designed to gain further upside exposure at more attractive levels, which suffered from the sudden, sharp fall in markets. The Fund’s equity holdings also contributed negatively to returns. Negative contributions came from aerospace and defence (General Electric and Thales) and the oil and gas sector (Royal Dutch Shell and Total), where investors anticipated a more protracted recovery. on the positive side were technology stocks such as Accenture, Apple, Microsoft and ASML which benefited from strong performance as demand for digital and online products surged during the lockdown, reinforcing their solid market position. Emerging market debt, which was reduced over the period, alternatives and, to a lesser extent, corporate bonds were also negative contributors to returns.
Stabilising assets and hedging positions had a positive impact on Fund returns. precious metals, specifically gold, performed strongly, with the gold price rising towards
ABSOLUTE RETURN, ALTERNATIVE & MULTI-ASSET cont’d.BNy MELLON GLOBAL REAL RETURN FUND (GBp) cont’d.
03613-1A.indd 14 19/08/2020 19:00
1515
BNY MelloN GloBal FuNds, plc
INVESTMENT MANAGERS’ REPORTS cont’d.
Markets showed resiliency to start the year while continuing to march higher despite US-Iran geopolitical tensions. however, sentiment turned dramatically negative due to the rapid spread of Covid-19 and unprecedented government responses that effectively closed down the global economy. Markets began to rebound in the second quarter as economic green shoots emerged in high frequency data on the back of monetary and fiscal policy stimulus in both developed and emerging economies. policy support has continued and within China, where the disease first took hold, production is bouncing back. however global trade has taken a significant hit and the first wave of Covid-19 is continuing to spread across the world.
The Fund had entered the downswing in markets with a relatively modest risk budget and although what allocation it did hold to corporate credit and emerging market debt contributed to a negative total return in the first quarter, it was able to position aggressively for the rebound in credit spreads and since March has generated strong return as corporate spreads have tightened from the wides seen towards the end of the previous quarter. The Fund held c.37.5% in investment grade corporate bonds and a further 4% in high yield corporate bonds at the end of June compared to a combined figure of 8.3% at the end of February 2020 ahead of the major downturn in markets the following month.
overall duration of the Fund increased by c.1 year from December 2019 to stand at c.1.5 years as at 30 June 2020 with an average credit rating of A. The Fund maintains diversification across approximately 200 individual bonds generating a weighted current yield of 2.03% (1.48% on a yield to worst basis), both expressed in US dollar terms.
Mellon Investments Corporation July 2020
Markets, particularly equities, began 2020 in the way 2019 ended – in rally mode. however, the spread of Covid-19 led to sharp market declines before unprecedented monetary and fiscal policy measures facilitated a recovery.
Return-seeking assets made a negative contribution overall, with all categories detracting. Equities, and emerging market debt were the key underperformers. Stabilising assets and hedging positions, meanwhile, contributed positively but not sufficiently to offset weakness in return-seeking assets. Currency hedging instruments and precious metals were the top performers.
The holdings in iShares physical Gold, Invesco physical Gold and Amundi physical Metals were the top performers. Gold is often considered both a ‘safe haven’ and an inflation hedge, and performed well in the wake of the Covid-19 pandemic and associated stimulus. Chinese social media and video-gaming company Tencent outperformed, benefiting from increased stay at home demand. Microsoft and Amazon also boosted returns for similar reasons. Both have experienced increased demand for their services and products given the closure of workplaces and shops during the coronavirus lockdowns.
on the downside, fund management business M&G was a detractor, as weak financial markets and asset outflows affected sentiment. The holding in support services firm Bureau Veritas also weighed on returns, as the company reported steep coronavirus-related declines in its consumer products and certification businesses. Similarly, trade fair company Informa suffered from the cancellation of many key conferences.
While our view of risk assets is more constructive, the manager remains conscious of the many risks still facing the global economy. Fund exposure to risk assets has increased but is counterbalanced by greater commitment to stabilising assets, which can act as hedges for the Fund in a range of scenarios. Furthermore, the asset allocation remains dynamic in nature and, as has been shown over time, the manager is prepared to materially adjust this as the evolving outlook requires.
Newton Investment Management Limited July 2020
BNy MELLON TARGETED RETURN BOND FUNDover the six-month review period, the Fund’s USD A (Acc.) share class returned 2.60%, compared with a return of 0.24% for the Lipper Global – Bond Global USD sector average, both in USD terms.
ABSOLUTE RETURN, ALTERNATIVE & MULTI-ASSET cont’d.BNy MELLON SUSTAINABLE GLOBAL REAL RETURN FUND (EUR) cont’d.
03613-1A.indd 15 19/08/2020 19:00
1616
BNY MelloN GloBal FuNds, plc
INVESTMENT MANAGERS’ REPORTS cont’d.
German property manager Deutsche Wohnen was sold outright as the shares recovered from prior regulatory concerns. Meanwhile, the lack of near-term catalysts and a challenging US pharmacy backdrop prompted the manager to sell the remaining holding in Walgreens Boots Alliance.
Looking ahead, the manager’s focus remains on the key investment themes that could drive earnings growth and positive returns over the long term. At company level, key attributes, like sustainable competitive advantage, high returns on capital and conservative balance sheets, are central to the manager’s analysis. These could allow the manager to unearth a range of ideas and to construct a balanced portfolio comprising a variety of diverse investment cases.
Newton Investment Management Limited July 2020
BNy MELLON GLOBAL EQUITy INCOME FUNDover the six-month period under review, the Fund’s USD A (Inc.) share class returned -13.14%, compared with a return of -6.20% for the FTSE World TR Index and -12.06% for the Lipper Global – Equity Global Income sector average, all in US dollar terms.
The Fund produced a negative return and was behind both the benchmark and the sector.
Equity markets began 2020 in the way 2019 ended – in rally mode. however, the spread of Covid-19 led to sharp market declines during the first quarter before unprecedented monetary and fiscal policy measures helped markets to recover. Stock selection was negative for returns overall, in particular within consumer services, consumer staples and technology. on the plus side, financials made a positive contribution. By contrast, asset allocation by industry was positive, with financials again the standout.
Trade fair company Informa was hit hard by the Covid-19 pandemic, as global travel disruption meant many of its events and conferences were cancelled or postponed. Beauty products manufacturer Coty also detracted after announcing higher than expected restructuring costs. Meanwhile, not holding Microsoft hurt returns, as the shares rose after the coronavirus accelerated adoption of its cloud software services.
More positively, pharmaceutical companies Gilead Sciences and Roche were two of the strongest performers. Gilead Sciences’ share price advanced on hopes that its drug Remdesivir could be an effective treatment for Covid-19, while Roche stock gained after the US Food and Drug Administration granted emergency authorisation for its coronavirus test. Elsewhere, Qualcomm shares
GLOBAL EQUITy
BNy MELLON GLOBAL EQUITy FUNDover the six-month review period, the Fund’s USD A share class returned -4.68%, compared with a return of -6.25% for the MSCI AC World NR Index and -6.00% for the Lipper Global – Equity Global sector average, all in US dollar terms.
The Fund produced a negative return but was ahead of the benchmark. Equity markets began 2020 in the way 2019 ended – in rally mode. however, the spread of Covid-19 led to sharp market declines during the first quarter before unprecedented monetary and fiscal policy measures helped markets to then recover.
Stock selection and sector allocation were both positive influences on relative returns. Stock selection was strongest in consumer discretionary and financials, with communications services the main laggard. Microsoft performed well, as positive results drove upgrades to analyst forecasts. The coronavirus and working from home trends have accelerated adoption for services like cloud computing. Elsewhere, electric vehicle battery manufacturer Samsung SDI outperformed, benefiting from South korean and European Commission green energy initiatives and positive news on its Gen 5 battery. Dollar General was another standout, as the US discount retailer benefited from increased purchases of day to day goods, such as toilet paper and foodstuffs, needed to sustain consumers now required to work from home.
Citigroup was the principal detractor as investors continued to fret about the impact of the lower for longer interest rate environment on profitability. oil major Royal Dutch Shell also lagged, as the coronavirus prompted a demand shock amid ongoing oil oversupply and forced management cut the dividend for the first time since 1945. Trade fair company Informa was also weak, as Covid-19 caused the cancellation of many key conferences, although the manager believes the shares could recover once face to face marketing resumes.
Transactions included adding to Mastercard on weakness caused by Covid-19-related declines in cross-border travel. In the manager’s view, investors penalised the shares excessively and the holding was increased. The manager also established a position in ping An Insurance, China’s leading life insurer. The growth opportunity for protection products in China is significant and margins are the highest in Asia. Elsewhere, the manager took the opportunity to purchase German automotive supplier Continental. Cost-cutting in its tyre division and signs of recovery in Chinese automotive production suggest the company is in a good position to increase market share through the downturn.
holdings were reduced in selected growth-oriented stocks after some strong relative performance. These included L’oréal, Roche, Merck, Costco Wholesale and Novartis.
03613-1A.indd 16 19/08/2020 19:00

1717
BNY MelloN GloBal FuNds, plc
INVESTMENT MANAGERS’ REPORTS cont’d.
performance, though the main contributor to relative performance was the Fund’s considerable underexposure to the financials sector.
At the stock level, Adobe was a major contributor to the Fund’s performance. The adoption of information technology products and services is being accelerated by the pandemic, and could underpin the long-term growth outlook for the publishing software company. New purchase Illumina, a gene sequencing company which is involved in fields ranging from cancer research to agriculture, also performed strongly, while Japanese sensor company keyence posted solid gains following the announcement of resilient fourth-quarter fiscal year 2020 results.
Businesses more affected by the economic shutdowns saw significant falls. Energy companies Schlumberger and EoG Resources fell sharply over the period, reflecting the volatility in the oil market as a result of the initial Saudi-driven supply shock, and the demand downdraught brought about by the pandemic. Spanish retailer Inditex, owner of the Zara brand, has temporarily been affected by inevitable store closures, though the company continues to strengthen the business by closing some less-efficient stores and increasing online sales.
In addition to Illumina, new purchases in the period included ASML, a leading provider of vital equipment for the semiconductor industry, Edwards Lifesciences, a pioneering manufacturer of products for the treatment of heart disease, and analogue semiconductor maker Texas Instruments. Disposals included Gilead Sciences, Johnson & Johnson, Schlumberger and Starbucks. In the context of the current environment, the manager felt there were unquantifiable downside risks to Starbucks’ operations in the short-term, and concerns have grown about its weakened balance sheet.
Looking ahead, tempering the more positive economic indicators is the fact that the pandemic containment measures are leaving a deep scar on countries across the world. Labour markets remain fragile, with unemployment high. Many companies are still experiencing demand attrition in this tough environment. The crisis has highlighted the frailties of over-leveraged companies with vulnerable business models. As this pernicious downturn runs its course, adaptability, innovation, tried and tested management and balance sheet rigour are paramount, in the manager’s view. These are qualities that sit at the core of the companies in which the Fund invests.
Walter Scott & partners Limited July 2020
continued to respond positively to strong semiconductor sales driven by demand for ever-more sophisticated chips.
Activity involved taking profits from Gilead Sciences. Expectations for its Covid-19 treatment are high and, even if successful, it is unlikely to be a material part of the business. Cosmetics business Coty was sold due to excessive debt, while the turnaround needed to stabilise the business will be very difficult in competitive markets, in the manager’s view. The manager sold the holding in harley-Davidson on share price strength. While the company owns an iconic brand, it is facing environmental and demographic headwinds.
purchases included ping An Insurance, China’s leading life insurer. The growth opportunity for protection products in China is significant and margins are the highest in Asia. Banking business Citigroup was also added after the shares fell in tandem with the US sector, despite lower interest rate sensitivity and an attractive share repurchase plan. Finally, a position in Japanese telecommunications giant kDDI was acquired. The Japanese market remains structurally attractive and with its strong customer service, keen pricing and an attractive dividend, kDDI could support returns.
The Fund’s disciplined income strategy remains as relevant today as it has ever been, in the manager’s view. It remains to be seen whether the rapid ‘V-shaped’ economic recovery being discounted by markets transpires. An active, stockpicking approach is essential in navigating the challenging environment and in identifying the companies that can survive and thrive longer-term once business conditions normalise.
Newton Investment Management Limited July 2020
BNy MELLON GLOBAL LEADERS FUNDover the six-month period under review, the Fund’s USD A (Acc.) share class returned -1.24% compared to -5.77% for the MSCI World NR Index and -5.91% for the Lipper Global – Equity Global sector average, all in US dollar terms.
After the significant downdraught of the first quarter of 2020, global equity indices staged a partial recovery despite the ongoing economic damage being wrought by the Covid-19 pandemic and associated containment measures. The rally has its roots in the massive fiscal and monetary policy stimuli being deployed by policymakers across the globe, and the gradual re-emergence of a number of economies from lockdown.
Information technology and healthcare stocks featured prominently among the top contributors to absolute
BNy MELLON GLOBAL EQUITy INCOME FUND cont’d.
GLOBAL EQUITy cont’d.
03613-1A.indd 17 19/08/2020 19:00
1818
BNY MelloN GloBal FuNds, plc
INVESTMENT MANAGERS’ REPORTS cont’d.
the opportunity to establish a holding in the company. The manager initiated a position in US homebuilder Lennar before selling the stock when the company recovered well from the lows witnessed in March.
The manager reduced the holding in Gilead Sciences with its shares supported by a series of positive updates around the use of its drug Remdesivir as a treatment for Covid-19. Recognising the weakening macroeconomic backdrop in Norway and an environment of record low interest rates, the manager sold all but a small residual holding in DNB, given its shares have performed well relative to the broader banking sector for several years.
With investors anticipating a swift recovery in economies, employment and corporate earnings, the upturn in global equities since March’s rapid market declines has been eye-catching. Financial markets may yet reconnect with the reality of such a testing environment and, against a liquidity-driven backdrop, the manager feels it is important to retain a focus on individual holdings, their long-term prospects and valuations. The manager remains concentrated on ensuring that the portfolio is well placed for the environment that the Fund’s investment themes suggest will be seen in the future.
Newton Investment Management Limited July 2020
BNy MELLON LONG-TERM GLOBAL EQUITy FUNDover the six-month reporting period, the Fund’s Euro A share class returned -5.03%, compared with a return of -5.82% for the MSCI World NR Index and -5.97% for the Lipper Global – Equity Global sector average, all in euro terms.
This first quarter of 2020 saw new highs in a few major indices give way to market falls of the magnitude not seen since the crash of 1987. The measures enacted to combat the spread of the Covid-19 virus impacted almost every aspect of economic activity. however, global equity markets staged a significant recovery in the second quarter of 2020. Despite a litany of negatives, investor sentiment has been bolstered by the extraordinary monetary and fiscal policy stimuli being deployed almost worldwide to resuscitate economic growth, and an easing of containment measures in various countries as the pandemic ebbs.
Information technology stocks featured as major contributors to returns on an absolute basis, though on a relative basis, the Fund’s limited exposure to the lagging financial sector was the largest contributor to performance.
This six-month period has seen investors pursue growth themes less affected by Covid-19. Indeed, the pandemic
BNy MELLON GLOBAL OppORTUNITIES FUNDover the six-month period under review, the Fund’s USD A share class returned -7.48% against a return of -6.25% from the MSCI AC World NR Index, both in US dollar terms.
The Fund produced a negative return that was behind the benchmark.
At the industry level, asset allocation was positive, with an overweight position in information technology contributing most, while an underweight to consumer discretionary detracted. Stock selection detracted from returns, in aggregate, particularly consumer discretionary and consumer staples.
The period was one of the most testing environments faced by equity investors for many years. Euphoric conditions that had briefly prevailed at the start of the year rapidly gave way to extreme risk aversion as the global scope of the Covid-19 pandemic became apparent. however, as lockdown measures eased, investors began to anticipate a move towards economic normalisation. Financial markets also had to contend with the shock of an oil price war, while the US and China maintained their hostile rhetoric.
The position in Rolls-Royce was the Fund’s largest detractor as investors took fright at the global downturn in airline traffic. Royal Dutch Shell’s share price declined with the historic decision to cut its dividend for the first time since 1945 following a collapse in the oil price. Not holding Amazon, a sizeable index constituent, also weighed on relative returns. The company continued to appeal to investors as a beneficiary of the accelerating shift towards online retail.
Microsoft contributed most to relative returns, despite warning of coronavirus disruption to certain areas of its business. Increased demand for the company’s cloud software aided the shares as more people started to work from home.
Electric vehicle battery manufacturer Samsung SDI was another top information technology contributor. This reflected South korea’s intention to pursue green initiatives to revive its economy and positive news on the company’s Gen 5 battery. Gilead Sciences also performed well on hopes that its drug Remdesivir could be effective in treating Covid-19.
The manager invested in Continental, a German automotive supplier. The company is restructuring and spinning off its troubled power-train business. The manager believes this could lead to improved cash flow and a better return on invested capital for the remaining business. Covid-19-related weakness in the shares of Alibaba, the oldest e-commerce platform in China, provided the manager with
BNy MELLON GLOBAL EQUITy INCOME FUND cont’d.
GLOBAL EQUITy cont’d.
03613-1A.indd 18 19/08/2020 19:00

1919
BNY MelloN GloBal FuNds, plc
INVESTMENT MANAGERS’ REPORTS cont’d.
REGIONAL EQUITy
BNy MELLON ASIA RISING STARS FUNDover the six-month period under review, the Fund’s USD A (Acc.) share class returned -7.86%, compared with a return of -8.35% from the MSCI AC Asia Small Cap NR Index and -6.41% from the Lipper Global – Equity Asia pacific Small & Mid Cap sector average, all in US dollar terms.
The Fund was weighted Asian equity ex-Japan 46.7% and Japan small-cap 51.4%. The Fund held 131 stocks in the Asian equity ex-Japan portion and 30 stocks in the Japan small-cap portion at the end of the period.
Markets remained volatile through the first half of the year, driven largely by the breakout of the Covid-19 pandemic. The first quarter saw a sharp sell-off in markets followed by a recovery in the second quarter. The Asian equity ex-Japan portion of the Fund outperformed in the sell off in the first quarter but lagged the recovery in the second quarter and ended up underperforming the performance benchmark over the six-month reporting period.
The Asian equity ex-Japan portion of the Fund is 94% invested at the end of the period with hong kong/China, India and Indonesia being the key country exposures.
Despite market volatility, the manager continues to remain positive on the outlook for small and mid-cap stocks in Asia. Small and mid-cap companies typically offer higher growth rates. In addition, information inefficiency in the small and mid-cap asset classes due to patchy sell side research can result in mispricing, which offers bottom up stock pickers the opportunity to generate superior returns for investors by investing in these mispriced stocks.
The Japan small-cap portion of the Fund performed positively over the six-month period under review. Stock selection was the main contributor to performance.
At the industry level, the main positive contributors to performance were insurance and information and communication, where the Fund was overweight relative to the benchmark, and machinery, where the Fund was underweight. The main detractors were electric appliances and services, where the Fund was overweight, and pharmaceutical, where the Fund had no holdings.
At the individual stock level, the main contributors to performance included TechMatrix, which provides system integration and solution services; eGuarantee, which offers guarantee services for accounts and note receivables; and BayCurrent Consulting, which provides comprehensive consulting services. The main detractors from performance were Vision, a leading provider of mobile Wi-Fi router rental services available overseas; Sanken Electric, which produces discrete semiconductors and analog integrated circuits; and Tomy, a leading manufacturer of toys.
has accelerated the adoption of information technology products and services, which could underpin the long-term growth outlook for Microsoft Corporation, the major absolute contributor to Fund performance, and publishing software company Adobe, with the latter benefiting from the shift to ’WFh’- working from home. Also among the top performing stocks was Japanese sensor company keyence, which announced resilient fourth quarter results in April. While there is some caution regarding the near-term outlook for the company, its diversified industrial exposure and the recovery in China could be supportive of revenues.
Stocks in the eye of the pandemic storm fared less well, with corporate catering company Compass Group temporarily suffering from the lockdowns. The longer-term picture looks bright for this financially strong company in the manager’s view, given likely sector consolidation and the ongoing need for catering in businesses that can’t operate WFh on a long-term basis. Energy stocks EoG Resources and Schlumberger were weak over the period, as the oil price reflected the initial Saudi-driven supply shock and the pandemic-induced demand downdraught.
New purchases during the period included leading gene-sequencing company Illumina, which is involved in fields ranging from cancer research to agriculture, and Texas Instruments, a dominant player in the analogue semiconductor market.
Disposals of note included Starbucks. In the context of the current environment, the manager felt there were unquantifiable downside risks to its operations in the short-term, and concerns grew about its weakened balance sheet. Gilead Sciences and Schlumberger were also sold, with the latter being disposed of in view of its deteriorating outlook and elevated balance-sheet risks.
The short-term equity environment could be ripe for renewed volatility. While there are efforts to get back to normality, it remains to be seen what the ‘new normal’ entails for many countries, with uncertainty abounding regarding the full extent of the economic damage being wrought by the pandemic. The current economic turbulence emphasises the manager’s opinion of the need for investors to focus on financially strong, innovative companies that can take advantage of long-term growth trends as well as weather the near-term challenges ahead.
Walter Scott & partners Limited July 2020
BNy MELLON LONG-TERM GLOBAL EQUITy FUND cont’d.
GLOBAL EQUITy cont’d.
03613-1A.indd 19 19/08/2020 19:00

2020
BNY MelloN GloBal FuNds, plc
INVESTMENT MANAGERS’ REPORTS cont’d.
chain. Detracting from performance were a number of the Fund’s Indian holdings which suffered from the market’s fear of significant impact of Covid-19 on the Indian consumer sector, but the manager retains a very positive multi-year view and believes the holdings are robust. The Indian market correction hurt holdings in vehicle manufacturer Maruti Suzuki, mortgage lender hDFC and cinema operator pVR, which will do a small rights issue in the near future to be on the safe side.
In terms of activity, Elite Material, a supplier of high-end copper clad laminates, was added. The company is winning market share, owing to its exposure to high-end products, and is supported by strong trends such as 5G, cloud computing and electric vehicles.
A position in toll-road operator IRB Invit was also taken, though this is small to reflect the high risk, even though the stock is very cash generative and the urbanisation of India leads to rising traffic growth over time. The manager also added a far more substantial holding in LoNGi Green Energy Technology, a manufacturer of solar-energy products. The growth potential is compelling as solar economics is driving rapid adoption and the manager believes this is the best-in-class technology leader with impressive ESG improvements for a domestic Chinese company.
Following strong performance that made Chinese healthcare stock 3SBio one of the Fund’s top contributors in 2019, the remaining position was sold. Indian financial services business Edelweiss was also sold, as it was caught in the Indian liquidity crunch owing to its reliance on wholesale funding. Godrej Consumer products and hindustan Unilever were also sold, the latter having acted particularly defensively in the first quarter.
The manager believes that the annualised return potential for the Fund from current levels remains very attractive, with underlying growth in companies typically close to 20%. Sustained downside risk is very low, in the manager’s view, unless there is a prolonged global recession. Robust emerging markets such as China and India could outperform developed markets in this context, particularly if the US dollar bull market starts to reverse, although there will be stocks to avoid, hence a highly active approach is advocated.
Newton Investment Management Limited July 2020
BNy MELLON ASIAN INCOME FUNDover the six-month period under review, the Fund’s USD W (Inc.) share class returned -16.19% compared with a return of -5.95% from the FTSE Asia pacific ex Japan TR Index and -6.64% for the Lipper Global – Equity Asia pacific ex-Japan sector average, all in US dollar terms.
There was one new name added during the review period, Insource, which provides corporate training and business-related open courses. The holding in Star Micronics, which creates high-performance machine tools, was sold. At the end of June, the Fund was overweight services, electric appliances and other financing business industries.
Governments around the world have taken drastic measures to mitigate the spread of the Covid-19 virus and to provide both monetary and fiscal policy support, and the manager remains optimistic. While the exact bottom of the market is hard to predict, and there may be pull back due to fear of a second wave of the virus, the manager expects the stock market to also be at a better level in the medium-term. In terms of strategy, the manager is of the view that many stocks in the Fund were previously sold to attractive levels and has added to these, funding them from stocks which have held up relatively well.
BNY Mellon Asset Management Japan Limited July 2020
BNy MELLON ASIAN EQUITy FUNDover the six-month review period, the Fund’s USD A share class returned 5.28%, compared with a return of -6.02% for the MSCI AC Asia pacific ex Japan TR Index and -6.64% for the Lipper Global – Equity Asia pacific ex-Japan sector average, all in US dollar terms.
The Fund produced a positive return and was well ahead of the benchmark, delivering a respectable positive return despite the Covid-19 shock. Asian equities, as with other global markets, experienced a sharp downturn due to the coronavirus in February and March, before recovering somewhat in the second quarter of 2020.
Stock selection was very strong, especially in China. At a sector level, it was notably positive in information technology. Sector allocation was also a positive factor behind returns, with the material overweighting of consumer discretionary and underweighting of financials aiding performance, whilst the fund had no oil stocks.
At the stock level, shares in Chinese online education stock GSX Techedu more than doubled, with investors expecting strong long-term earnings momentum following a substantial rise in enrolments for its online courses over the period. This also helped New oriental Education, which was also very strong, with investors similarly confident in its business model. The Fund further benefited from online food delivery company Meituan Dianping, which proved resilient at a time when footfall-dependent businesses have suffered. Lithium battery-maker Samsung SDI also performed strongly owing to its highly advantaged position in the electric vehicle supply
BNy MELLON ASIA RISING STARS FUND cont’d.
REGIONAL EQUITy cont’d.
03613-1A.indd 20 19/08/2020 19:00
2121
BNY MelloN GloBal FuNds, plc
INVESTMENT MANAGERS’ REPORTS cont’d.
central banks, market sentiment remains febrile. It is very doubtful that we will see a ‘V-shaped’ recovery, in the manager’s opinion.
Newton Investment Management Limited July 2020
BNy MELLON BRAZIL EQUITy FUNDover the six-month period under review, the Fund’s USD A share class returned -33.58%, compared to a return of -37.80% for the MSCI Brazil 10/40 NR Index and -35.79% for the Lipper Global – Equity Brazil sector average, all in US dollar terms.
At the industry level, stock selection in consumer discretionary and food processors and the underweight in banks were the main positive contributors for the Fund’s performance in relation to the benchmark. Negative performance relative to the benchmark came from stock selection in software, the overweight versus the benchmark in global capital goods and both being underweight and stock selection in capital goods.
At the stock level, the Fund benefited from the exposures to B2W, B3 and Marfrig. The strong performance of B2W shares was due to the sharp rise in sales after the Covid-19 pandemic hit Brazil. Its business model, comprising a strong item assortment, robust logistic platform and relevant brand awareness, has brought several new clients, a rise in purchase recurrence and higher volumes per client. B3 shares were positive in the six months under review, with stock exchange volumes increasing sharply and record levels of new personal accounts. Marfrig shares posted positive performance as the company is showing very positive trends for both its business divisions, North America and South America. In the North American division, profits on beef are at attractive levels and there is a positive cattle supply for the medium-term. In addition, the South American division is enjoying depreciated local currency levels and higher exports to China, improving results.
Among the negative contributors at the stock level were Embraer, Banks (Itaú, Banco do Brasil and Bradesco) and BR Malls. Embraer shares suffered as the pandemic escalated and the air travel market declined. Another negative driver was the announcement of the termination of the joint venture with Boeing. Itaú stocks, as other banking stocks in the Fund such as Banco do Brasil and Bradesco, posted negative performance because investors are factoring in a scenario of lower interest rates, fiercer competition coming from financial technology competitors and higher default rates as the recession scenario evolves. BR Malls shares were also negative over the six-month period under review, with malls temporarily closing their operations due to social restriction measures and investors still assessing the medium-term impact on their operations.
The Fund produced a negative return and was behind the benchmark. Asian equities experienced a savage downturn due to Covid-19 in February and March, before recovering somewhat in the final quarter.
Both stock selection and sector allocation were negative factors behind the weak relative returns. Not being able to hold Tencent due to its low yield was a negative, with the share price benefiting from being a ‘stay at home’ play (due to its social network and gaming exposure). Not holding Alibaba, owing to its lack of yield, was also detrimental to relative performance. Shares in Link REIT, which fell due to the continued social unrest in hong kong, also detracted from performance. In terms of country allocation, the Fund’s material underweight in China and overweight exposure to Singapore detracted from returns. on the positive side were the Fund’s technology holdings. Taiwan Semiconductor was one of the top performers owing to strong earnings momentum based on strong foundry activity, reflecting the growing demand for semiconductors. Samsung Electronics was another strong performer in the sector, driven by positive earnings momentum. The holding in hong kong Exchanges & Clearing also contributed owing mainly to more secondary listings of Chinese companies listed in the US.
In terms of activity, Elite Material, a supplier of copper clad laminates, used in printed circuit-boards, was added. The company is winning market share, owing to its exposure to high-end products.
The manager also invested in Jiangsu Expressway, a toll road operator in Jiangsu province in China. The company could grow strongly over the long-term and offers a secure 5.5% dividend yield. A stake in ping An Insurance, China’s leading life insurer, was also made. The growth opportunity for protection products in China is compelling in the manager’s view. Within the technology sector, the holding in Taiwan’s Quanta Computer was sold, as the manager foresees vulnerabilities in maintaining its high dividend yield owing to various supply chain disruptions across the world. The position in Taiwan Mobile was also sold due to foreseen increased capital expenditure and competition. Finally, the holding in Sydney Airport was sold owing to the difficulties facing the travel industry.
The Fund is focused on investing in companies that can, in the manager’s opinion, survive the current downturn and return to growth once business conditions normalise. Strong companies will emerge stronger, while the crisis will likely cause some weaker firms to disappear. The Fund is invested in some of Asia’s best-managed companies, with strong balance sheets and enduring franchises. however, the manager remains cautious on the outlook for financial markets and the global economy. Despite the fiscal and monetary policy support provided by governments and
BNy MELLON ASIAN INCOME FUND cont’d.
REGIONAL EQUITy cont’d.
03613-1A.indd 21 19/08/2020 19:00

2222
BNY MelloN GloBal FuNds, plc
INVESTMENT MANAGERS’ REPORTS cont’d.
at 10% as in the manager’s view it remains an attractive risk hedge to equities due to its negative correlation.
Mellon Investments Corporation July 2020
BNy MELLON GLOBAL EMERGING MARKETS FUNDover the six-month review period, the Fund’s USD A share class returned 2.15%, compared with a return of -9.78% for the MSCI Emerging Markets NR Index and -10.36% for the Lipper Global – Equity Emerging Markets Global sector average, all in US dollar terms.
The Fund produced a positive return despite the Covid-19 shock and was substantially ahead of the benchmark. Emerging market equities, along with other global markets, experienced heightened volatility during the period, falling sharply as Covid-19 spread across the world, before recovering in the final quarter. The manager took advantage of price gyrations to sell some outperformers and add to selective more cyclical holdings that had been heavily discounted, whilst maintaining the substantial core in online and technology-led businesses that held up far better than the wider market.
Stock selection was the key driver of relative returns over the period at the regional level, especially in China and South korea, and in the information technology and consumer discretionary sectors, while sector allocation also contributed strongly, notably the overweighting of consumer discretionary, particularly online businesses. The shares of Meituan Dianping, China’s leading food and consumer service delivery platform, soared after the company reported first quarter results that were ahead of expectations. Lithium battery maker Samsung SDI was another strong contributor to performance, driven by tighter global emissions targets and rising demand across the electric vehicle supply chain, as well as increasing competitive advantage from its leading technology. Chinese education stock GSX Techedu performed well, more than doubling as it demonstrated strong earnings momentum, driven by robust demand for its online educational courses. China’s New oriental Education contributed positively on a similar theme. on the negative side were Indian stocks such as vehicle manufacturer Maruti Suzuki, mortgage lender hDFC and cinema operator pVR. Despite having robust balance sheets and strong long-term growth prospects, the Indian market underperformed other emerging markets due to a greater perceived impact from Covid-19. For example, Jeweller Titan fell after the company lowered its sales guidance, but the manager has been adding to such companies as the manager expects them to recover quickly and believes their long-term growth outlook remains excellent.
In terms of activity, a new position was established in hong kong-listed Meituan Dianping, a fast growing e-commerce
During the first half of the year, new investments in the Fund were: Bradespar (mining), JBS (food processor) and Yduqs (education). Additionally, holdings in CCR, Metalurgica Gerdau, Tupy and Vivara were sold.
The manager is cautiously optimistic for the Brazilian equities market in the second half of 2020. Before the pandemic, domestic activity and many confidence indicators were on the right path. Although the country’s economy was severely hit by the lockdown, interest rates are at historically low levels and fiscal and monetary policy measures appear to be addressing some of the vulnerable businesses, as recent data has been better than initially predicted.
ARX Investimentos Ltda July 2020
BNy MELLON DyNAMIC U.S. EQUITy FUNDover the six-month period under review, the Fund’s USD A (Inc.) share class returned -1.63% compared with a return of -3.37% for the S&p 500 NR Index, both in US dollar terms.
The Fund produced a negative return but outperformed the benchmark due to the long US Treasury position. As 2020 began, the Fund held an equity exposure of 110%, with call options comprising 10%. The options proved pivotal during the extreme sell-off that began on 20 February, after which the S&p 500 tumbled by a third over the ensuing 23 trading days. As the market sell-off intensified, the Fund’s equity exposure quickly fell to 100% by 10 March as the option position effectively expired worthless. The manager did not have to make any costly or unusual trades to lower the risk. The use of options is built into the Fund’s design and it performed as expected.
Equally importantly, while the equity exposure moved to neutral (100%), the allocation to long-dated US Treasuries, which provides a risk hedge to stocks and general downside protection, also worked as designed. The Fund started 2020 with a 10% allocation to long-dated Treasury futures. In mid-January, with the long-dated Treasury yield exceeding 2.3%, the manager raised the allocation to 20%. Long-dated Treasuries rallied as investors sought ‘safe haven’ assets amid the steep equity decline. With long-dated Treasuries rallying strongly during the first quarter, the allocation proved to be the decisive driver of returns.
Against a backdrop of sharply lower earnings expectations and leading economic indicators, the Fund maintained a defensive position during the second quarter. The equity target allocation was reduced to 90% at the end of April after continued weakness in earnings and macroeconomic data. The Fund’s Treasury bond exposure was held steady
REGIONAL EQUITy cont’d.
BNy MELLON BRAZIL EQUITy FUND cont’d.
03613-1A.indd 22 19/08/2020 19:00
2323
BNY MelloN GloBal FuNds, plc
INVESTMENT MANAGERS’ REPORTS cont’d.
a leading provider of mobile Wi-Fi router rental services available overseas; Sanken Electric, which produces discrete semiconductors and analogue integrated circuits; and Tomy, a leading manufacturer of toys including Tomica.
There were three new names added to the Fund, including M-Up which operates fan club sites and an electronic ticket business; Brainpad, which supports its clients to improve their business performance with data analytics; and Takeuchi, one of the largest manufacturers of construction machinery, such as compact hydraulic excavators and track loaders. The manager sold out of V-cube, which provides platforms and software for videoconferencing services; Nichias, which manufacturers building and insulation related materials; and open Door, which operates a travel comparison site.
In addition, the manager increased the weight of existing holdings which were sold-off by the market, funding them from stocks which have held up relatively well.
At the end of June 2020, the Fund held 30 stocks, unchanged from the end of December 2019. At the end of June, the Fund was overweight services, electric appliances and other financing business industries. The Fund’s sector allocation decisions are mainly the result of bottom up stock picking decisions.
The largest overweight positions in the Fund include Sakata, which manufactures printing inks; Techmatrix; Vector, a pR and advertising company using simple notification services and the web and a leading provider of press releases; RS Technologies, a major provider of silicon wafer reclaim services for the semiconductor industry; and Wacom.
Governments around the world have taken drastic measures to mitigate the spread of Covid-19 and to provide both monetary and fiscal policy support and the manager continues to believe that the economy could be at a much improved level on a medium-term view.
While the exact bottom of the market is hard to predict, and there may be pull back due to fear of a second wave of the virus, the manager remains optimistic. In terms of strategy, the manager is of the view that many stocks in the Fund were sold to attractive levels, and has added to these, funding them from stocks which have held up relatively well.
once the economy is in a more normal economic environment, the manager expects to be able to refocus on the longer-term theme that Japan has transitioned to an expansionary phase after many years of nominal Gross Domestic Product (GDP).
BNY Mellon Asset Management Japan Limited July 2020
company focused on food delivery, which is well positioned, in the manager’s view, to increase its service offerings and with the potential to reach attractive profitability levels. This quickly grew to one of the largest positions. The manager also added Elite Material, a supplier of high-end copper clad laminates. The company is gaining market share, owing to its exposure to high-end products, and is supported by strong trends such as 5G, cloud computing and electric vehicles. A position was made in headhunter, which is the leading online recruitment platform in Russia and the Commonwealth of Independent States. In common with many other online job-search companies, headhunter is thematically attractive, given the shift of such business online, enabled by smartphone penetration and improved networks.
Major sales included Brazilian travel company CVC, Godrej Consumer products in India, and Indian financial company Edelweiss.
The manager believes that annualised return potential for the Fund from current levels remains very attractive, with underlying growth in companies typically close to 20%. Sustained downside risk is very low, in the manager’s view, unless there is a prolonged global recession. Robust emerging markets such as China and India could outperform developed markets in this context, particularly if the multi-year US dollar bull market starts to unwind, although there will be stocks to avoid, hence a highly active approach is advocated.
Newton Investment Management Limited July 2020
BNy MELLON JApAN SMALL CAp EQUITy FOCUS FUNDover the six-month period under review, the Fund’s JpY C share class returned -7.46%, compared with -11.20% for the Russell/Nomura Small Cap TR Index and -8.13% for the Lipper Global – Equity Japan Small & Mid Cap sector average, all in Japanese yen terms.
The main contributor to the Fund’s performance was stock selection. At the industry level, the main positive contributors to performance were insurance and information and communication where the Fund was overweight compared to the benchmark and machinery where the Fund was underweight. The main detractors were electric appliances and services where the Fund was overweight and pharmaceutical where the Fund had no holdings.
At the individual stock level, the main contributors to performance included TechMatrix, which provides system integration and solution services; BayCurrent Consulting, which provides comprehensive consulting services; and Wacom, which specialises in graphic tablets and related products. The main detractors to performance were Vision,
REGIONAL EQUITy cont’d.
BNy MELLON GLOBAL EMERGING MARKETS FUND cont’d.
03613-1A.indd 23 19/08/2020 19:00

2424
BNY MelloN GloBal FuNds, plc
INVESTMENT MANAGERS’ REPORTS cont’d.
In this environment, the Fund outperformed its benchmark. By country, Germany led relative contributors by a wide margin due to positive stock selection. positioning and effective stock selection among Spanish equities also contributed positively.
Meanwhile, France was the largest relative detractor followed by the Netherlands. By sector, consumer discretionary and industrials led relative contributors while information technology and real estate detracted most. positive stock selection among consumer discretionary, particularly in Germany, contributed to relative results. Specifically, the position in helloFresh SE buoyed performance as the company generated triple digit returns.
on the downside, challenging stock selection among French IT services names weighed most on results. In real estate, challenging stock selection among real estate management and development weighed on relative performance. Shares of Italian real estate company Immobiliare Grande Distribuzione SIIQ lagged.
Fund activity was moderate during the period. Exposure to industrials was increased, with new positions in Arcadis and ASTM. Exposure to energy was reduced through the sale of Dutch tank storage company Royal Vopak.
In the first quarter of 2020, international markets underperformed US markets. International developed markets tend to be a more cyclical asset class compared to the US. Technology and healthcare make up a large part of the US market and are more defensive, while the financials, energy and industrials sectors are larger representations in international markets and are less defensive. This played out during the first quarter downturn.
In the second quarter of 2020 there was a recovery from previously depressed levels. hard data around employment, spending and consumption continue to recover in China, and over the past two months, there has been a meaningful improvement in leading economic indicators in non-US developed markets. The ongoing robust and rapid monetary and fiscal policy response remain a tailwind for the burgeoning recovery in Europe, the Uk and Japan.
Looking forward, the manager expects Europe, like the US, to see a gradual reopening of its economies and this is already being seen in real economic data. The European Central Bank remains highly accommodative and inflation levels are well below targets. over the next couple of quarters, the manager believes investors will weigh potential Covid-19 related setbacks against the real improvements in employment trends and economic normalisation to gauge how governments may respond in a second wave scenario.
BNy MELLON S&p 500® INDEx TRACKERover the six-month period under review, the Fund’s USD A share class returned -4.03%, compared with a return of -3.37% for the S&p 500 NR Index and -4.06% for the Lipper Global – Equity US sector average, all in US dollar terms.
The one-year annualised tracking error for the Fund as at 30 June 2020 was 0.03%. The tracking error is related to withholding tax and the cost associated with managing the daily activity. The anticipated tracking error of the Fund is 0.10%. Meanwhile, the difference in performance between the Fund and S&p 500 Index related to the market impact of fees and the cost associated with managing daily activity on the former.
The annualised tracking error provided was calculated using gross of fees monthly returns for the period in question. The tracking error being the standard deviation of the relative returns that have been annualised (multiplied by the square root of 12).
For further commentary, please refer to the market review at the beginning of this document.
The strategy is positioned to match the performance and overall characteristics of the S&p 500 Index in a risk-controlled, cost-effective manner utilising a full replication approach.
Mellon Investments Corporation July 2020
BNy MELLON SMALL CAp EUROLAND FUNDover the six-month period under review, the Fund’s Euro A share class returned -12.48%, compared with a return of -12.56% for the S&p EuroZone Small Cap TR Index and -11.22% for the Lipper Global – Equity EuroZone Small & Mid Cap sector average, all in euro terms.
Equity markets experienced significant volatility during the first half of 2020 due to the global impact of the Covid-19 pandemic. As economic activity halted, equities plummeted in the first quarter but rebounded during the second quarter as global economies reopened and optimism surrounding a possible vaccine increased. Early in the period, president Donald Trump declared a national emergency in the US and Congress passed a US$2 trillion stimulus package. As the second quarter came to a close, markets witnessed their best quarter in more than two decades due in part to extensive stimulus measures from the Federal Reserve (Fed). The unemployment rate reached record highs early in the quarter but steadily declined throughout the period. After cutting interest rates to near zero in March, the Fed left interest rates unchanged during the second quarter, while the US dollar consistently fell.
REGIONAL EQUITy cont’d.
03613-1A.indd 24 19/08/2020 19:00

2525
BNY MelloN GloBal FuNds, plc
INVESTMENT MANAGERS’ REPORTS cont’d.
In the manager’s view, there is potential for stability over the next 12 months, provided there is some follow-through to this recovery. The manager does not think it will be a straight line economic recovery despite the global equity markets resembling a ‘V-shaped’ recovery this past quarter. however, the manager expects comparisons to be very favourable across the markets toward the end of 2020 and into early next year.
Mellon Investments Corporation July 2020
BNy MELLON U.S. DyNAMIC VALUE FUNDover the six-month period under review, the Fund’s USD A share class returned -19.97%, compared with a return of -16.26% for the Russell 1000 Value TR Index and -4.06% for the Lipper Global – Equity US sector average, all in US dollar terms.
Equity markets experienced significant volatility during the first half of 2020 due to the global impact of the Covid-19 pandemic. As economic activity halted, equities plummeted in the first quarter but rebounded during the second quarter as global economies reopened and optimism surrounding a possible vaccine increased. Early in the period, president Donald Trump declared a national emergency in the US and Congress passed a US$2 trillion stimulus package. As the second quarter came to a close, markets witnessed their best quarter in more than two decades due in part to extensive stimulus measures from the Federal Reserve (Fed). After cutting interest rates near zero in March, the Fed left interest rates unchanged during the second quarter, while the US dollar consistently fell.
In this environment, the Fund underperformed its benchmark. on a sector basis, positioning in financials led relative contributors followed by information technology. Conversely, healthcare was the largest relative detractor, followed by industrials and materials.
In financials, solid stock selection and positioning in the banks segment drove relative results in the sector. Overweight positioning in capital markets was also additive. In information technology, overweight positioning in the semiconductors and semiconductor equipment segment was most beneficial to relative results.
The heathcare sector was the largest detractor over the period primarily due to weak stock selection. key holdings within healthcare equipment and supplies and underweight positioning in pharmaceuticals primarily weighed on relative performance. Overweight positioning in both the struggling airlines and aerospace and defence segments weighed most on industrials sector performance.
The manager recently added to the Fund’s healthcare exposure, and moved from an underweight to an overweight position. healthcare weight was increased through a number of new names including AbbVie and Eli Lilly and Company. AbbVie outperformed due to positive investor sentiment as the biotechnology company announced the completion of its acquisition of Allergan after receiving regulatory approval from governmental authorities. The manager reduced exposure to communication services, exiting positions in AT&T and Comcast over the period.
Markets have staged an impressive recovery from late March lows as the economy slowly reopens and investors begin to anticipate some level of normalisation following what is hoped to be the worst of the Covid-19 pandemic. pessimistic expectations and historically low valuations remain a compelling combination for the manager’s approach to investing, which creates the potential for a robust recovery as revenue and earnings re-accelerate on the other side of the pandemic.
After the initial recovery in April, the balance of the second quarter saw trading patterns resemble a tug of war between ‘risk on’ and ‘risk off’ characteristics. As purchasing managers’ indices continue to recover from depressed levels in China, and more recently in the US, investors are looking to China for signs of how a staggered reopening of the economy may fare. The manager believes earnings growth will resume in the second half of 2020 after absorbing a hit in the first half due to the negative supply and demand shock associated with the virus. As the economy begins to normalise, generous stimulus measures coupled with low commodity prices could be added tailwinds to the consumer.
Recent US employment trends have come in ahead of expectations as large states reopen. Consumer confidence and strong demand from the housing industry complete recent signposts for recovery. Investors will have to weigh concerns around recent US Covid-19 case acceleration in Sunbelt states as well as California to determine the scale and pace of economic normalisation; it is unlikely to recover in a straight-line fashion. The most acute phase of the recession appears to be over, with modest green shoots of recovery under way.
The manager remains confident in the Fund’s positioning and believes the market dislocation positions US large-cap value stocks to produce attractive returns over the next several years.
Mellon Investments Corporation July 2020
REGIONAL EQUITy cont’d.
BNy MELLON SMALL CAp EUROLAND FUND cont’d.
03613-1A.indd 25 19/08/2020 19:00

2626
BNY MelloN GloBal FuNds, plc
INVESTMENT MANAGERS’ REPORTS cont’d.
REGIONAL EQUITy cont’d.
completion of its acquisition of Allergan after receiving regulatory approval from governmental authorities.
Markets have staged an impressive recovery from late-March lows as the economy slowly reopens and investors begin to anticipate some level of ‘normalisation’ following what is hoped to be the worst of the Covid-19 pandemic. pessimistic expectations and historically low valuations remain a compelling combination for the manager’s approach to investing, which creates the potential for a robust recovery as revenue and earnings re-accelerate on the other side of the pandemic.
After the initial recovery in April, the rest of the second quarter saw trading patterns resemble a tug of war between ‘risk on’ and ‘risk off’ characteristics. As purchasing managers’ indices continue to recover from depressed levels in China, and more recently in the US, investors are looking to China for signs of how a staggered reopening of the economy may fare. The manager believes earnings growth could resume in the second half of 2020 after absorbing a hit in the first half due to the negative supply and demand shock associated with the pandemic. As the economy begins to normalise, generous stimulus measures coupled with low commodity prices could be added tailwinds to the consumer.
Recent US employment trends have come in ahead of expectations as large states reopen. Consumer confidence and strong demand from the housing industry complete recent signposts for recovery. Investors will have to weigh concerns around recent US Covid-19 case acceleration in Sunbelt states as well as California to determine the scale and pace of economic normalisation; it is unlikely to recover in a straight-line fashion. The most acute phase of the recession appears to the manager to be over, with modest green shoots of recovery under way.
The manager remains confident in the portfolio positioning and believes the market dislocation positions US large-cap value stocks to produce attractive returns over the next several years.
Mellon Investments Corporation July 2020
BNy MELLON U.S. EQUITy INCOME FUNDover the six-month period under review, the Fund’s USD C (Inc.) share class returned -22.06%, compared with a return of -3.37% for the S&p 500 NR Index and -17.99% for the Lipper Global – Equity US Income sector average, all in US dollar terms.
Equity markets experienced significant volatility during the first half of 2020 due to the global impact of the Covid-19 pandemic. As economic activity halted, equities plummeted in the first quarter but rebounded during the second quarter as global economies reopened and optimism surrounding a possible vaccine increased. Early in the period, president Donald Trump declared a national emergency in the US and Congress passed a US$2 trillion stimulus package. As the second quarter came to a close, markets witnessed their best quarter in more than two decades due in part to extensive stimulus measures from the Federal Reserve (Fed). The unemployment rate reached record highs early in the second quarter of 2020 but steadily declined throughout the period. After cutting interest rates to near zero in March, the Fed left interest rates unchanged during the second quarter, while the US dollar consistently fell.
In this environment, the Fund underperformed its benchmark. on a sector basis, consumer staples was the sole positive contributor, while information technology and financials led detractors relative to the benchmark.
In consumer staples, solid stock selection in the beverages segment contributed most to relative performance. positive stock selection and positioning among food products names also supported results. The Fund’s lack of exposure to beverage company Coca-Cola Company buoyed performance as well.
Conversely, in information technology the Fund’s underweight to the software segment weighed on performance most. The portfolio’s lack of exposure to Microsoft and Amazon.com were notable detractors over the period. Underweight positioning and challenging stock selection in technology hardware, storage & peripherals also detracted from relative performance. A significant overweight to the banks segment drove underperformance in the financials sector. Overweight positioning and challenging stock selection among insurance names also weighed on results.
The Fund remains overweight the financials, materials, utilities and energy sectors and underweight the consumer staples, information technology, communication services and consumer discretionary sectors. The manager decreased the Fund’s exposure to real estate during the period and moved to an overweight position in industrials. The manager also increased exposure to healthcare through new positions in AbbVie and Bristol-Myers Squibb. positive investor sentiment grew as AbbVie announced the
03613-1A.indd 26 19/08/2020 19:00

2727
BNY MelloN GloBal FuNds, plc
INVESTMENT MANAGERS’ REPORTS cont’d.
technologies over time, and that it has been significantly expedited in response to the global pandemic.
The manager believes we are rapidly approaching a period of significant investment in blockchain technology, which could benefit both enablers and beneficiaries. As a result, the investment universe continues to grow, with global opportunities across every industry and region. In particular, China appears to be investing considerably in blockchain technology, which has been reflected in the composition of the Fund’s portfolio. Broadening use cases have yielded new opportunities in areas such as healthcare and supply chain management, and the manager expects to see continued interest in the technology in both of these areas. Similarly, the manager has increased exposure to technology and communications services as a number of technology-related companies have increased investments in blockchain-based solutions.
Looking beyond the remainder of this year, the manager believes blockchain is positioned to become an integral component of next generation technology infrastructure. Blockchain’s key attributes in areas such as immutability, security and transparency are paramount to success in a digital society, in the manager’s view. The manager fully expects the blockchain theme to take at least a decade to reach its full potential and believes deep domain expertise, combined with a robust global equity research platform, could benefit the Fund over the long term.
Mellon Investment Corporation July 2020
BNy MELLON GLOBAL INFRASTRUCTURE INCOME FUNDover the six-month period under review, the Fund’s USD W (Acc.) share class returned -21.25%, compared with a return of -19.68% for the S&p Global Infrastructure NR Index, both in US dollar terms.
Equity markets experienced significant volatility during the first half of 2020 due to the global impact of the Covid-19 pandemic. As economic activity halted, equities plummeted in the first quarter but rebounded during the second quarter as global economies reopened and optimism surrounding a possible vaccine increased. Early in the period, president Donald Trump declared a national emergency in the US and Congress passed a US$2 trillion stimulus package. As the second quarter came to a close, markets witnessed their best quarter in more than two decades due in part to extensive stimulus measures from the Federal Reserve (Fed). The unemployment rate reached record highs early in the quarter but steadily declined throughout the period. After cutting interest rates to near zero in March, the Fed left interest rates unchanged during the second quarter, while the US dollar consistently fell.
SpECIALIST EQUITy
BNy MELLON DIGITAL ASSETS FUNDover the six-month period under review, the Fund’s USD W (Acc.) share class generated a return of 4.06% compared with a return of -6.25% for the MSCI AC World NR Index, both in US dollar terms.
Equity markets experienced significant volatility during the first half of 2020 due to the global impact of the Covid-19 pandemic. As economic activity halted, equities plummeted in the first quarter but rebounded during the second quarter as global economies reopened and optimism surrounding a possible coronavirus vaccine increased. Early in the period, president Donald Trump declared a national emergency in the US and Congress passed a US$2 trillion monetary stimulus package. As the second quarter came to a close, markets witnessed their best quarter in more than two decades due in part to extensive measures from the Federal Reserve (Fed). The unemployment rate reached record highs early in the quarter but steadily declined throughout the period. After cutting interest rates near to zero in March, the Fed left interest rates unchanged during the second quarter, while the US dollar consistently fell.
The Fund significantly outperformed the benchmark during the period. Overweight positioning and effective stock selection among software names led relative contributors by a wide margin. Specifically, the position in oneConnect Financial Technology traded higher after the company reported its earnings in early May, which were received favourably by the market. Effective stock selection and an overweight to IT services and semiconductors and semiconductor equipment also buoyed performance.
Conversely, challenging stock selection among internet and direct marketing retail names detracted most from relative results. In particular, the position in Webjet lagged. A lack of exposure to technology hardware storage and peripherals also detracted from results. Challenging stock selection among healthcare technology names also weighed on performance as the sector was the top performer in the index.
Fund activity was moderate during the period. The manager increased exposure to software through a new position in oneConnect Financial Technology, a spinoff from ping An Insurance which the manager believes fulfills a need in the public equity space as the company is one of the more pure forms of a key blockchain enabler. Exposure to air freight and logistics was decreased through the sale of Xpo Logistics.
The manager remains optimistic about the opportunities in the blockchain market. The manager’s belief has been that digital transformation would lead to significant spending on new
03613-1A.indd 27 19/08/2020 19:00

2828
BNY MelloN GloBal FuNds, plc
INVESTMENT MANAGERS’ REPORTS cont’d.
trends with medical breakthroughs, in conjunction with a gradual global reopening, could put in a floor for earnings and cash flow power among infrastructure assets. As such, valuation and dividend yield opportunities within the asset class remain very compelling, in the manager’s view.
Mellon Investments Corporation July 2020
BNy MELLON MOBILITy INNOVATION FUNDover the six-month period under review, the Fund’s USD A (Acc.) share class generated a return of 6.64%, compared with a return of -9.99% for the MSCI AC World Mid Cap NR Index, both in US dollar terms.
Equity markets experienced significant volatility during the first half of 2020 due to the global impact of the Covid-19 pandemic. As economic activity halted, equities plummeted in the first quarter but rebounded during the second quarter as global economies reopened and optimism surrounding a possible vaccine increased. Early in the period, president Donald Trump declared a national emergency in the US and Congress passed a US$2 trillion stimulus package. As the second quarter came to a close, markets witnessed their best quarter in more than two decades due in part to extensive stimulus measures from the Federal Reserve (Fed). The unemployment rate reached record highs early in the quarter but steadily declined throughout the period. After cutting interest rates to near zero in March, the Fed left interest rates unchanged during the second quarter of 2020, while the US dollar consistently fell.
The Fund’s overweight, relative to the benchmark, to software and semiconductors and semiconductor equipment led relative contributors. Meanwhile, a lack of exposure to healthcare equipment and supplies and challenging stock selection among auto components names lagged most.
In software, Splunk led contributors as the cloud business is benefiting from work from home trends. Shares rose after the company reported better than expected quarterly earnings. positive sentiment for a robust pipeline, despite economic headwinds, also buoyed shares. In semiconductors and semiconductor equipment, MediaTek rose as this key chip provider for huawei looks poised to benefit from recently announced restrictions expected to limit huawei’s ability to procure their own silicon, thereby benefiting key suppliers.
Conversely, shares of hyundai Mobis lagged most in the auto components segment. In the Fund overall, Guangzhou Automobile Group in the automobiles segment also detracted. Negative trends in Chinese passenger vehicle volumes and consumption continued to weigh on performance. however, the manager believes that the
The Fund underperformed the S&p Global Infrastructure Index. The underweight to industrials helped relative results. positioning in European transportation infrastructure was a positive tailwind, primarily driven by holdings in Deutsche post and Bouygues, which both appreciated.
Near-term catalysts for Bouygues include price increases in their no-frills mobile service, as well as indications from the French government that it could aid some of the infrastructure construction companies with Covid-19 related costs. Utilities was the second largest contributor driven by effective stock selection among US-based utilities and a sizable overweight allocation to Europe, which outperformed other regions.
Conversely, energy led relative detractors. The Fund absorbed particularly difficult relative performance within its energy infrastructure exposure faced with severe demand destruction amid the spread of Covid-19 and corresponding global breakdown in the energy sector following the unraveling opEC’s recent production cut agreement. Canadian midstream pipeline group Inter pipeline detracted as investors weighed the company’s ongoing capital expenditure commitments related to their large-scale heartland petrochemical project. In real estate, off benchmark exposure to omega healthcare Investors hurt results. Investors weighed the risks of rising costs associated with labour, sanitation and deep cleaning services as well as protective equipment such as masks and gloves in addition to potential occupancy declines amid the spread of Covid-19.
The manager slightly decreased the Fund’s utilities and industrials weight and increased energy exposure during the period. The remaining stake in electric utility group Exelon was sold over concerns that the ongoing investigation in Illinois could weigh on the company’s ability to benefit from legislation that would support their nuclear assets. Shares of midstream natural gas group oneok were purchased.
The asset class looks poised to recover along with broader global equities as the global economy gradually reopens. Traditionally defensive infrastructure assets such as toll roads, airports and seaports saw volumes drop precipitously along with other retail businesses due to the widespread lockdown measures. As economic conditions normalise, there is improvement in traffic volumes across such networks from historically depressed levels. As a result, the manager anticipates strong operating leverage into the economic recovery, which could translate into compelling potential returns for many segments of the asset class. Asia, and China specifically, is leading out of the lockdown phase, and elements of normalisation are likely to improve as case counts and the death toll declines and the world moves towards potential therapies and a vaccine. positive
BNy MELLON GLOBAL INFRASTRUCTURE INCOME FUND cont’d.
SpECIALIST EQUITy cont’d.
03613-1A.indd 28 19/08/2020 19:00

2929
BNY MelloN GloBal FuNds, plc
INVESTMENT MANAGERS’ REPORTS cont’d.
SpECIALIST EQUITy cont’d. GLOBAL FIxED INCOME
BNy MELLON GLOBAL BOND FUNDover the six-month review period, the Fund’s USD A share class returned 3.54%, compared with a return of 4.60% for the Jp Morgan Global Government Bond Index (Unhedged) TR Index and 0.34% for the Lipper Global – Bond Global USD sector average, all in US dollar terms.
The Fund produced a positive return but was behind its benchmark. Bond markets were buoyed by renewed quantitative easing from major central banks, in response to the arrival of Covid-19.
The Fund’s government bond holdings produced firmly positive returns. US Treasuries were the standout performers, but Australian, Singaporean and New Zealand government bond holdings also boosted returns owing to aggressive monetary easing. Despite already depressed inflation expectations, significant diversification into US Treasury inflation-protected securities (TIPS) detracted from performance in the first quarter, as real yields and inflation expectations collapsed following the breakdown in talks over oil production cuts. Additionally, emerging market sovereign bonds incurred significant capital losses, with oil exporting issuers (Colombia and Mexico) among the worst performers. Emerging market sovereign bond returns were boosted, later in the period, by the strong performance of new issues, including Qatar, Abu Dhabi and Mexico, as global US dollar liquidity conditions and risk appetite recovered.
Being underweight Japanese government bond duration proved beneficial, especially in the second quarter of the period, as Japanese government bond yields rose. however, being underweight Uk Gilt duration proved a drag on relative performance as the Uk’s weak economic outlook and the Bank of England’s reference to potentially negative interest rates ensured Gilts proved relatively strong performers, as yields declined. European bond positioning produced positive returns, later in the period, with the Fund’s overweight position in Spain a standout contributor, as spreads tightened aggressively.
In terms of activity, the manager increased the Fund’s duration in the first quarter, aided by the purchase of 2029 (the year in which the bond matures) and 2045 US Treasuries and Australia 2047 bonds. however, US dollar duration was reduced in the second quarter, particularly at the long end of the US Treasury yield curve.
Currency strategy rotated towards risk, with the net US dollar positioning moving to -5%, while exposure was added to the Indonesian rupiah, Czech koruna, peruvian sol, Norwegian krone and Canadian dollar. Meanwhile, ‘safe haven’ currency holdings were reduced, with the long Japanese yen positioning sold and risk-currency short positions in the Canadian dollar, polish zloty and philippine peso closed.
company will likely show recovery as stimulus policies set by local governments take hold.
Exposure to machinery was increased through new positions in kion Group, a leading global player in the materials handling industry, and Nikola Corporation, a manufacturer of hybrid trucks.
The manager reduced exposure to electronic equipment instruments and components through the sale of Delta Electronics, due to lower materiality to the mobility theme and weaker fundamentals.
The outlook for the global economy and equity markets appears to be brighter, in the manager’s view, after an unprecedented move to shut down the global economy to counteract the spread of Covid-19.
In the US passenger vehicle market, June was the second straight month of recorded sequential growth with volumes of seasonally adjusted annual rate (SAAR) of 13.2m. As the US economy reopens from shutdowns due to Covid-19 and vehicle production comes online, the manager expects SAAR to continue to improve months ahead. In Western Europe, the passenger vehicle market had another challenging month in June but sequential improvement from May. China, the world’s largest passenger vehicle market, has witnessed a ‘V-shaped’ recovery since March of this year. Figures from the Chinese passenger Car Association show recovery continued in June. The manager expects to see continued improvement in underlying demand looking ahead to the second half of the year, assuming China’s domestic economy remains on a positive upwards trend.
Looking ahead, the manager believes the Fund’s holdings are well positioned as potential beneficiaries from the secular growth within the mobility theme. Despite the challenges thus far in 2020, the manager believes the outlook for growth in advanced driver-assisted systems (ADAS) and vehicle electrification remains positive over the mid to long term. ADAS content and functionality per vehicle continues to increase in key markets, as does the underlying shift to vehicle electrification, which remains a key focus for Europe and China due to emission policies and regulations.
Mellon Investments Corporation July 2020
BNy MELLON MOBILITy INNOVATION FUND cont’d.
03613-1A.indd 29 19/08/2020 19:00
3030
BNY MelloN GloBal FuNds, plc
INVESTMENT MANAGERS’ REPORTS cont’d.
The manager increased the overweight credit position in the first quarter of 2020, taking advantage of attractive valuations following the sharp sell-off. It was then scaled back somewhat, selling cyclical sectors such as energy and automobiles. The manager remained overweight duration, shifting the regional bias as relative value emerged.
The economy and markets face an unprecedented shock from the Covid-19 outbreak. however, the policy response has been huge. Direct or indirect monetary expansion has financed large government debts. Therefore, the manager expects yields to stay low and yield curves flat for a long time. The risk of a second wave of Covid-19 infections remains, with some localised lockdown measures already rolled back.
political risk is here for the foreseeable future, whether it relates to US-China relations, Brexit, or the US presidential election, in the manager’s view.
The Fund remains overweight duration, shifting the regional bias as relative value evolves. The Fund continue to hold positions which the manager thinks have structural value in the medium-term, primarily in long positions in peripheral markets relative to core European.
Within credit, valuations have fallen to levels where they are only modestly attractive compared to long-run averages. All credit now looks strategically cheap but the manager prefers segments that are the least exposed to rising defaults, being actively supported by central bank measures, and in jurisdictions where government fiscal policy plans are less reliant on foreign flows.
Insight Investment Management (Global) Limited July 2020
BNy MELLON GLOBAL DyNAMIC BOND FUNDover the six-month review period, the Fund’s USD A share class returned 0.64%, compared with a return of 1.44% for 1 Month USD LIBoR + 2% per annum, both in US dollar terms.
The Fund produced a positive return but was behind its benchmark. Bond markets were buoyed by renewed quantitative easing from major central banks, responding to the arrival of the Covid-19 coronavirus.
The Fund’s government bond holdings produced firmly positive returns. US Treasuries were the standout performers, but Australian, Singaporean and New Zealand government bond holdings also boosted returns. Despite already depressed inflation expectations, significant diversification into US Treasury inflation-protected securities (TIPS) detracted from performance in the first quarter of 2020, as real yields and inflation expectations
In the manager’s view, the tug of war between an economic rebound, assisted by hefty fiscal and monetary policy support, versus the impact of persistent lockdowns and longer-term economic damage is likely to continue. Maintaining balance in the Fund is therefore particularly important. While debt sustainability requires the maintenance of ultra-low interest rates, anchoring the front end of yield curves, longer-dated issuance remains vulnerable to a bounce in inflation expectations.
Newton Investment Management Limited July 2020
BNy MELLON GLOBAL CREDIT FUNDover the six-month period under review, the Fund’s USD W (Acc.) share class returned 6.94%, compared with a return of 3.43% for the Bloomberg Barclays Global Aggregate Credit TR Index (USD hedged) and 2.91% for the Lipper Global – Bond Global Corporates USD sector average, all in US dollar terms.
The Fund generated a positive return and outperformed both its benchmark and the sector average.
As the Covid-19 outbreak spread, global credit spreads widened considerably in the first quarter as risk assets in general slumped; however, spreads then tightened markedly as risk appetite returned thanks to a huge fiscal and monetary policy response and the gradual reopening of economies. Investment grade and high yield credit both started the year strongly, sold off sharply in March, then rebounded. As economic growth slowed, defaults picked up (particularly in the US energy sector) but they remained below average historically; moreover, the recovery in capital markets helped companies to refinance at attractive rates. Government bond yields trended lower as the US Federal Reserve (Fed) slashed the Fed funds rate to a range of 0 to 0.25% and announced unlimited asset purchases; the European Central Bank kept its main refinancing rate at 0% but now has a €1.35 trillion pandemic Emergency purchase programme. The US economy has been particularly affected by Covid-19 and ongoing trade tensions with China, with a presidential election looming. In Europe, Brexit remains the key risk. ‘Safe haven’ flows supported the US dollar before it sold off as investor risk appetite returned (helping emerging market currencies).
The Fund’s credit strategy positively contributed to performance over the period, with a strong contribution in April compensating for a substantial loss in March. Security selection consistently added value over the period. however, the Fund’s interest rate strategies were detrimental, particularly its country allocation and inflation positions (largely due to losses in February and March).
GLOBAL FIxED INCOME cont’d.
BNy MELLON GLOBAL BOND FUND cont’d.
03613-1A.indd 30 19/08/2020 19:00
3131
BNY MelloN GloBal FuNds, plc
INVESTMENT MANAGERS’ REPORTS cont’d.
BNy MELLON GLOBAL HIGH yIELD BOND FUNDover the six-month period under review, the Fund’s USD C share class returned -5.51% compared with a return of -4.64% for the ICE Bank of America Merrill Lynch Developed Markets high Yield Constrained TR Index (USD hedged) and -5.16% for the Lipper Global – Bond Global high Yield USD sector average, all in US dollar terms.
Coming off a strong second half of 2019, developed market high yield spreads rallied to near post-financial crisis lows early in the year as investor appetite for yield along with improved US-China trade led to strong demand for risk assets. Sentiment shifted sharply in late February into March of 2020, as the Covid-19 crisis led to an unprecedented demand shock, and the developed high yield market experienced one of the most pronounced periods of spread widening on record. While the market sold off in tandem, higher quality initially outperformed.
The market troughed on 23 March following stimulus measures from the US Federal Reserve (Fed) along with a slowdown in Covid-19 cases globally, which gave way to improved sentiment. Bonds with single B and CCC credit ratings caught up in the second quarter rally, most notably in Europe, with EU CCCs ending the first half of the year as a top performer. As a result of the shift in sentiment in the second quarter of the year, spreads tightened, but remained wider than 2019 year end levels.
While high yield rallied in the second quarter of 2020, more defensive sectors still outperformed, as market participants remained cautious on those issuers and industries particularly exposed to the Covid-19 crisis. European high yield underperformed US high yield during the period, largely due to stimulus measures enacted by the Fed in late March, which included a robust bond buying programme providing support for US credit overall.
New issue volumes picked up significantly in 2020, mainly in US high yield, as issuers tapped the high yield market on a supportive Fed backdrop and strong investor demand. US high yield saw a record amount of issuance in the second quarter, most of which was for general corporate purposes, but we also saw a record amount of refinancing issuance in June.
The Fund underperformed the broader developed high yield market during the reporting period. The Fund benefited from certain asset allocation decisions through the first half of the year, particularly the decision to remain underweight sectors with largest Covid-19 exposure, such as leisure, transport and retail. however, the Fund’s overweight in broadcasting, which experienced a sharp decline in advertising spending, as well as underweight in defensive sectors telecommunications and food and beverage, adversely affected performance. Across the
collapsed following the breakdown in talks over oil production cuts.
High yield bonds proved a significant detractor in the first quarter as headline spreads widened to their highest level since the global financial crisis, with the onset of Covid-19. Emerging market sovereign bonds also incurred significant capital losses. The worst performers included local currency exchange-traded fund (ETF) exposure, and oil-exporting issuers, including Colombia, Mexico and Ecuador. however, the second quarter was a favourable one for high yield credit, with issues including UBS, Nationwide and Lloyds, all rallying. Investment grade credit and emerging market sovereign bonds produced similarly positive returns at that time. Emerging market sovereign returns were boosted by the strong performance of new issues, including Qatar, Abu Dhabi and Mexico, as global dollar liquidity conditions and risk appetite recovered.
In terms of activity, the manager increased the Fund’s duration, in the first quarter, aided by the purchase of 2029 (the year in which the bonds mature) and 2045 US Treasuries and Australia 2024 bonds. Duration was subsequently reduced in the second quarter. US TIPS exposure was increased via 2024 bonds. The Fund’s high yield exposure was lowered while emerging market sovereign exposure was also reduced. The manager sold the local currency ETF position.
In the second quarter, the manager increased exposure to investment grade bonds. Exposure was gained mainly through new issues including General Motors, Apple, AT&T, Linde and Richemont. Exposure to high yield was increased through new issues such as Carnival, Labco and Nokia.
Emerging market sovereign duration was increased, with stable investment grade rated sovereign new issues added in Qatar, Abu Dhabi and Mexico. profits were taken in Morocco and hungary.
Currency strategy rotated towards risk, with the US dollar positioning moving to -5%, while adding exposure to the Indonesian rupiah, Malaysian ringgit, Czech koruna, the euro, peruvian sol, Norwegian krone and Canadian dollar.
In the manager’s view, the tug of war between an economic rebound, assisted by hefty fiscal and monetary policy support, versus the impact of persistent lockdowns and longer-term economic damage is likely to continue. Maintaining balance in the Fund is therefore particularly important. While debt sustainability requires the maintenance of ultra-low interest rates, anchoring the front end of yield curves, longer-dated issuance remains vulnerable to a bounce in inflation expectations.
Newton Investment Management Limited July 2020
GLOBAL FIxED INCOME cont’d.
BNy MELLON GLOBAL DyNAMIC BOND FUND cont’d.
03613-1A.indd 31 19/08/2020 19:00
3232
BNY MelloN GloBal FuNds, plc
INVESTMENT MANAGERS’ REPORTS cont’d.
debt-related securities that may be investment grade or sub investment grade quality.
There are now 86 names in the portfolio. The Fund has an average credit rating of BB- (which has improved from B+ since the last period as better-rated names were added to the Fund) and average duration of 1.8 years.
over January and February, the Fund continued to switch positions and reinvest cash proceeds. When markets notably weakened in March, the manager allowed cash to build in the Fund but also selectively added some short-dated bonds that had sold off. over April and May, the Fund continued to switch into better quality bonds, shortened duration, and reinvested cash, favouring the telecommunications, cable, and packaging sectors. In June, the manager continued to upgrade the Fund, reinvesting cash proceeds from redeemed bonds.
The manager remains extremely cautious, but opportunistic, as we continue to work through the effects of the global shutdown followed by the reopening of economies. The manager is actively engaging with the management teams of all the companies the Fund invests in and has found these discussions reassuring. The main purchases have been defensive companies that have sold off with the market, despite having robust business profiles and cash flows; in contrast, the manager continues to prune issuers considered too risky. The manager is finding some very attractive opportunities for the Fund, is looking globally to add risk and expects markets to remain solid over the coming months.
Insight Investment Management (Global) Limited July 2020
BNy MELLON SUSTAINABLE GLOBAL DyNAMIC BOND FUNDover the six-month period under review, the Fund’s Euro W (Acc.) share class returned -0.51%, compared with a return of 0.77% for 1 Month EURIBoR +2% per annum, both in euro terms.
The Fund produced a negative return and was behind the benchmark.
The first quarter of 2020 witnessed by far the most turbulent market conditions since the global financial crisis, as a result of the of Covid-19 global pandemic. The Fund generated a positive return through to the end of February, but significant losses in March outweighed these prior gains, as credit and emerging market sovereign bonds fell sharply. Government bond holdings produced positive returns, with US Treasuries the standout performers. High yield credit proved the biggest detractor as headline spreads widened to their highest level since
Fund, the manager initiated a robust analysis of the liquidity runway and access to capital markets given the uncertainty of the length and depth of this crisis. This led to several idiosyncratic reductions and default loss mitigation. Moreover, this increased intensity of the monitoring process has allowed the manager to focus the Fund on the highest-conviction positions. The manager took advantage of the influx of ‘fallen angels’ (bonds initially rated as investment grade but which have since been reduced to junk status) during the period, which was beneficial to performance. The Fund was constructive on US high yield in the second quarter of 2020 based on the supportive Fed backdrop, which was beneficial to performance. The Fund’s allocation to BB-rated credits was increased over the period as the manager believed the risk/return potential was more favourable in higher quality credits.
Alcentra NY, LLC July 2020
BNy MELLON GLOBAL SHORT-DATED HIGH yIELD BOND FUNDover the six-month period under review, the Fund’s USD A (Acc.) share class returned -4.56%, compared with a return of 0.53% for 3 Month USD LIBoR and -4.70% for the Lipper Global – Bond Global high Yield USD sector average, all in US dollar terms.
The Fund generated a negative return, and underperformed the Cash Benchmark (3 Month USD LIBoR), but outperformed the sector average.
With economic growth slowing sharply because of the Covid-19 pandemic, credit defaults increased, particularly in the US energy sector (following the oil price war between Saudi Arabia and Russia in March). The high yield sector came under increased selling pressure as the first quarter progressed. Fund outflows, combined with much weaker new issuance, created more challenging technical conditions. however, an aggressive monetary and fiscal policy response to the economic slowdown resulted in improved investor risk appetite, with the high yield sector performing strongly over the second quarter of 2020. Fund flows into the area turned positive but new issuance activity increased markedly as companies refinanced and raised liquidity. With fears of a global recession rising, government bond yields fell markedly over the first quarter but were then flat as the reopening of economies was offset by fears of a second wave of Covid-19 cases.
The manager invests the majority (over 50%) of assets in a portfolio of high yielding bonds that are short-dated (that is bonds that mature, or are expected to mature, within approximately three years) with no geographical, industry or sector focus. The manager invests in debt and
GLOBAL FIxED INCOME cont’d.
BNy MELLON GLOBAL HIGH yIELD BOND FUND cont’d.
03613-1A.indd 32 19/08/2020 19:00

3333
BNY MelloN GloBal FuNds, plc
INVESTMENT MANAGERS’ REPORTS cont’d.
REGIONAL & SpECIALIST FIxED INCOME
BNy MELLON EFFICIENT U.S. HIGH yIELD BETA FUNDover the six-month period under review, the Fund’s USD A (Inc.) share class returned -5.99%, compared with a return of -3.80% for the Bloomberg Barclays US Corporate high Yield TR Index and -5.36% for the Lipper Global – Bond USD high Yield sector average, all in US dollar terms.
Early in the year, the spread of Covid-19 led to an acute deterioration in sentiment as markets priced in the threat of a global recession. High yield bonds tumbled in March, their worst month since october 2008. Risk appetite recovered during the second quarter as central banks responded with unprecedented fiscal and monetary policy stimulus and Covid-19 lockdowns eased, boosting optimism for recovery. High yield bonds recouped most of the early year losses but finished down several percentage points year to date. Bonds with a higher credit rating outperformed. on a total return basis, BB-rated bonds rose 0.21%, while B-rated bonds fell 5.45%. The CCC-rated bonds was down 13.32%. Most sectors were negative, led by a large drop in the energy sector. The yield on the 10-year US Treasury note fell 126 basis points (bps) to 0.66%, while the 5-year yield was lower by 140bps to 0.29%. High yield underperformed US Treasuries by 8.67%.
The Fund is positioned to provide diversified exposure to US high yield corporate bond securities with similar credit rating, duration, and maturity characteristics as found in the Bloomberg Barclays US Corporate high Yield Index, while seeking to mitigate and minimise default risk and transaction costs associated with traditional sample and replication approaches.
Mellon Investments Corporation July 2020
BNy MELLON EMERGING MARKETS CORpORATE DEBT FUNDover the six-month period under review, the Fund’s USD A share class returned -2.35%, compared with a return of -0.16% for the Jp Morgan Corporate EMBI Broad Diversified TR Index and -2.45% for the Lipper Global – Bond Emerging Markets Global Corporates sector average, all in US dollar terms.
The Fund generated a negative return and underperformed both its benchmark and the sector average.
Following their sharp sell-off in March because of the Covid-19 pandemic, emerging market corporate bonds have been supported by numerous central banks in both developing and advanced economies cutting interest rates, a weaker US dollar and recovering commodity prices. Also, while the global economy has slowed sharply, the local economies still have relatively high growth rates. The rebound in the asset class came despite concerns about
the global financial crisis. Contingent convertible bonds in BBVA, Lloyds, Santander and Nationwide were notable drags on performance. Emerging market sovereign bonds also incurred significant capital losses.
The Fund recovered some of these losses in the second quarter of 2020 as government bond yields remained within recent ranges, while credit spreads compressed sharply. Government bonds generated a modest positive performance, with New Zealand local government holdings among the best performers. High yield credit proved the standout positive contributor to Fund performance, with contingent convertible holdings, including UBS, Nationwide and Lloyds, rallying. Investment grade credit and emerging market sovereign bonds produced similarly solid positive returns. Emerging market sovereign returns were boosted by the strong performance of issues, such as Mexico and paraguay, as global US-dollar liquidity conditions and risk appetite recovered. Active currency positions also contributed positively to performance mainly owing to long pro-risk exposure focused on the Mexican peso, Norwegian krone and Canadian dollar, and short US dollar and sterling positions.
In terms of activity, the manager reduced the Fund’s high yield exposure, aided by the sale of InterXion 2025 (the year in which the bond matures), Charter 2024 and panther 2026 holdings, in the first quarter. The Fund’s emerging market sovereign bond exposure was also reduced. Risk currency exposure was reduced, aided by the sale of the Fund’s Indonesian rupiah, Malaysian ringgit and Norwegian krone positions. A short polish zloty position versus the US dollar was added. In the final quarter, the manager continued the gradual reduction in ‘safe haven’ government duration and an increase in exposure to emerging market and high yield debt. Exposure to investment grade bonds was increased, mainly through new issues including Apple, Cellnex Telecom, Covivio, Linde and Lonza. In high yield, the manager selectively added exposure through new issues such as IQVIA and Virgin Media. Currency strategy rotated towards risk, with the addition of exposure to currencies such as the Indonesian rupiah, Czech koruna, and peruvian sol.
In the manager’s view, the tug of war between an economic rebound, assisted by hefty fiscal and monetary policy support, versus the impact of persistent lockdowns and longer-term economic damage is likely to continue. Maintaining balance in the Fund is therefore particularly important. While debt sustainability requires the maintenance of ultra-low interest rates, anchoring the front end of yield curves, longer-dated issuance remains vulnerable to a rise in inflation expectations.
Newton Investment Management Limited July 2020
GLOBAL FIxED INCOME cont’d.
BNy MELLON SUSTAINABLE GLOBAL DyNAMIC BOND FUND cont’d.
03613-1A.indd 33 19/08/2020 19:00

3434
BNY MelloN GloBal FuNds, plc
INVESTMENT MANAGERS’ REPORTS cont’d.
on a bottom-up basis, emerging market corporates remain supported by still very attractive valuations with robust fundamentals in the manager’s view.
The manager remains constructive on emerging market corporate bonds and has a barbell position (positions at the long and short-dated end of maturities) in emerging market investment grade and high yield corporates. The manager’s positive outlook could change should supply increase more than expected in the primary market and/or if a sharp rally makes valuations less attractive, both in historical terms and relative to those in developed markets.
Insight Investment Management (Global) Limited July 2020
BNy MELLON EMERGING MARKETS DEBT FUNDover the six-month period under review, the Fund’s USD A share class returned -5.81%, compared with a return of -1.87% for the Jp Morgan EMBI Global TR Index and -3.64% for the Lipper Global – Bond Emerging Markets Global hC sector average, all in US dollar terms.
Financial markets experienced significant volatility during the first half of 2020 due to the global impact of the Covid-19 pandemic. For example, as economic activity halted, equities plummeted in the first quarter but rebounded during the second quarter as global economies reopened and optimism surrounding a possible vaccine increased.
Economic green shoots emerged in high frequency data on the back of monetary and fiscal policy stimulus in both emerging and developed economies. policy support continued and Chinese production is bouncing back; however, global trade took a significant hit and the first wave of Covid-19 is continuing to spread across the world.
The Fund underperformed in the first half of the year. The majority of underperformance was driven by long positions in oil-sensitive countries and corporates during the sell-off at the start of the year. In the second half of the period, security selection bounced back, specifically in Latin American corporates. however, over the period security selection was still a laggard. In asset allocation terms, the themes from the first quarter’s severe price movement dominated the first half of the year.
At the start of the period, the Fund added several investment grade names among the heavy supply to start the year. As the sell-off began and the primary market dried up, the manager focused on shifting from oil-sensitive to defensive names. Another overarching trading theme was a focus on credits with low tourism and remittance dependency.
The path of the pandemic is central to the global economic outlook. In Asia, Covid-19 has largely been brought under control and regional policymakers have shifted focus from
a possible second wave of Covid-19 cases, the global trade war and heightened geopolitical uncertainty in various regions. With volatility now subsiding, emerging market corporate bonds have enjoyed increasing inflows, with the low interest rate environment worldwide making them particularly attractive for income investors.
By region, Central and Eastern Europe and the Middle East and Africa significantly detracted from performance over the period, but Latin America and Asia were small positives.
The most positive countries were Chile, Colombia, China, Turkey and Argentina while the largest detractors were Ukraine, Saudi Arabia, Mexico, Indonesia and Brazil.
By sector, the main positive contributors were technology, media, and telecommunications; pulp and paper; industrials; and sovereigns while utilities, real estate, oil and gas, and consumer detracted most.
Investment grade bonds, particularly BBB-rated instruments, detracted from performance. High yield bonds also had a negative contribution, largely due to C-rated instruments, although B, CCC and CC-rated bonds were small positives.
The manager made various adjustments to the Fund’s positions over the period. The manager also selectively participated in the new issue market. As the global pandemic took hold in the first quarter, high yield exposure was reduced somewhat as the Fund became more defensive. however, given a huge amount of policy stimulus, the reopening of economies and attractive valuations, the manager invested cash in the second quarter before increasing it to fund anticipated new issuance in July. overall, the Fund is overweight high yield and slightly long duration given the manager’s positive near-term outlook. The Fund’s preference for Latin America and Central and Eastern Europe over Asia remains.
The easing of containment measures has led to a bounce in survey data, increasing market expectations for an economic recovery to start in the third quarter of the year. however, the shape of recovery remains uncertain and will likely vary across countries. Moreover, concerns over a second wave and the reopening of economies could lead to spikes in volatility on the way.
The manager expects emerging market corporate bond spreads to continue to tighten while emerging market economies recover (to various degrees) helped by their respective ongoing policy support measures. Global central bank buying of developed market corporates could lead to a further compression of emerging market spreads through the trickle-down effect.
BNy MELLON EMERGING MARKETS CORpORATE DEBT FUND cont’d.
REGIONAL & SpECIALIST FIxED INCOME cont’d.
03613-1A.indd 34 19/08/2020 19:00

3535
BNY MelloN GloBal FuNds, plc
INVESTMENT MANAGERS’ REPORTS cont’d.
rates detracted from performance from pressure on local quasi-government pEMEX (Mexico) and EpM (Colombia).
During the first quarter the manager reduced risk in both rates and emerging markets currency, as the economic implications of the virus began to appear. Several long rates positions were trimmed closer to benchmark weight, taking full or partial profits. Several long emerging markets currency positions were reduced as well, mostly in euro-centric currencies. In the second quarter the manager added back some of the rates positions in countries such as peru and Mexico. Currency risk was also increased through larger shorts and increased longs/reduced underweights.
The path of the Covid-19 pandemic is central to the global economic outlook. In Asia, Covid-19 has largely been brought under control and regional policymakers have shifted focus from triage to recovery. Unfortunately, the global backdrop is far from supportive. The US and Latin America remain deep in the throes of crisis. The prompt policy response of central bankers has restored order to financial markets and government transfers have blunted the negative shock to household incomes. Still, the prospect of a return to pre-pandemic levels of economic output seems remote in the manager’s view.
The world seems an unusually uncertain place. historically large shocks are reverberating through the global economy and policymakers have responded in kind. As is so often the case, the outlook for the economy is tied to the outlook for policy – specifically mitigation efforts. As the public conversation around the trade-offs between economic and physical health evolves, so too will the relative priorities of policymakers. In the manager’s view, the new post-pandemic normal is likely to be characterised by low inflation, high unemployment and persistent government intervention in financial markets. Around this gloomy trend, the manager believes the risks remain to the downside.
Mellon Investments Corporation July 2020
BNy MELLON EMERGING MARKETS DEBT OppORTUNISTIC FUNDover the six-month period under review, the Fund’s USD C share class returned -6.55%, compared with a return of -3.83% for the benchmark, a composite index comprising 50% Jp Morgan Government Bond Index – Emerging Markets Global Diversified TR Index, 25% Jp Morgan Emerging Markets Bond Index Global TR Index, 25% Jp Morgan Corporate Emerging Markets Bond Index Diversified TR Index, and -7.17% for the Lipper Global – Bond Emerging Markets Global hC sector average, all in US dollar terms.
Financial markets experienced significant volatility during the first half of 2020 due to the global impact of the Covid-19 pandemic. For example, as economic activity halted,
triage to recovery. Unfortunately, the global backdrop is far from supportive. The US and Latin America remain deep in the throes of crisis. The prompt policy response of central bankers has restored order to financial markets and government transfers have blunted the negative shock to household incomes. Still, the prospect of a return to pre-pandemic levels of economic output seems remote, in the manager’s view.
The world seems an unusually uncertain place. historically large shocks are reverberating through the global economy and policymakers have responded in kind. As is so often the case, the outlook for the economy is tied to the outlook for policy – specifically mitigation efforts. As the public conversation around the trade-offs between economic and physical health evolves, so too will the relative priorities of policymakers. In the manager’s view, the new post-pandemic normal is likely to be characterised by low inflation, high unemployment and persistent government intervention in financial markets. Around this gloomy trend, the manager believes the risks remain to the downside.
Mellon Investments Corporation July 2020
BNy MELLON EMERGING MARKETS DEBT LOCAL CURRENCy FUNDover the six-month period under review, the Fund’s USD A share class returned -9.50%, compared with a return of -6.89% for the Jp Morgan GBI-EM Global Diversified TR Index and -7.17% for the Lipper Global – Bond Emerging Markets Global LC sector average, all in US dollar terms.
Financial markets experienced significant volatility during the first half of 2020 due to the global impact of the Covid-19 pandemic. For example, as economic activity halted, equities plummeted in the first quarter but rebounded during the second quarter of 2020 as global economies reopened and optimism surrounding a possible vaccine increased.
Economic green shoots emerged in high frequency data on the back of monetary and fiscal policy stimulus in both emerging and developed economies. policy support continued and Chinese production is bouncing back; however, global trade took a significant hit and the first wave of Covid-19 continues to spread across the world.
The Fund was mostly long emerging markets currency and local rates during the first half of the year. Long emerging markets currency positions, especially in oil-sensitive currencies, generally underperformed including the Argentine peso, Brazilian real, Colombian peso and Chilean peso. Interest rates performance was mixed; led by a long position in Argentina inflation-linked bonds, long South African rates and long Russian rates. on the other hand,
BNy MELLON EMERGING MARKETS DEBT FUND cont’d.
REGIONAL & SpECIALIST FIxED INCOME cont’d.
03613-1A.indd 35 19/08/2020 19:00

3636
BNY MelloN GloBal FuNds, plc
INVESTMENT MANAGERS’ REPORTS cont’d.
shock to household incomes. Still, the prospect of a return to pre-pandemic levels of economic output seems remote, in the manager’s view.
The world seems an unusually uncertain place. historically large shocks are reverberating through the global economy and policymakers have responded in kind. As is so often the case, the outlook for the economy is tied to the outlook for policy – specifically mitigation efforts. As the public conversation around the trade-offs between economic and physical health evolves, so too will the relative priorities of policymakers. In the manager’s view, the new post-pandemic normal is likely to be characterised by low inflation, high unemployment and persistent government intervention in financial markets. Around this gloomy trend, the manager believes the risks remain to the downside.
Mellon Investments Corporation July 2020
BNy MELLON EMERGING MARKETS DEBT TOTAL RETURN FUNDover the six-month period under review, the Fund’s USD W (Acc.) share class returned -3.66%, compared with a return of -3.27% for the benchmark* and -7.17% for the Lipper Global – Bond Emerging Markets Global LC sector average, all in US dollar terms.
The Fund generated a negative return and underperformed its benchmark but outperformed the sector average.
Following their sharp sell-off in March because of the Covid-19 pandemic, emerging market bonds have been supported by numerous central banks in both developing and advanced economies cutting interest rates, a weaker US dollar and recovering commodity prices.
Also, while the global economy has slowed sharply, local economies still have relatively high growth rates. The rebound in the asset class came despite concerns about a possible second wave of Covid-19 cases, the global trade war and heightened geopolitical uncertainty in various regions. With volatility now subsiding, emerging market bonds have enjoyed increasing inflows, with the low interest rate environment worldwide making such instruments particularly attractive for income investors.
By region, Latin America, in particular, and Asia detracted from performance but the Middle East and Africa and, to a much lesser extent, Central and Eastern Europe were positives.
Foreign exchange allocations detracted from performance. The largest negatives were Brazil, Colombia and South Africa but the Czech Republic and Egypt helped. US dollar denominated corporates also weighed on returns,
equities plummeted in the first quarter but rebounded during the second quarter as global economies reopened and optimism surrounding a possible vaccine increased.
Economic green shoots emerged in high frequency data on the back of monetary and fiscal policy stimulus in both emerging and developed economies. policy support continued and Chinese production is bouncing back; however, global trade took a significant hit and the first wave of Covid-19 is continuing to spread across the world.
The Fund underperformed the benchmark in the first half of the year. In the hard currency portion, the majority of underperformance was driven by long positions in oil-sensitive countries and corporates during the sell-off at the start of the year. In asset allocation terms, the themes from the first quarter’s severe price movement dominated the first half of the year. The Fund was mostly long emerging markets currency and local during the first half of the year. Long emerging markets currency positions underperformed, especially in oil-sensitive Latin American currencies like the Argentine peso, Brazilian real, Colombian peso and Chilean peso.
Interest rates performance was mixed, led by a long position in Argentina inflation-linked bonds, long South African rates, and long Russian rates. on the other hand, rates detracted from performance due to pressure on local quasi-government pEMEX (Mexico) and EpM (Colombia).
In the local currency portion, the Fund reduced risk in both rates and emerging markets currency, as the economic implications of the virus began to appear. Several long rates positions were trimmed closer to benchmark weight, taking full or partial profits. Several long emerging markets currency positions were reduced as well, mostly in euro-centric currencies. In the second quarter the manager added back some of the rates positions in countries such as peru and Mexico. Currency risk was also increased through larger short positions and increased long positions/reduced underweights. In the hard currency portion, as the sell-off began and the primary market dried up, the manager focused on shifting from oil-sensitive to defensive names. Another overarching trading theme was a focus on credits with low tourism and remittance dependency.
The path of the Covid-19 pandemic is central to the global economic outlook. In Asia, Covid-19 has largely been brought under control and regional policymakers have shifted focus from triage to recovery. Unfortunately, the global backdrop is far from supportive. The US and Latin America remain deep in the throes of crisis. The prompt policy response of central bankers has restored order to financial markets and government transfers have blunted the negative
REGIONAL & SpECIALIST FIxED INCOME cont’d.
BNy MELLON EMERGING MARKETS DEBT OppORTUNISTIC FUND cont’d.
03613-1A.indd 36 19/08/2020 19:00
3737
BNY MelloN GloBal FuNds, plc
INVESTMENT MANAGERS’ REPORTS cont’d.
BNy MELLON EUROLAND BOND FUNDover the six-month review period, the Fund’s Euro A share class returned -0.76%, compared with a return of 1.24% for the Bloomberg Barclays Euro Aggregate Bond TR Index and -0.41% for the Lipper Global – Bond EUR sector average, all in euro terms.
Markets showed resiliency to start the year while continuing to march higher despite US-Iran geopolitical tensions. however, sentiment turned dramatically negative due to the rapid spread of Covid-19 and unprecedented government responses that effectively closed down the global economy. Markets began to rebound in the second quarter as economic green shoots emerged in high frequency data on the back of monetary and fiscal policy stimulus in both developed and emerging economies. policy support has continued and within China, where the disease first took hold, production is bouncing back. however global trade has taken a significant hit and the first wave of Covid-19 is continuing to spread across the world.
The Fund had maintained a largely neutral position to investment grade corporate bonds ahead of the March sell-off, finding little value in that market but did however hold a material overweight to emerging market debt which contributed to the significant underperformance the Fund experienced in the first quarter of the year as spreads on hard currency emerging market debt ballooned and local currency instruments were impacted by US dollar strength.
The dislocation in credit spreads experienced during March presented the Fund with an attractive opportunity to increase allocation to corporate credit and benefit from the additional yield advantage and prospect of spread contraction.
The Bloomberg Barclays Euro Aggregate IG Corporate Index spread reached a peak of 247 basis points (bps) on 24 March and finished the first quarter at 239bps having started the year at 93bps. During the second quarter of 2020 spreads narrowed by 90bps to 149bps. The material overweight to this sector, as well as off-benchmark exposure to corporate high yield that also narrowed significantly during this period, contributed significantly to outperformance in the second quarter of 2020. The overweight to corporate credit remains a strong conviction view by the investment team.
The Fund has reduced its exposure to developed economy government bonds over the six-month period from around neutral to index at c.57% to almost 22% underweight at c.35.8% of the Fund compared to 57.7% for the benchmark.
overall duration in the Fund stood at 7.35 years as at 30 June 2020, a decrease of c.0.2 years since the end of 2019. Specific country duration overweight positions include Spain, Australia, Cyprus, Italy and portugal with
particularly those in Mexico, Indonesia, Saudi Arabia and the United Arab Emirates; however, Colombia, Ghana, kuwait and Turkey were positives. Meanwhile, local currency rates positions had a positive effect on returns, particularly those in South Africa, Mexico and Indonesia but peru, Romania and Thailand were negatives. US dollar denominated sovereign bonds were also supportive: Mexico, the United Arab Emirates and Israel were the main positives, while Ecuador, Argentina and the Dominican Republic were the largest detractors.
The manager made various adjustments to the Fund’s positions over the period. As the global pandemic took hold in the first quarter, risk was reduced somewhat as the Fund became more defensive. however, given a huge amount of fiscal and monetary policy stimulus, the reopening of economies and attractive valuations, the manager invested cash in the second quarter. overall, the Fund is now overweight both sovereigns and local rates. At the end of the reporting period the Fund had a neutral position in corporate bonds and was underweight foreign exchange.
The easing of containment measures has led to a bounce in survey data, increasing market expectations for an economic recovery to start in the third quarter of the year. however, the shape of recovery remains uncertain and will likely vary across countries. Moreover, concerns over a second wave of Covid-19 and the reopening of economies could lead to spikes in volatility on the way.
The manager expects emerging market spreads to continue to tighten while emerging market economies recover (to various degrees) helped by their respective ongoing policy support measures. Global central bank buying of developed market bonds could lead to a further compression of emerging market spreads through the trickle-down effect. on a valuation basis, emerging market asset classes still remain attractive in the manager’s opinion. The main risk to the manager’s outlook is a large spike in Covid-19 cases, causing larger economies to enter another widescale lockdown. other risks include a pickup in US-China tensions heading into the US election – causing the ‘phase one’ trade deal to be disrupted – and increased volatility in developed market rates if the market temporarily challenges the assumption that central banks can purchase enough assets to control the shape of yield curves.
* Comprised 1/3 Jp Morgan Government Bond Index – Emerging Markets
Global Diversified TR Index, 1/3 Jp Morgan Emerging Markets Bond
Index Global Diversified TR Index, 1/3 Jp Morgan Corporate Emerging
Markets Bond Index Broad Diversified TR Index.
Insight Investment Management (Global) Limited July 2020
BNy MELLON EMERGING MARKETS DEBT TOTAL RETURN FUND cont’d.
REGIONAL & SpECIALIST FIxED INCOME cont’d.
03613-1A.indd 37 19/08/2020 19:00

3838
BNY MelloN GloBal FuNds, plc
INVESTMENT MANAGERS’ REPORTS cont’d.
The Fund has minimal exposure to non-euro (US dollar and sterling) credit.
The Fed has said that rates are on hold until at least the end of 2022. The Fed’s current guidance is that rates will not rise until it achieves its employment and inflation objectives, which seems unlikely before the end of 2022 in the manager’s view. Near-term risks remain to the downside, but negative rates seem unlikely. however, the Fed is considering yield curve control, likely focusing on maturities up to five years. The manager expects rates to remain stable for an extended period, then gradually normalise from late 2024. A relatively steep yield curve, and a downward revision in the long-run neutral rate, are probable.
With growth slowing, the ECB announced at its June meeting that it is increasing the size of the pEpp by €600bn to €1.35 trillion, with purchases under the programme continuing until at least June 2021; it will reinvest maturing securities until at least the end of 2022. The pEpp has become the ECB’s main policy tool in response to the crisis. The programme’s timescale, asset classes and jurisdictions will all remain under review, but the manager expects few changes through the end of the year.
Insight Investment Management (Global) Limited July 2020
BNy MELLON U.S. MUNICIpAL INFRASTRUCTURE DEBT FUNDover the six-month review period, the Fund’s USD C (Acc.) share class returned 4.12%, compared with a return of 4.60% for the benchmark (50% Bloomberg Barclays US Municipal Bond TR Index, 50% Bloomberg Barclays Taxable US Municipal Bond TR Index), both in US dollar terms.
The Fund seeks to take advantage of relative value opportunities across the US municipal bond market, to provide as high a level of income as is consistent with the preservation of capital. The Fund may hold both taxable and tax exempt instruments and may take exposure to US state, county or local issuers through revenue pledged bonds and general obligation instruments.
The Fund’s duration was 6.83 years as at 30 June 2020 and had an average credit rating of A. It held approximately 180 individual bonds generating a weighted current yield of 3.61% (2.40% on a yield to worst basis), both expressed in US dollar terms.
The Fund invests in issuers across a large number of US states although the economically more significant and populous states feature as domicile for a large proportion of the securities held in the portfolio. Grouped by state, the
relative duration underweight positions in Germany and the US. Benchmark duration stands at 7.51 years as at 30 June 2020, itself having extended by c.0.3 years since last December.
Mellon Investments Corporation July 2020
BNy MELLON EUROpEAN CREDIT FUNDover the six-month period under review, the Fund’s Euro A share class returned -2.15%, compared with a return of -1.22% for the Markit iBoxx Euro Corporates TR Index and -1.95% for the Lipper Global – Bond EUR Corporates sector average, all in euro terms.
The Fund generated a negative return and underperformed both its benchmark and the sector average.
The Covid-19 pandemic caused a sharp sell-off in financial markets during the first quarter. however, unprecedented fiscal and monetary policy stimulus measures, along with the reopening of economies, then triggered a sharp rebound. The global trade war continued to weigh on markets, although the US and China reached a ‘phase one’ agreement in January. Brexit concerns also remained, with the Uk aiming to reach a transitional trade agreement with the EU by year-end. The European Central Bank (ECB) kept its main refinancing rate at 0% but now has a €1.35 trillion pandemic Emergency purchase programme (pEpp). The US Federal Reserve (Fed) slashed the Fed funds rate to a range of 0 to 0.25% and announced unlimited asset purchases. The Bank of England (BoE) lowered its base rate by 65 basis points to 0.1% and increased quantitative easing to £745bn. Given subdued underlying inflation, signs of an economic recovery, and ongoing ECB support, European corporate bonds rebounded after their sell-off in March but still ended down over the period.
The Fund’s credit strategy was detrimental in the first quarter, particularly March, as spreads widened. however, some of that performance was recovered in the second quarter as spreads tightened again. While security selection was consistently strong across a number of sectors over the period, the Fund’s duration and yield curve strategies slightly detracted.
From a security selection perspective, the manager focused on new issues across a range of sectors over the period and also reduced exposure to a few names.
The Fund’s main overweights are in telecommunications, subordinated insurance, residential mortgage-backed securities and energy, while the manager is underweight in utilities, transport, cyclical consumer and capital goods.
REGIONAL & SpECIALIST FIxED INCOME cont’d.
BNy MELLON EUROLAND BOND FUND cont’d.
03613-1A.indd 38 19/08/2020 19:00

3939
BNY MelloN GloBal FuNds, plc
INVESTMENT MANAGERS’ REPORTS cont’d.
BNy MELLON U.S. MUNICIpAL INFRASTRUCTURE DEBT FUND cont’d.top five exposures represent c.52% of the Fund, comprising bond issuers domiciled in California, Illinois, pennsylvania, New York and Florida.
The Fund continues to favour revenue bonds and held exposure of c.78% compared to the custom benchmark weight of c.62% with overweights to the hospital and airport sectors. General obligation bonds represent c.10% of the Fund compared to the benchmark weight of c.19%. Tax exempt security exposure was c.30% with the balance of the Fund invested in taxable municipal bonds and cash.
Since launch in April 2017, the Fund has attracted significant international investor interest and stands at over US$500m assets under management as at 30 June 2020.
Mellon Investments Corporation July 2020
All data sourced from Lipper as at 30 June 2020 Total Return, no initial
charge, but includes annual charges, income reinvested gross of tax. The
impact of the initial charge can be material on the performance of your
investment. performance figures including the initial charge are available
on request. past performance is not a guide to future performance.
performance history is given in share class currency.
^ For a definition of italicised terms, please refer to the Glossary
on pages 40 to 42.
REGIONAL & SpECIALIST FIxED INCOME cont’d.
03613-1A.indd 39 19/08/2020 19:00

40
Term Definition
Alternatives An alternative is a financial asset that does not fall into one of the conventional investment categories. Conventional categories include equities, bonds and cash. Alternative investments include private equity or venture capital, hedge funds, managed funds, art and antiques, commodities and derivative contracts. Real estate is also often classified as an alternative.
Asset-Backed Securities (ABS)
pools of loans packaged and sold as securities – a process known as “securitisation”. Typically the assets backing these are home mortgages or credit card receivables.
Basis points (BPS) Basis point (BpS) refers to a common unit of measure for interest rates and other percentages in finance. one basis point is equal to 1/100th of 1%, or 0.01%, or 0.0001.
Bull/bullish A bull is an investor who is typically optimistic the price of a security or market will rise.
Bull market A market in which the prices of securities are rising, often characterised by investor optimism and confidence in continuing strong returns.
Call option(s) An option contract giving the owner the right, but not the obligation, to buy a specified amount of an underlying security at a specified price within a specified time period.
Consumer discretionary Goods and services considered non essential by consumers but desirable if their income is sufficient to purchase them.
Consumer staples Goods and services that people are unable or unwilling to cut out of their budgets regardless of their financial situation.
Consumer goods products bought for consumption by the average consumer e.g. clothing, food, and jewellery.
Consumer Price Index (CPI) An index used to measure inflation, based on the prices in a basket of goods and services, meant to be representative of those we typically spend our money on.
Contingent convertible bond(s)
A type of fixed income instrument that is convertible into equity (company shares) if a pre-specified trigger event occurs.
Correlation Correlation is a measure of the degree to which two variables move in relation to one another.
Credit(s) In this context it is synonymous with corporate bonds, debt issued by companies.
Credit rating(s) An evaluation of the credit worthiness of a borrower, such as a particular company or government. A company with a debt rated AAA is considered to be more credit worthy than a company rated BBB.
Term Definition
Credit spreads The difference in yield between two bonds of similar maturity but different credit quality; for example if the 10-year Treasury (US government debt) is trading at a yield of 6% and a 10-year corporate bond is trading at a yield of 8%, the corporate bond is said to offer a 200-basis-point spread over the Treasury. Widening credit spreads indicate growing concern about the ability of borrowers to service their debt. Narrowing credit spreads indicate improving private creditworthiness. See also the definitions of yield and basis points.
Cyclical(s) A cyclical stock or industry is one deemed sensitive to the wider economy. As such its revenues are generally higher in periods of economic prosperity and expansion and lower in periods of economic downturn and contraction.
Default(s) Default is the failure to pay interest or principal on a loan or security when due.
Default rates A statistical measure expressing the percentage of issuers in a given fixed-income asset class that failed to make scheduled interest or principal payments in the prior 12 months. For example, if an asset class had 100 individual issuers and two of them defaulted in the prior 12 months, the default rate would be 2%.
Defensive A defensive stock or industry is less sensitive to the wider economy, such that earnings and dividends are generally stable.
Derivative(s) A financial security with a value that is reliant upon or derived from an underlying asset or group of assets. The derivative itself is a contract between two or more parties based upon the asset or assets. Its price is determined by fluctuations in the underlying asset. The most common underlying assets include stocks, bonds, commodities, currencies, interest rates and market indexes.
Diversified/diversification Investing in a variety of companies or financial instruments, which typically perform differently from one another. For example, investing in different regions or sectors, with the aim of offsetting poor performance in one, with positive performance in another.
Dividend A sum paid regularly by a company to its investors as a reward for holdings their shares.
Dividend yield The dividend received from a share, expressed as a percentage based on the investment’s costs, its current market or its face value.
Drawdown(s) A decline in an investment or fund.
Duration A measure of the sensitivity of the fixed income security or bond fund to a change in interest rates. The longer a bond’s duration, the more sensitive it is to interest rate movements.
GLOSSARY OF FINANCE TERMS
03613-1A.indd 40 19/08/2020 19:00

4141
BNY MelloN GloBal FuNds, plc
GLOSSARY OF FINANCE TERMS cont’d.
Term Definition
Equity/Equities Shares issued by a company, representing an ownership interest.
Equity risk premium Refers to the difference from investing in a holding or stock market that may be expected over a notional ‘risk-free’ rate (often longer term government bonds, assuming zero default risk by the government). This return compensates investors for taking on the relatively higher risk of equity investing. The size of the premium varies and depends on the level of risk in a particular holding, index or portfolio. It also changes over time as market risk fluctuates.
Eurozone The economic region that contains all members of the European Union that use the euro as currency.
Exchange-Traded Fund (ETF) A type of investment fund that is traded on a stock exchange, typically tracks a stock index, a commodity, bonds, or a basket of assets.
Fiscal policy Government policy on taxation, spending and borrowing.
Fiscal year The 12-month period that a company used for accounting purposes and preparing financial statements.
Fundamentals (company) A basic principle, rule, law, or the like, that serves as the groundwork of a system. A company’s fundamentals are factors such as its business model, earnings, balance sheet and debt.
Fundamentals (economic) A basic principle, rule, law, or the like, that serves as the groundwork of a system. Economic fundamentals are factors such as inflation, employment and economic growth.
Futures Futures are financial contracts obligating the buyer to purchase an asset or the seller to sell an asset, such as a physical commodity or a financial instrument, at a predetermined future date and price. Futures contracts detail the quality and quantity of the underlying asset; they are standardised to facilitate trading on futures exchanges.
Geopolitics/Geopolitical Geographic influences on power relationships in international relations.
Gross Domestic Product (GDP)
Gross domestic product is a monetary measure of the market value of all goods and services produced in a given period of time.
General obligation bonds/instruments/securities
Municipal securities that are secured by the tax receipts of the issuing government body. often in the event of default, general obligation bonds have a superior claim on a municipal’s assets or tax receipts over other debt securities.
Gilt(s) Fixed income security issued by the United kingdom government.
Term Definition
Hard currency hard currencies are issued by developed countries that have a strong industrial economy accompanied by a stable government. Generally used to refer to the Uk pound sterling, the euro and the US dollar.
Hedge(s)/hedged/hedging A method of reducing unnecessary or unintended risk.
High yield Fixed income securities with a low credit rating that is considered to be at higher risk of default than better quality securities but have the potential for higher rewards.
Inflation/Inflationary The rate of increase in the cost of living. Inflation is usually quoted as an annual percentage, comparing the average price this month with the same month a year earlier.
Inflation-linked bonds Fixed income securities where both the value of the loan and the interest payments are adjusted in line with inflation over the life of the security. Also referred to as Index-linked bonds.
Investment grade Fixed income securities with a medium or high credit rating that are considered to be at lower risk from default than those issued with lower credit ratings.
Large-cap This refers to a company with a very large market capitalisation value. This is based on the market value of a publicly traded company’s outstanding shares.
Leverage(d) When referring to a company, leverage is the level of a company’s debt in relation to its assets. A company with significantly more debt than capital is considered to be leveraged. It can also refer to a fund that borrows money or uses derivatives to magnify an investment position.
Liquidity Liquidity describes the degree to which an asset or security can be quickly bought or sold in the market without affecting its price. Market liquidity refers to the extent to which a market, such as a country’s stock market, allows assets to be bought and sold at stable prices.
Long Refers to ownership of a security held in the expectation that the security will rise in value.
Macroeconomic The performance and behaviour of an economy, including factors such as economic output, unemployment, inflation and investment.
Maturity/maturities The length of time until the initial investment amount of a fixed income security is due to be repaid to the holder of the security.
Mid-cap This refers to a company with a medium-sized market capitalisation value. This is based on the market value of a publicy traded company’s outstanding shares.
03613-1A.indd 41 19/08/2020 19:00

4242
BNY MelloN GloBal FuNds, plc
GLOSSARY OF FINANCE TERMS cont’d.
Term Definition
Spread(s) The difference between the yield of a corporate bond, and a government bond with the same maturity. Yield refers to the income received from an investment and is expressed as a percentage of the investment’s current market value.
Standard deviation A statistical measure of dispersion of a set of data from its mean.
Sub-investment grade Fixed income securities issued with a low rating. They are considered to be at higher risk of default.
Subordinated debt A loan or security that ranks below other loans or securities with regard to claims on assets or earnings.
Synthetic A synthetic investment is a position that is meant to imitate the characteristics of another investment, without holding a physical position in the underlying asset.
Total return The term for the gain or loss derived from an investment over a particular period. Total return includes income (in the form of interest or dividend payments) and capital gains.
Treasury/Treasuries U.S. government debt security with a maturity of more than 10 years. Treasury bonds make interest payments semi-annually.
Treasury Inflation-Protected Securities (TIPS)
U.S government debt securities where the value of the loan and the interest payments are adjusted in line with inflation, as reflected in the Consumer price Index, over the life of the security.
Underweight having less invested in a company, region or sector, than the benchmark or comparative product.
Unhedged A position not balanced by a compensating contract or transaction.
Volatile/volatility Large and/or frequent moves up or down in the price or value of an investment or market.
Yield(s) The interest received from a bond or the dividends received from a share. It is usually expressed as a percentage based on the investment’s costs, its current market value or its face value.
Yield curve A yield curve is a line that plots the interest rates, at a set point in time, of bonds having equal credit quality but differing maturity dates.
Yield-to-worst The lowest potential yield that can be received on a bond without the issuer defaulting. This metric is used to evaluate the worst-case scenario for yield to help investors manage risks and ensure that specific income requirements will still be met even in the worst scenarios.
Term Definition
Monetary easing Monetary policy in which a central bank lowers interest rates and deposit ratios to make credit more easily available.
Monetary policy A central bank’s regulation of money in circulation and interest rates.
Monetary stimulus An attempt by a government to make the economy grow faster by increasing the money supply (the amount of money in the economy) or lowering interest rates.
Option(s) Financial contracts that offer the right, but not the obligation, to buy or sell an asset at a given price on or before a given date in the future.
Overweight/overweights/overweighted
having more invested in a company, region or sector, than the benchmark or comparative product.
Put option(s) An option contract giving the owner the right, but not the obligation, to sell a specified amount of an underlying security at a specified price within a specified time period.
Quantitative easing A monetary policy whereby a central bank buys predetermined amounts of government bonds or other financial assets in order to stimulate the economy and increase liquidity.
Quasi-government A type of corporation in the private sector that is backed by a branch of government. Most quasi-public corporations begin as government agencies and then become separate entities.
Residential Mortgage-Backed Securities (RMBS)
A type of security secured or backed by mortgages on a pool of residential properties.
Revenue bonds Municipal bonds that finance income-producing projects and are secured by a specified revenue source. Typically, revenue bonds can be issued by any government agency or fund that is managed in the manner of a business, such as entities having both operating revenues and expenses.
Risk asset(s) A risk asset is any asset that carries a degree of risk. Risk asset generally refers to assets that have a significant degree of price volatility, such as equities, commodities, high yield bonds and currencies.
‘Safe haven’ Refers to assets that investors perceive to be relatively safe from suffering a loss in times of market turmoil.
Security/Securities A tradable financial asset such as a share in a company or a fixed income security also known as a bond.
Short A way for a fund manager to express his or her view that the market or a security might fall in value.
Small-cap This refers to a company with a small market capitalisation value. This is based on the market value of a publicly traded company’s outstanding shares.
03613-1A.indd 42 19/08/2020 19:00

43
HALF YEARLY MANAGEMENT REPORT
There have been no other significant events affecting the Company during the financial period other than those disclosed in Note 18 to the financial statements.
SUBSEQUENT EVENTSThere have been no significant events affecting the Company since the financial period end other than those disclosed in Note 19 to the financial statements.
COMpANy RISKThe Company’s investment activities expose it to the various types of risk, which are associated with the financial instruments and markets in which it invests: market risk (including market price risk, interest rate risk and currency risk), credit risk and liquidity risk. The Company has in place risk management programmes that seek to limit the potential adverse effects of these risks on the Funds’ financial performances.
RISK MANAGEMENT OBJECTIVES AND pOLICIESDetails of the risks inherent in investing in the Company, its risk management objectives and policies are disclosed in Note 15 to the financial statements.
RELATED pARTy TRANSACTIONS AND BALANCESother than as disclosed in Note 10 to the financial statements, the Directors are not aware of any contracts or arrangements of any significance in relation to the business of the Company in which the Directors had any beneficial interest as defined in the Companies Act 2014, as amended, at any time during the financial period ended 30 June 2020 and 31 December 2019.
CONNECTED pERSON TRANSACTIONSIn accordance with Section 43(1) of the Central Bank (Supervision and Enforcement) Act 2013 (Section 48(1)) (Undertakings for Collective Investment in Transferable Securities) Regulations 2019 (the “Central Bank UCITS Regulations”), any transaction carried out with the Company by its promoter, manager, depositary, investment adviser and/or associated or group companies of these entities (“connected persons”) must be carried out as if negotiated at arm’s length. Such transactions must be in the best interests of the shareholders. In addition to those transactions, there are also transactions carried out by connected persons on behalf of the Company to which the Directors have no direct access and in respect of which the Directors must rely upon assurances from its delegates that the connected persons carrying out those transactions do carry them out on a similar basis.
BUSINESS REVIEWThe results of operations are set out in the Statement of Comprehensive Income. Further information on risk management objectives and policies are detailed below.
Assets under management at the end of the financial period are set out on the Statement of Financial position.
There is a detailed review in the Investment Managers’ Reports of factors contributing to the Funds’ performance. At this time, the Board of Directors does not anticipate any changes in the structure or investment objective of the Company.
DISTRIBUTIONSDistributions to redeemable participating shareholders are recognised in the Statement of Comprehensive Income as finance costs when they are declared to the Euronext Dublin, as detailed in the prospectus. Distributions are declared to the extent necessary to enable the Company to pursue a full distribution policy in accordance with the current Uk tax legislation.
Details of distributions paid to redeemable participating shareholders are disclosed in the Statement of Comprehensive Income and distributions declared subsequent to the financial period end to redeemable participating shareholders are disclosed in Note 19 to the financial statements.
SIGNIFICANT EVENTS DURING THE pERIODCOVID-19In March 2020, the World health organisation declared CoVID-19 a pandemic. While the full impact is not yet known, CoVID-19 may result in continued market volatility and a period of economic decline globally. It may also have a significant adverse impact on the value of a Sub-Fund’s investments and the ability to access markets or implement the Sub-Fund’s investment policy in the manner originally contemplated. Government interventions or other limitations or bans introduced by regulatory authorities or exchanges and trading venues as temporary measures in light of significant market volatility may also negatively impact on the ability to implement a Sub-Fund’s investment policy. Sub-Funds’ access to liquidity could also be impaired in circumstances where the need for liquidity to meet redemption requests may rise significantly. Services required for the operation of the Company may in certain circumstances be interrupted as a result of the pandemic.
The developments are being monitored closely. Given the nature of the outbreak and the on-going developments, there is a high degree of uncertainty and it is not possible at this time to predict the extent and nature of the overall future impact on the Company.
03613-1A.indd 43 19/08/2020 19:00

4444
BNY MelloN GloBal FuNds, plc
HALF YEARLY MANAGEMENT REPORT cont’d.
CONNECTED pERSON TRANSACTIONS cont’d.Shareholders should have regard to the governance structure of the Company as more particularly described in the Corporate Governance Statement section of the Directors’ Report to the most recent annual report and audited financial statements of the Company for the financial year ended 31 December 2019 and the roles and responsibilities of the Company’s respective delegates subject to the overall supervision of the Board. Further, shareholders should refer to the prospectus which identifies many of the connected person transactions and the general nature of the contractual arrangements with the principal connected persons but it is not exhaustive of all connected person transactions. Shareholders should also refer to the provisions of the prospectus dealing with conflicts of interest.
Therefore, having regard to confirmations from the Manager and its relevant delegates, the Board of Directors of the Company is satisfied that:
(i) there are arrangements (as evidenced by written procedures documented by the Investment Managers) in place to ensure that the obligations described above are applied to all transactions with connected persons; and
(ii) transactions with connected persons entered into during the financial period complied with these obligations, as attested by the Investment Managers through regular updates to the Directors.
Note 10 details related party transactions during the financial period. however, shareholders should understand that not all “connected persons” are related parties. Details of fees paid to related parties and certain connected persons are set out in Notes 3 to 7 and 10.
03613-1A.indd 44 19/08/2020 19:00
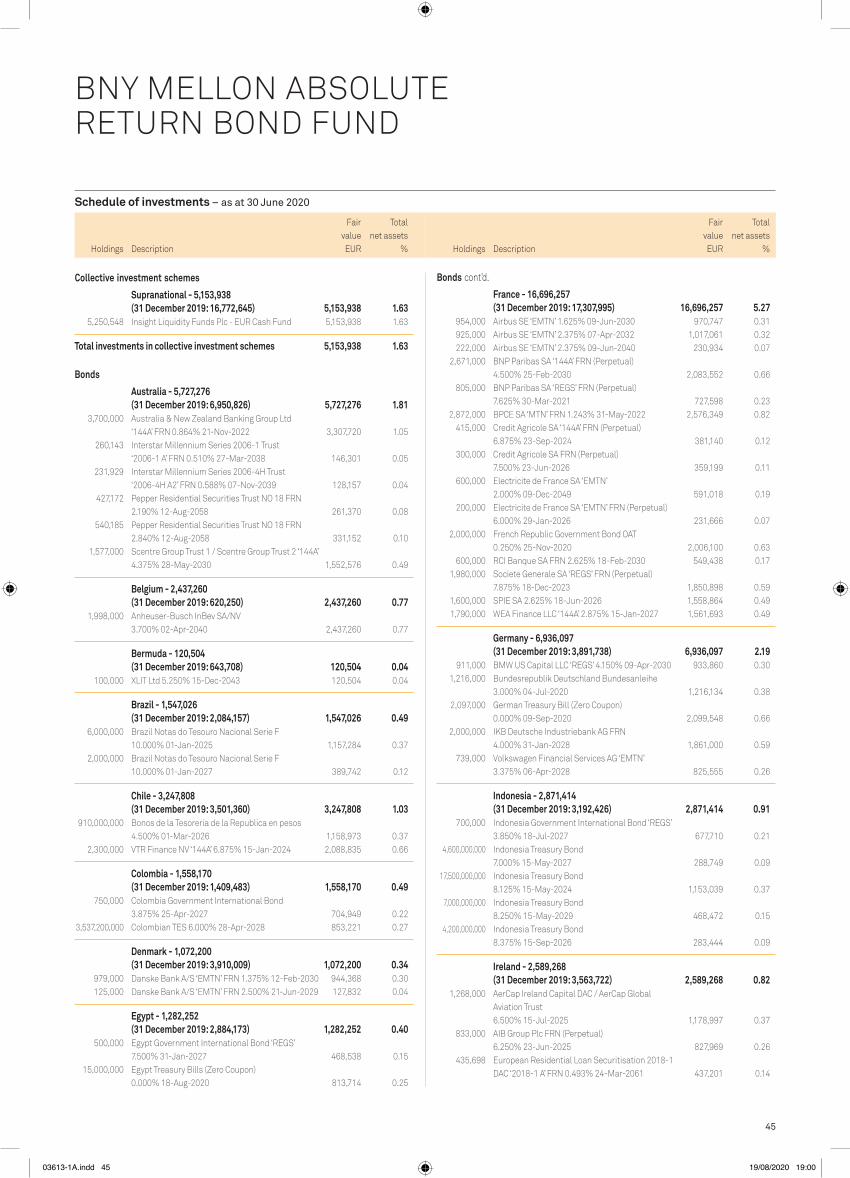
45
Schedule of investments – as at 30 June 2020
Holdings Description
Fair value
Total net assets
% Holdings Description
Fair value
Total net assets
%
FUND 1 – BNy MELLON ABSOLUTE RETURN BOND FUND
Collective investment schemes
Supranational - 5,153,938 (31 December 2019: 16,772,645) 5,153,938 1.63
5,250,548 Insight Liquidity Funds Plc - EUR Cash Fund 5,153,938 1.63
Total investments in collective investment schemes 5,153,938 1.63
Bonds
Australia - 5,727,276 (31 December 2019: 6,950,826) 5,727,276 1.81
3,700,000 Australia & New Zealand Banking Group Ltd ‘144A’ FRN 0.864% 21-Nov-2022 3,307,720 1.05
260,143 Interstar Millennium Series 2006-1 Trust ‘2006-1 A’ FRN 0.510% 27-Mar-2038 146,301 0.05
231,929 Interstar Millennium Series 2006-4H Trust ‘2006-4H A2’ FRN 0.588% 07-Nov-2039 128,157 0.04
427,172 Pepper Residential Securities Trust NO 18 FRN 2.190% 12-Aug-2058 261,370 0.08
540,185 Pepper Residential Securities Trust NO 18 FRN 2.840% 12-Aug-2058 331,152 0.10
1,577,000 Scentre Group Trust 1 / Scentre Group Trust 2 ‘144A’ 4.375% 28-May-2030 1,552,576 0.49
Belgium - 2,437,260 (31 December 2019: 620,250) 2,437,260 0.77
1,998,000 Anheuser-Busch InBev SA/NV 3.700% 02-Apr-2040 2,437,260 0.77
Bermuda - 120,504 (31 December 2019: 643,708) 120,504 0.04
100,000 XLIT Ltd 5.250% 15-Dec-2043 120,504 0.04
Brazil - 1,547,026 (31 December 2019: 2,084,157) 1,547,026 0.49
6,000,000 Brazil Notas do Tesouro Nacional Serie F 10.000% 01-Jan-2025 1,157,284 0.37
2,000,000 Brazil Notas do Tesouro Nacional Serie F 10.000% 01-Jan-2027 389,742 0.12
Chile - 3,247,808 (31 December 2019: 3,501,360) 3,247,808 1.03
910,000,000 Bonos de la Tesoreria de la Republica en pesos 4.500% 01-Mar-2026 1,158,973 0.37
2,300,000 VTR Finance NV ‘144A’ 6.875% 15-Jan-2024 2,088,835 0.66
Colombia - 1,558,170 (31 December 2019: 1,409,483) 1,558,170 0.49
750,000 Colombia Government International Bond 3.875% 25-Apr-2027 704,949 0.22
3,537,200,000 Colombian TES 6.000% 28-Apr-2028 853,221 0.27
Denmark - 1,072,200 (31 December 2019: 3,910,009) 1,072,200 0.34
979,000 Danske Bank A/S ‘EMTN’ FRN 1.375% 12-Feb-2030 944,368 0.30 125,000 Danske Bank A/S ‘EMTN’ FRN 2.500% 21-Jun-2029 127,832 0.04
Egypt - 1,282,252 (31 December 2019: 2,884,173) 1,282,252 0.40
500,000 Egypt Government International Bond ‘REGS’ 7.500% 31-Jan-2027 468,538 0.15
15,000,000 Egypt Treasury Bills (Zero Coupon) 0.000% 18-Aug-2020 813,714 0.25
France - 16,696,257 (31 December 2019: 17,307,995) 16,696,257 5.27
954,000 Airbus SE ‘EMTN’ 1.625% 09-Jun-2030 970,747 0.31 925,000 Airbus SE ‘EMTN’ 2.375% 07-Apr-2032 1,017,061 0.32 222,000 Airbus SE ‘EMTN’ 2.375% 09-Jun-2040 230,934 0.07 2,671,000 BNP Paribas SA ‘144A’ FRN (Perpetual)
4.500% 25-Feb-2030 2,083,552 0.66 805,000 BNP Paribas SA ‘REGS’ FRN (Perpetual)
7.625% 30-Mar-2021 727,598 0.23 2,872,000 BPCE SA ‘MTN’ FRN 1.243% 31-May-2022 2,576,349 0.82 415,000 Credit Agricole SA ‘144A’ FRN (Perpetual)
6.875% 23-Sep-2024 381,140 0.12 300,000 Credit Agricole SA FRN (Perpetual)
7.500% 23-Jun-2026 359,199 0.11 600,000 Electricite de France SA ‘EMTN’
2.000% 09-Dec-2049 591,018 0.19 200,000 Electricite de France SA ‘EMTN’ FRN (Perpetual)
6.000% 29-Jan-2026 231,666 0.07 2,000,000 French Republic Government Bond OAT
0.250% 25-Nov-2020 2,006,100 0.63 600,000 RCI Banque SA FRN 2.625% 18-Feb-2030 549,438 0.17 1,980,000 Societe Generale SA ‘REGS’ FRN (Perpetual)
7.875% 18-Dec-2023 1,850,898 0.59 1,600,000 SPIE SA 2.625% 18-Jun-2026 1,558,864 0.49 1,790,000 WEA Finance LLC ‘144A’ 2.875% 15-Jan-2027 1,561,693 0.49
Germany - 6,936,097 (31 December 2019: 3,891,738) 6,936,097 2.19
911,000 BMW US Capital LLC ‘REGS’ 4.150% 09-Apr-2030 933,860 0.30 1,216,000 Bundesrepublik Deutschland Bundesanleihe
3.000% 04-Jul-2020 1,216,134 0.38 2,097,000 German Treasury Bill (Zero Coupon)
0.000% 09-Sep-2020 2,099,548 0.66 2,000,000 IKB Deutsche Industriebank AG FRN
4.000% 31-Jan-2028 1,861,000 0.59 739,000 Volkswagen Financial Services AG ‘EMTN’
3.375% 06-Apr-2028 825,555 0.26
Indonesia - 2,871,414 (31 December 2019: 3,192,426) 2,871,414 0.91
700,000 Indonesia Government International Bond ‘REGS’ 3.850% 18-Jul-2027 677,710 0.21
4,600,000,000 Indonesia Treasury Bond 7.000% 15-May-2027 288,749 0.09
17,500,000,000 Indonesia Treasury Bond 8.125% 15-May-2024 1,153,039 0.37
7,000,000,000 Indonesia Treasury Bond 8.250% 15-May-2029 468,472 0.15
4,200,000,000 Indonesia Treasury Bond 8.375% 15-Sep-2026 283,444 0.09
Ireland - 2,589,268 (31 December 2019: 3,563,722) 2,589,268 0.82
1,268,000 AerCap Ireland Capital DAC / AerCap Global Aviation Trust 6.500% 15-Jul-2025 1,178,997 0.37
833,000 AIB Group Plc FRN (Perpetual) 6.250% 23-Jun-2025 827,969 0.26
435,698 European Residential Loan Securitisation 2018-1 DAC ‘2018-1 A’ FRN 0.493% 24-Mar-2061 437,201 0.14
BNY MELLON ABSOLUTE RETURN BOND FUND
Bonds cont’d.
EUR EUR
03613-1A.indd 45 19/08/2020 19:00

46
Schedule of investments – as at 30 June 2020
Holdings Description
Fair value
Total net assets
% Holdings Description
Fair value
Total net assets
%
BNy MELLON ABSOLUTE RETURN BOND FUND
1,600,000 LeasePlan Corp NV FRN (Perpetual) 7.375% 29-May-2024 1,572,000 0.50
1,800,000 Lincoln Financing SARL ‘REGS’ FRN 3.875% 01-Apr-2024 1,667,250 0.53
400,000 Summer BidCo BV ‘REGS’ 9.750% 15-Nov-2025 368,000 0.12 330,000 United Group BV ‘REGS’ 3.125% 15-Feb-2026 312,659 0.10 980,000 VIVAT NV FRN (Perpetual) 7.000% 19-Jun-2025 1,006,950 0.32
peru - 660,461 (31 December 2019: –) 660,461 0.21
1,700,000 Peru Government Bond ‘144A’ 5.400% 12-Aug-2034 456,474 0.14 700,000 Peruvian Government International Bond ‘REGS’
5.940% 12-Feb-2029 203,987 0.07
portugal - 3,258,925 (31 December 2019: 4,277,480) 3,258,925 1.03
1,800,000 Banco Comercial Portugues SA FRN (Perpetual) 9.250% 31-Jan-2024 1,686,654 0.53
400,000 Caixa Geral de Depositos SA FRN (Perpetual) 10.750% 30-Mar-2022 440,000 0.14
1,400,000 Novo Banco SA/Luxembourg ‘EMTN’ 3.500% 19-Feb-2043 1,132,271 0.36
Qatar - 486,102 (31 December 2019: –) 486,102 0.15
500,000 Qatar Government International Bond ‘REGS’ 3.400% 16-Apr-2025 486,102 0.15
Russia - 1,947,360 (31 December 2019: 3,174,980) 1,947,360 0.62
54,000,000 Russian Federal Bond - OFZ 7.150% 12-Nov-2025 742,569 0.24 17,800,000 Russian Federal Bond - OFZ 7.400% 17-Jul-2024 244,113 0.08 66,500,000 Russian Federal Bond - OFZ 7.950% 07-Oct-2026 960,678 0.30
Saudi Arabia - 736,517 (31 December 2019: 98,356) 736,517 0.23
750,000 Saudi Government International Bond ‘REGS’ 3.625% 04-Mar-2028 736,517 0.23
South Africa - 609,820 (31 December 2019: –) 609,820 0.19
9,100,000 Republic of South Africa Government Bond 8.875% 28-Feb-2035 405,882 0.13
3,462,597 Republic of South Africa Government Bond 10.500% 21-Dec-2026 203,938 0.06
Spain - 11,857,708 (31 December 2019: 11,748,350) 11,857,708 3.75
500,000 Abanca Corp Bancaria SA FRN 4.625% 07-Apr-2030 472,845 0.15 600,000 Abanca Corp Bancaria SA FRN 6.125% 18-Jan-2029 605,250 0.19 500,000 Banco Santander SA FRN (Perpetual)
6.250% 11-Sep-2021 478,125 0.15 400,000 CaixaBank SA FRN (Perpetual) 5.250% 23-Mar-2026 355,500 0.11 700,000 Cellnex Telecom SA 1.875% 26-Jun-2029 692,601 0.22 1,800,000 Ibercaja Banco SA FRN 2.750% 23-Jul-2030 1,584,000 0.50 2,400,000 Liberbank SA FRN 6.875% 14-Mar-2027 2,466,000 0.78 727,227 TDA 14-Mixto FTA FRN 0.489% 27-Dec-2030 708,357 0.23 3,400,000 TDA 15-Mixto FTA FRN 0.261% 27-Jun-2042 3,232,734 1.02 800,000 TDA 15-Mixto FTA FRN 0.261% 27-Jun-2042 734,626 0.23 578,595 TDA 18-Mixto FTA FRN 0.361% 22-Jun-2045 527,670 0.17
34,591 Topaz Asset Finance 2016-2 DAC ‘2016-2 A’ 4.000% 04-Nov-2026 34,697 0.01
100,000 Virgin Media Vendor Financing Notes III DAC ‘REGS’ 4.875% 15-Jul-2028 110,404 0.04
Italy - 16,576,281 (31 December 2019: 20,383,297) 16,576,281 5.24
350,000 Assicurazioni Generali SpA FRN (Perpetual) 6.416% 08-Feb-2022 402,303 0.13
400,000 Intesa Sanpaolo SpA ‘144A’ FRN (Perpetual) 7.700% 17-Sep-2025 356,114 0.11
1,976,000 Intesa Sanpaolo SpA FRN (Perpetual) 3.750% 27-Feb-2025 1,598,090 0.51
11,668,000 Italy Buoni Poliennali Del Tesoro ‘144A’ 2.800% 01-Mar-2067 12,979,003 4.10
702,000 UniCredit SpA FRN (Perpetual) 8.000% 03-Jun-2024 628,631 0.20
597,000 Unipol Gruppo SpA ‘EMTN’ 3.500% 29-Nov-2027 612,140 0.19
Japan - 11,647,649 (31 December 2019: 13,597,524) 11,647,649 3.68
7,650,000 Mitsubishi UFJ Financial Group Inc FRN 1.373% 13-Sep-2021 6,881,970 2.17
5,322,000 Mitsubishi UFJ Financial Group Inc FRN 1.641% 26-Jul-2021 4,765,679 1.51
Kazakhstan - 294,557 (31 December 2019: 324,658) 294,557 0.09
140,000,000 Development Bank of Kazakhstan JSC 9.500% 14-Dec-2020 294,557 0.09
Luxembourg - 6,055,978 (31 December 2019: 5,747,109) 6,055,978 1.91
850,000 ARD Finance SA ‘REGS’ 5.000% 30-Jun-2027 822,375 0.26 3,300,000 Emerald Bay SA (Zero Coupon)
0.000% 08-Oct-2020 3,242,250 1.02 800,000 Garfunkelux Holdco 2 SA ‘REGS’
11.000% 01-Nov-2023 758,347 0.24 1,289,000 INEOS Finance Plc ‘REGS’ 2.875% 01-May-2026 1,233,006 0.39
Mexico - 3,806,010 (31 December 2019: 2,900,741) 3,806,010 1.20
1,000,000 CEMEX Finance LLC ‘144A’ 6.000% 01-Apr-2024 887,955 0.28 12,800,000 Mexican Bonos 5.750% 05-Mar-2026 505,795 0.16 17,640,000 Mexican Bonos 7.750% 29-May-2031 767,303 0.24 21,300,000 Mexican Bonos 8.500% 31-May-2029 970,618 0.31 700,000 Mexico Government International Bond
4.125% 21-Jan-2026 674,339 0.21
Netherlands - 11,637,637 (31 December 2019: 24,052,275) 11,637,637 3.68
5,412,000 ABN AMRO Bank NV ‘144A’ FRN 0.939% 27-Aug-2021 4,853,045 1.53
800,000 ABN AMRO Bank NV FRN (Perpetual) 4.375% 22-Sep-2025 775,424 0.24
342,000 Heineken NV ‘EMTN’ 1.750% 07-May-2040 345,839 0.11 300,000 ING Groep NV FRN (Perpetual)
6.500% 16-Apr-2025 274,534 0.09 500,000 ING Groep NV FRN (Perpetual)
6.875% 16-Apr-2022 461,936 0.14
Bonds cont’d.
Ireland cont’d.
Bonds cont’d.
Netherlands cont’d.
EUR EUR
03613-1A.indd 46 19/08/2020 19:00

47
Schedule of investments – as at 30 June 2020
Holdings Description
Fair value
Total net assets
% Holdings Description
Fair value
Total net assets
%
BNy MELLON ABSOLUTE RETURN BOND FUND
1,540,000 Newday Partnership Funding 2015-1 Plc ‘2015-1 C’ FRN 2.944% 15-Apr-2025 1,617,868 0.51
1,155,000 Newday Partnership Funding 2015-1 Plc ‘2015-1 D’ FRN 3.494% 15-Apr-2025 1,204,647 0.38
100,000 Phoenix Group Holdings Plc ‘EMTN’ 5.625% 28-Apr-2031 118,202 0.04
470,000 Phoenix Life Ltd FRN (Perpetual) 7.250% 25-Mar-2021 520,292 0.16
373,511 Punch Taverns Finance B Ltd ‘REGS’ 7.369% 30-Sep-2021 401,446 0.13
1,450,000 RAC Bond Co Plc ‘EMTN’ 4.870% 06-May-2026 1,588,183 0.50 1,119,000 Reassure Group Plc 5.867% 13-Jun-2029 1,313,591 0.41 770,000 Residential Mortgage Securities 28 Plc FRN
3.693% 15-Jun-2046 844,833 0.27 1,569,000 Residential Mortgage Securities 29 Plc FRN
2.432% 20-Dec-2046 1,687,163 0.53 742,000 Residential Mortgage Securities 30 Plc FRN
2.682% 20-Mar-2050 772,440 0.24 602,415 RMAC Securities No 1 Plc ‘2006-NS2X B1C’ FRN
0.348% 12-Jun-2044 534,647 0.17 623,321 RMAC Securities No 1 Plc ‘2006-NS3X M1C’ FRN
0.000% 12-Jun-2044 551,099 0.17 1,294,000 Rothesay Life Plc 3.375% 12-Jul-2026 1,403,027 0.44 500,000 Royal Bank of Scotland Group Plc FRN (Perpetual)
8.625% 15-Aug-2021 462,115 0.15 462,000 Stanlington No 1 Plc ‘2017-1 D’ FRN
3.048% 12-Jun-2046 497,713 0.16 250,000 Synlab Bondco Plc ‘REGS’ FRN
4.750% 01-Jul-2025 249,888 0.08 770,000 THRONES 2015-1 Plc ‘2015-1 D’ FRN
2.408% 18-Mar-2050 848,079 0.27 1,924,000 Trinity Square 2015-1 Plc ‘2015-1X C’ FRN
2.368% 15-Jul-2051 2,075,446 0.66 1,924,000 Trinity Square 2015-1 Plc ‘2015-1X D’ FRN
2.818% 15-Jul-2051 2,022,480 0.64 600,000 Virgin Media Finance Plc ‘144A’
5.000% 15-Jul-2030 521,789 0.16 250,000 Virgin Money UK Plc FRN (Perpetual)
8.750% 10-Nov-2021 269,406 0.08 770,000 Warwick Finance Residential Mortgages No One
Plc FRN 2.432% 21-Sep-2049 843,850 0.27 1,924,000 Warwick Finance Residential Mortgages No One
Plc FRN 3.882% 21-Sep-2049 2,111,739 0.67
United States of America - 75,192,642 (31 December 2019: 128,572,988) 75,192,642 23.76
624,000 Air Lease Corp 3.375% 01-Jul-2025 557,743 0.18 227,000 Air Lease Corp 4.625% 01-Oct-2028 207,018 0.07 227,000 Bank of America Corp ‘GMTN’ FRN
1.769% 21-Jul-2021 202,566 0.06 2,825,000 Boeing Co/The 5.150% 01-May-2030 2,799,580 0.89 528,000 Boeing Co/The 5.805% 01-May-2050 548,372 0.17 6,835,000 Citibank NA ‘BKNT’ FRN 0.977% 20-May-2022 6,108,241 1.93 695,000 Citigroup Capital XVIII FRN 1.019% 28-Jun-2067 686,006 0.22 5,000,000 Goldman Sachs Group Inc/The ‘EMTN’ FRN
0.277% 09-Sep-2022 4,968,150 1.57 1,073,000 Goldman Sachs Group Inc/The FRN
1.540% 31-Oct-2022 957,179 0.30 865,000 ONEOK Inc 6.350% 15-Jan-2031 915,163 0.29
Sweden - 1,836,080 (31 December 2019: 2,239,254) 1,836,080 0.58
2,050,000 Skandinaviska Enskilda Banken AB ‘REGS’ FRN 0.963% 12-Dec-2022 1,836,080 0.58
Switzerland - 3,510,823 (31 December 2019: 2,384,753) 3,510,823 1.11
390,000 Credit Suisse Group AG ‘144A’ FRN (Perpetual) 7.250% 12-Sep-2025 357,309 0.11
340,000 Credit Suisse Group AG FRN (Perpetual) 7.125% 29-Jul-2022 312,424 0.10
1,650,000 Credit Suisse Group Funding Guernsey Ltd FRN 3.425% 16-Apr-2021 1,495,210 0.47
1,071,000 UBS Group AG FRN (Perpetual) 7.125% 10-Aug-2021 975,840 0.31 400,000 UBS Group AG ‘REGS’ FRN (Perpetual)
7.000% 31-Jan-2024 370,040 0.12
Ukraine - 286,362 (31 December 2019: –) 286,362 0.09
2,700,000 Ukraine Government Bond 18.000% 24-Mar-2021 95,090 0.03 200,000 Ukraine Government International Bond ‘REGS’
8.994% 01-Feb-2024 191,272 0.06
United Kingdom - 44,103,240 (31 December 2019: 55,651,851) 44,103,240 13.93
744,260 Alba 2007-1 Plc ‘2007-1 B’ FRN 0.412% 17-Mar-2039 723,889 0.23 341,000 Bank of Scotland Plc FRN (Perpetual)
7.281% 31-May-2026 430,224 0.14 670,000 Barclays Bank Plc ‘EMTN’ FRN (Perpetual)
0.352% 15-Sep-2020 561,339 0.18 1,053,000 BP Capital Markets Plc FRN (Perpetual)
3.250% 22-Mar-2026 1,060,898 0.33 1,168,000 BP Capital Markets Plc FRN (Perpetual)
3.625% 22-Mar-2029 1,176,760 0.37 2,628,000 Dukinfield Plc FRN 2.092% 15-Aug-2045 2,885,498 0.91 420,000 esure Group Plc 6.750% 19-Dec-2024 447,112 0.14 1,155,000 Eurosail 2006-1 Plc ‘2006-1X B1A’ FRN
0.000% 10-Jun-2044 1,106,665 0.35 3,079,000 Greene King Finance Plc FRN 2.273%
15-Mar-2036 2,866,564 0.91 330,000 Hiscox Ltd FRN 6.125% 24-Nov-2045 379,779 0.12 375,000 HSBC Holdings Plc FRN (Perpetual)
6.000% 22-May-2027 332,741 0.10 525,000 HSBC Holdings Plc FRN (Perpetual)
6.500% 23-Mar-2028 480,464 0.15 1,090,000 HSBC Holdings Plc FRN (Perpetual)
6.875% 01-Jun-2021 986,843 0.31 1,100,000 Ithaca Energy North Sea Plc ‘REGS’
9.375% 15-Jul-2024 777,713 0.25 1,314,784 Landmark Mortgage Securities No 1 Plc FRN
0.245% 17-Jun-2038 1,220,258 0.39 1 Ludgate Funding Plc ‘2006-1X BB’ FRN
0.000% 01-Dec-2060 1 0.00 1,295,000 Marston’s Issuer Plc FRN 1.988% 15-Oct-2027 1,195,855 0.38 300,000 Nationwide Building Society FRN (Perpetual)
5.750% 20-Jun-2027 333,561 0.10 3,285,000 NatWest Markets Plc ‘EMTN’ FRN
0.348% 18-Jun-2021 3,293,755 1.04 1,274,000 Newday Funding 2017-1 Plc ‘2017-1 D’ FRN
2.344% 15-Jul-2025 1,383,378 0.44
Bonds cont’d.
United Kingdom cont’d.
Bonds cont’d.
EUR EUR
03613-1A.indd 47 19/08/2020 19:00
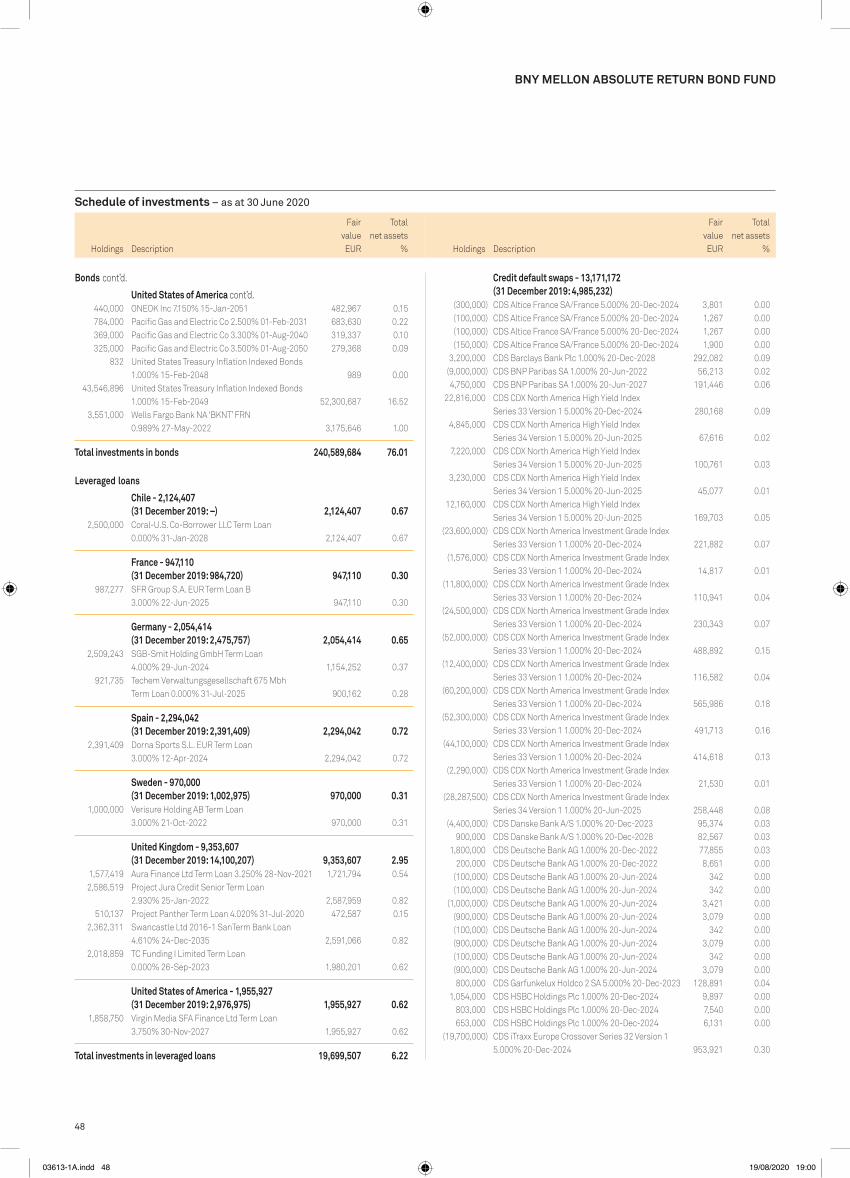
48
Schedule of investments – as at 30 June 2020
Holdings Description
Fair value
Total net assets
% Holdings Description
Fair value
Total net assets
%
BNy MELLON ABSOLUTE RETURN BOND FUND
Credit default swaps - 13,171,172 (31 December 2019: 4,985,232)
(300,000) CDS Altice France SA/France 5.000% 20-Dec-2024 3,801 0.00 (100,000) CDS Altice France SA/France 5.000% 20-Dec-2024 1,267 0.00 (100,000) CDS Altice France SA/France 5.000% 20-Dec-2024 1,267 0.00 (150,000) CDS Altice France SA/France 5.000% 20-Dec-2024 1,900 0.00 3,200,000 CDS Barclays Bank Plc 1.000% 20-Dec-2028 292,082 0.09 (9,000,000) CDS BNP Paribas SA 1.000% 20-Jun-2022 56,213 0.02 4,750,000 CDS BNP Paribas SA 1.000% 20-Jun-2027 191,446 0.06 22,816,000 CDS CDX North America High Yield Index
Series 33 Version 1 5.000% 20-Dec-2024 280,168 0.09 4,845,000 CDS CDX North America High Yield Index
Series 34 Version 1 5.000% 20-Jun-2025 67,616 0.02 7,220,000 CDS CDX North America High Yield Index
Series 34 Version 1 5.000% 20-Jun-2025 100,761 0.03 3,230,000 CDS CDX North America High Yield Index
Series 34 Version 1 5.000% 20-Jun-2025 45,077 0.01 12,160,000 CDS CDX North America High Yield Index
Series 34 Version 1 5.000% 20-Jun-2025 169,703 0.05 (23,600,000) CDS CDX North America Investment Grade Index
Series 33 Version 1 1.000% 20-Dec-2024 221,882 0.07 (1,576,000) CDS CDX North America Investment Grade Index
Series 33 Version 1 1.000% 20-Dec-2024 14,817 0.01 (11,800,000) CDS CDX North America Investment Grade Index
Series 33 Version 1 1.000% 20-Dec-2024 110,941 0.04 (24,500,000) CDS CDX North America Investment Grade Index
Series 33 Version 1 1.000% 20-Dec-2024 230,343 0.07 (52,000,000) CDS CDX North America Investment Grade Index
Series 33 Version 1 1.000% 20-Dec-2024 488,892 0.15 (12,400,000) CDS CDX North America Investment Grade Index
Series 33 Version 1 1.000% 20-Dec-2024 116,582 0.04 (60,200,000) CDS CDX North America Investment Grade Index
Series 33 Version 1 1.000% 20-Dec-2024 565,986 0.18 (52,300,000) CDS CDX North America Investment Grade Index
Series 33 Version 1 1.000% 20-Dec-2024 491,713 0.16 (44,100,000) CDS CDX North America Investment Grade Index
Series 33 Version 1 1.000% 20-Dec-2024 414,618 0.13 (2,290,000) CDS CDX North America Investment Grade Index
Series 33 Version 1 1.000% 20-Dec-2024 21,530 0.01 (28,287,500) CDS CDX North America Investment Grade Index
Series 34 Version 1 1.000% 20-Jun-2025 258,448 0.08 (4,400,000) CDS Danske Bank A/S 1.000% 20-Dec-2023 95,374 0.03 900,000 CDS Danske Bank A/S 1.000% 20-Dec-2028 82,567 0.03 1,800,000 CDS Deutsche Bank AG 1.000% 20-Dec-2022 77,855 0.03 200,000 CDS Deutsche Bank AG 1.000% 20-Dec-2022 8,651 0.00 (100,000) CDS Deutsche Bank AG 1.000% 20-Jun-2024 342 0.00 (100,000) CDS Deutsche Bank AG 1.000% 20-Jun-2024 342 0.00 (1,000,000) CDS Deutsche Bank AG 1.000% 20-Jun-2024 3,421 0.00 (900,000) CDS Deutsche Bank AG 1.000% 20-Jun-2024 3,079 0.00 (100,000) CDS Deutsche Bank AG 1.000% 20-Jun-2024 342 0.00 (900,000) CDS Deutsche Bank AG 1.000% 20-Jun-2024 3,079 0.00 (100,000) CDS Deutsche Bank AG 1.000% 20-Jun-2024 342 0.00 (900,000) CDS Deutsche Bank AG 1.000% 20-Jun-2024 3,079 0.00 800,000 CDS Garfunkelux Holdco 2 SA 5.000% 20-Dec-2023 128,891 0.04 1,054,000 CDS HSBC Holdings Plc 1.000% 20-Dec-2024 9,897 0.00 803,000 CDS HSBC Holdings Plc 1.000% 20-Dec-2024 7,540 0.00 653,000 CDS HSBC Holdings Plc 1.000% 20-Dec-2024 6,131 0.00 (19,700,000) CDS iTraxx Europe Crossover Series 32 Version 1
5.000% 20-Dec-2024 953,921 0.30
440,000 ONEOK Inc 7.150% 15-Jan-2051 482,967 0.15 784,000 Pacific Gas and Electric Co 2.500% 01-Feb-2031 683,630 0.22 369,000 Pacific Gas and Electric Co 3.300% 01-Aug-2040 319,337 0.10 325,000 Pacific Gas and Electric Co 3.500% 01-Aug-2050 279,368 0.09 832 United States Treasury Inflation Indexed Bonds
1.000% 15-Feb-2048 989 0.00 43,546,896 United States Treasury Inflation Indexed Bonds
1.000% 15-Feb-2049 52,300,687 16.52 3,551,000 Wells Fargo Bank NA ‘BKNT’ FRN
0.989% 27-May-2022 3,175,646 1.00
Total investments in bonds 240,589,684 76.01
Leveraged loans
Chile - 2,124,407 (31 December 2019: –) 2,124,407 0.67
2,500,000 Coral-U.S. Co-Borrower LLC Term Loan 0.000% 31-Jan-2028 2,124,407 0.67
France - 947,110 (31 December 2019: 984,720) 947,110 0.30
987,277 SFR Group S.A. EUR Term Loan B 3.000% 22-Jun-2025 947,110 0.30
Germany - 2,054,414 (31 December 2019: 2,475,757) 2,054,414 0.65
2,509,243 SGB-Smit Holding GmbH Term Loan 4.000% 29-Jun-2024 1,154,252 0.37
921,735 Techem Verwaltungsgesellschaft 675 Mbh Term Loan 0.000% 31-Jul-2025 900,162 0.28
Spain - 2,294,042 (31 December 2019: 2,391,409) 2,294,042 0.72
2,391,409 Dorna Sports S.L. EUR Term Loan 3.000% 12-Apr-2024 2,294,042 0.72
Sweden - 970,000 (31 December 2019: 1,002,975) 970,000 0.31
1,000,000 Verisure Holding AB Term Loan 3.000% 21-Oct-2022 970,000 0.31
United Kingdom - 9,353,607 (31 December 2019: 14,100,207) 9,353,607 2.95
1,577,419 Aura Finance Ltd Term Loan 3.250% 28-Nov-2021 1,721,794 0.54 2,586,519 Project Jura Credit Senior Term Loan
2.930% 25-Jan-2022 2,587,959 0.82 510,137 Project Panther Term Loan 4.020% 31-Jul-2020 472,587 0.15 2,362,311 Swancastle Ltd 2016-1 SanTerm Bank Loan
4.610% 24-Dec-2035 2,591,066 0.82 2,018,859 TC Funding I Limited Term Loan
0.000% 26-Sep-2023 1,980,201 0.62
United States of America - 1,955,927 (31 December 2019: 2,976,975) 1,955,927 0.62
1,858,750 Virgin Media SFA Finance Ltd Term Loan 3.750% 30-Nov-2027 1,955,927 0.62
Total investments in leveraged loans 19,699,507 6.22
Bonds cont’d.
United States of America cont’d.
EUR EUR
03613-1A.indd 48 19/08/2020 19:00

49
Schedule of investments – as at 30 June 2020
Holdings Description
Fair value
Total net assets
% Holdings Description
Fair value
Total net assets
%
BNy MELLON ABSOLUTE RETURN BOND FUND
Credit default swaps cont’d. 520,000 CDS Lloyds Banking Group Plc
1.000% 20-Jun-2025 13,224 0.00 3,300,000 CDS Royal Bank of Scotland Group Plc
1.000% 20-Jun-2025 112,073 0.04 1,150,000 CDS Royal Bank of Scotland Group Plc
1.000% 20-Jun-2025 39,056 0.01 1,800,000 CDS Societe Generale 1.000% 20-Dec-2027 111,634 0.04
Total credit default swaps 13,171,172 4.16
Currency options - 47,765 (31 December 2019: 28,831)
1,400,000 US dollar/Australian dollar Put 20-Jul-2020 0.685 14,112 0.01 1,300,000 US dollar/Brazilian real Put 02-Jul-2020 5.450 8,665 0.00 1,400,000 US dollar/Japanese yen Call 17-Aug-2020 106.000 5,157 0.00 1,400,000 US dollar/Mexican peso Put 08-Jul-2020 20.900 43 0.00 1,400,000 US dollar/South African rand Call 16-Jul-2020 17.300 19,788 0.01
Total currency options 47,765 0.02
Holdings Description
Underlying exposure
EUR
Fair value
EUR
Total net assets
%
Open futures contracts - 1,288,311 (31 December 2019: 4,038,479)
87 U.S. 2 Year Treasury Note Long Futures Contracts Exp Sep-2020 17,138,613 3,032 0.00
2 U.S. 5 Year Treasury Note Long Futures Contracts Exp Sep-2020 224,415 474 0.00
3 U.S. 5 Year Treasury Note Long Futures Contracts Exp Sep-2020 336,622 878 0.00
347 U.S. Treasury Ultra Bond Long Futures Contracts Exp Sep-2020 67,854,402 1,283,927 0.41
Total open futures contracts 1,288,311 0.41 Unrealised gain on forward foreign currency contracts - 4,769,777 (see below) (31 December 2019: 3,496,534) 4,769,777 1.51
Total financial assets at fair value through profit or loss 284,720,154 89.96
Credit default swaps - (14,004,709) (31 December 2019: (11,120,273))
(625,000) CDS Airbus SE 1.000% 20-Jun-2025 (4,720) (0.00) (5,800,000) CDS Barclays Bank Plc 1.000% 20-Dec-2023 (107,292) (0.03) 1,300,000 CDS Barrick Gold Corp 1.000% 20-Jun-2025 (45,111) (0.01) 1,050,000 CDS Barrick Gold Corp 1.000% 20-Jun-2025 (36,436) (0.01) (22,816,000) CDS CDX North America High Yield Index
Series 33 Version 1 5.000% 20-Dec-2024 (280,168) (0.09) 23,112,500 CDS CDX North America Investment Grade Index
Series 33 Version 1 1.000% 20-Dec-2024 (217,298) (0.07) 16,900,000 CDS CDX North America Investment Grade Index
Series 33 Version 1 1.000% 20-Dec-2024 (158,890) (0.05)
(13,750,000) CDS iTraxx Europe Senior Financials Series 32 Version 1 1.000% 20-Dec-2024 151,813 0.05
(13,750,000) CDS iTraxx Europe Senior Financials Series 32 Version 1 1.000% 20-Dec-2024 151,813 0.05
(10,800,000) CDS iTraxx Europe Senior Financials Series 32 Version 1 1.000% 20-Dec-2024 119,242 0.04
(39,300,000) CDS iTraxx Europe Senior Financials Series 32 Version 1 1.000% 20-Dec-2024 433,910 0.14
(1,600,000) CDS iTraxx Europe Senior Financials Series 32 Version 1 1.000% 20-Dec-2024 17,666 0.01
(800,000) CDS iTraxx Europe Senior Financials Series 32 Version 1 1.000% 20-Dec-2024 8,833 0.00
(31,000,000) CDS iTraxx Europe Senior Financials Series 32 Version 1 1.000% 20-Dec-2024 342,270 0.11
(800,000) CDS iTraxx Europe Senior Financials Series 32 Version 1 1.000% 20-Dec-2024 8,833 0.00
(1,300,000) CDS iTraxx Europe Senior Financials Series 32 Version 1 1.000% 20-Dec-2024 14,353 0.00
(8,600,000) CDS iTraxx Europe Senior Financials Series 32 Version 1 1.000% 20-Dec-2024 94,952 0.03
(4,500,000) CDS iTraxx Europe Senior Financials Series 33 Version 1 1.000% 20-Jun-2025 35,915 0.01
(42,300,000) CDS iTraxx Europe Series 32 Version 1 1.000% 20-Dec-2024 633,434 0.20
(9,600,000) CDS iTraxx Europe Series 32 Version 1 1.000% 20-Dec-2024 143,758 0.05
(19,000,000) CDS iTraxx Europe Series 32 Version 1 1.000% 20-Dec-2024 284,521 0.09
(66,500,000) CDS iTraxx Europe Series 32 Version 1 1.000% 20-Dec-2024 995,824 0.32
(9,600,000) CDS iTraxx Europe Series 32 Version 1 1.000% 20-Dec-2024 143,758 0.05
(46,200,000) CDS iTraxx Europe Series 32 Version 1 1.000% 20-Dec-2024 691,835 0.22
(52,800,000) CDS iTraxx Europe Series 32 Version 1 1.000% 20-Dec-2024 790,669 0.25
(8,300,000) CDS iTraxx Europe Series 32 Version 1 1.000% 20-Dec-2024 124,291 0.04
(19,400,000) CDS iTraxx Europe Series 32 Version 1 1.000% 20-Dec-2024 290,511 0.09
(19,900,000) CDS iTraxx Europe Series 32 Version 1 1.000% 20-Dec-2024 297,998 0.09
22,150,000 CDS iTraxx Europe Series 32 Version 1 1.000% 20-Dec-2029 166,698 0.05
(53,800,000) CDS iTraxx Europe Series 33 Version 1 1.000% 20-Jun-2025 804,284 0.25
(4,600,000) CDS iTraxx Europe Series 33 Version 1 1.000% 20-Jun-2025 68,768 0.02
(12,500,000) CDS iTraxx Europe Series 33 Version 1 1.000% 20-Jun-2025 186,869 0.06
(10,350,000) CDS iTraxx Europe Series 33 Version 1 1.000% 20-Jun-2025 154,727 0.05
(10,350,000) CDS iTraxx Europe Series 33 Version 1 1.000% 20-Jun-2025 154,728 0.05
1,640,000 CDS iTraxx Europe Sub Financials Series 32 Version 1 1.000% 20-Dec-2024 42,360 0.01
340,000 CDS Lloyds Banking Group Plc 1.000% 20-Jun-2025 8,646 0.00
Credit default swaps cont’d.
EUR EUR
03613-1A.indd 49 19/08/2020 19:00
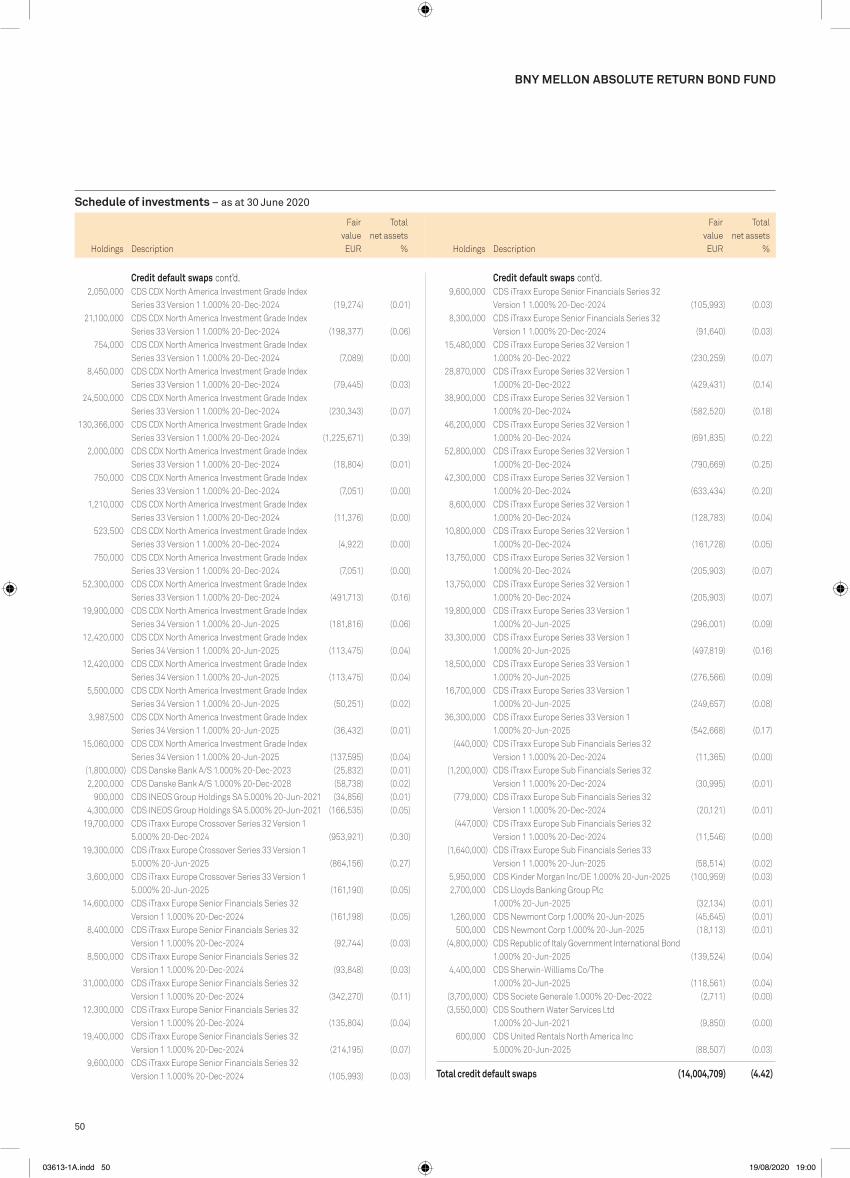
50
Schedule of investments – as at 30 June 2020
Holdings Description
Fair value
Total net assets
% Holdings Description
Fair value
Total net assets
%
BNy MELLON ABSOLUTE RETURN BOND FUND
9,600,000 CDS iTraxx Europe Senior Financials Series 32 Version 1 1.000% 20-Dec-2024 (105,993) (0.03)
8,300,000 CDS iTraxx Europe Senior Financials Series 32 Version 1 1.000% 20-Dec-2024 (91,640) (0.03)
15,480,000 CDS iTraxx Europe Series 32 Version 1 1.000% 20-Dec-2022 (230,259) (0.07)
28,870,000 CDS iTraxx Europe Series 32 Version 1 1.000% 20-Dec-2022 (429,431) (0.14)
38,900,000 CDS iTraxx Europe Series 32 Version 1 1.000% 20-Dec-2024 (582,520) (0.18)
46,200,000 CDS iTraxx Europe Series 32 Version 1 1.000% 20-Dec-2024 (691,835) (0.22)
52,800,000 CDS iTraxx Europe Series 32 Version 1 1.000% 20-Dec-2024 (790,669) (0.25)
42,300,000 CDS iTraxx Europe Series 32 Version 1 1.000% 20-Dec-2024 (633,434) (0.20)
8,600,000 CDS iTraxx Europe Series 32 Version 1 1.000% 20-Dec-2024 (128,783) (0.04)
10,800,000 CDS iTraxx Europe Series 32 Version 1 1.000% 20-Dec-2024 (161,728) (0.05)
13,750,000 CDS iTraxx Europe Series 32 Version 1 1.000% 20-Dec-2024 (205,903) (0.07)
13,750,000 CDS iTraxx Europe Series 32 Version 1 1.000% 20-Dec-2024 (205,903) (0.07)
19,800,000 CDS iTraxx Europe Series 33 Version 1 1.000% 20-Jun-2025 (296,001) (0.09)
33,300,000 CDS iTraxx Europe Series 33 Version 1 1.000% 20-Jun-2025 (497,819) (0.16)
18,500,000 CDS iTraxx Europe Series 33 Version 1 1.000% 20-Jun-2025 (276,566) (0.09)
16,700,000 CDS iTraxx Europe Series 33 Version 1 1.000% 20-Jun-2025 (249,657) (0.08)
36,300,000 CDS iTraxx Europe Series 33 Version 1 1.000% 20-Jun-2025 (542,668) (0.17)
(440,000) CDS iTraxx Europe Sub Financials Series 32 Version 1 1.000% 20-Dec-2024 (11,365) (0.00)
(1,200,000) CDS iTraxx Europe Sub Financials Series 32 Version 1 1.000% 20-Dec-2024 (30,995) (0.01)
(779,000) CDS iTraxx Europe Sub Financials Series 32 Version 1 1.000% 20-Dec-2024 (20,121) (0.01)
(447,000) CDS iTraxx Europe Sub Financials Series 32 Version 1 1.000% 20-Dec-2024 (11,546) (0.00)
(1,640,000) CDS iTraxx Europe Sub Financials Series 33 Version 1 1.000% 20-Jun-2025 (58,514) (0.02)
5,950,000 CDS Kinder Morgan Inc/DE 1.000% 20-Jun-2025 (100,959) (0.03) 2,700,000 CDS Lloyds Banking Group Plc
1.000% 20-Jun-2025 (32,134) (0.01) 1,260,000 CDS Newmont Corp 1.000% 20-Jun-2025 (45,645) (0.01) 500,000 CDS Newmont Corp 1.000% 20-Jun-2025 (18,113) (0.01) (4,800,000) CDS Republic of Italy Government International Bond
1.000% 20-Jun-2025 (139,524) (0.04) 4,400,000 CDS Sherwin-Williams Co/The
1.000% 20-Jun-2025 (118,561) (0.04) (3,700,000) CDS Societe Generale 1.000% 20-Dec-2022 (2,711) (0.00) (3,550,000) CDS Southern Water Services Ltd
1.000% 20-Jun-2021 (9,850) (0.00) 600,000 CDS United Rentals North America Inc
5.000% 20-Jun-2025 (88,507) (0.03)
Total credit default swaps (14,004,709) (4.42)
2,050,000 CDS CDX North America Investment Grade Index Series 33 Version 1 1.000% 20-Dec-2024 (19,274) (0.01)
21,100,000 CDS CDX North America Investment Grade Index Series 33 Version 1 1.000% 20-Dec-2024 (198,377) (0.06)
754,000 CDS CDX North America Investment Grade Index Series 33 Version 1 1.000% 20-Dec-2024 (7,089) (0.00)
8,450,000 CDS CDX North America Investment Grade Index Series 33 Version 1 1.000% 20-Dec-2024 (79,445) (0.03)
24,500,000 CDS CDX North America Investment Grade Index Series 33 Version 1 1.000% 20-Dec-2024 (230,343) (0.07)
130,366,000 CDS CDX North America Investment Grade Index Series 33 Version 1 1.000% 20-Dec-2024 (1,225,671) (0.39)
2,000,000 CDS CDX North America Investment Grade Index Series 33 Version 1 1.000% 20-Dec-2024 (18,804) (0.01)
750,000 CDS CDX North America Investment Grade Index Series 33 Version 1 1.000% 20-Dec-2024 (7,051) (0.00)
1,210,000 CDS CDX North America Investment Grade Index Series 33 Version 1 1.000% 20-Dec-2024 (11,376) (0.00)
523,500 CDS CDX North America Investment Grade Index Series 33 Version 1 1.000% 20-Dec-2024 (4,922) (0.00)
750,000 CDS CDX North America Investment Grade Index Series 33 Version 1 1.000% 20-Dec-2024 (7,051) (0.00)
52,300,000 CDS CDX North America Investment Grade Index Series 33 Version 1 1.000% 20-Dec-2024 (491,713) (0.16)
19,900,000 CDS CDX North America Investment Grade Index Series 34 Version 1 1.000% 20-Jun-2025 (181,816) (0.06)
12,420,000 CDS CDX North America Investment Grade Index Series 34 Version 1 1.000% 20-Jun-2025 (113,475) (0.04)
12,420,000 CDS CDX North America Investment Grade Index Series 34 Version 1 1.000% 20-Jun-2025 (113,475) (0.04)
5,500,000 CDS CDX North America Investment Grade Index Series 34 Version 1 1.000% 20-Jun-2025 (50,251) (0.02)
3,987,500 CDS CDX North America Investment Grade Index Series 34 Version 1 1.000% 20-Jun-2025 (36,432) (0.01)
15,060,000 CDS CDX North America Investment Grade Index Series 34 Version 1 1.000% 20-Jun-2025 (137,595) (0.04)
(1,800,000) CDS Danske Bank A/S 1.000% 20-Dec-2023 (25,832) (0.01) 2,200,000 CDS Danske Bank A/S 1.000% 20-Dec-2028 (58,738) (0.02) 900,000 CDS INEOS Group Holdings SA 5.000% 20-Jun-2021 (34,856) (0.01) 4,300,000 CDS INEOS Group Holdings SA 5.000% 20-Jun-2021 (166,535) (0.05) 19,700,000 CDS iTraxx Europe Crossover Series 32 Version 1
5.000% 20-Dec-2024 (953,921) (0.30) 19,300,000 CDS iTraxx Europe Crossover Series 33 Version 1
5.000% 20-Jun-2025 (864,156) (0.27) 3,600,000 CDS iTraxx Europe Crossover Series 33 Version 1
5.000% 20-Jun-2025 (161,190) (0.05) 14,600,000 CDS iTraxx Europe Senior Financials Series 32
Version 1 1.000% 20-Dec-2024 (161,198) (0.05) 8,400,000 CDS iTraxx Europe Senior Financials Series 32
Version 1 1.000% 20-Dec-2024 (92,744) (0.03) 8,500,000 CDS iTraxx Europe Senior Financials Series 32
Version 1 1.000% 20-Dec-2024 (93,848) (0.03) 31,000,000 CDS iTraxx Europe Senior Financials Series 32
Version 1 1.000% 20-Dec-2024 (342,270) (0.11) 12,300,000 CDS iTraxx Europe Senior Financials Series 32
Version 1 1.000% 20-Dec-2024 (135,804) (0.04) 19,400,000 CDS iTraxx Europe Senior Financials Series 32
Version 1 1.000% 20-Dec-2024 (214,195) (0.07) 9,600,000 CDS iTraxx Europe Senior Financials Series 32
Version 1 1.000% 20-Dec-2024 (105,993) (0.03)
Credit default swaps cont’d. Credit default swaps cont’d.
EUR EUR
03613-1A.indd 50 19/08/2020 19:00

51
Schedule of investments – as at 30 June 2020
Holdings Description
Fair value
Total net assets
% Holdings Description
Fair value
Total net assets
%
BNy MELLON ABSOLUTE RETURN BOND FUND
Unrealised loss on forward foreign currency contracts - (5,087,307) (see below) (31 December 2019: (4,463,886)) (5,087,307) (1.61)
Total financial liabilities at fair value through profit or loss (21,851,410) (6.91)
Net current assets 53,651,419 16.95
Total net assets 316,520,163 100.00
The counterparties for credit default swaps are Bank of America Merrill Lynch, Barclays Bank pLC, BNp paribas, Citigroup Global Markets Limited, Credit Suisse AG, Goldman Sachs, JpMorgan Chase Bank and Morgan Stanley. The counterparties for currency options are Barclays Bank pLC, BNp paribas and Goldman Sachs. The counterparty for futures contracts is Goldman Sachs. The counterparty for swaptions is Goldman Sachs.
Analysis of portfolio % of Total Assets
Transferable securities and money market instruments admitted to official stock exchange listing or traded on a regulated market 70.61Transferable securities and money market instruments other than those admitted to official stock exchange listing or traded on a regulated market 5.66Financial derivative instruments dealt in on a regulated market 0.37oTC financial derivative instruments 5.17other current assets 18.19
Total assets 100.00
Currency options - (23,921) (31 December 2019: (16,761))
(2,800,000) US dollar/Australian dollar Put 20-Jul-2020 0.665 (8,059) (0.00) (1,950,000) US dollar/Brazilian real Put 02-Jul-2020 5.650 (1,626) (0.00) (1,400,000) US dollar/Japanese yen Call 17-Aug-2020 102.000 (1,039) (0.00) (1,400,000) US dollar/Japanese yen Call 17-Aug-2020 104.000 (2,196) (0.00) (2,100,000) US dollar/South African rand Call 16-Jul-2020 17.800 (11,001) (0.01)
Total currency options (23,921) (0.01)
Holdings Description
Underlying exposure
EUR
Fair value
EUR
Total net assets
%
Open futures contracts - (2,642,113) (31 December 2019: (1,605,562))
(9) Euro-Bobl Short Futures Contracts Exp Sep-2020 (1,215,000) (6,520) (0.00)
(28) Euro-Bobl Short Futures Contracts Exp Sep-2020 (3,780,000) (16,030) (0.01)
(317) Euro-BTP Short Futures Contracts Exp Sep-2020 (45,568,750) (964,275) (0.31)
(567) Euro-Bund Short Futures Contracts Exp Sep-2020 (100,177,560) (760,824) (0.24)
(14) Euro-Buxl 30 Year Bond Short Futures Contracts Exp Sep-2020 (3,092,040) (59,752) (0.02)
(48) U.S. 10 Year Treasury Note Short Futures Contracts Exp Sep-2020 (5,966,406) (28,493) (0.01)
(37) U.S. 10 Year Ultra Treasury Note Short Futures Contracts Exp Sep-2020 (5,206,679) (34,867) (0.01)
(2) U.S. 10 Year Ultra Treasury Note Short Futures Contracts Exp Sep-2020 (281,442) (1,547) (0.00)
(3) U.S. Treasury Bond Short Futures Contracts Exp Sep-2020 (479,162) (7,750) (0.00)
(2) U.S. Treasury Bond Short Futures Contracts Exp Sep-2020 (319,442) (2,705) (0.00)
(539) UK Long Gilt Short Futures Contracts Exp Sep-2020 (81,313,922) (759,350) (0.24)
Total open futures contracts (2,642,113) (0.84)
Swaptions - (93,360) (31 December 2019: (186,456))
(59,000,000) CDS iTraxx Europe Series 33 Put 20-Jun-2025 42.500 (93,360) (0.03)
Total swaptions (93,360) (0.03)
Description
EUR EUR
03613-1A.indd 51 19/08/2020 19:00

52
Schedule of investments – as at 30 June 2020
BNy MELLON ABSOLUTE RETURN BOND FUND
Forward foreign currency contracts cont’d.Unrealised
Gain/(Loss)Buy Sell Amount (B) Amount (S)Settle
Date Counterparty
BNy Mellon Absolute Return Bond Fund cont’d.US dollar South African rand 446,840 7,544,034 27-Jul-20 Bank of America
Merrill Lynch 11,680US dollar South African rand 822,819 13,940,230 27-Jul-20 Morgan Stanley 19,022US dollar South African rand 466,149 8,106,179 27-Jul-20 Bank of America
Merrill Lynch 79US dollar South African rand 478,106 8,250,000 27-Jul-20 Goldman Sachs 3,368Euro US dollar 1,226,546 1,336,000 30-Jul-20 Natwest
Markets Plc 35,401Euro Sterling 805,117 730,000 03-Aug-20 BNP Paribas 6,395Euro Sterling 1,934,903 1,725,000 03-Aug-20 Barclays Bank PLC 47,512Euro Sterling 1,933,598 1,724,000 03-Aug-20 Citigroup Global
Markets Limited 47,301Euro Sterling 153,786 138,000 03-Aug-20 Citigroup Global
Markets Limited 2,795Euro Sterling 49,821,175 44,660,000 03-Aug-20 UBS AG 956,892Euro Sterling 447,444 400,000 03-Aug-20 BNP Paribas 9,788Euro Sterling 220,876 200,000 03-Aug-20 Lloyds Bank plc 2,048Euro Sterling 348,729 311,000 03-Aug-20 Lloyds Bank plc 8,452Euro Sterling 551,476 495,000 03-Aug-20 Lloyds Bank plc 9,876Euro Sterling 523,651 470,000 03-Aug-20 Natwest
Markets Plc 9,405Euro Sterling 1,283,597 1,150,000 03-Aug-20 BNP Paribas 25,336Euro Sterling 358,920 320,000 03-Aug-20 BNP Paribas 8,795Euro Sterling 323,617 290,000 03-Aug-20 Lloyds Bank plc 6,316US dollar Brazilian real 1,426,780 7,571,496 04-Aug-20 Goldman Sachs 24,838US dollar Brazilian real 612,433 3,250,000 04-Aug-20 Goldman Sachs 10,661Euro US dollar 813,564 897,000 17-Aug-20 RBC Capital
Markets 14,137Euro US dollar 178,788 200,000 17-Aug-20 Natwest
Markets Plc 543Euro US dollar 1,319,906 1,470,000 17-Aug-20 Bank of America
Merrill Lynch 9,808Euro US dollar 35,028,647 38,610,000 17-Aug-20 JPMorgan Chase
Bank 618,527US dollar Euro 800,000 711,019 17-Aug-20 Lloyds Bank plc 1,960US dollar Euro 1,210,000 1,074,221 17-Aug-20 Bank of America
Merrill Lynch 4,159US dollar Euro 1,230,000 1,089,659 17-Aug-20 Bank of America
Merrill Lynch 6,545US dollar Euro 360,000 318,091 17-Aug-20 Bank of America
Merrill Lynch 2,749US dollar Euro 469,000 417,232 11-Sep-20 Morgan Stanley 517
EUR 4,556,470
South African rand US dollar 8,250,000 479,459 01-Jul-20 Goldman Sachs (3,345)Brazilian real US dollar 7,571,496 1,428,315 02-Jul-20 Goldman Sachs (24,703)Brazilian real US dollar 3,250,000 613,092 02-Jul-20 Goldman Sachs (10,604)Brazilian real US dollar 2,440,633 481,303 02-Jul-20 JPMorgan Chase
Bank (26,602)Brazilian real US dollar 2,400,000 468,894 02-Jul-20 BNP Paribas (22,238)US dollar Brazilian real 403,217 2,196,122 02-Jul-20 Citigroup Global
Markets Limited (2,708)Euro US dollar 2,613,594 2,940,000 15-Jul-20 Lloyds Bank plc (8,526)Euro US dollar 1,499,008 1,700,000 15-Jul-20 Bank of America
Merrill Lynch (17,183)US dollar Euro 3,243,000 2,952,812 15-Jul-20 Lloyds Bank plc (60,453)Australian dollar US dollar 1,011,271 700,000 16-Jul-20 Citigroup Global
Markets Limited (6,540)Australian dollar US dollar 1,016,406 700,000 16-Jul-20 Goldman Sachs (3,402)Australian dollar US dollar 1,010,508 700,000 16-Jul-20 BNP Paribas (7,006)Euro Polish zloty 200,000 894,924 16-Jul-20 HSBC Bank plc (511)Euro Polish zloty 200,000 894,972 16-Jul-20 HSBC Bank plc (521)Euro Polish zloty 200,000 894,870 16-Jul-20 BNP Paribas (498)Euro US dollar 1,469,731 1,650,000 16-Jul-20 BNP Paribas (1,833)Euro US dollar 1,050,000 1,177,675 16-Jul-20 Goldman Sachs (319)Euro US dollar 530,000 595,567 16-Jul-20 Bank of America
Merrill Lynch (1,161)
Forward foreign currency contracts cont’d.Unrealised
Gain/(Loss)Buy Sell Amount (B) Amount (S)Settle
Date Counterparty
BNy Mellon Absolute Return Bond FundUS dollar Brazilian real 469,393 2,470,694 02-Jul-20 BNP Paribas 11,016US dollar Brazilian real 634,861 3,250,000 02-Jul-20 BNP Paribas 30,025US dollar Brazilian real 1,442,155 7,745,312 02-Jul-20 Goldman Sachs 8,366Australian dollar Euro 12,280,000 7,298,719 15-Jul-20 Bank of America
Merrill Lynch 202,966Euro US dollar 35,647,288 38,765,000 15-Jul-20 Natwest
Markets Plc 1,073,655Euro US dollar 214,866 232,000 15-Jul-20 Lloyds Bank plc 7,950Euro US dollar 256,680 278,000 15-Jul-20 Citigroup Global
Markets Limited 8,738Euro US dollar 606,118 656,000 15-Jul-20 Natwest
Markets Plc 21,046Euro US dollar 906,044 1,010,000 15-Jul-20 Bank of America
Merrill Lynch 5,248Euro US dollar 409,925 450,000 15-Jul-20 Bank of America
Merrill Lynch 8,580US dollar Euro 1,190,000 1,060,681 15-Jul-20 BNP Paribas 653US dollar Euro 10,250,000 9,136,857 15-Jul-20 Bank of America
Merrill Lynch 4,888US dollar Australian dollar 10,417,279 15,015,144 16-Jul-20 Citigroup Global
Markets Limited 118,342US dollar Australian dollar 700,000 1,018,552 16-Jul-20 BNP Paribas 2,091US dollar Australian dollar 700,000 1,019,303 16-Jul-20 Citigroup Global
Markets Limited 1,633US dollar Euro 1,250,000 1,110,774 16-Jul-20 Lloyds Bank plc 4,047US dollar Korean won 700,800 840,000,000 16-Jul-20 HSBC Bank plc 2,229US dollar Mexican peso 350,000 7,873,006 16-Jul-20 BNP Paribas 9,548US dollar Mexican peso 700,000 15,951,656 16-Jul-20 JPMorgan Chase
Bank 11,193US dollar Mexican peso 350,000 7,888,374 16-Jul-20 Citigroup Global
Markets Limited 8,958US dollar Mexican peso 700,000 16,183,725 16-Jul-20 BNP Paribas 2,273US dollar Russian rouble 693,876 48,300,000 16-Jul-20 BNP Paribas 13,030US dollar South African rand 700,000 12,119,710 16-Jul-20 Bank of America
Merrill Lynch 2,044US dollar South African rand 700,000 12,138,356 16-Jul-20 BNP Paribas 1,086US dollar Sterling 2,341,262 1,844,702 16-Jul-20 HSBC Bank plc 69,127Russian rouble US dollar 30,800,000 417,521 17-Jul-20 Barclays Bank PLC 13,897US dollar Chilean peso 668,619 525,000,000 17-Jul-20 Bank of America
Merrill Lynch 26,191US dollar Chilean peso 76,979 63,000,000 17-Jul-20 Citigroup Global
Markets Limited 240US dollar Peruvian nuevo sol 961,763 3,300,000 17-Jul-20 BNP Paribas 24,013Czech koruna US dollar 12,260,000 479,872 27-Jul-20 JPMorgan Chase
Bank 29,195Euro US dollar 7,927,312 8,600,000 27-Jul-20 Lloyds Bank plc 259,245Euro US dollar 7,926,283 8,600,000 27-Jul-20 JPMorgan Chase
Bank 258,215Euro US dollar 7,834,267 8,500,000 27-Jul-20 Lloyds Bank plc 255,364Polish zloty US dollar 2,042,000 482,147 27-Jul-20 BNP Paribas 27,520Romanian leu Euro 450,000 92,298 27-Jul-20 Goldman Sachs 432Romanian leu Euro 460,000 94,336 27-Jul-20 HSBC Bank plc 454Romanian leu Euro 460,000 94,333 27-Jul-20 HSBC Bank plc 458Romanian leu US dollar 1,350,000 304,473 27-Jul-20 JPMorgan Chase
Bank 6,711Romanian leu US dollar 1,350,000 304,404 27-Jul-20 JPMorgan Chase
Bank 6,772Romanian leu US dollar 1,350,000 304,418 27-Jul-20 JPMorgan Chase
Bank 6,760South African rand US dollar 350,000 20,035 27-Jul-20 Bank of America
Merrill Lynch 79Thai baht US dollar 12,000,000 380,644 27-Jul-20 Citigroup Global
Markets Limited 6,758Thai baht US dollar 46,600,000 1,482,424 27-Jul-20 Goldman Sachs 22,450Thai baht US dollar 11,500,000 365,784 27-Jul-20 Natwest
Markets Plc 5,585US dollar Mexican peso 954,324 20,851,470 27-Jul-20 JPMorgan Chase
Bank 50,928US dollar Mexican peso 243,073 5,600,000 27-Jul-20 BNP Paribas 1,885US dollar Mexican peso 752,755 16,981,384 27-Jul-20 BNP Paribas 19,681
03613-1A.indd 52 19/08/2020 19:00

53
Schedule of investments – as at 30 June 2020
BNy MELLON ABSOLUTE RETURN BOND FUND
Forward foreign currency contracts cont’d.Unrealised
Gain/(Loss)Buy Sell Amount (B) Amount (S)Settle
Date Counterparty
BNy Mellon Absolute Return Bond Fund cont’d.Euro US dollar 1,247,737 1,410,000 30-Jul-20 Bank of America
Merrill Lynch (9,384)Sterling Euro 26,000 29,161 03-Aug-20 RBC Capital
Markets (714)Sterling Euro 860,000 951,692 03-Aug-20 Lloyds Bank plc (10,731)Sterling Euro 458,000 507,212 03-Aug-20 UBS AG (6,096)Sterling Euro 630,000 698,419 03-Aug-20 Bank of America
Merrill Lynch (9,111)Sterling Euro 860,000 958,570 03-Aug-20 Bank of America
Merrill Lynch (17,610)Sterling Euro 391,000 439,435 03-Aug-20 Lloyds Bank plc (11,627)Sterling Euro 100,000 111,434 03-Aug-20 Lloyds Bank plc (2,020)Sterling Euro 1,140,000 1,271,796 03-Aug-20 Lloyds Bank plc (24,477)Sterling Euro 106,000 118,830 03-Aug-20 Lloyds Bank plc (2,852)Sterling Euro 400,000 444,892 03-Aug-20 Bank of America
Merrill Lynch (7,236)Sterling Euro 207,000 230,952 03-Aug-20 Lloyds Bank plc (4,465)Sterling Euro 1,660,000 1,854,318 03-Aug-20 Bank of America
Merrill Lynch (38,046)Sterling Euro 800,000 881,765 03-Aug-20 Bank of America
Merrill Lynch (6,453)Euro US dollar 27,567,782 31,390,000 28-Aug-20 Bank of America
Merrill Lynch (400,975)Euro US dollar 1,472,236 1,678,000 28-Aug-20 RBC Capital
Markets (22,876)Euro US dollar 29,513,027 33,354,000 11-Sep-20 Bank of America
Merrill Lynch (196,137)Euro US dollar 1,366,214 1,545,000 11-Sep-20 Lloyds Bank plc (9,952)
EUR (1,970,740)
Net EUR 2,585,730
BNy Mellon Absolute Return Bond Fund CHF T (Acc) (Hedged) Share ClassSwiss franc Euro 31,264 29,052 15-Jul-20 The Bank of
New York Mellon 294
EUR 294
CHF 313
BNy Mellon Absolute Return Bond Fund Sterling T (Acc) (Hedged) Share ClassEuro Sterling 2,642 2,389 01-Jul-20 The Bank of
New York Mellon 26
EUR 26
GBp 24
Sterling Euro 100,000 112,037 15-Jul-20 The Bank of New York Mellon (2,590)
Sterling Euro 9,190,031 10,310,536 15-Jul-20 The Bank of New York Mellon (252,291)
Sterling Euro 2,389 2,641 15-Jul-20 The Bank of New York Mellon (26)
EUR (254,907)
GBp (232,855)
Net EUR (254,881)
Net GBp (232,831)
Forward foreign currency contracts cont’d.Unrealised
Gain/(Loss)Buy Sell Amount (B) Amount (S)Settle
Date Counterparty
BNy Mellon Absolute Return Bond Fund cont’d.Euro US dollar 2,439,559 2,780,000 16-Jul-20 Bank of America
Merrill Lynch (39,804)Euro US dollar 35,227 40,124 16-Jul-20 Bank of America
Merrill Lynch (557)Euro US dollar 1,679,021 1,900,000 16-Jul-20 Bank of America
Merrill Lynch (15,508)Korean won US dollar 2,400,000,000 2,017,264 16-Jul-20 HSBC Bank plc (19,728)Mexican peso US dollar 15,572,421 700,000 16-Jul-20 Citigroup Global
Markets Limited (25,769)Mexican peso US dollar 28,148,926 1,260,882 16-Jul-20 RBC Capital
Markets (42,613)Polish zloty US dollar 2,635,622 670,186 16-Jul-20 Citigroup Global
Markets Limited (7,191)Russian rouble US dollar 49,000,000 701,307 16-Jul-20 BNP Paribas (10,877)Russian rouble US dollar 91,000,000 1,318,525 16-Jul-20 HSBC Bank plc (34,557)Sterling Euro 538,220 600,000 16-Jul-20 BNP Paribas (10,942)Sterling Euro 261,669 292,000 16-Jul-20 Citigroup Global
Markets Limited (5,614)Sterling Euro 814,206 908,000 16-Jul-20 BNP Paribas (16,887)Sterling US dollar 500,000 620,626 16-Jul-20 Bank of America
Merrill Lynch (6,282)US dollar Australian dollar 700,000 1,022,447 16-Jul-20 Citigroup Global
Markets Limited (288)US dollar Australian dollar 700,000 1,022,159 16-Jul-20 Citigroup Global
Markets Limited (112)US dollar Indian rupee 692,822 52,500,000 16-Jul-20 JPMorgan Chase
Bank (1,021)US dollar Korean won 692,475 840,000,000 16-Jul-20 JPMorgan Chase
Bank (5,195)US dollar Korean won 692,881 840,000,000 16-Jul-20 JPMorgan Chase
Bank (4,834)Chilean peso US dollar 388,000,000 473,080 17-Jul-20 HSBC Bank plc (573)Chilean peso US dollar 490,000,000 601,541 17-Jul-20 BNP Paribas (4,375)Chilean peso US dollar 388,000,000 472,928 17-Jul-20 BNP Paribas (437)Colombian peso US dollar 880,000,000 235,038 17-Jul-20 JPMorgan Chase
Bank (379)Colombian peso US dollar 860,000,000 229,784 17-Jul-20 JPMorgan Chase
Bank (450)Colombian peso US dollar 860,000,000 229,926 17-Jul-20 Citigroup Global
Markets Limited (576)US dollar Chilean peso 2,792,703 2,302,835,000 17-Jul-20 Barclays Bank PLC (10,061)US dollar Colombian peso 359,695 1,420,000,000 17-Jul-20 Barclays Bank PLC (16,842)US dollar Colombian peso 835,167 3,274,022,565 17-Jul-20 Citigroup Global
Markets Limited (33,625)US dollar Indonesian rupiah 2,257,268 34,305,954,301 17-Jul-20 Citigroup Global
Markets Limited (105,488)US dollar Indonesian rupiah 493,879 7,500,000,000 17-Jul-20 Bank of America
Merrill Lynch (22,711)US dollar Russian rouble 2,872,962 212,728,483 17-Jul-20 Goldman Sachs (105,574)Euro US dollar 5,331,262 6,000,000 27-Jul-20 Bank of America
Merrill Lynch (18,552)Mexican peso US dollar 9,918,269 440,785 27-Jul-20 JPMorgan Chase
Bank (12,498)Mexican peso US dollar 1,615,000 71,430 27-Jul-20 BNP Paribas (1,729)Mexican peso US dollar 9,918,270 440,273 27-Jul-20 BNP Paribas (12,042)South African rand US dollar 7,715,000 444,006 27-Jul-20 Goldman Sachs (389)South African rand US dollar 12,577,068 736,382 27-Jul-20 BNP Paribas (11,833)South African rand US dollar 13,554,000 815,492 27-Jul-20 Morgan Stanley (32,288)South African rand US dollar 11,528,000 683,064 27-Jul-20 Bank of America
Merrill Lynch (18,072)South African rand US dollar 7,800,000 450,600 27-Jul-20 Bank of America
Merrill Lynch (1,911)US dollar Mexican peso 1,475,487 36,236,000 27-Jul-20 Barclays Bank PLC (74,623)US dollar Romanian leu 1,201,238 5,420,000 27-Jul-20 Citigroup Global
Markets Limited (45,814)US dollar South African rand 1,926,341 36,158,000 27-Jul-20 RBC Capital
Markets (136,013)US dollar Thai baht 2,171,667 69,770,000 27-Jul-20 UBS AG (76,263)Euro US dollar 542,933 610,000 30-Jul-20 Bank of America
Merrill Lynch (928)
03613-1A.indd 53 19/08/2020 19:00

54
Schedule of investments – as at 30 June 2020
BNy MELLON ABSOLUTE RETURN BOND FUND
Forward foreign currency contracts cont’d.Unrealised
Gain/(Loss)Buy Sell Amount (B) Amount (S)Settle
Date Counterparty
BNy Mellon Absolute Return Bond Fund Sterling W (Acc) (Hedged) Share ClassEuro Sterling 23,079 20,875 01-Jul-20 The Bank of
New York Mellon 227Euro Sterling 24,441 21,985 15-Jul-20 The Bank of
New York Mellon 379Euro Sterling 4,573 4,092 15-Jul-20 The Bank of
New York Mellon 95Euro Sterling 17,001 15,217 15-Jul-20 The Bank of
New York Mellon 347Euro Sterling 1,634 1,455 15-Jul-20 The Bank of
New York Mellon 41Euro Sterling 98,311 87,748 15-Jul-20 The Bank of
New York Mellon 2,273Euro Sterling 3,690,146 3,338,521 15-Jul-20 The Bank of
New York Mellon 36,223Euro Sterling 89,749 81,426 15-Jul-20 The Bank of
New York Mellon 630Sterling Euro 1,000 1,091 15-Jul-20 The Bank of
New York Mellon 3
EUR 40,218
GBp 36,739
Sterling Euro 3,338,521 3,691,037 01-Jul-20 The Bank of New York Mellon (36,356)
Euro Sterling 1,091 1,000 02-Jul-20 The Bank of New York Mellon (3)
Sterling Euro 2,000 2,208 15-Jul-20 The Bank of New York Mellon (19)
Sterling Euro 88,583 97,862 15-Jul-20 The Bank of New York Mellon (910)
Sterling Euro 367,341 408,371 15-Jul-20 The Bank of New York Mellon (6,326)
Sterling Euro 19,760 22,084 15-Jul-20 The Bank of New York Mellon (457)
Sterling Euro 19,000 21,127 15-Jul-20 The Bank of New York Mellon (332)
Sterling Euro 1,000 1,116 15-Jul-20 The Bank of New York Mellon (22)
Sterling Euro 92,322,319 103,578,822 15-Jul-20 The Bank of New York Mellon (2,534,493)
Sterling Euro 20,875 23,074 15-Jul-20 The Bank of New York Mellon (227)
Sterling Euro 342,616 380,280 15-Jul-20 The Bank of New York Mellon (5,296)
Sterling Euro 106 117 15-Jul-20 The Bank of New York Mellon (1)
Sterling Euro 140,000 154,310 15-Jul-20 The Bank of New York Mellon (1,084)
EUR (2,585,526)
GBp (2,361,856)
Net EUR (2,545,308)
Net GBp (2,325,117)
Forward foreign currency contracts cont’d.Unrealised
Gain/(Loss)Buy Sell Amount (B) Amount (S)Settle
Date Counterparty
BNy Mellon Absolute Return Bond Fund Sterling W (Inc) (Hedged) Share ClassSterling Euro 181,775 203,938 15-Jul-20 The Bank of
New York Mellon (4,990)
EUR (4,990)
GBp (4,558)
BNy Mellon Absolute Return Bond Fund Sterling x (Acc) (Hedged) Share ClassSterling Euro 9,873,673 11,077,532 15-Jul-20 The Bank of
New York Mellon (271,059)
EUR (271,059)
GBp (247,610)
BNy Mellon Absolute Return Bond Fund USD R (Hedged) Share ClassSterling Euro 3,667,919 3,230,072 15-Jul-20 The Bank of
New York Mellon 41,263
EUR 41,263
USD 46,252
BNy Mellon Absolute Return Bond Fund USD T (Hedged) Share ClassUS dollar Euro 9,148,189 8,056,150 15-Jul-20 The Bank of
New York Mellon 102,914
EUR 102,914
USD 115,356
Euro US dollar 25,900 29,135 15-Jul-20 The Bank of New York Mellon (85)
EUR (85)
USD (95)
Net EUR 102,829
Net USD 115,261
BNy Mellon Absolute Return Bond Fund USD W (Acc) (Hedged) Share ClassUS dollar Euro 50,443 44,608 15-Jul-20 The Bank of
New York Mellon 381US dollar Euro 2,507,685 2,208,338 15-Jul-20 The Bank of
New York Mellon 28,211
EUR 28,592
USD 32,049
03613-1A.indd 54 19/08/2020 19:00

55
Schedule of investments – as at 30 June 2020
Holdings Description
Fair value
Total net assets
% Holdings Description
Fair value
Total net assets
%
Collective investment schemes
Guernsey - 3,277,358 (31 December 2019: 5,602,322) 3,277,358 1.21
9,337,203 Sherborne Investors Guernsey C Ltd 3,277,358 1.21
United Kingdom - 26,141,675 (31 December 2019: 41,789,262) 26,141,675 9.61
425,892 Electra Private Equity Plc 813,454 0.30 25,328,221 Insight Liquidity Funds Plc - GBP Liquidity Fund 25,328,221 9.31
Total investments in collective investment schemes 29,419,033 10.82
Floating rate notes
Australia - 12,005,220 (31 December 2019: 17,014,195) 12,005,220 4.41
12,000,000 National Australia Bank Ltd ‘GMTN’ FRN 1.060% 17-Jul-2020 12,005,220 4.41
Canada - 12,992,460 (31 December 2019: 15,015,600) 12,992,460 4.78
13,000,000 Bank of Nova Scotia/The ‘EMTN’ FRN 0.584% 11-Jun-2021 12,992,460 4.78
Finland - 13,033,280 (31 December 2019: 15,015,675) 13,033,280 4.79
13,000,000 OP Corporate Bank plc ‘EMTN’ FRN 0.568% 30-May-2021 13,033,280 4.79
Supranational - 3,004,785 (31 December 2019: 17,013,540) 3,004,785 1.11
3,000,000 European Investment Bank ‘EMTN’ FRN 0.465% 21-May-2021 3,004,785 1.11
Total investments in floating rate notes 41,035,745 15.09
Certificate of deposit
Belgium - 9,999,876 (31 December 2019: 16,497,798) 9,999,876 3.68
10,000,000 Euroclear Bank SA/NV 0.000% 08-Jul-2020 CD 9,999,876 3.68
France - 18,000,074 (31 December 2019: –) 18,000,074 6.62
10,000,000 Banque Federative du Credit Mutuel SA 0.000% 07-Aug-2020 CD 9,999,000 3.68
8,000,000 BNP Paribas SA 0.880% 07-Jul-2020 CD 8,001,074 2.94
Switzerland - 18,036,420 (31 December 2019: 10,005,252) 18,036,420 6.63
10,000,000 Credit Suisse 1.020% 13-Nov-2020 CD 10,029,538 3.69 8,000,000 UBS AG 0.820% 14-Aug-2020 CD 8,006,882 2.94
United Arab Emirates - 4,002,622 (31 December 2019: –) 4,002,622 1.47
4,000,000 National Bank of Abu Dhabi 0.420% 18-Dec-2020 CD 4,002,622 1.47
United Kingdom - 35,010,214 (31 December 2019: 21,972,008) 35,010,214 12.87
9,000,000 Barclays Plc 0.360% 24-Aug-2020 CD 9,003,240 3.31 8,000,000 Mizuho Bank Ltd 0.000% 28-Aug-2020 CD 7,998,464 2.94 10,000,000 MUFG Bank Ltd 0.540% 09-Sep-2020 CD 10,007,879 3.68
8,000,000 Sumitomo Mitsui Trust Bank Ltd 0.170% 09-Sep-2020 CD 8,000,631 2.94
Total investments in certificate of deposit 85,049,206 31.27
Commercial paper
Finland - 8,999,749 (31 December 2019: –) 8,999,749 3.31
9,000,000 Nordea Bank Abp 0.000% 15-Jul-2020 CP 8,999,749 3.31
France - 19,999,490 (31 December 2019: 29,984,123) 19,999,490 7.36
10,000,000 Agence Centrale des Organismes de Securite Sociale 0.000% 13-Jul-2020 CP 9,999,769 3.68
10,000,000 Dexia Credit Local 0.000% 15-Jul-2020 CP 9,999,721 3.68
Spain - 7,998,620 (31 December 2019: 14,987,491) 7,998,620 2.94
8,000,000 Banco Santander SA 0.000% 24-Aug-2020 CP 7,998,620 2.94
United Kingdom - 7,999,777 (31 December 2019: –) 7,999,777 2.94
8,000,000 Transport For London 0.000% 15-Jul-2020 CP 7,999,777 2.94
Total investments in commercial paper 44,997,636 16.55
Equities
Germany - 1,388,251 (31 December 2019: 2,391,929) 1,388,251 0.51
34,226 Dermapharm Holding SE 1,388,251 0.51
Guernsey - 923,756 (31 December 2019: 1,527,361) 923,756 0.34
17,595,350 Sherborne Investors Guernsey B Ltd 923,756 0.34
Spain - 9,470,549 (31 December 2019: 18,277,778) 9,470,549 3.48
622,601 Grifols SA ADR 9,470,549 3.48
Switzerland - 977,732 (31 December 2019: –) 977,732 0.36
3,466 Roche Holding AG 977,732 0.36
United Kingdom - 2,730,959 (31 December 2019: 2,975,351) 2,730,959 1.01
2,609,141 Applied Graphene Materials Plc 430,508 0.16 26,000 Blue Prism Group plc 295,880 0.11 21,000 Dechra Pharmaceuticals Plc 595,770 0.22 400,000 Johnson Service Group Plc 465,200 0.17 257,143 National Express Group Plc 500,401 0.19 20,000 Whitbread Plc 443,200 0.16
Total investments in equities 15,491,247 5.70
Bonds
United Kingdom - 26,030,030 (31 December 2019: 30,070,509) 26,030,030 9.57
26,000,000 United Kingdom Gilt 2.000% 22-Jul-2020 26,030,030 9.57
Total investments in bonds 26,030,030 9.57
BNY MELLON ABSOLUTE RETURN EQUITY FUND
FUND 2 – BNy MELLON ABSOLUTE RETURN EQUITy FUND
Certificate of deposit cont’d.
United Kingdom cont’d.
GBPGBP
03613-1A.indd 55 19/08/2020 19:00

56
Schedule of investments – as at 30 June 2020
Holdings Description
Fair value
Total net assets
% Holdings Description
Fair value
Total net assets
%
BNy MELLON ABSOLUTE RETURN EQUITy FUND
Equity index swaps
Europe - 201,602 (31 December 2019: 84,874) 201,602 0.07
(28,050) Euro STOXX Banks 16-Oct-2020 152,355 0.06 (1,058) STOXX 600 - Auto & Parts 13-Jan-2021 34,777 0.01 (1,155) STOXX 600 - Health Care 13-Jan-2021 2,502 0.00 (6,610) STOXX 600 - Insurance 04-Nov-2020 9,416 0.00 (3,628) STOXX 600 - Oil & Gas 16-Oct-2020 2,552 0.00
Supranational - 17,125 (31 December 2019: –) 17,125 0.01
16,677 MS Telecommunications Europe 25-Jun-2021 17,125 0.01
United Kingdom - 340,858 (31 December 2019: 26,717) 340,858 0.13
(203) FTSE 250 Index 13-Jan-2021 86,469 0.03 (210) FTSE 350 Aerospace & Defense Index 16-Oct-2020 470 0.00 (41,248) JPINF3RT 04-Nov-2020 130,861 0.05 (15,300) JPINHOME 04-Nov-2020 59,449 0.02 (4,500) JPMorgan Index CMNT 04-Nov-2020 16,493 0.01 (10,000) JPMorgan Index UKFM 04-Nov-2020 47,116 0.02
United States of America - 88,059 (31 December 2019: 40,547) 88,059 0.03
(10,900) JPMorgan Index AIR 04-Nov-2020 84,263 0.03 (5,746) JPMorgan Index LVO 04-Nov-2020 3,796 0.00
Total investments in equity index swaps 647,644 0.24
Equity swaps
Belgium - 11,448 (31 December 2019: 192,485) 11,448 0.00
100,258 D’ieteren SA/NV 25-Jun-2021 11,448 0.00
Denmark - 110,531 (31 December 2019: –) 110,531 0.04
7,895 Carlsberg A/S 13-Jan-2021 61,549 0.02 212,255 Danske Bank A/S 25-Jun-2021 36,164 0.01 40,220 Topdanmark A/S 25-Jun-2021 12,818 0.01
Finland - 46,424 (31 December 2019: 181,490) 46,424 0.02
22,727 Neste Oyj 16-Oct-2020 38,200 0.02 60,020 Sampo Oyj - Class A 25-Jun-2021 8,224 0.00
France - 984,822 (31 December 2019: 1,495,683) 984,822 0.36
(119,750) AXA SA 16-Oct-2020 138,495 0.05 57,029 Bureau Veritas SA 25-Jun-2021 1,823 0.00 116,010 Credit Agricole SA 25-Jun-2021 32,004 0.01 51,639 Edenred 13-Jan-2021 201,960 0.08 (8,335) EssilorLuxottica SA 16-Oct-2020 31,270 0.01 3,876 L’Oreal SA 16-Oct-2020 93,861 0.04 40,289 Nexity SA 25-Jun-2021 6,993 0.00 (9,351) Orpea 16-Oct-2020 18,770 0.01 54,070 SCOR SE 16-Oct-2020 29,833 0.01 8,372 SEB SA 25-Jun-2021 7,265 0.00 12,057 Trigano SA 16-Oct-2020 254,147 0.09 9,793 Ubisoft Entertainment SA 13-Jan-2021 33,818 0.01 49,439 Vivendi SA 13-Jan-2021 134,583 0.05
Germany - 1,184,524 (31 December 2019: 1,404,280) 1,184,524 0.44
(11,160) Allianz SE 13-Jan-2021 81,718 0.03 33,297 Deutsche Boerse AG 16-Oct-2020 190,864 0.07 (30,000) Evonik Industries AG 16-Oct-2020 20,770 0.01 10,165 Muenchener Rueckversicherungs-Gesellschaft AG
in Muenchen 13-Jan-2021 418,253 0.15 25,982 Rheinmetall AG 25-Jun-2021 14,003 0.01 5,000 SAP SE 04-Nov-2020 48,465 0.02 11,962 Siemens AG 25-Jun-2021 22,729 0.01 8,809 Siltronic AG 25-Jun-2021 8,530 0.00 100,562 Takkt AG 16-Oct-2020 78,083 0.03 19,265 Volkswagen AG - Preference 13-Jan-2021 301,109 0.11
Ireland - 609,399 (31 December 2019: 559,486) 609,399 0.22
72,000 CRH Plc 13-Jan-2021 369,964 0.14 12,830 Linde Plc 25-Jun-2021 57,722 0.02 134,000 Ryanair Holdings Plc 13-Jan-2021 168,005 0.06 78,000 Smurfit Kappa Group Plc 04-Nov-2020 13,708 0.00
Italy - 762,232 (31 December 2019: 1,649,686) 762,232 0.28
520,117 Anima Holding SpA ‘144A’ 13-Jan-2021 447,780 0.17 73,100 Assicurazioni Generali SpA 25-Jun-2021 1,836 0.00 58,806 Banca Generali SpA 25-Jun-2021 34,917 0.01 (93,799) Eni SpA 16-Oct-2020 10,668 0.00 116,694 FinecoBank Banca Fineco SpA 25-Jun-2021 19,721 0.01 39,215 Recordati SpA 13-Jan-2021 244,131 0.09 3,663,680 Telecom Italia SpA/Milano 25-Jun-2021 3,179 0.00
Japan - 96,646 (31 December 2019: 327,505) 96,646 0.04
22,667 Sony Corp ADR 04-Nov-2020 96,646 0.04
Jersey - 115,758 (31 December 2019: 655,349) 115,758 0.04
130,986 boohoo Group Plc 04-Nov-2020 83,445 0.03 115,404 Sanne Group Plc 13-Jan-2021 32,313 0.01
Netherlands - 292,436 (31 December 2019: 952,280) 292,436 0.11
60,497 EXOR NV 25-Jun-2021 81,790 0.03 245,119 ING Groep NV 16-Oct-2020 182,373 0.07 211,219 Marel HF 16-Oct-2020 28,273 0.01
Spain - 1,169,774 (31 December 2019: 1,066,042) 1,169,774 0.43
51,706 Endesa SA 16-Oct-2020 71,558 0.03 (373,084) Grifols SA 04-Nov-2020 984,938 0.36 178,139 Merlin Properties Socimi SA (REIT)
16-Oct-2020 61,837 0.02 13,272 Red Electrica Corp SA 13-Jan-2021 14,185 0.01 94,582 Repsol SA (Right) 16-Oct-2020 37,256 0.01
Sweden - 211,777 (31 December 2019: 485,681) 211,777 0.08
78,154 Atlas Copco AB 16-Oct-2020 148,541 0.06 231,600 Swedbank AB 25-Jun-2021 63,236 0.02
Equity swaps cont’d.
GBPGBP
03613-1A.indd 56 19/08/2020 19:00

57
Schedule of investments – as at 30 June 2020
Holdings Description
Fair value
Total net assets
% Holdings Description
Fair value
Total net assets
%
BNy MELLON ABSOLUTE RETURN EQUITy FUND
Switzerland - 631,721 (31 December 2019: 472,361) 631,721 0.23
40,011 Cie Financiere Richemont SA 04-Nov-2020 275,802 0.10 2,239 Geberit AG 13-Jan-2021 9,361 0.00 13,411 Novartis AG 04-Nov-2020 19,647 0.01 (4,089) Temenos AG 04-Nov-2020 3,741 0.00 152,500 UBS Group AG 16-Oct-2020 65,972 0.02 6,603 Zurich Insurance Group AG 16-Oct-2020 257,198 0.10
United Kingdom - 3,051,851 (31 December 2019: 4,217,553) 3,051,851 1.12
51,945 Admiral Group Plc 16-Oct-2020 25,669 0.01 222,580 Ashmore Group Plc 04-Nov-2020 102,164 0.04 (125,000) Babcock International Group Plc 13-Jan-2021 80,437 0.03 332,772 Balfour Beatty Plc 13-Jan-2021 75,956 0.03 31,474 Berkeley Group Holdings Plc 13-Jan-2021 44,980 0.02 (450,000) BP Plc 13-Jan-2021 53,269 0.02 420,000 Chemring Group Plc 16-Oct-2020 150,150 0.06 1,110,278 ConvaTec Group Plc ‘144A’ 13-Jan-2021 155,439 0.06 18,000 Dechra Pharmaceuticals Plc 16-Oct-2020 40,809 0.01 266,000 Direct Line Insurance Group Plc 13-Jan-2021 11,974 0.00 (120,000) DS Smith Plc 16-Oct-2020 13,255 0.00 (100,000) Equiniti Group Plc ‘144A’ 04-Nov-2020 14,100 0.01 30,000 Gamma Communications Plc 13-Jan-2021 5,815 0.00 49,379 GlaxoSmithKline Plc 16-Oct-2020 1,083 0.00 (46,111) Greggs Plc 16-Oct-2020 112,636 0.04 170,000 Howden Joinery Group Plc 04-Nov-2020 39,838 0.01 30,000 IMI Plc 13-Jan-2021 2,040 0.00 119,233 Intermediate Capital Group Plc 04-Nov-2020 250,666 0.09 (20,204) Intertek Group Plc 25-Jun-2021 8,890 0.00 180,000 JD Sports Fashion Plc 04-Nov-2020 184,860 0.07 (235,000) Legal & General Group Plc 16-Oct-2020 32,858 0.01 3,000,000 Lloyds Banking Group Plc 16-Oct-2020 282 0.00 (480,000) Marks & Spencer Group Plc 16-Oct-2020 42,569 0.02 1,280,116 Melrose Industries Plc 04-Nov-2020 280,281 0.10 (55,000) Mondi Plc 16-Oct-2020 2,396 0.00 252,831 National Grid Plc 13-Jan-2021 192,705 0.07 (20,000) Next Plc 16-Oct-2020 105,956 0.04 80,000 Persimmon Plc 13-Jan-2021 42,419 0.02 751,000 Quilter Plc ‘144A’ 13-Jan-2021 106,437 0.04 20,000 Reckitt Benckiser Group Plc 16-Oct-2020 63,290 0.02 (115,000) Royal Dutch Shell Plc 13-Jan-2021 31,273 0.01 323,170 RSA Insurance Group Plc 13-Jan-2021 33,887 0.01 (27,550) Schroders Plc 13-Jan-2021 31,566 0.01 977,702 Serco Group Plc 13-Jan-2021 239,523 0.09 (62,000) Smith & Nephew Plc 13-Jan-2021 53,559 0.02 (191,600) Standard Chartered Plc 16-Oct-2020 44,922 0.02 45,000 Tate & Lyle Plc 13-Jan-2021 9,033 0.00 63,000 Travis Perkins Plc 13-Jan-2021 30,060 0.01 231,144 UNITE Group Plc/The (REIT) 16-Oct-2020 46,019 0.02 (300,000) Vodafone Group Plc 13-Jan-2021 24,665 0.01 19,500 Whitbread Plc 13-Jan-2021 139,620 0.05 (490,493) William Hill Plc 13-Jan-2021 105,516 0.04 183,431 Wm Morrison Supermarkets Plc 13-Jan-2021 18,985 0.01
Total investments in equity swaps 9,279,343 3.41
Underlying exposure
GBP
Open futures contracts - 129,507 (31 December 2019: 54,531)
(14) DAX Index Short Futures Contracts Exp Sep-2020 (3,918,994) 45,081 0.02
(60) FTSE 100 Index Short Futures Contracts Exp Sep-2020 (3,691,500) 26,612 0.01
(35) FTSE MIB Index Short Futures Contracts Exp Sep-2020 (3,086,117) 36,768 0.01
(6) IBEX 35 Index Short Futures Contracts Exp Jul-2020 (395,725) 9,098 0.00
(8) MDAX Index Short Futures Contracts Exp Sep-2020 (942,650) 11,948 0.01
Total open futures contracts 129,507 0.05 Unrealised gain on forward foreign currency contracts - 4,424,682 (see below) (31 December 2019: 2,662,866) 4,424,682 1.63
Total financial assets at fair value through profit or loss 256,504,073 94.33
Equity index swaps
Europe - (515,111) (31 December 2019: (886,480)) (515,111) (0.19)
(14,877) Euro STOXX Banks 16-Oct-2020 (31,911) (0.01) (2,022) STOXX 600 - Insurance 04-Nov-2020 (55,659) (0.02) (4,235) STOXX 600 - Auto & Parts 13-Jan-2021 (211,959) (0.08) (19,150) STOXX 600 - Banks 04-Nov-2020 (17,250) (0.01) (1,701) STOXX 600 - Health Care 13-Jan-2021 (9,261) (0.00) (1,915) STOXX 600 - Industrial Goods & Service 13-Jan-2021 (149,743) (0.06) (10,400) STOXX 600 - Insurance 04-Nov-2020 (39,328) (0.01)
Germany - (8,546) (31 December 2019: –) (8,546) (0.00)
(157) DAX Index 04-Nov-2020 (8,546) (0.00)
United Kingdom - (884,279) (31 December 2019: (957,385)) (884,279) (0.33)
(541) FTSE 250 Index 13-Jan-2021 (467,288) (0.17) (197) FTSE 350 General Retail Index 04-Nov-2020 (38,907) (0.02) (221) FTSE 350 Retails 04-Nov-2020 (23,406) (0.01) (6,642) JPINCAPR 04-Nov-2020 (85,812) (0.03) (2,896) JPINF3RT 04-Nov-2020 (5,118) (0.00) (11,300) JPINHOME 04-Nov-2020 (37,099) (0.02) 3,818 JPINHVO2 04-Nov-2020 (5,949) (0.00) (10,500) JPINITBK 04-Nov-2020 (7,278) (0.00) 8,411 JPMorgan Index UKBP 04-Nov-2020 (15,604) (0.01) (18,800) JPMorgan Index UKFM 04-Nov-2020 (197,818) (0.07)
United States of America - (384,182) (31 December 2019: (110,398)) (384,182) (0.14)
(7,700) JPMorgan Index AIR 04-Nov-2020 (85,470) (0.03) (25,000) JPMorgan Index CMNT 04-Nov-2020 (298,712) (0.11)
Total investments in equity index swaps (1,792,118) (0.66)
Equity swaps cont’d.
GBPGBP
03613-1A.indd 57 19/08/2020 19:00
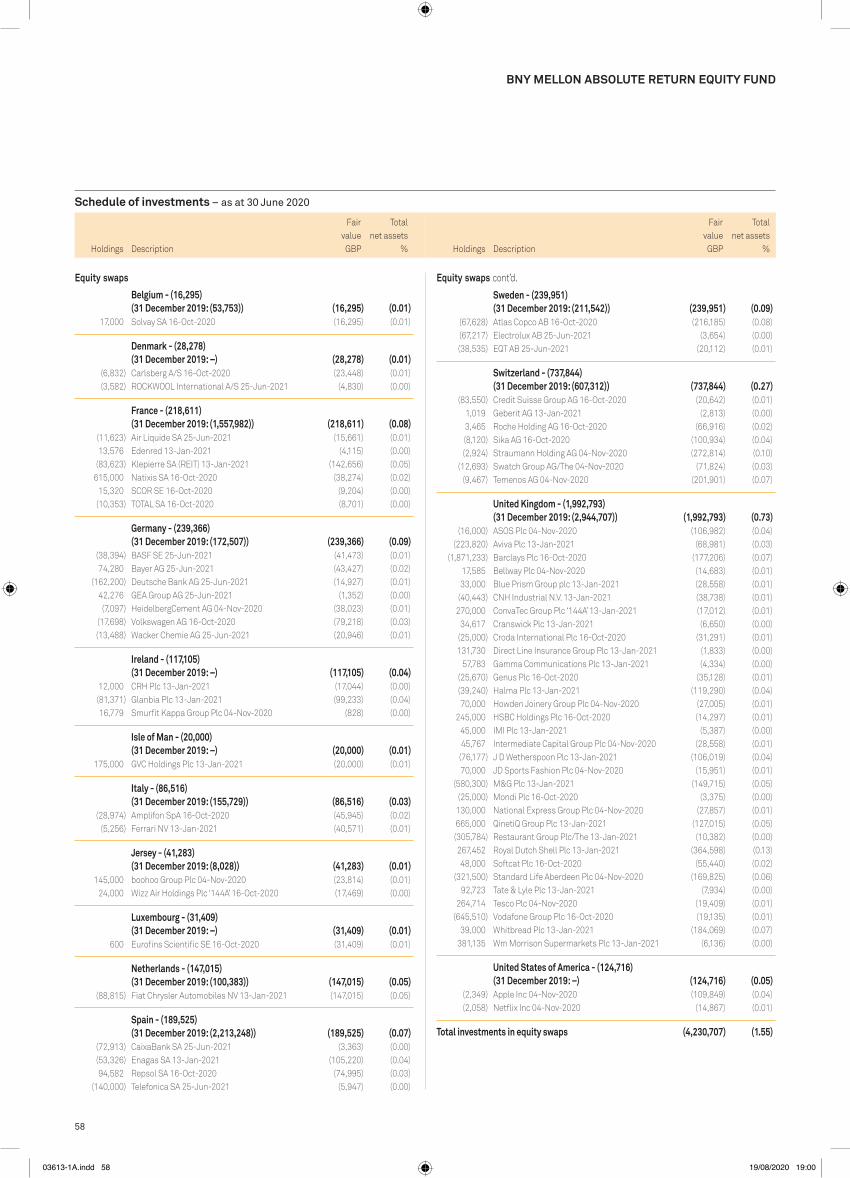
58
Schedule of investments – as at 30 June 2020
Holdings Description
Fair value
Total net assets
% Holdings Description
Fair value
Total net assets
%
BNy MELLON ABSOLUTE RETURN EQUITy FUND
Equity swaps
Belgium - (16,295) (31 December 2019: (53,753)) (16,295) (0.01)
17,000 Solvay SA 16-Oct-2020 (16,295) (0.01)
Denmark - (28,278) (31 December 2019: –) (28,278) (0.01)
(6,832) Carlsberg A/S 16-Oct-2020 (23,448) (0.01) (3,582) ROCKWOOL International A/S 25-Jun-2021 (4,830) (0.00)
France - (218,611) (31 December 2019: (1,557,982)) (218,611) (0.08)
(11,623) Air Liquide SA 25-Jun-2021 (15,661) (0.01) 13,576 Edenred 13-Jan-2021 (4,115) (0.00) (83,623) Klepierre SA (REIT) 13-Jan-2021 (142,656) (0.05) 615,000 Natixis SA 16-Oct-2020 (38,274) (0.02) 15,320 SCOR SE 16-Oct-2020 (9,204) (0.00) (10,353) TOTAL SA 16-Oct-2020 (8,701) (0.00)
Germany - (239,366) (31 December 2019: (172,507)) (239,366) (0.09)
(38,394) BASF SE 25-Jun-2021 (41,473) (0.01) 74,280 Bayer AG 25-Jun-2021 (43,427) (0.02) (162,200) Deutsche Bank AG 25-Jun-2021 (14,927) (0.01) 42,276 GEA Group AG 25-Jun-2021 (1,352) (0.00) (7,097) HeidelbergCement AG 04-Nov-2020 (38,023) (0.01) (17,698) Volkswagen AG 16-Oct-2020 (79,218) (0.03) (13,488) Wacker Chemie AG 25-Jun-2021 (20,946) (0.01)
Ireland - (117,105) (31 December 2019: –) (117,105) (0.04)
12,000 CRH Plc 13-Jan-2021 (17,044) (0.00) (81,371) Glanbia Plc 13-Jan-2021 (99,233) (0.04) 16,779 Smurfit Kappa Group Plc 04-Nov-2020 (828) (0.00)
Isle of Man - (20,000) (31 December 2019: –) (20,000) (0.01)
175,000 GVC Holdings Plc 13-Jan-2021 (20,000) (0.01)
Italy - (86,516) (31 December 2019: (155,729)) (86,516) (0.03)
(28,974) Amplifon SpA 16-Oct-2020 (45,945) (0.02) (5,256) Ferrari NV 13-Jan-2021 (40,571) (0.01)
Jersey - (41,283) (31 December 2019: (8,028)) (41,283) (0.01)
145,000 boohoo Group Plc 04-Nov-2020 (23,814) (0.01) 24,000 Wizz Air Holdings Plc ‘144A’ 16-Oct-2020 (17,469) (0.00)
Luxembourg - (31,409) (31 December 2019: –) (31,409) (0.01)
600 Eurofins Scientific SE 16-Oct-2020 (31,409) (0.01)
Netherlands - (147,015) (31 December 2019: (100,383)) (147,015) (0.05)
(88,815) Fiat Chrysler Automobiles NV 13-Jan-2021 (147,015) (0.05)
Spain - (189,525) (31 December 2019: (2,213,248)) (189,525) (0.07)
(72,913) CaixaBank SA 25-Jun-2021 (3,363) (0.00) (53,326) Enagas SA 13-Jan-2021 (105,220) (0.04) 94,582 Repsol SA 16-Oct-2020 (74,995) (0.03) (140,000) Telefonica SA 25-Jun-2021 (5,947) (0.00)
Sweden - (239,951) (31 December 2019: (211,542)) (239,951) (0.09)
(67,628) Atlas Copco AB 16-Oct-2020 (216,185) (0.08) (67,217) Electrolux AB 25-Jun-2021 (3,654) (0.00) (38,535) EQT AB 25-Jun-2021 (20,112) (0.01)
Switzerland - (737,844) (31 December 2019: (607,312)) (737,844) (0.27)
(83,550) Credit Suisse Group AG 16-Oct-2020 (20,642) (0.01) 1,019 Geberit AG 13-Jan-2021 (2,813) (0.00) 3,465 Roche Holding AG 16-Oct-2020 (66,916) (0.02) (8,120) Sika AG 16-Oct-2020 (100,934) (0.04) (2,924) Straumann Holding AG 04-Nov-2020 (272,814) (0.10) (12,693) Swatch Group AG/The 04-Nov-2020 (71,824) (0.03) (9,467) Temenos AG 04-Nov-2020 (201,901) (0.07)
United Kingdom - (1,992,793) (31 December 2019: (2,944,707)) (1,992,793) (0.73)
(16,000) ASOS Plc 04-Nov-2020 (106,982) (0.04) (223,820) Aviva Plc 13-Jan-2021 (68,981) (0.03) (1,871,233) Barclays Plc 16-Oct-2020 (177,206) (0.07) 17,585 Bellway Plc 04-Nov-2020 (14,683) (0.01) 33,000 Blue Prism Group plc 13-Jan-2021 (28,558) (0.01) (40,443) CNH Industrial N.V. 13-Jan-2021 (38,738) (0.01) 270,000 ConvaTec Group Plc ‘144A’ 13-Jan-2021 (17,012) (0.01) 34,617 Cranswick Plc 13-Jan-2021 (6,650) (0.00) (25,000) Croda International Plc 16-Oct-2020 (31,291) (0.01) 131,730 Direct Line Insurance Group Plc 13-Jan-2021 (1,833) (0.00) 57,783 Gamma Communications Plc 13-Jan-2021 (4,334) (0.00) (25,670) Genus Plc 16-Oct-2020 (35,128) (0.01) (39,240) Halma Plc 13-Jan-2021 (119,290) (0.04) 70,000 Howden Joinery Group Plc 04-Nov-2020 (27,005) (0.01) 245,000 HSBC Holdings Plc 16-Oct-2020 (14,297) (0.01) 45,000 IMI Plc 13-Jan-2021 (5,387) (0.00) 45,767 Intermediate Capital Group Plc 04-Nov-2020 (28,558) (0.01) (76,177) J D Wetherspoon Plc 13-Jan-2021 (106,019) (0.04) 70,000 JD Sports Fashion Plc 04-Nov-2020 (15,951) (0.01) (580,300) M&G Plc 13-Jan-2021 (149,715) (0.05) (25,000) Mondi Plc 16-Oct-2020 (3,375) (0.00) 130,000 National Express Group Plc 04-Nov-2020 (27,857) (0.01) 665,000 QinetiQ Group Plc 13-Jan-2021 (127,015) (0.05) (305,784) Restaurant Group Plc/The 13-Jan-2021 (10,382) (0.00) 267,452 Royal Dutch Shell Plc 13-Jan-2021 (364,598) (0.13) 48,000 Softcat Plc 16-Oct-2020 (55,440) (0.02) (321,500) Standard Life Aberdeen Plc 04-Nov-2020 (169,825) (0.06) 92,723 Tate & Lyle Plc 13-Jan-2021 (7,934) (0.00) 264,714 Tesco Plc 04-Nov-2020 (19,409) (0.01) (645,510) Vodafone Group Plc 16-Oct-2020 (19,135) (0.01) 39,000 Whitbread Plc 13-Jan-2021 (184,069) (0.07) 381,135 Wm Morrison Supermarkets Plc 13-Jan-2021 (6,136) (0.00)
United States of America - (124,716) (31 December 2019: –) (124,716) (0.05)
(2,349) Apple Inc 04-Nov-2020 (109,849) (0.04) (2,058) Netflix Inc 04-Nov-2020 (14,867) (0.01)
Total investments in equity swaps (4,230,707) (1.55)
Equity swaps cont’d.
GBPGBP
03613-1A.indd 58 19/08/2020 19:00

59
Schedule of investments – as at 30 June 2020
Holdings Description
Fair value
Total net assets
% Holdings Description
Fair value
Total net assets
%
BNy MELLON ABSOLUTE RETURN EQUITy FUND
Underlying exposure
GBP
Open futures contracts - (7,585) (31 December 2019: (16,487))
(81) CAC 40 10 Euro Index Short Futures Contracts Exp Jul-2020 (3,645,627) (3,848) (0.01)
(11) Eurex SMI Index Short Futures Contracts Exp Sep-2020 (945,263) (1,415) (0.00)
(235) Euro STOXX 50 Index Short Futures Contracts Exp Sep-2020 (6,901,658) (2,322) (0.00)
Total open futures contracts (7,585) (0.01)
Unrealised loss on forward foreign currency contracts - (598,089) (see below) (31 December 2019: (115,097)) (598,089) (0.22)
Total financial liabilities at fair value through profit or loss (6,628,499) (2.44)
Net current assets 22,050,492 8.11
Total net assets 271,926,066 100.00
The counterparties for equity index swaps are Bank of America Merrill Lynch, Barclays Bank pLC and JpMorgan Chase Bank.The counterparties for equity swaps are Bank of America Merrill Lynch, Barclays Bank pLC, JpMorgan Chase Bank and Morgan Stanley.The counterparty for futures contracts is Goldman Sachs.
Analysis of portfolio % of Total Assets
Transferable securities and money market instruments admitted to official stock exchange listing or traded on a regulated market 39.31Transferable securities and money market instruments other than those admitted to official stock exchange listing or traded on a regulated market 45.66Financial derivative instruments dealt in on a regulated market 0.05oTC financial derivative instruments 5.04other current assets 9.94
Total assets 100.00
GBPGBP
Forward foreign currency contracts cont’d.Unrealised
Gain/(Loss)Buy Sell Amount (B) Amount (S)Settle
Date Counterparty
BNy Mellon Absolute Return Equity FundSwiss franc Sterling 560,000 468,218 12-Aug-20 Bank of America
Merrill Lynch 12,358
GBp 12,358
Euro Sterling 2,000,000 1,833,393 12-Aug-20 Goldman Sachs(5,197)
Sterling Euro 1,339,745 1,500,000 12-Aug-20 Goldman Sachs (31,402)Sterling Euro 1,179,663 1,300,000 12-Aug-20 Goldman Sachs (8,664)Sterling Euro 2,050,625 2,300,000 12-Aug-20 Bank of America
Merrill Lynch (51,800)Sterling Euro 10,754,091 12,250,000 12-Aug-20 Bank of America
Merrill Lynch (443,609)Sterling Swiss franc 404,396 480,000 12-Aug-20 Bank of America
Merrill Lynch (7,527)
GBp (548,199)
Net GBp (535,841)
BNy Mellon Absolute Return Equity Fund CHF R (Hedged) Share ClassSwiss franc Sterling 14,826 12,279 15-Jul-20 The Bank of
New York Mellon 436
GBp 436
CHF 725
BNy Mellon Absolute Return Equity Fund EUR D (Acc) (Hedged) Share ClassEuro Sterling 193,968 172,926 15-Jul-20 The Bank of
New York Mellon 4,299
GBp 4,299
EUR 4,706
BNy Mellon Absolute Return Equity Fund EUR R (Hedged) Share ClassEuro Sterling 111,587 100,932 01-Jul-20 The Bank of
New York Mellon 1,002Euro Sterling 11,615 10,538 15-Jul-20 The Bank of
New York Mellon 75Euro Sterling 26,862 24,315 15-Jul-20 The Bank of
New York Mellon 228Euro Sterling 25,003 22,491 15-Jul-20 The Bank of
New York Mellon 354Euro Sterling 6,937 6,208 15-Jul-20 The Bank of
New York Mellon 130Euro Sterling 4,622 4,141 15-Jul-20 The Bank of
New York Mellon 82Euro Sterling 87 78 15-Jul-20 The Bank of
New York Mellon 1Euro Sterling 335,774 299,698 15-Jul-20 The Bank of
New York Mellon 7,093
03613-1A.indd 59 19/08/2020 19:00

60
Schedule of investments – as at 30 June 2020
BNy MELLON ABSOLUTE RETURN EQUITy FUND
Forward foreign currency contracts cont’d.Unrealised
Gain/(Loss)Buy Sell Amount (B) Amount (S)Settle
Date Counterparty
BNy Mellon Absolute Return Equity Fund EUR R (Hedged) Share Class cont’d.Euro Sterling 64,744,432 57,720,947 15-Jul-20 The Bank of
New York Mellon 1,434,833Sterling Euro 8,621 9,407 15-Jul-20 The Bank of
New York Mellon 25
GBp 1,443,823
EUR 1,580,554
Euro Sterling 9,407 8,619 02-Jul-20 The Bank of New York Mellon (26)
Sterling Euro 21,381 23,602 15-Jul-20 The Bank of New York Mellon (184)
Sterling Euro 7,606 8,403 15-Jul-20 The Bank of New York Mellon (71)
Sterling Euro 114,788 127,609 15-Jul-20 The Bank of New York Mellon (1,806)
Sterling Euro 124,599 139,252 15-Jul-20 The Bank of New York Mellon (2,633)
Sterling Euro 28,038 31,330 15-Jul-20 The Bank of New York Mellon (587)
Sterling Euro 87,847 97,679 15-Jul-20 The Bank of New York Mellon (1,401)
Sterling Euro 87,938 98,156 15-Jul-20 The Bank of New York Mellon (1,746)
Sterling Euro 45,095 50,272 15-Jul-20 The Bank of New York Mellon (837)
Sterling Euro 50,059 56,213 15-Jul-20 The Bank of New York Mellon (1,302)
Sterling Euro 120,046 134,497 15-Jul-20 The Bank of New York Mellon (2,841)
Sterling Euro 100,950 111,587 15-Jul-20 The Bank of New York Mellon (1,005)
Sterling Euro 179,148 198,842 15-Jul-20 The Bank of New York Mellon (2,530)
Sterling Euro 52,558 58,170 15-Jul-20 The Bank of New York Mellon (591)
Sterling Euro 79,321 87,428 15-Jul-20 The Bank of New York Mellon (561)
GBp (18,121)
EUR (19,837)
Net GBp 1,425,702
Net EUR 1,560,717
BNy Mellon Absolute Return Equity Fund EUR R (Inc) (Hedged) Share ClassEuro Sterling 3,576,426 3,188,455 15-Jul-20 The Bank of
New York Mellon 79,259
GBp 79,259
EUR 86,765
Forward foreign currency contracts cont’d.Unrealised
Gain/(Loss)Buy Sell Amount (B) Amount (S)Settle
Date Counterparty
BNy Mellon Absolute Return Equity Fund EUR R (Inc) (Hedged) Share Class cont’d.Sterling Euro 10,757 12,020 15-Jul-20 The Bank of
New York Mellon (225)
GBp (225)
EUR (246)
Net GBp 79,034
Net EUR 86,519
BNy Mellon Absolute Return Equity Fund EUR T (Hedged) Share ClassEuro Sterling 20,456 18,502 01-Jul-20 The Bank of
New York Mellon 184Sterling Euro 6,620 7,225 02-Jul-20 The Bank of
New York Mellon 20Euro Sterling 1,384 1,252 15-Jul-20 The Bank of
New York Mellon 12Euro Sterling 1,235 1,102 15-Jul-20 The Bank of
New York Mellon 26Euro Sterling 1,389 1,237 15-Jul-20 The Bank of
New York Mellon 32Euro Sterling 1,298 1,164 15-Jul-20 The Bank of
New York Mellon 22Euro Sterling 875 784 15-Jul-20 The Bank of
New York Mellon 16Euro Sterling 37,008 33,283 15-Jul-20 The Bank of
New York Mellon 531Euro Sterling 872 780 15-Jul-20 The Bank of
New York Mellon 16Euro Sterling 1,103 992 15-Jul-20 The Bank of
New York Mellon 16Euro Sterling 47,079,119 41,971,969 15-Jul-20 The Bank of
New York Mellon 1,043,343Euro Sterling 457 414 15-Jul-20 The Bank of
New York Mellon 4Euro Sterling 885 802 15-Jul-20 The Bank of
New York Mellon 7Euro Sterling 1,663 1,509 15-Jul-20 The Bank of
New York Mellon 11Euro Sterling 758 685 15-Jul-20 The Bank of
New York Mellon 8Euro Sterling 336 303 15-Jul-20 The Bank of
New York Mellon 4Euro Sterling 32 29 15-Jul-20 The Bank of
New York Mellon 1Sterling Euro 74,850 81,680 15-Jul-20 The Bank of
New York Mellon 220
GBp 1,044,473
EUR 1,143,385
Sterling Euro 1,252 1,384 01-Jul-20 The Bank of New York Mellon (12)
Euro Sterling 81,680 74,837 02-Jul-20 The Bank of New York Mellon (223)
Euro Sterling 7,225 6,621 15-Jul-20 The Bank of New York Mellon (20)
03613-1A.indd 60 19/08/2020 19:00

61
Schedule of investments – as at 30 June 2020
BNy MELLON ABSOLUTE RETURN EQUITy FUND
Forward foreign currency contracts cont’d.Unrealised
Gain/(Loss)Buy Sell Amount (B) Amount (S)Settle
Date Counterparty
BNy Mellon Absolute Return Equity Fund EUR U (Hedged) Share Class cont’d.Euro Sterling 8,755 7,888 15-Jul-20 The Bank of
New York Mellon 111Euro Sterling 5,143 4,646 15-Jul-20 The Bank of
New York Mellon 52Sterling Euro 20,079 21,911 15-Jul-20 The Bank of
New York Mellon 59
GBp 1,555,975
EUR 1,703,327
Sterling Euro 223 246 01-Jul-20 The Bank of New York Mellon (2)
Euro Sterling 21,911 20,076 02-Jul-20 The Bank of New York Mellon (60)
Euro Sterling 1,279 1,172 15-Jul-20 The Bank of New York Mellon (3)
Sterling Euro 115,818 129,760 15-Jul-20 The Bank of New York Mellon (2,741)
Sterling Euro 16,007 17,975 15-Jul-20 The Bank of New York Mellon (416)
Sterling Euro 4,304 4,798 15-Jul-20 The Bank of New York Mellon (80)
Sterling Euro 4,480 5,000 15-Jul-20 The Bank of New York Mellon (89)
Sterling Euro 16,061 17,859 15-Jul-20 The Bank of New York Mellon (256)
Sterling Euro 24,347 27,206 15-Jul-20 The Bank of New York Mellon (510)
Sterling Euro 34,692 38,567 15-Jul-20 The Bank of New York Mellon (546)
Sterling Euro 13,498 14,912 15-Jul-20 The Bank of New York Mellon (127)
Sterling Euro 108,692 119,802 15-Jul-20 The Bank of New York Mellon (769)
Sterling Euro 5,799 6,418 15-Jul-20 The Bank of New York Mellon (65)
Sterling Euro 14,980 16,627 15-Jul-20 The Bank of New York Mellon (212)
Sterling Euro 12,280 13,573 15-Jul-20 The Bank of New York Mellon (122)
Sterling Euro 12,012 13,425 15-Jul-20 The Bank of New York Mellon (254)
Sterling Euro 6,947 7,668 15-Jul-20 The Bank of New York Mellon (60)
GBp (6,312)
EUR (6,910)
Net GBp 1,549,663
Net EUR 1,696,417
BNy Mellon Absolute Return Equity Fund EUR U (Inc) (Hedged) Share ClassEuro Sterling 17 15 15-Jul-20 The Bank of
New York Mellon -
GBp -
EUR -
Forward foreign currency contracts cont’d.Unrealised
Gain/(Loss)Buy Sell Amount (B) Amount (S)Settle
Date Counterparty
BNy Mellon Absolute Return Equity Fund EUR T (Hedged) Share Class cont’d.Sterling Euro 107,689 119,527 15-Jul-20 The Bank of
New York Mellon (1,521)Sterling Euro 18,506 20,456 15-Jul-20 The Bank of
New York Mellon (184)Sterling Euro 444,242 497,718 15-Jul-20 The Bank of
New York Mellon (10,513)Sterling Euro 73,230 82,233 15-Jul-20 The Bank of
New York Mellon (1,904)Sterling Euro 37,847 42,191 15-Jul-20 The Bank of
New York Mellon (703)Sterling Euro 69,983 78,115 15-Jul-20 The Bank of
New York Mellon (1,389)Sterling Euro 26,432 29,390 15-Jul-20 The Bank of
New York Mellon (421)Sterling Euro 31,232 34,899 15-Jul-20 The Bank of
New York Mellon (654)Sterling Euro 32,140 35,920 15-Jul-20 The Bank of
New York Mellon (679)Sterling Euro 179,668 199,736 15-Jul-20 The Bank of
New York Mellon (2,827)Sterling Euro 11,124 12,290 15-Jul-20 The Bank of
New York Mellon (104)Sterling Euro 1,030 1,137 15-Jul-20 The Bank of
New York Mellon (9)Sterling Euro 214,549 237,456 15-Jul-20 The Bank of
New York Mellon (2,411)Sterling Euro 13,784 15,193 15-Jul-20 The Bank of
New York Mellon (98)
GBp (23,672)
EUR (25,914)
Net GBp 1,020,801
Net EUR 1,117,471
BNy Mellon Absolute Return Equity Fund EUR U (Hedged) Share ClassEuro Sterling 13,573 12,277 01-Jul-20 The Bank of
New York Mellon 122Sterling Euro 1,172 1,279 02-Jul-20 The Bank of
New York Mellon 3Euro Sterling 5,258 4,729 15-Jul-20 The Bank of
New York Mellon 74Euro Sterling 1,797 1,608 15-Jul-20 The Bank of
New York Mellon 34Euro Sterling 1,274 1,140 15-Jul-20 The Bank of
New York Mellon 24Euro Sterling 10,114 9,061 15-Jul-20 The Bank of
New York Mellon 180Euro Sterling 31,701 28,437 15-Jul-20 The Bank of
New York Mellon 528Euro Sterling 1,728 1,539 15-Jul-20 The Bank of
New York Mellon 40Euro Sterling 10,074 8,991 15-Jul-20 The Bank of
New York Mellon 213Euro Sterling 70,145,669 62,536,257 15-Jul-20 The Bank of
New York Mellon 1,554,533Euro Sterling 246 223 15-Jul-20 The Bank of
New York Mellon 2
03613-1A.indd 61 19/08/2020 19:00

62
Schedule of investments – as at 30 June 2020
BNy MELLON ABSOLUTE RETURN EQUITy FUND
Forward foreign currency contracts cont’d.Unrealised
Gain/(Loss)Buy Sell Amount (B) Amount (S)Settle
Date Counterparty
BNy Mellon Absolute Return Equity Fund USD R (Hedged) Share ClassSterling US dollar 19 23 02-Jul-20 The Bank of
New York Mellon - US dollar Sterling 23 19 15-Jul-20 The Bank of
New York Mellon - US dollar Sterling 5 4 15-Jul-20 The Bank of
New York Mellon - US dollar Sterling 21 17 15-Jul-20 The Bank of
New York Mellon - US dollar Sterling 2,266 1,830 15-Jul-20 The Bank of
New York Mellon 17US dollar Sterling 3 2 15-Jul-20 The Bank of
New York Mellon - US dollar Sterling 21 17 15-Jul-20 The Bank of
New York Mellon 1US dollar Sterling 93 74 15-Jul-20 The Bank of
New York Mellon 3US dollar Sterling 63 49 15-Jul-20 The Bank of
New York Mellon 2US dollar Sterling 6,531,146 5,127,551 15-Jul-20 The Bank of
New York Mellon 194,627
GBp 194,650
USD 238,845
Sterling US dollar 20,709 25,926 15-Jul-20 The Bank of New York Mellon (418)
Sterling US dollar 90 115 15-Jul-20 The Bank of New York Mellon (3)
Sterling US dollar 25 32 15-Jul-20 The Bank of New York Mellon (1)
Sterling US dollar 16,403 20,746 15-Jul-20 The Bank of New York Mellon (503)
GBp (925)
USD (1,135)
Net GBp 193,725
Net USD 237,710
BNy Mellon Absolute Return Equity Fund USD T (Hedged) Share ClassUS dollar Sterling 632,374 496,472 15-Jul-20 The Bank of
New York Mellon 18,845
GBp 18,845
USD 23,124
Forward foreign currency contracts cont’d.Unrealised
Gain/(Loss)Buy Sell Amount (B) Amount (S)Settle
Date Counterparty
BNy Mellon Absolute Return Equity Fund USD U (Hedged) Share ClassUS dollar Sterling 32,175 25,495 15-Jul-20 The Bank of
New York Mellon 724US dollar Sterling 2,343,653 1,839,983 15-Jul-20 The Bank of
New York Mellon 69,840
GBp 70,564
USD 86,586
Sterling US dollar 69,148 85,635 15-Jul-20 The Bank of New York Mellon (635)
GBp (635)
USD (779)
Net GBp 69,929
Net USD 85,807
03613-1A.indd 62 19/08/2020 19:00
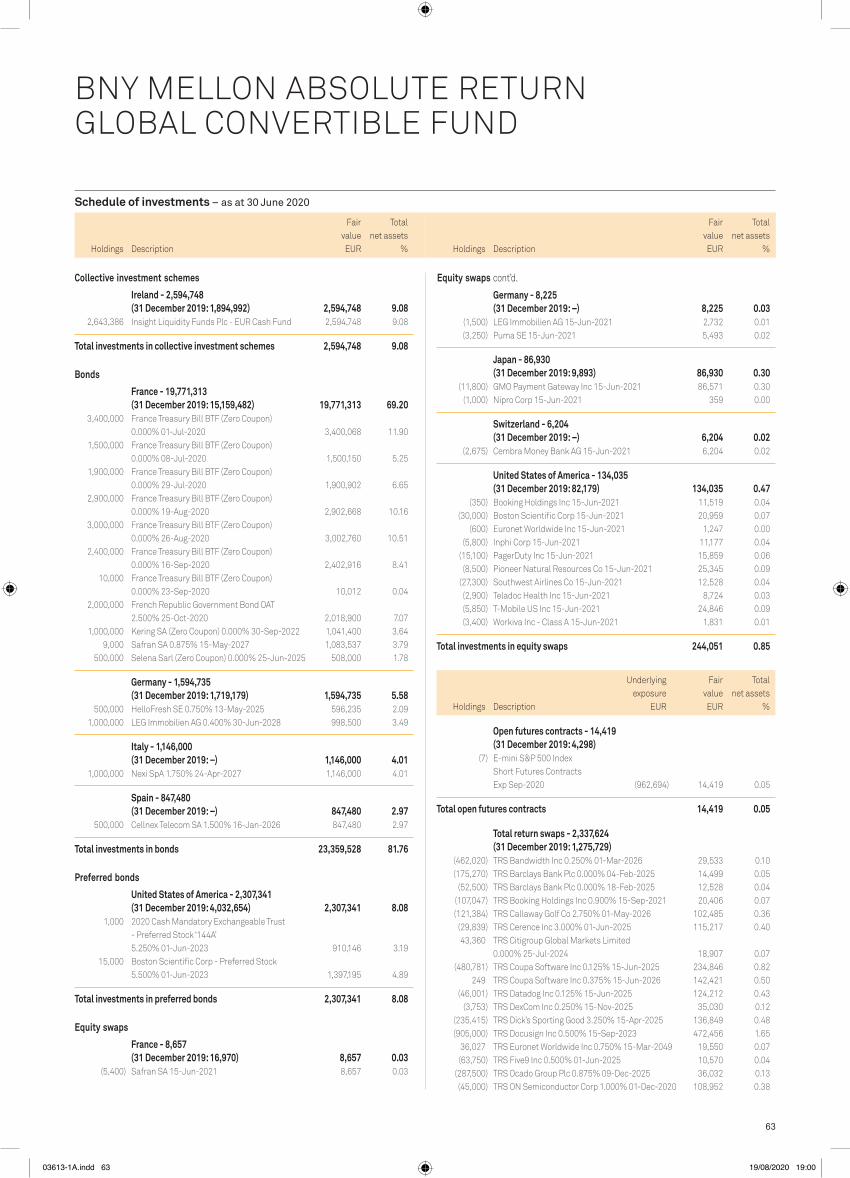
63
Schedule of investments – as at 30 June 2020
Holdings Description
Fair value
Total net assets
% Holdings Description
Fair value
Total net assets
%
3. BNy MELLON ABSOLUTE RETURN GLOBAL CONVERTIBLE FUND
BNY MELLON ABSOLUTE RETURN GLOBAL CONVERTIBLE FUND
Collective investment schemes
Ireland - 2,594,748 (31 December 2019: 1,894,992) 2,594,748 9.08
2,643,386 Insight Liquidity Funds Plc - EUR Cash Fund 2,594,748 9.08
Total investments in collective investment schemes 2,594,748 9.08
Bonds
France - 19,771,313 (31 December 2019: 15,159,482) 19,771,313 69.20
3,400,000 France Treasury Bill BTF (Zero Coupon) 0.000% 01-Jul-2020 3,400,068 11.90
1,500,000 France Treasury Bill BTF (Zero Coupon) 0.000% 08-Jul-2020 1,500,150 5.25
1,900,000 France Treasury Bill BTF (Zero Coupon) 0.000% 29-Jul-2020 1,900,902 6.65
2,900,000 France Treasury Bill BTF (Zero Coupon) 0.000% 19-Aug-2020 2,902,668 10.16
3,000,000 France Treasury Bill BTF (Zero Coupon) 0.000% 26-Aug-2020 3,002,760 10.51
2,400,000 France Treasury Bill BTF (Zero Coupon) 0.000% 16-Sep-2020 2,402,916 8.41
10,000 France Treasury Bill BTF (Zero Coupon) 0.000% 23-Sep-2020 10,012 0.04
2,000,000 French Republic Government Bond OAT 2.500% 25-Oct-2020 2,018,900 7.07
1,000,000 Kering SA (Zero Coupon) 0.000% 30-Sep-2022 1,041,400 3.64 9,000 Safran SA 0.875% 15-May-2027 1,083,537 3.79 500,000 Selena Sarl (Zero Coupon) 0.000% 25-Jun-2025 508,000 1.78
Germany - 1,594,735 (31 December 2019: 1,719,179) 1,594,735 5.58
500,000 HelloFresh SE 0.750% 13-May-2025 596,235 2.09 1,000,000 LEG Immobilien AG 0.400% 30-Jun-2028 998,500 3.49
Italy - 1,146,000 (31 December 2019: –) 1,146,000 4.01
1,000,000 Nexi SpA 1.750% 24-Apr-2027 1,146,000 4.01
Spain - 847,480 (31 December 2019: –) 847,480 2.97
500,000 Cellnex Telecom SA 1.500% 16-Jan-2026 847,480 2.97
Total investments in bonds 23,359,528 81.76
preferred bonds
United States of America - 2,307,341 (31 December 2019: 4,032,654) 2,307,341 8.08
1,000 2020 Cash Mandatory Exchangeable Trust - Preferred Stock ‘144A’ 5.250% 01-Jun-2023 910,146 3.19
15,000 Boston Scientific Corp - Preferred Stock 5.500% 01-Jun-2023 1,397,195 4.89
Total investments in preferred bonds 2,307,341 8.08
Equity swaps
France - 8,657 (31 December 2019: 16,970) 8,657 0.03
(5,400) Safran SA 15-Jun-2021 8,657 0.03
Germany - 8,225 (31 December 2019: –) 8,225 0.03
(1,500) LEG Immobilien AG 15-Jun-2021 2,732 0.01 (3,250) Puma SE 15-Jun-2021 5,493 0.02
Japan - 86,930 (31 December 2019: 9,893) 86,930 0.30
(11,800) GMO Payment Gateway Inc 15-Jun-2021 86,571 0.30 (1,000) Nipro Corp 15-Jun-2021 359 0.00
Switzerland - 6,204 (31 December 2019: –) 6,204 0.02
(2,675) Cembra Money Bank AG 15-Jun-2021 6,204 0.02
United States of America - 134,035 (31 December 2019: 82,179) 134,035 0.47
(350) Booking Holdings Inc 15-Jun-2021 11,519 0.04 (30,000) Boston Scientific Corp 15-Jun-2021 20,959 0.07 (600) Euronet Worldwide Inc 15-Jun-2021 1,247 0.00 (5,800) Inphi Corp 15-Jun-2021 11,177 0.04 (15,100) PagerDuty Inc 15-Jun-2021 15,859 0.06 (8,500) Pioneer Natural Resources Co 15-Jun-2021 25,345 0.09 (27,300) Southwest Airlines Co 15-Jun-2021 12,528 0.04 (2,900) Teladoc Health Inc 15-Jun-2021 8,724 0.03 (5,850) T-Mobile US Inc 15-Jun-2021 24,846 0.09 (3,400) Workiva Inc - Class A 15-Jun-2021 1,831 0.01
Total investments in equity swaps 244,051 0.85
Holdings Description
Underlying exposure
EUR
Fair value
EUR
Total net assets
%
Open futures contracts - 14,419 (31 December 2019: 4,298)
(7) E-mini S&P 500 Index Short Futures Contracts Exp Sep-2020 (962,694) 14,419 0.05
Total open futures contracts 14,419 0.05
Total return swaps - 2,337,624 (31 December 2019: 1,275,729)
(462,020) TRS Bandwidth Inc 0.250% 01-Mar-2026 29,533 0.10 (175,270) TRS Barclays Bank Plc 0.000% 04-Feb-2025 14,499 0.05 (52,500) TRS Barclays Bank Plc 0.000% 18-Feb-2025 12,528 0.04 (107,047) TRS Booking Holdings Inc 0.900% 15-Sep-2021 20,406 0.07 (121,384) TRS Callaway Golf Co 2.750% 01-May-2026 102,485 0.36 (29,839) TRS Cerence Inc 3.000% 01-Jun-2025 115,217 0.40 43,360 TRS Citigroup Global Markets Limited
0.000% 25-Jul-2024 18,907 0.07 (480,781) TRS Coupa Software Inc 0.125% 15-Jun-2025 234,846 0.82 249 TRS Coupa Software Inc 0.375% 15-Jun-2026 142,421 0.50 (46,001) TRS Datadog Inc 0.125% 15-Jun-2025 124,212 0.43 (3,753) TRS DexCom Inc 0.250% 15-Nov-2025 35,030 0.12 (235,415) TRS Dick’s Sporting Good 3.250% 15-Apr-2025 136,849 0.48 (905,000) TRS Docusign Inc 0.500% 15-Sep-2023 472,456 1.65 36,027 TRS Euronet Worldwide Inc 0.750% 15-Mar-2049 19,550 0.07 (63,750) TRS Five9 Inc 0.500% 01-Jun-2025 10,570 0.04 (287,500) TRS Ocado Group Plc 0.875% 09-Dec-2025 36,032 0.13 (45,000) TRS ON Semiconductor Corp 1.000% 01-Dec-2020 108,952 0.38
Equity swaps cont’d.
EUR EUR
03613-1A.indd 63 19/08/2020 19:00

64
Schedule of investments – as at 30 June 2020
Holdings Description
Fair value
Total net assets
% Holdings Description
Fair value
Total net assets
%
BNy MELLON ABSOLUTE RETURN GLOBAL CONVERTIBLE FUND
(2,500) Splunk Inc 15-Jun-2021 (11,704) (0.04) (9,500) Square Inc 15-Jun-2021 (59,740) (0.21) (14,900) Teradyne Inc 15-Jun-2021 (65,183) (0.23) (7,900) Varonis Systems Inc 15-Jun-2021 (6,188) (0.02) (1,400) Visa Inc - Class A 15-Jun-2021 (2,586) (0.01) (11,000) Winnebago Industries Inc 15-Jun-2021 (84,152) (0.29) (3,000) Zscaler Inc 15-Jun-2021 (7,893) (0.03)
Total investments in equity swaps (1,875,470) (6.56)
Holdings Description
Underlying exposure
EUR
Fair value
EUR
Total net assets
%
Open futures contracts - (10,347) (31 December 2019: –)
(31) U.S. 5 Year Treasury Note Short Futures Contracts Exp Sep-2020 (3,469,519) (10,347) (0.04)
Total open futures contracts (10,347) (0.04)
Total return swaps - (127,150) (31 December 2019: (70,096))
19,500 TRS Cembra Money Bank AG 0.000% 09-Jul-2026 (10,804) (0.04) (63,125,000) TRS GMO Internet Inc 0.000% 19-Jun-2023 (58,896) (0.20) (227,156) TRS Inphi Corp 0.750% 15-Apr-2025 (19,655) (0.07) 425,000 TRS Nipro Corporation 0.000% 29-Jan-2021 (932) (0.00) (30,000) TRS Pagerduty Inc 1.250% 01-Jul-2025 (33,378) (0.12) (109,930) TRS Teladoc Health Inc 1.250% 01-Jun-2027 (61) (0.00) 36,353 TRS Workiva Inc 1.125% 15-Aug-2026 (3,424) (0.01)
Total total return swaps (127,150) (0.44)
Unrealised loss on forward foreign currency contracts - (4,594) (see below) (31 December 2019: (39,971)) (4,594) (0.01)
Total financial liabilities at fair value through profit or loss (2,017,561) (7.05)
Net current liabilities (307,204) (1.08)
Total net assets 28,570,632 100.00
The counterparty for equity swaps is BNp paribas. The counterparty for futures contracts is Goldman Sachs. The counterparty for total return swaps is BNp paribas.
Analysis of portfolio % of Total Assets
Transferable securities and money market instruments admitted to official stock exchange listing or traded on a regulated market 82.37Financial derivative instruments dealt in on a regulated market 0.04oTC financial derivative instruments 7.63other current assets 9.96
Total assets 100.00
(207,730) TRS Pioneer Natural Resources Co 0.250% 15-May-2025 61,816 0.22
(118,750) TRS Sea Ltd 2.375% 01-Dec-2025 241,830 0.85 (143,500) TRS Sika AG 0.150% 05-Jun-2025 28,183 0.10 (232,649) TRS Snap-on Inc 0.250% 01-May-2025 46,500 0.16 (271,251) TRS Southwest Airlines Co 1.250% 01-May-2025 33,641 0.12 (51,785) TRS Splunk Inc 1.125% 15-Jun-2027 16,528 0.06 (410,000) TRS Square Inc 0.500% 15-May-2023 71,034 0.25 (770,558) TRS Teradyne Inc 1.250% 15-Dec-2023 64,235 0.23 (155,260) TRS Varonis System Inc 1.250% 15-Aug-2025 12,386 0.04 (88,750) TRS Winnebago Industries 1.500% 01-Apr-2025 125,723 0.44 (25,000) TRS Zscaler Inc 0.125% 01-Jul-2025 1,255 0.00
Total total return swaps 2,337,624 8.18 Unrealised gain on forward foreign currency contracts - 37,686 (see below) (31 December 2019: 50,991) 37,686 0.13
Total financial assets at fair value through profit or loss 30,895,397 108.13
Equity swaps
Cayman Islands - (230,381) (31 December 2019: (39,990)) (230,381) (0.80)
(71,000) Longfor Group Holdings Ltd ‘144A’ 15-Jun-2021 (27,519) (0.09) (8,500) Sea Ltd ADR 15-Jun-2021 (202,862) (0.71)
Germany - (44,955) (31 December 2019: (55,917)) (44,955) (0.16)
(5,400) HelloFresh SE 15-Jun-2021 (44,955) (0.16)
Italy - (8,513) (31 December 2019: –) (8,513) (0.03)
(30,800) Nexi SpA ‘144A’ 15-Jun-2021 (8,513) (0.03)
Spain - (39,215) (31 December 2019: (113,696)) (39,215) (0.14)
(11,500) Cellnex Telecom SA ‘144A’ 15-Jun-2021 (39,215) (0.14)
Switzerland - (10,505) (31 December 2019: (91,431)) (10,505) (0.04)
(2,100) Sika AG 15-Jun-2021 (10,505) (0.04)
United Kingdom - (23,392) (31 December 2019: –) (23,392) (0.08)
(42,000) Ocado Group Plc 15-Jun-2021 (23,392) (0.08)
United States of America - (1,518,509) (31 December 2019: (633,346)) (1,518,509) (5.31)
(9,300) Bandwidth Inc - Class A 15-Jun-2021 (25,123) (0.09) (42,600) Callaway Golf Co 15-Jun-2021 (64,270) (0.22) (9,300) Cerence Inc 15-Jun-2021 (80,287) (0.28) (6,500) Coupa Software Inc 15-Jun-2021 (305,340) (1.07) (6,800) Datadog Inc 15-Jun-2021 (95,483) (0.33) (1,440) DexCom Inc 15-Jun-2021 (29,947) (0.10) (21,200) Dick’s Sporting Goods Inc 15-Jun-2021 (95,763) (0.34) (12,100) DocuSign Inc - Class A 15-Jun-2021 (421,534) (1.48) (4,700) Five9 Inc 15-Jun-2021 (8,806) (0.03) (2,800) Microsoft Corp 15-Jun-2021 (46,068) (0.16) (32,000) ON Semiconductor Corp 15-Jun-2021 (76,090) (0.27) (33,500) Snap Inc 15-Jun-2021 (32,352) (0.11)
Total return swaps cont’d. Equity swaps cont’d.
United States of America cont’d.
EUR EUR
03613-1A.indd 64 19/08/2020 19:00

65
Schedule of investments – as at 30 June 2020
BNy MELLON ABSOLUTE RETURN GLOBAL CONVERTIBLE FUND
Forward foreign currency contracts cont’d.Unrealised
Gain/(Loss)Buy Sell Amount (B) Amount (S)Settle
Date Counterparty
BNy Mellon Absolute Return Global Convertible Fund USD U (Acc) (Hedged) Share ClassUS dollar Euro 150,717 132,714 15-Jul-20 The Bank of
New York Mellon 1,395US dollar Euro 170,000 151,025 15-Jul-20 The Bank of
New York Mellon 242
EUR 1,637
USD 1,839
US dollar Euro 485,000 432,686 15-Jul-20 The Bank of New York Mellon (1,131)
EUR (1,131)
USD (1,271)
Net EUR 506
Net USD 568
Forward foreign currency contracts cont’d.Unrealised
Gain/(Loss)Buy Sell Amount (B) Amount (S)Settle
Date Counterparty
BNy Mellon Absolute Return Global Convertible FundEuro US dollar 2,750,000 3,077,339 09-Jul-20 BNP Paribas 11,383
EUR 11,383
BNy Mellon Absolute Return Global Convertible Fund Sterling F (Acc) (Hedged) Share ClassSterling Euro 101,686 113,806 15-Jul-20 The Bank of
New York Mellon (1,680)
EUR (1,680)
GBp (1,523)
BNy Mellon Absolute Return Global Convertible Fund Sterling U (Acc) (Hedged) Share ClassEuro Sterling 16 15 15-Jul-20 The Bank of
New York Mellon - Euro Sterling 114,302 103,270 15-Jul-20 The Bank of
New York Mellon 430
EUR 430
GBp 390
Sterling Euro 103,285 115,595 15-Jul-20 The Bank of New York Mellon (1,707)
EUR (1,707)
GBp (1,548)
Net EUR (1,277)
Net GBp (1,158)
BNy Mellon Absolute Return Global Convertible Fund USD F (Acc) (Hedged) Share ClassUS dollar Euro 2,618,357 2,305,595 15-Jul-20 The Bank of
New York Mellon 24,236
EUR 24,236
USD 27,229
Euro US dollar 10,316 11,679 15-Jul-20 The Bank of New York Mellon (76)
EUR (76)
USD (85)
Net EUR 24,160
Net USD 27,144
03613-1A.indd 65 19/08/2020 19:00

66
Schedule of investments – as at 30 June 2020
Holdings Description
Fair value
Total net assets
% Holdings Description
Fair value
Total net assets
%
Equities
Basic Materials - 390,738 (31 December 2019: 474,679) 390,738 5.33
7,600 Birla Carbon Thailand PCL NVDR 9,744 0.13 64,763 Chevron Lubricants Lanka Plc 23,443 0.32 141,100 Diamond Building Products PCL NVDR 24,766 0.34 4,700 Dowa Holdings Co Ltd 142,649 1.95 523 KPX Chemical Co Ltd 20,859 0.28 16,900 Sakata INX Corp 161,408 2.20 575,000 Waskita Beton Precast Tbk PT 7,869 0.11
Communication Services - 1,082,680 (31 December 2019: 1,309,008) 1,082,680 14.76
80,100 ABS-CBN Holdings Corp Receipt 22,957 0.31 102,500 APT Satellite Holdings Ltd 26,385 0.36 3,700 Atrae Inc 108,091 1.47 510 Baidu Inc ADR 61,896 0.85 2,000 China Mobile Ltd 13,484 0.18 84,000 China Telecom Corp Ltd ‘H’ 23,411 0.32 72,000 China Unicom Hong Kong Ltd 38,973 0.53 760,425 Dialog Axiata Plc 47,782 0.65 158,000 Hutchison Telecommunications Hong Kong
Holdings Ltd 24,872 0.34 8,100 Itokuro Inc 100,555 1.37 3,571 KT Skylife Co Ltd 23,557 0.32 2,521 LG HelloVision Co Ltd 8,399 0.12 153,300 Link Net Tbk PT 24,200 0.33 195 NAVER Corp 43,244 0.59 12,000 Singapore Telecommunications Ltd 21,170 0.29 88 SK Telecom Co Ltd 15,418 0.21 26,649 SmarTone Telecommunications Holdings Ltd 14,201 0.19 1,900 Tencent Holdings Ltd 122,211 1.67 20,200 Vector Inc 163,396 2.23 17,700 Vision Inc/Tokyo Japan 111,467 1.52 200 Weibo Corp ADR 6,659 0.09 311,800 XL Axiata Tbk PT 60,352 0.82
Consumer Discretionary - 829,680 (31 December 2019: 1,242,770) 829,680 11.31
220 Alibaba Group Holding Ltd ADR 47,299 0.64 2,600 Arata Corp 117,041 1.60 100,000 China Maple Leaf Educational Systems Ltd 30,580 0.42 22,000 Dongfeng Motor Group Co Ltd ‘H’ 13,129 0.18 400 Fila Holdings Corp 11,689 0.16 106 Hyundai Mobis Co Ltd 16,964 0.23 13,500 Lii Hen Industries BHD 7,672 0.10 2,000 momo.com Inc 48,772 0.66 6,100 Nifco Inc/Japan 129,966 1.77 20,000 Oishi Group PCL NVDR 25,479 0.35 134,000 Qingling Motors Co Ltd ‘H’ 24,466 0.33 5,600 RE&S Holdings Ltd 363 0.00 11,100 Resorttrust Inc 143,566 1.96 1,200 Saha Pathanapibul PCL NVDR 2,334 0.03 87,400 Somboon Advance Technology PCL NVDR 30,540 0.42 86,200 Straco Corp Ltd 31,309 0.43 800 Tomy Co Ltd 6,319 0.09 26,300 Yonex Co Ltd 142,192 1.94
Consumer Staples - 663,705 (31 December 2019: 489,254) 663,705 9.05
2,500 Ain Holdings Inc 163,820 2.23 24,800 Bumitama Agri Ltd 7,765 0.11 5,000 Carabao Group PCL NVDR 16,784 0.23
24,000 China Feihe Ltd ‘144A’ 48,030 0.65 3,000 Chlitina Holding Ltd 22,039 0.30 27,000 Ginebra San Miguel Inc 16,785 0.23 11,500 Hengan International Group Co Ltd 90,033 1.23 1,187,700 Industri Jamu Dan Farmasi Sido Muncul Tbk PT 101,227 1.38 250 KT&G Corp 16,264 0.22 1,000 NeoPharm Co Ltd 27,331 0.37 400 Orion Corp/Republic of Korea 44,478 0.61 33,700 Sappe PCL NVDR 20,771 0.28 30,000 Tingyi Cayman Islands Holding Corp 46,683 0.64 100,000 Tsit Wing International Holdings Ltd 13,484 0.18 56,700 Uni-Charm Indonesia Tbk PT 5,527 0.08 30,000 Want Want China Holdings Ltd 22,684 0.31
Energy - 47,251 (31 December 2019: 55,954) 47,251 0.64
20,000 China Shenhua Energy Co Ltd ‘H’ 31,303 0.42 48,000 PetroChina Co Ltd ‘H’ 15,948 0.22
Financials - 653,871 (31 December 2019: 741,308) 653,871 8.92
2,800 Anicom Holdings Inc 119,027 1.62 770,600 Bank OCBC Nisp Tbk PT 39,919 0.55 280,671 Bank Permata Tbk PT 24,904 0.34 7,600 Dah Sing Financial Holdings Ltd 21,304 0.29 6,200 eGuarantee Inc 147,001 2.01 138,000 First Pacific Co Ltd 26,175 0.36 334,400 GMA Holdings Inc Receipt 30,940 0.42 500 Hana Financial Group Inc 11,213 0.15 34,917 Metropolitan Bank & Trust Co 25,912 0.35 716,200 Panin Financial Tbk PT 9,200 0.13 37,370 Philippine National Bank 15,169 0.21 29,022 Rizal Commercial Banking Corp 9,838 0.13 30,000 Sun Hung Kai & Co Ltd 11,729 0.16 4,300 Zenkoku Hosho Co Ltd 161,540 2.20
Health Care - 142,992 (31 December 2019: 77,399) 142,992 1.95
20,000 China Medical System Holdings Ltd 23,548 0.32 27,000 Consun Pharmaceutical Group Ltd 10,957 0.15 20,000 Mega Lifesciences PCL NVDR 23,942 0.32 6,100 Prodia Widyahusada Tbk PT 1,337 0.02 20,000 Rajthanee Hospital PCL NVDR 13,751 0.19 81,000 Tianjin ZhongXin Pharmaceutical Group Corp Ltd 69,457 0.95
Industrials - 803,036 (31 December 2019: 976,691) 803,036 10.95
5,000 A-Living Services Co Ltd ‘H’ ‘144A’ 25,209 0.34 809,600 Arwana Citramulia Tbk PT 21,707 0.30 116,800 Astra Graphia Tbk PT 5,580 0.08 1,800 BayCurrent Consulting Inc 149,443 2.04 15,600 Hong Leong Industries Bhd 29,161 0.40 59,900 HRnetgroup Ltd 21,114 0.29 5,100 Insource Co Ltd 125,086 1.70 197,600 LT Group Inc 31,687 0.43 16,200 Penta-Ocean Construction Co Ltd 87,285 1.19 20,000 Precision Tsugami China Corp Ltd 15,974 0.22 20,500 Sembcorp Industries Ltd 25,749 0.35 757,900 Surya Semesta Internusa Tbk PT 20,639 0.28 6,100 Takeuchi Manufacturing Co Ltd 101,403 1.38 36,000 TK Group Holdings Ltd 10,312 0.14
4 – BNy MELLON ASIA RISING STARS
BNY MELLON ASIA RISING STARS FUND
Equities cont’d.
Consumer Staples cont’d.
USDUSD
03613-1A.indd 66 19/08/2020 19:00

67
Schedule of investments – as at 30 June 2020
Holdings Description
Fair value
Total net assets
% Holdings Description
Fair value
Total net assets
%
BNy MELLON ASIA RISING STARS FUND
390,000 Total Bangun Persada Tbk PT 8,982 0.12 4,900 Totetsu Kogyo Co Ltd 123,705 1.69
Information Technology - 1,191,845 (31 December 2019: 1,208,535) 1,191,845 16.25
4,900 Anritsu Corp 116,383 1.59 2,100 BrainPad Inc 89,319 1.22 2,000 Catcher Technology Co Ltd 15,066 0.21 4,000 Hon Hai Precision Industry Co Ltd 11,707 0.16 13,600 MCJ Co Ltd 108,179 1.47 15,200 Osaki Electric Co Ltd 71,316 0.97 4,400 RS Technologies Co Ltd 140,895 1.92 440 Samsung Electronics Co Ltd 19,332 0.26 6,600 Sanken Electric Co Ltd 130,113 1.77 2,000 Taiwan Semiconductor Manufacturing Co Ltd 21,234 0.29 600 Taiwan Semiconductor Manufacturing Co Ltd ADR 33,843 0.46 1,600 TeamSpirit Inc 39,606 0.54 11,000 TechMatrix Corp 190,821 2.60 5,300 Venture Corp Ltd 61,354 0.84 28,000 Wacom Co Ltd 142,677 1.95
Real Estate - 187,052 (31 December 2019: 213,475) 187,052 2.55
109,200 APAC Realty Ltd 29,894 0.41 1,037,400 Jaya Real Property Tbk PT 29,702 0.40 1,135,400 Puradelta Lestari Tbk PT 13,710 0.19 8,000 Sichuan Languang Justbon Services Group Co Ltd ‘H’ 51,148 0.70 205,200 Sinarmas Land Ltd 26,435 0.36 7,000 United Industrial Corp Ltd 11,047 0.15 112,300 Yoma Strategic Holdings Ltd 25,116 0.34
Utilities - 180,254 (31 December 2019: 241,412) 180,254 2.46
28,000 Kunlun Energy Co Ltd 18,173 0.25 3,200 Nippon Gas Co Ltd 137,813 1.88 53,814 Towngas China Co Ltd 24,268 0.33
Total investments in equities 6,173,104 84.17
participatory Notes (“p-Notes”)
Basic Materials - 99,739 (31 December 2019: 109,167) 99,739 1.36
725 Bayer CropScience Ltd P-Note 22-Nov-2021 57,284 0.78 2,365 Insecticides India Ltd P-Note 11-Jan-2021 13,891 0.19 25,366 NMDC Ltd P-Note 27-Jan-2021 27,364 0.37 94 Vinati Organics Ltd P-Note 06-Aug-2020 1,200 0.02
Communication Services - 13,216 (31 December 2019: 14,955) 13,216 0.18
14,621 GSPL Hathway Ltd P-Note 06-Jul-2020 13,216 0.18
Conglomerate - 10,595 (31 December 2019: –) 10,595 0.14
1,221 Hinduja Ltd P-Note 03-Jan-2025 10,595 0.14
Consumer Discretionary - 45,997 (31 December 2019: 62,283) 45,997 0.63
3,000 Future Lifestyle Fashions Limited P-Note 05-Feb-2024 5,939 0.08 5,000 ITC Limited P-Note 06-Aug-2021 12,928 0.18 12,000 Somany Home Innovation Limited P-Note 27,130 0.37
Consumer, Cyclical - 10,985 (31 December 2019: 7,556) 10,985 0.15
15,739 HSIL Ltd P-Note 12-Oct-2021 10,985 0.15
Consumer, Non-cyclical - 9,567 (31 December 2019: 12,866) 9,567 0.13
1,890 Security and Intelligence SE P-Note 30-Jan-2023 9,567 0.13
Electrical Components - 37,747 (31 December 2019: 51,415) 37,747 0.51
10,009 Finolex Cables Ltd P-Note 27-May-2021 37,747 0.51
Energy - 23,470 (31 December 2019: 38,956) 23,470 0.32
30,000 Gujarat Mineral Development Corp Ltd P-Note 13-Aug-2020 15,863 0.22
6,128 Oil India Ltd P-Note 24-Jun-2021 7,607 0.10
Financials - 101,485 (31 December 2019: 195,012) 101,485 1.38
29,429 Bank of Baroda P-Note 25-Nov-2020 18,972 0.26 7,150 Bank of Baroda P-Note 08-Apr-2024 4,609 0.06 26,000 IDFC Ltd P-Note 21-May-2021 6,362 0.09 26,567 JM Financial Ltd P-Note 25-Jun-2021 24,666 0.33 374,992 South Indian Bank Ltd/The P-Note 22-Jan-2021 39,981 0.55 54,800 SREI Infrastructure Finance Ltd P-Note 05-Feb-2021 6,895 0.09
Health Care - 187,360 (31 December 2019: 170,317) 187,360 2.56
6,500 Eris Lifesciences Limited P-Note 03-Sep-2021 39,321 0.54 10,295 FDC Limited P-Note 06-Aug-2021 38,345 0.52 4,500 JB Chemicals & Pharmaceuticals Limited P-Note
20-Nov-2021 42,167 0.58 500 Pfizer Limited P-Note 20-Aug-2021 26,260 0.36 234 Sanofi India Ltd P-Note 09-Nov-2021 24,375 0.33 1,000 Zydus Wellness Limited P-Note 06-Aug-2021 16,892 0.23
Industrials - 49,274 (31 December 2019: 58,607) 49,274 0.67
30,385 Ircon International Ltd P-Note 15-Oct-2020 35,243 0.48 6,276 Transport Corp of India Ltd P-Note 28-Aug-2020 14,031 0.19
Information Technology - 2,717 (31 December 2019: 3,552) 2,717 0.04
14,500 Digicontent Limited P-Note 30-Jan-2023 262 0.01 249 Vindhya Telelinks Ltd P-Note 11-Feb-2021 2,455 0.03
Real Estate - 38,553 (31 December 2019: 96,186) 38,553 0.53
6,979 Mahindra Lifespace Developers Ltd P-Note 27-Nov-2023 19,635 0.27
35,400 Puravankara Ltd P-Note 07-Jun-2021 18,918 0.26
Telecommunication Services - 10,025 (31 December 2019: 11,726) 10,025 0.14
58,000 HT Media Ltd P-Note 30-Jan-2023 10,025 0.14
Textile & Textile products - 27,180 (31 December 2019: 29,805) 27,180 0.37
60,627 Vardhman Acrylics Ltd P-Note 13-Jan-2022 27,180 0.37
participatory Notes (“p-Notes”) cont’d.Equities cont’d.
Industrials cont’d.
USDUSD
03613-1A.indd 67 19/08/2020 19:00

68
Schedule of investments – as at 30 June 2020
Holdings Description
Fair value
Total net assets
% Holdings Description
Fair value
Total net assets
%
BNy MELLON ASIA RISING STARS FUND
Transport - 26,515 (31 December 2019: 32,951) 26,515 0.36
8,125 Rites Ltd P-Note 31-May-2021 26,515 0.36
Utilities - 14,692 (31 December 2019: 17,781) 14,692 0.20
50,594 SJVN Ltd P-Note 30-May-2022 14,692 0.20
Total investments in participatory notes 709,117 9.67 Unrealised gain on forward foreign currency contracts - 128 (see below) (31 December 2019: 11,466) 128 0.00
Total financial assets at fair value through profit or loss 6,882,349 93.84 Unrealised loss on forward foreign currency contracts - (8,289) (see below) (31 December 2019: –) (8,289) (0.11)
Total financial liabilities at fair value through profit or loss (8,289) (0.11)
Net current assets 459,696 6.27
Total net assets 7,333,756 100.00
Analysis of portfolio % of Total Assets
Transferable securities and money market instruments admitted to official stock exchange listing or traded on a regulated market 83.63Transferable securities and money market instruments other than those admitted to official stock exchange listing or traded on a regulated market 9.61oTC financial derivative instruments 0.00other current assets 6.76
Total assets 100.00
Forward foreign currency contractsUnrealised
Gain/(Loss)Buy Sell Amount (B) Amount (S)Settle
Date Counterparty
BNy Mellon Asia Rising Stars FundUS dollar Hong Kong dollar 2,707 21,001 02-Jul-20 The Bank of
New York Mellon (3)
USD (3)
BNy Mellon Asia Rising Stars Fund SGD H (Acc) (Hedged) Share ClassUS dollar Singapore dollar 37,498 52,214 15-Jul-20 The Bank of
New York Mellon 128
USD 128
SGD 179
Singapore dollar US dollar 37,803 27,121 15-Jul-20 The Bank of New York Mellon (65)
Singapore dollar US dollar 1,801,256 1,297,399 15-Jul-20 The Bank of New York Mellon (8,221)
USD 8,286
SGD 11,578
Net USD 8,158
Net SGD 11,399
participatory Notes (“p-Notes”) cont’d.
USD
03613-1A.indd 68 19/08/2020 19:00
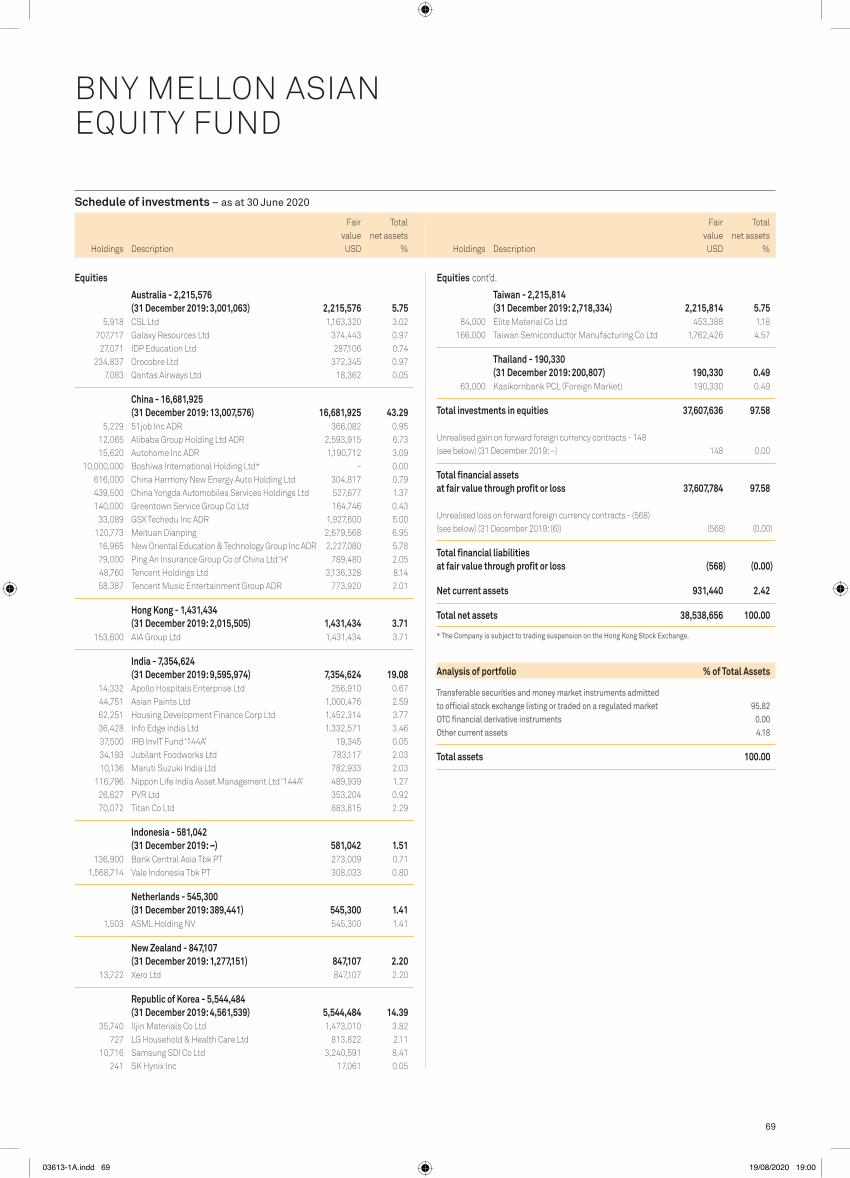
69
Schedule of investments – as at 30 June 2020
Holdings Description
Fair value
Total net assets
% Holdings Description
Fair value
Total net assets
%
Taiwan - 2,215,814 (31 December 2019: 2,718,334) 2,215,814 5.75
84,000 Elite Material Co Ltd 453,388 1.18 166,000 Taiwan Semiconductor Manufacturing Co Ltd 1,762,426 4.57
Thailand - 190,330 (31 December 2019: 200,807) 190,330 0.49
63,000 Kasikornbank PCL (Foreign Market) 190,330 0.49
Total investments in equities 37,607,636 97.58
Unrealised gain on forward foreign currency contracts - 148 (see below) (31 December 2019: –) 148 0.00
Total financial assets at fair value through profit or loss 37,607,784 97.58
Unrealised loss on forward foreign currency contracts - (568) (see below) (31 December 2019: (6)) (568) (0.00)
Total financial liabilities at fair value through profit or loss (568) (0.00)
Net current assets 931,440 2.42
Total net assets 38,538,656 100.00
* The Company is subject to trading suspension on the hong kong Stock Exchange.
Analysis of portfolio % of Total Assets
Transferable securities and money market instruments admitted to official stock exchange listing or traded on a regulated market 95.82oTC financial derivative instruments 0.00other current assets 4.18
Total assets 100.00
FUND 5 – BNy MELLON ASIAN EQUITy FUND
BNY MELLON ASIAN EQUITY FUND
Equities
Australia - 2,215,576 (31 December 2019: 3,001,063) 2,215,576 5.75
5,918 CSL Ltd 1,163,320 3.02 707,717 Galaxy Resources Ltd 374,443 0.97 27,071 IDP Education Ltd 287,106 0.74 234,837 Orocobre Ltd 372,345 0.97 7,083 Qantas Airways Ltd 18,362 0.05
China - 16,681,925 (31 December 2019: 13,007,576) 16,681,925 43.29
5,229 51job Inc ADR 366,082 0.95 12,065 Alibaba Group Holding Ltd ADR 2,593,915 6.73 15,620 Autohome Inc ADR 1,190,712 3.09 10,000,000 Boshiwa International Holding Ltd* - 0.00 616,000 China Harmony New Energy Auto Holding Ltd 304,817 0.79 439,500 China Yongda Automobiles Services Holdings Ltd 527,677 1.37 140,000 Greentown Service Group Co Ltd 164,746 0.43 33,089 GSX Techedu Inc ADR 1,927,600 5.00 120,773 Meituan Dianping 2,679,568 6.95 16,965 New Oriental Education & Technology Group Inc ADR 2,227,080 5.78 79,000 Ping An Insurance Group Co of China Ltd ‘H’ 789,480 2.05 48,760 Tencent Holdings Ltd 3,136,328 8.14 58,387 Tencent Music Entertainment Group ADR 773,920 2.01
Hong Kong - 1,431,434 (31 December 2019: 2,015,505) 1,431,434 3.71
153,600 AIA Group Ltd 1,431,434 3.71
India - 7,354,624 (31 December 2019: 9,595,974) 7,354,624 19.08
14,332 Apollo Hospitals Enterprise Ltd 256,910 0.67 44,751 Asian Paints Ltd 1,000,476 2.59 62,251 Housing Development Finance Corp Ltd 1,452,314 3.77 36,428 Info Edge India Ltd 1,332,571 3.46 37,500 IRB InvIT Fund ‘144A’ 19,345 0.05 34,193 Jubilant Foodworks Ltd 783,117 2.03 10,136 Maruti Suzuki India Ltd 782,933 2.03 116,796 Nippon Life India Asset Management Ltd ‘144A’ 489,939 1.27 26,627 PVR Ltd 353,204 0.92 70,072 Titan Co Ltd 883,815 2.29
Indonesia - 581,042 (31 December 2019: –) 581,042 1.51
136,900 Bank Central Asia Tbk PT 273,009 0.71 1,568,714 Vale Indonesia Tbk PT 308,033 0.80
Netherlands - 545,300 (31 December 2019: 389,441) 545,300 1.41
1,503 ASML Holding NV 545,300 1.41
New Zealand - 847,107 (31 December 2019: 1,277,151) 847,107 2.20
13,722 Xero Ltd 847,107 2.20
Republic of Korea - 5,544,484 (31 December 2019: 4,561,539) 5,544,484 14.39
35,740 Iljin Materials Co Ltd 1,473,010 3.82 727 LG Household & Health Care Ltd 813,822 2.11 10,716 Samsung SDI Co Ltd 3,240,591 8.41 241 SK Hynix Inc 17,061 0.05
Equities cont’d.
USDUSD
03613-1A.indd 69 19/08/2020 19:00

70
Schedule of investments – as at 30 June 2020
BNy MELLON ASIAN EQUITy FUND
Forward foreign currency contractsUnrealised
Gain/(Loss)Buy Sell Amount (B) Amount (S)Settle
Date Counterparty
BNy Mellon Asian Equity FundIndonesian rupiah US dollar 62,818,692 4,333 01-Jul-20 The Bank of
New York Mellon 64Indonesian rupiah US dollar 56,112,829 3,871 01-Jul-20 The Bank of
New York Mellon 57US dollar Euro 485,611 433,215 01-Jul-20 Barclays Bank PLC 21Hong Kong dollar US dollar 1,028,188 132,662 02-Jul-20 Citigroup Global
Markets Limited 6
USD 148
Australian dollar US dollar 63,517 43,695 01-Jul-20 UBS AG (193)Korean won US dollar 55,200,654 46,188 01-Jul-20 The Bank of
New York Mellon (296)Korean won US dollar 13,142,628 10,997 01-Jul-20 The Bank of
New York Mellon (71)Thai baht US dollar 90,348 2,931 01-Jul-20 The Bank of
New York Mellon (8)
USD (568)
Net USD (420)
03613-1A.indd 70 19/08/2020 19:00

71
Schedule of investments – as at 30 June 2020
Holdings Description
Fair value
Total net assets
% Holdings Description
Fair value
Total net assets
%
FUND 6 – BNy MELLON ASIAN INCOME FUND
BNY MELLON ASIAN INCOME FUND
Collective investment schemes
Republic of Korea - 1,076,297 (31 December 2019: 1,257,223) 1,076,297 3.65
113,315 Macquarie Korea Infrastructure Fund 1,076,297 3.65
Total investments in collective investment schemes 1,076,297 3.65
Equities
Australia - 3,867,619 (31 December 2019: 5,085,012) 3,867,619 13.10
137,073 Dexus (Units) (REIT) 864,178 2.93 342,814 Insurance Australia Group Ltd 1,353,584 4.58 93,510 Qantas Airways Ltd 242,411 0.82 205,652 Scentre Group (REIT) 304,943 1.03 215,231 Star Entertainment Grp Ltd/The 417,912 1.42 44,991 Suncorp Group Ltd 284,262 0.96 41,381 Transurban Group 400,329 1.36
China - 1,792,019 (31 December 2019: 908,131) 1,792,019 6.07
133,000 China Mobile Ltd 896,666 3.04 141,467 Jiangsu Expressway Co Ltd ‘H’ 165,834 0.56 73,000 Ping An Insurance Group Co of China Ltd ‘H’ 729,519 2.47
Hong Kong - 4,176,430 (31 December 2019: 4,037,420) 4,176,430 14.15
18,900 ASM Pacific Technology Ltd 198,387 0.67 118,500 CLP Holdings Ltd 1,160,138 3.93 17,096 Hong Kong Exchanges & Clearing Ltd 727,508 2.47 162,000 Link REIT (Units) (REIT) 1,323,680 4.48 146,977 Samsonite International SA ‘144A’ 148,018 0.50 157,600 Sands China Ltd 618,699 2.10
India - 657,663 (31 December 2019: 690,468) 657,663 2.23
254,908 ITC Ltd GDR 657,663 2.23
Indonesia - 402,935 (31 December 2019: 437,509) 402,935 1.37
1,884,100 Telekomunikasi Indonesia Persero Tbk PT 402,935 1.37
New Zealand - 1,839,914 (31 December 2019: 2,127,868) 1,839,914 6.23
141,895 Mercury NZ Ltd 425,497 1.44 198,713 Meridian Energy Ltd 617,191 2.09 186,094 SKYCITY Entertainment Group Ltd 293,765 0.99 172,594 Spark New Zealand Ltd 503,461 1.71
Republic of Korea - 2,634,771 (31 December 2019: 2,551,799) 2,634,771 8.93
59,426 Samsung Electronics Co Ltd - Preference 2,299,772 7.79 1,912 SK Telecom Co Ltd 334,999 1.14
Singapore - 6,722,126 (31 December 2019: 7,330,983) 6,722,126 22.77
204,200 ComfortDelGro Corp Ltd 212,640 0.72 84,100 DBS Group Holdings Ltd 1,252,246 4.24 532,900 Mapletree North Asia Commercial Trust
(Units) (REIT) 353,741 1.20 284,600 Parkway Life Real Estate Investment Trust
(Units) (REIT) 684,384 2.32
261,300 SATS Ltd 535,784 1.81 425,700 Singapore Technologies Engineering Ltd 1,003,887 3.40 279,200 Singapore Telecommunications Ltd 492,559 1.67 91,500 United Overseas Bank Ltd 1,324,450 4.49 74,500 Venture Corp Ltd 862,435 2.92
Taiwan - 3,508,168 (31 December 2019: 3,716,484) 3,508,168 11.88
107,000 Delta Electronics Inc 608,356 2.06 75,000 Elite Material Co Ltd 404,811 1.37 235,000 Taiwan Semiconductor Manufacturing Co Ltd 2,495,001 8.45
Thailand - 1,031,355 (31 December 2019: 1,315,548) 1,031,355 3.49
218,600 Bangkok Bank PCL (Foreign Market) 758,549 2.57 90,300 Kasikornbank PCL (Foreign Market) 272,806 0.92
United Kingdom - 762,777 (31 December 2019: 720,193) 762,777 2.58
37,810 BHP Group Plc 762,777 2.58
Total investments in equities 27,395,777 92.80 Unrealised gain on forward foreign currency contracts - 5 (see below) (31 December 2019: –) 5 0.00
Total financial assets at fair value through profit or loss 28,472,079 96.45 Unrealised loss on forward foreign currency contracts - (3) (see below) (31 December 2019: (43)) (3) (0.00)
Total financial liabilities at fair value through profit or loss (3) (0.00)
Net current assets 1,047,422 3.55
Total net assets 29,519,498 100.00
Analysis of portfolio % of Total Assets
Transferable securities and money market instruments admitted to official stock exchange listing or traded on a regulated market 95.93oTC financial derivative instruments 0.00other current assets 4.07
Total assets 100.00
Equities cont’d.
Singapore cont’d.
USDUSD
03613-1A.indd 71 19/08/2020 19:00

72
Schedule of investments – as at 30 June 2020
BNy MELLON ASIAN INCOME FUND
Forward foreign currency contractsUnrealised
Gain/(Loss)Buy Sell Amount (B) Amount (S)Settle
Date Counterparty
BNy Mellon Asian Income FundUS dollar Euro 13,252 11,822 01-Jul-20 Barclays Bank PLC - US dollar Singapore dollar 1,271 1,769 01-Jul-20 UBS AG 5
USD 5
US dollar Singapore dollar 48,628 67,950 02-Jul-20 State Street Bank (3)
USD (3)
Net USD 2
03613-1A.indd 72 19/08/2020 19:00

73
Schedule of investments – as at 30 June 2020
Holdings Description
Fair value
Total net assets
% Holdings Description
Fair value
Total net assets
%
Malls - 1,127,606 (31 December 2019: 2,420,201) 1,127,606 1.85
607,433 BR Malls Participacoes SA 1,127,606 1.85
Technology - 1,132,692 (31 December 2019: 2,408,896) 1,132,692 1.86
243,466 Linx SA 1,132,692 1.86
Utilities - 7,789,004 (31 December 2019: 14,580,286) 7,789,004 12.77
164,254 AES Tiete Energia SA 472,848 0.77 259,300 Cia Energetica de Sao Paulo - Preference 1,381,589 2.27 233,542 Cia Paranaense de Energia ADR 2,651,869 4.35 86,856 CPFL Energia SA 490,173 0.80 508,751 EDP - Energias do Brasil SA 1,633,437 2.68 67,634 Engie Brasil Energia SA 524,720 0.86 207,942 Light SA 634,368 1.04
Total investments in equities 59,679,782 97.86
Unrealised gain on forward foreign currency contracts - 7,152 (see below) (31 December 2019: 79,467) 7,152 0.01
Total financial assets at fair value through profit or loss 59,686,934 97.87
Unrealised loss on forward foreign currency contracts - (68,926) (see below) (31 December 2019: (867)) (68,926) (0.11)
Total financial liabilities at fair value through profit or loss (68,926) (0.11)
Net current assets 1,365,094 2.24
Total net assets 60,983,102 100.00
Analysis of portfolio % of Total Assets
Transferable securities and money market instruments admitted to official stock exchange listing or traded on a regulated market 93.83oTC financial derivative instruments 0.01other current assets 6.16
Total assets 100.00
BNY MELLON BRAZIL EQUITY FUND
FUND 7 – BNy MELLON BRAZIL EQUITy FUND
Equities
Basic Materials - 9,156,125 (31 December 2019: 15,291,086) 9,156,125 15.02
134,543 Gerdau SA - Preference 396,348 0.65 1,156,500 Gerdau SA ADR 3,417,457 5.61 955,431 Usinas Siderurgicas de Minas Gerais SA
Usiminas - Preference 1,279,038 2.10 375,484 Vale SA 3,862,139 6.33 19,500 Vale SA ADR - Class B 201,143 0.33
Communications - 1,554,130 (31 December 2019: 2,842,369) 1,554,130 2.55
20,285 Telefonica Brasil SA - Preference 179,701 0.30 155,040 Telefonica Brasil SA ADR 1,374,429 2.25
Consumer, Cyclical - 7,777,491 (31 December 2019: 10,062,275) 7,777,491 12.75
264,703 B2W Cia Digital 5,232,388 8.58 507,816 Lojas Americanas SA 2,545,103 4.17
Consumer, Non-cyclical - 8,462,426 (31 December 2019: 13,963,646) 8,462,426 13.88
626,224 Atacadao SA 2,281,219 3.74 126,416 Cia Brasileira de Distribuicao 1,650,259 2.71 179,555 JBS SA 700,311 1.15 901,507 Marfrig Global Foods SA 2,090,437 3.43 376,043 Petrobras Distribuidora SA 1,488,793 2.44 2,600 Ultrapar Participacoes SA 8,792 0.01 71,886 Ultrapar Participacoes SA ADR 242,615 0.40
Education - 994,775 (31 December 2019: –) 994,775 1.63
160,644 YDUQS Participacoes SA 994,775 1.63
Energy - 3,721,904 (31 December 2019: 8,002,313) 3,721,904 6.10
629,571 Petroleo Brasileiro SA - Preference 2,497,746 4.09 129,550 Petroleo Brasileiro SA ADR 1,072,026 1.76 19,100 Petroleo Brasileiro SA ADR 152,132 0.25
Financials - 12,040,605 (31 December 2019: 20,803,727) 12,040,605 19.74
353,891 B3 SA - Brasil Bolsa Balcao 3,585,049 5.88 685,142 Banco Bradesco SA ADR 2,603,540 4.27 418,767 Banco do Brasil SA 2,476,517 4.06 113,500 Bradespar SA - Preference 761,905 1.25 304,754 Itau Unibanco Holding SA - Preference 1,427,352 2.34 253,200 Itau Unibanco Holding SA ADR 1,186,242 1.94
Healthcare - 3,544,184 (31 December 2019: 6,059,702) 3,544,184 5.81
207,904 Hapvida Participacoes e Investimentos SA ‘144A’ 2,383,130 3.91 140,045 Sul America SA (Units) 1,161,054 1.90
Industrials - 2,378,840 (31 December 2019: 9,264,086) 2,378,840 3.90
42 Embraer SA 62 0.00 158,130 Embraer SA ADR 944,827 1.55 1,407,575 Santos Brasil Participacoes SA 1,433,951 2.35
Equities cont’d.
USDUSD
03613-1A.indd 73 19/08/2020 19:00

74
Schedule of investments – as at 30 June 2020
BNy MELLON BRAZIL EQUITy FUND
Forward foreign currency contracts cont’d.Unrealised
Gain/(Loss)Buy Sell Amount (B) Amount (S)Settle
Date Counterparty
BNy Mellon Brazil Equity Fund EUR H (Hedged) Share Class cont’d.Euro US dollar 53,077 59,822 15-Jul-20 The Bank of
New York Mellon (172)Euro US dollar 4,990 5,610 15-Jul-20 The Bank of
New York Mellon (2)Euro US dollar 6,000 6,757 15-Jul-20 The Bank of
New York Mellon (14)Euro US dollar 174,990 199,460 15-Jul-20 The Bank of
New York Mellon (2,799)Euro US dollar 1,005 1,140 15-Jul-20 The Bank of
New York Mellon (11)Euro US dollar 3,499 3,956 15-Jul-20 The Bank of
New York Mellon (24)Euro US dollar 1,696,904 1,927,736 15-Jul-20 The Bank of
New York Mellon (20,687)US dollar Euro 14,600 13,000 15-Jul-20 The Bank of
New York Mellon (10)US dollar Euro 77,192 68,795 15-Jul-20 The Bank of
New York Mellon (122)
USD (23,841)
EUR (21,220)
Net USD (21,510)
Net EUR (19,145)
BNy Mellon Brazil Equity Fund EUR I (Acc) (Hedged) Share ClassEuro US dollar 83,943 94,108 15-Jul-20 The Bank of
New York Mellon 231US dollar Euro 118,337 104,524 15-Jul-20 The Bank of
New York Mellon 869US dollar Euro 74,322 65,923 15-Jul-20 The Bank of
New York Mellon 236US dollar Euro 137,262 121,615 15-Jul-20 The Bank of
New York Mellon 586US dollar Euro 155,248 136,374 15-Jul-20 The Bank of
New York Mellon 1,985US dollar Euro 125,723 111,641 15-Jul-20 The Bank of
New York Mellon 256
USD 4,163
EUR 3,705
Euro US dollar 210,523 238,344 15-Jul-20 The Bank of New York Mellon (1,750)
Euro US dollar 3,417,788 3,882,714 15-Jul-20 The Bank of New York Mellon (41,667)
Euro US dollar 102,568 115,602 15-Jul-20 The Bank of New York Mellon (332)
US dollar Euro 149,569 133,298 15-Jul-20 The Bank of New York Mellon (236)
USD (43,985)
EUR (39,150)
Net USD (39,822)
Net EUR (35,445)
Forward foreign currency contracts cont’d.Unrealised
Gain/(Loss)Buy Sell Amount (B) Amount (S)Settle
Date Counterparty
BNy Mellon Brazil Equity Fund EUR G (Acc) (Hedged) Share ClassUS dollar Euro 1,948 1,728 15
20The Bank of New York Mellon 6
US dollar Euro 3,597 3,187 15-Jul-20 The Bank of New York Mellon 15
US dollar Euro 4,069 3,574 15-Jul-20 The Bank of New York Mellon 52
US dollar Euro 2 2 15-Jul-20 The Bank of New York Mellon -
US dollar Euro 94,627 83,680 15-Jul-20 The Bank of New York Mellon 585
USD 658
EUR 586
Euro US dollar 89,572 101,756 15-Jul-20 The Bank of New York Mellon (1,092)
Euro US dollar 2,599 2,929 15-Jul-20 The Bank of New York Mellon (8)
USD (1,100)
EUR (979)
Net USD (442)
Net EUR (393)
BNy Mellon Brazil Equity Fund EUR H (Hedged) Share ClassEuro US dollar 1 1 15-Jul-20 The Bank of
New York Mellon - Euro US dollar 31,594 35,414 15-Jul-20 The Bank of
New York Mellon 92Euro US dollar 42,617 47,777 15-Jul-20 The Bank of
New York Mellon 117US dollar Euro 17,565 15,624 15-Jul-20 The Bank of
New York Mellon 6US dollar Euro 27,004 23,972 15-Jul-20 The Bank of
New York Mellon 63US dollar Euro 53,367 47,137 15-Jul-20 The Bank of
New York Mellon 392US dollar Euro 41,260 36,597 15-Jul-20 The Bank of
New York Mellon 131US dollar Euro 75,731 67,098 15-Jul-20 The Bank of
New York Mellon 323US dollar Euro 77,369 67,963 15-Jul-20 The Bank of
New York Mellon 989US dollar Euro 64,655 57,413 15-Jul-20 The Bank of
New York Mellon 132US dollar Euro 29 26 15-Jul-20 The Bank of
New York Mellon - US dollar Euro 8,032 7,136 15-Jul-20 The Bank of
New York Mellon 13US dollar Euro 11,810 10,444 15-Jul-20 The Bank of
New York Mellon 73
USD 2,331
EUR 2,075
03613-1A.indd 74 19/08/2020 19:00
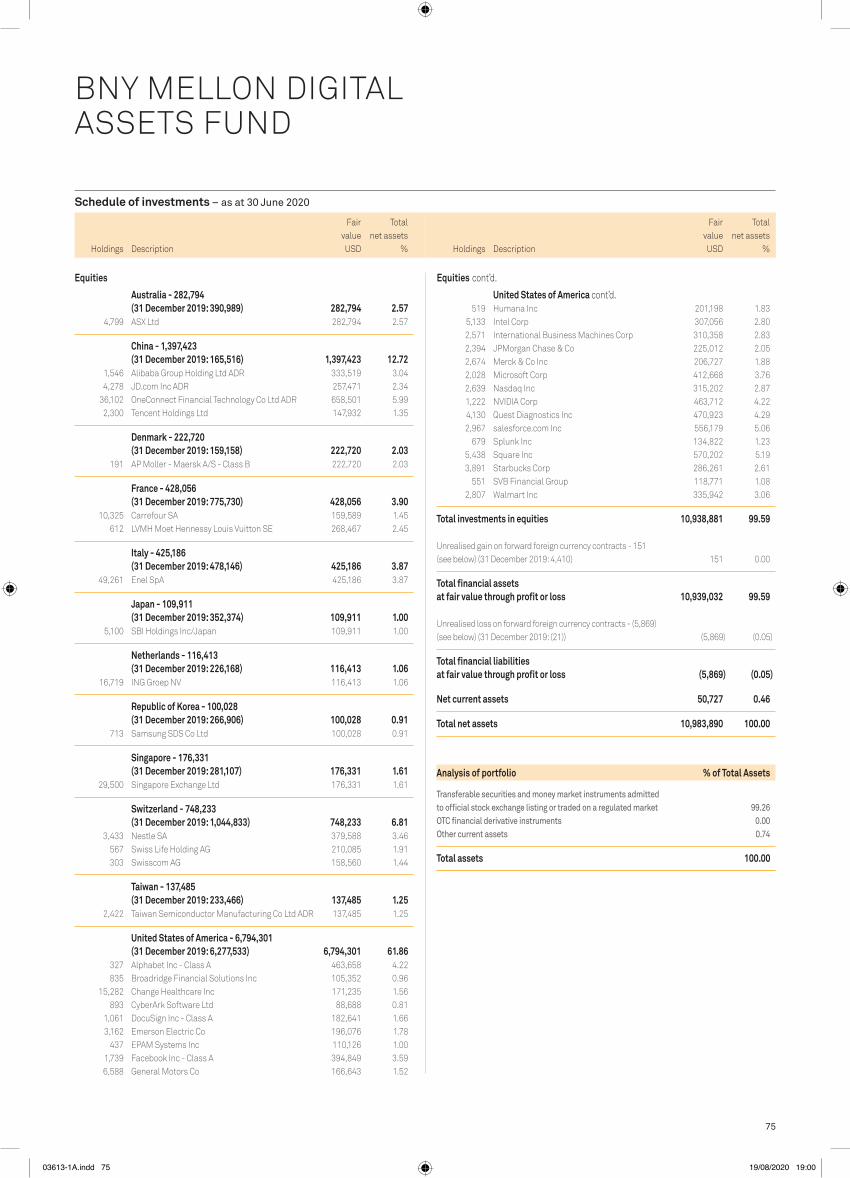
75
Schedule of investments – as at 30 June 2020
Holdings Description
Fair value
Total net assets
% Holdings Description
Fair value
Total net assets
%
Equities
Australia - 282,794 (31 December 2019: 390,989) 282,794 2.57
4,799 ASX Ltd 282,794 2.57
China - 1,397,423 (31 December 2019: 165,516) 1,397,423 12.72
1,546 Alibaba Group Holding Ltd ADR 333,519 3.04 4,278 JD.com Inc ADR 257,471 2.34 36,102 OneConnect Financial Technology Co Ltd ADR 658,501 5.99 2,300 Tencent Holdings Ltd 147,932 1.35
Denmark - 222,720 (31 December 2019: 159,158) 222,720 2.03
191 AP Moller - Maersk A/S - Class B 222,720 2.03
France - 428,056 (31 December 2019: 775,730) 428,056 3.90
10,325 Carrefour SA 159,589 1.45 612 LVMH Moet Hennessy Louis Vuitton SE 268,467 2.45
Italy - 425,186 (31 December 2019: 478,146) 425,186 3.87
49,261 Enel SpA 425,186 3.87
Japan - 109,911 (31 December 2019: 352,374) 109,911 1.00
5,100 SBI Holdings Inc/Japan 109,911 1.00
Netherlands - 116,413 (31 December 2019: 226,168) 116,413 1.06
16,719 ING Groep NV 116,413 1.06
Republic of Korea - 100,028 (31 December 2019: 266,906) 100,028 0.91
713 Samsung SDS Co Ltd 100,028 0.91
Singapore - 176,331 (31 December 2019: 281,107) 176,331 1.61
29,500 Singapore Exchange Ltd 176,331 1.61
Switzerland - 748,233 (31 December 2019: 1,044,833) 748,233 6.81
3,433 Nestle SA 379,588 3.46 567 Swiss Life Holding AG 210,085 1.91 303 Swisscom AG 158,560 1.44
Taiwan - 137,485 (31 December 2019: 233,466) 137,485 1.25
2,422 Taiwan Semiconductor Manufacturing Co Ltd ADR 137,485 1.25
United States of America - 6,794,301 (31 December 2019: 6,277,533) 6,794,301 61.86
327 Alphabet Inc - Class A 463,658 4.22 835 Broadridge Financial Solutions Inc 105,352 0.96 15,282 Change Healthcare Inc 171,235 1.56 893 CyberArk Software Ltd 88,688 0.81 1,061 DocuSign Inc - Class A 182,641 1.66 3,162 Emerson Electric Co 196,076 1.78 437 EPAM Systems Inc 110,126 1.00 1,739 Facebook Inc - Class A 394,849 3.59 6,588 General Motors Co 166,643 1.52
519 Humana Inc 201,198 1.83 5,133 Intel Corp 307,056 2.80 2,571 International Business Machines Corp 310,358 2.83 2,394 JPMorgan Chase & Co 225,012 2.05 2,674 Merck & Co Inc 206,727 1.88 2,028 Microsoft Corp 412,668 3.76 2,639 Nasdaq Inc 315,202 2.87 1,222 NVIDIA Corp 463,712 4.22 4,130 Quest Diagnostics Inc 470,923 4.29 2,967 salesforce.com Inc 556,179 5.06 679 Splunk Inc 134,822 1.23 5,438 Square Inc 570,202 5.19 3,891 Starbucks Corp 286,261 2.61 551 SVB Financial Group 118,771 1.08 2,807 Walmart Inc 335,942 3.06
Total investments in equities 10,938,881 99.59 Unrealised gain on forward foreign currency contracts - 151 (see below) (31 December 2019: 4,410) 151 0.00
Total financial assets at fair value through profit or loss 10,939,032 99.59 Unrealised loss on forward foreign currency contracts - (5,869) (see below) (31 December 2019: (21)) (5,869) (0.05)
Total financial liabilities at fair value through profit or loss (5,869) (0.05)
Net current assets 50,727 0.46
Total net assets 10,983,890 100.00
Analysis of portfolio % of Total Assets
Transferable securities and money market instruments admitted to official stock exchange listing or traded on a regulated market 99.26oTC financial derivative instruments 0.00other current assets 0.74
Total assets 100.00
BNY MELLON DIGITAL ASSETS FUND
FUND 8 – BNy MELLON DIGITAL ASSETS FUND
Equities cont’d.
United States of America cont’d.
USDUSD
03613-1A.indd 75 19/08/2020 19:00
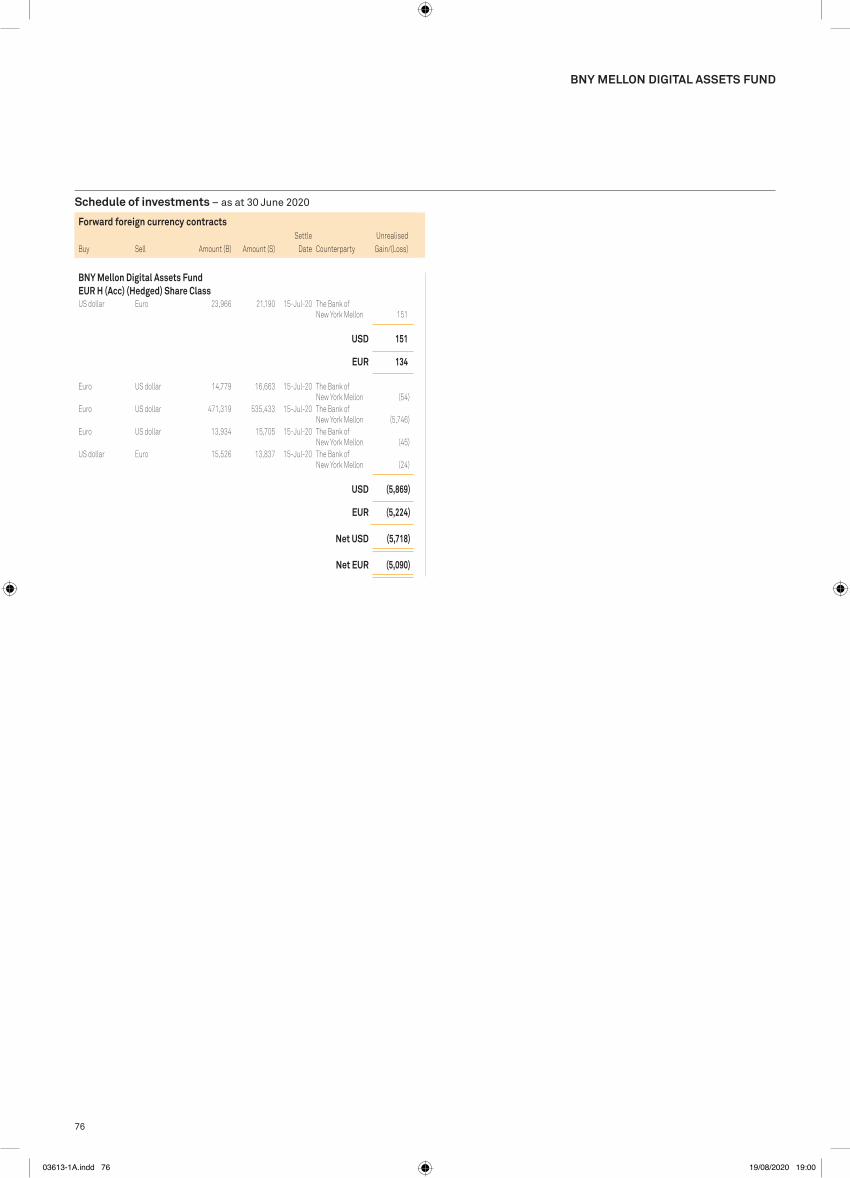
76
Schedule of investments – as at 30 June 2020
BNy MELLON DIGITAL ASSETS FUND
Forward foreign currency contractsUnrealised
Gain/(Loss)Buy Sell Amount (B) Amount (S)Settle
Date Counterparty
BNy Mellon Digital Assets Fund EUR H (Acc) (Hedged) Share ClassUS dollar Euro 23,966 21,190 15-Jul-20 The Bank of
New York Mellon 151
USD 151
EUR 134
Euro US dollar 14,779 16,663 15-Jul-20 The Bank of New York Mellon (54)
Euro US dollar 471,319 535,433 15-Jul-20 The Bank of New York Mellon (5,746)
Euro US dollar 13,934 15,705 15-Jul-20 The Bank of New York Mellon (45)
US dollar Euro 15,526 13,837 15-Jul-20 The Bank of New York Mellon (24)
USD (5,869)
EUR (5,224)
Net USD (5,718)
Net EUR (5,090)
03613-1A.indd 76 19/08/2020 19:00

77
Schedule of investments – as at 30 June 2020
Holdings Description
Fair value
Total net assets
% Holdings Description
Fair value
Total net assets
%
1 DAX Index Long Futures Contracts Exp Sep-2020 346,193 6,868 0.03
48 E-mini S&P 500 Index Long Futures Contracts Exp Sep-2020 7,416,600 159,906 0.66
(2) FTSE 100 Index Short Futures Contracts Exp Sep-2020 (152,347) 2,514 0.01
(4) FTSE MIB Index Short Futures Contracts Exp Sep-2020 (433,424) 3,514 0.01
(3) IBEX 35 Index Short Futures Contracts Exp Jul-2020 (243,007) 3,681 0.02
10 MSCI Emerging Markets Index Long Futures Contracts Exp Sep-2020 492,850 461 0.00
1 S&P TSX 60 Index Long Futures Contracts Exp Sep-2020 136,785 1,113 0.01
63 SFE 10 Year Australian Treasury Bond Long Futures Contracts Exp Sep-2020 6,468,769 28,268 0.12
5 SPI 200 Index Long Futures Contracts Exp Sep-2020 508,259 134 0.00
(7) TOPIX Index Short Futures Contracts Exp Sep-2020 (1,010,373) 11,600 0.05
(6) U.S. 10 Year Treasury Note Short Futures Contracts Exp Sep-2020 (835,031) 373 0.00
(41) UK Long Gilt Short Futures Contracts Exp Sep-2020 (6,992,542) 3,273 0.01
Total open futures contracts 222,601 0.92 Unrealised gain on forward foreign currency contracts - 120,229 (see below) (31 December 2019: 171,752) 120,229 0.50
Total financial assets at fair value through profit or loss 22,079,836 91.56
Index options - (103,200) (31 December 2019: (32,750))
(10) E-mini S&P 500 Index Call 07-Aug-2020 3,170.000 (27,000) (0.11) (10) E-mini S&P 500 Index Call 17-Jul-2020 3,160.000 (15,000) (0.06) (10) E-mini S&P 500 Index Put 07-Aug-2020 2,870.000 (20,875) (0.09) (10) E-mini S&P 500 Index Put 17-Jul-2020 2,860.000 (8,125) (0.03) (9) E-mini S&P 500 Index Put 17-Jul-2020 2,965.000 (13,950) (0.06) (10) E-mini S&P 500 Index Put 24-Jul-2020 2,940.000 (18,250) (0.08)
Total index options (103,200) (0.43)
Collective investment schemes
Ireland - 1,081,315 (31 December 2019: 1,279,813) 1,081,315 4.49
113,844 iShares Diversified Commodity Swap UCITS ETF - ETF 462,947 1.92
18,434 SPDR Bloomberg Barclays 1-10 Year U.S. Corporate Bond UCITS ETF - ETF 618,368 2.57
United States of America - 1,131,659 (31 December 2019: 1,234,000) 1,131,659 4.69
44,916 SPDR Bloomberg Barclays Short Term High Yield Bond ETF - ETF 1,131,659 4.69
Total investments in collective investment schemes 2,212,974 9.18
Bonds
United States of America - 17,594,381 (31 December 2019: 20,910,671) 17,594,381 72.96
2,617,000 United States Treasury Bill (Zero Coupon) 0.000% 16-Jul-2020 2,616,872 10.85
2,157,000 United States Treasury Bill (Zero Coupon) 0.000% 13-Aug-2020 2,156,678 8.94
2,971,000 United States Treasury Bill (Zero Coupon) 0.000% 08-Oct-2020 2,969,815 12.32
3,000,000 United States Treasury Bill (Zero Coupon) 0.000% 22-Oct-2020 2,998,587 12.44
2,239,000 United States Treasury Bill (Zero Coupon) 0.000% 05-Nov-2020 2,237,815 9.28
1,888,000 United States Treasury Bill (Zero Coupon) 0.000% 19-Nov-2020 1,886,872 7.82
1,382,000 United States Treasury Bill (Zero Coupon) 0.000% 17-Dec-2020 1,381,084 5.73
1,348,000 United States Treasury Bill (Zero Coupon) 0.000% 25-Feb-2021* 1,346,658 5.58
Total investments in bonds 17,594,381 72.96
Future options - 1,882,463 (31 December 2019: 1,037,203)
20 Euro-Bund Future Put 21-Aug-2020 194.000 392,776 1.63 105 U.S. 10 Year Treasury Note Future Call
21-Aug-2020 125.000 1,489,687 6.18
Total future options 1,882,463 7.81
Index options - 47,188 (31 December 2019: 20,785)
25 E-mini S&P 500 Index Call 21-Aug-2020 3,250.000 47,188 0.19
Total index options 47,188 0.19
Holdings Description
Underlying exposure
USD
Fair value USD
Total net assets
%
Open futures contracts - 222,601 (31 December 2019: 172,119)
1 AEX Index Long Futures Contracts Exp Jul-2020 125,731 896 0.00
Open futures contracts cont’d.
Underlying exposure
USD
FUND 9 – BNy MELLON DyNAMIC TOTAL RETURN FUND
BNY MELLON DYNAMIC TOTAL RETURN FUND
USDUSD
03613-1A.indd 77 19/08/2020 19:00

78
Schedule of investments – as at 30 June 2020
Holdings Description
Fair value
Total net assets
%
BNy MELLON DyNAMIC TOTAL RETURN FUND
Holdings Description
Underlying exposure
USD
Fair value
Total net assets
%
Open futures contracts - (84,197) (31 December 2019: (22,617))
(2) CAC 40 10 Euro Index Short Futures Contracts Exp Jul-2020 (110,406) (322) (0.00)
1 Canadian 10 Year Treasury Bond Long Futures Contracts Exp Sep-2020 113,303 (76) (0.00)
10 Eurex SMI Index Long Futures Contracts Exp Sep-2020 1,056,309 (7,860) (0.03)
(28) Euro-Bund Short Futures Contracts Exp Sep-2020 (5,552,970) (49,615) (0.21)
13 Hang Seng Index Long Futures Contracts Exp Jul-2020 2,033,488 (18,844) (0.08)
55 SGX 10 Year Mini Japanese Government Bond Long Futures Contracts Exp Sep-2020 7,736,420 (7,480) (0.03)
Total open futures contracts (84,197) (0.35) Unrealised loss on forward foreign currency contracts - (159,607) (see below) (31 December 2019: (202,197)) (159,607) (0.66)
Total financial liabilities at fair value through profit or loss (347,004) (1.44)
Net current assets 2,380,484 9.88
Total net assets 24,113,316 100.00
* held as collateral by JpMorgan Chase Bank in respect of futures contracts, future options and index options held by the Fund.
The counterparty for future options is JpMorgan Chase Bank.The counterparty for index options is JpMorgan Chase Bank.The counterparty for futures contracts is JpMorgan Chase Bank.
Analysis of portfolio % of Total Assets
Transferable securities and money market instruments admitted to official stock exchange listing or traded on a regulated market 75.93Financial derivative instruments dealt in on a regulated market 8.25oTC financial derivative instruments 0.46other current assets 15.36
Total assets 100.00
Underlying exposure
USD
USD
Forward foreign currency contracts cont’d.Unrealised
Gain/(Loss)Buy Sell Amount (B) Amount (S)Settle
Date Counterparty
BNy Mellon Dynamic Total Return FundAustralian dollar US dollar 451,000 309,747 16-Sep-20 Citigroup Global
Markets Limited 1,571Australian dollar US dollar 241,000 166,154 16-Sep-20 Citigroup Global
Markets Limited 205Canadian dollar US dollar 288,000 211,549 16-Sep-20 Citigroup Global
Markets Limited 622New Zealand dollar US dollar 2,195,000 1,411,137 16-Sep-20 Goldman Sachs 5,204New Zealand dollar US dollar 259,000 166,793 16-Sep-20 Citigroup Global
Markets Limited 328Swiss franc US dollar 272,307 287,766 16-Sep-20 Goldman Sachs 311Swiss franc US dollar 272,307 287,764 16-Sep-20 Citigroup Global
Markets Limited 313Swiss franc US dollar 272,307 287,948 16-Sep-20 Morgan Stanley 129Swiss franc US dollar 207,476 219,338 16-Sep-20 Royal Bank
of Canada 154Swiss franc US dollar 272,307 287,856 16-Sep-20 Bank of Montreal 221US dollar Australian dollar 620,857 890,660 16-Sep-20 Bank of Montreal 6,048US dollar Australian dollar 584,632 838,269 16-Sep-20 Citigroup Global
Markets Limited 5,988US dollar Australian dollar 620,773 890,660 16-Sep-20 Royal Bank
of Canada 5,965US dollar Canadian dollar 546,616 733,597 16-Sep-20 Bank of Montreal 6,170US dollar Canadian dollar 514,317 690,446 16-Sep-20 Citigroup Global
Markets Limited 5,661US dollar Canadian dollar 546,637 733,597 16-Sep-20 Royal Bank
of Canada 6,191US dollar Euro 1,107,783 973,533 16-Sep-20 Morgan Stanley 12,134US dollar Euro 1,107,832 973,533 16-Sep-20 Goldman Sachs 12,183US dollar Euro 844,484 741,744 16-Sep-20 Royal Bank
of Canada 9,699US dollar Euro 1,108,474 973,533 16-Sep-20 Bank of Montreal 12,825US dollar Euro 163,438 145,000 16-Sep-20 Goldman Sachs 250US dollar Euro 1,107,846 973,533 16-Sep-20 Citigroup Global
Markets Limited 12,197US dollar Japanese yen 141,446 15,246,000 16-Sep-20 Citigroup Global
Markets Limited 99US dollar New Zealand dollar 81,286 124,562 16-Sep-20 Royal Bank
of Canada 912US dollar New Zealand dollar 81,292 124,562 16-Sep-20 Bank of Montreal 917US dollar New Zealand dollar 76,459 117,236 16-Sep-20 Citigroup Global
Markets Limited 812US dollar Sterling 430,595 346,000 16-Sep-20 Goldman Sachs 1,672US dollar Sterling 556,667 448,000 16-Sep-20 Citigroup Global
Markets Limited 1,299US dollar Sterling 1,039,066 830,000 16-Sep-20 Goldman Sachs 10,149
USD 120,229
Canadian dollar US dollar 455,000 335,486 16-Sep-20 Citigroup Global Markets Limited (285)
Canadian dollar US dollar 856,000 630,674 16-Sep-20 Goldman Sachs (53)Euro US dollar 80,000 90,052 16-Sep-20 Citigroup Global
Markets Limited (17)Euro US dollar 291,000 328,704 16-Sep-20 Goldman Sachs (1,202)Euro US dollar 230,000 258,890 16-Sep-20 Citigroup Global
Markets Limited (40)Japanese yen US dollar 30,601,000 287,015 16-Sep-20 Citigroup Global
Markets Limited (3,311)Japanese yen US dollar 112,418,586 1,045,351 16-Sep-20 Goldman Sachs (3,110)Japanese yen US dollar 112,418,586 1,045,783 16-Sep-20 Morgan Stanley (3,543)Japanese yen US dollar 85,652,256 796,564 16-Sep-20 Bank of Montreal (2,476)Japanese yen US dollar 112,418,586 1,045,380 16-Sep-20 Royal Bank
of Canada (3,139)Japanese yen US dollar 112,418,586 1,045,343 16-Sep-20 Citigroup Global
Markets Limited (3,102)Japanese yen US dollar 3,614,000 33,700 16-Sep-20 Goldman Sachs (194)Norwegian krone US dollar 3,345,095 361,124 16-Sep-20 Bank of Montreal (13,491)Norwegian krone US dollar 3,345,095 361,222 16-Sep-20 Goldman Sachs (13,589)
03613-1A.indd 78 19/08/2020 19:00

79
Schedule of investments – as at 30 June 2020
BNy MELLON DyNAMIC TOTAL RETURN FUND
Forward foreign currency contracts cont’d.Unrealised
Gain/(Loss)Buy Sell Amount (B) Amount (S)Settle
Date Counterparty
BNy Mellon Dynamic Total Return Fund cont’d.Norwegian krone US dollar 3,345,095 361,233 16-Sep-20 Citigroup Global
Markets Limited (13,601)Norwegian krone US dollar 1,337,000 140,670 16-Sep-20 Citigroup Global
Markets Limited (1,725)Norwegian krone US dollar 2,548,647 275,166 16-Sep-20 Royal Bank
of Canada (10,303)Norwegian krone US dollar 3,345,095 360,770 16-Sep-20 Morgan Stanley (13,137)Sterling US dollar 233,174 297,285 16-Sep-20 Bank of Montreal (8,229)Sterling US dollar 233,174 296,806 16-Sep-20 Goldman Sachs (7,749)Sterling US dollar 233,174 297,005 16-Sep-20 Morgan Stanley (7,949)Sterling US dollar 177,658 226,477 16-Sep-20 Royal Bank
of Canada (6,241)Sterling US dollar 233,174 296,803 16-Sep-20 Citigroup Global
Markets Limited (7,746)Swedish krona US dollar 3,280,581 358,324 16-Sep-20 Citigroup Global
Markets Limited (5,928)Swedish krona US dollar 2,499,491 272,970 16-Sep-20 Royal Bank
of Canada (4,478)Swedish krona US dollar 3,280,581 358,320 16-Sep-20 Goldman Sachs (5,924)Swedish krona US dollar 3,280,581 358,007 16-Sep-20 Morgan Stanley (5,611)Swedish krona US dollar 3,280,581 358,283 16-Sep-20 Bank of Montreal (5,887)US dollar Australian dollar 369,715 540,000 16-Sep-20 Goldman Sachs (3,038)US dollar Euro 631,991 562,000 16-Sep-20 Citigroup Global
Markets Limited (504)US dollar Swiss franc 168,664 160,000 16-Sep-20 Citigroup Global
Markets Limited (602)US dollar Swiss franc 506,630 479,000 16-Sep-20 Goldman Sachs (110)US dollar Swiss franc 558,296 528,000 16-Sep-20 Citigroup Global
Markets Limited (282)US dollar Swiss franc 317,024 301,000 16-Sep-20 Goldman Sachs (1,408)
USD (158,004)
Net USD (37,775)
BNy Mellon Dynamic Total Return Fund EUR H (Acc) (Hedged) Share ClassEuro US dollar 131,499 149,387 15-Jul-20 The Bank of
New York Mellon (1,603)
USD (1,603)
EUR (1,427)
03613-1A.indd 79 19/08/2020 19:00

80
Schedule of investments – as at 30 June 2020
Holdings Description
Fair value
Total net assets
% Holdings Description
Fair value
Total net assets
%
Bonds
Government - 30,488,824 (31 December 2019: 24,159,866) 30,488,824 7.51
3,000,000 United States Treasury Bill (Zero Coupon) 0.000% 16-Jul-2020 2,999,853 0.74
3,000,000 United States Treasury Bill (Zero Coupon) 0.000% 06-Aug-2020 2,999,670 0.74
3,000,000 United States Treasury Bill (Zero Coupon) 0.000% 13-Aug-2020 2,999,552 0.74
5,000,000 United States Treasury Bill (Zero Coupon) 0.000% 17-Sep-2020 4,998,537 1.23
6,000,000 United States Treasury Bill (Zero Coupon) 0.000% 08-Oct-2020 5,997,607 1.48
3,000,000 United States Treasury Bill (Zero Coupon) 0.000% 05-Nov-2020 2,998,413 0.74
2,500,000 United States Treasury Bill (Zero Coupon) 0.000% 19-Nov-2020 2,498,507 0.61
5,000,000 United States Treasury Bill (Zero Coupon) 0.000% 17-Dec-2020 4,996,685 1.23
Total investments in bonds 30,488,824 7.51
Equities
Basic Materials - 7,063,775 (31 December 2019: 3,021,329) 7,063,775 1.74
2,938 Air Products & Chemicals Inc 708,881 0.17 1,413 Albemarle Corp 109,084 0.03 1,608 Celanese Corp - Class A 138,875 0.03 2,840 CF Industries Holdings Inc 79,932 0.02 9,885 Dow Inc 402,764 0.10 9,770 DuPont de Nemours Inc 518,982 0.13 1,843 Eastman Chemical Co 128,420 0.03 3,307 Ecolab Inc 657,646 0.16 1,700 FMC Corp 169,328 0.04 19,548 Freeport-McMoRan Inc 226,073 0.06 1,438 International Flavors & Fragrances Inc 175,860 0.04 5,203 International Paper Co 183,224 0.05 7,029 Linde Plc 1,491,062 0.37 3,447 LyondellBasell Industries NV 226,399 0.06 4,859 Mosaic Co/The 60,810 0.02 10,742 Newmont Corp 663,104 0.16 4,012 Nucor Corp 166,077 0.04 3,125 PPG Industries Inc 331,453 0.08 1,083 Sherwin-Williams Co/The 625,801 0.15
Communications - 56,611,513 (31 December 2019: 20,644,919) 56,611,513 13.94
3,913 Alphabet Inc 5,533,178 1.36 4,005 Alphabet Inc - Class A 5,678,750 1.40 5,590 Amazon.com Inc 15,413,726 3.80 720 Arista Networks Inc 151,175 0.04 95,369 AT&T Inc 2,879,667 0.71 548 Booking Holdings Inc 873,591 0.21 1,932 CDW Corp/DE 224,566 0.06 13,061 CenturyLink Inc 130,937 0.03 2,020 Charter Communications Inc 1,029,533 0.25 56,625 Cisco Systems Inc 2,640,424 0.65 60,794 Comcast Corp 2,368,838 0.58 10,158 Corning Inc 263,143 0.06 2,117 Discovery Inc - Class A 44,637 0.01
4,269 Discovery Inc - Class C 82,178 0.02 3,417 DISH Network Corp - Class A 117,904 0.03 3,009 E*TRADE Financial Corp 149,683 0.04 8,950 eBay Inc 469,248 0.12 1,815 Expedia Group Inc 149,184 0.04 826 F5 Networks Inc 115,161 0.03 32,105 Facebook Inc - Class A 7,289,601 1.79 4,591 Fox Corp - Class A 123,108 0.03 2,248 Fox Corp - Class B 60,303 0.01 5,146 Interpublic Group of Cos Inc/The 88,280 0.02 4,408 Juniper Networks Inc 100,745 0.02 2,264 Motorola Solutions Inc 317,277 0.08 5,870 Netflix Inc 2,669,969 0.66 5,381 News Corp - Class A 63,792 0.02 1,325 News Corp - Class B 15,820 0.00 7,277 NortonLifeLock Inc 144,376 0.04 2,860 Omnicom Group Inc 156,084 0.04 7,449 T-Mobile US Inc 775,851 0.19 5,107 T-Mobile US Inc Rights 29-Jul-2020 807 0.00 10,458 Twitter Inc 311,491 0.08 1,366 VeriSign Inc 282,386 0.07 55,246 Verizon Communications Inc 3,041,845 0.75 7,185 ViacomCBS Inc - Class B 167,446 0.04 24,111 Walt Disney Co/The 2,686,809 0.66
Consumer, Cyclical - 26,588,957 (31 December 2019: 11,893,393) 26,588,957 6.55
922 Advance Auto Parts Inc 131,334 0.03 1,710 Alaska Air Group Inc 61,996 0.02 5,066 American Airlines Group Inc 66,086 0.02 3,378 Aptiv Plc 263,095 0.06 314 AutoZone Inc 354,448 0.09 3,014 Best Buy Co Inc 262,987 0.06 2,745 BorgWarner Inc 96,940 0.02 2,178 CarMax Inc 195,051 0.05 6,182 Carnival Corp 101,416 0.02 343 Chipotle Mexican Grill Inc - Class A 360,932 0.09 2,755 Copart Inc 229,423 0.06 5,896 Costco Wholesale Corp 1,787,107 0.44 1,976 Cummins Inc 342,243 0.08 1,766 Darden Restaurants Inc 133,819 0.03 7,637 Delta Air Lines Inc 214,103 0.05 3,356 Dollar General Corp 639,335 0.16 3,131 Dollar Tree Inc 290,244 0.07 520 Domino’s Pizza Inc 192,137 0.05 4,438 DR Horton Inc 245,910 0.06 7,581 Fastenal Co 324,505 0.08 52,110 Ford Motor Co 317,089 0.08 3,121 Gap Inc/The 39,403 0.01 16,800 General Motors Co 424,956 0.10 1,908 Genuine Parts Co 165,910 0.04 4,427 Hanesbrands Inc 49,959 0.01 1,725 Hasbro Inc 129,289 0.03 3,730 Hilton Worldwide Holdings Inc 273,950 0.07 14,380 Home Depot Inc/The 3,598,307 0.89 2,089 Kohl’s Corp 43,378 0.01 3,090 L Brands Inc 46,273 0.01 4,540 Las Vegas Sands Corp 206,706 0.05
BNY MELLON DYNAMIC U.S. EQUITY FUND
FUND 10 – BNy MELLON DyNAMIC U.S. EQUITy FUND / NOWy OD DEC/2017
Equities cont’d.
Communications cont’d.
USDUSD
03613-1A.indd 80 19/08/2020 19:00
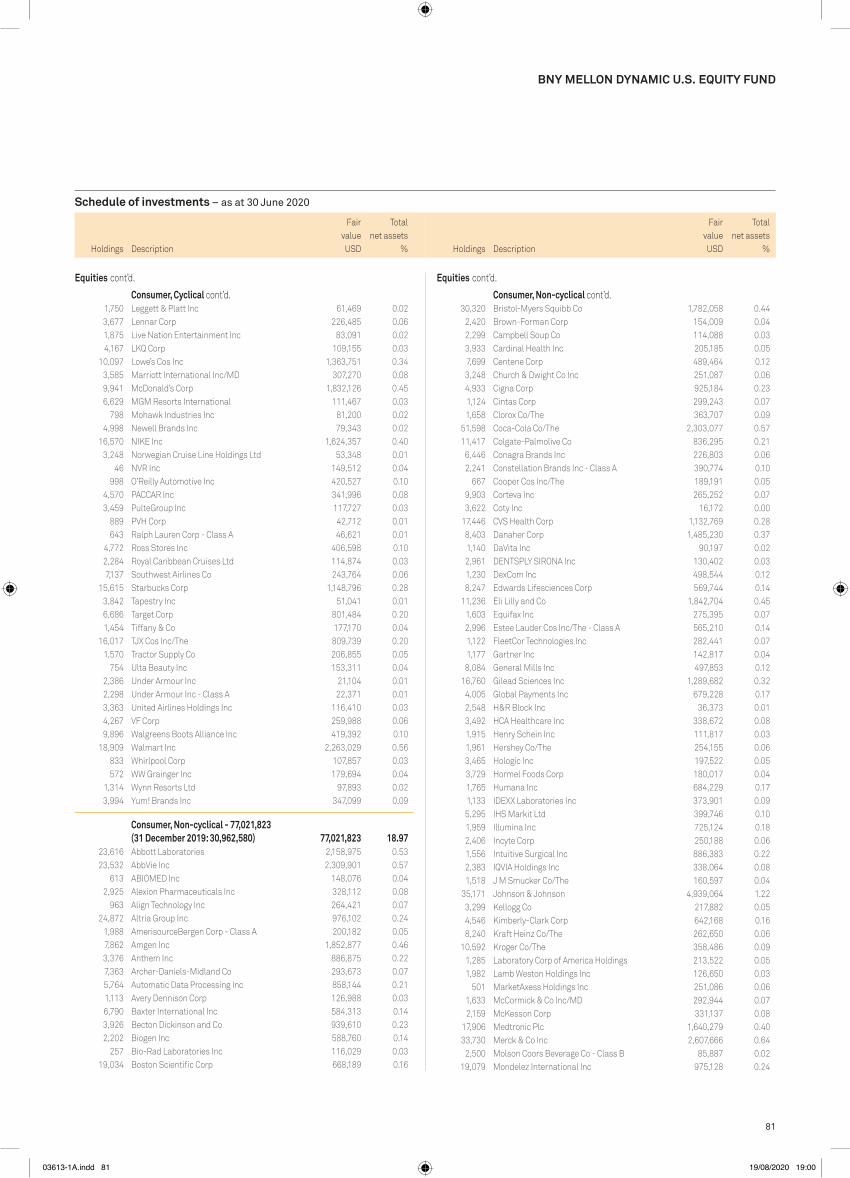
81
Schedule of investments – as at 30 June 2020
Holdings Description
Fair value
Total net assets
% Holdings Description
Fair value
Total net assets
%
BNy MELLON DyNAMIC U.S. EQUITy FUND
30,320 Bristol-Myers Squibb Co 1,782,058 0.44 2,420 Brown-Forman Corp 154,009 0.04 2,299 Campbell Soup Co 114,088 0.03 3,933 Cardinal Health Inc 205,185 0.05 7,699 Centene Corp 489,464 0.12 3,248 Church & Dwight Co Inc 251,087 0.06 4,933 Cigna Corp 925,184 0.23 1,124 Cintas Corp 299,243 0.07 1,658 Clorox Co/The 363,707 0.09 51,598 Coca-Cola Co/The 2,303,077 0.57 11,417 Colgate-Palmolive Co 836,295 0.21 6,446 Conagra Brands Inc 226,803 0.06 2,241 Constellation Brands Inc - Class A 390,774 0.10 667 Cooper Cos Inc/The 189,191 0.05 9,903 Corteva Inc 265,252 0.07 3,622 Coty Inc 16,172 0.00 17,446 CVS Health Corp 1,132,769 0.28 8,403 Danaher Corp 1,485,230 0.37 1,140 DaVita Inc 90,197 0.02 2,961 DENTSPLY SIRONA Inc 130,402 0.03 1,230 DexCom Inc 498,544 0.12 8,247 Edwards Lifesciences Corp 569,744 0.14 11,236 Eli Lilly and Co 1,842,704 0.45 1,603 Equifax Inc 275,395 0.07 2,996 Estee Lauder Cos Inc/The - Class A 565,210 0.14 1,122 FleetCor Technologies Inc 282,441 0.07 1,177 Gartner Inc 142,817 0.04 8,084 General Mills Inc 497,853 0.12 16,760 Gilead Sciences Inc 1,289,682 0.32 4,005 Global Payments Inc 679,228 0.17 2,548 H&R Block Inc 36,373 0.01 3,492 HCA Healthcare Inc 338,672 0.08 1,915 Henry Schein Inc 111,817 0.03 1,961 Hershey Co/The 254,155 0.06 3,465 Hologic Inc 197,522 0.05 3,729 Hormel Foods Corp 180,017 0.04 1,765 Humana Inc 684,229 0.17 1,133 IDEXX Laboratories Inc 373,901 0.09 5,295 IHS Markit Ltd 399,746 0.10 1,959 Illumina Inc 725,124 0.18 2,406 Incyte Corp 250,188 0.06 1,556 Intuitive Surgical Inc 886,383 0.22 2,383 IQVIA Holdings Inc 338,064 0.08 1,518 J M Smucker Co/The 160,597 0.04 35,171 Johnson & Johnson 4,939,064 1.22 3,299 Kellogg Co 217,882 0.05 4,546 Kimberly-Clark Corp 642,168 0.16 8,240 Kraft Heinz Co/The 262,650 0.06 10,592 Kroger Co/The 358,486 0.09 1,285 Laboratory Corp of America Holdings 213,522 0.05 1,982 Lamb Weston Holdings Inc 126,650 0.03 501 MarketAxess Holdings Inc 251,086 0.06 1,633 McCormick & Co Inc/MD 292,944 0.07 2,159 McKesson Corp 331,137 0.08 17,906 Medtronic Plc 1,640,279 0.40 33,730 Merck & Co Inc 2,607,666 0.64 2,500 Molson Coors Beverage Co - Class B 85,887 0.02 19,079 Mondelez International Inc 975,128 0.24
1,750 Leggett & Platt Inc 61,469 0.02 3,677 Lennar Corp 226,485 0.06 1,875 Live Nation Entertainment Inc 83,091 0.02 4,167 LKQ Corp 109,155 0.03 10,097 Lowe’s Cos Inc 1,363,751 0.34 3,585 Marriott International Inc/MD 307,270 0.08 9,941 McDonald’s Corp 1,832,126 0.45 6,629 MGM Resorts International 111,467 0.03 798 Mohawk Industries Inc 81,200 0.02 4,998 Newell Brands Inc 79,343 0.02 16,570 NIKE Inc 1,624,357 0.40 3,248 Norwegian Cruise Line Holdings Ltd 53,348 0.01 46 NVR Inc 149,512 0.04 998 O’Reilly Automotive Inc 420,527 0.10 4,570 PACCAR Inc 341,996 0.08 3,459 PulteGroup Inc 117,727 0.03 889 PVH Corp 42,712 0.01 643 Ralph Lauren Corp - Class A 46,621 0.01 4,772 Ross Stores Inc 406,598 0.10 2,284 Royal Caribbean Cruises Ltd 114,874 0.03 7,137 Southwest Airlines Co 243,764 0.06 15,615 Starbucks Corp 1,148,796 0.28 3,842 Tapestry Inc 51,041 0.01 6,686 Target Corp 801,484 0.20 1,454 Tiffany & Co 177,170 0.04 16,017 TJX Cos Inc/The 809,739 0.20 1,570 Tractor Supply Co 206,855 0.05 754 Ulta Beauty Inc 153,311 0.04 2,386 Under Armour Inc 21,104 0.01 2,298 Under Armour Inc - Class A 22,371 0.01 3,363 United Airlines Holdings Inc 116,410 0.03 4,267 VF Corp 259,988 0.06 9,896 Walgreens Boots Alliance Inc 419,392 0.10 18,909 Walmart Inc 2,263,029 0.56 833 Whirlpool Corp 107,857 0.03 572 WW Grainger Inc 179,694 0.04 1,314 Wynn Resorts Ltd 97,893 0.02 3,994 Yum! Brands Inc 347,099 0.09
Consumer, Non-cyclical - 77,021,823 (31 December 2019: 30,962,580) 77,021,823 18.97
23,616 Abbott Laboratories 2,158,975 0.53 23,532 AbbVie Inc 2,309,901 0.57 613 ABIOMED Inc 148,076 0.04 2,925 Alexion Pharmaceuticals Inc 328,112 0.08 963 Align Technology Inc 264,421 0.07 24,872 Altria Group Inc 976,102 0.24 1,988 AmerisourceBergen Corp - Class A 200,182 0.05 7,862 Amgen Inc 1,852,877 0.46 3,376 Anthem Inc 886,875 0.22 7,363 Archer-Daniels-Midland Co 293,673 0.07 5,764 Automatic Data Processing Inc 858,144 0.21 1,113 Avery Dennison Corp 126,988 0.03 6,790 Baxter International Inc 584,313 0.14 3,926 Becton Dickinson and Co 939,610 0.23 2,202 Biogen Inc 588,760 0.14 257 Bio-Rad Laboratories Inc 116,029 0.03 19,034 Boston Scientific Corp 668,189 0.16
Equities cont’d.
Consumer, Cyclical cont’d.
Equities cont’d.
Consumer, Non-cyclical cont’d.
USDUSD
03613-1A.indd 81 19/08/2020 19:00

82
Schedule of investments – as at 30 June 2020
Holdings Description
Fair value
Total net assets
% Holdings Description
Fair value
Total net assets
%
BNy MELLON DyNAMIC U.S. EQUITy FUND
5,556 TechnipFMC Plc 38,031 0.01 5,423 Valero Energy Corp 318,954 0.08 16,014 Williams Cos Inc/The 304,186 0.08
Financials - 49,793,935 (31 December 2019: 24,896,239) 49,793,935 12.26
9,596 Aflac Inc 345,696 0.09 1,680 Alexandria Real Estate Equities Inc (REIT) 272,462 0.07 4,204 Allstate Corp/The 407,725 0.10 8,830 American Express Co 840,351 0.21 11,491 American International Group Inc 358,232 0.09 5,919 American Tower Corp (REIT) 1,529,440 0.38 1,641 Ameriprise Financial Inc 246,175 0.06 3,123 Aon Plc 601,224 0.15 1,994 Apartment Investment and Management Co (REIT) 75,024 0.02 2,527 Arthur J Gallagher & Co 246,307 0.06 808 Assurant Inc 83,495 0.02 1,877 AvalonBay Communities Inc (REIT) 290,344 0.07 104,633 Bank of America Corp 2,483,464 0.61 10,531 Bank of New York Mellon Corp/The 407,076 0.10 25,985 Berkshire Hathaway Inc - Class B 4,636,893 1.14 2,058 BlackRock Inc 1,118,667 0.28 1,926 Boston Properties Inc (REIT) 174,081 0.04 6,089 Capital One Financial Corp 381,019 0.09 1,473 Cboe Global Markets Inc 137,173 0.03 4,504 CBRE Group Inc - Class A 203,626 0.05 15,283 Charles Schwab Corp/The 515,572 0.13 6,039 Chubb Ltd 763,933 0.19 2,062 Cincinnati Financial Corp 131,999 0.03 27,933 Citigroup Inc 1,427,237 0.35 5,717 Citizens Financial Group Inc 144,268 0.04 4,772 CME Group Inc 775,426 0.19 1,938 Comerica Inc 73,828 0.02 5,564 Crown Castle International Corp (REIT) 930,662 0.23 3,572 Digital Realty Trust Inc (REIT) 507,581 0.12 4,105 Discover Financial Services 205,640 0.05 4,879 Duke Realty Corp (REIT) 172,692 0.04 1,181 Equinix Inc (REIT) 828,832 0.20 4,616 Equity Residential (REIT) 271,467 0.07 888 Essex Property Trust Inc (REIT) 203,348 0.05 519 Everest Re Group Ltd 106,943 0.03 1,721 Extra Space Storage Inc (REIT) 158,909 0.04 940 Federal Realty Investment Trust (REIT) 80,032 0.02 9,560 Fifth Third Bancorp 184,365 0.05 2,285 First Republic Bank/CA 242,256 0.06 3,654 Franklin Resources Inc 76,643 0.02 1,357 Globe Life Inc 100,784 0.02 4,145 Goldman Sachs Group Inc/The 818,617 0.20 4,853 Hartford Financial Services Group Inc/The 186,913 0.05 7,128 Healthpeak Properties Inc (REIT) 196,269 0.05 9,449 Host Hotels & Resorts Inc (REIT) 102,002 0.02 13,594 Huntington Bancshares Inc/OH 122,822 0.03 7,321 Intercontinental Exchange Inc 670,164 0.16 4,965 Invesco Ltd 53,399 0.01 3,827 Iron Mountain Inc (REIT) 99,866 0.02 40,801 JPMorgan Chase & Co 3,834,886 0.94 12,951 KeyCorp 157,678 0.04 5,683 Kimco Realty Corp (REIT) 72,941 0.02
5,041 Monster Beverage Corp 349,165 0.09 2,153 Moody’s Corp 591,440 0.15 7,017 Mylan NV 112,939 0.03 4,665 Nielsen Holdings Plc 69,299 0.02 15,677 PayPal Holdings Inc 2,731,560 0.67 18,534 PepsiCo Inc 2,450,658 0.60 1,812 Perrigo Co Plc 100,140 0.02 74,138 Pfizer Inc 2,423,942 0.60 20,790 Philip Morris International Inc 1,455,300 0.36 33,077 Procter & Gamble Co/The 3,951,875 0.97 1,913 Quanta Services Inc 75,037 0.02 1,811 Quest Diagnostics Inc 206,499 0.05 1,343 Regeneron Pharmaceuticals Inc 836,857 0.21 1,930 ResMed Inc 370,357 0.09 1,569 Robert Half International Inc 82,875 0.02 1,795 Rollins Inc 76,045 0.02 3,221 S&P Global Inc 1,060,337 0.26 1,143 STERIS Plc 175,359 0.04 4,289 Stryker Corp 772,749 0.19 6,738 Sysco Corp 368,131 0.09 623 Teleflex Inc 226,750 0.06 5,282 Thermo Fisher Scientific Inc 1,911,635 0.47 3,907 Tyson Foods Inc - Class A 233,228 0.06 966 United Rentals Inc 143,958 0.04 12,661 UnitedHealth Group Inc 3,730,564 0.92 1,043 Universal Health Services Inc 96,921 0.02 1,194 Varian Medical Systems Inc 146,396 0.04 2,164 Verisk Analytics Inc - Class A 368,356 0.09 3,460 Vertex Pharmaceuticals Inc 1,004,974 0.25 981 West Pharmaceutical Services Inc 222,839 0.05 2,758 Zimmer Biomet Holdings Inc 329,126 0.08 6,344 Zoetis Inc 870,143 0.21
Energy - 9,650,104 (31 December 2019: 6,139,523) 9,650,104 2.38
5,002 Apache Corp 67,552 0.02 8,649 Baker Hughes Co - Class A 133,151 0.03 5,175 Cabot Oil & Gas Corp 88,881 0.02 24,959 Chevron Corp 2,227,092 0.55 2,671 Concho Resources Inc 137,503 0.03 14,356 ConocoPhillips 603,167 0.15 5,203 Devon Energy Corp 58,976 0.01 2,134 Diamondback Energy Inc 89,319 0.02 7,765 EOG Resources Inc 393,258 0.10 56,458 Exxon Mobil Corp 2,522,826 0.62 11,479 Halliburton Co 149,055 0.04 3,473 Hess Corp 179,884 0.04 2,053 HollyFrontier Corp 59,917 0.02 25,954 Kinder Morgan Inc 393,463 0.10 10,775 Marathon Oil Corp 65,889 0.02 8,675 Marathon Petroleum Corp 324,141 0.08 5,176 National Oilwell Varco Inc 63,380 0.02 6,118 Noble Energy Inc 54,848 0.01 11,974 Occidental Petroleum Corp 219,064 0.05 5,554 ONEOK Inc 184,337 0.05 5,862 Phillips 66 421,243 0.10 2,166 Pioneer Natural Resources Co 211,607 0.05 18,514 Schlumberger Ltd 340,380 0.08
Equities cont’d.
Consumer, Non-cyclical cont’d.
Equities cont’d.
Energy cont’d.
USDUSD
03613-1A.indd 82 19/08/2020 19:00

83
Schedule of investments – as at 30 June 2020
Holdings Description
Fair value
Total net assets
% Holdings Description
Fair value
Total net assets
%
BNy MELLON DyNAMIC U.S. EQUITy FUND
10,239 CSX Corp 714,426 0.18 4,176 Deere & Co 656,112 0.16 1,903 Dover Corp 183,830 0.05 5,354 Eaton Corp Plc 468,073 0.12 8,036 Emerson Electric Co 498,312 0.12 2,199 Expeditors International of Washington Inc 167,157 0.04 3,207 FedEx Corp 449,333 0.11 1,781 FLIR Systems Inc 72,219 0.02 1,835 Flowserve Corp 52,352 0.01 3,912 Fortive Corp 264,901 0.07 1,889 Fortune Brands Home & Security Inc 120,764 0.03 1,918 Garmin Ltd 186,938 0.05 3,092 General Dynamics Corp 461,914 0.11 116,341 General Electric Co 794,027 0.20 9,389 Honeywell International Inc 1,358,260 0.33 5,200 Howmet Aerospace Inc 82,394 0.02 557 Huntington Ingalls Industries Inc 97,213 0.02 999 IDEX Corp 157,822 0.04 3,847 Illinois Tool Works Inc 671,859 0.17 4,606 Ingersoll Rand Inc 129,544 0.03 1,744 Jacobs Engineering Group Inc 147,882 0.04 1,136 JB Hunt Transport Services Inc 136,729 0.03 9,963 Johnson Controls International plc 340,037 0.08 1,275 Kansas City Southern 190,338 0.05 2,482 Keysight Technologies Inc 250,111 0.06 2,887 L3Harris Technologies Inc 489,823 0.12 3,303 Lockheed Martin Corp 1,205,215 0.30 831 Martin Marietta Materials Inc 171,639 0.04 3,543 Masco Corp 177,859 0.04 322 Mettler-Toledo International Inc 259,384 0.06 3,436 Norfolk Southern Corp 603,533 0.15 2,073 Northrop Grumman Corp 637,313 0.16 1,252 Old Dominion Freight Line Inc 212,258 0.05 5,431 Otis Worldwide Corp 308,698 0.08 1,284 Packaging Corp of America 128,137 0.03 1,699 Parker-Hannifin Corp 311,495 0.08 2,237 Pentair Plc 84,995 0.02 1,461 PerkinElmer Inc 143,317 0.04 19,635 Raytheon Technologies Corp 1,209,418 0.30 2,789 Republic Services Inc - Class A 228,796 0.06 1,545 Rockwell Automation Inc 329,039 0.08 1,393 Roper Technologies Inc 540,853 0.13 2,079 Sealed Air Corp 68,326 0.02 724 Snap-on Inc 100,220 0.02 2,054 Stanley Black & Decker Inc 286,235 0.07 4,417 TE Connectivity Ltd 360,206 0.09 441 Teledyne Technologies Inc 137,050 0.03 3,040 Textron Inc 100,062 0.02 3,168 Trane Technologies Plc 281,857 0.07 671 TransDigm Group Inc 296,485 0.07 9,082 Union Pacific Corp 1,534,313 0.38 9,399 United Parcel Service Inc - Class B 1,044,652 0.26 1,782 Vulcan Materials Co 206,454 0.05 5,183 Waste Management Inc 548,595 0.14 846 Waters Corp 152,589 0.04 2,395 Westinghouse Air Brake Technologies Corp 137,892 0.03 3,445 Westrock Co 97,287 0.02 2,393 Xylem Inc/NY 155,401 0.04
2,523 Lincoln National Corp 92,834 0.02 3,257 Loews Corp 111,699 0.03 1,712 M&T Bank Corp 178,005 0.04 6,807 Marsh & McLennan Cos Inc 730,527 0.18 11,795 Mastercard Inc 3,486,071 0.86 10,323 MetLife Inc 376,944 0.09 1,513 Mid-America Apartment Communities Inc (REIT) 173,503 0.04 15,950 Morgan Stanley 770,465 0.19 1,503 Nasdaq Inc 179,518 0.04 2,786 Northern Trust Corp 220,902 0.05 5,963 People’s United Financial Inc 68,962 0.02 5,684 PNC Financial Services Group Inc/The 597,815 0.15 3,411 Principal Financial Group Inc 141,744 0.03 7,808 Progressive Corp/The 625,187 0.15 9,830 Prologis Inc (REIT) 917,090 0.23 5,313 Prudential Financial Inc 323,509 0.08 2,006 Public Storage (REIT) 384,841 0.09 1,677 Raymond James Financial Inc 115,445 0.03 4,536 Realty Income Corp (REIT) 269,733 0.07 2,253 Regency Centers Corp (REIT) 103,334 0.03 12,841 Regions Financial Corp 142,728 0.04 1,486 SBA Communications Corp (REIT) - Class A 442,471 0.11 4,063 Simon Property Group Inc (REIT) 277,808 0.07 985 SL Green Realty Corp (REIT) 48,565 0.01 4,713 State Street Corp 299,653 0.07 687 SVB Financial Group 148,086 0.04 7,199 Synchrony Financial 159,494 0.04 3,045 T Rowe Price Group Inc 376,240 0.09 3,409 Travelers Cos Inc/The 388,779 0.10 17,968 Truist Financial Corp 674,609 0.17 3,853 UDR Inc (REIT) 143,987 0.04 2,691 Unum Group 44,657 0.01 18,374 US Bancorp 676,439 0.17 4,947 Ventas Inc (REIT) 181,060 0.04 22,557 Visa Inc - Class A 4,352,035 1.07 2,108 Vornado Realty Trust (REIT) 80,515 0.02 1,895 W R Berkley Corp 108,536 0.03 49,977 Wells Fargo & Co 1,278,162 0.31 5,556 Welltower Inc (REIT) 287,384 0.07 5,510 Western Union Co/The 119,154 0.03 10,018 Weyerhaeuser Co (REIT) 224,904 0.06 1,718 Willis Towers Watson Plc 338,205 0.08 2,232 Zions Bancorp NA 75,888 0.02
Industrials - 26,743,067 (31 December 2019: 12,453,557) 26,743,067 6.58
7,681 3M Co 1,197,506 0.29 1,825 A O Smith Corp 86,021 0.02 4,087 Agilent Technologies Inc 361,127 0.09 1,238 Allegion plc 126,530 0.03 21,106 Amcor Plc 215,387 0.05 3,024 AMETEK Inc 270,089 0.07 3,915 Amphenol Corp - Class A 374,724 0.09 4,325 Ball Corp 300,479 0.07 7,157 Boeing Co/The 1,310,590 0.32 10,907 Carrier Global Corp 242,299 0.06 7,243 Caterpillar Inc 915,769 0.23 1,779 CH Robinson Worldwide Inc 140,603 0.03
Equities cont’d.
Financials cont’d.
Equities cont’d.
Industrials cont’d.
USDUSD
03613-1A.indd 83 19/08/2020 19:00
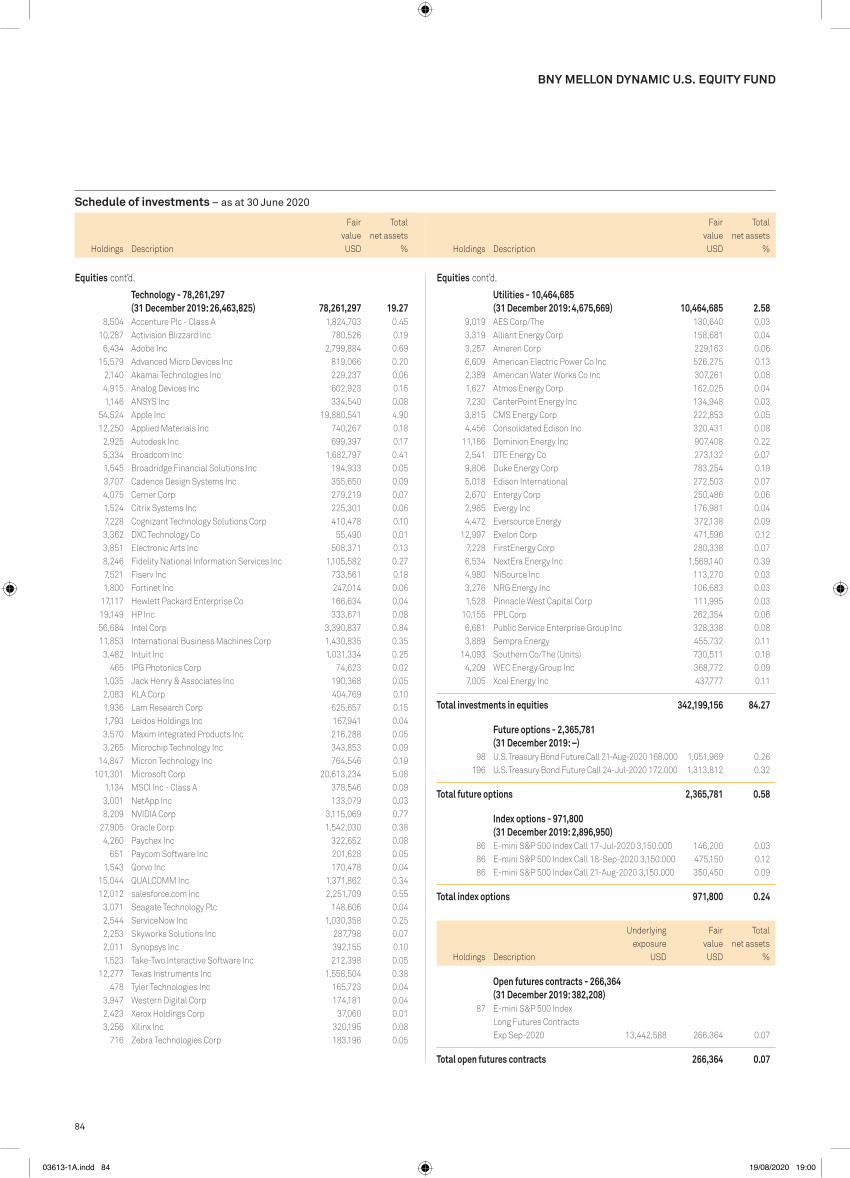
84
Schedule of investments – as at 30 June 2020
Holdings Description
Fair value
Total net assets
% Holdings Description
Fair value
Total net assets
%
BNy MELLON DyNAMIC U.S. EQUITy FUND
Utilities - 10,464,685 (31 December 2019: 4,675,669) 10,464,685 2.58
9,019 AES Corp/The 130,640 0.03 3,319 Alliant Energy Corp 158,681 0.04 3,257 Ameren Corp 229,163 0.06 6,609 American Electric Power Co Inc 526,275 0.13 2,389 American Water Works Co Inc 307,261 0.08 1,627 Atmos Energy Corp 162,025 0.04 7,230 CenterPoint Energy Inc 134,948 0.03 3,815 CMS Energy Corp 222,853 0.05 4,456 Consolidated Edison Inc 320,431 0.08 11,186 Dominion Energy Inc 907,408 0.22 2,541 DTE Energy Co 273,132 0.07 9,806 Duke Energy Corp 783,254 0.19 5,018 Edison International 272,503 0.07 2,670 Entergy Corp 250,486 0.06 2,985 Evergy Inc 176,981 0.04 4,472 Eversource Energy 372,138 0.09 12,997 Exelon Corp 471,596 0.12 7,228 FirstEnergy Corp 280,338 0.07 6,534 NextEra Energy Inc 1,569,140 0.39 4,980 NiSource Inc 113,270 0.03 3,276 NRG Energy Inc 106,683 0.03 1,528 Pinnacle West Capital Corp 111,995 0.03 10,155 PPL Corp 262,354 0.06 6,681 Public Service Enterprise Group Inc 328,338 0.08 3,889 Sempra Energy 455,732 0.11 14,093 Southern Co/The (Units) 730,511 0.18 4,209 WEC Energy Group Inc 368,772 0.09 7,005 Xcel Energy Inc 437,777 0.11
Total investments in equities 342,199,156 84.27
Future options - 2,365,781 (31 December 2019: –)
98 U.S. Treasury Bond Future Call 21-Aug-2020 168.000 1,051,969 0.26 196 U.S. Treasury Bond Future Call 24-Jul-2020 172.000 1,313,812 0.32
Total future options 2,365,781 0.58
Index options - 971,800 (31 December 2019: 2,896,950)
86 E-mini S&P 500 Index Call 17-Jul-2020 3,150.000 146,200 0.03 86 E-mini S&P 500 Index Call 18-Sep-2020 3,150.000 475,150 0.12 86 E-mini S&P 500 Index Call 21-Aug-2020 3,150.000 350,450 0.09
Total index options 971,800 0.24
Holdings Description
Underlying exposure
USD
Fair value USD
Total net assets
%
Open futures contracts - 266,364 (31 December 2019: 382,208)
87 E-mini S&P 500 Index Long Futures Contracts Exp Sep-2020 13,442,588 266,364 0.07
Total open futures contracts 266,364 0.07
Technology - 78,261,297 (31 December 2019: 26,463,825) 78,261,297 19.27
8,504 Accenture Plc - Class A 1,824,703 0.45 10,287 Activision Blizzard Inc 780,526 0.19 6,434 Adobe Inc 2,799,884 0.69 15,579 Advanced Micro Devices Inc 819,066 0.20 2,140 Akamai Technologies Inc 229,237 0.06 4,915 Analog Devices Inc 602,923 0.15 1,146 ANSYS Inc 334,540 0.08 54,524 Apple Inc 19,880,541 4.90 12,250 Applied Materials Inc 740,267 0.18 2,925 Autodesk Inc 699,397 0.17 5,334 Broadcom Inc 1,682,797 0.41 1,545 Broadridge Financial Solutions Inc 194,933 0.05 3,707 Cadence Design Systems Inc 355,650 0.09 4,075 Cerner Corp 279,219 0.07 1,524 Citrix Systems Inc 225,301 0.06 7,228 Cognizant Technology Solutions Corp 410,478 0.10 3,362 DXC Technology Co 55,490 0.01 3,851 Electronic Arts Inc 508,371 0.13 8,246 Fidelity National Information Services Inc 1,105,582 0.27 7,521 Fiserv Inc 733,561 0.18 1,800 Fortinet Inc 247,014 0.06 17,117 Hewlett Packard Enterprise Co 166,634 0.04 19,149 HP Inc 333,671 0.08 56,684 Intel Corp 3,390,837 0.84 11,853 International Business Machines Corp 1,430,835 0.35 3,482 Intuit Inc 1,031,334 0.25 465 IPG Photonics Corp 74,623 0.02 1,035 Jack Henry & Associates Inc 190,368 0.05 2,083 KLA Corp 404,769 0.10 1,936 Lam Research Corp 625,657 0.15 1,793 Leidos Holdings Inc 167,941 0.04 3,570 Maxim Integrated Products Inc 216,288 0.05 3,265 Microchip Technology Inc 343,853 0.09 14,847 Micron Technology Inc 764,546 0.19 101,301 Microsoft Corp 20,613,234 5.08 1,134 MSCI Inc - Class A 378,546 0.09 3,001 NetApp Inc 133,079 0.03 8,209 NVIDIA Corp 3,115,069 0.77 27,905 Oracle Corp 1,542,030 0.38 4,260 Paychex Inc 322,652 0.08 651 Paycom Software Inc 201,628 0.05 1,543 Qorvo Inc 170,478 0.04 15,044 QUALCOMM Inc 1,371,862 0.34 12,012 salesforce.com Inc 2,251,709 0.55 3,071 Seagate Technology Plc 148,606 0.04 2,544 ServiceNow Inc 1,030,358 0.25 2,253 Skyworks Solutions Inc 287,798 0.07 2,011 Synopsys Inc 392,155 0.10 1,523 Take-Two Interactive Software Inc 212,398 0.05 12,277 Texas Instruments Inc 1,558,504 0.38 478 Tyler Technologies Inc 165,723 0.04 3,947 Western Digital Corp 174,181 0.04 2,423 Xerox Holdings Corp 37,060 0.01 3,256 Xilinx Inc 320,195 0.08 716 Zebra Technologies Corp 183,196 0.05
Equities cont’d. Equities cont’d.
USDUSD
03613-1A.indd 84 19/08/2020 19:00
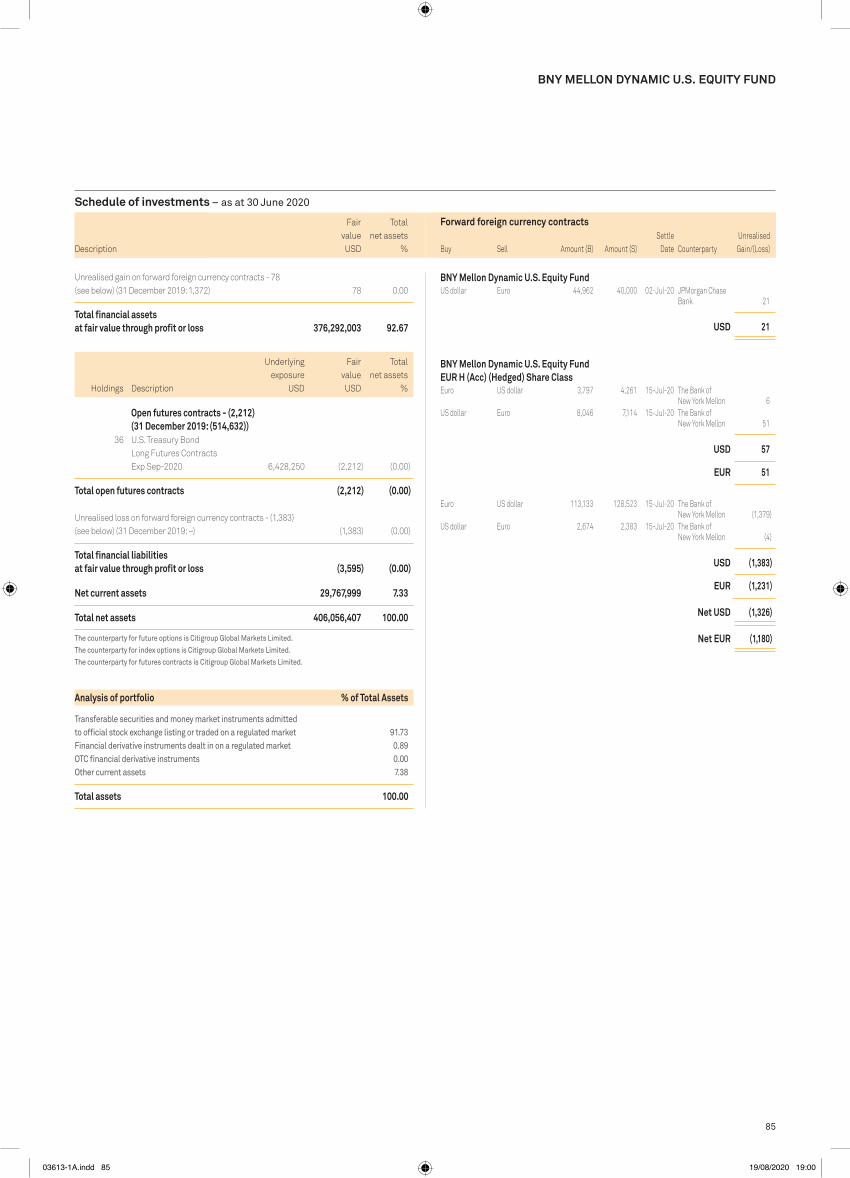
85
Schedule of investments – as at 30 June 2020
Holdings Description
Fair value
Total net assets
% Holdings Description
Fair value
Total net assets
%
BNy MELLON DyNAMIC U.S. EQUITy FUND
Unrealised gain on forward foreign currency contracts - 78 (see below) (31 December 2019: 1,372) 78 0.00
Total financial assets at fair value through profit or loss 376,292,003 92.67
Holdings Description
Underlying exposure
USD
Fair value USD
Total net assets
%
Open futures contracts - (2,212) (31 December 2019: (514,632))
36 U.S. Treasury Bond Long Futures Contracts Exp Sep-2020 6,428,250 (2,212) (0.00)
Total open futures contracts (2,212) (0.00) Unrealised loss on forward foreign currency contracts - (1,383) (see below) (31 December 2019: –) (1,383) (0.00)
Total financial liabilities at fair value through profit or loss (3,595) (0.00)
Net current assets 29,767,999 7.33
Total net assets 406,056,407 100.00
The counterparty for future options is Citigroup Global Markets Limited. The counterparty for index options is Citigroup Global Markets Limited. The counterparty for futures contracts is Citigroup Global Markets Limited.
Analysis of portfolio % of Total Assets
Transferable securities and money market instruments admitted to official stock exchange listing or traded on a regulated market 91.73Financial derivative instruments dealt in on a regulated market 0.89oTC financial derivative instruments 0.00other current assets 7.38
Total assets 100.00
Description
USDUSD
Forward foreign currency contractsUnrealised
Gain/(Loss)Buy Sell Amount (B) Amount (S)Settle
Date Counterparty
BNy Mellon Dynamic U.S. Equity FundUS dollar Euro 44,962 40,000 02-Jul-20 JPMorgan Chase
Bank 21
USD 21
BNy Mellon Dynamic U.S. Equity Fund EUR H (Acc) (Hedged) Share ClassEuro US dollar 3,797 4,261 15-Jul-20 The Bank of
New York Mellon 6US dollar Euro 8,046 7,114 15-Jul-20 The Bank of
New York Mellon 51
USD 57
EUR 51
Euro US dollar 113,133 128,523 15-Jul-20 The Bank of New York Mellon (1,379)
US dollar Euro 2,674 2,383 15-Jul-20 The Bank of New York Mellon (4)
USD (1,383)
EUR (1,231)
Net USD (1,326)
Net EUR (1,180)
03613-1A.indd 85 19/08/2020 19:00

86
Schedule of investments – as at 30 June 2020
Holdings Description
Fair value
Total net assets
% Holdings Description
Fair value
Total net assets
%
FUND 11 – BNy MELLON EFFICIENT GLOBAL IG CORpORATE BETA FUND / NOWy OD 6-2020
BNY MELLON EFFICIENT GLOBAL IG CORPORATE BETA FUND
Bonds
Canadian Dollar - 1,884,313 1,884,313 3.02 5,000 407 International Inc 3.830% 11-May-2046 4,496 0.01 5,000 407 International Inc 5.750% 14-Feb-2036 4,968 0.01 50,000 407 International Inc ‘MTN’ 2.840% 07-Mar-2050 38,482 0.06 5,000 407 International Inc ‘MTN’ 4.680% 07-Oct-2053 5,322 0.01 15,000 407 International Inc ‘MTN’ 5.960% 03-Dec-2035 16,040 0.03 10,000 Algonquin Power Co 4.090% 17-Feb-2027 8,115 0.01 10,000 AltaGas Ltd ‘MTN’ 3.720% 28-Sep-2021 7,581 0.01 10,000 AltaLink LP ‘MTN’ 2.747% 29-May-2026 7,966 0.01 15,000 AltaLink LP ‘MTN’ 4.090% 30-Jun-2045 14,237 0.02 5,000 Anheuser-Busch InBev Finance Inc
4.320% 15-May-2047 3,823 0.01 10,000 Bank of America Corp FRN 2.932% 25-Apr-2025 7,693 0.01 10,000 Bank of Montreal 1.610% 28-Oct-2021 7,446 0.01 25,000 Bank of Montreal 2.270% 11-Jul-2022 18,918 0.03 30,000 Bank of Montreal 2.700% 11-Sep-2024 23,509 0.04 15,000 Bank of Montreal 2.890% 20-Jun-2023 11,663 0.02 50,000 Bank of Montreal 3.190% 01-Mar-2028 41,648 0.07 25,000 Bank of Montreal FRN 2.880% 17-Sep-2029 19,047 0.03 10,000 Bank of Montreal ‘MTN’ 2.370% 03-Feb-2025 7,663 0.01 25,000 Bank of Montreal ‘MTN’ FRN 2.570% 01-Jun-2027 18,808 0.03 10,000 Bank of Nova Scotia/The 1.900% 02-Dec-2021 7,483 0.01 50,000 Bank of Nova Scotia/The 2.160% 03-Feb-2025 37,974 0.06 50,000 Bank of Nova Scotia/The 2.290% 28-Jun-2024 38,583 0.06 50,000 Bank of Nova Scotia/The 2.380% 01-May-2023 38,038 0.06 15,000 Bank of Nova Scotia/The 3.100% 02-Feb-2028 12,412 0.02 50,000 Bank of Nova Scotia/The FRN 2.836% 03-Jul-2029 38,127 0.06 50,000 Bell Canada Inc ‘MTN’ 3.350% 12-Mar-2025 39,719 0.06 15,000 Bell Canada Inc ‘MTN’ 6.170% 26-Feb-2037 15,305 0.02 10,000 BMW Canada Inc 2.150% 26-Nov-2021 7,436 0.01 10,000 Brookfield Asset Management Inc ‘MTN’
4.540% 31-Mar-2023 7,911 0.01 30,000 Brookfield Infrastructure Finance ULC ‘MTN’
3.410% 09-Oct-2029 22,943 0.04 10,000 Brookfield Renewable Partners ULC ‘MTN’
3.630% 15-Jan-2027 7,974 0.01 10,000 Bruce Power LP 3.969% 23-Jun-2026 8,188 0.01 20,000 Canadian Imperial Bank of Commerce
2.300% 11-Jul-2022 15,143 0.02 10,000 Canadian Imperial Bank of Commerce
2.350% 28-Aug-2024 7,638 0.01 20,000 Canadian Imperial Bank of Commerce
2.470% 05-Dec-2022 15,280 0.02 15,000 Canadian Imperial Bank of Commerce
2.970% 11-Jul-2023 11,682 0.02 10,000 Canadian Imperial Bank of Commerce
3.290% 15-Jan-2024 7,856 0.01 30,000 Canadian Imperial Bank of Commerce
3.300% 26-May-2025 24,307 0.04 5,000 Canadian National Railway Co 3.050% 08-Feb-2050 4,010 0.01 50,000 Canadian National Railway Co 3.600% 01-Aug-2047 43,920 0.07 50,000 Canadian Pacific Railway Co ‘MTN’
6.450% 17-Nov-2039 57,351 0.09 10,000 Canadian Tire Corp Ltd ‘MTN’ 6.445% 24-Feb-2034 8,860 0.01 10,000 Canadian Western Bank 2.597% 06-Sep-2024 7,427 0.01 10,000 Canadian Western Bank 2.833% 14-Mar-2022 7,463 0.01 50,000 Choice Properties Real Estate Investment Trust
2.981% 04-Mar-2030 37,213 0.06 10,000 Choice Properties Real Estate Investment Trust
4.293% 08-Feb-2024 7,941 0.01
10,000 CU Inc 2.963% 07-Sep-2049 7,881 0.01 15,000 CU Inc 3.964% 27-Jul-2045 13,738 0.02 10,000 CU Inc 4.085% 02-Sep-2044 9,278 0.02 5,000 CU Inc 4.543% 24-Oct-2041 4,823 0.01 5,000 CU Inc 4.722% 09-Sep-2043 4,993 0.01 50,000 Daimler Canada Finance Inc ‘EMTN’
3.300% 16-Aug-2022 37,832 0.06 50,000 Emera Inc 2.900% 16-Jun-2023 38,032 0.06 5,000 Enbridge Gas Inc ‘MTN’ 4.200% 02-Jun-2044 4,710 0.01 5,000 Enbridge Gas Inc ‘MTN’ 4.500% 23-Nov-2043 4,856 0.01 5,000 Energir Inc 3.530% 16-May-2047 4,463 0.01 5,000 EPCOR Utilities Inc 6.800% 28-Jun-2029 5,142 0.01 5,000 First Capital Real Estate Investment Trust
4.790% 30-Aug-2024 3,866 0.01 10,000 Greater Toronto Airports Authority ‘MTN’
5.300% 25-Feb-2041 10,511 0.02 10,000 Great-West Lifeco Inc 3.337% 28-Feb-2028 8,269 0.01 5,000 Great-West Lifeco Inc 6.740% 24-Nov-2031 5,138 0.01 10,000 Honda Canada Finance Inc 1.823% 07-Dec-2021 7,432 0.01 15,000 Honda Canada Finance Inc 2.500% 04-Jun-2024 11,472 0.02 15,000 Husky Energy Inc 3.550% 12-Mar-2025 11,101 0.02 5,000 Hydro One Inc 7.350% 03-Jun-2030 5,354 0.01 50,000 Hydro One Inc ‘MTN’ 2.540% 05-Apr-2024 38,682 0.06 50,000 Hydro One Inc ‘MTN’ 3.200% 13-Jan-2022 38,105 0.06 10,000 Hydro One Inc ‘MTN’ 3.630% 25-Jun-2049 8,982 0.01 15,000 Hydro One Inc ‘MTN’ 3.720% 18-Nov-2047 13,586 0.02 15,000 Hydro One Inc ‘MTN’ 6.590% 22-Apr-2043 18,658 0.03 5,000 IGM Financial Inc 4.206% 21-Mar-2050 4,034 0.01 15,000 Inter Pipeline Ltd ‘MTN’ 2.608% 13-Sep-2023 11,066 0.02 15,000 Inter Pipeline Ltd ‘MTN’ 4.637% 30-May-2044 10,664 0.02 25,000 John Deere Financial Inc 2.410% 14-Jan-2025 19,273 0.03 10,000 Laurentian Bank of Canada 2.550% 20-Jun-2022 7,417 0.01 10,000 Laurentian Bank of Canada 3.000% 12-Sep-2022 7,456 0.01 5,000 Loblaw Cos Ltd 4.488% 11-Dec-2028 4,401 0.01 20,000 Loblaw Cos Ltd ‘MTN’ 5.900% 18-Jan-2036 19,682 0.03 10,000 Molson Coors International LP 3.440% 15-Jul-2026 7,588 0.01 10,000 Mondelez International Inc 3.250% 07-Mar-2025 7,872 0.01 10,000 National Bank of Canada 2.983% 04-Mar-2024 7,803 0.01 50,000 North West Redwater Partnership /
NWR Financing Co Ltd 4.350% 10-Jan-2039 42,437 0.07 20,000 Pembina Pipeline Corp 4.020% 27-Mar-2028 16,237 0.03 20,000 Pembina Pipeline Corp ‘MTN’ 3.310% 01-Feb-2030 15,426 0.03 10,000 Pembina Pipeline Corp ‘MTN’ 3.430% 10-Nov-2021 7,551 0.01 30,000 Pembina Pipeline Corp ‘MTN’ 4.740% 21-Jan-2047 24,471 0.04 10,000 RioCan Real Estate Investment Trust
3.287% 12-Feb-2024 7,551 0.01 20,000 Rogers Communications Inc 3.250% 01-May-2029 16,102 0.03 20,000 Rogers Communications Inc 4.000% 13-Mar-2024 16,012 0.03 10,000 Rogers Communications Inc ‘MTN’
6.560% 22-Mar-2041 10,991 0.02 50,000 Royal Bank of Canada 1.968% 02-Mar-2022 37,610 0.06 15,000 Royal Bank of Canada 2.328% 28-Jan-2027 11,519 0.02 50,000 Royal Bank of Canada 2.352% 02-Jul-2024 38,202 0.06 25,000 Royal Bank of Canada 2.360% 05-Dec-2022 19,028 0.03 20,000 Royal Bank of Canada 3.296% 26-Sep-2023 15,762 0.03 20,000 Shaw Communications Inc 4.350% 31-Jan-2024 16,111 0.03 5,000 Sun Life Assurance Co of Canada 6.300% 15-May-2028 4,799 0.01 30,000 Sun Life Financial Inc ‘MTN’ FRN
5.400% 29-May-2042 28,094 0.05
Bonds cont’d.
Canadian Dollar cont’d.
^
USDUSD
03613-1A.indd 86 19/08/2020 19:00
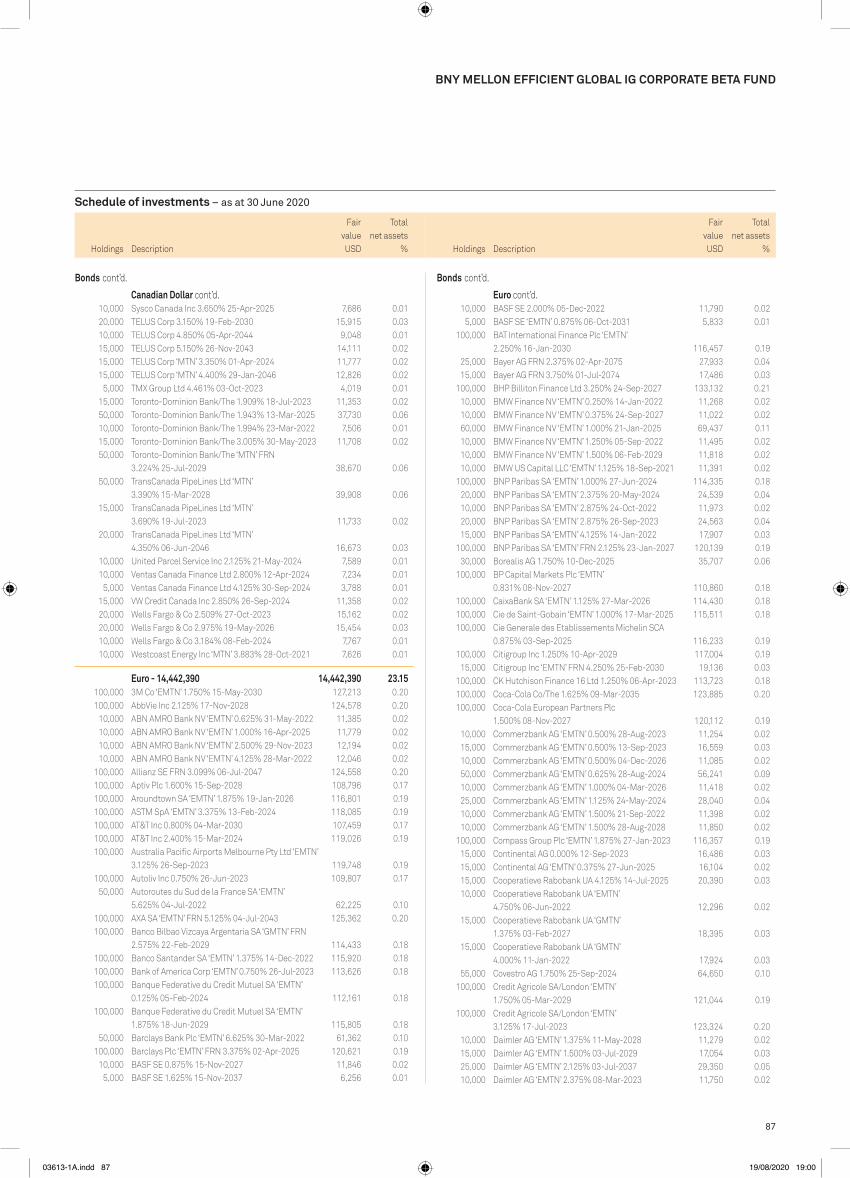
87
Schedule of investments – as at 30 June 2020
Holdings Description
Fair value
Total net assets
% Holdings Description
Fair value
Total net assets
%
BNy MELLON EFFICIENT GLOBAL IG CORpORATE BETA FUND
10,000 BASF SE 2.000% 05-Dec-2022 11,790 0.02 5,000 BASF SE ‘EMTN’ 0.875% 06-Oct-2031 5,833 0.01 100,000 BAT International Finance Plc ‘EMTN’
2.250% 16-Jan-2030 116,457 0.19 25,000 Bayer AG FRN 2.375% 02-Apr-2075 27,933 0.04 15,000 Bayer AG FRN 3.750% 01-Jul-2074 17,486 0.03 100,000 BHP Billiton Finance Ltd 3.250% 24-Sep-2027 133,132 0.21 10,000 BMW Finance NV ‘EMTN’ 0.250% 14-Jan-2022 11,268 0.02 10,000 BMW Finance NV ‘EMTN’ 0.375% 24-Sep-2027 11,022 0.02 60,000 BMW Finance NV ‘EMTN’ 1.000% 21-Jan-2025 69,437 0.11 10,000 BMW Finance NV ‘EMTN’ 1.250% 05-Sep-2022 11,495 0.02 10,000 BMW Finance NV ‘EMTN’ 1.500% 06-Feb-2029 11,818 0.02 10,000 BMW US Capital LLC ‘EMTN’ 1.125% 18-Sep-2021 11,391 0.02 100,000 BNP Paribas SA ‘EMTN’ 1.000% 27-Jun-2024 114,335 0.18 20,000 BNP Paribas SA ‘EMTN’ 2.375% 20-May-2024 24,539 0.04 10,000 BNP Paribas SA ‘EMTN’ 2.875% 24-Oct-2022 11,973 0.02 20,000 BNP Paribas SA ‘EMTN’ 2.875% 26-Sep-2023 24,563 0.04 15,000 BNP Paribas SA ‘EMTN’ 4.125% 14-Jan-2022 17,907 0.03 100,000 BNP Paribas SA ‘EMTN’ FRN 2.125% 23-Jan-2027 120,139 0.19 30,000 Borealis AG 1.750% 10-Dec-2025 35,707 0.06 100,000 BP Capital Markets Plc ‘EMTN’
0.831% 08-Nov-2027 110,860 0.18 100,000 CaixaBank SA ‘EMTN’ 1.125% 27-Mar-2026 114,430 0.18 100,000 Cie de Saint-Gobain ‘EMTN’ 1.000% 17-Mar-2025 115,511 0.18 100,000 Cie Generale des Etablissements Michelin SCA
0.875% 03-Sep-2025 116,233 0.19 100,000 Citigroup Inc 1.250% 10-Apr-2029 117,004 0.19 15,000 Citigroup Inc ‘EMTN’ FRN 4.250% 25-Feb-2030 19,136 0.03 100,000 CK Hutchison Finance 16 Ltd 1.250% 06-Apr-2023 113,723 0.18 100,000 Coca-Cola Co/The 1.625% 09-Mar-2035 123,885 0.20 100,000 Coca-Cola European Partners Plc
1.500% 08-Nov-2027 120,112 0.19 10,000 Commerzbank AG ‘EMTN’ 0.500% 28-Aug-2023 11,254 0.02 15,000 Commerzbank AG ‘EMTN’ 0.500% 13-Sep-2023 16,559 0.03 10,000 Commerzbank AG ‘EMTN’ 0.500% 04-Dec-2026 11,085 0.02 50,000 Commerzbank AG ‘EMTN’ 0.625% 28-Aug-2024 56,241 0.09 10,000 Commerzbank AG ‘EMTN’ 1.000% 04-Mar-2026 11,418 0.02 25,000 Commerzbank AG ‘EMTN’ 1.125% 24-May-2024 28,040 0.04 10,000 Commerzbank AG ‘EMTN’ 1.500% 21-Sep-2022 11,398 0.02 10,000 Commerzbank AG ‘EMTN’ 1.500% 28-Aug-2028 11,850 0.02 100,000 Compass Group Plc ‘EMTN’ 1.875% 27-Jan-2023 116,357 0.19 15,000 Continental AG 0.000% 12-Sep-2023 16,486 0.03 15,000 Continental AG ‘EMTN’ 0.375% 27-Jun-2025 16,104 0.02 15,000 Cooperatieve Rabobank UA 4.125% 14-Jul-2025 20,390 0.03 10,000 Cooperatieve Rabobank UA ‘EMTN’
4.750% 06-Jun-2022 12,296 0.02 15,000 Cooperatieve Rabobank UA ‘GMTN’
1.375% 03-Feb-2027 18,395 0.03 15,000 Cooperatieve Rabobank UA ‘GMTN’
4.000% 11-Jan-2022 17,924 0.03 55,000 Covestro AG 1.750% 25-Sep-2024 64,650 0.10 100,000 Credit Agricole SA/London ‘EMTN’
1.750% 05-Mar-2029 121,044 0.19 100,000 Credit Agricole SA/London ‘EMTN’
3.125% 17-Jul-2023 123,324 0.20 10,000 Daimler AG ‘EMTN’ 1.375% 11-May-2028 11,279 0.02 15,000 Daimler AG ‘EMTN’ 1.500% 03-Jul-2029 17,054 0.03 25,000 Daimler AG ‘EMTN’ 2.125% 03-Jul-2037 29,350 0.05 10,000 Daimler AG ‘EMTN’ 2.375% 08-Mar-2023 11,750 0.02
10,000 Sysco Canada Inc 3.650% 25-Apr-2025 7,686 0.01 20,000 TELUS Corp 3.150% 19-Feb-2030 15,915 0.03 10,000 TELUS Corp 4.850% 05-Apr-2044 9,048 0.01 15,000 TELUS Corp 5.150% 26-Nov-2043 14,111 0.02 15,000 TELUS Corp ‘MTN’ 3.350% 01-Apr-2024 11,777 0.02 15,000 TELUS Corp ‘MTN’ 4.400% 29-Jan-2046 12,826 0.02 5,000 TMX Group Ltd 4.461% 03-Oct-2023 4,019 0.01 15,000 Toronto-Dominion Bank/The 1.909% 18-Jul-2023 11,353 0.02 50,000 Toronto-Dominion Bank/The 1.943% 13-Mar-2025 37,730 0.06 10,000 Toronto-Dominion Bank/The 1.994% 23-Mar-2022 7,506 0.01 15,000 Toronto-Dominion Bank/The 3.005% 30-May-2023 11,708 0.02 50,000 Toronto-Dominion Bank/The ‘MTN’ FRN
3.224% 25-Jul-2029 38,670 0.06 50,000 TransCanada PipeLines Ltd ‘MTN’
3.390% 15-Mar-2028 39,908 0.06 15,000 TransCanada PipeLines Ltd ‘MTN’
3.690% 19-Jul-2023 11,733 0.02 20,000 TransCanada PipeLines Ltd ‘MTN’
4.350% 06-Jun-2046 16,673 0.03 10,000 United Parcel Service Inc 2.125% 21-May-2024 7,589 0.01 10,000 Ventas Canada Finance Ltd 2.800% 12-Apr-2024 7,234 0.01 5,000 Ventas Canada Finance Ltd 4.125% 30-Sep-2024 3,788 0.01 15,000 VW Credit Canada Inc 2.850% 26-Sep-2024 11,358 0.02 20,000 Wells Fargo & Co 2.509% 27-Oct-2023 15,162 0.02 20,000 Wells Fargo & Co 2.975% 19-May-2026 15,454 0.03 10,000 Wells Fargo & Co 3.184% 08-Feb-2024 7,767 0.01 10,000 Westcoast Energy Inc ‘MTN’ 3.883% 28-Oct-2021 7,626 0.01
Euro - 14,442,390 14,442,390 23.15 100,000 3M Co ‘EMTN’ 1.750% 15-May-2030 127,213 0.20 100,000 AbbVie Inc 2.125% 17-Nov-2028 124,578 0.20 10,000 ABN AMRO Bank NV ‘EMTN’ 0.625% 31-May-2022 11,385 0.02 10,000 ABN AMRO Bank NV ‘EMTN’ 1.000% 16-Apr-2025 11,779 0.02 10,000 ABN AMRO Bank NV ‘EMTN’ 2.500% 29-Nov-2023 12,194 0.02 10,000 ABN AMRO Bank NV ‘EMTN’ 4.125% 28-Mar-2022 12,046 0.02 100,000 Allianz SE FRN 3.099% 06-Jul-2047 124,558 0.20 100,000 Aptiv Plc 1.600% 15-Sep-2028 108,796 0.17 100,000 Aroundtown SA ‘EMTN’ 1.875% 19-Jan-2026 116,801 0.19 100,000 ASTM SpA ‘EMTN’ 3.375% 13-Feb-2024 118,085 0.19 100,000 AT&T Inc 0.800% 04-Mar-2030 107,459 0.17 100,000 AT&T Inc 2.400% 15-Mar-2024 119,026 0.19 100,000 Australia Pacific Airports Melbourne Pty Ltd ‘EMTN’
3.125% 26-Sep-2023 119,748 0.19 100,000 Autoliv Inc 0.750% 26-Jun-2023 109,807 0.17 50,000 Autoroutes du Sud de la France SA ‘EMTN’
5.625% 04-Jul-2022 62,225 0.10 100,000 AXA SA ‘EMTN’ FRN 5.125% 04-Jul-2043 125,362 0.20 100,000 Banco Bilbao Vizcaya Argentaria SA ‘GMTN’ FRN
2.575% 22-Feb-2029 114,433 0.18 100,000 Banco Santander SA ‘EMTN’ 1.375% 14-Dec-2022 115,920 0.18 100,000 Bank of America Corp ‘EMTN’ 0.750% 26-Jul-2023 113,626 0.18 100,000 Banque Federative du Credit Mutuel SA ‘EMTN’
0.125% 05-Feb-2024 112,161 0.18 100,000 Banque Federative du Credit Mutuel SA ‘EMTN’
1.875% 18-Jun-2029 115,805 0.18 50,000 Barclays Bank Plc ‘EMTN’ 6.625% 30-Mar-2022 61,362 0.10 100,000 Barclays Plc ‘EMTN’ FRN 3.375% 02-Apr-2025 120,621 0.19 10,000 BASF SE 0.875% 15-Nov-2027 11,846 0.02 5,000 BASF SE 1.625% 15-Nov-2037 6,256 0.01
Bonds cont’d.
Canadian Dollar cont’d.
Bonds cont’d.
Euro cont’d.
USDUSD
03613-1A.indd 87 19/08/2020 19:00
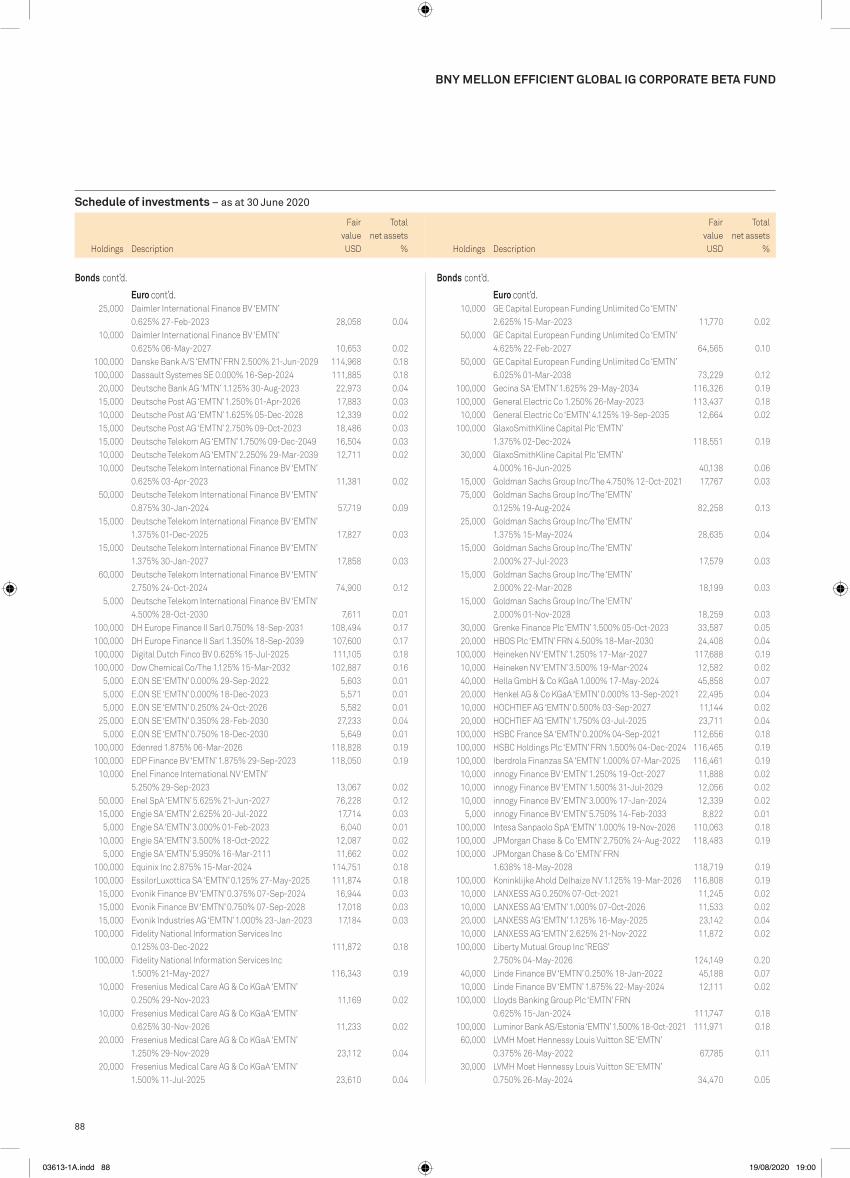
88
Schedule of investments – as at 30 June 2020
Holdings Description
Fair value
Total net assets
% Holdings Description
Fair value
Total net assets
%
BNy MELLON EFFICIENT GLOBAL IG CORpORATE BETA FUND
10,000 GE Capital European Funding Unlimited Co ‘EMTN’ 2.625% 15-Mar-2023 11,770 0.02
50,000 GE Capital European Funding Unlimited Co ‘EMTN’ 4.625% 22-Feb-2027 64,565 0.10
50,000 GE Capital European Funding Unlimited Co ‘EMTN’ 6.025% 01-Mar-2038 73,229 0.12
100,000 Gecina SA ‘EMTN’ 1.625% 29-May-2034 116,326 0.19 100,000 General Electric Co 1.250% 26-May-2023 113,437 0.18 10,000 General Electric Co ‘EMTN’ 4.125% 19-Sep-2035 12,664 0.02 100,000 GlaxoSmithKline Capital Plc ‘EMTN’
1.375% 02-Dec-2024 118,551 0.19 30,000 GlaxoSmithKline Capital Plc ‘EMTN’
4.000% 16-Jun-2025 40,138 0.06 15,000 Goldman Sachs Group Inc/The 4.750% 12-Oct-2021 17,767 0.03 75,000 Goldman Sachs Group Inc/The ‘EMTN’
0.125% 19-Aug-2024 82,258 0.13 25,000 Goldman Sachs Group Inc/The ‘EMTN’
1.375% 15-May-2024 28,635 0.04 15,000 Goldman Sachs Group Inc/The ‘EMTN’
2.000% 27-Jul-2023 17,579 0.03 15,000 Goldman Sachs Group Inc/The ‘EMTN’
2.000% 22-Mar-2028 18,199 0.03 15,000 Goldman Sachs Group Inc/The ‘EMTN’
2.000% 01-Nov-2028 18,259 0.03 30,000 Grenke Finance Plc ‘EMTN’ 1.500% 05-Oct-2023 33,587 0.05 20,000 HBOS Plc ‘EMTN’ FRN 4.500% 18-Mar-2030 24,408 0.04 100,000 Heineken NV ‘EMTN’ 1.250% 17-Mar-2027 117,688 0.19 10,000 Heineken NV ‘EMTN’ 3.500% 19-Mar-2024 12,582 0.02 40,000 Hella GmbH & Co KGaA 1.000% 17-May-2024 45,858 0.07 20,000 Henkel AG & Co KGaA ‘EMTN’ 0.000% 13-Sep-2021 22,495 0.04 10,000 HOCHTIEF AG ‘EMTN’ 0.500% 03-Sep-2027 11,144 0.02 20,000 HOCHTIEF AG ‘EMTN’ 1.750% 03-Jul-2025 23,711 0.04 100,000 HSBC France SA ‘EMTN’ 0.200% 04-Sep-2021 112,656 0.18 100,000 HSBC Holdings Plc ‘EMTN’ FRN 1.500% 04-Dec-2024 116,465 0.19 100,000 Iberdrola Finanzas SA ‘EMTN’ 1.000% 07-Mar-2025 116,461 0.19 10,000 innogy Finance BV ‘EMTN’ 1.250% 19-Oct-2027 11,888 0.02 10,000 innogy Finance BV ‘EMTN’ 1.500% 31-Jul-2029 12,056 0.02 10,000 innogy Finance BV ‘EMTN’ 3.000% 17-Jan-2024 12,339 0.02 5,000 innogy Finance BV ‘EMTN’ 5.750% 14-Feb-2033 8,822 0.01 100,000 Intesa Sanpaolo SpA ‘EMTN’ 1.000% 19-Nov-2026 110,063 0.18 100,000 JPMorgan Chase & Co ‘EMTN’ 2.750% 24-Aug-2022 118,483 0.19 100,000 JPMorgan Chase & Co ‘EMTN’ FRN
1.638% 18-May-2028 118,719 0.19 100,000 Koninklijke Ahold Delhaize NV 1.125% 19-Mar-2026 116,808 0.19 10,000 LANXESS AG 0.250% 07-Oct-2021 11,245 0.02 10,000 LANXESS AG ‘EMTN’ 1.000% 07-Oct-2026 11,533 0.02 20,000 LANXESS AG ‘EMTN’ 1.125% 16-May-2025 23,142 0.04 10,000 LANXESS AG ‘EMTN’ 2.625% 21-Nov-2022 11,872 0.02 100,000 Liberty Mutual Group Inc ‘REGS’
2.750% 04-May-2026 124,149 0.20 40,000 Linde Finance BV ‘EMTN’ 0.250% 18-Jan-2022 45,188 0.07 10,000 Linde Finance BV ‘EMTN’ 1.875% 22-May-2024 12,111 0.02 100,000 Lloyds Banking Group Plc ‘EMTN’ FRN
0.625% 15-Jan-2024 111,747 0.18 100,000 Luminor Bank AS/Estonia ‘EMTN’ 1.500% 18-Oct-2021 111,971 0.18 60,000 LVMH Moet Hennessy Louis Vuitton SE ‘EMTN’
0.375% 26-May-2022 67,785 0.11 30,000 LVMH Moet Hennessy Louis Vuitton SE ‘EMTN’
0.750% 26-May-2024 34,470 0.05
25,000 Daimler International Finance BV ‘EMTN’ 0.625% 27-Feb-2023 28,058 0.04
10,000 Daimler International Finance BV ‘EMTN’ 0.625% 06-May-2027 10,653 0.02
100,000 Danske Bank A/S ‘EMTN’ FRN 2.500% 21-Jun-2029 114,968 0.18 100,000 Dassault Systemes SE 0.000% 16-Sep-2024 111,885 0.18 20,000 Deutsche Bank AG ‘MTN’ 1.125% 30-Aug-2023 22,973 0.04 15,000 Deutsche Post AG ‘EMTN’ 1.250% 01-Apr-2026 17,883 0.03 10,000 Deutsche Post AG ‘EMTN’ 1.625% 05-Dec-2028 12,339 0.02 15,000 Deutsche Post AG ‘EMTN’ 2.750% 09-Oct-2023 18,486 0.03 15,000 Deutsche Telekom AG ‘EMTN’ 1.750% 09-Dec-2049 16,504 0.03 10,000 Deutsche Telekom AG ‘EMTN’ 2.250% 29-Mar-2039 12,711 0.02 10,000 Deutsche Telekom International Finance BV ‘EMTN’
0.625% 03-Apr-2023 11,381 0.02 50,000 Deutsche Telekom International Finance BV ‘EMTN’
0.875% 30-Jan-2024 57,719 0.09 15,000 Deutsche Telekom International Finance BV ‘EMTN’
1.375% 01-Dec-2025 17,827 0.03 15,000 Deutsche Telekom International Finance BV ‘EMTN’
1.375% 30-Jan-2027 17,858 0.03 60,000 Deutsche Telekom International Finance BV ‘EMTN’
2.750% 24-Oct-2024 74,900 0.12 5,000 Deutsche Telekom International Finance BV ‘EMTN’
4.500% 28-Oct-2030 7,611 0.01 100,000 DH Europe Finance II Sarl 0.750% 18-Sep-2031 108,494 0.17 100,000 DH Europe Finance II Sarl 1.350% 18-Sep-2039 107,600 0.17 100,000 Digital Dutch Finco BV 0.625% 15-Jul-2025 111,105 0.18 100,000 Dow Chemical Co/The 1.125% 15-Mar-2032 102,887 0.16 5,000 E.ON SE ‘EMTN’ 0.000% 29-Sep-2022 5,603 0.01 5,000 E.ON SE ‘EMTN’ 0.000% 18-Dec-2023 5,571 0.01 5,000 E.ON SE ‘EMTN’ 0.250% 24-Oct-2026 5,582 0.01 25,000 E.ON SE ‘EMTN’ 0.350% 28-Feb-2030 27,233 0.04 5,000 E.ON SE ‘EMTN’ 0.750% 18-Dec-2030 5,649 0.01 100,000 Edenred 1.875% 06-Mar-2026 118,828 0.19 100,000 EDP Finance BV ‘EMTN’ 1.875% 29-Sep-2023 118,050 0.19 10,000 Enel Finance International NV ‘EMTN’
5.250% 29-Sep-2023 13,067 0.02 50,000 Enel SpA ‘EMTN’ 5.625% 21-Jun-2027 76,228 0.12 15,000 Engie SA ‘EMTN’ 2.625% 20-Jul-2022 17,714 0.03 5,000 Engie SA ‘EMTN’ 3.000% 01-Feb-2023 6,040 0.01 10,000 Engie SA ‘EMTN’ 3.500% 18-Oct-2022 12,087 0.02 5,000 Engie SA ‘EMTN’ 5.950% 16-Mar-2111 11,662 0.02 100,000 Equinix Inc 2.875% 15-Mar-2024 114,751 0.18 100,000 EssilorLuxottica SA ‘EMTN’ 0.125% 27-May-2025 111,874 0.18 15,000 Evonik Finance BV ‘EMTN’ 0.375% 07-Sep-2024 16,944 0.03 15,000 Evonik Finance BV ‘EMTN’ 0.750% 07-Sep-2028 17,018 0.03 15,000 Evonik Industries AG ‘EMTN’ 1.000% 23-Jan-2023 17,184 0.03 100,000 Fidelity National Information Services Inc
0.125% 03-Dec-2022 111,872 0.18 100,000 Fidelity National Information Services Inc
1.500% 21-May-2027 116,343 0.19 10,000 Fresenius Medical Care AG & Co KGaA ‘EMTN’
0.250% 29-Nov-2023 11,169 0.02 10,000 Fresenius Medical Care AG & Co KGaA ‘EMTN’
0.625% 30-Nov-2026 11,233 0.02 20,000 Fresenius Medical Care AG & Co KGaA ‘EMTN’
1.250% 29-Nov-2029 23,112 0.04 20,000 Fresenius Medical Care AG & Co KGaA ‘EMTN’
1.500% 11-Jul-2025 23,610 0.04
Bonds cont’d.
Euro cont’d.
Bonds cont’d.
Euro cont’d.
USDUSD
03613-1A.indd 88 19/08/2020 19:00
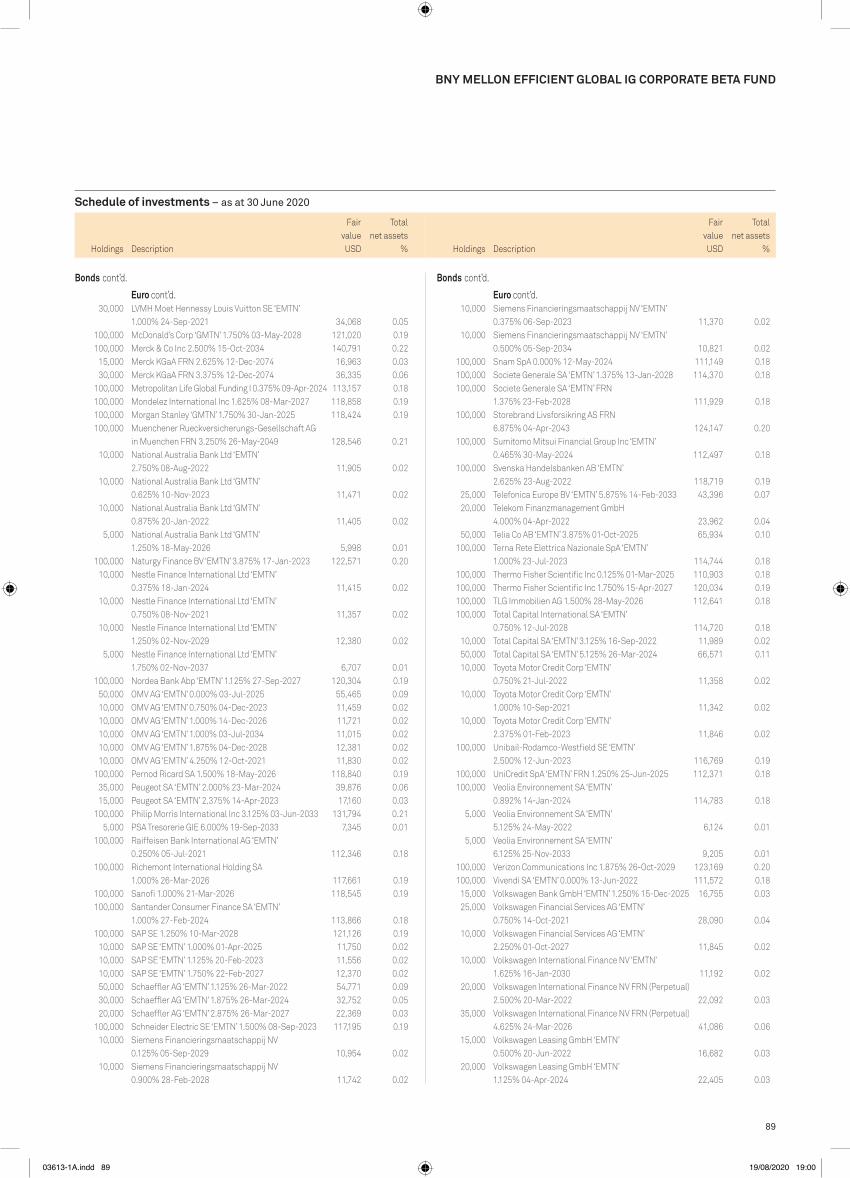
89
Schedule of investments – as at 30 June 2020
Holdings Description
Fair value
Total net assets
% Holdings Description
Fair value
Total net assets
%
BNy MELLON EFFICIENT GLOBAL IG CORpORATE BETA FUND
10,000 Siemens Financieringsmaatschappij NV ‘EMTN’ 0.375% 06-Sep-2023 11,370 0.02
10,000 Siemens Financieringsmaatschappij NV ‘EMTN’ 0.500% 05-Sep-2034 10,821 0.02
100,000 Snam SpA 0.000% 12-May-2024 111,149 0.18 100,000 Societe Generale SA ‘EMTN’ 1.375% 13-Jan-2028 114,370 0.18 100,000 Societe Generale SA ‘EMTN’ FRN
1.375% 23-Feb-2028 111,929 0.18 100,000 Storebrand Livsforsikring AS FRN
6.875% 04-Apr-2043 124,147 0.20 100,000 Sumitomo Mitsui Financial Group Inc ‘EMTN’
0.465% 30-May-2024 112,497 0.18 100,000 Svenska Handelsbanken AB ‘EMTN’
2.625% 23-Aug-2022 118,719 0.19 25,000 Telefonica Europe BV ‘EMTN’ 5.875% 14-Feb-2033 43,396 0.07 20,000 Telekom Finanzmanagement GmbH
4.000% 04-Apr-2022 23,962 0.04 50,000 Telia Co AB ‘EMTN’ 3.875% 01-Oct-2025 65,934 0.10 100,000 Terna Rete Elettrica Nazionale SpA ‘EMTN’
1.000% 23-Jul-2023 114,744 0.18 100,000 Thermo Fisher Scientific Inc 0.125% 01-Mar-2025 110,903 0.18 100,000 Thermo Fisher Scientific Inc 1.750% 15-Apr-2027 120,034 0.19 100,000 TLG Immobilien AG 1.500% 28-May-2026 112,641 0.18 100,000 Total Capital International SA ‘EMTN’
0.750% 12-Jul-2028 114,720 0.18 10,000 Total Capital SA ‘EMTN’ 3.125% 16-Sep-2022 11,989 0.02 50,000 Total Capital SA ‘EMTN’ 5.125% 26-Mar-2024 66,571 0.11 10,000 Toyota Motor Credit Corp ‘EMTN’
0.750% 21-Jul-2022 11,358 0.02 10,000 Toyota Motor Credit Corp ‘EMTN’
1.000% 10-Sep-2021 11,342 0.02 10,000 Toyota Motor Credit Corp ‘EMTN’
2.375% 01-Feb-2023 11,846 0.02 100,000 Unibail-Rodamco-Westfield SE ‘EMTN’
2.500% 12-Jun-2023 116,769 0.19 100,000 UniCredit SpA ‘EMTN’ FRN 1.250% 25-Jun-2025 112,371 0.18 100,000 Veolia Environnement SA ‘EMTN’
0.892% 14-Jan-2024 114,783 0.18 5,000 Veolia Environnement SA ‘EMTN’
5.125% 24-May-2022 6,124 0.01 5,000 Veolia Environnement SA ‘EMTN’
6.125% 25-Nov-2033 9,205 0.01 100,000 Verizon Communications Inc 1.875% 26-Oct-2029 123,169 0.20 100,000 Vivendi SA ‘EMTN’ 0.000% 13-Jun-2022 111,572 0.18 15,000 Volkswagen Bank GmbH ‘EMTN’ 1.250% 15-Dec-2025 16,755 0.03 25,000 Volkswagen Financial Services AG ‘EMTN’
0.750% 14-Oct-2021 28,090 0.04 10,000 Volkswagen Financial Services AG ‘EMTN’
2.250% 01-Oct-2027 11,845 0.02 10,000 Volkswagen International Finance NV ‘EMTN’
1.625% 16-Jan-2030 11,192 0.02 20,000 Volkswagen International Finance NV FRN (Perpetual)
2.500% 20-Mar-2022 22,092 0.03 35,000 Volkswagen International Finance NV FRN (Perpetual)
4.625% 24-Mar-2026 41,086 0.06 15,000 Volkswagen Leasing GmbH ‘EMTN’
0.500% 20-Jun-2022 16,682 0.03 20,000 Volkswagen Leasing GmbH ‘EMTN’
1.125% 04-Apr-2024 22,405 0.03
30,000 LVMH Moet Hennessy Louis Vuitton SE ‘EMTN’ 1.000% 24-Sep-2021 34,068 0.05
100,000 McDonald’s Corp ‘GMTN’ 1.750% 03-May-2028 121,020 0.19 100,000 Merck & Co Inc 2.500% 15-Oct-2034 140,791 0.22 15,000 Merck KGaA FRN 2.625% 12-Dec-2074 16,963 0.03 30,000 Merck KGaA FRN 3.375% 12-Dec-2074 36,335 0.06 100,000 Metropolitan Life Global Funding I 0.375% 09-Apr-2024 113,157 0.18 100,000 Mondelez International Inc 1.625% 08-Mar-2027 118,858 0.19 100,000 Morgan Stanley ‘GMTN’ 1.750% 30-Jan-2025 118,424 0.19 100,000 Muenchener Rueckversicherungs-Gesellschaft AG
in Muenchen FRN 3.250% 26-May-2049 128,546 0.21 10,000 National Australia Bank Ltd ‘EMTN’
2.750% 08-Aug-2022 11,905 0.02 10,000 National Australia Bank Ltd ‘GMTN’
0.625% 10-Nov-2023 11,471 0.02 10,000 National Australia Bank Ltd ‘GMTN’
0.875% 20-Jan-2022 11,405 0.02 5,000 National Australia Bank Ltd ‘GMTN’
1.250% 18-May-2026 5,998 0.01 100,000 Naturgy Finance BV ‘EMTN’ 3.875% 17-Jan-2023 122,571 0.20 10,000 Nestle Finance International Ltd ‘EMTN’
0.375% 18-Jan-2024 11,415 0.02 10,000 Nestle Finance International Ltd ‘EMTN’
0.750% 08-Nov-2021 11,357 0.02 10,000 Nestle Finance International Ltd ‘EMTN’
1.250% 02-Nov-2029 12,380 0.02 5,000 Nestle Finance International Ltd ‘EMTN’
1.750% 02-Nov-2037 6,707 0.01 100,000 Nordea Bank Abp ‘EMTN’ 1.125% 27-Sep-2027 120,304 0.19 50,000 OMV AG ‘EMTN’ 0.000% 03-Jul-2025 55,465 0.09 10,000 OMV AG ‘EMTN’ 0.750% 04-Dec-2023 11,459 0.02 10,000 OMV AG ‘EMTN’ 1.000% 14-Dec-2026 11,721 0.02 10,000 OMV AG ‘EMTN’ 1.000% 03-Jul-2034 11,015 0.02 10,000 OMV AG ‘EMTN’ 1.875% 04-Dec-2028 12,381 0.02 10,000 OMV AG ‘EMTN’ 4.250% 12-Oct-2021 11,830 0.02 100,000 Pernod Ricard SA 1.500% 18-May-2026 118,840 0.19 35,000 Peugeot SA ‘EMTN’ 2.000% 23-Mar-2024 39,876 0.06 15,000 Peugeot SA ‘EMTN’ 2.375% 14-Apr-2023 17,160 0.03 100,000 Philip Morris International Inc 3.125% 03-Jun-2033 131,794 0.21 5,000 PSA Tresorerie GIE 6.000% 19-Sep-2033 7,345 0.01 100,000 Raiffeisen Bank International AG ‘EMTN’
0.250% 05-Jul-2021 112,346 0.18 100,000 Richemont International Holding SA
1.000% 26-Mar-2026 117,661 0.19 100,000 Sanofi 1.000% 21-Mar-2026 118,545 0.19 100,000 Santander Consumer Finance SA ‘EMTN’
1.000% 27-Feb-2024 113,866 0.18 100,000 SAP SE 1.250% 10-Mar-2028 121,126 0.19 10,000 SAP SE ‘EMTN’ 1.000% 01-Apr-2025 11,750 0.02 10,000 SAP SE ‘EMTN’ 1.125% 20-Feb-2023 11,556 0.02 10,000 SAP SE ‘EMTN’ 1.750% 22-Feb-2027 12,370 0.02 50,000 Schaeffler AG ‘EMTN’ 1.125% 26-Mar-2022 54,771 0.09 30,000 Schaeffler AG ‘EMTN’ 1.875% 26-Mar-2024 32,752 0.05 20,000 Schaeffler AG ‘EMTN’ 2.875% 26-Mar-2027 22,369 0.03 100,000 Schneider Electric SE ‘EMTN’ 1.500% 08-Sep-2023 117,195 0.19 10,000 Siemens Financieringsmaatschappij NV
0.125% 05-Sep-2029 10,954 0.02 10,000 Siemens Financieringsmaatschappij NV
0.900% 28-Feb-2028 11,742 0.02
Bonds cont’d.
Euro cont’d.
Bonds cont’d.
Euro cont’d.
USDUSD
03613-1A.indd 89 19/08/2020 19:00

90
Schedule of investments – as at 30 June 2020
Holdings Description
Fair value
Total net assets
% Holdings Description
Fair value
Total net assets
%
BNy MELLON EFFICIENT GLOBAL IG CORpORATE BETA FUND
30,000 Legal & General Finance Plc ‘EMTN’ 5.875% 11-Dec-2031 54,399 0.09
100,000 Liberty Living Finance Plc 2.625% 28-Nov-2024 125,510 0.20 5,000 Lloyds Bank Plc 9.625% 06-Apr-2023 7,420 0.01 10,000 Lloyds Bank Plc ‘EMTN’ 6.500% 17-Sep-2040 21,497 0.04 15,000 Lloyds Bank Plc ‘EMTN’ 7.625% 22-Apr-2025 23,034 0.04 50,000 London & Quadrant Housing Trust
5.500% 27-Jan-2040 94,973 0.15 8,000 McDonald’s Corp ‘EMTN’ 5.875% 23-Apr-2032 14,421 0.02 50,000 Motability Operations Group Plc ‘EMTN’
5.375% 28-Jun-2022 67,529 0.11 50,000 Orange SA ‘EMTN’ 5.375% 22-Nov-2050 107,996 0.17 10,000 Prudential Plc ‘EMTN’ 6.125% 19-Dec-2031 15,998 0.03 5,000 Severn Trent Utilities Finance Plc
6.250% 07-Jun-2029 8,808 0.01 50,000 Sky Ltd ‘EMTN’ 6.000% 21-May-2027 82,564 0.13 10,000 South Eastern Power Networks Plc ‘EMTN’
5.500% 05-Jun-2026 15,347 0.03 15,000 SSE Plc 5.875% 22-Sep-2022 20,631 0.03 10,000 Sunderland SHG Finance Plc 6.380% 31-Mar-2042 18,153 0.03 50,000 Thames Water Utilities Finance Plc ‘EMTN’
5.125% 28-Sep-2037 88,627 0.14 10,000 Thames Water Utilities Finance Plc ‘EMTN’
6.750% 16-Nov-2028 17,326 0.03 20,000 THFC Funding No 1 Plc 5.125% 21-Dec-2035 36,293 0.06 5,000 United Utilities Water Ltd ‘EMTN’ 5.625% 20-Dec-2027 8,216 0.01 100,000 Verizon Communications Inc 2.500% 08-Apr-2031 136,169 0.22 5,000 Vodafone Group Plc ‘EMTN’ 5.625% 04-Dec-2025 7,683 0.01 10,000 Volkswagen Financial Services NV ‘EMTN’
1.750% 12-Sep-2022 12,461 0.02 5,000 Volkswagen Financial Services NV ‘EMTN’
2.250% 12-Apr-2025 6,325 0.01 10,000 Walmart Inc 5.250% 28-Sep-2035 19,519 0.03 50,000 Wellcome Trust Finance Plc 4.625% 25-Jul-2036 98,747 0.16 50,000 Wells Fargo Bank NA ‘EMTN’ 5.250% 01-Aug-2023 68,904 0.11 5,000 Wessex Water Services Finance Plc
5.375% 10-Mar-2028 8,056 0.01
US Dollar - 42,922,067 42,922,067 68.81 60,000 3M Co 2.375% 26-Aug-2029 64,897 0.10 50,000 3M Co 2.650% 15-Apr-2025 54,109 0.09 50,000 3M Co 3.050% 15-Apr-2030 56,677 0.09 5,000 3M Co ‘MTN’ 2.250% 15-Mar-2023 5,228 0.01 30,000 3M Co ‘MTN’ 2.250% 19-Sep-2026 32,336 0.05 30,000 3M Co ‘MTN’ 3.000% 07-Aug-2025 33,241 0.05 5,000 3M Co ‘MTN’ 5.700% 15-Mar-2037 7,108 0.01 10,000 ABB Finance USA Inc 2.875% 08-May-2022 10,390 0.02 50,000 Abbott Laboratories 1.150% 30-Jan-2028 50,168 0.08 50,000 Abbott Laboratories 1.400% 30-Jun-2030 49,822 0.08 15,000 Abbott Laboratories 3.400% 30-Nov-2023 16,347 0.03 40,000 Abbott Laboratories 3.875% 15-Sep-2025 46,076 0.07 20,000 Abbott Laboratories 6.000% 01-Apr-2039 30,074 0.05 10,000 Abbott Laboratories 6.150% 30-Nov-2037 15,219 0.02 35,000 AbbVie Inc 2.900% 06-Nov-2022 36,735 0.06 15,000 AbbVie Inc 3.375% 14-Nov-2021 15,544 0.02 60,000 AbbVie Inc 3.600% 14-May-2025 66,389 0.11 40,000 AbbVie Inc 3.750% 14-Nov-2023 43,504 0.07 40,000 AbbVie Inc 4.250% 14-Nov-2028 46,851 0.08 10,000 AbbVie Inc 4.400% 06-Nov-2042 11,986 0.02
15,000 Volkswagen Leasing GmbH ‘EMTN’ 2.125% 04-Apr-2022 17,196 0.03
15,000 Vonovia Finance BV 1.500% 31-Mar-2025 17,696 0.03 60,000 Vonovia Finance BV 2.125% 09-Jul-2022 69,881 0.11 100,000 Vonovia Finance BV ‘EMTN’ 0.500% 14-Sep-2029 108,414 0.17 100,000 Wells Fargo & Co ‘EMTN’ 1.375% 26-Oct-2026 116,126 0.19 100,000 Westpac Banking Corp ‘EMTN’ 0.875% 17-Apr-2027 118,108 0.19 100,000 WPC Eurobond BV 2.250% 09-Apr-2026 117,982 0.19 20,000 Wurth Finance International BV ‘EMTN’
1.000% 26-May-2025 23,293 0.04
Sterling - 2,888,888 2,888,888 4.63 50,000 Affinity Sutton Capital Markets Plc ‘EMTN’
5.981% 17-Sep-2038 101,851 0.16 5,000 Anheuser-Busch InBev SA/NV ‘EMTN’
1.750% 07-Mar-2025 6,398 0.01 5,000 Anheuser-Busch InBev SA/NV ‘EMTN’
2.250% 24-May-2029 6,425 0.01 5,000 Anheuser-Busch InBev SA/NV ‘EMTN’
2.850% 25-May-2037 6,624 0.01 50,000 AT&T Inc ‘EMTN’ 7.000% 30-Apr-2040 100,896 0.16 10,000 Aviva Plc FRN 6.125% 14-Nov-2036 14,648 0.02 10,000 Aviva Plc FRN (Perpetual) 6.125% 29-Sep-2022 13,258 0.02 50,000 AXA SA ‘EMTN’ FRN (Perpetual) 6.686% 06-Jul-2026 73,637 0.12 20,000 Barclays Bank Plc 9.500% 07-Aug-2021 26,674 0.04 35,000 Barclays Bank Plc ‘EMTN’ 5.750% 14-Sep-2026 50,703 0.08 50,000 BAT International Finance Plc ‘EMTN’
7.250% 12-Mar-2024 75,146 0.12 20,000 Citigroup Inc ‘EMTN’ 5.150% 21-May-2026 29,938 0.05 50,000 Cooperatieve Rabobank UA ‘EMTN’
4.875% 10-Jan-2023 68,253 0.11 100,000 Credit Suisse Group AG FRN 2.125% 12-Sep-2025 126,475 0.20 5,000 E.ON International Finance BV ‘EMTN’
6.375% 07-Jun-2032 9,277 0.02 50,000 Enel Finance International NV ‘EMTN’
5.625% 14-Aug-2024 73,043 0.12 50,000 Enel Finance International NV ‘EMTN’
5.750% 14-Sep-2040 96,060 0.15 50,000 Enel SpA ‘EMTN’ 5.750% 22-Jun-2037 93,133 0.15 50,000 Engie SA ‘EMTN’ 5.000% 01-Oct-2060 119,336 0.19 20,000 Freshwater Finance Plc 5.182% 20-Apr-2035 34,468 0.06 5,000 General Electric Co ‘EMTN’ 5.250% 07-Dec-2028 7,148 0.01 100,000 GlaxoSmithKline Capital Plc ‘EMTN’
4.250% 18-Dec-2045 190,466 0.31 15,000 GlaxoSmithKline Capital Plc ‘EMTN’
5.250% 19-Dec-2033 27,669 0.05 5,000 Goldman Sachs Group Inc/The 5.500% 12-Oct-2021 6,498 0.01 50,000 Goldman Sachs Group Inc/The 7.125% 07-Aug-2025 79,409 0.13 15,000 Goldman Sachs Group Inc/The ‘EMTN’
3.125% 25-Jul-2029 20,587 0.03 5,000 Hammerson Plc 6.000% 23-Feb-2026 6,151 0.01 50,000 Heathrow Funding Ltd ‘EMTN’ 6.750% 03-Dec-2026 77,632 0.13 30,000 HSBC Bank Capital Funding Sterling 1 LP FRN
(Perpetual) 5.844% 05-Nov-2031 49,580 0.08 15,000 HSBC Bank Plc ‘EMTN’ 6.500% 07-Jul-2023 21,002 0.03 30,000 HSBC Bank Plc ‘EMTN’ FRN 5.375% 04-Nov-2030 43,127 0.07 10,000 HSBC Holdings Plc ‘EMTN’ 5.750% 20-Dec-2027 14,863 0.02 10,000 innogy Finance BV ‘EMTN’ 5.625% 06-Dec-2023 14,320 0.02 10,000 innogy Finance BV ‘EMTN’ 6.250% 03-Jun-2030 17,587 0.03
Bonds cont’d.
Euro cont’d.
Bonds cont’d.
Sterling cont’d.
USDUSD
03613-1A.indd 90 19/08/2020 19:00

91
Schedule of investments – as at 30 June 2020
Holdings Description
Fair value
Total net assets
% Holdings Description
Fair value
Total net assets
%
BNy MELLON EFFICIENT GLOBAL IG CORpORATE BETA FUND
15,000 Allstate Corp/The 3.280% 15-Dec-2026 17,091 0.03 60,000 Allstate Corp/The FRN 5.750% 15-Aug-2053 62,098 0.10 45,000 Allstate Corp/The FRN 6.500% 15-May-2057 54,635 0.09 30,000 Ally Financial Inc 4.125% 13-Feb-2022 30,838 0.05 20,000 Alphabet Inc 1.998% 15-Aug-2026 21,445 0.03 40,000 Alphabet Inc 3.375% 25-Feb-2024 44,033 0.07 25,000 Altera Corp 4.100% 15-Nov-2023 28,027 0.04 65,000 Altria Group Inc 2.350% 06-May-2025 68,380 0.11 40,000 Altria Group Inc 2.850% 09-Aug-2022 41,691 0.07 20,000 Altria Group Inc 3.490% 14-Feb-2022 20,875 0.03 40,000 Altria Group Inc 3.800% 14-Feb-2024 43,764 0.07 20,000 Altria Group Inc 3.875% 16-Sep-2046 20,007 0.03 45,000 Altria Group Inc 4.000% 31-Jan-2024 49,607 0.08 10,000 Altria Group Inc 4.250% 09-Aug-2042 10,622 0.02 45,000 Altria Group Inc 4.800% 14-Feb-2029 52,576 0.08 40,000 Altria Group Inc 5.375% 31-Jan-2044 48,243 0.08 15,000 Altria Group Inc 5.800% 14-Feb-2039 18,572 0.03 10,000 Altria Group Inc 5.950% 14-Feb-2049 13,136 0.02 15,000 Altria Group Inc 6.200% 14-Feb-2059 20,077 0.03 50,000 Amazon.com Inc 1.500% 03-Jun-2030 50,719 0.08 25,000 Amazon.com Inc 2.500% 03-Jun-2050 25,800 0.04 30,000 Amazon.com Inc 2.700% 03-Jun-2060 30,703 0.05 10,000 Amazon.com Inc 2.800% 22-Aug-2024 10,871 0.02 10,000 Amazon.com Inc 4.250% 22-Aug-2057 13,376 0.02 15,000 Amazon.com Inc 5.200% 03-Dec-2025 18,432 0.03 20,000 Amcor Finance USA Inc 4.500% 15-May-2028 23,019 0.04 10,000 Ameren Corp 2.500% 15-Sep-2024 10,609 0.02 25,000 Ameren Illinois Co 2.700% 01-Sep-2022 25,993 0.04 15,000 Ameren Illinois Co 3.250% 01-Mar-2025 16,413 0.03 10,000 America Movil SAB de CV 6.375% 01-Mar-2035 14,604 0.02 20,000 American Electric Power Co Inc
4.300% 01-Dec-2028 23,536 0.04 35,000 American Express Co 2.650% 02-Dec-2022 36,672 0.06 50,000 American Express Co 2.750% 20-May-2022 51,926 0.08 20,000 American Express Co 3.400% 27-Feb-2023 21,405 0.03 20,000 American Express Co 3.700% 03-Aug-2023 21,763 0.03 45,000 American Express Credit Corp ‘MTN’
2.700% 03-Mar-2022 46,602 0.07 50,000 American Homes 4 Rent LP 4.250% 15-Feb-2028 53,540 0.09 10,000 American Homes 4 Rent LP 4.900% 15-Feb-2029 11,168 0.02 30,000 American Tower Corp 2.250% 15-Jan-2022 30,755 0.05 10,000 American Tower Corp 2.400% 15-Mar-2025 10,569 0.02 30,000 American Tower Corp 2.750% 15-Jan-2027 32,247 0.05 10,000 American Tower Corp 2.900% 15-Jan-2030 10,695 0.02 20,000 American Tower Corp 2.950% 15-Jan-2025 21,768 0.03 15,000 American Tower Corp 3.375% 15-Oct-2026 16,697 0.03 5,000 American Tower Corp 3.450% 15-Sep-2021 5,175 0.01 20,000 American Tower Corp 3.800% 15-Aug-2029 22,679 0.04 20,000 American Tower Corp 3.950% 15-Mar-2029 22,797 0.04 10,000 American Tower Corp 4.000% 01-Jun-2025 11,233 0.02 10,000 American Tower Corp 4.400% 15-Feb-2026 11,568 0.02 50,000 American Tower Corp 4.700% 15-Mar-2022 53,478 0.09 15,000 American Tower Corp 5.000% 15-Feb-2024 17,121 0.03 50,000 American Water Capital Corp 3.400% 01-Mar-2025 55,602 0.09 20,000 American Water Capital Corp 3.450% 01-Jun-2029 22,942 0.04 50,000 American Water Capital Corp 3.850% 01-Mar-2024 55,468 0.09 20,000 American Water Capital Corp 4.150% 01-Jun-2049 24,852 0.04 30,000 Amgen Inc 1.900% 21-Feb-2025 31,367 0.05 45,000 Amgen Inc 2.200% 21-Feb-2027 47,527 0.08
15,000 AbbVie Inc 4.450% 14-May-2046 18,363 0.03 20,000 AbbVie Inc 4.700% 14-May-2045 25,179 0.04 20,000 AbbVie Inc 4.875% 14-Nov-2048 26,309 0.04 50,000 AbbVie Inc ‘144A’ 2.150% 19-Nov-2021 50,961 0.08 35,000 AbbVie Inc ‘144A’ 2.300% 21-Nov-2022 36,220 0.06 60,000 AbbVie Inc ‘144A’ 2.600% 21-Nov-2024 63,736 0.10 45,000 AbbVie Inc ‘144A’ 2.950% 21-Nov-2026 48,986 0.08 45,000 AbbVie Inc ‘144A’ 3.200% 21-Nov-2029 49,716 0.08 50,000 AbbVie Inc ‘144A’ 3.250% 01-Oct-2022 52,423 0.08 60,000 AbbVie Inc ‘144A’ 3.450% 15-Mar-2022 62,427 0.10 15,000 AbbVie Inc ‘144A’ 3.800% 15-Mar-2025 16,660 0.03 40,000 AbbVie Inc ‘144A’ 3.850% 15-Jun-2024 43,860 0.07 25,000 AbbVie Inc ‘144A’ 4.050% 21-Nov-2039 29,276 0.05 40,000 AbbVie Inc ‘144A’ 4.250% 21-Nov-2049 48,704 0.08 20,000 AbbVie Inc ‘144A’ 4.550% 15-Mar-2035 24,320 0.04 5,000 AbbVie Inc ‘144A’ 4.625% 01-Oct-2042 6,104 0.01 5,000 Activision Blizzard Inc 2.300% 15-Sep-2021 5,098 0.01 5,000 Adobe Inc 1.700% 01-Feb-2023 5,179 0.01 45,000 Adobe Inc 1.900% 01-Feb-2025 47,550 0.08 20,000 Adobe Inc 2.150% 01-Feb-2027 21,489 0.03 25,000 Adobe Inc 2.300% 01-Feb-2030 27,034 0.04 45,000 Adobe Inc 3.250% 01-Feb-2025 50,060 0.08 30,000 Advance Auto Parts Inc 4.500% 15-Jan-2022 31,473 0.05 50,000 AerCap Ireland Capital DAC /
AerCap Global Aviation Trust 4.125% 03-Jul-2023 48,930 0.08 50,000 AerCap Ireland Capital DAC /
AerCap Global Aviation Trust 5.000% 01-Oct-2021 50,586 0.08 25,000 Aetna Inc 2.800% 15-Jun-2023 26,377 0.04 20,000 Aetna Inc 3.875% 15-Aug-2047 22,621 0.04 10,000 Aetna Inc 6.625% 15-Jun-2036 14,177 0.02 5,000 Affiliated Managers Group Inc 4.250% 15-Feb-2024 5,436 0.01 30,000 Aflac Inc 3.250% 17-Mar-2025 33,642 0.05 30,000 Aflac Inc 3.625% 15-Jun-2023 32,835 0.05 10,000 Agilent Technologies Inc 3.200% 01-Oct-2022 10,459 0.02 5,000 Ahold Finance USA LLC 6.875% 01-May-2029 6,935 0.01 30,000 Air Lease Corp 3.375% 01-Jun-2021 30,125 0.05 25,000 Air Lease Corp 3.625% 01-Apr-2027 24,556 0.04 50,000 Air Lease Corp 3.625% 01-Dec-2027 48,855 0.08 50,000 Air Lease Corp 3.750% 01-Feb-2022 50,592 0.08 30,000 Air Lease Corp 3.875% 03-Jul-2023 30,550 0.05 55,000 Air Lease Corp 4.250% 15-Sep-2024 55,907 0.09 65,000 Air Lease Corp ‘MTN’ 2.300% 01-Feb-2025 62,297 0.10 50,000 Air Lease Corp ‘MTN’ 4.250% 01-Feb-2024 51,484 0.08 20,000 Air Products and Chemicals Inc
2.700% 15-May-2040 21,091 0.03 20,000 Aircastle Ltd 4.125% 01-May-2024 18,812 0.03 30,000 Albemarle Corp 4.150% 01-Dec-2024 32,187 0.05 20,000 Alexandria Real Estate Equities Inc
2.750% 15-Dec-2029 21,370 0.03 20,000 Alexandria Real Estate Equities Inc
3.950% 15-Jan-2028 22,845 0.04 10,000 Alexandria Real Estate Equities Inc
4.000% 01-Feb-2050 12,231 0.02 10,000 Alexandria Real Estate Equities Inc
4.850% 15-Apr-2049 13,141 0.02 50,000 Alibaba Group Holding Ltd 3.125% 28-Nov-2021 51,453 0.08 75,000 Alibaba Group Holding Ltd 3.400% 06-Dec-2027 83,375 0.13 100,000 Alibaba Group Holding Ltd 3.600% 28-Nov-2024 109,135 0.17 30,000 Allstate Corp/The 3.150% 15-Jun-2023 32,201 0.05
Bonds cont’d.
US Dollar cont’d.
Bonds cont’d.
US Dollar cont’d.
USDUSD
03613-1A.indd 91 19/08/2020 19:00

92
Schedule of investments – as at 30 June 2020
Holdings Description
Fair value
Total net assets
% Holdings Description
Fair value
Total net assets
%
BNy MELLON EFFICIENT GLOBAL IG CORpORATE BETA FUND
20,000 AT&T Inc 3.600% 15-Jul-2025 22,232 0.04 50,000 AT&T Inc 3.800% 15-Feb-2027 56,362 0.09 10,000 AT&T Inc 3.875% 15-Jan-2026 11,275 0.02 15,000 AT&T Inc 3.900% 11-Mar-2024 16,580 0.03 35,000 AT&T Inc 3.950% 15-Jan-2025 39,217 0.06 45,000 AT&T Inc 4.100% 15-Feb-2028 51,511 0.08 30,000 AT&T Inc 4.125% 17-Feb-2026 34,213 0.05 15,000 AT&T Inc 4.250% 01-Mar-2027 17,097 0.03 15,000 AT&T Inc 4.300% 15-Feb-2030 17,593 0.03 10,000 AT&T Inc 4.300% 15-Dec-2042 11,208 0.02 35,000 AT&T Inc 4.350% 01-Mar-2029 40,838 0.07 15,000 AT&T Inc 4.350% 15-Jun-2045 16,906 0.03 30,000 AT&T Inc 4.450% 01-Apr-2024 33,722 0.05 40,000 AT&T Inc 4.500% 09-Mar-2048 47,362 0.08 35,000 AT&T Inc 4.550% 09-Mar-2049 41,335 0.07 10,000 AT&T Inc 4.650% 01-Jun-2044 11,465 0.02 20,000 AT&T Inc 4.750% 15-May-2046 24,014 0.04 15,000 AT&T Inc 4.800% 15-Jun-2044 17,790 0.03 10,000 AT&T Inc 4.850% 01-Mar-2039 12,077 0.02 25,000 AT&T Inc 4.850% 15-Jul-2045 29,821 0.05 20,000 AT&T Inc 4.900% 15-Aug-2037 24,093 0.04 10,000 AT&T Inc 5.150% 15-Mar-2042 12,500 0.02 10,000 AT&T Inc 5.150% 15-Nov-2046 12,406 0.02 20,000 AT&T Inc 5.150% 15-Feb-2050 25,689 0.04 20,000 AT&T Inc 5.250% 01-Mar-2037 24,757 0.04 10,000 AT&T Inc 5.450% 01-Mar-2047 13,106 0.02 10,000 AT&T Inc 5.550% 15-Aug-2041 12,937 0.02 10,000 AT&T Inc 5.650% 15-Feb-2047 13,095 0.02 15,000 AT&T Inc 5.700% 01-Mar-2057 20,592 0.03 10,000 AT&T Inc 6.000% 15-Aug-2040 13,601 0.02 25,000 AT&T Inc 6.100% 15-Jul-2040 33,416 0.05 15,000 AT&T Inc 6.375% 01-Mar-2041 21,308 0.03 25,000 AutoZone Inc 2.875% 15-Jan-2023 25,852 0.04 30,000 AutoZone Inc 3.125% 18-Apr-2024 31,652 0.05 5,000 AutoZone Inc 3.700% 15-Apr-2022 5,232 0.01 25,000 AutoZone Inc 3.750% 01-Jun-2027 28,058 0.04 25,000 AutoZone Inc 3.750% 18-Apr-2029 28,453 0.05 20,000 AvalonBay Communities Inc ‘GMTN’
4.200% 15-Dec-2023 22,000 0.04 5,000 AvalonBay Communities Inc ‘MTN’
2.300% 01-Mar-2030 5,260 0.01 10,000 AvalonBay Communities Inc ‘MTN’
3.200% 15-Jan-2028 11,118 0.02 10,000 AvalonBay Communities Inc ‘MTN’
3.300% 01-Jun-2029 11,288 0.02 35,000 Avangrid Inc 3.200% 15-Apr-2025 38,319 0.06 25,000 Avery Dennison Corp 4.875% 06-Dec-2028 29,910 0.05 10,000 Aviation Capital Group LLC ‘144A’
2.875% 20-Jan-2022 9,559 0.02 30,000 Aviation Capital Group LLC ‘144A’
3.875% 01-May-2023 28,525 0.05 25,000 Aviation Capital Group LLC ‘144A’
4.375% 30-Jan-2024 23,513 0.04 25,000 Aviation Capital Group LLC ‘144A’
4.875% 01-Oct-2025 22,927 0.04 10,000 Avolon Holdings Funding Ltd ‘144A’
2.875% 15-Feb-2025 8,409 0.01 10,000 Avolon Holdings Funding Ltd ‘144A’
3.950% 01-Jul-2024 8,696 0.01
15,000 Amgen Inc 2.650% 11-May-2022 15,536 0.02 5,000 Amgen Inc 2.700% 01-May-2022 5,173 0.01 40,000 Amgen Inc 3.125% 01-May-2025 44,010 0.07 10,000 Amgen Inc 3.150% 21-Feb-2040 10,779 0.02 15,000 Amgen Inc 3.375% 21-Feb-2050 16,807 0.03 10,000 Amgen Inc 3.625% 15-May-2022 10,467 0.02 50,000 Amgen Inc 3.625% 22-May-2024 54,860 0.09 16,571 Amgen Inc 3.875% 15-Nov-2021 17,194 0.03 10,000 Amgen Inc 4.400% 01-May-2045 12,462 0.02 20,000 Amgen Inc 4.563% 15-Jun-2048 26,134 0.04 40,000 Amgen Inc 4.663% 15-Jun-2051 53,423 0.09 10,000 Amgen Inc 4.950% 01-Oct-2041 12,987 0.02 10,000 Amgen Inc 5.750% 15-Mar-2040 13,811 0.02 15,000 Amgen Inc 6.400% 01-Feb-2039 21,906 0.04 50,000 Amphenol Corp 2.800% 15-Feb-2030 53,274 0.09 50,000 Amphenol Corp 3.200% 01-Apr-2024 53,599 0.09 15,000 Analog Devices Inc 2.875% 01-Jun-2023 15,719 0.03 5,000 Analog Devices Inc 3.500% 05-Dec-2026 5,594 0.01 30,000 Analog Devices Inc 5.300% 15-Dec-2045 40,561 0.06 40,000 Anthem Inc 2.375% 15-Jan-2025 42,481 0.07 50,000 Anthem Inc 3.300% 15-Jan-2023 53,287 0.09 50,000 Anthem Inc 4.375% 01-Dec-2047 62,320 0.10 10,000 Anthem Inc 4.550% 01-Mar-2048 12,739 0.02 35,000 Anthem Inc 6.375% 15-Jun-2037 48,430 0.08 5,000 Aon Corp 3.750% 02-May-2029 5,733 0.01 25,000 Aon Plc 3.500% 14-Jun-2024 27,177 0.04 5,000 Aon Plc 4.000% 27-Nov-2023 5,471 0.01 10,000 Aon Plc 4.750% 15-May-2045 12,532 0.02 25,000 Appalachian Power Co 3.300% 01-Jun-2027 27,024 0.04 45,000 Appalachian Power Co 7.000% 01-Apr-2038 67,114 0.11 5,000 Apple Inc 2.150% 09-Feb-2022 5,146 0.01 50,000 Apple Inc 2.200% 11-Sep-2029 53,621 0.09 30,000 Apple Inc 2.400% 03-May-2023 31,725 0.05 10,000 Apple Inc 2.500% 09-Feb-2022 10,341 0.02 5,000 Apple Inc 2.500% 09-Feb-2025 5,386 0.01 25,000 Apple Inc 2.750% 13-Jan-2025 27,170 0.04 25,000 Apple Inc 3.200% 13-May-2025 27,911 0.04 30,000 Apple Inc 3.250% 23-Feb-2026 33,627 0.05 20,000 Apple Inc 3.350% 09-Feb-2027 22,804 0.04 20,000 Apple Inc 3.450% 06-May-2024 22,080 0.04 10,000 Apple Inc 4.500% 23-Feb-2036 13,222 0.02 25,000 Applied Materials Inc 5.100% 01-Oct-2035 34,880 0.06 20,000 APT Pipelines Ltd ‘144A’ 4.200% 23-Mar-2025 21,954 0.04 15,000 Aptiv Corp 4.150% 15-Mar-2024 16,020 0.03 25,000 Aptiv Plc 4.350% 15-Mar-2029 26,800 0.04 10,000 Ares Capital Corp 3.250% 15-Jul-2025 9,716 0.02 10,000 Ares Capital Corp 4.250% 01-Mar-2025 10,236 0.02 10,000 Arizona Public Service Co 2.600% 15-Aug-2029 10,580 0.02 65,000 AstraZeneca Plc 2.375% 12-Jun-2022 67,323 0.11 30,000 AstraZeneca Plc 3.125% 12-Jun-2027 33,463 0.05 15,000 AstraZeneca Plc 3.375% 16-Nov-2025 16,871 0.03 10,000 AstraZeneca Plc 4.000% 17-Jan-2029 12,261 0.02 20,000 AstraZeneca Plc 4.000% 18-Sep-2042 24,508 0.04 20,000 AstraZeneca Plc 4.375% 16-Nov-2045 26,100 0.04 20,000 AstraZeneca Plc 6.450% 15-Sep-2037 30,449 0.05 30,000 AT&T Inc 2.625% 01-Dec-2022 31,276 0.05 30,000 AT&T Inc 3.000% 30-Jun-2022 31,341 0.05 55,000 AT&T Inc 3.400% 15-May-2025 60,482 0.10 20,000 AT&T Inc 3.600% 17-Feb-2023 21,482 0.03
Bonds cont’d.
US Dollar cont’d.
Bonds cont’d.
US Dollar cont’d.
USDUSD
03613-1A.indd 92 19/08/2020 19:00

93
Schedule of investments – as at 30 June 2020
Holdings Description
Fair value
Total net assets
% Holdings Description
Fair value
Total net assets
%
BNy MELLON EFFICIENT GLOBAL IG CORpORATE BETA FUND
50,000 Berkshire Hathaway Finance Corp 1.850% 12-Mar-2030 51,476 0.08
35,000 Berkshire Hathaway Finance Corp 5.750% 15-Jan-2040 53,147 0.09
45,000 Berkshire Hathaway Inc 2.750% 15-Mar-2023 47,674 0.08 20,000 Berkshire Hathaway Inc 3.000% 11-Feb-2023 21,351 0.03 20,000 Berkshire Hathaway Inc 3.125% 15-Mar-2026 22,388 0.04 50,000 Berkshire Hathaway Inc 3.750% 15-Aug-2021 51,906 0.08 20,000 Biogen Inc 2.250% 01-May-2030 20,207 0.03 35,000 Biogen Inc 5.200% 15-Sep-2045 45,961 0.07 5,000 Black Hills Corp 3.050% 15-Oct-2029 5,301 0.01 10,000 Black Hills Corp 4.250% 30-Nov-2023 10,900 0.02 30,000 BlackRock Inc 2.400% 30-Apr-2030 32,404 0.05 30,000 BlackRock Inc 3.250% 30-Apr-2029 34,525 0.06 45,000 Booking Holdings Inc 3.600% 01-Jun-2026 49,422 0.08 20,000 Booking Holdings Inc 3.650% 15-Mar-2025 21,976 0.04 50,000 Booking Holdings Inc 4.100% 13-Apr-2025 56,180 0.09 50,000 Booking Holdings Inc 4.500% 13-Apr-2027 57,512 0.09 50,000 Booking Holdings Inc 4.625% 13-Apr-2030 59,133 0.09 15,000 Boston Properties LP 3.650% 01-Feb-2026 16,622 0.03 20,000 Boston Properties LP 3.800% 01-Feb-2024 21,716 0.03 30,000 Boston Scientific Corp 3.375% 15-May-2022 31,362 0.05 20,000 Boston Scientific Corp 3.750% 01-Mar-2026 22,728 0.04 10,000 Boston Scientific Corp 3.850% 15-May-2025 11,259 0.02 20,000 Boston Scientific Corp 4.000% 01-Mar-2029 22,901 0.04 15,000 Boston Scientific Corp 4.550% 01-Mar-2039 18,465 0.03 20,000 Boston Scientific Corp 4.700% 01-Mar-2049 25,559 0.04 50,000 BP Capital Markets America Inc 2.112% 16-Sep-2021 50,966 0.08 35,000 BP Capital Markets America Inc 2.750% 10-May-2023 36,996 0.06 20,000 BP Capital Markets America Inc 2.937% 06-Apr-2023 21,161 0.03 20,000 BP Capital Markets America Inc 3.119% 04-May-2026 21,877 0.03 5,000 BP Capital Markets America Inc 3.245% 06-May-2022 5,247 0.01 35,000 BP Capital Markets America Inc 3.410% 11-Feb-2026 38,767 0.06 5,000 BP Capital Markets America Inc 3.633% 06-Apr-2030 5,685 0.01 20,000 BP Capital Markets America Inc 3.796% 21-Sep-2025 22,601 0.04 30,000 BP Capital Markets America Inc 3.937% 21-Sep-2028 34,376 0.06 25,000 BP Capital Markets America Inc 4.234% 06-Nov-2028 29,069 0.05 20,000 BP Capital Markets Plc 3.062% 17-Mar-2022 20,826 0.03 5,000 BP Capital Markets Plc 3.279% 19-Sep-2027 5,446 0.01 5,000 BP Capital Markets Plc 3.506% 17-Mar-2025 5,534 0.01 20,000 BP Capital Markets Plc 3.561% 01-Nov-2021 20,802 0.03 5,000 BP Capital Markets Plc 3.814% 10-Feb-2024 5,496 0.01 10,000 Bristol-Myers Squibb Co 2.000% 01-Aug-2022 10,293 0.02 10,000 Bristol-Myers Squibb Co 7.150% 15-Jun-2023 11,841 0.02 20,000 Bristol-Myers Squibb Co ‘144A’ 2.750% 15-Feb-2023 21,103 0.03 60,000 Bristol-Myers Squibb Co ‘144A’ 2.900% 26-Jul-2024 64,978 0.10 20,000 Bristol-Myers Squibb Co ‘144A’ 3.250% 20-Feb-2023 21,299 0.03 35,000 Bristol-Myers Squibb Co ‘144A’ 3.400% 26-Jul-2029 40,808 0.07 20,000 Bristol-Myers Squibb Co ‘144A’ 3.550% 15-Aug-2022 21,254 0.03 25,000 Bristol-Myers Squibb Co ‘144A’ 3.875% 15-Aug-2025 28,459 0.05 15,000 Bristol-Myers Squibb Co ‘144A’ 4.000% 15-Aug-2023 16,555 0.03 30,000 Bristol-Myers Squibb Co ‘144A’ 4.125% 15-Jun-2039 38,299 0.06 10,000 British Telecommunications Plc 9.625% 15-Dec-2030 16,327 0.03 25,000 Broadcom Corp / Broadcom Cayman Finance Ltd
2.650% 15-Jan-2023 25,948 0.04 35,000 Broadcom Corp / Broadcom Cayman Finance Ltd
3.125% 15-Jan-2025 37,410 0.06 40,000 Broadcom Corp / Broadcom Cayman Finance Ltd
3.500% 15-Jan-2028 42,371 0.07
10,000 Avolon Holdings Funding Ltd ‘144A’ 5.125% 01-Oct-2023 9,262 0.01
10,000 AXIS Specialty Finance LLC FRN 4.900% 15-Jan-2040 9,404 0.01 50,000 Bank of America Corp 3.950% 21-Apr-2025 55,402 0.09 50,000 Bank of America Corp 4.183% 25-Nov-2027 57,288 0.09 40,000 Bank of America Corp 4.750% 21-Apr-2045 52,997 0.08 50,000 Bank of America Corp FRN 3.004% 20-Dec-2023 52,546 0.08 50,000 Bank of America Corp FRN 3.366% 23-Jan-2026 54,645 0.09 20,000 Bank of America Corp FRN 3.419% 20-Dec-2028 22,292 0.04 25,000 Bank of America Corp FRN 3.550% 05-Mar-2024 26,734 0.04 15,000 Bank of America Corp FRN 4.244% 24-Apr-2038 18,250 0.03 50,000 Bank of America Corp ‘GMTN’ 3.300% 11-Jan-2023 53,383 0.09 35,000 Bank of America Corp ‘MTN’ 2.503% 21-Oct-2022 35,841 0.06 50,000 Bank of America Corp ‘MTN’ 3.248% 21-Oct-2027 55,175 0.09 50,000 Bank of America Corp ‘MTN’ 3.875% 01-Aug-2025 56,678 0.09 25,000 Bank of America Corp ‘MTN’ 4.125% 22-Jan-2024 27,781 0.04 50,000 Bank of America Corp ‘MTN’ 4.200% 26-Aug-2024 55,542 0.09 50,000 Bank of America Corp ‘MTN’ 4.250% 22-Oct-2026 57,401 0.09 20,000 Bank of America Corp ‘MTN’ FRN 3.559% 23-Apr-2027 22,333 0.04 55,000 Bank of America Corp ‘MTN’ FRN 3.824% 20-Jan-2028 62,462 0.10 20,000 Bank of America Corp ‘MTN’ FRN 3.864% 23-Jul-2024 21,683 0.03 50,000 Bank of America Corp ‘MTN’ FRN 3.970% 05-Mar-2029 57,361 0.09 50,000 Bank of America Corp ‘MTN’ FRN 3.974% 07-Feb-2030 58,260 0.09 10,000 Bank of America Corp ‘MTN’ FRN 4.078% 23-Apr-2040 12,175 0.02 15,000 Bank of America Corp ‘MTN’ FRN 4.271% 23-Jul-2029 17,704 0.03 50,000 Bank of Montreal 3.300% 05-Feb-2024 54,343 0.09 50,000 Bank of Montreal FRN 4.338% 05-Oct-2028 53,427 0.09 10,000 Bank of Montreal ‘MTN’ 1.900% 27-Aug-2021 10,173 0.02 20,000 Bank of Montreal ‘MTN’ 2.050% 01-Nov-2022 20,668 0.03 65,000 Bank of Montreal ‘MTN’ 2.350% 11-Sep-2022 67,958 0.11 50,000 Bank of Montreal ‘MTN’ 2.500% 28-Jun-2024 53,060 0.08 20,000 Bank of Montreal ‘MTN’ 2.550% 06-Nov-2022 20,981 0.03 20,000 Bank of Nova Scotia/The 1.950% 01-Feb-2023 20,609 0.03 20,000 Bank of Nova Scotia/The 2.375% 18-Jan-2023 20,833 0.03 50,000 Bank of Nova Scotia/The 2.700% 07-Mar-2022 51,823 0.08 20,000 Bank of Nova Scotia/The ‘BKNT’
2.450% 19-Sep-2022 20,885 0.03 10,000 Barrick North America Finance LLC
5.700% 30-May-2041 13,479 0.02 10,000 Barrick North America Finance LLC
5.750% 01-May-2043 14,168 0.02 25,000 BAT Capital Corp 4.390% 15-Aug-2037 27,310 0.04 10,000 BAT Capital Corp 4.540% 15-Aug-2047 10,875 0.02 25,000 Baxter International Inc ‘144A’ 3.750% 01-Oct-2025 28,504 0.05 50,000 Bayer US Finance II LLC ‘144A’ 4.875% 25-Jun-2048 64,034 0.10 70,000 Becton Dickinson and Co 2.894% 06-Jun-2022 72,510 0.12 30,000 Becton Dickinson and Co 3.125% 08-Nov-2021 30,830 0.05 35,000 Becton Dickinson and Co 3.363% 06-Jun-2024 37,795 0.06 25,000 Becton Dickinson and Co 3.700% 06-Jun-2027 27,959 0.04 45,000 Becton Dickinson and Co 3.734% 15-Dec-2024 49,671 0.08 10,000 Becton Dickinson and Co 4.669% 06-Jun-2047 12,282 0.02 10,000 Becton Dickinson and Co 4.685% 15-Dec-2044 12,343 0.02 10,000 Bell Canada Inc 4.464% 01-Apr-2048 12,696 0.02 25,000 Berkshire Hathaway Energy Co 3.250% 15-Apr-2028 28,312 0.05 20,000 Berkshire Hathaway Energy Co 3.500% 01-Feb-2025 22,319 0.04 10,000 Berkshire Hathaway Energy Co 3.750% 15-Nov-2023 11,002 0.02 10,000 Berkshire Hathaway Energy Co 6.125% 01-Apr-2036 14,464 0.02 35,000 Berkshire Hathaway Energy Co ‘144A’
4.050% 15-Apr-2025 40,086 0.06
Bonds cont’d.
US Dollar cont’d.
Bonds cont’d.
US Dollar cont’d.
USDUSD
03613-1A.indd 93 19/08/2020 19:00

94
Schedule of investments – as at 30 June 2020
Holdings Description
Fair value
Total net assets
% Holdings Description
Fair value
Total net assets
%
BNy MELLON EFFICIENT GLOBAL IG CORpORATE BETA FUND
50,000 CC Holdings GS V LLC / Crown Castle GS III Corp 3.849% 15-Apr-2023 54,045 0.09
55,000 Celanese US Holdings LLC 3.500% 08-May-2024 58,088 0.09 5,000 Cenovus Energy Inc 5.400% 15-Jun-2047 4,298 0.01 15,000 Cenovus Energy Inc 6.750% 15-Nov-2039 14,620 0.02 25,000 CH Robinson Worldwide Inc 4.200% 15-Apr-2028 28,518 0.05 30,000 Charles Schwab Corp/The 3.000% 10-Mar-2025 32,827 0.05 30,000 Charles Schwab Corp/The 3.550% 01-Feb-2024 32,920 0.05 50,000 Charter Communications Operating LLC /
Charter Communications Operating Capital 2.800% 01-Apr-2031 50,789 0.08
35,000 Charter Communications Operating LLC / Charter Communications Operating Capital 3.750% 15-Feb-2028 38,216 0.06
40,000 Charter Communications Operating LLC / Charter Communications Operating Capital 4.200% 15-Mar-2028 44,896 0.07
50,000 Charter Communications Operating LLC / Charter Communications Operating Capital 4.464% 23-Jul-2022 53,349 0.09
40,000 Charter Communications Operating LLC / Charter Communications Operating Capital 4.500% 01-Feb-2024 44,285 0.07
15,000 Charter Communications Operating LLC / Charter Communications Operating Capital 4.800% 01-Mar-2050 16,670 0.03
35,000 Charter Communications Operating LLC / Charter Communications Operating Capital 4.908% 23-Jul-2025 40,139 0.06
70,000 Charter Communications Operating LLC / Charter Communications Operating Capital 5.050% 30-Mar-2029 82,687 0.13
10,000 Charter Communications Operating LLC / Charter Communications Operating Capital 5.125% 01-Jul-2049 11,567 0.02
20,000 Charter Communications Operating LLC / Charter Communications Operating Capital 5.375% 01-May-2047 23,654 0.04
50,000 Charter Communications Operating LLC / Charter Communications Operating Capital 5.750% 01-Apr-2048 62,337 0.10
20,000 Charter Communications Operating LLC / Charter Communications Operating Capital 6.384% 23-Oct-2035 26,484 0.04
40,000 Charter Communications Operating LLC / Charter Communications Operating Capital 6.484% 23-Oct-2045 53,075 0.08
25,000 Charter Communications Operating LLC / Charter Communications Operating Capital 6.834% 23-Oct-2055 33,766 0.05
10,000 Cheniere Corpus Christi Holdings LLC 5.875% 31-Mar-2025 11,218 0.02
40,000 Chevron Corp 1.995% 11-May-2027 41,924 0.07 30,000 Chevron Corp 2.236% 11-May-2030 31,459 0.05 10,000 Chevron Corp 2.355% 05-Dec-2022 10,418 0.02 50,000 Chevron Corp 2.954% 16-May-2026 55,421 0.09 50,000 Chevron Corp 3.191% 24-Jun-2023 53,631 0.09 20,000 Chevron Corp 3.326% 17-Nov-2025 22,435 0.04 10,000 Chubb INA Holdings Inc 3.350% 03-May-2026 11,405 0.02
50,000 Broadcom Corp / Broadcom Cayman Finance Ltd 3.625% 15-Jan-2024 53,784 0.09
50,000 Broadcom Corp / Broadcom Cayman Finance Ltd 3.875% 15-Jan-2027 54,076 0.09
40,000 Broadcom Inc ‘144A’ 3.125% 15-Oct-2022 41,698 0.07 35,000 Broadcom Inc ‘144A’ 3.625% 15-Oct-2024 38,038 0.06 35,000 Broadcom Inc ‘144A’ 4.250% 15-Apr-2026 38,981 0.06 55,000 Broadcom Inc ‘144A’ 4.700% 15-Apr-2025 62,039 0.10 30,000 Broadcom Inc ‘144A’ 4.750% 15-Apr-2029 34,078 0.05 45,000 Broadcom Inc ‘144A’ 5.000% 15-Apr-2030 51,822 0.08 25,000 Broadridge Financial Solutions Inc
2.900% 01-Dec-2029 26,766 0.04 25,000 Brown & Brown Inc 4.200% 15-Sep-2024 27,123 0.04 5,000 Brown-Forman Corp 3.500% 15-Apr-2025 5,609 0.01 50,000 Burlington Northern Santa Fe LLC
3.050% 15-Mar-2022 52,025 0.08 50,000 Burlington Northern Santa Fe LLC
3.050% 01-Sep-2022 52,481 0.08 50,000 Burlington Northern Santa Fe LLC
3.250% 15-Jun-2027 56,603 0.09 25,000 Burlington Northern Santa Fe LLC
3.400% 01-Sep-2024 27,537 0.04 50,000 Burlington Northern Santa Fe LLC
3.750% 01-Apr-2024 55,324 0.09 50,000 Burlington Northern Santa Fe LLC
3.850% 01-Sep-2023 54,785 0.09 10,000 Burlington Resources LLC 5.950% 15-Oct-2036 13,491 0.02 20,000 Cadence Design Systems Inc 4.375% 15-Oct-2024 22,306 0.04 5,000 Camden Property Trust 2.800% 15-May-2030 5,421 0.01 20,000 Campbell Soup Co 2.375% 24-Apr-2030 20,760 0.03 5,000 Campbell Soup Co 2.500% 02-Aug-2022 5,153 0.01 10,000 Campbell Soup Co 3.950% 15-Mar-2025 11,245 0.02 20,000 Canadian Imperial Bank of Commerce
2.250% 28-Jan-2025 20,891 0.03 20,000 Canadian Imperial Bank of Commerce
2.550% 16-Jun-2022 20,843 0.03 20,000 Canadian Imperial Bank of Commerce ‘BKNT’
3.500% 13-Sep-2023 21,830 0.03 30,000 Canadian National Railway Co 2.850% 15-Dec-2021 30,861 0.05 25,000 Canadian National Railway Co 2.950% 21-Nov-2024 27,043 0.04 25,000 Canadian Pacific Railway Co 2.900% 01-Feb-2025 27,124 0.04 5,000 Canadian Pacific Railway Co 4.000% 01-Jun-2028 5,810 0.01 10,000 Canadian Pacific Railway Co 6.125% 15-Sep-2115 15,409 0.02 90,000 Capital One Financial Corp 3.050% 09-Mar-2022 93,444 0.15 50,000 Capital One Financial Corp 3.200% 30-Jan-2023 52,697 0.08 30,000 Capital One Financial Corp 3.200% 05-Feb-2025 32,252 0.05 35,000 Capital One Financial Corp 3.300% 30-Oct-2024 37,682 0.06 60,000 Capital One Financial Corp 3.500% 15-Jun-2023 64,266 0.10 20,000 Capital One Financial Corp 3.750% 28-Jul-2026 21,871 0.03 20,000 Capital One Financial Corp 3.800% 31-Jan-2028 22,281 0.04 50,000 Capital One Financial Corp 3.900% 29-Jan-2024 54,410 0.09 20,000 Capital One Financial Corp 4.200% 29-Oct-2025 22,243 0.04 25,000 Capital One Financial Corp 4.250% 30-Apr-2025 28,122 0.04 25,000 Carlisle Cos Inc 2.750% 01-Mar-2030 25,785 0.04 15,000 Carlisle Cos Inc 3.500% 01-Dec-2024 16,251 0.03 25,000 Carlisle Cos Inc 3.750% 15-Nov-2022 26,066 0.04 50,000 Carrier Global Corp ‘144A’ 2.242% 15-Feb-2025 51,176 0.08 50,000 Carrier Global Corp ‘144A’ 2.722% 15-Feb-2030 50,321 0.08 10,000 Carrier Global Corp ‘144A’ 3.577% 05-Apr-2050 9,888 0.02
Bonds cont’d.
US Dollar cont’d.
Bonds cont’d.
US Dollar cont’d.
USDUSD
03613-1A.indd 94 19/08/2020 19:00
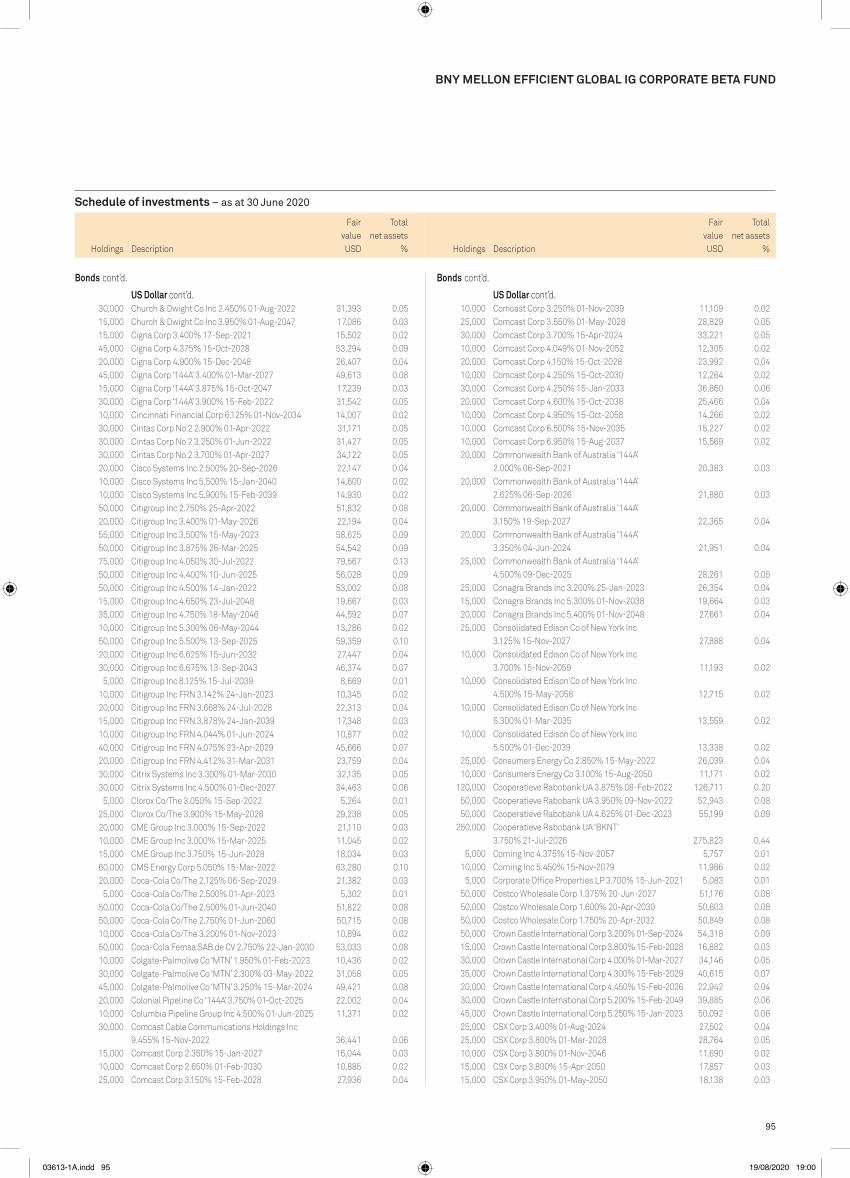
95
Schedule of investments – as at 30 June 2020
Holdings Description
Fair value
Total net assets
% Holdings Description
Fair value
Total net assets
%
BNy MELLON EFFICIENT GLOBAL IG CORpORATE BETA FUND
10,000 Comcast Corp 3.250% 01-Nov-2039 11,109 0.02 25,000 Comcast Corp 3.550% 01-May-2028 28,829 0.05 30,000 Comcast Corp 3.700% 15-Apr-2024 33,221 0.05 10,000 Comcast Corp 4.049% 01-Nov-2052 12,305 0.02 20,000 Comcast Corp 4.150% 15-Oct-2028 23,992 0.04 10,000 Comcast Corp 4.250% 15-Oct-2030 12,264 0.02 30,000 Comcast Corp 4.250% 15-Jan-2033 36,860 0.06 20,000 Comcast Corp 4.600% 15-Oct-2038 25,466 0.04 10,000 Comcast Corp 4.950% 15-Oct-2058 14,266 0.02 10,000 Comcast Corp 6.500% 15-Nov-2035 15,227 0.02 10,000 Comcast Corp 6.950% 15-Aug-2037 15,569 0.02 20,000 Commonwealth Bank of Australia ‘144A’
2.000% 06-Sep-2021 20,383 0.03 20,000 Commonwealth Bank of Australia ‘144A’
2.625% 06-Sep-2026 21,880 0.03 20,000 Commonwealth Bank of Australia ‘144A’
3.150% 19-Sep-2027 22,365 0.04 20,000 Commonwealth Bank of Australia ‘144A’
3.350% 04-Jun-2024 21,951 0.04 25,000 Commonwealth Bank of Australia ‘144A’
4.500% 09-Dec-2025 28,261 0.05 25,000 Conagra Brands Inc 3.200% 25-Jan-2023 26,354 0.04 15,000 Conagra Brands Inc 5.300% 01-Nov-2038 19,664 0.03 20,000 Conagra Brands Inc 5.400% 01-Nov-2048 27,661 0.04 25,000 Consolidated Edison Co of New York Inc
3.125% 15-Nov-2027 27,888 0.04 10,000 Consolidated Edison Co of New York Inc
3.700% 15-Nov-2059 11,193 0.02 10,000 Consolidated Edison Co of New York Inc
4.500% 15-May-2058 12,715 0.02 10,000 Consolidated Edison Co of New York Inc
5.300% 01-Mar-2035 13,559 0.02 10,000 Consolidated Edison Co of New York Inc
5.500% 01-Dec-2039 13,338 0.02 25,000 Consumers Energy Co 2.850% 15-May-2022 26,039 0.04 10,000 Consumers Energy Co 3.100% 15-Aug-2050 11,171 0.02 120,000 Cooperatieve Rabobank UA 3.875% 08-Feb-2022 126,711 0.20 50,000 Cooperatieve Rabobank UA 3.950% 09-Nov-2022 52,943 0.08 50,000 Cooperatieve Rabobank UA 4.625% 01-Dec-2023 55,199 0.09 250,000 Cooperatieve Rabobank UA ‘BKNT’
3.750% 21-Jul-2026 275,823 0.44 5,000 Corning Inc 4.375% 15-Nov-2057 5,757 0.01 10,000 Corning Inc 5.450% 15-Nov-2079 11,986 0.02 5,000 Corporate Office Properties LP 3.700% 15-Jun-2021 5,083 0.01 50,000 Costco Wholesale Corp 1.375% 20-Jun-2027 51,176 0.08 50,000 Costco Wholesale Corp 1.600% 20-Apr-2030 50,603 0.08 50,000 Costco Wholesale Corp 1.750% 20-Apr-2032 50,849 0.08 50,000 Crown Castle International Corp 3.200% 01-Sep-2024 54,318 0.09 15,000 Crown Castle International Corp 3.800% 15-Feb-2028 16,882 0.03 30,000 Crown Castle International Corp 4.000% 01-Mar-2027 34,146 0.05 35,000 Crown Castle International Corp 4.300% 15-Feb-2029 40,615 0.07 20,000 Crown Castle International Corp 4.450% 15-Feb-2026 22,942 0.04 30,000 Crown Castle International Corp 5.200% 15-Feb-2049 39,885 0.06 45,000 Crown Castle International Corp 5.250% 15-Jan-2023 50,092 0.08 25,000 CSX Corp 3.400% 01-Aug-2024 27,502 0.04 25,000 CSX Corp 3.800% 01-Mar-2028 28,764 0.05 10,000 CSX Corp 3.800% 01-Nov-2046 11,690 0.02 15,000 CSX Corp 3.800% 15-Apr-2050 17,857 0.03 15,000 CSX Corp 3.950% 01-May-2050 18,138 0.03
30,000 Church & Dwight Co Inc 2.450% 01-Aug-2022 31,393 0.05 15,000 Church & Dwight Co Inc 3.950% 01-Aug-2047 17,086 0.03 15,000 Cigna Corp 3.400% 17-Sep-2021 15,502 0.02 45,000 Cigna Corp 4.375% 15-Oct-2028 53,294 0.09 20,000 Cigna Corp 4.900% 15-Dec-2048 26,407 0.04 45,000 Cigna Corp ‘144A’ 3.400% 01-Mar-2027 49,613 0.08 15,000 Cigna Corp ‘144A’ 3.875% 15-Oct-2047 17,239 0.03 30,000 Cigna Corp ‘144A’ 3.900% 15-Feb-2022 31,542 0.05 10,000 Cincinnati Financial Corp 6.125% 01-Nov-2034 14,007 0.02 30,000 Cintas Corp No 2 2.900% 01-Apr-2022 31,171 0.05 30,000 Cintas Corp No 2 3.250% 01-Jun-2022 31,427 0.05 30,000 Cintas Corp No 2 3.700% 01-Apr-2027 34,122 0.05 20,000 Cisco Systems Inc 2.500% 20-Sep-2026 22,147 0.04 10,000 Cisco Systems Inc 5.500% 15-Jan-2040 14,600 0.02 10,000 Cisco Systems Inc 5.900% 15-Feb-2039 14,930 0.02 50,000 Citigroup Inc 2.750% 25-Apr-2022 51,832 0.08 20,000 Citigroup Inc 3.400% 01-May-2026 22,194 0.04 55,000 Citigroup Inc 3.500% 15-May-2023 58,625 0.09 50,000 Citigroup Inc 3.875% 26-Mar-2025 54,542 0.09 75,000 Citigroup Inc 4.050% 30-Jul-2022 79,567 0.13 50,000 Citigroup Inc 4.400% 10-Jun-2025 56,028 0.09 50,000 Citigroup Inc 4.500% 14-Jan-2022 53,002 0.08 15,000 Citigroup Inc 4.650% 23-Jul-2048 19,667 0.03 35,000 Citigroup Inc 4.750% 18-May-2046 44,592 0.07 10,000 Citigroup Inc 5.300% 06-May-2044 13,286 0.02 50,000 Citigroup Inc 5.500% 13-Sep-2025 59,359 0.10 20,000 Citigroup Inc 6.625% 15-Jun-2032 27,447 0.04 30,000 Citigroup Inc 6.675% 13-Sep-2043 46,374 0.07 5,000 Citigroup Inc 8.125% 15-Jul-2039 8,669 0.01 10,000 Citigroup Inc FRN 3.142% 24-Jan-2023 10,345 0.02 20,000 Citigroup Inc FRN 3.668% 24-Jul-2028 22,313 0.04 15,000 Citigroup Inc FRN 3.878% 24-Jan-2039 17,348 0.03 10,000 Citigroup Inc FRN 4.044% 01-Jun-2024 10,877 0.02 40,000 Citigroup Inc FRN 4.075% 23-Apr-2029 45,666 0.07 20,000 Citigroup Inc FRN 4.412% 31-Mar-2031 23,759 0.04 30,000 Citrix Systems Inc 3.300% 01-Mar-2030 32,135 0.05 30,000 Citrix Systems Inc 4.500% 01-Dec-2027 34,463 0.06 5,000 Clorox Co/The 3.050% 15-Sep-2022 5,264 0.01 25,000 Clorox Co/The 3.900% 15-May-2028 29,238 0.05 20,000 CME Group Inc 3.000% 15-Sep-2022 21,110 0.03 10,000 CME Group Inc 3.000% 15-Mar-2025 11,045 0.02 15,000 CME Group Inc 3.750% 15-Jun-2028 18,034 0.03 60,000 CMS Energy Corp 5.050% 15-Mar-2022 63,280 0.10 20,000 Coca-Cola Co/The 2.125% 06-Sep-2029 21,382 0.03 5,000 Coca-Cola Co/The 2.500% 01-Apr-2023 5,302 0.01 50,000 Coca-Cola Co/The 2.500% 01-Jun-2040 51,822 0.08 50,000 Coca-Cola Co/The 2.750% 01-Jun-2060 50,715 0.08 10,000 Coca-Cola Co/The 3.200% 01-Nov-2023 10,894 0.02 50,000 Coca-Cola Femsa SAB de CV 2.750% 22-Jan-2030 53,033 0.08 10,000 Colgate-Palmolive Co ‘MTN’ 1.950% 01-Feb-2023 10,436 0.02 30,000 Colgate-Palmolive Co ‘MTN’ 2.300% 03-May-2022 31,058 0.05 45,000 Colgate-Palmolive Co ‘MTN’ 3.250% 15-Mar-2024 49,421 0.08 20,000 Colonial Pipeline Co ‘144A’ 3.750% 01-Oct-2025 22,002 0.04 10,000 Columbia Pipeline Group Inc 4.500% 01-Jun-2025 11,371 0.02 30,000 Comcast Cable Communications Holdings Inc
9.455% 15-Nov-2022 36,441 0.06 15,000 Comcast Corp 2.350% 15-Jan-2027 16,044 0.03 10,000 Comcast Corp 2.650% 01-Feb-2030 10,885 0.02 25,000 Comcast Corp 3.150% 15-Feb-2028 27,936 0.04
Bonds cont’d.
US Dollar cont’d.
Bonds cont’d.
US Dollar cont’d.
USDUSD
03613-1A.indd 95 19/08/2020 19:00

96
Schedule of investments – as at 30 June 2020
Holdings Description
Fair value
Total net assets
% Holdings Description
Fair value
Total net assets
%
BNy MELLON EFFICIENT GLOBAL IG CORpORATE BETA FUND
10,000 Dow Chemical Co/The 9.400% 15-May-2039 16,704 0.03 20,000 DR Horton Inc 5.750% 15-Aug-2023 22,627 0.04 40,000 DTE Energy Co 2.529% 01-Oct-2024 41,906 0.07 10,000 Duke Energy Carolinas LLC 5.300% 15-Feb-2040 13,886 0.02 10,000 Duke Realty LP 3.050% 01-Mar-2050 10,498 0.02 20,000 Duke Realty LP 3.375% 15-Dec-2027 22,359 0.04 40,000 DuPont de Nemours Inc 2.169% 01-May-2023 40,798 0.07 45,000 DuPont de Nemours Inc 4.205% 15-Nov-2023 49,355 0.08 10,000 DuPont de Nemours Inc 5.319% 15-Nov-2038 12,694 0.02 30,000 DuPont de Nemours Inc 5.419% 15-Nov-2048 39,579 0.06 30,000 Eastman Chemical Co 3.800% 15-Mar-2025 32,591 0.05 10,000 Eastman Chemical Co 4.650% 15-Oct-2044 11,512 0.02 35,000 eBay Inc 2.600% 15-Jul-2022 36,178 0.06 20,000 eBay Inc 2.700% 11-Mar-2030 21,223 0.03 10,000 eBay Inc 3.450% 01-Aug-2024 10,925 0.02 60,000 eBay Inc 3.800% 09-Mar-2022 63,039 0.10 5,000 eBay Inc 4.000% 15-Jul-2042 5,450 0.01 45,000 Ecolab Inc 2.700% 01-Nov-2026 50,024 0.08 15,000 Ecolab Inc 4.800% 24-Mar-2030 19,038 0.03 35,000 Edison International 2.950% 15-Mar-2023 35,839 0.06 35,000 Edison International 3.550% 15-Nov-2024 36,931 0.06 25,000 Edwards Lifesciences Corp 4.300% 15-Jun-2028 29,845 0.05 10,000 El Paso Electric Co 5.000% 01-Dec-2044 11,880 0.02 25,000 Eli Lilly and Co 2.750% 01-Jun-2025 27,529 0.04 10,000 Eli Lilly and Co 3.375% 15-Mar-2029 11,577 0.02 15,000 Emera US Finance LP 2.700% 15-Jun-2021 15,277 0.02 40,000 Emera US Finance LP 3.550% 15-Jun-2026 44,984 0.07 5,000 Emerson Electric Co 2.625% 01-Dec-2021 5,151 0.01 20,000 Enbridge Energy Partners LP 4.200% 15-Sep-2021 20,679 0.03 20,000 Enbridge Inc 2.500% 15-Jan-2025 20,799 0.03 25,000 Enbridge Inc 2.900% 15-Jul-2022 25,945 0.04 20,000 Enbridge Inc 4.000% 01-Oct-2023 21,700 0.03 5,000 Enbridge Inc 4.000% 15-Nov-2049 5,443 0.01 10,000 Enbridge Inc 4.500% 10-Jun-2044 11,390 0.02 25,000 Enbridge Inc 5.500% 01-Dec-2046 32,341 0.05 5,000 Enstar Group Ltd 4.950% 01-Jun-2029 5,285 0.01 10,000 Entergy Louisiana LLC 4.050% 01-Sep-2023 10,949 0.02 15,000 Enterprise Products Operating LLC
3.350% 15-Mar-2023 15,896 0.03 30,000 Enterprise Products Operating LLC
3.500% 01-Feb-2022 31,288 0.05 10,000 Enterprise Products Operating LLC
3.700% 31-Jan-2051 10,522 0.02 15,000 Enterprise Products Operating LLC
3.750% 15-Feb-2025 16,604 0.03 5,000 Enterprise Products Operating LLC
3.950% 31-Jan-2060 5,205 0.01 30,000 Enterprise Products Operating LLC
4.050% 15-Feb-2022 31,690 0.05 15,000 Enterprise Products Operating LLC
4.200% 31-Jan-2050 16,810 0.03 10,000 Enterprise Products Operating LLC
4.850% 15-Aug-2042 11,562 0.02 20,000 Enterprise Products Operating LLC
4.850% 15-Mar-2044 23,237 0.04 10,000 Enterprise Products Operating LLC
5.100% 15-Feb-2045 11,932 0.02 15,000 Enterprise Products Operating LLC
6.875% 01-Mar-2033 19,871 0.03
10,000 CSX Corp 4.250% 01-Nov-2066 12,160 0.02 10,000 CSX Corp 4.300% 01-Mar-2048 12,521 0.02 10,000 CSX Corp 4.400% 01-Mar-2043 12,336 0.02 15,000 CSX Corp 4.750% 15-Nov-2048 19,949 0.03 10,000 CSX Corp 6.000% 01-Oct-2036 13,666 0.02 10,000 CSX Corp 6.220% 30-Apr-2040 14,576 0.02 45,000 CVS Health Corp 3.625% 01-Apr-2027 50,609 0.08 55,000 CVS Health Corp 4.100% 25-Mar-2025 62,241 0.10 15,000 CVS Health Corp 4.250% 01-Apr-2050 18,005 0.03 65,000 CVS Health Corp 4.300% 25-Mar-2028 76,071 0.12 45,000 CVS Health Corp 5.050% 25-Mar-2048 59,042 0.09 20,000 CVS Health Corp 5.125% 20-Jul-2045 25,809 0.04 15,000 CVS Health Corp 6.125% 15-Sep-2039 21,404 0.03 45,000 CVS Health Corp 6.250% 01-Jun-2027 56,560 0.09 10,000 Daimler Finance North America LLC
8.500% 18-Jan-2031 15,248 0.02 25,000 Danaher Corp 3.350% 15-Sep-2025 27,907 0.04 10,000 Deutsche Telekom International Finance BV
8.750% 15-Jun-2030 15,655 0.03 20,000 DH Europe Finance II Sarl 2.050% 15-Nov-2022 20,665 0.03 25,000 DH Europe Finance II Sarl 2.200% 15-Nov-2024 26,292 0.04 5,000 DH Europe Finance II Sarl 2.600% 15-Nov-2029 5,332 0.01 10,000 DH Europe Finance II Sarl 3.250% 15-Nov-2039 11,063 0.02 10,000 DH Europe Finance II Sarl 3.400% 15-Nov-2049 11,299 0.02 20,000 Discover Financial Services 3.950% 06-Nov-2024 21,896 0.04 20,000 Discover Financial Services 4.100% 09-Feb-2027 21,878 0.03 5,000 Discover Financial Services 5.200% 27-Apr-2022 5,339 0.01 40,000 Dollar General Corp 3.500% 03-Apr-2030 45,022 0.07 25,000 Dollar General Corp 3.875% 15-Apr-2027 28,763 0.05 10,000 Dollar General Corp 4.125% 01-May-2028 11,711 0.02 10,000 Dollar General Corp 4.150% 01-Nov-2025 11,552 0.02 20,000 Dominion Energy Gas Holdings LLC
3.000% 15-Nov-2029 21,464 0.03 40,000 Dominion Energy Gas Holdings LLC
3.550% 01-Nov-2023 43,003 0.07 20,000 Dominion Energy Gas Holdings LLC
3.600% 15-Dec-2024 21,999 0.04 30,000 Dominion Energy Gas Holdings LLC
4.600% 15-Dec-2044 33,997 0.05 20,000 Dominion Energy Inc 2.750% 15-Sep-2022 20,731 0.03 5,000 Dominion Energy Inc 2.850% 15-Aug-2026 5,375 0.01 50,000 Dominion Energy Inc 3.375% 01-Apr-2030 55,305 0.09 20,000 Dominion Energy Inc 4.600% 15-Mar-2049 25,277 0.04 15,000 Dominion Energy Inc 4.700% 01-Dec-2044 18,577 0.03 5,000 Dominion Energy Inc 7.000% 15-Jun-2038 7,132 0.01 20,000 Dominion Energy Inc ‘144A’ 2.450% 15-Jan-2023 20,656 0.03 55,000 Dominion Energy Inc FRN 5.750% 01-Oct-2054 56,131 0.09 50,000 Dominion Energy Inc Step-Up Coupon
2.715% 15-Aug-2021 51,121 0.08 20,000 Dominion Energy Inc Step-Up Coupon
3.071% 15-Aug-2024 21,526 0.03 10,000 Dominion Energy South Carolina Inc
6.050% 15-Jan-2038 14,554 0.02 15,000 Dover Corp 5.375% 01-Mar-2041 19,321 0.03 5,000 Dow Chemical Co/The 4.250% 01-Oct-2034 5,589 0.01 10,000 Dow Chemical Co/The 4.375% 15-Nov-2042 11,189 0.02 10,000 Dow Chemical Co/The 4.625% 01-Oct-2044 11,603 0.02 10,000 Dow Chemical Co/The 4.800% 15-May-2049 11,917 0.02 10,000 Dow Chemical Co/The 5.250% 15-Nov-2041 12,105 0.02
Bonds cont’d.
US Dollar cont’d.
Bonds cont’d.
US Dollar cont’d.
USDUSD
03613-1A.indd 96 19/08/2020 19:00

97
Schedule of investments – as at 30 June 2020
Holdings Description
Fair value
Total net assets
% Holdings Description
Fair value
Total net assets
%
BNy MELLON EFFICIENT GLOBAL IG CORpORATE BETA FUND
15,000 Flowserve Corp 4.000% 15-Nov-2023 15,446 0.02 25,000 FMC Corp 3.450% 01-Oct-2029 27,214 0.04 30,000 FMC Corp 4.100% 01-Feb-2024 32,419 0.05 30,000 FNB Corp/PA 2.200% 24-Feb-2023 29,863 0.05 10,000 Fortune Brands Home & Security Inc
3.250% 15-Sep-2029 10,682 0.02 10,000 Fox Corp 5.576% 25-Jan-2049 13,949 0.02 30,000 Franklin Resources Inc 2.850% 30-Mar-2025 32,536 0.05 50,000 GATX Corp 3.250% 30-Mar-2025 52,321 0.08 50,000 GATX Corp 3.850% 30-Mar-2027 53,623 0.09 30,000 GATX Corp 5.200% 15-Mar-2044 35,309 0.06 50,000 GE Capital International Funding Co Unlimited Co
4.418% 15-Nov-2035 50,894 0.08 30,000 General Dynamics Corp 3.500% 15-May-2025 33,583 0.05 25,000 General Electric Co 3.450% 01-May-2027 25,611 0.04 30,000 General Electric Co 3.625% 01-May-2030 30,096 0.05 15,000 General Electric Co 4.350% 01-May-2050 14,860 0.02 10,000 General Electric Co 4.500% 11-Mar-2044 10,015 0.02 10,000 General Electric Co 6.750% 15-Mar-2032 12,176 0.02 10,000 General Electric Co ‘GMTN’ 6.150% 07-Aug-2037 11,681 0.02 10,000 General Electric Co ‘GMTN’ 6.875% 10-Jan-2039 12,299 0.02 20,000 General Electric Co ‘MTN’ 4.650% 17-Oct-2021 20,942 0.03 10,000 General Electric Co ‘MTN’ 5.875% 14-Jan-2038 11,300 0.02 10,000 General Mills Inc 3.150% 15-Dec-2021 10,309 0.02 20,000 General Mills Inc 3.200% 10-Feb-2027 22,581 0.04 20,000 General Mills Inc 3.650% 15-Feb-2024 22,010 0.04 10,000 General Mills Inc 4.150% 15-Feb-2043 12,174 0.02 25,000 General Mills Inc 4.200% 17-Apr-2028 29,613 0.05 20,000 General Mills Inc 4.550% 17-Apr-2038 25,264 0.04 15,000 Genpact Luxembourg Sarl 3.700% 01-Apr-2022 15,409 0.02 20,000 Georgia Power Co 2.650% 15-Sep-2029 21,019 0.03 10,000 Georgia Power Co 3.250% 30-Mar-2027 10,847 0.02 10,000 Georgia-Pacific LLC 8.875% 15-May-2031 16,037 0.03 5,000 Gilead Sciences Inc 4.400% 01-Dec-2021 5,236 0.01 5,000 GlaxoSmithKline Capital Inc 2.800% 18-Mar-2023 5,297 0.01 5,000 GlaxoSmithKline Capital Inc 3.375% 15-May-2023 5,393 0.01 5,000 GlaxoSmithKline Capital Inc 3.625% 15-May-2025 5,651 0.01 10,000 GlaxoSmithKline Capital Inc 6.375% 15-May-2038 15,193 0.02 45,000 GlaxoSmithKline Capital Plc 3.375% 01-Jun-2029 51,827 0.08 75,000 Glencore Funding LLC ‘144A’ 4.125% 30-May-2023 80,244 0.13 20,000 Global Payments Inc 2.650% 15-Feb-2025 21,213 0.03 10,000 Global Payments Inc 3.200% 15-Aug-2029 10,733 0.02 15,000 Global Payments Inc 3.750% 01-Jun-2023 16,164 0.03 15,000 Global Payments Inc 4.800% 01-Apr-2026 17,578 0.03 30,000 GLP Capital LP / GLP Financing II Inc
4.000% 15-Jan-2030 29,806 0.05 10,000 GLP Capital LP / GLP Financing II Inc
5.250% 01-Jun-2025 10,905 0.02 40,000 GLP Capital LP / GLP Financing II Inc
5.300% 15-Jan-2029 43,399 0.07 25,000 GLP Capital LP / GLP Financing II Inc
5.375% 01-Nov-2023 26,688 0.04 25,000 GLP Capital LP / GLP Financing II Inc
5.375% 15-Apr-2026 27,373 0.04 40,000 Goldman Sachs Capital I 6.345% 15-Feb-2034 55,135 0.09 50,000 Goldman Sachs Group Inc/The 2.600% 07-Feb-2030 52,495 0.08 20,000 Goldman Sachs Group Inc/The 3.500% 23-Jan-2025 21,799 0.03 35,000 Goldman Sachs Group Inc/The 3.500% 01-Apr-2025 38,419 0.06 20,000 Goldman Sachs Group Inc/The 3.500% 16-Nov-2026 22,011 0.04
35,000 Enterprise Products Operating LLC FRN 4.875% 16-Aug-2077 30,502 0.05
50,000 Enterprise Products Operating LLC FRN 5.250% 16-Aug-2077 46,837 0.07
35,000 Enterprise Products Operating LLC FRN 5.375% 15-Feb-2078 31,386 0.05
10,000 EOG Resources Inc 3.900% 01-Apr-2035 11,690 0.02 15,000 Equifax Inc 3.300% 15-Dec-2022 15,743 0.03 35,000 Equinix Inc 2.625% 18-Nov-2024 37,331 0.06 15,000 Equinix Inc 2.900% 18-Nov-2026 16,204 0.03 45,000 Equinix Inc 3.200% 18-Nov-2029 49,016 0.08 30,000 Equinix Inc 5.375% 15-May-2027 32,799 0.05 70,000 Equinix Inc 5.875% 15-Jan-2026 73,830 0.12 5,000 ERP Operating LP 2.500% 15-Feb-2030 5,344 0.01 10,000 ERP Operating LP 3.500% 01-Mar-2028 11,337 0.02 10,000 ERP Operating LP 4.150% 01-Dec-2028 11,862 0.02 15,000 ERP Operating LP 4.625% 15-Dec-2021 15,721 0.03 20,000 Essex Portfolio LP 3.250% 01-May-2023 21,076 0.03 40,000 Essex Portfolio LP 3.625% 15-Aug-2022 41,963 0.07 15,000 Essex Portfolio LP 3.875% 01-May-2024 16,339 0.03 15,000 Essex Portfolio LP 4.000% 01-Mar-2029 17,462 0.03 25,000 Essex Portfolio LP 4.500% 15-Mar-2048 31,564 0.05 20,000 Estee Lauder Cos Inc/The 2.600% 15-Apr-2030 21,787 0.03 45,000 Evergy Inc 2.450% 15-Sep-2024 47,585 0.08 15,000 Eversource Energy 2.750% 15-Mar-2022 15,550 0.02 85,000 Eversource Energy 2.800% 01-May-2023 89,050 0.14 50,000 Eversource Energy 2.900% 01-Oct-2024 53,691 0.09 10,000 Eversource Energy 3.150% 15-Jan-2025 10,872 0.02 35,000 Eversource Energy 3.800% 01-Dec-2023 38,352 0.06 10,000 Exxon Mobil Corp 2.610% 15-Oct-2030 10,729 0.02 20,000 Exxon Mobil Corp 3.043% 01-Mar-2026 21,996 0.04 10,000 Exxon Mobil Corp 3.452% 15-Apr-2051 11,128 0.02 10,000 Exxon Mobil Corp 4.227% 19-Mar-2040 12,052 0.02 15,000 Federal Realty Investment Trust
3.200% 15-Jun-2029 15,633 0.02 5,000 FedEx Corp 3.400% 14-Jan-2022 5,209 0.01 40,000 FedEx Corp 4.050% 15-Feb-2048 41,177 0.07 10,000 FedEx Corp 4.100% 15-Apr-2043 10,417 0.02 10,000 FedEx Corp 4.400% 15-Jan-2047 10,633 0.02 15,000 FedEx Corp 4.550% 01-Apr-2046 16,197 0.03 15,000 FedEx Corp 4.750% 15-Nov-2045 16,564 0.03 20,000 FedEx Corp 5.250% 15-May-2050 24,627 0.04 20,000 Fidelity National Information Services Inc
3.500% 15-Apr-2023 21,428 0.03 10,000 Fidelity National Information Services Inc
3.750% 21-May-2029 11,726 0.02 20,000 Fidelity National Information Services Inc
4.500% 15-Aug-2046 24,764 0.04 5,000 Fidelity National Information Services Inc
5.000% 15-Oct-2025 5,995 0.01 15,000 First American Financial Corp 4.600% 15-Nov-2024 16,184 0.03 35,000 FirstEnergy Corp 4.250% 15-Mar-2023 37,871 0.06 10,000 FirstEnergy Corp 7.375% 15-Nov-2031 14,623 0.02 20,000 Fiserv Inc 2.750% 01-Jul-2024 21,338 0.03 10,000 Fiserv Inc 3.500% 01-Oct-2022 10,576 0.02 25,000 Fiserv Inc 3.500% 01-Jul-2029 28,157 0.05 10,000 Fiserv Inc 3.850% 01-Jun-2025 11,301 0.02 20,000 Fiserv Inc 4.400% 01-Jul-2049 24,448 0.04 40,000 Flowers Foods Inc 4.375% 01-Apr-2022 41,703 0.07
Bonds cont’d.
US Dollar cont’d.
Bonds cont’d.
US Dollar cont’d.
USDUSD
03613-1A.indd 97 19/08/2020 19:00

98
Schedule of investments – as at 30 June 2020
Holdings Description
Fair value
Total net assets
% Holdings Description
Fair value
Total net assets
%
BNy MELLON EFFICIENT GLOBAL IG CORpORATE BETA FUND
10,000 Home Depot Inc/The 5.875% 16-Dec-2036 14,952 0.02 5,000 Honeywell International Inc 5.700% 15-Mar-2036 7,161 0.01 200,000 HSBC Holdings Plc FRN 3.262% 13-Mar-2023 207,243 0.33 100,000 HSBC USA Inc 3.500% 23-Jun-2024 109,088 0.17 20,000 Hubbell Inc 3.150% 15-Aug-2027 20,825 0.03 10,000 Hubbell Inc 3.350% 01-Mar-2026 10,738 0.02 25,000 Humana Inc 2.900% 15-Dec-2022 26,115 0.04 25,000 Humana Inc 3.850% 01-Oct-2024 27,416 0.04 20,000 Humana Inc 4.800% 15-Mar-2047 26,156 0.04 80,000 Huntington Bancshares Inc/OH 2.300% 14-Jan-2022 82,130 0.13 25,000 Huntington Ingalls Industries Inc 3.483% 01-Dec-2027 26,974 0.04 50,000 IHS Markit Ltd 4.125% 01-Aug-2023 54,749 0.09 30,000 Illinois Tool Works Inc 3.375% 15-Sep-2021 30,824 0.05 30,000 Intel Corp 2.700% 17-Jun-2024 32,276 0.05 50,000 Intel Corp 3.750% 25-Mar-2027 58,298 0.09 5,000 Intel Corp 4.950% 25-Mar-2060 7,383 0.01 10,000 Intercontinental Exchange Inc 3.100% 15-Sep-2027 11,139 0.02 10,000 Intercontinental Exchange Inc
3.750% 21-Sep-2028 11,660 0.02 100,000 International Business Machines Corp
3.500% 15-May-2029 115,433 0.18 10,000 International Business Machines Corp
5.875% 29-Nov-2032 14,151 0.02 30,000 International Business Machines Corp
7.000% 30-Oct-2025 39,461 0.06 15,000 International Business Machines Corp
7.125% 01-Dec-2096 26,316 0.04 20,000 International Flavors & Fragrances Inc
4.375% 01-Jun-2047 21,653 0.03 20,000 International Flavors & Fragrances Inc
5.000% 26-Sep-2048 23,371 0.04 10,000 Interstate Power and Light Co 3.250% 01-Dec-2024 10,866 0.02 15,000 Interstate Power and Light Co 3.600% 01-Apr-2029 16,892 0.03 15,000 Interstate Power and Light Co 4.100% 26-Sep-2028 17,398 0.03 10,000 J M Smucker Co/The 3.375% 15-Dec-2027 11,051 0.02 15,000 J M Smucker Co/The 3.500% 15-Mar-2025 16,646 0.03 5,000 J M Smucker Co/The 4.250% 15-Mar-2035 5,909 0.01 4,939 JetBlue 2019-1 Class AA Pass Through Trust
2.750% 15-May-2032 4,707 0.01 50,000 Johnson & Johnson 2.050% 01-Mar-2023 52,112 0.08 20,000 Johnson & Johnson 2.450% 01-Mar-2026 21,873 0.03 20,000 Johnson & Johnson 3.375% 05-Dec-2023 22,127 0.04 5,000 Johnson & Johnson 3.400% 15-Jan-2038 5,943 0.01 5,000 Johnson & Johnson 3.625% 03-Mar-2037 5,981 0.01 5,000 Johnson & Johnson 5.850% 15-Jul-2038 7,650 0.01 20,000 Johnson & Johnson 6.950% 01-Sep-2029 29,121 0.05 20,000 JPMorgan Chase & Co 2.950% 01-Oct-2026 21,984 0.04 20,000 JPMorgan Chase & Co 2.972% 15-Jan-2023 20,714 0.03 50,000 JPMorgan Chase & Co 3.200% 15-Jun-2026 55,542 0.09 50,000 JPMorgan Chase & Co 3.250% 23-Sep-2022 52,821 0.08 20,000 JPMorgan Chase & Co 3.300% 01-Apr-2026 22,372 0.04 20,000 JPMorgan Chase & Co 3.875% 10-Sep-2024 22,188 0.04 50,000 JPMorgan Chase & Co 4.125% 15-Dec-2026 58,277 0.09 50,000 JPMorgan Chase & Co 4.250% 01-Oct-2027 58,264 0.09 20,000 JPMorgan Chase & Co FRN 2.739% 15-Oct-2030 21,474 0.03 25,000 JPMorgan Chase & Co FRN 2.776% 25-Apr-2023 25,896 0.04 25,000 JPMorgan Chase & Co FRN 3.207% 01-Apr-2023 26,036 0.04 50,000 JPMorgan Chase & Co FRN 3.509% 23-Jan-2029 55,907 0.09 15,000 JPMorgan Chase & Co FRN 3.540% 01-May-2028 16,762 0.03
50,000 Goldman Sachs Group Inc/The 3.625% 22-Jan-2023 53,607 0.09 20,000 Goldman Sachs Group Inc/The 3.750% 22-May-2025 22,174 0.04 20,000 Goldman Sachs Group Inc/The 3.750% 25-Feb-2026 22,322 0.04 55,000 Goldman Sachs Group Inc/The 3.800% 15-Mar-2030 62,559 0.10 45,000 Goldman Sachs Group Inc/The 3.850% 26-Jan-2027 50,799 0.08 25,000 Goldman Sachs Group Inc/The 4.250% 21-Oct-2025 28,163 0.05 20,000 Goldman Sachs Group Inc/The 4.750% 21-Oct-2045 26,165 0.04 30,000 Goldman Sachs Group Inc/The 5.150% 22-May-2045 39,618 0.06 20,000 Goldman Sachs Group Inc/The 5.250% 27-Jul-2021 21,005 0.03 40,000 Goldman Sachs Group Inc/The 5.750% 24-Jan-2022 43,163 0.07 20,000 Goldman Sachs Group Inc/The 5.950% 15-Jan-2027 24,812 0.04 20,000 Goldman Sachs Group Inc/The 6.450% 01-May-2036 27,622 0.04 30,000 Goldman Sachs Group Inc/The 6.750% 01-Oct-2037 43,726 0.07 25,000 Goldman Sachs Group Inc/The FRN
2.876% 31-Oct-2022 25,637 0.04 50,000 Goldman Sachs Group Inc/The FRN
2.905% 24-Jul-2023 51,966 0.08 45,000 Goldman Sachs Group Inc/The FRN
2.908% 05-Jun-2023 46,662 0.07 25,000 Goldman Sachs Group Inc/The FRN
3.691% 05-Jun-2028 28,023 0.04 55,000 Goldman Sachs Group Inc/The FRN
3.814% 23-Apr-2029 62,217 0.10 10,000 Goldman Sachs Group Inc/The FRN
4.017% 31-Oct-2038 11,620 0.02 70,000 Goldman Sachs Group Inc/The FRN
4.223% 01-May-2029 81,499 0.13 40,000 Goldman Sachs Group Inc/The FRN
4.411% 23-Apr-2039 48,232 0.08 20,000 Goldman Sachs Group Inc/The ‘MTN’
3.850% 08-Jul-2024 22,063 0.04 5,000 Goodman US Finance Three LLC ‘144A’
3.700% 15-Mar-2028 5,414 0.01 30,000 Grupo Televisa SAB 6.625% 15-Jan-2040 38,985 0.06 55,000 Gulf Power Co 3.300% 30-May-2027 61,083 0.10 10,000 Hartford Financial Services Group Inc/The
4.300% 15-Apr-2043 11,538 0.02 10,000 Hartford Financial Services Group Inc/The
4.400% 15-Mar-2048 12,094 0.02 25,000 Hasbro Inc 3.000% 19-Nov-2024 26,210 0.04 10,000 Hasbro Inc 3.900% 19-Nov-2029 10,434 0.02 25,000 HBOS Plc ‘144A’ 6.000% 01-Nov-2033 33,579 0.05 20,000 HCA Inc 4.750% 01-May-2023 21,709 0.03 10,000 HCA Inc 5.250% 15-Jun-2049 12,009 0.02 10,000 HCA Inc 5.500% 15-Jun-2047 12,206 0.02 15,000 Healthcare Trust of America Holdings LP
3.750% 01-Jul-2027 15,851 0.03 5,000 Healthpeak Properties Inc 3.000% 15-Jan-2030 5,231 0.01 30,000 Healthpeak Properties Inc 3.400% 01-Feb-2025 32,372 0.05 15,000 Healthpeak Properties Inc 4.200% 01-Mar-2024 16,364 0.03 50,000 Hershey Co/The 1.700% 01-Jun-2030 51,139 0.08 55,000 Hershey Co/The 3.200% 21-Aug-2025 60,284 0.10 20,000 Hershey Co/The 3.375% 15-May-2023 21,611 0.03 50,000 Highwoods Realty LP 3.200% 15-Jun-2021 50,806 0.08 20,000 Highwoods Realty LP 4.200% 15-Apr-2029 21,524 0.03 15,000 Home Depot Inc/The 2.950% 15-Jun-2029 16,882 0.03 10,000 Home Depot Inc/The 3.000% 01-Apr-2026 11,257 0.02 10,000 Home Depot Inc/The 3.350% 15-Sep-2025 11,267 0.02 10,000 Home Depot Inc/The 3.900% 06-Dec-2028 11,970 0.02
Bonds cont’d.
US Dollar cont’d.
Bonds cont’d.
US Dollar cont’d.
USDUSD
03613-1A.indd 98 19/08/2020 19:00

99
Schedule of investments – as at 30 June 2020
Holdings Description
Fair value
Total net assets
% Holdings Description
Fair value
Total net assets
%
BNy MELLON EFFICIENT GLOBAL IG CORpORATE BETA FUND
10,000 Laboratory Corp of America Holdings 2.950% 01-Dec-2029 10,629 0.02
20,000 Laboratory Corp of America Holdings 3.200% 01-Feb-2022 20,750 0.03
10,000 Laboratory Corp of America Holdings 3.600% 01-Sep-2027 11,221 0.02
10,000 Las Vegas Sands Corp 2.900% 25-Jun-2025 9,724 0.02 10,000 Lazard Group LLC 3.625% 01-Mar-2027 10,513 0.02 10,000 Lazard Group LLC 3.750% 13-Feb-2025 10,631 0.02 10,000 Lazard Group LLC 4.500% 19-Sep-2028 11,294 0.02 10,000 Legg Mason Inc 4.750% 15-Mar-2026 11,331 0.02 35,000 Lennox International Inc 3.000% 15-Nov-2023 36,148 0.06 25,000 Life Storage LP 3.875% 15-Dec-2027 27,299 0.04 30,000 Lockheed Martin Corp 3.550% 15-Jan-2026 34,515 0.06 5,000 Lockheed Martin Corp 3.600% 01-Mar-2035 6,013 0.01 5,000 Lockheed Martin Corp 4.090% 15-Sep-2052 6,542 0.01 30,000 Lowe’s Cos Inc 2.500% 15-Apr-2026 32,646 0.05 10,000 Lowe’s Cos Inc 3.700% 15-Apr-2046 11,165 0.02 10,000 Lowe’s Cos Inc 4.375% 15-Sep-2045 12,082 0.02 10,000 Lowe’s Cos Inc 4.550% 05-Apr-2049 12,607 0.02 5,000 Lowe’s Cos Inc 4.650% 15-Apr-2042 6,279 0.01 25,000 Lowe’s Cos Inc 6.500% 15-Mar-2029 33,658 0.05 10,000 LYB International Finance III LLC 4.200% 15-Oct-2049 10,802 0.02 10,000 LyondellBasell Industries NV 4.625% 26-Feb-2055 11,223 0.02 5,000 Magellan Midstream Partners LP 3.950% 01-Mar-2050 5,022 0.01 25,000 Magellan Midstream Partners LP 4.200% 03-Oct-2047 25,536 0.04 10,000 Markel Corp 4.300% 01-Nov-2047 11,368 0.02 10,000 Markel Corp 5.000% 05-Apr-2046 12,373 0.02 30,000 Marriott International Inc/MD 3.600% 15-Apr-2024 30,180 0.05 35,000 Marriott International Inc/MD 5.750% 01-May-2025 38,062 0.06 30,000 Marsh & McLennan Cos Inc 3.300% 14-Mar-2023 31,982 0.05 30,000 Marsh & McLennan Cos Inc 3.500% 03-Jun-2024 32,911 0.05 30,000 Marsh & McLennan Cos Inc 3.500% 10-Mar-2025 33,239 0.05 35,000 Marsh & McLennan Cos Inc 3.875% 15-Mar-2024 38,764 0.06 130,000 Marsh & McLennan Cos Inc 4.375% 15-Mar-2029 154,905 0.25 20,000 Martin Marietta Materials Inc 3.450% 01-Jun-2027 21,556 0.03 25,000 Martin Marietta Materials Inc 3.500% 15-Dec-2027 27,567 0.04 10,000 Masco Corp 4.450% 01-Apr-2025 11,333 0.02 15,000 Massachusetts Institute of Technology
3.885% 01-Jul-2116 18,727 0.03 10,000 Mastercard Inc 2.950% 01-Jun-2029 11,251 0.02 25,000 Maxim Integrated Products Inc
3.375% 15-Mar-2023 25,984 0.04 20,000 McCormick & Co Inc/MD 2.500% 15-Apr-2030 20,908 0.03 10,000 McCormick & Co Inc/MD 2.700% 15-Aug-2022 10,424 0.02 25,000 McCormick & Co Inc/MD 3.150% 15-Aug-2024 27,102 0.04 10,000 McCormick & Co Inc/MD 3.400% 15-Aug-2027 11,153 0.02 15,000 McCormick & Co Inc/MD 4.200% 15-Aug-2047 17,904 0.03 30,000 McDonald’s Corp ‘MTN’ 1.450% 01-Sep-2025 30,794 0.05 15,000 McDonald’s Corp ‘MTN’ 2.625% 15-Jan-2022 15,507 0.02 30,000 McDonald’s Corp ‘MTN’ 3.250% 10-Jun-2024 32,991 0.05 10,000 McDonald’s Corp ‘MTN’ 3.350% 01-Apr-2023 10,722 0.02 10,000 McDonald’s Corp ‘MTN’ 3.375% 26-May-2025 11,103 0.02 25,000 McDonald’s Corp ‘MTN’ 3.500% 01-Mar-2027 28,331 0.05 5,000 McDonald’s Corp ‘MTN’ 3.625% 01-May-2043 5,504 0.01 20,000 McDonald’s Corp ‘MTN’ 3.700% 30-Jan-2026 22,690 0.04 10,000 McDonald’s Corp ‘MTN’ 3.700% 15-Feb-2042 11,233 0.02 10,000 McDonald’s Corp ‘MTN’ 3.800% 01-Apr-2028 11,699 0.02 15,000 McDonald’s Corp ‘MTN’ 4.200% 01-Apr-2050 18,269 0.03
35,000 JPMorgan Chase & Co FRN 3.559% 23-Apr-2024 37,483 0.06 50,000 JPMorgan Chase & Co FRN 3.797% 23-Jul-2024 54,263 0.09 10,000 JPMorgan Chase & Co FRN 3.882% 24-Jul-2038 11,759 0.02 20,000 JPMorgan Chase & Co FRN 3.960% 29-Jan-2027 22,798 0.04 10,000 JPMorgan Chase & Co FRN 4.005% 23-Apr-2029 11,551 0.02 50,000 JPMorgan Chase & Co FRN 4.023% 05-Dec-2024 55,121 0.09 50,000 JPMorgan Chase & Co ‘MTN’ 2.295% 15-Aug-2021 50,106 0.08 35,000 Kansas City Southern 2.875% 15-Nov-2029 37,017 0.06 20,000 Kellogg Co 3.250% 01-Apr-2026 22,299 0.04 25,000 Kellogg Co 4.300% 15-May-2028 29,505 0.05 15,000 Kellogg Co 4.500% 01-Apr-2046 18,556 0.03 5,000 Kennametal Inc 3.875% 15-Feb-2022 5,190 0.01 20,000 Keurig Dr Pepper Inc 3.130% 15-Dec-2023 21,503 0.03 20,000 Keurig Dr Pepper Inc 3.800% 01-May-2050 22,704 0.04 20,000 Keurig Dr Pepper Inc 4.057% 25-May-2023 21,814 0.03 10,000 Keurig Dr Pepper Inc 4.420% 15-Dec-2046 11,952 0.02 85,000 Keurig Dr Pepper Inc 4.597% 25-May-2028 102,121 0.16 35,000 Keurig Dr Pepper Inc 4.985% 25-May-2038 44,852 0.07 10,000 Kilroy Realty LP 3.450% 15-Dec-2024 10,495 0.02 15,000 Kilroy Realty LP 4.750% 15-Dec-2028 16,844 0.03 20,000 Kimberly-Clark Corp 2.400% 01-Jun-2023 21,035 0.03 25,000 Kimberly-Clark Corp 3.050% 15-Aug-2025 27,665 0.04 20,000 Kinder Morgan Energy Partners LP
3.500% 01-Sep-2023 21,368 0.03 40,000 Kinder Morgan Energy Partners LP
3.950% 01-Sep-2022 42,190 0.07 30,000 Kinder Morgan Energy Partners LP
4.150% 01-Feb-2024 32,562 0.05 25,000 Kinder Morgan Energy Partners LP
4.250% 01-Sep-2024 27,542 0.04 20,000 Kinder Morgan Energy Partners LP
4.300% 01-May-2024 21,953 0.04 30,000 Kinder Morgan Energy Partners LP
5.000% 01-Oct-2021 31,192 0.05 10,000 Kinder Morgan Energy Partners LP
5.500% 01-Mar-2044 11,864 0.02 10,000 Kinder Morgan Energy Partners LP
6.375% 01-Mar-2041 12,319 0.02 10,000 Kinder Morgan Energy Partners LP
6.550% 15-Sep-2040 12,719 0.02 40,000 Kinder Morgan Inc 3.150% 15-Jan-2023 41,912 0.07 15,000 Kinder Morgan Inc 4.300% 01-Jun-2025 16,840 0.03 10,000 Kinder Morgan Inc 5.050% 15-Feb-2046 11,524 0.02 15,000 Kinder Morgan Inc 5.550% 01-Jun-2045 18,337 0.03 15,000 Kinder Morgan Inc ‘GMTN’ 7.750% 15-Jan-2032 20,991 0.03 5,000 KLA Corp 3.300% 01-Mar-2050 5,189 0.01 5,000 KLA Corp 4.100% 15-Mar-2029 5,905 0.01 40,000 KLA Corp 4.650% 01-Nov-2024 45,900 0.07 5,000 Koninklijke Philips NV 5.000% 15-Mar-2042 6,474 0.01 20,000 Kroger Co/The 2.200% 01-May-2030 20,847 0.03 5,000 Kroger Co/The 3.400% 15-Apr-2022 5,213 0.01 15,000 Kroger Co/The 3.950% 15-Jan-2050 17,268 0.03 10,000 L3Harris Technologies Inc 3.832% 27-Apr-2025 11,172 0.02 25,000 L3Harris Technologies Inc 3.950% 28-May-2024 27,414 0.04 25,000 L3Harris Technologies Inc 4.400% 15-Jun-2028 29,622 0.05 10,000 L3Harris Technologies Inc 4.400% 15-Jun-2028 11,849 0.02 10,000 L3Harris Technologies Inc 4.854% 27-Apr-2035 12,777 0.02 15,000 L3Harris Technologies Inc 5.054% 27-Apr-2045 19,768 0.03 15,000 L3Harris Technologies Inc 6.150% 15-Dec-2040 21,143 0.03
Bonds cont’d.
US Dollar cont’d.
Bonds cont’d.
US Dollar cont’d.
USDUSD
03613-1A.indd 99 19/08/2020 19:00
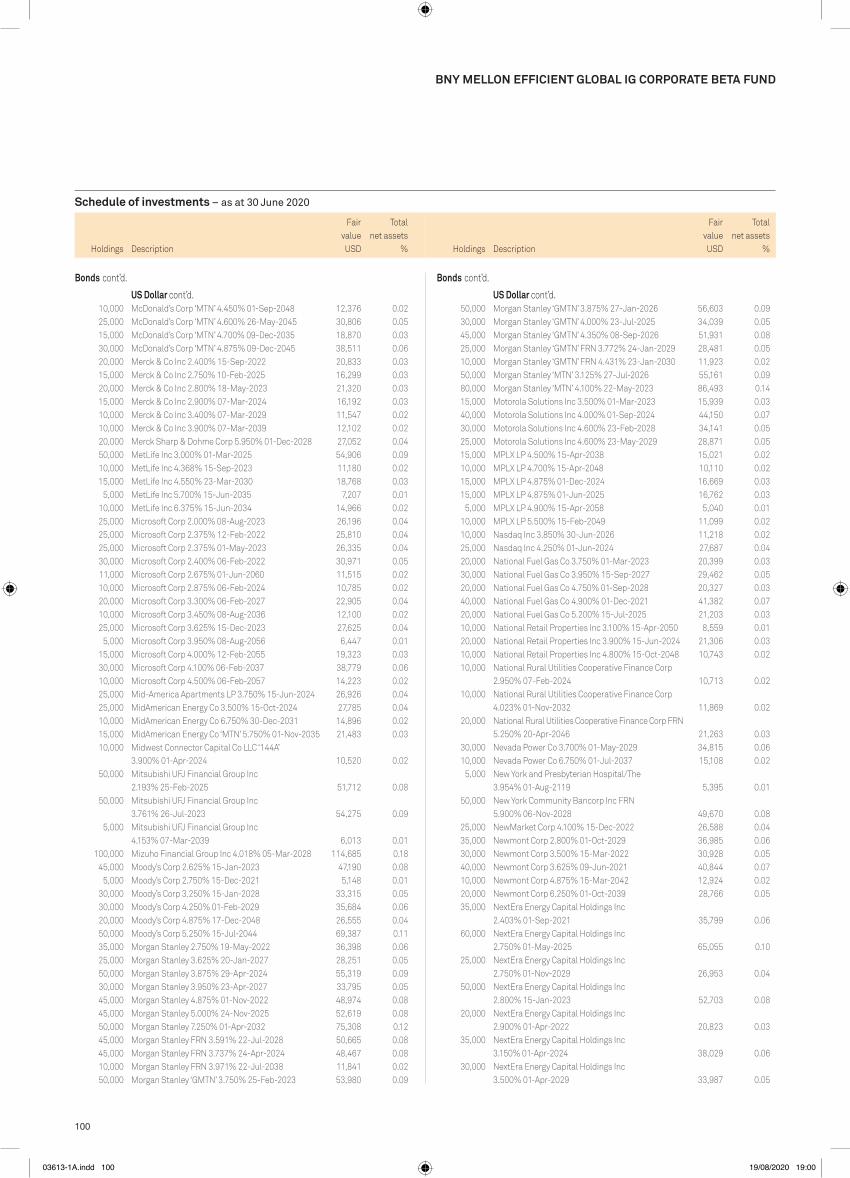
100
Schedule of investments – as at 30 June 2020
Holdings Description
Fair value
Total net assets
% Holdings Description
Fair value
Total net assets
%
BNy MELLON EFFICIENT GLOBAL IG CORpORATE BETA FUND
50,000 Morgan Stanley ‘GMTN’ 3.875% 27-Jan-2026 56,603 0.09 30,000 Morgan Stanley ‘GMTN’ 4.000% 23-Jul-2025 34,039 0.05 45,000 Morgan Stanley ‘GMTN’ 4.350% 08-Sep-2026 51,931 0.08 25,000 Morgan Stanley ‘GMTN’ FRN 3.772% 24-Jan-2029 28,481 0.05 10,000 Morgan Stanley ‘GMTN’ FRN 4.431% 23-Jan-2030 11,923 0.02 50,000 Morgan Stanley ‘MTN’ 3.125% 27-Jul-2026 55,161 0.09 80,000 Morgan Stanley ‘MTN’ 4.100% 22-May-2023 86,493 0.14 15,000 Motorola Solutions Inc 3.500% 01-Mar-2023 15,939 0.03 40,000 Motorola Solutions Inc 4.000% 01-Sep-2024 44,150 0.07 30,000 Motorola Solutions Inc 4.600% 23-Feb-2028 34,141 0.05 25,000 Motorola Solutions Inc 4.600% 23-May-2029 28,871 0.05 15,000 MPLX LP 4.500% 15-Apr-2038 15,021 0.02 10,000 MPLX LP 4.700% 15-Apr-2048 10,110 0.02 15,000 MPLX LP 4.875% 01-Dec-2024 16,669 0.03 15,000 MPLX LP 4.875% 01-Jun-2025 16,762 0.03 5,000 MPLX LP 4.900% 15-Apr-2058 5,040 0.01 10,000 MPLX LP 5.500% 15-Feb-2049 11,099 0.02 10,000 Nasdaq Inc 3.850% 30-Jun-2026 11,218 0.02 25,000 Nasdaq Inc 4.250% 01-Jun-2024 27,687 0.04 20,000 National Fuel Gas Co 3.750% 01-Mar-2023 20,399 0.03 30,000 National Fuel Gas Co 3.950% 15-Sep-2027 29,462 0.05 20,000 National Fuel Gas Co 4.750% 01-Sep-2028 20,327 0.03 40,000 National Fuel Gas Co 4.900% 01-Dec-2021 41,382 0.07 20,000 National Fuel Gas Co 5.200% 15-Jul-2025 21,203 0.03 10,000 National Retail Properties Inc 3.100% 15-Apr-2050 8,559 0.01 20,000 National Retail Properties Inc 3.900% 15-Jun-2024 21,306 0.03 10,000 National Retail Properties Inc 4.800% 15-Oct-2048 10,743 0.02 10,000 National Rural Utilities Cooperative Finance Corp
2.950% 07-Feb-2024 10,713 0.02 10,000 National Rural Utilities Cooperative Finance Corp
4.023% 01-Nov-2032 11,869 0.02 20,000 National Rural Utilities Cooperative Finance Corp FRN
5.250% 20-Apr-2046 21,263 0.03 30,000 Nevada Power Co 3.700% 01-May-2029 34,815 0.06 10,000 Nevada Power Co 6.750% 01-Jul-2037 15,108 0.02 5,000 New York and Presbyterian Hospital/The
3.954% 01-Aug-2119 5,395 0.01 50,000 New York Community Bancorp Inc FRN
5.900% 06-Nov-2028 49,670 0.08 25,000 NewMarket Corp 4.100% 15-Dec-2022 26,588 0.04 35,000 Newmont Corp 2.800% 01-Oct-2029 36,985 0.06 30,000 Newmont Corp 3.500% 15-Mar-2022 30,928 0.05 40,000 Newmont Corp 3.625% 09-Jun-2021 40,844 0.07 10,000 Newmont Corp 4.875% 15-Mar-2042 12,924 0.02 20,000 Newmont Corp 6.250% 01-Oct-2039 28,766 0.05 35,000 NextEra Energy Capital Holdings Inc
2.403% 01-Sep-2021 35,799 0.06 60,000 NextEra Energy Capital Holdings Inc
2.750% 01-May-2025 65,055 0.10 25,000 NextEra Energy Capital Holdings Inc
2.750% 01-Nov-2029 26,953 0.04 50,000 NextEra Energy Capital Holdings Inc
2.800% 15-Jan-2023 52,703 0.08 20,000 NextEra Energy Capital Holdings Inc
2.900% 01-Apr-2022 20,823 0.03 35,000 NextEra Energy Capital Holdings Inc
3.150% 01-Apr-2024 38,029 0.06 30,000 NextEra Energy Capital Holdings Inc
3.500% 01-Apr-2029 33,987 0.05
10,000 McDonald’s Corp ‘MTN’ 4.450% 01-Sep-2048 12,376 0.02 25,000 McDonald’s Corp ‘MTN’ 4.600% 26-May-2045 30,806 0.05 15,000 McDonald’s Corp ‘MTN’ 4.700% 09-Dec-2035 18,870 0.03 30,000 McDonald’s Corp ‘MTN’ 4.875% 09-Dec-2045 38,511 0.06 20,000 Merck & Co Inc 2.400% 15-Sep-2022 20,833 0.03 15,000 Merck & Co Inc 2.750% 10-Feb-2025 16,299 0.03 20,000 Merck & Co Inc 2.800% 18-May-2023 21,320 0.03 15,000 Merck & Co Inc 2.900% 07-Mar-2024 16,192 0.03 10,000 Merck & Co Inc 3.400% 07-Mar-2029 11,547 0.02 10,000 Merck & Co Inc 3.900% 07-Mar-2039 12,102 0.02 20,000 Merck Sharp & Dohme Corp 5.950% 01-Dec-2028 27,052 0.04 50,000 MetLife Inc 3.000% 01-Mar-2025 54,906 0.09 10,000 MetLife Inc 4.368% 15-Sep-2023 11,180 0.02 15,000 MetLife Inc 4.550% 23-Mar-2030 18,768 0.03 5,000 MetLife Inc 5.700% 15-Jun-2035 7,207 0.01 10,000 MetLife Inc 6.375% 15-Jun-2034 14,966 0.02 25,000 Microsoft Corp 2.000% 08-Aug-2023 26,196 0.04 25,000 Microsoft Corp 2.375% 12-Feb-2022 25,810 0.04 25,000 Microsoft Corp 2.375% 01-May-2023 26,335 0.04 30,000 Microsoft Corp 2.400% 06-Feb-2022 30,971 0.05 11,000 Microsoft Corp 2.675% 01-Jun-2060 11,515 0.02 10,000 Microsoft Corp 2.875% 06-Feb-2024 10,785 0.02 20,000 Microsoft Corp 3.300% 06-Feb-2027 22,905 0.04 10,000 Microsoft Corp 3.450% 08-Aug-2036 12,100 0.02 25,000 Microsoft Corp 3.625% 15-Dec-2023 27,625 0.04 5,000 Microsoft Corp 3.950% 08-Aug-2056 6,447 0.01 15,000 Microsoft Corp 4.000% 12-Feb-2055 19,323 0.03 30,000 Microsoft Corp 4.100% 06-Feb-2037 38,779 0.06 10,000 Microsoft Corp 4.500% 06-Feb-2057 14,223 0.02 25,000 Mid-America Apartments LP 3.750% 15-Jun-2024 26,926 0.04 25,000 MidAmerican Energy Co 3.500% 15-Oct-2024 27,785 0.04 10,000 MidAmerican Energy Co 6.750% 30-Dec-2031 14,896 0.02 15,000 MidAmerican Energy Co ‘MTN’ 5.750% 01-Nov-2035 21,483 0.03 10,000 Midwest Connector Capital Co LLC ‘144A’
3.900% 01-Apr-2024 10,520 0.02 50,000 Mitsubishi UFJ Financial Group Inc
2.193% 25-Feb-2025 51,712 0.08 50,000 Mitsubishi UFJ Financial Group Inc
3.761% 26-Jul-2023 54,275 0.09 5,000 Mitsubishi UFJ Financial Group Inc
4.153% 07-Mar-2039 6,013 0.01 100,000 Mizuho Financial Group Inc 4.018% 05-Mar-2028 114,685 0.18 45,000 Moody’s Corp 2.625% 15-Jan-2023 47,190 0.08 5,000 Moody’s Corp 2.750% 15-Dec-2021 5,148 0.01 30,000 Moody’s Corp 3.250% 15-Jan-2028 33,315 0.05 30,000 Moody’s Corp 4.250% 01-Feb-2029 35,684 0.06 20,000 Moody’s Corp 4.875% 17-Dec-2048 26,555 0.04 50,000 Moody’s Corp 5.250% 15-Jul-2044 69,387 0.11 35,000 Morgan Stanley 2.750% 19-May-2022 36,398 0.06 25,000 Morgan Stanley 3.625% 20-Jan-2027 28,251 0.05 50,000 Morgan Stanley 3.875% 29-Apr-2024 55,319 0.09 30,000 Morgan Stanley 3.950% 23-Apr-2027 33,795 0.05 45,000 Morgan Stanley 4.875% 01-Nov-2022 48,974 0.08 45,000 Morgan Stanley 5.000% 24-Nov-2025 52,619 0.08 50,000 Morgan Stanley 7.250% 01-Apr-2032 75,308 0.12 45,000 Morgan Stanley FRN 3.591% 22-Jul-2028 50,665 0.08 45,000 Morgan Stanley FRN 3.737% 24-Apr-2024 48,467 0.08 10,000 Morgan Stanley FRN 3.971% 22-Jul-2038 11,841 0.02 50,000 Morgan Stanley ‘GMTN’ 3.750% 25-Feb-2023 53,980 0.09
Bonds cont’d.
US Dollar cont’d.
Bonds cont’d.
US Dollar cont’d.
USDUSD
03613-1A.indd 100 19/08/2020 19:00

101
Schedule of investments – as at 30 June 2020
Holdings Description
Fair value
Total net assets
% Holdings Description
Fair value
Total net assets
%
BNy MELLON EFFICIENT GLOBAL IG CORpORATE BETA FUND
10,000 O’Reilly Automotive Inc 3.600% 01-Sep-2027 11,256 0.02 25,000 O’Reilly Automotive Inc 3.900% 01-Jun-2029 28,794 0.05 10,000 O’Reilly Automotive Inc 4.350% 01-Jun-2028 11,675 0.02 50,000 ORIX Corp 3.250% 04-Dec-2024 53,958 0.09 50,000 ORIX Corp 4.050% 16-Jan-2024 54,967 0.09 10,000 Otis Worldwide Corp ‘144A’ 3.362% 15-Feb-2050 10,640 0.02 10,000 Owl Rock Capital Corp 3.750% 22-Jul-2025 9,783 0.02 25,000 PACCAR Financial Corp ‘MTN’ 2.850% 01-Mar-2022 26,005 0.04 15,000 PacifiCorp 3.600% 01-Apr-2024 16,433 0.03 15,000 PacifiCorp 5.250% 15-Jun-2035 20,714 0.03 25,000 PacifiCorp 6.250% 15-Oct-2037 36,439 0.06 10,000 PacifiCorp 7.700% 15-Nov-2031 15,325 0.02 35,000 Packaging Corp of America 3.000% 15-Dec-2029 38,054 0.06 10,000 Packaging Corp of America 3.400% 15-Dec-2027 11,030 0.02 30,000 Packaging Corp of America 3.650% 15-Sep-2024 32,762 0.05 30,000 Park Aerospace Holdings Ltd ‘144A’
4.500% 15-Mar-2023 27,386 0.04 35,000 Park Aerospace Holdings Ltd ‘144A’
5.250% 15-Aug-2022 32,870 0.05 10,000 Park Aerospace Holdings Ltd ‘144A’
5.500% 15-Feb-2024 9,156 0.01 5,000 Parker-Hannifin Corp 4.100% 01-Mar-2047 5,724 0.01 15,000 PartnerRe Finance B LLC 3.700% 02-Jul-2029 16,503 0.03 10,000 PayPal Holdings Inc 1.350% 01-Jun-2023 10,202 0.02 10,000 PayPal Holdings Inc 1.650% 01-Jun-2025 10,349 0.02 5,000 PayPal Holdings Inc 2.300% 01-Jun-2030 5,234 0.01 25,000 Penske Truck Leasing Co Lp / PTL Finance Corp ‘144A’
3.350% 01-Nov-2029 25,533 0.04 20,000 Pentair Finance Sarl 4.500% 01-Jul-2029 21,931 0.04 40,000 People’s United Financial Inc 3.650% 06-Dec-2022 41,589 0.07 10,000 PepsiCo Inc 2.625% 29-Jul-2029 11,064 0.02 20,000 PepsiCo Inc 2.750% 01-Mar-2023 21,243 0.03 45,000 PepsiCo Inc 2.750% 30-Apr-2025 49,136 0.08 25,000 PepsiCo Inc 2.750% 19-Mar-2030 27,902 0.04 35,000 PepsiCo Inc 3.500% 17-Jul-2025 39,545 0.06 15,000 PepsiCo Inc 3.600% 01-Mar-2024 16,517 0.03 5,000 PepsiCo Inc 5.500% 15-Jan-2040 7,315 0.01 20,000 PepsiCo Inc 7.000% 01-Mar-2029 28,866 0.05 10,000 PerkinElmer Inc 3.300% 15-Sep-2029 10,739 0.02 5,000 Pfizer Inc 2.550% 28-May-2040 5,185 0.01 20,000 Pfizer Inc 2.625% 01-Apr-2030 22,060 0.04 5,000 Pfizer Inc 3.000% 15-Jun-2023 5,366 0.01 10,000 Pfizer Inc 3.450% 15-Mar-2029 11,694 0.02 20,000 Pfizer Inc 3.600% 15-Sep-2028 23,597 0.04 10,000 Pfizer Inc 3.900% 15-Mar-2039 12,332 0.02 10,000 Pfizer Inc 5.800% 12-Aug-2023 11,619 0.02 30,000 Pfizer Inc 7.200% 15-Mar-2039 50,789 0.08 50,000 Philip Morris International Inc 2.100% 01-May-2030 51,587 0.08 20,000 Philip Morris International Inc 2.125% 10-May-2023 20,917 0.03 20,000 Philip Morris International Inc 2.375% 17-Aug-2022 20,776 0.03 5,000 Philip Morris International Inc 2.625% 18-Feb-2022 5,158 0.01 5,000 Philip Morris International Inc 3.250% 10-Nov-2024 5,539 0.01 25,000 Philip Morris International Inc 3.375% 11-Aug-2025 27,877 0.04 30,000 Philip Morris International Inc 3.375% 15-Aug-2029 34,138 0.05 20,000 Phillips 66 4.300% 01-Apr-2022 21,208 0.03 10,000 Phillips 66 4.650% 15-Nov-2034 11,843 0.02 15,000 Phillips 66 4.875% 15-Nov-2044 18,627 0.03 20,000 Phillips 66 5.875% 01-May-2042 27,126 0.04 15,000 Phillips 66 Partners LP 2.450% 15-Dec-2024 15,458 0.02
20,000 NextEra Energy Capital Holdings Inc 3.550% 01-May-2027 22,705 0.04
20,000 NextEra Energy Capital Holdings Inc FRN 4.800% 01-Dec-2077 20,766 0.03
65,000 NextEra Energy Capital Holdings Inc FRN 5.650% 01-May-2079 71,061 0.11
30,000 NiSource Inc 2.650% 17-Nov-2022 31,352 0.05 10,000 NiSource Inc 3.650% 15-Jun-2023 10,810 0.02 20,000 NiSource Inc 4.375% 15-May-2047 24,206 0.04 30,000 NiSource Inc 5.250% 15-Feb-2043 38,620 0.06 25,000 Norfolk Southern Corp 2.550% 01-Nov-2029 26,686 0.04 50,000 Norfolk Southern Corp 3.000% 01-Apr-2022 51,985 0.08 5,000 Norfolk Southern Corp 3.850% 15-Jan-2024 5,540 0.01 10,000 Norfolk Southern Corp 3.942% 01-Nov-2047 11,808 0.02 5,000 Norfolk Southern Corp 3.950% 01-Oct-2042 5,843 0.01 10,000 Norfolk Southern Corp 4.650% 15-Jan-2046 13,088 0.02 5,000 Norfolk Southern Corp 4.837% 01-Oct-2041 6,507 0.01 25,000 Northern States Power Co/MN 2.150% 15-Aug-2022 25,706 0.04 15,000 Northrop Grumman Corp 2.550% 15-Oct-2022 15,681 0.03 10,000 Northrop Grumman Corp 2.930% 15-Jan-2025 10,823 0.02 15,000 Northrop Grumman Corp 4.030% 15-Oct-2047 18,214 0.03 20,000 Northrop Grumman Corp 4.750% 01-Jun-2043 25,975 0.04 10,000 Northrop Grumman Corp 5.250% 01-May-2050 14,407 0.02 10,000 Novartis Capital Corp 3.400% 06-May-2024 11,008 0.02 25,000 NSTAR Electric Co 3.200% 15-May-2027 28,129 0.04 10,000 Nucor Corp 4.000% 01-Aug-2023 10,866 0.02 10,000 Nucor Corp 5.200% 01-Aug-2043 12,850 0.02 25,000 NVIDIA Corp 2.850% 01-Apr-2030 27,871 0.04 20,000 NVIDIA Corp 3.200% 16-Sep-2026 22,685 0.04 10,000 Occidental Petroleum Corp 4.200% 15-Mar-2048 6,784 0.01 5,000 Occidental Petroleum Corp 4.625% 15-Jun-2045 3,525 0.01 20,000 Occidental Petroleum Corp 6.450% 15-Sep-2036 17,003 0.03 20,000 Omega Healthcare Investors Inc 4.375% 01-Aug-2023 20,784 0.03 25,000 Omega Healthcare Investors Inc 4.500% 15-Jan-2025 25,774 0.04 10,000 Omega Healthcare Investors Inc 4.500% 01-Apr-2027 10,491 0.02 50,000 Omega Healthcare Investors Inc 4.750% 15-Jan-2028 52,989 0.08 15,000 Omega Healthcare Investors Inc 4.950% 01-Apr-2024 15,813 0.03 50,000 ONE Gas Inc 2.000% 15-May-2030 50,929 0.08 5,000 ONEOK Inc 3.400% 01-Sep-2029 4,882 0.01 20,000 ONEOK Inc 4.000% 13-Jul-2027 20,305 0.03 5,000 ONEOK Inc 4.450% 01-Sep-2049 4,647 0.01 10,000 ONEOK Inc 5.200% 15-Jul-2048 10,015 0.02 10,000 ONEOK Partners LP 3.375% 01-Oct-2022 10,357 0.02 20,000 ONEOK Partners LP 5.000% 15-Sep-2023 21,635 0.03 25,000 Oracle Corp 2.400% 15-Sep-2023 26,157 0.04 35,000 Oracle Corp 2.500% 01-Apr-2025 37,527 0.06 20,000 Oracle Corp 2.650% 15-Jul-2026 21,663 0.03 45,000 Oracle Corp 2.950% 15-Nov-2024 48,806 0.08 35,000 Oracle Corp 2.950% 01-Apr-2030 39,059 0.06 30,000 Oracle Corp 3.600% 01-Apr-2040 34,174 0.05 25,000 Oracle Corp 3.625% 15-Jul-2023 27,268 0.04 10,000 Oracle Corp 3.800% 15-Nov-2037 11,554 0.02 25,000 Oracle Corp 3.850% 15-Jul-2036 29,209 0.05 20,000 Oracle Corp 3.850% 01-Apr-2060 23,537 0.04 10,000 Oracle Corp 3.900% 15-May-2035 12,090 0.02 50,000 Oracle Corp 4.300% 08-Jul-2034 62,073 0.10 5,000 Oracle Corp 4.375% 15-May-2055 6,292 0.01 30,000 Orange SA 9.000% 01-Mar-2031 48,983 0.08 10,000 O’Reilly Automotive Inc 3.550% 15-Mar-2026 11,338 0.02
Bonds cont’d.
US Dollar cont’d.
Bonds cont’d.
US Dollar cont’d.
USDUSD
03613-1A.indd 101 19/08/2020 19:00

102
Schedule of investments – as at 30 June 2020
Holdings Description
Fair value
Total net assets
% Holdings Description
Fair value
Total net assets
%
BNy MELLON EFFICIENT GLOBAL IG CORpORATE BETA FUND
10,000 Realty Income Corp 3.650% 15-Jan-2028 11,013 0.02 35,000 Regions Financial Corp 2.750% 14-Aug-2022 36,467 0.06 20,000 Reliance Steel & Aluminum Co 4.500% 15-Apr-2023 21,458 0.03 10,000 RenaissanceRe Holdings Ltd 3.600% 15-Apr-2029 10,981 0.02 20,000 Republic Services Inc 2.300% 01-Mar-2030 20,884 0.03 25,000 Republic Services Inc 2.500% 15-Aug-2024 26,608 0.04 10,000 Republic Services Inc 2.900% 01-Jul-2026 10,940 0.02 5,000 Republic Services Inc 3.050% 01-Mar-2050 5,133 0.01 25,000 Republic Services Inc 3.375% 15-Nov-2027 28,057 0.04 10,000 Republic Services Inc 3.550% 01-Jun-2022 10,510 0.02 15,000 Republic Services Inc 4.750% 15-May-2023 16,637 0.03 5,000 Reynolds American Inc 5.700% 15-Aug-2035 6,156 0.01 10,000 Reynolds American Inc 5.850% 15-Aug-2045 12,326 0.02 45,000 Rio Tinto Finance USA Ltd 3.750% 15-Jun-2025 50,928 0.08 30,000 Rockwell Automation Inc 2.875% 01-Mar-2025 32,208 0.05 5,000 Rogers Communications Inc 3.700% 15-Nov-2049 5,530 0.01 10,000 Rogers Communications Inc 4.350% 01-May-2049 12,307 0.02 10,000 Rogers Communications Inc 5.000% 15-Mar-2044 12,807 0.02 35,000 Roper Technologies Inc 2.350% 15-Sep-2024 36,910 0.06 15,000 Roper Technologies Inc 3.125% 15-Nov-2022 15,721 0.03 45,000 Roper Technologies Inc 3.650% 15-Sep-2023 48,960 0.08 25,000 Roper Technologies Inc 4.200% 15-Sep-2028 29,337 0.05 20,000 Royal Bank of Canada ‘GMTN’ 1.950% 17-Jan-2023 20,640 0.03 20,000 Royal Bank of Canada ‘GMTN’ 2.250% 01-Nov-2024 21,056 0.03 20,000 Royal Bank of Canada ‘GMTN’ 2.550% 16-Jul-2024 21,251 0.03 5,000 Royal Bank of Canada ‘GMTN’ 2.750% 01-Feb-2022 5,188 0.01 15,000 Royal Bank of Canada ‘GMTN’ 3.700% 05-Oct-2023 16,399 0.03 20,000 Royal Bank of Canada ‘GMTN’ 4.650% 27-Jan-2026 23,322 0.04 20,000 RPM International Inc 4.250% 15-Jan-2048 19,730 0.03 15,000 RPM International Inc 4.550% 01-Mar-2029 16,890 0.03 10,000 RPM International Inc 5.250% 01-Jun-2045 11,315 0.02 65,000 S&P Global Inc 2.500% 01-Dec-2029 70,383 0.11 10,000 S&P Global Inc 2.950% 22-Jan-2027 11,019 0.02 20,000 Sabine Pass Liquefaction LLC 4.200% 15-Mar-2028 21,483 0.03 20,000 Sabine Pass Liquefaction LLC 5.625% 01-Mar-2025 22,872 0.04 100,000 Sabine Pass Liquefaction LLC 5.750% 15-May-2024 112,671 0.18 10,000 Sabine Pass Liquefaction LLC 5.875% 30-Jun-2026 11,758 0.02 10,000 San Diego Gas & Electric Co 3.600% 01-Sep-2023 10,797 0.02 50,000 Sands China Ltd 4.600% 08-Aug-2023 52,765 0.08 20,000 Santander Holdings USA Inc 3.400% 18-Jan-2023 20,811 0.03 25,000 Santander Holdings USA Inc 3.500% 07-Jun-2024 26,311 0.04 20,000 Santander Holdings USA Inc 4.500% 17-Jul-2025 21,651 0.03 50,000 Santander UK Plc 4.000% 13-Mar-2024 55,152 0.09 20,000 Schlumberger Finance Canada Ltd ‘144A’
2.650% 20-Nov-2022 20,630 0.03 20,000 Schlumberger Investment SA ‘144A’
2.400% 01-Aug-2022 20,504 0.03 50,000 Seagate HDD Cayman 4.750% 01-Jan-2025 53,683 0.09 25,000 Seagate HDD Cayman 4.875% 01-Mar-2024 26,813 0.04 10,000 Selective Insurance Group Inc
5.375% 01-Mar-2049 11,559 0.02 35,000 Sempra Energy 3.550% 15-Jun-2024 37,678 0.06 35,000 Sempra Energy 4.050% 01-Dec-2023 38,153 0.06 5,000 Sempra Energy 6.000% 15-Oct-2039 6,916 0.01 20,000 Service Properties Trust 4.950% 01-Oct-2029 16,975 0.03 15,000 Shell International Finance BV 2.375% 07-Nov-2029 15,841 0.03 35,000 Shell International Finance BV 2.875% 10-May-2026 38,455 0.06 5,000 Shell International Finance BV 3.250% 11-May-2025 5,543 0.01 5,000 Shell International Finance BV 3.500% 13-Nov-2023 5,443 0.01
35,000 Phillips 66 Partners LP 3.605% 15-Feb-2025 37,401 0.06 5,000 Phillips 66 Partners LP 4.680% 15-Feb-2045 5,331 0.01 10,000 Phillips 66 Partners LP 4.900% 01-Oct-2046 10,847 0.02 20,000 Physicians Realty LP 3.950% 15-Jan-2028 20,424 0.03 15,000 Plains All American Pipeline LP / PAA Finance Corp
5.150% 01-Jun-2042 14,569 0.02 50,000 PNC Financial Services Group Inc/The
2.550% 22-Jan-2030 54,105 0.09 25,000 PNC Financial Services Group Inc/The
3.300% 08-Mar-2022 26,091 0.04 50,000 PNC Financial Services Group Inc/The
3.450% 23-Apr-2029 57,532 0.09 25,000 PNC Financial Services Group Inc/The
3.500% 23-Jan-2024 27,348 0.04 35,000 PNC Financial Services Group Inc/The Step-Up Coupon
2.854% 09-Nov-2022 36,881 0.06 10,000 Precision Castparts Corp 2.500% 15-Jan-2023 10,487 0.02 10,000 Precision Castparts Corp 3.250% 15-Jun-2025 11,104 0.02 10,000 Principal Financial Group Inc 3.100% 15-Nov-2026 10,923 0.02 50,000 Principal Financial Group Inc 3.700% 15-May-2029 56,972 0.09 30,000 Procter & Gamble Co/The 2.150% 11-Aug-2022 31,156 0.05 5,000 Procter & Gamble Co/The 2.300% 06-Feb-2022 5,164 0.01 45,000 Procter & Gamble Co/The 2.450% 25-Mar-2025 48,871 0.08 35,000 Procter & Gamble Co/The 2.700% 02-Feb-2026 39,191 0.06 10,000 Procter & Gamble Co/The 2.850% 11-Aug-2027 11,272 0.02 30,000 Procter & Gamble Co/The 3.000% 25-Mar-2030 34,391 0.06 25,000 Procter & Gamble Co/The 3.100% 15-Aug-2023 27,307 0.04 5,000 Procter & Gamble Co/The 3.550% 25-Mar-2040 6,025 0.01 15,000 Progressive Corp/The 2.450% 15-Jan-2027 16,038 0.03 15,000 Progressive Corp/The 4.000% 01-Mar-2029 17,967 0.03 10,000 Prologis LP 3.875% 15-Sep-2028 11,865 0.02 10,000 Prologis LP 4.375% 01-Feb-2029 12,170 0.02 50,000 Prudential Financial Inc ‘MTN’ 2.100% 10-Mar-2030 50,969 0.08 10,000 Prudential Financial Inc ‘MTN’ 3.700% 13-Mar-2051 10,986 0.02 20,000 Prudential Financial Inc ‘MTN’ 6.625% 01-Dec-2037 29,291 0.05 25,000 Public Service Co of Colorado 6.500% 01-Aug-2038 38,492 0.06 35,000 Public Service Enterprise Group Inc
2.875% 15-Jun-2024 37,409 0.06 10,000 Public Storage 3.094% 15-Sep-2027 11,171 0.02 10,000 Public Storage 3.385% 01-May-2029 11,559 0.02 40,000 Puget Energy Inc 3.650% 15-May-2025 42,791 0.07 10,000 Puget Sound Energy Inc 5.757% 01-Oct-2039 13,996 0.02 10,000 QUALCOMM Inc 4.650% 20-May-2035 13,322 0.02 5,000 Quest Diagnostics Inc 2.950% 30-Jun-2030 5,286 0.01 10,000 QVC Inc 4.450% 15-Feb-2025 9,853 0.02 5,000 Raytheon Technologies Corp 3.750% 01-Nov-2046 5,720 0.01 30,000 Raytheon Technologies Corp 3.950% 16-Aug-2025 34,159 0.05 25,000 Raytheon Technologies Corp 4.125% 16-Nov-2028 29,468 0.05 25,000 Raytheon Technologies Corp 4.500% 01-Jun-2042 31,204 0.05 5,000 Raytheon Technologies Corp 4.625% 16-Nov-2048 6,503 0.01 10,000 Raytheon Technologies Corp 5.700% 15-Apr-2040 13,863 0.02 10,000 Raytheon Technologies Corp 6.050% 01-Jun-2036 14,178 0.02 10,000 Raytheon Technologies Corp ‘144A’
3.500% 15-Mar-2027 11,269 0.02 5,000 Raytheon Technologies Corp ‘144A’
4.350% 15-Apr-2047 6,086 0.01 10,000 Raytheon Technologies Corp ‘144A’
4.875% 15-Oct-2040 12,779 0.02 10,000 Realty Income Corp 3.250% 15-Jun-2029 10,825 0.02
Bonds cont’d.
US Dollar cont’d.
Bonds cont’d.
US Dollar cont’d.
USDUSD
03613-1A.indd 102 19/08/2020 19:00

103
Schedule of investments – as at 30 June 2020
Holdings Description
Fair value
Total net assets
% Holdings Description
Fair value
Total net assets
%
BNy MELLON EFFICIENT GLOBAL IG CORpORATE BETA FUND
100,000 Sumitomo Mitsui Financial Group Inc 3.040% 16-Jul-2029 107,755 0.17
25,000 Sumitomo Mitsui Financial Group Inc 3.364% 12-Jul-2027 27,659 0.04
25,000 Sumitomo Mitsui Financial Group Inc 3.446% 11-Jan-2027 27,796 0.04
25,000 Sumitomo Mitsui Financial Group Inc 3.544% 17-Jan-2028 27,926 0.04
25,000 SVB Financial Group 3.500% 29-Jan-2025 26,463 0.04 20,000 Synchrony Financial 2.850% 25-Jul-2022 20,349 0.03 55,000 Synchrony Financial 4.250% 15-Aug-2024 57,788 0.09 5,000 Sysco Corp 2.600% 12-Jun-2022 5,156 0.01 50,000 Sysco Corp 3.300% 15-Jul-2026 53,591 0.09 10,000 Sysco Corp 4.500% 01-Apr-2046 10,877 0.02 30,000 Sysco Corp 6.600% 01-Apr-2050 41,708 0.07 30,000 Target Corp 2.250% 15-Apr-2025 32,121 0.05 25,000 TCI Communications Inc 7.125% 15-Feb-2028 34,813 0.06 50,000 Telstra Corp Ltd ‘144A’ 3.125% 07-Apr-2025 54,249 0.09 30,000 Tennessee Gas Pipeline Co LLC 7.000% 15-Oct-2028 38,004 0.06 5,000 Texas Eastern Transmission LP 7.000% 15-Jul-2032 6,724 0.01 25,000 Texas Instruments Inc 1.375% 12-Mar-2025 25,682 0.04 5,000 Texas Instruments Inc 1.750% 04-May-2030 5,087 0.01 25,000 Texas Instruments Inc 2.250% 04-Sep-2029 26,633 0.04 10,000 Texas Instruments Inc 2.625% 15-May-2024 10,755 0.02 10,000 Texas Instruments Inc 3.875% 15-Mar-2039 12,440 0.02 15,000 Thermo Fisher Scientific Inc 4.100% 15-Aug-2047 18,734 0.03 50,000 Thermo Fisher Scientific Inc 4.150% 01-Feb-2024 55,533 0.09 40,000 Thermo Fisher Scientific Inc 4.497% 25-Mar-2030 49,637 0.08 20,000 Thomson Reuters Corp 5.500% 15-Aug-2035 24,880 0.04 25,000 Thomson Reuters Corp 5.850% 15-Apr-2040 31,164 0.05 10,000 Time Warner Cable LLC 5.875% 15-Nov-2040 12,379 0.02 20,000 Time Warner Cable LLC 6.550% 01-May-2037 26,340 0.04 10,000 Time Warner Cable LLC 7.300% 01-Jul-2038 13,795 0.02 50,000 T-Mobile USA Inc ‘144A’ 1.500% 15-Feb-2026 50,121 0.08 50,000 T-Mobile USA Inc ‘144A’ 2.050% 15-Feb-2028 50,148 0.08 50,000 T-Mobile USA Inc ‘144A’ 2.550% 15-Feb-2031 50,301 0.08 55,000 T-Mobile USA Inc ‘144A’ 3.500% 15-Apr-2025 59,965 0.10 30,000 T-Mobile USA Inc ‘144A’ 3.750% 15-Apr-2027 33,283 0.05 90,000 T-Mobile USA Inc ‘144A’ 3.875% 15-Apr-2030 100,335 0.16 20,000 T-Mobile USA Inc ‘144A’ 4.500% 15-Apr-2050 23,855 0.04 20,000 Toronto-Dominion Bank/The ‘GMTN’
3.500% 19-Jul-2023 21,879 0.03 20,000 Toronto-Dominion Bank/The ‘MTN’
1.900% 01-Dec-2022 20,660 0.03 20,000 Toronto-Dominion Bank/The ‘MTN’
2.650% 12-Jun-2024 21,414 0.03 5,000 Total Capital SA 4.250% 15-Dec-2021 5,283 0.01 15,000 Toyota Motor Corp 3.669% 20-Jul-2028 17,462 0.03 15,000 Toyota Motor Credit Corp 3.350% 08-Jan-2024 16,273 0.03 50,000 Toyota Motor Credit Corp ‘GMTN’ 3.450% 20-Sep-2023 54,381 0.09 40,000 Toyota Motor Credit Corp ‘MTN’ 1.800% 13-Feb-2025 41,489 0.07 30,000 Toyota Motor Credit Corp ‘MTN’ 2.150% 08-Sep-2022 31,022 0.05 15,000 Toyota Motor Credit Corp ‘MTN’ 2.250% 18-Oct-2023 15,726 0.03 35,000 Toyota Motor Credit Corp ‘MTN’ 3.000% 01-Apr-2025 38,065 0.06 20,000 Toyota Motor Credit Corp ‘MTN’ 3.300% 12-Jan-2022 20,842 0.03 15,000 Toyota Motor Credit Corp ‘MTN’ 3.375% 01-Apr-2030 17,300 0.03 15,000 Trane Technologies Global Holding Co Ltd
5.750% 15-Jun-2043 19,701 0.03 25,000 TransCanada PipeLines Ltd 2.500% 01-Aug-2022 25,788 0.04
15,000 Shell International Finance BV 3.875% 13-Nov-2028 17,454 0.03 15,000 Shell International Finance BV 6.375% 15-Dec-2038 22,532 0.04 10,000 Sherwin-Williams Co/The 2.950% 15-Aug-2029 10,771 0.02 40,000 Sherwin-Williams Co/The 3.125% 01-Jun-2024 43,031 0.07 30,000 Sherwin-Williams Co/The 3.450% 01-Aug-2025 33,136 0.05 10,000 Sherwin-Williams Co/The 4.500% 01-Jun-2047 12,194 0.02 10,000 Sherwin-Williams Co/The 4.550% 01-Aug-2045 11,692 0.02 25,000 Shire Acquisitions Investments Ireland DAC
2.875% 23-Sep-2023 26,511 0.04 30,000 Shire Acquisitions Investments Ireland DAC
3.200% 23-Sep-2026 33,315 0.05 15,000 Simon Property Group LP 2.350% 30-Jan-2022 15,293 0.02 15,000 Simon Property Group LP 2.625% 15-Jun-2022 15,422 0.02 50,000 Societe Generale SA ‘144A’ 4.750% 14-Sep-2028 58,281 0.09 15,000 Sonoco Products Co 5.750% 01-Nov-2040 18,436 0.03 20,000 Southern California Edison Co 6.650% 01-Apr-2029 24,821 0.04 50,000 Southern California Gas Co 2.550% 01-Feb-2030 53,949 0.09 10,000 Southern California Gas Co 2.600% 15-Jun-2026 10,827 0.02 30,000 Southern Co Gas Capital Corp 2.450% 01-Oct-2023 31,506 0.05 40,000 Southern Co Gas Capital Corp 4.400% 01-Jun-2043 45,401 0.07 50,000 Southern Co Gas Capital Corp 5.875% 15-Mar-2041 66,567 0.11 35,000 Southern Co/The 2.350% 01-Jul-2021 35,601 0.06 20,000 Southern Co/The 2.950% 01-Jul-2023 21,158 0.03 30,000 Southern Co/The 3.250% 01-Jul-2026 33,272 0.05 20,000 Southern Co/The FRN 5.500% 15-Mar-2057 20,287 0.03 10,000 Southern Copper Corp 3.500% 08-Nov-2022 10,499 0.02 10,000 Southern Copper Corp 5.250% 08-Nov-2042 11,884 0.02 35,000 Southern Copper Corp 5.875% 23-Apr-2045 44,770 0.07 20,000 Southern Copper Corp 6.750% 16-Apr-2040 27,173 0.04 20,000 Southwestern Electric Power Co 2.750% 01-Oct-2026 21,320 0.03 30,000 Southwestern Electric Power Co 3.850% 01-Feb-2048 32,249 0.05 15,000 Southwestern Electric Power Co 3.900% 01-Apr-2045 16,311 0.03 20,000 Spectra Energy Partners LP 4.500% 15-Mar-2045 22,766 0.04 10,000 Spectra Energy Partners LP 4.750% 15-Mar-2024 11,182 0.02 30,000 Spectra Energy Partners LP 5.950% 25-Sep-2043 37,713 0.06 20,000 Standard Chartered Bank ‘144A’ 8.000% 30-May-2031 26,635 0.04 60,000 Stanley Black & Decker Inc FRN 4.000% 15-Mar-2060 60,094 0.10 25,000 Starbucks Corp 2.000% 12-Mar-2027 26,352 0.04 20,000 Starbucks Corp 2.250% 12-Mar-2030 20,588 0.03 50,000 Starbucks Corp 2.550% 15-Nov-2030 52,565 0.08 35,000 Starbucks Corp 3.100% 01-Mar-2023 37,264 0.06 15,000 Starbucks Corp 3.350% 12-Mar-2050 15,569 0.02 10,000 Starbucks Corp 3.500% 01-Mar-2028 11,269 0.02 50,000 Starbucks Corp 3.500% 15-Nov-2050 52,929 0.08 10,000 Starbucks Corp 3.750% 01-Dec-2047 10,790 0.02 15,000 Starbucks Corp 3.800% 15-Aug-2025 16,917 0.03 15,000 Starbucks Corp 4.300% 15-Jun-2045 17,592 0.03 10,000 Starbucks Corp 4.500% 15-Nov-2048 11,807 0.02 30,000 Steel Dynamics Inc 2.800% 15-Dec-2024 31,260 0.05 30,000 Steel Dynamics Inc 4.125% 15-Sep-2025 30,684 0.05 15,000 Steel Dynamics Inc 5.000% 15-Dec-2026 15,882 0.03 30,000 Steel Dynamics Inc 5.500% 01-Oct-2024 30,844 0.05 40,000 Stifel Financial Corp 4.250% 18-Jul-2024 42,535 0.07 5,000 Stryker Corp 3.375% 01-Nov-2025 5,600 0.01 20,000 Stryker Corp 3.500% 15-Mar-2026 22,509 0.04 200,000 Sumitomo Mitsui Financial Group Inc
2.724% 27-Sep-2029 210,625 0.34 50,000 Sumitomo Mitsui Financial Group Inc
2.750% 15-Jan-2030 53,033 0.08
Bonds cont’d.
US Dollar cont’d.
Bonds cont’d.
US Dollar cont’d.
USDUSD
03613-1A.indd 103 19/08/2020 19:00

104
Schedule of investments – as at 30 June 2020
Holdings Description
Fair value
Total net assets
% Holdings Description
Fair value
Total net assets
%
BNy MELLON EFFICIENT GLOBAL IG CORpORATE BETA FUND
5,000 US Bancorp ‘MTN’ 3.000% 15-Mar-2022 5,220 0.01 30,000 US Bancorp ‘MTN’ 3.100% 27-Apr-2026 33,336 0.05 20,000 US Bancorp ‘MTN’ 3.600% 11-Sep-2024 22,277 0.04 20,000 Vale Overseas Ltd 6.875% 21-Nov-2036 26,216 0.04 10,000 Valero Energy Corp 6.625% 15-Jun-2037 13,313 0.02 25,000 Valmont Industries Inc 5.000% 01-Oct-2044 26,059 0.04 30,000 Ventas Realty LP 3.500% 01-Feb-2025 31,001 0.05 5,000 Ventas Realty LP 4.000% 01-Mar-2028 5,305 0.01 25,000 VEREIT Operating Partnership LP 3.100% 15-Dec-2029 24,115 0.04 45,000 VEREIT Operating Partnership LP 4.625% 01-Nov-2025 48,695 0.08 50,000 Verisk Analytics Inc 3.625% 15-May-2050 56,765 0.09 25,000 Verisk Analytics Inc 4.125% 15-Mar-2029 29,231 0.05 10,000 Verisk Analytics Inc 5.500% 15-Jun-2045 13,756 0.02 10,000 Verizon Communications Inc 2.450% 01-Nov-2022 10,396 0.02 15,000 Verizon Communications Inc 2.625% 15-Aug-2026 16,335 0.03 20,000 Verizon Communications Inc 3.150% 22-Mar-2030 22,481 0.04 40,000 Verizon Communications Inc 3.376% 15-Feb-2025 44,535 0.07 20,000 Verizon Communications Inc 3.500% 01-Nov-2024 22,150 0.04 20,000 Verizon Communications Inc 3.875% 08-Feb-2029 23,672 0.04 50,000 Verizon Communications Inc 4.016% 03-Dec-2029 59,746 0.10 50,000 Verizon Communications Inc 4.125% 16-Mar-2027 59,011 0.09 10,000 Verizon Communications Inc 4.125% 15-Aug-2046 12,541 0.02 20,000 Verizon Communications Inc 4.272% 15-Jan-2036 24,763 0.04 30,000 Verizon Communications Inc 4.329% 21-Sep-2028 36,131 0.06 25,000 Verizon Communications Inc 4.400% 01-Nov-2034 31,162 0.05 15,000 Verizon Communications Inc 4.500% 10-Aug-2033 18,704 0.03 40,000 Verizon Communications Inc 4.522% 15-Sep-2048 53,006 0.08 40,000 Verizon Communications Inc 4.672% 15-Mar-2055 54,482 0.09 20,000 Verizon Communications Inc 4.812% 15-Mar-2039 26,160 0.04 20,000 Verizon Communications Inc 4.862% 21-Aug-2046 27,204 0.04 10,000 Verizon Communications Inc 5.012% 15-Apr-2049 13,983 0.02 5,000 Verizon Communications Inc 5.012% 21-Aug-2054 7,277 0.01 30,000 Verizon Communications Inc 5.150% 15-Sep-2023 34,182 0.05 20,000 Verizon Communications Inc 5.250% 16-Mar-2037 26,807 0.04 10,000 Verizon Communications Inc 5.500% 16-Mar-2047 14,848 0.02 10,000 Virginia Electric and Power Co 3.500% 15-Mar-2027 11,357 0.02 10,000 Virginia Electric and Power Co 6.000% 15-Jan-2036 13,841 0.02 25,000 Virginia Electric and Power Co 8.875% 15-Nov-2038 45,008 0.07 5,000 Visa Inc 2.700% 15-Apr-2040 5,366 0.01 20,000 Visa Inc 2.750% 15-Sep-2027 22,080 0.04 40,000 Visa Inc 3.150% 14-Dec-2025 44,590 0.07 30,000 Vistra Operations Co LLC ‘144A’ 3.550% 15-Jul-2024 30,982 0.05 35,000 VMware Inc 2.950% 21-Aug-2022 36,217 0.06 45,000 VMware Inc 3.900% 21-Aug-2027 47,784 0.08 30,000 VMware Inc 4.500% 15-May-2025 32,858 0.05 5,000 Vodafone Group Plc 4.250% 17-Sep-2050 5,981 0.01 10,000 Vodafone Group Plc 4.375% 19-Feb-2043 11,656 0.02 10,000 Vodafone Group Plc 4.875% 19-Jun-2049 12,660 0.02 10,000 Vodafone Group Plc 5.000% 30-May-2038 12,584 0.02 15,000 Vodafone Group Plc 5.250% 30-May-2048 19,621 0.03 15,000 Vodafone Group Plc 6.150% 27-Feb-2037 21,049 0.03 5,000 Vornado Realty LP 3.500% 15-Jan-2025 5,001 0.01 20,000 Vulcan Materials Co 3.900% 01-Apr-2027 21,909 0.04 5,000 Vulcan Materials Co 4.500% 15-Jun-2047 5,599 0.01 10,000 W R Berkley Corp 4.750% 01-Aug-2044 11,779 0.02 10,000 Wachovia Corp 5.500% 01-Aug-2035 13,078 0.02 25,000 Walmart Inc 2.850% 08-Jul-2024 27,222 0.04 25,000 Walmart Inc 3.300% 22-Apr-2024 27,508 0.04 35,000 Walmart Inc 3.400% 26-Jun-2023 38,149 0.06
20,000 TransCanada PipeLines Ltd 3.750% 16-Oct-2023 21,619 0.03 10,000 TransCanada PipeLines Ltd 4.625% 01-Mar-2034 11,512 0.02 10,000 TransCanada PipeLines Ltd 4.750% 15-May-2038 11,777 0.02 35,000 TransCanada PipeLines Ltd 5.000% 16-Oct-2043 41,133 0.07 20,000 TransCanada PipeLines Ltd 5.100% 15-Mar-2049 25,666 0.04 10,000 TransCanada PipeLines Ltd 5.850% 15-Mar-2036 13,121 0.02 20,000 TransCanada PipeLines Ltd 6.100% 01-Jun-2040 26,285 0.04 10,000 TransCanada PipeLines Ltd 7.625% 15-Jan-2039 15,501 0.02 30,000 Transcanada Trust FRN 5.500% 15-Sep-2079 29,977 0.05 10,000 Travelers Cos Inc/The ‘MTN’ 6.250% 15-Jun-2037 14,864 0.02 10,000 Travelers Property Casualty Corp 6.375% 15-Mar-2033 14,759 0.02 10,000 Trimble Inc 4.150% 15-Jun-2023 10,668 0.02 25,000 Trimble Inc 4.900% 15-Jun-2028 28,734 0.05 45,000 Trinity Acquisition Plc 4.400% 15-Mar-2026 51,339 0.08 10,000 Truist Bank 3.200% 01-Apr-2024 10,848 0.02 20,000 Truist Bank ‘BKNT’ 2.450% 01-Aug-2022 20,733 0.03 20,000 Truist Bank ‘BKNT’ 3.000% 02-Feb-2023 21,161 0.03 50,000 Truist Bank ‘BKNT’ FRN 3.502% 02-Aug-2022 51,595 0.08 15,000 TWDC Enterprises 18 Corp ‘MTN’ 2.550% 15-Feb-2022 15,477 0.02 5,000 Tyco Electronics Group SA 3.500% 03-Feb-2022 5,201 0.01 25,000 Tyson Foods Inc 3.550% 02-Jun-2027 27,698 0.04 25,000 Tyson Foods Inc 3.950% 15-Aug-2024 27,712 0.04 20,000 Tyson Foods Inc 4.000% 01-Mar-2026 22,898 0.04 10,000 Tyson Foods Inc 4.550% 02-Jun-2047 12,311 0.02 20,000 Tyson Foods Inc 5.100% 28-Sep-2048 25,766 0.04 25,000 UDR Inc 3.100% 01-Nov-2034 26,728 0.04 15,000 UDR Inc ‘MTN’ 3.200% 15-Jan-2030 16,361 0.03 100,000 Unilever Capital Corp 3.500% 22-Mar-2028 115,585 0.19 25,000 Union Pacific Corp 2.400% 05-Feb-2030 26,690 0.04 5,000 Union Pacific Corp 2.950% 01-Mar-2022 5,198 0.01 25,000 Union Pacific Corp 2.950% 15-Jan-2023 26,430 0.04 25,000 Union Pacific Corp 3.150% 01-Mar-2024 27,156 0.04 25,000 Union Pacific Corp 3.250% 15-Jan-2025 27,518 0.04 10,000 Union Pacific Corp 3.250% 05-Feb-2050 11,009 0.02 10,000 Union Pacific Corp 3.375% 01-Feb-2035 11,280 0.02 10,000 Union Pacific Corp 3.646% 15-Feb-2024 10,948 0.02 25,000 Union Pacific Corp 3.750% 15-Mar-2024 27,585 0.04 40,000 Union Pacific Corp 3.750% 15-Jul-2025 45,311 0.07 20,000 Union Pacific Corp 3.750% 05-Feb-2070 22,411 0.04 20,000 Union Pacific Corp 3.799% 01-Oct-2051 23,838 0.04 10,000 Union Pacific Corp 3.839% 20-Mar-2060 11,619 0.02 40,000 Union Pacific Corp 4.000% 15-Apr-2047 48,348 0.08 10,000 Union Pacific Corp 4.050% 01-Mar-2046 11,933 0.02 15,000 Union Pacific Corp 4.300% 01-Mar-2049 19,214 0.03 15,000 Union Pacific Corp 4.500% 10-Sep-2048 19,374 0.03 5,000 Union Pacific Corp ‘MTN’ 3.550% 15-Aug-2039 5,625 0.01 50,000 United Parcel Service Inc 4.450% 01-Apr-2030 62,555 0.10 5,000 UnitedHealth Group Inc 2.750% 15-May-2040 5,361 0.01 35,000 UnitedHealth Group Inc 2.875% 15-Mar-2023 37,328 0.06 30,000 UnitedHealth Group Inc 3.500% 15-Jun-2023 32,700 0.05 30,000 UnitedHealth Group Inc 3.500% 15-Feb-2024 33,023 0.05 10,000 UnitedHealth Group Inc 3.500% 15-Aug-2039 11,645 0.02 30,000 UnitedHealth Group Inc 3.700% 15-Dec-2025 34,435 0.06 40,000 UnitedHealth Group Inc 3.750% 15-Jul-2025 45,605 0.07 10,000 UnitedHealth Group Inc 3.875% 15-Aug-2059 12,278 0.02 60,000 UnitedHealth Group Inc 6.875% 15-Feb-2038 93,554 0.15 15,000 University of Chicago/The 4.003% 01-Oct-2053 19,126 0.03 5,000 University of Southern California 3.226% 01-Oct-2120 5,224 0.01 25,000 US Bancorp ‘MTN’ 2.950% 15-Jul-2022 26,211 0.04
Bonds cont’d.
US Dollar cont’d.
Bonds cont’d.
US Dollar cont’d.
USDUSD
03613-1A.indd 104 19/08/2020 19:00
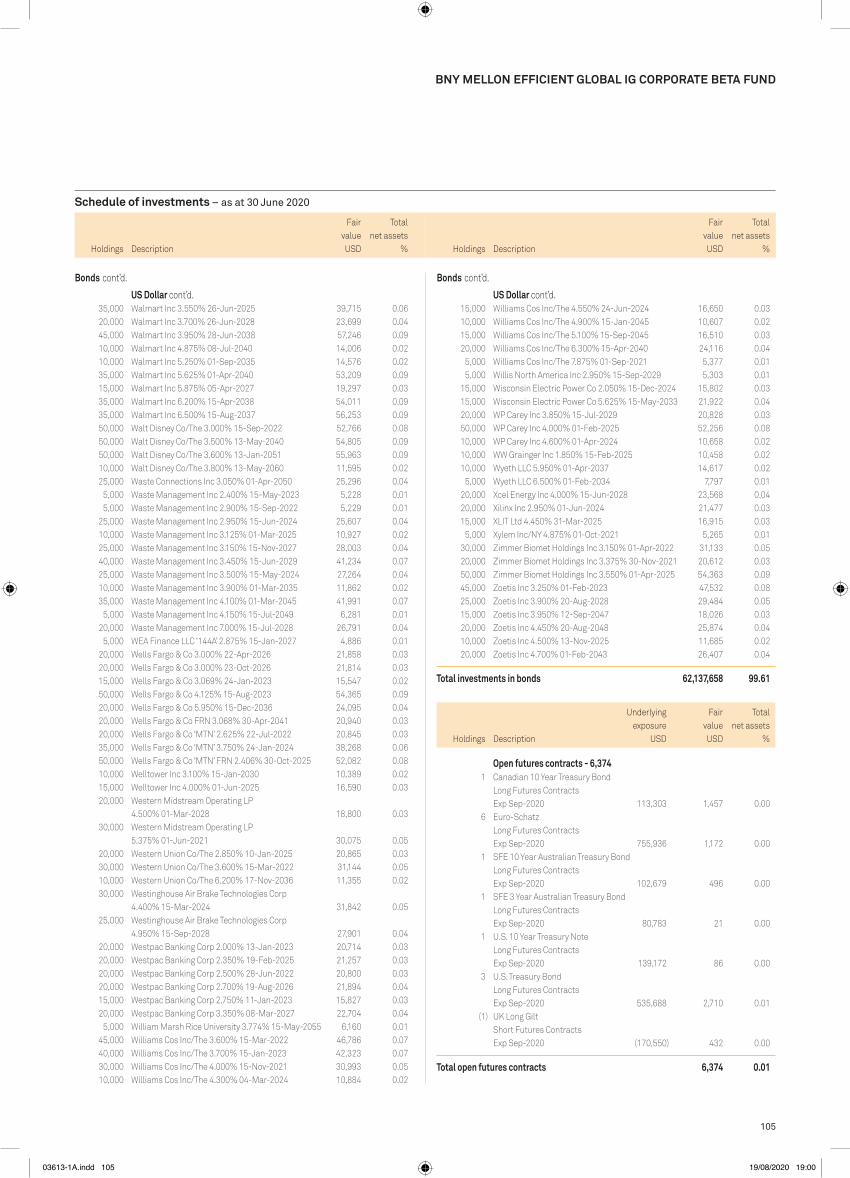
105
Schedule of investments – as at 30 June 2020
Holdings Description
Fair value
Total net assets
% Holdings Description
Fair value
Total net assets
%
BNy MELLON EFFICIENT GLOBAL IG CORpORATE BETA FUND
15,000 Williams Cos Inc/The 4.550% 24-Jun-2024 16,650 0.03 10,000 Williams Cos Inc/The 4.900% 15-Jan-2045 10,607 0.02 15,000 Williams Cos Inc/The 5.100% 15-Sep-2045 16,510 0.03 20,000 Williams Cos Inc/The 6.300% 15-Apr-2040 24,116 0.04 5,000 Williams Cos Inc/The 7.875% 01-Sep-2021 5,377 0.01 5,000 Willis North America Inc 2.950% 15-Sep-2029 5,303 0.01 15,000 Wisconsin Electric Power Co 2.050% 15-Dec-2024 15,802 0.03 15,000 Wisconsin Electric Power Co 5.625% 15-May-2033 21,922 0.04 20,000 WP Carey Inc 3.850% 15-Jul-2029 20,828 0.03 50,000 WP Carey Inc 4.000% 01-Feb-2025 52,256 0.08 10,000 WP Carey Inc 4.600% 01-Apr-2024 10,658 0.02 10,000 WW Grainger Inc 1.850% 15-Feb-2025 10,458 0.02 10,000 Wyeth LLC 5.950% 01-Apr-2037 14,617 0.02 5,000 Wyeth LLC 6.500% 01-Feb-2034 7,797 0.01 20,000 Xcel Energy Inc 4.000% 15-Jun-2028 23,568 0.04 20,000 Xilinx Inc 2.950% 01-Jun-2024 21,477 0.03 15,000 XLIT Ltd 4.450% 31-Mar-2025 16,915 0.03 5,000 Xylem Inc/NY 4.875% 01-Oct-2021 5,265 0.01 30,000 Zimmer Biomet Holdings Inc 3.150% 01-Apr-2022 31,133 0.05 20,000 Zimmer Biomet Holdings Inc 3.375% 30-Nov-2021 20,612 0.03 50,000 Zimmer Biomet Holdings Inc 3.550% 01-Apr-2025 54,363 0.09 45,000 Zoetis Inc 3.250% 01-Feb-2023 47,532 0.08 25,000 Zoetis Inc 3.900% 20-Aug-2028 29,484 0.05 15,000 Zoetis Inc 3.950% 12-Sep-2047 18,026 0.03 20,000 Zoetis Inc 4.450% 20-Aug-2048 25,874 0.04 10,000 Zoetis Inc 4.500% 13-Nov-2025 11,685 0.02 20,000 Zoetis Inc 4.700% 01-Feb-2043 26,407 0.04
Total investments in bonds 62,137,658 99.61
Holdings Description
Underlying exposure
USD
Fair value USD
Total net assets
%
Open futures contracts - 6,374 1 Canadian 10 Year Treasury Bond
Long Futures Contracts Exp Sep-2020 113,303 1,457 0.00
6 Euro-Schatz Long Futures Contracts Exp Sep-2020 755,936 1,172 0.00
1 SFE 10 Year Australian Treasury Bond Long Futures Contracts Exp Sep-2020 102,679 496 0.00
1 SFE 3 Year Australian Treasury Bond Long Futures Contracts Exp Sep-2020 80,783 21 0.00
1 U.S. 10 Year Treasury Note Long Futures Contracts Exp Sep-2020 139,172 86 0.00
3 U.S. Treasury Bond Long Futures Contracts Exp Sep-2020 535,688 2,710 0.01
(1) UK Long Gilt Short Futures Contracts Exp Sep-2020 (170,550) 432 0.00
Total open futures contracts 6,374 0.01
35,000 Walmart Inc 3.550% 26-Jun-2025 39,715 0.06 20,000 Walmart Inc 3.700% 26-Jun-2028 23,699 0.04 45,000 Walmart Inc 3.950% 28-Jun-2038 57,246 0.09 10,000 Walmart Inc 4.875% 08-Jul-2040 14,006 0.02 10,000 Walmart Inc 5.250% 01-Sep-2035 14,576 0.02 35,000 Walmart Inc 5.625% 01-Apr-2040 53,209 0.09 15,000 Walmart Inc 5.875% 05-Apr-2027 19,297 0.03 35,000 Walmart Inc 6.200% 15-Apr-2038 54,011 0.09 35,000 Walmart Inc 6.500% 15-Aug-2037 56,253 0.09 50,000 Walt Disney Co/The 3.000% 15-Sep-2022 52,766 0.08 50,000 Walt Disney Co/The 3.500% 13-May-2040 54,805 0.09 50,000 Walt Disney Co/The 3.600% 13-Jan-2051 55,963 0.09 10,000 Walt Disney Co/The 3.800% 13-May-2060 11,595 0.02 25,000 Waste Connections Inc 3.050% 01-Apr-2050 25,296 0.04 5,000 Waste Management Inc 2.400% 15-May-2023 5,228 0.01 5,000 Waste Management Inc 2.900% 15-Sep-2022 5,229 0.01 25,000 Waste Management Inc 2.950% 15-Jun-2024 25,607 0.04 10,000 Waste Management Inc 3.125% 01-Mar-2025 10,927 0.02 25,000 Waste Management Inc 3.150% 15-Nov-2027 28,003 0.04 40,000 Waste Management Inc 3.450% 15-Jun-2029 41,234 0.07 25,000 Waste Management Inc 3.500% 15-May-2024 27,264 0.04 10,000 Waste Management Inc 3.900% 01-Mar-2035 11,862 0.02 35,000 Waste Management Inc 4.100% 01-Mar-2045 41,991 0.07 5,000 Waste Management Inc 4.150% 15-Jul-2049 6,281 0.01 20,000 Waste Management Inc 7.000% 15-Jul-2028 26,791 0.04 5,000 WEA Finance LLC ‘144A’ 2.875% 15-Jan-2027 4,886 0.01 20,000 Wells Fargo & Co 3.000% 22-Apr-2026 21,858 0.03 20,000 Wells Fargo & Co 3.000% 23-Oct-2026 21,814 0.03 15,000 Wells Fargo & Co 3.069% 24-Jan-2023 15,547 0.02 50,000 Wells Fargo & Co 4.125% 15-Aug-2023 54,365 0.09 20,000 Wells Fargo & Co 5.950% 15-Dec-2036 24,095 0.04 20,000 Wells Fargo & Co FRN 3.068% 30-Apr-2041 20,940 0.03 20,000 Wells Fargo & Co ‘MTN’ 2.625% 22-Jul-2022 20,845 0.03 35,000 Wells Fargo & Co ‘MTN’ 3.750% 24-Jan-2024 38,268 0.06 50,000 Wells Fargo & Co ‘MTN’ FRN 2.406% 30-Oct-2025 52,082 0.08 10,000 Welltower Inc 3.100% 15-Jan-2030 10,389 0.02 15,000 Welltower Inc 4.000% 01-Jun-2025 16,590 0.03 20,000 Western Midstream Operating LP
4.500% 01-Mar-2028 18,800 0.03 30,000 Western Midstream Operating LP
5.375% 01-Jun-2021 30,075 0.05 20,000 Western Union Co/The 2.850% 10-Jan-2025 20,865 0.03 30,000 Western Union Co/The 3.600% 15-Mar-2022 31,144 0.05 10,000 Western Union Co/The 6.200% 17-Nov-2036 11,355 0.02 30,000 Westinghouse Air Brake Technologies Corp
4.400% 15-Mar-2024 31,842 0.05 25,000 Westinghouse Air Brake Technologies Corp
4.950% 15-Sep-2028 27,901 0.04 20,000 Westpac Banking Corp 2.000% 13-Jan-2023 20,714 0.03 20,000 Westpac Banking Corp 2.350% 19-Feb-2025 21,257 0.03 20,000 Westpac Banking Corp 2.500% 28-Jun-2022 20,800 0.03 20,000 Westpac Banking Corp 2.700% 19-Aug-2026 21,894 0.04 15,000 Westpac Banking Corp 2.750% 11-Jan-2023 15,827 0.03 20,000 Westpac Banking Corp 3.350% 08-Mar-2027 22,704 0.04 5,000 William Marsh Rice University 3.774% 15-May-2055 6,160 0.01 45,000 Williams Cos Inc/The 3.600% 15-Mar-2022 46,786 0.07 40,000 Williams Cos Inc/The 3.700% 15-Jan-2023 42,323 0.07 30,000 Williams Cos Inc/The 4.000% 15-Nov-2021 30,993 0.05 10,000 Williams Cos Inc/The 4.300% 04-Mar-2024 10,884 0.02
Bonds cont’d.
US Dollar cont’d.
Bonds cont’d.
US Dollar cont’d.
USDUSD
03613-1A.indd 105 19/08/2020 19:00

106
Schedule of investments – as at 30 June 2020
Holdings Description
Fair value
Total net assets
% Holdings Description
Fair value
Total net assets
%
BNy MELLON EFFICIENT GLOBAL IG CORpORATE BETA FUND
Unrealised gain on forward foreign currency contracts - 246,594 (see below) 246,594 0.40
Total financial assets at fair value through profit or loss 62,390,626 100.02
Holdings Description
Underlying exposure
USD
Fair value USD
Total net assets
%
Open futures contracts - (14,171) (1) Euro-Bobl
Short Futures Contracts Exp Sep-2020 (151,650) (1,080) (0.00)
1 Euro-Bund Long Futures Contracts Exp Sep-2020 198,320 (11) (0.00)
3 SGX 10 Year Mini Japanese Government Bond Long Futures Contracts Exp Sep-2020 421,986 (410) (0.00)
(9) U.S. 10 Year Ultra Treasury Note Short Futures Contracts Exp Sep-2020 (1,417,359) (5,205) (0.01)
(2) U.S. 2 Year Treasury Note Short Futures Contracts Exp Sep-2020 (441,656) (57) (0.00)
(20) U.S. 5 Year Treasury Note Short Futures Contracts Exp Sep-2020 (2,514,844) (3,892) (0.01)
16 U.S. Treasury Ultra Bond Long Futures Contracts Exp Sep-2020 3,490,500 (3,516) (0.00)
Total open futures contracts (14,171) (0.02) Unrealised loss on forward foreign currency contracts - (1,583,800) (see below) (1,583,800) (2.54)
Total financial liabilities at fair value through profit or loss (1,597,971) (2.56)
Net current assets 1,585,880 2.54
Total net assets 62,378,535 100.00
please refer to Note 18 of the financial statements. The counterparty for futures contracts is Goldman Sachs.
Analysis of portfolio % of Total Assets
Transferable securities and money market instruments admitted to official stock exchange listing or traded on a regulated market 97.10Financial derivative instruments dealt in on a regulated market 0.01oTC financial derivative instruments 0.39other current assets 2.50
Total assets 100.00
Description
USDUSD
Forward foreign currency contracts cont’d.Unrealised
Gain/(Loss)Buy Sell Amount (B) Amount (S)Settle
Date Counterparty
BNy Mellon Efficient Global IG Corporate Beta FundUS dollar Canadian dollar 1,846,458 2,481,000 15-Jul-20 Citigroup Global
Markets Limited 18,898US dollar Euro 14,533,727 12,799,700 15-Jul-20 JPMorgan Chase
Bank 148,909US dollar Sterling 2,953,766 2,320,000 15-Jul-20 JPMorgan Chase
Bank 78,787
USD 246,594
US dollar Canadian dollar 77,094 105,000 15-Jul-20 Citigroup Global Markets Limited (252)
US dollar Euro 224,686 200,000 15-Jul-20 Citigroup Global Markets Limited (82)
US dollar Sterling 86,497 70,000 15-Jul-20 Citigroup Global Markets Limited (248)
USD (582)
Net USD 246,012
BNy Mellon Efficient Global IG Corporate Beta Fund EUR W (Acc) (Hedged) Share ClassEuro US dollar 100,453 114,117 15-Jul-20 The Bank of
New York Mellon (1,225)
USD (1,225)
EUR (1,090)
BNy Mellon Efficient Global IG Corporate Beta Fund Sterling L (Acc) (Hedged) Share ClassSterling US dollar 49,659,209 63,117,240 15-Jul-20 The Bank of
New York Mellon (1,578,802)
USD (1,578,802)
GBp (1,274,152)
BNy Mellon Efficient Global IG Corporate Beta Fund Sterling W (Acc) (Hedged) Share ClassSterling US dollar 100,370 127,571 15-Jul-20 The Bank of
New York Mellon (3,191)
USD (3,191)
GBp (2,575)
03613-1A.indd 106 19/08/2020 19:00
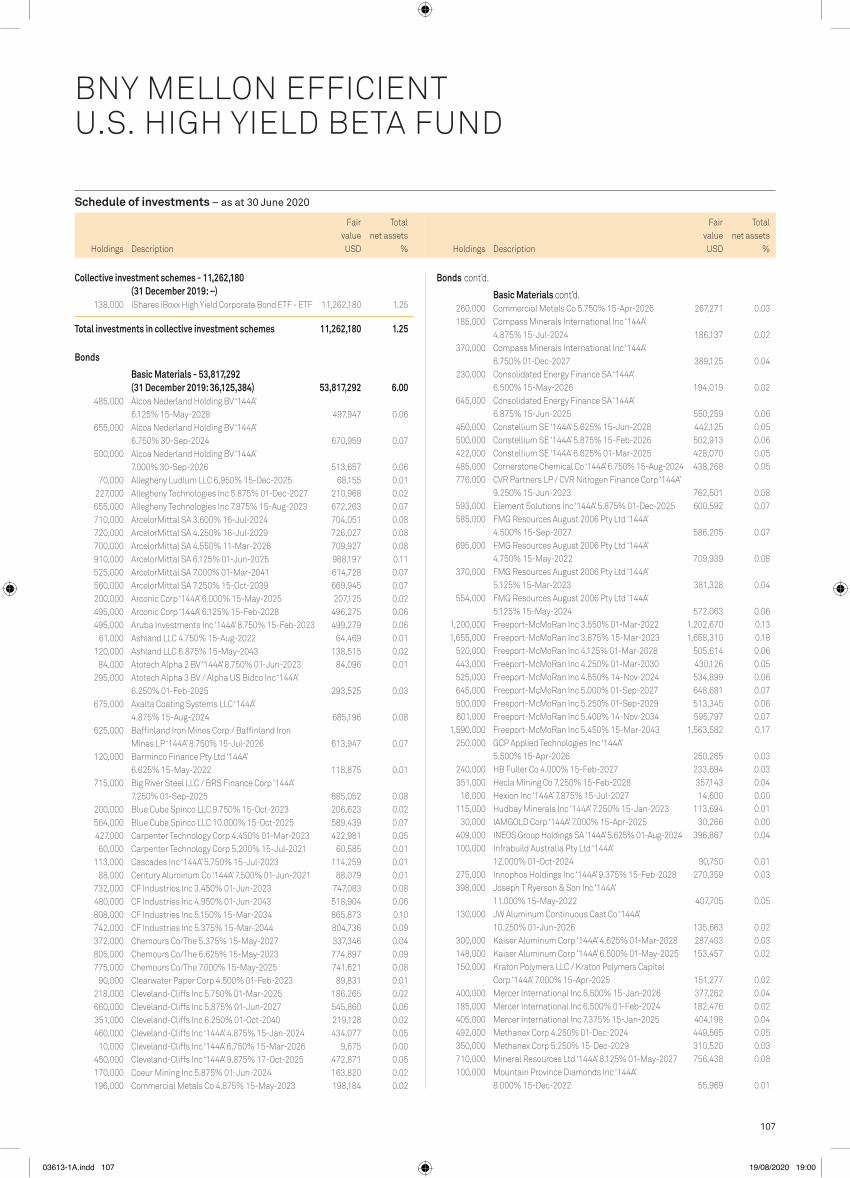
107
Schedule of investments – as at 30 June 2020
Holdings Description
Fair value
Total net assets
% Holdings Description
Fair value
Total net assets
%
12 – BNy MELLON EFFICIENT U.S. HIGH yIELD BETA FUND* / NOWy OD 31.12.2019
Collective investment schemes - 11,262,180 (31 December 2019: –)
138,000 iShares iBoxx High Yield Corporate Bond ETF - ETF 11,262,180 1.25
Total investments in collective investment schemes 11,262,180 1.25
Bonds
Basic Materials - 53,817,292 (31 December 2019: 36,125,384) 53,817,292 6.00
485,000 Alcoa Nederland Holding BV ‘144A’ 6.125% 15-May-2028 497,947 0.06
655,000 Alcoa Nederland Holding BV ‘144A’ 6.750% 30-Sep-2024 670,959 0.07
500,000 Alcoa Nederland Holding BV ‘144A’ 7.000% 30-Sep-2026 513,657 0.06
70,000 Allegheny Ludlum LLC 6.950% 15-Dec-2025 68,155 0.01 227,000 Allegheny Technologies Inc 5.875% 01-Dec-2027 210,968 0.02 655,000 Allegheny Technologies Inc 7.875% 15-Aug-2023 672,263 0.07 710,000 ArcelorMittal SA 3.600% 16-Jul-2024 704,051 0.08 720,000 ArcelorMittal SA 4.250% 16-Jul-2029 726,027 0.08 700,000 ArcelorMittal SA 4.550% 11-Mar-2026 709,927 0.08 910,000 ArcelorMittal SA 6.125% 01-Jun-2025 988,197 0.11 525,000 ArcelorMittal SA 7.000% 01-Mar-2041 614,728 0.07 560,000 ArcelorMittal SA 7.250% 15-Oct-2039 669,945 0.07 200,000 Arconic Corp ‘144A’ 6.000% 15-May-2025 207,125 0.02 495,000 Arconic Corp ‘144A’ 6.125% 15-Feb-2028 496,275 0.06 495,000 Aruba Investments Inc ‘144A’ 8.750% 15-Feb-2023 499,279 0.06 61,000 Ashland LLC 4.750% 15-Aug-2022 64,469 0.01 120,000 Ashland LLC 6.875% 15-May-2043 138,515 0.02 84,000 Atotech Alpha 2 BV ‘144A’ 8.750% 01-Jun-2023 84,096 0.01 295,000 Atotech Alpha 3 BV / Alpha US Bidco Inc ‘144A’
6.250% 01-Feb-2025 293,525 0.03 675,000 Axalta Coating Systems LLC ‘144A’
4.875% 15-Aug-2024 685,196 0.08 625,000 Baffinland Iron Mines Corp / Baffinland Iron
Mines LP ‘144A’ 8.750% 15-Jul-2026 613,947 0.07 120,000 Barminco Finance Pty Ltd ‘144A’
6.625% 15-May-2022 118,875 0.01 715,000 Big River Steel LLC / BRS Finance Corp ‘144A’
7.250% 01-Sep-2025 685,052 0.08 200,000 Blue Cube Spinco LLC 9.750% 15-Oct-2023 206,623 0.02 564,000 Blue Cube Spinco LLC 10.000% 15-Oct-2025 589,439 0.07 427,000 Carpenter Technology Corp 4.450% 01-Mar-2023 422,981 0.05 60,000 Carpenter Technology Corp 5.200% 15-Jul-2021 60,585 0.01 113,000 Cascades Inc ‘144A’ 5.750% 15-Jul-2023 114,259 0.01 88,000 Century Aluminum Co ‘144A’ 7.500% 01-Jun-2021 88,079 0.01 732,000 CF Industries Inc 3.450% 01-Jun-2023 747,083 0.08 480,000 CF Industries Inc 4.950% 01-Jun-2043 518,904 0.06 808,000 CF Industries Inc 5.150% 15-Mar-2034 865,873 0.10 742,000 CF Industries Inc 5.375% 15-Mar-2044 804,736 0.09 372,000 Chemours Co/The 5.375% 15-May-2027 337,346 0.04 805,000 Chemours Co/The 6.625% 15-May-2023 774,897 0.09 775,000 Chemours Co/The 7.000% 15-May-2025 741,621 0.08 90,000 Clearwater Paper Corp 4.500% 01-Feb-2023 89,831 0.01 218,000 Cleveland-Cliffs Inc 5.750% 01-Mar-2025 186,265 0.02 660,000 Cleveland-Cliffs Inc 5.875% 01-Jun-2027 545,860 0.06 351,000 Cleveland-Cliffs Inc 6.250% 01-Oct-2040 219,128 0.02 460,000 Cleveland-Cliffs Inc ‘144A’ 4.875% 15-Jan-2024 434,077 0.05 10,000 Cleveland-Cliffs Inc ‘144A’ 6.750% 15-Mar-2026 9,675 0.00 450,000 Cleveland-Cliffs Inc ‘144A’ 9.875% 17-Oct-2025 472,871 0.05 170,000 Coeur Mining Inc 5.875% 01-Jun-2024 163,820 0.02 196,000 Commercial Metals Co 4.875% 15-May-2023 198,184 0.02
260,000 Commercial Metals Co 5.750% 15-Apr-2026 267,271 0.03 185,000 Compass Minerals International Inc ‘144A’
4.875% 15-Jul-2024 186,137 0.02 370,000 Compass Minerals International Inc ‘144A’
6.750% 01-Dec-2027 389,125 0.04 230,000 Consolidated Energy Finance SA ‘144A’
6.500% 15-May-2026 194,019 0.02 645,000 Consolidated Energy Finance SA ‘144A’
6.875% 15-Jun-2025 550,259 0.06 450,000 Constellium SE ‘144A’ 5.625% 15-Jun-2028 442,125 0.05 500,000 Constellium SE ‘144A’ 5.875% 15-Feb-2026 502,913 0.06 422,000 Constellium SE ‘144A’ 6.625% 01-Mar-2025 428,070 0.05 485,000 Cornerstone Chemical Co ‘144A’ 6.750% 15-Aug-2024 438,268 0.05 776,000 CVR Partners LP / CVR Nitrogen Finance Corp ‘144A’
9.250% 15-Jun-2023 762,501 0.08 593,000 Element Solutions Inc ‘144A’ 5.875% 01-Dec-2025 600,592 0.07 585,000 FMG Resources August 2006 Pty Ltd ‘144A’
4.500% 15-Sep-2027 586,205 0.07 695,000 FMG Resources August 2006 Pty Ltd ‘144A’
4.750% 15-May-2022 709,939 0.08 370,000 FMG Resources August 2006 Pty Ltd ‘144A’
5.125% 15-Mar-2023 381,328 0.04 554,000 FMG Resources August 2006 Pty Ltd ‘144A’
5.125% 15-May-2024 572,063 0.06 1,200,000 Freeport-McMoRan Inc 3.550% 01-Mar-2022 1,202,670 0.13 1,655,000 Freeport-McMoRan Inc 3.875% 15-Mar-2023 1,658,310 0.18 520,000 Freeport-McMoRan Inc 4.125% 01-Mar-2028 505,614 0.06 443,000 Freeport-McMoRan Inc 4.250% 01-Mar-2030 430,126 0.05 525,000 Freeport-McMoRan Inc 4.550% 14-Nov-2024 534,899 0.06 645,000 Freeport-McMoRan Inc 5.000% 01-Sep-2027 648,681 0.07 500,000 Freeport-McMoRan Inc 5.250% 01-Sep-2029 513,345 0.06 601,000 Freeport-McMoRan Inc 5.400% 14-Nov-2034 595,797 0.07 1,590,000 Freeport-McMoRan Inc 5.450% 15-Mar-2043 1,563,582 0.17 250,000 GCP Applied Technologies Inc ‘144A’
5.500% 15-Apr-2026 250,265 0.03 240,000 HB Fuller Co 4.000% 15-Feb-2027 233,694 0.03 351,000 Hecla Mining Co 7.250% 15-Feb-2028 357,143 0.04 16,000 Hexion Inc ‘144A’ 7.875% 15-Jul-2027 14,600 0.00 115,000 Hudbay Minerals Inc ‘144A’ 7.250% 15-Jan-2023 113,694 0.01 30,000 IAMGOLD Corp ‘144A’ 7.000% 15-Apr-2025 30,266 0.00 409,000 INEOS Group Holdings SA ‘144A’ 5.625% 01-Aug-2024 396,867 0.04 100,000 Infrabuild Australia Pty Ltd ‘144A’
12.000% 01-Oct-2024 90,750 0.01 275,000 Innophos Holdings Inc ‘144A’ 9.375% 15-Feb-2028 270,359 0.03 398,000 Joseph T Ryerson & Son Inc ‘144A’
11.000% 15-May-2022 407,705 0.05 130,000 JW Aluminum Continuous Cast Co ‘144A’
10.250% 01-Jun-2026 135,663 0.02 300,000 Kaiser Aluminum Corp ‘144A’ 4.625% 01-Mar-2028 287,403 0.03 148,000 Kaiser Aluminum Corp ‘144A’ 6.500% 01-May-2025 153,457 0.02 150,000 Kraton Polymers LLC / Kraton Polymers Capital
Corp ‘144A’ 7.000% 15-Apr-2025 151,277 0.02 400,000 Mercer International Inc 5.500% 15-Jan-2026 377,262 0.04 185,000 Mercer International Inc 6.500% 01-Feb-2024 182,476 0.02 405,000 Mercer International Inc 7.375% 15-Jan-2025 404,198 0.04 492,000 Methanex Corp 4.250% 01-Dec-2024 449,565 0.05 350,000 Methanex Corp 5.250% 15-Dec-2029 310,520 0.03 710,000 Mineral Resources Ltd ‘144A’ 8.125% 01-May-2027 756,438 0.08 100,000 Mountain Province Diamonds Inc ‘144A’
8.000% 15-Dec-2022 55,969 0.01
BNY MELLON EFFICIENT U.S. HIGH YIELD BETA FUND
Bonds cont’d.
Basic Materials cont’d.
USDUSD
03613-1A.indd 107 19/08/2020 19:00

108
Schedule of investments – as at 30 June 2020
Holdings Description
Fair value
Total net assets
% Holdings Description
Fair value
Total net assets
%
BNy MELLON EFFICIENT U.S. HIGH yIELD BETA FUND
75,000 Belo Corp 7.250% 15-Sep-2027 80,142 0.01 410,000 Belo Corp 7.750% 01-Jun-2027 455,848 0.05 1,109,000 C&W Senior Financing DAC ‘144A’
6.875% 15-Sep-2027 1,103,904 0.12 615,000 C&W Senior Financing DAC ‘144A’
7.500% 15-Oct-2026 630,624 0.07 395,000 CCO Holdings LLC / CCO Holdings Capital Corp ‘144A’
4.000% 01-Mar-2023 397,218 0.04 2,035,000 CCO Holdings LLC / CCO Holdings Capital Corp ‘144A’
4.500% 15-Aug-2030 2,083,138 0.23 1,125,000 CCO Holdings LLC / CCO Holdings Capital Corp ‘144A’
4.500% 01-May-2032 1,140,469 0.13 2,590,000 CCO Holdings LLC / CCO Holdings Capital Corp ‘144A’
4.750% 01-Mar-2030 2,654,025 0.30 2,215,000 CCO Holdings LLC / CCO Holdings Capital Corp ‘144A’
5.000% 01-Feb-2028 2,289,203 0.26 2,695,000 CCO Holdings LLC / CCO Holdings Capital Corp ‘144A’
5.125% 01-May-2027 2,792,155 0.31 50,000 CCO Holdings LLC / CCO Holdings Capital Corp ‘144A’
5.375% 01-May-2025 51,380 0.01 840,000 CCO Holdings LLC / CCO Holdings Capital Corp ‘144A’
5.375% 01-Jun-2029 887,158 0.10 1,610,000 CCO Holdings LLC / CCO Holdings Capital Corp ‘144A’
5.500% 01-May-2026 1,670,625 0.19 1,731,000 CCO Holdings LLC / CCO Holdings Capital Corp ‘144A’
5.750% 15-Feb-2026 1,794,259 0.20 1,059,000 CCO Holdings LLC / CCO Holdings Capital Corp ‘144A’
5.875% 01-Apr-2024 1,093,153 0.12 938,000 CCO Holdings LLC / CCO Holdings Capital Corp ‘144A’
5.875% 01-May-2027 979,694 0.11 460,000 Cengage Learning Inc ‘144A’ 9.500% 15-Jun-2024 323,677 0.04 540,000 CenturyLink Inc 5.625% 01-Apr-2025 559,767 0.06 1,036,000 CenturyLink Inc 5.800% 15-Mar-2022 1,066,795 0.12 660,000 CenturyLink Inc 6.450% 15-Jun-2021 677,044 0.08 555,000 CenturyLink Inc 6.750% 01-Dec-2023 597,954 0.07 300,000 CenturyLink Inc 6.875% 15-Jan-2028 320,178 0.04 381,000 CenturyLink Inc 7.500% 01-Apr-2024 419,351 0.05 575,000 CenturyLink Inc 7.600% 15-Sep-2039 620,120 0.07 274,000 CenturyLink Inc 7.650% 15-Mar-2042 295,042 0.03 112,000 CenturyLink Inc ‘144A’ 4.000% 15-Feb-2027 109,036 0.01 250,000 CenturyLink Inc ‘144A’ 5.125% 15-Dec-2026 249,764 0.03 535,000 Cincinnati Bell Inc ‘144A’ 7.000% 15-Jul-2024 547,367 0.06 421,000 Cincinnati Bell Inc ‘144A’ 8.000% 15-Oct-2025 440,953 0.05 1,044,000 Clear Channel Worldwide Holdings Inc
9.250% 15-Feb-2024 971,134 0.11 85,000 Clear Channel Worldwide Holdings Inc ‘144A’
5.125% 15-Aug-2027 81,750 0.01 335,000 Cogent Communications Group Inc ‘144A’
5.375% 01-Mar-2022 345,809 0.04 925,000 CommScope Inc ‘144A’ 5.500% 01-Mar-2024 936,563 0.10 645,000 CommScope Inc ‘144A’ 5.500% 15-Jun-2024 656,823 0.07 1,125,000 CommScope Inc ‘144A’ 6.000% 01-Mar-2026 1,156,084 0.13 355,000 CommScope Inc ‘144A’ 7.125% 01-Jul-2028 355,923 0.04 716,000 CommScope Inc ‘144A’ 8.250% 01-Mar-2027 737,093 0.08 555,000 CommScope Technologies LLC ‘144A’
5.000% 15-Mar-2027 501,559 0.06 1,210,000 CommScope Technologies LLC ‘144A’
6.000% 15-Jun-2025 1,171,643 0.13 1,261,000 Connect Finco SARL / Connect US Finco LLC ‘144A’
6.750% 01-Oct-2026 1,197,193 0.13
193,000 Neon Holdings Inc ‘144A’ 10.125% 01-Apr-2026 192,517 0.02 300,000 New Gold Inc ‘144A’ 6.250% 15-Nov-2022 303,338 0.03 270,000 New Gold Inc ‘144A’ 6.375% 15-May-2025 273,684 0.03 1,130,000 Novelis Corp ‘144A’ 4.750% 30-Jan-2030 1,081,952 0.12 1,209,000 Novelis Corp ‘144A’ 5.875% 30-Sep-2026 1,211,757 0.14 590,000 Nufarm Australia Ltd / Nufarm Americas Inc ‘144A’
5.750% 30-Apr-2026 571,450 0.06 420,000 OCI NV ‘144A’ 5.250% 01-Nov-2024 404,775 0.05 510,000 OCI NV ‘144A’ 6.625% 15-Apr-2023 515,100 0.06 513,000 Olin Corp 5.000% 01-Feb-2030 455,193 0.05 245,000 Olin Corp 5.125% 15-Sep-2027 229,787 0.03 880,000 Olin Corp 5.625% 01-Aug-2029 810,722 0.09 550,000 Olin Corp ‘144A’ 9.500% 01-Jun-2025 614,281 0.07 456,000 PolyOne Corp 5.250% 15-Mar-2023 493,900 0.06 217,000 PolyOne Corp ‘144A’ 5.750% 15-May-2025 223,646 0.02 352,000 PQ Corp ‘144A’ 5.750% 15-Dec-2025 355,923 0.04 719,000 Rain CII Carbon LLC / CII Carbon Corp ‘144A’
7.250% 01-Apr-2025 692,480 0.08 351,000 Rayonier AM Products Inc ‘144A’ 5.500% 01-Jun-2024 209,321 0.02 45,000 Resolute Forest Products Inc 5.875% 15-May-2023 41,339 0.00 105,000 Schweitzer-Mauduit International Inc ‘144A’
6.875% 01-Oct-2026 107,736 0.01 300,000 Smurfit Kappa Treasury Funding DAC
7.500% 20-Nov-2025 349,410 0.04 65,000 SPCM SA ‘144A’ 4.875% 15-Sep-2025 65,708 0.01 1,010,000 Starfruit Finco BV / Starfruit US Holdco LLC ‘144A’
8.000% 01-Oct-2026 1,037,113 0.12 246,000 Taseko Mines Ltd ‘144A’ 8.750% 15-Jun-2022 206,275 0.02 290,000 TPC Group Inc ‘144A’ 10.500% 01-Aug-2024 260,124 0.03 581,000 Trinseo Materials Operating SCA / Trinseo Materials
Finance Inc ‘144A’ 5.375% 01-Sep-2025 552,313 0.06 335,000 Tronox Finance Plc ‘144A’ 5.750% 01-Oct-2025 311,096 0.03 130,000 Tronox Inc ‘144A’ 6.500% 01-May-2025 131,544 0.01 714,000 Tronox Inc ‘144A’ 6.500% 15-Apr-2026 669,304 0.07 790,000 United States Steel Corp 6.250% 15-Mar-2026 501,504 0.06 845,000 United States Steel Corp 6.875% 15-Aug-2025 576,801 0.06 325,000 Valvoline Inc ‘144A’ 4.250% 15-Feb-2030 320,684 0.04 197,000 Venator Finance Sarl / Venator Materials LLC ‘144A’
5.750% 15-Jul-2025 140,710 0.02 82,000 WR Grace & Co-Conn ‘144A’ 5.125% 01-Oct-2021 86,412 0.01 190,000 WR Grace & Co-Conn ‘144A’ 5.625% 01-Oct-2024 200,668 0.02
Communications - 176,376,789 (31 December 2019: 145,463,206) 176,376,789 19.67
890,000 Altice Financing SA ‘144A’ 5.000% 15-Jan-2028 885,510 0.10 2,550,000 Altice Financing SA ‘144A’ 7.500% 15-May-2026 2,677,564 0.30 200,000 Altice Finco SA ‘144A’ 7.625% 15-Feb-2025 208,731 0.02 855,000 Altice France Holding SA ‘144A’
6.000% 15-Feb-2028 813,323 0.09 760,000 Altice France Holding SA ‘144A’
10.500% 15-May-2027 840,503 0.09 430,000 Altice France SA/France ‘144A’
5.500% 15-Jan-2028 435,027 0.05 4,054,000 Altice France SA/France ‘144A’
7.375% 01-May-2026 4,231,768 0.47 1,242,000 Altice France SA/France ‘144A’
8.125% 01-Feb-2027 1,359,860 0.15 159,000 AMC Networks Inc 4.750% 15-Dec-2022 158,956 0.02 500,000 AMC Networks Inc 4.750% 01-Aug-2025 493,403 0.05 915,000 AMC Networks Inc 5.000% 01-Apr-2024 908,709 0.10
Bonds cont’d.
Basic Materials cont’d.
Bonds cont’d.
Communications cont’d.
USDUSD
03613-1A.indd 108 19/08/2020 19:00

109
Schedule of investments – as at 30 June 2020
Holdings Description
Fair value
Total net assets
% Holdings Description
Fair value
Total net assets
%
BNy MELLON EFFICIENT U.S. HIGH yIELD BETA FUND
374,000 iHeartCommunications Inc ‘144A’ 4.750% 15-Jan-2028 345,647 0.04
370,000 iHeartCommunications Inc ‘144A’ 5.250% 15-Aug-2027 354,900 0.04
1,105,000 Intrado Corp ‘144A’ 8.500% 15-Oct-2025 881,928 0.10 485,000 Koninklijke KPN NV ‘144A’ FRN
7.000% 28-Mar-2073 522,221 0.06 169,000 Lamar Media Corp 5.000% 01-May-2023 170,371 0.02 572,000 Lamar Media Corp 5.750% 01-Feb-2026 591,411 0.07 445,000 Lamar Media Corp ‘144A’ 3.750% 15-Feb-2028 420,937 0.05 600,000 Lamar Media Corp ‘144A’ 4.000% 15-Feb-2030 575,820 0.06 130,000 LCPR Senior Secured Financing DAC ‘144A’
6.750% 15-Oct-2027 132,820 0.01 32,000 Level 3 Financing Inc 5.125% 01-May-2023 32,083 0.00 993,000 Level 3 Financing Inc 5.250% 15-Mar-2026 1,022,606 0.11 525,000 Level 3 Financing Inc 5.375% 15-Jan-2024 530,851 0.06 469,000 Level 3 Financing Inc 5.375% 01-May-2025 480,188 0.05 575,000 Level 3 Financing Inc ‘144A’ 4.625% 15-Sep-2027 580,948 0.06 880,000 Liberty Interactive LLC 8.250% 01-Feb-2030 858,304 0.10 524,000 Liberty Interactive LLC 8.500% 15-Jul-2029 509,690 0.06 870,000 Match Group Inc/old ‘144A’ 5.000% 15-Dec-2027 908,376 0.10 215,000 Match Group Inc/old ‘144A’ 5.625% 15-Feb-2029 227,403 0.03 1,133,000 McGraw-Hill Global Education Holdings LLC /
McGraw-Hill Global Education Finance ‘144A’ 7.875% 15-May-2024 757,575 0.08
665,000 MDC Partners Inc ‘144A’ 6.500% 01-May-2024 620,528 0.07 1,045,000 Meredith Corp 6.875% 01-Feb-2026 872,711 0.10 100,000 Meredith Corp ‘144A’ 6.500% 01-Jul-2025 99,500 0.01 480,000 Metropolitan Light Co Ltd ‘144A’
5.500% 21-Nov-2022 485,784 0.05 65,000 Midcontinent Communications /
Midcontinent Finance Corp ‘144A’ 5.375% 15-Aug-2027 66,231 0.01
319,000 National CineMedia LLC 5.750% 15-Aug-2026 221,246 0.02 294,000 National CineMedia LLC ‘144A’ 5.875% 15-Apr-2028 242,678 0.03 858,000 Netflix Inc 4.375% 15-Nov-2026 895,537 0.10 1,300,000 Netflix Inc 4.875% 15-Apr-2028 1,392,170 0.16 520,000 Netflix Inc 5.500% 15-Feb-2022 543,855 0.06 145,000 Netflix Inc 5.750% 01-Mar-2024 157,491 0.02 785,000 Netflix Inc 5.875% 15-Feb-2025 869,470 0.10 1,405,000 Netflix Inc 5.875% 15-Nov-2028 1,602,452 0.18 660,000 Netflix Inc 6.375% 15-May-2029 766,715 0.09 540,000 Netflix Inc ‘144A’ 3.625% 15-Jun-2025 546,412 0.06 175,000 Netflix Inc ‘144A’ 4.875% 15-Jun-2030 188,158 0.02 856,000 Netflix Inc ‘144A’ 5.375% 15-Nov-2029 938,672 0.10 865,000 Nexstar Broadcasting Inc ‘144A’ 5.625% 01-Aug-2024 873,741 0.10 909,000 Nexstar Broadcasting Inc ‘144A’ 5.625% 15-Jul-2027 904,482 0.10 170,000 Nokia of America Corp 6.450% 15-Mar-2029 175,100 0.02 374,000 Nokia Oyj 3.375% 12-Jun-2022 382,630 0.04 450,000 Nokia Oyj 4.375% 12-Jun-2027 476,521 0.05 287,000 Nokia Oyj 6.625% 15-May-2039 342,361 0.04 330,000 NortonLifeLock Inc 3.950% 15-Jun-2022 336,187 0.04 765,000 NortonLifeLock Inc ‘144A’ 5.000% 15-Apr-2025 780,300 0.09 160,000 ORBCOMM Inc ‘144A’ 8.000% 01-Apr-2024 152,750 0.02 575,000 Outfront Media Capital LLC / Outfront Media
Capital Corp ‘144A’ 4.625% 15-Mar-2030 521,347 0.06 340,000 Outfront Media Capital LLC / Outfront Media
Capital Corp ‘144A’ 5.000% 15-Aug-2027 306,575 0.03 100,000 Outfront Media Capital LLC / Outfront Media
Capital Corp ‘144A’ 6.250% 15-Jun-2025 101,093 0.01
617,000 Consolidated Communications Inc 6.500% 01-Oct-2022 569,445 0.06
1,096,000 CSC Holdings LLC 5.250% 01-Jun-2024 1,156,395 0.13 480,000 CSC Holdings LLC 5.875% 15-Sep-2022 502,668 0.06 746,000 CSC Holdings LLC 6.750% 15-Nov-2021 785,184 0.09 1,400,000 CSC Holdings LLC ‘144A’ 4.625% 01-Dec-2030 1,366,904 0.15 675,000 CSC Holdings LLC ‘144A’ 5.375% 15-Jul-2023 685,260 0.08 825,000 CSC Holdings LLC ‘144A’ 5.375% 01-Feb-2028 864,522 0.10 1,200,000 CSC Holdings LLC ‘144A’ 5.500% 15-May-2026 1,235,130 0.14 1,025,000 CSC Holdings LLC ‘144A’ 5.500% 15-Apr-2027 1,067,537 0.12 100,000 CSC Holdings LLC ‘144A’ 5.750% 15-Jan-2030 104,291 0.01 1,700,000 CSC Holdings LLC ‘144A’ 6.500% 01-Feb-2029 1,862,563 0.21 270,000 CSC Holdings LLC ‘144A’ 6.625% 15-Oct-2025 281,304 0.03 575,000 CSC Holdings LLC ‘144A’ 7.500% 01-Apr-2028 629,139 0.07 150,000 CSC Holdings LLC ‘144A’ 7.750% 15-Jul-2025 156,482 0.02 1,255,000 CSC Holdings LLC ‘144A’ 10.875% 15-Oct-2025 1,352,068 0.15 480,000 Cumulus Media New Holdings Inc ‘144A’
6.750% 01-Jul-2026 444,223 0.05 2,260,000 Diamond Sports Group LLC / Diamond Sports
Finance Co ‘144A’ 5.375% 15-Aug-2026 1,647,156 0.18 46,000 Diamond Sports Group LLC / Diamond Sports
Finance Co ‘144A’ 12.750% 01-Dec-2026 43,700 0.00 1,168,000 DISH DBS Corp 5.000% 15-Mar-2023 1,166,850 0.13 1,675,000 DISH DBS Corp 5.875% 15-Jul-2022 1,706,867 0.19 1,952,000 DISH DBS Corp 5.875% 15-Nov-2024 1,945,588 0.22 1,340,000 DISH DBS Corp 6.750% 01-Jun-2021 1,367,336 0.15 1,875,000 DISH DBS Corp 7.750% 01-Jul-2026 1,991,006 0.22 87,000 DISH DBS Corp ‘144A’ 7.375% 01-Jul-2028 86,891 0.01 225,000 DKT Finance ApS ‘144A’ 9.375% 17-Jun-2023 226,969 0.03 100,000 E*TRADE Financial Corp FRN (Perpetual)
5.875% 15-Sep-2026 104,179 0.01 364,000 EIG Investors Corp 10.875% 01-Feb-2024 354,407 0.04 1,260,000 Embarq Corp 7.995% 01-Jun-2036 1,417,777 0.16 280,000 Entercom Media Corp ‘144A’ 6.500% 01-May-2027 252,297 0.03 371,000 Entercom Media Corp ‘144A’ 7.250% 01-Nov-2024 324,122 0.04 326,000 EW Scripps Co/The ‘144A’ 5.125% 15-May-2025 310,888 0.03 296,000 GCI LLC 6.875% 15-Apr-2025 305,959 0.03 65,000 GCI LLC ‘144A’ 6.625% 15-Jun-2024 68,216 0.01 220,000 Getty Images Inc ‘144A’ 9.750% 01-Mar-2027 208,056 0.02 446,000 Go Daddy Operating Co LLC /
GD Finance Co Inc ‘144A’ 5.250% 01-Dec-2027 454,837 0.05 615,000 Gogo Intermediate Holdings LLC /
Gogo Finance Co Inc ‘144A’ 9.875% 01-May-2024 524,352 0.06 391,000 Gray Television Inc ‘144A’ 5.125% 15-Oct-2024 392,019 0.04 717,000 Gray Television Inc ‘144A’ 5.875% 15-Jul-2026 715,340 0.08 753,000 Gray Television Inc ‘144A’ 7.000% 15-May-2027 773,820 0.09 430,000 GrubHub Holdings Inc ‘144A’ 5.500% 01-Jul-2027 440,645 0.05 360,000 GTT Communications Inc ‘144A’
7.875% 31-Dec-2024 190,125 0.02 68,000 HC2 Holdings Inc ‘144A’ 11.500% 01-Dec-2021 64,982 0.01 35,000 Houghton Mifflin Harcourt Publishers Inc ‘144A’
9.000% 15-Feb-2025 33,939 0.00 910,000 Hughes Satellite Systems Corp
5.250% 01-Aug-2026 944,362 0.11 1,084,000 Hughes Satellite Systems Corp
6.625% 01-Aug-2026 1,128,921 0.13 481,000 Hughes Satellite Systems Corp
7.625% 15-Jun-2021 496,524 0.06 960,332 iHeartCommunications Inc 6.375% 01-May-2026 952,976 0.11 1,339,886 iHeartCommunications Inc 8.375% 01-May-2027 1,230,263 0.14
Bonds cont’d.
Communications cont’d.
Bonds cont’d.
Communications cont’d.
USDUSD
03613-1A.indd 109 19/08/2020 19:00
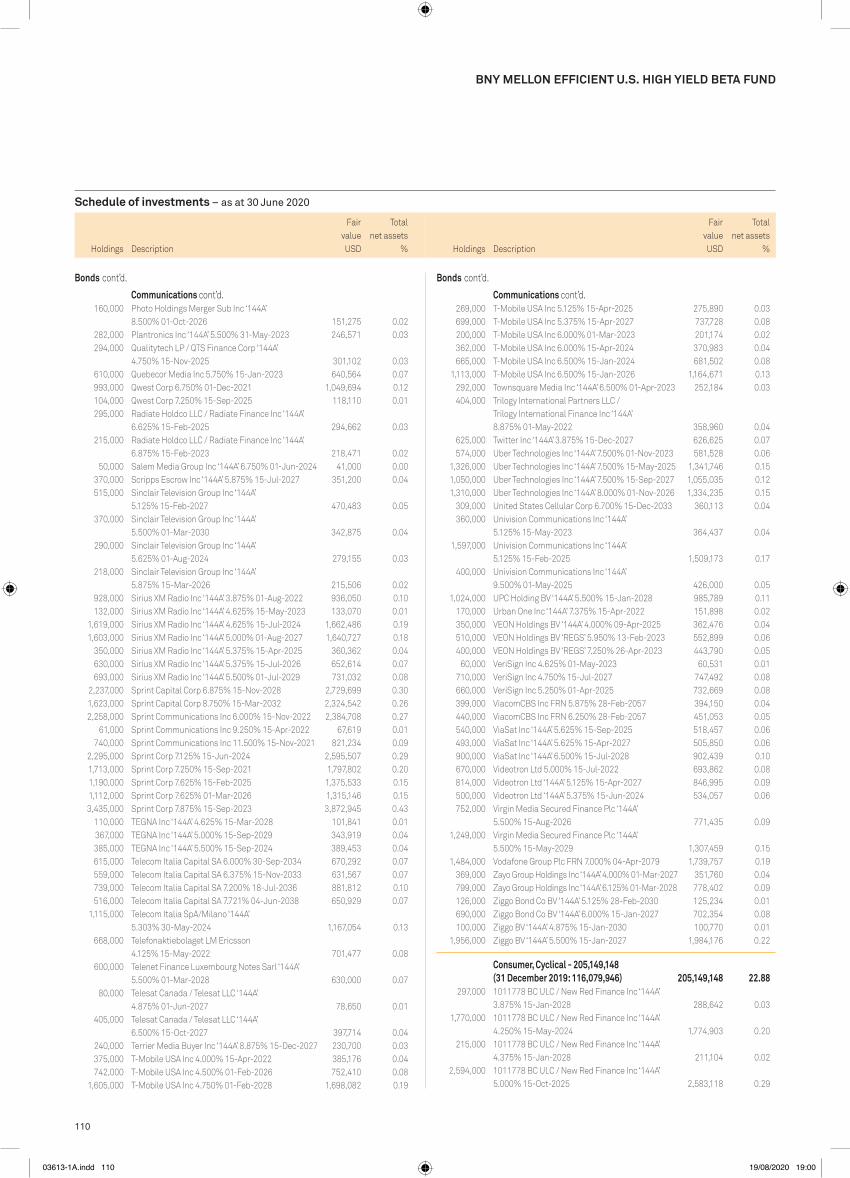
110
Schedule of investments – as at 30 June 2020
Holdings Description
Fair value
Total net assets
% Holdings Description
Fair value
Total net assets
%
BNy MELLON EFFICIENT U.S. HIGH yIELD BETA FUND
269,000 T-Mobile USA Inc 5.125% 15-Apr-2025 275,890 0.03 699,000 T-Mobile USA Inc 5.375% 15-Apr-2027 737,728 0.08 200,000 T-Mobile USA Inc 6.000% 01-Mar-2023 201,174 0.02 362,000 T-Mobile USA Inc 6.000% 15-Apr-2024 370,983 0.04 665,000 T-Mobile USA Inc 6.500% 15-Jan-2024 681,502 0.08 1,113,000 T-Mobile USA Inc 6.500% 15-Jan-2026 1,164,671 0.13 292,000 Townsquare Media Inc ‘144A’ 6.500% 01-Apr-2023 252,184 0.03 404,000 Trilogy International Partners LLC /
Trilogy International Finance Inc ‘144A’ 8.875% 01-May-2022 358,960 0.04
625,000 Twitter Inc ‘144A’ 3.875% 15-Dec-2027 626,625 0.07 574,000 Uber Technologies Inc ‘144A’ 7.500% 01-Nov-2023 581,528 0.06 1,326,000 Uber Technologies Inc ‘144A’ 7.500% 15-May-2025 1,341,746 0.15 1,050,000 Uber Technologies Inc ‘144A’ 7.500% 15-Sep-2027 1,055,035 0.12 1,310,000 Uber Technologies Inc ‘144A’ 8.000% 01-Nov-2026 1,334,235 0.15 309,000 United States Cellular Corp 6.700% 15-Dec-2033 360,113 0.04 360,000 Univision Communications Inc ‘144A’
5.125% 15-May-2023 364,437 0.04 1,597,000 Univision Communications Inc ‘144A’
5.125% 15-Feb-2025 1,509,173 0.17 400,000 Univision Communications Inc ‘144A’
9.500% 01-May-2025 426,000 0.05 1,024,000 UPC Holding BV ‘144A’ 5.500% 15-Jan-2028 985,789 0.11 170,000 Urban One Inc ‘144A’ 7.375% 15-Apr-2022 151,898 0.02 350,000 VEON Holdings BV ‘144A’ 4.000% 09-Apr-2025 362,476 0.04 510,000 VEON Holdings BV ‘REGS’ 5.950% 13-Feb-2023 552,899 0.06 400,000 VEON Holdings BV ‘REGS’ 7.250% 26-Apr-2023 443,790 0.05 60,000 VeriSign Inc 4.625% 01-May-2023 60,531 0.01 710,000 VeriSign Inc 4.750% 15-Jul-2027 747,492 0.08 660,000 VeriSign Inc 5.250% 01-Apr-2025 732,669 0.08 399,000 ViacomCBS Inc FRN 5.875% 28-Feb-2057 394,150 0.04 440,000 ViacomCBS Inc FRN 6.250% 28-Feb-2057 451,053 0.05 540,000 ViaSat Inc ‘144A’ 5.625% 15-Sep-2025 518,457 0.06 493,000 ViaSat Inc ‘144A’ 5.625% 15-Apr-2027 505,850 0.06 900,000 ViaSat Inc ‘144A’ 6.500% 15-Jul-2028 902,439 0.10 670,000 Videotron Ltd 5.000% 15-Jul-2022 693,862 0.08 814,000 Videotron Ltd ‘144A’ 5.125% 15-Apr-2027 846,995 0.09 500,000 Videotron Ltd ‘144A’ 5.375% 15-Jun-2024 534,057 0.06 752,000 Virgin Media Secured Finance Plc ‘144A’
5.500% 15-Aug-2026 771,435 0.09 1,249,000 Virgin Media Secured Finance Plc ‘144A’
5.500% 15-May-2029 1,307,459 0.15 1,484,000 Vodafone Group Plc FRN 7.000% 04-Apr-2079 1,739,757 0.19 369,000 Zayo Group Holdings Inc ‘144A’ 4.000% 01-Mar-2027 351,760 0.04 799,000 Zayo Group Holdings Inc ‘144A’ 6.125% 01-Mar-2028 778,402 0.09 126,000 Ziggo Bond Co BV ‘144A’ 5.125% 28-Feb-2030 125,234 0.01 690,000 Ziggo Bond Co BV ‘144A’ 6.000% 15-Jan-2027 702,354 0.08 100,000 Ziggo BV ‘144A’ 4.875% 15-Jan-2030 100,770 0.01 1,956,000 Ziggo BV ‘144A’ 5.500% 15-Jan-2027 1,984,176 0.22
Consumer, Cyclical - 205,149,148 (31 December 2019: 116,079,946) 205,149,148 22.88
297,000 1011778 BC ULC / New Red Finance Inc ‘144A’ 3.875% 15-Jan-2028 288,642 0.03
1,770,000 1011778 BC ULC / New Red Finance Inc ‘144A’ 4.250% 15-May-2024 1,774,903 0.20
215,000 1011778 BC ULC / New Red Finance Inc ‘144A’ 4.375% 15-Jan-2028 211,104 0.02
2,594,000 1011778 BC ULC / New Red Finance Inc ‘144A’ 5.000% 15-Oct-2025 2,583,118 0.29
160,000 Photo Holdings Merger Sub Inc ‘144A’ 8.500% 01-Oct-2026 151,275 0.02
282,000 Plantronics Inc ‘144A’ 5.500% 31-May-2023 246,571 0.03 294,000 Qualitytech LP / QTS Finance Corp ‘144A’
4.750% 15-Nov-2025 301,102 0.03 610,000 Quebecor Media Inc 5.750% 15-Jan-2023 640,564 0.07 993,000 Qwest Corp 6.750% 01-Dec-2021 1,049,694 0.12 104,000 Qwest Corp 7.250% 15-Sep-2025 118,110 0.01 295,000 Radiate Holdco LLC / Radiate Finance Inc ‘144A’
6.625% 15-Feb-2025 294,662 0.03 215,000 Radiate Holdco LLC / Radiate Finance Inc ‘144A’
6.875% 15-Feb-2023 218,471 0.02 50,000 Salem Media Group Inc ‘144A’ 6.750% 01-Jun-2024 41,000 0.00 370,000 Scripps Escrow Inc ‘144A’ 5.875% 15-Jul-2027 351,200 0.04 515,000 Sinclair Television Group Inc ‘144A’
5.125% 15-Feb-2027 470,483 0.05 370,000 Sinclair Television Group Inc ‘144A’
5.500% 01-Mar-2030 342,875 0.04 290,000 Sinclair Television Group Inc ‘144A’
5.625% 01-Aug-2024 279,155 0.03 218,000 Sinclair Television Group Inc ‘144A’
5.875% 15-Mar-2026 215,506 0.02 928,000 Sirius XM Radio Inc ‘144A’ 3.875% 01-Aug-2022 936,050 0.10 132,000 Sirius XM Radio Inc ‘144A’ 4.625% 15-May-2023 133,070 0.01 1,619,000 Sirius XM Radio Inc ‘144A’ 4.625% 15-Jul-2024 1,662,486 0.19 1,603,000 Sirius XM Radio Inc ‘144A’ 5.000% 01-Aug-2027 1,640,727 0.18 350,000 Sirius XM Radio Inc ‘144A’ 5.375% 15-Apr-2025 360,362 0.04 630,000 Sirius XM Radio Inc ‘144A’ 5.375% 15-Jul-2026 652,614 0.07 693,000 Sirius XM Radio Inc ‘144A’ 5.500% 01-Jul-2029 731,032 0.08 2,237,000 Sprint Capital Corp 6.875% 15-Nov-2028 2,729,699 0.30 1,623,000 Sprint Capital Corp 8.750% 15-Mar-2032 2,324,542 0.26 2,258,000 Sprint Communications Inc 6.000% 15-Nov-2022 2,384,708 0.27 61,000 Sprint Communications Inc 9.250% 15-Apr-2022 67,619 0.01 740,000 Sprint Communications Inc 11.500% 15-Nov-2021 821,234 0.09 2,295,000 Sprint Corp 7.125% 15-Jun-2024 2,595,507 0.29 1,713,000 Sprint Corp 7.250% 15-Sep-2021 1,797,802 0.20 1,190,000 Sprint Corp 7.625% 15-Feb-2025 1,375,533 0.15 1,112,000 Sprint Corp 7.625% 01-Mar-2026 1,315,146 0.15 3,435,000 Sprint Corp 7.875% 15-Sep-2023 3,872,945 0.43 110,000 TEGNA Inc ‘144A’ 4.625% 15-Mar-2028 101,841 0.01 367,000 TEGNA Inc ‘144A’ 5.000% 15-Sep-2029 343,919 0.04 385,000 TEGNA Inc ‘144A’ 5.500% 15-Sep-2024 389,453 0.04 615,000 Telecom Italia Capital SA 6.000% 30-Sep-2034 670,292 0.07 559,000 Telecom Italia Capital SA 6.375% 15-Nov-2033 631,567 0.07 739,000 Telecom Italia Capital SA 7.200% 18-Jul-2036 881,812 0.10 516,000 Telecom Italia Capital SA 7.721% 04-Jun-2038 650,929 0.07 1,115,000 Telecom Italia SpA/Milano ‘144A’
5.303% 30-May-2024 1,167,054 0.13 668,000 Telefonaktiebolaget LM Ericsson
4.125% 15-May-2022 701,477 0.08 600,000 Telenet Finance Luxembourg Notes Sarl ‘144A’
5.500% 01-Mar-2028 630,000 0.07 80,000 Telesat Canada / Telesat LLC ‘144A’
4.875% 01-Jun-2027 78,650 0.01 405,000 Telesat Canada / Telesat LLC ‘144A’
6.500% 15-Oct-2027 397,714 0.04 240,000 Terrier Media Buyer Inc ‘144A’ 8.875% 15-Dec-2027 230,700 0.03 375,000 T-Mobile USA Inc 4.000% 15-Apr-2022 385,176 0.04 742,000 T-Mobile USA Inc 4.500% 01-Feb-2026 752,410 0.08 1,605,000 T-Mobile USA Inc 4.750% 01-Feb-2028 1,698,082 0.19
Bonds cont’d.
Communications cont’d.
Bonds cont’d.
Communications cont’d.
USDUSD
03613-1A.indd 110 19/08/2020 19:00

111
Schedule of investments – as at 30 June 2020
Holdings Description
Fair value
Total net assets
% Holdings Description
Fair value
Total net assets
%
BNy MELLON EFFICIENT U.S. HIGH yIELD BETA FUND
540,000 Beazer Homes USA Inc 5.875% 15-Oct-2027 517,404 0.06 170,000 Beazer Homes USA Inc 6.750% 15-Mar-2025 168,920 0.02 500,000 Beazer Homes USA Inc 7.250% 15-Oct-2029 486,577 0.05 185,000 Bed Bath & Beyond Inc 3.749% 01-Aug-2024 154,013 0.02 110,000 Bed Bath & Beyond Inc 4.915% 01-Aug-2034 66,550 0.01 336,000 Bed Bath & Beyond Inc 5.165% 01-Aug-2044 191,654 0.02 735,000 Boyd Gaming Corp 6.000% 15-Aug-2026 689,621 0.08 570,000 Boyd Gaming Corp 6.375% 01-Apr-2026 542,577 0.06 1,010,000 Boyd Gaming Corp ‘144A’ 4.750% 01-Dec-2027 870,782 0.10 300,000 Boyd Gaming Corp ‘144A’ 8.625% 01-Jun-2025 314,063 0.03 434,000 Boyne USA Inc ‘144A’ 7.250% 01-May-2025 456,197 0.05 230,000 Brinker International Inc 3.875% 15-May-2023 213,469 0.02 268,000 Brinker International Inc ‘144A’
5.000% 01-Oct-2024 250,887 0.03 370,000 Brookfield Residential Properties Inc /
Brookfield Residential US Corp ‘144A’ 4.875% 15-Feb-2030 309,520 0.03
284,000 Brookfield Residential Properties Inc / Brookfield Residential US Corp ‘144A’ 6.250% 15-Sep-2027 272,250 0.03
435,000 Brookfield Residential Properties Inc / Brookfield Residential US Corp ‘144A’ 6.375% 15-May-2025 432,236 0.05
359,000 Buena Vista Gaming Authority ‘144A’ 13.000% 01-Apr-2023 299,279 0.03
135,000 Burlington Coat Factory Warehouse Corp ‘144A’ 6.250% 15-Apr-2025 141,328 0.02
1,565,000 Caesars Resort Collection LLC / CRC Finco Inc ‘144A’ 5.250% 15-Oct-2025 1,363,913 0.15
270,000 Carlson Travel Inc ‘144A’ 6.750% 15-Dec-2023 176,484 0.02 115,000 Carlson Travel Inc ‘144A’ 9.500% 15-Dec-2024 51,019 0.01 300,000 Carnival Corp ‘144A’ 11.500% 01-Apr-2023 326,250 0.04 645,000 Carvana Co ‘144A’ 8.875% 01-Oct-2023 648,828 0.07 277,000 CCM Merger Inc ‘144A’ 6.000% 15-Mar-2022 275,096 0.03 371,000 Cedar Fair LP / Canada’s Wonderland Co /
Magnum Management Corp 5.375% 01-Jun-2024 352,645 0.04 610,000 Cedar Fair LP / Canada’s Wonderland Co /
Magnum Management Corp / Millennium Op 5.375% 15-Apr-2027 547,722 0.06
1,450,000 Cedar Fair LP / Canada’s Wonderland Co / Magnum Management Corp / Millennium Op ‘144A’ 5.500% 01-May-2025 1,463,594 0.16
805,000 Cedar Fair LP ‘144A’ 5.250% 15-Jul-2029 729,885 0.08 333,000 Century Communities Inc 5.875% 15-Jul-2025 332,549 0.04 495,000 Century Communities Inc 6.750% 01-Jun-2027 498,913 0.06 830,000 Churchill Downs Inc ‘144A’ 4.750% 15-Jan-2028 802,871 0.09 655,000 Churchill Downs Inc ‘144A’ 5.500% 01-Apr-2027 642,630 0.07 388,000 Cinemark USA Inc 4.875% 01-Jun-2023 329,069 0.04 520,000 Cinemark USA Inc 5.125% 15-Dec-2022 460,728 0.05 505,000 Cirsa Finance International Sarl ‘144A’
7.875% 20-Dec-2023 468,387 0.05 661,000 Clarios Global LP / Clarios US Finance Co ‘144A’
6.250% 15-May-2026 684,578 0.08 2,085,000 Clarios Global LP / Clarios US Finance Co ‘144A’
8.500% 15-May-2027 2,100,585 0.23 38,000 Clarios Global LP ‘144A’ 6.750% 15-May-2025 39,639 0.00 535,000 Colt Merger Sub Inc ‘144A’ 8.125% 01-Jul-2027 518,281 0.06 122,000 Conn’s Inc 7.250% 15-Jul-2022 98,210 0.01 30,000 Constellation Merger Sub Inc ‘144A’
8.500% 15-Sep-2025 24,109 0.00
14,000 1011778 BC ULC / New Red Finance Inc ‘144A’ 5.750% 15-Apr-2025 14,726 0.00
215,000 24 Hour Fitness Worldwide Inc ‘144A’ (Defaulted) 8.000% 01-Jun-2022 5,913 0.00
269,000 AAG FH LP / AAG FH Finco Inc ‘144A’ 9.750% 15-Jul-2024 252,860 0.03
750,000 Adient Global Holdings Ltd ‘144A’ 4.875% 15-Aug-2026 618,064 0.07 215,000 Adient US LLC ‘144A’ 7.000% 15-May-2026 222,877 0.02 400,000 Adient US LLC ‘144A’ 9.000% 15-Apr-2025 432,630 0.05 160,000 Allen Media LLC / Allen Media Co-Issuer Inc ‘144A’
10.500% 15-Feb-2028 146,879 0.02 715,000 Allison Transmission Inc ‘144A’ 4.750% 01-Oct-2027 712,183 0.08 715,000 Allison Transmission Inc ‘144A’ 5.000% 01-Oct-2024 715,436 0.08 285,000 Allison Transmission Inc ‘144A’ 5.875% 01-Jun-2029 297,228 0.03 35,000 AMC Entertainment Holdings Inc 5.875% 15-Nov-2026 11,463 0.00 172,000 AMC Entertainment Holdings Inc 6.125% 15-May-2027 54,610 0.01 408,121 American Airlines 2013-2 Class A Pass Through Trust
4.950% 15-Jan-2023 331,556 0.04 100,000 American Airlines Group Inc ‘144A’
3.750% 01-Mar-2025 46,661 0.01 555,000 American Airlines Group Inc ‘144A’
5.000% 01-Jun-2022 323,587 0.04 545,000 American Axle & Manufacturing Inc
6.250% 15-Mar-2026 526,503 0.06 604,000 American Axle & Manufacturing Inc
6.500% 01-Apr-2027 587,387 0.07 59,000 American Axle & Manufacturing Inc
6.625% 15-Oct-2022 59,904 0.01 1,480,000 American Axle & Manufacturing Inc
6.875% 01-Jul-2028 1,470,750 0.16 250,000 American Builders & Contractors Supply Co Inc ‘144A’
4.000% 15-Jan-2028 243,365 0.03 445,000 American Builders & Contractors Supply Co Inc ‘144A’
5.875% 15-May-2026 441,580 0.05 152,000 American Greetings Corp ‘144A’ 8.750% 15-Apr-2025 129,754 0.01 121,000 Anixter Inc 5.125% 01-Oct-2021 127,425 0.01 580,000 Aramark Services Inc 4.750% 01-Jun-2026 559,935 0.06 650,000 Aramark Services Inc ‘144A’ 5.000% 01-Apr-2025 642,275 0.07 1,061,000 Aramark Services Inc ‘144A’ 5.000% 01-Feb-2028 1,010,385 0.11 487,000 Aramark Services Inc ‘144A’ 6.375% 01-May-2025 503,804 0.06 25,000 Arrow Bidco LLC ‘144A’ 9.500% 15-Mar-2024 19,591 0.00 205,000 Asbury Automotive Group Inc ‘144A’
4.500% 01-Mar-2028 199,491 0.02 140,000 Asbury Automotive Group Inc ‘144A’
4.750% 01-Mar-2030 136,850 0.02 25,000 Ashton Woods USA LLC /
Ashton Woods Finance Co ‘144A’ 6.625% 15-Jan-2028 24,625 0.00 376,000 Ashton Woods USA LLC /
Ashton Woods Finance Co ‘144A’ 6.750% 01-Aug-2025 370,791 0.04 277,000 Ashton Woods USA LLC /
Ashton Woods Finance Co ‘144A’ 9.875% 01-Apr-2027 295,299 0.03 1,050,000 Aston Martin Capital Holdings Ltd ‘144A’
6.500% 15-Apr-2022 949,200 0.11 225,000 Banijay Entertainment SASU ‘144A’
5.375% 01-Mar-2025 220,641 0.02 498,000 BCD Acquisition Inc ‘144A’ 9.625% 15-Sep-2023 477,141 0.05 75,000 Beacon Roofing Supply Inc ‘144A’
4.500% 15-Nov-2026 73,430 0.01 1,190,000 Beacon Roofing Supply Inc ‘144A’
4.875% 01-Nov-2025 1,065,252 0.12
Bonds cont’d.
Consumer, Cyclical cont’d.
Bonds cont’d.
Consumer, Cyclical cont’d.
USDUSD
03613-1A.indd 111 19/08/2020 19:00

112
Schedule of investments – as at 30 June 2020
Holdings Description
Fair value
Total net assets
% Holdings Description
Fair value
Total net assets
%
BNy MELLON EFFICIENT U.S. HIGH yIELD BETA FUND
700,000 Ford Motor Credit Co LLC 4.250% 20-Sep-2022 688,772 0.08 785,000 Ford Motor Credit Co LLC 4.271% 09-Jan-2027 734,479 0.08 100,000 Ford Motor Credit Co LLC 4.375% 06-Aug-2023 98,488 0.01 430,000 Ford Motor Credit Co LLC 4.542% 01-Aug-2026 409,037 0.05 340,000 Ford Motor Credit Co LLC 4.687% 09-Jun-2025 333,302 0.04 1,170,000 Ford Motor Credit Co LLC 5.113% 03-May-2029 1,141,821 0.13 1,295,000 Ford Motor Credit Co LLC 5.125% 16-Jun-2025 1,298,755 0.14 335,000 Ford Motor Credit Co LLC 5.584% 18-Mar-2024 338,941 0.04 1,000,000 Ford Motor Credit Co LLC 5.596% 07-Jan-2022 1,010,625 0.11 1,335,000 Ford Motor Credit Co LLC 5.875% 02-Aug-2021 1,350,646 0.15 1,050,000 Ford Motor Credit Co LLC ‘GMTN’
4.389% 08-Jan-2026 1,001,270 0.11 680,000 Ford Motor Credit Co LLC ‘MTN’ 3.550% 07-Oct-2022 662,711 0.07 140,000 Forestar Group Inc ‘144A’ 5.000% 01-Mar-2028 137,528 0.02 260,000 Forestar Group Inc ‘144A’ 8.000% 15-Apr-2024 271,375 0.03 25,000 Gap Inc/The ‘144A’ 8.375% 15-May-2023 27,328 0.00 600,000 Gap Inc/The ‘144A’ 8.625% 15-May-2025 637,875 0.07 100,000 Gap Inc/The ‘144A’ 8.875% 15-May-2027 107,429 0.01 435,000 Gateway Casinos & Entertainment Ltd ‘144A’
8.250% 01-Mar-2024 358,286 0.04 156,000 Golden Entertainment Inc ‘144A’ 7.625% 15-Apr-2026 143,983 0.02 1,580,000 Golden Nugget Inc ‘144A’ 6.750% 15-Oct-2024 1,137,600 0.13 834,000 Golden Nugget Inc ‘144A’ 8.750% 01-Oct-2025 473,808 0.05 111,000 Goodyear Tire & Rubber Co/The 4.875% 15-Mar-2027 102,162 0.01 966,000 Goodyear Tire & Rubber Co/The 5.000% 31-May-2026 903,215 0.10 1,350,000 Goodyear Tire & Rubber Co/The 5.125% 15-Nov-2023 1,295,581 0.14 35,000 Goodyear Tire & Rubber Co/The 7.000% 15-Mar-2028 34,886 0.00 1,500,000 Goodyear Tire & Rubber Co/The 9.500% 31-May-2025 1,607,812 0.18 405,000 Group 1 Automotive Inc 5.000% 01-Jun-2022 403,738 0.04 285,000 Guitar Center Inc ‘144A’ 9.500% 15-Oct-2021 210,990 0.02 675,000 H&E Equipment Services Inc 5.625% 01-Sep-2025 683,367 0.08 870,000 Hanesbrands Inc ‘144A’ 4.625% 15-May-2024 867,916 0.10 865,000 Hanesbrands Inc ‘144A’ 4.875% 15-May-2026 873,490 0.10 270,844 Hawaiian Airlines 2013-1 Class A Pass Through
Certificates 3.900% 15-Jan-2026 237,450 0.03 755,000 HD Supply Inc ‘144A’ 5.375% 15-Oct-2026 773,237 0.09 950,000 Hilton Domestic Operating Co Inc
4.250% 01-Sep-2024 925,153 0.10 905,000 Hilton Domestic Operating Co Inc
4.875% 15-Jan-2030 893,488 0.10 920,000 Hilton Domestic Operating Co Inc
5.125% 01-May-2026 919,255 0.10 100,000 Hilton Domestic Operating Co Inc ‘144A’
5.375% 01-May-2025 100,437 0.01 78,000 Hilton Domestic Operating Co Inc ‘144A’
5.750% 01-May-2028 79,121 0.01 310,000 Hilton Grand Vacations Borrower LLC /
Hilton Grand Vacations Borrower Inc 6.125% 01-Dec-2024 312,680 0.03
695,000 Hilton Worldwide Finance LLC / Hilton Worldwide Finance Corp 4.625% 01-Apr-2025 682,042 0.08
650,000 Hilton Worldwide Finance LLC / Hilton Worldwide Finance Corp 4.875% 01-Apr-2027 636,067 0.07
120,000 IAA Inc ‘144A’ 5.500% 15-Jun-2027 124,072 0.01 535,000 IHO Verwaltungs GmbH ‘144A’ 4.750% 15-Sep-2026 525,854 0.06 240,000 IHO Verwaltungs GmbH ‘144A’ 6.000% 15-May-2027 244,604 0.03 140,000 Installed Building Products Inc ‘144A’
5.750% 01-Feb-2028 140,498 0.02 690,000 International Game Technology Plc ‘144A’
6.250% 15-Feb-2022 698,004 0.08
191,000 Cooper-Standard Automotive Inc ‘144A’ 5.625% 15-Nov-2026 122,920 0.01
234,000 Core & Main Holdings LP ‘144A’ 8.625% 15-Sep-2024 235,081 0.03 555,000 Core & Main LP ‘144A’ 6.125% 15-Aug-2025 554,870 0.06 265,000 Dana Financing Luxembourg Sarl ‘144A’
5.750% 15-Apr-2025 269,941 0.03 477,000 Dana Financing Luxembourg Sarl ‘144A’
6.500% 01-Jun-2026 495,424 0.06 165,000 Dana Inc 5.375% 15-Nov-2027 165,101 0.02 185,000 Dana Inc 5.500% 15-Dec-2024 187,062 0.02 260,000 Dealer Tire LLC / DT Issuer LLC ‘144A’
8.000% 01-Feb-2028 241,475 0.03 550,000 Delphi Technologies Plc ‘144A’ 5.000% 01-Oct-2025 591,690 0.07 1,410,000 Delta Air Lines Inc 2.900% 28-Oct-2024 1,144,649 0.13 1,284,000 Delta Air Lines Inc 3.625% 15-Mar-2022 1,216,656 0.14 745,000 Delta Air Lines Inc 3.750% 28-Oct-2029 597,249 0.07 740,000 Delta Air Lines Inc 3.800% 19-Apr-2023 661,430 0.07 630,000 Delta Air Lines Inc 4.375% 19-Apr-2028 519,272 0.06 1,900,000 Delta Air Lines Inc 7.375% 15-Jan-2026 1,840,104 0.21 575,000 Diamond Resorts International Inc ‘144A’
7.750% 01-Sep-2023 552,354 0.06 250,000 Diamond Resorts International Inc ‘144A’
10.750% 01-Sep-2024 225,911 0.03 422,000 Downstream Development Authority of the Quapaw
Tribe of Oklahoma ‘144A’ 10.500% 15-Feb-2023 358,128 0.04 765,000 eG Global Finance Plc ‘144A’ 6.750% 07-Feb-2025 748,346 0.08 300,000 eG Global Finance Plc ‘144A’ 8.500% 30-Oct-2025 308,094 0.03 117,000 Eldorado Resorts Inc 6.000% 01-Apr-2025 122,687 0.01 765,000 Eldorado Resorts Inc 6.000% 15-Sep-2026 828,235 0.09 241,000 Eldorado Resorts Inc 7.000% 01-Aug-2023 249,711 0.03 327,000 Enterprise Development Authority/The ‘144A’
12.000% 15-Jul-2024 329,827 0.04 2,000 Ferrellgas LP / Ferrellgas Finance Corp
6.750% 15-Jun-2023 1,657 0.00 1,575,000 Fiat Chrysler Automobiles NV 5.250% 15-Apr-2023 1,631,220 0.18 135,000 FirstCash Inc ‘144A’ 5.375% 01-Jun-2024 136,167 0.02 320,000 Ford Holdings LLC 9.300% 01-Mar-2030 361,504 0.04 1,191,000 Ford Motor Co 4.346% 08-Dec-2026 1,115,169 0.12 2,115,000 Ford Motor Co 4.750% 15-Jan-2043 1,675,598 0.19 866,000 Ford Motor Co 5.291% 08-Dec-2046 716,199 0.08 600,000 Ford Motor Co 6.375% 01-Feb-2029 588,780 0.07 470,000 Ford Motor Co 6.625% 01-Oct-2028 475,015 0.05 435,000 Ford Motor Co 7.400% 01-Nov-2046 425,756 0.05 1,800,000 Ford Motor Co 7.450% 16-Jul-2031 1,901,385 0.21 2,000,000 Ford Motor Co 8.500% 21-Apr-2023 2,118,750 0.24 2,600,000 Ford Motor Co 9.000% 22-Apr-2025 2,818,595 0.31 1,000,000 Ford Motor Co 9.625% 22-Apr-2030 1,186,175 0.13 514,000 Ford Motor Credit Co LLC 2.979% 03-Aug-2022 494,571 0.06 1,610,000 Ford Motor Credit Co LLC 3.087% 09-Jan-2023 1,537,051 0.17 850,000 Ford Motor Credit Co LLC 3.096% 04-May-2023 808,733 0.09 370,000 Ford Motor Credit Co LLC 3.219% 09-Jan-2022 361,753 0.04 850,000 Ford Motor Credit Co LLC 3.339% 28-Mar-2022 826,370 0.09 730,000 Ford Motor Credit Co LLC 3.350% 01-Nov-2022 701,917 0.08 430,000 Ford Motor Credit Co LLC 3.664% 08-Sep-2024 406,978 0.05 1,012,000 Ford Motor Credit Co LLC 3.810% 09-Jan-2024 975,619 0.11 2,600,000 Ford Motor Credit Co LLC 3.813% 12-Oct-2021 2,584,530 0.29 430,000 Ford Motor Credit Co LLC 3.815% 02-Nov-2027 392,592 0.04 1,000,000 Ford Motor Credit Co LLC 4.063% 01-Nov-2024 957,005 0.11 963,000 Ford Motor Credit Co LLC 4.134% 04-Aug-2025 916,367 0.10 210,000 Ford Motor Credit Co LLC 4.140% 15-Feb-2023 206,524 0.02
Bonds cont’d.
Consumer, Cyclical cont’d.
Bonds cont’d.
Consumer, Cyclical cont’d.
USDUSD
03613-1A.indd 112 19/08/2020 19:00

113
Schedule of investments – as at 30 June 2020
Holdings Description
Fair value
Total net assets
% Holdings Description
Fair value
Total net assets
%
BNy MELLON EFFICIENT U.S. HIGH yIELD BETA FUND
575,000 LTF Merger Sub Inc ‘144A’ 8.500% 15-Jun-2023 477,908 0.05 5,000 M/I Homes Inc 4.950% 01-Feb-2028 4,984 0.00 297,000 M/I Homes Inc 5.625% 01-Aug-2025 301,053 0.03 668,000 Macy’s Retail Holdings Inc 2.875% 15-Feb-2023 528,174 0.06 130,000 Macy’s Retail Holdings Inc 3.625% 01-Jun-2024 94,699 0.01 630,000 Macy’s Retail Holdings Inc 3.875% 15-Jan-2022 559,314 0.06 590,000 Macy’s Retail Holdings Inc 4.375% 01-Sep-2023 439,550 0.05 90,000 Macy’s Retail Holdings Inc 4.500% 15-Dec-2034 53,757 0.01 231,000 Macy’s Retail Holdings Inc 6.375% 15-Mar-2037 148,995 0.02 410,000 Marks & Spencer Plc ‘144A’ 7.125% 01-Dec-2037 411,025 0.05 756,000 Marriott Ownership Resorts Inc / ILG LLC
6.500% 15-Sep-2026 762,970 0.08 220,000 Marriott Ownership Resorts Inc ‘144A’
4.750% 15-Jan-2028 200,517 0.02 100,000 Marriott Ownership Resorts Inc ‘144A’
6.125% 15-Sep-2025 102,687 0.01 390,000 Mattamy Group Corp ‘144A’ 4.625% 01-Mar-2030 375,071 0.04 315,000 Mattamy Group Corp ‘144A’ 5.250% 15-Dec-2027 314,409 0.03 685,000 Mattel Inc 3.150% 15-Mar-2023 653,247 0.07 650,000 Mattel Inc 5.450% 01-Nov-2041 542,084 0.06 590,000 Mattel Inc 6.200% 01-Oct-2040 512,884 0.06 310,000 Mattel Inc ‘144A’ 5.875% 15-Dec-2027 320,261 0.04 1,050,000 Mattel Inc ‘144A’ 6.750% 31-Dec-2025 1,091,197 0.12 240,000 MDC Holdings Inc 3.850% 15-Jan-2030 229,613 0.03 370,000 MDC Holdings Inc 5.500% 15-Jan-2024 397,249 0.04 630,000 MDC Holdings Inc 6.000% 15-Jan-2043 664,474 0.07 515,000 Melco Resorts Finance Ltd ‘144A’
5.375% 04-Dec-2029 517,910 0.06 757,000 Melco Resorts Finance Ltd ‘REGS’
4.875% 06-Jun-2025 763,577 0.09 360,000 Melco Resorts Finance Ltd ‘REGS’
5.250% 26-Apr-2026 363,532 0.04 125,000 Melco Resorts Finance Ltd ‘REGS’
5.625% 17-Jul-2027 126,625 0.01 292,000 Men’s Wearhouse Inc/The 7.000% 01-Jul-2022 44,826 0.00 262,000 Meritage Homes Corp 5.125% 06-Jun-2027 270,793 0.03 621,000 Meritage Homes Corp 6.000% 01-Jun-2025 662,983 0.07 220,000 Meritage Homes Corp 7.000% 01-Apr-2022 232,323 0.03 335,000 Meritor Inc 6.250% 15-Feb-2024 338,734 0.04 425,000 Merlin Entertainments Ltd ‘144A’
5.750% 15-Jun-2026 410,865 0.05 350,000 MGM China Holdings Ltd ‘144A’ 5.375% 15-May-2024 356,162 0.04 270,000 MGM China Holdings Ltd ‘144A’ 5.875% 15-May-2026 278,651 0.03 680,000 MGM Resorts International 4.625% 01-Sep-2026 620,775 0.07 450,000 MGM Resorts International 5.500% 15-Apr-2027 433,757 0.05 645,000 MGM Resorts International 5.750% 15-Jun-2025 639,766 0.07 1,130,000 MGM Resorts International 6.000% 15-Mar-2023 1,144,244 0.13 1,130,000 MGM Resorts International 6.750% 01-May-2025 1,123,734 0.13 669,000 MGM Resorts International 7.750% 15-Mar-2022 683,869 0.08 200,000 Michaels Stores Inc ‘144A’ 8.000% 15-Jul-2027 174,338 0.02 139,000 Mobile Mini Inc 5.875% 01-Jul-2024 143,160 0.02 1,080,000 Mohegan Gaming & Entertainment ‘144A’
7.875% 15-Oct-2024 900,337 0.10 165,000 Motion Bondco DAC ‘144A’ 6.625% 15-Nov-2027 145,812 0.02 400,000 Murphy Oil USA Inc 4.750% 15-Sep-2029 409,926 0.05 525,000 Murphy Oil USA Inc 5.625% 01-May-2027 543,932 0.06 1,195,000 Navistar International Corp ‘144A’
6.625% 01-Nov-2025 1,135,375 0.13 75,000 Navistar International Corp ‘144A’
9.500% 01-May-2025 80,694 0.01
450,000 International Game Technology Plc ‘144A’ 6.500% 15-Feb-2025 461,531 0.05
408,000 IRB Holding Corp ‘144A’ 6.750% 15-Feb-2026 391,092 0.04 415,000 IRB Holding Corp ‘144A’ 7.000% 15-Jun-2025 428,519 0.05 410,000 Jacobs Entertainment Inc ‘144A’
7.875% 01-Feb-2024 362,704 0.04 830,000 Jaguar Land Rover Automotive Plc ‘144A’
4.500% 01-Oct-2027 653,961 0.07 550,000 Jaguar Land Rover Automotive Plc ‘144A’
5.625% 01-Feb-2023 485,713 0.05 249,000 JB Poindexter & Co Inc ‘144A’ 7.125% 15-Apr-2026 252,376 0.03 100,000 K Hovnanian Enterprises Inc ‘144A’
7.750% 15-Feb-2026 99,500 0.01 780,000 KAR Auction Services Inc ‘144A’ 5.125% 01-Jun-2025 770,332 0.09 221,000 KB Home 4.800% 15-Nov-2029 217,823 0.02 220,000 KB Home 6.875% 15-Jun-2027 240,583 0.03 300,000 KB Home 7.000% 15-Dec-2021 314,753 0.03 473,000 KB Home 7.500% 15-Sep-2022 517,233 0.06 449,000 KB Home 7.625% 15-May-2023 491,047 0.05 428,000 KFC Holding Co/Pizza Hut Holdings LLC/
Taco Bell of America LLC ‘144A’ 4.750% 01-Jun-2027 439,943 0.05 620,000 KFC Holding Co/Pizza Hut Holdings LLC/
Taco Bell of America LLC ‘144A’ 5.000% 01-Jun-2024 633,240 0.07 1,315,000 KFC Holding Co/Pizza Hut Holdings LLC/
Taco Bell of America LLC ‘144A’ 5.250% 01-Jun-2026 1,352,024 0.15 278,000 KGA Escrow LLC ‘144A’ 7.500% 15-Aug-2023 278,666 0.03 421,000 L Brands Inc 5.250% 01-Feb-2028 334,056 0.04 797,000 L Brands Inc 5.625% 15-Feb-2022 780,841 0.09 380,000 L Brands Inc 5.625% 15-Oct-2023 360,120 0.04 452,000 L Brands Inc 6.694% 15-Jan-2027 383,549 0.04 755,000 L Brands Inc 6.750% 01-Jul-2036 621,554 0.07 985,000 L Brands Inc 6.875% 01-Nov-2035 823,411 0.09 125,000 L Brands Inc 6.950% 01-Mar-2033 87,320 0.01 600,000 L Brands Inc 7.500% 15-Jun-2029 524,514 0.06 110,000 L Brands Inc 7.600% 15-Jul-2037 75,272 0.01 200,000 LBC Tank Terminals Holding Netherlands BV ‘144A’
6.875% 15-May-2023 202,583 0.02 760,000 Lennar Corp 4.125% 15-Jan-2022 771,191 0.09 675,000 Lennar Corp 4.500% 30-Apr-2024 703,617 0.08 620,000 Lennar Corp 4.750% 15-Nov-2022 643,079 0.07 370,000 Lennar Corp 4.750% 30-May-2025 395,939 0.04 524,000 Lennar Corp 4.750% 29-Nov-2027 569,693 0.06 569,000 Lennar Corp 4.875% 15-Dec-2023 602,369 0.07 761,000 Lennar Corp 5.000% 15-Jun-2027 824,589 0.09 829,000 Lennar Corp 5.250% 01-Jun-2026 898,271 0.10 223,000 Lennar Corp 5.375% 01-Oct-2022 235,213 0.03 500,000 Lennar Corp 5.875% 15-Nov-2024 548,198 0.06 334,000 Levi Strauss & Co 5.000% 01-May-2025 336,473 0.04 333,000 LGI Homes Inc ‘144A’ 6.875% 15-Jul-2026 340,013 0.04 530,000 Lions Gate Capital Holdings LLC ‘144A’
5.875% 01-Nov-2024 508,082 0.06 410,000 Lions Gate Capital Holdings LLC ‘144A’
6.375% 01-Feb-2024 401,027 0.04 20,000 Lithia Motors Inc ‘144A’ 5.250% 01-Aug-2025 20,073 0.00 550,000 Live Nation Entertainment Inc ‘144A’
4.750% 15-Oct-2027 474,433 0.05 665,000 Live Nation Entertainment Inc ‘144A’
4.875% 01-Nov-2024 600,571 0.07 250,000 Live Nation Entertainment Inc ‘144A’
5.625% 15-Mar-2026 228,390 0.03
Bonds cont’d.
Consumer, Cyclical cont’d.
Bonds cont’d.
Consumer, Cyclical cont’d.
USDUSD
03613-1A.indd 113 19/08/2020 19:00

114
Schedule of investments – as at 30 June 2020
Holdings Description
Fair value
Total net assets
% Holdings Description
Fair value
Total net assets
%
BNy MELLON EFFICIENT U.S. HIGH yIELD BETA FUND
Bonds cont’d.
Consumer, Cyclical cont’d.
Bonds cont’d.
Consumer, Cyclical cont’d. 25,000 Shea Homes LP / Shea Homes Funding Corp ‘144A’
6.125% 01-Apr-2025 25,216 0.00 1,120,000 Six Flags Entertainment Corp ‘144A’
4.875% 31-Jul-2024 1,005,894 0.11 555,000 Six Flags Entertainment Corp ‘144A’
5.500% 15-Apr-2027 496,725 0.06 400,000 Six Flags Theme Parks Inc ‘144A’
7.000% 01-Jul-2025 415,250 0.05 283,000 Sonic Automotive Inc 6.125% 15-Mar-2027 281,177 0.03 15,000 Speedway Motorsports LLC /
Speedway Funding II Inc ‘144A’ 4.875% 01-Nov-2027 13,687 0.00
200,000 SRS Distribution Inc ‘144A’ 8.250% 01-Jul-2026 203,712 0.02 1,308,000 Staples Inc ‘144A’ 7.500% 15-Apr-2026 1,030,541 0.11 1,590,000 Staples Inc ‘144A’ 10.750% 15-Apr-2027 937,806 0.10 550,000 Stars Group Holdings BV /
Stars Group US Co-Borrower LLC ‘144A’ 7.000% 15-Jul-2026 581,039 0.06
355,000 Station Casinos LLC ‘144A’ 4.500% 15-Feb-2028 301,528 0.03 630,000 Station Casinos LLC ‘144A’ 5.000% 01-Oct-2025 556,369 0.06 550,000 Studio City Finance Ltd ‘REGS’
7.250% 11-Feb-2024 564,484 0.06 318,000 Suburban Propane Partners LP/
Suburban Energy Finance Corp 5.500% 01-Jun-2024 315,811 0.04
25,000 Suburban Propane Partners LP/ Suburban Energy Finance Corp 5.750% 01-Mar-2025 25,091 0.00
348,000 Suburban Propane Partners LP/ Suburban Energy Finance Corp 5.875% 01-Mar-2027 345,759 0.04
255,000 Sugarhouse HSP Gaming Prop Mezz LP / Sugarhouse HSP Gaming Finance Corp ‘144A’ 5.875% 15-May-2025 249,554 0.03
407,000 Superior Plus LP / Superior General Partner Inc ‘144A’ 7.000% 15-Jul-2026 427,781 0.05
255,000 Taylor Morrison Communities Inc / Taylor Morrison Holdings II Inc ‘144A’ 5.625% 01-Mar-2024 262,304 0.03
257,000 Taylor Morrison Communities Inc / Taylor Morrison Holdings II Inc ‘144A’ 5.875% 15-Apr-2023 265,004 0.03
200,000 Taylor Morrison Communities Inc ‘144A’ 5.750% 15-Jan-2028 206,712 0.02
221,000 Taylor Morrison Communities Inc ‘144A’ 5.875% 31-Jan-2025 225,351 0.03
200,000 Taylor Morrison Communities Inc ‘144A’ 5.875% 15-Jun-2027 207,604 0.02
240,000 Taylor Morrison Communities Inc ‘144A’ 6.000% 01-Sep-2023 246,526 0.03
40,000 Taylor Morrison Communities Inc ‘144A’ 6.625% 15-Jul-2027 42,071 0.00
443,000 Tempur Sealy International Inc 5.500% 15-Jun-2026 448,456 0.05
565,000 Tempur Sealy International Inc 5.625% 15-Oct-2023 572,709 0.06
53,000 Tenneco Inc 5.000% 15-Jul-2026 35,147 0.00 175,000 Tenneco Inc 5.375% 15-Dec-2024 119,419 0.01 1,785,000 Tesla Inc ‘144A’ 5.300% 15-Aug-2025 1,787,044 0.20 210,000 Titan International Inc 6.500% 30-Nov-2023 137,898 0.02
440,000 New Home Co Inc/The 7.250% 01-Apr-2022 410,747 0.05 125,000 Newell Brands Inc 4.000% 15-Jun-2022 128,437 0.01 248,000 Newell Brands Inc 4.000% 01-Dec-2024 249,240 0.03 670,000 Newell Brands Inc 4.350% 01-Apr-2023 693,316 0.08 1,900,000 Newell Brands Inc 4.700% 01-Apr-2026 1,999,522 0.22 15,000 Newell Brands Inc 4.875% 01-Jun-2025 15,737 0.00 500,000 Newell Brands Inc 5.875% 01-Apr-2036 535,625 0.06 750,000 Newell Brands Inc 6.000% 01-Apr-2046 797,100 0.09 284,000 Party City Holdings Inc ‘144A’ 6.125% 15-Aug-2023 59,640 0.01 250,000 Party City Holdings Inc ‘144A’ 6.625% 01-Aug-2026 52,500 0.01 40,000 Penn National Gaming Inc ‘144A’
5.625% 15-Jan-2027 37,458 0.00 221,000 Penske Automotive Group Inc 5.375% 01-Dec-2024 221,253 0.02 782,000 Penske Automotive Group Inc 5.500% 15-May-2026 781,855 0.09 411,000 Performance Food Group Inc ‘144A’
5.500% 01-Jun-2024 408,388 0.05 400,000 Performance Food Group Inc ‘144A’
5.500% 15-Oct-2027 386,732 0.04 760,000 PetSmart Inc ‘144A’ 5.875% 01-Jun-2025 764,260 0.09 2,075,000 PetSmart Inc ‘144A’ 7.125% 15-Mar-2023 2,049,768 0.23 555,000 PetSmart Inc ‘144A’ 8.875% 01-Jun-2025 557,070 0.06 181,000 PriSo Acquisition Corp ‘144A’ 9.000% 15-May-2023 161,995 0.02 635,000 PulteGroup Inc 5.000% 15-Jan-2027 681,295 0.08 776,000 PulteGroup Inc 5.500% 01-Mar-2026 848,560 0.09 270,000 PulteGroup Inc 6.000% 15-Feb-2035 312,146 0.03 250,000 PulteGroup Inc 6.375% 15-May-2033 293,506 0.03 222,000 PulteGroup Inc 7.875% 15-Jun-2032 284,565 0.03 770,000 QVC Inc 4.375% 15-Mar-2023 773,773 0.09 900,000 QVC Inc 4.450% 15-Feb-2025 886,770 0.10 675,000 QVC Inc 4.750% 15-Feb-2027 655,678 0.07 500,000 QVC Inc 4.850% 01-Apr-2024 505,800 0.06 885,000 QVC Inc 5.125% 02-Jul-2022 898,098 0.10 380,000 QVC Inc 5.450% 15-Aug-2034 345,523 0.04 360,000 QVC Inc 5.950% 15-Mar-2043 300,600 0.03 510,000 Resideo Funding Inc ‘144A’ 6.125% 01-Nov-2026 500,134 0.06 178,000 Rite Aid Corp 7.700% 15-Feb-2027 151,150 0.02 852,000 Rite Aid Corp ‘144A’ 6.125% 01-Apr-2023 829,955 0.09 448,000 Rite Aid Corp ‘144A’ 7.500% 01-Jul-2025 449,120 0.05 345,000 Royal Caribbean Cruises Ltd 3.700% 15-Mar-2028 217,396 0.02 980,000 Royal Caribbean Cruises Ltd 5.250% 15-Nov-2022 762,656 0.08 563,000 Royal Caribbean Cruises Ltd 7.500% 15-Oct-2027 427,741 0.05 525,000 Sabre GLBL Inc ‘144A’ 5.250% 15-Nov-2023 484,635 0.05 780,000 Sabre GLBL Inc ‘144A’ 5.375% 15-Apr-2023 730,193 0.08 575,000 Sabre GLBL Inc ‘144A’ 9.250% 15-Apr-2025 608,422 0.07 292,000 Sally Holdings LLC / Sally Capital Inc
5.500% 01-Nov-2023 284,882 0.03 450,000 Sally Holdings LLC / Sally Capital Inc
5.625% 01-Dec-2025 438,444 0.05 1,267,000 Scientific Games International Inc ‘144A’
5.000% 15-Oct-2025 1,174,230 0.13 125,000 Scientific Games International Inc ‘144A’
7.000% 15-May-2028 100,211 0.01 95,000 Scientific Games International Inc ‘144A’
7.250% 15-Nov-2029 76,161 0.01 285,000 Scientific Games International Inc ‘144A’
8.250% 15-Mar-2026 256,095 0.03 398,000 Scotts Miracle-Gro Co/The 4.500% 15-Oct-2029 410,698 0.05 184,000 Scotts Miracle-Gro Co/The 5.250% 15-Dec-2026 191,785 0.02 90,000 Shea Homes LP / Shea Homes Funding Corp ‘144A’
4.750% 15-Feb-2028 85,711 0.01
USDUSD
03613-1A.indd 114 19/08/2020 19:00

115
Schedule of investments – as at 30 June 2020
Holdings Description
Fair value
Total net assets
% Holdings Description
Fair value
Total net assets
%
BNy MELLON EFFICIENT U.S. HIGH yIELD BETA FUND
380,000 Wynn Resorts Finance LLC / Wynn Resorts Capital Corp ‘144A’ 7.750% 15-Apr-2025 384,398 0.04
153,000 Yum! Brands Inc 3.750% 01-Nov-2021 154,702 0.02 75,000 Yum! Brands Inc 3.875% 01-Nov-2023 77,073 0.01 91,000 Yum! Brands Inc 5.350% 01-Nov-2043 88,270 0.01 530,000 Yum! Brands Inc 6.875% 15-Nov-2037 572,026 0.06 100,000 Yum! Brands Inc ‘144A’ 4.750% 15-Jan-2030 101,772 0.01 725,000 Yum! Brands Inc ‘144A’ 7.750% 01-Apr-2025 783,453 0.09 670,000 ZF North America Capital Inc ‘144A’
4.500% 29-Apr-2022 690,267 0.08 895,000 ZF North America Capital Inc ‘144A’
4.750% 29-Apr-2025 898,249 0.10
Consumer, Non-cyclical - 178,312,254 (31 December 2019: 110,325,607) 178,312,254 19.88
640,000 Acadia Healthcare Co Inc 5.125% 01-Jul-2022 640,512 0.07 480,000 Acadia Healthcare Co Inc 5.625% 15-Feb-2023 481,418 0.05 269,000 Acadia Healthcare Co Inc 6.500% 01-Mar-2024 274,736 0.03 287,000 ACCO Brands Corp ‘144A’ 5.250% 15-Dec-2024 291,634 0.03 150,000 ACE Cash Express Inc ‘144A’ 12.000% 15-Dec-2022 108,750 0.01 200,000 Adani Abbot Point Terminal Pty Ltd ‘144A’
4.450% 15-Dec-2022 173,492 0.02 940,000 ADT Security Corp/The 3.500% 15-Jul-2022 937,288 0.10 525,000 ADT Security Corp/The 4.125% 15-Jun-2023 527,680 0.06 548,000 ADT Security Corp/The 6.250% 15-Oct-2021 562,947 0.06 581,000 ADT Security Corp/The ‘144A’ 4.875% 15-Jul-2032 530,543 0.06 854,000 Ahern Rentals Inc ‘144A’ 7.375% 15-May-2023 413,033 0.05 395,000 AHP Health Partners Inc ‘144A’ 9.750% 15-Jul-2026 407,269 0.05 229,000 Air Medical Group Holdings Inc ‘144A’
6.375% 15-May-2023 211,515 0.02 430,000 Air Methods Corp ‘144A’ 8.000% 15-May-2025 304,717 0.03 650,000 Ajecorp BV ‘144A’ 6.500% 14-May-2022 642,535 0.07 1,444,000 Albertsons Cos Inc / Safeway Inc /
New Albertsons LP / Albertsons LLC 5.750% 15-Mar-2025 1,480,858 0.17
1,135,000 Albertsons Cos Inc / Safeway Inc / New Albertsons LP / Albertsons LLC 6.625% 15-Jun-2024 1,164,510 0.13
250,000 Albertsons Cos Inc / Safeway Inc / New Albertsons LP / Albertsons LLC ‘144A’ 3.500% 15-Feb-2023 253,375 0.03
140,000 Albertsons Cos Inc / Safeway Inc / New Albertsons LP / Albertsons LLC ‘144A’ 4.625% 15-Jan-2027 140,148 0.02
369,000 Albertsons Cos Inc / Safeway Inc / New Albertsons LP / Albertsons LLC ‘144A’ 4.875% 15-Feb-2030 377,904 0.04
325,000 Albertsons Cos Inc / Safeway Inc / New Albertsons LP / Albertsons LLC ‘144A’ 5.875% 15-Feb-2028 335,875 0.04
630,000 Albertsons Cos Inc / Safeway Inc / New Albertsons LP / Albertsons LLC ‘144A’ 7.500% 15-Mar-2026 681,874 0.08
590,000 Algeco Global Finance Plc ‘144A’ 8.000% 15-Feb-2023 568,238 0.06 743,000 Allied Universal Holdco LLC / Allied Universal
Finance Corp ‘144A’ 6.625% 15-Jul-2026 782,561 0.09 325,000 Allied Universal Holdco LLC / Allied Universal
Finance Corp ‘144A’ 9.750% 15-Jul-2027 343,034 0.04 230,000 AMN Healthcare Inc ‘144A’ 4.625% 01-Oct-2027 224,638 0.03 242,000 AMN Healthcare Inc ‘144A’ 5.125% 01-Oct-2024 242,882 0.03
275,000 Toll Brothers Finance Corp 3.800% 01-Nov-2029 277,208 0.03 120,000 Toll Brothers Finance Corp 4.350% 15-Feb-2028 124,927 0.01 490,000 Toll Brothers Finance Corp 4.375% 15-Apr-2023 510,161 0.06 20,000 Toll Brothers Finance Corp 4.875% 15-Nov-2025 21,402 0.00 335,000 Toll Brothers Finance Corp 4.875% 15-Mar-2027 362,155 0.04 450,000 Toll Brothers Finance Corp 5.625% 15-Jan-2024 483,140 0.05 425,000 Toll Brothers Finance Corp 5.875% 15-Feb-2022 443,957 0.05 15,000 TPro Acquisition Corp ‘144A’ 11.000% 15-Oct-2024 14,727 0.00 372,000 TRI Pointe Group Inc 5.250% 01-Jun-2027 371,464 0.04 580,000 TRI Pointe Group Inc / TRI Pointe Homes Inc
5.875% 15-Jun-2024 597,780 0.07 58,000 Truck Hero Inc ‘144A’ 8.500% 21-Apr-2024 58,211 0.01 190,000 Twin River Worldwide Holdings Inc ‘144A’
6.750% 01-Jun-2027 181,176 0.02 58,344 UAL 2007-1 Pass Through Trust
6.636% 02-Jul-2022 50,510 0.01 818,000 Under Armour Inc 3.250% 15-Jun-2026 726,139 0.08 530,000 United Airlines Holdings Inc 4.250% 01-Oct-2022 451,329 0.05 195,000 United Airlines Holdings Inc 4.875% 15-Jan-2025 156,320 0.02 535,000 United Airlines Holdings Inc 5.000% 01-Feb-2024 437,028 0.05 100,000 Univar Solutions USA Inc/Washington ‘144A’
5.125% 01-Dec-2027 101,331 0.01 160,000 Vail Resorts Inc ‘144A’ 6.250% 15-May-2025 168,100 0.02 610,000 Viking Cruises Ltd ‘144A’ 5.875% 15-Sep-2027 364,588 0.04 295,000 Viking Cruises Ltd ‘144A’ 6.250% 15-May-2025 169,225 0.02 281,000 Vista Outdoor Inc 5.875% 01-Oct-2023 275,702 0.03 390,000 VOC Escrow Ltd ‘144A’ 5.000% 15-Feb-2028 290,478 0.03 394,000 Wabash National Corp ‘144A’ 5.500% 01-Oct-2025 362,931 0.04 100,000 William Carter Co/The ‘144A’ 5.500% 15-May-2025 103,312 0.01 563,000 William Carter Co/The ‘144A’ 5.625% 15-Mar-2027 581,526 0.06 365,000 Williams Scotsman International Inc ‘144A’
6.875% 15-Aug-2023 375,988 0.04 120,000 Williams Scotsman International Inc ‘144A’
7.875% 15-Dec-2022 124,726 0.01 46,000 WMG Acquisition Corp ‘144A’ 5.000% 01-Aug-2023 46,743 0.01 177,000 WMG Acquisition Corp ‘144A’ 5.500% 15-Apr-2026 183,772 0.02 150,000 Wolverine Escrow LLC ‘144A’ 8.500% 15-Nov-2024 114,750 0.01 225,000 Wolverine Escrow LLC ‘144A’ 9.000% 15-Nov-2026 163,125 0.02 390,000 Wolverine Escrow LLC ‘144A’ 13.125% 15-Nov-2027 273,975 0.03 100,000 Wolverine World Wide Inc ‘144A’ 6.375% 15-May-2025 105,187 0.01 305,000 Wyndham Destinations Inc 3.900% 01-Mar-2023 285,448 0.03 400,000 Wyndham Destinations Inc 4.250% 01-Mar-2022 394,326 0.04 350,000 Wyndham Destinations Inc 5.400% 01-Apr-2024 339,026 0.04 505,000 Wyndham Destinations Inc 5.750% 01-Apr-2027 487,860 0.05 167,000 Wyndham Destinations Inc 6.350% 01-Oct-2025 169,279 0.02 65,000 Wyndham Destinations Inc ‘144A’
4.625% 01-Mar-2030 59,912 0.01 514,000 Wyndham Hotels & Resorts Inc ‘144A’
5.375% 15-Apr-2026 496,218 0.06 630,000 Wynn Las Vegas LLC / Wynn Las Vegas Capital
Corp ‘144A’ 4.250% 30-May-2023 594,162 0.07 895,000 Wynn Las Vegas LLC / Wynn Las Vegas Capital
Corp ‘144A’ 5.250% 15-May-2027 775,634 0.09 1,550,000 Wynn Las Vegas LLC / Wynn Las Vegas Capital
Corp ‘144A’ 5.500% 01-Mar-2025 1,423,202 0.16 650,000 Wynn Macau Ltd ‘144A’ 4.875% 01-Oct-2024 635,443 0.07 375,000 Wynn Macau Ltd ‘144A’ 5.125% 15-Dec-2029 364,688 0.04 760,000 Wynn Macau Ltd ‘144A’ 5.500% 01-Oct-2027 754,608 0.08 555,000 Wynn Resorts Finance LLC / Wynn Resorts
Capital Corp ‘144A’ 5.125% 01-Oct-2029 496,986 0.06
Bonds cont’d.
Consumer, Cyclical cont’d.
Bonds cont’d.
Consumer, Cyclical cont’d.
USDUSD
03613-1A.indd 115 19/08/2020 19:00

116
Schedule of investments – as at 30 June 2020
Holdings Description
Fair value
Total net assets
% Holdings Description
Fair value
Total net assets
%
BNy MELLON EFFICIENT U.S. HIGH yIELD BETA FUND
575,000 Charles River Laboratories International Inc ‘144A’ 4.250% 01-May-2028 575,679 0.06
130,000 Charles River Laboratories International Inc ‘144A’ 5.500% 01-Apr-2026 135,578 0.02
830,000 Chobani LLC / Chobani Finance Corp Inc ‘144A’ 7.500% 15-Apr-2025 803,535 0.09
2,169,000 CHS/Community Health Systems Inc 6.250% 31-Mar-2023 2,045,801 0.23
400,000 CHS/Community Health Systems Inc 6.875% 01-Feb-2022 321,250 0.04
760,000 CHS/Community Health Systems Inc ‘144A’ 6.625% 15-Feb-2025 716,300 0.08
100,000 CHS/Community Health Systems Inc ‘144A’ 6.875% 01-Apr-2028 39,636 0.00
1,555,000 CHS/Community Health Systems Inc ‘144A’ 8.000% 15-Mar-2026 1,471,341 0.16
40,000 CHS/Community Health Systems Inc ‘144A’ 8.000% 15-Dec-2027 38,333 0.00
1,115,000 CHS/Community Health Systems Inc ‘144A’ 8.125% 30-Jun-2024 750,523 0.08
1,095,000 CHS/Community Health Systems Inc ‘144A’ 8.625% 15-Jan-2024 1,074,190 0.12
715,000 CHS/Community Health Systems Inc Step-Up Coupon ‘144A’ 9.875% 30-Jun-2023 558,840 0.06
665,000 Cimpress Plc ‘144A’ 7.000% 15-Jun-2026 615,830 0.07 20,000 Clearwater Seafoods Inc ‘144A’
6.875% 01-May-2025 19,873 0.00 483,000 Cooke Omega Investments Inc / Alpha VesselCo
Holdings Inc ‘144A’ 8.500% 15-Dec-2022 482,283 0.05 925,000 Cott Holdings Inc ‘144A’ 5.500% 01-Apr-2025 932,118 0.10 429,000 Coty Inc ‘144A’ 6.500% 15-Apr-2026 366,004 0.04 249,000 Darling Ingredients Inc ‘144A’ 5.250% 15-Apr-2027 256,641 0.03 1,137,000 DaVita Inc 5.000% 01-May-2025 1,163,720 0.13 730,000 DaVita Inc 5.125% 15-Jul-2024 743,505 0.08 115,000 DaVita Inc ‘144A’ 4.625% 01-Jun-2030 114,520 0.01 215,000 Del Monte Foods Inc ‘144A’ 11.875% 15-May-2025 217,553 0.02 170,000 Dole Food Co Inc ‘144A’ 7.250% 15-Jun-2025 163,395 0.02 400,000 Edgewell Personal Care Co 4.700% 24-May-2022 415,254 0.05 265,000 Elanco Animal Health Inc 4.662% 27-Aug-2021 271,459 0.03 746,000 Elanco Animal Health Inc 5.022% 28-Aug-2023 786,564 0.09 723,000 Elanco Animal Health Inc 5.650% 28-Aug-2028 804,826 0.09 165,000 Emeco Pty Ltd 9.250% 31-Mar-2022 166,650 0.02 715,000 Encompass Health Corp 4.500% 01-Feb-2028 686,979 0.08 955,000 Encompass Health Corp 4.750% 01-Feb-2030 913,639 0.10 185,000 Encompass Health Corp 5.125% 15-Mar-2023 186,599 0.02 520,000 Encompass Health Corp 5.750% 01-Nov-2024 521,355 0.06 297,000 Encompass Health Corp 5.750% 15-Sep-2025 304,023 0.03 100,000 Endo Dac / Endo Finance LLC / Endo Finco Inc ‘144A’
5.875% 15-Oct-2024 97,135 0.01 875,000 Endo Dac / Endo Finance LLC / Endo Finco Inc ‘144A’
6.000% 15-Jul-2023 658,976 0.07 400,000 Endo Dac / Endo Finance LLC / Endo Finco Inc ‘144A’
6.000% 01-Feb-2025 310,404 0.03 25,000 Endo Finance LLC / Endo Finco Inc ‘144A’
5.375% 15-Jan-2023 24,279 0.00 50,000 Envision Healthcare Corp ‘144A’ 8.750% 15-Oct-2026 23,928 0.00 500,000 FAGE International SA / FAGE USA Dairy
Industry Inc ‘144A’ 5.625% 15-Aug-2026 471,780 0.05 580,000 Fresh Market Inc/The ‘144A’ 9.750% 01-May-2023 495,900 0.06 100,000 Garda World Security Corp ‘144A’ 4.625% 15-Feb-2027 98,812 0.01
125,000 Aptim Corp ‘144A’ 7.750% 15-Jun-2025 49,831 0.01 515,000 APX Group Inc 7.625% 01-Sep-2023 475,677 0.05 965,000 APX Group Inc 7.875% 01-Dec-2022 963,181 0.11 285,000 APX Group Inc 8.500% 01-Nov-2024 278,914 0.03 215,000 APX Group Inc ‘144A’ 6.750% 15-Feb-2027 203,276 0.02 605,000 ASGN Inc ‘144A’ 4.625% 15-May-2028 591,878 0.07 110,000 Atento Luxco 1 SA ‘144A’ 6.125% 10-Aug-2022 89,925 0.01 1,107,000 Avantor Inc ‘144A’ 6.000% 01-Oct-2024 1,157,922 0.13 5,000 Avantor Inc ‘144A’ 9.000% 01-Oct-2025 5,381 0.00 25,000 Avis Budget Car Rental LLC /
Avis Budget Finance Inc ‘144A’ 5.250% 15-Mar-2025 20,125 0.00 100,000 Avis Budget Car Rental LLC /
Avis Budget Finance Inc ‘144A’ 5.750% 15-Jul-2027 76,804 0.01 230,000 Avis Budget Car Rental LLC /
Avis Budget Finance Inc ‘144A’ 6.375% 01-Apr-2024 189,726 0.02 295,000 Avon International Capital Plc ‘144A’
6.500% 15-Aug-2022 289,953 0.03 370,000 Avon International Operations Inc ‘144A’
7.875% 15-Aug-2022 371,708 0.04 308,000 Avon Products Inc 7.000% 15-Mar-2023 305,328 0.03 289,000 Avon Products Inc 8.950% 15-Mar-2043 328,042 0.04 425,000 B&G Foods Inc 5.250% 01-Apr-2025 428,612 0.05 406,000 B&G Foods Inc 5.250% 15-Sep-2027 407,397 0.05 1,420,000 Bausch Health Americas Inc ‘144A’
8.500% 31-Jan-2027 1,509,779 0.17 1,540,000 Bausch Health Americas Inc ‘144A’
9.250% 01-Apr-2026 1,672,748 0.19 400,000 Bausch Health Cos Inc ‘144A’ 5.000% 30-Jan-2028 377,096 0.04 925,000 Bausch Health Cos Inc ‘144A’ 5.250% 30-Jan-2030 878,630 0.10 692,000 Bausch Health Cos Inc ‘144A’ 5.500% 01-Mar-2023 694,522 0.08 1,365,000 Bausch Health Cos Inc ‘144A’ 5.500% 01-Nov-2025 1,400,490 0.16 175,000 Bausch Health Cos Inc ‘144A’ 5.750% 15-Aug-2027 185,904 0.02 800,000 Bausch Health Cos Inc ‘144A’ 5.875% 15-May-2023 798,624 0.09 2,733,000 Bausch Health Cos Inc ‘144A’ 6.125% 15-Apr-2025 2,775,853 0.31 1,200,000 Bausch Health Cos Inc ‘144A’ 6.250% 15-Feb-2029 1,208,250 0.14 771,000 Bausch Health Cos Inc ‘144A’ 7.000% 15-Mar-2024 801,508 0.09 460,000 Bausch Health Cos Inc ‘144A’ 7.000% 15-Jan-2028 474,577 0.05 555,000 Bausch Health Cos Inc ‘144A’ 7.250% 30-May-2029 583,685 0.07 991,000 Bausch Health Cos Inc ‘144A’ 9.000% 15-Dec-2025 1,068,704 0.12 460,000 Brink’s Co/The ‘144A’ 4.625% 15-Oct-2027 442,936 0.05 305,000 Capitol Investment Merger Sub 2 LLC ‘144A’
10.000% 01-Aug-2024 305,250 0.03 572,000 Cardtronics Inc / Cardtronics USA Inc ‘144A’
5.500% 01-May-2025 556,925 0.06 89,000 Carriage Services Inc ‘144A’ 6.625% 01-Jun-2026 93,878 0.01 565,000 Catalent Pharma Solutions Inc ‘144A’
4.875% 15-Jan-2026 575,599 0.06 52,000 Catalent Pharma Solutions Inc ‘144A’
5.000% 15-Jul-2027 54,071 0.01 1,950,000 Centene Corp 3.375% 15-Feb-2030 1,971,986 0.22 2,235,000 Centene Corp 4.250% 15-Dec-2027 2,311,493 0.26 2,825,000 Centene Corp 4.625% 15-Dec-2029 2,987,438 0.33 350,000 Centene Corp 4.750% 15-May-2022 354,716 0.04 1,390,000 Centene Corp 4.750% 15-Jan-2025 1,424,833 0.16 1,300,000 Centene Corp 4.750% 15-Jan-2025 1,332,578 0.15 529,000 Centene Corp ‘144A’ 5.250% 01-Apr-2025 545,444 0.06 1,790,000 Centene Corp ‘144A’ 5.375% 01-Jun-2026 1,862,898 0.21 552,000 Centene Corp ‘144A’ 5.375% 15-Aug-2026 576,440 0.06 109,000 Central Garden & Pet Co 5.125% 01-Feb-2028 113,108 0.01
Bonds cont’d.
Consumer, Non-cyclical cont’d.
Bonds cont’d.
Consumer, Non-cyclical cont’d.
USDUSD
03613-1A.indd 116 19/08/2020 19:00
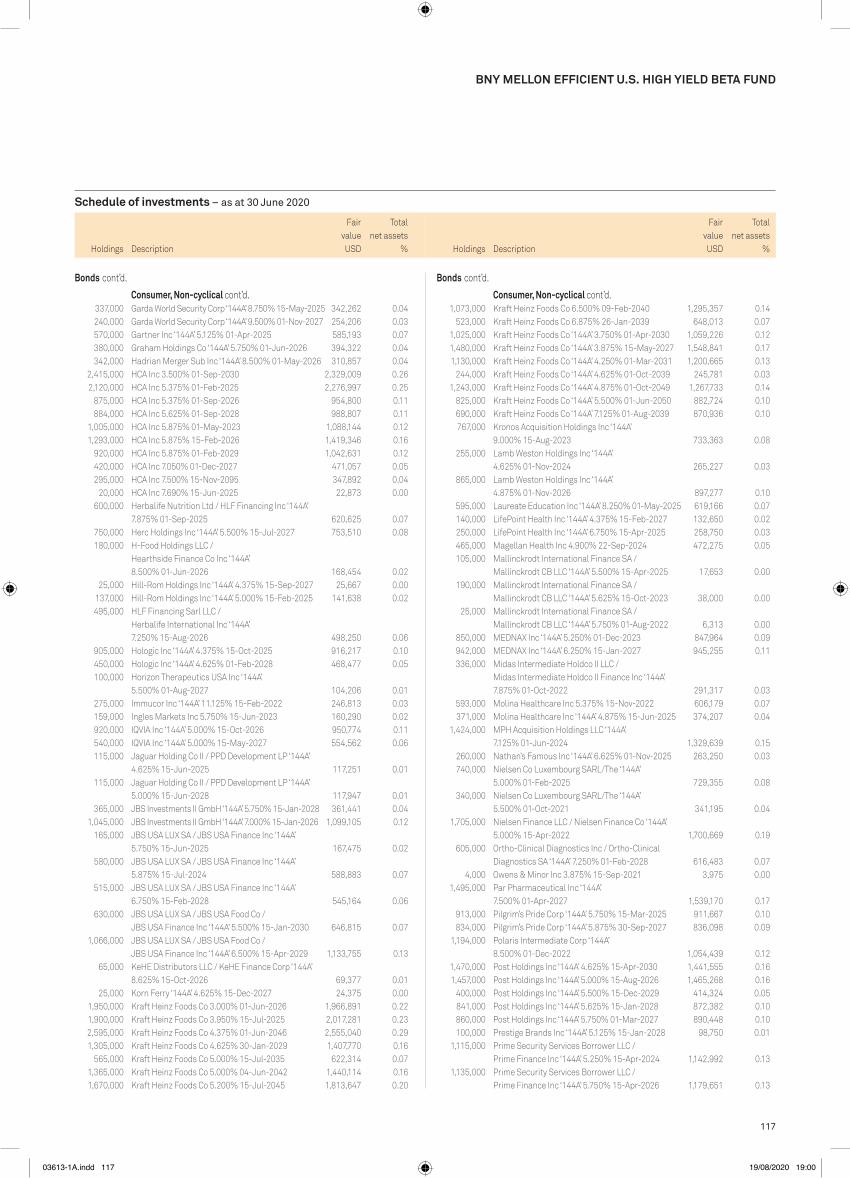
117
Schedule of investments – as at 30 June 2020
Holdings Description
Fair value
Total net assets
% Holdings Description
Fair value
Total net assets
%
BNy MELLON EFFICIENT U.S. HIGH yIELD BETA FUND
1,073,000 Kraft Heinz Foods Co 6.500% 09-Feb-2040 1,295,357 0.14 523,000 Kraft Heinz Foods Co 6.875% 26-Jan-2039 648,013 0.07 1,025,000 Kraft Heinz Foods Co ‘144A’ 3.750% 01-Apr-2030 1,059,226 0.12 1,480,000 Kraft Heinz Foods Co ‘144A’ 3.875% 15-May-2027 1,548,841 0.17 1,130,000 Kraft Heinz Foods Co ‘144A’ 4.250% 01-Mar-2031 1,200,665 0.13 244,000 Kraft Heinz Foods Co ‘144A’ 4.625% 01-Oct-2039 245,781 0.03 1,243,000 Kraft Heinz Foods Co ‘144A’ 4.875% 01-Oct-2049 1,267,733 0.14 825,000 Kraft Heinz Foods Co ‘144A’ 5.500% 01-Jun-2050 882,724 0.10 690,000 Kraft Heinz Foods Co ‘144A’ 7.125% 01-Aug-2039 870,936 0.10 767,000 Kronos Acquisition Holdings Inc ‘144A’
9.000% 15-Aug-2023 733,363 0.08 255,000 Lamb Weston Holdings Inc ‘144A’
4.625% 01-Nov-2024 265,227 0.03 865,000 Lamb Weston Holdings Inc ‘144A’
4.875% 01-Nov-2026 897,277 0.10 595,000 Laureate Education Inc ‘144A’ 8.250% 01-May-2025 619,166 0.07 140,000 LifePoint Health Inc ‘144A’ 4.375% 15-Feb-2027 132,650 0.02 250,000 LifePoint Health Inc ‘144A’ 6.750% 15-Apr-2025 258,750 0.03 465,000 Magellan Health Inc 4.900% 22-Sep-2024 472,275 0.05 105,000 Mallinckrodt International Finance SA /
Mallinckrodt CB LLC ‘144A’ 5.500% 15-Apr-2025 17,653 0.00 190,000 Mallinckrodt International Finance SA /
Mallinckrodt CB LLC ‘144A’ 5.625% 15-Oct-2023 38,000 0.00 25,000 Mallinckrodt International Finance SA /
Mallinckrodt CB LLC ‘144A’ 5.750% 01-Aug-2022 6,313 0.00 850,000 MEDNAX Inc ‘144A’ 5.250% 01-Dec-2023 847,964 0.09 942,000 MEDNAX Inc ‘144A’ 6.250% 15-Jan-2027 945,255 0.11 336,000 Midas Intermediate Holdco II LLC /
Midas Intermediate Holdco II Finance Inc ‘144A’ 7.875% 01-Oct-2022 291,317 0.03
593,000 Molina Healthcare Inc 5.375% 15-Nov-2022 606,179 0.07 371,000 Molina Healthcare Inc ‘144A’ 4.875% 15-Jun-2025 374,207 0.04 1,424,000 MPH Acquisition Holdings LLC ‘144A’
7.125% 01-Jun-2024 1,329,639 0.15 260,000 Nathan’s Famous Inc ‘144A’ 6.625% 01-Nov-2025 263,250 0.03 740,000 Nielsen Co Luxembourg SARL/The ‘144A’
5.000% 01-Feb-2025 729,355 0.08 340,000 Nielsen Co Luxembourg SARL/The ‘144A’
5.500% 01-Oct-2021 341,195 0.04 1,705,000 Nielsen Finance LLC / Nielsen Finance Co ‘144A’
5.000% 15-Apr-2022 1,700,669 0.19 605,000 Ortho-Clinical Diagnostics Inc / Ortho-Clinical
Diagnostics SA ‘144A’ 7.250% 01-Feb-2028 616,483 0.07 4,000 Owens & Minor Inc 3.875% 15-Sep-2021 3,975 0.00 1,495,000 Par Pharmaceutical Inc ‘144A’
7.500% 01-Apr-2027 1,539,170 0.17 913,000 Pilgrim’s Pride Corp ‘144A’ 5.750% 15-Mar-2025 911,667 0.10 834,000 Pilgrim’s Pride Corp ‘144A’ 5.875% 30-Sep-2027 836,098 0.09 1,194,000 Polaris Intermediate Corp ‘144A’
8.500% 01-Dec-2022 1,054,439 0.12 1,470,000 Post Holdings Inc ‘144A’ 4.625% 15-Apr-2030 1,441,555 0.16 1,457,000 Post Holdings Inc ‘144A’ 5.000% 15-Aug-2026 1,465,268 0.16 400,000 Post Holdings Inc ‘144A’ 5.500% 15-Dec-2029 414,324 0.05 841,000 Post Holdings Inc ‘144A’ 5.625% 15-Jan-2028 872,382 0.10 860,000 Post Holdings Inc ‘144A’ 5.750% 01-Mar-2027 890,448 0.10 100,000 Prestige Brands Inc ‘144A’ 5.125% 15-Jan-2028 98,750 0.01 1,115,000 Prime Security Services Borrower LLC /
Prime Finance Inc ‘144A’ 5.250% 15-Apr-2024 1,142,992 0.13 1,135,000 Prime Security Services Borrower LLC /
Prime Finance Inc ‘144A’ 5.750% 15-Apr-2026 1,179,651 0.13
337,000 Garda World Security Corp ‘144A’ 8.750% 15-May-2025 342,262 0.04 240,000 Garda World Security Corp ‘144A’ 9.500% 01-Nov-2027 254,206 0.03 570,000 Gartner Inc ‘144A’ 5.125% 01-Apr-2025 585,193 0.07 380,000 Graham Holdings Co ‘144A’ 5.750% 01-Jun-2026 394,322 0.04 342,000 Hadrian Merger Sub Inc ‘144A’ 8.500% 01-May-2026 310,857 0.04 2,415,000 HCA Inc 3.500% 01-Sep-2030 2,329,009 0.26 2,120,000 HCA Inc 5.375% 01-Feb-2025 2,276,997 0.25 875,000 HCA Inc 5.375% 01-Sep-2026 954,800 0.11 884,000 HCA Inc 5.625% 01-Sep-2028 988,807 0.11 1,005,000 HCA Inc 5.875% 01-May-2023 1,088,144 0.12 1,293,000 HCA Inc 5.875% 15-Feb-2026 1,419,346 0.16 920,000 HCA Inc 5.875% 01-Feb-2029 1,042,631 0.12 420,000 HCA Inc 7.050% 01-Dec-2027 471,057 0.05 295,000 HCA Inc 7.500% 15-Nov-2095 347,892 0.04 20,000 HCA Inc 7.690% 15-Jun-2025 22,873 0.00 600,000 Herbalife Nutrition Ltd / HLF Financing Inc ‘144A’
7.875% 01-Sep-2025 620,625 0.07 750,000 Herc Holdings Inc ‘144A’ 5.500% 15-Jul-2027 753,510 0.08 180,000 H-Food Holdings LLC /
Hearthside Finance Co Inc ‘144A’ 8.500% 01-Jun-2026 168,454 0.02
25,000 Hill-Rom Holdings Inc ‘144A’ 4.375% 15-Sep-2027 25,667 0.00 137,000 Hill-Rom Holdings Inc ‘144A’ 5.000% 15-Feb-2025 141,638 0.02 495,000 HLF Financing Sarl LLC /
Herbalife International Inc ‘144A’ 7.250% 15-Aug-2026 498,250 0.06
905,000 Hologic Inc ‘144A’ 4.375% 15-Oct-2025 916,217 0.10 450,000 Hologic Inc ‘144A’ 4.625% 01-Feb-2028 468,477 0.05 100,000 Horizon Therapeutics USA Inc ‘144A’
5.500% 01-Aug-2027 104,206 0.01 275,000 Immucor Inc ‘144A’ 11.125% 15-Feb-2022 246,813 0.03 159,000 Ingles Markets Inc 5.750% 15-Jun-2023 160,290 0.02 920,000 IQVIA Inc ‘144A’ 5.000% 15-Oct-2026 950,774 0.11 540,000 IQVIA Inc ‘144A’ 5.000% 15-May-2027 554,562 0.06 115,000 Jaguar Holding Co II / PPD Development LP ‘144A’
4.625% 15-Jun-2025 117,251 0.01 115,000 Jaguar Holding Co II / PPD Development LP ‘144A’
5.000% 15-Jun-2028 117,947 0.01 365,000 JBS Investments II GmbH ‘144A’ 5.750% 15-Jan-2028 361,441 0.04 1,045,000 JBS Investments II GmbH ‘144A’ 7.000% 15-Jan-2026 1,099,105 0.12 165,000 JBS USA LUX SA / JBS USA Finance Inc ‘144A’
5.750% 15-Jun-2025 167,475 0.02 580,000 JBS USA LUX SA / JBS USA Finance Inc ‘144A’
5.875% 15-Jul-2024 588,883 0.07 515,000 JBS USA LUX SA / JBS USA Finance Inc ‘144A’
6.750% 15-Feb-2028 545,164 0.06 630,000 JBS USA LUX SA / JBS USA Food Co /
JBS USA Finance Inc ‘144A’ 5.500% 15-Jan-2030 646,815 0.07 1,066,000 JBS USA LUX SA / JBS USA Food Co /
JBS USA Finance Inc ‘144A’ 6.500% 15-Apr-2029 1,133,755 0.13 65,000 KeHE Distributors LLC / KeHE Finance Corp ‘144A’
8.625% 15-Oct-2026 69,377 0.01 25,000 Korn Ferry ‘144A’ 4.625% 15-Dec-2027 24,375 0.00 1,950,000 Kraft Heinz Foods Co 3.000% 01-Jun-2026 1,966,891 0.22 1,900,000 Kraft Heinz Foods Co 3.950% 15-Jul-2025 2,017,281 0.23 2,595,000 Kraft Heinz Foods Co 4.375% 01-Jun-2046 2,555,040 0.29 1,305,000 Kraft Heinz Foods Co 4.625% 30-Jan-2029 1,407,770 0.16 565,000 Kraft Heinz Foods Co 5.000% 15-Jul-2035 622,314 0.07 1,365,000 Kraft Heinz Foods Co 5.000% 04-Jun-2042 1,440,114 0.16 1,670,000 Kraft Heinz Foods Co 5.200% 15-Jul-2045 1,813,647 0.20
Bonds cont’d.
Consumer, Non-cyclical cont’d.
Bonds cont’d.
Consumer, Non-cyclical cont’d.
USDUSD
03613-1A.indd 117 19/08/2020 19:00
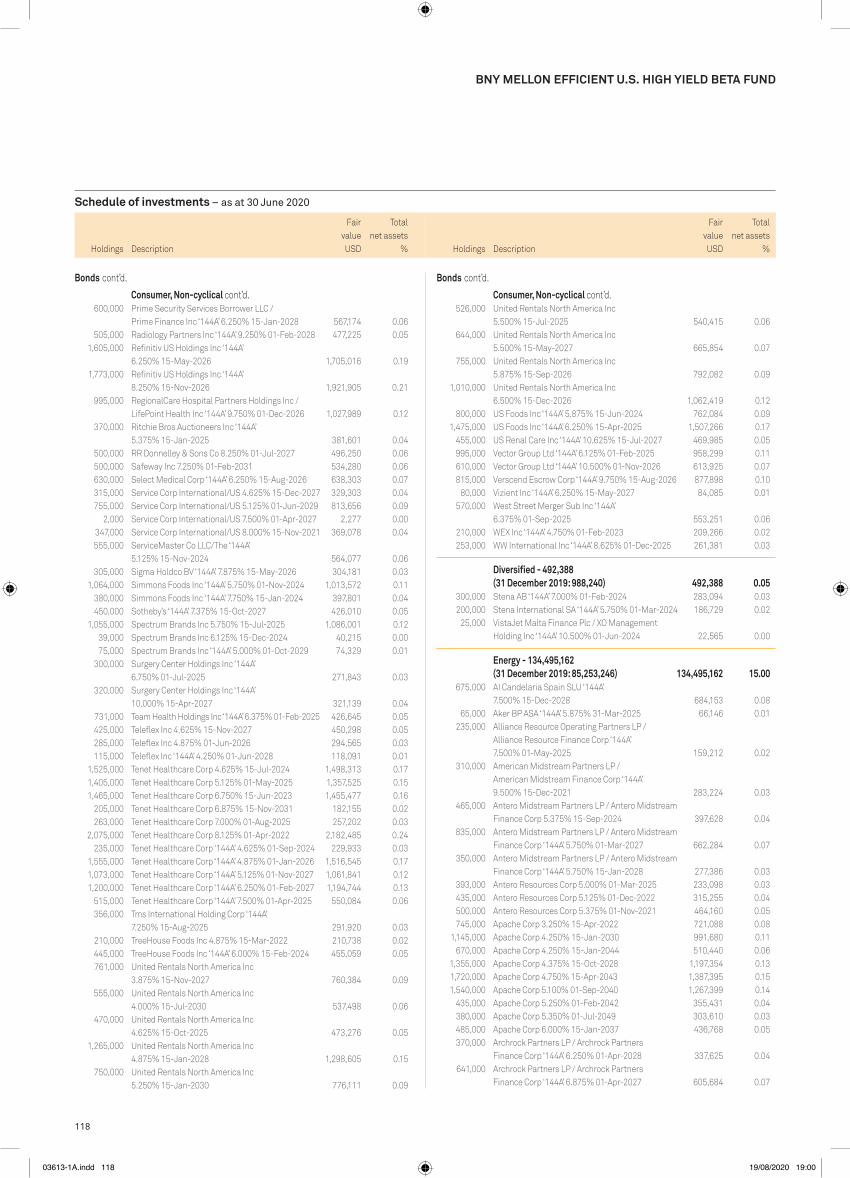
118
Schedule of investments – as at 30 June 2020
Holdings Description
Fair value
Total net assets
% Holdings Description
Fair value
Total net assets
%
BNy MELLON EFFICIENT U.S. HIGH yIELD BETA FUND
526,000 United Rentals North America Inc 5.500% 15-Jul-2025 540,415 0.06
644,000 United Rentals North America Inc 5.500% 15-May-2027 665,854 0.07
755,000 United Rentals North America Inc 5.875% 15-Sep-2026 792,082 0.09
1,010,000 United Rentals North America Inc 6.500% 15-Dec-2026 1,062,419 0.12
800,000 US Foods Inc ‘144A’ 5.875% 15-Jun-2024 762,084 0.09 1,475,000 US Foods Inc ‘144A’ 6.250% 15-Apr-2025 1,507,266 0.17 455,000 US Renal Care Inc ‘144A’ 10.625% 15-Jul-2027 469,985 0.05 995,000 Vector Group Ltd ‘144A’ 6.125% 01-Feb-2025 958,299 0.11 610,000 Vector Group Ltd ‘144A’ 10.500% 01-Nov-2026 613,925 0.07 815,000 Verscend Escrow Corp ‘144A’ 9.750% 15-Aug-2026 877,898 0.10 80,000 Vizient Inc ‘144A’ 6.250% 15-May-2027 84,085 0.01 570,000 West Street Merger Sub Inc ‘144A’
6.375% 01-Sep-2025 553,251 0.06 210,000 WEX Inc ‘144A’ 4.750% 01-Feb-2023 209,266 0.02 253,000 WW International Inc ‘144A’ 8.625% 01-Dec-2025 261,381 0.03
Diversified - 492,388 (31 December 2019: 988,240) 492,388 0.05
300,000 Stena AB ‘144A’ 7.000% 01-Feb-2024 283,094 0.03 200,000 Stena International SA ‘144A’ 5.750% 01-Mar-2024 186,729 0.02 25,000 VistaJet Malta Finance Plc / XO Management
Holding Inc ‘144A’ 10.500% 01-Jun-2024 22,565 0.00
Energy - 134,495,162 (31 December 2019: 85,253,246) 134,495,162 15.00
675,000 AI Candelaria Spain SLU ‘144A’ 7.500% 15-Dec-2028 684,153 0.08
65,000 Aker BP ASA ‘144A’ 5.875% 31-Mar-2025 66,146 0.01 235,000 Alliance Resource Operating Partners LP /
Alliance Resource Finance Corp ‘144A’ 7.500% 01-May-2025 159,212 0.02
310,000 American Midstream Partners LP / American Midstream Finance Corp ‘144A’ 9.500% 15-Dec-2021 283,224 0.03
465,000 Antero Midstream Partners LP / Antero Midstream Finance Corp 5.375% 15-Sep-2024 397,628 0.04
835,000 Antero Midstream Partners LP / Antero Midstream Finance Corp ‘144A’ 5.750% 01-Mar-2027 662,284 0.07
350,000 Antero Midstream Partners LP / Antero Midstream Finance Corp ‘144A’ 5.750% 15-Jan-2028 277,386 0.03
393,000 Antero Resources Corp 5.000% 01-Mar-2025 233,098 0.03 435,000 Antero Resources Corp 5.125% 01-Dec-2022 315,255 0.04 500,000 Antero Resources Corp 5.375% 01-Nov-2021 464,160 0.05 745,000 Apache Corp 3.250% 15-Apr-2022 721,088 0.08 1,145,000 Apache Corp 4.250% 15-Jan-2030 991,680 0.11 670,000 Apache Corp 4.250% 15-Jan-2044 510,440 0.06 1,355,000 Apache Corp 4.375% 15-Oct-2028 1,197,354 0.13 1,720,000 Apache Corp 4.750% 15-Apr-2043 1,387,395 0.15 1,540,000 Apache Corp 5.100% 01-Sep-2040 1,267,399 0.14 435,000 Apache Corp 5.250% 01-Feb-2042 355,431 0.04 380,000 Apache Corp 5.350% 01-Jul-2049 303,610 0.03 485,000 Apache Corp 6.000% 15-Jan-2037 436,768 0.05 370,000 Archrock Partners LP / Archrock Partners
Finance Corp ‘144A’ 6.250% 01-Apr-2028 337,625 0.04 641,000 Archrock Partners LP / Archrock Partners
Finance Corp ‘144A’ 6.875% 01-Apr-2027 605,684 0.07
600,000 Prime Security Services Borrower LLC / Prime Finance Inc ‘144A’ 6.250% 15-Jan-2028 567,174 0.06
505,000 Radiology Partners Inc ‘144A’ 9.250% 01-Feb-2028 477,225 0.05 1,605,000 Refinitiv US Holdings Inc ‘144A’
6.250% 15-May-2026 1,705,016 0.19 1,773,000 Refinitiv US Holdings Inc ‘144A’
8.250% 15-Nov-2026 1,921,905 0.21 995,000 RegionalCare Hospital Partners Holdings Inc /
LifePoint Health Inc ‘144A’ 9.750% 01-Dec-2026 1,027,989 0.12 370,000 Ritchie Bros Auctioneers Inc ‘144A’
5.375% 15-Jan-2025 381,601 0.04 500,000 RR Donnelley & Sons Co 8.250% 01-Jul-2027 496,250 0.06 500,000 Safeway Inc 7.250% 01-Feb-2031 534,280 0.06 630,000 Select Medical Corp ‘144A’ 6.250% 15-Aug-2026 638,303 0.07 315,000 Service Corp International/US 4.625% 15-Dec-2027 329,303 0.04 755,000 Service Corp International/US 5.125% 01-Jun-2029 813,656 0.09 2,000 Service Corp International/US 7.500% 01-Apr-2027 2,277 0.00 347,000 Service Corp International/US 8.000% 15-Nov-2021 369,078 0.04 555,000 ServiceMaster Co LLC/The ‘144A’
5.125% 15-Nov-2024 564,077 0.06 305,000 Sigma Holdco BV ‘144A’ 7.875% 15-May-2026 304,181 0.03 1,064,000 Simmons Foods Inc ‘144A’ 5.750% 01-Nov-2024 1,013,572 0.11 380,000 Simmons Foods Inc ‘144A’ 7.750% 15-Jan-2024 397,801 0.04 450,000 Sotheby’s ‘144A’ 7.375% 15-Oct-2027 426,010 0.05 1,055,000 Spectrum Brands Inc 5.750% 15-Jul-2025 1,086,001 0.12 39,000 Spectrum Brands Inc 6.125% 15-Dec-2024 40,215 0.00 75,000 Spectrum Brands Inc ‘144A’ 5.000% 01-Oct-2029 74,329 0.01 300,000 Surgery Center Holdings Inc ‘144A’
6.750% 01-Jul-2025 271,843 0.03 320,000 Surgery Center Holdings Inc ‘144A’
10.000% 15-Apr-2027 321,139 0.04 731,000 Team Health Holdings Inc ‘144A’ 6.375% 01-Feb-2025 426,645 0.05 425,000 Teleflex Inc 4.625% 15-Nov-2027 450,298 0.05 285,000 Teleflex Inc 4.875% 01-Jun-2026 294,565 0.03 115,000 Teleflex Inc ‘144A’ 4.250% 01-Jun-2028 118,091 0.01 1,525,000 Tenet Healthcare Corp 4.625% 15-Jul-2024 1,498,313 0.17 1,405,000 Tenet Healthcare Corp 5.125% 01-May-2025 1,357,525 0.15 1,465,000 Tenet Healthcare Corp 6.750% 15-Jun-2023 1,455,477 0.16 205,000 Tenet Healthcare Corp 6.875% 15-Nov-2031 182,155 0.02 263,000 Tenet Healthcare Corp 7.000% 01-Aug-2025 257,202 0.03 2,075,000 Tenet Healthcare Corp 8.125% 01-Apr-2022 2,182,485 0.24 235,000 Tenet Healthcare Corp ‘144A’ 4.625% 01-Sep-2024 229,933 0.03 1,555,000 Tenet Healthcare Corp ‘144A’ 4.875% 01-Jan-2026 1,516,545 0.17 1,073,000 Tenet Healthcare Corp ‘144A’ 5.125% 01-Nov-2027 1,061,841 0.12 1,200,000 Tenet Healthcare Corp ‘144A’ 6.250% 01-Feb-2027 1,194,744 0.13 515,000 Tenet Healthcare Corp ‘144A’ 7.500% 01-Apr-2025 550,084 0.06 356,000 Tms International Holding Corp ‘144A’
7.250% 15-Aug-2025 291,920 0.03 210,000 TreeHouse Foods Inc 4.875% 15-Mar-2022 210,738 0.02 445,000 TreeHouse Foods Inc ‘144A’ 6.000% 15-Feb-2024 455,059 0.05 761,000 United Rentals North America Inc
3.875% 15-Nov-2027 760,384 0.09 555,000 United Rentals North America Inc
4.000% 15-Jul-2030 537,498 0.06 470,000 United Rentals North America Inc
4.625% 15-Oct-2025 473,276 0.05 1,265,000 United Rentals North America Inc
4.875% 15-Jan-2028 1,298,605 0.15 750,000 United Rentals North America Inc
5.250% 15-Jan-2030 776,111 0.09
Bonds cont’d.
Consumer, Non-cyclical cont’d.
Bonds cont’d.
Consumer, Non-cyclical cont’d.
USDUSD
03613-1A.indd 118 19/08/2020 19:00

119
Schedule of investments – as at 30 June 2020
Holdings Description
Fair value
Total net assets
% Holdings Description
Fair value
Total net assets
%
BNy MELLON EFFICIENT U.S. HIGH yIELD BETA FUND
1,150,000 Continental Resources Inc/OK 5.000% 15-Sep-2022 1,131,456 0.13 354,000 Crestwood Midstream Partners LP / Crestwood
Midstream Finance Corp 5.750% 01-Apr-2025 306,877 0.03 500,000 Crestwood Midstream Partners LP / Crestwood
Midstream Finance Corp 6.250% 01-Apr-2023 446,303 0.05 370,000 Crestwood Midstream Partners LP / Crestwood
Midstream Finance Corp ‘144A’ 5.625% 01-May-2027 309,633 0.03 885,000 CrownRock LP / CrownRock Finance Inc ‘144A’
5.625% 15-Oct-2025 795,938 0.09 412,000 CSI Compressco LP / CSI Compressco Finance Inc
7.250% 15-Aug-2022 218,360 0.02 309,000 CSI Compressco LP / CSI Compressco Finance Inc ‘144A’
7.500% 01-Apr-2025 263,423 0.03 100,000 CVR Energy Inc ‘144A’ 5.250% 15-Feb-2025 92,313 0.01 385,000 CVR Energy Inc ‘144A’ 5.750% 15-Feb-2028 337,838 0.04 95,000 DCP Midstream Operating LP 3.875% 15-Mar-2023 92,445 0.01 257,000 DCP Midstream Operating LP 4.950% 01-Apr-2022 259,309 0.03 925,000 DCP Midstream Operating LP 5.125% 15-May-2029 888,990 0.10 650,000 DCP Midstream Operating LP 5.375% 15-Jul-2025 647,150 0.07 200,000 DCP Midstream Operating LP 5.600% 01-Apr-2044 160,859 0.02 125,000 DCP Midstream Operating LP 8.125% 16-Aug-2030 131,695 0.01 300,000 DCP Midstream Operating LP ‘144A’
4.750% 30-Sep-2021 305,825 0.03 4,000 DCP Midstream Operating LP ‘144A’
6.450% 03-Nov-2036 3,617 0.00 240,000 DCP Midstream Operating LP ‘144A’
6.750% 15-Sep-2037 216,380 0.02 137,000 Delek Logistics Partners LP /
Delek Logistics Finance Corp 6.750% 15-May-2025 127,224 0.01 100,000 Denbury Resources Inc ‘144A’ 7.750% 15-Feb-2024 38,302 0.00 165,000 Denbury Resources Inc ‘144A’ 9.250% 31-Mar-2022 66,580 0.01 1,040,000 Endeavor Energy Resources LP / EER Finance Inc ‘144A’
5.500% 30-Jan-2026 998,821 0.11 948,000 Endeavor Energy Resources LP / EER Finance Inc ‘144A’
5.750% 30-Jan-2028 912,275 0.10 52,000 Energy Ventures Gom LLC / EnVen Finance Corp ‘144A’
11.000% 15-Feb-2023 43,610 0.00 485,000 EnLink Midstream LLC 5.375% 01-Jun-2029 365,159 0.04 815,000 EnLink Midstream Partners LP 4.150% 01-Jun-2025 629,673 0.07 405,000 EnLink Midstream Partners LP 4.400% 01-Apr-2024 337,614 0.04 350,000 EnLink Midstream Partners LP 4.850% 15-Jul-2026 260,122 0.03 292,000 EnLink Midstream Partners LP 5.050% 01-Apr-2045 183,112 0.02 55,000 EnLink Midstream Partners LP 5.450% 01-Jun-2047 34,268 0.00 245,000 EnLink Midstream Partners LP 5.600% 01-Apr-2044 150,502 0.02 100,000 Ensign Drilling Inc ‘144A’ 9.250% 15-Apr-2024 44,812 0.00 185,000 Enviva Partners LP / Enviva Partners Finance Corp ‘144A’
6.500% 15-Jan-2026 192,747 0.02 613,000 EQM Midstream Partners LP 4.000% 01-Aug-2024 581,648 0.06 1,010,000 EQM Midstream Partners LP 4.125% 01-Dec-2026 927,619 0.10 1,135,000 EQM Midstream Partners LP 4.750% 15-Jul-2023 1,144,625 0.13 1,215,000 EQM Midstream Partners LP 5.500% 15-Jul-2028 1,159,997 0.13 635,000 EQM Midstream Partners LP 6.500% 15-Jul-2048 580,622 0.06 1,170,000 EQT Corp 3.000% 01-Oct-2022 1,091,756 0.12 1,616,000 EQT Corp 3.900% 01-Oct-2027 1,319,472 0.15 335,000 EQT Corp 4.875% 15-Nov-2021 329,246 0.04 1,055,000 EQT Corp 6.125% 01-Feb-2025 1,053,164 0.12 825,000 EQT Corp 7.000% 01-Feb-2030 850,880 0.09 380,000 Exterran Energy Solutions LP / EES Finance Corp
8.125% 01-May-2025 315,835 0.04
750,000 Ascent Resources Utica Holdings LLC / ARU Finance Corp ‘144A’ 7.000% 01-Nov-2026 482,670 0.05
721,000 Ascent Resources Utica Holdings LLC / ARU Finance Corp ‘144A’ 10.000% 01-Apr-2022 616,898 0.07
191,000 Athabasca Oil Corp ‘144A’ 9.875% 24-Feb-2022 78,504 0.01 195,000 Basic Energy Services Inc ‘144A’
10.750% 15-Oct-2023 79,463 0.01 146,000 Baytex Energy Corp ‘144A’ 5.625% 01-Jun-2024 89,592 0.01 100,000 Baytex Energy Corp ‘144A’ 8.750% 01-Apr-2027 49,925 0.01 550,000 Berry Petroleum Co LLC ‘144A’ 7.000% 15-Feb-2026 447,458 0.05 630,000 Blue Racer Midstream LLC / Blue Racer Finance
Corp ‘144A’ 6.125% 15-Nov-2022 628,252 0.07 575,000 Blue Racer Midstream LLC / Blue Racer Finance
Corp ‘144A’ 6.625% 15-Jul-2026 513,797 0.06 262,000 Buckeye Partners LP 3.950% 01-Dec-2026 247,701 0.03 340,000 Buckeye Partners LP 4.125% 01-Dec-2027 324,913 0.04 550,000 Buckeye Partners LP 4.150% 01-Jul-2023 536,759 0.06 875,000 Buckeye Partners LP 4.350% 15-Oct-2024 829,609 0.09 210,000 Buckeye Partners LP 5.600% 15-Oct-2044 168,656 0.02 220,000 Buckeye Partners LP 5.850% 15-Nov-2043 191,604 0.02 90,000 Buckeye Partners LP ‘144A’ 4.125% 01-Mar-2025 86,559 0.01 585,000 Buckeye Partners LP ‘144A’ 4.500% 01-Mar-2028 548,437 0.06 295,000 Buckeye Partners LP FRN 6.375% 22-Jan-2078 216,617 0.02 446,000 Callon Petroleum Co 6.125% 01-Oct-2024 168,755 0.02 270,000 Callon Petroleum Co 6.250% 15-Apr-2023 103,109 0.01 587,000 Callon Petroleum Co 6.375% 01-Jul-2026 195,800 0.02 85,000 Callon Petroleum Co 8.250% 15-Jul-2025 30,060 0.00 257,000 Calumet Specialty Products Partners LP /
Calumet Finance Corp 7.625% 15-Jan-2022 246,338 0.03 241,000 Calumet Specialty Products Partners LP /
Calumet Finance Corp 7.750% 15-Apr-2023 225,008 0.03 409,000 Calumet Specialty Products Partners LP /
Calumet Finance Corp ‘144A’ 11.000% 15-Apr-2025 395,703 0.04 605,000 Cenovus Energy Inc 3.000% 15-Aug-2022 588,567 0.07 950,000 Cenovus Energy Inc 3.800% 15-Sep-2023 893,854 0.10 935,000 Cenovus Energy Inc 4.250% 15-Apr-2027 847,550 0.09 750,000 Cenovus Energy Inc 5.250% 15-Jun-2037 649,266 0.07 615,000 Cenovus Energy Inc 5.400% 15-Jun-2047 528,656 0.06 695,000 Cenovus Energy Inc 6.750% 15-Nov-2039 677,414 0.08 325,000 CGG Holding US Inc ‘144A’ 9.000% 01-May-2023 329,063 0.04 388,000 ChampionX Corp 6.375% 01-May-2026 361,938 0.04 150,000 Chaparral Energy Inc ‘144A’ 8.750% 15-Jul-2023 16,500 0.00 1,383,000 Cheniere Energy Partners LP 5.250% 01-Oct-2025 1,379,819 0.15 815,000 Cheniere Energy Partners LP 5.625% 01-Oct-2026 813,394 0.09 1,065,000 Cheniere Energy Partners LP ‘144A’
4.500% 01-Oct-2029 1,034,988 0.12 564,063 Chesapeake Energy Corp (Defaulted)
4.875% 15-Apr-2022 19,742 0.00 490,000 CNX Midstream Partners LP / CNX Midstream
Finance Corp ‘144A’ 6.500% 15-Mar-2026 452,544 0.05 146,000 CNX Resources Corp 5.875% 15-Apr-2022 144,536 0.02 590,000 CNX Resources Corp ‘144A’ 7.250% 14-Mar-2027 543,549 0.06 340,000 Comstock Resources Inc 9.750% 15-Aug-2026 317,900 0.04 485,000 Comstock Resources Inc 9.750% 15-Aug-2026 454,913 0.05 375,000 Comstock Resources Inc ‘144A’ 7.500% 15-May-2025 342,656 0.04 30,000 CONSOL Energy Inc ‘144A’ 11.000% 15-Nov-2025 12,791 0.00 506,000 Continental Resources Inc/OK 3.800% 01-Jun-2024 474,471 0.05 1,150,000 Continental Resources Inc/OK 4.375% 15-Jan-2028 1,014,311 0.11 1,425,000 Continental Resources Inc/OK 4.500% 15-Apr-2023 1,366,618 0.15 1,000,000 Continental Resources Inc/OK 4.900% 01-Jun-2044 798,415 0.09
Bonds cont’d.
Energy cont’d.
Bonds cont’d.
Energy cont’d.
USDUSD
03613-1A.indd 119 19/08/2020 19:00

120
Schedule of investments – as at 30 June 2020
Holdings Description
Fair value
Total net assets
% Holdings Description
Fair value
Total net assets
%
BNy MELLON EFFICIENT U.S. HIGH yIELD BETA FUND
325,000 Nabors Industries Inc 5.750% 01-Feb-2025 132,810 0.01 100,000 Natural Resource Partners LP /
NRP Finance Corp ‘144A’ 9.125% 30-Jun-2025 83,364 0.01 400,000 Neptune Energy Bondco Plc ‘144A’
6.625% 15-May-2025 349,246 0.04 286,000 NGL Energy Partners LP / NGL Energy Finance Corp
6.125% 01-Mar-2025 216,972 0.02 700,000 NGL Energy Partners LP / NGL Energy Finance Corp
7.500% 01-Nov-2023 583,181 0.06 335,000 NGL Energy Partners LP / NGL Energy Finance Corp
7.500% 15-Apr-2026 255,384 0.03 275,000 Nine Energy Service Inc ‘144A’ 8.750% 01-Nov-2023 135,180 0.02 254,000 Noble Holding International Ltd 5.250% 15-Mar-2042 8,890 0.00 50,000 Noble Holding International Ltd 6.050% 01-Mar-2041 1,625 0.00 63,000 Noble Holding International Ltd 6.200% 01-Aug-2040 1,171 0.00 140,000 Noble Holding International Ltd 7.750% 15-Jan-2024 3,310 0.00 610,000 Noble Holding International Ltd 7.950% 01-Apr-2025 20,523 0.00 395,000 Noble Holding International Ltd ‘144A’
7.875% 01-Feb-2026 104,106 0.01 224,000 NuStar Logistics LP 4.750% 01-Feb-2022 220,307 0.02 615,000 NuStar Logistics LP 5.625% 28-Apr-2027 594,899 0.07 515,000 NuStar Logistics LP 6.000% 01-Jun-2026 500,433 0.06 1,399,000 Occidental Petroleum Corp 2.600% 13-Aug-2021 1,370,985 0.15 595,000 Occidental Petroleum Corp 2.600% 15-Apr-2022 569,891 0.06 1,754,000 Occidental Petroleum Corp 2.700% 15-Aug-2022 1,636,122 0.18 1,102,000 Occidental Petroleum Corp 2.700% 15-Feb-2023 1,009,707 0.11 2,450,000 Occidental Petroleum Corp 2.900% 15-Aug-2024 2,098,352 0.23 690,000 Occidental Petroleum Corp 3.000% 15-Feb-2027 538,338 0.06 400,000 Occidental Petroleum Corp 3.125% 15-Feb-2022 385,080 0.04 1,045,000 Occidental Petroleum Corp 3.200% 15-Aug-2026 853,634 0.10 1,100,000 Occidental Petroleum Corp 3.400% 15-Apr-2026 899,250 0.10 840,000 Occidental Petroleum Corp 3.500% 15-Jun-2025 714,000 0.08 1,570,000 Occidental Petroleum Corp 3.500% 15-Aug-2029 1,151,124 0.13 110,000 Occidental Petroleum Corp 4.100% 15-Feb-2047 74,663 0.01 600,000 Occidental Petroleum Corp 4.200% 15-Mar-2048 407,070 0.05 495,000 Occidental Petroleum Corp 4.300% 15-Aug-2039 343,572 0.04 600,000 Occidental Petroleum Corp 4.400% 15-Apr-2046 419,535 0.05 845,000 Occidental Petroleum Corp 4.400% 15-Aug-2049 585,978 0.07 400,000 Occidental Petroleum Corp 4.500% 15-Jul-2044 277,750 0.03 120,000 Occidental Petroleum Corp 4.625% 15-Jun-2045 84,600 0.01 1,490,000 Occidental Petroleum Corp 5.550% 15-Mar-2026 1,362,970 0.15 465,000 Occidental Petroleum Corp 6.200% 15-Mar-2040 391,472 0.04 930,000 Occidental Petroleum Corp 6.450% 15-Sep-2036 790,658 0.09 75,000 Occidental Petroleum Corp 6.600% 15-Mar-2046 65,613 0.01 790,000 Occidental Petroleum Corp 6.950% 01-Jul-2024 778,150 0.09 670,000 Occidental Petroleum Corp 7.500% 01-May-2031 625,837 0.07 675,000 Occidental Petroleum Corp 7.875% 15-Sep-2031 642,097 0.07 200,000 Occidental Petroleum Corp 7.950% 15-Jun-2039 180,875 0.02 361,000 Oceaneering International Inc 4.650% 15-Nov-2024 273,683 0.03 435,000 Oceaneering International Inc 6.000% 01-Feb-2028 306,049 0.03 370,000 Pacific Drilling SA ‘144A’ 8.375% 01-Oct-2023 93,653 0.01 313,000 Par Petroleum LLC / Par Petroleum Finance Corp ‘144A’
7.750% 15-Dec-2025 271,169 0.03 200,000 Parkland Corp/Canada ‘144A’ 5.875% 15-Jul-2027 207,963 0.02 365,000 Parkland Corp/Canada ‘144A’ 6.000% 01-Apr-2026 374,970 0.04 175,000 Parsley Energy LLC / Parsley Finance Corp ‘144A’
4.125% 15-Feb-2028 158,812 0.02 610,000 Parsley Energy LLC / Parsley Finance Corp ‘144A’
5.250% 15-Aug-2025 588,037 0.07
500,000 Extraction Oil & Gas Inc ‘144A’ (Defaulted) 5.625% 01-Feb-2026 98,030 0.01
273,000 FTS International Inc 6.250% 01-May-2022 90,090 0.01 260,000 Genesis Energy LP / Genesis Energy Finance Corp
5.625% 15-Jun-2024 227,148 0.03 510,000 Genesis Energy LP / Genesis Energy Finance Corp
6.000% 15-May-2023 460,859 0.05 833,000 Genesis Energy LP / Genesis Energy Finance Corp
6.250% 15-May-2026 717,580 0.08 1,004,000 Genesis Energy LP / Genesis Energy Finance Corp
6.500% 01-Oct-2025 861,547 0.10 832,000 Genesis Energy LP / Genesis Energy Finance Corp
7.750% 01-Feb-2028 741,262 0.08 202,000 Global Partners LP / GLP Finance Corp
7.000% 15-Jun-2023 194,909 0.02 215,000 Global Partners LP / GLP Finance Corp
7.000% 01-Aug-2027 199,506 0.02 550,000 Great Western Petroleum LLC / Great Western
Finance Corp ‘144A’ 9.000% 30-Sep-2021 335,500 0.04 100,000 Gulfport Energy Corp 6.000% 15-Oct-2024 51,312 0.01 385,000 Gulfport Energy Corp 6.375% 15-May-2025 193,443 0.02 160,000 Gulfport Energy Corp 6.625% 01-May-2023 95,762 0.01 240,000 Hess Midstream Operations LP ‘144A’
5.625% 15-Feb-2026 238,025 0.03 483,000 HighPoint Operating Corp 7.000% 15-Oct-2022 117,618 0.01 205,000 HighPoint Operating Corp 8.750% 15-Jun-2025 50,225 0.01 610,000 Hilcorp Energy I LP / Hilcorp Finance Co ‘144A’
5.000% 01-Dec-2024 526,823 0.06 370,000 Hilcorp Energy I LP / Hilcorp Finance Co ‘144A’
5.750% 01-Oct-2025 315,849 0.04 620,000 Hilcorp Energy I LP / Hilcorp Finance Co ‘144A’
6.250% 01-Nov-2028 499,757 0.06 370,000 Holly Energy Partners LP / Holly Energy Finance
Corp ‘144A’ 5.000% 01-Feb-2028 353,293 0.04 1,025,000 Indigo Natural Resources LLC ‘144A’
6.875% 15-Feb-2026 956,484 0.11 325,000 Ithaca Energy North Sea Plc ‘144A’
9.375% 15-Jul-2024 261,622 0.03 465,000 Jagged Peak Energy LLC 5.875% 01-May-2026 452,429 0.05 445,000 Laredo Petroleum Inc 9.500% 15-Jan-2025 308,025 0.03 295,000 Laredo Petroleum Inc 10.125% 15-Jan-2028 204,287 0.02 60,000 Lonestar Resources America Inc ‘144A’
11.250% 01-Jan-2023 6,300 0.00 287,000 Magnolia Oil & Gas Operating LLC / Magnolia Oil
& Gas Finance Corp ‘144A’ 6.000% 01-Aug-2026 272,650 0.03 825,000 Matador Resources Co 5.875% 15-Sep-2026 612,455 0.07 736,000 MEG Energy Corp ‘144A’ 6.500% 15-Jan-2025 687,350 0.08 745,000 MEG Energy Corp ‘144A’ 7.000% 31-Mar-2024 640,778 0.07 890,000 MEG Energy Corp ‘144A’ 7.125% 01-Feb-2027 742,037 0.08 790,000 Montage Resources Corp 8.875% 15-Jul-2023 626,561 0.07 400,000 Moss Creek Resources Holdings Inc ‘144A’
7.500% 15-Jan-2026 201,424 0.02 405,000 Murphy Oil Corp 4.000% 01-Jun-2022 390,062 0.04 331,000 Murphy Oil Corp 4.950% 01-Dec-2022 320,446 0.04 250,000 Murphy Oil Corp 5.750% 15-Aug-2025 224,401 0.02 405,000 Murphy Oil Corp 5.875% 01-Dec-2027 356,781 0.04 142,000 Murphy Oil Corp 6.375% 01-Dec-2042 110,788 0.01 509,000 Murphy Oil Corp 6.875% 15-Aug-2024 477,241 0.05 120,000 Murphy Oil Corp 7.050% 01-May-2029 108,427 0.01 32,000 Nabors Industries Inc 4.625% 15-Sep-2021 25,040 0.00
Bonds cont’d.
Energy cont’d.
Bonds cont’d.
Energy cont’d.
USDUSD
03613-1A.indd 120 19/08/2020 19:00

121
Schedule of investments – as at 30 June 2020
Holdings Description
Fair value
Total net assets
% Holdings Description
Fair value
Total net assets
%
BNy MELLON EFFICIENT U.S. HIGH yIELD BETA FUND
238,000 Summit Midstream Holdings LLC / Summit Midstream Finance Corp 5.500% 15-Aug-2022 157,917 0.02
720,000 SunCoke Energy Partners LP / SunCoke Energy Partners Finance Corp ‘144A’ 7.500% 15-Jun-2025 610,787 0.07
275,000 Suncor Energy Ventures Corp ‘144A’ 4.500% 01-Apr-2022 279,149 0.03
215,000 Suncor Energy Ventures Corp ‘144A’ 6.000% 01-Apr-2042 219,570 0.02
940,000 Sunoco LP / Sunoco Finance Corp 4.875% 15-Jan-2023 929,326 0.10
800,000 Sunoco LP / Sunoco Finance Corp 5.500% 15-Feb-2026 778,848 0.09
450,000 Sunoco LP / Sunoco Finance Corp 5.875% 15-Mar-2028 448,299 0.05
396,000 Sunoco LP / Sunoco Finance Corp 6.000% 15-Apr-2027 392,943 0.04
370,000 Tallgrass Energy Partners LP / Tallgrass Energy Finance Corp ‘144A’ 4.750% 01-Oct-2023 341,553 0.04
555,000 Tallgrass Energy Partners LP / Tallgrass Energy Finance Corp ‘144A’ 5.500% 15-Sep-2024 502,933 0.06
780,000 Tallgrass Energy Partners LP / Tallgrass Energy Finance Corp ‘144A’ 5.500% 15-Jan-2028 676,966 0.08
100,000 Tallgrass Energy Partners LP / Tallgrass Energy Finance Corp ‘144A’ 6.000% 01-Mar-2027 89,000 0.01
525,000 Targa Resources Partners LP / Targa Resources Partners Finance Corp 4.250% 15-Nov-2023 502,743 0.06
620,000 Targa Resources Partners LP / Targa Resources Partners Finance Corp 5.000% 15-Jan-2028 584,837 0.07
627,000 Targa Resources Partners LP / Targa Resources Partners Finance Corp 5.125% 01-Feb-2025 605,441 0.07
140,000 Targa Resources Partners LP / Targa Resources Partners Finance Corp 5.250% 01-May-2023 136,865 0.02
680,000 Targa Resources Partners LP / Targa Resources Partners Finance Corp 5.375% 01-Feb-2027 657,774 0.07
703,000 Targa Resources Partners LP / Targa Resources Partners Finance Corp 5.875% 15-Apr-2026 697,615 0.08
719,000 Targa Resources Partners LP / Targa Resources Partners Finance Corp 6.500% 15-Jul-2027 722,595 0.08
515,000 Targa Resources Partners LP / Targa Resources Partners Finance Corp 6.750% 15-Mar-2024 515,317 0.06
700,000 Targa Resources Partners LP / Targa Resources Partners Finance Corp 6.875% 15-Jan-2029 735,438 0.08
704,000 Targa Resources Partners LP / Targa Resources Partners Finance Corp ‘144A’ 5.500% 01-Mar-2030 680,458 0.08
311,000 Teine Energy Ltd ‘144A’ 6.875% 30-Sep-2022 308,206 0.03 495,000 TerraForm Power Operating LLC ‘144A’
4.250% 31-Jan-2023 502,729 0.06 655,000 TerraForm Power Operating LLC ‘144A’
4.750% 15-Jan-2030 666,338 0.07 710,000 TerraForm Power Operating LLC ‘144A’
5.000% 31-Jan-2028 741,819 0.08 104,000 TransMontaigne Partners LP / TLP Finance Corp
6.125% 15-Feb-2026 100,730 0.01 459,250 Transocean Guardian Ltd ‘144A’ 5.875% 15-Jan-2024 406,317 0.05 285,000 Transocean Inc 5.800% 15-Oct-2022 155,325 0.02 965,000 Transocean Inc 6.800% 15-Mar-2038 291,855 0.03 316,000 Transocean Inc 7.500% 15-Apr-2031 93,220 0.01 409,000 Transocean Inc 8.375% 15-Dec-2021 290,390 0.03
603,000 Parsley Energy LLC / Parsley Finance Corp ‘144A’ 5.375% 15-Jan-2025 588,474 0.07
399,000 Parsley Energy LLC / Parsley Finance Corp ‘144A’ 5.625% 15-Oct-2027 393,939 0.04
233,000 Pattern Energy Group Inc ‘144A’ 5.875% 01-Feb-2024 235,014 0.03
650,000 Patterson-UTI Energy Inc 3.950% 01-Feb-2028 491,560 0.05 300,000 Patterson-UTI Energy Inc 5.150% 15-Nov-2029 227,709 0.03 760,000 PBF Holding Co LLC / PBF Finance Corp
7.250% 15-Jun-2025 691,680 0.08 740,000 PBF Holding Co LLC / PBF Finance Corp ‘144A’
6.000% 15-Feb-2028 616,050 0.07 90,000 PBF Holding Co LLC / PBF Finance Corp ‘144A’
9.250% 15-May-2025 96,244 0.01 487,000 PBF Logistics LP / PBF Logistics Finance Corp
6.875% 15-May-2023 465,382 0.05 445,000 PDC Energy Inc 5.750% 15-May-2026 406,354 0.05 295,000 PDC Energy Inc 6.125% 15-Sep-2024 275,425 0.03 273,000 Peabody Energy Corp ‘144A’ 6.000% 31-Mar-2022 178,303 0.02 50,000 Peabody Energy Corp ‘144A’ 6.375% 31-Mar-2025 26,656 0.00 84,000 Precision Drilling Corp 5.250% 15-Nov-2024 56,419 0.01 43,000 Precision Drilling Corp 7.750% 15-Dec-2023 29,612 0.00 28,000 Precision Drilling Corp ‘144A’ 7.125% 15-Jan-2026 17,180 0.00 300,000 Puma International Financing SA ‘144A’
5.000% 24-Jan-2026 251,250 0.03 300,000 Puma International Financing SA ‘144A’
5.125% 06-Oct-2024 254,250 0.03 350,000 QEP Resources Inc 5.250% 01-May-2023 232,094 0.03 140,000 QEP Resources Inc 5.375% 01-Oct-2022 106,892 0.01 370,000 QEP Resources Inc 5.625% 01-Mar-2026 236,117 0.03 599,000 Range Resources Corp 4.875% 15-May-2025 454,117 0.05 417,000 Range Resources Corp 5.000% 15-Aug-2022 380,773 0.04 605,000 Range Resources Corp 5.000% 15-Mar-2023 522,185 0.06 565,000 Range Resources Corp ‘144A’ 9.250% 01-Feb-2026 508,941 0.06 295,000 Rockies Express Pipeline LLC ‘144A’
3.600% 15-May-2025 273,517 0.03 405,000 Rockies Express Pipeline LLC ‘144A’
4.950% 15-Jul-2029 378,796 0.04 320,000 Rockies Express Pipeline LLC ‘144A’
6.875% 15-Apr-2040 304,832 0.03 145,000 Rockies Express Pipeline LLC ‘144A’
7.500% 15-Jul-2038 140,650 0.02 115,909 Ruby Pipeline LLC ‘144A’ 7.000% 01-Apr-2022 107,889 0.01 135,000 SESI LLC 7.125% 15-Dec-2021 49,275 0.01 140,000 SESI LLC 7.750% 15-Sep-2024 51,610 0.01 520,000 Seven Generations Energy Ltd ‘144A’
5.375% 30-Sep-2025 459,220 0.05 315,000 Seven Generations Energy Ltd ‘144A’
6.750% 01-May-2023 303,548 0.03 335,000 Seven Generations Energy Ltd ‘144A’
6.875% 30-Jun-2023 325,334 0.04 95,000 SM Energy Co 5.000% 15-Jan-2024 51,646 0.01 100,000 SM Energy Co 6.625% 15-Jan-2027 49,291 0.01 310,000 SM Energy Co 6.750% 15-Sep-2026 156,996 0.02 129,000 SM Energy Co ‘144A’ 10.000% 15-Jan-2025 122,793 0.01 689,000 Southwestern Energy Co 4.950% 23-Jan-2025 592,099 0.07 685,000 Southwestern Energy Co 7.500% 01-Apr-2026 601,742 0.07 162,000 Southwestern Energy Co 7.750% 01-Oct-2027 141,451 0.02
Bonds cont’d.
Energy cont’d.
Bonds cont’d.
Energy cont’d.
USDUSD
03613-1A.indd 121 19/08/2020 19:00
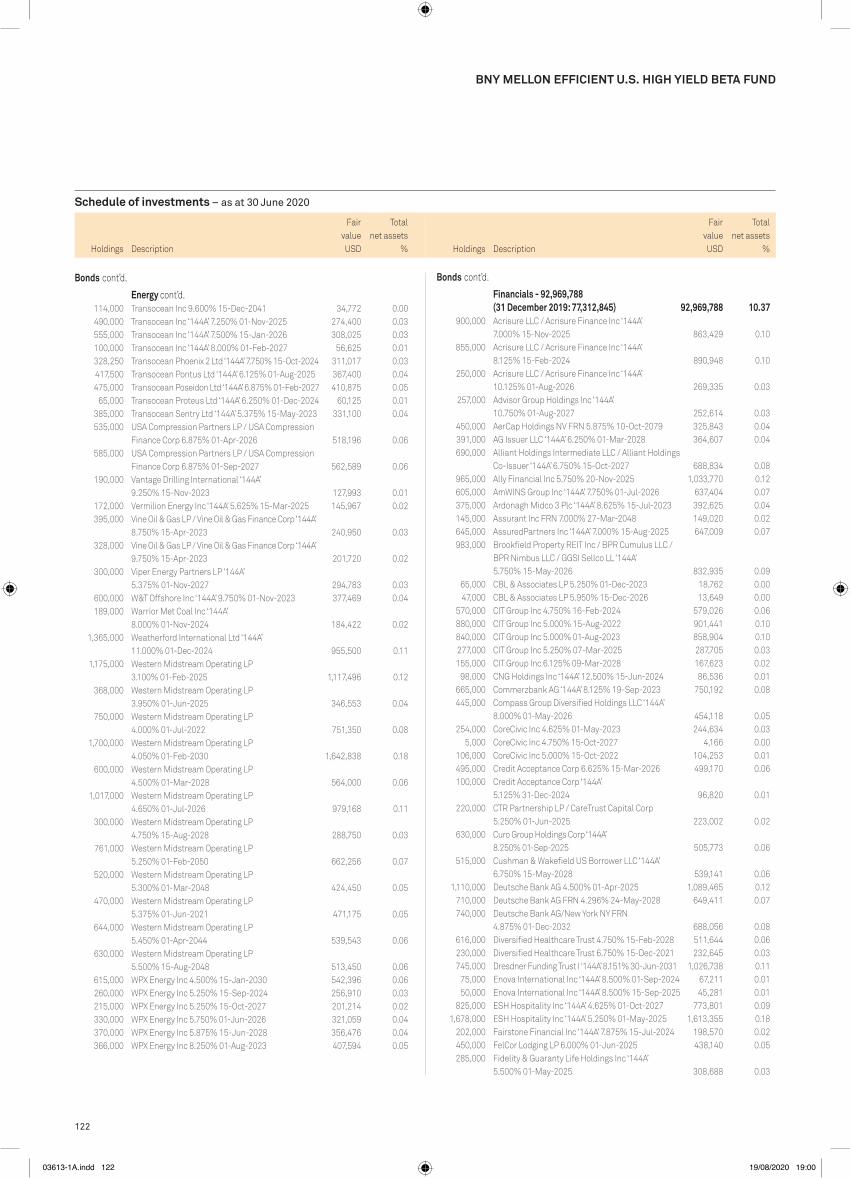
122
Schedule of investments – as at 30 June 2020
Holdings Description
Fair value
Total net assets
% Holdings Description
Fair value
Total net assets
%
BNy MELLON EFFICIENT U.S. HIGH yIELD BETA FUND
Financials - 92,969,788 (31 December 2019: 77,312,845) 92,969,788 10.37
900,000 Acrisure LLC / Acrisure Finance Inc ‘144A’ 7.000% 15-Nov-2025 863,429 0.10
855,000 Acrisure LLC / Acrisure Finance Inc ‘144A’ 8.125% 15-Feb-2024 890,948 0.10
250,000 Acrisure LLC / Acrisure Finance Inc ‘144A’ 10.125% 01-Aug-2026 269,335 0.03
257,000 Advisor Group Holdings Inc ‘144A’ 10.750% 01-Aug-2027 252,614 0.03
450,000 AerCap Holdings NV FRN 5.875% 10-Oct-2079 325,843 0.04 391,000 AG Issuer LLC ‘144A’ 6.250% 01-Mar-2028 364,607 0.04 690,000 Alliant Holdings Intermediate LLC / Alliant Holdings
Co-Issuer ‘144A’ 6.750% 15-Oct-2027 688,834 0.08 965,000 Ally Financial Inc 5.750% 20-Nov-2025 1,033,770 0.12 605,000 AmWINS Group Inc ‘144A’ 7.750% 01-Jul-2026 637,404 0.07 375,000 Ardonagh Midco 3 Plc ‘144A’ 8.625% 15-Jul-2023 392,625 0.04 145,000 Assurant Inc FRN 7.000% 27-Mar-2048 149,020 0.02 645,000 AssuredPartners Inc ‘144A’ 7.000% 15-Aug-2025 647,009 0.07 983,000 Brookfield Property REIT Inc / BPR Cumulus LLC /
BPR Nimbus LLC / GGSI Sellco LL ‘144A’ 5.750% 15-May-2026 832,935 0.09
65,000 CBL & Associates LP 5.250% 01-Dec-2023 18,762 0.00 47,000 CBL & Associates LP 5.950% 15-Dec-2026 13,649 0.00 570,000 CIT Group Inc 4.750% 16-Feb-2024 579,026 0.06 880,000 CIT Group Inc 5.000% 15-Aug-2022 901,441 0.10 840,000 CIT Group Inc 5.000% 01-Aug-2023 858,904 0.10 277,000 CIT Group Inc 5.250% 07-Mar-2025 287,705 0.03 155,000 CIT Group Inc 6.125% 09-Mar-2028 167,623 0.02 98,000 CNG Holdings Inc ‘144A’ 12.500% 15-Jun-2024 86,536 0.01 665,000 Commerzbank AG ‘144A’ 8.125% 19-Sep-2023 750,192 0.08 445,000 Compass Group Diversified Holdings LLC ‘144A’
8.000% 01-May-2026 454,118 0.05 254,000 CoreCivic Inc 4.625% 01-May-2023 244,634 0.03 5,000 CoreCivic Inc 4.750% 15-Oct-2027 4,166 0.00 106,000 CoreCivic Inc 5.000% 15-Oct-2022 104,253 0.01 495,000 Credit Acceptance Corp 6.625% 15-Mar-2026 499,170 0.06 100,000 Credit Acceptance Corp ‘144A’
5.125% 31-Dec-2024 96,820 0.01 220,000 CTR Partnership LP / CareTrust Capital Corp
5.250% 01-Jun-2025 223,002 0.02 630,000 Curo Group Holdings Corp ‘144A’
8.250% 01-Sep-2025 505,773 0.06 515,000 Cushman & Wakefield US Borrower LLC ‘144A’
6.750% 15-May-2028 539,141 0.06 1,110,000 Deutsche Bank AG 4.500% 01-Apr-2025 1,089,465 0.12 710,000 Deutsche Bank AG FRN 4.296% 24-May-2028 649,411 0.07 740,000 Deutsche Bank AG/New York NY FRN
4.875% 01-Dec-2032 688,056 0.08 616,000 Diversified Healthcare Trust 4.750% 15-Feb-2028 511,644 0.06 230,000 Diversified Healthcare Trust 6.750% 15-Dec-2021 232,645 0.03 745,000 Dresdner Funding Trust I ‘144A’ 8.151% 30-Jun-2031 1,026,738 0.11 75,000 Enova International Inc ‘144A’ 8.500% 01-Sep-2024 67,211 0.01 50,000 Enova International Inc ‘144A’ 8.500% 15-Sep-2025 45,281 0.01 825,000 ESH Hospitality Inc ‘144A’ 4.625% 01-Oct-2027 773,801 0.09 1,678,000 ESH Hospitality Inc ‘144A’ 5.250% 01-May-2025 1,613,355 0.18 202,000 Fairstone Financial Inc ‘144A’ 7.875% 15-Jul-2024 198,570 0.02 450,000 FelCor Lodging LP 6.000% 01-Jun-2025 438,140 0.05 285,000 Fidelity & Guaranty Life Holdings Inc ‘144A’
5.500% 01-May-2025 308,688 0.03
114,000 Transocean Inc 9.600% 15-Dec-2041 34,772 0.00 490,000 Transocean Inc ‘144A’ 7.250% 01-Nov-2025 274,400 0.03 555,000 Transocean Inc ‘144A’ 7.500% 15-Jan-2026 308,025 0.03 100,000 Transocean Inc ‘144A’ 8.000% 01-Feb-2027 56,625 0.01 328,250 Transocean Phoenix 2 Ltd ‘144A’ 7.750% 15-Oct-2024 311,017 0.03 417,500 Transocean Pontus Ltd ‘144A’ 6.125% 01-Aug-2025 367,400 0.04 475,000 Transocean Poseidon Ltd ‘144A’ 6.875% 01-Feb-2027 410,875 0.05 65,000 Transocean Proteus Ltd ‘144A’ 6.250% 01-Dec-2024 60,125 0.01 385,000 Transocean Sentry Ltd ‘144A’ 5.375% 15-May-2023 331,100 0.04 535,000 USA Compression Partners LP / USA Compression
Finance Corp 6.875% 01-Apr-2026 518,196 0.06 585,000 USA Compression Partners LP / USA Compression
Finance Corp 6.875% 01-Sep-2027 562,589 0.06 190,000 Vantage Drilling International ‘144A’
9.250% 15-Nov-2023 127,993 0.01 172,000 Vermilion Energy Inc ‘144A’ 5.625% 15-Mar-2025 145,967 0.02 395,000 Vine Oil & Gas LP / Vine Oil & Gas Finance Corp ‘144A’
8.750% 15-Apr-2023 240,950 0.03 328,000 Vine Oil & Gas LP / Vine Oil & Gas Finance Corp ‘144A’
9.750% 15-Apr-2023 201,720 0.02 300,000 Viper Energy Partners LP ‘144A’
5.375% 01-Nov-2027 294,783 0.03 600,000 W&T Offshore Inc ‘144A’ 9.750% 01-Nov-2023 377,469 0.04 189,000 Warrior Met Coal Inc ‘144A’
8.000% 01-Nov-2024 184,422 0.02 1,365,000 Weatherford International Ltd ‘144A’
11.000% 01-Dec-2024 955,500 0.11 1,175,000 Western Midstream Operating LP
3.100% 01-Feb-2025 1,117,496 0.12 368,000 Western Midstream Operating LP
3.950% 01-Jun-2025 346,553 0.04 750,000 Western Midstream Operating LP
4.000% 01-Jul-2022 751,350 0.08 1,700,000 Western Midstream Operating LP
4.050% 01-Feb-2030 1,642,838 0.18 600,000 Western Midstream Operating LP
4.500% 01-Mar-2028 564,000 0.06 1,017,000 Western Midstream Operating LP
4.650% 01-Jul-2026 979,168 0.11 300,000 Western Midstream Operating LP
4.750% 15-Aug-2028 288,750 0.03 761,000 Western Midstream Operating LP
5.250% 01-Feb-2050 662,256 0.07 520,000 Western Midstream Operating LP
5.300% 01-Mar-2048 424,450 0.05 470,000 Western Midstream Operating LP
5.375% 01-Jun-2021 471,175 0.05 644,000 Western Midstream Operating LP
5.450% 01-Apr-2044 539,543 0.06 630,000 Western Midstream Operating LP
5.500% 15-Aug-2048 513,450 0.06 615,000 WPX Energy Inc 4.500% 15-Jan-2030 542,396 0.06 260,000 WPX Energy Inc 5.250% 15-Sep-2024 256,910 0.03 215,000 WPX Energy Inc 5.250% 15-Oct-2027 201,214 0.02 330,000 WPX Energy Inc 5.750% 01-Jun-2026 321,059 0.04 370,000 WPX Energy Inc 5.875% 15-Jun-2028 356,476 0.04 366,000 WPX Energy Inc 8.250% 01-Aug-2023 407,594 0.05
Bonds cont’d.
Energy cont’d.
Bonds cont’d.
USDUSD
03613-1A.indd 122 19/08/2020 19:00

123
Schedule of investments – as at 30 June 2020
Holdings Description
Fair value
Total net assets
% Holdings Description
Fair value
Total net assets
%
BNy MELLON EFFICIENT U.S. HIGH yIELD BETA FUND
195,000 Ladder Capital Finance Holdings LLLP / Ladder Capital Finance Corp ‘144A’ 5.875% 01-Aug-2021 193,757 0.02
445,000 Liberty Mutual Group Inc ‘144A’ 7.800% 15-Mar-2037 534,190 0.06
155,000 LPL Holdings Inc ‘144A’ 4.625% 15-Nov-2027 153,547 0.02 690,000 LPL Holdings Inc ‘144A’ 5.750% 15-Sep-2025 700,774 0.08 370,000 Mack-Cali Realty LP 3.150% 15-May-2023 322,977 0.04 25,000 Mack-Cali Realty LP 4.500% 18-Apr-2022 23,198 0.00 120,000 MBIA Inc 5.700% 01-Dec-2034 78,878 0.01 366,000 MGIC Investment Corp 5.750% 15-Aug-2023 379,229 0.04 328,000 MGM Growth Properties Operating Partnership LP /
MGP Finance Co-Issuer Inc 4.500% 01-Sep-2026 325,771 0.04 557,000 MGM Growth Properties Operating Partnership LP /
MGP Finance Co-Issuer Inc 4.500% 15-Jan-2028 531,133 0.06 865,000 MGM Growth Properties Operating Partnership LP /
MGP Finance Co-Issuer Inc 5.625% 01-May-2024 897,546 0.10 920,000 MGM Growth Properties Operating Partnership LP /
MGP Finance Co-Issuer Inc 5.750% 01-Feb-2027 944,440 0.11 669,000 MPT Operating Partnership LP / MPT Finance Corp
4.625% 01-Aug-2029 673,496 0.08 438,000 MPT Operating Partnership LP / MPT Finance Corp
5.000% 15-Oct-2027 451,427 0.05 905,000 MPT Operating Partnership LP / MPT Finance Corp
5.250% 01-Aug-2026 941,567 0.10 370,000 MPT Operating Partnership LP / MPT Finance Corp
6.375% 01-Mar-2024 381,679 0.04 10,000 Nationstar Mortgage Holdings Inc ‘144A’
6.000% 15-Jan-2027 9,517 0.00 705,000 Nationstar Mortgage Holdings Inc ‘144A’
8.125% 15-Jul-2023 725,308 0.08 735,000 Nationstar Mortgage Holdings Inc ‘144A’
9.125% 15-Jul-2026 777,950 0.09 550,000 Navient Corp 5.000% 15-Mar-2027 463,207 0.05 314,000 Navient Corp 5.500% 25-Jan-2023 302,029 0.03 250,000 Navient Corp 5.875% 25-Oct-2024 235,624 0.03 630,000 Navient Corp 6.500% 15-Jun-2022 620,944 0.07 161,000 Navient Corp 6.625% 26-Jul-2021 158,232 0.02 335,000 Navient Corp 6.750% 25-Jun-2025 320,553 0.04 370,000 Navient Corp 6.750% 15-Jun-2026 343,107 0.04 907,000 Navient Corp 7.250% 25-Sep-2023 889,318 0.10 250,000 Navient Corp ‘MTN’ 5.625% 01-Aug-2033 193,226 0.02 62,000 Navient Corp ‘MTN’ 6.125% 25-Mar-2024 59,093 0.01 397,000 Navient Corp ‘MTN’ 7.250% 25-Jan-2022 398,876 0.04 645,000 Newmark Group Inc 6.125% 15-Nov-2023 641,998 0.07 712,000 NFP Corp ‘144A’ 6.875% 15-Jul-2025 704,577 0.08 265,000 NFP Corp ‘144A’ 8.000% 15-Jul-2025 259,838 0.03 13,000 Ocwen Loan Servicing LLC ‘144A’ 8.375% 15-Nov-2022 9,796 0.00 442,000 Oxford Finance LLC / Oxford Finance
Co-Issuer II Inc ‘144A’ 6.375% 15-Dec-2022 408,194 0.05 115,000 Park Intermediate Holdings LLC / PK Domestic
Property LLC / PK Finance Co-Issuer ‘144A’ 7.500% 01-Jun-2025 118,091 0.01
317,000 Provident Funding Associates LP / PFG Finance Corp ‘144A’ 6.375% 15-Jun-2025 297,550 0.03
975,000 Quicken Loans LLC ‘144A’ 5.250% 15-Jan-2028 1,008,915 0.11 1,170,000 Quicken Loans LLC ‘144A’ 5.750% 01-May-2025 1,199,127 0.13 541,000 Radian Group Inc 4.500% 01-Oct-2024 524,037 0.06 430,000 Radian Group Inc 4.875% 15-Mar-2027 405,462 0.05 1,000,000 Radian Group Inc 6.625% 15-Mar-2025 1,026,875 0.11
326,000 Five Point Operating Co LP / Five Point Capital Corp ‘144A’ 7.875% 15-Nov-2025 309,085 0.03
510,000 Freedom Mortgage Corp ‘144A’ 8.125% 15-Nov-2024 496,559 0.06 574,000 Freedom Mortgage Corp ‘144A’ 8.250% 15-Apr-2025 570,048 0.06 128,000 Freedom Mortgage Corp ‘144A’ 10.750% 01-Apr-2024 132,360 0.01 465,000 FS Energy and Power Fund ‘144A’
7.500% 15-Aug-2023 397,624 0.04 283,000 Genworth Holdings Inc 4.800% 15-Feb-2024 226,577 0.03 280,000 Genworth Holdings Inc 4.900% 15-Aug-2023 224,875 0.03 10,000 Genworth Holdings Inc 6.500% 15-Jun-2034 7,900 0.00 515,000 Genworth Holdings Inc 7.625% 24-Sep-2021 483,670 0.05 250,000 GEO Group Inc/The 5.125% 01-Apr-2023 217,031 0.02 290,000 GEO Group Inc/The 5.875% 15-Jan-2022 272,169 0.03 253,000 GEO Group Inc/The 5.875% 15-Oct-2024 199,704 0.02 85,000 GEO Group Inc/The 6.000% 15-Apr-2026 65,607 0.01 795,000 Global Aircraft Leasing Co Ltd ‘144A’
6.500% 15-Sep-2024 534,637 0.06 215,000 goeasy Ltd ‘144A’ 5.375% 01-Dec-2024 208,976 0.02 640,000 Greystar Real Estate Partners LLC ‘144A’
5.750% 01-Dec-2025 646,528 0.07 405,000 GTCR AP Finance Inc ‘144A’ 8.000% 15-May-2027 418,337 0.05 370,000 HAT Holdings I LLC / HAT Holdings II LLC ‘144A’
5.250% 15-Jul-2024 378,133 0.04 65,000 HAT Holdings I LLC / HAT Holdings II LLC ‘144A’
6.000% 15-Apr-2025 68,209 0.01 955,000 Howard Hughes Corp/The ‘144A’
5.375% 15-Mar-2025 891,698 0.10 1,850,000 HUB International Ltd ‘144A’ 7.000% 01-May-2026 1,847,974 0.21 664,000 Hunt Cos Inc ‘144A’ 6.250% 15-Feb-2026 606,169 0.07 915,000 Icahn Enterprises LP / Icahn Enterprises Finance Corp
4.750% 15-Sep-2024 861,715 0.10 1,050,000 Icahn Enterprises LP / Icahn Enterprises Finance Corp
5.250% 15-May-2027 1,016,531 0.11 925,000 Icahn Enterprises LP / Icahn Enterprises Finance Corp
6.250% 15-May-2026 927,812 0.10 555,000 Icahn Enterprises LP / Icahn Enterprises Finance Corp
6.375% 15-Dec-2025 550,896 0.06 1,940,000 Intesa Sanpaolo SpA ‘144A’ 5.017% 26-Jun-2024 1,988,915 0.22 845,000 Intesa Sanpaolo SpA ‘144A’ 5.710% 15-Jan-2026 891,057 0.10 972,000 Iron Mountain Inc 5.750% 15-Aug-2024 984,359 0.11 719,000 Iron Mountain Inc ‘144A’ 4.875% 15-Sep-2027 702,531 0.08 435,000 Iron Mountain Inc ‘144A’ 4.875% 15-Sep-2029 423,473 0.05 815,000 Iron Mountain Inc ‘144A’ 5.250% 15-Mar-2028 812,812 0.09 460,000 Iron Mountain US Holdings Inc ‘144A’
5.375% 01-Jun-2026 463,938 0.05 405,000 iStar Inc 4.250% 01-Aug-2025 367,537 0.04 409,000 iStar Inc 4.750% 01-Oct-2024 382,714 0.04 501,000 iStar Inc 5.250% 15-Sep-2022 487,731 0.05 175,000 Jefferies Finance LLC / JFIN Co-Issuer Corp ‘144A’
6.250% 03-Jun-2026 164,937 0.02 652,000 Jefferies Finance LLC / JFIN Co-Issuer Corp ‘144A’
7.250% 15-Aug-2024 576,137 0.06 855,000 Kennedy-Wilson Inc 5.875% 01-Apr-2024 853,388 0.10 208,000 Ladder Capital Finance Holdings LLLP / Ladder
Capital Finance Corp ‘144A’ 4.250% 01-Feb-2027 166,920 0.02 570,000 Ladder Capital Finance Holdings LLLP / Ladder
Capital Finance Corp ‘144A’ 5.250% 15-Mar-2022 543,276 0.06 530,000 Ladder Capital Finance Holdings LLLP / Ladder
Capital Finance Corp ‘144A’ 5.250% 01-Oct-2025 458,898 0.05
Bonds cont’d.
Financials cont’d.
Bonds cont’d.
Financials cont’d.
USDUSD
03613-1A.indd 123 19/08/2020 19:00
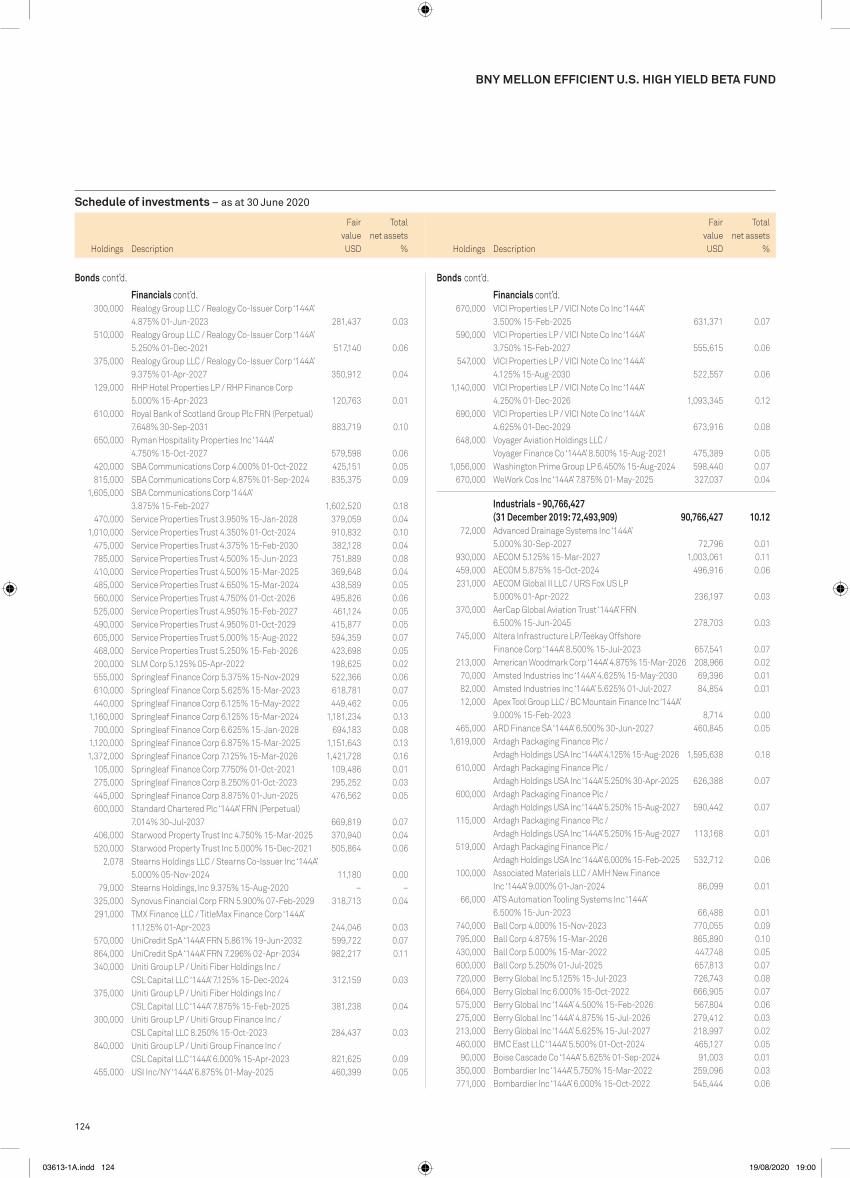
124
Schedule of investments – as at 30 June 2020
Holdings Description
Fair value
Total net assets
% Holdings Description
Fair value
Total net assets
%
BNy MELLON EFFICIENT U.S. HIGH yIELD BETA FUND
670,000 VICI Properties LP / VICI Note Co Inc ‘144A’ 3.500% 15-Feb-2025 631,371 0.07
590,000 VICI Properties LP / VICI Note Co Inc ‘144A’ 3.750% 15-Feb-2027 555,615 0.06
547,000 VICI Properties LP / VICI Note Co Inc ‘144A’ 4.125% 15-Aug-2030 522,557 0.06
1,140,000 VICI Properties LP / VICI Note Co Inc ‘144A’ 4.250% 01-Dec-2026 1,093,345 0.12
690,000 VICI Properties LP / VICI Note Co Inc ‘144A’ 4.625% 01-Dec-2029 673,916 0.08
648,000 Voyager Aviation Holdings LLC / Voyager Finance Co ‘144A’ 8.500% 15-Aug-2021 475,389 0.05
1,056,000 Washington Prime Group LP 6.450% 15-Aug-2024 598,440 0.07 670,000 WeWork Cos Inc ‘144A’ 7.875% 01-May-2025 327,037 0.04
Industrials - 90,766,427 (31 December 2019: 72,493,909) 90,766,427 10.12
72,000 Advanced Drainage Systems Inc ‘144A’ 5.000% 30-Sep-2027 72,796 0.01
930,000 AECOM 5.125% 15-Mar-2027 1,003,061 0.11 459,000 AECOM 5.875% 15-Oct-2024 496,916 0.06 231,000 AECOM Global II LLC / URS Fox US LP
5.000% 01-Apr-2022 236,197 0.03 370,000 AerCap Global Aviation Trust ‘144A’ FRN
6.500% 15-Jun-2045 278,703 0.03 745,000 Altera Infrastructure LP/Teekay Offshore
Finance Corp ‘144A’ 8.500% 15-Jul-2023 657,541 0.07 213,000 American Woodmark Corp ‘144A’ 4.875% 15-Mar-2026 208,966 0.02 70,000 Amsted Industries Inc ‘144A’ 4.625% 15-May-2030 69,396 0.01 82,000 Amsted Industries Inc ‘144A’ 5.625% 01-Jul-2027 84,854 0.01 12,000 Apex Tool Group LLC / BC Mountain Finance Inc ‘144A’
9.000% 15-Feb-2023 8,714 0.00 465,000 ARD Finance SA ‘144A’ 6.500% 30-Jun-2027 460,845 0.05 1,619,000 Ardagh Packaging Finance Plc /
Ardagh Holdings USA Inc ‘144A’ 4.125% 15-Aug-2026 1,595,638 0.18 610,000 Ardagh Packaging Finance Plc /
Ardagh Holdings USA Inc ‘144A’ 5.250% 30-Apr-2025 626,388 0.07 600,000 Ardagh Packaging Finance Plc /
Ardagh Holdings USA Inc ‘144A’ 5.250% 15-Aug-2027 590,442 0.07 115,000 Ardagh Packaging Finance Plc /
Ardagh Holdings USA Inc ‘144A’ 5.250% 15-Aug-2027 113,168 0.01 519,000 Ardagh Packaging Finance Plc /
Ardagh Holdings USA Inc ‘144A’ 6.000% 15-Feb-2025 532,712 0.06 100,000 Associated Materials LLC / AMH New Finance
Inc ‘144A’ 9.000% 01-Jan-2024 86,099 0.01 66,000 ATS Automation Tooling Systems Inc ‘144A’
6.500% 15-Jun-2023 66,488 0.01 740,000 Ball Corp 4.000% 15-Nov-2023 770,055 0.09 795,000 Ball Corp 4.875% 15-Mar-2026 865,890 0.10 430,000 Ball Corp 5.000% 15-Mar-2022 447,748 0.05 600,000 Ball Corp 5.250% 01-Jul-2025 657,813 0.07 720,000 Berry Global Inc 5.125% 15-Jul-2023 726,743 0.08 664,000 Berry Global Inc 6.000% 15-Oct-2022 666,905 0.07 575,000 Berry Global Inc ‘144A’ 4.500% 15-Feb-2026 567,804 0.06 275,000 Berry Global Inc ‘144A’ 4.875% 15-Jul-2026 279,412 0.03 213,000 Berry Global Inc ‘144A’ 5.625% 15-Jul-2027 218,997 0.02 460,000 BMC East LLC ‘144A’ 5.500% 01-Oct-2024 465,127 0.05 90,000 Boise Cascade Co ‘144A’ 5.625% 01-Sep-2024 91,003 0.01 350,000 Bombardier Inc ‘144A’ 5.750% 15-Mar-2022 259,096 0.03 771,000 Bombardier Inc ‘144A’ 6.000% 15-Oct-2022 545,444 0.06
300,000 Realogy Group LLC / Realogy Co-Issuer Corp ‘144A’ 4.875% 01-Jun-2023 281,437 0.03
510,000 Realogy Group LLC / Realogy Co-Issuer Corp ‘144A’ 5.250% 01-Dec-2021 517,140 0.06
375,000 Realogy Group LLC / Realogy Co-Issuer Corp ‘144A’ 9.375% 01-Apr-2027 350,912 0.04
129,000 RHP Hotel Properties LP / RHP Finance Corp 5.000% 15-Apr-2023 120,763 0.01
610,000 Royal Bank of Scotland Group Plc FRN (Perpetual) 7.648% 30-Sep-2031 883,719 0.10
650,000 Ryman Hospitality Properties Inc ‘144A’ 4.750% 15-Oct-2027 579,598 0.06
420,000 SBA Communications Corp 4.000% 01-Oct-2022 425,151 0.05 815,000 SBA Communications Corp 4.875% 01-Sep-2024 835,375 0.09 1,605,000 SBA Communications Corp ‘144A’
3.875% 15-Feb-2027 1,602,520 0.18 470,000 Service Properties Trust 3.950% 15-Jan-2028 379,059 0.04 1,010,000 Service Properties Trust 4.350% 01-Oct-2024 910,832 0.10 475,000 Service Properties Trust 4.375% 15-Feb-2030 382,128 0.04 785,000 Service Properties Trust 4.500% 15-Jun-2023 751,889 0.08 410,000 Service Properties Trust 4.500% 15-Mar-2025 369,648 0.04 485,000 Service Properties Trust 4.650% 15-Mar-2024 438,589 0.05 560,000 Service Properties Trust 4.750% 01-Oct-2026 495,826 0.06 525,000 Service Properties Trust 4.950% 15-Feb-2027 461,124 0.05 490,000 Service Properties Trust 4.950% 01-Oct-2029 415,877 0.05 605,000 Service Properties Trust 5.000% 15-Aug-2022 594,359 0.07 468,000 Service Properties Trust 5.250% 15-Feb-2026 423,698 0.05 200,000 SLM Corp 5.125% 05-Apr-2022 198,625 0.02 555,000 Springleaf Finance Corp 5.375% 15-Nov-2029 522,366 0.06 610,000 Springleaf Finance Corp 5.625% 15-Mar-2023 618,781 0.07 440,000 Springleaf Finance Corp 6.125% 15-May-2022 449,462 0.05 1,160,000 Springleaf Finance Corp 6.125% 15-Mar-2024 1,181,234 0.13 700,000 Springleaf Finance Corp 6.625% 15-Jan-2028 694,183 0.08 1,120,000 Springleaf Finance Corp 6.875% 15-Mar-2025 1,151,643 0.13 1,372,000 Springleaf Finance Corp 7.125% 15-Mar-2026 1,421,728 0.16 105,000 Springleaf Finance Corp 7.750% 01-Oct-2021 109,486 0.01 275,000 Springleaf Finance Corp 8.250% 01-Oct-2023 295,252 0.03 445,000 Springleaf Finance Corp 8.875% 01-Jun-2025 476,562 0.05 600,000 Standard Chartered Plc ‘144A’ FRN (Perpetual)
7.014% 30-Jul-2037 669,819 0.07 406,000 Starwood Property Trust Inc 4.750% 15-Mar-2025 370,940 0.04 520,000 Starwood Property Trust Inc 5.000% 15-Dec-2021 505,864 0.06 2,078 Stearns Holdings LLC / Stearns Co-Issuer Inc ‘144A’
5.000% 05-Nov-2024 11,180 0.00 79,000 Stearns Holdings, Inc 9.375% 15-Aug-2020 – – 325,000 Synovus Financial Corp FRN 5.900% 07-Feb-2029 318,713 0.04 291,000 TMX Finance LLC / TitleMax Finance Corp ‘144A’
11.125% 01-Apr-2023 244,046 0.03 570,000 UniCredit SpA ‘144A’ FRN 5.861% 19-Jun-2032 599,722 0.07 864,000 UniCredit SpA ‘144A’ FRN 7.296% 02-Apr-2034 982,217 0.11 340,000 Uniti Group LP / Uniti Fiber Holdings Inc /
CSL Capital LLC ‘144A’ 7.125% 15-Dec-2024 312,159 0.03 375,000 Uniti Group LP / Uniti Fiber Holdings Inc /
CSL Capital LLC ‘144A’ 7.875% 15-Feb-2025 381,238 0.04 300,000 Uniti Group LP / Uniti Group Finance Inc /
CSL Capital LLC 8.250% 15-Oct-2023 284,437 0.03 840,000 Uniti Group LP / Uniti Group Finance Inc /
CSL Capital LLC ‘144A’ 6.000% 15-Apr-2023 821,625 0.09 455,000 USI Inc/NY ‘144A’ 6.875% 01-May-2025 460,399 0.05
Bonds cont’d.
Financials cont’d.
Bonds cont’d.
Financials cont’d.
USDUSD
03613-1A.indd 124 19/08/2020 19:00

125
Schedule of investments – as at 30 June 2020
Holdings Description
Fair value
Total net assets
% Holdings Description
Fair value
Total net assets
%
BNy MELLON EFFICIENT U.S. HIGH yIELD BETA FUND
94,000 Graphic Packaging International LLC 4.125% 15-Aug-2024 97,398 0.01
185,000 Graphic Packaging International LLC 4.875% 15-Nov-2022 191,663 0.02
100,000 Graphic Packaging International LLC ‘144A’ 3.500% 15-Mar-2028 99,470 0.01
240,000 Great Lakes Dredge & Dock Corp 8.000% 15-May-2022 246,844 0.03 520,000 Greif Inc ‘144A’ 6.500% 01-Mar-2027 530,496 0.06 250,000 Griffon Corp 5.750% 01-Mar-2028 247,500 0.03 988,000 Grinding Media Inc / Moly-Cop AltaSteel Ltd ‘144A’
7.375% 15-Dec-2023 986,138 0.11 450,000 Harsco Corp ‘144A’ 5.750% 31-Jul-2027 452,263 0.05 1,253,000 Hillenbrand Inc 4.500% 15-Sep-2026 1,259,653 0.14 244,000 Hillman Group Inc/The ‘144A’ 6.375% 15-Jul-2022 226,062 0.03 295,000 Husky III Holding Ltd ‘144A’ 13.000% 15-Feb-2025 284,859 0.03 437,000 Ingram Micro Inc 5.000% 10-Aug-2022 437,219 0.05 485,000 Ingram Micro Inc 5.450% 15-Dec-2024 489,437 0.05 268,000 Itron Inc ‘144A’ 5.000% 15-Jan-2026 267,949 0.03 100,000 James Hardie International Finance DAC ‘144A’
4.750% 15-Jan-2025 102,115 0.01 85,000 JELD-WEN Inc ‘144A’ 4.625% 15-Dec-2025 81,910 0.01 292,000 JELD-WEN Inc ‘144A’ 4.875% 15-Dec-2027 281,360 0.03 511,000 Kenan Advantage Group Inc/The ‘144A’
7.875% 31-Jul-2023 451,543 0.05 669,000 Koppers Inc ‘144A’ 6.000% 15-Feb-2025 652,683 0.07 220,000 Kratos Defense & Security Solutions Inc ‘144A’
6.500% 30-Nov-2025 229,052 0.03 140,000 LABL Escrow Issuer LLC ‘144A’ 6.750% 15-Jul-2026 145,972 0.02 490,000 LABL Escrow Issuer LLC ‘144A’ 10.500% 15-Jul-2027 521,742 0.06 275,000 Leonardo US Holdings Inc ‘144A’ 6.250% 15-Jan-2040 306,519 0.03 249,000 Louisiana-Pacific Corp 4.875% 15-Sep-2024 251,827 0.03 530,000 LSB Industries Inc ‘144A’ 9.625% 01-May-2023 512,168 0.06 230,000 Manitowoc Co Inc/The ‘144A’ 9.000% 01-Apr-2026 228,382 0.03 78,000 Masonite International Corp ‘144A’
5.375% 01-Feb-2028 79,887 0.01 313,000 Masonite International Corp ‘144A’
5.750% 15-Sep-2026 323,504 0.04 314,000 MasTec Inc 4.875% 15-Mar-2023 312,790 0.03 244,000 Matthews International Corp ‘144A’
5.250% 01-Dec-2025 220,489 0.02 935,000 Mauser Packaging Solutions Holding Co ‘144A’
5.500% 15-Apr-2024 920,379 0.10 1,228,000 Mauser Packaging Solutions Holding Co ‘144A’
7.250% 15-Apr-2025 1,117,161 0.12 601,000 Maxim Crane Works Holdings Capital LLC ‘144A’
10.125% 01-Aug-2024 592,619 0.07 285,000 Moog Inc ‘144A’ 4.250% 15-Dec-2027 277,163 0.03 217,000 Mueller Water Products Inc ‘144A’
5.500% 15-Jun-2026 225,368 0.03 560,000 New Enterprise Stone & Lime Co Inc ‘144A’
6.250% 15-Mar-2026 564,794 0.06 105,000 New Enterprise Stone & Lime Co Inc ‘144A’
10.125% 01-Apr-2022 104,844 0.01 275,000 Norbord Inc ‘144A’ 5.750% 15-Jul-2027 281,479 0.03 426,000 Norbord Inc ‘144A’ 6.250% 15-Apr-2023 448,942 0.05 85,000 Northwest Hardwoods Inc ‘144A’
7.500% 01-Aug-2021 31,025 0.00 207,000 OI European Group BV ‘144A’ 4.000% 15-Mar-2023 204,635 0.02 25,000 Owens-Brockway Glass Container Inc ‘144A’
5.375% 15-Jan-2025 25,341 0.00
754,000 Bombardier Inc ‘144A’ 6.125% 15-Jan-2023 519,355 0.06 100,000 Bombardier Inc ‘144A’ 7.450% 01-May-2034 61,403 0.01 740,000 Bombardier Inc ‘144A’ 7.500% 01-Dec-2024 486,628 0.05 575,000 Bombardier Inc ‘144A’ 7.500% 15-Mar-2025 377,042 0.04 1,446,000 Bombardier Inc ‘144A’ 7.875% 15-Apr-2027 949,567 0.11 800,000 Bombardier Inc ‘144A’ 8.750% 01-Dec-2021 653,828 0.07 960,000 Brand Industrial Services Inc ‘144A’
8.500% 15-Jul-2025 866,990 0.10 405,000 Builders FirstSource Inc ‘144A’ 5.000% 01-Mar-2030 381,650 0.04 773,000 Builders FirstSource Inc ‘144A’ 6.750% 01-Jun-2027 793,628 0.09 580,000 BWX Technologies Inc ‘144A’ 4.125% 30-Jun-2028 580,725 0.06 350,000 BWX Technologies Inc ‘144A’ 5.375% 15-Jul-2026 361,879 0.04 135,000 Cargo Aircraft Management Inc ‘144A’
4.750% 01-Feb-2028 134,156 0.02 150,000 Cascades Inc/Cascades USA Inc ‘144A’
5.125% 15-Jan-2026 152,719 0.02 45,000 Clean Harbors Inc ‘144A’ 4.875% 15-Jul-2027 46,314 0.01 120,000 Clean Harbors Inc ‘144A’ 5.125% 15-Jul-2029 124,811 0.01 351,000 Cleaver-Brooks Inc ‘144A’ 7.875% 01-Mar-2023 298,752 0.03 300,000 Colfax Corp ‘144A’ 6.000% 15-Feb-2024 310,156 0.03 460,000 Colfax Corp ‘144A’ 6.375% 15-Feb-2026 481,420 0.05 455,000 Cornerstone Building Brands Inc ‘144A’
8.000% 15-Apr-2026 459,848 0.05 33,000 Covanta Holding Corp 5.875% 01-Mar-2024 33,409 0.00 200,000 Covanta Holding Corp 5.875% 01-Jul-2025 203,229 0.02 179,000 Covanta Holding Corp 6.000% 01-Jan-2027 181,893 0.02 918,000 Crown Americas LLC / Crown Americas Capital
Corp IV 4.500% 15-Jan-2023 943,810 0.11 492,000 Crown Americas LLC / Crown Americas Capital
Corp V 4.250% 30-Sep-2026 504,822 0.06 846,000 Crown Americas LLC / Crown Americas Capital
Corp VI 4.750% 01-Feb-2026 865,111 0.10 260,000 Crown Cork & Seal Co Inc 7.375% 15-Dec-2026 305,126 0.03 685,000 Energizer Holdings Inc ‘144A’ 5.500% 15-Jun-2025 708,225 0.08 494,000 Energizer Holdings Inc ‘144A’ 6.375% 15-Jul-2026 512,016 0.06 300,000 Energizer Holdings Inc ‘144A’ 7.750% 15-Jan-2027 320,576 0.04 405,000 EnerSys ‘144A’ 5.000% 30-Apr-2023 416,601 0.05 345,000 EnPro Industries Inc 5.750% 15-Oct-2026 346,228 0.04 345,000 F-Brasile SpA / F-Brasile US LLC ‘144A’
7.375% 15-Aug-2026 266,409 0.03 670,000 Flex Acquisition Co Inc ‘144A’ 6.875% 15-Jan-2025 648,637 0.07 576,000 Flex Acquisition Co Inc ‘144A’ 7.875% 15-Jul-2026 560,393 0.06 730,000 Fluor Corp 3.500% 15-Dec-2024 619,405 0.07 795,000 Fluor Corp 4.250% 15-Sep-2028 684,694 0.08 375,000 Fly Leasing Ltd 5.250% 15-Oct-2024 305,117 0.03 555,000 Fortress Transportation and Infrastructure
Investors LLC ‘144A’ 6.500% 01-Oct-2025 501,640 0.06 740,000 Fortress Transportation and Infrastructure
Investors LLC ‘144A’ 6.750% 15-Mar-2022 712,387 0.08 330,000 frontdoor Inc ‘144A’ 6.750% 15-Aug-2026 351,800 0.04 377,000 FXI Holdings Inc ‘144A’ 7.875% 01-Nov-2024 325,394 0.04 172,000 FXI Holdings Inc ‘144A’ 12.250% 15-Nov-2026 167,350 0.02 420,000 Gates Global LLC / Gates Corp ‘144A’
6.250% 15-Jan-2026 413,351 0.05 225,000 GFL Environmental Inc ‘144A’ 4.250% 01-Jun-2025 227,391 0.03 215,000 GFL Environmental Inc ‘144A’ 5.125% 15-Dec-2026 223,063 0.02 529,000 GFL Environmental Inc ‘144A’ 7.000% 01-Jun-2026 549,398 0.06 297,000 GFL Environmental Inc ‘144A’ 8.500% 01-May-2027 323,675 0.04 20,000 Global Ship Lease Inc ‘144A’ 9.875% 15-Nov-2022 18,833 0.00 223,000 Granite US Holdings Corp ‘144A’ 11.000% 01-Oct-2027 217,522 0.02
Bonds cont’d.
Industrials cont’d.
Bonds cont’d.
Industrials cont’d.
USDUSD
03613-1A.indd 125 19/08/2020 19:00

126
Schedule of investments – as at 30 June 2020
Holdings Description
Fair value
Total net assets
% Holdings Description
Fair value
Total net assets
%
BNy MELLON EFFICIENT U.S. HIGH yIELD BETA FUND
351,000 Tennant Co 5.625% 01-May-2025 355,789 0.04 1,036,000 Terex Corp ‘144A’ 5.625% 01-Feb-2025 947,940 0.11 270,000 Tervita Corp ‘144A’ 7.625% 01-Dec-2021 212,710 0.02 1,120,000 Titan Acquisition Ltd / Titan Co-Borrower LLC ‘144A’
7.750% 15-Apr-2026 1,063,054 0.12 495,000 TopBuild Corp ‘144A’ 5.625% 01-May-2026 501,712 0.06 2,160,000 TransDigm Inc 5.500% 15-Nov-2027 1,891,026 0.21 1,258,000 TransDigm Inc 6.375% 15-Jun-2026 1,150,114 0.13 888,000 TransDigm Inc 6.500% 15-Jul-2024 850,167 0.09 780,000 TransDigm Inc 6.500% 15-May-2025 731,402 0.08 975,000 TransDigm Inc 7.500% 15-Mar-2027 937,160 0.10 3,463,000 TransDigm Inc ‘144A’ 6.250% 15-Mar-2026 3,460,385 0.39 341,000 TransDigm Inc ‘144A’ 8.000% 15-Dec-2025 359,879 0.04 850,000 TransDigm UK Holdings Plc 6.875% 15-May-2026 793,526 0.09 70,000 Trident TPI Holdings Inc ‘144A’ 6.625% 01-Nov-2025 66,755 0.01 195,000 Trident TPI Holdings Inc ‘144A’ 9.250% 01-Aug-2024 200,464 0.02 76,000 TriMas Corp ‘144A’ 4.875% 15-Oct-2025 76,345 0.01 499,000 Trinity Industries Inc 4.550% 01-Oct-2024 501,037 0.06 200,000 Triumph Group Inc 5.250% 01-Jun-2022 171,703 0.02 630,000 Triumph Group Inc 7.750% 15-Aug-2025 476,437 0.05 292,000 Triumph Group Inc ‘144A’ 6.250% 15-Sep-2024 248,778 0.03 680,000 Trivium Packaging Finance BV ‘144A’
5.500% 15-Aug-2026 689,350 0.08 315,000 Trivium Packaging Finance BV ‘144A’
8.500% 15-Aug-2027 337,385 0.04 225,000 TTM Technologies Inc ‘144A’ 5.625% 01-Oct-2025 223,993 0.03 283,000 Tutor Perini Corp ‘144A’ 6.875% 01-May-2025 270,442 0.03 442,000 US Concrete Inc 6.375% 01-Jun-2024 437,626 0.05 305,000 Waste Pro USA Inc ‘144A’ 5.500% 15-Feb-2026 292,005 0.03 750 Watco Cos LLC / Watco Finance Corp ‘144A’
6.375% 01-Apr-2023 760 0.00 206,000 Weekley Homes LLC / Weekley Finance Corp
6.000% 01-Feb-2023 205,206 0.02 385,000 Weekley Homes LLC / Weekley Finance Corp
6.625% 15-Aug-2025 389,291 0.04 315,000 Welbilt Inc 9.500% 15-Feb-2024 302,400 0.03 20,000 Werner FinCo LP / Werner FinCo Inc ‘144A’
8.750% 15-Jul-2025 17,073 0.00 401,000 WESCO Distribution Inc 5.375% 15-Jun-2024 400,541 0.04 509,000 XPO CNW Inc 6.700% 01-May-2034 525,148 0.06 396,000 XPO Logistics Inc ‘144A’ 6.125% 01-Sep-2023 401,982 0.04 1,392,000 XPO Logistics Inc ‘144A’ 6.250% 01-May-2025 1,460,730 0.16 250,000 XPO Logistics Inc ‘144A’ 6.500% 15-Jun-2022 250,869 0.03 930,000 XPO Logistics Inc ‘144A’ 6.750% 15-Aug-2024 976,691 0.11
Technology - 40,090,230 (31 December 2019: 30,789,588) 40,090,230 4.47
270,000 ACI Worldwide Inc ‘144A’ 5.750% 15-Aug-2026 282,234 0.03 250,000 Advanced Micro Devices Inc 7.500% 15-Aug-2022 277,129 0.03 346,000 Amkor Technology Inc ‘144A’ 6.625% 15-Sep-2027 371,149 0.04 875,000 Ascend Learning LLC ‘144A’ 6.875% 01-Aug-2025 884,643 0.10 300,000 Ascend Learning LLC ‘144A’ 6.875% 01-Aug-2025 302,594 0.03 1,145,000 Banff Merger Sub Inc ‘144A’ 9.750% 01-Sep-2026 1,154,801 0.13 259,000 Blackboard Inc ‘144A’ 10.375% 15-Nov-2024 253,334 0.03 358,000 Booz Allen Hamilton Inc ‘144A’ 5.125% 01-May-2025 364,675 0.04 115,000 Boxer Parent Co Inc ‘144A’ 7.125% 02-Oct-2025 120,793 0.01 215,000 Camelot Finance SA ‘144A’ 4.500% 01-Nov-2026 215,503 0.02 383,000 Castle US Holding Corp ‘144A’ 9.500% 15-Feb-2028 355,173 0.04 535,000 CDK Global Inc 4.875% 01-Jun-2027 550,437 0.06 285,000 CDK Global Inc 5.000% 15-Oct-2024 302,986 0.03
520,000 Owens-Brockway Glass Container Inc ‘144A’ 5.875% 15-Aug-2023 536,955 0.06
100,000 Owens-Brockway Glass Container Inc ‘144A’ 6.375% 15-Aug-2025 106,062 0.01
100,000 Owens-Brockway Glass Container Inc ‘144A’ 6.625% 13-May-2027 104,187 0.01
395,000 Pactiv LLC 7.950% 15-Dec-2025 422,115 0.05 370,000 Pactiv LLC 8.375% 15-Apr-2027 402,767 0.04 288,000 Park-Ohio Industries Inc 6.625% 15-Apr-2027 237,185 0.03 180,000 Patrick Industries Inc ‘144A’ 7.500% 15-Oct-2027 185,928 0.02 300,000 PGT Innovations Inc ‘144A’ 6.750% 01-Aug-2026 304,068 0.03 1,020,000 Plastipak Holdings Inc ‘144A’ 6.250% 15-Oct-2025 992,587 0.11 115,000 PowerTeam Services LLC ‘144A’
9.033% 04-Dec-2025 117,803 0.01 600,000 RBS Global Inc / Rexnord LLC ‘144A’
4.875% 15-Dec-2025 604,869 0.07 1,698,000 Reynolds Group Issuer Inc / Reynolds Group
Issuer LLC / Reynolds Group Issuer Lu ‘144A’ 5.125% 15-Jul-2023 1,713,307 0.19
630,000 Reynolds Group Issuer Inc / Reynolds Group Issuer LLC / Reynolds Group Issuer Lu ‘144A’ 7.000% 15-Jul-2024 633,248 0.07
510,000 Sealed Air Corp ‘144A’ 4.875% 01-Dec-2022 525,818 0.06 440,000 Sealed Air Corp ‘144A’ 5.125% 01-Dec-2024 471,075 0.05 354,000 Sealed Air Corp ‘144A’ 5.250% 01-Apr-2023 371,383 0.04 410,000 Sealed Air Corp ‘144A’ 5.500% 15-Sep-2025 442,244 0.05 500,000 Sealed Air Corp ‘144A’ 6.875% 15-Jul-2033 593,030 0.07 718,000 Sensata Technologies BV ‘144A’ 4.875% 15-Oct-2023 747,535 0.08 215,000 Sensata Technologies BV ‘144A’ 5.000% 01-Oct-2025 229,471 0.03 125,000 Sensata Technologies BV ‘144A’ 5.625% 01-Nov-2024 132,956 0.01 215,000 Sensata Technologies Inc ‘144A’ 4.375% 15-Feb-2030 213,394 0.02 360,000 Signature Aviation US Holdings Inc ‘144A’
4.000% 01-Mar-2028 325,958 0.04 291,000 Signature Aviation US Holdings Inc ‘144A’
5.375% 01-May-2026 292,049 0.03 621,000 Silgan Holdings Inc ‘144A’ 4.125% 01-Feb-2028 617,119 0.07 220,000 Spirit AeroSystems Inc 3.850% 15-Jun-2026 201,300 0.02 430,000 Spirit AeroSystems Inc 3.950% 15-Jun-2023 365,500 0.04 850,000 Spirit AeroSystems Inc 4.600% 15-Jun-2028 689,626 0.08 100,000 Spirit AeroSystems Inc ‘144A’ 7.500% 15-Apr-2025 99,062 0.01 231,000 SPX FLOW Inc ‘144A’ 5.625% 15-Aug-2024 237,039 0.03 205,000 SPX FLOW Inc ‘144A’ 5.875% 15-Aug-2026 210,342 0.02 630,000 SSL Robotics LLC ‘144A’ 9.750% 31-Dec-2023 675,675 0.08 940,000 Standard Industries Inc/NJ ‘144A’
4.750% 15-Jan-2028 955,656 0.11 540,000 Standard Industries Inc/NJ ‘144A’
5.000% 15-Feb-2027 548,319 0.06 350,000 Standard Industries Inc/NJ ‘144A’
5.375% 15-Nov-2024 360,715 0.04 1,350,000 Standard Industries Inc/NJ ‘144A’
6.000% 15-Oct-2025 1,393,720 0.16 410,000 Stericycle Inc ‘144A’ 5.375% 15-Jul-2024 421,275 0.05 501,000 Stevens Holding Co Inc ‘144A’ 6.125% 01-Oct-2026 525,329 0.06 250,000 Summit Materials LLC / Summit Materials
Finance Corp 6.125% 15-Jul-2023 249,279 0.03 284,000 Summit Materials LLC / Summit Materials
Finance Corp ‘144A’ 5.125% 01-Jun-2025 281,485 0.03 195,000 Summit Materials LLC / Summit Materials
Finance Corp ‘144A’ 6.500% 15-Mar-2027 200,082 0.02 300,000 Teekay Corp ‘144A’ 9.250% 15-Nov-2022 289,054 0.03
Bonds cont’d.
Industrials cont’d.
Bonds cont’d.
Industrials cont’d.
USDUSD
03613-1A.indd 126 19/08/2020 19:00

127
Schedule of investments – as at 30 June 2020
Holdings Description
Fair value
Total net assets
% Holdings Description
Fair value
Total net assets
%
BNy MELLON EFFICIENT U.S. HIGH yIELD BETA FUND
201,000 RP Crown Parent LLC ‘144A’ 7.375% 15-Oct-2024 201,230 0.02 125,000 Science Applications International Corp ‘144A’
4.875% 01-Apr-2028 124,472 0.01 810,000 Sensata Technologies UK Financing Co Plc ‘144A’
6.250% 15-Feb-2026 842,250 0.09 2,075,000 Solera LLC / Solera Finance Inc ‘144A’
10.500% 01-Mar-2024 2,115,535 0.24 1,605,000 SS&C Technologies Inc ‘144A’ 5.500% 30-Sep-2027 1,635,808 0.18 905,000 Tempo Acquisition LLC / Tempo Acquisition
Finance Corp ‘144A’ 6.750% 01-Jun-2025 919,132 0.10 720,000 Vericast Corp ‘144A’ 8.375% 15-Aug-2022 611,269 0.07 385,550 Vericast Corp/Harland Clarke/Checks in the Mail/
Valassis Comm/Valassis Direct ‘144A’ 12.500% 01-May-2024 396,153 0.04
290,000 Veritas US Inc / Veritas Bermuda Ltd ‘144A’ 7.500% 01-Feb-2023 286,707 0.03
710,000 Veritas US Inc / Veritas Bermuda Ltd ‘144A’ 10.500% 01-Feb-2024 638,038 0.07
1,704,000 Western Digital Corp 4.750% 15-Feb-2026 1,763,623 0.20 927,000 Xerox Corp 3.800% 15-May-2024 904,886 0.10 160,000 Xerox Corp 4.070% 17-Mar-2022 159,362 0.02 1,100,000 Xerox Corp 4.125% 15-Mar-2023 1,101,771 0.12 400,000 Xerox Corp 4.800% 01-Mar-2035 374,634 0.04 175,000 Xerox Corp 6.750% 15-Dec-2039 182,139 0.02
Utilities - 19,538,586 (31 December 2019: 16,329,380) 19,538,586 2.18
365,000 AES Corp/The 5.125% 01-Sep-2027 379,532 0.04 26,000 AES Corp/The 5.500% 15-Apr-2025 26,765 0.00 515,000 AES Corp/The 6.000% 15-May-2026 536,148 0.06 250,000 AmeriGas Partners LP / AmeriGas Finance Corp
5.500% 20-May-2025 258,279 0.03 694,000 AmeriGas Partners LP / AmeriGas Finance Corp
5.625% 20-May-2024 721,975 0.08 579,000 AmeriGas Partners LP / AmeriGas Finance Corp
5.750% 20-May-2027 613,974 0.07 70,000 AmeriGas Partners LP / AmeriGas Finance Corp
5.875% 20-Aug-2026 74,012 0.01 505,000 Calpine Corp 5.500% 01-Feb-2024 505,311 0.06 876,000 Calpine Corp 5.750% 15-Jan-2025 887,314 0.10 339,000 Calpine Corp ‘144A’ 4.500% 15-Feb-2028 331,095 0.04 920,000 Calpine Corp ‘144A’ 5.125% 15-Mar-2028 903,555 0.10 862,000 Calpine Corp ‘144A’ 5.250% 01-Jun-2026 872,874 0.10 258,000 Clearway Energy Operating LLC 5.000% 15-Sep-2026 262,143 0.03 639,000 Clearway Energy Operating LLC 5.750% 15-Oct-2025 661,432 0.07 100,000 Clearway Energy Operating LLC ‘144A’
4.750% 15-Mar-2028 102,088 0.01 274,000 DPL Inc 4.350% 15-Apr-2029 277,917 0.03 97,000 DPL Inc 7.250% 15-Oct-2021 103,414 0.01 470,000 Drax Finco Plc ‘144A’ 6.625% 01-Nov-2025 482,974 0.05 465,000 InterGen NV ‘144A’ 7.000% 30-Jun-2023 450,469 0.05 68,374 Midland Cogeneration Venture LP ‘144A’
6.000% 15-Mar-2025 70,503 0.01 235,000 NextEra Energy Operating Partners LP ‘144A’
3.875% 15-Oct-2026 235,210 0.03 359,000 NextEra Energy Operating Partners LP ‘144A’
4.250% 15-Jul-2024 363,750 0.04 481,000 NextEra Energy Operating Partners LP ‘144A’
4.250% 15-Sep-2024 485,120 0.05
565,000 CDK Global Inc 5.875% 15-Jun-2026 588,128 0.07 320,000 CDK Global Inc ‘144A’ 5.250% 15-May-2029 332,595 0.04 510,000 CDW LLC / CDW Finance Corp 4.125% 01-May-2025 512,869 0.06 538,000 CDW LLC / CDW Finance Corp 4.250% 01-Apr-2028 549,161 0.06 245,000 CDW LLC / CDW Finance Corp 5.000% 01-Sep-2025 252,682 0.03 550,000 CDW LLC / CDW Finance Corp 5.500% 01-Dec-2024 599,442 0.07 1,015,000 Change Healthcare Holdings LLC / Change
Healthcare Finance Inc ‘144A’ 5.750% 01-Mar-2025 1,004,667 0.11 253,000 Dell Inc 5.400% 10-Sep-2040 256,364 0.03 860,000 Dell Inc 6.500% 15-Apr-2038 931,058 0.10 250,000 Dell International LLC / EMC Corp ‘144A’
5.875% 15-Jun-2021 250,466 0.03 450,000 Dell International LLC / EMC Corp ‘144A’
7.125% 15-Jun-2024 466,622 0.05 310,000 Diebold Nixdorf Inc 8.500% 15-Apr-2024 246,805 0.03 306,000 Donnelley Financial Solutions Inc
8.250% 15-Oct-2024 302,553 0.03 851,000 Dun & Bradstreet Corp/The ‘144A’
6.875% 15-Aug-2026 899,001 0.10 647,000 Dun & Bradstreet Corp/The ‘144A’
10.250% 15-Feb-2027 719,668 0.08 609,000 EMC Corp 3.375% 01-Jun-2023 617,901 0.07 303,000 Entegris Inc ‘144A’ 4.375% 15-Apr-2028 309,818 0.03 405,000 Entegris Inc ‘144A’ 4.625% 10-Feb-2026 412,011 0.05 108,000 Everi Payments Inc ‘144A’ 7.500% 15-Dec-2025 103,804 0.01 625,000 Exela Intermediate LLC / Exela Finance Inc ‘144A’
10.000% 15-Jul-2023 154,687 0.02 632,000 Fair Isaac Corp ‘144A’ 4.000% 15-Jun-2028 635,160 0.07 180,000 Fair Isaac Corp ‘144A’ 5.250% 15-May-2026 196,841 0.02 275,000 Genesys Telecommunications Laboratories Inc/
Greeneden Lux 3 Sarl/Greeneden US Ho ‘144A’ 10.000% 30-Nov-2024 286,716 0.03
170,000 Granite Merger Sub 2 Inc ‘144A’ 11.000% 15-Jul-2027 176,726 0.02 690,000 j2 Cloud Services LLC / j2 Cloud Co-Obligor Inc ‘144A’
6.000% 15-Jul-2025 703,872 0.08 440,000 Marble II Pte Ltd ‘REGS’ 5.300% 20-Jun-2022 435,584 0.05 85,000 MSCI Inc ‘144A’ 3.625% 01-Sep-2030 84,721 0.01 740,000 MSCI Inc ‘144A’ 4.000% 15-Nov-2029 756,051 0.08 567,000 MSCI Inc ‘144A’ 4.750% 01-Aug-2026 588,203 0.07 466,000 MSCI Inc ‘144A’ 5.375% 15-May-2027 495,896 0.05 190,000 MTS Systems Corp ‘144A’ 5.750% 15-Aug-2027 175,001 0.02 445,000 NCR Corp 5.000% 15-Jul-2022 445,140 0.05 405,000 NCR Corp 6.375% 15-Dec-2023 412,636 0.05 414,000 NCR Corp ‘144A’ 5.750% 01-Sep-2027 414,944 0.05 300,000 NCR Corp ‘144A’ 6.125% 01-Sep-2029 299,757 0.03 410,000 NCR Corp ‘144A’ 8.125% 15-Apr-2025 436,394 0.05 565,000 Nuance Communications Inc 5.625% 15-Dec-2026 589,241 0.07 825,000 Open Text Corp ‘144A’ 5.875% 01-Jun-2026 857,938 0.10 115,000 Open Text Holdings Inc ‘144A’ 4.125% 15-Feb-2030 113,257 0.01 222,000 Pitney Bowes Inc 4.625% 15-Mar-2024 155,978 0.02 448,000 Pitney Bowes Inc 5.125% 15-May-2022 368,935 0.04 34,000 Pitney Bowes Inc 5.700% 01-Apr-2023 25,284 0.00 254,000 Presidio Holdings Inc ‘144A’ 4.875% 01-Feb-2027 248,722 0.03 255,000 Presidio Holdings Inc ‘144A’ 8.250% 01-Feb-2028 255,797 0.03 535,000 PTC Inc ‘144A’ 3.625% 15-Feb-2025 532,325 0.06 325,000 PTC Inc ‘144A’ 4.000% 15-Feb-2028 322,602 0.04 735,000 Qorvo Inc 5.500% 15-Jul-2026 765,664 0.09 400,000 Qorvo Inc ‘144A’ 4.375% 15-Oct-2029 410,320 0.05 1,575,000 Rackspace Hosting Inc ‘144A’ 8.625% 15-Nov-2024 1,584,450 0.18 185,000 Riverbed Technology Inc ‘144A’ 8.875% 01-Mar-2023 113,313 0.01
Bonds cont’d.
Technology cont’d.
Bonds cont’d.
Technology cont’d.
USDUSD
03613-1A.indd 127 19/08/2020 19:00

128
Schedule of investments – as at 30 June 2020
Holdings Description
Fair value
Total net assets
% Holdings Description
Fair value
Total net assets
%
BNy MELLON EFFICIENT U.S. HIGH yIELD BETA FUND
600,000 NextEra Energy Operating Partners LP ‘144A’ 4.500% 15-Sep-2027 628,941 0.07
643,000 NRG Energy Inc 5.750% 15-Jan-2028 679,854 0.08 1,167,000 NRG Energy Inc 6.625% 15-Jan-2027 1,219,807 0.14 697,000 NRG Energy Inc 7.250% 15-May-2026 736,949 0.08 736,000 NRG Energy Inc ‘144A’ 5.250% 15-Jun-2029 774,504 0.09 700,000 Rockpoint Gas Storage Canada Ltd ‘144A’
7.000% 31-Mar-2023 644,059 0.07 730,000 Talen Energy Supply LLC 6.500% 01-Jun-2025 484,461 0.05 100,000 Talen Energy Supply LLC ‘144A’ 6.625% 15-Jan-2028 98,168 0.01 400,000 Talen Energy Supply LLC ‘144A’ 7.250% 15-May-2027 398,676 0.04 781,000 Talen Energy Supply LLC ‘144A’ 10.500% 15-Jan-2026 619,259 0.07 275,000 Terraform Global Operating LLC ‘144A’
6.125% 01-Mar-2026 271,854 0.03 255,000 TransAlta Corp 4.500% 15-Nov-2022 258,390 0.03 421,000 TransAlta Corp 6.500% 15-Mar-2040 420,371 0.05 692,000 Vistra Operations Co LLC ‘144A’ 5.000% 31-Jul-2027 700,477 0.08 937,000 Vistra Operations Co LLC ‘144A’ 5.500% 01-Sep-2026 958,874 0.11 1,010,000 Vistra Operations Co LLC ‘144A’ 5.625% 15-Feb-2027 1,038,088 0.11
Total investments in bonds 992,008,064 110.62 Unrealised gain on forward foreign currency contracts - 185,862 (see below) (31 December 2019: 4,523,271) 185,862 0.02
Total financial assets at fair value through profit or loss 1,003,456,106 111.89
Credit default swaps - (128,895) (31 December 2019: 1,430,980)
(19,760,000) CDS CDX North America High Yield Index Series 34 5.000% 20-Jun-2025 (128,895) (0.01)
Total credit default swaps (128,895) (0.01) Unrealised loss on forward foreign currency contracts - (10,946,757) (see below) (31 December 2019: (15,359)) (10,946,757) (1.22)
Total financial liabilities at fair value through profit or loss (11,075,652) (1.23)
Net current liabilities (95,599,105) (10.66)
Total net assets 896,781,349 100.00
The counterparty for credit default swaps is Goldman Sachs.
Analysis of portfolio % of Total Assets
Transferable securities and money market instruments admitted to official stock exchange listing or traded on a regulated market 97.45oTC financial derivative instruments 0.02other current assets 2.53
Total assets 100.00
Bonds cont’d.
Utilities cont’d.
USDUSD
Forward foreign currency contracts cont’d.Unrealised
Gain/(Loss)Buy Sell Amount (B) Amount (S)Settle
Date Counterparty
BNy Mellon Efficient U.S. High yield Beta Fund CHF W (Inc) (Hedged) Share ClassUS dollar Sterling 7,493,467 5,951,089 15-Jul-20 The Bank of
New York Mellon 118,788
USD 118,788
CHF 112,546
Sterling US dollar 4,246,800 5,273,559 15-Jul-20 The Bank of New York Mellon (10,861)
Sterling US dollar 2,549,900 3,212,121 15-Jul-20 The Bank of New York Mellon (52,246)
Sterling US dollar 842,900 1,076,386 15-Jul-20 The Bank of New York Mellon (31,851)
Sterling US dollar 2,446,000 3,114,109 15-Jul-20 The Bank of New York Mellon (82,989)
Sterling US dollar 255,946,144 325,309,537 15-Jul-20 The Bank of New York Mellon (8,137,230)
Sterling US dollar 14,300 17,765 15-Jul-20 The Bank of New York Mellon (45)
USD (8,315,222)
CHF (7,878,257)
Net USD (8,196,434)
Net CHF (7,765,711)
BNy Mellon Efficient U.S. High yield Beta Fund EUR E (Acc) (Hedged) Share ClassUS dollar Euro 1,089,919 963,687 15-Jul-20 The Bank of
New York Mellon 6,889
USD 6,889
EUR 6,132
Euro US dollar 450,000 506,916 15-Jul-20 The Bank of New York Mellon (1,188)
Euro US dollar 740,000 836,687 15-Jul-20 The Bank of New York Mellon (5,046)
Euro US dollar 41,054,542 46,639,248 15-Jul-20 The Bank of New York Mellon (500,504)
USD (506,738)
EUR (451,035)
Net USD (499,849)
Net EUR (444,903)
03613-1A.indd 128 19/08/2020 19:00

129
Schedule of investments – as at 30 June 2020
BNy MELLON EFFICIENT U.S. HIGH yIELD BETA FUND
Forward foreign currency contracts cont’d.Unrealised
Gain/(Loss)Buy Sell Amount (B) Amount (S)Settle
Date Counterparty
BNy Mellon Efficient U.S. High yield Beta Fund EUR H (Acc) (Hedged) Share ClassEuro US dollar 49,538 55,584 15-Jul-20 The Bank of
New York Mellon 88US dollar Euro 210,245 184,452 15-Jul-20 The Bank of
New York Mellon 2,950US dollar Euro 2,123,855 1,872,104 15-Jul-20 The Bank of
New York Mellon 19,909US dollar Euro 761,777 677,609 15-Jul-20 The Bank of
New York Mellon 253US dollar Euro 2,512,626 2,230,511 15-Jul-20 The Bank of
New York Mellon 5,889US dollar Euro 80,273 70,976 15-Jul-20 The Bank of
New York Mellon 507
USD 29,596
EUR 26,343
Euro US dollar 5,024,500 5,707,990 15-Jul-20 The Bank of New York Mellon (61,255)
US dollar Euro 893 797 15-Jul-20 The Bank of New York Mellon (2)
USD (61,257)
EUR (54,523)
Net USD (31,661)
Net EUR (28,180)
BNy Mellon Efficient U.S. High yield Beta Fund EUR K (Acc) (Hedged) Share ClassUS dollar Euro 2,620 2,316 15-Jul-20 The Bank of
New York Mellon 17
USD 17
EUR 15
Euro US dollar 100,370 114,024 15-Jul-20 The Bank of New York Mellon (1,224)
USD (1,224)
EUR (1,089)
Net USD (1,207)
Net EUR (1,074)
Forward foreign currency contracts cont’d.Unrealised
Gain/(Loss)Buy Sell Amount (B) Amount (S)Settle
Date Counterparty
BNy Mellon Efficient U.S. High yield Beta Fund EUR L (Acc) (Hedged) Share ClassEuro US dollar 136,800 153,108 15-Jul-20 The Bank of
New York Mellon 633Euro US dollar 55,610 62,334 15-Jul-20 The Bank of
New York Mellon 162Euro US dollar 30,265 33,973 15-Jul-20 The Bank of
New York Mellon 40US dollar Euro 852,231 753,527 15-Jul-20 The Bank of
New York Mellon 5,386
USD 6,221
EUR 5,537
Euro US dollar 65,313 73,551 15-Jul-20 The Bank of New York Mellon (150)
Euro US dollar 43,190 48,555 15-Jul-20 The Bank of New York Mellon (16)
Euro US dollar 98,097 110,468 15-Jul-20 The Bank of New York Mellon (223)
Euro US dollar 171,000 193,995 15-Jul-20 The Bank of New York Mellon (1,818)
Euro US dollar 36,607 41,390 15-Jul-20 The Bank of New York Mellon (250)
Euro US dollar 32,471,514 36,888,659 15-Jul-20 The Bank of New York Mellon (395,866)
USD (398,323)
EUR (354,537)
Net USD (392,102)
Net EUR (349,000)
BNy Mellon Efficient U.S. High yield Beta Fund EUR W (Inc) (Hedged) Share ClassUS dollar Euro 41,941 37,084 15-Jul-20 The Bank of
New York Mellon 265
USD 265
EUR 236
Euro US dollar 1,607,543 1,826,220 15-Jul-20 The Bank of New York Mellon (19,598)
USD (19,598)
EUR (17,444)
Net USD (19,333)
Net EUR (17,208)
03613-1A.indd 129 19/08/2020 19:00
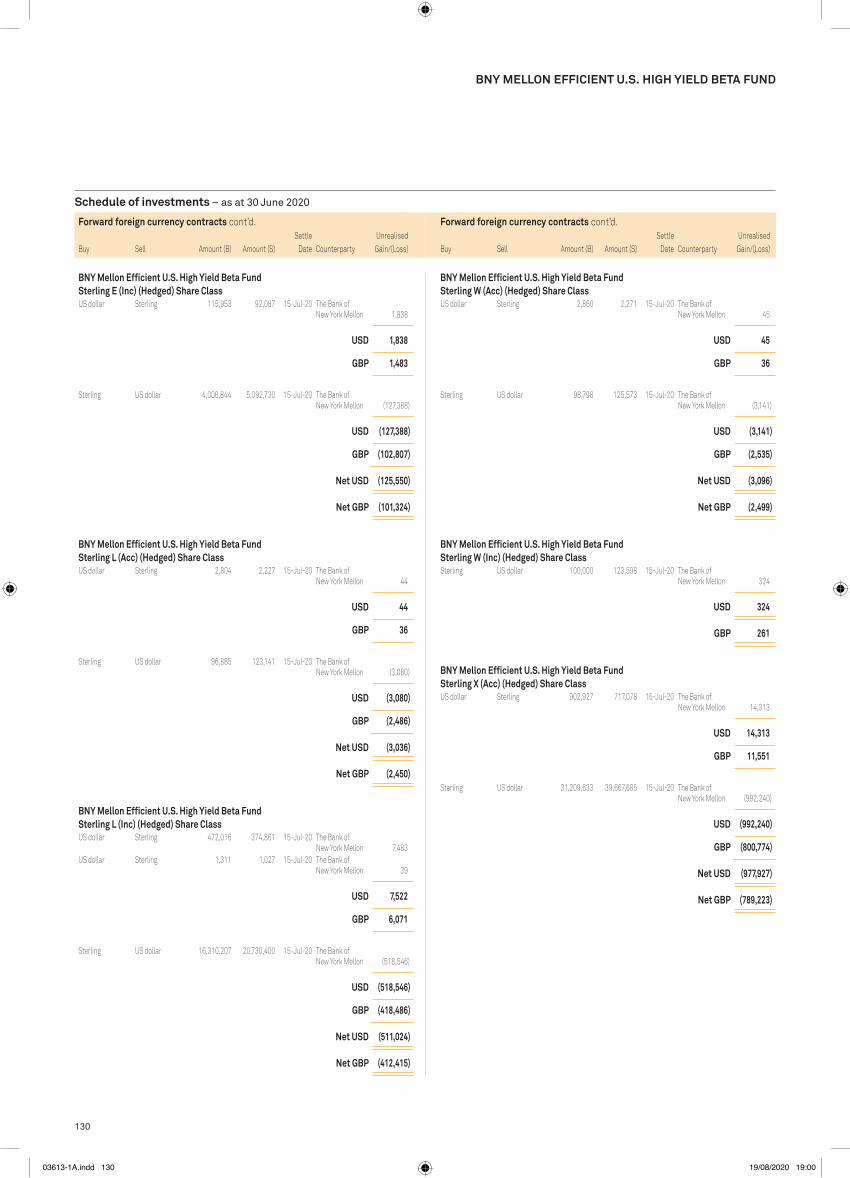
130
Schedule of investments – as at 30 June 2020
BNy MELLON EFFICIENT U.S. HIGH yIELD BETA FUND
Forward foreign currency contracts cont’d.Unrealised
Gain/(Loss)Buy Sell Amount (B) Amount (S)Settle
Date Counterparty
BNy Mellon Efficient U.S. High yield Beta Fund Sterling W (Acc) (Hedged) Share ClassUS dollar Sterling 2,860 2,271 15-Jul-20 The Bank of
New York Mellon 45
USD 45
GBp 36
Sterling US dollar 98,798 125,573 15-Jul-20 The Bank of New York Mellon (3,141)
USD (3,141)
GBp (2,535)
Net USD (3,096)
Net GBp (2,499)
BNy Mellon Efficient U.S. High yield Beta Fund Sterling W (Inc) (Hedged) Share ClassSterling US dollar 100,000 123,598 15-Jul-20 The Bank of
New York Mellon 324
USD 324
GBp 261
BNy Mellon Efficient U.S. High yield Beta Fund Sterling x (Acc) (Hedged) Share ClassUS dollar Sterling 902,927 717,078 15-Jul-20 The Bank of
New York Mellon 14,313
USD 14,313
GBp 11,551
Sterling US dollar 31,209,633 39,667,685 15-Jul-20 The Bank of New York Mellon (992,240)
USD (992,240)
GBp (800,774)
Net USD (977,927)
Net GBp (789,223)
Forward foreign currency contracts cont’d.Unrealised
Gain/(Loss)Buy Sell Amount (B) Amount (S)Settle
Date Counterparty
BNy Mellon Efficient U.S. High yield Beta Fund Sterling E (Inc) (Hedged) Share ClassUS dollar Sterling 115,953 92,087 15-Jul-20 The Bank of
New York Mellon 1,838
USD 1,838
GBp 1,483
Sterling US dollar 4,006,844 5,092,730 15-Jul-20 The Bank of New York Mellon (127,388)
USD (127,388)
GBp (102,807)
Net USD (125,550)
Net GBp (101,324)
BNy Mellon Efficient U.S. High yield Beta Fund Sterling L (Acc) (Hedged) Share ClassUS dollar Sterling 2,804 2,227 15-Jul-20 The Bank of
New York Mellon 44
USD 44
GBp 36
Sterling US dollar 96,885 123,141 15-Jul-20 The Bank of New York Mellon (3,080)
USD (3,080)
GBp (2,486)
Net USD (3,036)
Net GBp (2,450)
BNy Mellon Efficient U.S. High yield Beta Fund Sterling L (Inc) (Hedged) Share ClassUS dollar Sterling 472,016 374,861 15-Jul-20 The Bank of
New York Mellon 7,483US dollar Sterling 1,311 1,027 15-Jul-20 The Bank of
New York Mellon 39
USD 7,522
GBp 6,071
Sterling US dollar 16,310,207 20,730,400 15-Jul-20 The Bank of New York Mellon (518,546)
USD (518,546)
GBp (418,486)
Net USD (511,024)
Net GBp (412,415)
03613-1A.indd 130 19/08/2020 19:00
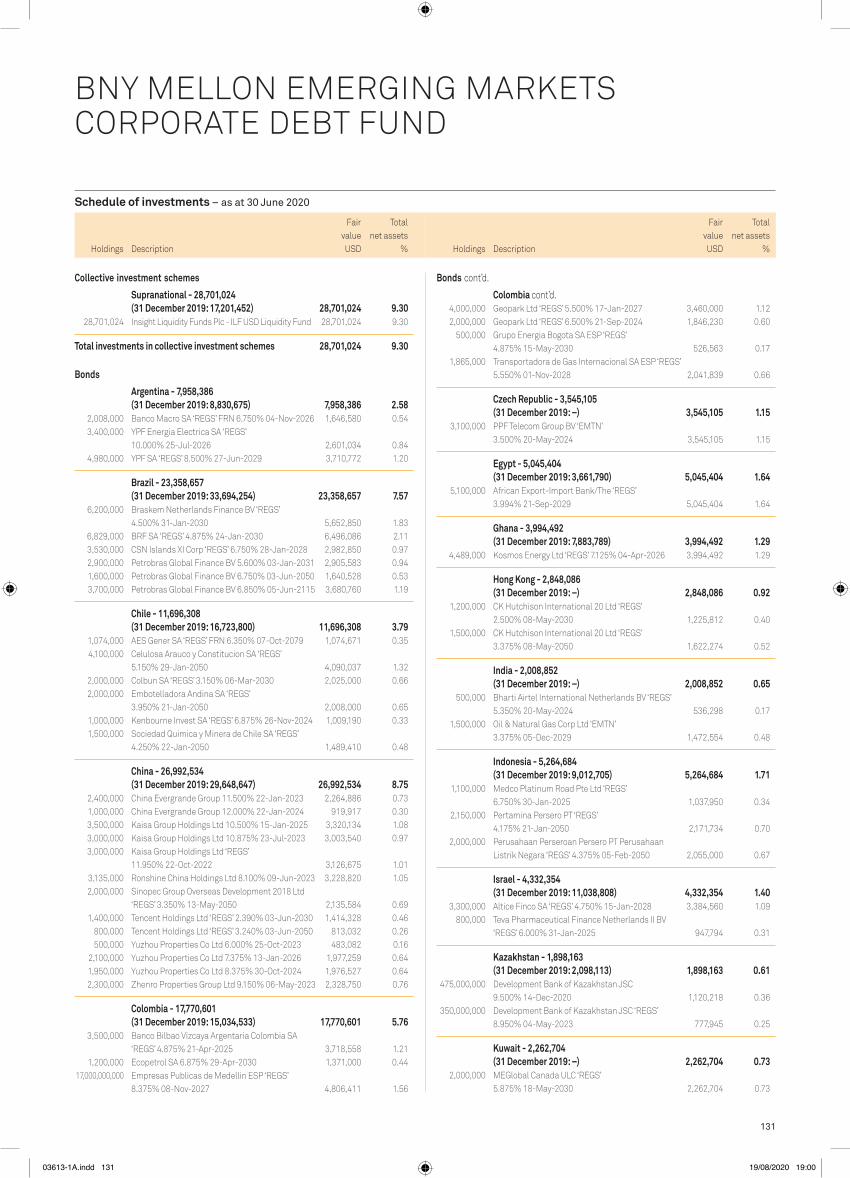
131
Schedule of investments – as at 30 June 2020
Holdings Description
Fair value
Total net assets
% Holdings Description
Fair value
Total net assets
%
FUND 13 – BNy MELLON EMERGING MARKETS CORpORATE DEBT FUND
Collective investment schemes
Supranational - 28,701,024 (31 December 2019: 17,201,452) 28,701,024 9.30
28,701,024 Insight Liquidity Funds Plc - ILF USD Liquidity Fund 28,701,024 9.30
Total investments in collective investment schemes 28,701,024 9.30
Bonds
Argentina - 7,958,386 (31 December 2019: 8,830,675) 7,958,386 2.58
2,008,000 Banco Macro SA ‘REGS’ FRN 6.750% 04-Nov-2026 1,646,580 0.54 3,400,000 YPF Energia Electrica SA ‘REGS’
10.000% 25-Jul-2026 2,601,034 0.84 4,980,000 YPF SA ‘REGS’ 8.500% 27-Jun-2029 3,710,772 1.20
Brazil - 23,358,657 (31 December 2019: 33,694,254) 23,358,657 7.57
6,200,000 Braskem Netherlands Finance BV ‘REGS’ 4.500% 31-Jan-2030 5,652,850 1.83
6,829,000 BRF SA ‘REGS’ 4.875% 24-Jan-2030 6,496,086 2.11 3,530,000 CSN Islands XI Corp ‘REGS’ 6.750% 28-Jan-2028 2,982,850 0.97 2,900,000 Petrobras Global Finance BV 5.600% 03-Jan-2031 2,905,583 0.94 1,600,000 Petrobras Global Finance BV 6.750% 03-Jun-2050 1,640,528 0.53 3,700,000 Petrobras Global Finance BV 6.850% 05-Jun-2115 3,680,760 1.19
Chile - 11,696,308 (31 December 2019: 16,723,800) 11,696,308 3.79
1,074,000 AES Gener SA ‘REGS’ FRN 6.350% 07-Oct-2079 1,074,671 0.35 4,100,000 Celulosa Arauco y Constitucion SA ‘REGS’
5.150% 29-Jan-2050 4,090,037 1.32 2,000,000 Colbun SA ‘REGS’ 3.150% 06-Mar-2030 2,025,000 0.66 2,000,000 Embotelladora Andina SA ‘REGS’
3.950% 21-Jan-2050 2,008,000 0.65 1,000,000 Kenbourne Invest SA ‘REGS’ 6.875% 26-Nov-2024 1,009,190 0.33 1,500,000 Sociedad Quimica y Minera de Chile SA ‘REGS’
4.250% 22-Jan-2050 1,489,410 0.48
China - 26,992,534 (31 December 2019: 29,648,647) 26,992,534 8.75
2,400,000 China Evergrande Group 11.500% 22-Jan-2023 2,264,886 0.73 1,000,000 China Evergrande Group 12.000% 22-Jan-2024 919,917 0.30 3,500,000 Kaisa Group Holdings Ltd 10.500% 15-Jan-2025 3,320,134 1.08 3,000,000 Kaisa Group Holdings Ltd 10.875% 23-Jul-2023 3,003,540 0.97 3,000,000 Kaisa Group Holdings Ltd ‘REGS’
11.950% 22-Oct-2022 3,126,675 1.01 3,135,000 Ronshine China Holdings Ltd 8.100% 09-Jun-2023 3,228,820 1.05 2,000,000 Sinopec Group Overseas Development 2018 Ltd
‘REGS’ 3.350% 13-May-2050 2,135,584 0.69 1,400,000 Tencent Holdings Ltd ‘REGS’ 2.390% 03-Jun-2030 1,414,328 0.46 800,000 Tencent Holdings Ltd ‘REGS’ 3.240% 03-Jun-2050 813,032 0.26 500,000 Yuzhou Properties Co Ltd 6.000% 25-Oct-2023 483,082 0.16 2,100,000 Yuzhou Properties Co Ltd 7.375% 13-Jan-2026 1,977,259 0.64 1,950,000 Yuzhou Properties Co Ltd 8.375% 30-Oct-2024 1,976,527 0.64 2,300,000 Zhenro Properties Group Ltd 9.150% 06-May-2023 2,328,750 0.76
Colombia - 17,770,601 (31 December 2019: 15,034,533) 17,770,601 5.76
3,500,000 Banco Bilbao Vizcaya Argentaria Colombia SA ‘REGS’ 4.875% 21-Apr-2025 3,718,558 1.21
1,200,000 Ecopetrol SA 6.875% 29-Apr-2030 1,371,000 0.44 17,000,000,000 Empresas Publicas de Medellin ESP ‘REGS’
8.375% 08-Nov-2027 4,806,411 1.56
4,000,000 Geopark Ltd ‘REGS’ 5.500% 17-Jan-2027 3,460,000 1.12 2,000,000 Geopark Ltd ‘REGS’ 6.500% 21-Sep-2024 1,846,230 0.60 500,000 Grupo Energia Bogota SA ESP ‘REGS’
4.875% 15-May-2030 526,563 0.17 1,865,000 Transportadora de Gas Internacional SA ESP ‘REGS’
5.550% 01-Nov-2028 2,041,839 0.66
Czech Republic - 3,545,105 (31 December 2019: –) 3,545,105 1.15
3,100,000 PPF Telecom Group BV ‘EMTN’ 3.500% 20-May-2024 3,545,105 1.15
Egypt - 5,045,404 (31 December 2019: 3,661,790) 5,045,404 1.64
5,100,000 African Export-Import Bank/The ‘REGS’ 3.994% 21-Sep-2029 5,045,404 1.64
Ghana - 3,994,492 (31 December 2019: 7,883,789) 3,994,492 1.29
4,489,000 Kosmos Energy Ltd ‘REGS’ 7.125% 04-Apr-2026 3,994,492 1.29
Hong Kong - 2,848,086 (31 December 2019: –) 2,848,086 0.92
1,200,000 CK Hutchison International 20 Ltd ‘REGS’ 2.500% 08-May-2030 1,225,812 0.40
1,500,000 CK Hutchison International 20 Ltd ‘REGS’ 3.375% 08-May-2050 1,622,274 0.52
India - 2,008,852 (31 December 2019: –) 2,008,852 0.65
500,000 Bharti Airtel International Netherlands BV ‘REGS’ 5.350% 20-May-2024 536,298 0.17
1,500,000 Oil & Natural Gas Corp Ltd ‘EMTN’ 3.375% 05-Dec-2029 1,472,554 0.48
Indonesia - 5,264,684 (31 December 2019: 9,012,705) 5,264,684 1.71
1,100,000 Medco Platinum Road Pte Ltd ‘REGS’ 6.750% 30-Jan-2025 1,037,950 0.34
2,150,000 Pertamina Persero PT ‘REGS’ 4.175% 21-Jan-2050 2,171,734 0.70
2,000,000 Perusahaan Perseroan Persero PT Perusahaan Listrik Negara ‘REGS’ 4.375% 05-Feb-2050 2,055,000 0.67
Israel - 4,332,354 (31 December 2019: 11,038,808) 4,332,354 1.40
3,300,000 Altice Finco SA ‘REGS’ 4.750% 15-Jan-2028 3,384,560 1.09 800,000 Teva Pharmaceutical Finance Netherlands II BV
‘REGS’ 6.000% 31-Jan-2025 947,794 0.31
Kazakhstan - 1,898,163 (31 December 2019: 2,098,113) 1,898,163 0.61
475,000,000 Development Bank of Kazakhstan JSC 9.500% 14-Dec-2020 1,120,218 0.36
350,000,000 Development Bank of Kazakhstan JSC ‘REGS’ 8.950% 04-May-2023 777,945 0.25
Kuwait - 2,262,704 (31 December 2019: –) 2,262,704 0.73
2,000,000 MEGlobal Canada ULC ‘REGS’ 5.875% 18-May-2030 2,262,704 0.73
BNY MELLON EMERGING MARKETS CORPORATE DEBT FUND
Bonds cont’d.
Colombia cont’d.
USDUSD
03613-1A.indd 131 19/08/2020 19:00

132
Schedule of investments – as at 30 June 2020
Holdings Description
Fair value
Total net assets
% Holdings Description
Fair value
Total net assets
%
BNy MELLON EMERGING MARKETS CORpORATE DEBT FUND
2,000,000 Phosagro OAO Via Phosagro Bond Funding DAC ‘REGS’ 3.050% 23-Jan-2025 2,022,550 0.65
2,500,000 Russian Railways Via RZD Capital Plc 2.200% 23-May-2027 2,871,832 0.93
Saudi Arabia - 8,332,787 (31 December 2019: 14,091,917) 8,332,787 2.70
7,406,000 Dar Al-Arkan Sukuk Co Ltd 6.875% 26-Feb-2027 6,325,287 2.05
2,000,000 Riyad Bank FRN 3.174% 25-Feb-2030 2,007,500 0.65
Serbia - 3,169,347 (31 December 2019: –) 3,169,347 1.03
3,000,000 United Group BV ‘REGS’ 3.625% 15-Feb-2028 3,169,347 1.03
South Africa - 6,089,169 (31 December 2019: 2,037,612) 6,089,169 1.97
4,350,000 Eskom Holdings SOC Ltd ‘REGS’ 8.450% 10-Aug-2028 4,103,029 1.33
2,000,000 Liquid Telecommunications Financing Plc ‘REGS’ 8.500% 13-Jul-2022 1,986,140 0.64
Tanzania - 2,689,074 (31 December 2019: –) 2,689,074 0.87
2,650,000 HTA Group Ltd/Mauritius ‘REGS’ 7.000% 18-Dec-2025 2,689,074 0.87
Thailand - 3,593,053 (31 December 2019: 7,673,591) 3,593,053 1.16
1,000,000 PTTEP Treasury Center Co Ltd ‘REGS’ 2.587% 10-Jun-2027 1,024,877 0.33
2,400,000 PTTEP Treasury Center Co Ltd ‘REGS’ 3.903% 06-Dec-2059 2,568,176 0.83
Turkey - 15,329,812 (31 December 2019: 15,872,060) 15,329,812 4.97
200,000 Akbank T.A.S. ‘REGS’ FRN 6.797% 27-Apr-2028 182,602 0.06
3,500,000 Turkcell Iletisim Hizmetleri AS ‘REGS’ 5.800% 11-Apr-2028 3,482,664 1.13
6,200,000 Turkiye Garanti Bankasi AS ‘REGS’ FRN 6.125% 24-May-2027 5,844,120 1.89
1,900,000 Turkiye Is Bankasi AS FRN 7.750% 22-Jan-2030 1,801,717 0.58 2,100,000 Turkiye Sise ve Cam Fabrikalari AS ‘REGS’
6.950% 14-Mar-2026 2,176,709 0.71 2,000,000 Turkiye Vakiflar Bankasi TAO ‘REGS’
5.250% 05-Feb-2025 1,842,000 0.60
Ukraine - 9,276,870 (31 December 2019: 19,559,700) 9,276,870 3.01
7,400,000 Metinvest BV ‘REGS’ 5.625% 17-Jun-2025 7,589,620 2.46 1,700,000 VF Ukraine PAT via VFU Funding Plc ‘REGS’
6.200% 11-Feb-2025 1,687,250 0.55
United Arab Emirates - 21,651,671 (31 December 2019: 15,202,975) 21,651,671 7.02
2,700,000 Aldar Sukuk No 2 Ltd 3.875% 22-Oct-2029 2,774,790 0.90 4,300,000 DP World Plc ‘REGS’ 4.700% 30-Sep-2049 4,243,425 1.38 7,700,000 DP World Salaam FRN (Perpetual)
6.000% 01-Oct-2025 7,634,781 2.47 7,120,000 MAF Sukuk Ltd ‘EMTN’ 3.933% 28-Feb-2030 6,998,675 2.27
Macau - 6,252,750 (31 December 2019: –) 6,252,750 2.03
3,200,000 MGM China Holdings Ltd ‘REGS’ 5.250% 18-Jun-2025 3,264,000 1.06
3,000,000 Wynn Macau Ltd ‘REGS’ 5.500% 15-Jan-2026 2,988,750 0.97
Mexico - 21,707,946 (31 December 2019: 29,395,522) 21,707,946 7.04
7,800,000 Braskem Idesa SAPI ‘REGS’ 7.450% 15-Nov-2029 7,314,918 2.37 500,000 Cemex SAB de CV ‘REGS’ 7.375% 05-Jun-2027 510,625 0.17 1,500,000 Credito Real SAB de CV SOFOM ER ‘REGS’
5.000% 01-Feb-2027 1,424,424 0.46 2,700,000 Orbia Advance Corp SAB de CV ‘REGS’
5.500% 15-Jan-2048 2,860,097 0.93 6,900,000 Petroleos Mexicanos ‘REGS’ 6.840% 23-Jan-2030 6,001,758 1.94 4,730,000 Petroleos Mexicanos ‘REGS’ 6.950% 28-Jan-2060 3,596,124 1.17
Moldova - 3,135,000 (31 December 2019: 3,210,000) 3,135,000 1.02
3,000,000 Aragvi Finance International DAC ‘REGS’ 12.000% 09-Apr-2024 3,135,000 1.02
Nigeria - 12,059,370 (31 December 2019: 11,800,197) 12,059,370 3.91
8,400,000 Africa Finance Corp 3.750% 30-Oct-2029 8,492,820 2.75 1,200,000 IHS Netherlands Holdco BV ‘REGS’
7.125% 18-Mar-2025 1,224,000 0.40 2,300,000 IHS Netherlands Holdco BV ‘REGS’
8.000% 18-Sep-2027 2,342,550 0.76
panama - 10,775,213 (31 December 2019: 13,258,254) 10,775,213 3.49
1,500,000 C&W Senior Financing DAC ‘REGS’ 6.875% 15-Sep-2027 1,485,383 0.48
2,000,000 Cable Onda SA ‘REGS’ 4.500% 30-Jan-2030 2,017,230 0.65 7,130,000 Global Bank Corp ‘REGS’ FRN
5.250% 16-Apr-2029 7,272,600 2.36
peru - 2,484,569 (31 December 2019: 15,298,873) 2,484,569 0.81
2,520,000 Camposol SA ‘REGS’ 6.000% 03-Feb-2027 2,484,569 0.81
philippines - 4,558,519 (31 December 2019: –) 4,558,519 1.48
2,000,000 PLDT Inc 2.500% 23-Jan-2031 2,029,150 0.66 2,500,000 PLDT Inc 3.450% 23-Jun-2050 2,529,369 0.82
Qatar - 2,558,925 (31 December 2019: 4,011,040) 2,558,925 0.83
500,000 ABQ Finance Ltd ‘EMTN’ 3.125% 24-Sep-2024 508,665 0.17 2,000,000 QNB Finance Ltd ‘EMTN’ 2.625% 12-May-2025 2,050,260 0.66
Republic of Korea - 9,652,238 (31 December 2019: 7,262,732) 9,652,238 3.13
3,500,000 Kookmin Bank ‘REGS’ FRN (Perpetual) 4.350% 02-Jul-2024 3,608,933 1.17
5,500,000 Shinhan Bank Co Ltd ‘REGS’ 4.000% 23-Apr-2029 6,043,305 1.96
Russia - 7,353,693 (31 December 2019: 24,651,495) 7,353,693 2.38
2,100,000 Gazprom PJSC via Gaz Finance Plc 2.950% 15-Apr-2025 2,459,311 0.80
Bonds cont’d. Bonds cont’d.
Russia cont’d.
USDUSD
03613-1A.indd 132 19/08/2020 19:00

133
Schedule of investments – as at 30 June 2020
Holdings Description
Fair value
Total net assets
% Holdings Description
Fair value
Total net assets
%
BNy MELLON EMERGING MARKETS CORpORATE DEBT FUND
Zambia - 573,585 (31 December 2019: 7,169,474) 573,585 0.19
600,000 First Quantum Minerals Ltd ‘REGS’ 7.250% 01-Apr-2023 573,585 0.19
Total investments in bonds 270,219,921 87.59
Unrealised gain on forward foreign currency contracts - 28,903 (see below) (31 December 2019: 1,170,429) 28,903 0.01
Total financial assets at fair value through profit or loss 298,949,848 96.90
Unrealised loss on forward foreign currency contracts - (3,262,058) (see below) (31 December 2019: (488,963)) (3,262,058) (1.06)
Total financial liabilities at fair value through profit or loss (3,262,058) (1.06)
Net current assets 12,812,219 4.16
Total net assets 308,500,009 100.00
Analysis of portfolio % of Total Assets
Transferable securities and money market instruments admitted to official stock exchange listing or traded on a regulated market 93.50oTC financial derivative instruments 0.01other current assets 6.49
Total assets 100.00
Bonds cont’d.
USDUSD
Forward foreign currency contracts cont’d.Unrealised
Gain/(Loss)Buy Sell Amount (B) Amount (S)Settle
Date Counterparty
BNy Mellon Emerging Markets Corporate Debt FundUS dollar Colombian peso 4,649,755 18,227,969,000 17-Jul-20 Citigroup Global
Markets Limited (209,913)Euro US dollar 1,590,000 1,789,908 27-Jul-20 BNP Paribas (6,669)Euro US dollar 1,250,000 1,406,658 27-Jul-20 Natwest
Markets Plc (4,740)US dollar Euro 30,601,061 28,200,000 27-Jul-20 Bank of America
Merrill Lynch (1,026,206)
USD (1,247,528)
BNy Mellon Emerging Markets Corporate Debt Fund CHF W (Acc) (Hedged) Share ClassSwiss franc US dollar 403,612 425,081 15-Jul-20 The Bank of
New York Mellon (310)Swiss franc US dollar 40,045 42,154 15-Jul-20 The Bank of
New York Mellon (10)Swiss franc US dollar 12,893,910 13,608,803 15-Jul-20 The Bank of
New York Mellon (38,920)US dollar Swiss franc 312,188 296,788 15-Jul-20 The Bank of
New York Mellon (159)
USD (39,399)
CHF (37,451)
BNy Mellon Emerging Markets Corporate Debt Fund CHF W (Inc) (Hedged) Share ClassSwiss franc US dollar 5,802,177 6,123,874 15-Jul-20 The Bank of
New York Mellon (17,514)US dollar Swiss franc 140,483 133,553 15-Jul-20 The Bank of
New York Mellon (72)
USD (17,586)
CHF (16,716)
BNy Mellon Emerging Markets Corporate Debt Fund EUR H (Hedged) Share ClassUS dollar Euro 8,294 7,392 15-Jul-20 The Bank of
New York Mellon 6US dollar Euro 100,861 89,663 15-Jul-20 The Bank of
New York Mellon 328US dollar Euro 51,787 45,735 15-Jul-20 The Bank of
New York Mellon 508US dollar Euro 444,164 394,452 15-Jul-20 The Bank of
New York Mellon 1,893US dollar Euro 39,670 34,874 15-Jul-20 The Bank of
New York Mellon 568US dollar Euro 24,149 21,390 15-Jul-20 The Bank of
New York Mellon 165US dollar Euro 5,292 4,720 15-Jul-20 The Bank of
New York Mellon - US dollar Euro 11,258 9,965 15-Jul-20 The Bank of
New York Mellon 86
USD 3,554
EUR 3,171
03613-1A.indd 133 19/08/2020 19:00
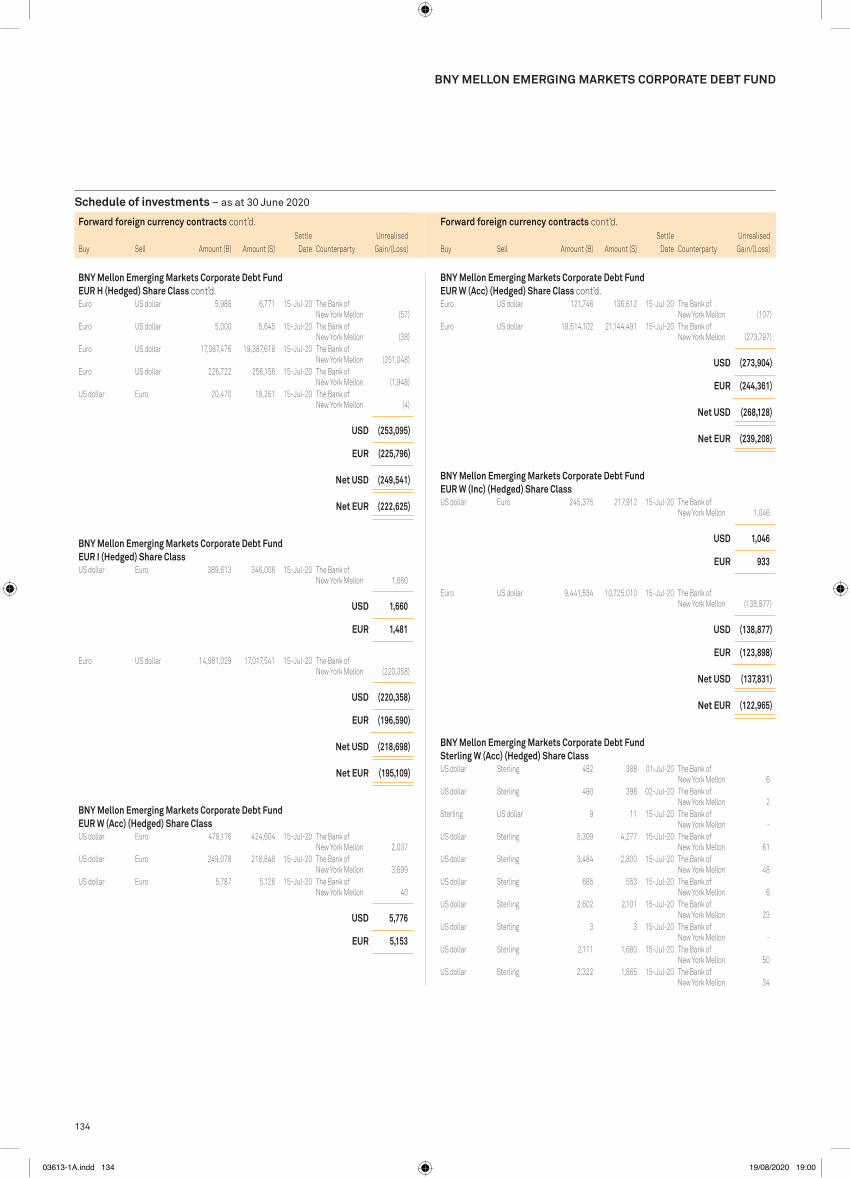
134
Schedule of investments – as at 30 June 2020
BNy MELLON EMERGING MARKETS CORpORATE DEBT FUND
Forward foreign currency contracts cont’d.Unrealised
Gain/(Loss)Buy Sell Amount (B) Amount (S)Settle
Date Counterparty
BNy Mellon Emerging Markets Corporate Debt Fund EUR H (Hedged) Share Class cont’d.Euro US dollar 5,988 6,771 15-Jul-20 The Bank of
New York Mellon (57)Euro US dollar 5,000 5,645 15-Jul-20 The Bank of
New York Mellon (38)Euro US dollar 17,067,476 19,387,618 15-Jul-20 The Bank of
New York Mellon (251,048)Euro US dollar 226,722 256,156 15-Jul-20 The Bank of
New York Mellon (1,948)US dollar Euro 20,470 18,261 15-Jul-20 The Bank of
New York Mellon (4)
USD (253,095)
EUR (225,796)
Net USD (249,541)
Net EUR (222,625)
BNy Mellon Emerging Markets Corporate Debt Fund EUR I (Hedged) Share ClassUS dollar Euro 389,613 346,006 15-Jul-20 The Bank of
New York Mellon 1,660
USD 1,660
EUR 1,481
Euro US dollar 14,981,029 17,017,541 15-Jul-20 The Bank of New York Mellon (220,358)
USD (220,358)
EUR (196,590)
Net USD (218,698)
Net EUR (195,109)
BNy Mellon Emerging Markets Corporate Debt Fund EUR W (Acc) (Hedged) Share ClassUS dollar Euro 478,116 424,604 15-Jul-20 The Bank of
New York Mellon 2,037US dollar Euro 249,078 218,848 15-Jul-20 The Bank of
New York Mellon 3,699US dollar Euro 5,787 5,126 15-Jul-20 The Bank of
New York Mellon 40
USD 5,776
EUR 5,153
Forward foreign currency contracts cont’d.Unrealised
Gain/(Loss)Buy Sell Amount (B) Amount (S)Settle
Date Counterparty
BNy Mellon Emerging Markets Corporate Debt Fund EUR W (Acc) (Hedged) Share Class cont’d.Euro US dollar 121,746 136,612 15-Jul-20 The Bank of
New York Mellon (107)Euro US dollar 18,614,102 21,144,491 15-Jul-20 The Bank of
New York Mellon (273,797)
USD (273,904)
EUR (244,361)
Net USD (268,128)
Net EUR (239,208)
BNy Mellon Emerging Markets Corporate Debt Fund EUR W (Inc) (Hedged) Share ClassUS dollar Euro 245,375 217,912 15-Jul-20 The Bank of
New York Mellon 1,046
USD 1,046
EUR 933
Euro US dollar 9,441,534 10,725,010 15-Jul-20 The Bank of New York Mellon (138,877)
USD (138,877)
EUR (123,898)
Net USD (137,831)
Net EUR (122,965)
BNy Mellon Emerging Markets Corporate Debt Fund Sterling W (Acc) (Hedged) Share ClassUS dollar Sterling 482 388 01-Jul-20 The Bank of
New York Mellon 6US dollar Sterling 490 398 02-Jul-20 The Bank of
New York Mellon 2Sterling US dollar 9 11 15-Jul-20 The Bank of
New York Mellon - US dollar Sterling 5,309 4,277 15-Jul-20 The Bank of
New York Mellon 61US dollar Sterling 3,484 2,800 15-Jul-20 The Bank of
New York Mellon 48US dollar Sterling 685 553 15-Jul-20 The Bank of
New York Mellon 6US dollar Sterling 2,602 2,101 15-Jul-20 The Bank of
New York Mellon 23US dollar Sterling 3 3 15-Jul-20 The Bank of
New York Mellon - US dollar Sterling 2,111 1,680 15-Jul-20 The Bank of
New York Mellon 50US dollar Sterling 2,322 1,865 15-Jul-20 The Bank of
New York Mellon 34
03613-1A.indd 134 19/08/2020 19:00

135
Schedule of investments – as at 30 June 2020
BNy MELLON EMERGING MARKETS CORpORATE DEBT FUND
Forward foreign currency contracts cont’d.Unrealised
Gain/(Loss)Buy Sell Amount (B) Amount (S)Settle
Date Counterparty
BNy Mellon Emerging Markets Corporate Debt Fund Sterling W (Acc) (Hedged) Share Class cont’d.US dollar Sterling 1,860 1,470 15-Jul-20 The Bank of
New York Mellon 56US dollar Sterling 170 135 15-Jul-20 The Bank of
New York Mellon 5US dollar Sterling 114,898 91,725 15-Jul-20 The Bank of
New York Mellon 2,337US dollar Sterling 7,437 5,862 15-Jul-20 The Bank of
New York Mellon 244US dollar Sterling 18,538 14,515 15-Jul-20 The Bank of
New York Mellon 726US dollar Sterling 23 18 15-Jul-20 The Bank of
New York Mellon 1US dollar Sterling 961 767 15-Jul-20 The Bank of
New York Mellon 19US dollar Sterling 115,538 92,332 15-Jul-20 The Bank of
New York Mellon 2,233US dollar Sterling 271 220 15-Jul-20 The Bank of
New York Mellon 1
USD 5,852
GBp 4,769
Sterling US dollar 4,277 5,309 01-Jul-20 The Bank of New York Mellon (61)
Sterling US dollar 220 271 02-Jul-20 The Bank of New York Mellon (1)
Sterling US dollar 363 449 15-Jul-20 The Bank of New York Mellon (4)
Sterling US dollar 721 903 15-Jul-20 The Bank of New York Mellon (18)
Sterling US dollar 3,870 4,865 15-Jul-20 The Bank of New York Mellon (116)
Sterling US dollar 3,182 4,025 15-Jul-20 The Bank of New York Mellon (121)
Sterling US dollar 13,401 16,770 15-Jul-20 The Bank of New York Mellon (324)
Sterling US dollar 5,008 6,321 15-Jul-20 The Bank of New York Mellon (175)
Sterling US dollar 16,523 21,103 15-Jul-20 The Bank of New York Mellon (827)
Sterling US dollar 30,000 37,939 15-Jul-20 The Bank of New York Mellon (1,124)
Sterling US dollar 3,965,544 5,052,053 15-Jul-20 The Bank of New York Mellon (185,709)
Sterling US dollar 398 490 15-Jul-20 The Bank of New York Mellon (2)
Sterling US dollar 388 482 15-Jul-20 The Bank of New York Mellon (6)
Sterling US dollar 100 125 15-Jul-20 The Bank of New York Mellon (2)
Sterling US dollar 38 47 15-Jul-20 The Bank of New York Mellon (1)
USD (188,491)
GBp (153,613)
Net USD (182,639)
Net GBp (148,844)
Forward foreign currency contracts cont’d.Unrealised
Gain/(Loss)Buy Sell Amount (B) Amount (S)Settle
Date Counterparty
BNy Mellon Emerging Markets Corporate Debt Fund Sterling x (Acc) (Hedged) Share ClassUS dollar Sterling 541,516 432,301 15-Jul-20 The Bank of
New York Mellon 11,015
USD 11,015
GBp 8,977
Sterling US dollar 18,851,371 24,016,409 15-Jul-20 The Bank of New York Mellon (882,820)
USD (882,820)
GBp (719,465)
Net USD (871,805)
Net GBp (710,488)
03613-1A.indd 135 19/08/2020 19:00

136
Schedule of investments – as at 30 June 2020
Holdings Description
Fair value
Total net assets
% Holdings Description
Fair value
Total net assets
%
FUND 14 – BNy MELLON EMERGING MARKETS DEBT FUND
BNY MELLON EMERGING MARKETS DEBT FUND
Bonds
Argentina - 433,825 (31 December 2019: 955,486) 433,825 1.47
610,000 Argentine Republic Government International Bond 5.875% 11-Jan-2028 244,342 0.83
160,000 Argentine Republic Government International Bond 6.875% 26-Jan-2027 64,440 0.22
320,000 Argentine Republic Government International Bond 6.875% 11-Jan-2048 125,043 0.42
Azerbaijan - 230,526 (31 December 2019: 474,982) 230,526 0.78
200,000 Southern Gas Corridor CJSC ‘REGS’ 6.875% 24-Mar-2026 230,526 0.78
Bahrain - 908,137 (31 December 2019: 958,749) 908,137 3.08
260,000 Bahrain Government International Bond ‘REGS’ 5.625% 30-Sep-2031 263,640 0.89
210,000 Bahrain Government International Bond ‘REGS’ 6.000% 19-Sep-2044 208,357 0.71
200,000 Bahrain Government International Bond ‘REGS’ 7.000% 12-Oct-2028 223,614 0.76
200,000 CBB International Sukuk Programme Co SPC ‘REGS’ 6.250% 14-Nov-2024 212,526 0.72
Brazil - 1,623,617 (31 December 2019: 2,594,145) 1,623,617 5.51
500,000 BRF SA ‘REGS’ 4.875% 24-Jan-2030 471,875 1.60 395,000 Cosan Ltd ‘REGS’ 5.500% 20-Sep-2029 375,155 1.27 200,000 Globo Comunicacao e Participacoes SA ‘REGS’
4.875% 22-Jan-2030 181,200 0.62 450,000 NBM US Holdings Inc ‘REGS’ 7.000% 14-May-2026 451,868 1.53 150,000 Petrobras Global Finance BV 5.625% 20-May-2043 143,519 0.49
Chile - 640,496 (31 December 2019: 408,281) 640,496 2.17
400,000 Banco Santander Chile ‘REGS’ 2.700% 10-Jan-2025 411,502 1.39 200,000 Corp Nacional del Cobre de Chile ‘REGS’
4.375% 05-Feb-2049 228,994 0.78
China - 859,581 (31 December 2019: 1,620,883) 859,581 2.92
765,000 Tencent Holdings Ltd ‘REGS’ 3.975% 11-Apr-2029 859,581 2.92
Colombia - 750,613 (31 December 2019: 1,014,614) 750,613 2.55
200,000 Colombia Government International Bond 3.125% 15-Apr-2031 198,850 0.68
310,000 Empresas Publicas de Medellin ESP ‘REGS’ 4.250% 18-Jul-2029 311,685 1.06
225,000 Millicom International Cellular SA ‘REGS’ 6.625% 15-Oct-2026 240,078 0.81
Dominican Republic - 393,870 (31 December 2019: 251,831) 393,870 1.34
200,000 Dominican Republic International Bond ‘REGS’ 4.500% 30-Jan-2030 181,900 0.62
220,000 Dominican Republic International Bond ‘REGS’ 6.850% 27-Jan-2045 211,970 0.72
Ecuador - 655,965 (31 December 2019: 1,624,255) 655,965 2.23
220,000 Ecuador Government International Bond ‘REGS’ 7.950% 20-Jun-2024 108,902 0.37
420,000 Ecuador Government International Bond ‘REGS’ 8.875% 23-Oct-2027 177,975 0.60
210,000 Ecuador Government International Bond ‘REGS’ 9.500% 27-Mar-2030 90,038 0.31
200,000 Ecuador Government International Bond ‘REGS’ 10.650% 31-Jan-2029 83,050 0.28
400,000 Ecuador Government International Bond ‘REGS’ 10.750% 28-Mar-2022 196,000 0.67
Egypt - 392,601 (31 December 2019: 1,501,669) 392,601 1.33
200,000 Egypt Government International Bond ‘REGS’ 7.625% 29-May-2032 195,718 0.66
200,000 Egypt Government International Bond ‘REGS’ 8.700% 01-Mar-2049 196,883 0.67
El Salvador - 95,739 (31 December 2019: 319,607) 95,739 0.33
111,000 El Salvador Government International Bond ‘REGS’ 6.375% 18-Jan-2027 95,739 0.33
Georgia - 513,589 (31 December 2019: 948,766) 513,589 1.74
525,000 Bank of Georgia JSC ‘REGS’ 6.000% 26-Jul-2023 513,589 1.74
Ghana - 608,690 (31 December 2019: 306,599) 608,690 2.07
450,000 Ghana Government International Bond ‘REGS’ 7.625% 16-May-2029 426,690 1.45
200,000 Ghana Government International Bond ‘REGS’ 7.875% 11-Feb-2035 182,000 0.62
India - 593,200 (31 December 2019: 685,457) 593,200 2.01
240,000 Export-Import Bank of India ‘EMTN’ 4.000% 14-Jan-2023 251,168 0.85
345,000 Export-Import Bank of India ‘REGS’ 3.250% 15-Jan-2030 342,032 1.16
Indonesia - 2,339,716 (31 December 2019: 3,610,478) 2,339,716 7.94
200,000 Indonesia Asahan Aluminium Persero PT ‘REGS’ 6.757% 15-Nov-2048 245,033 0.83
430,000 Indonesia Government International Bond ‘REGS’ 3.750% 14-Jun-2028 552,552 1.88
200,000 Pertamina Persero PT ‘REGS’ 4.300% 20-May-2023 211,755 0.72 200,000 Pertamina Persero PT ‘REGS’ 6.500% 27-May-2041 249,028 0.84 140,000 Perusahaan Perseroan Persero PT Perusahaan
Listrik Negara ‘REGS’ 1.875% 05-Nov-2031 145,269 0.49 200,000 Perusahaan Perseroan Persero PT Perusahaan
Listrik Negara ‘REGS’ 3.875% 17-Jul-2029 209,412 0.71 250,000 Perusahaan Perseroan Persero PT Perusahaan
Listrik Negara ‘REGS’ 4.875% 17-Jul-2049 272,949 0.93 400,000 Perusahaan Perseroan Persero PT Perusahaan
Listrik Negara ‘REGS’ 5.250% 24-Oct-2042 453,718 1.54
Bonds cont’d.
USDUSD
03613-1A.indd 136 19/08/2020 19:00
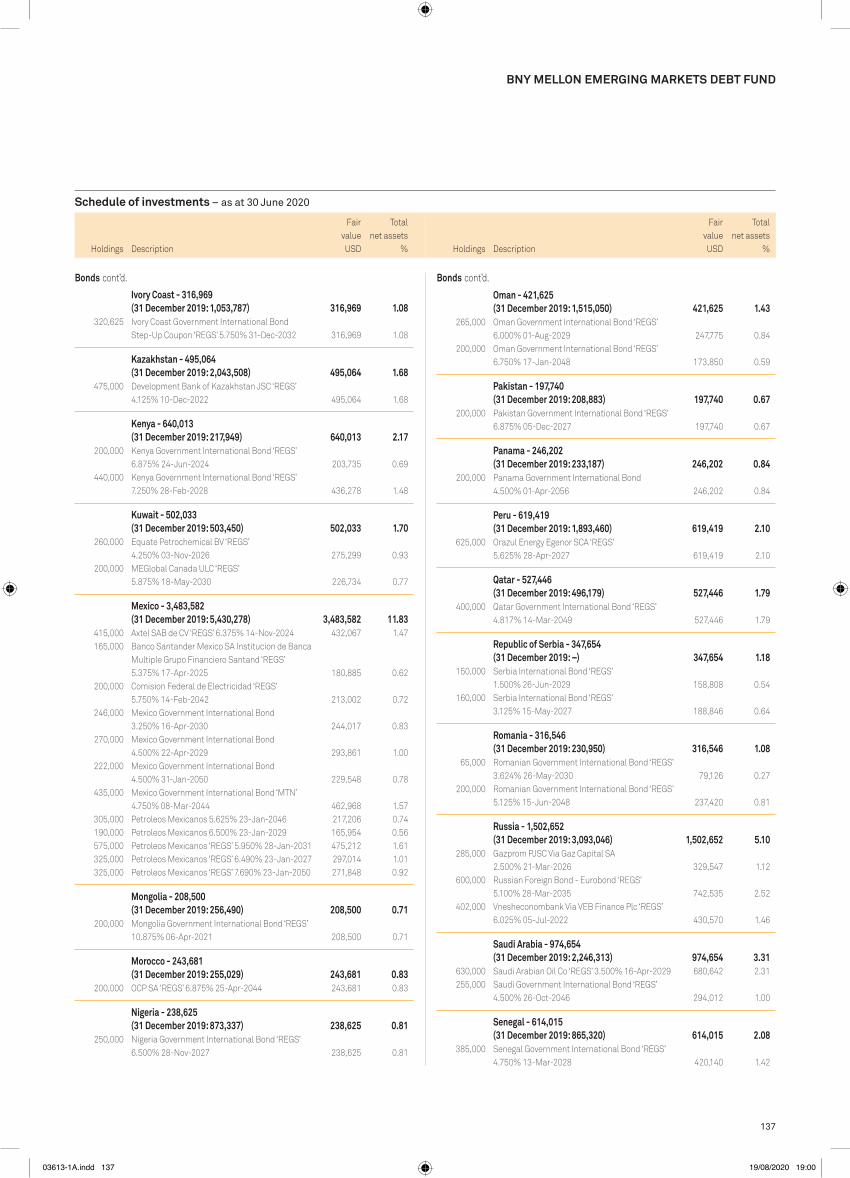
137
Schedule of investments – as at 30 June 2020
Holdings Description
Fair value
Total net assets
% Holdings Description
Fair value
Total net assets
%
BNy MELLON EMERGING MARKETS DEBT FUND
Oman - 421,625 (31 December 2019: 1,515,050) 421,625 1.43
265,000 Oman Government International Bond ‘REGS’ 6.000% 01-Aug-2029 247,775 0.84
200,000 Oman Government International Bond ‘REGS’ 6.750% 17-Jan-2048 173,850 0.59
pakistan - 197,740 (31 December 2019: 208,883) 197,740 0.67
200,000 Pakistan Government International Bond ‘REGS’ 6.875% 05-Dec-2027 197,740 0.67
panama - 246,202 (31 December 2019: 233,187) 246,202 0.84
200,000 Panama Government International Bond 4.500% 01-Apr-2056 246,202 0.84
peru - 619,419 (31 December 2019: 1,893,460) 619,419 2.10
625,000 Orazul Energy Egenor SCA ‘REGS’ 5.625% 28-Apr-2027 619,419 2.10
Qatar - 527,446 (31 December 2019: 496,179) 527,446 1.79
400,000 Qatar Government International Bond ‘REGS’ 4.817% 14-Mar-2049 527,446 1.79
Republic of Serbia - 347,654 (31 December 2019: –) 347,654 1.18
150,000 Serbia International Bond ‘REGS’ 1.500% 26-Jun-2029 158,808 0.54
160,000 Serbia International Bond ‘REGS’ 3.125% 15-May-2027 188,846 0.64
Romania - 316,546 (31 December 2019: 230,950) 316,546 1.08
65,000 Romanian Government International Bond ‘REGS’ 3.624% 26-May-2030 79,126 0.27
200,000 Romanian Government International Bond ‘REGS’ 5.125% 15-Jun-2048 237,420 0.81
Russia - 1,502,652 (31 December 2019: 3,093,046) 1,502,652 5.10
285,000 Gazprom PJSC Via Gaz Capital SA 2.500% 21-Mar-2026 329,547 1.12
600,000 Russian Foreign Bond - Eurobond ‘REGS’ 5.100% 28-Mar-2035 742,535 2.52
402,000 Vnesheconombank Via VEB Finance Plc ‘REGS’ 6.025% 05-Jul-2022 430,570 1.46
Saudi Arabia - 974,654 (31 December 2019: 2,246,313) 974,654 3.31
630,000 Saudi Arabian Oil Co ‘REGS’ 3.500% 16-Apr-2029 680,642 2.31 255,000 Saudi Government International Bond ‘REGS’
4.500% 26-Oct-2046 294,012 1.00
Senegal - 614,015 (31 December 2019: 865,320) 614,015 2.08
385,000 Senegal Government International Bond ‘REGS’ 4.750% 13-Mar-2028 420,140 1.42
Ivory Coast - 316,969 (31 December 2019: 1,053,787) 316,969 1.08
320,625 Ivory Coast Government International Bond Step-Up Coupon ‘REGS’ 5.750% 31-Dec-2032 316,969 1.08
Kazakhstan - 495,064 (31 December 2019: 2,043,508) 495,064 1.68
475,000 Development Bank of Kazakhstan JSC ‘REGS’ 4.125% 10-Dec-2022 495,064 1.68
Kenya - 640,013 (31 December 2019: 217,949) 640,013 2.17
200,000 Kenya Government International Bond ‘REGS’ 6.875% 24-Jun-2024 203,735 0.69
440,000 Kenya Government International Bond ‘REGS’ 7.250% 28-Feb-2028 436,278 1.48
Kuwait - 502,033 (31 December 2019: 503,450) 502,033 1.70
260,000 Equate Petrochemical BV ‘REGS’ 4.250% 03-Nov-2026 275,299 0.93
200,000 MEGlobal Canada ULC ‘REGS’ 5.875% 18-May-2030 226,734 0.77
Mexico - 3,483,582 (31 December 2019: 5,430,278) 3,483,582 11.83
415,000 Axtel SAB de CV ‘REGS’ 6.375% 14-Nov-2024 432,067 1.47 165,000 Banco Santander Mexico SA Institucion de Banca
Multiple Grupo Financiero Santand ‘REGS’ 5.375% 17-Apr-2025 180,885 0.62
200,000 Comision Federal de Electricidad ‘REGS’ 5.750% 14-Feb-2042 213,002 0.72
246,000 Mexico Government International Bond 3.250% 16-Apr-2030 244,017 0.83
270,000 Mexico Government International Bond 4.500% 22-Apr-2029 293,861 1.00
222,000 Mexico Government International Bond 4.500% 31-Jan-2050 229,548 0.78
435,000 Mexico Government International Bond ‘MTN’ 4.750% 08-Mar-2044 462,968 1.57
305,000 Petroleos Mexicanos 5.625% 23-Jan-2046 217,206 0.74 190,000 Petroleos Mexicanos 6.500% 23-Jan-2029 165,954 0.56 575,000 Petroleos Mexicanos ‘REGS’ 5.950% 28-Jan-2031 475,212 1.61 325,000 Petroleos Mexicanos ‘REGS’ 6.490% 23-Jan-2027 297,014 1.01 325,000 Petroleos Mexicanos ‘REGS’ 7.690% 23-Jan-2050 271,848 0.92
Mongolia - 208,500 (31 December 2019: 256,490) 208,500 0.71
200,000 Mongolia Government International Bond ‘REGS’ 10.875% 06-Apr-2021 208,500 0.71
Morocco - 243,681 (31 December 2019: 255,029) 243,681 0.83
200,000 OCP SA ‘REGS’ 6.875% 25-Apr-2044 243,681 0.83
Nigeria - 238,625 (31 December 2019: 873,337) 238,625 0.81
250,000 Nigeria Government International Bond ‘REGS’ 6.500% 28-Nov-2027 238,625 0.81
Bonds cont’d. Bonds cont’d.
USDUSD
03613-1A.indd 137 19/08/2020 19:00
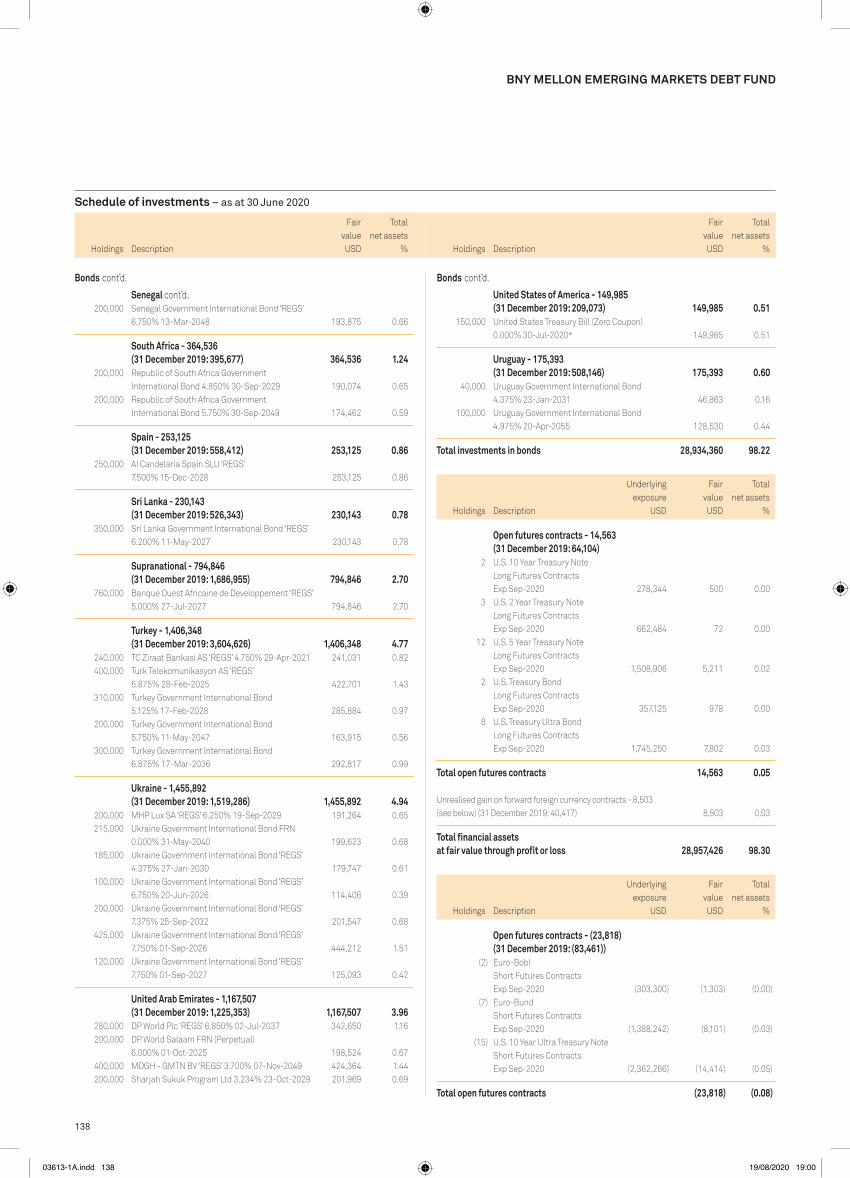
138
Schedule of investments – as at 30 June 2020
Holdings Description
Fair value
Total net assets
% Holdings Description
Fair value
Total net assets
%
BNy MELLON EMERGING MARKETS DEBT FUND
United States of America - 149,985 (31 December 2019: 209,073) 149,985 0.51
150,000 United States Treasury Bill (Zero Coupon) 0.000% 30-Jul-2020* 149,985 0.51
Uruguay - 175,393 (31 December 2019: 508,146) 175,393 0.60
40,000 Uruguay Government International Bond 4.375% 23-Jan-2031 46,863 0.16
100,000 Uruguay Government International Bond 4.975% 20-Apr-2055 128,530 0.44
Total investments in bonds 28,934,360 98.22
Holdings Description
Underlying exposure
USD
Fair value USD
Total net assets
%
Open futures contracts - 14,563 (31 December 2019: 64,104)
2 U.S. 10 Year Treasury Note Long Futures Contracts Exp Sep-2020 278,344 500 0.00
3 U.S. 2 Year Treasury Note Long Futures Contracts Exp Sep-2020 662,484 72 0.00
12 U.S. 5 Year Treasury Note Long Futures Contracts Exp Sep-2020 1,508,906 5,211 0.02
2 U.S. Treasury Bond Long Futures Contracts Exp Sep-2020 357,125 978 0.00
8 U.S. Treasury Ultra Bond Long Futures Contracts Exp Sep-2020 1,745,250 7,802 0.03
Total open futures contracts 14,563 0.05 Unrealised gain on forward foreign currency contracts - 8,503 (see below) (31 December 2019: 40,417) 8,503 0.03
Total financial assets at fair value through profit or loss 28,957,426 98.30
Holdings Description
Underlying exposure
USD
Fair value USD
Total net assets
%
Open futures contracts - (23,818) (31 December 2019: (83,461))
(2) Euro-Bobl Short Futures Contracts Exp Sep-2020 (303,300) (1,303) (0.00)
(7) Euro-Bund Short Futures Contracts Exp Sep-2020 (1,388,242) (8,101) (0.03)
(15) U.S. 10 Year Ultra Treasury Note Short Futures Contracts Exp Sep-2020 (2,362,266) (14,414) (0.05)
Total open futures contracts (23,818) (0.08)
200,000 Senegal Government International Bond ‘REGS’ 6.750% 13-Mar-2048 193,875 0.66
South Africa - 364,536 (31 December 2019: 395,677) 364,536 1.24
200,000 Republic of South Africa Government International Bond 4.850% 30-Sep-2029 190,074 0.65
200,000 Republic of South Africa Government International Bond 5.750% 30-Sep-2049 174,462 0.59
Spain - 253,125 (31 December 2019: 558,412) 253,125 0.86
250,000 AI Candelaria Spain SLU ‘REGS’ 7.500% 15-Dec-2028 253,125 0.86
Sri Lanka - 230,143 (31 December 2019: 526,343) 230,143 0.78
350,000 Sri Lanka Government International Bond ‘REGS’ 6.200% 11-May-2027 230,143 0.78
Supranational - 794,846 (31 December 2019: 1,686,955) 794,846 2.70
760,000 Banque Ouest Africaine de Developpement ‘REGS’ 5.000% 27-Jul-2027 794,846 2.70
Turkey - 1,406,348 (31 December 2019: 3,604,626) 1,406,348 4.77
240,000 TC Ziraat Bankasi AS ‘REGS’ 4.750% 29-Apr-2021 241,031 0.82 400,000 Turk Telekomunikasyon AS ‘REGS’
6.875% 28-Feb-2025 422,701 1.43 310,000 Turkey Government International Bond
5.125% 17-Feb-2028 285,884 0.97 200,000 Turkey Government International Bond
5.750% 11-May-2047 163,915 0.56 300,000 Turkey Government International Bond
6.875% 17-Mar-2036 292,817 0.99
Ukraine - 1,455,892 (31 December 2019: 1,519,286) 1,455,892 4.94
200,000 MHP Lux SA ‘REGS’ 6.250% 19-Sep-2029 191,264 0.65 215,000 Ukraine Government International Bond FRN
0.000% 31-May-2040 199,623 0.68 185,000 Ukraine Government International Bond ‘REGS’
4.375% 27-Jan-2030 179,747 0.61 100,000 Ukraine Government International Bond ‘REGS’
6.750% 20-Jun-2026 114,406 0.39 200,000 Ukraine Government International Bond ‘REGS’
7.375% 25-Sep-2032 201,547 0.68 425,000 Ukraine Government International Bond ‘REGS’
7.750% 01-Sep-2026 444,212 1.51 120,000 Ukraine Government International Bond ‘REGS’
7.750% 01-Sep-2027 125,093 0.42
United Arab Emirates - 1,167,507 (31 December 2019: 1,225,353) 1,167,507 3.96
280,000 DP World Plc ‘REGS’ 6.850% 02-Jul-2037 342,650 1.16 200,000 DP World Salaam FRN (Perpetual)
6.000% 01-Oct-2025 198,524 0.67 400,000 MDGH - GMTN BV ‘REGS’ 3.700% 07-Nov-2049 424,364 1.44 200,000 Sharjah Sukuk Program Ltd 3.234% 23-Oct-2029 201,969 0.69
Bonds cont’d.Bonds cont’d.
Senegal cont’d.
USDUSD
03613-1A.indd 138 19/08/2020 19:00

139
Schedule of investments – as at 30 June 2020
Holdings Description
Fair value
Total net assets
% Holdings Description
Fair value
Total net assets
%
BNy MELLON EMERGING MARKETS DEBT FUND
Unrealised loss on forward foreign currency contracts - (34,624) (see below) (31 December 2019: (40,535)) (34,624) (0.12)
Total financial liabilities at fair value through profit or loss (58,442) (0.20)
Net current assets 560,977 1.90
Total net assets 29,459,961 100.00
* held as collateral by Bank of America Merrill Lynch in respect of futures contracts held by the Fund. The counterparty for futures contracts is Bank of America Merrill Lynch.
Analysis of portfolio % of Total Assets
Transferable securities and money market instruments admitted to official stock exchange listing or traded on a regulated market 96.38Financial derivative instruments dealt in on a regulated market 0.05oTC financial derivative instruments 0.03other current assets 3.54
Total assets 100.00
Description
USDUSD
Forward foreign currency contractsUnrealised
Gain/(Loss)Buy Sell Amount (B) Amount (S)Settle
Date Counterparty
BNy Mellon Emerging Markets Debt FundUS dollar Euro 2,138,954 1,896,604 31-Jul-20 Citigroup Global
Markets Limited 6,682
USD 6,682
BNy Mellon Emerging Markets Debt Fund EUR H (Hedged) Share ClassEuro US dollar 11,630 13,016 15-Jul-20 The Bank of
New York Mellon 54US dollar Euro 22,113 19,492 15-Jul-20 The Bank of
New York Mellon 207US dollar Euro 111,138 97,504 15-Jul-20 The Bank of
New York Mellon 1,560
USD 1,821
EUR 1,621
Euro US dollar 8,488 9,558 15-Jul-20 The Bank of New York Mellon (20)
Euro US dollar 5,000 5,672 15-Jul-20 The Bank of New York Mellon (53)
Euro US dollar 2,834,070 3,219,592 15-Jul-20 The Bank of New York Mellon (34,551)
USD (34,624)
EUR (30,818)
Net USD (32,803)
Net EUR (29,197)
03613-1A.indd 139 19/08/2020 19:00

140
Schedule of investments – as at 30 June 2020
Holdings Description
Fair value
Total net assets
% Holdings Description
Fair value
Total net assets
%
FUND 15 – BNy MELLON EMERGING MARKETS DEBT LOCAL CURRENCy FUND
BNY MELLON EMERGING MARKETS DEBT LOCAL CURRENCY FUND
Bonds
Argentina - 2,814,264 (31 December 2019: 8,649,882) 2,814,264 1.11
13,241,300 Argentine Republic Government International Bond FRN 5.830% 31-Dec-2033 2,814,264 1.11
Brazil - 14,777,146 (31 December 2019: 38,075,053) 14,777,146 5.85
18,590,000 Brazil Notas do Tesouro Nacional Serie F 10.000% 01-Jan-2025 4,003,367 1.59
14,050,000 Brazil Notas do Tesouro Nacional Serie F 10.000% 01-Jan-2027 3,063,964 1.21
13,360,000 Brazil Notas do Tesouro Nacional Serie F 10.000% 01-Jan-2029 2,950,204 1.17
21,400,000 Brazil Notas do Tesouro Nacional Serie F 10.000% 01-Jan-2031 4,759,611 1.88
Chile - 9,515,840 (31 December 2019: 11,811,788) 9,515,840 3.76
2,940,000,000 Bonos de la Tesoreria de la Republica en pesos 5.000% 01-Mar-2035 4,528,011 1.79
3,385,000,000 Bonos de la Tesoreria de la Republica en pesos ‘144A’ 4.700% 01-Sep-2030 4,987,829 1.97
China - 14,210,808 (31 December 2019: –) 14,210,808 5.62
18,000,000 China Government Bond 3.120% 05-Dec-2026 2,587,535 1.02 26,100,000 China Government Bond 3.250% 06-Jun-2026 3,794,754 1.50 53,830,000 China Government Bond 3.290% 23-May-2029 7,828,519 3.10
Colombia - 18,144,815 (31 December 2019: 40,601,314) 18,144,815 7.18
7,413,500,000 Colombian TES 7.000% 04-May-2022 2,109,728 0.84 2,736,000,000 Colombian TES 7.000% 30-Jun-2032 751,066 0.30 11,057,000,000 Colombian TES 7.750% 18-Sep-2030 3,233,831 1.28 16,569,000,000 Empresas Publicas de Medellin ESP ‘REGS’
7.625% 10-Sep-2024 4,606,823 1.82 26,415,000,000 Empresas Publicas de Medellin ESP ‘REGS’
8.375% 08-Nov-2027 7,443,367 2.94
Czech Republic - 3,514,408 (31 December 2019: 2,819,586) 3,514,408 1.39
50,110,000 Czech Republic Government Bond 2.500% 25-Aug-2028 2,416,552 0.96
22,080,000 Czech Republic Government Bond 2.750% 23-Jul-2029 1,097,856 0.43
Dominican Republic - 476,096 (31 December 2019: 557,239) 476,096 0.19
29,700,000 Dominican Republic International Bond ‘REGS’ 8.900% 15-Feb-2023 476,096 0.19
Indonesia - 25,616,064 (31 December 2019: 43,625,823) 25,616,064 10.13
58,113,000,000 Indonesia Treasury Bond 6.125% 15-May-2028 3,820,365 1.51 53,790,000,000 Indonesia Treasury Bond 7.000% 15-May-2027 3,776,785 1.49 24,110,000,000 Indonesia Treasury Bond 7.000% 15-Sep-2030 1,664,493 0.66 33,297,000,000 Indonesia Treasury Bond 7.500% 15-Aug-2032 2,301,537 0.91 36,450,000,000 Indonesia Treasury Bond 7.500% 15-Jun-2035 2,526,877 1.00 40,469,000,000 Indonesia Treasury Bond 8.250% 15-Jun-2032 2,949,407 1.17 51,527,000,000 Indonesia Treasury Bond 8.250% 15-May-2036 3,757,485 1.49 65,246,000,000 Indonesia Treasury Bond 8.375% 15-Mar-2034 4,819,115 1.90
Kazakhstan - 1,084,821 (31 December 2019: 1,606,549) 1,084,821 0.43
487,750,000 Development Bank of Kazakhstan JSC ‘REGS’ 8.950% 04-May-2023 1,084,821 0.43
Malaysia - 7,789,911 (31 December 2019: 19,200,481) 7,789,911 3.08
5,950,000 Malaysia Government Bond 3.885% 15-Aug-2029 1,498,640 0.59 7,295,000 Malaysia Government Bond 4.181% 15-Jul-2024 1,817,048 0.72 6,865,000 Malaysia Government Bond 4.893% 08-Jun-2038 1,869,396 0.74 9,700,000 Malaysia Government Bond 4.921% 06-Jul-2048 2,604,827 1.03
Mexico - 33,164,718 (31 December 2019: 36,600,187) 33,164,718 13.12
132,500,000 Mexican Bonos 7.500% 03-Jun-2027 6,426,433 2.54 83,200,000 Mexican Bonos 7.750% 13-Nov-2042 3,957,308 1.57 200,600,000 Mexican Bonos 8.500% 31-May-2029 10,339,351 4.09 5,341,914 Mexican Udibonos 4.500% 04-Dec-2025 266,247 0.10 328,465,000 Petroleos Mexicanos ‘REGS’ 7.190% 12-Sep-2024 12,175,379 4.82
peru - 8,367,221 (31 December 2019: 19,195,068) 8,367,221 3.31
8,590,000 Peru Government Bond ‘144A’ 5.350% 12-Aug-2040 2,438,568 0.97 3,515,000 Peru Government Bond ‘144A’ 5.400% 12-Aug-2034 1,047,751 0.41 3,885,000 Peru Government Bond ‘144A’ 5.940% 12-Feb-2029 1,267,507 0.50 11,180,000 Peru Government Bond ‘144A’ 6.150% 12-Aug-2032 3,613,395 1.43
poland - 12,899,318 (31 December 2019: 22,295,313) 12,899,318 5.10
11,495,000 Republic of Poland Government Bond 2.500% 25-Jul-2026 3,172,099 1.25
23,400,000 Republic of Poland Government Bond 2.500% 25-Jul-2027 6,461,580 2.56
11,470,000 Republic of Poland Government Bond 2.750% 25-Oct-2029 3,265,639 1.29
Romania - 4,957,218 (31 December 2019: 11,617,407) 4,957,218 1.96
10,760,000 Romania Government Bond 4.750% 24-Feb-2025 2,618,017 1.04
5,350,000 Romania Government Bond 5.800% 26-Jul-2027 1,402,599 0.55
3,790,000 Romania Government Bond 5.850% 26-Apr-2023 936,602 0.37
Russia - 36,116,206 (31 December 2019: 58,302,588) 36,116,206 14.29
488,580,000 Russian Federal Bond - OFZ 7.000% 16-Aug-2023 7,317,355 2.89 696,510,000 Russian Federal Bond - OFZ 7.050% 19-Jan-2028 10,688,824 4.23 409,481,000 Russian Federal Bond - OFZ 7.700% 23-Mar-2033 6,591,426 2.61 710,500,000 Russian Federal Bond - OFZ 8.150% 03-Feb-2027 11,518,601 4.56
South Africa - 30,319,771 (31 December 2019: 66,506,029) 30,319,771 12.00
179,210,000 Republic of South Africa Government Bond 7.000% 28-Feb-2031 8,506,343 3.37
164,850,000 Republic of South Africa Government Bond 8.750% 28-Feb-2048 7,493,657 2.96
131,791,735 Republic of South Africa Government Bond 10.500% 21-Dec-2026 8,668,900 3.43
96,460,000 Transnet SOC Ltd ‘REGS’ 9.500% 13-May-2021 5,650,871 2.24
Bonds cont’d.
USDUSD
03613-1A.indd 140 19/08/2020 19:00

141
Schedule of investments – as at 30 June 2020
Holdings Description
Fair value
Total net assets
% Holdings Description
Fair value
Total net assets
%
BNy MELLON EMERGING MARKETS DEBT LOCAL CURRENCy FUND
Supranational - 3,616,493 (31 December 2019: 4,338,196) 3,616,493 1.43
265,880,000 International Finance Corp ‘GMTN’ 6.300% 25-Nov-2024 3,616,493 1.43
Thailand - 16,572,954 (31 December 2019: 37,754,667) 16,572,954 6.56
26,700,000 Thailand Government Bond 2.875% 17-Jun-2046 1,018,866 0.40
165,295,000 Thailand Government Bond 3.400% 17-Jun-2036 6,697,264 2.65
156,900,000 Thailand Government Bond 3.650% 20-Jun-2031 6,210,137 2.46
62,785,000 Thailand Government Bond 4.875% 22-Jun-2029 2,646,687 1.05
Turkey - 2,171,976 (31 December 2019: 12,758,436) 2,171,976 0.86
8,320,000 Turkey Government Bond 10.600% 11-Feb-2026 1,198,196 0.47
6,810,000 Turkey Government Bond 11.000% 24-Feb-2027 973,780 0.39
United States of America - 2,410,767 (31 December 2019: 2,070,823) 2,410,767 0.95
2,411,000 United States Treasury Bill (Zero Coupon) 0.000% 30-Jul-2020* 2,410,767 0.95
Uruguay - 908,015 (31 December 2019: 1,066,079) 908,015 0.36
23,780,000 Uruguay Government International Bond 3.875% 02-Jul-2040 565,688 0.22
15,745,000 Uruguay Government International Bond ‘REGS’ 8.500% 15-Mar-2028 342,327 0.14
Total investments in bonds 249,448,830 98.68
Currency options - 20,750 (31 December 2019: 718,204)
2,660,000 US dollar/Mexican peso Put 09-Sep-2020 21.350 10,095 0.00 2,660,000 US dollar/Russian rouble Call 09-Sep-2020 67.500 10,404 0.01 4,540,000 US dollar/Russian rouble Put 31-Jul-2020 62.500 251 0.00
Total currency options 20,750 0.01 Unrealised gain on forward foreign currency contracts - 1,540,732 (see below) (31 December 2019: 3,788,873) 1,540,732 0.61
Total financial assets at fair value through profit or loss 251,010,312 99.30
Currency options - (370,685) (31 December 2019: (184,498))
(2,660,000) US dollar/Mexican peso Call 09-Sep-2020 23.000 (96,021) (0.04) (4,540,000) US dollar/Russian rouble Call 31-Jul-2020 68.200 (214,928) (0.09) (2,660,000) US dollar/Russian rouble Put 09-Sep-2020 72.000 (59,736) (0.02)
Total currency options (370,685) (0.15)
Bonds cont’d. Unrealised loss on forward foreign currency contracts - (3,086,226) (see below) (31 December 2019: (3,356,348)) (3,086,226) (1.22)
Total financial liabilities at fair value through profit or loss (3,456,911) (1.37)
Net current assets 5,226,811 2.07
Total net assets 252,780,212 100.00
* part of the holding is held as collateral by Citigroup Global Markets Limited, Goldman Sachs and JpMorgan Chase Bank in respect of currency options and forward foreign currency contracts held by the Fund.
The counterparties for currency options are Bank of America Merrill Lynch, Citigroup Global Markets Limited and Goldman Sachs.
Analysis of portfolio % of Total Assets
Transferable securities and money market instruments admitted to official stock exchange listing or traded on a regulated market 93.79oTC financial derivative instruments 0.59other current assets 5.62
Total assets 100.00
Description
USDUSD
03613-1A.indd 141 19/08/2020 19:00

142
Schedule of investments – as at 30 June 2020
BNy MELLON EMERGING MARKETS DEBT LOCAL CURRENCy FUND
Forward foreign currency contracts cont’d.Unrealised
Gain/(Loss)Buy Sell Amount (B) Amount (S)Settle
Date Counterparty
BNy Mellon Emerging Markets Debt Local Currency FundEuro US dollar 100,000 112,309 01-Jul-20 UBS AG 41Sterling US dollar 6,560,000 8,103,617 01-Jul-20 Barclays Bank PLC 24,882Sterling US dollar 50,000 61,885 02-Jul-20 JPMorgan Chase
Bank 71US dollar Peruvian nuevo sol 10,540,462 36,080,000 14-Jul-20 Barclays Bank PLC 355,276US dollar Euro 7,945,217 7,045,000 31-Jul-20 Citigroup Global
Markets Limited 24,820US dollar Chilean peso 1,276,516 1,017,000,000 01-Sep-20 HSBC Bank plc 37,277Thai baht US dollar 27,910,000 901,180 17-Sep-20 Morgan Stanley 1,710Turkish lira US dollar 17,600,000 2,511,953 17-Sep-20 Citigroup Global
Markets Limited 779Turkish lira US dollar 13,600,000 1,940,639 17-Sep-20 Morgan Stanley 1,018US dollar Chinese yuan 2,261,165 16,000,000 17-Sep-20 Barclays Bank PLC 8,005US dollar Chinese yuan 4,551,044 32,200,000 17-Sep-20 HSBC Bank plc 16,561US dollar Colombian peso 1,396,091 5,175,450,000 17-Sep-20 Citigroup Global
Markets Limited 27,842US dollar Indonesian rupiah 756,911 10,924,500,000 17-Sep-20 JPMorgan Chase
Bank 16,001US dollar Mexican peso 10,108,915 228,442,271 17-Sep-20 Morgan Stanley 272,377US dollar Russian rouble 10,361,901 727,250,000 17-Sep-20 JPMorgan Chase
Bank 234,147US dollar South African rand 12,203,289 204,414,000 17-Sep-20 Barclays Bank PLC 518,237
USD 1,539,044
Peruvian nuevo sol US dollar 600,000 175,541 14-Jul-20 Citigroup Global Markets Limited (6,165)
Peruvian nuevo sol US dollar 4,350,000 1,276,034 14-Jul-20 Barclays Bank PLC (48,053)Peruvian nuevo sol US dollar 4,350,000 1,279,036 14-Jul-20 Citigroup Global
Markets Limited (51,054)Peruvian nuevo sol US dollar 13,430,000 3,893,092 14-Jul-20 Citigroup Global
Markets Limited (101,877)Peruvian nuevo sol US dollar 13,000,000 3,839,338 14-Jul-20 JPMorgan Chase
Bank (169,510)Peruvian nuevo sol US dollar 610,000 178,624 14-Jul-20 Citigroup Global
Markets Limited (6,424)Brazilian real US dollar 49,035,000 9,081,565 04-Aug-20 Citigroup Global
Markets Limited (80,195)Chilean peso US dollar 2,089,000,000 2,712,776 01-Sep-20 Citigroup Global
Markets Limited (167,279)Chilean peso US dollar 3,035,760,000 3,934,625 01-Sep-20 Barclays Bank PLC (235,479)US dollar Taiwanese dollar 297,483 8,840,000 08-Sep-20 JPMorgan Chase
Bank (2,250)US dollar Taiwanese dollar 339,850 10,070,000 08-Sep-20 Citigroup Global
Markets Limited (1,587)US dollar Taiwanese dollar 4,571,620 136,760,000 08-Sep-20 Barclays Bank PLC (65,418)Czech koruna US dollar 62,110,000 2,653,712 17-Sep-20 Bank of America
Securities Ltd (34,198)Czech koruna US dollar 270,460,000 11,575,433 17-Sep-20 UBS AG (168,672)Hungarian forint US dollar 3,012,000,000 9,969,549 17-Sep-20 Citigroup Global
Markets Limited (417,451)Malaysian ringgit US dollar 42,675,000 10,015,255 17-Sep-20 Morgan Stanley (91,449)Polish zloty US dollar 39,310,000 10,004,276 17-Sep-20 HSBC Bank plc (65,798)Polish zloty US dollar 16,220,000 4,125,389 17-Sep-20 JPMorgan Chase
Bank (24,598)Thai baht US dollar 177,760,000 5,750,890 17-Sep-20 JPMorgan Chase
Bank (344)US dollar Indian rupee 1,123,550 85,810,000 17-Sep-20 JPMorgan Chase
Bank (2,803)US dollar Philippine peso 843,301 42,300,000 17-Sep-20 Barclays Bank PLC (3,467)US dollar Hong Kong dollar 11,846,824 92,500,000 15-Jan-21 JPMorgan Chase
Bank (68,254)
USD (1,812,325)
Net USD (273,281)
Forward foreign currency contracts cont’d.Unrealised
Gain/(Loss)Buy Sell Amount (B) Amount (S)Settle
Date Counterparty
BNy Mellon Emerging Markets Debt Local Currency Fund EUR H (Hedged) Share ClassEuro US dollar 294,640 330,807 01-Jul-20 The Bank of
New York Mellon 221US dollar Euro 6,620 5,878 15-Jul-20 The Bank of
New York Mellon 13US dollar Euro 22,066 19,589 15-Jul-20 The Bank of
New York Mellon 52US dollar Euro 20,916 18,573 15-Jul-20 The Bank of
New York Mellon 42US dollar Euro 98,798 87,366 15-Jul-20 The Bank of
New York Mellon 613US dollar Euro 11,345 10,000 15-Jul-20 The Bank of
New York Mellon 106US dollar Euro 16,859 15,000 15-Jul-20 The Bank of
New York Mellon 1US dollar Euro 41,585 36,968 15-Jul-20 The Bank of
New York Mellon 39US dollar Euro 18,519 16,452 15-Jul-20 The Bank of
New York Mellon 30US dollar Euro 26,847 23,741 15-Jul-20 The Bank of
New York Mellon 166
USD 1,283
EUR 1,142
Euro US dollar 15,000 16,855 02-Jul-20 The Bank of New York Mellon (2)
Euro US dollar 9,007 10,143 15-Jul-20 The Bank of New York Mellon (21)
Euro US dollar 5,114 5,783 15-Jul-20 The Bank of New York Mellon (36)
Euro US dollar 27,298,777 31,012,268 15-Jul-20 The Bank of New York Mellon (332,805)
US dollar Euro 15,911 14,216 15-Jul-20 The Bank of New York Mellon (66)
US dollar Euro 98,352 87,742 15-Jul-20 The Bank of New York Mellon (256)
US dollar Euro 687,009 612,144 15-Jul-20 The Bank of New York Mellon (943)
US dollar Euro 330,898 294,640 15-Jul-20 The Bank of New York Mellon (230)
US dollar Euro 48,468 43,177 15-Jul-20 The Bank of New York Mellon (57)
USD (334,416)
EUR (297,655)
Net USD (333,133)
Net EUR (296,513)
BNy Mellon Emerging Markets Debt Local Currency Fund EUR I (Hedged) Share ClassEuro US dollar 1,819,191 2,066,658 15-Jul-20 The Bank of
New York Mellon (22,178)US dollar Euro 45,609 40,639 15-Jul-20 The Bank of
New York Mellon (63)
USD (22,241)
EUR (19,796)
03613-1A.indd 142 19/08/2020 19:00
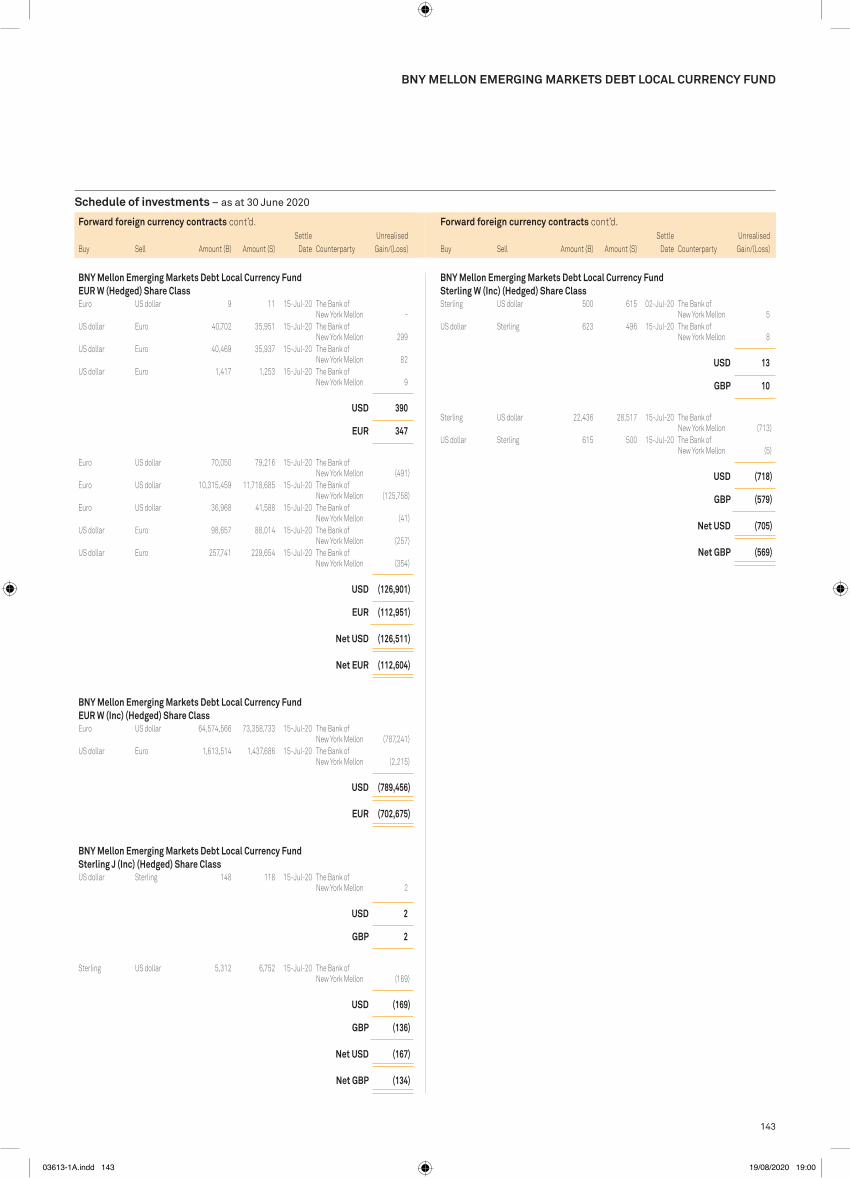
143
Schedule of investments – as at 30 June 2020
BNy MELLON EMERGING MARKETS DEBT LOCAL CURRENCy FUND
Forward foreign currency contracts cont’d.Unrealised
Gain/(Loss)Buy Sell Amount (B) Amount (S)Settle
Date Counterparty
BNy Mellon Emerging Markets Debt Local Currency Fund EUR W (Hedged) Share ClassEuro US dollar 9 11 15-Jul-20 The Bank of
New York Mellon - US dollar Euro 40,702 35,951 15-Jul-20 The Bank of
New York Mellon 299US dollar Euro 40,469 35,937 15-Jul-20 The Bank of
New York Mellon 82US dollar Euro 1,417 1,253 15-Jul-20 The Bank of
New York Mellon 9
USD 390
EUR 347
Euro US dollar 70,050 79,216 15-Jul-20 The Bank of New York Mellon (491)
Euro US dollar 10,315,459 11,718,685 15-Jul-20 The Bank of New York Mellon (125,758)
Euro US dollar 36,968 41,588 15-Jul-20 The Bank of New York Mellon (41)
US dollar Euro 98,657 88,014 15-Jul-20 The Bank of New York Mellon (257)
US dollar Euro 257,741 229,654 15-Jul-20 The Bank of New York Mellon (354)
USD (126,901)
EUR (112,951)
Net USD (126,511)
Net EUR (112,604)
BNy Mellon Emerging Markets Debt Local Currency Fund EUR W (Inc) (Hedged) Share ClassEuro US dollar 64,574,566 73,358,733 15-Jul-20 The Bank of
New York Mellon (787,241)US dollar Euro 1,613,514 1,437,686 15-Jul-20 The Bank of
New York Mellon (2,215)
USD (789,456)
EUR (702,675)
BNy Mellon Emerging Markets Debt Local Currency Fund Sterling J (Inc) (Hedged) Share ClassUS dollar Sterling 148 118 15-Jul-20 The Bank of
New York Mellon 2
USD 2
GBp 2
Sterling US dollar 5,312 6,752 15-Jul-20 The Bank of New York Mellon (169)
USD (169)
GBp (136)
Net USD (167)
Net GBp (134)
Forward foreign currency contracts cont’d.Unrealised
Gain/(Loss)Buy Sell Amount (B) Amount (S)Settle
Date Counterparty
BNy Mellon Emerging Markets Debt Local Currency Fund Sterling W (Inc) (Hedged) Share ClassSterling US dollar 500 615 02-Jul-20 The Bank of
New York Mellon 5US dollar Sterling 623 496 15-Jul-20 The Bank of
New York Mellon 8
USD 13
GBp 10
Sterling US dollar 22,436 28,517 15-Jul-20 The Bank of New York Mellon (713)
US dollar Sterling 615 500 15-Jul-20 The Bank of New York Mellon (5)
USD (718)
GBp (579)
Net USD (705)
Net GBp (569)
03613-1A.indd 143 19/08/2020 19:00

144
Schedule of investments – as at 30 June 2020
Holdings Description
Fair value
Total net assets
% Holdings Description
Fair value
Total net assets
%
Bonds
Argentina - 290,506 (31 December 2019: 424,346) 290,506 0.98
380,000 Argentine Republic Government International Bond 3.750% 31-Dec-2038 149,832 0.51
360,000 Argentine Republic Government International Bond 6.875% 11-Jan-2048 140,674 0.47
Azerbaijan - 230,526 (31 December 2019: 237,491) 230,526 0.78
200,000 Southern Gas Corridor CJSC ‘REGS’ 6.875% 24-Mar-2026 230,526 0.78
Bahrain - 432,137 (31 December 2019: 234,134) 432,137 1.46
200,000 Bahrain Government International Bond ‘REGS’ 6.750% 20-Sep-2029 219,610 0.74
200,000 CBB International Sukuk Programme Co SPC ‘REGS’ 6.250% 14-Nov-2024 212,527 0.72
Brazil - 1,810,476 (31 December 2019: 2,099,197) 1,810,476 6.13
360,000 Aegea Finance Sarl ‘REGS’ 5.750% 10-Oct-2024 365,888 1.24 190,000 Brazil Notas do Tesouro Nacional Serie F
10.000% 01-Jan-2023 39,705 0.13 1,050,000 Brazil Notas do Tesouro Nacional Serie F
10.000% 01-Jan-2025 226,118 0.77 1,400,000 Brazil Notas do Tesouro Nacional Serie F
10.000% 01-Jan-2027 305,306 1.03 1,100,000 Brazil Notas do Tesouro Nacional Serie F
10.000% 01-Jan-2029 242,906 0.82 300,000 Brazil Notas do Tesouro Nacional Serie F
10.000% 01-Jan-2031 66,723 0.23 200,000 BRF SA ‘REGS’ 4.875% 24-Jan-2030 188,750 0.64 200,000 Cosan Ltd ‘REGS’ 5.500% 20-Sep-2029 189,952 0.64 210,000 Rede D’or Finance Sarl ‘REGS’
4.500% 22-Jan-2030 185,128 0.63
Chile - 1,613,657 (31 December 2019: 758,161) 1,613,657 5.47
60,000,000 Bonos de la Tesoreria de la Republica en pesos 4.500% 01-Mar-2026 85,665 0.29
215,000,000 Bonos de la Tesoreria de la Republica en pesos 5.000% 01-Mar-2035 331,130 1.12
285,000,000 Bonos de la Tesoreria de la Republica en pesos ‘144A’ 4.700% 01-Sep-2030 419,950 1.42
200,000 VTR Comunicaciones SpA ‘REGS’ 5.125% 15-Jan-2028 205,100 0.70
559,000 VTR Finance NV ‘REGS’ 6.875% 15-Jan-2024 571,812 1.94
China - 1,078,760 (31 December 2019: –) 1,078,760 3.65
1,000,000 China Government Bond 3.120% 05-Dec-2026 143,752 0.49 1,000,000 China Government Bond 3.250% 06-Jun-2026 145,393 0.49 3,870,000 China Government Bond 3.290% 23-May-2029 562,815 1.90 200,000 Prosus NV ‘REGS’ 5.500% 21-Jul-2025 226,800 0.77
Colombia - 1,186,272 (31 December 2019: 1,202,093) 1,186,272 4.02
346,100,000 Colombian TES 7.750% 18-Sep-2030 101,224 0.34 1,481,000,000 Empresas Publicas de Medellin ESP ‘REGS’
7.625% 10-Sep-2024 411,775 1.40
1,630,000,000 Empresas Publicas de Medellin ESP ‘REGS’ 8.375% 08-Nov-2027 459,310 1.56
200,000 Millicom International Cellular SA ‘REGS’ 6.250% 25-Mar-2029 213,963 0.72
Dominican Republic - 136,425 (31 December 2019: 167,116) 136,425 0.46
150,000 Dominican Republic International Bond ‘REGS’ 4.500% 30-Jan-2030 136,425 0.46
Ecuador - 321,350 (31 December 2019: 667,902) 321,350 1.09
200,000 Ecuador Government International Bond ‘REGS’ 9.500% 27-Mar-2030 85,750 0.29
320,000 Ecuador Government International Bond ‘REGS’ 9.625% 02-Jun-2027 137,600 0.47
200,000 Ecuador Government International Bond ‘REGS’ 10.750% 28-Mar-2022 98,000 0.33
Egypt - 196,883 (31 December 2019: 443,536) 196,883 0.67
200,000 Egypt Government International Bond ‘REGS’ 8.700% 01-Mar-2049 196,883 0.67
El Salvador - 24,150 (31 December 2019: 53,268) 24,150 0.08
28,000 El Salvador Government International Bond ‘REGS’ 6.375% 18-Jan-2027 24,150 0.08
Georgia - 450,002 (31 December 2019: 484,925) 450,002 1.52
460,000 Bank of Georgia JSC ‘REGS’ 6.000% 26-Jul-2023 450,002 1.52
Ghana - 371,640 (31 December 2019: 382,180) 371,640 1.26
200,000 Ghana Government International Bond ‘REGS’ 7.625% 16-May-2029 189,640 0.64
200,000 Ghana Government International Bond ‘REGS’ 7.875% 11-Feb-2035 182,000 0.62
Guatemala - 161,402 (31 December 2019: 169,057) 161,402 0.55
160,000 Central American Bottling Corp ‘REGS’ 5.750% 31-Jan-2027 161,402 0.55
India - 198,279 (31 December 2019: 370,051) 198,279 0.67
200,000 Export-Import Bank of India ‘REGS’ 3.250% 15-Jan-2030 198,279 0.67
Indonesia - 2,806,686 (31 December 2019: 2,231,698) 2,806,686 9.51
250,000 Adaro Indonesia PT ‘REGS’ 4.250% 31-Oct-2024 237,187 0.80 2,294,000,000 Indonesia Treasury Bond 6.125% 15-May-2028 150,808 0.51 5,160,000,000 Indonesia Treasury Bond 7.000% 15-May-2027 362,302 1.23 1,930,000,000 Indonesia Treasury Bond 7.500% 15-Aug-2032 133,404 0.45 4,900,000,000 Indonesia Treasury Bond 7.500% 15-Jun-2035 339,690 1.15 1,064,000,000 Indonesia Treasury Bond 8.250% 15-Jun-2032 77,545 0.26 4,785,000,000 Indonesia Treasury Bond 8.250% 15-May-2036 348,935 1.18
BNY MELLON EMERGING MARKETS DEBT OPPORTUNISTIC FUND
FUND 16 – BNy MELLON EMERGING MARKETS DEBT OppORTUNISTIC FUND
Bonds cont’d.
Colombia cont’d.
USDUSD
03613-1A.indd 144 19/08/2020 19:00

145
Schedule of investments – as at 30 June 2020
Holdings Description
Fair value
Total net assets
% Holdings Description
Fair value
Total net assets
%
BNy MELLON EMERGING MARKETS DEBT OppORTUNISTIC FUND
Oman - 187,000 (31 December 2019: 230,314) 187,000 0.63
200,000 Oman Government International Bond ‘REGS’ 6.000% 01-Aug-2029 187,000 0.63
pakistan - 197,740 (31 December 2019: –) 197,740 0.67
200,000 Pakistan Government International Bond ‘REGS’ 6.875% 05-Dec-2027 197,740 0.67
panama - 246,202 (31 December 2019: –) 246,202 0.83
200,000 Panama Government International Bond 4.500% 01-Apr-2056 246,202 0.83
peru - 937,499 (31 December 2019: 1,511,605) 937,499 3.18
400,000 Orazul Energy Egenor SCA ‘REGS’ 5.625% 28-Apr-2027 396,428 1.34
560,000 Peru Government Bond ‘144A’ 5.350% 12-Aug-2040 158,975 0.54
235,000 Peru Government Bond ‘144A’ 5.940% 12-Feb-2029 76,670 0.26
945,000 Peru Government Bond ‘144A’ 6.150% 12-Aug-2032 305,426 1.04
poland - 815,570 (31 December 2019: 758,667) 815,570 2.76
1,675,000 Republic of Poland Government Bond 2.500% 25-Jul-2027 462,528 1.57
1,240,000 Republic of Poland Government Bond 2.750% 25-Oct-2029 353,042 1.19
Romania - 158,152 (31 December 2019: 529,257) 158,152 0.54
650,000 Romania Government Bond 4.750% 24-Feb-2025 158,152 0.54
Russia - 3,194,068 (31 December 2019: 2,773,141) 3,194,068 10.82
245,000 Gazprom PJSC Via Gaz Capital SA 2.500% 21-Mar-2026 283,295 0.96
17,655,000 Russian Federal Bond - OFZ 7.000% 16-Aug-2023 264,415 0.90 84,540,000 Russian Federal Bond - OFZ 7.050% 19-Jan-2028 1,297,373 4.39 28,423,000 Russian Federal Bond - OFZ 7.700% 23-Mar-2033 457,526 1.55 9,800,000 Russian Federal Bond - OFZ 8.150% 03-Feb-2027 158,877 0.54 200,000 Russian Foreign Bond - Eurobond ‘REGS’
5.250% 23-Jun-2047 264,500 0.90 200,000 Vnesheconombank Via VEB Finance Plc ‘REGS’
5.942% 21-Nov-2023 222,466 0.75 245,000 Vnesheconombank Via VEB Finance Plc ‘REGS’
6.902% 09-Jul-2020 245,616 0.83
Saudi Arabia - 216,077 (31 December 2019: –) 216,077 0.73
200,000 Saudi Arabian Oil Co ‘REGS’ 3.500% 16-Apr-2029 216,077 0.73
Senegal - 403,443 (31 December 2019: 627,392) 403,443 1.37
395,000 Senegal Government International Bond ‘REGS’ 6.250% 23-May-2033 403,443 1.37
3,272,000,000 Indonesia Treasury Bond 8.375% 15-Sep-2026 247,490 0.84 1,754,000,000 Indonesia Treasury Bond 8.375% 15-Mar-2034 129,552 0.44 1,615,000,000 Indonesia Treasury Bond 9.000% 15-Mar-2029 125,514 0.43 1,527,000,000 Indonesia Treasury Bond 11.000% 15-Sep-2025 126,778 0.43 200,000 Perusahaan Perseroan Persero PT Perusahaan
Listrik Negara ‘REGS’ 3.000% 30-Jun-2030 198,535 0.67 290,000 Perusahaan Perseroan Persero PT Perusahaan
Listrik Negara ‘REGS’ 5.250% 24-Oct-2042 328,946 1.12
Israel - 334,931 (31 December 2019: 574,560) 334,931 1.13
280,000 ICL Group Ltd ‘144A’ 6.375% 31-May-2038 334,931 1.13
Ivory Coast - 212,194 (31 December 2019: 347,988) 212,194 0.72
200,000 Ivory Coast Government International Bond ‘REGS’ 5.875% 17-Oct-2031 212,194 0.72
Kazakhstan - 332,425 (31 December 2019: 411,292) 332,425 1.13
200,000 Development Bank of Kazakhstan JSC ‘REGS’ 4.125% 10-Dec-2022 208,448 0.71
120,000 Kazakhstan Government International Bond ‘REGS’ 1.500% 30-Sep-2034 123,977 0.42
Kenya - 198,308 (31 December 2019: –) 198,308 0.67
200,000 Kenya Government International Bond ‘REGS’ 7.250% 28-Feb-2028 198,308 0.67
Malaysia - 668,989 (31 December 2019: 842,151) 668,989 2.27
540,000 Malaysia Government Bond 3.885% 15-Aug-2029 136,011 0.46 280,000 Malaysia Government Bond 3.900% 30-Nov-2026 69,817 0.24 1,050,000 Malaysia Government Bond 4.181% 15-Jul-2024 261,535 0.89 415,000 Malaysia Government Bond 4.893% 08-Jun-2038 113,008 0.38 330,000 Malaysia Government Bond 4.921% 06-Jul-2048 88,618 0.30
Mexico - 3,051,069 (31 December 2019: 2,325,238) 3,051,069 10.33
250,000 Axtel SAB de CV ‘REGS’ 6.375% 14-Nov-2024 260,281 0.88 4,850,000 Mexican Bonos 7.500% 03-Jun-2027 235,232 0.80 5,800,000 Mexican Bonos 7.750% 13-Nov-2042 275,870 0.93 14,650,000 Mexican Bonos 8.500% 31-May-2029 755,092 2.56 1,288,761 Mexican Udibonos 4.500% 04-Dec-2025 64,233 0.22 250,000 Orbia Advance Corp SAB de CV ‘REGS’
5.875% 17-Sep-2044 276,076 0.93 120,000 Petroleos Mexicanos 5.625% 23-Jan-2046 85,458 0.29 65,000 Petroleos Mexicanos 6.500% 23-Jan-2029 56,774 0.19 2,725,000 Petroleos Mexicanos 7.470% 12-Nov-2026 93,113 0.32 21,200,000 Petroleos Mexicanos ‘REGS’
7.190% 12-Sep-2024 785,831 2.66 195,000 Petroleos Mexicanos ‘REGS’
7.690% 23-Jan-2050 163,109 0.55
Nigeria - 190,900 (31 December 2019: 486,337) 190,900 0.65
200,000 Nigeria Government International Bond ‘REGS’ 6.500% 28-Nov-2027 190,900 0.65
Bonds cont’d.Bonds cont’d.
Indonesia cont’d.
USDUSD
03613-1A.indd 145 19/08/2020 19:00

146
Schedule of investments – as at 30 June 2020
Holdings Description
Fair value
Total net assets
% Holdings Description
Fair value
Total net assets
%
BNy MELLON EMERGING MARKETS DEBT OppORTUNISTIC FUND
United States of America - 19,998 (31 December 2019: 19,912) 19,998 0.07
20,000 United States Treasury Bill (Zero Coupon) 0.000% 30-Jul-2020* 19,998 0.07
Uruguay - 101,806 (31 December 2019: 56,218) 101,806 0.34
1,060,000 Uruguay Government International Bond 3.875% 02-Jul-2040 25,216 0.08
20,000 Uruguay Government International Bond 4.375% 23-Jan-2031 23,431 0.08
2,445,000 Uruguay Government International Bond ‘REGS’ 8.500% 15-Mar-2028 53,159 0.18
Total investments in bonds 28,817,828 97.61
Currency options - 2,328 (31 December 2019: 47,933)
300,000 US dollar/Mexican peso Put 09-Sep-2020 21.350 1,139 0.00 300,000 US dollar/Russian rouble Call 09-Sep-2020 67.500 1,173 0.01 290,000 US dollar/Russian rouble Put 31-Jul-2020 62.500 16 0.00
Total currency options 2,328 0.01
Holdings Description
Underlying exposure
USD
Fair value USD
Total net assets
%
Open futures contracts - 250 (31 December 2019: 4,666)
1 U.S. 10 Year Treasury Note Long Futures Contracts Exp Sep-2020 139,172 250 0.00
Total open futures contracts 250 0.00 Unrealised gain on forward foreign currency contracts - 134,312 (see below) (31 December 2019: 107,376) 134,312 0.45
Total financial assets at fair value through profit or loss 28,954,718 98.07
Currency options - (31,296) (31 December 2019: (13,256))
(300,000) US dollar/Mexican peso Call 09-Sep-2020 23.000 (10,830) (0.04) (290,000) US dollar/Russian rouble Call 31-Jul-2020 68.200 (13,729) (0.05) (300,000) US dollar/Russian rouble Put 09-Sep-2020 72.000 (6,737) (0.02)
Total currency options (31,296) (0.11)
Holdings Description
Underlying exposure
USD
Fair value USD
Total net assets
%
Open futures contracts - (3,472) (31 December 2019: (1,079))
(3) Euro-Bund Short Futures Contracts Exp Sep-2020 (594,961) (3,472) (0.01)
Total open futures contracts (3,472) (0.01)
South Africa - 1,850,910 (31 December 2019: 2,396,064) 1,850,910 6.27
18,815,000 Republic of South Africa Government Bond 7.000% 28-Feb-2031 893,069 3.02
8,650,000 Republic of South Africa Government Bond 8.750% 28-Feb-2048 393,207 1.33
4,790,000 Republic of South Africa Government Bond 10.500% 21-Dec-2026 315,073 1.07
4,260,000 Transnet SOC Ltd ‘REGS’ 9.500% 13-May-2021 249,561 0.85
Spain - 253,125 (31 December 2019: –) 253,125 0.86
250,000 AI Candelaria Spain SLU ‘REGS’ 7.500% 15-Dec-2028 253,125 0.86
Supranational - 675,255 (31 December 2019: 691,622) 675,255 2.29
230,000 African Export-Import Bank/The ‘REGS’ 3.994% 21-Sep-2029 227,538 0.77
245,000 Banque Ouest Africaine de Developpement ‘REGS’ 4.700% 22-Oct-2031 247,768 0.84
14,700,000 International Finance Corp ‘GMTN’ 6.300% 25-Nov-2024 199,949 0.68
Thailand - 1,074,807 (31 December 2019: 1,234,120) 1,074,807 3.64
3,395,000 Thailand Government Bond 2.125% 17-Dec-2026 117,753 0.40
7,250,000 Thailand Government Bond 3.400% 17-Jun-2036 293,749 0.99
15,735,000 Thailand Government Bond 4.875% 22-Jun-2029 663,305 2.25
Turkey - 714,283 (31 December 2019: 1,217,744) 714,283 2.42
200,000 Turk Telekomunikasyon AS ‘REGS’ 6.875% 28-Feb-2025 211,350 0.72
400,000 Turkey Government Bond 11.000% 24-Feb-2027 57,197 0.19
200,000 Turkey Government International Bond 4.250% 13-Mar-2025 186,952 0.63
260,000 Turkey Government International Bond 5.750% 22-Mar-2024 258,784 0.88
Ukraine - 606,288 (31 December 2019: 516,840) 606,288 2.05
200,000 MHP Lux SA ‘REGS’ 6.950% 03-Apr-2026 203,853 0.69 115,000 Ukraine Government International Bond FRN
0.000% 31-May-2040 106,775 0.36 100,000 Ukraine Government International Bond ‘REGS’
4.375% 27-Jan-2030 97,160 0.33 200,000 VF Ukraine PAT via VFU Funding Plc ‘REGS’
6.200% 11-Feb-2025 198,500 0.67
United Arab Emirates - 867,638 (31 December 2019: 831,551) 867,638 2.94
200,000 DP World Plc ‘REGS’ 6.850% 02-Jul-2037 244,750 0.83 200,000 DP World Salaam FRN (Perpetual)
6.000% 01-Oct-2025 198,524 0.67 400,000 MDGH - GMTN BV ‘REGS’
3.700% 07-Nov-2049 424,364 1.44
Bonds cont’d. Bonds cont’d.
USDUSD
03613-1A.indd 146 19/08/2020 19:00

147
Schedule of investments – as at 30 June 2020
Holdings Description
Fair value
Total net assets
% Holdings Description
Fair value
Total net assets
%
BNy MELLON EMERGING MARKETS DEBT OppORTUNISTIC FUND
Unrealised loss on forward foreign currency contracts - (150,817) (see below) (31 December 2019: (172,735)) (150,817) (0.51)
Total financial liabilities at fair value through profit or loss (185,585) (0.63)
Net current assets 753,333 2.56
Total net assets 29,522,466 100.00
* held as collateral by Bank of America Merrill Lynch in respect of futures contracts held by the Fund. The counterparties for currency options are Bank of America Merrill Lynch, Citigroup Global Markets Limited and Goldman Sachs. The counterparty for futures contracts is Bank of America Merrill Lynch.
Analysis of portfolio % of Total Assets
Transferable securities and money market instruments admitted to official stock exchange listing or traded on a regulated market 95.47Financial derivative instruments dealt in on a regulated market 0.00oTC financial derivative instruments 0.45other current assets 4.08
Total assets 100.00
Description
USDUSD
Forward foreign currency contracts cont’d.Unrealised
Gain/(Loss)Buy Sell Amount (B) Amount (S)Settle
Date Counterparty
BNy Mellon Emerging Markets Debt Opportunistic FundUS dollar Peruvian nuevo sol 1,142,273 3,910,000 14-Jul-20 Barclays Bank PLC 38,501US dollar Euro 1,516,865 1,345,000 31-Jul-20 Citigroup Global
Markets Limited 4,739US dollar Chilean peso 141,835 113,000,000 01-Sep-20 HSBC Bank plc 4,142Indian rupee US dollar 6,200,000 81,179 17-Sep-20 JPMorgan Chase
Bank 203Thai baht US dollar 4,630,000 149,571 17-Sep-20 JPMorgan Chase
Bank 210Turkish lira US dollar 750,000 107,043 17-Sep-20 Citigroup Global
Markets Limited 33Turkish lira US dollar 410,000 58,499 17-Sep-20 JPMorgan Chase
Bank 36Turkish lira US dollar 460,000 65,639 17-Sep-20 Morgan Stanley 34US dollar Chinese yuan 440,971 3,120,000 17-Sep-20 HSBC Bank plc 1,605US dollar Indonesian rupiah 605,501 8,739,200,000 17-Sep-20 JPMorgan Chase
Bank 12,800US dollar Mexican peso 95,260 2,150,000 17-Sep-20 Goldman Sachs 2,683US dollar Mexican peso 853,767 19,293,523 17-Sep-20 Morgan Stanley 23,004US dollar Romanian leu 98,094 420,000 17-Sep-20 JPMorgan Chase
Bank 1,018US dollar Russian rouble 446,534 31,340,000 17-Sep-20 JPMorgan Chase
Bank 10,090US dollar South African rand 829,218 13,890,000 17-Sep-20 Barclays Bank PLC 35,214
USD 134,312
Peruvian nuevo sol US dollar 1,410,000 416,421 14-Jul-20 JPMorgan Chase Bank (18,385)
Peruvian nuevo sol US dollar 1,020,000 295,678 14-Jul-20 Citigroup Global Markets Limited (7,738)
Peruvian nuevo sol US dollar 480,000 141,135 14-Jul-20 Citigroup Global Markets Limited (5,634)
Peruvian nuevo sol US dollar 490,000 143,737 14-Jul-20 Barclays Bank PLC (5,413)Peruvian nuevo sol US dollar 140,000 40,960 14-Jul-20 Citigroup Global
Markets Limited (1,439)Peruvian nuevo sol US dollar 150,000 43,924 14-Jul-20 Citigroup Global
Markets Limited (1,580)Brazilian real US dollar 2,650,000 490,795 04-Aug-20 Citigroup Global
Markets Limited (4,334)Chilean peso US dollar 164,870,000 214,100 01-Sep-20 Citigroup Global
Markets Limited (13,202)Chilean peso US dollar 356,020,000 461,435 01-Sep-20 Barclays Bank PLC (27,616)US dollar Taiwanese dollar 300,852 9,000,000 08-Sep-20 Barclays Bank PLC (4,305)US dollar Taiwanese dollar 265,177 7,880,000 08-Sep-20 JPMorgan Chase
Bank (2,005)Colombian peso US dollar 546,595,000 147,445 17-Sep-20 Citigroup Global
Markets Limited (2,941)Czech koruna US dollar 3,780,000 161,504 17-Sep-20 Bank of America
Securities Ltd (2,081)Czech koruna US dollar 19,800,000 847,421 17-Sep-20 UBS AG (12,348)Czech koruna US dollar 2,740,000 117,094 17-Sep-20 Barclays Bank PLC (1,534)Czech koruna US dollar 3,690,000 157,769 17-Sep-20 Morgan Stanley (2,141)Hungarian forint US dollar 40,500,000 134,053 17-Sep-20 Citigroup Global
Markets Limited (5,613)Hungarian forint US dollar 123,440,000 408,520 17-Sep-20 UBS AG (17,049)Malaysian ringgit US dollar 1,365,000 320,347 17-Sep-20 Morgan Stanley (2,925)Polish zloty US dollar 1,290,000 328,301 17-Sep-20 HSBC Bank plc (2,159)Polish zloty US dollar 2,780,000 707,064 17-Sep-20 JPMorgan Chase
Bank (4,216)Thai baht US dollar 3,760,000 121,643 17-Sep-20 JPMorgan Chase
Bank (7)US dollar Philippine peso 121,711 6,105,000 17-Sep-20 Barclays Bank PLC (500)US dollar Hong Kong dollar 981,045 7,660,000 15-Jan-21 JPMorgan Chase
Bank (5,652)
USD (150,817)
Net USD (16,505)
03613-1A.indd 147 19/08/2020 19:00

148
Schedule of investments – as at 30 June 2020
Holdings Description
Fair value
Total net assets
% Holdings Description
Fair value
Total net assets
%
Collective investment schemes
Ireland - 9,750,123 (31 December 2019: 4,800,000) 9,750,123 5.07
9,750,123 Insight Liquidity Funds Plc - ILF USD Liquidity Fund 9,750,123 5.07
Total investments in collective investment schemes 9,750,123 5.07
Bonds
Angola - 1,723,901 (31 December 2019: 3,926,750) 1,723,901 0.90
700,000 Angolan Government International Bond ‘REGS’ 8.000% 26-Nov-2029 578,900 0.30
1,400,000 Angolan Government International Bond ‘REGS’ 9.375% 08-May-2048 1,145,001 0.60
Argentina - 2,045,568 (31 December 2019: 2,035,050) 2,045,568 1.06
4,280,000 Argentine Republic Government International Bond 7.625% 22-Apr-2046 1,674,785 0.87
500,000 YPF SA ‘REGS’ 8.500% 27-Jun-2029 370,783 0.19
Belarus - 3,341,003 (31 December 2019: –) 3,341,003 1.74
1,554,000 Republic of Belarus Ministry of Finance ‘REGS’ 5.875% 24-Feb-2026 1,509,944 0.79
1,892,000 Republic of Belarus Ministry of Finance ‘REGS’ 6.378% 24-Feb-2031 1,831,059 0.95
Brazil - 13,479,600 (31 December 2019: 12,590,649) 13,479,600 7.01
1,795,000 Braskem Netherlands Finance BV ‘REGS’ 4.500% 31-Jan-2030 1,645,566 0.86
6,000,000 Brazil Notas do Tesouro Nacional Serie F 10.000% 01-Jan-2023 1,253,829 0.65
22,000,000 Brazil Notas do Tesouro Nacional Serie F 10.000% 01-Jan-2025 4,737,712 2.47
12,000,000 Brazil Notas do Tesouro Nacional Serie F 10.000% 01-Jan-2027 2,616,909 1.36
925,000 Petrobras Global Finance BV 5.600% 03-Jan-2031 929,972 0.48 900,000 Petrobras Global Finance BV 6.750% 03-Jun-2050 927,900 0.48 1,375,000 Petrobras Global Finance BV 6.850% 05-Jun-2115 1,367,712 0.71
Chile - 8,440,555 (31 December 2019: 7,770,825) 8,440,555 4.39
3,240,000,000 Bonos de la Tesoreria de la Republica en pesos 4.500% 01-Mar-2026 4,625,912 2.41
1,900,000 Colbun SA ‘REGS’ 3.150% 06-Mar-2030 1,924,700 1.00 1,080,000 Kenbourne Invest SA ‘REGS’ 6.875% 26-Nov-2024 1,095,865 0.57 770,000 VTR Finance NV ‘REGS’ 6.375% 15-Jul-2028 794,078 0.41
China - 1,304,448 (31 December 2019: 6,010,096) 1,304,448 0.68
900,000 Tencent Holdings Ltd ‘REGS’ 2.390% 03-Jun-2030 902,317 0.47 400,000 Tencent Holdings Ltd ‘REGS’ 3.240% 03-Jun-2050 402,131 0.21
Colombia - 8,562,809 (31 December 2019: 6,100,899) 8,562,809 4.45
2,800,000 Colombia Government International Bond 4.125% 15-May-2051 2,819,600 1.46
14,400,000,000 Colombian TES 6.000% 28-Apr-2028 3,902,428 2.03 1,750,000 Grupo Energia Bogota SA ESP ‘REGS’
4.875% 15-May-2030 1,840,781 0.96
Costa Rica - 1,734,500 (31 December 2019: 1,709,496) 1,734,500 0.90
2,000,000 Costa Rica Government International Bond ‘REGS’ 6.125% 19-Feb-2031 1,734,500 0.90
Cote d’Ivoire - 2,705,480 (31 December 2019: 3,794,684) 2,705,480 1.41
2,550,000 Ivory Coast Government International Bond ‘REGS’ 5.875% 17-Oct-2031 2,705,480 1.41
Dominican Republic - 5,608,586 (31 December 2019: 3,707,886) 5,608,586 2.92
600,000 Dominican Republic International Bond ‘REGS’ 6.000% 19-Jul-2028 605,736 0.32
1,300,000 Dominican Republic International Bond ‘REGS’ 6.400% 05-Jun-2049 1,196,000 0.62
4,100,000 Dominican Republic International Bond ‘REGS’ 6.500% 15-Feb-2048 3,806,850 1.98
Ecuador - 2,045,087 (31 December 2019: 2,610,991) 2,045,087 1.06
2,500,000 Ecuador Government International Bond ‘REGS’ 7.775% 23-Jan-2028 1,037,525 0.54
2,350,000 Ecuador Government International Bond ‘REGS’ 9.500% 27-Mar-2030 1,007,562 0.52
Egypt - 7,432,467 (31 December 2019: 8,187,045) 7,432,467 3.87
1,350,000 Egypt Government International Bond ‘REGS’ 5.750% 29-May-2024 1,356,001 0.71
1,100,000 Egypt Government International Bond ‘REGS’ 5.875% 11-Jun-2025 1,111,000 0.58
2,600,000 Egypt Government International Bond ‘REGS’ 7.625% 29-May-2032 2,544,334 1.32
900,000 Egypt Government International Bond ‘REGS’ 8.875% 29-May-2050 891,747 0.46
25,000,000 Egypt Treasury Bills (Zero Coupon) 0.000% 18-Aug-2020 1,529,385 0.80
El Salvador - 1,035,012 (31 December 2019: –) 1,035,012 0.54
1,200,000 El Salvador Government International Bond ‘REGS’ 6.375% 18-Jan-2027 1,035,012 0.54
Hong Kong - 816,298 (31 December 2019: –) 816,298 0.42
800,000 CK Hutchison International 20 Ltd ‘REGS’ 2.500% 08-May-2030 816,298 0.42
Hungary - 1,324,891 (31 December 2019: –) 1,324,891 0.69
1,200,000 Hungary Government International Bond 1.750% 05-Jun-2035 1,324,891 0.69
Indonesia - 19,740,776 (31 December 2019: 10,807,256) 19,740,776 10.27
1,810,000 Indonesia Government International Bond 3.850% 15-Oct-2030 2,017,973 1.05
1,400,000 Indonesia Government International Bond ‘REGS’ 4.125% 15-Jan-2025 1,523,650 0.79
26,536,000,000 Indonesia Treasury Bond 6.125% 15-May-2028 1,744,484 0.91
BNY MELLON EMERGING MARKETS DEBT TOTAL RETURN FUND
FUND 17 – BNy MELLON EMERGING MARKETS DEBT TOTAL RETURN FUND / NEW OD DEC 2017
Bonds cont’d.
USDUSD
03613-1A.indd 148 19/08/2020 19:00
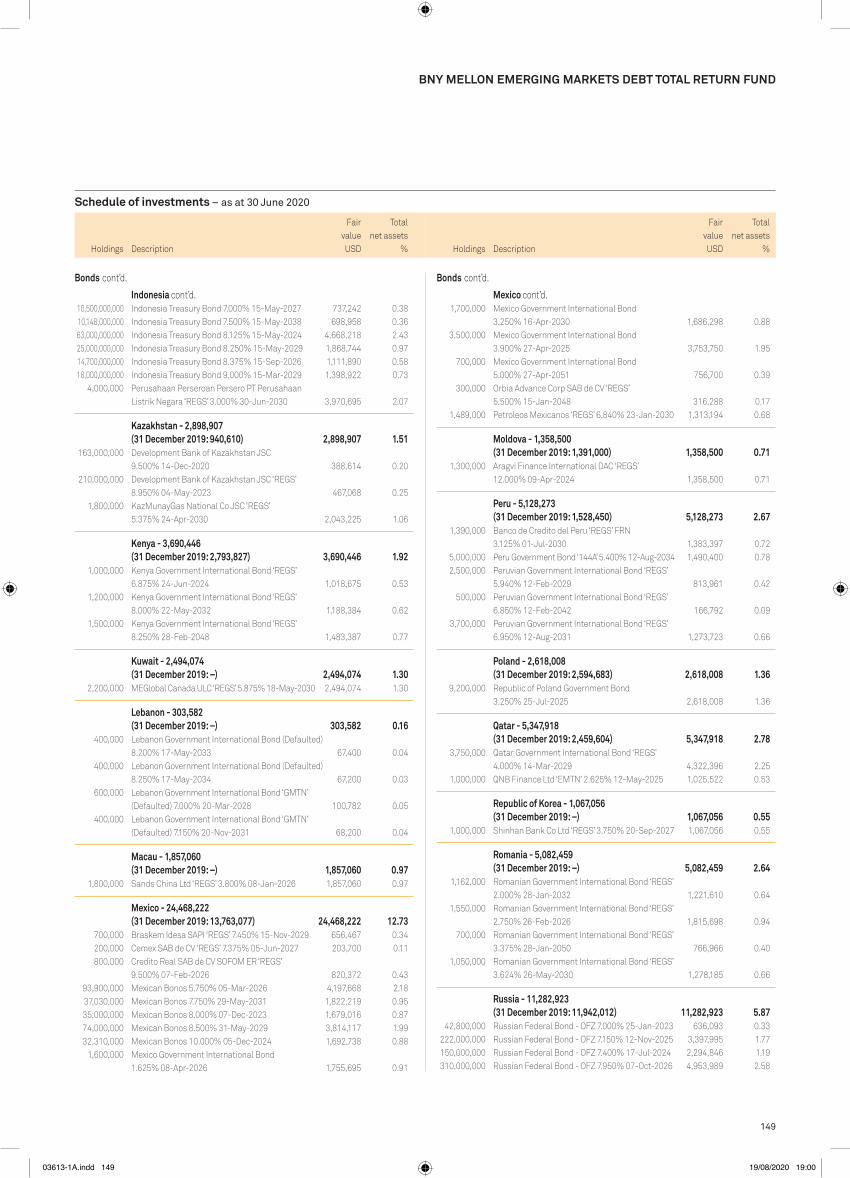
149
Schedule of investments – as at 30 June 2020
Holdings Description
Fair value
Total net assets
% Holdings Description
Fair value
Total net assets
%
BNy MELLON EMERGING MARKETS DEBT TOTAL RETURN FUND
FUND 17 – BNy MELLON EMERGING MARKETS DEBT TOTAL RETURN FUND / NEW OD DEC 2017
1,700,000 Mexico Government International Bond 3.250% 16-Apr-2030 1,686,298 0.88
3,500,000 Mexico Government International Bond 3.900% 27-Apr-2025 3,753,750 1.95
700,000 Mexico Government International Bond 5.000% 27-Apr-2051 756,700 0.39
300,000 Orbia Advance Corp SAB de CV ‘REGS’ 5.500% 15-Jan-2048 316,288 0.17
1,489,000 Petroleos Mexicanos ‘REGS’ 6.840% 23-Jan-2030 1,313,194 0.68
Moldova - 1,358,500 (31 December 2019: 1,391,000) 1,358,500 0.71
1,300,000 Aragvi Finance International DAC ‘REGS’ 12.000% 09-Apr-2024 1,358,500 0.71
peru - 5,128,273 (31 December 2019: 1,528,450) 5,128,273 2.67
1,390,000 Banco de Credito del Peru ‘REGS’ FRN 3.125% 01-Jul-2030 1,383,397 0.72
5,000,000 Peru Government Bond ‘144A’ 5.400% 12-Aug-2034 1,490,400 0.78 2,500,000 Peruvian Government International Bond ‘REGS’
5.940% 12-Feb-2029 813,961 0.42 500,000 Peruvian Government International Bond ‘REGS’
6.850% 12-Feb-2042 166,792 0.09 3,700,000 Peruvian Government International Bond ‘REGS’
6.950% 12-Aug-2031 1,273,723 0.66
poland - 2,618,008 (31 December 2019: 2,594,683) 2,618,008 1.36
9,200,000 Republic of Poland Government Bond 3.250% 25-Jul-2025 2,618,008 1.36
Qatar - 5,347,918 (31 December 2019: 2,459,604) 5,347,918 2.78
3,750,000 Qatar Government International Bond ‘REGS’ 4.000% 14-Mar-2029 4,322,396 2.25
1,000,000 QNB Finance Ltd ‘EMTN’ 2.625% 12-May-2025 1,025,522 0.53
Republic of Korea - 1,067,056 (31 December 2019: –) 1,067,056 0.55
1,000,000 Shinhan Bank Co Ltd ‘REGS’ 3.750% 20-Sep-2027 1,067,056 0.55
Romania - 5,082,459 (31 December 2019: –) 5,082,459 2.64
1,162,000 Romanian Government International Bond ‘REGS’ 2.000% 28-Jan-2032 1,221,610 0.64
1,550,000 Romanian Government International Bond ‘REGS’ 2.750% 26-Feb-2026 1,815,698 0.94
700,000 Romanian Government International Bond ‘REGS’ 3.375% 28-Jan-2050 766,966 0.40
1,050,000 Romanian Government International Bond ‘REGS’ 3.624% 26-May-2030 1,278,185 0.66
Russia - 11,282,923 (31 December 2019: 11,942,012) 11,282,923 5.87
42,800,000 Russian Federal Bond - OFZ 7.000% 25-Jan-2023 636,093 0.33 222,000,000 Russian Federal Bond - OFZ 7.150% 12-Nov-2025 3,397,995 1.77 150,000,000 Russian Federal Bond - OFZ 7.400% 17-Jul-2024 2,294,846 1.19 310,000,000 Russian Federal Bond - OFZ 7.950% 07-Oct-2026 4,953,989 2.58
10,500,000,000 Indonesia Treasury Bond 7.000% 15-May-2027 737,242 0.38 10,148,000,000 Indonesia Treasury Bond 7.500% 15-May-2038 698,958 0.36 63,000,000,000 Indonesia Treasury Bond 8.125% 15-May-2024 4,668,218 2.43 25,000,000,000 Indonesia Treasury Bond 8.250% 15-May-2029 1,868,744 0.97 14,700,000,000 Indonesia Treasury Bond 8.375% 15-Sep-2026 1,111,890 0.58 18,000,000,000 Indonesia Treasury Bond 9.000% 15-Mar-2029 1,398,922 0.73 4,000,000 Perusahaan Perseroan Persero PT Perusahaan
Listrik Negara ‘REGS’ 3.000% 30-Jun-2030 3,970,695 2.07
Kazakhstan - 2,898,907 (31 December 2019: 940,610) 2,898,907 1.51
163,000,000 Development Bank of Kazakhstan JSC 9.500% 14-Dec-2020 388,614 0.20
210,000,000 Development Bank of Kazakhstan JSC ‘REGS’ 8.950% 04-May-2023 467,068 0.25
1,800,000 KazMunayGas National Co JSC ‘REGS’ 5.375% 24-Apr-2030 2,043,225 1.06
Kenya - 3,690,446 (31 December 2019: 2,793,827) 3,690,446 1.92
1,000,000 Kenya Government International Bond ‘REGS’ 6.875% 24-Jun-2024 1,018,675 0.53
1,200,000 Kenya Government International Bond ‘REGS’ 8.000% 22-May-2032 1,188,384 0.62
1,500,000 Kenya Government International Bond ‘REGS’ 8.250% 28-Feb-2048 1,483,387 0.77
Kuwait - 2,494,074 (31 December 2019: –) 2,494,074 1.30
2,200,000 MEGlobal Canada ULC ‘REGS’ 5.875% 18-May-2030 2,494,074 1.30
Lebanon - 303,582 (31 December 2019: –) 303,582 0.16
400,000 Lebanon Government International Bond (Defaulted) 8.200% 17-May-2033 67,400 0.04
400,000 Lebanon Government International Bond (Defaulted) 8.250% 17-May-2034 67,200 0.03
600,000 Lebanon Government International Bond ‘GMTN’ (Defaulted) 7.000% 20-Mar-2028 100,782 0.05
400,000 Lebanon Government International Bond ‘GMTN’ (Defaulted) 7.150% 20-Nov-2031 68,200 0.04
Macau - 1,857,060 (31 December 2019: –) 1,857,060 0.97
1,800,000 Sands China Ltd ‘REGS’ 3.800% 08-Jan-2026 1,857,060 0.97
Mexico - 24,468,222 (31 December 2019: 13,763,077) 24,468,222 12.73
700,000 Braskem Idesa SAPI ‘REGS’ 7.450% 15-Nov-2029 656,467 0.34 200,000 Cemex SAB de CV ‘REGS’ 7.375% 05-Jun-2027 203,700 0.11 800,000 Credito Real SAB de CV SOFOM ER ‘REGS’
9.500% 07-Feb-2026 820,372 0.43 93,900,000 Mexican Bonos 5.750% 05-Mar-2026 4,197,668 2.18 37,030,000 Mexican Bonos 7.750% 29-May-2031 1,822,219 0.95 35,000,000 Mexican Bonos 8.000% 07-Dec-2023 1,679,016 0.87 74,000,000 Mexican Bonos 8.500% 31-May-2029 3,814,117 1.99 32,310,000 Mexican Bonos 10.000% 05-Dec-2024 1,692,738 0.88 1,600,000 Mexico Government International Bond
1.625% 08-Apr-2026 1,755,695 0.91
Bonds cont’d.
Indonesia cont’d.
Bonds cont’d.
Mexico cont’d.
USDUSD
03613-1A.indd 149 19/08/2020 19:00
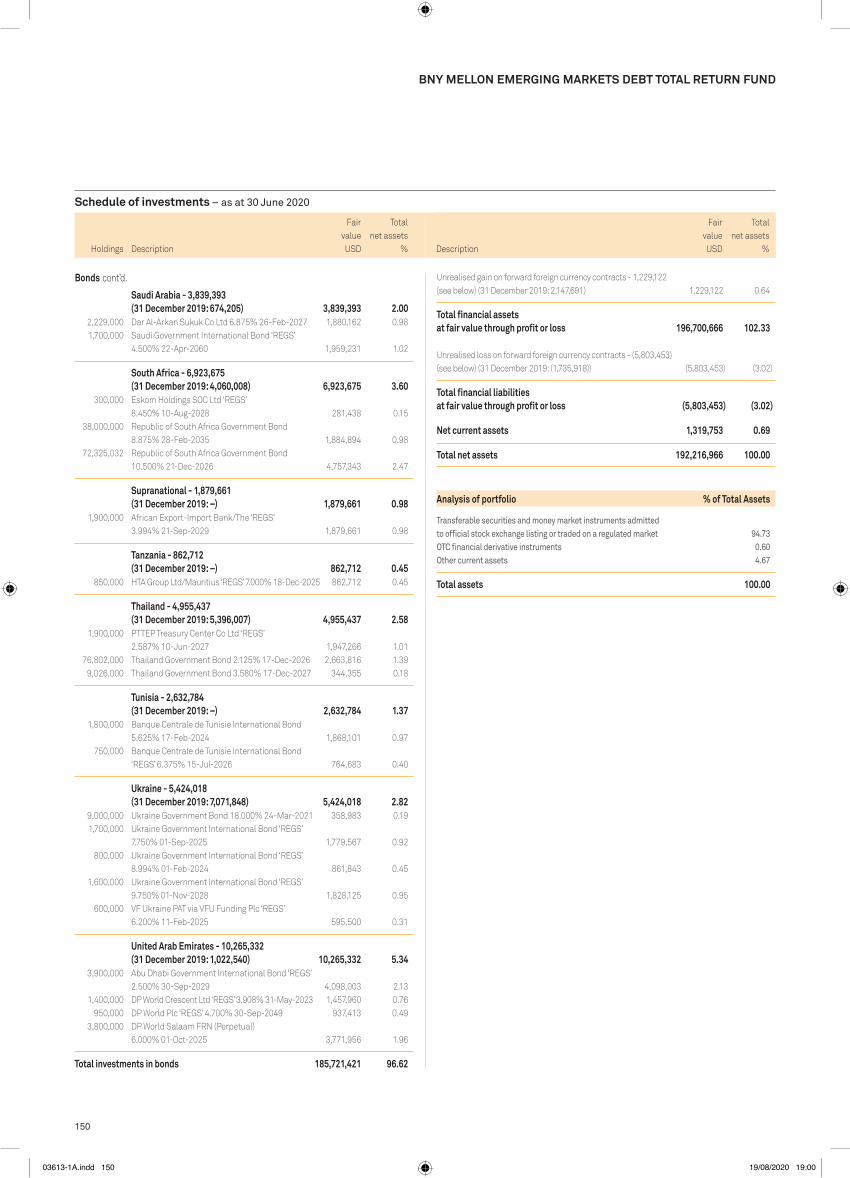
150
Schedule of investments – as at 30 June 2020
Holdings Description
Fair value
Total net assets
%
BNy MELLON EMERGING MARKETS DEBT TOTAL RETURN FUND
Unrealised gain on forward foreign currency contracts - 1,229,122 (see below) (31 December 2019: 2,147,691) 1,229,122 0.64
Total financial assets at fair value through profit or loss 196,700,666 102.33
Unrealised loss on forward foreign currency contracts - (5,803,453) (see below) (31 December 2019: (1,735,918)) (5,803,453) (3.02)
Total financial liabilities at fair value through profit or loss (5,803,453) (3.02)
Net current assets 1,319,753 0.69
Total net assets 192,216,966 100.00
Analysis of portfolio % of Total Assets
Transferable securities and money market instruments admitted to official stock exchange listing or traded on a regulated market 94.73oTC financial derivative instruments 0.60other current assets 4.67
Total assets 100.00
Bonds cont’d.
Saudi Arabia - 3,839,393 (31 December 2019: 674,205) 3,839,393 2.00
2,229,000 Dar Al-Arkan Sukuk Co Ltd 6.875% 26-Feb-2027 1,880,162 0.98 1,700,000 Saudi Government International Bond ‘REGS’
4.500% 22-Apr-2060 1,959,231 1.02
South Africa - 6,923,675 (31 December 2019: 4,060,008) 6,923,675 3.60
300,000 Eskom Holdings SOC Ltd ‘REGS’ 8.450% 10-Aug-2028 281,438 0.15
38,000,000 Republic of South Africa Government Bond 8.875% 28-Feb-2035 1,884,894 0.98
72,325,032 Republic of South Africa Government Bond 10.500% 21-Dec-2026 4,757,343 2.47
Supranational - 1,879,661 (31 December 2019: –) 1,879,661 0.98
1,900,000 African Export-Import Bank/The ‘REGS’ 3.994% 21-Sep-2029 1,879,661 0.98
Tanzania - 862,712 (31 December 2019: –) 862,712 0.45
850,000 HTA Group Ltd/Mauritius ‘REGS’ 7.000% 18-Dec-2025 862,712 0.45
Thailand - 4,955,437 (31 December 2019: 5,396,007) 4,955,437 2.58
1,900,000 PTTEP Treasury Center Co Ltd ‘REGS’ 2.587% 10-Jun-2027 1,947,266 1.01
76,802,000 Thailand Government Bond 2.125% 17-Dec-2026 2,663,816 1.39 9,026,000 Thailand Government Bond 3.580% 17-Dec-2027 344,355 0.18
Tunisia - 2,632,784 (31 December 2019: –) 2,632,784 1.37
1,800,000 Banque Centrale de Tunisie International Bond 5.625% 17-Feb-2024 1,868,101 0.97
750,000 Banque Centrale de Tunisie International Bond ‘REGS’ 6.375% 15-Jul-2026 764,683 0.40
Ukraine - 5,424,018 (31 December 2019: 7,071,848) 5,424,018 2.82
9,000,000 Ukraine Government Bond 18.000% 24-Mar-2021 358,983 0.19 1,700,000 Ukraine Government International Bond ‘REGS’
7.750% 01-Sep-2025 1,779,567 0.92 800,000 Ukraine Government International Bond ‘REGS’
8.994% 01-Feb-2024 861,843 0.45 1,600,000 Ukraine Government International Bond ‘REGS’
9.750% 01-Nov-2028 1,828,125 0.95 600,000 VF Ukraine PAT via VFU Funding Plc ‘REGS’
6.200% 11-Feb-2025 595,500 0.31
United Arab Emirates - 10,265,332 (31 December 2019: 1,022,540) 10,265,332 5.34
3,900,000 Abu Dhabi Government International Bond ‘REGS’ 2.500% 30-Sep-2029 4,098,003 2.13
1,400,000 DP World Crescent Ltd ‘REGS’ 3.908% 31-May-2023 1,457,960 0.76 950,000 DP World Plc ‘REGS’ 4.700% 30-Sep-2049 937,413 0.49 3,800,000 DP World Salaam FRN (Perpetual)
6.000% 01-Oct-2025 3,771,956 1.96
Total investments in bonds 185,721,421 96.62
Description
Fair value USD
Total net assets
%USD
03613-1A.indd 150 19/08/2020 19:00

151
Schedule of investments – as at 30 June 2020
BNy MELLON EMERGING MARKETS DEBT TOTAL RETURN FUND
Forward foreign currency contracts cont’d.Unrealised
Gain/(Loss)Buy Sell Amount (B) Amount (S)Settle
Date Counterparty
BNy Mellon Emerging Markets Debt Total Return Fund cont’d.South African rand US dollar 49,224,000 2,961,619 27-Jul-20 Morgan Stanley (133,244)South African rand US dollar 16,400,000 947,415 27-Jul-20 Bank of America
Merrill Lynch (5,083)South African rand US dollar 15,079,000 867,813 27-Jul-20 Goldman Sachs (1,384)South African rand US dollar 30,842,000 1,827,469 27-Jul-20 Bank of America
Merrill Lynch (55,311)US dollar Euro 2,828,831 2,594,000 27-Jul-20 BNP Paribas (87,223)US dollar Euro 1,868,027 1,665,000 27-Jul-20 Natwest
Markets Plc (3,689)US dollar Euro 1,774,029 1,579,000 27-Jul-20 Natwest
Markets Plc (1,010)US dollar Euro 1,308,702 1,168,000 27-Jul-20 Natwest
Markets Plc (4,309)US dollar Euro 8,681,152 8,000,000 27-Jul-20 Bank of America
Merrill Lynch (312,076)US dollar Mexican peso 4,099,000 100,666,000 27-Jul-20 Barclays Bank PLC (265,097)US dollar South African rand 5,130,127 96,294,000 27-Jul-20 RBC Capital
Markets (402,855)
USD (2,583,975)
Net USD (1,363,117)
BNy Mellon Emerging Markets Debt Total Return Fund EUR H (Acc) (Hedged) Share ClassEuro US dollar 98,002 111,333 15-Jul-20 The Bank of
New York Mellon (1,195)
USD (1,195)
EUR (1,064)
BNy Mellon Emerging Markets Debt Total Return Fund EUR W (Acc) (Hedged) Share ClassEuro US dollar 6,900 7,839 15-Jul-20 The Bank of
New York Mellon (84)
USD (84)
EUR (75)
BNy Mellon Emerging Markets Debt Total Return Fund Sterling E (Inc) (Hedged) Share ClassUS dollar Sterling 67,770 54,551 15-Jul-20 The Bank of
New York Mellon 170US dollar Sterling 49,045 39,491 15-Jul-20 The Bank of
New York Mellon 107US dollar Sterling 102 82 15-Jul-20 The Bank of
New York Mellon 1US dollar Sterling 124,580 99,259 15-Jul-20 The Bank of
New York Mellon 1,578US dollar Sterling 23,995 19,051 15-Jul-20 The Bank of
New York Mellon 387US dollar Sterling 277,988 221,946 15-Jul-20 The Bank of
New York Mellon 2,950US dollar Sterling 73,655 57,678 15-Jul-20 The Bank of
New York Mellon 2,180US dollar Sterling 17,664 13,871 15-Jul-20 The Bank of
New York Mellon 475
USD 7,848
GBp 6,334
Forward foreign currency contracts cont’d.Unrealised
Gain/(Loss)Buy Sell Amount (B) Amount (S)Settle
Date Counterparty
BNy Mellon Emerging Markets Debt Total Return FundUS dollar Brazilian real 2,987,078 16,042,551 02-Jul-20 Goldman Sachs 37,049US dollar Brazilian real 1,845,887 9,716,011 02-Jul-20 BNP Paribas 59,232Russian rouble US dollar 77,600,000 1,051,935 17-Jul-20 Barclays Bank PLC 36,135US dollar Chilean peso 2,443,793 2,000,000,000 17-Jul-20 Citigroup Global
Markets Limited 8,191US dollar Peruvian nuevo sol 2,710,422 9,300,000 17-Jul-20 BNP Paribas 85,231Czech koruna US dollar 62,341,000 2,440,108 27-Jul-20 JPMorgan Chase
Bank 188,163Hungarian forint US dollar 697,393,000 2,120,474 27-Jul-20 Citigroup Global
Markets Limited 91,589Polish zloty US dollar 12,506,000 2,952,855 27-Jul-20 BNP Paribas 208,445Romanian leu US dollar 779,000 172,650 27-Jul-20 Citigroup Global
Markets Limited 8,008South African rand US dollar 5,226,000 299,145 27-Jul-20 Bank of America
Merrill Lynch 1,137Thai baht US dollar 43,900,000 1,396,533 27-Jul-20 Goldman Sachs 23,720Thai baht US dollar 63,263,000 1,969,129 27-Jul-20 UBS AG 77,555US dollar Mexican peso 2,937,543 64,183,733 27-Jul-20 JPMorgan Chase
Bank 155,034US dollar Mexican peso 2,585,307 58,321,862 27-Jul-20 BNP Paribas 56,924US dollar Mexican peso 1,254,430 28,900,000 27-Jul-20 BNP Paribas 1,550US dollar South African rand 1,916,008 32,461,063 27-Jul-20 Morgan Stanley 50,820US dollar South African rand 927,525 15,659,467 27-Jul-20 Bank of America
Merrill Lynch 27,743US dollar South African rand 1,108,273 19,272,492 27-Jul-20 Bank of America
Merrill Lynch 890US dollar South African rand 1,996,397 34,449,000 27-Jul-20 Goldman Sachs 16,983US dollar Brazilian real 3,344,979 17,750,800 04-Aug-20 Goldman Sachs 86,459
USD 1,220,858
South African rand US dollar 34,449,000 2,002,046 01-Jul-20 Goldman Sachs (16,799)Brazilian real US dollar 17,750,800 3,348,576 02-Jul-20 Goldman Sachs (84,421)Brazilian real US dollar 8,000,000 1,562,980 02-Jul-20 BNP Paribas (91,878)Brazilian real US dollar 9,624,625 1,898,015 02-Jul-20 JPMorgan Chase
Bank (128,164)US dollar Brazilian real 1,765,696 9,616,863 02-Jul-20 Citigroup Global
Markets Limited (2,727)Chilean peso US dollar 730,000,000 930,041 17-Jul-20 Goldman Sachs (41,046)Chilean peso US dollar 1,100,000,000 1,354,063 17-Jul-20 Citigroup Global
Markets Limited (14,482)Chilean peso US dollar 1,750,000,000 2,148,359 17-Jul-20 BNP Paribas (17,207)Chilean peso US dollar 450,000,000 548,499 17-Jul-20 BNP Paribas (489)Chilean peso US dollar 449,000,000 547,456 17-Jul-20 HSBC Bank plc (664)Colombian peso US dollar 3,500,000,000 935,169 17-Jul-20 JPMorgan Chase
Bank (5,065)Colombian peso US dollar 3,500,000,000 935,744 17-Jul-20 Citigroup Global
Markets Limited (5,640)Colombian peso US dollar 3,500,000,000 934,809 17-Jul-20 JPMorgan Chase
Bank (4,705)US dollar Chilean peso 6,235,636 5,141,843,000 17-Jul-20 Barclays Bank PLC (26,106)US dollar Colombian peso 1,194,754 4,683,675,628 17-Jul-20 Citigroup Global
Markets Limited (49,904)US dollar Indonesian rupiah 5,170,795 78,585,737,380 17-Jul-20 Citigroup Global
Markets Limited (270,325)US dollar Indonesian rupiah 2,232,334 33,900,000,000 17-Jul-20 Bank of America
Merrill Lynch (114,834)US dollar Russian rouble 7,359,648 544,945,162 17-Jul-20 Goldman Sachs (281,313)Euro US dollar 1,000,000 1,139,737 27-Jul-20 BNP Paribas (15,584)Euro US dollar 765,000 861,182 27-Jul-20 BNP Paribas (1,205)Euro US dollar 240,000 270,078 27-Jul-20 Natwest
Markets Plc (281)Euro US dollar 1,900,000 2,145,070 27-Jul-20 Bank of America
Merrill Lynch (9,178)Mexican peso US dollar 7,722,000 341,536 27-Jul-20 BNP Paribas (6,770)Mexican peso US dollar 41,889,073 1,859,461 27-Jul-20 BNP Paribas (43,476)Mexican peso US dollar 41,889,073 1,861,623 27-Jul-20 JPMorgan Chase
Bank (45,638)South African rand US dollar 31,910,348 1,868,338 27-Jul-20 BNP Paribas (34,793)
03613-1A.indd 151 19/08/2020 19:00

152
Schedule of investments – as at 30 June 2020
BNy MELLON EMERGING MARKETS DEBT TOTAL RETURN FUND
Forward foreign currency contracts cont’d.Unrealised
Gain/(Loss)Buy Sell Amount (B) Amount (S)Settle
Date Counterparty
BNy Mellon Emerging Markets Debt Total Return Fund Sterling E (Inc) (Hedged) Share Class cont’d.Sterling US dollar 1,649 2,055 15-Jul-20 The Bank of
New York Mellon (12)Sterling US dollar 7,500,000 9,429,072 15-Jul-20 The Bank of
New York Mellon (134,960)Sterling US dollar 1,200 1,528 15-Jul-20 The Bank of
New York Mellon (41)Sterling US dollar 96,656,230 122,850,819 15-Jul-20 The Bank of
New York Mellon (3,072,967)US dollar Sterling 9,270 7,500 15-Jul-20 The Bank of
New York Mellon (24)
USD (3,208,004)
GBp (2,588,978)
Net USD (3,200,156)
Net GBp (2,582,644)
BNy Mellon Emerging Markets Debt Total Return Fund Sterling W (Acc) (Hedged) Share ClassUS dollar Sterling 39,193 31,292 15-Jul-20 The Bank of
New York Mellon 416
USD 416
GBp 336
Sterling US dollar 320,658 407,559 15-Jul-20 The Bank of New York Mellon (10,195)
USD (10,195)
GBp (8,228)
Net USD (9,779)
Net GBp (7,892)
03613-1A.indd 152 19/08/2020 19:00

153
Schedule of investments – as at 30 June 2020
Holdings Description
Fair value
Total net assets
% Holdings Description
Fair value
Total net assets
%
FUND 18 – BNy MELLON EUROLAND BOND FUND
BNY MELLON EUROLAND BOND FUND
Collective investment schemes
Ireland - 15,454,797 (31 December 2019: 30,612,679) 15,454,797 2.88
5,087,338 BNY Mellon Efficient U.S. High Yield Beta Fund ^ 4,806,138 0.89 2,576,582 BNY Mellon Emerging Markets Debt Fund ^ 2,235,100 0.42 7,976,912 BNY Mellon U.S. Municipal Infrastructure
Debt Fund ^ 8,413,559 1.57
Total investments in collective investment schemes 15,454,797 2.88
Bonds
Australia - 3,435,880 (31 December 2019: 11,016,548) 3,435,880 0.64
2,241,749 Driver Australia Five Trust 1.020% 21-Jul-2026 1,375,236 0.26 3,385,000 Queensland Treasury Corp ‘144A’
1.750% 20-Jul-2034 2,060,644 0.38
Belgium - 19,652,289 (31 December 2019: 40,222,394) 19,652,289 3.66
4,300,000 Anheuser-Busch InBev SA/NV 3.700% 02-Apr-2040 5,247,118 0.98
2,250,000 Anheuser-Busch InBev SA/NV ‘EMTN’ 1.650% 28-Mar-2031 2,324,894 0.43
9,425,000 Kingdom of Belgium Government Bond ‘144A’ 1.900% 22-Jun-2038 12,080,277 2.25
Brazil - 1,719,714 (31 December 2019: 710,582) 1,719,714 0.32
2,000,000 Brazilian Government International Bond 3.875% 12-Jun-2030 1,719,714 0.32
Canada - 904,289 (31 December 2019: 3,324,700) 904,289 0.17
475,000 Nutrien Ltd 1.900% 13-May-2023 436,600 0.08 480,000 Teck Resources Ltd 6.250% 15-Jul-2041 467,689 0.09
Chile - 593,302 (31 December 2019: –) 593,302 0.11
650,000 VTR Comunicaciones SpA ‘REGS’ 5.125% 15-Jan-2028 593,302 0.11
Croatia - 1,837,123 (31 December 2019: –) 1,837,123 0.34
850,000 Croatia Government International Bond 1.500% 17-Jun-2031 851,751 0.16
875,000 Croatia Government International Bond 2.750% 27-Jan-2030 985,372 0.18
Cyprus - 9,176,742 (31 December 2019: –) 9,176,742 1.71
1,265,000 Cyprus Government International Bond ‘EMTN’ 1.250% 21-Jan-2040 1,238,365 0.23
4,125,000 Cyprus Government International Bond ‘EMTN’ 2.250% 16-Apr-2050 4,618,680 0.86
2,680,000 Cyprus Government International Bond ‘EMTN’ 2.750% 03-May-2049 3,319,697 0.62
Estonia - 1,504,470 (31 December 2019: –) 1,504,470 0.28
1,500,000 Estonia Government International Bond 0.125% 10-Jun-2030 1,504,470 0.28
France - 91,419,495 (31 December 2019: 163,890,704) 91,419,495 17.03
7,000,000 Airbus SE 2.000% 07-Apr-2028 7,392,140 1.38 4,100,000 AXA SA ‘EMTN’ FRN (Perpetual)
3.875% 08-Oct-2025 4,476,540 0.83 5,030,000 BNP Paribas SA ‘EMTN’ 1.125% 10-Oct-2023 5,131,909 0.96 2,000,000 BNP Paribas SA ‘EMTN’ 1.375% 28-May-2029 2,088,328 0.39 4,200,000 Credit Agricole SA/London ‘EMTN’
1.750% 05-Mar-2029 4,524,998 0.84 1,400,000 Engie SA ‘EMTN’ 1.750% 27-Mar-2028 1,515,836 0.28 2,400,000 Engie SA FRN (Perpetual) 1.375% 16-Jan-2023 2,339,736 0.44 3,800,000 Engie SA FRN (Perpetual) 3.875% 02-Jun-2024 4,061,902 0.76 14,609,203 French Republic Government Bond OAT ‘144A’
0.700% 25-Jul-2030 17,103,724 3.19 4,100,000 Orange SA ‘EMTN’ 0.000% 04-Sep-2026 3,999,489 0.74 3,800,000 Orange SA ‘EMTN’ 1.625% 07-Apr-2032 4,133,925 0.77 2,000,000 Orange SA ‘EMTN’ FRN (Perpetual)
5.000% 01-Oct-2026 2,323,258 0.43 1,200,000 Sanofi ‘EMTN’ 1.000% 01-Apr-2025 1,253,010 0.23 4,300,000 Sanofi ‘EMTN’ 1.500% 01-Apr-2030 4,775,795 0.89 7,100,000 Societe Du Grand Paris EPIC ‘EMTN’
1.700% 25-May-2050 8,786,962 1.64 2,500,000 Societe Generale SA ‘EMTN’ 1.000% 01-Apr-2022 2,522,870 0.47 4,800,000 Societe Generale SA ‘EMTN’ 1.125% 23-Jan-2025 4,843,864 0.90 2,900,000 Total Capital International SA ‘EMTN’
1.994% 08-Apr-2032 3,263,530 0.61 3,765,000 TOTAL SA ‘EMTN’ FRN (Perpetual)
1.750% 04-Apr-2024 3,722,769 0.69 3,000,000 Veolia Environnement SA ‘EMTN’
1.250% 15-Apr-2028 3,158,910 0.59
Germany - 33,576,522 (31 December 2019: 119,367,290) 33,576,522 6.25
3,900,000 Allianz SE ‘EMTN’ FRN (Perpetual) 4.750% 24-Oct-2023 4,291,436 0.80
3,600,000 Allianz SE FRN 5.625% 17-Oct-2042 3,962,074 0.74 3,800,000 Allianz SE FRN (Perpetual)
3.375% 18-Sep-2024 4,037,086 0.75 2,235,000 Bundesrepublik Deutschland Bundesanleihe
2.500% 15-Aug-2046 3,754,275 0.70 3,000,000 Daimler AG ‘EMTN’ 1.000% 15-Nov-2027 2,910,581 0.54 3,675,000 E.ON SE ‘EMTN’ 1.000% 07-Oct-2025 3,811,177 0.71 3,970,000 Kreditanstalt fuer Wiederaufbau ‘EMTN’
0.375% 23-Apr-2030 4,206,133 0.78 4,300,000 Siemens Financieringsmaatschappij NV ‘EMTN’
0.250% 20-Feb-2029 4,242,423 0.79 2,300,000 Volkswagen International Finance NV
1.875% 30-Mar-2027 2,361,337 0.44
Greece - 5,593,989 (31 December 2019: –) 5,593,989 1.04
500,000 Hellenic Republic Government Bond ‘144A’ 1.500% 18-Jun-2030 514,898 0.09
4,725,000 Hellenic Republic Government Bond ‘144A’ 2.000% 22-Apr-2027 5,079,091 0.95
Hungary - 3,444,113 (31 December 2019: 1,585,807) 3,444,113 0.64
2,275,000 Hungary Government International Bond 1.625% 28-Apr-2032 2,290,151 0.42
Bonds cont’d.
EUR EUR
03613-1A.indd 153 19/08/2020 19:00

154
Schedule of investments – as at 30 June 2020
Holdings Description
Fair value
Total net assets
% Holdings Description
Fair value
Total net assets
%
BNy MELLON EUROLAND BOND FUND
Bonds cont’d.
Hungary cont’d. Kazakhstan - 324,685 (31 December 2019: 5,969,672) 324,685 0.06
350,000 Development Bank of Kazakhstan JSC ‘REGS’ 4.125% 10-Dec-2022 324,685 0.06
Latvia - 10,329,250 (31 December 2019: –) 10,329,250 1.92
10,000,000 Latvia Government International Bond 0.375% 07-Oct-2026 10,329,250 1.92
Lithuania - 3,106,938 (31 December 2019: –) 3,106,938 0.58
2,915,000 Lithuania Government International Bond ‘EMTN’ 0.750% 06-May-2030 3,106,938 0.58
Luxembourg - 1,680,130 (31 December 2019: 3,457,752) 1,680,130 0.31
1,550,000 Prologis International Funding II SA ‘EMTN’ 1.750% 15-Mar-2028 1,680,130 0.31
Macau - 977,990 (31 December 2019: –) 977,990 0.18
1,050,000 Sands China Ltd ‘REGS’ 4.375% 18-Jun-2030 977,990 0.18
Mexico - 1,129,262 (31 December 2019: 2,540,614) 1,129,262 0.21
410,000 Infraestructura Energetica Nova SAB de CV ‘REGS’ 4.875% 14-Jan-2048 347,340 0.06
795,000 Petroleos Mexicanos ‘EMTN’ 5.125% 15-Mar-2023 781,922 0.15
Netherlands - 39,051,487 (31 December 2019: 44,679,009) 39,051,487 7.27
1,600,000 ABN AMRO Bank NV ‘EMTN’ FRN 2.875% 18-Jan-2028 1,663,413 0.31
3,905,000 Cooperatieve Rabobank UA FRN 2.500% 26-May-2026 3,945,436 0.73
3,700,000 Heineken NV ‘EMTN’ 2.250% 30-Mar-2030 4,196,189 0.78 3,130,000 ING Bank NV ‘EMTN’ 3.625% 31-Aug-2021 3,277,012 0.61 4,700,000 ING Groep NV ‘EMTN’ FRN 2.500% 15-Feb-2029 4,893,432 0.91 2,300,000 ING Groep NV ‘EMTN’ FRN 3.000% 11-Apr-2028 2,415,466 0.45 1,200,000 ING Groep NV FRN 2.000% 22-Mar-2030 1,228,895 0.23 12,650,000 Netherlands Government Bond ‘144A’
2.000% 15-Jul-2024 14,015,924 2.61 3,100,000 Shell International Finance BV ‘EMTN’
1.875% 07-Apr-2032 3,415,720 0.64
Norway - 876,718 (31 December 2019: 2,140,995) 876,718 0.16
925,000 Equinor ASA 3.250% 18-Nov-2049 876,718 0.16
peru - 426,949 (31 December 2019: 840,503) 426,949 0.08
375,000 Southern Copper Corp 5.875% 23-Apr-2045 426,949 0.08
philippines - 2,101,124 (31 December 2019: 1,070,155) 2,101,124 0.39
1,250,000 Philippine Government International Bond 0.000% 03-Feb-2023 1,227,200 0.23
350,000 Philippine Government International Bond 3.700% 02-Feb-2042 357,563 0.07
525,000 Philippine Government International Bond ‘EMTN’ 0.875% 17-May-2027 516,361 0.09
150,000 Hungary Government International Bond 1.750% 05-Jun-2035 147,407 0.03
1,000,000 MFB Magyar Fejlesztesi Bank Zrt 1.375% 24-Jun-2025 1,006,555 0.19
Indonesia - 1,541,583 (31 December 2019: 3,964,832) 1,541,583 0.29
435,000 Indonesia Government International Bond 1.400% 30-Oct-2031 413,848 0.08
340,000 Indonesia Government International Bond ‘REGS’ 3.750% 14-Jun-2028 388,875 0.07
800,000 Perusahaan Perseroan Persero PT Perusahaan Listrik Negara ‘REGS’ 1.875% 05-Nov-2031 738,860 0.14
Ireland - 11,274,784 (31 December 2019: 10,460,036) 11,274,784 2.10
500,000 AerCap Ireland Capital DAC / AerCap Global Aviation Trust 2.875% 14-Aug-2024 418,320 0.08
470,000 AerCap Ireland Capital DAC / AerCap Global Aviation Trust 4.450% 01-Oct-2025 402,212 0.07
800,000 AerCap Ireland Capital DAC / AerCap Global Aviation Trust 6.500% 15-Jul-2025 747,387 0.14
1,250,000 Ireland Government Bond 0.200% 18-Oct-2030 1,276,500 0.24 6,780,000 Ireland Government Bond 2.400% 15-May-2030 8,430,365 1.57
Israel - 1,929,211 (31 December 2019: 1,147,314) 1,929,211 0.36
525,000 Israel Government International Bond ‘EMTN’ 1.500% 16-Jan-2029 562,398 0.11
1,250,000 Israel Government International Bond ‘EMTN’ 2.875% 29-Jan-2024 1,366,813 0.25
Italy - 56,549,457 (31 December 2019: 110,189,558) 56,549,457 10.53
3,550,000 Assicurazioni Generali SpA ‘EMTN’ FRN 5.500% 27-Oct-2047 4,057,181 0.76
4,250,000 Enel Finance International NV ‘EMTN’ 0.375% 17-Jun-2027 4,205,471 0.78
6,925,000 Italy Buoni Poliennali Del Tesoro 0.950% 15-Mar-2023 7,061,665 1.32
18,505,000 Italy Buoni Poliennali Del Tesoro 1.350% 15-Apr-2022 18,925,804 3.52
4,025,000 Italy Buoni Poliennali Del Tesoro ‘144A’ 1.650% 01-Dec-2030 4,155,526 0.77
3,125,000 Italy Buoni Poliennali Del Tesoro ‘144A’ 2.800% 01-Mar-2067 3,485,649 0.65
6,420,000 Italy Buoni Poliennali Del Tesoro ‘144A’ 3.250% 01-Sep-2046 7,831,135 1.46
5,025,000 Italy Buoni Poliennali Del Tesoro ‘144A’ 4.000% 01-Feb-2037 6,606,413 1.23
220,714 SME Grecale 2017 Srl ‘2017-1 A’ FRN 0.000% 22-Mar-2056 220,613 0.04
Japan - 2,465,807 (31 December 2019: 24,528,797) 2,465,807 0.46
1,700,000 Takeda Pharmaceutical Co Ltd 2.000% 09-Jul-2040 1,701,419 0.32
650,000 Takeda Pharmaceutical Co Ltd ‘REGS’ 3.000% 21-Nov-2030 764,388 0.14
Bonds cont’d.
EUR EUR
03613-1A.indd 154 19/08/2020 19:01

155
Schedule of investments – as at 30 June 2020
Holdings Description
Fair value
Total net assets
% Holdings Description
Fair value
Total net assets
%
BNy MELLON EUROLAND BOND FUND
4,000,000 Iberdrola International BV ‘EMTN’ FRN (Perpetual) 2.625% 26-Mar-2024 4,126,020 0.77
11,900,000 Repsol International Finance BV ‘EMTN’ 2.625% 15-Apr-2030 13,288,611 2.48
1,600,000 Repsol International Finance BV FRN 4.500% 25-Mar-2075 1,668,149 0.31
5,900,000 Spain Government Bond ‘144A’ 0.600% 31-Oct-2029 6,038,973 1.12
3,400,000 Spain Government Bond ‘144A’ 1.200% 31-Oct-2040 3,492,395 0.65
2,275,000 Spain Government Bond ‘144A’ 1.250% 31-Oct-2030 2,467,738 0.46
2,025,000 Spain Government Bond ‘144A’ 2.350% 30-Jul-2033 2,455,148 0.46
16,330,000 Spain Government Bond ‘144A’ 2.900% 31-Oct-2046 22,650,035 4.22
Supranational - 1,828,726 (31 December 2019: 9,092,027) 1,828,726 0.34
975,000 African Export-Import Bank/The ‘EMTN’ 5.250% 11-Oct-2023 925,768 0.17
970,000 Banque Ouest Africaine de Developpement ‘REGS’ 5.000% 27-Jul-2027 902,958 0.17
Switzerland - 6,583,238 (31 December 2019: 50,875) 6,583,238 1.23
50,000 Credit Suisse AG/Guernsey ‘EMTN’ 0.750% 17-Sep-2021 50,648 0.01
4,500,000 Nestle Finance International Ltd 0.375% 12-May-2032 4,434,637 0.83
1,900,000 Novartis Finance SA 1.375% 14-Aug-2030 2,097,953 0.39
Ukraine - 2,205,088 (31 December 2019: 4,459,060) 2,205,088 0.41
575,000 Ukraine Government International Bond FRN 0.000% 31-May-2040 475,189 0.09
1,025,000 Ukraine Government International Bond ‘REGS’ 7.750% 01-Sep-2020 916,423 0.17
875,000 Ukraine Government International Bond ‘REGS’ 7.750% 01-Sep-2022 813,476 0.15
United Kingdom - 23,151,474 (31 December 2019: 13,914,108) 23,151,474 4.31
1,535,000 Barclays Plc ‘EMTN’ FRN 2.000% 07-Feb-2028 1,507,356 0.28 3,150,000 Barclays Plc ‘EMTN’ FRN 3.375% 02-Apr-2025 3,381,887 0.63 2,775,000 BP Capital Markets Plc 2.822% 07-Apr-2032 3,188,059 0.59 1,700,000 BP Capital Markets Plc ‘EMTN’
1.231% 08-May-2031 1,684,384 0.31 4,200,000 BP Capital Markets Plc FRN (Perpetual)
4.375% 22-Jun-2025 3,803,735 0.71 1,425,000 CK Hutchison Group Telecom Finance SA
1.125% 17-Oct-2028 1,407,632 0.26 506,362 DLL UK Equipment Finance 2019-1 Plc
‘2019-1UK A’ FRN 0.929% 25-Mar-2028 557,391 0.11 3,825,000 Lloyds Bank Corporate Markets Plc ‘EMTN’
2.375% 09-Apr-2026 4,113,367 0.77 1,725,000 Sky Ltd ‘EMTN’ 2.500% 15-Sep-2026 1,945,451 0.36 960,000 Unilever NV 1.750% 25-Mar-2030 1,090,373 0.20 470,000 Vodafone Group Plc FRN 3.100% 03-Jan-2079 471,839 0.09
poland - 1,044,862 (31 December 2019: 2,198,881) 1,044,862 0.20
975,000 Republic of Poland Government International Bond ‘EMTN’ 1.125% 07-Aug-2026 1,044,862 0.20
portugal - 21,298,868 (31 December 2019: 8,925,808) 21,298,868 3.97
3,375,000 EDP Finance BV ‘EMTN’ 0.375% 16-Sep-2026 3,326,907 0.62 3,925,000 EDP Finance BV ‘EMTN’ 1.500% 22-Nov-2027 4,159,736 0.77 7,325,000 Portugal Obrigacoes do Tesouro OT ‘144A’
3.875% 15-Feb-2030 9,698,610 1.81 2,575,000 Portugal Obrigacoes do Tesouro OT ‘144A’
4.100% 15-Feb-2045 4,113,615 0.77
Republic of Serbia - 1,575,817 (31 December 2019: –) 1,575,817 0.29
1,500,000 Serbia International Bond ‘REGS’ 3.125% 15-May-2027 1,575,817 0.29
Romania - 1,386,455 (31 December 2019: 2,649,146) 1,386,455 0.26
475,000 Romanian Government International Bond ‘EMTN’ 2.875% 11-Mar-2029 492,563 0.09
825,000 Romanian Government International Bond ‘REGS’ 3.624% 26-May-2030 893,892 0.17
Russia - 720,440 (31 December 2019: 26,194,874) 720,440 0.14
700,000 Gazprom PJSC Via Gaz Capital SA 2.500% 21-Mar-2026 720,440 0.14
Singapore - 1,924,848 (31 December 2019: 3,673,656) 1,924,848 0.36
1,800,000 Temasek Financial I Ltd ‘GMTN’ 1.250% 20-Nov-2049 1,924,848 0.36
Slovakia - 805,475 (31 December 2019: –) 805,475 0.15
725,000 Slovakia Government Bond 1.000% 14-May-2032 805,475 0.15
Slovenia - 3,599,110 (31 December 2019: –) 3,599,110 0.67
3,300,000 Slovenia Government Bond 1.188% 14-Mar-2029 3,599,110 0.67
South Africa - 783,565 (31 December 2019: 1,547,862) 783,565 0.15
280,000 Anglo American Capital Plc ‘EMTN’ 1.625% 18-Sep-2025 281,284 0.05
505,000 Anglo American Capital Plc ‘EMTN’ 1.625% 11-Mar-2026 502,281 0.10
Spain - 64,912,289 (31 December 2019: 94,553,121) 64,912,289 12.09
400,000 Adif Alta Velocidad ‘EMTN’ 0.550% 30-Apr-2030 396,618 0.07 4,800,000 Banco Santander SA ‘EMTN’ 2.500% 18-Mar-2025 5,015,991 0.93 2,200,000 Iberdrola Finanzas SA ‘EMTN’
0.875% 16-Jun-2025 2,266,616 0.42 1,000,000 Iberdrola International BV ‘EMTN’
3.000% 31-Jan-2022 1,045,995 0.20
Bonds cont’d. Bonds cont’d.
Spain cont’d.
EUR EUR
03613-1A.indd 155 19/08/2020 19:01

156
Schedule of investments – as at 30 June 2020
Holdings Description
Fair value
Total net assets
% Holdings Description
Fair value
Total net assets
%
BNy MELLON EUROLAND BOND FUND
850,000 InTown Hotel Portfolio Trust 2018-STAY ‘2018-STYX B’ FRN 1.235% 15-Jan-2033 706,400 0.13
1,650,000 John Deere Cash Management SA ‘EMTN’ 2.200% 02-Apr-2032 1,869,524 0.35
1,175,000 JPMorgan Chase & Co FRN 2.956% 13-May-2031 1,111,582 0.21 425,000 Kraft Heinz Foods Co 4.625% 30-Jan-2029 408,072 0.08 410,000 Kraft Heinz Foods Co ‘REGS’ 3.875% 15-May-2027 381,905 0.07 335,000 Kraft Heinz Foods Co ‘REGS’ 4.250% 01-Mar-2031 316,822 0.06 215,000 Kraft Heinz Foods Co ‘REGS’ 4.875% 01-Oct-2049 195,174 0.04 175,000 Lamar Media Corp ‘REGS’ 3.750% 15-Feb-2028 147,340 0.03 1,090,000 Lennar Corp 4.750% 29-Nov-2027 1,054,782 0.20 1,170,000 Marsh & McLennan Cos Inc 1.979% 21-Mar-2030 1,292,779 0.24 300,000 Medtronic Global Holdings SCA
1.625% 07-Mar-2031 327,634 0.06 415,000 Microsoft Corp 2.525% 01-Jun-2050 387,293 0.07 700,000 Molina Healthcare Inc ‘REGS’
4.375% 15-Jun-2028 623,442 0.12 1,425,000 Occidental Petroleum Corp 8.875% 15-Jul-2030 1,269,942 0.24 875,000 PayPal Holdings Inc 2.300% 01-Jun-2030 815,190 0.15 325,000 Prologis LP 2.250% 15-Apr-2030 304,998 0.06 1,175,000 Quicken Loans LLC ‘REGS’ 5.750% 01-May-2025 1,071,874 0.20 1,080,000 SCF Equipment Trust 2016-1 LLC ‘2019-1X A2’
3.230% 20-Oct-2024 955,966 0.18 400,000 Sherwin-Williams Co/The 2.300% 15-May-2030 364,190 0.07 875,000 Southern California Edison Co
3.650% 01-Feb-2050 858,670 0.16 1,025,000 Sprint Spectrum Co LLC / Sprint Spectrum Co II LLC /
Sprint Spectrum Co III LLC ‘144A’ 4.738% 20-Mar-2025 993,401 0.18
2,125,000 Starbucks Corp 2.550% 15-Nov-2030 1,988,428 0.37 320,000 Starbucks Corp 3.500% 15-Nov-2050 301,507 0.06 320,000 Steel Dynamics Inc 2.400% 15-Jun-2025 293,677 0.05 400,000 Steel Dynamics Inc 3.250% 15-Jan-2031 363,924 0.07 375,000 Steel Dynamics Inc 3.450% 15-Apr-2030 349,632 0.06 1,125,000 T-Mobile USA Inc 4.750% 01-Feb-2028 1,059,407 0.20 300,000 United Rentals North America Inc
4.000% 15-Jul-2030 258,602 0.05 14,530,000 United States Treasury Bill (Zero Coupon)
0.000% 30-Jul-2020* 12,931,540 2.41 131,000 VICI Properties LP / VICI Note Co Inc ‘REGS’
3.500% 15-Feb-2025 109,877 0.02 280,000 Western Midstream Operating LP
3.100% 01-Feb-2025 237,024 0.04 370,000 Western Midstream Operating LP
4.050% 01-Feb-2030 318,254 0.06 285,000 Western Midstream Operating LP
4.650% 01-Jul-2026 244,235 0.04 375,000 Xcel Energy Inc 3.500% 01-Dec-2049 371,295 0.07
Total investments in bonds 500,743,326 93.26
Credit default swaps - 91,146 (31 December 2019: 1,691,286)
(8,750,000) CDS CDX North America Investment Grade Index Series 34 Version 1 1.000% 20-Jun-2025 91,146 0.02
Total credit default swaps 91,146 0.02
United States of America - 62,299,768 (31 December 2019: 67,356,395) 62,299,768 11.60
390,000 AbbVie Inc ‘REGS’ 4.250% 21-Nov-2049 422,661 0.08 290,000 AES Corp/The 6.000% 15-May-2026 268,722 0.05 1,900,000 Air Products and Chemicals Inc ‘EMTN’
0.500% 05-May-2028 1,910,916 0.36 525,000 Air Products and Chemicals Inc ‘EMTN’
0.800% 05-May-2032 528,937 0.10 675,000 American Electric Power Co Inc
3.250% 01-Mar-2050 625,817 0.12 2,250,000 Amgen Inc 2.300% 25-Feb-2031 2,100,657 0.39 630,000 AT&T Inc 1.800% 14-Sep-2039 592,974 0.11 800,000 AT&T Inc 2.050% 19-May-2032 832,568 0.15 525,000 AT&T Inc 2.350% 05-Sep-2029 573,344 0.11 650,000 Bank of America Corp ‘EMTN’ FRN
1.662% 25-Apr-2028 686,552 0.13 950,000 Bank of America Corp ‘MTN’ FRN
4.083% 20-Mar-2051 1,064,508 0.20 1,095,000 Berkshire Hathaway Inc 0.000% 12-Mar-2025 1,084,461 0.20 625,000 Carrier Global Corp ‘REGS’ 2.722% 15-Feb-2030 559,864 0.10 280,000 CCO Holdings LLC / CCO Holdings Capital Corp
4.500% 15-Aug-2030 255,116 0.05 430,000 CCO Holdings LLC / CCO Holdings Capital Corp ‘REGS’
4.500% 15-Aug-2030 391,786 0.07 500,000 Centene Corp 3.375% 15-Feb-2030 450,055 0.08 125,000 CenturyLink Inc ‘REGS’ 4.000% 15-Feb-2027 108,315 0.02 1,425,000 CGDB Commercial Mortgage Trust 2019-MOB
‘2019-MOBX A’ FRN 1.135% 15-Nov-2036 1,270,112 0.24 900,000 Cigna Corp 3.400% 15-Mar-2050 866,155 0.16 800,000 Comcast Corp 0.750% 20-Feb-2032 777,128 0.14 1,425,000 Crown Americas LLC / Crown Americas Capital Corp VI
4.750% 01-Feb-2026 1,297,009 0.24 275,000 CVS Health Corp 5.125% 20-Jul-2045 315,869 0.06 400,000 CyrusOne LP / CyrusOne Finance Corp
1.450% 22-Jan-2027 384,220 0.07 175,000 CyrusOne LP / CyrusOne Finance Corp
2.900% 15-Nov-2024 163,838 0.03 500,000 CyrusOne LP / CyrusOne Finance Corp
3.450% 15-Nov-2029 464,012 0.09 325,000 Danaher Corp 2.500% 30-Mar-2030 373,802 0.07 1,035,000 DH Europe Finance II Sarl 0.200% 18-Mar-2026 1,020,165 0.19 525,000 Diamondback Energy Inc 2.875% 01-Dec-2024 468,041 0.09 550,000 Diamondback Energy Inc 5.375% 31-May-2025 504,258 0.09 1,250,000 Digital Dutch Finco BV 1.500% 15-Mar-2030 1,280,938 0.24 420,000 Edison International 4.125% 15-Mar-2028 395,645 0.07 300,000 Elanco Animal Health Inc 5.650% 28-Aug-2028 297,243 0.05 450,000 Enterprise Products Operating LLC
2.800% 31-Jan-2030 417,987 0.08 1,285,000 EQT Corp 3.000% 01-Oct-2022 1,067,258 0.20 1,450,000 Fidelity National Information Services Inc
1.500% 21-May-2027 1,501,533 0.28 200,000 FirstEnergy Corp 2.050% 01-Mar-2025 184,044 0.03 1,375,000 General Electric Co FRN (Perpetual)
5.000% 21-Jan-2021 957,805 0.18 646,000 Genesis Energy LP / Genesis Energy Finance Corp
7.750% 01-Feb-2028 512,280 0.09 371,000 HCA Inc 3.500% 01-Sep-2030 318,460 0.06 275,000 HCA Inc 5.875% 01-Feb-2029 277,397 0.05 460,000 Healthcare Trust of America Holdings LP
3.500% 01-Aug-2026 442,934 0.08
Bonds cont’d.
United States of America cont’d.
Bonds cont’d.
EUR EUR
03613-1A.indd 156 19/08/2020 19:01

157
Schedule of investments – as at 30 June 2020
Holdings Description
Fair value
Total net assets
% Holdings Description
Fair value
Total net assets
%
BNy MELLON EUROLAND BOND FUND
Underlying exposure
EUR
Open futures contracts - (1,600,252) (31 December 2019: (571,150))
(16) Canadian 10 Year Treasury Bond Short Futures Contracts Exp Sep-2020 (1,613,569) (5,665) (0.00)
(327) Euro-Bund Short Futures Contracts Exp Sep-2020 (57,722,040) (325,250) (0.06)
(93) Euro-Buxl 30 Year Bond Short Futures Contracts Exp Sep-2020 (20,456,280) (933,100) (0.18)
(485) U.S. 10 Year Treasury Note Short Futures Contracts Exp Sep-2020 (60,078,602) (126,999) (0.02)
(19) U.S. 10 Year Ultra Treasury Note Short Futures Contracts Exp Sep-2020 (2,663,285) (24,481) (0.01)
(64) U.S. 2 Year Treasury Note Short Futures Contracts Exp Sep-2020 (12,579,430) (87) (0.00)
(4) U.S. Treasury Bond Short Futures Contracts Exp Sep-2020 (635,736) (3,115) (0.00)
(112) U.S. Treasury Ultra Bond Short Futures Contracts Exp Sep-2020 (21,747,648) (167,791) (0.03)
(78) UK Long Gilt Short Futures Contracts Exp Sep-2020 (11,840,565) (13,764) (0.00)
Total open futures contracts (1,600,252) (0.30) Unrealised loss on forward foreign currency contracts - (877,792) (see below) (31 December 2019: (1,806,177)) (877,792) (0.17)
Total financial liabilities at fair value through profit or loss (2,976,244) (0.56)
Net current assets 19,266,442 3.60
Total net assets 536,899,130 100.00
* part of the holding is held as collateral by Bank of America Merrill Lynch in respect of futures contracts held by the Fund and by UBS AG in respect of forward foreign currency contracts held by the Fund.
^ Investment in other Funds of the Company.The counteparty for credit default swaps is Bank of America Merrill Lynch.The counterparty for currency options is Citigroup Global Markets Limited.The counterparty for interest rate swaps is Bank of America Merrill Lynch.The counterparty for futures contracts is Bank of America Merrill Lynch.
Analysis of portfolio % of Total Assets
Transferable securities and money market instruments admitted to official stock exchange listing or traded on a regulated market 87.39Financial derivative instruments dealt in on a regulated market 0.27oTC financial derivative instruments 0.47other current assets 11.87
Total assets 100.00
Currency options - 491 (31 December 2019: 171,704)
9,990,000 US dollar/Russian rouble Put 31-Jul-2020 62.500 491 0.00
Total currency options 491 0.00
Interest rate swaps - 2,492,707 (31 December 2019: 1,507,737)
61,400,000 IRS Receive Fixed 0.131% Pay Euro EURIBOR-Reuters Index 6 Months 06-Mar-2022 546,556 0.10
27,100,000 IRS Receive Fixed 0.748% Pay Euro EURIBOR-Reuters Index 6 Months 06-Mar-2027 1,946,151 0.36
Total interest rate swaps 2,492,707 0.46
Holdings Description
Underlying exposure
EUR
Fair value
EUR
Total net assets
%
Open futures contracts - 1,622,386 (31 December 2019: 3,626,095)
110 Euro-Bobl Long Futures Contracts Exp Sep-2020 14,847,800 77,252 0.01
202 Euro-BTP Long Futures Contracts Exp Sep-2020 29,063,760 630,150 0.12
100 Euro-OAT Long Futures Contracts Exp Sep-2020 16,765,000 223,000 0.04
141 Euro-Schatz Long Futures Contracts Exp Sep-2020 15,811,740 11,985 0.00
(1) Japanese 10 Year Bond Short Futures Contracts Exp Sep-2020 (1,252,576) 82 0.00
449 SFE 10 Year Australian Treasury Bond Long Futures Contracts Exp Sep-2020 41,034,964 470,792 0.09
759 U.S. 5 Year Treasury Note Long Futures Contracts Exp Sep-2020 84,947,263 209,125 0.04
Total open futures contracts 1,622,386 0.30 Unrealised gain on forward foreign currency contracts - 204,079 (see below) (31 December 2019: 2,292,120) 204,079 0.04
Total financial assets at fair value through profit or loss 520,608,932 96.96
Credit default swaps - (498,200) (31 December 2019: –)
(6,004,000) CDS CDX North America High Yield Index Series 34 Version 1 5.000% 20-Jun-2025 (36,713) (0.00)
(32,537,500) CDS CDX North America High Yield Index Series 34 Version 1 5.000% 20-Jun-2025 (198,958) (0.04)
(8,200,000) CDS iTraxx Europe Sub Financials Series 33 Version 1 1.000% 20-Jun-2025 (262,529) (0.05)
Total credit default swaps (498,200) (0.09)
EUR EUR
03613-1A.indd 157 19/08/2020 19:01

158
Schedule of investments – as at 30 June 2020
BNy MELLON EUROLAND BOND FUND
Forward foreign currency contracts cont’d.Unrealised
Gain/(Loss)Buy Sell Amount (B) Amount (S)Settle
Date Counterparty
BNy Mellon Euroland Bond FundUS dollar Euro 650,000 577,046 01-Jul-20 JPMorgan Chase
Bank1,502
Canadian dollar Euro 3,500,000 2,283,226 31-Jul-20 Goldman Sachs 10,109Euro Sterling 1,790,413 1,620,000 31-Jul-20 Goldman Sachs 4,563Euro Swiss franc 1,992,652 2,120,000 31-Jul-20 Citigroup Global
Markets Limited 555Swedish krona Euro 64,500,000 6,132,251 31-Jul-20 UBS AG 26,976Swiss franc Euro 4,100,000 3,833,240 31-Jul-20 Morgan Stanley 19,400US dollar Euro 960,000 853,755 31-Jul-20 HSBC Bank plc 142US dollar Euro 2,840,000 2,520,615 31-Jul-20 UBS AG 5,496US dollar Euro 2,230,000 1,983,353 31-Jul-20 Citigroup Global
Markets Limited 178Polish zloty Euro 49,900,000 11,158,318 17-Sep-20 Morgan Stanley 51,192US dollar Korean won 638,247 758,110,000 17-Sep-20 UBS AG 5,273
EUR 125,386
Euro US dollar 852,467 957,952 01-Jul-20 HSBC Bank plc (181)Euro Australian dollar 10,398,008 16,945,000 31-Jul-20 UBS AG (5,134)Euro Canadian dollar 4,561,365 6,985,000 31-Jul-20 Citigroup Global
Markets Limited (15,476)Euro Sterling 1,387,851 1,260,000 31-Jul-20 HSBC Bank plc (1,144)Euro Swiss franc 2,531,930 2,700,000 31-Jul-20 UBS AG (5,174)Euro US dollar 1,267,049 1,430,000 31-Jul-20 Morgan Stanley (4,901)Euro US dollar 576,669 650,000 31-Jul-20 JPMorgan Chase
Bank (1,491)Euro US dollar 10,000,000 11,274,400 31-Jul-20 JPMorgan Chase
Bank (28,304)Euro US dollar 102,790,392 115,890,000 31-Jul-20 JPMorgan Chase
Bank (290,943)Euro US dollar 2,307,665 2,600,000 31-Jul-20 Goldman Sachs (4,972)Euro US dollar 346,001 390,000 31-Jul-20 JPMorgan Chase
Bank (894)Japanese yen Euro 2,137,940,000 17,764,140 31-Jul-20 HSBC Bank plc (145,468)New Zealand dollar Euro 8,190,000 4,707,627 31-Jul-20 JPMorgan Chase
Bank (6,414)Norwegian krone Euro 72,270,000 6,717,936 31-Jul-20 Citigroup Global
Markets Limited (38,660)US dollar Euro 8,700,000 7,744,377 31-Jul-20 Morgan Stanley (5,939)US dollar Euro 510,000 454,013 31-Jul-20 Morgan Stanley (380)US dollar Euro 2,000,000 1,782,241 31-Jul-20 UBS AG (3,289)Indian rupee US dollar 236,560,000 3,105,481 17-Sep-20 Barclays Bank PLC (324)Indian rupee US dollar 243,040,000 3,191,386 17-Sep-20 HSBC Bank plc (1,077)Mexican peso Euro 160,000,000 6,196,175 17-Sep-20 Barclays Bank PLC (74,715)Russian rouble US dollar 845,000,000 12,039,610 17-Sep-20 JPMorgan Chase
Bank (241,731)Thai baht US dollar 14,270,000 461,663 17-Sep-20 JPMorgan Chase
Bank (25)
EUR (876,636)
Net EUR (751,250)
Forward foreign currency contracts cont’d.Unrealised
Gain/(Loss)Buy Sell Amount (B) Amount (S)Settle
Date Counterparty
BNy Mellon Euroland Bond Fund CHF H (Hedged) Share ClassSwiss franc Euro 4,964,650 4,605,802 15-Jul-20 The Bank of
New York Mellon58,705
EUR 58,705
CHF 62,489
Euro Swiss franc 92,784 99,984 15-Jul-20 The Bank of New York Mellon (1,156)
EUR (1,156)
CHF (1,231)
Net EUR 57,549
Net CHF 61,258
BNy Mellon Euroland Bond Fund CHF I (Hedged) Share ClassSwiss franc Euro 1,690,364 1,568,184 15-Jul-20 The Bank of
New York Mellon 19,988
EUR 19,988
CHF 21,276
03613-1A.indd 158 19/08/2020 19:01

159
Schedule of investments – as at 30 June 2020
Holdings Description
Fair value
Total net assets
% Holdings Description
Fair value
Total net assets
%
FUND 19 – BNy MELLON EUROpEAN CREDIT FUND
BNY MELLON EUROPEAN CREDIT FUND
Collective investment schemes
Ireland - 2,956,339 (31 December 2019: 4,845,219) 2,956,339 4.05
7,071 BNY Mellon Emerging Markets Debt Fund ^ 1,103,011 1.51 1,815,589 BNY Mellon Global Short-Dated High Yield Bond Fund ^ 1,853,328 2.54
Total investments in collective investment schemes 2,956,339 4.05
Bonds
Australia - 1,410,912 (31 December 2019: 860,022) 1,410,912 1.93
108,000 Glencore Finance Europe Ltd ‘EMTN’ 1.250% 17-Mar-2021 108,161 0.15
350,000 Glencore Finance Europe Ltd ‘EMTN’ 1.750% 17-Mar-2025 352,068 0.48
312,000 Scentre Group Trust 1 / Scentre Group Trust 2 ‘REGS’ 4.375% 28-May-2030 307,168 0.42
300,000 SGSP Australia Assets Pty Ltd ‘EMTN’ 2.000% 30-Jun-2022 307,389 0.42
222,000 Telstra Corp Ltd 1.000% 23-Apr-2030 228,950 0.31 100,000 Telstra Corp Ltd ‘EMTN’ 1.375% 26-Mar-2029 107,176 0.15
Austria - 402,586 (31 December 2019: 1,203,015) 402,586 0.55
300,000 Erste Group Bank AG ‘EMTN’ 0.875% 22-May-2026 303,227 0.41
100,000 Raiffeisen Bank International AG ‘EMTN’ 0.375% 25-Sep-2026 99,359 0.14
Belgium - 1,440,600 (31 December 2019: 2,918,545) 1,440,600 1.97
499,000 Anheuser-Busch InBev SA/NV 3.700% 02-Apr-2040 608,705 0.83
110,000 Anheuser-Busch InBev SA/NV ‘EMTN’ 2.750% 17-Mar-2036 122,129 0.17
200,000 Elia Transmission Belgium SA ‘EMTN’ 0.875% 28-Apr-2030 204,899 0.28
300,000 Groupe Bruxelles Lambert SA 1.375% 23-May-2024 301,970 0.41 200,000 KBC Group NV ‘EMTN’ 0.750% 18-Oct-2023 202,897 0.28
Bermuda - 990,071 (31 December 2019: 1,031,512) 990,071 1.36
70,000 XLIT Ltd 5.250% 15-Dec-2043 84,353 0.12 100,000 XLIT Ltd 5.500% 31-Mar-2045 120,116 0.16 740,000 XLIT Ltd FRN 3.250% 29-Jun-2047 785,602 1.08
Czech Republic - 722,992 (31 December 2019: 735,709) 722,992 0.99
150,000 CEZ AS ‘EMTN’ 0.875% 21-Nov-2022 151,091 0.21 569,000 EP Infrastructure AS 1.659% 26-Apr-2024 571,901 0.78
Denmark - 944,057 (31 December 2019: 1,072,337) 944,057 1.29
200,000 Carlsberg Breweries A/S ‘EMTN’ 0.500% 06-Sep-2023 201,736 0.27
759,000 Nykredit Realkredit A/S ‘EMTN’ 0.625% 17-Jan-2025 742,321 1.02
Finland - 266,349 (31 December 2019: 269,335) 266,349 0.37
269,000 OP Corporate Bank plc ‘EMTN’ 0.375% 19-Jun-2024 266,349 0.37
France - 9,888,402 (31 December 2019: 8,591,485) 9,888,402 13.55
200,000 Aeroports de Paris 1.000% 05-Jan-2029 197,487 0.27 100,000 Aeroports de Paris 2.750% 02-Apr-2030 114,443 0.16 226,000 Airbus SE ‘EMTN’ 2.375% 07-Apr-2032 248,493 0.34 300,000 ALD SA ‘EMTN’ 0.875% 18-Jul-2022 294,636 0.40 200,000 APRR SA ‘EMTN’ 1.250% 18-Jan-2028 211,558 0.29 220,000 AXA SA ‘EMTN’ FRN (Perpetual)
3.875% 08-Oct-2025 240,048 0.33 600,000 BNP Paribas SA ‘EMTN’ 0.125% 04-Sep-2026 576,502 0.79 230,000 BNP Paribas SA ‘EMTN’ 1.125% 11-Jun-2026 234,329 0.32 300,000 BPCE SA 0.250% 15-Jan-2026 298,060 0.41 600,000 BPCE SA 0.625% 28-Apr-2025 609,489 0.84 200,000 Capgemini SE 2.375% 15-Apr-2032 220,822 0.30 50,000 CNP Assurances FRN 6.000% 14-Sep-2040 50,313 0.07 100,000 Credit Agricole SA 2.625% 17-Mar-2027 107,943 0.15 500,000 Credit Agricole SA ‘EMTN’ FRN
1.625% 05-Jun-2030 503,915 0.69 400,000 Credit Agricole SA/London ‘EMTN’
0.500% 24-Jun-2024 399,024 0.55 100,000 Credit Mutuel Arkea SA ‘EMTN’
0.875% 05-Oct-2023 101,874 0.14 200,000 Credit Mutuel Arkea SA ‘EMTN’ FRN
1.250% 11-Jun-2029 200,258 0.27 400,000 Credit Mutuel Arkea SA ‘EMTN’ FRN
1.875% 25-Oct-2029 400,974 0.55 300,000 Dassault Systemes SE 0.125% 16-Sep-2026 297,222 0.41 100,000 Electricite de France SA ‘EMTN’ 2.000% 09-Dec-2049 98,503 0.13 250,000 Electricite de France SA ‘EMTN’ 4.500% 12-Nov-2040 366,568 0.50 200,000 Engie SA ‘EMTN’ 0.500% 24-Oct-2030 195,656 0.27 300,000 Iliad SA 0.625% 25-Nov-2021 296,845 0.41 100,000 La Mondiale SAM 2.125% 23-Jun-2031 98,951 0.14 200,000 LVMH Moet Hennessy Louis Vuitton SE
0.125% 11-Feb-2028 196,675 0.27 400,000 Orange SA 1.200% 11-Jul-2034 401,010 0.55 427,000 RCI Banque SA ‘EMTN’ 1.125% 15-Jan-2027 401,239 0.55 200,000 RTE Reseau de Transport d’Electricite SADIR ‘EMTN’
1.500% 27-Sep-2030 222,343 0.30 200,000 SapphireOne Mortgages FCT 2016-2 ‘2016-2 C’ FRN
1.091% 25-Jun-2061 200,468 0.27 200,000 SapphireOne Mortgages FCT 2016-3 ‘2016-3 C’ FRN
1.341% 27-Jun-2061 200,747 0.28 300,000 Societe Generale SA 0.750% 25-Jan-2027 292,758 0.40 200,000 TDF Infrastructure SASU 2.500% 07-Apr-2026 205,078 0.28 200,000 Total Capital International SA ‘EMTN’
0.696% 31-May-2028 203,419 0.28 100,000 Total Capital International SA ‘EMTN’
0.952% 18-May-2031 102,679 0.14 200,000 Total Capital International SA ‘EMTN’
1.618% 18-May-2040 208,976 0.29 220,000 TOTAL SA ‘EMTN’ FRN (Perpetual)
2.708% 05-May-2023 223,850 0.31 222,000 TOTAL SA ‘EMTN’ FRN (Perpetual)
3.875% 18-May-2022 229,484 0.31 100,000 Unibail-Rodamco-Westfield SE ‘EMTN’
1.125% 28-Apr-2027 97,873 0.13 120,000 Unibail-Rodamco-Westfield SE ‘EMTN’
2.500% 04-Jun-2026 127,004 0.17 200,000 Veolia Environnement SA ‘EMTN’
1.250% 15-Apr-2028 210,886 0.29
Bonds cont’d.
EUR EUR
03613-1A.indd 159 19/08/2020 19:01

160
Schedule of investments – as at 30 June 2020
Holdings Description
Fair value
Total net assets
% Holdings Description
Fair value
Total net assets
%
BNy MELLON EUROpEAN CREDIT FUND
Italy - 3,388,201 (31 December 2019: 4,898,933) 3,388,201 4.64
100,000 Assicurazioni Generali SpA ‘EMTN’ FRN 5.000% 08-Jun-2048 111,865 0.15
314,000 Assicurazioni Generali SpA ‘EMTN’ FRN 5.500% 27-Oct-2047 358,745 0.49
651,000 Banco BPM SpA ‘EMTN’ 1.625% 18-Feb-2025 600,857 0.82 200,000 FCA Bank SpA/Ireland ‘EMTN’
1.000% 21-Feb-2022 198,974 0.27 440,000 Intesa Sanpaolo SpA ‘EMTN’
1.375% 18-Jan-2024 444,051 0.61 250,000 Mediobanca Banca di Credito Finanziario
SpA ‘EMTN’ 1.125% 23-Apr-2025 239,720 0.33 249,000 Terna Rete Elettrica Nazionale SpA ‘EMTN’
0.125% 25-Jul-2025 246,959 0.34 100,000 Terna Rete Elettrica Nazionale SpA ‘EMTN’
1.000% 10-Apr-2026 103,201 0.14 417,000 UniCredit SpA ‘EMTN’ FRN (Perpetual)
3.875% 03-Jun-2027 307,538 0.42 780,000 Unione di Banche Italiane SpA ‘EMTN’
0.750% 17-Oct-2022 776,291 1.07
Japan - 470,697 (31 December 2019: 476,769) 470,697 0.65
400,000 Takeda Pharmaceutical Co Ltd ‘REGS’ 3.000% 21-Nov-2030 470,697 0.65
Luxembourg - 1,107,972 (31 December 2019: 2,632,847) 1,107,972 1.52
306,000 Blackstone Property Partners Europe Holdings Sarl ‘EMTN’ 0.500% 12-Sep-2023 302,412 0.41
255,000 Blackstone Property Partners Europe Holdings Sarl ‘EMTN’ 1.750% 12-Mar-2029 252,710 0.35
100,000 Logicor Financing Sarl ‘EMTN’ 1.625% 15-Jul-2027 100,841 0.14
445,000 SES SA FRN (Perpetual) 4.625% 02-Jan-2022 452,009 0.62
Netherlands - 3,316,276 (31 December 2019: 4,495,402) 3,316,276 4.54
400,000 ABN AMRO Bank NV ‘EMTN’ 1.250% 28-May-2025 409,402 0.56
600,000 de Volksbank NV ‘EMTN’ 0.750% 25-Jun-2023 606,798 0.83 240,000 Enexis Holding NV ‘EMTN’ 0.750% 02-Jul-2031 245,962 0.34 500,000 ING Bank NV FRN 3.625% 25-Feb-2026 507,430 0.69 400,000 ING Groep NV ‘EMTN’ 1.000% 20-Sep-2023 408,576 0.56 100,000 ING Groep NV FRN 2.000% 22-Mar-2030 102,373 0.14 576,000 LeasePlan Corp NV 0.125% 13-Sep-2023 555,060 0.76 290,000 Nationale-Nederlanden Levensverzekering
Maatschappij NV FRN 9.000% 29-Aug-2042 336,955 0.46 130,000 Shell International Finance BV ‘EMTN’
1.875% 07-Apr-2032 143,720 0.20
portugal - 291,486 (31 December 2019: 303,525) 291,486 0.40
300,000 Caixa Geral de Depositos SA ‘EMTN’ 1.250% 25-Nov-2024 291,486 0.40
Slovakia - 122,572 (31 December 2019: 123,495) 122,572 0.17
113,000 Zapadoslovenska Energetika AS 1.750% 02-Mar-2028 122,572 0.17
Germany - 9,515,697 (31 December 2019: 8,396,023) 9,515,697 13.04
200,000 Allianz SE FRN 2.121% 08-Jul-2050 202,770 0.28 100,000 Aroundtown SA ‘EMTN’ 1.875% 19-Jan-2026 103,961 0.14 200,000 Bayer AG FRN 2.375% 12-Nov-2079 194,584 0.27 360,000 BMW Finance NV ‘EMTN’ 0.125% 13-Jul-2022 359,357 0.49 462,000 Commerzbank AG ‘EMTN’ 0.500% 28-Aug-2023 462,737 0.63 300,000 Commerzbank AG ‘EMTN’ FRN 4.000% 05-Dec-2030 301,070 0.41 243,000 Continental AG ‘EMTN’ 2.500% 27-Aug-2026 256,698 0.35 296,000 Daimler AG ‘EMTN’ 1.125% 06-Nov-2031 282,599 0.39 171,000 Daimler AG ‘EMTN’ 2.000% 22-Aug-2026 177,808 0.24 231,000 Daimler International Finance BV ‘EMTN’
0.625% 06-May-2027 218,976 0.30 200,000 Deutsche Bank AG ‘EMTN’ 1.625% 20-Jan-2027 197,666 0.27 149,000 Deutsche Bank AG ‘EMTN’ FRN 1.375% 10-Jun-2026 151,286 0.21 200,000 Deutsche Boerse AG FRN 1.250% 16-Jun-2047 199,568 0.27 300,000 Deutsche Telekom AG ‘EMTN’ 0.500% 05-Jul-2027 301,114 0.41 118,000 Deutsche Telekom AG ‘EMTN’ 1.375% 05-Jul-2034 121,467 0.17 300,000 Eurogrid GmbH ‘EMTN’ 1.113% 15-May-2032 317,193 0.43 100,000 Eurogrid GmbH ‘EMTN’ 1.500% 18-Apr-2028 108,109 0.15 200,000 Eurogrid GmbH ‘EMTN’ 1.625% 03-Nov-2023 209,472 0.29 200,000 HeidelbergCement Finance Luxembourg SA ‘EMTN’
1.625% 07-Apr-2026 204,909 0.28 200,000 Infineon Technologies AG ‘EMTN’ 1.625% 24-Jun-2029 200,115 0.27 100,000 Infineon Technologies AG ‘EMTN’ 2.000% 24-Jun-2032 99,924 0.14 400,000 Merck Financial Services GmbH ‘EMTN’
0.375% 05-Jul-2027 402,658 0.55 360,000 Merck KGaA FRN 2.625% 12-Dec-2074 362,448 0.50 292,000 Roadster Finance DAC ‘EMTN’ 1.625% 09-Dec-2024 289,674 0.40 73,000 Schaeffler AG ‘EMTN’ 2.875% 26-Mar-2027 72,489 0.10 233,000 Schaeffler Finance BV ‘REGS’
3.250% 15-May-2025 233,051 0.32 300,000 Siemens Financieringsmaatschappij NV ‘EMTN’
0.375% 05-Jun-2026 302,388 0.41 163,000 Siemens Financieringsmaatschappij NV ‘EMTN’
1.750% 28-Feb-2039 182,391 0.25 100,000 Volkswagen Bank GmbH ‘EMTN’ 1.250% 01-Aug-2022 100,467 0.14 319,000 Volkswagen Financial Services AG ‘EMTN’
1.375% 16-Oct-2023 321,069 0.44 337,000 Volkswagen Financial Services AG ‘EMTN’
3.375% 06-Apr-2028 376,471 0.52 200,000 Volkswagen International Finance NV
4.125% 16-Nov-2038 245,758 0.34 790,000 Volkswagen Leasing GmbH ‘EMTN’
0.500% 20-Jun-2022 781,476 1.07 200,000 Vonovia Finance BV 1.800% 29-Jun-2025 212,253 0.29 100,000 Vonovia Finance BV 2.250% 07-Apr-2030 111,710 0.15 100,000 Vonovia Finance BV ‘EMTN’ 0.625% 07-Oct-2027 98,933 0.14 600,000 Wintershall Dea Finance BV 1.332% 25-Sep-2028 563,784 0.77 200,000 Wintershall Dea Finance BV 1.823% 25-Sep-2031 187,294 0.26
Ireland - 1,148,720 (31 December 2019: 1,419,586) 1,148,720 1.57
129,000 ESB Finance DAC ‘EMTN’ 2.125% 05-Nov-2033 150,196 0.21 94,220 European Residential Loan Securitisation
2019-NPL1 DAC ‘2019-NPL1 A’ FRN 1.493% 24-Jul-2054 77,028 0.10
1,124,343 European Residential Loan Securitisation 2019-NPL2 DAC ‘2019-NPL2 A’ FRN 0.993% 24-Feb-2058 921,496 1.26
Bonds cont’d. Bonds cont’d.
EUR EUR
03613-1A.indd 160 19/08/2020 19:01

161
Schedule of investments – as at 30 June 2020
Holdings Description
Fair value
Total net assets
% Holdings Description
Fair value
Total net assets
%
BNy MELLON EUROpEAN CREDIT FUND
550,000 Barclays Plc ‘EMTN’ FRN 2.000% 07-Feb-2028 539,763 0.74 261,000 BAT International Finance Plc ‘EMTN’
2.250% 16-Jan-2030 271,828 0.37 286,000 BP Capital Markets Plc 1.876% 07-Apr-2024 300,588 0.41 200,000 BP Capital Markets Plc ‘EMTN’
1.953% 03-Mar-2025 212,498 0.29 165,000 BP Capital Markets Plc FRN (Perpetual)
3.250% 22-Mar-2026 166,237 0.23 121,000 BP Capital Markets Plc FRN (Perpetual)
3.625% 22-Mar-2029 121,908 0.17 115,000 Cadent Finance Plc ‘EMTN’ 0.750% 11-Mar-2032 112,858 0.15 310,000 CK Hutchison Group Telecom Finance SA
1.500% 17-Oct-2031 308,022 0.42 288,000 Diageo Finance Plc ‘EMTN’ 2.500% 27-Mar-2032 346,270 0.47 717,000 Dowson 2019-1 Plc ‘2019-1 B’ FRN
2.466% 20-Sep-2026 774,957 1.06 200,000 Heathrow Funding Ltd ‘EMTN’ 1.875% 14-Mar-2034 203,251 0.28 150,000 Imperial Brands Finance Plc ‘EMTN’
2.125% 12-Feb-2027 154,053 0.21 333,000 Lloyds Bank Corporate Markets Plc ‘EMTN’
0.375% 28-Jan-2025 327,665 0.45 210,000 Lloyds Banking Group Plc ‘EMTN’ FRN
0.500% 12-Nov-2025 204,849 0.28 203,000 National Grid Electricity Transmission Plc
0.190% 20-Jan-2025 203,556 0.28 100,000 NatWest Markets Plc ‘EMTN’ 1.000% 28-May-2024 99,666 0.14 185,000 NatWest Markets Plc ‘EMTN’ 2.750% 02-Apr-2025 197,942 0.27 100,000 RELX Finance BV 0.000% 18-Mar-2024 98,591 0.14 209,000 Standard Chartered Plc FRN 2.500% 09-Sep-2030 212,371 0.29 360,000 Tesco Corporate Treasury Services Plc ‘EMTN’
0.875% 29-May-2026 357,163 0.49 300,000 Tesco Corporate Treasury Services Plc ‘EMTN’
2.500% 01-Jul-2024 319,572 0.44 100,000 Unilever NV 1.750% 25-Mar-2030 113,775 0.16 452,000 Vodafone Group Plc 1.625% 24-Nov-2030 481,972 0.66 600,000 Vodafone Group Plc FRN 3.100% 03-Jan-2079 603,750 0.83
United States of America - 14,095,160 (31 December 2019: 16,902,913) 14,095,160 19.32
240,000 Abbott Ireland Financing DAC 0.875% 27-Sep-2023 245,716 0.34 300,000 AbbVie Inc ‘144A’ 0.500% 01-Jun-2021 300,164 0.41 100,000 Air Products and Chemicals Inc ‘EMTN’
0.500% 05-May-2028 100,773 0.14 100,000 Air Products and Chemicals Inc ‘EMTN’
0.800% 05-May-2032 100,930 0.14 1,201,000 Altria Group Inc 1.000% 15-Feb-2023 1,212,325 1.66 100,000 Altria Group Inc 2.200% 15-Jun-2027 105,496 0.14 337,000 AT&T Inc 0.250% 04-Mar-2026 325,264 0.45 436,000 AT&T Inc 1.950% 15-Sep-2023 451,798 0.62 108,000 AT&T Inc 2.050% 19-May-2032 112,608 0.15 351,000 AT&T Inc 3.550% 17-Dec-2032 423,168 0.58 170,000 Bank of America Corp ‘EMTN’ FRN
1.379% 07-Feb-2025 174,994 0.24 149,000 Bank of America Corp ‘EMTN’ FRN
1.662% 25-Apr-2028 156,795 0.21 316,000 Becton Dickinson Euro Finance Sarl
0.632% 04-Jun-2023 314,155 0.43 200,000 Celanese US Holdings LLC 1.125% 26-Sep-2023 197,185 0.27 290,000 Celanese US Holdings LLC 1.250% 11-Feb-2025 283,679 0.39
Spain - 4,498,769 (31 December 2019: 4,608,524) 4,498,769 6.17
100,000 Abertis Infraestructuras SA ‘EMTN’ 3.000% 27-Mar-2031 103,613 0.14
200,000 Banco Bilbao Vizcaya Argentaria SA ‘GMTN’ FRN 1.000% 16-Jan-2030 188,500 0.26
400,000 Banco de Sabadell SA FRN 2.000% 17-Jan-2030 336,500 0.46 100,000 Banco Santander SA ‘EMTN’ 1.375% 05-Jan-2026 101,489 0.14 300,000 Bankinter SA 0.625% 06-Oct-2027 283,338 0.39 500,000 CaixaBank SA ‘EMTN’ 0.375% 03-Feb-2025 491,768 0.67 200,000 CaixaBank SA ‘EMTN’ 1.375% 19-Jun-2026 199,730 0.27 300,000 CaixaBank SA ‘EMTN’ 1.750% 24-Oct-2023 305,055 0.42 219,000 FCC Aqualia SA 2.629% 08-Jun-2027 228,109 0.31 400,000 Inmobiliaria Colonial Socimi SA ‘EMTN’
1.625% 28-Nov-2025 400,810 0.55 300,000 Inmobiliaria Colonial Socimi SA ‘EMTN’
2.000% 17-Apr-2026 304,154 0.42 300,000 Kutxabank SA 0.500% 25-Sep-2024 286,596 0.39 313,000 Repsol International Finance BV FRN
4.500% 25-Mar-2075 326,415 0.45 178,000 Repsol International Finance BV FRN (Perpetual)
4.247% 11-Sep-2028 181,338 0.25 400,000 Santander Consumer Finance SA ‘EMTN’
0.375% 27-Jun-2024 394,868 0.54 158,684 Silverback Finance DAC 3.126% 25-Feb-2037 171,486 0.24 200,000 Telefonica Europe BV FRN (Perpetual)
2.625% 07-Mar-2023 195,000 0.27
Sweden - 1,088,186 (31 December 2019: 421,919) 1,088,186 1.49
192,000 Akelius Residential Property AB ‘EMTN’ 1.750% 07-Feb-2025 194,282 0.27
430,000 Skandinaviska Enskilda Banken AB ‘GMTN’ FRN 2.500% 28-May-2026 432,840 0.59
244,000 Swedbank AB ‘EMTN’ FRN 1.000% 22-Nov-2027 241,865 0.33 200,000 Telia Co AB ‘EMTN’ 2.125% 20-Feb-2034 219,199 0.30
Switzerland - 2,591,796 (31 December 2019: 2,177,908) 2,591,796 3.55
100,000 Argentum Netherlands BV for Givaudan SA 1.125% 17-Sep-2025 104,247 0.14
200,000 Coca-Cola HBC Finance BV ‘EMTN’ 1.625% 14-May-2031 214,209 0.29
350,000 Credit Suisse Group AG ‘EMTN’ FRN 0.650% 14-Jan-2028 340,205 0.47
100,000 Givaudan Finance Europe BV 1.000% 22-Apr-2027 103,791 0.14 100,000 Givaudan Finance Europe BV 1.625% 22-Apr-2032 107,532 0.15 95,000 Nestle Finance International Ltd ‘EMTN’
1.500% 01-Apr-2030 105,002 0.14 174,000 Swisscom Finance BV 0.375% 14-Nov-2028 175,097 0.24 585,000 UBS AG/London ‘EMTN’ 0.750% 21-Apr-2023 594,275 0.82 820,000 UBS Group AG 1.500% 30-Nov-2024 847,438 1.16
United Arab Emirates - 97,235 (31 December 2019: 107,705) 97,235 0.13
100,000 DP World Plc ‘REGS’ 2.375% 25-Sep-2026 97,235 0.13
United Kingdom - 7,755,549 (31 December 2019: 8,868,029) 7,755,549 10.63
200,000 Aviva Plc ‘EMTN’ FRN 6.125% 05-Jul-2043 226,503 0.31 814,000 Barclays Plc ‘EMTN’ FRN 0.750% 09-Jun-2025 795,941 1.09
Bonds cont’d. Bonds cont’d.
United Kingdom cont’d.
EUR EUR
03613-1A.indd 161 19/08/2020 19:01
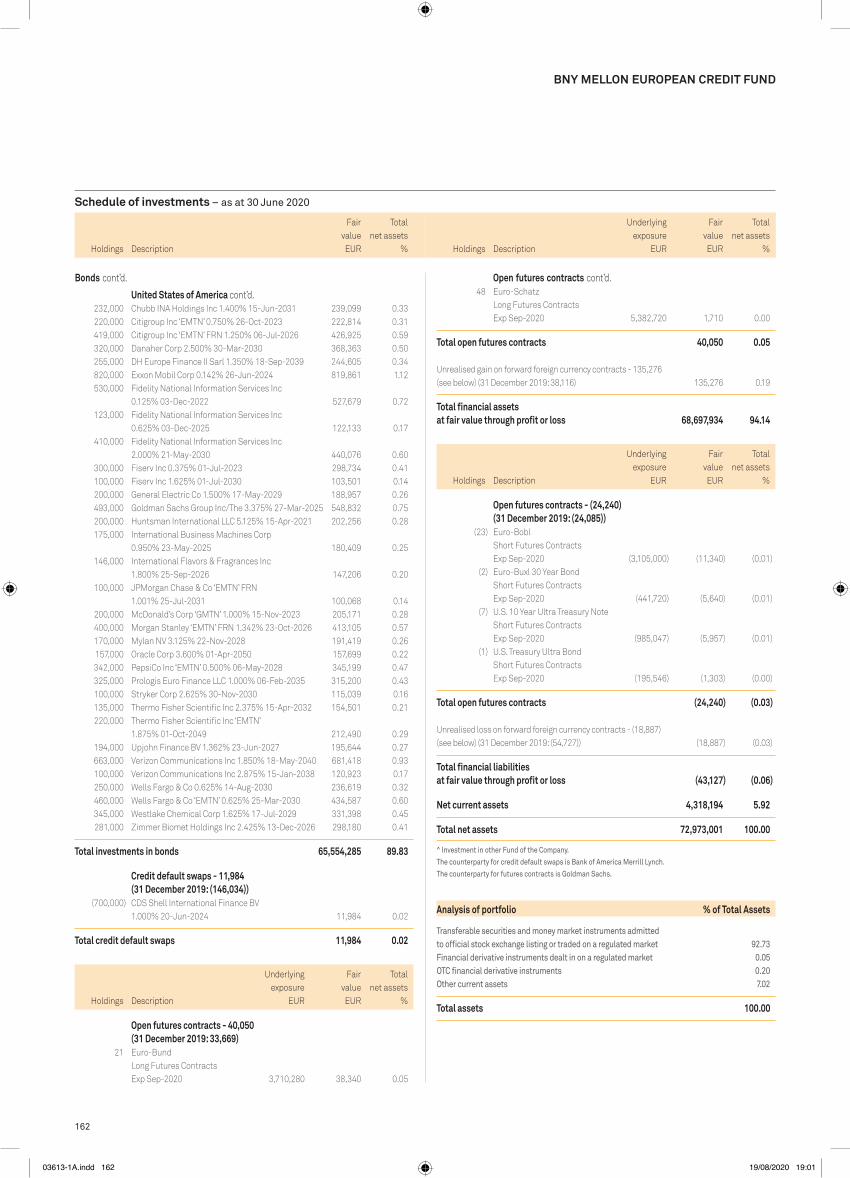
162
Schedule of investments – as at 30 June 2020
Holdings Description
Fair value
Total net assets
% Holdings Description
Fair value
Total net assets
%
BNy MELLON EUROpEAN CREDIT FUND
Open futures contracts cont’d. 48 Euro-Schatz
Long Futures Contracts Exp Sep-2020 5,382,720 1,710 0.00
Total open futures contracts 40,050 0.05 Unrealised gain on forward foreign currency contracts - 135,276 (see below) (31 December 2019: 38,116) 135,276 0.19
Total financial assets at fair value through profit or loss 68,697,934 94.14
Holdings Description
Underlying exposure
EUR
Fair value
EUR
Total net assets
%
Open futures contracts - (24,240) (31 December 2019: (24,085))
(23) Euro-Bobl Short Futures Contracts Exp Sep-2020 (3,105,000) (11,340) (0.01)
(2) Euro-Buxl 30 Year Bond Short Futures Contracts Exp Sep-2020 (441,720) (5,640) (0.01)
(7) U.S. 10 Year Ultra Treasury Note Short Futures Contracts Exp Sep-2020 (985,047) (5,957) (0.01)
(1) U.S. Treasury Ultra Bond Short Futures Contracts Exp Sep-2020 (195,546) (1,303) (0.00)
Total open futures contracts (24,240) (0.03) Unrealised loss on forward foreign currency contracts - (18,887) (see below) (31 December 2019: (54,727)) (18,887) (0.03)
Total financial liabilities at fair value through profit or loss (43,127) (0.06)
Net current assets 4,318,194 5.92
Total net assets 72,973,001 100.00
^ Investment in other Fund of the Company.The counterparty for credit default swaps is Bank of America Merrill Lynch. The counterparty for futures contracts is Goldman Sachs.
Analysis of portfolio % of Total Assets
Transferable securities and money market instruments admitted to official stock exchange listing or traded on a regulated market 92.73Financial derivative instruments dealt in on a regulated market 0.05oTC financial derivative instruments 0.20other current assets 7.02
Total assets 100.00
232,000 Chubb INA Holdings Inc 1.400% 15-Jun-2031 239,099 0.33 220,000 Citigroup Inc ‘EMTN’ 0.750% 26-Oct-2023 222,814 0.31 419,000 Citigroup Inc ‘EMTN’ FRN 1.250% 06-Jul-2026 426,925 0.59 320,000 Danaher Corp 2.500% 30-Mar-2030 368,363 0.50 255,000 DH Europe Finance II Sarl 1.350% 18-Sep-2039 244,605 0.34 820,000 Exxon Mobil Corp 0.142% 26-Jun-2024 819,861 1.12 530,000 Fidelity National Information Services Inc
0.125% 03-Dec-2022 527,679 0.72 123,000 Fidelity National Information Services Inc
0.625% 03-Dec-2025 122,133 0.17 410,000 Fidelity National Information Services Inc
2.000% 21-May-2030 440,076 0.60 300,000 Fiserv Inc 0.375% 01-Jul-2023 298,734 0.41 100,000 Fiserv Inc 1.625% 01-Jul-2030 103,501 0.14 200,000 General Electric Co 1.500% 17-May-2029 188,957 0.26 493,000 Goldman Sachs Group Inc/The 3.375% 27-Mar-2025 548,832 0.75 200,000 Huntsman International LLC 5.125% 15-Apr-2021 202,256 0.28 175,000 International Business Machines Corp
0.950% 23-May-2025 180,409 0.25 146,000 International Flavors & Fragrances Inc
1.800% 25-Sep-2026 147,206 0.20 100,000 JPMorgan Chase & Co ‘EMTN’ FRN
1.001% 25-Jul-2031 100,068 0.14 200,000 McDonald’s Corp ‘GMTN’ 1.000% 15-Nov-2023 205,171 0.28 400,000 Morgan Stanley ‘EMTN’ FRN 1.342% 23-Oct-2026 413,105 0.57 170,000 Mylan NV 3.125% 22-Nov-2028 191,419 0.26 157,000 Oracle Corp 3.600% 01-Apr-2050 157,699 0.22 342,000 PepsiCo Inc ‘EMTN’ 0.500% 06-May-2028 345,199 0.47 325,000 Prologis Euro Finance LLC 1.000% 06-Feb-2035 315,200 0.43 100,000 Stryker Corp 2.625% 30-Nov-2030 115,039 0.16 135,000 Thermo Fisher Scientific Inc 2.375% 15-Apr-2032 154,501 0.21 220,000 Thermo Fisher Scientific Inc ‘EMTN’
1.875% 01-Oct-2049 212,490 0.29 194,000 Upjohn Finance BV 1.362% 23-Jun-2027 195,644 0.27 663,000 Verizon Communications Inc 1.850% 18-May-2040 681,418 0.93 100,000 Verizon Communications Inc 2.875% 15-Jan-2038 120,923 0.17 250,000 Wells Fargo & Co 0.625% 14-Aug-2030 236,619 0.32 460,000 Wells Fargo & Co ‘EMTN’ 0.625% 25-Mar-2030 434,587 0.60 345,000 Westlake Chemical Corp 1.625% 17-Jul-2029 331,398 0.45 281,000 Zimmer Biomet Holdings Inc 2.425% 13-Dec-2026 298,180 0.41
Total investments in bonds 65,554,285 89.83
Credit default swaps - 11,984 (31 December 2019: (146,034))
(700,000) CDS Shell International Finance BV 1.000% 20-Jun-2024 11,984 0.02
Total credit default swaps 11,984 0.02
Holdings Description
Underlying exposure
EUR
Fair value
EUR
Total net assets
%
Open futures contracts - 40,050 (31 December 2019: 33,669)
21 Euro-Bund Long Futures Contracts Exp Sep-2020 3,710,280 38,340 0.05
Bonds cont’d.
United States of America cont’d.
Underlying exposure
EUREUR EUR
03613-1A.indd 162 19/08/2020 19:01

163
Schedule of investments – as at 30 June 2020
BNy MELLON EUROpEAN CREDIT FUND
Forward foreign currency contractsUnrealised
Gain/(Loss)Buy Sell Amount (B) Amount (S)Settle
Date Counterparty
BNy Mellon European Credit FundEuro US dollar 696,698 754,000 15-Jul-20 Citigroup Global
Markets Limited 24,222Euro US dollar 184,662 200,000 15-Jul-20 Citigroup Global
Markets Limited 6,286Euro US dollar 1,163,198 1,267,000 30-Jul-20 Natwest
Markets Plc 33,572US dollar Euro 419,000 369,981 30-Jul-20 Lloyds Bank plc 3,589Euro Sterling 962,736 859,000 03-Aug-20 UBS AG 22,870Euro US dollar 2,120,527 2,338,000 17-Aug-20 RBC Capital
Markets 36,848US dollar Euro 614,000 542,531 17-Aug-20 Bank of America
Merrill Lynch 4,680US dollar Euro 701,000 621,782 17-Aug-20 Morgan Stanley 2,965US dollar Euro 221,000 196,606 11-Sep-20 Morgan Stanley 244
EUR 135,276
Sterling Euro 150,000 167,140 03-Aug-20 Goldman Sachs (3,018)Sterling Euro 178,000 198,411 03-Aug-20 Natwest
Markets Plc (3,654)US dollar Euro 287,000 255,914 17-Aug-20 BNP Paribas (133)Euro US dollar 493,085 562,000 28-Aug-20 RBC Capital
Markets (7,662)Euro US dollar 584,348 661,000 11-Sep-20 JPMorgan Chase
Bank (4,420)
EUR (18,887)
Net EUR 116,389
03613-1A.indd 163 19/08/2020 19:01

164
Schedule of investments – as at 30 June 2020
Holdings Description
Fair value
Total net assets
% Holdings Description
Fair value
Total net assets
%
FUND 20 – BNy MELLON GLOBAL BOND FUND
BNY MELLON GLOBAL BOND FUND
Collective investment schemes
US Dollar - 16,781,381 (31 December 2019: 5,873,761) 16,781,381 2.80
3,273,777 iShares China CNY Bond UCITS ETF - ETF 16,781,381 2.80
Total investments in collective investment schemes 16,781,381 2.80
Bonds
Australian Dollar - 40,551,064 (31 December 2019: 21,432,160) 40,551,064 6.76
4,990,000 Australia Government Bond 3.000% 20-Sep-2025 4,997,343 0.83 14,040,000 Australia Government Bond 3.000% 21-Mar-2047 12,249,141 2.04 8,330,000 International Bank for Reconstruction
& Development ‘MTN’ 2.800% 12-Jan-2022 5,908,810 0.99 11,430,000 New South Wales Treasury Corp
3.000% 20-Mar-2028 8,952,221 1.49 9,150,000 Treasury Corp of Victoria 1.000% 20-Nov-2023 6,394,765 1.07 2,820,000 Treasury Corp of Victoria 2.250% 20-Nov-2034 2,048,784 0.34
Canadian Dollar - 15,424,888 (31 December 2019: 19,135,957) 15,424,888 2.57
9,790,000 Canada Housing Trust No 1 ‘144A’ 2.100% 15-Sep-2029 7,900,272 1.32
9,720,000 Canada Housing Trust No 1 ‘144A’ 2.350% 15-Sep-2023 7,524,616 1.25
Colombian peso - 5,036,928 (31 December 2019: –) 5,036,928 0.84
18,453,200,000 Colombia Government International Bond ‘REGS’ 6.000% 28-Apr-2028 5,036,928 0.84
Czech Koruna - 6,297,957 (31 December 2019: –) 6,297,957 1.05
128,170,000 Czech Republic Government Bond 2.750% 23-Jul-2029 6,297,957 1.05
Danish Krone - 15,808,434 (31 December 2019: –) 15,808,434 2.64
97,100,000 Denmark Government Bond ‘144A’ 0.500% 15-Nov-2029 15,808,434 2.64
Euro - 122,076,790 (31 December 2019: 117,050,963) 122,076,790 20.36
5,800,000 FMS Wertmanagement ‘EMTN’ 0.375% 29-Apr-2030 6,852,357 1.14
3,310,000 French Republic Government Bond OAT 3.250% 25-May-2045 6,171,964 1.03
6,300,000 German Postal Pensions Securitisation Plc 3.750% 18-Jan-2021 7,252,200 1.21
2,440,000 Indonesia Government International Bond 1.750% 24-Apr-2025 2,754,239 0.46
4,870,000 Ireland Government Bond 1.000% 15-May-2026 5,890,919 0.98 4,930,000 Ireland Government Bond 1.100% 15-May-2029 6,127,496 1.02 2,514,379 Ireland Government Bond 1.500% 15-May-2050 3,499,570 0.58 4,780,000 Italy Buoni Poliennali Del Tesoro
4.500% 01-May-2023 6,001,427 1.00 10,020,000 Italy Buoni Poliennali Del Tesoro ‘144A’
1.850% 01-Jul-2025 11,872,540 1.98 4,990,000 Italy Buoni Poliennali Del Tesoro ‘144A’
2.450% 01-Sep-2050 5,836,017 0.97 4,990,000 Italy Buoni Poliennali Del Tesoro ‘144A’
5.000% 01-Aug-2034 7,943,246 1.33
5,170,000 Kreditanstalt fuer Wiederaufbau ‘EMTN’ 1.375% 31-Jul-2035 6,998,546 1.17
3,233,000 Province of British Columbia Canada ‘EMTN’ 0.875% 08-Oct-2025 3,821,682 0.64
4,900,000 SNCF Reseau ‘EMTN’ 1.125% 25-May-2030 6,023,421 1.00 6,360,000 Spain Government Bond 5.750% 30-Jul-2032 11,474,471 1.91 7,040,000 Spain Government Bond ‘144A’ 5.150% 31-Oct-2028 11,075,212 1.85 1,630,000 Spain Government Bond ‘144A’ 5.150% 31-Oct-2044 3,400,285 0.57 5,960,000 Spain Government Bond ‘144A’ 5.900% 30-Jul-2026 9,081,198 1.52
Indonesian Rupiah - 7,632,749 (31 December 2019: 5,994,123) 7,632,749 1.27
38,230,000,000 European Bank for Reconstruction & Development ‘GMTN’ 6.450% 13-Dec-2022 2,621,277 0.44
72,000,000,000 European Bank for Reconstruction & Development ‘GMTN’ 8.300% 02-Oct-2020 5,011,472 0.83
Japanese yen - 52,682,447 (31 December 2019: 78,224,973) 52,682,447 8.79
630,650,000 Japan Government Ten Year Bond 0.100% 20-Dec-2029 5,901,032 0.98
2,229,400,000 Japan Government Thirty Year Bond 0.500% 20-Sep-2046 20,554,079 3.43
489,950,000 Japan Government Twenty Year Bond 0.400% 20-Mar-2040 4,537,563 0.76
686,200,000 Japan Government Twenty Year Bond 1.000% 20-Dec-2035 7,053,198 1.18
941,000,000 Japan Government Two Year Bond 0.100% 01-Apr-2022 8,774,253 1.46
633,933,061 Japanese Government CPI Linked Bond 0.100% 10-Mar-2028 5,862,322 0.98
Malaysian Ringgit - 9,026,404 (31 December 2019: 6,109,640) 9,026,404 1.51
36,196,000 Malaysia Government Bond 3.906% 15-Jul-2026 9,026,404 1.51
Mexican Nuevo peso - 9,162,832 (31 December 2019: 6,565,684) 9,162,832 1.53
88,900,000 Mexican Bonos 7.500% 03-Jun-2027 4,274,133 0.71 95,710,000 Mexican Bonos 8.500% 31-May-2029 4,888,699 0.82
New Zealand Dollar - 12,267,607 (31 December 2019: 22,119,143) 12,267,607 2.05
4,130,000 Housing New Zealand Ltd ‘MTN’ 3.360% 12-Jun-2025 2,978,673 0.50
6,940,000 New Zealand Government Inflation Linked Bond 3.000% 20-Sep-2030 6,274,039 1.05
3,860,000 New Zealand Local Government Funding Agency Bond 3.500% 14-Apr-2033 3,014,895 0.50
Norwegian Krone - 6,141,770 (31 December 2019: 13,647,704) 6,141,770 1.02
55,620,000 Norway Government Bond ‘144A’ 1.375% 19-Aug-2030 6,141,770 1.02
peruvian Nuevo Sol - 4,648,375 (31 December 2019: 3,035,753) 4,648,375 0.78
12,680,000 Peruvian Government International Bond ‘REGS’ 8.200% 12-Aug-2026 4,648,375 0.78
Bonds cont’d.
Euro cont’d.
USDUSD
03613-1A.indd 164 19/08/2020 19:01

165
Schedule of investments – as at 30 June 2020
Holdings Description
Fair value
Total net assets
% Holdings Description
Fair value
Total net assets
%
BNy MELLON GLOBAL BOND FUND
2,780,000 United States Treasury Note/Bond 1.500% 15-Feb-2030 3,009,676 0.50
5,990,000 United States Treasury Note/Bond 2.000% 15-Feb-2050 6,895,285 1.15
22,305,700 United States Treasury Note/Bond 2.375% 15-May-2029 25,778,767 4.30
9,410,000 United States Treasury Note/Bond 2.875% 15-May-2043 12,353,749 2.06
16,270,000 United States Treasury Note/Bond 3.000% 15-Nov-2045 22,046,803 3.68
6,000,000 United States Treasury Strip Principal (Zero Coupon) 0.000% 15-May-2043 4,379,807 0.73
Total investments in bonds 568,260,943 94.80 Unrealised gain on forward foreign currency contracts - 1,382,086 (see below) (31 December 2019: 699,600) 1,382,086 0.23
Total financial assets at fair value through profit or loss 586,424,410 97.83
Holdings Description
Underlying exposure
USD
Fair value USD
Total net assets
%
Open futures contracts - (328,855) (31 December 2019: –)
(73) Euro-Bund Short Futures Contracts Exp Sep-2020 (14,456,977) (134,235) (0.02)
(146) SFE 10 Year Australian Treasury Bond Short Futures Contracts Exp Sep-2020 (14,878,159) (194,620) (0.03)
Total open futures contracts (328,855) (0.05) Unrealised loss on forward foreign currency contracts - (938,251) (see below) (31 December 2019: (1,824,238)) (938,251) (0.16)
Total financial liabilities at fair value through profit or loss (1,267,106) (0.21)
Net current assets 14,282,988 2.38
Total net assets 599,440,292 100.00
The counterparty for futures contracts is UBS AG.
Analysis of portfolio % of Total Assets
Transferable securities and money market instruments admitted to official stock exchange listing or traded on a regulated market 96.94oTC financial derivative instruments 0.23other current assets 2.83
Total assets 100.00
philippine peso - 5,877,003 (31 December 2019: 2,998,489) 5,877,003 0.98
290,000,000 Philippine Government International Bond 4.950% 15-Jan-2021 5,877,003 0.98
Sterling - 18,871,580 (31 December 2019: 39,643,040) 18,871,580 3.15
2,100,000 Affordable Housing Finance Plc ‘EMTN’ 3.800% 20-May-2042 3,847,663 0.64
6,220,000 United Kingdom Gilt 3.250% 22-Jan-2044 12,025,728 2.01 1,270,000 United Kingdom Gilt 3.750% 22-Jul-2052 2,998,189 0.50
Swedish Krona - 6,342,265 (31 December 2019: 6,352,986) 6,342,265 1.06
56,540,000 European Investment Bank ‘EMTN’ 1.250% 12-May-2025 6,342,265 1.06
US Dollar - 230,411,850 (31 December 2019: 210,586,743) 230,411,850 38.44
4,031,000 Abu Dhabi Government International Bond ‘REGS’ 2.500% 16-Apr-2025 4,252,705 0.71
2,340,000 Colombia Government International Bond 8.125% 21-May-2024 2,796,639 0.47
5,610,000 European Bank for Reconstruction & Development ‘GMTN’ FRN 0.458% 11-May-2022 5,603,693 0.93
5,450,000 Export-Import Bank of Korea FRN 1.866% 25-Jan-2022 5,480,313 0.91
2,732,000 Indonesia Government International Bond ‘REGS’ 4.750% 08-Jan-2026 3,082,614 0.51
4,669,000 Inter-American Development Bank ‘GMTN’ 3.875% 28-Oct-2041 6,534,948 1.09
5,620,000 International Bank for Reconstruction & Development FRN 0.728% 11-Feb-2021 5,625,440 0.94
2,940,000 Kommunekredit ‘EMTN’ 1.625% 01-Jun-2021 2,975,033 0.50 4,288,000 Mexico Government International Bond
3.900% 27-Apr-2025 4,601,024 0.77 3,000,000 Nederlandse Financierings-Maatschappij
voor Ontwikkelingslanden NV FRN 0.358% 07-Sep-2021 2,997,653 0.50
5,970,000 Nordic Investment Bank 1.250% 02-Aug-2021 6,031,045 1.01 5,750,000 Oesterreichische Kontrollbank AG
2.875% 07-Sep-2021 5,924,466 0.99 2,731,000 Philippine Government International Bond
2.457% 05-May-2030 2,870,032 0.48 8,610,000 Province of British Columbia Canada
2.250% 02-Jun-2026 9,378,736 1.56 5,288,000 Qatar Government International Bond ‘REGS’
3.400% 16-Apr-2025 5,762,566 0.96 3,925,763 United States Treasury Inflation Indexed Bonds
0.500% 15-Apr-2024 4,126,891 0.69 22,608,672 United States Treasury Inflation Indexed Bonds
0.750% 15-Jul-2028 25,535,083 4.26 4,426,531 United States Treasury Inflation Indexed Bonds
2.125% 15-Feb-2041 6,654,423 1.11 11,470,000 United States Treasury Note/Bond
0.500% 15-Mar-2023 11,575,066 1.93 10,420,000 United States Treasury Note/Bond
1.125% 28-Feb-2022 10,588,511 1.77 22,090,000 United States Treasury Note/Bond
1.500% 15-Aug-2026 23,550,882 3.93
Bonds cont’d. Bonds cont’d.
US Dollar cont’d.
USDUSD
03613-1A.indd 165 19/08/2020 19:01

166
Schedule of investments – as at 30 June 2020
BNy MELLON GLOBAL BOND FUND
Forward foreign currency contracts cont’d.Unrealised
Gain/(Loss)Buy Sell Amount (B) Amount (S)Settle
Date Counterparty
BNy Mellon Global Bond Fund EUR H (Hedged) Share Class cont’d.Euro US dollar 12,056 13,577 15-Jul-20 The Bank of
New York Mellon (59)Euro US dollar 2,278,237 2,587,940 15-Jul-20 The Bank of
New York Mellon (33,511)
USD (33,570)
EUR (29,949)
Net USD (33,005)
Net EUR (29,445)
BNy Mellon Global Bond Fund EUR I (Hedged) Share ClassUS dollar Euro 302 268 02-Jul-20 The Bank of
New York Mellon 2Euro US dollar 2,008 2,251 15-Jul-20 The Bank of
New York Mellon - US dollar Euro 50,861 45,050 15-Jul-20 The Bank of
New York Mellon 349US dollar Euro 7,017 6,248 15-Jul-20 The Bank of
New York Mellon 12US dollar Euro 8,739 7,794 15-Jul-20 The Bank of
New York Mellon - US dollar Euro 1,354 1,197 15-Jul-20 The Bank of
New York Mellon 12US dollar Euro 9,835 8,705 15-Jul-20 The Bank of
New York Mellon 75US dollar Euro 8,584 7,650 15-Jul-20 The Bank of
New York Mellon 7US dollar Euro 13,275 11,788 15-Jul-20 The Bank of
New York Mellon 58US dollar Euro 4,191 3,725 15-Jul-20 The Bank of
New York Mellon 14US dollar Euro 3,692 3,261 15-Jul-20 The Bank of
New York Mellon 36US dollar Euro 16,647 14,791 15-Jul-20 The Bank of
New York Mellon 63US dollar Euro 11,077 9,796 15-Jul-20 The Bank of
New York Mellon 94US dollar Euro 1,983 1,742 15-Jul-20 The Bank of
New York Mellon 29US dollar Euro 4,457 3,918 15-Jul-20 The Bank of
New York Mellon 64US dollar Euro 2,094 1,855 15-Jul-20 The Bank of
New York Mellon 14
USD 829
EUR 740
Euro US dollar 6,248 7,015 01-Jul-20 The Bank of New York Mellon (12)
Euro US dollar 45,050 50,847 02-Jul-20 The Bank of New York Mellon (350)
Euro US dollar 268 302 15-Jul-20 The Bank of New York Mellon (2)
Euro US dollar 7,498 8,413 15-Jul-20 The Bank of New York Mellon (7)
Euro US dollar 723 815 15-Jul-20 The Bank of New York Mellon (4)
Euro US dollar 2,248 2,529 15-Jul-20 The Bank of New York Mellon (8)
Euro US dollar 17,327 19,620 15-Jul-20 The Bank of New York Mellon (192)
Forward foreign currency contracts cont’d.Unrealised
Gain/(Loss)Buy Sell Amount (B) Amount (S)Settle
Date Counterparty
BNy Mellon Global Bond FundUS dollar Euro 242,541 216,371 01-Jul-20 Barclays Bank PLC 10Japanese yen US dollar 7,195,489,301 66,820,282 15-Sep-20 JPMorgan Chase
Bank 33,649US dollar Australian dollar 31,634,893 45,694,099 15-Sep-20 Royal Bank
of Scotland 332,258US dollar Canadian dollar 1,481,415 1,993,101 15-Sep-20 Citigroup Global
Markets Limited 24,259US dollar Colombian peso 5,407,348 19,862,272,000 15-Sep-20 Royal Bank
of Scotland 138,007US dollar Danish krone 13,356,512 88,154,941 15-Sep-20 Royal Bank
of Scotland 75,263US dollar Euro 1,504,036 1,338,000 15-Sep-20 State Street Bank 1,745US dollar Euro 6,420,701 5,692,493 15-Sep-20 State Street Bank 29,237US dollar Euro 1,020,350 907,000 15-Sep-20 Canadian Imperial
Bank 1,981US dollar Indonesian rupiah 5,717,898 82,223,374,000 15-Sep-20 State Street Bank 138,138US dollar Japanese yen 1,986,259 212,886,000 15-Sep-20 Royal Bank
of Scotland 8,316US dollar Japanese yen 776,984 82,967,000 15-Sep-20 Barclays Bank PLC 6,130US dollar New Zealand dollar 12,666,580 19,558,532 15-Sep-20 JPMorgan Chase
Bank 142,126US dollar Norwegian krone 137,844 1,290,538 15-Sep-20 Citigroup Global
Markets Limited 5,212US dollar Norwegian krone 6,267,727 58,036,000 15-Sep-20 UBS AG 303,178US dollar Sterling 2,633,281 2,075,000 15-Sep-20 Citigroup Global
Markets Limited 86,042US dollar Swedish krona 5,048,470 46,783,158 15-Sep-20 UBS AG 50,540
USD 1,376,091
Colombian peso US dollar 19,862,272,000 5,275,238 15-Sep-20State Street Bank (5,896)
Czech koruna US dollar 66,093,909 2,794,001 15-Sep-20 Citigroup Global Markets Limited (29,349)
Euro US dollar 671,326 755,725 15-Sep-20 Royal Bank of Scotland (1,967)
Euro US dollar 953,663 1,071,968 15-Sep-20 Canadian Imperial Bank (1,206)
Euro US dollar 364,448 413,194 15-Sep-20 State Street Bank (3,995)Euro US dollar 427,536 486,598 15-Sep-20 Canadian Imperial
Bank (6,566)Euro US dollar 34,007,667 38,436,486 15-Sep-20 The Bank of
New York Mellon (253,077)Euro US dollar 483,564 545,939 15-Sep-20 Barclays Bank PLC (2,999)Sterling US dollar 2,219,013 2,759,579 15-Sep-20 State Street Bank (35,551)Sterling US dollar 10,784,043 13,654,593 15-Sep-20 The Bank of
New York Mellon (416,263)US dollar Philippine peso 5,621,167 282,562,000 15-Sep-20 State Street Bank (20,766)
USD (777,635)
Net USD 598,456
BNy Mellon Global Bond Fund EUR H (Hedged) Share ClassUS dollar Euro 8,416 7,501 15-Jul-20 The Bank of
New York Mellon 7US dollar Euro 37,546 32,989 15-Jul-20 The Bank of
New York Mellon 558
USD 565
EUR 504
03613-1A.indd 166 19/08/2020 19:01

167
Schedule of investments – as at 30 June 2020
BNy MELLON GLOBAL BOND FUND
Forward foreign currency contracts cont’d.Unrealised
Gain/(Loss)Buy Sell Amount (B) Amount (S)Settle
Date Counterparty
BNy Mellon Global Bond Fund Sterling W (Inc) (Hedged) Share ClassUS dollar Sterling 128,670 103,330 15-Jul-20 The Bank of
New York Mellon 1,867
USD 1,867
GBp 1,522
Sterling US dollar 1,029 1,288 15-Jul-20 The Bank of New York Mellon (25)
Sterling US dollar 102,301 130,330 15-Jul-20 The Bank of New York Mellon (4,791)
USD (4,816)
GBp (3,925)
Net USD (2,949)
Net GBp (2,403)
BNy Mellon Global Bond Fund Sterling Z (Acc) (Hedged) Share ClassSterling US dollar 101,953 129,887 15-Jul-20 The Bank of
New York Mellon (4,775)
USD (4,775)
GBp (3,891)
BNy Mellon Global Bond Fund Sterling Z (Inc) (Hedged) Share ClassSterling US dollar 101,953 129,887 15-Jul-20 The Bank of
New York Mellon (4,775)
USD (4,775)
GBp (3,891)
Forward foreign currency contracts cont’d.Unrealised
Gain/(Loss)Buy Sell Amount (B) Amount (S)Settle
Date Counterparty
BNy Mellon Global Bond Fund EUR I (Hedged) Share Class cont’d.Euro US dollar 4,350 4,919 15-Jul-20 The Bank of
New York Mellon (42)Euro US dollar 5,887 6,646 15-Jul-20 The Bank of
New York Mellon (45)Euro US dollar 7,187,485 8,164,548 15-Jul-20 The Bank of
New York Mellon (105,722)US dollar Euro 6,540 5,834 15-Jul-20 The Bank of
New York Mellon (1)
USD (106,385)
EUR (94,910)
Net USD (105,556)
Net EUR (94,170)
BNy Mellon Global Bond Fund EUR W (Acc) (Hedged) Share ClassUS dollar Euro 113,934 100,843 15-Jul-20 The Bank of
New York Mellon 867
USD 867
EUR 773
Euro US dollar 972 1,100 15-Jul-20 The Bank of New York Mellon (10)
Euro US dollar 99,870 113,447 15-Jul-20 The Bank of New York Mellon (1,469)
USD (1,479)
EUR (1,319)
Net USD (612)
Net EUR (546)
BNy Mellon Global Bond Fund Sterling W (Acc) (Hedged) Share ClassUS dollar Sterling 128,670 103,330 15-Jul-20 The Bank of
New York Mellon 1,867
USD 1,867
GBp 1,522
Sterling US dollar 1,029 1,288 15-Jul-20 The Bank of New York Mellon (25)
Sterling US dollar 102,301 130,330 15-Jul-20 The Bank of New York Mellon (4,791)
USD (4,816)
GBp (3,925)
Net USD (2,949)
Net GBp (2,403)
03613-1A.indd 167 19/08/2020 19:01

168
Schedule of investments – as at 30 June 2020
Holdings Description
Fair value
Total net assets
% Holdings Description
Fair value
Total net assets
%
Bonds cont’d.
France cont’d.
Collective investment schemes
Supranational - 16,193,685 (31 December 2019: 3,970,242) 16,193,685 2.65
16,193,685 Insight Liquidity Funds Plc - ILF USD Liquidity Fund 16,193,685 2.65
Total investments in collective investment schemes 16,193,685 2.65
Bonds
Australia - 12,257,270 (31 December 2019: 14,696,709) 12,257,270 2.00
3,589,000 Australia & New Zealand Banking Group Ltd ‘144A’ FRN 0.864% 21-Nov-2022 3,596,388 0.59
4,170,000 Australia Government Bond 3.000% 21-Mar-2047 3,665,721 0.60 125,639 Pepper Residential Securities Trust NO 18 FRN
2.190% 12-Aug-2058 86,822 0.01 4,458,000 Scentre Group Trust 1 / Scentre Group Trust 2
‘144A’ 4.375% 28-May-2030 4,908,339 0.80
Belgium - 7,682,877 (31 December 2019: –) 7,682,877 1.26
5,604,000 Anheuser-Busch InBev SA/NV 3.700% 02-Apr-2040 7,682,877 1.26
Bermuda - 789,145 (31 December 2019: 749,007) 789,145 0.13
588,000 XLIT Ltd 5.500% 31-Mar-2045 789,145 0.13
Brazil - 5,675,218 (31 December 2019: 7,918,697) 5,675,218 0.93
2,430,000 Braskem Netherlands Finance BV ‘REGS’ 4.500% 31-Jan-2030 2,227,702 0.37
3,000,000 Brazil Notas do Tesouro Nacional Serie F 10.000% 01-Jan-2027 654,227 0.11
1,833,000 BRF SA ‘REGS’ 4.875% 24-Jan-2030 1,729,894 0.28 1,059,000 NBM US Holdings Inc ‘REGS’ 7.000% 14-May-2026 1,063,395 0.17
Canada - 714,449 (31 December 2019: 5,327,095) 714,449 0.12
801,338 Air Canada 2017-1 Class AA Pass Through Trust ‘144A’ 3.300% 15-Jan-2030 714,449 0.12
Colombia - 4,673,880 (31 December 2019: 4,803,782) 4,673,880 0.76
1,500,000 Colombia Government International Bond 4.500% 15-Mar-2029 1,653,090 0.27
1,065,000 Colombia Government International Bond 5.200% 15-May-2049 1,255,300 0.20
1,614,000 Transportadora de Gas Internacional SA ESP ‘REGS’ 5.550% 01-Nov-2028 1,765,490 0.29
Denmark - 3,626,251 (31 December 2019: 4,716,232) 3,626,251 0.59
3,346,000 Danske Bank A/S ‘EMTN’ FRN 1.375% 12-Feb-2030 3,626,251 0.59
Egypt - 3,107,589 (31 December 2019: 3,271,358) 3,107,589 0.51
3,020,000 Egypt Government International Bond ‘REGS’ 6.200% 01-Mar-2024 3,107,589 0.51
France - 18,157,800 (31 December 2019: 40,572,412) 18,157,800 2.97
2,958,000 Airbus SE ‘EMTN’ 1.625% 09-Jun-2030 3,368,064 0.55 687,000 Airbus SE ‘EMTN’ 2.375% 09-Jun-2040 798,624 0.13
7,900,000 BPCE SA ‘MTN’ FRN 1.243% 31-May-2022 7,943,482 1.30 6,189,000 WEA Finance LLC ‘144A’ 2.875% 15-Jan-2027 6,047,630 0.99
Germany - 40,277,564 (31 December 2019: 18,324,023) 40,277,564 6.58
1,563,000 BMW US Capital LLC ‘144A’ 4.150% 09-Apr-2030 1,799,679 0.29 954,000 BMW US Capital LLC ‘REGS’ 4.150% 09-Apr-2030 1,098,461 0.18 25,377,777 Bundesobligation 0.000% 11-Apr-2025 29,496,044 4.82 5,500,000 Eurogrid GmbH ‘EMTN’ 1.113% 15-May-2032 6,522,512 1.07 1,300,000 IKB Deutsche Industriebank AG FRN
4.000% 31-Jan-2028 1,360,868 0.22
Indonesia - 4,742,831 (31 December 2019: 4,714,936) 4,742,831 0.77
2,670,000 Indonesia Government International Bond ‘REGS’ 5.250% 08-Jan-2047 3,351,199 0.55
19,820,000,000 Indonesia Treasury Bond 7.000% 15-May-2027 1,391,632 0.22
Ireland - 7,879,912 (31 December 2019: 4,178,994) 7,879,912 1.29
2,957,000 AerCap Ireland Capital DAC / AerCap Global Aviation Trust 6.500% 15-Jul-2025 3,103,704 0.51
323,022 Arrow CMBS 2018 DAC ‘2018-1 C’ FRN 2.050% 22-May-2030 342,520 0.06
1,097,938 European Loan Conduit No 37 DAC 2.118% 02-May-2030 1,260,147 0.21
698,688 European Loan Conduit No 37 DAC FRN 2.868% 02-May-2030 796,230 0.13
140,128 European Residential Loan Securitisation 2018-1 DAC ‘2018-1 A’ FRN 0.493% 24-Mar-2061 157,971 0.02
1,873,905 European Residential Loan Securitisation 2019-NPL2 DAC ‘2019-NPL2 A’ FRN 0.993% 24-Feb-2058 1,728,166 0.28
460,000 Toro European CLO 4 DAC FRN 2.100% 15-Jul-2030 491,174 0.08
Italy - 12,002,827 (31 December 2019: 9,086,318) 12,002,827 1.96
2,598,000 Intesa Sanpaolo SpA ‘EMTN’ 1.750% 04-Jul-2029 2,937,011 0.48
1,057,000 Intesa Sanpaolo SpA FRN (Perpetual) 3.750% 27-Feb-2025 961,908 0.16
3,664,780 Italy Buoni Poliennali Del Tesoro ‘144A’ 1.300% 15-May-2028 4,280,795 0.70
2,623,000 UniCredit SpA FRN 2.731% 15-Jan-2032 2,678,034 0.44 995,000 Unipol Gruppo SpA ‘EMTN’
3.500% 29-Nov-2027 1,145,079 0.18
Japan - 16,739,018 (31 December 2019: 9,651,075) 16,739,018 2.74
6,750,000 Mitsubishi UFJ Financial Group Inc FRN 1.781% 25-Jul-2022 6,775,303 1.11
903,000 Mizuho Financial Group Inc FRN 1.311% 28-Feb-2022 908,854 0.15
1,922,000 Mizuho Financial Group Inc FRN 1.453% 13-Sep-2021 1,939,768 0.32
3,327,000 Takeda Pharmaceutical Co Ltd 1.375% 09-Jul-2032 3,775,509 0.62
2,970,000 Takeda Pharmaceutical Co Ltd 2.000% 09-Jul-2040 3,339,584 0.54
BNY MELLON GLOBAL CREDIT FUND
FUND 21 – BNy MELLON GLOBAL CREDIT FUND
USDUSD
03613-1A.indd 168 19/08/2020 19:01
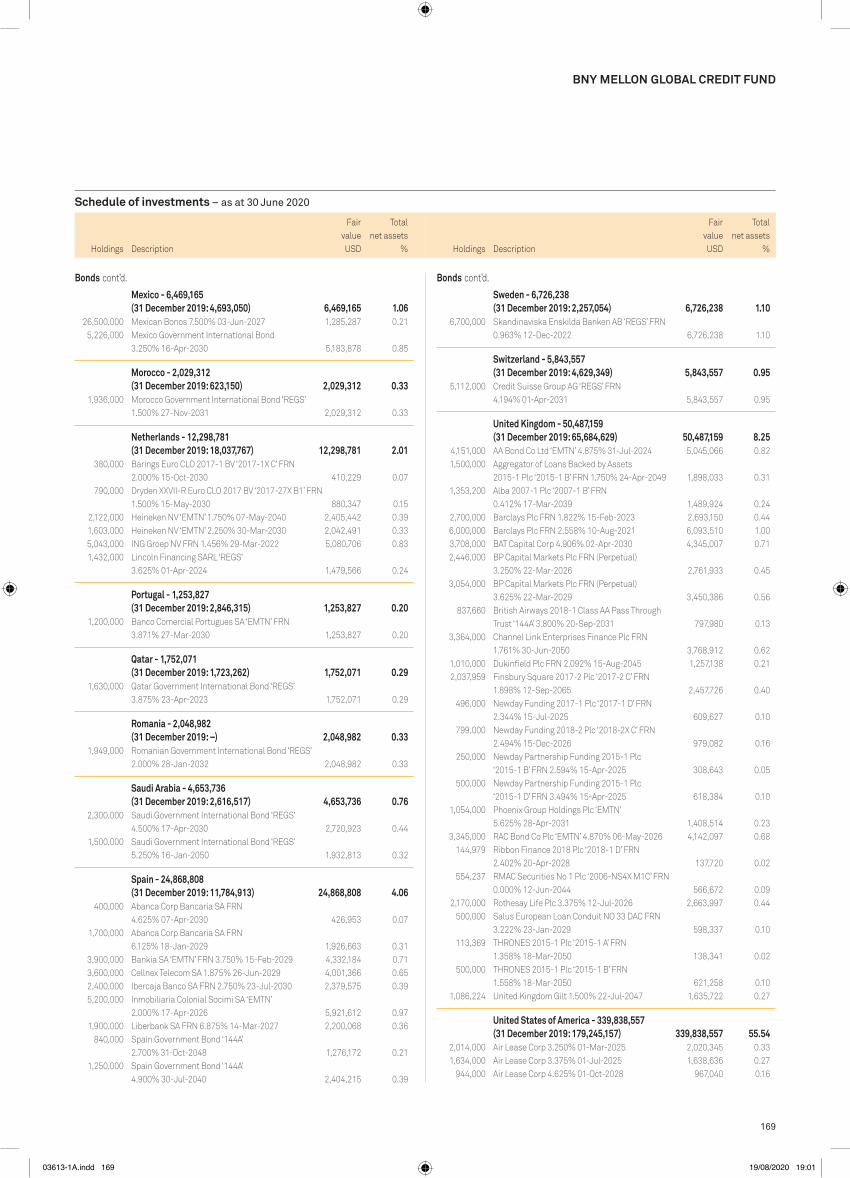
169
Schedule of investments – as at 30 June 2020
Holdings Description
Fair value
Total net assets
% Holdings Description
Fair value
Total net assets
%
BNy MELLON GLOBAL CREDIT FUND
Sweden - 6,726,238 (31 December 2019: 2,257,054) 6,726,238 1.10
6,700,000 Skandinaviska Enskilda Banken AB ‘REGS’ FRN 0.963% 12-Dec-2022 6,726,238 1.10
Switzerland - 5,843,557 (31 December 2019: 4,629,349) 5,843,557 0.95
5,112,000 Credit Suisse Group AG ‘REGS’ FRN 4.194% 01-Apr-2031 5,843,557 0.95
United Kingdom - 50,487,159 (31 December 2019: 65,684,629) 50,487,159 8.25
4,151,000 AA Bond Co Ltd ‘EMTN’ 4.875% 31-Jul-2024 5,045,066 0.82 1,500,000 Aggregator of Loans Backed by Assets
2015-1 Plc ‘2015-1 B’ FRN 1.750% 24-Apr-2049 1,898,033 0.31 1,353,200 Alba 2007-1 Plc ‘2007-1 B’ FRN
0.412% 17-Mar-2039 1,489,924 0.24 2,700,000 Barclays Plc FRN 1.822% 15-Feb-2023 2,693,150 0.44 6,000,000 Barclays Plc FRN 2.558% 10-Aug-2021 6,093,510 1.00 3,708,000 BAT Capital Corp 4.906% 02-Apr-2030 4,345,007 0.71 2,446,000 BP Capital Markets Plc FRN (Perpetual)
3.250% 22-Mar-2026 2,761,933 0.45 3,054,000 BP Capital Markets Plc FRN (Perpetual)
3.625% 22-Mar-2029 3,450,386 0.56 837,660 British Airways 2018-1 Class AA Pass Through
Trust ‘144A’ 3.800% 20-Sep-2031 797,980 0.13 3,364,000 Channel Link Enterprises Finance Plc FRN
1.761% 30-Jun-2050 3,768,912 0.62 1,010,000 Dukinfield Plc FRN 2.092% 15-Aug-2045 1,257,138 0.21 2,037,959 Finsbury Square 2017-2 Plc ‘2017-2 C’ FRN
1.898% 12-Sep-2065 2,457,726 0.40 496,000 Newday Funding 2017-1 Plc ‘2017-1 D’ FRN
2.344% 15-Jul-2025 609,627 0.10 799,000 Newday Funding 2018-2 Plc ‘2018-2X C’ FRN
2.494% 15-Dec-2026 979,082 0.16 250,000 Newday Partnership Funding 2015-1 Plc
‘2015-1 B’ FRN 2.594% 15-Apr-2025 308,643 0.05 500,000 Newday Partnership Funding 2015-1 Plc
‘2015-1 D’ FRN 3.494% 15-Apr-2025 618,384 0.10 1,054,000 Phoenix Group Holdings Plc ‘EMTN’
5.625% 28-Apr-2031 1,408,514 0.23 3,345,000 RAC Bond Co Plc ‘EMTN’ 4.870% 06-May-2026 4,142,097 0.68 144,979 Ribbon Finance 2018 Plc ‘2018-1 D’ FRN
2.402% 20-Apr-2028 137,720 0.02 554,237 RMAC Securities No 1 Plc ‘2006-NS4X M1C’ FRN
0.000% 12-Jun-2044 566,672 0.09 2,170,000 Rothesay Life Plc 3.375% 12-Jul-2026 2,663,997 0.44 500,000 Salus European Loan Conduit NO 33 DAC FRN
3.222% 23-Jan-2029 598,337 0.10 113,369 THRONES 2015-1 Plc ‘2015-1 A’ FRN
1.358% 18-Mar-2050 138,341 0.02 500,000 THRONES 2015-1 Plc ‘2015-1 B’ FRN
1.558% 18-Mar-2050 621,258 0.10 1,086,224 United Kingdom Gilt 1.500% 22-Jul-2047 1,635,722 0.27
United States of America - 339,838,557 (31 December 2019: 179,245,157) 339,838,557 55.54
2,014,000 Air Lease Corp 3.250% 01-Mar-2025 2,020,345 0.33 1,634,000 Air Lease Corp 3.375% 01-Jul-2025 1,638,636 0.27 944,000 Air Lease Corp 4.625% 01-Oct-2028 967,040 0.16
Mexico - 6,469,165 (31 December 2019: 4,693,050) 6,469,165 1.06
26,500,000 Mexican Bonos 7.500% 03-Jun-2027 1,285,287 0.21 5,226,000 Mexico Government International Bond
3.250% 16-Apr-2030 5,183,878 0.85
Morocco - 2,029,312 (31 December 2019: 623,150) 2,029,312 0.33
1,936,000 Morocco Government International Bond ‘REGS’ 1.500% 27-Nov-2031 2,029,312 0.33
Netherlands - 12,298,781 (31 December 2019: 18,037,767) 12,298,781 2.01
380,000 Barings Euro CLO 2017-1 BV ‘2017-1X C’ FRN 2.000% 15-Oct-2030 410,229 0.07
790,000 Dryden XXVII-R Euro CLO 2017 BV ‘2017-27X B1’ FRN 1.500% 15-May-2030 880,347 0.15
2,122,000 Heineken NV ‘EMTN’ 1.750% 07-May-2040 2,405,442 0.39 1,603,000 Heineken NV ‘EMTN’ 2.250% 30-Mar-2030 2,042,491 0.33 5,043,000 ING Groep NV FRN 1.456% 29-Mar-2022 5,080,706 0.83 1,432,000 Lincoln Financing SARL ‘REGS’
3.625% 01-Apr-2024 1,479,566 0.24
portugal - 1,253,827 (31 December 2019: 2,846,315) 1,253,827 0.20
1,200,000 Banco Comercial Portugues SA ‘EMTN’ FRN 3.871% 27-Mar-2030 1,253,827 0.20
Qatar - 1,752,071 (31 December 2019: 1,723,262) 1,752,071 0.29
1,630,000 Qatar Government International Bond ‘REGS’ 3.875% 23-Apr-2023 1,752,071 0.29
Romania - 2,048,982 (31 December 2019: –) 2,048,982 0.33
1,949,000 Romanian Government International Bond ‘REGS’ 2.000% 28-Jan-2032 2,048,982 0.33
Saudi Arabia - 4,653,736 (31 December 2019: 2,616,517) 4,653,736 0.76
2,300,000 Saudi Government International Bond ‘REGS’ 4.500% 17-Apr-2030 2,720,923 0.44
1,500,000 Saudi Government International Bond ‘REGS’ 5.250% 16-Jan-2050 1,932,813 0.32
Spain - 24,868,808 (31 December 2019: 11,784,913) 24,868,808 4.06
400,000 Abanca Corp Bancaria SA FRN 4.625% 07-Apr-2030 426,953 0.07
1,700,000 Abanca Corp Bancaria SA FRN 6.125% 18-Jan-2029 1,926,663 0.31
3,900,000 Bankia SA ‘EMTN’ FRN 3.750% 15-Feb-2029 4,332,184 0.71 3,600,000 Cellnex Telecom SA 1.875% 26-Jun-2029 4,001,366 0.65 2,400,000 Ibercaja Banco SA FRN 2.750% 23-Jul-2030 2,379,575 0.39 5,200,000 Inmobiliaria Colonial Socimi SA ‘EMTN’
2.000% 17-Apr-2026 5,921,612 0.97 1,900,000 Liberbank SA FRN 6.875% 14-Mar-2027 2,200,068 0.36 840,000 Spain Government Bond ‘144A’
2.700% 31-Oct-2048 1,276,172 0.21 1,250,000 Spain Government Bond ‘144A’
4.900% 30-Jul-2040 2,404,215 0.39
Bonds cont’d. Bonds cont’d.
USDUSD
03613-1A.indd 169 19/08/2020 19:01
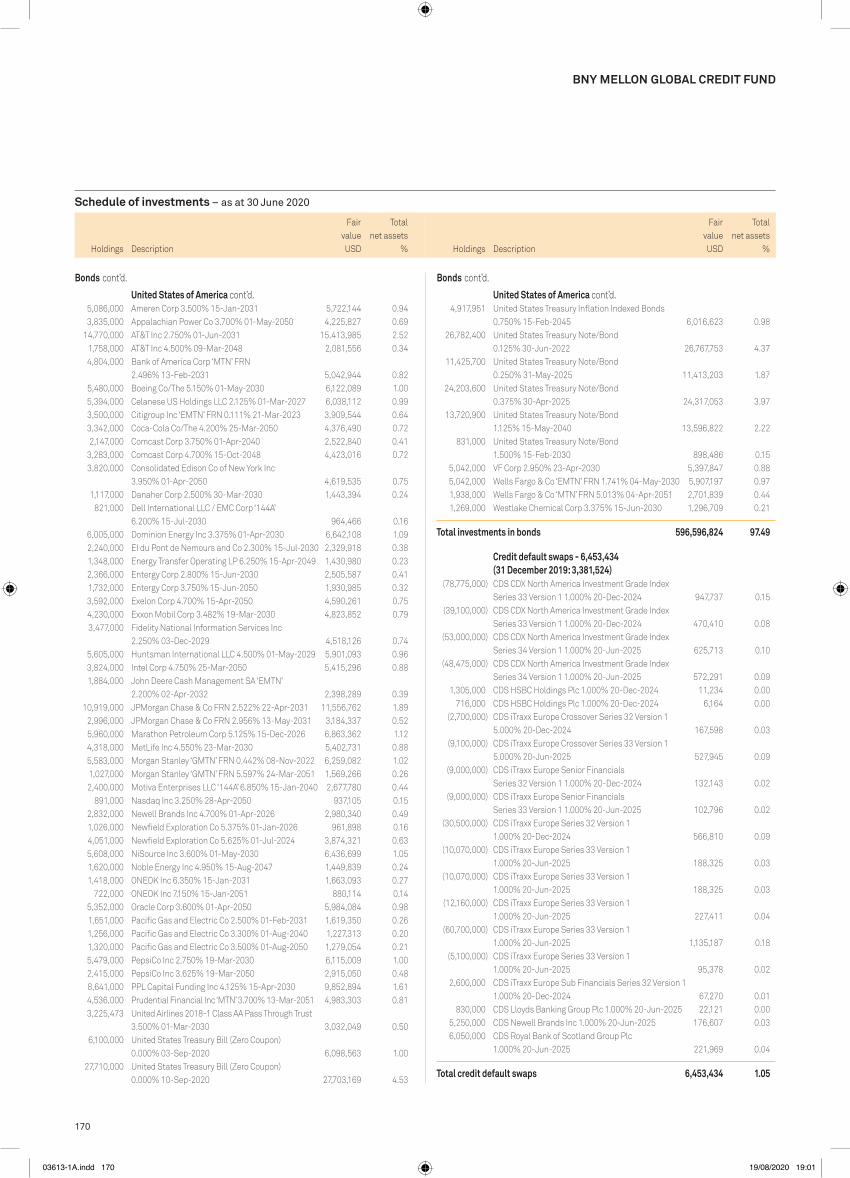
170
Schedule of investments – as at 30 June 2020
Holdings Description
Fair value
Total net assets
% Holdings Description
Fair value
Total net assets
%
BNy MELLON GLOBAL CREDIT FUND
4,917,951 United States Treasury Inflation Indexed Bonds 0.750% 15-Feb-2045 6,016,623 0.98
26,782,400 United States Treasury Note/Bond 0.125% 30-Jun-2022 26,767,753 4.37
11,425,700 United States Treasury Note/Bond 0.250% 31-May-2025 11,413,203 1.87
24,203,600 United States Treasury Note/Bond 0.375% 30-Apr-2025 24,317,053 3.97
13,720,900 United States Treasury Note/Bond 1.125% 15-May-2040 13,596,822 2.22
831,000 United States Treasury Note/Bond 1.500% 15-Feb-2030 898,486 0.15
5,042,000 VF Corp 2.950% 23-Apr-2030 5,397,847 0.88 5,042,000 Wells Fargo & Co ‘EMTN’ FRN 1.741% 04-May-2030 5,907,197 0.97 1,938,000 Wells Fargo & Co ‘MTN’ FRN 5.013% 04-Apr-2051 2,701,839 0.44 1,269,000 Westlake Chemical Corp 3.375% 15-Jun-2030 1,296,709 0.21
Total investments in bonds 596,596,824 97.49
Credit default swaps - 6,453,434 (31 December 2019: 3,381,524)
(78,775,000) CDS CDX North America Investment Grade Index Series 33 Version 1 1.000% 20-Dec-2024 947,737 0.15
(39,100,000) CDS CDX North America Investment Grade Index Series 33 Version 1 1.000% 20-Dec-2024 470,410 0.08
(53,000,000) CDS CDX North America Investment Grade Index Series 34 Version 1 1.000% 20-Jun-2025 625,713 0.10
(48,475,000) CDS CDX North America Investment Grade Index Series 34 Version 1 1.000% 20-Jun-2025 572,291 0.09
1,305,000 CDS HSBC Holdings Plc 1.000% 20-Dec-2024 11,234 0.00 716,000 CDS HSBC Holdings Plc 1.000% 20-Dec-2024 6,164 0.00 (2,700,000) CDS iTraxx Europe Crossover Series 32 Version 1
5.000% 20-Dec-2024 167,598 0.03 (9,100,000) CDS iTraxx Europe Crossover Series 33 Version 1
5.000% 20-Jun-2025 527,945 0.09 (9,000,000) CDS iTraxx Europe Senior Financials
Series 32 Version 1 1.000% 20-Dec-2024 132,143 0.02 (9,000,000) CDS iTraxx Europe Senior Financials
Series 33 Version 1 1.000% 20-Jun-2025 102,796 0.02 (30,500,000) CDS iTraxx Europe Series 32 Version 1
1.000% 20-Dec-2024 566,810 0.09 (10,070,000) CDS iTraxx Europe Series 33 Version 1
1.000% 20-Jun-2025 188,325 0.03 (10,070,000) CDS iTraxx Europe Series 33 Version 1
1.000% 20-Jun-2025 188,325 0.03 (12,160,000) CDS iTraxx Europe Series 33 Version 1
1.000% 20-Jun-2025 227,411 0.04 (60,700,000) CDS iTraxx Europe Series 33 Version 1
1.000% 20-Jun-2025 1,135,187 0.18 (5,100,000) CDS iTraxx Europe Series 33 Version 1
1.000% 20-Jun-2025 95,378 0.02 2,600,000 CDS iTraxx Europe Sub Financials Series 32 Version 1
1.000% 20-Dec-2024 67,270 0.01 830,000 CDS Lloyds Banking Group Plc 1.000% 20-Jun-2025 22,121 0.00 5,250,000 CDS Newell Brands Inc 1.000% 20-Jun-2025 176,607 0.03 6,050,000 CDS Royal Bank of Scotland Group Plc
1.000% 20-Jun-2025 221,969 0.04
Total credit default swaps 6,453,434 1.05
5,086,000 Ameren Corp 3.500% 15-Jan-2031 5,722,144 0.94 3,835,000 Appalachian Power Co 3.700% 01-May-2050 4,225,827 0.69 14,770,000 AT&T Inc 2.750% 01-Jun-2031 15,413,985 2.52 1,758,000 AT&T Inc 4.500% 09-Mar-2048 2,081,556 0.34 4,804,000 Bank of America Corp ‘MTN’ FRN
2.496% 13-Feb-2031 5,042,944 0.82 5,480,000 Boeing Co/The 5.150% 01-May-2030 6,122,089 1.00 5,394,000 Celanese US Holdings LLC 2.125% 01-Mar-2027 6,038,112 0.99 3,500,000 Citigroup Inc ‘EMTN’ FRN 0.111% 21-Mar-2023 3,909,544 0.64 3,342,000 Coca-Cola Co/The 4.200% 25-Mar-2050 4,376,490 0.72 2,147,000 Comcast Corp 3.750% 01-Apr-2040 2,522,840 0.41 3,283,000 Comcast Corp 4.700% 15-Oct-2048 4,423,016 0.72 3,820,000 Consolidated Edison Co of New York Inc
3.950% 01-Apr-2050 4,619,535 0.75 1,117,000 Danaher Corp 2.500% 30-Mar-2030 1,443,394 0.24 821,000 Dell International LLC / EMC Corp ‘144A’
6.200% 15-Jul-2030 964,466 0.16 6,005,000 Dominion Energy Inc 3.375% 01-Apr-2030 6,642,108 1.09 2,240,000 EI du Pont de Nemours and Co 2.300% 15-Jul-2030 2,329,918 0.38 1,348,000 Energy Transfer Operating LP 6.250% 15-Apr-2049 1,430,980 0.23 2,366,000 Entergy Corp 2.800% 15-Jun-2030 2,505,587 0.41 1,732,000 Entergy Corp 3.750% 15-Jun-2050 1,930,985 0.32 3,592,000 Exelon Corp 4.700% 15-Apr-2050 4,590,261 0.75 4,230,000 Exxon Mobil Corp 3.482% 19-Mar-2030 4,823,852 0.79 3,477,000 Fidelity National Information Services Inc
2.250% 03-Dec-2029 4,518,126 0.74 5,605,000 Huntsman International LLC 4.500% 01-May-2029 5,901,093 0.96 3,824,000 Intel Corp 4.750% 25-Mar-2050 5,415,296 0.88 1,884,000 John Deere Cash Management SA ‘EMTN’
2.200% 02-Apr-2032 2,398,289 0.39 10,919,000 JPMorgan Chase & Co FRN 2.522% 22-Apr-2031 11,556,762 1.89 2,996,000 JPMorgan Chase & Co FRN 2.956% 13-May-2031 3,184,337 0.52 5,960,000 Marathon Petroleum Corp 5.125% 15-Dec-2026 6,863,362 1.12 4,318,000 MetLife Inc 4.550% 23-Mar-2030 5,402,731 0.88 5,583,000 Morgan Stanley ‘GMTN’ FRN 0.442% 08-Nov-2022 6,259,082 1.02 1,027,000 Morgan Stanley ‘GMTN’ FRN 5.597% 24-Mar-2051 1,569,266 0.26 2,400,000 Motiva Enterprises LLC ‘144A’ 6.850% 15-Jan-2040 2,677,780 0.44 891,000 Nasdaq Inc 3.250% 28-Apr-2050 937,105 0.15 2,832,000 Newell Brands Inc 4.700% 01-Apr-2026 2,980,340 0.49 1,026,000 Newfield Exploration Co 5.375% 01-Jan-2026 961,898 0.16 4,051,000 Newfield Exploration Co 5.625% 01-Jul-2024 3,874,321 0.63 5,608,000 NiSource Inc 3.600% 01-May-2030 6,436,699 1.05 1,620,000 Noble Energy Inc 4.950% 15-Aug-2047 1,449,839 0.24 1,418,000 ONEOK Inc 6.350% 15-Jan-2031 1,663,093 0.27 722,000 ONEOK Inc 7.150% 15-Jan-2051 880,114 0.14 5,352,000 Oracle Corp 3.600% 01-Apr-2050 5,984,084 0.98 1,651,000 Pacific Gas and Electric Co 2.500% 01-Feb-2031 1,619,350 0.26 1,256,000 Pacific Gas and Electric Co 3.300% 01-Aug-2040 1,227,313 0.20 1,320,000 Pacific Gas and Electric Co 3.500% 01-Aug-2050 1,279,054 0.21 5,479,000 PepsiCo Inc 2.750% 19-Mar-2030 6,115,009 1.00 2,415,000 PepsiCo Inc 3.625% 19-Mar-2050 2,915,050 0.48 8,641,000 PPL Capital Funding Inc 4.125% 15-Apr-2030 9,852,894 1.61 4,536,000 Prudential Financial Inc ‘MTN’ 3.700% 13-Mar-2051 4,983,303 0.81 3,225,473 United Airlines 2018-1 Class AA Pass Through Trust
3.500% 01-Mar-2030 3,032,049 0.50 6,100,000 United States Treasury Bill (Zero Coupon)
0.000% 03-Sep-2020 6,098,563 1.00 27,710,000 United States Treasury Bill (Zero Coupon)
0.000% 10-Sep-2020 27,703,169 4.53
Bonds cont’d.
United States of America cont’d.
Bonds cont’d.
United States of America cont’d.
USDUSD
03613-1A.indd 170 19/08/2020 19:01
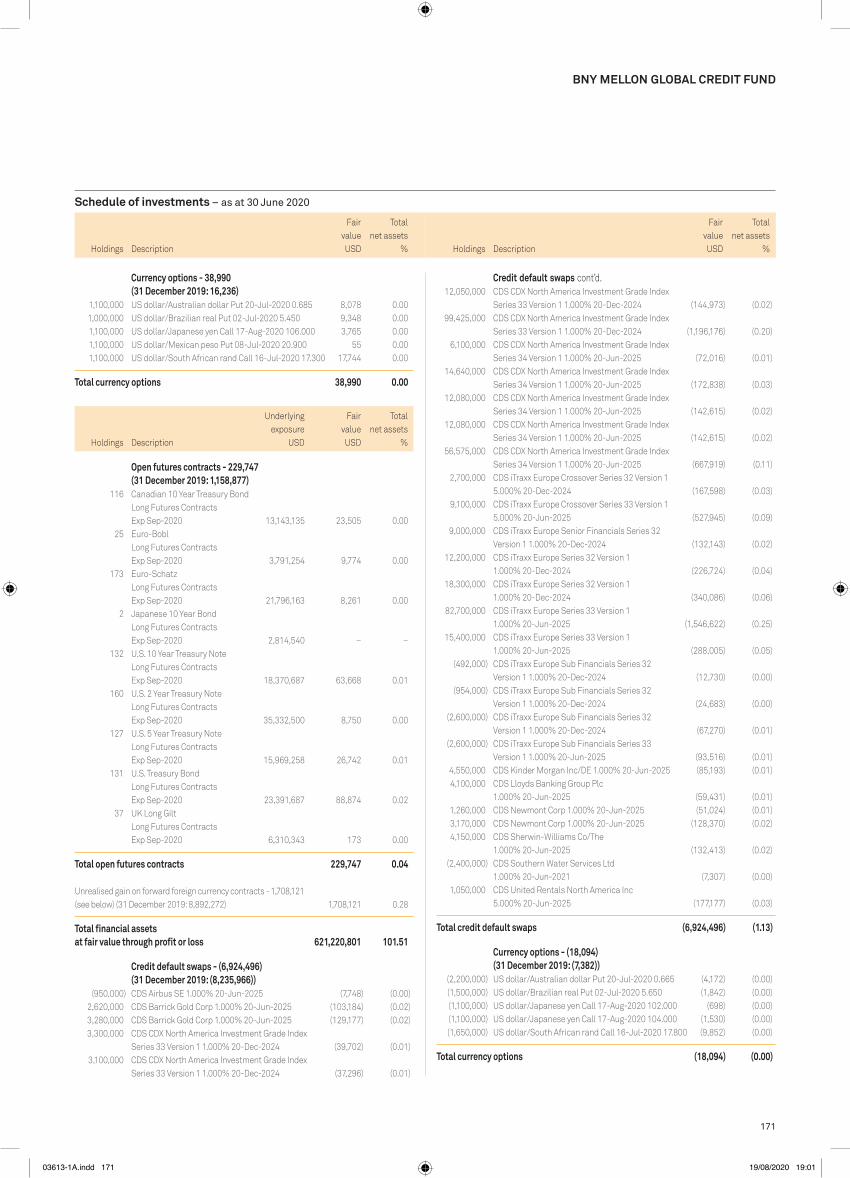
171
Schedule of investments – as at 30 June 2020
Holdings Description
Fair value
Total net assets
% Holdings Description
Fair value
Total net assets
%
BNy MELLON GLOBAL CREDIT FUND
12,050,000 CDS CDX North America Investment Grade Index Series 33 Version 1 1.000% 20-Dec-2024 (144,973) (0.02)
99,425,000 CDS CDX North America Investment Grade Index Series 33 Version 1 1.000% 20-Dec-2024 (1,196,176) (0.20)
6,100,000 CDS CDX North America Investment Grade Index Series 34 Version 1 1.000% 20-Jun-2025 (72,016) (0.01)
14,640,000 CDS CDX North America Investment Grade Index Series 34 Version 1 1.000% 20-Jun-2025 (172,838) (0.03)
12,080,000 CDS CDX North America Investment Grade Index Series 34 Version 1 1.000% 20-Jun-2025 (142,615) (0.02)
12,080,000 CDS CDX North America Investment Grade Index Series 34 Version 1 1.000% 20-Jun-2025 (142,615) (0.02)
56,575,000 CDS CDX North America Investment Grade Index Series 34 Version 1 1.000% 20-Jun-2025 (667,919) (0.11)
2,700,000 CDS iTraxx Europe Crossover Series 32 Version 1 5.000% 20-Dec-2024 (167,598) (0.03)
9,100,000 CDS iTraxx Europe Crossover Series 33 Version 1 5.000% 20-Jun-2025 (527,945) (0.09)
9,000,000 CDS iTraxx Europe Senior Financials Series 32 Version 1 1.000% 20-Dec-2024 (132,143) (0.02)
12,200,000 CDS iTraxx Europe Series 32 Version 1 1.000% 20-Dec-2024 (226,724) (0.04)
18,300,000 CDS iTraxx Europe Series 32 Version 1 1.000% 20-Dec-2024 (340,086) (0.06)
82,700,000 CDS iTraxx Europe Series 33 Version 1 1.000% 20-Jun-2025 (1,546,622) (0.25)
15,400,000 CDS iTraxx Europe Series 33 Version 1 1.000% 20-Jun-2025 (288,005) (0.05)
(492,000) CDS iTraxx Europe Sub Financials Series 32 Version 1 1.000% 20-Dec-2024 (12,730) (0.00)
(954,000) CDS iTraxx Europe Sub Financials Series 32 Version 1 1.000% 20-Dec-2024 (24,683) (0.00)
(2,600,000) CDS iTraxx Europe Sub Financials Series 32 Version 1 1.000% 20-Dec-2024 (67,270) (0.01)
(2,600,000) CDS iTraxx Europe Sub Financials Series 33 Version 1 1.000% 20-Jun-2025 (93,516) (0.01)
4,550,000 CDS Kinder Morgan Inc/DE 1.000% 20-Jun-2025 (85,193) (0.01) 4,100,000 CDS Lloyds Banking Group Plc
1.000% 20-Jun-2025 (59,431) (0.01) 1,260,000 CDS Newmont Corp 1.000% 20-Jun-2025 (51,024) (0.01) 3,170,000 CDS Newmont Corp 1.000% 20-Jun-2025 (128,370) (0.02) 4,150,000 CDS Sherwin-Williams Co/The
1.000% 20-Jun-2025 (132,413) (0.02) (2,400,000) CDS Southern Water Services Ltd
1.000% 20-Jun-2021 (7,307) (0.00) 1,050,000 CDS United Rentals North America Inc
5.000% 20-Jun-2025 (177,177) (0.03)
Total credit default swaps (6,924,496) (1.13)
Currency options - (18,094) (31 December 2019: (7,382))
(2,200,000) US dollar/Australian dollar Put 20-Jul-2020 0.665 (4,172) (0.00) (1,500,000) US dollar/Brazilian real Put 02-Jul-2020 5.650 (1,842) (0.00) (1,100,000) US dollar/Japanese yen Call 17-Aug-2020 102.000 (698) (0.00) (1,100,000) US dollar/Japanese yen Call 17-Aug-2020 104.000 (1,530) (0.00) (1,650,000) US dollar/South African rand Call 16-Jul-2020 17.800 (9,852) (0.00)
Total currency options (18,094) (0.00)
Currency options - 38,990 (31 December 2019: 16,236)
1,100,000 US dollar/Australian dollar Put 20-Jul-2020 0.685 8,078 0.00 1,000,000 US dollar/Brazilian real Put 02-Jul-2020 5.450 9,348 0.00 1,100,000 US dollar/Japanese yen Call 17-Aug-2020 106.000 3,765 0.00 1,100,000 US dollar/Mexican peso Put 08-Jul-2020 20.900 55 0.00 1,100,000 US dollar/South African rand Call 16-Jul-2020 17.300 17,744 0.00
Total currency options 38,990 0.00
Holdings Description
Underlying exposure
USD
Fair value USD
Total net assets
%
Open futures contracts - 229,747 (31 December 2019: 1,158,877)
116 Canadian 10 Year Treasury Bond Long Futures Contracts Exp Sep-2020 13,143,135 23,505 0.00
25 Euro-Bobl Long Futures Contracts Exp Sep-2020 3,791,254 9,774 0.00
173 Euro-Schatz Long Futures Contracts Exp Sep-2020 21,796,163 8,261 0.00
2 Japanese 10 Year Bond Long Futures Contracts Exp Sep-2020 2,814,540 – –
132 U.S. 10 Year Treasury Note Long Futures Contracts Exp Sep-2020 18,370,687 63,668 0.01
160 U.S. 2 Year Treasury Note Long Futures Contracts Exp Sep-2020 35,332,500 8,750 0.00
127 U.S. 5 Year Treasury Note Long Futures Contracts Exp Sep-2020 15,969,258 26,742 0.01
131 U.S. Treasury Bond Long Futures Contracts Exp Sep-2020 23,391,687 88,874 0.02
37 UK Long Gilt Long Futures Contracts Exp Sep-2020 6,310,343 173 0.00
Total open futures contracts 229,747 0.04 Unrealised gain on forward foreign currency contracts - 1,708,121 (see below) (31 December 2019: 8,892,272) 1,708,121 0.28
Total financial assets at fair value through profit or loss 621,220,801 101.51
Credit default swaps - (6,924,496) (31 December 2019: (8,235,966))
(950,000) CDS Airbus SE 1.000% 20-Jun-2025 (7,748) (0.00) 2,620,000 CDS Barrick Gold Corp 1.000% 20-Jun-2025 (103,184) (0.02) 3,280,000 CDS Barrick Gold Corp 1.000% 20-Jun-2025 (129,177) (0.02) 3,300,000 CDS CDX North America Investment Grade Index
Series 33 Version 1 1.000% 20-Dec-2024 (39,702) (0.01) 3,100,000 CDS CDX North America Investment Grade Index
Series 33 Version 1 1.000% 20-Dec-2024 (37,296) (0.01)
Credit default swaps cont’d.
USDUSD
03613-1A.indd 171 19/08/2020 19:01

172
Schedule of investments – as at 30 June 2020
Holdings Description
Fair value
Total net assets
% Holdings Description
Fair value
Total net assets
%
BNy MELLON GLOBAL CREDIT FUND
Underlying exposure
USD
Open futures contracts - (460,407) (31 December 2019: (1,028,254))
(11) Euro-BTP Short Futures Contracts Exp Sep-2020 (1,778,142) (34,941) (0.01)
(35) Euro-Bund Short Futures Contracts Exp Sep-2020 (6,941,213) (16,606) (0.00)
(16) Euro-Buxl 30 Year Bond Short Futures Contracts Exp Sep-2020 (3,954,004) (14,533) (0.00)
(68) SFE 10 Year Australian Treasury Bond Short Futures Contracts Exp Sep-2020 (6,982,164) (73,126) (0.01)
(381) U.S. 10 Year Ultra Treasury Note Short Futures Contracts Exp Sep-2020 (60,001,547) (280,701) (0.05)
(10) U.S. Treasury Ultra Bond Short Futures Contracts Exp Sep-2020 (2,181,562) (40,500) (0.01)
Total open futures contracts (460,407) (0.08) Unrealised loss on forward foreign currency contracts - (5,102,579) (see below) (31 December 2019: (2,636,877)) (5,102,579) (0.83)
Total financial liabilities at fair value through profit or loss (12,505,576) (2.04)
Net current assets 3,244,653 0.53
Total net assets 611,959,878 100.00
The counterparties for credit default swaps are Bank of America Merrill Lynch, Barclays Bank pLC, BNp paribas, Citigroup Global Markets Limited, Goldman Sachs, JpMorgan Chase Bank and Morgan Stanley.The counterparties for currency options are Barclays Bank pLC, BNp paribas and Goldman Sachs.The counterparty for futures contracts is Goldman Sachs.
Analysis of portfolio % of Total Assets
Transferable securities and money market instruments admitted to official stock exchange listing or traded on a regulated market 96.54Financial derivative instruments dealt in on a regulated market 0.04oTC financial derivative instruments 1.29other current assets 2.13
Total assets 100.00
USDUSD
Forward foreign currency contracts cont’d.Unrealised
Gain/(Loss)Buy Sell Amount (B) Amount (S)Settle
Date Counterparty
BNy Mellon Global Credit FundUS dollar Brazilian real 488,355 2,500,000 02-Jul-20 BNP Paribas 28,635US dollar Brazilian real 746,278 4,008,000 02-Jul-20 Goldman Sachs 9,256Euro US dollar 1,640,000 1,839,691 10-Jul-20 Lloyds Bank plc 3,193Euro US dollar 1,620,000 1,815,351 10-Jul-20 HSBC Bank plc 5,059Japanese yen US dollar 134,627,000 1,230,739 10-Jul-20 JPMorgan Chase
Bank 16,228Sterling US dollar 3,710,000 4,568,001 10-Jul-20 Lloyds Bank plc 29,324US dollar Euro 119,049,096 105,655,000 10-Jul-20 Natwest
Markets Plc 323,551US dollar Euro 3,420,551 3,040,000 10-Jul-20 BNP Paribas 4,474US dollar Euro 29,375,422 26,040,000 10-Jul-20 Goldman Sachs 114,022US dollar Euro 3,366,781 2,983,000 10-Jul-20 Bank of America
Merrill Lynch 14,755US dollar Mexican peso 1,121,244 24,403,000 10-Jul-20 Goldman Sachs 60,741US dollar Sterling 13,391,531 10,624,000 10-Jul-20 Toronto Dominion
Bank 226,578US dollar Sterling 13,385,828 10,623,000 10-Jul-20 HSBC Bank plc 222,114US dollar Sterling 13,390,161 10,624,000 10-Jul-20 JPMorgan Chase
Bank 225,209US dollar Sterling 3,264,232 2,600,000 10-Jul-20 Natwest
Markets Plc 42,388Australian dollar US dollar 798,605 550,000 16-Jul-20 Goldman Sachs 1,164Korean won US dollar 120,000,000 99,695 16-Jul-20 Citigroup Global
Markets Limited 208Mexican peso US dollar 3,744,676 161,317 16-Jul-20 Citigroup Global
Markets Limited 1,279US dollar Australian dollar 1,076,303 1,551,350 16-Jul-20 Citigroup Global
Markets Limited 5,625US dollar Euro 5,770,708 5,068,227 16-Jul-20 Citigroup Global
Markets Limited 74,698US dollar Japanese yen 797,571 85,243,161 16-Jul-20 Bank of America
Merrill Lynch 7,954US dollar Korean won 550,629 660,000,000 16-Jul-20 HSBC Bank plc 1,163US dollar Mexican peso 550,000 12,533,444 16-Jul-20 JPMorgan Chase
Bank 5,790US dollar Mexican peso 275,000 6,185,933 16-Jul-20 BNP Paribas 6,403US dollar Mexican peso 275,000 6,198,008 16-Jul-20 Citigroup Global
Markets Limited 5,879US dollar Russian rouble 545,189 37,950,000 16-Jul-20 BNP Paribas 12,996US dollar South African rand 550,000 9,537,279 16-Jul-20 BNP Paribas 1,285US dollar South African rand 550,000 9,522,629 16-Jul-20 Bank of America
Merrill Lynch 2,127US dollar Sterling 6,500,322 5,121,663 16-Jul-20 HSBC Bank plc 153,434US dollar Chilean peso 525,344 412,500,000 17-Jul-20 Bank of America
Merrill Lynch 23,001US dollar Brazilian real 1,226,374 6,508,000 04-Aug-20 Goldman Sachs 31,699US dollar Indonesian rupiah 1,473,079 20,915,802,000 11-Aug-20 BNP Paribas 44,007
USD 1,704,239
Brazilian real US dollar 6,508,000 1,227,693 02-Jul-20 Goldman Sachs (30,951)Euro US dollar 2,095,000 2,356,714 10-Jul-20 Bank of America
Merrill Lynch (2,542)Euro US dollar 3,590,000 4,084,575 10-Jul-20 BNP Paribas (50,457)Euro US dollar 2,240,000 2,551,611 10-Jul-20 JPMorgan Chase
Bank (34,501)Euro US dollar 8,470,000 9,567,717 10-Jul-20 Goldman Sachs (49,896)Euro US dollar 1,781,000 2,010,078 10-Jul-20 Citigroup Global
Markets Limited (8,751)Sterling US dollar 3,015,000 3,741,329 10-Jul-20 Lloyds Bank plc (5,228)Sterling US dollar 740,000 918,351 10-Jul-20 Lloyds Bank plc (1,365)Sterling US dollar 1,687,000 2,107,768 10-Jul-20 Lloyds Bank plc (17,287)US dollar Australian dollar 3,319,996 4,817,000 10-Jul-20 Citigroup Global
Markets Limited (4,378)US dollar Euro 5,168,630 4,600,000 10-Jul-20 Citigroup Global
Markets Limited (434)US dollar Japanese yen 401,344 43,621,000 10-Jul-20 JPMorgan Chase
Bank (2,691)
03613-1A.indd 172 19/08/2020 19:01

173
Schedule of investments – as at 30 June 2020
BNy MELLON GLOBAL CREDIT FUND
Forward foreign currency contracts cont’d.Unrealised
Gain/(Loss)Buy Sell Amount (B) Amount (S)Settle
Date Counterparty
BNy Mellon Global Credit Fund cont’d.Australian dollar US dollar 794,570 550,000 16-Jul-20 Citigroup Global
Markets Limited (1,620)Australian dollar US dollar 793,971 550,000 16-Jul-20 BNP Paribas (2,034)Euro Polish zloty 166,000 742,742 16-Jul-20 BNP Paribas (1,184)Euro Polish zloty 167,000 747,302 16-Jul-20 HSBC Bank plc (1,212)Euro Polish zloty 167,000 747,262 16-Jul-20 HSBC Bank plc (1,202)Korean won US dollar 1,860,000,000 1,563,380 16-Jul-20 HSBC Bank plc (14,887)Mexican peso US dollar 21,653,020 969,909 16-Jul-20 RBC Capital
Markets (29,722)Mexican peso US dollar 12,235,473 550,000 16-Jul-20 Citigroup Global
Markets Limited (18,729)Polish zloty US dollar 1,976,716 502,639 16-Jul-20 Citigroup Global
Markets Limited (2,978)Russian rouble US dollar 38,500,000 551,027 16-Jul-20 BNP Paribas (11,122)Russian rouble US dollar 70,000,000 1,014,250 16-Jul-20 HSBC Bank plc (32,604)Sterling Euro 448,517 500,000 16-Jul-20 BNP Paribas (6,121)Sterling Euro 678,804 757,000 16-Jul-20 BNP Paribas (9,576)Sterling Euro 217,759 243,000 16-Jul-20 Citigroup Global
Markets Limited (3,247)US dollar Australian dollar 550,000 800,881 16-Jul-20 Citigroup Global
Markets Limited (2,735)US dollar Australian dollar 550,000 803,351 16-Jul-20 Citigroup Global
Markets Limited (4,440)US dollar Australian dollar 550,000 803,125 16-Jul-20 Citigroup Global
Markets Limited (4,284)US dollar Australian dollar 550,000 800,291 16-Jul-20 BNP Paribas (2,328)US dollar Indian rupee 395,898 30,000,000 16-Jul-20 JPMorgan Chase
Bank (759)US dollar Korean won 544,088 660,000,000 16-Jul-20 JPMorgan Chase
Bank (5,378)US dollar Korean won 544,406 660,000,000 16-Jul-20 JPMorgan Chase
Bank (5,059)US dollar Mexican peso 550,000 12,715,784 16-Jul-20 BNP Paribas (2,127)
USD (371,829)
Net USD 1,332,410
BNy Mellon Global Credit Fund CAD x (Acc) (Hedged) Share ClassCanadian dollar US dollar 600,931,672 447,252,759 15-Jul-20 The Bank of
New York Mellon (4,593,145)
USD (4,593,145)
CAD (6,235,654)
BNy Mellon Global Credit Fund EUR H (Acc) (Hedged) Share ClassUS dollar Euro 16,841 14,988 02-Jul-20 The Bank of
New York Mellon 2Euro US dollar 35,000 39,288 15-Jul-20 The Bank of
New York Mellon 46Euro US dollar 74,974 83,911 15-Jul-20 The Bank of
New York Mellon 347Euro US dollar 89,933 100,808 15-Jul-20 The Bank of
New York Mellon 263US dollar Euro 534,669 472,883 15-Jul-20 The Bank of
New York Mellon 3,224
USD 3,882
EUR 3,455
Forward foreign currency contracts cont’d.Unrealised
Gain/(Loss)Buy Sell Amount (B) Amount (S)Settle
Date Counterparty
BNy Mellon Global Credit Fund EUR H (Acc) (Hedged) Share Class cont’d.Euro US dollar 406,933 457,480 15-Jul-20 The Bank of
New York Mellon (152)Euro US dollar 13,536 15,325 15-Jul-20 The Bank of
New York Mellon (113)Euro US dollar 113,168 127,440 15-Jul-20 The Bank of
New York Mellon (257)Euro US dollar 49,988 56,528 15-Jul-20 The Bank of
New York Mellon (351)Euro US dollar 29,972 34,163 15-Jul-20 The Bank of
New York Mellon (479)Euro US dollar 39,986 45,363 15-Jul-20 The Bank of
New York Mellon (425)Euro US dollar 30,505 34,490 15-Jul-20 The Bank of
New York Mellon (208)Euro US dollar 9,816,515 11,151,869 15-Jul-20 The Bank of
New York Mellon (119,675)Euro US dollar 8,988 10,163 15-Jul-20 The Bank of
New York Mellon (63)Euro US dollar 14,988 16,845 15-Jul-20 The Bank of
New York Mellon (2)Euro US dollar 50,000 56,282 15-Jul-20 The Bank of
New York Mellon (90)Euro US dollar 159,936 180,109 15-Jul-20 The Bank of
New York Mellon (367)
USD (122,182)
EUR (108,751)
Net USD (118,300)
Net EUR (105,296)
BNy Mellon Global Credit Fund Sterling W (Acc) (Hedged) Share ClassSterling US dollar 12,606 15,653 15-Jul-20 The Bank of
New York Mellon (32)Sterling US dollar 14,843 18,661 15-Jul-20 The Bank of
New York Mellon (267)Sterling US dollar 114,606 146,352 15-Jul-20 The Bank of
New York Mellon (4,331)Sterling US dollar 339,465 431,463 15-Jul-20 The Bank of
New York Mellon (10,793)
USD (15,423)
GBp (12,447)
03613-1A.indd 173 19/08/2020 19:01

174
Schedule of investments – as at 30 June 2020
Holdings Description
Fair value
Total net assets
% Holdings Description
Fair value
Total net assets
%
FUND 22 – BNy MELLON GLOBAL DyNAMIC BOND FUND
BNY MELLON GLOBAL DYNAMIC BOND FUND
1,600,000 Covivio 1.625% 23-Jun-2030 1,797,082 0.49 1,715,000 CRH Finland Services Oyj ‘EMTN’
0.875% 05-Nov-2023 1,953,381 0.53 619,000 DH Europe Finance II Sarl 0.450% 18-Mar-2028 680,069 0.18 2,115,000 Digital Euro Finco LLC 1.125% 09-Apr-2028 2,380,176 0.64 831,000 Fidelity National Information Services Inc
0.625% 03-Dec-2025 924,902 0.25 1,350,000 Fomento Economico Mexicano SAB de CV
1.750% 20-Mar-2023 1,560,111 0.42 3,500,000 German Postal Pensions Securitisation Plc
3.750% 18-Jan-2021 4,029,000 1.09 800,000 Infineon Technologies AG ‘EMTN’ FRN
(Perpetual) 2.875% 01-Jan-2025 878,105 0.24 500,000 Infineon Technologies AG FRN (Perpetual)
3.625% 01-Jan-2028 557,687 0.15 994,000 Informa Plc ‘EMTN’ 1.500% 05-Jul-2023 1,094,527 0.30 1,132,000 IQVIA Inc ‘REGS’ 2.875% 15-Jun-2028 1,267,274 0.34 7,280,000 Italy Buoni Poliennali Del Tesoro
4.500% 01-May-2023 9,140,249 2.47 6,280,000 Italy Buoni Poliennali Del Tesoro ‘144A’
1.850% 01-Jul-2025 7,441,073 2.01 1,500,000 JCDecaux SA 2.000% 24-Oct-2024 1,701,444 0.46 1,600,000 Linde Finance BV 0.250% 19-May-2027 1,809,394 0.49 1,015,000 Lloyds Banking Group Plc FRN (Perpetual)
4.947% 27-Jun-2025 1,110,307 0.30 1,280,000 Motability Operations Group Plc ‘EMTN’
1.625% 09-Jun-2023 1,502,574 0.41 1,265,000 Nestle Finance International Ltd ‘EMTN’
0.125% 12-Nov-2027 1,414,161 0.38 1,092,000 Nokia Oyj ‘EMTN’ 2.375% 15-May-2025 1,260,310 0.34 246,000 Orange SA ‘EMTN’ FRN (Perpetual)
4.000% 01-Oct-2021 284,947 0.08 723,000 PepsiCo Inc 0.250% 06-May-2024 816,283 0.22 300,000 Prologis International Funding II SA ‘EMTN’
1.625% 17-Jun-2032 352,203 0.10 3,930,000 Province of British Columbia Canada ‘EMTN’
0.875% 08-Oct-2025 4,645,595 1.26 1,529,000 Reckitt Benckiser Treasury Services
Nederland BV ‘REGS’ 0.375% 19-May-2026 1,725,400 0.47 2,017,000 SELP Finance Sarl 1.250% 25-Oct-2023 2,280,188 0.62 1,160,000 Shell International Finance BV ‘EMTN’
1.125% 07-Apr-2024 1,350,383 0.36 592,000 SIG Combibloc PurchaseCo Sarl ‘REGS’
1.875% 18-Jun-2023 673,361 0.18 1,952,564 Silverback Finance DAC 3.126% 25-Feb-2037 2,365,206 0.64 892,000 Societe Generale SA FRN (Perpetual)
6.750% 07-Apr-2021 997,924 0.27 4,800,000 Spain Government Bond ‘144A’
5.150% 31-Oct-2028 7,551,281 2.04 1,628,000 Summer BC Holdco B SARL ‘REGS’
5.750% 31-Oct-2026 1,760,958 0.48 342,000 Synlab Bondco Plc ‘REGS’ FRN
4.750% 01-Jul-2025 383,176 0.10 171,000 Synthomer Plc ‘REGS’ 3.875% 01-Jul-2025 193,852 0.05 1,000,000 Telefonica Europe BV FRN (Perpetual)
4.375% 14-Dec-2024 1,158,731 0.31 1,820,000 UBS AG ‘EMTN’ FRN 4.750% 12-Feb-2026 2,079,596 0.56 1,260,000 UniCredit SpA ‘EMTN’ FRN (Perpetual)
3.875% 03-Jun-2027 1,041,597 0.28
Collective investment schemes
Sterling - 5,108,233 (31 December 2019: 8,541,856) 5,108,233 1.38
3,120,000 BNY Mellon Investments Funds - BNY Mellon Global High Yield Bond Fund 5,108,233 1.38
US Dollar - 1,810,749 (31 December 2019: 22,411,413) 1,810,749 0.49
353,248 iShares China CNY Bond UCITS ETF - ETF 1,810,749 0.49
Total investments in collective investment schemes 6,918,982 1.87
Bonds
Australian Dollar - 17,541,328 (31 December 2019: 23,795,567) 17,541,328 4.74
3,130,000 Australia Government Bond 3.000% 20-Sep-2025 3,134,606 0.85 5,250,000 Australia Government Bond 3.000% 21-Mar-2047 4,580,341 1.24 8,010,000 Treasury Corp of Victoria 1.000% 20-Nov-2023 5,598,040 1.51 5,820,000 Treasury Corp of Victoria 2.250% 20-Nov-2034 4,228,341 1.14
Canadian Dollar - 9,515,105 (31 December 2019: 13,865,586) 9,515,105 2.57
4,980,000 Canada Housing Trust No 1 ‘144A’ 2.100% 15-Sep-2029 4,018,729 1.09
7,100,000 Canada Housing Trust No 1 ‘144A’ 2.350% 15-Sep-2023 5,496,376 1.48
Colombian peso - 3,198,263 (31 December 2019: –) 3,198,263 0.86
11,717,100,000 Colombia Government International Bond ‘REGS’ 6.000% 28-Apr-2028 3,198,263 0.86
Czech Koruna - 3,799,873 (31 December 2019: –) 3,799,873 1.03
87,750,000 Czech Republic Government Bond 1.250% 14-Feb-2025 3,799,873 1.03
Danish Krone - 2,191,358 (31 December 2019: 4,097,107) 2,191,358 0.59
14,420,000 Jyske Realkredit A/S 1.000% 01-Apr-2021 2,191,358 0.59
Euro - 87,360,094 (31 December 2019: 74,927,586) 87,360,094 23.62
497,000 Air Products and Chemicals Inc ‘EMTN’ 0.500% 05-May-2028 561,394 0.15
892,000 Akelius Residential Property AB FRN 2.249% 17-May-2081 925,015 0.25
1,299,000 Allied Irish Banks Plc ‘EMTN’ FRN 4.125% 26-Nov-2025 1,462,049 0.40
1,319,000 AT&T Inc 1.600% 19-May-2028 1,515,334 0.41 1,200,000 Banco Bilbao Vizcaya Argentaria SA FRN
(Perpetual) 5.875% 24-May-2022 1,310,647 0.35 800,000 Banco Santander SA FRN (Perpetual)
5.250% 29-Sep-2023 847,401 0.23 524,000 Banijay Entertainment SASU ‘REGS’
3.500% 01-Mar-2025 563,071 0.15 1,100,000 CA Immobilien Anlagen AG 0.875% 05-Feb-2027 1,166,126 0.32 1,000,000 Cellnex Telecom SA 1.875% 26-Jun-2029 1,109,053 0.30 1,063,000 Cirsa Finance International Sarl ‘REGS’
4.750% 22-May-2025 1,063,227 0.29 1,000,000 Coventry Building Society 2.500% 18-Nov-2020 1,131,297 0.31
Bonds cont’d.
Euro cont’d.
USDUSD
03613-1A.indd 174 19/08/2020 19:01

175
Schedule of investments – as at 30 June 2020
Holdings Description
Fair value
Total net assets
% Holdings Description
Fair value
Total net assets
%
BNy MELLON GLOBAL DyNAMIC BOND FUND
Bonds cont’d.
Euro cont’d. Singapore Dollar - 4,275,973 (31 December 2019: 2,450,058) 4,275,973 1.16
5,870,000 Singapore Government Bond 2.250% 01-Jun-2021 4,275,973 1.16
Sterling - 27,166,894 (31 December 2019: 26,324,834) 27,166,894 7.35
928,000 Anglian Water Services Financing Plc ‘EMTN’ 1.625% 10-Aug-2025 1,165,104 0.32
899,000 Bank of Ireland Group Plc ‘EMTN’ FRN 3.125% 19-Sep-2027 1,091,823 0.30
1,390,000 BUPA Finance Plc FRN (Perpetual) 6.125% 16-Sep-2020 1,706,155 0.46
1,323,000 Close Brothers Finance Plc ‘EMTN’ 2.750% 19-Oct-2026 1,704,696 0.46
629,000 CPUK Finance Ltd ‘REGS’ 4.250% 28-Aug-2022 743,837 0.20 3,000,000 Dexia Credit Local SA 0.500% 22-Jul-2023 3,694,700 1.00 354,000 Hiscox Ltd 2.000% 14-Dec-2022 435,440 0.12 1,055,000 Iceland Bondco Plc ‘REGS’ 4.625% 15-Mar-2025 1,164,334 0.31 868,000 Investec Plc ‘EMTN’ FRN (Perpetual)
6.750% 05-Dec-2024 880,214 0.24 592,000 Jerrold Finco Plc ‘REGS’ 4.875% 15-Jan-2026 661,052 0.18 1,130,000 Lloyds Banking Group Plc FRN (Perpetual)
5.125% 27-Dec-2024 1,270,616 0.34 1,519,272 Mitchells & Butlers Finance Plc
6.013% 15-Dec-2028 2,003,606 0.54 1,600,000 Nationwide Building Society FRN (Perpetual)
5.875% 20-Dec-2024 1,975,022 0.53 815,000 UBS AG/London ‘EMTN’ 1.250% 10-Dec-2020 1,002,342 0.27 1,260,000 UNITE USAF II Plc 3.374% 30-Jun-2023 1,606,010 0.43 844,200 Virgin Media Secured Finance Plc ‘REGS’
6.250% 28-Mar-2029 1,097,309 0.30 829,000 Virgin Media Vendor Financing Notes III DAC
‘REGS’ 4.875% 15-Jul-2028 1,025,907 0.28 1,032,000 Vodafone Group Plc FRN 4.875% 03-Oct-2078 1,319,819 0.36 2,120,000 Yorkshire Building Society FRN
0.664% 19-Nov-2023 2,618,908 0.71
Swedish Krona - 4,561,070 (31 December 2019: 7,281,195) 4,561,070 1.23
21,000,000 Stadshypotek AB 1.500% 01-Mar-2024 2,353,595 0.63 20,300,000 Swedbank Hypotek AB 1.000% 15-Jun-2022 2,207,475 0.60
US Dollar - 136,477,462 (31 December 2019: 198,636,179) 136,477,462 36.90
2,666,000 Abu Dhabi Government International Bond ‘REGS’ 2.500% 16-Apr-2025 2,812,630 0.76
1,108,000 American Airlines Inc ‘144A’ 11.750% 15-Jul-2025 1,058,140 0.29 420,000 Apple Inc 1.700% 11-Sep-2022 432,672 0.12 617,000 Argentine Republic Government International Bond
6.875% 22-Apr-2021 261,994 0.07 2,100,000 Bank of Montreal ‘REGS’ 2.100% 15-Jun-2022 2,164,885 0.59 2,164,000 Best Buy Co Inc 5.500% 15-Mar-2021 2,211,724 0.60 1,050,000 Bolivian Government International Bond ‘REGS’
4.500% 20-Mar-2028 897,761 0.24 1,220,000 Carnival Corp ‘144A’ 11.500% 01-Apr-2023 1,296,324 0.35 1,467,000 CEMEX Finance LLC ‘REGS’ 6.000% 01-Apr-2024 1,460,120 0.39 1,060,000 Comcast Corp FRN 0.626% 01-Oct-2020 1,060,874 0.29 1,500,000 Commonwealth Bank of Australia ‘REGS’
2.125% 22-Jul-2020 1,501,596 0.41
300,000 Volkswagen International Finance NV 0.500% 30-Mar-2021 335,996 0.09
1,700,000 Volkswagen International Finance NV FRN (Perpetual) 3.875% 17-Jun-2029 1,868,193 0.50
1,282,000 Whirlpool EMEA Finance Sarl 0.500% 20-Feb-2028 1,338,784 0.36
Indian Rupee - 683,670 (31 December 2019: 860,905) 683,670 0.19
50,000,000 Housing Development Finance Corp Ltd ‘EMTN’ 8.220% 28-Mar-2022 683,670 0.19
Indonesian Rupiah - 3,162,606 (31 December 2019: 2,384,513) 3,162,606 0.86
46,125,000,000 European Bank for Reconstruction & Development ‘GMTN’ 6.450% 13-Dec-2022 3,162,606 0.86
Japanese yen - 15,725,427 (31 December 2019: 41,345,970) 15,725,427 4.25
293,850,000 Japan Government Two Year Bond 0.100% 01-Jun-2021 2,735,077 0.74
1,170,000,000 Japan Government Two Year Bond 0.100% 01-Apr-2022 10,909,539 2.95
225,012,404 Japanese Government CPI Linked Bond 0.100% 10-Mar-2028 2,080,811 0.56
Malaysian Ringgit - 5,503,972 (31 December 2019: 4,964,400) 5,503,972 1.49
22,071,000 Malaysia Government Bond 3.906% 15-Jul-2026 5,503,972 1.49
Mexican Nuevo peso - 5,733,142 (31 December 2019: 5,216,878) 5,733,142 1.55
41,500,000 Mexican Bonos 7.500% 03-Jun-2027 1,995,236 0.54 73,180,000 Mexican Bonos 8.500% 31-May-2029 3,737,906 1.01
New Zealand Dollar - 5,728,217 (31 December 2019: 16,454,305) 5,728,217 1.55
4,280,000 New Zealand Government Inflation Linked Bond 3.000% 20-Sep-2030 3,869,292 1.05
2,380,000 New Zealand Local Government Funding Agency Bond 3.500% 14-Apr-2033 1,858,925 0.50
Norwegian Krone - 11,099,512 (31 December 2019: 14,768,010) 11,099,512 3.00
78,225,000 Norway Government Bond ‘144A’ 1.750% 17-Feb-2027 8,712,563 2.36
23,000,000 SpareBank 1 Boligkreditt AS ‘GMTN’ 1.500% 16-Jun-2021 2,386,949 0.64
peruvian Nuevo Sol - 2,866,742 (31 December 2019: 2,590,509) 2,866,742 0.78
7,820,000 Peruvian Government International Bond ‘REGS’ 8.200% 12-Aug-2026 2,866,742 0.78
philippine peso - 4,458,416 (31 December 2019: 2,598,691) 4,458,416 1.21
220,000,000 Philippine Government International Bond 4.950% 15-Jan-2021 4,458,416 1.21
Bonds cont’d.
USDUSD
03613-1A.indd 175 19/08/2020 19:01

176
Schedule of investments – as at 30 June 2020
Holdings Description
Fair value
Total net assets
% Holdings Description
Fair value
Total net assets
%
BNy MELLON GLOBAL DyNAMIC BOND FUND
1,032,000 Country Garden Holdings Co Ltd ‘REGS’ 7.250% 04-Apr-2021 1,041,033 0.28
520,000 Credit Suisse Group AG ‘REGS’ FRN (Perpetual) 7.250% 12-Sep-2025 534,011 0.14
1,700,000 CSC Holdings LLC ‘144A’ 5.375% 15-Jul-2023 1,726,180 0.47 1,750,000 CSC Holdings LLC ‘144A’ 6.625% 15-Oct-2025 1,816,736 0.49 1,640,000 Dell International LLC / EMC Corp ‘144A’
7.125% 15-Jun-2024 1,696,990 0.46 416,000 DH Europe Finance II Sarl 2.200% 15-Nov-2024 439,516 0.12 2,090,000 DNB Boligkreditt AS ‘REGS’ 2.500% 28-Mar-2022 2,160,074 0.58 766,667 Dominican Republic International Bond ‘REGS’
7.500% 06-May-2021 792,549 0.21 1,950,000 Ecuador Government International Bond ‘REGS’
8.875% 23-Oct-2027 826,312 0.22 785,000 Ethiopia International Bond ‘REGS’
6.625% 11-Dec-2024 788,611 0.21 541,000 European Bank for Reconstruction & Development
1.625% 27-Sep-2024 567,956 0.15 3,940,000 Export-Import Bank of Korea FRN
1.866% 25-Jan-2022 3,961,915 1.07 1,610,000 Fiji Government International Bond
6.625% 02-Oct-2020 1,609,847 0.44 1,293,000 GMR Hyderabad International Airport Ltd ‘REGS’
4.250% 27-Oct-2027 1,157,041 0.31 2,716,000 HSBC Bank Canada ‘REGS’ 0.950% 14-May-2023 2,740,201 0.74 2,620,000 Inter-American Development Bank
3.125% 18-Sep-2028 3,101,735 0.84 4,430,000 Inter-American Development Bank FRN
0.341% 16-Sep-2022 4,417,165 1.19 3,680,000 International Bank for Reconstruction
& Development FRN 0.471% 17-Jun-2024 3,678,534 0.99 2,700,000 JPMorgan Chase & Co FRN 2.083% 22-Apr-2026 2,807,175 0.76 4,020,000 Kreditanstalt fuer Wiederaufbau
1.500% 15-Jun-2021 4,069,255 1.10 1,074,000 Laureate Education Inc ‘144A’
8.250% 01-May-2025 1,118,480 0.30 58,000 Lennar Corp 4.750% 29-Nov-2027 63,128 0.02 1,745,000 Level 3 Financing Inc 5.375% 15-Aug-2022 1,747,286 0.47 1,810,000 Level 3 Financing Inc 5.375% 15-Jan-2024 1,832,435 0.50 210,000 Lloyds Banking Group Plc FRN (Perpetual)
6.750% 27-Jun-2026 214,375 0.06 1,239,000 Metropolitan Life Global Funding I ‘REGS’ FRN
0.650% 07-Sep-2020 1,239,845 0.34 2,625,000 Mexico Government International Bond
3.900% 27-Apr-2025 2,816,625 0.76 1,630,000 Microsoft Corp 2.000% 08-Aug-2023 1,700,520 0.46 251,000 Mileage Plus Holdings LLC /
Mileage Plus Intellectual Property Assets Ltd ‘144A’ 6.500% 20-Jun-2027 251,532 0.07
1,550,000 Mongolia Government International Bond ‘REGS’ 10.875% 06-Apr-2021 1,615,875 0.44
2,593,000 New York Life Global Funding ‘REGS’ 1.700% 14-Sep-2021 2,633,634 0.71
464,000 NextEra Energy Capital Holdings Inc 3.250% 01-Apr-2026 519,192 0.14
419,000 PG&E Corp 5.000% 01-Jul-2028 417,953 0.11 1,284,000 Philippine Government International Bond
2.457% 05-May-2030 1,349,367 0.37 3,291,000 Qatar Government International Bond ‘REGS’
3.400% 16-Apr-2025 3,586,348 0.97
Bonds cont’d.
US Dollar cont’d.
Bonds cont’d.
US Dollar cont’d. 2,640,000 Republic of Uzbekistan Bond ‘REGS’
4.750% 20-Feb-2024 2,791,433 0.75 1,557,000 Royal Bank of Scotland Group Plc FRN (Perpetual)
6.000% 29-Dec-2025 1,575,684 0.43 1,632,000 Royal Bank of Scotland Group Plc FRN (Perpetual)
7.500% 10-Aug-2020 1,638,773 0.44 153,000 Silgan Holdings Inc ‘144A’ 4.125% 01-Feb-2028 152,426 0.04 1,760,000 Stadshypotek AB ‘REGS’ 2.500% 05-Apr-2022 1,821,601 0.49 1,667,000 T-Mobile USA Inc 6.000% 01-Mar-2023 1,678,769 0.45 2,200,000 UBS Group AG FRN (Perpetual)
5.000% 31-Jan-2023 2,074,237 0.56 2,812,774 United States Treasury Inflation Indexed Bonds
0.500% 15-Apr-2024 2,956,880 0.80 9,270,000 United States Treasury Note/Bond
0.500% 15-Mar-2023 9,354,914 2.53 14,300,000 United States Treasury Note/Bond
1.500% 15-Aug-2026 15,245,705 4.12 10,900,000 United States Treasury Note/Bond
1.500% 15-Feb-2030 11,800,527 3.19 1,500,000 United States Treasury Note/Bond
2.000% 15-Feb-2050 1,726,699 0.47 413,000 Upjohn Inc ‘144A’ 2.300% 22-Jun-2027 426,502 0.12 2,742,000 US Bank NA/Cincinnati OH ‘BKNT’ FRN
1.311% 26-Apr-2021 2,747,916 0.74 36,000 Vietnam Government International Bond ‘REGS’
4.800% 19-Nov-2024 39,509 0.01 549,000 Vodafone Group Plc FRN 7.000% 04-Apr-2079 637,534 0.17 537,000 Volkswagen Group of America Finance LLC ‘144A’
3.350% 13-May-2025 575,900 0.16 246,000 VTR Comunicaciones SpA ‘REGS’
5.125% 15-Jan-2028 250,612 0.07 1,670,000 Westpac Banking Corp ‘REGS’
2.100% 25-Feb-2021 1,687,815 0.46 1,100,000 Wynn Macau Ltd ‘REGS’ 5.500% 15-Jan-2026 1,095,875 0.30
Total investments in bonds 351,049,124 94.93 Unrealised gain on forward foreign currency contracts - 3,111,056 (see below) (31 December 2019: 2,557,717) 3,111,056 0.84
Total financial assets at fair value through profit or loss 361,079,162 97.64
Holdings Description
Underlying exposure
USD
Fair value USD
Total net assets
%
Open futures contracts - (223,402) (31 December 2019: 169,291)
(44) Euro-Bund Short Futures Contracts Exp Sep-2020 (8,713,794) (80,909) (0.02)
(91) SFE 10 Year Australian Treasury Bond Short Futures Contracts Exp Sep-2020 (9,273,373) (121,304) (0.03)
(33) UK Long Gilt Short Futures Contracts Exp Sep-2020 (5,580,297) (21,189) (0.01)
Total open futures contracts (223,402) (0.06)
USDUSD
03613-1A.indd 176 19/08/2020 19:01

177
Schedule of investments – as at 30 June 2020
Holdings Description
Fair value
Total net assets
% Holdings Description
Fair value
Total net assets
%
BNy MELLON GLOBAL DyNAMIC BOND FUND
Unrealised loss on forward foreign currency contracts - (2,266,757) (see below) (31 December 2019: (3,304,526)) (2,266,757) (0.61)
Total financial liabilities at fair value through profit or loss (2,490,159) (0.67)
Net current assets 11,226,517 3.03
Total net assets 369,815,520 100.00
The counterparty for futures contracts is UBS AG.
Analysis of portfolio % of Total Assets
Transferable securities and money market instruments admitted to official stock exchange listing or traded on a regulated market 95.13oTC financial derivative instruments 0.83other current assets 4.04
Total assets 100.00
Description
USDUSD
Forward foreign currency contracts cont’d.Unrealised
Gain/(Loss)Buy Sell Amount (B) Amount (S)Settle
Date Counterparty
BNy Mellon Global Dynamic Bond FundUS dollar Euro 40,202 35,864 01-Jul-20 Barclays Bank PLC 2Euro US dollar 568,554 638,121 15-Sep-20 Royal Bank
of Scotland 245Sterling US dollar 152,831 187,483 15-Sep-20 JPMorgan Chase
Bank 131Sterling US dollar 883,650 1,084,498 15-Sep-20 Canadian Imperial
Bank 258US dollar Australian dollar 22,171,113 32,024,418 15-Sep-20 Royal Bank
of Scotland 232,861US dollar Brazilian real 5,472,632 29,295,000 15-Sep-20 State Street Bank 68,771US dollar Canadian dollar 5,004,066 6,732,488 15-Sep-20 Citigroup Global
Markets Limited 81,946US dollar Canadian dollar 870,019 1,181,470 15-Sep-20 HSBC Bank plc 6,247US dollar Colombian peso 3,311,357 12,195,726,000 15-Sep-20 Royal Bank
of Scotland 75,904US dollar Danish krone 2,283,582 15,071,964 15-Sep-20 Royal Bank
of Scotland 12,870US dollar Euro 448,391 397,625 15-Sep-20 State Street Bank 1,943US dollar Euro 80,205,119 70,967,104 15-Sep-20 Barclays Bank PLC 524,089US dollar Euro 2,265,873 1,998,356 15-Sep-20 State Street Bank 22,142US dollar Euro 702,151 619,326 15-Sep-20 JPMorgan Chase
Bank 6,779US dollar Euro 324,517 288,592 15-Sep-20 Canadian Imperial
Bank 489US dollar Euro 2,906,937 2,570,777 15-Sep-20 JPMorgan Chase
Bank 20,498US dollar Euro 193,065 171,000 15-Sep-20 State Street Bank 1,068US dollar Euro 667,658 594,006 15-Sep-20 State Street Bank 716US dollar Euro 445,040 395,334 15-Sep-20 Barclays Bank PLC 1,164US dollar Euro 666,947 592,000 15-Sep-20 Canadian Imperial
Bank 2,256US dollar Indonesian rupiah 1,667,267 23,941,952,500 15-Sep-20 Royal Bank
of Scotland 42,542US dollar Japanese yen 3,745,593 398,471,745 15-Sep-20 State Street Bank 43,356US dollar New Zealand dollar 5,923,688 9,146,778 15-Sep-20 JPMorgan Chase
Bank 66,480US dollar Norwegian krone 3,768,670 34,894,000 15-Sep-20 Citigroup Global
Markets Limited 182,500US dollar Norwegian krone 7,854,910 73,539,908 15-Sep-20 Citigroup Global
Markets Limited 296,974US dollar Singapore dollar 4,134,192 5,756,900 15-Sep-20 Citigroup Global
Markets Limited 13,290US dollar Sterling 1,015,716 802,351 15-Sep-20 State Street Bank 30,762US dollar Sterling 2,006,370 1,581,000 15-Sep-20 Citigroup Global
Markets Limited 65,558US dollar Sterling 40,129,940 31,694,760 15-Sep-20 UBS AG 1,221,926US dollar Swedish krona 4,580,198 42,443,782 15-Sep-20 UBS AG 45,852
USD 3,069,619
US dollar Sterling 187,407 152,831 01-Jul-20 JPMorgan Chase Bank (125)
Australian dollar US dollar 818,408 565,321 15-Sep-20 Canadian Imperial Bank (4,673)
Australian dollar US dollar 1,550,458 1,068,824 15-Sep-20 State Street Bank (6,687)Australian dollar US dollar 4,135,669 2,870,411 15-Sep-20 JPMorgan Chase
Bank (37,280)Colombian peso US dollar 12,195,726,000 3,239,073 15-Sep-20 State Street Bank (3,620)Czech koruna US dollar 41,412,994 1,750,660 15-Sep-20 Citigroup Global
Markets Limited (18,390)Sterling US dollar 359,292 446,062 15-Sep-20 State Street Bank (5,000)Sterling US dollar 893,747 1,107,051 15-Sep-20 State Street Bank (9,902)US dollar Indian rupee 802,600 61,248,000 15-Sep-20 UBS AG (1,082)US dollar Japanese yen 12,073,924 1,300,166,256 15-Sep-20 State Street Bank (6,036)US dollar Philippine peso 4,306,998 216,502,000 15-Sep-20 State Street Bank (15,911)
USD (108,706)
Net USD 2,960,913
03613-1A.indd 177 19/08/2020 19:01

178
Schedule of investments – as at 30 June 2020
BNy MELLON GLOBAL DyNAMIC BOND FUND
Forward foreign currency contracts cont’d.Unrealised
Gain/(Loss)Buy Sell Amount (B) Amount (S)Settle
Date Counterparty
BNy Mellon Global Dynamic Bond Fund EUR I (Hedged) Share ClassUS dollar Euro 161 143 15-Jul-20 The Bank of
New York Mellon 1US dollar Euro 2,250 2,000 15-Jul-20 The Bank of
New York Mellon 7US dollar Euro 28 25 15-Jul-20 The Bank of
New York Mellon - US dollar Euro 601,782 533,050 15-Jul-20 The Bank of
New York Mellon 4,110
USD 4,118
EUR 3,674
Euro US dollar 13,295,777 15,103,197 15-Jul-20 The Bank of New York Mellon (195,569)
USD (195,569)
EUR (174,475)
Net USD (191,451)
Net EUR (170,801)
BNy Mellon Global Dynamic Bond Fund EUR I (Inc) (Hedged) Share ClassEuro US dollar 1,622,363 1,842,906 15-Jul-20 The Bank of
New York Mellon (23,864)
USD (23,864)
EUR (21,290)
BNy Mellon Global Dynamic Bond Fund EUR W (Hedged) Share ClassUS dollar Euro 210,206 186,242 02-Jul-20 The Bank of
New York Mellon 1,447Euro US dollar 49,310 55,286 15-Jul-20 The Bank of
New York Mellon 2US dollar Euro 75,558 66,926 15-Jul-20 The Bank of
New York Mellon 518US dollar Euro 23,062 20,553 15-Jul-20 The Bank of
New York Mellon 18US dollar Euro 2,202,651 1,958,110 15-Jul-20 The Bank of
New York Mellon 7,159US dollar Euro 223,555 197,430 15-Jul-20 The Bank of
New York Mellon 2,191US dollar Euro 67,175 59,022 15-Jul-20 The Bank of
New York Mellon 998
USD 12,333
EUR 11,003
Forward foreign currency contracts cont’d.Unrealised
Gain/(Loss)Buy Sell Amount (B) Amount (S)Settle
Date Counterparty
BNy Mellon Global Dynamic Bond Fund CHF W (Acc) (Hedged) Share ClassSwiss franc US dollar 17,422 18,379 15-Jul-20 The Bank of
New York Mellon (44)Swiss franc US dollar 2,266,796 2,392,477 15-Jul-20 The Bank of
New York Mellon (6,842)Swiss franc US dollar 3,335 3,512 15-Jul-20 The Bank of
New York Mellon (3)
USD (6,889)
CHF (6,548)
BNy Mellon Global Dynamic Bond Fund EUR H (Hedged) Share ClassEuro US dollar 49,970 56,273 15-Jul-20 The Bank of
New York Mellon (245)Euro US dollar 14,346 16,146 15-Jul-20 The Bank of
New York Mellon (61)Euro US dollar 5,587,049 6,346,549 15-Jul-20 The Bank of
New York Mellon (82,181)US dollar Euro 105,483 94,097 15-Jul-20 The Bank of
New York Mellon (21)
USD (82,508)
EUR (73,609)
BNy Mellon Global Dynamic Bond Fund EUR H (Inc) (Hedged) Share ClassUS dollar Euro 31,238 27,587 15-Jul-20 The Bank of
New York Mellon 306US dollar Euro 33,235 29,439 15-Jul-20 The Bank of
New York Mellon 227
USD 533
EUR 476
Euro US dollar 713,590 810,595 15-Jul-20 The Bank of New York Mellon (10,496)
USD (10,496)
EUR (9,364)
Net USD (9,963)
Net EUR (8,888)
03613-1A.indd 178 19/08/2020 19:01

179
Schedule of investments – as at 30 June 2020
BNy MELLON GLOBAL DyNAMIC BOND FUND
Forward foreign currency contracts cont’d.Unrealised
Gain/(Loss)Buy Sell Amount (B) Amount (S)Settle
Date Counterparty
BNy Mellon Global Dynamic Bond Fund EUR W (Hedged) Share Class cont’d.Euro US dollar 66,926 75,538 02-Jul-20 The Bank of
New York Mellon (520)Euro US dollar 94,338 106,502 15-Jul-20 The Bank of
New York Mellon (727)Euro US dollar 72,906,444 82,817,303 15-Jul-20 The Bank of
New York Mellon (1,072,391)Euro US dollar 186,242 210,261 15-Jul-20 The Bank of
New York Mellon (1,441)US dollar Euro 568,218 506,800 15-Jul-20 The Bank of
New York Mellon (21)
USD (1,075,100)
EUR (959,139)
Net USD (1,062,767)
Net EUR (948,136)
BNy Mellon Global Dynamic Bond Fund EUR W (Inc) (Hedged) Share ClassEuro US dollar 9,376,837 10,651,518 15-Jul-20 The Bank of
New York Mellon (137,925)
USD (137,925)
EUR (123,048)
BNy Mellon Global Dynamic Bond Fund Jpy x (Acc) (Hedged) Share ClassJapanese yen US dollar 995,215,600 9,250,995 15-Jul-20 The Bank of
New York Mellon (12,240)
USD (12,240)
Jpy (1,318,738)
BNy Mellon Global Dynamic Bond Fund NOK H (Acc) (Hedged) Share ClassNorwegian krone US dollar 885,650 95,432 15-Jul-20 The Bank of
New York Mellon (4,432)
USD (4,432)
NOK (43,137)
BNy Mellon Global Dynamic Bond Fund NOK W (Acc) (Hedged) Share ClassNorwegian krone US dollar 892,124 96,129 15-Jul-20 The Bank of
New York Mellon (4,465)
USD (4,465)
NOK (43,458)
Forward foreign currency contracts cont’d.Unrealised
Gain/(Loss)Buy Sell Amount (B) Amount (S)Settle
Date Counterparty
BNy Mellon Global Dynamic Bond Fund Sterling W (Acc) (Hedged) Share ClassUS dollar Sterling 22,009 17,730 01-Jul-20 The Bank of
New York Mellon 253Sterling US dollar 72 88 02-Jul-20 The Bank of
New York Mellon - US dollar Sterling 10,214 8,247 15-Jul-20 The Bank of
New York Mellon 94US dollar Sterling 6,220 5,023 15-Jul-20 The Bank of
New York Mellon 56US dollar Sterling 50,283 40,000 15-Jul-20 The Bank of
New York Mellon 1,197US dollar Sterling 88 72 15-Jul-20 The Bank of
New York Mellon - US dollar Sterling 279 225 15-Jul-20 The Bank of
New York Mellon 3US dollar Sterling 72,630 57,408 15-Jul-20 The Bank of
New York Mellon 2,182US dollar Sterling 29 23 15-Jul-20 The Bank of
New York Mellon 1US dollar Sterling 102,781 80,474 15-Jul-20 The Bank of
New York Mellon 4,027US dollar Sterling 561,691 444,158 15-Jul-20 The Bank of
New York Mellon 16,640
USD 24,453
GBp 19,928
Sterling US dollar 225 279 01-Jul-20 The Bank of New York Mellon (3)
Sterling US dollar 17,730 22,011 15-Jul-20 The Bank of New York Mellon (254)
Sterling US dollar 3,483 4,335 15-Jul-20 The Bank of New York Mellon (60)
Sterling US dollar 1,153 1,443 15-Jul-20 The Bank of New York Mellon (29)
Sterling US dollar 7,949 9,898 15-Jul-20 The Bank of New York Mellon (144)
Sterling US dollar 3,162 3,917 15-Jul-20 The Bank of New York Mellon (36)
Sterling US dollar 647 810 15-Jul-20 The Bank of New York Mellon (16)
Sterling US dollar 17,027 21,404 15-Jul-20 The Bank of New York Mellon (510)
Sterling US dollar 2,680 3,391 15-Jul-20 The Bank of New York Mellon (102)
Sterling US dollar 2,609 3,265 15-Jul-20 The Bank of New York Mellon (63)
Sterling US dollar 329 415 15-Jul-20 The Bank of New York Mellon (12)
Sterling US dollar 33,664 42,713 15-Jul-20 The Bank of New York Mellon (1,402)
Sterling US dollar 17,312 22,111 15-Jul-20 The Bank of New York Mellon (866)
Sterling US dollar 688 870 15-Jul-20 The Bank of New York Mellon (26)
Sterling US dollar 12,536,468 15,971,302 15-Jul-20 The Bank of New York Mellon (587,090)
USD (590,613)
GBp (481,327)
Net USD (566,160)
Net GBp (461,399)
03613-1A.indd 179 19/08/2020 19:01

180
Schedule of investments – as at 30 June 2020
BNy MELLON GLOBAL DyNAMIC BOND FUND
Forward foreign currency contracts cont’d.Unrealised
Gain/(Loss)Buy Sell Amount (B) Amount (S)Settle
Date Counterparty
BNy Mellon Global Dynamic Bond Fund Sterling W (Inc) (Hedged) Share ClassSterling US dollar 99,341 126,560 15-Jul-20 The Bank of
New York Mellon (4,652)
USD (4,652)
GBp (3,791)
BNy Mellon Global Dynamic Bond Fund Sterling Z (Acc) (Hedged) Share ClassSterling US dollar 99,281 126,483 15-Jul-20 The Bank of
New York Mellon (4,649)
USD (4,649)
GBp (3,789)
BNy Mellon Global Dynamic Bond Fund Sterling Z (Inc) (Hedged) Share ClassSterling US dollar 99,277 126,478 15-Jul-20 The Bank of
New York Mellon (4,649)
USD (4,649)
GBp (3,789)
03613-1A.indd 180 19/08/2020 19:01

181
Schedule of investments – as at 30 June 2020
Holdings Description
Fair value
Total net assets
% Holdings Description
Fair value
Total net assets
%
Equities
Argentina - 1,415,139 (31 December 2019: 1,060,631) 1,415,139 4.65
6,383 Globant SA 937,631 3.08 487 MercadoLibre Inc 477,508 1.57
Australia - 423,201 (31 December 2019: 492,391) 423,201 1.39
16,715 IDP Education Ltd 177,274 0.58 155,106 Orocobre Ltd 245,927 0.81
Brazil - 193,573 (31 December 2019: 655,955) 193,573 0.64
4,485 Arco Platform Ltd - Class A 193,573 0.64
Chile - 238,078 (31 December 2019: 222,331) 238,078 0.78
9,061 Sociedad Quimica y Minera de Chile SA ADR 238,078 0.78
China - 11,014,005 (31 December 2019: 9,456,364) 11,014,005 36.19
5,165 51job Inc ADR 361,602 1.19 7,925 Alibaba Group Holding Ltd ADR 1,703,835 5.60 10,677 Autohome Inc ADR 813,908 2.67 408,000 China Harmony New Energy Auto Holding Ltd 201,891 0.66 322,000 China Yongda Automobiles Services Holdings Ltd 386,603 1.27 7,550 GSX Techedu Inc ADR 439,825 1.45 76,134 Meituan Dianping 1,689,171 5.55 13,578 New Oriental Education & Technology Group Inc ADR 1,782,452 5.86 53,000 Ping An Insurance Group Co of China Ltd ‘H’ 529,651 1.74 11,802 Prosus NV 1,090,059 3.58 23,224 Tencent Holdings Ltd 1,493,808 4.91 39,321 Tencent Music Entertainment Group ADR 521,200 1.71
Germany - 783,061 (31 December 2019: 795,041) 783,061 2.57
7,739 Delivery Hero SE ‘144A’ 783,061 2.57
Hong Kong - 1,181,679 (31 December 2019: 1,450,155) 1,181,679 3.88
126,800 AIA Group Ltd 1,181,679 3.88
India - 5,685,097 (31 December 2019: 7,717,801) 5,685,097 18.68
11,554 Apollo Hospitals Enterprise Ltd 207,112 0.68 35,527 Asian Paints Ltd 794,260 2.61 1,649 Hindustan Unilever Ltd 47,535 0.15 48,505 Housing Development Finance Corp Ltd 1,131,620 3.72 24,854 Info Edge India Ltd 909,183 2.99 30,789 Jubilant Foodworks Ltd 705,156 2.32 8,814 Maruti Suzuki India Ltd 680,819 2.24 51,370 Nippon Life India Asset Management Ltd ‘144A’ 215,488 0.71 21,588 PVR Ltd 286,363 0.94 56,098 Titan Co Ltd 707,561 2.32
Indonesia - 235,910 (31 December 2019: –) 235,910 0.77
1,201,417 Vale Indonesia Tbk PT 235,910 0.77
Netherlands - 494,869 (31 December 2019: 568,124) 494,869 1.63
1,364 ASML Holding NV 494,869 1.63
Republic of Korea - 3,576,026 (31 December 2019: 4,040,751) 3,576,026 11.75
29,309 Iljin Materials Co Ltd 1,207,959 3.97 601 LG Household & Health Care Ltd 672,774 2.21 5,606 Samsung SDI Co Ltd 1,695,293 5.57
Russia - 244,962 (31 December 2019: –) 244,962 0.80
10,561 HeadHunter Group Plc ADR 244,962 0.80
South Africa - 1,135,742 (31 December 2019: 2,394,525) 1,135,742 3.73
24,041 Clicks Group Ltd 289,483 0.95 60,542 Discovery Ltd 368,890 1.21 2,613 Naspers Ltd 477,369 1.57
Taiwan - 1,905,608 (31 December 2019: 1,878,524) 1,905,608 6.26
58,000 Elite Material Co Ltd 313,054 1.03 150,000 Taiwan Semiconductor Manufacturing Co Ltd 1,592,554 5.23
Thailand - 228,094 (31 December 2019: 177,656) 228,094 0.75
75,500 Kasikornbank PCL (Foreign Market) 228,094 0.75
United States of America - 1,307,792 (31 December 2019: 1,661,083) 1,307,792 4.30
2,865 EPAM Systems Inc 705,277 2.32 19,048 Laureate Education Inc - Class A 188,861 0.62 68,885 Livent Corp 413,654 1.36
Total investments in equities 30,062,836 98.77 Unrealised gain on forward foreign currency contracts - 212 (see below) (31 December 2019: 5,902) 212 0.00
Total financial assets at fair value through profit or loss 30,063,048 98.77 Unrealised loss on forward foreign currency contracts - (9,635) (see below) (31 December 2019: –) (9,635) (0.03)
Total financial liabilities at fair value through profit or loss (9,635) (0.03)
Net current assets 384,499 1.26
Total net assets 30,437,912 100.00
Analysis of portfolio % of Total Assets
Transferable securities and money market instruments admitted to official stock exchange listing or traded on a regulated market 98.15oTC financial derivative instruments 0.00other current assets 1.85
Total assets 100.00
BNY MELLON GLOBAL EMERGING MARKETS FUND
FUND 23 – BNy MELLON GLOBAL EMERGING MARKETS FUND
Equities cont’d.
USDUSD
03613-1A.indd 181 19/08/2020 19:01

182
Schedule of investments – as at 30 June 2020
BNy MELLON GLOBAL EMERGING MARKETS FUND
Forward foreign currency contractsUnrealised
Gain/(Loss)Buy Sell Amount (B) Amount (S)Settle
Date Counterparty
BNy Mellon Global Emerging Markets Fund EUR H (Hedged) Share ClassEuro US dollar 30 34 15-Jul-20 The Bank of
New York Mellon - US dollar Euro 1,414 1,254 15-Jul-20 The Bank of
New York Mellon 8
USD 8
EUR 7
Euro US dollar 743 838 15-Jul-20 The Bank of New York Mellon (4)
Euro US dollar 918 1,034 15-Jul-20 The Bank of New York Mellon (5)
Euro US dollar 35,555 40,388 15-Jul-20 The Bank of New York Mellon (523)
USD (532)
EUR (475)
Net USD (524)
Net EUR (468)
BNy Mellon Global Emerging Markets Fund EUR I (Hedged) Share ClassUS dollar Euro 23,927 21,216 15-Jul-20 The Bank of
New York Mellon 140US dollar Euro 4,319 3,795 15-Jul-20 The Bank of
New York Mellon 64
USD 204
EUR 182
Euro US dollar 608,482 691,198 15-Jul-20 The Bank of New York Mellon (8,950)
Euro US dollar 12,746 14,361 15-Jul-20 The Bank of New York Mellon (70)
Euro US dollar 15,636 17,615 15-Jul-20 The Bank of New York Mellon (83)
USD (9,103)
EUR (8,121)
Net USD (8,899)
Net EUR (7,939)
03613-1A.indd 182 19/08/2020 19:01

183
Schedule of investments – as at 30 June 2020
Holdings Description
Fair value
Total net assets
% Holdings Description
Fair value
Total net assets
%
FUND 24 – BNy MELLON GLOBAL EQUITy FUND
BNY MELLON GLOBAL EQUITY FUND
Thailand - 2,451,028 (31 December 2019: –) 2,451,028 0.68
811,300 Kasikornbank PCL (Foreign Market) 2,451,028 0.68
United Kingdom - 20,131,574 (31 December 2019: 30,528,047) 20,131,574 5.56
141,694 Associated British Foods Plc 3,327,356 0.92 145,269 Diageo Plc 4,807,024 1.33 81,417 Ferguson Plc 6,609,571 1.83 754,788 Informa Plc 4,357,599 1.20 290,561 Rolls-Royce Holdings Plc 1,030,024 0.28
United States of America - 176,852,773 (31 December 2019: 172,872,344) 176,852,773 48.85
115,065 Abbott Laboratories 10,243,086 2.83 43,260 Accenture Plc - Class A 9,204,430 2.54 7,297 Alphabet Inc - Class A 10,198,178 2.82 121,044 Altria Group Inc 4,749,767 1.31 5,090 Amazon.com Inc 13,648,784 3.77 43,834 Apple Inc 15,866,593 4.38 130,307 Applied Materials Inc 7,696,583 2.13 220,348 Cisco Systems Inc 10,172,365 2.81 197,920 Citigroup Inc 9,956,366 2.75 78,501 CMS Energy Corp 4,518,518 1.25 17,060 Costco Wholesale Corp 5,145,381 1.42 42,863 Dollar General Corp 8,147,399 2.25 48,325 Eversource Energy 4,016,049 1.11 433,353 General Electric Co 2,944,634 0.81 58,839 Gilead Sciences Inc 4,388,507 1.21 43,920 Goldman Sachs Group Inc/The 8,502,253 2.35 55,458 Lennar Corp 3,380,720 0.94 26,643 Mastercard Inc 7,810,262 2.16 77,343 Medtronic Plc 6,982,139 1.93 55,310 Merck & Co Inc 4,210,197 1.16 96,011 Microsoft Corp 19,054,823 5.26 109,987 Verizon Communications Inc 6,015,739 1.66
Total investments in equities 356,893,169 98.58 Unrealised gain on forward foreign currency contracts - 90 (see below) (31 December 2019: 83,593) 90 0.00
Total financial assets at fair value through profit or loss 356,893,259 98.58 Unrealised loss on forward foreign currency contracts - (378,554) (see below) (31 December 2019: (136,180)) (378,554) (0.10)
Total financial liabilities at fair value through profit or loss (378,554) (0.10)
Net current assets 5,508,745 1.52
Total net assets 362,023,450 100.00
Analysis of portfolio % of Total Assets
Transferable securities and money market instruments admitted to official stock exchange listing or traded on a regulated market 97.58oTC financial derivative instruments 0.00other current assets 2.42
Total assets 100.00
Equities Canada - 5,666,035
(31 December 2019: 9,055,289) 5,666,035 1.57 60,466 Intact Financial Corp 5,666,035 1.57
China - 11,050,417 (31 December 2019: –) 11,050,417 3.05
34,479 Alibaba Group Holding Ltd ADR 7,412,812 2.05 364,000 Ping An Insurance Group Co of China Ltd ‘H’ 3,637,605 1.00
France - 12,921,756 (31 December 2019: 14,585,846) 12,921,756 3.57
14,605 L’Oreal SA 4,684,493 1.29 319,582 Vivendi SA 8,237,263 2.28
Germany - 28,378,650 (31 December 2019: 23,719,548) 28,378,650 7.84
75,487 Bayer AG 5,597,180 1.55 89,265 Brenntag AG 4,691,183 1.29 26,899 Continental AG 2,634,604 0.73 138,622 Deutsche Post AG 5,066,215 1.40 75,222 SAP SE 10,389,468 2.87
Hong Kong - 9,220,451 (31 December 2019: 11,796,696) 9,220,451 2.55
989,400 AIA Group Ltd 9,220,451 2.55
Japan - 26,708,397 (31 December 2019: 29,220,736) 26,708,397 7.38
53,000 Ebara Corp 1,241,127 0.34 200,900 Japan Tobacco Inc 3,733,078 1.03 66,800 Seven & i Holdings Co Ltd 2,179,959 0.60 79,100 Sony Corp 5,417,109 1.50 72,100 Sugi Holdings Co Ltd 4,881,841 1.35 86,900 Suntory Beverage & Food Ltd 3,385,583 0.94 173,000 Suzuki Motor Corp 5,869,700 1.62
Netherlands - 24,416,484 (31 December 2019: 35,295,586) 24,416,484 6.74
378,428 Relx Plc 8,699,938 2.40 272,595 Royal Dutch Shell Plc 4,437,837 1.22 126,086 Unilever NV 6,728,010 1.86 58,830 Wolters Kluwer NV 4,550,699 1.26
Norway - 2,146,507 (31 December 2019: 4,834,116) 2,146,507 0.59
161,391 DNB ASA 2,146,507 0.59
Republic of Korea - 7,902,192 (31 December 2019: 5,031,589) 7,902,192 2.18
26,131 Samsung SDI Co Ltd 7,902,192 2.18
Sweden - 4,189,730 (31 December 2019: 4,628,101) 4,189,730 1.16
326,462 Swedbank AB 4,189,730 1.16
Switzerland - 21,009,282 (31 December 2019: 21,176,455) 21,009,282 5.80
10,862 Lonza Group AG 5,676,968 1.57 77,470 Novartis AG 6,730,693 1.86 24,850 Roche Holding AG 8,601,621 2.37
Taiwan - 3,847,893 (31 December 2019: –) 3,847,893 1.06
68,219 Taiwan Semiconductor Manufacturing Co Ltd ADR 3,847,893 1.06
Equities cont’d.
USDUSD
03613-1A.indd 183 19/08/2020 19:01
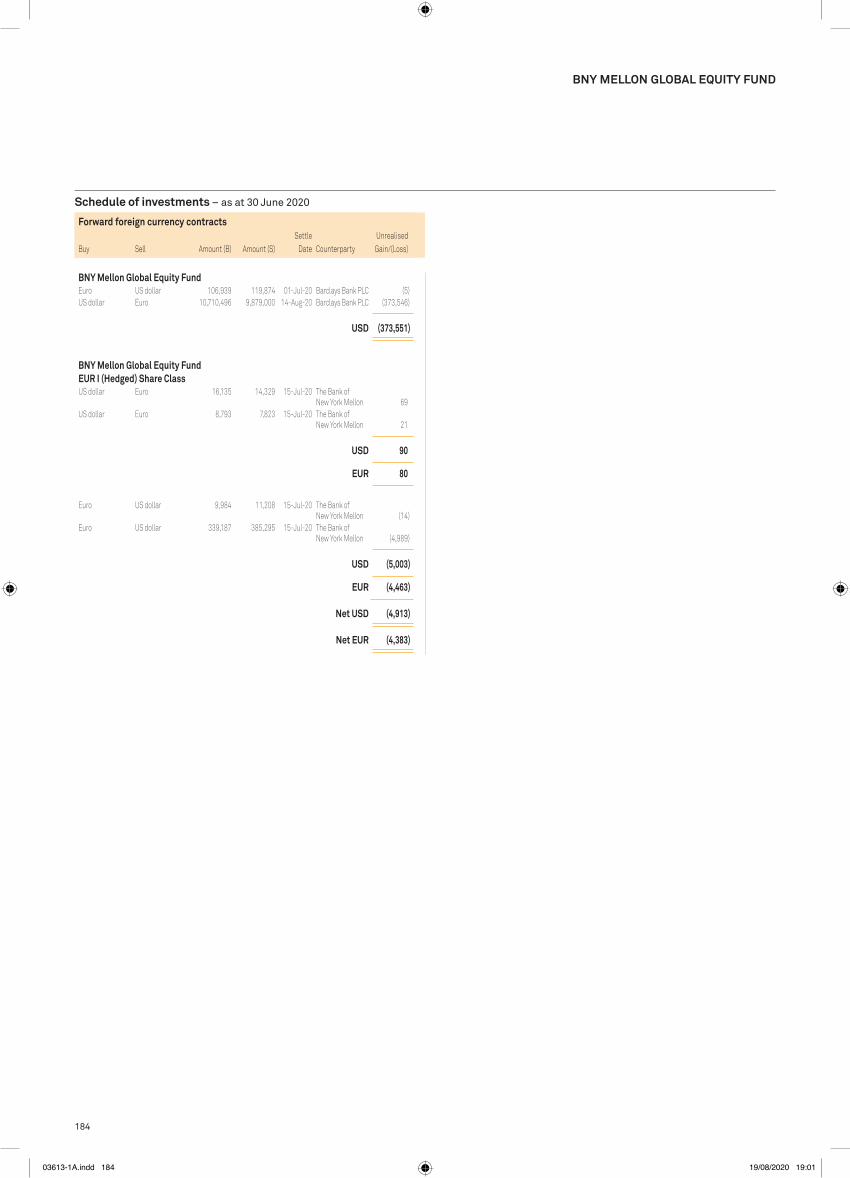
184
Schedule of investments – as at 30 June 2020
BNy MELLON GLOBAL EQUITy FUND
Forward foreign currency contractsUnrealised
Gain/(Loss)Buy Sell Amount (B) Amount (S)Settle
Date Counterparty
BNy Mellon Global Equity FundEuro US dollar 106,939 119,874 01-Jul-20 Barclays Bank PLC (5)US dollar Euro 10,710,496 9,879,000 14-Aug-20 Barclays Bank PLC (373,546)
USD (373,551)
BNy Mellon Global Equity Fund EUR I (Hedged) Share ClassUS dollar Euro 16,135 14,329 15-Jul-20 The Bank of
New York Mellon 69US dollar Euro 8,793 7,823 15-Jul-20 The Bank of
New York Mellon 21
USD 90
EUR 80
Euro US dollar 9,984 11,208 15-Jul-20 The Bank of New York Mellon (14)
Euro US dollar 339,187 385,295 15-Jul-20 The Bank of New York Mellon (4,989)
USD (5,003)
EUR (4,463)
Net USD (4,913)
Net EUR (4,383)
03613-1A.indd 184 19/08/2020 19:01

185
Schedule of investments – as at 30 June 2020
Holdings Description
Fair value
Total net assets
% Holdings Description
Fair value
Total net assets
%
FUND 25 – BNy MELLON GLOBAL EQUITy INCOME FUND
BNY MELLON GLOBAL EQUITY INCOME FUND
102,553 Roche Holding AG 35,497,871 2.95 115,156 Zurich Insurance Group AG 40,317,623 3.35
United Kingdom - 158,830,458 (31 December 2019: 244,551,780) 158,830,458 13.22
4,416,159 BAE Systems Plc 26,441,291 2.20 842,933 British American Tobacco Plc 32,379,445 2.69 294,377 British American Tobacco Plc ADR 11,517,500 0.96 136,085 Ferguson Plc 11,047,612 0.92 5,635,982 Informa Plc 32,538,076 2.71 830,149 Unilever Plc 44,906,534 3.74
United States of America - 502,244,545 (31 December 2019: 838,493,607) 502,244,545 41.80
602,001 Brixmor Property Group Inc (REIT) 7,798,923 0.65 1,527,048 Cisco Systems Inc 70,496,171 5.87 188,130 Citigroup Inc 9,463,880 0.79 392,252 CMS Energy Corp 22,578,025 1.88 294,066 Emerson Electric Co 18,048,301 1.50 301,727 Eversource Energy 25,075,022 2.09 172,391 Gilead Sciences Inc 12,857,783 1.07 107,680 Harley-Davidson Inc 2,567,630 0.21 754,412 Maxim Integrated Products Inc 44,959,183 3.74 472,723 Merck & Co Inc 35,983,675 2.99 434,478 Omnicom Group Inc 23,589,983 1.96 293,647 Paychex Inc 21,649,125 1.80 349,770 PepsiCo Inc 45,863,591 3.82 199,149 Philip Morris International Inc 14,048,966 1.17 473,795 Principal Financial Group Inc 19,110,521 1.59 247,754 Procter & Gamble Co/The 29,148,258 2.43 632,245 QUALCOMM Inc 56,342,513 4.69 774,328 Tapestry Inc 10,348,894 0.86 249,990 Verizon Communications Inc 13,673,203 1.14 875,365 Western Union Co/The 18,640,898 1.55
Total investments in equities 1,169,235,380 97.31 Unrealised gain on forward foreign currency contracts - 21,739 (see below) (31 December 2019: 691,530) 21,739 0.00
Total financial assets at fair value through profit or loss 1,184,580,753 98.58 Unrealised loss on forward foreign currency contracts - (570,150) (see below) (31 December 2019: (4,284)) (570,150) (0.05)
Total financial liabilities at fair value through profit or loss (570,150) (0.05)
Net current assets 17,578,989 1.47
Total net assets 1,201,589,592 100.00
Analysis of portfolio % of Total Assets
Transferable securities and money market instruments admitted to official stock exchange listing or traded on a regulated market 97.37oTC financial derivative instruments 0.00other current assets 2.63
Total assets 100.00
Collective investment schemes
Republic of Korea - 15,323,634 (31 December 2019: 25,124,445) 15,323,634 1.27
1,613,307 Macquarie Korea Infrastructure Fund 15,323,634 1.27
Total investments in collective investment schemes 15,323,634 1.27
Equities
China - 15,329,905 (31 December 2019: –) 15,329,905 1.28
1,534,000 Ping An Insurance Group Co of China Ltd ‘H’ 15,329,905 1.28
France - 54,056,166 (31 December 2019: 92,629,261) 54,056,166 4.50
380,509 Sanofi 38,586,621 3.21 405,137 TOTAL SA 15,469,545 1.29
Germany - 53,867,912 (31 December 2019: 59,086,920) 53,867,912 4.48
546,378 Bayer AG 40,512,616 3.37 136,356 Continental AG 13,355,296 1.11
Hong Kong - 15,683,554 (31 December 2019: 26,865,678) 15,683,554 1.30
1,919,449 Link REIT (Units) (REIT) 15,683,554 1.30
India - 33,125,373 (31 December 2019: 46,464,042) 33,125,373 2.76
3,459,569 Infosys Ltd ADR 33,125,373 2.76
Japan - 26,543,921 (31 December 2019: –) 26,543,921 2.21
885,400 KDDI Corp 26,543,921 2.21
Netherlands - 13,205,070 (31 December 2019: 31,775,249) 13,205,070 1.10
811,124 Royal Dutch Shell Plc 13,205,070 1.10
New Zealand - 4,990,822 (31 December 2019: 6,621,219) 4,990,822 0.41
1,710,930 Spark New Zealand Ltd 4,990,822 0.41
Norway - 7,887,867 (31 December 2019: 31,666,011) 7,887,867 0.66
911,036 Orkla ASA 7,887,867 0.66
Republic of Korea - 40,016,011 (31 December 2019: 53,663,955) 40,016,011 3.33
1,034,012 Samsung Electronics Co Ltd - Preference 40,016,011 3.33
Spain - 24,790,788 (31 December 2019: 39,743,119) 24,790,788 2.06
936,559 Industria de Diseno Textil SA 24,790,788 2.06
Sweden - 49,579,641 (31 December 2019: 82,733,873) 49,579,641 4.13
1,548,974 Hennes & Mauritz AB 22,265,659 1.85 2,854,820 Svenska Handelsbanken AB 27,313,982 2.28
Switzerland - 169,083,347 (31 December 2019: 225,366,812) 169,083,347 14.07
435,298 Cie Financiere Richemont SA 27,705,569 2.31 243,315 Nestle SA 26,923,225 2.24 444,734 Novartis AG 38,639,059 3.22
Equities cont’d.
Switzerland cont’d.
USDUSD
03613-1A.indd 185 19/08/2020 19:01

186
Schedule of investments – as at 30 June 2020
BNy MELLON GLOBAL EQUITy INCOME FUND
Forward foreign currency contracts cont’d.Unrealised
Gain/(Loss)Buy Sell Amount (B) Amount (S)Settle
Date Counterparty
BNy Mellon Global Equity Income FundSterling US dollar 162,115 198,849 01-Jul-20 State Street Bank 74
USD 74
Euro US dollar 1,394,732 1,563,423 01-Jul-20 Barclays Bank PLC (67)US dollar Norwegian krone 387,373 3,782,188 01-Jul-20 UBS AG (1,219)
USD (1,286)
Net USD (1,212)
BNy Mellon Global Equity Income Fund EUR H (Hedged) Share ClassUS dollar Euro 12,569 11,211 15-Jul-20 The Bank of
New York Mellon - US dollar Euro 318,649 283,810 15-Jul-20 The Bank of
New York Mellon 433US dollar Euro 3,334 2,946 15-Jul-20 The Bank of
New York Mellon 30US dollar Euro 645,340 573,111 15-Jul-20 The Bank of
New York Mellon 2,750US dollar Euro 299,082 262,783 15-Jul-20 The Bank of
New York Mellon 4,442US dollar Euro 276,105 244,570 15-Jul-20 The Bank of
New York Mellon 1,886US dollar Euro 82,861 73,844 15-Jul-20 The Bank of
New York Mellon 65US dollar Euro 10,724 9,533 15-Jul-20 The Bank of
New York Mellon 35US dollar Euro 20,946 18,610 15-Jul-20 The Bank of
New York Mellon 79US dollar Euro 20,284 17,938 15-Jul-20 The Bank of
New York Mellon 172
USD 9,892
EUR 8,825
Euro US dollar 40,000 45,193 15-Jul-20 The Bank of New York Mellon (344)
Euro US dollar 280,239 314,591 15-Jul-20 The Bank of New York Mellon (379)
Euro US dollar 329,422 374,926 15-Jul-20 The Bank of New York Mellon (5,568)
Euro US dollar 10,642,889 12,089,677 15-Jul-20 The Bank of New York Mellon (156,548)
US dollar Euro 9,388 8,375 15-Jul-20 The Bank of New York Mellon (2)
USD (162,841)
EUR (145,277)
Net USD (152,949)
Net EUR (136,452)
Forward foreign currency contracts cont’d.Unrealised
Gain/(Loss)Buy Sell Amount (B) Amount (S)Settle
Date Counterparty
BNy Mellon Global Equity Income Fund EUR H (Inc) (Hedged) Share ClassEuro US dollar 34,710 38,910 15-Jul-20 The Bank of
New York Mellon 8US dollar Euro 237,973 211,954 15-Jul-20 The Bank of
New York Mellon 323US dollar Euro 66,740 59,072 15-Jul-20 The Bank of
New York Mellon 507US dollar Euro 123,731 109,418 15-Jul-20 The Bank of
New York Mellon 1,048US dollar Euro 488,016 433,396 15-Jul-20 The Bank of
New York Mellon 2,080
USD 3,966
EUR 3,538
Euro US dollar 209,166 234,806 15-Jul-20 The Bank of New York Mellon (283)
Euro US dollar 7,896,889 8,970,388 15-Jul-20 The Bank of New York Mellon (116,156)
USD (116,439)
EUR (103,880)
Net USD (112,473)
Net EUR (100,342)
BNy Mellon Global Equity Income Fund EUR I (Hedged) Share ClassUS dollar Euro 463,308 412,653 15-Jul-20 The Bank of
New York Mellon 629US dollar Euro 105,273 93,046 15-Jul-20 The Bank of
New York Mellon 948US dollar Euro 32,661 28,930 15-Jul-20 The Bank of
New York Mellon 224US dollar Euro 167,579 149,210 15-Jul-20 The Bank of
New York Mellon 280US dollar Euro 3,686 3,285 15-Jul-20 The Bank of
New York Mellon 3US dollar Euro 1,252 1,112 15-Jul-20 The Bank of
New York Mellon 5US dollar Euro 64 56 15-Jul-20 The Bank of
New York Mellon 1US dollar Euro 78,653 69,883 15-Jul-20 The Bank of
New York Mellon 299US dollar Euro 947,283 841,260 15-Jul-20 The Bank of
New York Mellon 4,037US dollar Euro 11,032 9,693 15-Jul-20 The Bank of
New York Mellon 164US dollar Euro 90 79 15-Jul-20 The Bank of
New York Mellon 1
USD 6,591
EUR 5,880
03613-1A.indd 186 19/08/2020 19:01

187
Schedule of investments – as at 30 June 2020
BNy MELLON GLOBAL EQUITy INCOME FUND
Forward foreign currency contracts cont’d.Unrealised
Gain/(Loss)Buy Sell Amount (B) Amount (S)Settle
Date Counterparty
BNy Mellon Global Equity Income Fund EUR W (Acc) (Hedged) Share ClassUS dollar Euro 32,263 28,736 15-Jul-20 The Bank of
New York Mellon 44US dollar Euro 82,305 73,093 15-Jul-20 The Bank of
New York Mellon 351
USD 395
EUR 352
Euro US dollar 36,244 40,687 15-Jul-20 The Bank of New York Mellon (49)
Euro US dollar 14,792 16,835 15-Jul-20 The Bank of New York Mellon (250)
Euro US dollar 1,324,510 1,504,564 15-Jul-20 The Bank of New York Mellon (19,482)
US dollar Euro 334,655 298,531 15-Jul-20 The Bank of New York Mellon (67)
USD (19,848)
EUR (17,707)
Net USD (19,453)
Net EUR (17,355)
Forward foreign currency contracts cont’d.Unrealised
Gain/(Loss)Buy Sell Amount (B) Amount (S)Settle
Date Counterparty
BNy Mellon Global Equity Income Fund EUR I (Hedged) Share Class cont’d.Euro US dollar 149,210 167,534 01-Jul-20 The Bank of
New York Mellon (285)Euro US dollar 28,930 32,652 02-Jul-20 The Bank of
New York Mellon (225)Euro US dollar 5,494 6,180 15-Jul-20 The Bank of
New York Mellon (20)Euro US dollar 412,721 463,314 15-Jul-20 The Bank of
New York Mellon (558)Euro US dollar 15,232 17,225 15-Jul-20 The Bank of
New York Mellon (146)Euro US dollar 15,357,133 17,444,772 15-Jul-20 The Bank of
New York Mellon (225,890)
USD (227,124)
EUR (202,626)
Net USD (220,533)
Net EUR (196,746)
BNy Mellon Global Equity Income Fund EUR I (Inc) (Hedged) Share ClassUS dollar Euro 84,537 75,294 15-Jul-20 The Bank of
New York Mellon 115US dollar Euro 165,798 147,242 15-Jul-20 The Bank of
New York Mellon 706
USD 821
EUR 732
Euro US dollar 75,096 84,302 15-Jul-20 The Bank of New York Mellon (101)
Euro US dollar 1,093,288 1,243,626 15-Jul-20 The Bank of New York Mellon (17,799)
Euro US dollar 1,680,033 1,908,415 15-Jul-20 The Bank of New York Mellon (24,712)
USD (42,612)
EUR (38,016)
Net USD (41,791)
Net EUR (37,284)
03613-1A.indd 187 19/08/2020 19:01

188
Schedule of investments – as at 30 June 2020
Holdings Description
Fair value
Total net assets
% Holdings Description
Fair value
Total net assets
%
FUND 26 – BNy MELLON GLOBAL HIGH yIELD BOND FUND
Bonds Canada - 3,907,025
(31 December 2019: 4,109,841) 3,907,025 3.50 155,000 1011778 BC ULC / New Red Finance Inc ‘144A’
4.375% 15-Jan-2028 152,937 0.14 140,000 1011778 BC ULC / New Red Finance Inc ‘144A’
5.750% 15-Apr-2025 147,263 0.13 80,000 Bausch Health Cos Inc ‘144A’ 5.000% 30-Jan-2028 74,876 0.07 80,000 Bausch Health Cos Inc ‘144A’ 5.250% 30-Jan-2030 75,054 0.07 260,000 Bausch Health Cos Inc ‘144A’ 6.125% 15-Apr-2025 261,667 0.23 395,000 Bausch Health Cos Inc ‘144A’ 6.250% 15-Feb-2029 397,597 0.36 295,000 Bausch Health Cos Inc ‘144A’ 7.250% 30-May-2029 307,719 0.27 110,000 Bausch Health Cos Inc ‘REGS’ 9.000% 15-Dec-2025 118,528 0.11 125,000 Bombardier Inc ‘144A’ 6.125% 15-Jan-2023 84,962 0.08 325,000 Bombardier Inc ‘144A’ 7.500% 15-Mar-2025 209,828 0.19 515,000 Clarios Global LP ‘144A’ 6.750% 15-May-2025 537,209 0.48 355,000 First Quantum Minerals Ltd ‘144A’
7.250% 01-Apr-2023 339,371 0.30 37,000 GFL Environmental Inc ‘144A’ 7.000% 01-Jun-2026 38,704 0.03 163,000 GFL Environmental Inc ‘144A’ 8.500% 01-May-2027 177,994 0.16 295,000 Hudbay Minerals Inc ‘144A’ 7.625% 15-Jan-2025 278,664 0.25 315,000 Husky III Holding Ltd ‘144A’ 13.000% 15-Feb-2025 308,109 0.28 276,000 Masonite International Corp ‘144A’
5.375% 01-Feb-2028 283,021 0.25 85,000 Precision Drilling Corp ‘144A’ 7.125% 15-Jan-2026 53,003 0.05 60,000 Reliance Intermediate Holdings LP ‘REGS’
6.500% 01-Apr-2023 60,519 0.05
Cayman Islands - 386,854 (31 December 2019: 943,592) 386,854 0.35
250,000 Shelf Drilling Holdings Ltd ‘144A’ 8.250% 15-Feb-2025 125,779 0.11 220,000 Transocean Poseidon Ltd ‘144A’ 6.875% 01-Feb-2027 194,700 0.18 75,000 Transocean Poseidon Ltd ‘REGS’ 6.875% 01-Feb-2027 66,375 0.06
Denmark - 330,666 (31 December 2019: –) 330,666 0.30
295,000 DKT Finance ApS ‘REGS’ 7.000% 17-Jun-2023 330,666 0.30
France - 3,634,745 (31 December 2019: 1,814,833) 3,634,745 3.26
435,000 Altice France SA/France ‘144A’ 8.125% 01-Feb-2027 475,464 0.43 385,000 Banijay Entertainment SASU ‘144A’
5.375% 01-Mar-2025 377,541 0.34 560,000 Banijay Group SAS ‘REGS’ 6.500% 01-Mar-2026 565,851 0.51 145,000 Constantin Investissement 3 SASU ‘144A’
5.375% 15-Apr-2025 163,824 0.15 340,000 Constantin Investissement 3 SASU ‘REGS’
5.375% 15-Apr-2025 384,140 0.34 470,000 Kapla Holding SAS ‘REGS’ 3.375% 15-Dec-2026 468,214 0.42 215,000 Kapla Holding SAS ‘REGS’ FRN 3.250% 15-Dec-2026 216,865 0.19 375,000 La Financiere Atalian SASU ‘REGS’
5.125% 15-May-2025 317,355 0.28 290,000 Loxam SAS ‘REGS’ 2.875% 15-Apr-2026 280,118 0.25 400,000 Renault SA 1.125% 04-Oct-2027 385,373 0.35
Germany - 1,873,547 (31 December 2019: 876,932) 1,873,547 1.68
366,000 Cheplapharm Arzneimittel GmbH ‘REGS’ 3.500% 11-Feb-2027 406,717 0.36
420,000 Nidda BondCo GmbH ‘REGS’ 5.000% 30-Sep-2025 467,248 0.42 165,000 Nidda BondCo GmbH ‘REGS’ 7.250% 30-Sep-2025 189,228 0.17
155,000 Nidda Healthcare Holding GmbH ‘REGS’ 3.500% 30-Sep-2024 172,412 0.15
295,000 Techem Verwaltungsgesellschaft 674 mbH ‘REGS’ 6.000% 30-Jul-2026 340,586 0.31
270,000 WEPA Hygieneprodukte GmbH ‘REGS’ 2.875% 15-Dec-2027 297,356 0.27
Ireland - 2,297,892 (31 December 2019: 1,556,652) 2,297,892 2.06
255,000 Ardagh Packaging Finance Plc / Ardagh Holdings USA Inc ‘144A’ 4.125% 15-Aug-2026 249,778 0.22
333,000 Ardagh Packaging Finance Plc / Ardagh Holdings USA Inc ‘144A’ 5.250% 30-Apr-2025 342,033 0.31
200,000 Ardagh Packaging Finance Plc / Ardagh Holdings USA Inc ‘144A’ 5.250% 15-Aug-2027 194,898 0.18
500,000 Carlyle Euro CLO 2019-1 DAC ‘2019-1X D’ FRN 6.120% 15-Mar-2032 510,178 0.46
500,000 Grand Harbour CLO 2019-1 DAC ‘2019-1X D’ FRN 4.100% 15-Mar-2032 515,614 0.46
300,000 Harvest CLO XXI DAC FRN 6.190% 15-Jul-2031 305,950 0.27 145,000 Virgin Media Vendor Financing Notes III DAC ‘REGS’
4.875% 15-Jul-2028 179,441 0.16
Italy - 353,902 (31 December 2019: 1,036,297) 353,902 0.32
355,000 Fire BC SpA ‘REGS’ FRN 4.750% 30-Sep-2024 353,902 0.32
Luxembourg - 6,516,218 (31 December 2019: 8,995,433) 6,516,218 5.84
295,000 Altice Financing SA ‘144A’ 5.000% 15-Jan-2028 294,733 0.27 560,000 Altice Financing SA ‘144A’ 7.500% 15-May-2026 588,132 0.53 415,000 Altice France Holding SA ‘144A’ 6.000% 15-Feb-2028 392,571 0.35 275,000 Altice France Holding SA ‘144A’ 8.000% 15-May-2027 326,098 0.29 490,000 Altice France Holding SA ‘144A’ 10.500% 15-May-2027 539,919 0.48 275,000 Altice France Holding SA ‘REGS’ 4.000% 15-Feb-2028 279,676 0.25 115,000 ArcelorMittal SA 4.550% 11-Mar-2026 116,695 0.11 255,000 ARD Finance SA ‘144A’ 6.500% 30-Jun-2027 252,657 0.23 310,000 ARD Finance SA ‘REGS’ 5.000% 30-Jun-2027 336,186 0.30 100,000 Cabot Financial Luxembourg SA ‘REGS’
7.500% 01-Oct-2023 123,002 0.11 485,000 Connect Finco SARL / Connect US Finco LLC ‘144A’
6.750% 01-Oct-2026 459,246 0.41 595,000 Consolidated Energy Finance SA ‘144A’
6.875% 15-Jun-2025 506,116 0.45 380,000 Garfunkelux Holdco 3 SA ‘REGS’ 8.500% 01-Nov-2022 439,424 0.39 630,000 Matterhorn Telecom SA ‘REGS’ 4.000% 15-Nov-2027 713,794 0.64 115,000 Telecom Italia Capital SA 6.000% 30-Sep-2034 125,489 0.11 430,000 Telecom Italia Finance SA ‘EMTN’
7.750% 24-Jan-2033 678,718 0.61 300,000 Telenet Finance Luxembourg Notes Sarl ‘REGS’
3.500% 01-Mar-2028 343,762 0.31
Netherlands - 4,193,239 (31 December 2019: 3,381,916) 4,193,239 3.76
100,000 Energizer Gamma Acquisition BV ‘REGS’ 4.625% 15-Jul-2026 114,993 0.10
280,000 Intertrust Group BV ‘REGS’ 3.375% 15-Nov-2025 317,383 0.29 467,000 Samvardhana Motherson Automotive Systems
Group BV ‘REGS’ 1.800% 06-Jul-2024 453,882 0.41
BNY MELLON GLOBAL HIGH YIELD BOND FUND
Bonds cont’d.
Germany cont’d.
USDUSD
03613-1A.indd 188 19/08/2020 19:01

189
Schedule of investments – as at 30 June 2020
Holdings Description
Fair value
Total net assets
% Holdings Description
Fair value
Total net assets
%
BNy MELLON GLOBAL HIGH yIELD BOND FUND
Bonds cont’d.
Netherlands cont’d. 390,000 Allen Media LLC / Allen Media Co-Issuer Inc ‘144A’
10.500% 15-Feb-2028 358,018 0.32 305,000 American Airlines Inc ‘144A’ 11.750% 15-Jul-2025 291,275 0.26 300,000 American Axle & Manufacturing Inc
6.250% 01-Apr-2025 294,629 0.26 115,000 American Axle & Manufacturing Inc
6.875% 01-Jul-2028 113,131 0.10 365,000 AMN Healthcare Inc ‘144A’ 4.625% 01-Oct-2027 356,264 0.32 505,000 AmWINS Group Inc ‘144A’ 7.750% 01-Jul-2026 528,361 0.47 145,000 Antero Midstream Partners LP /
Antero Midstream Finance Corp ‘144A’ 5.750% 01-Mar-2027 117,907 0.11
243,000 Apache Corp 4.375% 15-Oct-2028 214,047 0.19 324,000 Apache Corp 5.100% 01-Sep-2040 263,793 0.24 80,000 Apache Corp 5.350% 01-Jul-2049 63,639 0.06 445,000 APX Group Inc ‘144A’ 6.750% 15-Feb-2027 418,300 0.38 160,000 Arconic Corp ‘144A’ 6.000% 15-May-2025 165,100 0.15 515,000 Arconic Corp ‘144A’ 6.125% 15-Feb-2028 499,563 0.45 535,000 Ascend Learning LLC ‘144A’ 6.875% 01-Aug-2025 538,288 0.48 355,000 Ashtead Capital Inc ‘144A’ 4.250% 01-Nov-2029 355,692 0.32 205,000 Ashton Woods USA LLC / Ashton Woods Finance
Co ‘144A’ 6.625% 15-Jan-2028 202,437 0.18 215,000 Avantor Inc ‘144A’ 9.000% 01-Oct-2025 231,394 0.21 100,000 Avantor Inc ‘REGS’ 4.750% 01-Oct-2024 116,013 0.10 150,000 Axalta Coating Systems LLC /
Axalta Coating Systems Dutch Holding B BV ‘144A’ 4.750% 15-Jun-2027 151,500 0.14
450,000 Banff Merger Sub Inc ‘144A’ 9.750% 01-Sep-2026 453,573 0.41 210,000 Banff Merger Sub Inc ‘REGS’ 8.375% 01-Sep-2026 236,842 0.21 200,000 Bank of America Corp FRN (Perpetual)
5.200% 01-Jun-2023 193,758 0.17 235,000 Berry Global Inc 5.125% 15-Jul-2023 235,509 0.21 230,000 Block Communications Inc ‘144A’
4.875% 01-Mar-2028 226,514 0.20 395,000 Blue Racer Midstream LLC / Blue Racer Finance
Corp ‘144A’ 6.625% 15-Jul-2026 358,162 0.32 150,000 Boxer Parent Co Inc ‘144A’ 7.125% 02-Oct-2025 157,875 0.14 85,000 Boyd Gaming Corp 6.375% 01-Apr-2026 80,872 0.07 92,000 Boyd Gaming Corp ‘144A’ 8.625% 01-Jun-2025 94,215 0.08 245,000 Brand Industrial Services Inc ‘144A’
8.500% 15-Jul-2025 226,163 0.20 240,000 Brink’s Co/The ‘144A’ 4.625% 15-Oct-2027 229,897 0.21 235,000 Brookfield Property REIT Inc / BPR Cumulus LLC /
BPR Nimbus LLC / GGSI Sellco LL ‘144A’ 5.750% 15-May-2026 198,540 0.18
205,000 Burlington Coat Factory Warehouse Corp ‘144A’ 6.250% 15-Apr-2025 214,609 0.19
180,000 Calpine Corp ‘144A’ 4.500% 15-Feb-2028 177,040 0.16 170,000 Calpine Corp ‘144A’ 5.125% 15-Mar-2028 166,035 0.15 290,000 CCO Holdings LLC / CCO Holdings Capital Corp ‘144A’
4.500% 15-Aug-2030 294,786 0.26 300,000 CCO Holdings LLC / CCO Holdings Capital Corp ‘144A’
4.750% 01-Mar-2030 307,509 0.28 245,000 CCO Holdings LLC / CCO Holdings Capital Corp ‘144A’
5.000% 01-Feb-2028 253,820 0.23 120,000 CCO Holdings LLC / CCO Holdings Capital Corp ‘144A’
5.125% 01-May-2027 124,230 0.11 345,000 CCO Holdings LLC / CCO Holdings Capital Corp ‘144A’
5.500% 01-May-2026 358,315 0.32
390,000 Stars Group Holdings BV / Stars Group US Co-Borrower LLC ‘144A’ 7.000% 15-Jul-2026 411,397 0.37
235,969 Summer BidCo BV ‘REGS’ 9.750% 15-Nov-2025 250,040 0.22 285,000 Summer BidCo BV ‘REGS’ 9.750% 15-Nov-2025 293,900 0.26 200,000 Telefonica Europe BV FRN (Perpetual)
2.875% 24-Jun-2027 213,432 0.19 300,000 Telefonica Europe BV FRN (Perpetual)
3.875% 22-Jun-2026 336,691 0.30 200,000 Trivium Packaging Finance BV ‘144A’
8.500% 15-Aug-2027 213,963 0.19 135,000 Trivium Packaging Finance BV ‘REGS’
3.750% 15-Aug-2026 149,809 0.13 395,000 United Group BV ‘REGS’ 4.875% 01-Jul-2024 440,542 0.40 130,000 Volkswagen International Finance NV FRN
(Perpetual) 3.500% 20-Mar-2030 142,426 0.13 200,000 Volkswagen International Finance NV FRN
(Perpetual) 4.625% 27-Jun-2028 233,531 0.21 400,000 ZF Europe Finance BV 3.000% 23-Oct-2029 403,092 0.36 205,000 Ziggo Bond Co BV ‘REGS’ 3.375% 28-Feb-2030 218,158 0.20
Sweden - 833,242 (31 December 2019: –) 833,242 0.75
110,000 Verisure Holding AB ‘REGS’ FRN 5.000% 15-Apr-2025 125,001 0.11 165,000 Verisure Midholding AB ‘144A’ 5.750% 01-Dec-2023 186,976 0.17 460,000 Verisure Midholding AB ‘REGS’ 5.750% 01-Dec-2023 521,265 0.47
United Kingdom - 6,122,463 (31 December 2019: 3,771,209) 6,122,463 5.49
451,000 Centrica Plc FRN 5.250% 10-Apr-2075 552,708 0.50 295,000 INEOS Finance Plc ‘REGS’ 2.875% 01-May-2026 316,302 0.28 200,000 International Game Technology Plc ‘144A’
5.250% 15-Jan-2029 195,860 0.18 265,000 Jerrold Finco Plc ‘REGS’ 4.875% 15-Jan-2026 295,910 0.26 490,000 Pinewood Finance Co Ltd ‘REGS’ 3.250% 30-Sep-2025 593,664 0.53 545,000 Synlab Bondco Plc ‘REGS’ FRN 4.750% 01-Jul-2025 610,616 0.55 390,000 Synlab Unsecured Bondco Plc ‘REGS’
8.250% 01-Jul-2023 449,073 0.40 315,000 Titan Acquisition Ltd / Titan Co-Borrower LLC ‘144A’
7.750% 15-Apr-2026 299,283 0.27 405,000 Venator Finance Sarl / Venator Materials LLC ‘144A’
5.750% 15-Jul-2025 289,277 0.26 395,000 Venator Finance Sarl / Venator Materials LLC ‘144A’
9.500% 01-Jul-2025 408,825 0.37 640,000 Virgin Media Secured Finance Plc ‘REGS’
4.250% 15-Jan-2030 778,190 0.70 430,000 Viridian Group FinanceCo Plc /
Viridian Power & Energy ‘REGS’ 4.750% 15-Sep-2024 520,947 0.47 275,000 Vodafone Group Plc FRN 4.875% 03-Oct-2078 351,696 0.31 375,000 William Hill Plc 4.750% 01-May-2026 460,112 0.41
United States of America - 76,715,994 (31 December 2019: 82,450,548) 76,715,994 68.80
250,000 AES Corp/The 6.000% 15-May-2026 261,801 0.23 165,000 Ahern Rentals Inc ‘144A’ 7.375% 15-May-2023 80,249 0.07 215,000 Albertsons Cos Inc / Safeway Inc / New Albertsons LP /
Albertsons LLC 6.625% 15-Jun-2024 221,128 0.20 145,000 Albertsons Cos Inc / Safeway Inc / New Albertsons LP /
Albertsons LLC ‘144A’ 5.875% 15-Feb-2028 149,233 0.13 320,000 Albertsons Cos Inc / Safeway Inc / New Albertsons LP /
Albertsons LLC ‘REGS’ 7.500% 15-Mar-2026 343,053 0.31
Bonds cont’d.
United States of America cont’d.
USDUSD
03613-1A.indd 189 19/08/2020 19:01
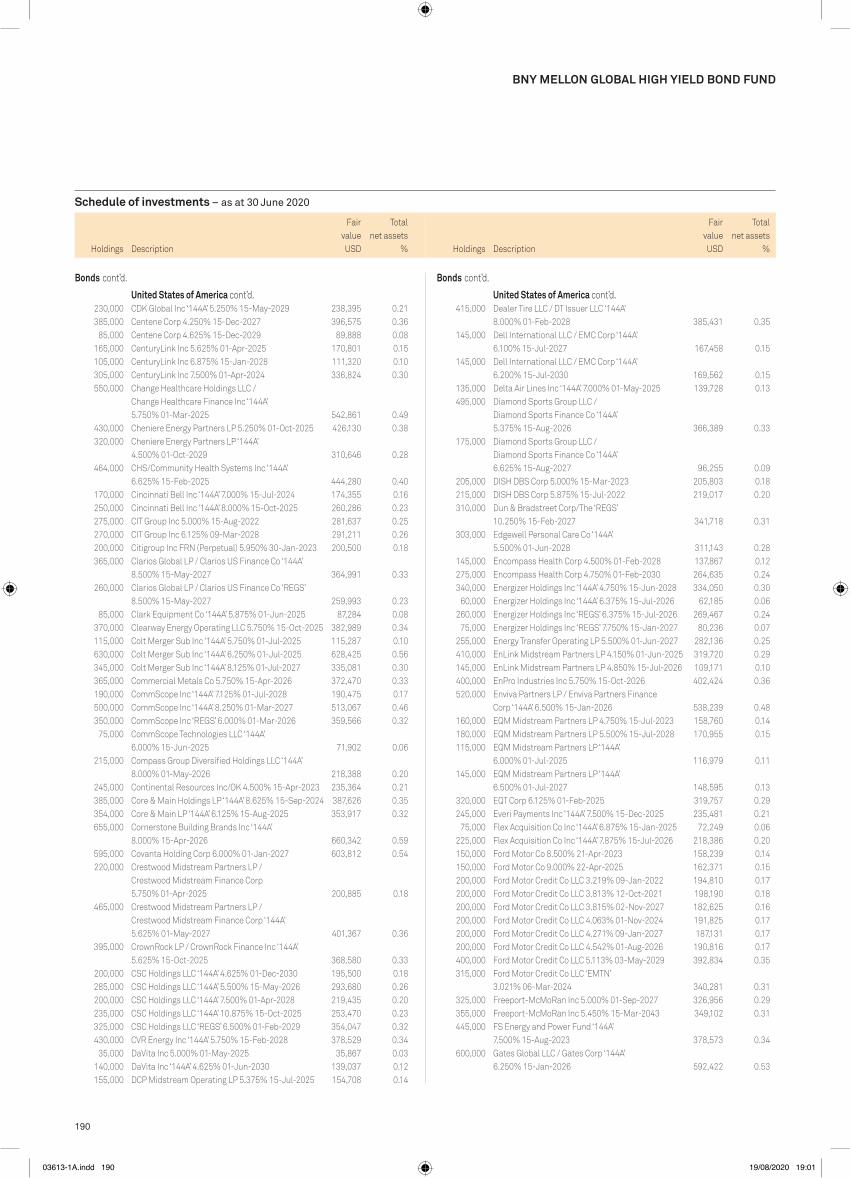
190
Schedule of investments – as at 30 June 2020
Holdings Description
Fair value
Total net assets
% Holdings Description
Fair value
Total net assets
%
BNy MELLON GLOBAL HIGH yIELD BOND FUND
415,000 Dealer Tire LLC / DT Issuer LLC ‘144A’ 8.000% 01-Feb-2028 385,431 0.35
145,000 Dell International LLC / EMC Corp ‘144A’ 6.100% 15-Jul-2027 167,458 0.15
145,000 Dell International LLC / EMC Corp ‘144A’ 6.200% 15-Jul-2030 169,562 0.15
135,000 Delta Air Lines Inc ‘144A’ 7.000% 01-May-2025 139,728 0.13 495,000 Diamond Sports Group LLC /
Diamond Sports Finance Co ‘144A’ 5.375% 15-Aug-2026 366,389 0.33
175,000 Diamond Sports Group LLC / Diamond Sports Finance Co ‘144A’ 6.625% 15-Aug-2027 96,255 0.09
205,000 DISH DBS Corp 5.000% 15-Mar-2023 205,803 0.18 215,000 DISH DBS Corp 5.875% 15-Jul-2022 219,017 0.20 310,000 Dun & Bradstreet Corp/The ‘REGS’
10.250% 15-Feb-2027 341,718 0.31 303,000 Edgewell Personal Care Co ‘144A’
5.500% 01-Jun-2028 311,143 0.28 145,000 Encompass Health Corp 4.500% 01-Feb-2028 137,867 0.12 275,000 Encompass Health Corp 4.750% 01-Feb-2030 264,635 0.24 340,000 Energizer Holdings Inc ‘144A’ 4.750% 15-Jun-2028 334,050 0.30 60,000 Energizer Holdings Inc ‘144A’ 6.375% 15-Jul-2026 62,185 0.06 260,000 Energizer Holdings Inc ‘REGS’ 6.375% 15-Jul-2026 269,467 0.24 75,000 Energizer Holdings Inc ‘REGS’ 7.750% 15-Jan-2027 80,236 0.07 255,000 Energy Transfer Operating LP 5.500% 01-Jun-2027 282,136 0.25 410,000 EnLink Midstream Partners LP 4.150% 01-Jun-2025 319,720 0.29 145,000 EnLink Midstream Partners LP 4.850% 15-Jul-2026 109,171 0.10 400,000 EnPro Industries Inc 5.750% 15-Oct-2026 402,424 0.36 520,000 Enviva Partners LP / Enviva Partners Finance
Corp ‘144A’ 6.500% 15-Jan-2026 538,239 0.48 160,000 EQM Midstream Partners LP 4.750% 15-Jul-2023 158,760 0.14 180,000 EQM Midstream Partners LP 5.500% 15-Jul-2028 170,955 0.15 115,000 EQM Midstream Partners LP ‘144A’
6.000% 01-Jul-2025 116,979 0.11 145,000 EQM Midstream Partners LP ‘144A’
6.500% 01-Jul-2027 148,595 0.13 320,000 EQT Corp 6.125% 01-Feb-2025 319,757 0.29 245,000 Everi Payments Inc ‘144A’ 7.500% 15-Dec-2025 235,481 0.21 75,000 Flex Acquisition Co Inc ‘144A’ 6.875% 15-Jan-2025 72,249 0.06 225,000 Flex Acquisition Co Inc ‘144A’ 7.875% 15-Jul-2026 218,386 0.20 150,000 Ford Motor Co 8.500% 21-Apr-2023 158,239 0.14 150,000 Ford Motor Co 9.000% 22-Apr-2025 162,371 0.15 200,000 Ford Motor Credit Co LLC 3.219% 09-Jan-2022 194,810 0.17 200,000 Ford Motor Credit Co LLC 3.813% 12-Oct-2021 198,190 0.18 200,000 Ford Motor Credit Co LLC 3.815% 02-Nov-2027 182,625 0.16 200,000 Ford Motor Credit Co LLC 4.063% 01-Nov-2024 191,825 0.17 200,000 Ford Motor Credit Co LLC 4.271% 09-Jan-2027 187,131 0.17 200,000 Ford Motor Credit Co LLC 4.542% 01-Aug-2026 190,816 0.17 400,000 Ford Motor Credit Co LLC 5.113% 03-May-2029 392,834 0.35 315,000 Ford Motor Credit Co LLC ‘EMTN’
3.021% 06-Mar-2024 340,281 0.31 325,000 Freeport-McMoRan Inc 5.000% 01-Sep-2027 326,956 0.29 355,000 Freeport-McMoRan Inc 5.450% 15-Mar-2043 349,102 0.31 445,000 FS Energy and Power Fund ‘144A’
7.500% 15-Aug-2023 378,573 0.34 600,000 Gates Global LLC / Gates Corp ‘144A’
6.250% 15-Jan-2026 592,422 0.53
230,000 CDK Global Inc ‘144A’ 5.250% 15-May-2029 238,395 0.21 385,000 Centene Corp 4.250% 15-Dec-2027 396,575 0.36 85,000 Centene Corp 4.625% 15-Dec-2029 89,888 0.08 165,000 CenturyLink Inc 5.625% 01-Apr-2025 170,801 0.15 105,000 CenturyLink Inc 6.875% 15-Jan-2028 111,320 0.10 305,000 CenturyLink Inc 7.500% 01-Apr-2024 336,824 0.30 550,000 Change Healthcare Holdings LLC /
Change Healthcare Finance Inc ‘144A’ 5.750% 01-Mar-2025 542,861 0.49
430,000 Cheniere Energy Partners LP 5.250% 01-Oct-2025 426,130 0.38 320,000 Cheniere Energy Partners LP ‘144A’
4.500% 01-Oct-2029 310,646 0.28 464,000 CHS/Community Health Systems Inc ‘144A’
6.625% 15-Feb-2025 444,280 0.40 170,000 Cincinnati Bell Inc ‘144A’ 7.000% 15-Jul-2024 174,355 0.16 250,000 Cincinnati Bell Inc ‘144A’ 8.000% 15-Oct-2025 260,286 0.23 275,000 CIT Group Inc 5.000% 15-Aug-2022 281,637 0.25 270,000 CIT Group Inc 6.125% 09-Mar-2028 291,211 0.26 200,000 Citigroup Inc FRN (Perpetual) 5.950% 30-Jan-2023 200,500 0.18 365,000 Clarios Global LP / Clarios US Finance Co ‘144A’
8.500% 15-May-2027 364,991 0.33 260,000 Clarios Global LP / Clarios US Finance Co ‘REGS’
8.500% 15-May-2027 259,993 0.23 85,000 Clark Equipment Co ‘144A’ 5.875% 01-Jun-2025 87,284 0.08 370,000 Clearway Energy Operating LLC 5.750% 15-Oct-2025 382,989 0.34 115,000 Colt Merger Sub Inc ‘144A’ 5.750% 01-Jul-2025 115,287 0.10 630,000 Colt Merger Sub Inc ‘144A’ 6.250% 01-Jul-2025 628,425 0.56 345,000 Colt Merger Sub Inc ‘144A’ 8.125% 01-Jul-2027 335,081 0.30 365,000 Commercial Metals Co 5.750% 15-Apr-2026 372,470 0.33 190,000 CommScope Inc ‘144A’ 7.125% 01-Jul-2028 190,475 0.17 500,000 CommScope Inc ‘144A’ 8.250% 01-Mar-2027 513,067 0.46 350,000 CommScope Inc ‘REGS’ 6.000% 01-Mar-2026 359,566 0.32 75,000 CommScope Technologies LLC ‘144A’
6.000% 15-Jun-2025 71,902 0.06 215,000 Compass Group Diversified Holdings LLC ‘144A’
8.000% 01-May-2026 218,388 0.20 245,000 Continental Resources Inc/OK 4.500% 15-Apr-2023 235,364 0.21 385,000 Core & Main Holdings LP ‘144A’ 8.625% 15-Sep-2024 387,626 0.35 354,000 Core & Main LP ‘144A’ 6.125% 15-Aug-2025 353,917 0.32 655,000 Cornerstone Building Brands Inc ‘144A’
8.000% 15-Apr-2026 660,342 0.59 595,000 Covanta Holding Corp 6.000% 01-Jan-2027 603,812 0.54 220,000 Crestwood Midstream Partners LP /
Crestwood Midstream Finance Corp 5.750% 01-Apr-2025 200,885 0.18
465,000 Crestwood Midstream Partners LP / Crestwood Midstream Finance Corp ‘144A’ 5.625% 01-May-2027 401,367 0.36
395,000 CrownRock LP / CrownRock Finance Inc ‘144A’ 5.625% 15-Oct-2025 368,580 0.33
200,000 CSC Holdings LLC ‘144A’ 4.625% 01-Dec-2030 195,500 0.18 285,000 CSC Holdings LLC ‘144A’ 5.500% 15-May-2026 293,680 0.26 200,000 CSC Holdings LLC ‘144A’ 7.500% 01-Apr-2028 219,435 0.20 235,000 CSC Holdings LLC ‘144A’ 10.875% 15-Oct-2025 253,470 0.23 325,000 CSC Holdings LLC ‘REGS’ 6.500% 01-Feb-2029 354,047 0.32 430,000 CVR Energy Inc ‘144A’ 5.750% 15-Feb-2028 378,529 0.34 35,000 DaVita Inc 5.000% 01-May-2025 35,867 0.03 140,000 DaVita Inc ‘144A’ 4.625% 01-Jun-2030 139,037 0.12 155,000 DCP Midstream Operating LP 5.375% 15-Jul-2025 154,708 0.14
Bonds cont’d.
United States of America cont’d.
Bonds cont’d.
United States of America cont’d.
USDUSD
03613-1A.indd 190 19/08/2020 19:01

191
Schedule of investments – as at 30 June 2020
Holdings Description
Fair value
Total net assets
% Holdings Description
Fair value
Total net assets
%
BNy MELLON GLOBAL HIGH yIELD BOND FUND
245,000 Matador Resources Co 5.875% 15-Sep-2026 181,881 0.16 225,000 Mauser Packaging Solutions Holding Co ‘144A’
7.250% 15-Apr-2025 201,413 0.18 245,000 Mauser Packaging Solutions Holding Co ‘144A’
8.500% 15-Apr-2024 251,125 0.23 125,000 Mercer International Inc 5.500% 15-Jan-2026 117,894 0.11 245,000 Mercer International Inc 7.375% 15-Jan-2025 246,891 0.22 218,000 Meredith Corp ‘144A’ 6.500% 01-Jul-2025 218,272 0.20 290,000 Midcontinent Communications /
Midcontinent Finance Corp ‘144A’ 5.375% 15-Aug-2027 296,745 0.27
115,000 Minerals Technologies Inc ‘144A’ 5.000% 01-Jul-2028 116,437 0.10
520,000 MPH Acquisition Holdings LLC ‘144A’ 7.125% 01-Jun-2024 486,200 0.44
355,000 Mueller Water Products Inc ‘144A’ 5.500% 15-Jun-2026 368,689 0.33
405,000 Nationstar Mortgage Holdings Inc ‘144A’ 6.000% 15-Jan-2027 389,314 0.35
330,000 Nationstar Mortgage Holdings Inc ‘144A’ 8.125% 15-Jul-2023 340,760 0.31
150,000 Nationstar Mortgage Holdings Inc ‘REGS’ 8.125% 15-Jul-2023 154,891 0.14
660,000 Navient Corp 5.500% 25-Jan-2023 632,362 0.57 365,000 Navient Corp 7.250% 25-Sep-2023 357,742 0.32 210,000 Netflix Inc 4.625% 15-May-2029 261,868 0.23 190,000 Netflix Inc 5.875% 15-Feb-2025 210,834 0.19 185,000 Netflix Inc ‘REGS’ 3.625% 15-Jun-2030 214,660 0.19 270,000 New Albertsons LP 8.000% 01-May-2031 303,075 0.27 265,000 Novelis Corp ‘144A’ 4.750% 30-Jan-2030 253,080 0.23 495,000 NRG Energy Inc 5.750% 15-Jan-2028 523,307 0.47 200,000 NRG Energy Inc 7.250% 15-May-2026 212,441 0.19 285,000 Occidental Petroleum Corp 2.900% 15-Aug-2024 242,874 0.22 145,000 Occidental Petroleum Corp 3.400% 15-Apr-2026 118,900 0.11 350,000 Occidental Petroleum Corp 3.500% 15-Aug-2029 257,810 0.23 280,000 Occidental Petroleum Corp 4.400% 15-Apr-2046 195,077 0.18 135,000 Occidental Petroleum Corp 5.550% 15-Mar-2026 124,756 0.11 285,000 Occidental Petroleum Corp 6.450% 15-Sep-2036 242,298 0.22 320,000 Occidental Petroleum Corp 6.950% 01-Jul-2024 314,200 0.28 220,000 Occidental Petroleum Corp 8.875% 15-Jul-2030 220,550 0.20 245,000 Open Text Holdings Inc ‘144A’ 4.125% 15-Feb-2030 241,336 0.22 470,000 Ortho-Clinical Diagnostics Inc / Ortho-Clinical
Diagnostics SA ‘144A’ 7.250% 01-Feb-2028 481,750 0.43 170,000 Ortho-Clinical Diagnostics Inc / Ortho-Clinical
Diagnostics SA ‘144A’ 7.375% 01-Jun-2025 173,719 0.16 105,000 Outfront Media Capital LLC / Outfront Media Capital
Corp ‘144A’ 4.625% 15-Mar-2030 96,025 0.09 200,000 Outfront Media Capital LLC / Outfront Media Capital
Corp ‘144A’ 5.000% 15-Aug-2027 179,778 0.16 155,000 Parsley Energy LLC / Parsley Finance Corp ‘REGS’
5.375% 15-Jan-2025 151,336 0.14 290,000 PBF Holding Co LLC / PBF Finance Corp ‘144A’
6.000% 15-Feb-2028 247,225 0.22 221,000 PBF Holding Co LLC / PBF Finance Corp ‘144A’
9.250% 15-May-2025 234,162 0.21 360,000 PDC Energy Inc 5.750% 15-May-2026 328,743 0.29 230,000 PetSmart Inc ‘144A’ 7.125% 15-Mar-2023 226,713 0.20 63,000 Picasso Finance Sub Inc ‘144A’ 6.125% 15-Jun-2025 64,247 0.06 705,000 Polaris Intermediate Corp ‘144A’ 8.500% 01-Dec-2022 624,359 0.56
405,000 General Electric Co FRN (Perpetual) 5.000% 21-Jan-2021 316,932 0.28
460,000 Genesis Energy LP / Genesis Energy Finance Corp 6.000% 15-May-2023 424,877 0.38
130,000 Genesis Energy LP / Genesis Energy Finance Corp 6.500% 01-Oct-2025 111,233 0.10
100,000 Genesis Energy LP / Genesis Energy Finance Corp 7.750% 01-Feb-2028 90,094 0.08
350,000 Genesys Telecommunications Laboratories Inc/ Greeneden Lux 3 Sarl/Greeneden US Ho ‘144A’ 10.000% 30-Nov-2024 364,807 0.33
110,000 Gray Television Inc ‘144A’ 7.000% 15-May-2027 113,228 0.10 345,000 Greystar Real Estate Partners LLC ‘144A’
5.750% 01-Dec-2025 348,519 0.31 555,000 Griffon Corp 5.750% 01-Mar-2028 549,284 0.49 435,000 GTCR AP Finance Inc ‘144A’ 8.000% 15-May-2027 445,249 0.40 90,000 H&E Equipment Services Inc 5.625% 01-Sep-2025 90,684 0.08 480,000 Harsco Corp ‘144A’ 5.750% 31-Jul-2027 483,614 0.43 300,000 HCA Inc 5.875% 01-May-2023 325,506 0.29 190,000 HUB International Ltd ‘144A’ 7.000% 01-May-2026 190,191 0.17 415,000 Icahn Enterprises LP / Icahn Enterprises
Finance Corp 5.250% 15-May-2027 399,074 0.36 520,000 Icahn Enterprises LP / Icahn Enterprises
Finance Corp 6.250% 15-May-2026 526,417 0.47 330,000 Innophos Holdings Inc ‘144A’
9.375% 15-Feb-2028 324,431 0.29 255,000 Intrado Corp ‘144A’ 8.500% 15-Oct-2025 203,101 0.18 385,000 Iron Mountain Inc ‘144A’ 5.250% 15-Jul-2030 380,428 0.34 340,000 Jagged Peak Energy LLC 5.875% 01-May-2026 330,920 0.30 90,000 Jaguar Holding Co II / PPD Development LP ‘144A’
4.625% 15-Jun-2025 91,631 0.08 150,000 Jaguar Holding Co II / PPD Development LP ‘144A’
5.000% 15-Jun-2028 153,844 0.14 475,000 Kaiser Aluminum Corp ‘144A’ 4.625% 01-Mar-2028 459,178 0.41 60,000 Kaiser Aluminum Corp ‘144A’ 6.500% 01-May-2025 61,976 0.06 195,000 Kraft Heinz Foods Co 4.625% 30-Jan-2029 210,002 0.19 180,000 Kraft Heinz Foods Co 5.000% 15-Jul-2035 197,749 0.18 105,000 Kraft Heinz Foods Co 5.000% 04-Jun-2042 108,606 0.10 330,000 Kraft Heinz Foods Co 5.200% 15-Jul-2045 352,912 0.32 140,000 Kraft Heinz Foods Co ‘144A’ 3.875% 15-May-2027 146,606 0.13 185,000 Kraft Heinz Foods Co ‘144A’ 4.250% 01-Mar-2031 195,187 0.18 325,000 Kraft Heinz Foods Co ‘144A’ 4.625% 01-Oct-2039 326,052 0.29 160,000 Kraton Polymers LLC / Kraton Polymers
Capital Corp ‘144A’ 7.000% 15-Apr-2025 161,362 0.14 575,000 LABL Escrow Issuer LLC ‘144A’ 6.750% 15-Jul-2026 598,026 0.54 85,000 LABL Escrow Issuer LLC ‘144A’ 10.500% 15-Jul-2027 90,506 0.08 205,000 Ladder Capital Finance Holdings LLLP /
Ladder Capital Finance Corp ‘144A’ 4.250% 01-Feb-2027 164,082 0.15
575,000 Ladder Capital Finance Holdings LLLP / Ladder Capital Finance Corp ‘144A’ 5.250% 01-Oct-2025 500,046 0.45
180,000 Laredo Petroleum Inc 9.500% 15-Jan-2025 127,105 0.11 45,000 Laredo Petroleum Inc 10.125% 15-Jan-2028 32,962 0.03 330,000 Level 3 Financing Inc 5.375% 01-May-2025 337,872 0.30 245,000 LifePoint Health Inc ‘144A’ 6.750% 15-Apr-2025 252,350 0.23 540,000 Lions Gate Capital Holdings LLC ‘144A’
6.375% 01-Feb-2024 528,182 0.47 340,000 Macy’s Inc ‘144A’ 8.375% 15-Jun-2025 338,937 0.30
Bonds cont’d.
United States of America cont’d.
Bonds cont’d.
United States of America cont’d.
USDUSD
03613-1A.indd 191 19/08/2020 19:01

192
Schedule of investments – as at 30 June 2020
Holdings Description
Fair value
Total net assets
% Holdings Description
Fair value
Total net assets
%
BNy MELLON GLOBAL HIGH yIELD BOND FUND
20,000 Tenet Healthcare Corp ‘REGS’ 6.250% 01-Feb-2027 19,812 0.02 320,000 TerraForm Power Operating LLC ‘144A’
4.750% 15-Jan-2030 325,757 0.29 260,000 Terrier Media Buyer Inc ‘144A’ 8.875% 15-Dec-2027 248,950 0.22 100,000 TransDigm Inc 5.500% 15-Nov-2027 88,057 0.08 550,000 TransDigm Inc 6.500% 15-May-2025 508,808 0.46 460,000 TransDigm Inc ‘144A’ 6.250% 15-Mar-2026 460,246 0.41 125,000 TRI Pointe Group Inc 5.700% 15-Jun-2028 127,812 0.11 380,000 Tronox Inc ‘144A’ 6.500% 01-May-2025 381,187 0.34 310,000 TTM Technologies Inc ‘144A’ 5.625% 01-Oct-2025 308,030 0.28 137,000 Ulti 4.750% 03-May-2026 134,945 0.12 315,000 United Rentals North America Inc
5.500% 15-May-2027 324,902 0.29 100,000 United Rentals North America Inc
5.875% 15-Sep-2026 104,861 0.09 335,000 US Foods Inc ‘144A’ 6.250% 15-Apr-2025 341,842 0.31 298,000 USA Compression Partners LP / USA Compression
Finance Corp 6.875% 01-Apr-2026 291,992 0.26 120,000 USA Compression Partners LP / USA Compression
Finance Corp 6.875% 01-Sep-2027 116,096 0.10 390,000 USI Inc/NY ‘144A’ 6.875% 01-May-2025 394,627 0.35 535,000 Verscend Escrow Corp ‘144A’ 9.750% 15-Aug-2026 576,636 0.52 165,000 VICI Properties LP / VICI Note Co Inc ‘144A’
4.125% 15-Aug-2030 157,627 0.14 170,000 VICI Properties LP / VICI Note Co Inc ‘144A’
4.250% 01-Dec-2026 162,618 0.15 125,000 VICI Properties LP / VICI Note Co Inc ‘144A’
4.625% 01-Dec-2029 121,784 0.11 235,000 Vistra Operations Co LLC ‘144A’ 5.625% 15-Feb-2027 240,659 0.22 165,000 Vistra Operations Co LLC ‘REGS’ 5.500% 01-Sep-2026 169,238 0.15 70,000 Vistra Operations Co LLC ‘REGS’ 5.625% 15-Feb-2027 71,686 0.06 420,000 Waste Pro USA Inc ‘144A’ 5.500% 15-Feb-2026 402,627 0.36 225,000 WESCO Distribution Inc ‘144A’ 7.125% 15-Jun-2025 237,656 0.21 405,000 WESCO Distribution Inc ‘144A’ 7.250% 15-Jun-2028 431,325 0.39 995,000 West Street Merger Sub Inc ‘144A’
6.375% 01-Sep-2025 968,249 0.87 180,000 Western Midstream Operating LP
3.100% 01-Feb-2025 170,329 0.15 300,000 Western Midstream Operating LP
4.500% 01-Mar-2028 283,500 0.25 310,000 Williams Scotsman International Inc ‘REGS’
6.875% 15-Aug-2023 319,333 0.29 145,000 WMG Acquisition Corp ‘144A’ 3.875% 15-Jul-2030 146,812 0.13 135,000 WPX Energy Inc 5.750% 01-Jun-2026 131,005 0.12 155,000 WW International Inc ‘144A’ 8.625% 01-Dec-2025 162,459 0.15 215,000 WW International Inc ‘REGS’ 8.625% 01-Dec-2025 225,347 0.20 415,000 Zayo Group Holdings Inc ‘144A’
4.000% 01-Mar-2027 392,889 0.35 230,000 ZF North America Capital Inc ‘144A’
4.750% 29-Apr-2025 229,713 0.21
Total investments in bonds 107,165,787 96.11
Leveraged loans
Luxembourg - 31,421 (31 December 2019: –) 31,421 0.02
34,912 Auris Luxembourg III Sarl Term Loan 0.000% 21-Feb-2026 31,421 0.02
240,000 Post Holdings Inc ‘144A’ 4.625% 15-Apr-2030 234,396 0.21 380,000 Post Holdings Inc ‘144A’ 5.750% 01-Mar-2027 393,454 0.35 170,000 Prestige Brands Inc ‘144A’ 5.125% 15-Jan-2028 170,425 0.15 255,000 Prime Security Services Borrower LLC /
Prime Finance Inc ‘144A’ 6.250% 15-Jan-2028 241,049 0.22 75,000 Prime Security Services Borrower LLC /
Prime Finance Inc ‘REGS’ 5.750% 15-Apr-2026 77,637 0.07 375,000 Quicken Loans LLC ‘144A’ 5.250% 15-Jan-2028 387,639 0.35 225,000 Quicken Loans LLC ‘144A’ 5.750% 01-May-2025 230,581 0.21 260,000 Rackspace Hosting Inc ‘144A’ 8.625% 15-Nov-2024 260,013 0.23 405,000 Radiate Holdco LLC / Radiate Finance Inc ‘144A’
6.625% 15-Feb-2025 402,471 0.36 230,000 Radiate Holdco LLC / Radiate Finance Inc ‘144A’
6.875% 15-Feb-2023 233,713 0.21 80,000 Realogy Group LLC / Realogy Co-Issuer Corp ‘144A’
7.625% 15-Jun-2025 80,024 0.07 395,000 Reynolds Group Issuer Inc / Reynolds Group
Issuer LLC / Reynolds Group Issuer Lu ‘144A’ 7.000% 15-Jul-2024 396,302 0.36
200,000 RP Crown Parent LLC ‘144A’ 7.375% 15-Oct-2024 200,229 0.18 211,000 SBA Communications Corp ‘144A’
3.875% 15-Feb-2027 209,480 0.19 240,000 Scientific Games International Inc ‘REGS’
8.250% 15-Mar-2026 215,209 0.19 351,000 Scotts Miracle-Gro Co/The 4.500% 15-Oct-2029 362,199 0.32 335,000 Scripps Escrow Inc ‘144A’ 5.875% 15-Jul-2027 321,329 0.29 315,000 Select Medical Corp ‘144A’ 6.250% 15-Aug-2026 317,671 0.29 160,000 Signature Aviation US Holdings Inc ‘144A’
4.000% 01-Mar-2028 145,470 0.13 70,000 Sinclair Television Group Inc ‘144A’
5.125% 15-Feb-2027 64,299 0.06 455,000 Sirius XM Radio Inc ‘144A’ 5.500% 01-Jul-2029 480,485 0.43 360,000 Southwestern Energy Co 7.500% 01-Apr-2026 319,628 0.29 135,000 Spectrum Brands Inc ‘144A’ 5.500% 15-Jul-2030 135,551 0.12 80,000 Sprint Capital Corp 6.875% 15-Nov-2028 97,021 0.09 65,000 Sprint Capital Corp 8.750% 15-Mar-2032 92,862 0.08 220,000 Sprint Corp 7.875% 15-Sep-2023 248,324 0.22 220,000 Staples Inc ‘144A’ 7.500% 15-Apr-2026 174,202 0.16 112,000 Station Casinos LLC ‘144A’ 4.500% 15-Feb-2028 96,110 0.09 260,000 Stevens Holding Co Inc ‘REGS’
6.125% 01-Oct-2026 273,276 0.25 55,000 Surgery Center Holdings Inc ‘144A’
10.000% 15-Apr-2027 54,921 0.05 50,000 Targa Resources Partners LP / Targa Resources
Partners Finance Corp 6.500% 15-Jul-2027 50,375 0.05 105,000 Taylor Morrison Communities Inc ‘144A’
5.875% 31-Jan-2025 106,701 0.10 190,000 Taylor Morrison Communities Inc ‘144A’
5.875% 15-Jun-2027 196,648 0.18 157,000 TEGNA Inc ‘144A’ 4.625% 15-Mar-2028 144,915 0.13 725,000 TEGNA Inc ‘144A’ 5.000% 15-Sep-2029 671,089 0.60 90,000 Tempo Acquisition LLC / Tempo Acquisition
Finance Corp ‘144A’ 5.750% 01-Jun-2025 92,756 0.08 500,000 Tempo Acquisition LLC / Tempo Acquisition
Finance Corp ‘144A’ 6.750% 01-Jun-2025 504,057 0.45 155,000 Tenet Healthcare Corp 8.125% 01-Apr-2022 162,157 0.15 645,000 Tenet Healthcare Corp ‘144A’ 6.250% 01-Feb-2027 638,950 0.57 65,000 Tenet Healthcare Corp ‘144A’ 7.500% 01-Apr-2025 68,616 0.06
Bonds cont’d.
United States of America cont’d.
Bonds cont’d.
United States of America cont’d.
USDUSD
03613-1A.indd 192 19/08/2020 19:01

193
Schedule of investments – as at 30 June 2020
Holdings Description
Fair value
Total net assets
% Holdings Description
Fair value
Total net assets
%
BNy MELLON GLOBAL HIGH yIELD BOND FUND
United States of America - 890,331 (31 December 2019: 5,035,813) 890,331 0.80
245,000 Asurion LLC Term Loan 7.880% 04-Aug-2025 243,775 0.22 521 AVSC Holding Corp Term Loan 0.000% 15-Oct-2026 380 0.00 491,252 Mayfield Agency Borrower Inc Term Loan
0.000% 31-Jan-2025 429,026 0.39 16,730 Pathway Vet Alliance LLC Term Loan
0.000% 31-Mar-2022 16,312 0.01 205,856 Pathway Vet Alliance LLC Term Loan
0.000% 31-Mar-2027 200,838 0.18
Total investments in leveraged loans 921,752 0.82 Unrealised gain on forward foreign currency contracts - 74,188 (see below) (31 December 2019: 436,070) 74,188 0.07
Total financial assets at fair value through profit or loss 108,161,727 97.00 Unrealised loss on forward foreign currency contracts - (469,320) (see below) (31 December 2019: (248,982)) (469,320) (0.42)
Total financial liabilities at fair value through profit or loss (469,320) (0.42)
Net current assets 3,814,126 3.42
Total net assets 111,506,533 100.00
Analysis of portfolio % of Total Assets
Transferable securities and money market instruments admitted to official stock exchange listing or traded on a regulated market 92.85Transferable securities and money market instruments other than those admitted to official stock exchange listing or traded on a regulated market 0.80oTC financial derivative instruments 0.06other current assets 6.29
Total assets 100.00
Leveraged loans cont’d.
USDUSD
Forward foreign currency contracts cont’d.Unrealised
Gain/(Loss)Buy Sell Amount (B) Amount (S)Settle
Date Counterparty
BNy Mellon Global High yield Bond FundUS dollar Euro 15,495,979 13,800,000 31-Jul-20 Goldman Sachs 17,407US dollar Euro 2,140,000 1,905,494 31-Jul-20 Goldman Sachs 2,730US dollar Sterling 310,624 250,000 31-Jul-20 Goldman Sachs 3,802US dollar Sterling 234,714 190,000 31-Jul-20 Citigroup Global
Markets Limited 1,530US dollar Sterling 5,016,287 4,050,000 31-Jul-20 Goldman Sachs 45,775
USD 71,244
Sterling US dollar 900,000 1,109,020 31-Jul-20 Goldman Sachs (4,461)
USD (4,461)
Net USD 66,783
BNy Mellon Global High yield Bond Fund EUR H (Hedged) Share ClassUS dollar Euro 27,714 24,658 15-Jul-20 The Bank of
New York Mellon 67
USD 67
EUR 60
Euro US dollar 49,975 56,878 15-Jul-20 The Bank of New York Mellon (845)
Euro US dollar 1,017,158 1,155,429 15-Jul-20 The Bank of New York Mellon (14,962)
Euro US dollar 29,988 33,770 15-Jul-20 The Bank of New York Mellon (147)
Euro US dollar 89,963 101,253 15-Jul-20 The Bank of New York Mellon (384)
Euro US dollar 30,975 35,027 15-Jul-20 The Bank of New York Mellon (297)
USD (16,635)
EUR (14,841)
Net USD (16,568)
Net EUR (14,781)
BNy Mellon Global High yield Bond Fund EUR I (Hedged) Share ClassUS dollar Euro 2,530 2,253 01-Jul-20 The Bank of
New York Mellon 4US dollar Euro 1,893 1,677 02-Jul-20 The Bank of
New York Mellon 13Euro US dollar 770 863 15-Jul-20 The Bank of
New York Mellon - US dollar Euro 276 244 15-Jul-20 The Bank of
New York Mellon 3US dollar Euro 302 267 15-Jul-20 The Bank of
New York Mellon 2US dollar Euro 6,518 5,756 15-Jul-20 The Bank of
New York Mellon 64
03613-1A.indd 193 19/08/2020 19:01

194
Schedule of investments – as at 30 June 2020
BNy MELLON GLOBAL HIGH yIELD BOND FUND
Forward foreign currency contracts cont’d.Unrealised
Gain/(Loss)Buy Sell Amount (B) Amount (S)Settle
Date Counterparty
BNy Mellon Global High yield Bond Fund EUR I (Hedged) Share Class cont’d.US dollar Euro 2,761 2,453 15-Jul-20 The Bank of
New York Mellon 11US dollar Euro 208,873 185,496 15-Jul-20 The Bank of
New York Mellon 890US dollar Euro 1,128 992 15-Jul-20 The Bank of
New York Mellon 16
USD 1,003
EUR 895
Euro US dollar 1,678 1,883 15-Jul-20 The Bank of New York Mellon (2)
Euro US dollar 9,407,633 10,686,501 15-Jul-20 The Bank of New York Mellon (138,378)
Euro US dollar 1,677 1,894 15-Jul-20 The Bank of New York Mellon (13)
Euro US dollar 2,253 2,531 15-Jul-20 The Bank of New York Mellon (4)
Euro US dollar 2,924 3,303 15-Jul-20 The Bank of New York Mellon (25)
USD (138,422)
EUR (123,492)
Net USD (137,419)
Net EUR (122,597)
BNy Mellon Global High yield Bond Fund EUR W (Acc) (Hedged) Share ClassUS dollar Euro 2,153 1,912 15-Jul-20 The Bank of
New York Mellon 9US dollar Euro 108,858 96,350 15-Jul-20 The Bank of
New York Mellon 828
USD 837
EUR 747
Euro US dollar 841 951 15-Jul-20 The Bank of New York Mellon (9)
Euro US dollar 97,421 110,665 15-Jul-20 The Bank of New York Mellon (1,433)
USD (1,442)
EUR (1,286)
Net USD (605)
Net EUR (539)
Forward foreign currency contracts cont’d.Unrealised
Gain/(Loss)Buy Sell Amount (B) Amount (S)Settle
Date Counterparty
BNy Mellon Global High yield Bond Fund EUR x (Inc) (Hedged) Share ClassUS dollar Euro 425,000 378,136 15-Jul-20 The Bank of
New York Mellon 1,023
USD 1,023
EUR 913
Euro US dollar 17,394,252 19,758,817 15-Jul-20 The Bank of New York Mellon (255,854)
USD (255,854)
EUR (228,257)
Net USD (254,831)
Net EUR (227,344)
BNy Mellon Global High yield Bond Fund Sterling W (Acc) (Hedged) Share ClassUS dollar Sterling 30,475 24,822 15-Jul-20 The Bank of
New York Mellon 14
USD 14
GBp 11
Sterling US dollar 1,121,186 1,428,377 15-Jul-20 The Bank of New York Mellon (52,506)
USD (52,506)
GBp (42,790)
Net USD (52,492)
Net GBp (42,779)
03613-1A.indd 194 19/08/2020 19:01

195
Schedule of investments – as at 30 June 2020
Holdings Description
Fair value
Total net assets
% Holdings Description
Fair value
Total net assets
%
BNY MELLON GLOBAL INFRASTRUCTURE INCOME FUND
FUND 27 – BNy MELLON GLOBAL INFRASTRUCTURE INCOME FUND
Equities
Belgium - 2,689,352 (31 December 2019: 1,623,678) 2,689,352 1.83
131,922 Proximus SADP 2,689,352 1.83
Canada - 11,766,112 (31 December 2019: 6,947,794) 11,766,112 7.99
274,905 Enbridge Inc 8,368,038 5.68 364,826 Inter Pipeline Ltd 3,398,074 2.31
China - 2,956,244 (31 December 2019: 680,446) 2,956,244 2.01
2,522,000 Jiangsu Expressway Co Ltd ‘H’ 2,956,244 2.01
France - 22,736,638 (31 December 2019: 6,351,395) 22,736,638 15.45
214,672 Bouygues SA 7,330,793 4.98 27,922 Eiffage SA 2,554,805 1.74 610,758 Orange SA 7,302,746 4.96 60,173 Vinci SA 5,548,294 3.77
Germany - 4,489,298 (31 December 2019: 2,152,812) 4,489,298 3.05
122,477 Deutsche Post AG 4,489,298 3.05
Italy - 16,655,667 (31 December 2019: 14,271,293) 16,655,667 11.31
289,382 Atlantia SpA 4,649,229 3.16 608,566 Enel SpA 5,252,713 3.57 1,163,294 Italgas SpA 6,753,725 4.58
Norway - 6,050,087 (31 December 2019: 2,637,663) 6,050,087 4.11
651,598 SFL Corp Ltd 6,050,087 4.11
Spain - 36,317,667 (31 December 2019: 12,823,462) 36,317,667 24.67
274,004 ACS Actividades de Construccion y Servicios SA 6,909,552 4.69 245,627 ACS Actividades de Construccion y Servicios SA
Rights 11-Jul-2020 382,829 0.26 45,784 Aena SME SA ‘144A’ 6,113,449 4.15 356,059 Enagas SA 8,710,710 5.92 314,223 Endesa SA 7,740,178 5.26 346,273 Red Electrica Corp SA 6,460,949 4.39
United Kingdom - 3,611,653 (31 December 2019: 6,149,464) 3,611,653 2.45
213,573 SSE Plc 3,611,653 2.45
United States of America - 40,816,275 (31 December 2019: 35,087,243) 40,816,275 27.73
53,219 Clearway Energy Inc 1,226,698 0.83 45,483 Dominion Energy Inc 3,689,581 2.51 149,737 Exelon Corp 5,433,207 3.69 306,365 Medical Properties Trust Inc (REIT) 5,758,130 3.91 274,271 ONEOK Inc 9,103,055 6.18 471,619 PPL Corp 12,184,277 8.28 69,617 Public Service Enterprise Group Inc 3,421,327 2.33
Total investments in equities 148,088,993 100.60
Unrealised gain on forward foreign currency contracts - 269,707 (see below) (31 December 2019: 390,155) 269,707 0.18
Total financial assets at fair value through profit or loss 148,358,700 100.78 Unrealised loss on forward foreign currency contracts - (3,365,373) (see below) (31 December 2019: (2,433)) (3,365,373) (2.28)
Total financial liabilities at fair value through profit or loss (3,365,373) (2.28)
Net current assets 2,211,745 1.50
Total net assets 147,205,072 100.00
Analysis of portfolio % of Total Assets
Transferable securities and money market instruments admitted to official stock exchange listing or traded on a regulated market 98.10oTC financial derivative instruments 0.18other current assets 1.72
Total assets 100.00
Description
USDUSD
03613-1A.indd 195 19/08/2020 19:01

196
Schedule of investments – as at 30 June 2020
BNy MELLON GLOBAL INFRASTRUCTURE INCOME FUND
Forward foreign currency contracts cont’d.Unrealised
Gain/(Loss)Buy Sell Amount (B) Amount (S)Settle
Date Counterparty
BNy Mellon Global Infrastructure Income FundEuro US dollar 228,350 256,108 01-Jul-20 Citigroup Global
Markets Limited 444
USD 444
BNy Mellon Global Infrastructure Income Fund EUR H (Acc) (Hedged) Share ClassEuro US dollar 6,142 6,893 15-Jul-20 The Bank of
New York Mellon 9US dollar Euro 6,157 5,473 15-Jul-20 The Bank of
New York Mellon 6US dollar Euro 22,671 20,045 15-Jul-20 The Bank of
New York Mellon 143US dollar Euro 9,162 8,055 15-Jul-20 The Bank of
New York Mellon 109
USD 267
EUR 238
Euro US dollar 5,084 5,732 15-Jul-20 The Bank of New York Mellon (19)
Euro US dollar 272,626 309,711 15-Jul-20 The Bank of New York Mellon (3,324)
US dollar Euro 5,873 5,234 15-Jul-20 The Bank of New York Mellon (9)
USD (3,352)
EUR (2,984)
Net USD (3,085)
Net EUR (2,746)
BNy Mellon Global Infrastructure Income Fund EUR H (Inc) (Hedged) Share ClassEuro US dollar 19,880 22,313 15-Jul-20 The Bank of
New York Mellon 29US dollar Euro 19,930 17,716 15-Jul-20 The Bank of
New York Mellon 20US dollar Euro 73,386 64,887 15-Jul-20 The Bank of
New York Mellon 464US dollar Euro 29,658 26,076 15-Jul-20 The Bank of
New York Mellon 353
USD 866
EUR 771
Euro US dollar 16,456 18,554 15-Jul-20 The Bank of New York Mellon (60)
Euro US dollar 882,496 1,002,543 15-Jul-20 The Bank of New York Mellon (10,759)
US dollar Euro 19,012 16,944 15-Jul-20 The Bank of New York Mellon (30)
USD (10,849)
EUR (9,656)
Net USD (9,983)
Net EUR (8,885)
Forward foreign currency contracts cont’d.Unrealised
Gain/(Loss)Buy Sell Amount (B) Amount (S)Settle
Date Counterparty
BNy Mellon Global Infrastructure Income Fund EUR W (Acc) (Hedged) Share ClassEuro US dollar 3,663 4,111 15-Jul-20 The Bank of
New York Mellon 5US dollar Euro 3,651 3,245 15-Jul-20 The Bank of
New York Mellon 4US dollar Euro 13,489 11,926 15-Jul-20 The Bank of
New York Mellon 85US dollar Euro 5,450 4,792 15-Jul-20 The Bank of
New York Mellon 65
USD 159
EUR 142
Euro US dollar 3,046 3,434 15-Jul-20 The Bank of New York Mellon (11)
Euro US dollar 162,333 184,415 15-Jul-20 The Bank of New York Mellon (1,979)
US dollar Euro 3,472 3,095 15-Jul-20 The Bank of New York Mellon (5)
USD (1,995)
EUR (1,776)
Net USD (1,836)
Net EUR (1,634)
BNy Mellon Global Infrastructure Income Fund EUR W (Inc) (Hedged) Share ClassEuro US dollar 340,898 382,613 15-Jul-20 The Bank of
New York Mellon 502US dollar Euro 339,798 302,051 15-Jul-20 The Bank of
New York Mellon 341US dollar Euro 1,255,470 1,110,065 15-Jul-20 The Bank of
New York Mellon 7,935US dollar Euro 507,235 445,974 15-Jul-20 The Bank of
New York Mellon 6,033
USD 14,811
EUR 13,183
Euro US dollar 283,509 319,650 15-Jul-20 The Bank of New York Mellon (1,032)
Euro US dollar 15,109,290 17,164,627 15-Jul-20 The Bank of New York Mellon (184,200)
US dollar Euro 323,192 288,033 15-Jul-20 The Bank of New York Mellon (511)
USD (185,743)
EUR (165,325)
Net USD (170,932)
Net EUR (152,142)
03613-1A.indd 196 19/08/2020 19:01

197
Schedule of investments – as at 30 June 2020
BNy MELLON GLOBAL INFRASTRUCTURE INCOME FUND
Forward foreign currency contracts cont’d.Unrealised
Gain/(Loss)Buy Sell Amount (B) Amount (S)Settle
Date Counterparty
BNy Mellon Global Infrastructure Income Fund SGD J (Inc) (Hedged) Share Class cont’d.Singapore dollar US dollar 1,500 1,078 15-Jul-20 The Bank of
New York Mellon (2)Singapore dollar US dollar 150,000 107,650 15-Jul-20 The Bank of
New York Mellon (12)Singapore dollar US dollar 49,675 35,700 15-Jul-20 The Bank of
New York Mellon (54)Singapore dollar US dollar 10,494 7,543 15-Jul-20 The Bank of
New York Mellon (13)Singapore dollar US dollar 200,975 145,385 15-Jul-20 The Bank of
New York Mellon (1,168)Singapore dollar US dollar 1,984 1,429 15-Jul-20 The Bank of
New York Mellon (5)Singapore dollar US dollar 343,294 247,212 15-Jul-20 The Bank of
New York Mellon (870)
USD (2,124)
SGD (2,960)
Net USD (1,984)
Net SGD (2,765)
BNy Mellon Global Infrastructure Income Fund Sterling E (Inc) (Hedged) Share ClassUS dollar Sterling 2,431,535 1,958,773 15-Jul-20 The Bank of
New York Mellon 4,194US dollar Sterling 2,557,036 2,057,411 15-Jul-20 The Bank of
New York Mellon 7,461US dollar Sterling 1 1 15-Jul-20 The Bank of
New York Mellon - US dollar Sterling 8,735,533 6,937,501 15-Jul-20 The Bank of
New York Mellon 138,477US dollar Sterling 109,099 85,693 15-Jul-20 The Bank of
New York Mellon 2,908US dollar Sterling 3,530,977 2,768,721 15-Jul-20 The Bank of
New York Mellon 99,936
USD 252,976
GBp 204,161
Sterling US dollar 4,190,938 5,257,101 15-Jul-20 The Bank of New York Mellon (63,628)
Sterling US dollar 8,000,000 10,020,039 15-Jul-20 The Bank of New York Mellon (106,319)
Sterling US dollar 94,079,462 119,575,727 15-Jul-20 The Bank of New York Mellon (2,991,044)
USD (3,160,991)
GBp (2,551,037)
Net USD (2,908,015)
Net GBp (2,346,876)
Forward foreign currency contracts cont’d.Unrealised
Gain/(Loss)Buy Sell Amount (B) Amount (S)Settle
Date Counterparty
BNy Mellon Global Infrastructure Income Fund SGD J (Acc) (Hedged) Share Class US dollar Singapore dollar 1,795 2,500 01-Jul-20 The Bank of
New York Mellon 1Singapore dollar US dollar 1,000 717 15-Jul-20 The Bank of
New York Mellon - Singapore dollar US dollar 2,687 1,927 15-Jul-20 The Bank of
New York Mellon 1US dollar Singapore dollar 5,103 7,101 15-Jul-20 The Bank of
New York Mellon 7US dollar Singapore dollar 6,329 8,795 15-Jul-20 The Bank of
New York Mellon 18US dollar Singapore dollar 2,554 3,536 15-Jul-20 The Bank of
New York Mellon 17
USD 44
SGD 61
Singapore dollar US dollar 2,500 1,795 15-Jul-20 The Bank of New York Mellon (1)
Singapore dollar US dollar 4,959 3,564 15-Jul-20 The Bank of New York Mellon (5)
Singapore dollar US dollar 69,650 49,987 15-Jul-20 The Bank of New York Mellon (7)
Singapore dollar US dollar 2,272 1,633 15-Jul-20 The Bank of New York Mellon (3)
Singapore dollar US dollar 119,799 86,270 15-Jul-20 The Bank of New York Mellon (303)
USD (319)
SGD (445)
Net USD (275)
Net SGD (384)
BNy Mellon Global Infrastructure Income Fund SGD J (Inc) (Hedged) Share Class Singapore dollar US dollar 12,421 8,908 15-Jul-20 The Bank of
New York Mellon 5US dollar Singapore dollar 8,637 12,019 15-Jul-20 The Bank of
New York Mellon 13US dollar Singapore dollar 7,938 11,061 15-Jul-20 The Bank of
New York Mellon 1US dollar Singapore dollar 1,361 1,897 15-Jul-20 The Bank of
New York Mellon - US dollar Singapore dollar 26,873 37,345 15-Jul-20 The Bank of
New York Mellon 74US dollar Singapore dollar 7,318 10,132 15-Jul-20 The Bank of
New York Mellon 47
USD 140
SGD 195
03613-1A.indd 197 19/08/2020 19:01

198
Schedule of investments – as at 30 June 2020
Holdings Description
Fair value
Total net assets
% Holdings Description
Fair value
Total net assets
%
BNY MELLON GLOBAL LEADERS FUND
FUND 28 – BNyM GLO LEADERS FUND
29,100 NIKE Inc 2,852,673 4.49 14,200 Texas Instruments Inc 1,802,619 2.84 44,000 TJX Cos Inc/The 2,224,420 3.50
Total investments in equities 62,584,169 98.50 Unrealised gain on forward foreign currency contracts - 222 (see below) (31 December 2019: 15,537) 222 0.00
Total financial assets at fair value through profit or loss 62,584,391 98.50 Unrealised loss on forward foreign currency contracts - (14,845) (see below) (31 December 2019: (168)) (14,845) (0.02)
Total financial liabilities at fair value through profit or loss (14,845) (0.02)
Net current assets 968,354 1.52
Total net assets 63,537,900 100.00
Analysis of portfolio % of Total Assets
Transferable securities and money market instruments admitted to official stock exchange listing or traded on a regulated market 98.36oTC financial derivative instruments 0.00other current assets 1.64
Total assets 100.00
Equities
Australia - 1,861,817 (31 December 2019: 3,678,378) 1,861,817 2.93
9,400 CSL Ltd 1,861,817 2.93
Denmark - 1,836,780 (31 December 2019: 3,142,843) 1,836,780 2.89
28,300 Novo Nordisk A/S 1,836,780 2.89
France - 5,383,799 (31 December 2019: 8,792,785) 5,383,799 8.47
4,500 Air Liquide SA 648,653 1.02 7,100 L’Oreal SA 2,278,589 3.58 5,600 LVMH Moet Hennessy Louis Vuitton SE 2,456,557 3.87
Germany - 2,374,642 (31 December 2019: 2,963,511) 2,374,642 3.74
17,000 SAP SE 2,374,642 3.74
Hong Kong - 2,603,660 (31 December 2019: 3,339,239) 2,603,660 4.10
279,400 AIA Group Ltd 2,603,660 4.10
Japan - 5,939,440 (31 December 2019: 7,153,219) 5,939,440 9.35
13,200 FANUC Corp 2,356,073 3.71 8,600 Keyence Corp 3,583,367 5.64
Netherlands - 1,983,119 (31 December 2019: –) 1,983,119 3.12
5,400 ASML Holding NV 1,983,119 3.12
Spain - 2,240,761 (31 December 2019: 3,407,395) 2,240,761 3.53
84,600 Industria de Diseno Textil SA 2,240,761 3.53
Switzerland - 1,836,498 (31 December 2019: 3,342,072) 1,836,498 2.89
5,300 Roche Holding AG 1,836,498 2.89
Taiwan - 3,371,841 (31 December 2019: 4,381,117) 3,371,841 5.31
59,400 Taiwan Semiconductor Manufacturing Co Ltd ADR 3,371,841 5.31
United Kingdom - 663,137 (31 December 2019: 2,110,633) 663,137 1.04
7,200 Reckitt Benckiser Group Plc 663,137 1.04
United States of America - 32,488,675 (31 December 2019: 40,723,592) 32,488,675 51.13
6,600 Adobe Inc 2,872,122 4.52 1,740 Alphabet Inc 2,460,447 3.87 28,000 Amphenol Corp - Class A 2,680,020 4.22 9,300 Automatic Data Processing Inc 1,384,584 2.18 37,700 Cognizant Technology Solutions Corp 2,140,983 3.37 8,600 Colgate-Palmolive Co 629,950 0.99 4,500 Ecolab Inc 894,893 1.41 16,800 Edwards Lifesciences Corp 1,160,628 1.83 35,800 EOG Resources Inc 1,813,091 2.85 6,300 Illumina Inc 2,331,945 3.67 4,300 Intuitive Surgical Inc 2,449,516 3.85 9,600 Mastercard Inc 2,837,328 4.47 9,600 Microsoft Corp 1,953,456 3.07
Equities cont’d.
United States of America cont’d.
USDUSD
03613-1A.indd 198 19/08/2020 19:01
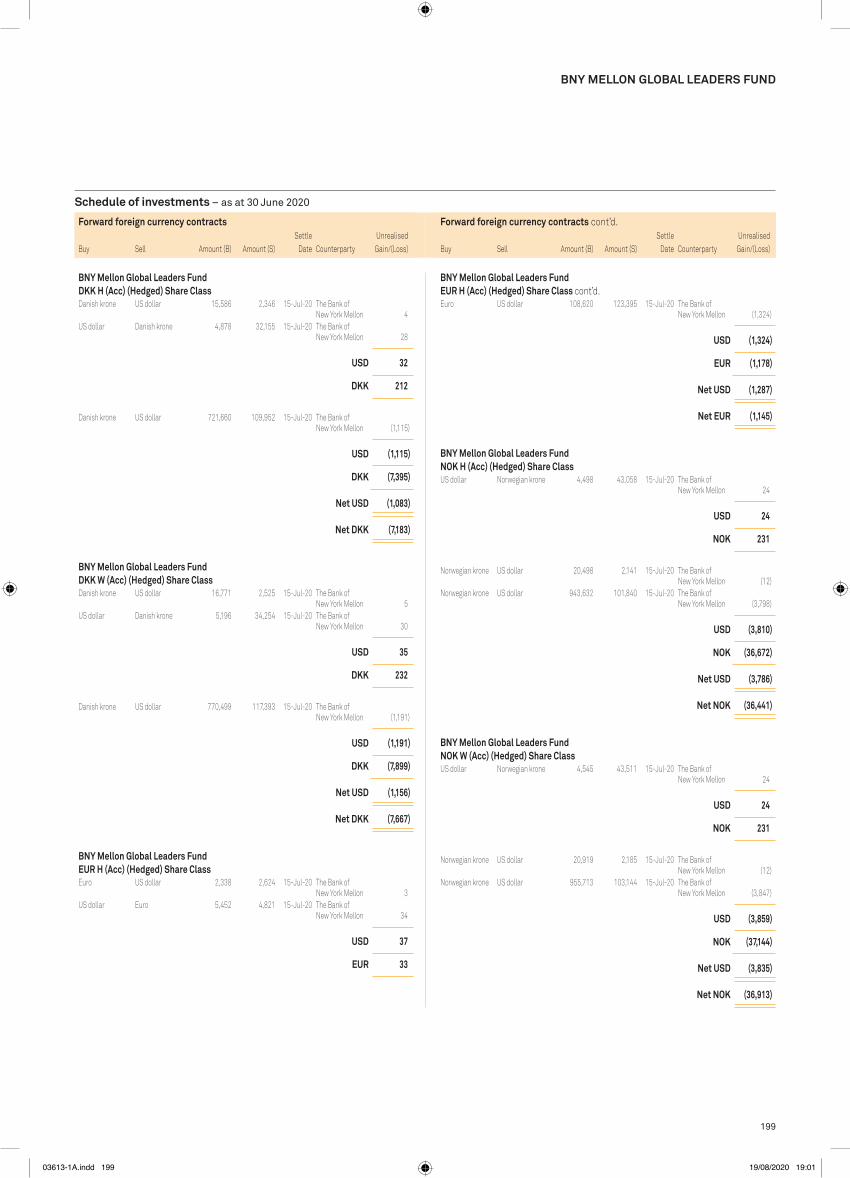
199
Schedule of investments – as at 30 June 2020
BNy MELLON GLOBAL LEADERS FUND
Forward foreign currency contracts cont’d.Unrealised
Gain/(Loss)Buy Sell Amount (B) Amount (S)Settle
Date Counterparty
BNy Mellon Global Leaders Fund DKK H (Acc) (Hedged) Share ClassDanish krone US dollar 15,586 2,346 15-Jul-20 The Bank of
New York Mellon 4US dollar Danish krone 4,878 32,155 15-Jul-20 The Bank of
New York Mellon 28
USD 32
DKK 212
Danish krone US dollar 721,660 109,952 15-Jul-20 The Bank of New York Mellon (1,115)
USD (1,115)
DKK (7,395)
Net USD (1,083)
Net DKK (7,183)
BNy Mellon Global Leaders Fund DKK W (Acc) (Hedged) Share ClassDanish krone US dollar 16,771 2,525 15-Jul-20 The Bank of
New York Mellon 5US dollar Danish krone 5,196 34,254 15-Jul-20 The Bank of
New York Mellon 30
USD 35
DKK 232
Danish krone US dollar 770,499 117,393 15-Jul-20 The Bank of New York Mellon (1,191)
USD (1,191)
DKK (7,899)
Net USD (1,156)
Net DKK (7,667)
BNy Mellon Global Leaders Fund EUR H (Acc) (Hedged) Share ClassEuro US dollar 2,338 2,624 15-Jul-20 The Bank of
New York Mellon 3US dollar Euro 5,452 4,821 15-Jul-20 The Bank of
New York Mellon 34
USD 37
EUR 33
Forward foreign currency contracts cont’d.Unrealised
Gain/(Loss)Buy Sell Amount (B) Amount (S)Settle
Date Counterparty
BNy Mellon Global Leaders Fund EUR H (Acc) (Hedged) Share Class cont’d.Euro US dollar 108,620 123,395 15-Jul-20 The Bank of
New York Mellon (1,324)
USD (1,324)
EUR (1,178)
Net USD (1,287)
Net EUR (1,145)
BNy Mellon Global Leaders Fund NOK H (Acc) (Hedged) Share ClassUS dollar Norwegian krone 4,498 43,058 15-Jul-20 The Bank of
New York Mellon 24
USD 24
NOK 231
Norwegian krone US dollar 20,498 2,141 15-Jul-20 The Bank of New York Mellon (12)
Norwegian krone US dollar 943,632 101,840 15-Jul-20 The Bank of New York Mellon (3,798)
USD (3,810)
NOK (36,672)
Net USD (3,786)
Net NOK (36,441)
BNy Mellon Global Leaders Fund NOK W (Acc) (Hedged) Share ClassUS dollar Norwegian krone 4,545 43,511 15-Jul-20 The Bank of
New York Mellon 24
USD 24
NOK 231
Norwegian krone US dollar 20,919 2,185 15-Jul-20 The Bank of New York Mellon (12)
Norwegian krone US dollar 955,713 103,144 15-Jul-20 The Bank of New York Mellon (3,847)
USD (3,859)
NOK (37,144)
Net USD (3,835)
Net NOK (36,913)
03613-1A.indd 199 19/08/2020 19:01

200
Schedule of investments – as at 30 June 2020
BNy MELLON GLOBAL LEADERS FUND
Forward foreign currency contracts cont’d.Unrealised
Gain/(Loss)Buy Sell Amount (B) Amount (S)Settle
Date Counterparty
BNy Mellon Global Leaders Fund SEK H (Acc) (Hedged) Share ClassSwedish krona US dollar 22,753 2,427 15-Jul-20 The Bank of
New York Mellon 16US dollar Swedish krona 5,019 46,584 15-Jul-20 The Bank of
New York Mellon 19
USD 35
SEK 326
Swedish krona US dollar 1,040,715 113,468 15-Jul-20 The Bank of New York Mellon (1,762)
USD (1,762)
SEK (16,419)
Net USD (1,727)
Net SEK (16,093)
BNy Mellon Global Leaders Fund SEK W (Acc) (Hedged) Share ClassSwedish krona US dollar 23,208 2,475 15-Jul-20 The Bank of
New York Mellon 16US dollar Swedish krona 5,068 47,045 15-Jul-20 The Bank of
New York Mellon 19
USD 35
SEK 326
Swedish krona US dollar 1,053,407 114,851 15-Jul-20 The Bank of New York Mellon (1,784)
USD (1,784)
SEK (16,624)
Net USD (1,749)
Net SEK (16,298)
03613-1A.indd 200 19/08/2020 19:01

201
Schedule of investments – as at 30 June 2020
Holdings Description
Fair value
Total net assets
% Holdings Description
Fair value
Total net assets
%
Collective investment schemes
Netherlands - 85,269 (31 December 2019: 110,045) 85,269 0.41
18,638 Volta Finance Ltd 85,269 0.41
Norway - 76,453 (31 December 2019: 85,666) 76,453 0.37
76,073 Aquila European Renewables Income Fund Plc/ The Fund 76,453 0.37
United Kingdom - 1,665,879 (31 December 2019: 5,649,234) 1,665,879 8.08
148,211 Blackstone/GSO Loan Financing Ltd 99,301 0.48 391,341 GCP Infrastructure Investments Ltd 481,523 2.34 286,614 Gresham House Energy Storage Fund Plc/The Fund 341,995 1.66 48,575 Octopus Renewables Infrastructure Trust Plc 58,971 0.28 359,180 Tufton Oceanic Assets Ltd/The Fund 293,201 1.42 103,139 US Solar Fund Plc/Fund 86,494 0.42 414,399 VPC Specialty Lending Investments Plc/Fund 304,394 1.48
Total investments in collective investment schemes 1,827,601 8.87
Bonds
Argentina - 56,824 (31 December 2019: 72,866) 56,824 0.28
150,000 Argentine Republic Government International Bond 6.875% 22-Apr-2021 56,824 0.28
Australia - 317,096 (31 December 2019: 380,247) 317,096 1.54
212,000 Australia Government Bond 3.250% 21-Apr-2029 156,525 0.76 229,800 New South Wales Treasury Corp
3.000% 20-Mar-2028 160,571 0.78
Brazil - 285,526 (31 December 2019: 126,341) 285,526 1.38
226,000 CSN Islands XI Corp ‘REGS’ 6.750% 28-Jan-2028 170,372 0.83 73,000 Petrobras Global Finance BV 6.875% 20-Jan-2040 69,314 0.33 46,000 Petrobras Global Finance BV 7.375% 17-Jan-2027 45,840 0.22
China - 154,916 (31 December 2019: 87,960) 154,916 0.75
175,000 Trip.com Group Ltd 1.000% 01-Jul-2020 154,916 0.75
Colombia - 164,711 (31 December 2019: 181,152) 164,711 0.80
609,200,000 Colombia Government International Bond ‘REGS’ 7.500% 26-Aug-2026 164,711 0.80
Ecuador - 75,609 (31 December 2019: 163,947) 75,609 0.37
200,000 Ecuador Government International Bond ‘REGS’ 8.875% 23-Oct-2027 75,609 0.37
France - 100,806 (31 December 2019: 107,959) 100,806 0.49
101,000 Societe Generale SA FRN (Perpetual) 6.750% 07-Apr-2021 100,806 0.49
Germany - 197,431 (31 December 2019: 208,296) 197,431 0.96
100,000 Infineon Technologies AG ‘EMTN’ FRN (Perpetual) 2.875% 01-Jan-2025 97,924 0.48
100,000 Infineon Technologies AG FRN (Perpetual) 3.625% 01-Jan-2028 99,507 0.48
Indonesia - 94,315 (31 December 2019: 97,746) 94,315 0.46
1,450,000,000 Indonesia Treasury Bond 8.250% 15-May-2036 94,315 0.46
Italy - 147,500 (31 December 2019: –) 147,500 0.72
200,000 UniCredit SpA ‘EMTN’ FRN (Perpetual) 3.875% 03-Jun-2027 147,500 0.72
Luxembourg - 111,940 (31 December 2019: –) 111,940 0.54
116,000 Summer BC Holdco B SARL ‘REGS’ 5.750% 31-Oct-2026 111,940 0.54
Mexico - 577,394 (31 December 2019: 453,959) 577,394 2.80
200,000 Cemex SAB de CV ‘REGS’ 6.125% 05-May-2025 173,280 0.84 8,868,200 Mexican Bonos 8.500% 31-May-2029 404,114 1.96
Netherlands - 183,022 (31 December 2019: –) 183,022 0.89
200,000 ING Groep NV FRN (Perpetual) 6.750% 16-Apr-2024 183,022 0.89
peru - 202,071 (31 December 2019: 210,649) 202,071 0.98
316,000 Peruvian Government International Bond ‘REGS’ 5.700% 12-Aug-2024 92,193 0.45
370,000 Peruvian Government International Bond ‘REGS’ 6.350% 12-Aug-2028 109,878 0.53
Sweden - 92,516 (31 December 2019: –) 92,516 0.45
100,000 Akelius Residential Property AB FRN 2.249% 17-May-2081 92,516 0.45
Switzerland - 101,939 (31 December 2019: 105,250) 101,939 0.49
100,000 UBS AG ‘EMTN’ FRN 4.750% 12-Feb-2026 101,939 0.49
United Kingdom - 372,569 (31 December 2019: 538,814) 372,569 1.81
100,000 B&M European Value Retail SA ‘REGS’ 4.125% 01-Feb-2022 109,675 0.53
53,000 BUPA Finance Plc FRN (Perpetual) 6.125% 16-Sep-2020 58,038 0.28
48,189 Tesco Property Finance 3 Plc 5.744% 13-Apr-2040 71,365 0.35 117,000 Vodafone Group Plc FRN 4.875% 03-Oct-2078 133,491 0.65
United States of America - 1,306,073 (31 December 2019: 1,569,851) 1,306,073 6.34
116,000 American Airlines Inc ‘144A’ 11.750% 15-Jul-2025 98,831 0.48 81,000 Best Buy Co Inc 5.500% 15-Mar-2021 73,857 0.36 74,000 CCO Holdings LLC / CCO Holdings Capital Corp ‘144A’
5.500% 01-May-2026 68,566 0.33 86,000 Citigroup Inc 5.500% 13-Sep-2025 90,970 0.44 125,000 Redwood Trust Inc 4.750% 15-Aug-2023 100,659 0.49 71,000 Sprint Capital Corp 8.750% 15-Mar-2032 90,494 0.44 68,000 T-Mobile USA Inc 6.000% 01-Mar-2023 61,094 0.30
BNY MELLON GLOBAL MULTI-ASSET INCOME FUND
FUND 29 – BNy MELLON GLOBAL MULTI ASSET INCOME FUND
Bonds cont’d.
Germany cont’d.
EUR EUR
03613-1A.indd 201 19/08/2020 19:01

202
Schedule of investments – as at 30 June 2020
Holdings Description
Fair value
Total net assets
% Holdings Description
Fair value
Total net assets
%
BNy MELLON GLOBAL MULTI-ASSET INCOME FUND
Mexico - 262,121 (31 December 2019: 338,253) 262,121 1.27
58,969 Kimberly-Clark de Mexico SAB de CV 79,249 0.38 85,500 Wal-Mart de Mexico SAB de CV 182,872 0.89
New Zealand - 330,071 (31 December 2019: 419,035) 330,071 1.60
154,716 SKYCITY Entertainment Group Ltd 217,890 1.06 43,107 Spark New Zealand Ltd 112,181 0.54
Norway - 122,719 (31 December 2019: 171,264) 122,719 0.60
7,401 Mowi ASA 122,719 0.60
Republic of Korea - 399,596 (31 December 2019: 361,386) 399,596 1.94
5,893 Samsung Electronics Co Ltd - Preference 203,459 0.99 727 Samsung SDI Co Ltd 196,137 0.95
Singapore - 100,551 (31 December 2019: 112,684) 100,551 0.49
59,300 Mapletree North Asia Commercial Trust (Units) (REIT) 35,118 0.17 30,500 Parkway Life Real Estate Investment Trust
(Units) (REIT) 65,433 0.32
South Africa - 129,454 (31 December 2019: –) 129,454 0.63
6,366 Anglo American Plc 129,454 0.63
Switzerland - 501,212 (31 December 2019: 567,272) 501,212 2.43
8,906 ABB Ltd 178,166 0.86 1,762 Novartis AG 136,573 0.66 597 Zurich Insurance Group AG 186,473 0.91
Taiwan - 217,853 (31 December 2019: 226,367) 217,853 1.06
23,000 Taiwan Semiconductor Manufacturing Co Ltd 217,853 1.06
Thailand - 89,752 (31 December 2019: –) 89,752 0.44
33,300 Kasikornbank PCL (Foreign Market) 89,752 0.44
United Kingdom - 2,679,250 (31 December 2019: 3,673,921) 2,679,250 13.00
30,641 Ascential Plc ‘144A’ 97,475 0.47 57,190 B&M European Value Retail SA 246,667 1.20 35,450 BAE Systems Plc 189,359 0.92 53,838 Barclays Plc 67,583 0.33 7,375 British American Tobacco Plc 252,738 1.22 222,994 Civitas Social Housing Plc (REIT) 268,523 1.30 4,055 Diageo Plc 119,709 0.58 187,989 Doric Nimrod Air Three Ltd - Preference 72,027 0.35 166,420 Doric Nimrod Air Two Ltd - Preference 114,773 0.56 106,690 EJF Investments Ltd 116,794 0.57 3,704 Ferguson Plc 268,264 1.30 8,289 Imperial Brands Plc 141,282 0.68 53,568 Informa Plc 275,906 1.34 288,220 Lloyds Banking Group Plc 98,314 0.48 13,092 Prudential Plc 175,207 0.85 77,287 Royal Bank of Scotland Group Plc 102,860 0.50 5,271 Royal Dutch Shell Plc 71,769 0.35
410,900 United States Treasury Inflation Indexed Bonds 0.750% 15-Jul-2028 414,029 2.01
299,442 United States Treasury Inflation Indexed Bonds 2.375% 15-Jan-2025 307,573 1.49
Total investments in bonds 4,542,258 22.05
Equities
Australia - 289,392 (31 December 2019: 357,687) 289,392 1.40
27,651 Insurance Australia Group Ltd 97,402 0.47 110,832 Star Entertainment Grp Ltd/The 191,990 0.93
Brazil - 48,128 (31 December 2019: 139,396) 48,128 0.23
20,092 Ambev SA ADR 48,128 0.23
Canada - 73,063 (31 December 2019: 140,948) 73,063 0.36
4,827 Suncor Energy Inc 73,063 0.36
China - 982,718 (31 December 2019: 442,871) 982,718 4.77
494,000 China Harmony New Energy Auto Holding Ltd 218,081 1.06 7,005 Hollysys Automation Technologies Ltd 82,586 0.40 250,241 Jiangsu Expressway Co Ltd ‘H’ 261,703 1.27 200,000 Man Wah Holdings Ltd 170,713 0.83 28,000 Ping An Insurance Group Co of China Ltd ‘H’ 249,635 1.21
Georgia - 189,511 (31 December 2019: 328,214) 189,511 0.92
6,453 Bank of Georgia Group Plc 75,586 0.37 11,667 TBC Bank Group Plc 113,925 0.55
Germany - 1,097,111 (31 December 2019: 834,593) 1,097,111 5.32
3,241 Bayer AG 214,392 1.04 2,935 Brenntag AG 137,607 0.67 1,680 Continental AG 146,798 0.71 1,531 HeidelbergCement AG 72,899 0.35 2,345 Hella GmbH & Co KGaA 86,413 0.42 109,697 Telefonica Deutschland Holding AG 289,984 1.41 1,110 Volkswagen AG - Preference 149,018 0.72
Hong Kong - 690,320 (31 December 2019: 910,499) 690,320 3.35
48,600 AIA Group Ltd 404,063 1.96 8,500 Link REIT (Units) (REIT) 61,961 0.30 82,804 Samsonite International SA ‘144A’ 74,396 0.36 42,800 Sands China Ltd 149,900 0.73
Ireland - 588,689 (31 December 2019: 614,900) 588,689 2.86
5,209 CRH Plc 158,797 0.77 356,757 Greencoat Renewables Plc 429,892 2.09
Japan - 188,437 (31 December 2019: 235,789) 188,437 0.91
4,100 Ebara Corp 85,656 0.41 6,200 Japan Tobacco Inc 102,781 0.50
Equities cont’d. Bonds cont’d.
United States of America cont’d.
EUR EUR
03613-1A.indd 202 19/08/2020 19:01

203
Schedule of investments – as at 30 June 2020
Holdings Description
Fair value
Total net assets
% Holdings Description
Fair value
Total net assets
%
BNy MELLON GLOBAL MULTI-ASSET INCOME FUND
United States of America - 1,444,913 (31 December 2019: 1,846,579) 1,444,913 7.01
2,695 Albemarle Corp 183,581 0.89 1,253 Apple Inc 404,628 1.96 3,811 Applied Materials Inc 200,818 0.98 3,255 Citigroup Inc 146,081 0.71 17,442 General Electric Co 105,735 0.51 1,502 Las Vegas Sands Corp 59,851 0.29 1,173 Microsoft Corp 207,690 1.01 22,163 Redwood Trust Inc (REIT) 136,529 0.66
Total investments in equities 10,424,861 50.59
Equity investment instruments
United Kingdom - 3,241,635 (31 December 2019: –) 3,241,635 15.74
214,827 BBGI SICAV SA/Fund 384,505 1.87 279,697 Greencoat UK Wind Plc/Funds 438,763 2.13 438,121 Hipgnosis Songs Fund Ltd/The Fund 556,349 2.70 206,810 International Public Partnerships Ltd 381,476 1.85 419,746 JLEN Environmental Assets Group Ltd 544,503 2.64 97,624 NextEnergy Solar Fund Ltd 114,991 0.56 409,173 Renewables Infrastructure Group Ltd/The 566,173 2.75 219,647 Sdcl Energy Efficiency Income Trust Plc 254,875 1.24
Total investments in equity investment instruments 3,241,635 15.74
preferred bonds
United Kingdom - 28,547 (31 December 2019: 31,753) 28,547 0.14
26,077 Balfour Beatty Plc - Preferred Stock 9.675% 01-Jul-2020 28,547 0.14
Total investments in preferred bonds 28,547 0.14 Unrealised gain on forward foreign currency contracts - 356,165 (see below) (31 December 2019: 63,698) 356,165 1.73
Total financial assets at fair value through profit or loss 20,421,067 99.11 Unrealised loss on forward foreign currency contracts - (30,500) (see below) (31 December 2019: (243,325)) (30,500) (0.15)
Total financial liabilities at fair value through profit or loss (30,500) (0.15)
Net current assets 214,895 1.04
Total net assets 20,605,462 100.00
Analysis of portfolio % of Total Assets
Transferable securities and money market instruments admitted to official stock exchange listing or traded on a regulated market 96.58oTC financial derivative instruments 1.71other current assets 1.71
Total assets 100.00
Equities cont’d.
EUR EUR
Forward foreign currency contractsUnrealised
Gain/(Loss)Buy Sell Amount (B) Amount (S)Settle
Date Counterparty
BNy Mellon Global Multi-Asset Income FundEuro US dollar 4,461 5,000 01-Jul-20 Barclays Bank PLC - Euro Japanese yen 70,328 8,299,000 15-Jul-20 State Street Bank 1,617Euro Sterling 72,359 64,817 15-Jul-20 The Bank of
New York Mellon 1,418Euro Sterling 5,377,830 4,730,618 15-Jul-20 State Street Bank 200,294Euro Sterling 30,016 27,143 15-Jul-20 The Bank of
New York Mellon 309Euro US dollar 4,491,209 4,864,661 15-Jul-20 State Street Bank 152,527
EUR 356,165
Euro Sterling 127,285 116,334 01-Jul-20 Citigroup Global Markets Limited (66)
Euro Australian dollar 293,001 523,318 15-Jul-20 The Bank of New York Mellon (26,687)
Euro US dollar 101,979 114,840 15-Jul-20 Barclays Bank PLC (444)Sterling Euro 1,013 1,156 15-Jul-20 State Street Bank (47)Sterling Euro 19,913 22,768 15-Jul-20 Barclays Bank PLC (973)Sterling Euro 18,772 21,481 15-Jul-20 State Street Bank (936)Sterling Euro 1,918 2,194 15-Jul-20 The Bank of
New York Mellon (94)Sterling Euro 5,291 6,048 15-Jul-20 State Street Bank (257)Sterling Euro 5,989 6,840 15-Jul-20 State Street Bank (285)Sterling Euro 4,148 4,743 15-Jul-20 Barclays Bank PLC (204)Sterling Euro 1,472 1,687 15-Jul-20 HSBC Bank plc (76)Sterling Euro 1,372 1,568 15-Jul-20 Royal Bank
of Scotland (67)Sterling Euro 4,206 4,781 15-Jul-20 State Street Bank (178)Sterling Euro 7,894 8,826 15-Jul-20 Royal Bank
of Scotland (186)
EUR (30,500)
Net EUR 325,665
03613-1A.indd 203 19/08/2020 19:01
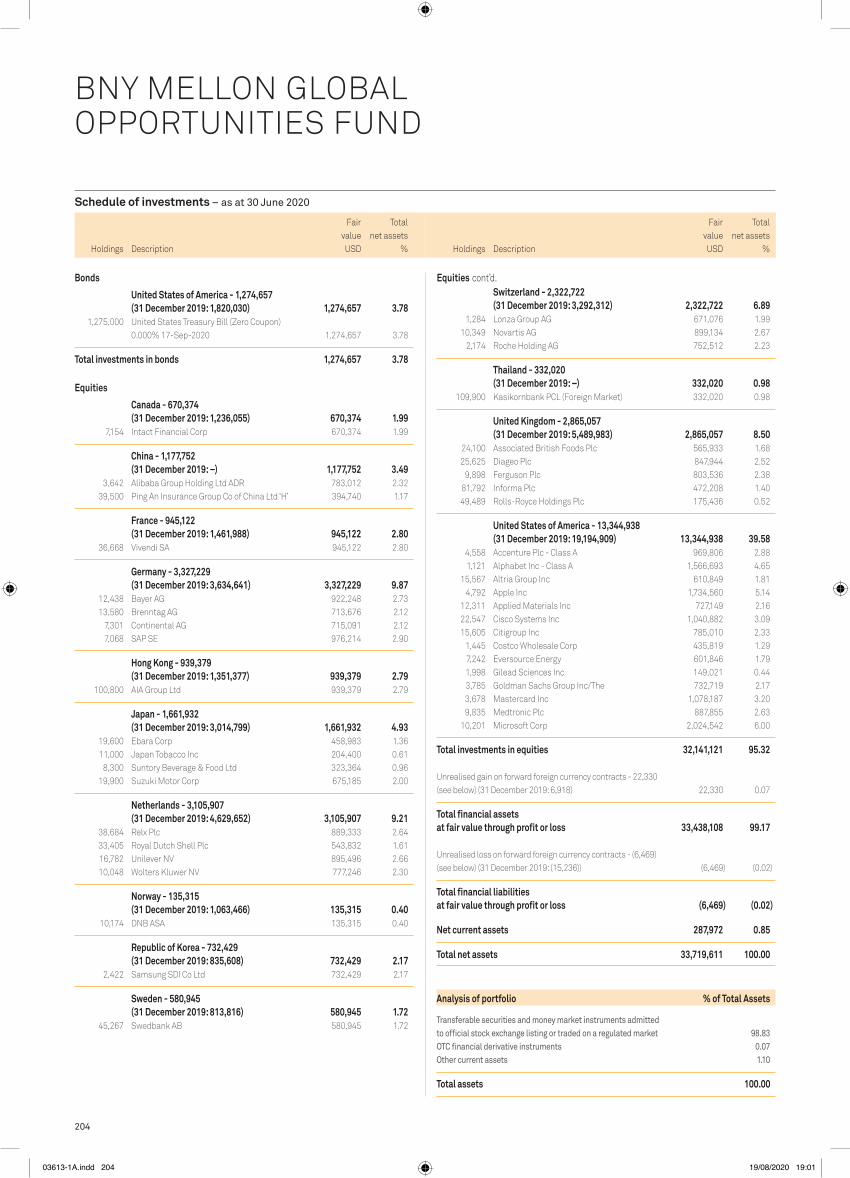
204
Schedule of investments – as at 30 June 2020
Holdings Description
Fair value
Total net assets
% Holdings Description
Fair value
Total net assets
%
Bonds
United States of America - 1,274,657 (31 December 2019: 1,820,030) 1,274,657 3.78
1,275,000 United States Treasury Bill (Zero Coupon) 0.000% 17-Sep-2020 1,274,657 3.78
Total investments in bonds 1,274,657 3.78
Equities
Canada - 670,374 (31 December 2019: 1,236,055) 670,374 1.99
7,154 Intact Financial Corp 670,374 1.99
China - 1,177,752 (31 December 2019: –) 1,177,752 3.49
3,642 Alibaba Group Holding Ltd ADR 783,012 2.32 39,500 Ping An Insurance Group Co of China Ltd ‘H’ 394,740 1.17
France - 945,122 (31 December 2019: 1,461,988) 945,122 2.80
36,668 Vivendi SA 945,122 2.80
Germany - 3,327,229 (31 December 2019: 3,634,641) 3,327,229 9.87
12,438 Bayer AG 922,248 2.73 13,580 Brenntag AG 713,676 2.12 7,301 Continental AG 715,091 2.12 7,068 SAP SE 976,214 2.90
Hong Kong - 939,379 (31 December 2019: 1,351,377) 939,379 2.79
100,800 AIA Group Ltd 939,379 2.79
Japan - 1,661,932 (31 December 2019: 3,014,799) 1,661,932 4.93
19,600 Ebara Corp 458,983 1.36 11,000 Japan Tobacco Inc 204,400 0.61 8,300 Suntory Beverage & Food Ltd 323,364 0.96 19,900 Suzuki Motor Corp 675,185 2.00
Netherlands - 3,105,907 (31 December 2019: 4,629,652) 3,105,907 9.21
38,684 Relx Plc 889,333 2.64 33,405 Royal Dutch Shell Plc 543,832 1.61 16,782 Unilever NV 895,496 2.66 10,048 Wolters Kluwer NV 777,246 2.30
Norway - 135,315 (31 December 2019: 1,063,466) 135,315 0.40
10,174 DNB ASA 135,315 0.40
Republic of Korea - 732,429 (31 December 2019: 835,608) 732,429 2.17
2,422 Samsung SDI Co Ltd 732,429 2.17
Sweden - 580,945 (31 December 2019: 813,816) 580,945 1.72
45,267 Swedbank AB 580,945 1.72
Switzerland - 2,322,722 (31 December 2019: 3,292,312) 2,322,722 6.89
1,284 Lonza Group AG 671,076 1.99 10,349 Novartis AG 899,134 2.67 2,174 Roche Holding AG 752,512 2.23
Thailand - 332,020 (31 December 2019: –) 332,020 0.98
109,900 Kasikornbank PCL (Foreign Market) 332,020 0.98
United Kingdom - 2,865,057 (31 December 2019: 5,489,983) 2,865,057 8.50
24,100 Associated British Foods Plc 565,933 1.68 25,625 Diageo Plc 847,944 2.52 9,898 Ferguson Plc 803,536 2.38 81,792 Informa Plc 472,208 1.40 49,489 Rolls-Royce Holdings Plc 175,436 0.52
United States of America - 13,344,938 (31 December 2019: 19,194,909) 13,344,938 39.58
4,558 Accenture Plc - Class A 969,806 2.88 1,121 Alphabet Inc - Class A 1,566,693 4.65 15,567 Altria Group Inc 610,849 1.81 4,792 Apple Inc 1,734,560 5.14 12,311 Applied Materials Inc 727,149 2.16 22,547 Cisco Systems Inc 1,040,882 3.09 15,605 Citigroup Inc 785,010 2.33 1,445 Costco Wholesale Corp 435,819 1.29 7,242 Eversource Energy 601,846 1.79 1,998 Gilead Sciences Inc 149,021 0.44 3,785 Goldman Sachs Group Inc/The 732,719 2.17 3,678 Mastercard Inc 1,078,187 3.20 9,835 Medtronic Plc 887,855 2.63 10,201 Microsoft Corp 2,024,542 6.00
Total investments in equities 32,141,121 95.32 Unrealised gain on forward foreign currency contracts - 22,330 (see below) (31 December 2019: 6,918) 22,330 0.07
Total financial assets at fair value through profit or loss 33,438,108 99.17 Unrealised loss on forward foreign currency contracts - (6,469) (see below) (31 December 2019: (15,236)) (6,469) (0.02)
Total financial liabilities at fair value through profit or loss (6,469) (0.02)
Net current assets 287,972 0.85
Total net assets 33,719,611 100.00
Analysis of portfolio % of Total Assets
Transferable securities and money market instruments admitted to official stock exchange listing or traded on a regulated market 98.83oTC financial derivative instruments 0.07other current assets 1.10
Total assets 100.00
FUND 30 – BNy MELLON GLOBAL OppORTUNITIES FUND
BNY MELLON GLOBAL OPPORTUNITIES FUND
Equities cont’d.
USDUSD
03613-1A.indd 204 19/08/2020 19:01

205
Schedule of investments – as at 30 June 2020
BNy MELLON GLOBAL OppORTUNITIES FUND
Forward foreign currency contractsUnrealised
Gain/(Loss)Buy Sell Amount (B) Amount (S)Settle
Date Counterparty
BNy Mellon Global Opportunities FundUS dollar Euro 2,695 2,404 01-Jul-20 Barclays Bank PLC - US dollar Euro 1,533,524 1,346,040 15-Sep-20 Canadian Imperial
Bank 22,206
USD 22,206
BNy Mellon Global Opportunities Fund EUR H (Hedged) Share ClassUS dollar Euro 402 357 15-Jul-20 The Bank of
New York Mellon 2US dollar Euro 20,084 17,836 15-Jul-20 The Bank of
New York Mellon 86US dollar Euro 12,233 10,884 15-Jul-20 The Bank of
New York Mellon 29
USD 117
EUR 104
Euro US dollar 1,521 1,713 15-Jul-20 The Bank of New York Mellon (7)
Euro US dollar 11,803 13,249 15-Jul-20 The Bank of New York Mellon (16)
Euro US dollar 219 249 15-Jul-20 The Bank of New York Mellon (4)
Euro US dollar 414,187 470,491 15-Jul-20 The Bank of New York Mellon (6,092)
Euro US dollar 447 505 15-Jul-20 The Bank of New York Mellon (4)
USD (6,123)
EUR (5,463)
Net USD (6,006)
Net EUR (5,359)
BNy Mellon Global Opportunities Fund EUR I (Hedged) Share ClassUS dollar Euro 1,133 1,006 15-Jul-20 The Bank of
New York Mellon 5US dollar Euro 681 606 15-Jul-20 The Bank of
New York Mellon 2
USD 7
EUR 6
Euro US dollar 670 752 15-Jul-20 The Bank of New York Mellon (1)
Euro US dollar 23,421 26,605 15-Jul-20 The Bank of New York Mellon (345)
USD (346)
EUR (309)
Net USD (339)
Net EUR (303)
03613-1A.indd 205 19/08/2020 19:01

206
Schedule of investments – as at 30 June 2020
Holdings Description
Fair value
Total net assets
% Holdings Description
Fair value
Total net assets
%
FUND 31 – BNy MELLON GLOBAL REAL RETURN FUND (EUR)
BNY MELLON GLOBAL REAL RETURN FUND (EUR)
Greece - 65,011,250 (31 December 2019: 140,380,980) 65,011,250 2.35
15,000,000 Hellenic Republic Treasury Bill (Zero Coupon) 0.000% 07-Aug-2020 14,996,250 0.54
50,000,000 Hellenic Republic Treasury Bill (Zero Coupon) 0.000% 28-Aug-2020 50,015,000 1.81
Hungary - 18,573,785 (31 December 2019: 65,344,287) 18,573,785 0.67
6,141,210,000 Hungary Government Bond 3.000% 21-Aug-2030 18,573,785 0.67
India - 4,270,799 (31 December 2019: 4,740,075) 4,270,799 0.15
360,000,000 National Highways Authority of India 7.300% 18-May-2022 4,270,799 0.15
Indonesia - 3,876,670 (31 December 2019: 4,701,634) 3,876,670 0.14
59,600,000,000 Indonesia Treasury Bond 8.250% 15-May-2036 3,876,670 0.14
Ireland - 12,382,671 (31 December 2019: 14,036,769) 12,382,671 0.45
8,175,000 AIB Group Plc FRN (Perpetual) 5.250% 09-Oct-2024 7,678,369 0.28 4,685,000 Allied Irish Banks Plc ‘EMTN’ FRN
4.125% 26-Nov-2025 4,704,302 0.17
Italy - 22,634,625 (31 December 2019: 17,713,102) 22,634,625 0.82
11,036,000 Intesa Sanpaolo SpA ‘144A’ FRN (Perpetual) 7.700% 17-Sep-2025 9,825,191 0.35
9,962,000 UniCredit SpA ‘EMTN’ FRN (Perpetual) 3.875% 03-Jun-2027 7,346,975 0.27
6,100,000 UniCredit SpA FRN (Perpetual) 8.000% 03-Jun-2024 5,462,459 0.20
Jersey - 4,562,952 (31 December 2019: 5,194,143) 4,562,952 0.16
4,325,000 CPUK Finance Ltd ‘REGS’ 4.250% 28-Aug-2022 4,562,952 0.16
Luxembourg - 17,417,619 (31 December 2019: 19,369,085) 17,417,619 0.63
11,242,000 SELP Finance Sarl 1.250% 25-Oct-2023 11,338,119 0.41 6,300,000 Summer BC Holdco B SARL ‘REGS’
5.750% 31-Oct-2026 6,079,500 0.22
Mexico - 26,692,282 (31 December 2019: 49,264,006) 26,692,282 0.96
183,791,200 Mexican Bonos 7.500% 03-Jun-2027 7,883,222 0.28 245,393,200 Mexican Bonos 7.750% 29-May-2031 10,674,081 0.39 175,610,500 Mexican Bonos 10.000% 05-Dec-2024 8,134,979 0.29
Netherlands - 19,600,768 (31 December 2019: 21,050,287) 19,600,768 0.71
15,841,000 ING Groep NV FRN (Perpetual) 4.875% 16-May-2029 13,320,123 0.48 4,086,000 ING Groep NV FRN (Perpetual) 6.750% 16-Apr-2024 3,739,145 0.14 2,600,000 Telefonica Europe BV FRN (Perpetual)
3.000% 04-Sep-2023 2,541,500 0.09
New Zealand - 20,558,322 (31 December 2019: 49,974,911) 20,558,322 0.74
10,290,000 New Zealand Government Bond 2.750% 15-Apr-2037 7,227,609 0.26 15,620,000 New Zealand Government Inflation Linked Bond
2.500% 20-Sep-2040 13,330,713 0.48
Collective investment schemes
Ireland - 488,316,694 (31 December 2019: 485,246,460) 488,316,694 17.63
2,130,036 Amundi Physical Gold ETC 134,303,893 4.85 470,916 Invesco Physical Gold ETC 72,090,966 2.60 11,819 iShares EUR Corp Bond 1-5yr UCITS ETF - ETF 1,299,558 0.05 15,678 iShares EUR High Yield Corp Bond
UCITS ETF - ETF 1,522,961 0.06 5,459,336 iShares Physical Gold ETC 168,543,282 6.08 967,841 iShares USD Corp Bond UCITS ETF - ETF 110,556,034 3.99
Jersey - 16,502,823 (31 December 2019: 13,547,168) 16,502,823 0.59
89,089 WisdomTree Physical Swiss Gold ETC 13,579,524 0.49 19,043 Xtrackers Physical Gold ETC 2,923,299 0.11
United Kingdom - 3,881,593 (31 December 2019: 80,693,662) 3,881,593 0.14
6,128,002 Riverstone Credit Opportunities Income Plc/The Fund 3,881,593 0.14
Total investments in collective investment schemes 508,701,110 18.36
Bonds
Australia - 111,667,693 (31 December 2019: 133,357,731) 111,667,693 4.03
37,994,000 Australia Government Bond 3.000% 21-Mar-2047 29,572,383 1.07 48,270,000 Australia Government Bond 3.250% 21-Jun-2039 37,945,365 1.37 8,186,000 Australia Government Bond 3.750% 21-Apr-2037 6,790,957 0.24 34,148,000 New South Wales Treasury Corp
2.750% 20-Nov-2025 31,556,110 1.14 4,398,000 Treasury Corp of Victoria 4.250% 20-Dec-2032 3,519,328 0.13 2,890,000 Treasury Corp of Victoria 5.500% 17-Nov-2026 2,283,550 0.08
Chile - 553,500 (31 December 2019: –) 553,500 0.02
609,000 VTR Comunicaciones SpA ‘REGS’ 5.125% 15-Jan-2028 553,500 0.02
Ecuador - 3,546,432 (31 December 2019: 8,958,062) 3,546,432 0.13
9,381,000 Ecuador Government International Bond ‘REGS’ 8.875% 23-Oct-2027 3,546,432 0.13
France - 37,097,821 (31 December 2019: 39,957,370) 37,097,821 1.34
2,192,000 Altice France SA/France ‘REGS’ 3.375% 15-Jan-2028 2,098,840 0.08 1,987,000 Banijay Entertainment SASU ‘REGS’
3.500% 01-Mar-2025 1,904,857 0.07 3,389,000 BNP Paribas SA FRN (Perpetual) 6.125% 17-Jun-2022 3,473,725 0.12 10,323,000 BNP Paribas SA ‘REGS’ FRN (Perpetual)
7.375% 19-Aug-2025 10,090,865 0.36 8,559,000 Societe Generale SA ‘144A’ FRN (Perpetual)
8.000% 29-Sep-2025 8,517,624 0.31 11,780,000 Societe Generale SA ‘REGS’ FRN (Perpetual)
7.875% 18-Dec-2023 11,011,910 0.40
Germany - 12,441,319 (31 December 2019: 20,175,294) 12,441,319 0.45
6,100,000 Infineon Technologies AG ‘EMTN’ FRN (Perpetual) 2.875% 01-Jan-2025 5,973,364 0.22
6,500,000 Infineon Technologies AG FRN (Perpetual) 3.625% 01-Jan-2028 6,467,955 0.23
Bonds cont’d.
EUR EUR
03613-1A.indd 206 19/08/2020 19:01

207
Schedule of investments – as at 30 June 2020
Holdings Description
Fair value
Total net assets
% Holdings Description
Fair value
Total net assets
%
BNy MELLON GLOBAL REAL RETURN FUND (EUR)
United States of America - 76,131,093 (31 December 2019: 248,430,550) 76,131,093 2.75
6,245,000 American Airlines Inc ‘144A’ 11.750% 15-Jul-2025 5,320,698 0.19 7,298,000 CCO Holdings LLC / CCO Holdings
Capital Corp ‘144A’ 5.500% 01-May-2026 6,762,120 0.25 3,765,000 CEMEX Finance LLC ‘REGS’ 6.000% 01-Apr-2024 3,343,152 0.12 18,735,000 Equinix Inc 2.875% 01-Feb-2026 19,203,937 0.69 4,781,000 General Motors Co 5.400% 02-Oct-2023 4,621,291 0.17 3,266,000 Laureate Education Inc ‘144A’
8.250% 01-May-2025 3,034,400 0.11 2,343,000 Refinitiv US Holdings Inc ‘REGS’ 6.875% 15-Nov-2026 2,509,095 0.09 5,512,000 Sprint Capital Corp 8.750% 15-Mar-2032 7,025,348 0.25 4,493,000 Sprint Corp 7.125% 15-Jun-2024 4,504,621 0.16 6,558,000 T-Mobile USA Inc 6.000% 01-Mar-2023 5,891,956 0.21 8,093,000 T-Mobile USA Inc 6.000% 15-Apr-2024 7,362,212 0.27 6,601,000 T-Mobile USA Inc ‘144A’ 3.875% 15-Apr-2030 6,552,263 0.24
Total investments in bonds 624,486,921 22.54
Equities
Australia - 7,425,050 (31 December 2019: 9,876,814) 7,425,050 0.27
385,281 Newcrest Mining Ltd 7,425,050 0.27
Canada - 25,319,280 (31 December 2019: 50,262,574) 25,319,280 0.91
365,537 Barrick Gold Corp 8,526,146 0.31 156,005 Intact Financial Corp 13,041,854 0.47 99,304 Wheaton Precious Metals Corp 3,751,280 0.13
Cayman Islands - 51,923,673 (31 December 2019: –) 51,923,673 1.87
94,977 Alibaba Group Holding Ltd ADR 18,217,114 0.66 109,867 New Oriental Education & Technology Group Inc ADR 12,867,141 0.46 258,378 Tencent Holdings Ltd 14,826,757 0.53 508,457 Tencent Music Entertainment Group ADR 6,012,661 0.22
China - 7,805,541 (31 December 2019: –) 7,805,541 0.28
875,500 Ping An Insurance Group Co of China Ltd ‘H’ 7,805,541 0.28
Denmark - 19,712,701 (31 December 2019: 21,493,565) 19,712,701 0.71
191,560 Orsted A/S ‘144A’ 19,712,701 0.71
France - 85,293,257 (31 December 2019: 67,494,682) 85,293,257 3.08
48,940 L’Oreal SA 14,004,181 0.50 32,740 LVMH Moet Hennessy Louis Vuitton SE 12,832,443 0.46 90,998 Sanofi 8,232,589 0.30 201,264 Thales SA 14,631,893 0.53 362,713 TOTAL SA 12,355,818 0.45 1,010,495 Vivendi SA 23,236,333 0.84
Germany - 165,288,276 (31 December 2019: 156,875,452) 165,288,276 5.97
570,147 Bayer AG 37,715,224 1.36 139,313 Continental AG 12,173,170 0.44 1,020,096 Deutsche Wohnen SE 40,752,835 1.47 331,199 LEG Immobilien AG 37,998,461 1.37 297,424 SAP SE 36,648,586 1.33
Norway - 7,610,036 (31 December 2019: 8,252,301) 7,610,036 0.27
8,671,000 DNB Bank ASA FRN (Perpetual) 4.875% 12-Nov-2024 7,610,036 0.27
philippines - 6,900,422 (31 December 2019: –) 6,900,422 0.25
7,360,000 Philippine Government International Bond 2.457% 05-May-2030 6,900,422 0.25
portugal - 15,773,140 (31 December 2019: 102,827,870) 15,773,140 0.57
12,944,507 Portugal Obrigacoes do Tesouro OT ‘144A’ 5.650% 15-Feb-2024 15,773,140 0.57
Qatar - 7,827,212 (31 December 2019: –) 7,827,212 0.28
8,051,000 Qatar Government International Bond ‘REGS’ 3.400% 16-Apr-2025 7,827,212 0.28
Spain - 31,606,399 (31 December 2019: 139,183,933) 31,606,399 1.14
6,600,000 Banco Bilbao Vizcaya Argentaria SA FRN (Perpetual) 5.875% 24-Sep-2023 6,454,272 0.23
8,600,000 Banco Bilbao Vizcaya Argentaria SA FRN (Perpetual) 6.000% 29-Mar-2024 8,519,246 0.31
8,400,000 Banco Santander SA FRN (Perpetual) 4.750% 19-Mar-2025 7,602,000 0.27
5,200,000 Banco Santander SA FRN (Perpetual) 5.250% 29-Sep-2023 4,914,000 0.18
4,037,000 Spain Government Bond ‘144A’ 0.250% 30-Jul-2024 4,116,881 0.15
United Arab Emirates - 8,470,865 (31 December 2019: –) 8,470,865 0.31
9,000,000 Abu Dhabi Government International Bond ‘REGS’ 2.500% 16-Apr-2025 8,470,865 0.31
United Kingdom - 89,279,246 (31 December 2019: 89,177,650) 89,279,246 3.22
689,000 Anglian Water Services Financing Plc 3.666% 30-Jul-2024 1,495,645 0.05
853,000 Anglian Water Services Financing Plc ‘EMTN’ 4.125% 28-Jul-2020 1,643,261 0.06
2,381,000 British Telecommunications Plc ‘EMTN’ 3.500% 25-Apr-2025 5,401,479 0.20
3,491,280 DWR Cymru Financing UK Plc ‘EMTN’ 1.859% 31-Mar-2048 7,359,005 0.27
1,680,779 High Speed Rail Finance 1 Plc ‘EMTN’ 1.566% 01-Nov-2038 2,678,434 0.10
20,000,000 Lloyds Banking Group Plc FRN (Perpetual) 4.947% 27-Jun-2025 19,518,200 0.70
3,615,550 Network Rail Infrastructure Finance Plc 1.750% 22-Nov-2027 5,388,505 0.19
4,390,000 Royal Bank of Scotland Group Plc FRN (Perpetual) 6.000% 29-Dec-2025 3,963,490 0.14
5,840,000 Tesco Plc ‘EMTN’ 3.322% 05-Nov-2025 12,934,423 0.47 290,000 Tesco Plc ‘EMTN’ 6.125% 24-Feb-2022 343,227 0.01 7,498,205 Tesco Property Finance 3 Plc
5.744% 13-Apr-2040 11,104,420 0.40 2,524,000 Vodafone Group Plc FRN 4.875% 03-Oct-2078 2,879,762 0.10 14,063,000 Vodafone Group Plc FRN 7.000% 04-Apr-2079 14,569,395 0.53
Bonds cont’d. Bonds cont’d.
EUR EUR
03613-1A.indd 207 19/08/2020 19:01

208
Schedule of investments – as at 30 June 2020
Holdings Description
Fair value
Total net assets
% Holdings Description
Fair value
Total net assets
%
BNy MELLON GLOBAL REAL RETURN FUND (EUR)
United States of America - 269,069,334 (31 December 2019: 242,224,800) 269,069,334 9.71
184,567 Abbott Laboratories 14,657,990 0.53 10,714 Alphabet Inc - Class A 13,358,652 0.48 6,629 Amazon.com Inc 15,858,312 0.57 54,073 Apple Inc 17,461,671 0.63 148,872 CMS Energy Corp 7,644,808 0.28 95,011 Ecolab Inc 16,574,570 0.60 214,534 Eversource Energy 15,905,820 0.57 86,169 Fidelity National Information Services Inc 10,084,048 0.36 1,360,084 General Electric Co 8,244,949 0.30 152,077 Goldman Sachs Group Inc/The 26,264,432 0.95 155,172 Lennar Corp 8,439,002 0.30 24,407 Lockheed Martin Corp 7,999,279 0.29 95,264 Mastercard Inc 24,914,035 0.90 194,378 Microsoft Corp 34,416,271 1.24 112,628 Newmont Corp 5,981,065 0.22 147,941 NIKE Inc 12,657,926 0.46 116,418 PepsiCo Inc 13,618,786 0.49 42,027 salesforce.com Inc 6,876,015 0.25 16,073 Sherwin-Williams Co/The 8,111,703 0.29
Total investments in equities 1,143,599,410 41.28
Equity investment instruments
Guernsey - 95,193,680 (31 December 2019: –) 95,193,680 3.43
8,538,675 Bluefield Solar Income Fund Ltd 12,572,110 0.45 3,392,646 Hipgnosis Songs Fund Ltd/The Fund 4,308,161 0.15 17,419,008 International Public Partnerships Ltd 32,130,593 1.16 6,750,834 JLEN Environmental Assets Group Ltd 8,757,319 0.32 2,313,427 NextEnergy Solar Fund Ltd 2,724,981 0.10 25,078,032 Renewables Infrastructure Group Ltd/The 34,700,516 1.25
Jersey - 10,929,432 (31 December 2019: –) 10,929,432 0.39
9,035,244 Foresight Solar Fund Ltd 10,929,432 0.39
Luxembourg - 11,308,189 (31 December 2019: –) 11,308,189 0.41
6,318,004 BBGI SICAV SA/Fund 11,308,189 0.41
United Kingdom - 69,223,902 (31 December 2019: –) 69,223,902 2.50
28,566,514 BioPharma Credit Plc/The Fund 25,001,095 0.90 23,074,011 Greencoat UK Wind Plc/Funds 36,196,343 1.31 6,917,083 Sdcl Energy Efficiency Income Trust Plc 8,026,464 0.29
Total investments in equity investment instruments 186,655,203 6.74
Index options - 58,053,694 (31 December 2019: 43,686,228)
1,969 CBOE S&P 500 Index Call 17-Dec-2020 3,000.000 43,775,037 1.58
1,340 CBOE S&P 500 Index Put 17-Dec-2020 2,650.000 14,278,657 0.51
Total index options 58,053,694 2.09
Guernsey - 4,115,044 (31 December 2019: 10,328,980) 4,115,044 0.15
11,056,054 Amedeo Air Four Plus Ltd 4,115,044 0.15
Hong Kong - 49,520,854 (31 December 2019: 69,992,286) 49,520,854 1.79
4,075,600 AIA Group Ltd 33,884,772 1.22 2,145,000 Link REIT (Units) (REIT) 15,636,082 0.57
India - 8,040,392 (31 December 2019: 21,447,819) 8,040,392 0.29
386,305 Housing Development Finance Corp Ltd 8,040,392 0.29
Ireland - 78,196,833 (31 December 2019: 58,716,029) 78,196,833 2.82
157,683 Accenture Plc - Class A 29,931,469 1.08 5,359,198 Greencoat Renewables Plc 6,457,834 0.23 161,326 Linde Plc 30,399,901 1.10 141,643 Medtronic Plc 11,407,629 0.41
Japan - 10,506,478 (31 December 2019: 19,754,742) 10,506,478 0.38
347,100 Suzuki Motor Corp 10,506,478 0.38
Jersey - 14,811,284 (31 December 2019: 32,967,223) 14,811,284 0.54
204,504 Ferguson Plc 14,811,284 0.54
Netherlands - 40,172,066 (31 December 2019: 18,524,344) 40,172,066 1.45
43,067 ASML Holding NV 13,939,711 0.50 551,042 Unilever NV 26,232,355 0.95
Republic of Korea - 41,785,063 (31 December 2019: 51,157,854) 41,785,063 1.51
583,059 Samsung Electronics Co Ltd - Preference 20,130,448 0.73 80,265 Samsung SDI Co Ltd 21,654,615 0.78
Switzerland - 93,997,779 (31 December 2019: 78,777,828) 93,997,779 3.39
338,527 Alcon Inc 17,300,115 0.62 30,018 Lonza Group AG 13,996,554 0.50 318,952 Novartis AG 24,722,040 0.89 24,729 Roche Holding AG 7,636,481 0.28 97,143 Zurich Insurance Group AG 30,342,589 1.10
United Kingdom - 170,616,505 (31 December 2019: 213,999,439) 170,616,505 6.16
785,782 Anglo American Plc 15,979,003 0.58 581,948 Associated British Foods Plc 12,191,715 0.44 1,533,478 BAE Systems Plc 8,191,214 0.30 1,036,389 Diageo Plc 30,595,594 1.10 5,295,643 Impact Healthcare Reit Plc (REIT) 5,472,504 0.20 2,061,819 Informa Plc 10,619,537 0.38 349,628 Persimmon Plc 8,818,284 0.32 2,472,978 Prudential Plc 33,095,164 1.19 1,195,048 Relx Plc 24,510,435 0.88 926,409 Royal Dutch Shell Plc 12,613,881 0.46 688,280 Travis Perkins Plc 8,529,174 0.31
Equities cont’d. Equities cont’d.
EUR EUR
03613-1A.indd 208 19/08/2020 19:01

209
Schedule of investments – as at 30 June 2020
BNy MELLON GLOBAL REAL RETURN FUND (EUR)
Forward foreign currency contracts cont’d.Unrealised
Gain/(Loss)Buy Sell Amount (B) Amount (S)Settle
Date Counterparty
BNy Mellon Global Real Return Fund (EUR)Sterling Euro 8,218,347 8,989,985 01-Jul-20 Royal Bank
of Scotland 6,646Euro Sterling 343,877,461 302,789,263 15-Jul-20 State Street Bank 12,482,645Euro Sterling 778,208 680,180 15-Jul-20 JPMorgan Chase
Bank 33,769Euro Sterling 1,793,340 1,569,876 15-Jul-20 HSBC Bank plc 75,152Euro Sterling 635,742 569,505 15-Jul-20 The Bank of
New York Mellon 12,434Euro Sterling 3,165,630 2,794,490 15-Jul-20 JPMorgan Chase
Bank 107,135Euro Sterling 5,641,263 4,995,663 15-Jul-20 JPMorgan Chase
Bank 173,643Euro Sterling 1,571,555 1,410,114 15-Jul-20 UBS AG 28,223Euro Sterling 804,163 701,056 15-Jul-20 HSBC Bank plc 36,875Euro Sterling 608,866 531,690 15-Jul-20 HSBC Bank plc 26,945Euro Sterling 788,575 699,346 15-Jul-20 Barclays Bank PLC 23,159Euro Sterling 1,672,936 1,461,918 15-Jul-20 Canadian Imperial
Bank 72,906Euro Sterling 2,783,979 2,434,282 15-Jul-20 Canadian Imperial
Bank 119,721Euro Sterling 253,287 221,760 15-Jul-20 Canadian Imperial
Bank 10,577Euro Sterling 332,494 289,795 15-Jul-20 JPMorgan Chase
Bank 15,321Euro Sterling 630,114 552,090 15-Jul-20 HSBC Bank plc 25,866Euro Sterling 1,295,762 1,130,752 15-Jul-20 HSBC Bank plc 58,184Euro Sterling 913,475 794,640 15-Jul-20 UBS AG 43,762Euro Sterling 3,539,618 3,106,820 15-Jul-20 Citigroup Global
Markets Limited 139,286Euro Sterling 2,427,395 2,195,600 15-Jul-20 The Bank of
New York Mellon 24,368Euro Sterling 2,369,833 2,123,043 15-Jul-20 State Street Bank 46,218Euro Sterling 695,700 607,530 15-Jul-20 Canadian Imperial
Bank 30,775Euro Sterling 928,550 833,133 15-Jul-20 The Bank of
New York Mellon 16,708Sterling Euro 17,581,000 19,224,833 15-Jul-20 Canadian Imperial
Bank 17,105Sterling Euro 12,558,000 13,711,403 15-Jul-20 UBS AG 32,995Swedish krona Euro 23,272,954 2,119,857 15-Jul-20 JPMorgan Chase
Bank 95,954Swedish krona Euro 44,236,584 4,039,095 15-Jul-20 JPMorgan Chase
Bank 172,655Swedish krona Euro 15,481,721 1,419,330 15-Jul-20 JPMorgan Chase
Bank 54,680Euro Canadian dollar 48,342,472 73,490,468 14-Aug-20 HSBC Bank plc 457,442Euro Hong Kong dollar 65,111,054 546,129,907 14-Aug-20 HSBC Bank plc 2,318,808Euro Hong Kong dollar 6,566,226 55,738,000 14-Aug-20 HSBC Bank plc 157,651Euro Korean won 38,792,665 51,376,618,060 14-Aug-20 State Street Bank 720,542Euro Swiss franc 82,309,113 86,560,987 14-Aug-20 Barclays Bank PLC 1,042,787Euro US dollar 11,018,902 12,106,534 14-Aug-20 Royal Bank
of Scotland 228,572Euro US dollar 4,402,124 4,806,477 14-Aug-20 State Street Bank 118,200Euro US dollar 1,468,466 1,592,342 14-Aug-20 Canadian Imperial
Bank 49,241Euro US dollar 11,013,374 12,248,000 14-Aug-20 Barclays Bank PLC 96,959Euro US dollar 8,236,260 9,186,000 14-Aug-20 The Bank of
New York Mellon 48,949Euro US dollar 2,436,091 2,675,060 14-Aug-20 JPMorgan Chase
Bank 51,859Euro US dollar 6,819,805 7,597,000 14-Aug-20 State Street Bank 48,739Euro US dollar 42,148,689 45,664,315 14-Aug-20 Barclays Bank PLC 1,448,930Euro US dollar 8,235,385 9,186,000 14-Aug-20 State Street Bank 48,073Euro US dollar 13,975,660 15,662,000 14-Aug-20 State Street Bank 16,410Euro US dollar 1,939,052 2,168,220 14-Aug-20 JPMorgan Chase
Bank 6,557Euro US dollar 13,471,707 14,588,000 14-Aug-20 UBS AG 469,693Euro US dollar 14,334,181 15,738,171 14-Aug-20 Royal Bank
of Scotland 307,040
Holdings Description
Underlying exposure
EUR
Fair value
EUR
Total net assets
%
Open futures contracts - 6,471,273 (31 December 2019: (3,246,464))
5,636 U.S. 10 Year Treasury Note Long Futures Contracts Exp Sep-2020 700,555,498 6,471,273 0.23
Total open futures contracts 6,471,273 0.23 Unrealised gain on forward foreign currency contracts - 60,260,433 (see below) (31 December 2019: 13,820,040) 60,260,433 2.18
Total financial assets at fair value through profit or loss 2,588,228,044 93.42
Commodity options - (1,355,741) (31 December 2019: –)
(16,524) iShares Physical Gold ETC Call 17-Jul-2020 35.250 (442,251) (0.02) (11,252) iShares Physical Gold ETC Call 21-Aug-2020 34.750 (913,490) (0.03)
Total commodity options (1,355,741) (0.05)
Index options - (17,575,416) (31 December 2019: (18,500,781))
(1,969) CBOE S&P 500 Index Call 17-Dec-2020 3,300.000 (15,633,942) (0.56) (558) CBOE S&P 500 Index Put 20-Aug-2020 2,650.000 (1,941,474) (0.07)
Total index options (17,575,416) (0.63) Unrealised loss on forward foreign currency contracts - (5,714,289) (see below) (31 December 2019: (31,765,155)) (5,714,289) (0.21)
Total financial liabilities at fair value through profit or loss (24,645,446) (0.89)
Net current assets 206,693,650 7.47
Total net assets 2,770,276,248 100.00
The counterparty for index options is UBS AG. The counterparty for futures contracts is UBS AG. The counterparty for commodity options is UBS AG.
Analysis of portfolio % of Total Assets
Transferable securities and money market instruments admitted to official stock exchange listing or traded on a regulated market 85.42Financial derivative instruments dealt in on a regulated market 2.24oTC financial derivative instruments 2.09other current assets 10.25
Total assets 100.00
03613-1A.indd 209 19/08/2020 19:01

210
Schedule of investments – as at 30 June 2020
BNy MELLON GLOBAL REAL RETURN FUND (EUR)
Forward foreign currency contracts cont’d.Unrealised
Gain/(Loss)Buy Sell Amount (B) Amount (S)Settle
Date Counterparty
BNy Mellon Global Real Return Fund (EUR) cont’d.Euro US dollar 7,323,705 7,921,388 14-Aug-20 State Street Bank 263,518Euro US dollar 3,165,158 3,436,131 14-Aug-20 JPMorgan Chase
Bank 102,599Euro US dollar 3,595,812 3,969,432 14-Aug-20 Royal Bank
of Scotland 57,931Euro US dollar 2,368,031 2,569,743 14-Aug-20 State Street Bank 77,666Euro US dollar 6,812,881 7,597,000 14-Aug-20 State Street Bank 41,815Euro US dollar 13,386,846 14,473,000 14-Aug-20 State Street Bank 487,329Euro US dollar 3,013,646 3,258,082 14-Aug-20 Barclays Bank PLC 109,778Euro US dollar 2,017,005 2,261,589 14-Aug-20 HSBC Bank plc 1,293Euro US dollar 1,014,602,903 1,100,000,000 14-Aug-20 Barclays Bank PLC 34,193,253Euro US dollar 6,367,399 7,021,430 14-Aug-20 Canadian Imperial
Bank 109,328Euro US dollar 10,816,765 11,989,000 14-Aug-20 The Bank of
New York Mellon 131,192Euro US dollar 6,816,345 7,363,000 14-Aug-20 JPMorgan Chase
Bank 253,840Euro US dollar 4,888,504 5,443,256 14-Aug-20 Royal Bank
of Scotland 37,030Euro US dollar 1,671,443 1,809,987 14-Aug-20 Barclays Bank PLC 58,234Euro US dollar 3,474,445 3,765,471 14-Aug-20 Royal Bank
of Scotland 118,350Hong Kong dollar Euro 3,632,169 416,009 14-Aug-20 Citigroup Global
Markets Limited 1,606Korean won Euro 7,478,852,000 5,512,735 14-Aug-20 State Street Bank 29,393New Zealand dollar Euro 16,887,273 9,468,754 14-Aug-20 State Street Bank 170,323New Zealand dollar Euro 5,623,124 3,116,530 14-Aug-20 Citigroup Global
Markets Limited 93,090New Zealand dollar Euro 10,019,853 5,557,952 14-Aug-20 Citigroup Global
Markets Limited 161,274Norwegian krone Euro 148,923,000 13,461,966 14-Aug-20 State Street Bank 177,703US dollar Euro 1,164,929 1,029,849 14-Aug-20 State Street Bank 8,431US dollar Euro 1,301,048 1,147,294 14-Aug-20 HSBC Bank plc 12,306US dollar Euro 62,291,602 54,948,824 14-Aug-20 Citigroup Global
Markets Limited 570,529US dollar Euro 31,531,587 27,843,599 14-Aug-20 Citigroup Global
Markets Limited 259,921US dollar Euro 1,747,099 1,544,459 14-Aug-20 State Street Bank 12,698US dollar Euro 704,500 627,716 14-Aug-20 Citigroup Global
Markets Limited 192US dollar Euro 5,115,480 4,504,044 14-Aug-20 State Street Bank 55,289US dollar Euro 3,218,352 2,829,538 14-Aug-20 State Street Bank 38,921US dollar Euro 6,523,503 5,763,186 14-Aug-20 HSBC Bank plc 51,091US dollar Euro 1,821,580 1,612,771 14-Aug-20 State Street Bank 10,769US dollar Euro 2,522,591 2,246,373 14-Aug-20 Citigroup Global
Markets Limited 1,966US dollar Euro 3,488,453 3,107,025 14-Aug-20 Royal Bank
of Scotland 2,168US dollar Euro 251,280 223,870 14-Aug-20 Barclays Bank PLC 91US dollar Euro 1,929,942 1,710,724 14-Aug-20 UBS AG 9,399US dollar Euro 238,366 210,088 14-Aug-20 Citigroup Global
Markets Limited 2,363US dollar Euro 5,710,602 5,012,860 14-Aug-20 State Street Bank 76,894Euro Australian dollar 104,422,925 170,000,000 15-Sep-20 Royal Bank
of Scotland 700,697Euro Australian dollar 13,365,531 21,761,410 15-Sep-20 The Bank of
New York Mellon 88,226
EUR 60,198,655
Euro Hungarian forint 48,369,672 17,716,582,258 15-Jul-20 State Street Bank (1,320,808)Euro Sterling 8,988,156 8,218,347 15-Jul-20 Royal Bank
of Scotland (6,607)Euro Swedish krona 9,977,025 109,791,497 15-Jul-20 JPMorgan Chase
Bank (476,187)Hungarian forint Euro 3,502,172,119 9,988,512 15-Jul-20 State Street Bank (165,816)Hungarian forint Euro 375,577,761 1,065,883 15-Jul-20 UBS AG (12,483)
Forward foreign currency contracts cont’d.Unrealised
Gain/(Loss)Buy Sell Amount (B) Amount (S)Settle
Date Counterparty
BNy Mellon Global Real Return Fund (EUR) cont’d.Hungarian forint Euro 2,271,492,944 6,435,757 15-Jul-20 Canadian Imperial
Bank (64,800)Hungarian forint Euro 7,121,426,939 20,378,958 15-Jul-20 Barclays Bank PLC (405,178)Hungarian forint Euro 750,243,768 2,146,998 15-Jul-20 JPMorgan Chase
Bank (42,757)Hungarian forint Euro 1,195,600,888 3,369,526 15-Jul-20 State Street Bank (16,171)Hungarian forint Euro 750,377,983 2,138,545 15-Jul-20 JPMorgan Chase
Bank (33,927)Hungarian forint Euro 1,749,689,856 4,931,984 15-Jul-20 UBS AG (24,552)Sterling Euro 625,342 692,354 15-Jul-20 Barclays Bank PLC (7,933)Sterling Euro 297,570 338,140 15-Jul-20 JPMorgan Chase
Bank (12,457)Sterling Euro 4,797,477 5,431,526 15-Jul-20 JPMorgan Chase
Bank (180,814)Sterling Euro 1,178,340 1,350,548 15-Jul-20 JPMorgan Chase
Bank (60,886)Sterling Euro 352,247 402,631 15-Jul-20 State Street Bank (17,107)Sterling Euro 697,620 791,135 15-Jul-20 State Street Bank (27,608)Sterling Euro 5,607,214 6,429,674 15-Jul-20 State Street Bank (292,727)Sterling Euro 207,849 237,926 15-Jul-20 JPMorgan Chase
Bank (10,440)Sterling Euro 127,231 144,729 15-Jul-20 State Street Bank (5,478)Sterling Euro 204,585 229,081 15-Jul-20 Citigroup Global
Markets Limited (5,168)Sterling Euro 728,763 811,241 15-Jul-20 State Street Bank (13,628)Sterling Euro 164,150 187,854 15-Jul-20 JPMorgan Chase
Bank (8,196)Sterling Euro 4,317,254 4,903,518 15-Jul-20 JPMorgan Chase
Bank (178,398)Canadian dollar Euro 8,703,248 5,727,923 14-Aug-20 State Street Bank (57,047)Canadian dollar Euro 5,217,781 3,423,465 14-Aug-20 JPMorgan Chase
Bank (23,656)Canadian dollar Euro 18,881,706 12,382,841 14-Aug-20 State Street Bank (79,870)Canadian dollar Euro 426,231 281,600 14-Aug-20 State Street Bank (3,875)Canadian dollar Euro 3,488,927 2,289,048 14-Aug-20 JPMorgan Chase
Bank (15,728)Canadian dollar Euro 5,167,365 3,375,891 14-Aug-20 UBS AG (8,932)Canadian dollar Euro 8,130,994 5,320,437 14-Aug-20 State Street Bank (22,432)Canadian dollar Euro 3,771,924 2,477,185 14-Aug-20 State Street Bank (19,469)Euro Hong Kong dollar 1,459,281 12,828,326 14-Aug-20 The Bank of
New York Mellon (15,678)Euro Japanese yen 10,907,496 1,323,749,000 14-Aug-20 UBS AG (49,297)Euro New Zealand dollar 34,728,247 62,207,671 14-Aug-20 JPMorgan Chase
Bank (779,233)Euro Swiss franc 4,533,203 4,840,580 14-Aug-20 State Street Bank (11,294)Euro Swiss franc 6,853,481 7,335,000 14-Aug-20 UBS AG (32,860)Euro US dollar 4,053,012 4,581,613 14-Aug-20 State Street Bank (30,495)Euro US dollar 7,092,130 8,001,483 14-Aug-20 Royal Bank
of Scotland (39,444)Euro US dollar 350,784 397,533 14-Aug-20 Royal Bank
of Scotland (3,530)Euro US dollar 1,679,854 1,896,814 14-Aug-20 UBS AG (10,741)Euro US dollar 7,046,772 7,934,211 14-Aug-20 JPMorgan Chase
Bank (24,844)Euro US dollar 46,639,137 52,514,204 14-Aug-20 State Street Bank (165,801)Euro US dollar 1,990,595 2,255,829 14-Aug-20 State Street Bank (19,983)Euro US dollar 5,622,058 6,362,000 14-Aug-20 The Bank of
New York Mellon (48,275)Euro US dollar 2,048,507 2,303,337 14-Aug-20 State Street Bank (4,414)Euro US dollar 1,849,636 2,084,465 14-Aug-20 State Street Bank (8,209)Euro US dollar 8,389,648 9,429,000 14-Aug-20 UBS AG (14,245)Korean won Euro 7,239,744,000 5,388,719 14-Aug-20 State Street Bank (23,780)US dollar Euro 1,930,706 1,721,221 14-Aug-20 Citigroup Global
Markets Limited (418)US dollar Euro 9,216,690 8,460,143 14-Aug-20 JPMorgan Chase
Bank (245,478)US dollar Euro 720,747 665,529 14-Aug-20 Canadian Imperial
Bank (23,141)
03613-1A.indd 210 19/08/2020 19:01

211
Schedule of investments – as at 30 June 2020
BNy MELLON GLOBAL REAL RETURN FUND (EUR)
Forward foreign currency contracts cont’d.Unrealised
Gain/(Loss)Buy Sell Amount (B) Amount (S)Settle
Date Counterparty
BNy Mellon Global Real Return Fund (EUR) cont’d.US dollar Euro 534,595 493,446 14-Aug-20 State Street Bank (16,972)US dollar Euro 11,531,840 10,470,891 14-Aug-20 HSBC Bank plc (192,776)US dollar Euro 1,844,431 1,688,164 14-Aug-20 JPMorgan Chase
Bank (44,257)US dollar Euro 433,986 394,737 14-Aug-20 Royal Bank
of Scotland (7,933)US dollar Euro 764,640 685,742 14-Aug-20 State Street Bank (4,232)US dollar Euro 1,936,300 1,756,688 14-Aug-20 State Street Bank (30,900)US dollar Euro 5,302,584 4,905,347 14-Aug-20 JPMorgan Chase
Bank (179,252)US dollar Euro 4,362,055 3,920,060 14-Aug-20 State Street Bank (32,241)Australian dollar Euro 877,845 538,589 15-Sep-20 JPMorgan Chase
Bank (2,989)
EUR (5,683,847)
Net EUR 54,514,808
BNy Mellon Global Real Return Fund (EUR) CHF W (Acc) (Hedged) Share ClassEuro Swiss franc 7,691 8,180 15-Jul-20 The Bank of
New York Mellon 13Swiss franc Euro 1,402,856 1,303,579 15-Jul-20 The Bank of
New York Mellon 13,190
EUR 13,203
CHF 14,067
Swiss franc Euro 8,180 7,690 01-Jul-20 The Bank of New York Mellon (12)
Euro Swiss franc 14,719 15,712 15-Jul-20 The Bank of New York Mellon (30)
EUR (42)
CHF (45)
Net EUR 13,161
Net CHF 14,022
BNy Mellon Global Real Return Fund (EUR) SGD H (Acc) (Hedged) Share ClassSingapore dollar Euro 4,714,160 2,990,172 15-Jul-20 The Bank of
New York Mellon 18,999
EUR 18,999
SGD 29,756
Forward foreign currency contracts cont’d.Unrealised
Gain/(Loss)Buy Sell Amount (B) Amount (S)Settle
Date Counterparty
BNy Mellon Global Real Return Fund (EUR) Sterling H (Acc) (Hedged) Share ClassSterling Euro 12,000 13,257 15-Jul-20 The Bank of
New York Mellon (123)Sterling Euro 19,000 21,181 15-Jul-20 The Bank of
New York Mellon (386)Sterling Euro 1,087,109 1,219,656 15-Jul-20 The Bank of
New York Mellon (29,844)
EUR (30,353)
GBp (27,727)
BNy Mellon Global Real Return Fund (EUR) USD H (Acc) (Hedged) Share ClassEuro US dollar 55,312 62,006 15-Jul-20 The Bank of
New York Mellon 10US dollar Euro 2,455,568 2,162,442 15-Jul-20 The Bank of
New York Mellon 27,624
EUR 27,634
USD 30,975
Euro US dollar 12,158 13,684 15-Jul-20 The Bank of New York Mellon (47)
EUR (47)
USD (53)
Net EUR 27,587
Net USD 30,922
BNy Mellon Global Real Return Fund (EUR) USD W (Acc) (Hedged) Share ClassUS dollar Euro 172,612 152,007 15-Jul-20 The Bank of
New York Mellon 1,942
EUR 1,942
USD 2,177
03613-1A.indd 211 19/08/2020 19:01

212
Schedule of investments – as at 30 June 2020
Holdings Description
Fair value
Total net assets
% Holdings Description
Fair value
Total net assets
%
FUND 32 – BNy MELLON GLOBAL REAL RETURN FUND (GBp)
BNY MELLON GLOBAL REAL RETURN FUND (GBP)
Ireland - 171,599 (31 December 2019: 184,320) 171,599 0.27
200,000 AIB Group Plc FRN (Perpetual) 5.250% 09-Oct-2024 171,599 0.27
Italy - 517,588 (31 December 2019: 329,759) 517,588 0.83
200,000 Intesa Sanpaolo SpA ‘144A’ FRN (Perpetual) 7.700% 17-Sep-2025 162,654 0.26
284,000 UniCredit SpA ‘EMTN’ FRN (Perpetual) 3.875% 03-Jun-2027 191,331 0.31
200,000 UniCredit SpA FRN (Perpetual) 8.000% 03-Jun-2024 163,603 0.26
Jersey - 96,375 (31 December 2019: 102,080) 96,375 0.15
100,000 CPUK Finance Ltd ‘REGS’ 4.250% 28-Aug-2022 96,375 0.15
Luxembourg - 175,422 (31 December 2019: 176,499) 175,422 0.28
199,000 Summer BC Holdco B SARL ‘REGS’ 5.750% 31-Oct-2026 175,422 0.28
Mexico - 837,716 (31 December 2019: 1,060,166) 837,716 1.34
5,484,600 Mexican Bonos 7.500% 03-Jun-2027 214,896 0.35 8,233,300 Mexican Bonos 7.750% 29-May-2031 327,150 0.52 6,987,100 Mexican Bonos 10.000% 05-Dec-2024 295,670 0.47
Netherlands - 473,355 (31 December 2019: 314,308) 473,355 0.76
500,000 ING Groep NV FRN (Perpetual) 4.875% 16-May-2029 384,061 0.62
100,000 Telefonica Europe BV FRN (Perpetual) 3.000% 04-Sep-2023 89,294 0.14
New Zealand - 555,152 (31 December 2019: 1,348,423) 555,152 0.89
395,000 New Zealand Government Bond 2.750% 15-Apr-2037 253,443 0.41
387,000 New Zealand Government Inflation Linked Bond 2.500% 20-Sep-2040 301,709 0.48
Norway - 188,404 (31 December 2019: 178,106) 188,404 0.30
235,000 DNB Bank ASA FRN (Perpetual) 4.875% 12-Nov-2024 188,404 0.30
Qatar - 189,165 (31 December 2019: –) 189,165 0.30
213,000 Qatar Government International Bond ‘REGS’ 3.400% 16-Apr-2025 189,165 0.30
Spain - 524,989 (31 December 2019: 552,613) 524,989 0.84
200,000 Banco Bilbao Vizcaya Argentaria SA FRN (Perpetual) 5.875% 24-Sep-2023 178,664 0.29
200,000 Banco Bilbao Vizcaya Argentaria SA FRN (Perpetual) 6.000% 29-Mar-2024 180,983 0.29
200,000 Banco Santander SA FRN (Perpetual) 4.750% 19-Mar-2025 165,342 0.26
Collective investment schemes
Ireland - 11,242,956 (31 December 2019: 9,083,500) 11,242,956 18.00
54,500 Amundi Physical Gold ETC 3,139,083 5.02 12,138 Invesco Physical Gold ETC 1,697,419 2.72 77,367 iShares China CNY Bond UCITS ETF - ETF 323,200 0.52 126,160 iShares Physical Gold ETC 3,557,934 5.70 24,201 iShares USD Corp Bond UCITS ETF - ETF 2,525,319 4.04
Jersey - 597,132 (31 December 2019: 294,156) 597,132 0.96
3,793 WisdomTree Physical Swiss Gold ETC 528,139 0.85 492 Xtrackers Physical Gold ETC 68,993 0.11
Total investments in collective investment schemes 11,840,088 18.96
Bonds
Australia - 2,838,236 (31 December 2019: 2,911,183) 2,838,236 4.55
1,046,000 Australia Government Bond 3.000% 21-Mar-2047 743,717 1.19 1,278,000 Australia Government Bond 3.250% 21-Jun-2039 917,734 1.47 240,000 Australia Government Bond 3.750% 21-Apr-2037 181,876 0.29 828,100 New South Wales Treasury Corp 2.750% 20-Nov-2025 699,046 1.12 149,000 Treasury Corp of Victoria 4.250% 20-Dec-2032 108,917 0.18 259,000 Treasury Corp of Victoria 5.500% 17-Nov-2026 186,946 0.30
Ecuador - 72,867 (31 December 2019: 147,017) 72,867 0.12
211,000 Ecuador Government International Bond ‘REGS’ 8.875% 23-Oct-2027 72,867 0.12
France - 946,618 (31 December 2019: 937,410) 946,618 1.52
200,000 BNP Paribas SA FRN (Perpetual) 6.125% 17-Jun-2022 187,266 0.30
206,000 BNP Paribas SA ‘REGS’ FRN (Perpetual) 7.375% 19-Aug-2025 183,948 0.30
400,000 Societe Generale SA ‘144A’ FRN (Perpetual) 8.000% 29-Sep-2025 363,630 0.58
248,000 Societe Generale SA ‘REGS’ FRN (Perpetual) 7.875% 18-Dec-2023 211,774 0.34
Germany - 180,352 (31 December 2019: 295,127) 180,352 0.29
100,000 Infineon Technologies AG ‘EMTN’ FRN (Perpetual) 2.875% 01-Jan-2025 89,453 0.14
100,000 Infineon Technologies AG FRN (Perpetual) 3.625% 01-Jan-2028 90,899 0.15
Hungary - 511,258 (31 December 2019: 1,367,781) 511,258 0.82
185,050,000 Hungary Government Bond 3.000% 21-Aug-2030 511,258 0.82
India - 108,371 (31 December 2019: 106,027) 108,371 0.17
10,000,000 National Highways Authority of India 7.300% 18-May-2022 108,371 0.17
Indonesia - 143,910 (31 December 2019: 138,776) 143,910 0.23
2,422,000,000 Indonesia Treasury Bond 8.250% 15-May-2036 143,910 0.23
Bonds cont’d.
GBP GBP
03613-1A.indd 212 19/08/2020 19:01

213
Schedule of investments – as at 30 June 2020
Holdings Description
Fair value
Total net assets
% Holdings Description
Fair value
Total net assets
%
BNy MELLON GLOBAL REAL RETURN FUND (GBp)
United Kingdom - 7,334,752 (31 December 2019: 12,442,014) 7,334,752 11.75
34,000 Anglian Water Services Financing Plc 3.666% 30-Jul-2024 67,421 0.11
37,000 Anglian Water Services Financing Plc ‘EMTN’ 4.125% 28-Jul-2020 65,112 0.10
45,000 British Telecommunications Plc ‘EMTN’ 3.500% 25-Apr-2025 93,255 0.15
276,000 Lloyds Banking Group Plc FRN (Perpetual) 4.947% 27-Jun-2025 246,050 0.39
88,393 Network Rail Infrastructure Finance Plc 1.750% 22-Nov-2027 120,341 0.19
50,000 Scotland Gas Networks Plc 2.127% 21-Oct-2022 82,237 0.13 139,000 Tesco Plc ‘EMTN’ 3.322% 05-Nov-2025 281,225 0.45 50,000 Tesco Plc ‘EMTN’ 6.125% 24-Feb-2022 54,058 0.09 185,046 Tesco Property Finance 3 Plc 5.744% 13-Apr-2040 250,335 0.40 3,597,700 United Kingdom Gilt 2.000% 22-Jul-2020 3,601,855 5.77 2,000,000 United Kingdom Gilt 3.750% 07-Sep-2020 2,013,910 3.23 118,000 Vodafone Group Plc FRN 4.875% 03-Oct-2078 122,986 0.20 355,000 Vodafone Group Plc FRN 7.000% 04-Apr-2079 335,967 0.54
United States of America - 1,163,861 (31 December 2019: 2,946,387) 1,163,860 1.86
199,000 CCO Holdings LLC / CCO Holdings Capital Corp ‘144A’ 5.500% 01-May-2026 168,437 0.27
123,000 General Motors Co 5.400% 02-Oct-2023 108,606 0.17 99,000 Laureate Education Inc ‘144A’ 8.250% 01-May-2025 84,023 0.13 150,000 Sprint Capital Corp 8.750% 15-Mar-2032 174,644 0.28 131,000 Sprint Corp 7.125% 15-Jun-2024 119,977 0.19 182,000 T-Mobile USA Inc 6.000% 01-Mar-2023 149,370 0.24 231,000 T-Mobile USA Inc 6.000% 15-Apr-2024 191,962 0.31 184,000 T-Mobile USA Inc ‘144A’ 3.875% 15-Apr-2030 166,841 0.27
Total investments in bonds 17,029,989 27.27
Equities
Australia - 196,168 (31 December 2019: 190,842) 196,168 0.31
11,143 Newcrest Mining Ltd 196,168 0.31
Canada - 621,692 (31 December 2019: 924,394) 621,692 1.00
9,684 Barrick Gold Corp 206,339 0.33 3,997 Intact Financial Corp 305,239 0.49 3,191 Wheaton Precious Metals Corp 110,114 0.18
Cayman Islands - 1,125,624 (31 December 2019: –) 1,125,624 1.80
2,259 Alibaba Group Holding Ltd ADR 395,806 0.63 2,617 New Oriental Education & Technology Group Inc ADR 279,977 0.45 5,904 Tencent Holdings Ltd 309,486 0.50 12,993 Tencent Music Entertainment Group ADR 140,355 0.22
China - 183,246 (31 December 2019: –) 183,246 0.29
22,500 Ping An Insurance Group Co of China Ltd ‘H’ 183,246 0.29
Denmark - 453,945 (31 December 2019: 410,886) 453,945 0.73
4,829 Orsted A/S ‘144A’ 453,945 0.73
France - 1,907,593 (31 December 2019: 1,285,255) 1,907,593 3.06
1,129 L’Oreal SA 295,116 0.47 809 LVMH Moet Hennessy Louis Vuitton SE 289,657 0.47 2,059 Sanofi 170,163 0.27 4,960 Thales SA 329,398 0.53 9,273 TOTAL SA 288,558 0.46 25,455 Vivendi SA 534,701 0.86
Germany - 3,642,219 (31 December 2019: 2,942,135) 3,642,219 5.83
13,938 Bayer AG 842,238 1.35 3,523 Continental AG 281,209 0.45 24,392 Deutsche Wohnen SE 890,162 1.43 7,536 LEG Immobilien AG 789,810 1.26 7,452 SAP SE 838,800 1.34
Guernsey - 79,750 (31 December 2019: 196,147) 79,750 0.13
234,558 Amedeo Air Four Plus Ltd 79,750 0.13
Hong Kong - 1,108,494 (31 December 2019: 1,444,304) 1,108,494 1.78
100,800 AIA Group Ltd 765,558 1.23 51,500 Link REIT (Units) (REIT) 342,936 0.55
India - 190,758 (31 December 2019: 410,940) 190,758 0.31
10,033 Housing Development Finance Corp Ltd 190,758 0.31
Ireland - 1,723,383 (31 December 2019: 1,182,912) 1,723,383 2.76
3,972 Accenture Plc - Class A 688,743 1.10 118,479 Greencoat Renewables Plc 130,416 0.21 3,728 Linde Plc 641,724 1.03 3,568 Medtronic Plc 262,500 0.42
Japan - 251,622 (31 December 2019: 363,296) 251,622 0.40
9,100 Suzuki Motor Corp 251,622 0.40
Jersey - 315,517 (31 December 2019: 610,783) 315,517 0.51
4,769 Ferguson Plc 315,517 0.51
Netherlands - 914,872 (31 December 2019: 358,411) 914,872 1.47
1,051 ASML Holding NV 310,754 0.50 13,892 Unilever NV 604,118 0.97
Republic of Korea - 980,444 (31 December 2019: 997,138) 980,444 1.57
15,271 Samsung Electronics Co Ltd - Preference 481,629 0.77 2,024 Samsung SDI Co Ltd 498,815 0.80
Switzerland - 2,075,856 (31 December 2019: 1,485,156) 2,075,856 3.32
8,172 Alcon Inc 381,495 0.61 751 Lonza Group AG 319,878 0.51 7,288 Novartis AG 516,026 0.83 559 Roche Holding AG 157,689 0.25 2,456 Zurich Insurance Group AG 700,768 1.12
Bonds cont’d. Equities cont’d.
GBPGBP
03613-1A.indd 213 19/08/2020 19:01

214
Schedule of investments – as at 30 June 2020
Holdings Description
Fair value
Total net assets
% Holdings Description
Fair value
Total net assets
%
BNy MELLON GLOBAL REAL RETURN FUND (GBp)
United Kingdom - 3,717,519 (31 December 2019: 4,415,962) 3,717,519 5.95
17,966 Anglo American Plc 333,737 0.53 13,505 Associated British Foods Plc 258,452 0.41 34,603 BAE Systems Plc 168,845 0.27 23,961 Diageo Plc 646,168 1.04 232,631 Impact Healthcare Reit Plc (REIT) 219,604 0.35 55,146 Informa Plc 259,462 0.42 8,408 Persimmon Plc 193,720 0.31 54,204 Prudential Plc 662,644 1.06 27,455 Relx Plc 514,389 0.82 22,165 Royal Dutch Shell Plc 275,688 0.44 16,326 Travis Perkins Plc 184,810 0.30
United States of America - 6,264,757 (31 December 2019: 4,786,242) 6,264,757 10.03
5,030 Abbott Laboratories 364,916 0.58 270 Alphabet Inc - Class A 307,524 0.49 171 Amazon.com Inc 373,689 0.60 1,253 Apple Inc 369,625 0.59 3,881 CMS Energy Corp 182,055 0.29 2,546 Ecolab Inc 405,725 0.65 5,331 Eversource Energy 361,055 0.58 2,071 Fidelity National Information Services Inc 221,395 0.35 37,558 General Electric Co 207,984 0.33 3,777 Goldman Sachs Group Inc/The 595,876 0.95 3,961 Lennar Corp 196,783 0.32 617 Lockheed Martin Corp 184,725 0.30 2,400 Mastercard Inc 573,365 0.92 5,043 Microsoft Corp 815,662 1.31 2,930 Newmont Corp 142,136 0.23 3,928 NIKE Inc 307,008 0.49 3,075 PepsiCo Inc 328,600 0.53 1,038 salesforce.com Inc 155,135 0.25 372 Sherwin-Williams Co/The 171,499 0.27
Total investments in equities 25,753,459 41.25
Equity investment instruments
Guernsey - 2,310,706 (31 December 2019: –) 2,310,706 3.70
173,475 Bluefield Solar Income Fund Ltd 233,324 0.37 183,415 Hipgnosis Songs Fund Ltd/The Fund 212,761 0.34 422,482 International Public Partnerships Ltd 711,882 1.14 166,386 JLEN Environmental Assets Group Ltd 197,168 0.32 67,546 NextEnergy Solar Fund Ltd 72,680 0.12 698,490 Renewables Infrastructure Group Ltd/The 882,891 1.41
Jersey - 235,994 (31 December 2019: –) 235,994 0.38
213,569 Foresight Solar Fund Ltd 235,994 0.38
Luxembourg - 258,392 (31 December 2019: –) 258,392 0.41
158,038 BBGI SICAV SA/Fund 258,392 0.41
United Kingdom - 1,917,729 (31 December 2019: –) 1,917,729 3.07
759,661 BioPharma Credit Plc/The Fund 607,332 0.97 499,912 Greencoat UK Wind Plc/Funds 716,374 1.15 560,399 Sdcl Energy Efficiency Income Trust Plc 594,023 0.95
Total investments in equity investment instruments 4,722,821 7.56
Index options - 1,316,353 (31 December 2019: 852,453)
49 CBOE S&P 500 Index Call 17-Dec-2020 3,000.000 995,134 1.59 33 CBOE S&P 500 Index Put 17-Dec-2020 2,650.000 321,219 0.52
Total index options 1,316,353 2.11
Holdings Description
Underlying exposure
GBP
Fair value
GBP
Total net assets
%
Open futures contracts - 147,361 (31 December 2019: (66,559))
138 U.S. 10 Year Treasury Note Long Futures Contracts Exp Sep-2020 15,669,504 147,361 0.24
Total open futures contracts 147,361 0.24 Unrealised gain on forward foreign currency contracts - 210,593 (see below) (31 December 2019: 1,481,737) 210,593 0.34
Total financial assets at fair value through profit or loss 61,020,664 97.73
Commodity options - (30,370) (31 December 2019: –)
(408) iShares Physical Gold ETC Call 17-Jul-2020 35.250 (9,975) (0.02) (275) iShares Physical Gold ETC Call 21-Aug-2020 34.750 (20,395) (0.03)
Total commodity options (30,370) (0.05)
Index options - (399,902) (31 December 2019: (363,168))
(49) CBOE S&P 500 Index Call 17-Dec-2020 3,300.000 (355,405) (0.57) (14) CBOE S&P 500 Index Put 20-Aug-2020 2,650.000 (44,497) (0.07)
Total index options (399,902) (0.64)
Equities cont’d. Equity investment instruments cont’d.
GBPGBP
03613-1A.indd 214 19/08/2020 19:01

215
Schedule of investments – as at 30 June 2020
Holdings Description
Fair value
Total net assets
% Holdings Description
Fair value
Total net assets
%
BNy MELLON GLOBAL REAL RETURN FUND (GBp)
Unrealised loss on forward foreign currency contracts - (939,461) (see below) (31 December 2019: (413,007)) (939,461) (1.51)
Total financial liabilities at fair value through profit or loss (1,369,733) (2.20)
Net current assets 2,791,556 4.47
Total net assets 62,442,487 100.00
The counterparty for index options is UBS AG. The counterparty for futures contracts is UBS AG. The counterparty for commodity options is UBS AG.
Analysis of portfolio % of Total Assets
Transferable securities and money market instruments admitted to official stock exchange listing or traded on a regulated market 92.62Financial derivative instruments dealt in on a regulated market 2.28oTC financial derivative instruments 0.33other current assets 4.77
Total assets 100.00
Description
GBPGBP
Forward foreign currency contracts cont’d.Unrealised
Gain/(Loss)Buy Sell Amount (B) Amount (S)Settle
Date Counterparty
BNy Mellon Global Real Return Fund (GBp) cont’d.Sterling Euro 6,764 7,399 01-Jul-20 Royal Bank
of Scotland 5Euro Sterling 55,996 49,680 15-Jul-20 HSBC Bank plc 1,482Euro Sterling 210,199 190,022 15-Jul-20 JPMorgan Chase
Bank 2,033Euro Sterling 129,396 116,109 15-Jul-20 UBS AG 2,117Euro Sterling 8,501 7,688 15-Jul-20 UBS AG 79Euro Sterling 12,930 11,547 15-Jul-20 JPMorgan Chase
Bank 267Euro Sterling 5,876 5,166 15-Jul-20 UBS AG 202Euro Sterling 67,749 60,744 15-Jul-20 UBS AG 1,158Euro Sterling 9,300 8,187 15-Jul-20 Canadian Imperial
Bank 310Euro Sterling 203,889 177,814 15-Jul-20 Royal Bank
of Scotland 8,476Euro Sterling 25,118 22,525 15-Jul-20 Canadian Imperial
Bank 425Hungarian forint Sterling 97,908,095 250,285 15-Jul-20 HSBC Bank plc 618Hungarian forint Sterling 67,540,106 166,928 15-Jul-20 HSBC Bank plc 6,153Hungarian forint Sterling 11,322,837 28,097 15-Jul-20 HSBC Bank plc 920Hungarian forint Sterling 33,416,141 82,337 15-Jul-20 HSBC Bank plc 3,296Hungarian forint Sterling 20,970,587 53,396 15-Jul-20 JPMorgan Chase
Bank 344Hungarian forint Sterling 48,915,016 123,107 15-Jul-20 HSBC Bank plc 2,245Hungarian forint Sterling 121,599,000 309,775 15-Jul-20 State Street Bank 1,840Swedish krona Sterling 453,527 36,323 15-Jul-20 JPMorgan Chase
Bank 3,130Swedish krona Sterling 1,295,911 103,578 15-Jul-20 JPMorgan Chase
Bank 9,155Swedish krona Sterling 681,835 54,803 15-Jul-20 JPMorgan Chase
Bank 4,510Canadian dollar Sterling 534,899 306,087 14-Aug-20 Royal Bank
of Scotland 12,515Canadian dollar Sterling 133,352 78,093 14-Aug-20 The Bank of
New York Mellon 1,335Canadian dollar Sterling 89,032 52,169 14-Aug-20 State Street Bank 861Canadian dollar Sterling 482,299 279,651 14-Aug-20 State Street Bank 7,620Canadian dollar Sterling 227,572 133,564 14-Aug-20 State Street Bank 1,985Canadian dollar Sterling 133,078 77,316 14-Aug-20 State Street Bank 1,949Canadian dollar Sterling 132,488 76,751 14-Aug-20 State Street Bank 2,163Hong Kong dollar Sterling 94,046 9,774 14-Aug-20 Citigroup Global
Markets Limited 110New Zealand dollar Sterling 315,537 154,628 14-Aug-20 Citigroup Global
Markets Limited 10,011New Zealand dollar Sterling 178,085 87,096 14-Aug-20 Citigroup Global
Markets Limited 5,824New Zealand dollar Sterling 531,054 261,703 14-Aug-20 HSBC Bank plc 15,388Sterling Hong Kong dollar 142,023 1,346,000 14-Aug-20 HSBC Bank plc 553Sterling US dollar 311,617 380,000 14-Aug-20 Canadian Imperial
Bank 2,013Sterling US dollar 154,124 189,000 14-Aug-20 The Bank of
New York Mellon 137Sterling US dollar 151,862 186,000 14-Aug-20 Barclays Bank PLC 319Sterling US dollar 109,000 132,789 14-Aug-20 Citigroup Global
Markets Limited 811Sterling US dollar 250,451 306,000 14-Aug-20 Canadian Imperial
Bank 1,138Sterling US dollar 148,435 182,087 14-Aug-20 Citigroup Global
Markets Limited 81Sterling US dollar 153,575 186,000 14-Aug-20 Barclays Bank PLC 2,033Sterling US dollar 153,159 186,000 14-Aug-20 Canadian Imperial
Bank 1,616Sterling US dollar 152,854 186,000 14-Aug-20 Canadian Imperial
Bank 1,311Sterling US dollar 183,313 224,000 14-Aug-20 Royal Bank
of Scotland 809Sterling US dollar 59,248 72,644 14-Aug-20 Royal Bank
of Scotland 62Sterling US dollar 142,950 174,409 14-Aug-20 HSBC Bank plc 851Sterling US dollar 122,996 150,000 14-Aug-20 State Street Bank 784
03613-1A.indd 215 19/08/2020 19:01
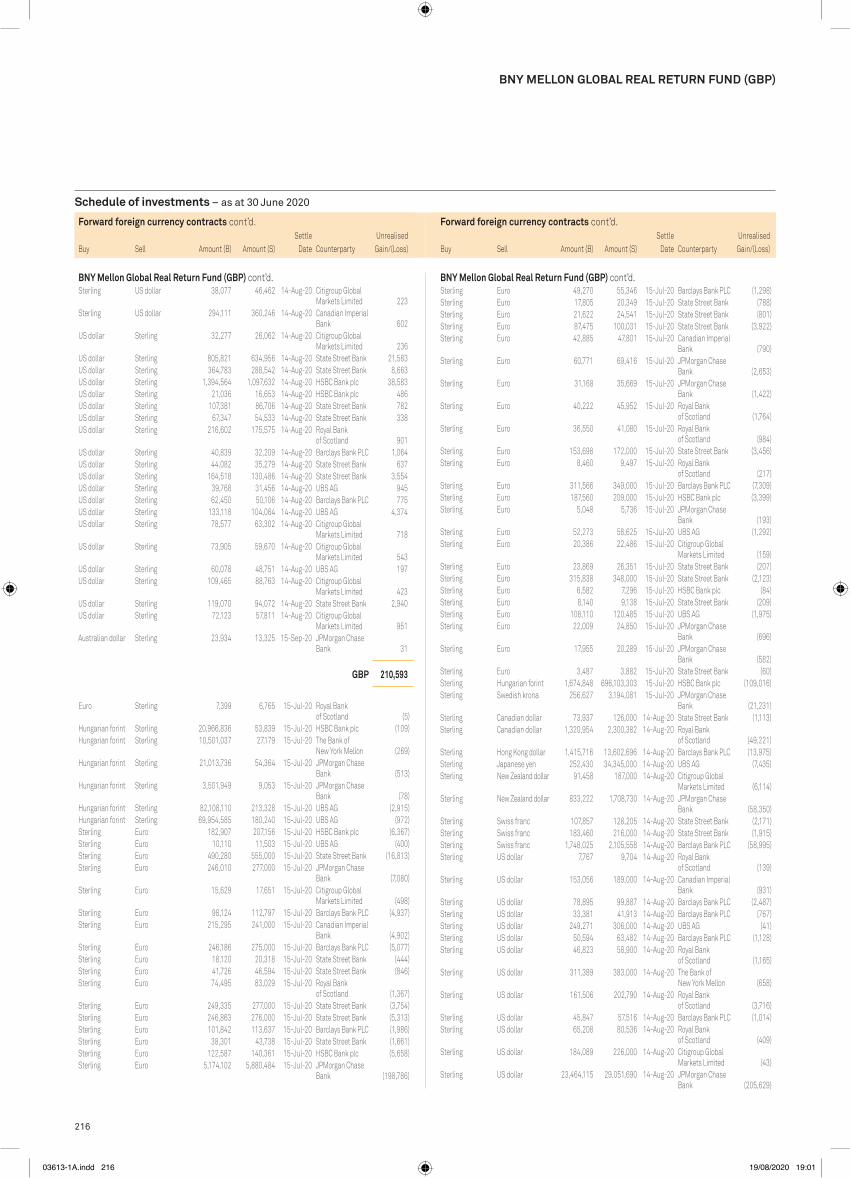
216
Schedule of investments – as at 30 June 2020
BNy MELLON GLOBAL REAL RETURN FUND (GBp)
Forward foreign currency contracts cont’d.Unrealised
Gain/(Loss)Buy Sell Amount (B) Amount (S)Settle
Date Counterparty
BNy Mellon Global Real Return Fund (GBp) cont’d.Sterling Euro 49,270 55,346 15-Jul-20 Barclays Bank PLC (1,298)Sterling Euro 17,805 20,349 15-Jul-20 State Street Bank (788)Sterling Euro 21,622 24,541 15-Jul-20 State Street Bank (801)Sterling Euro 87,475 100,031 15-Jul-20 State Street Bank (3,922)Sterling Euro 42,885 47,801 15-Jul-20 Canadian Imperial
Bank (790)Sterling Euro 60,771 69,416 15-Jul-20 JPMorgan Chase
Bank (2,653)Sterling Euro 31,168 35,669 15-Jul-20 JPMorgan Chase
Bank (1,422)Sterling Euro 40,222 45,952 15-Jul-20 Royal Bank
of Scotland (1,764)Sterling Euro 36,550 41,080 15-Jul-20 Royal Bank
of Scotland (984)Sterling Euro 153,698 172,000 15-Jul-20 State Street Bank (3,456)Sterling Euro 8,460 9,497 15-Jul-20 Royal Bank
of Scotland (217)Sterling Euro 311,566 349,000 15-Jul-20 Barclays Bank PLC (7,309)Sterling Euro 187,560 209,000 15-Jul-20 HSBC Bank plc (3,399)Sterling Euro 5,048 5,736 15-Jul-20 JPMorgan Chase
Bank (193)Sterling Euro 52,273 58,625 15-Jul-20 UBS AG (1,292)Sterling Euro 20,386 22,486 15-Jul-20 Citigroup Global
Markets Limited (159)Sterling Euro 23,869 26,351 15-Jul-20 State Street Bank (207)Sterling Euro 315,838 348,000 15-Jul-20 State Street Bank (2,123)Sterling Euro 6,582 7,296 15-Jul-20 HSBC Bank plc (84)Sterling Euro 8,140 9,138 15-Jul-20 State Street Bank (209)Sterling Euro 108,110 120,485 15-Jul-20 UBS AG (1,975)Sterling Euro 22,009 24,850 15-Jul-20 JPMorgan Chase
Bank (696)Sterling Euro 17,955 20,289 15-Jul-20 JPMorgan Chase
Bank (582)Sterling Euro 3,487 3,882 15-Jul-20 State Street Bank (60)Sterling Hungarian forint 1,674,848 696,103,303 15-Jul-20 HSBC Bank plc (109,016)Sterling Swedish krona 256,627 3,194,081 15-Jul-20 JPMorgan Chase
Bank (21,231)Sterling Canadian dollar 73,937 126,000 14-Aug-20 State Street Bank (1,113)Sterling Canadian dollar 1,320,954 2,300,382 14-Aug-20 Royal Bank
of Scotland (49,221)Sterling Hong Kong dollar 1,415,716 13,602,696 14-Aug-20 Barclays Bank PLC (13,975)Sterling Japanese yen 252,430 34,345,000 14-Aug-20 UBS AG (7,435)Sterling New Zealand dollar 91,458 187,000 14-Aug-20 Citigroup Global
Markets Limited (6,114)Sterling New Zealand dollar 833,222 1,708,730 14-Aug-20 JPMorgan Chase
Bank (58,350)Sterling Swiss franc 107,857 128,205 14-Aug-20 State Street Bank (2,171)Sterling Swiss franc 183,460 216,000 14-Aug-20 State Street Bank (1,915)Sterling Swiss franc 1,748,025 2,105,558 14-Aug-20 Barclays Bank PLC (58,995)Sterling US dollar 7,767 9,704 14-Aug-20 Royal Bank
of Scotland (139)Sterling US dollar 153,056 189,000 14-Aug-20 Canadian Imperial
Bank (931)Sterling US dollar 78,895 99,887 14-Aug-20 Barclays Bank PLC (2,487)Sterling US dollar 33,381 41,913 14-Aug-20 Barclays Bank PLC (767)Sterling US dollar 249,271 306,000 14-Aug-20 UBS AG (41)Sterling US dollar 50,594 63,482 14-Aug-20 Barclays Bank PLC (1,128)Sterling US dollar 46,823 58,900 14-Aug-20 Royal Bank
of Scotland (1,165)Sterling US dollar 311,389 383,000 14-Aug-20 The Bank of
New York Mellon (658)Sterling US dollar 161,506 202,790 14-Aug-20 Royal Bank
of Scotland (3,716)Sterling US dollar 45,847 57,516 14-Aug-20 Barclays Bank PLC (1,014)Sterling US dollar 65,208 80,536 14-Aug-20 Royal Bank
of Scotland (409)Sterling US dollar 184,089 226,000 14-Aug-20 Citigroup Global
Markets Limited (43)Sterling US dollar 23,464,115 29,051,690 14-Aug-20 JPMorgan Chase
Bank (205,629)
Forward foreign currency contracts cont’d.Unrealised
Gain/(Loss)Buy Sell Amount (B) Amount (S)Settle
Date Counterparty
BNy Mellon Global Real Return Fund (GBp) cont’d.Sterling US dollar 38,077 46,462 14-Aug-20 Citigroup Global
Markets Limited 223Sterling US dollar 294,111 360,246 14-Aug-20 Canadian Imperial
Bank 602US dollar Sterling 32,277 26,062 14-Aug-20 Citigroup Global
Markets Limited 236US dollar Sterling 805,821 634,956 14-Aug-20 State Street Bank 21,583US dollar Sterling 364,783 288,542 14-Aug-20 State Street Bank 8,663US dollar Sterling 1,394,564 1,097,632 14-Aug-20 HSBC Bank plc 38,583US dollar Sterling 21,036 16,653 14-Aug-20 HSBC Bank plc 486US dollar Sterling 107,381 86,706 14-Aug-20 State Street Bank 782US dollar Sterling 67,347 54,533 14-Aug-20 State Street Bank 338US dollar Sterling 216,602 175,575 14-Aug-20 Royal Bank
of Scotland 901US dollar Sterling 40,839 32,209 14-Aug-20 Barclays Bank PLC 1,064US dollar Sterling 44,082 35,279 14-Aug-20 State Street Bank 637US dollar Sterling 164,518 130,486 14-Aug-20 State Street Bank 3,554US dollar Sterling 39,768 31,456 14-Aug-20 UBS AG 945US dollar Sterling 62,450 50,106 14-Aug-20 Barclays Bank PLC 775US dollar Sterling 133,118 104,084 14-Aug-20 UBS AG 4,374US dollar Sterling 78,577 63,302 14-Aug-20 Citigroup Global
Markets Limited 718US dollar Sterling 73,905 59,670 14-Aug-20 Citigroup Global
Markets Limited 543US dollar Sterling 60,078 48,751 14-Aug-20 UBS AG 197US dollar Sterling 109,465 88,763 14-Aug-20 Citigroup Global
Markets Limited 423US dollar Sterling 119,070 94,072 14-Aug-20 State Street Bank 2,940US dollar Sterling 72,123 57,811 14-Aug-20 Citigroup Global
Markets Limited 951Australian dollar Sterling 23,934 13,325 15-Sep-20 JPMorgan Chase
Bank 31
GBp 210,593
Euro Sterling 7,399 6,765 15-Jul-20 Royal Bank of Scotland (5)
Hungarian forint Sterling 20,966,836 53,839 15-Jul-20 HSBC Bank plc (109)Hungarian forint Sterling 10,501,037 27,179 15-Jul-20 The Bank of
New York Mellon (269)Hungarian forint Sterling 21,013,736 54,364 15-Jul-20 JPMorgan Chase
Bank (513)Hungarian forint Sterling 3,501,949 9,053 15-Jul-20 JPMorgan Chase
Bank (78)Hungarian forint Sterling 82,108,110 213,328 15-Jul-20 UBS AG (2,915)Hungarian forint Sterling 69,954,585 180,240 15-Jul-20 UBS AG (972)Sterling Euro 182,907 207,156 15-Jul-20 HSBC Bank plc (6,367)Sterling Euro 10,110 11,503 15-Jul-20 UBS AG (400)Sterling Euro 490,280 555,000 15-Jul-20 State Street Bank (16,813)Sterling Euro 246,010 277,000 15-Jul-20 JPMorgan Chase
Bank (7,080)Sterling Euro 15,629 17,651 15-Jul-20 Citigroup Global
Markets Limited (498)Sterling Euro 98,124 112,797 15-Jul-20 Barclays Bank PLC (4,937)Sterling Euro 215,295 241,000 15-Jul-20 Canadian Imperial
Bank (4,902)Sterling Euro 246,186 275,000 15-Jul-20 Barclays Bank PLC (5,077)Sterling Euro 18,120 20,318 15-Jul-20 State Street Bank (444)Sterling Euro 41,726 46,594 15-Jul-20 State Street Bank (846)Sterling Euro 74,495 83,029 15-Jul-20 Royal Bank
of Scotland (1,367)Sterling Euro 249,335 277,000 15-Jul-20 State Street Bank (3,754)Sterling Euro 246,863 276,000 15-Jul-20 State Street Bank (5,313)Sterling Euro 101,842 113,637 15-Jul-20 Barclays Bank PLC (1,986)Sterling Euro 38,301 43,738 15-Jul-20 State Street Bank (1,661)Sterling Euro 122,587 140,361 15-Jul-20 HSBC Bank plc (5,658)Sterling Euro 5,174,102 5,880,484 15-Jul-20 JPMorgan Chase
Bank (198,786)
03613-1A.indd 216 19/08/2020 19:01

217
Schedule of investments – as at 30 June 2020
BNy MELLON GLOBAL REAL RETURN FUND (GBp)
Forward foreign currency contracts cont’d.Unrealised
Gain/(Loss)Buy Sell Amount (B) Amount (S)Settle
Date Counterparty
BNy Mellon Global Real Return Fund (GBp) cont’d.Sterling US dollar 183,190 227,000 14-Aug-20 UBS AG (1,757)Sterling US dollar 67,759 83,948 14-Aug-20 UBS AG (637)Sterling US dollar 62,646 77,566 14-Aug-20 JPMorgan Chase
Bank (550)Sterling US dollar 152,231 187,000 14-Aug-20 State Street Bank (127)Sterling US dollar 50,836 62,732 14-Aug-20 State Street Bank (275)Sterling US dollar 33,193 40,957 14-Aug-20 Royal Bank
of Scotland (177)Sterling US dollar 183,553 226,000 14-Aug-20 JPMorgan Chase
Bank (579)Sterling US dollar 111,543 137,707 14-Aug-20 UBS AG (654)Sterling US dollar 155,607 192,000 14-Aug-20 State Street Bank (824)Sterling US dollar 190,274 236,000 14-Aug-20 Canadian Imperial
Bank (2,006)Sterling US dollar 158,698 197,000 14-Aug-20 The Bank of
New York Mellon (1,807)Sterling US dollar 189,981 236,000 14-Aug-20 The Bank of
New York Mellon (2,299)Sterling US dollar 87,645 108,093 14-Aug-20 Royal Bank
of Scotland (423)Sterling US dollar 157,491 195,962 14-Aug-20 JPMorgan Chase
Bank (2,169)US dollar Sterling 52,829 43,139 14-Aug-20 HSBC Bank plc (96)US dollar Sterling 305,452 249,746 14-Aug-20 State Street Bank (880)US dollar Sterling 40,531 33,039 14-Aug-20 State Street Bank (16)US dollar Sterling 132,008 108,199 14-Aug-20 State Street Bank (646)Sterling Australian dollar 2,886,340 5,266,793 15-Sep-20 HSBC Bank plc (52,767)Sterling Danish krone 386,678 3,231,075 15-Sep-20 Royal Bank
of Scotland (9,863)Sterling Korean won 205,034 311,652,000 15-Sep-20 State Street Bank (6,113)
GBp (939,461)
Net GBp (728,868)
03613-1A.indd 217 19/08/2020 19:01

218
Schedule of investments – as at 30 June 2020
Holdings Description
Fair value
Total net assets
% Holdings Description
Fair value
Total net assets
%
FUND 33 – BNy MELLON GLOBAL REAL RETURN FUND (USD)
BNY MELLON GLOBAL REAL RETURN FUND (USD)
India - 398,928 (31 December 2019: 420,152) 398,928 0.14
30,000,000 National Highways Authority of India 7.300% 18-May-2022 398,928 0.14
Indonesia - 494,029 (31 December 2019: 512,843) 494,029 0.17
6,776,000,000 Indonesia Treasury Bond 8.250% 15-May-2036 494,029 0.17
Ireland - 740,123 (31 December 2019: 855,792) 740,123 0.25
703,000 AIB Group Plc FRN (Perpetual) 5.250% 09-Oct-2024 740,123 0.25
Italy - 2,254,684 (31 December 2019: 1,645,470) 2,254,684 0.77
945,000 Intesa Sanpaolo SpA ‘144A’ FRN (Perpetual) 7.700% 17-Sep-2025 943,036 0.32
897,000 UniCredit SpA ‘EMTN’ FRN (Perpetual) 3.875% 03-Jun-2027 741,518 0.25
568,000 UniCredit SpA FRN (Perpetual) 8.000% 03-Jun-2024 570,130 0.20
Jersey - 510,870 (31 December 2019: 582,498) 510,870 0.18
432,000 CPUK Finance Ltd ‘REGS’ 4.250% 28-Aug-2022 510,870 0.18
Luxembourg - 626,287 (31 December 2019: 678,325) 626,287 0.21
579,000 Summer BC Holdco B SARL ‘REGS’ 5.750% 31-Oct-2026 626,287 0.21
Mexico - 3,846,304 (31 December 2019: 5,221,928) 3,846,304 1.32
21,666,000 Mexican Bonos 7.500% 03-Jun-2027 1,041,658 0.36 30,225,200 Mexican Bonos 7.750% 29-May-2031 1,473,684 0.50 25,632,600 Mexican Bonos 10.000% 05-Dec-2024 1,330,962 0.46
Netherlands - 1,445,121 (31 December 2019: 1,050,093) 1,445,121 0.49
747,000 ING Groep NV FRN (Perpetual) 4.875% 16-May-2029 704,066 0.24 402,000 ING Groep NV FRN (Perpetual) 6.750% 16-Apr-2024 412,351 0.14 300,000 Telefonica Europe BV FRN (Perpetual)
3.000% 04-Sep-2023 328,704 0.11
New Zealand - 3,208,536 (31 December 2019: 5,738,312) 3,208,536 1.10
1,305,000 New Zealand Government Bond 2.750% 15-Apr-2037 1,027,442 0.35 2,280,000 New Zealand Government Inflation Linked Bond
2.500% 20-Sep-2040 2,181,094 0.75
Norway - 791,919 (31 December 2019: 805,894) 791,919 0.27
805,000 DNB Bank ASA FRN (Perpetual) 4.875% 12-Nov-2024 791,919 0.27
philippines - 881,713 (31 December 2019: –) 881,713 0.30
839,000 Philippine Government International Bond 2.457% 05-May-2030 881,713 0.30
Qatar - 895,770 (31 December 2019: –) 895,770 0.31
822,000 Qatar Government International Bond ‘REGS’ 3.400% 16-Apr-2025 895,770 0.31
Collective investment schemes
Ireland - 51,724,851 (31 December 2019: 42,173,540) 51,724,851 17.71
208,502 Amundi Physical Gold ETC 14,735,983 5.05 35,568 Invesco Physical Gold ETC 6,103,291 2.09 298,345 iShares China CNY Bond UCITS ETF - ETF 1,529,316 0.52 1,454 iShares EUR High Yield Corp Bond UCITS ETF - ETF 158,318 0.05 498,661 iShares Physical Gold ETC 17,256,164 5.91 93,266 iShares USD Corp Bond UCITS ETF - ETF 11,941,779 4.09
Jersey - 3,050,562 (31 December 2019: 1,439,262) 3,050,562 1.04
16,058 WisdomTree Physical Swiss Gold ETC 2,743,589 0.94 1,784 Xtrackers Physical Gold ETC 306,973 0.10
Total investments in collective investment schemes 54,775,413 18.75
Bonds
Australia - 13,805,119 (31 December 2019: 12,815,396) 13,805,119 4.73
4,610,000 Australia Government Bond 3.000% 21-Mar-2047 4,021,976 1.38
5,632,000 Australia Government Bond 3.250% 21-Jun-2039 4,962,623 1.70
1,061,000 Australia Government Bond 3.750% 21-Apr-2037 986,602 0.34
2,943,100 New South Wales Treasury Corp 2.750% 20-Nov-2025 3,048,530 1.04
531,000 Treasury Corp of Victoria 4.250% 20-Dec-2032 476,284 0.16 349,000 Treasury Corp of Victoria 5.500% 17-Nov-2026 309,104 0.11
Ecuador - 233,910 (31 December 2019: 508,037) 233,910 0.08
552,000 Ecuador Government International Bond ‘REGS’ 8.875% 23-Oct-2027 233,910 0.08
France - 4,355,437 (31 December 2019: 4,413,380) 4,355,437 1.49
622,000 Altice France SA/France ‘144A’ 7.375% 01-May-2026 646,103 0.22
179,000 Banijay Entertainment SASU ‘REGS’ 3.500% 01-Mar-2025 192,347 0.07
331,000 BNP Paribas SA FRN (Perpetual) 6.125% 17-Jun-2022 380,294 0.13
1,015,000 BNP Paribas SA ‘REGS’ FRN (Perpetual) 7.375% 19-Aug-2025 1,112,130 0.38
746,000 Societe Generale SA ‘144A’ FRN (Perpetual) 8.000% 29-Sep-2025 832,150 0.28
1,138,000 Societe Generale SA ‘REGS’ FRN (Perpetual) 7.875% 18-Dec-2023 1,192,413 0.41
Germany - 1,327,804 (31 December 2019: 2,035,513) 1,327,804 0.45
600,000 Infineon Technologies AG ‘EMTN’ FRN (Perpetual) 2.875% 01-Jan-2025 658,579 0.22
600,000 Infineon Technologies AG FRN (Perpetual) 3.625% 01-Jan-2028 669,225 0.23
Hungary - 2,148,041 (31 December 2019: 6,465,770) 2,148,041 0.74
633,620,000 Hungary Government Bond 3.000% 21-Aug-2030 2,148,041 0.74
Bonds cont’d.
USDUSD
03613-1A.indd 218 19/08/2020 19:01

219
Schedule of investments – as at 30 June 2020
Holdings Description
Fair value
Total net assets
% Holdings Description
Fair value
Total net assets
%
BNy MELLON GLOBAL REAL RETURN FUND (USD)
Spain - 2,993,074 (31 December 2019: 3,392,933) 2,993,074 1.02
600,000 Banco Bilbao Vizcaya Argentaria SA FRN (Perpetual) 5.875% 24-Sep-2023 657,691 0.22
800,000 Banco Bilbao Vizcaya Argentaria SA FRN (Perpetual) 6.000% 29-Mar-2024 888,300 0.30
800,000 Banco Santander SA FRN (Perpetual) 4.750% 19-Mar-2025 811,532 0.28
600,000 Banco Santander SA FRN (Perpetual) 5.250% 29-Sep-2023 635,551 0.22
United Arab Emirates - 890,420 (31 December 2019: –) 890,420 0.31
844,000 Abu Dhabi Government International Bond ‘REGS’ 2.500% 16-Apr-2025 890,420 0.31
United Kingdom - 7,908,245 (31 December 2019: 8,223,292) 7,908,245 2.71
44,000 Anglian Water Services Financing Plc 3.666% 30-Jul-2024 107,061 0.04
60,000 Anglian Water Services Financing Plc ‘EMTN’ 4.125% 28-Jul-2020 129,562 0.04
238,000 British Telecommunications Plc ‘EMTN’ 3.500% 25-Apr-2025 605,198 0.21
537,120 DWR Cymru Financing UK Plc ‘EMTN’ 1.859% 31-Mar-2048 1,269,033 0.43
291,224 High Speed Rail Finance 1 Plc ‘EMTN’ 1.566% 01-Nov-2038 520,193 0.18
243,793 Network Rail Infrastructure Finance Plc 1.750% 22-Nov-2027 407,270 0.14
150,000 Scotland Gas Networks Plc 2.127% 21-Oct-2022 302,729 0.10
550,000 Tesco Plc ‘EMTN’ 3.322% 05-Nov-2025 1,365,413 0.47 62,000 Tesco Plc ‘EMTN’ 6.125% 24-Feb-2022 82,251 0.03 782,589 Tesco Property Finance 3 Plc
5.744% 13-Apr-2040 1,299,091 0.44 263,000 Vodafone Group Plc FRN
4.875% 03-Oct-2078 336,349 0.12 1,278,000 Vodafone Group Plc FRN
7.000% 04-Apr-2079 1,484,095 0.51
United States of America - 14,695,647 (31 December 2019: 38,732,833) 14,695,647 5.03
707,000 CCO Holdings LLC / CCO Holdings Capital Corp ‘144A’ 5.500% 01-May-2026 734,287 0.25
395,000 CEMEX Finance LLC ‘REGS’ 6.000% 01-Apr-2024 393,148 0.13 471,000 General Motors Co 5.400% 02-Oct-2023 510,309 0.18 637,000 Laureate Education Inc ‘144A’
8.250% 01-May-2025 663,381 0.23 250,000 Refinitiv US Holdings Inc ‘REGS’
6.875% 15-Nov-2026 300,090 0.10 513,000 Sprint Capital Corp 8.750% 15-Mar-2032 732,898 0.25 468,000 Sprint Corp 7.125% 15-Jun-2024 525,938 0.18 724,000 T-Mobile USA Inc 6.000% 01-Mar-2023 729,111 0.25 844,000 T-Mobile USA Inc 6.000% 15-Apr-2024 860,614 0.29 647,000 T-Mobile USA Inc ‘144A’ 3.875% 15-Apr-2030 719,868 0.25 8,470,900 United States Treasury Note/Bond
2.750% 30-Sep-2020 8,526,003 2.92
Total investments in bonds 64,451,981 22.07
Equities
Australia - 1,966,853 (31 December 2019: 986,027) 1,966,853 0.67
36,697 Newcrest Mining Ltd 792,720 0.27 604,696 Star Entertainment Grp Ltd/The 1,174,133 0.40
Canada - 2,787,076 (31 December 2019: 4,903,678) 2,787,076 0.95
36,543 Barrick Gold Corp 955,417 0.33 15,147 Intact Financial Corp 1,419,367 0.48 9,737 Wheaton Precious Metals Corp 412,292 0.14
Cayman Islands - 5,344,186 (31 December 2019: –) 5,344,186 1.83
8,596 Alibaba Group Holding Ltd ADR 1,848,097 0.63 9,667 New Oriental Education & Technology Group
Inc ADR 1,269,035 0.44 24,436 Tencent Holdings Ltd 1,571,766 0.54 49,437 Tencent Music Entertainment Group ADR 655,288 0.22
China - 854,437 (31 December 2019: –) 854,437 0.29
85,500 Ping An Insurance Group Co of China Ltd ‘H’ 854,437 0.29
Denmark - 2,305,222 (31 December 2019: 2,106,700) 2,305,222 0.79
19,985 Orsted A/S ‘144A’ 2,305,222 0.79
France - 9,277,688 (31 December 2019: 6,417,940) 9,277,688 3.18
4,595 L’Oreal SA 1,473,827 0.51 2,975 LVMH Moet Hennessy Louis Vuitton SE 1,307,028 0.45 8,393 Sanofi 851,116 0.29 20,490 Thales SA 1,669,720 0.57 37,347 TOTAL SA 1,426,039 0.49 98,931 Vivendi SA 2,549,958 0.87
Germany - 16,325,050 (31 December 2019: 13,498,041) 16,325,050 5.59
53,184 Bayer AG 3,943,466 1.35 13,586 Continental AG 1,330,671 0.46 81,230 Deutsche Wohnen SE 3,637,479 1.24 26,373 LEG Immobilien AG 3,391,593 1.16 29,119 SAP SE 4,021,841 1.38
Guernsey - 416,413 (31 December 2019: 1,008,590) 416,413 0.14
998,120 Amedeo Air Four Plus Ltd 416,413 0.14
Hong Kong - 5,171,114 (31 December 2019: 6,988,707) 5,171,114 1.77
382,600 AIA Group Ltd 3,565,539 1.22 196,500 Link REIT (Units) (REIT) 1,605,575 0.55
India - 928,253 (31 December 2019: 2,040,697) 928,253 0.32
39,788 Housing Development Finance Corp Ltd 928,253 0.32
Ireland - 8,261,241 (31 December 2019: 5,697,589) 8,261,241 2.83
15,438 Accenture Plc - Class A 3,284,743 1.12 508,904 Greencoat Renewables Plc 687,369 0.24
Bonds cont’d.
USDUSD
03613-1A.indd 219 19/08/2020 19:01

220
Schedule of investments – as at 30 June 2020
Holdings Description
Fair value
Total net assets
% Holdings Description
Fair value
Total net assets
%
BNy MELLON GLOBAL REAL RETURN FUND (USD)
10,556 Newmont Corp 628,346 0.22 13,414 NIKE Inc 1,286,470 0.44 11,410 PepsiCo Inc 1,496,136 0.51 3,914 salesforce.com Inc 717,788 0.25 1,410 Sherwin-Williams Co/The 797,630 0.27
Total investments in equities 121,687,728 41.67
Equity investment instruments
Guernsey - 10,893,014 (31 December 2019: –) 10,893,014 3.73
869,373 Bluefield Solar Income Fund Ltd 1,434,799 0.49 758,117 Hipgnosis Songs Fund Ltd/The Fund 1,079,088 0.37 1,548,989 International Public Partnerships Ltd 3,202,661 1.10 548,389 JLEN Environmental Assets Group Ltd 797,388 0.27 252,062 NextEnergy Solar Fund Ltd 332,799 0.11 2,608,832 Renewables Infrastructure Group Ltd/The 4,046,279 1.39
Jersey - 1,172,530 (31 December 2019: –) 1,172,530 0.40
864,767 Foresight Solar Fund Ltd 1,172,530 0.40
Luxembourg - 1,193,901 (31 December 2019: –) 1,193,901 0.41
595,097 BBGI SICAV SA/Fund 1,193,901 0.41
United Kingdom - 8,642,334 (31 December 2019: –) 8,642,334 2.96
2,754,663 BioPharma Credit Plc/The Fund 2,702,325 0.93 1,800,758 Greencoat UK Wind Plc/Funds 3,166,388 1.08 2,132,449 Sdcl Energy Efficiency Income Trust Plc 2,773,621 0.95
Total investments in equity investment instruments 21,901,779 7.50
Index options - 6,191,968 (31 December 2019: 4,252,147)
190 CBOE S&P 500 Index Call 17-Dec-2020 3,000.000 4,734,800 1.62 122 CBOE S&P 500 Index Put 17-Dec-2020 2,650.000 1,457,168 0.50
Total index options 6,191,968 2.12
Holdings Description
Underlying exposure
USD
Fair value USD
Total net assets
%
Open futures contracts - 660,018 (31 December 2019: (313,055))
506 U.S. 10 Year Treasury Note Long Futures Contracts Exp Sep-2020 70,500,031 660,018 0.23
Total open futures contracts 660,018 0.23 Unrealised gain on forward foreign currency contracts - 902,415 (see below) (31 December 2019: 425,999) 902,415 0.31
Total financial assets at fair value through profit or loss 270,571,302 92.65
14,487 Linde Plc 3,059,944 1.05 13,616 Medtronic Plc 1,229,185 0.42
Japan - 1,173,940 (31 December 2019: 1,864,791) 1,173,940 0.40
34,600 Suzuki Motor Corp 1,173,940 0.40
Jersey - 1,401,927 (31 December 2019: 3,015,712) 1,401,927 0.48
17,269 Ferguson Plc 1,401,927 0.48
Netherlands - 4,325,456 (31 December 2019: 1,803,238) 4,325,456 1.48
4,108 ASML Holding NV 1,490,413 0.51 53,130 Unilever NV 2,835,043 0.97
Republic of Korea - 4,604,262 (31 December 2019: 4,790,541) 4,604,262 1.58
58,500 Samsung Electronics Co Ltd - Preference 2,263,936 0.78 7,739 Samsung SDI Co Ltd 2,340,326 0.80
Switzerland - 10,035,246 (31 December 2019: 7,359,381) 10,035,246 3.44
33,303 Alcon Inc 1,907,684 0.65 2,812 Lonza Group AG 1,469,677 0.51 30,164 Novartis AG 2,620,687 0.90 2,281 Roche Holding AG 789,549 0.27 9,276 Zurich Insurance Group AG 3,247,649 1.11
United Kingdom - 17,725,682 (31 December 2019: 20,918,159) 17,725,682 6.07
69,281 Anglo American Plc 1,579,170 0.54 51,413 Associated British Foods Plc 1,207,316 0.41 139,297 BAE Systems Plc 834,026 0.29 91,364 Diageo Plc 3,023,280 1.04 860,394 Impact Healthcare Reit Plc (REIT) 996,626 0.34 207,279 Informa Plc 1,196,679 0.41 32,059 Persimmon Plc 906,348 0.31 210,667 Prudential Plc 3,160,152 1.08 115,845 Relx Plc 2,663,239 0.91 84,566 Royal Dutch Shell Plc 1,290,652 0.44 62,504 Travis Perkins Plc 868,194 0.30
United States of America - 28,783,682 (31 December 2019: 23,327,856) 28,783,682 9.86
19,263 Abbott Laboratories 1,714,792 0.59 1,030 Alphabet Inc - Class A 1,439,513 0.49 639 Amazon.com Inc 1,713,472 0.59 5,000 Apple Inc 1,809,850 0.62 14,270 CMS Energy Corp 821,381 0.28 8,533 Ecolab Inc 1,668,543 0.57 20,089 Eversource Energy 1,669,496 0.57 8,037 Fidelity National Information Services Inc 1,054,254 0.36 142,245 General Electric Co 966,555 0.33 14,358 Goldman Sachs Group Inc/The 2,779,493 0.95 14,199 Lennar Corp 865,571 0.30 2,331 Lockheed Martin Corp 856,340 0.29 9,327 Mastercard Inc 2,734,163 0.94 18,965 Microsoft Corp 3,763,889 1.29
Equities cont’d.
Ireland cont’d.
Equities cont’d.
United States of America cont’d.
USDUSD
03613-1A.indd 220 19/08/2020 19:01
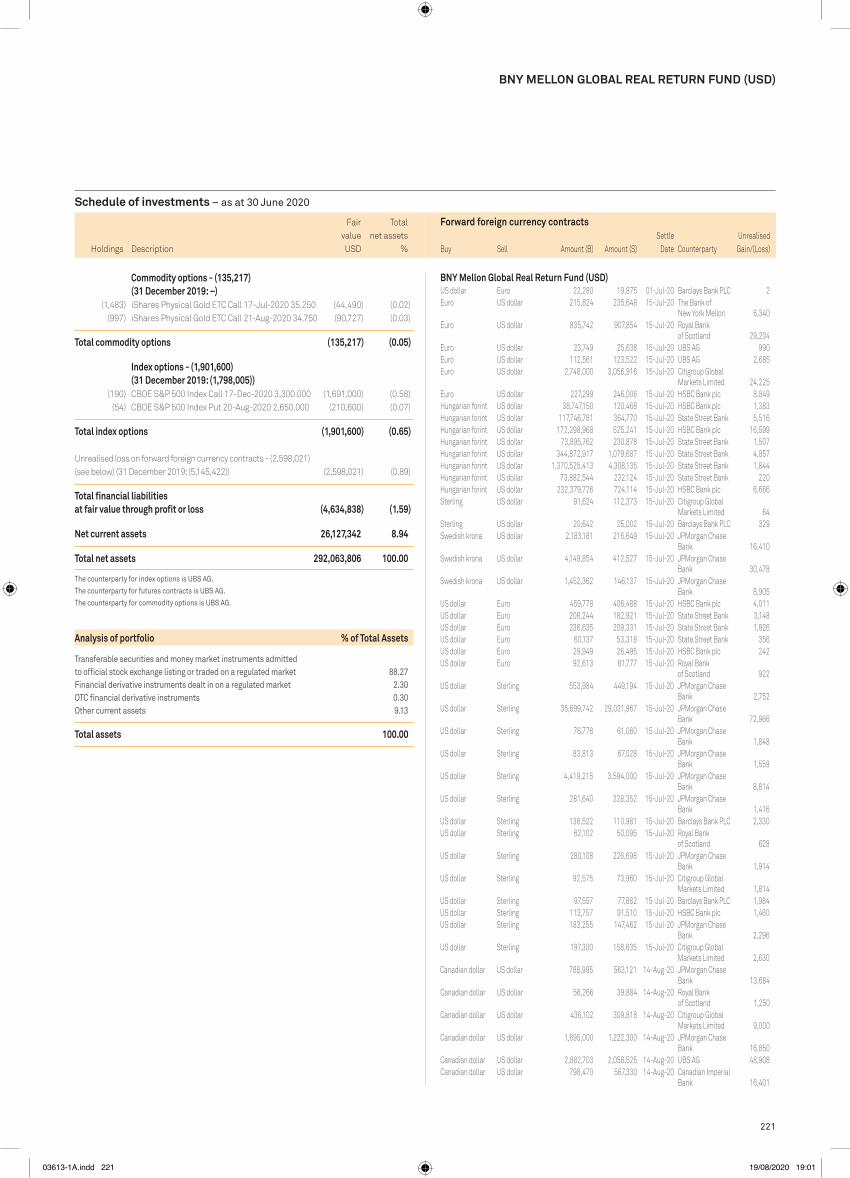
221
Schedule of investments – as at 30 June 2020
Holdings Description
Fair value
Total net assets
% Holdings Description
Fair value
Total net assets
%
BNy MELLON GLOBAL REAL RETURN FUND (USD)
Commodity options - (135,217) (31 December 2019: –)
(1,483) iShares Physical Gold ETC Call 17-Jul-2020 35.250 (44,490) (0.02) (997) iShares Physical Gold ETC Call 21-Aug-2020 34.750 (90,727) (0.03)
Total commodity options (135,217) (0.05)
Index options - (1,901,600) (31 December 2019: (1,798,005))
(190) CBOE S&P 500 Index Call 17-Dec-2020 3,300.000 (1,691,000) (0.58) (54) CBOE S&P 500 Index Put 20-Aug-2020 2,650.000 (210,600) (0.07)
Total index options (1,901,600) (0.65) Unrealised loss on forward foreign currency contracts - (2,598,021) (see below) (31 December 2019: (5,145,422)) (2,598,021) (0.89)
Total financial liabilities at fair value through profit or loss (4,634,838) (1.59)
Net current assets 26,127,342 8.94
Total net assets 292,063,806 100.00
The counterparty for index options is UBS AG. The counterparty for futures contracts is UBS AG. The counterparty for commodity options is UBS AG.
Analysis of portfolio % of Total Assets
Transferable securities and money market instruments admitted to official stock exchange listing or traded on a regulated market 88.27Financial derivative instruments dealt in on a regulated market 2.30oTC financial derivative instruments 0.30other current assets 9.13
Total assets 100.00
USDUSD
Forward foreign currency contracts cont’d.Unrealised
Gain/(Loss)Buy Sell Amount (B) Amount (S)Settle
Date Counterparty
BNy Mellon Global Real Return Fund (USD) cont’d.US dollar Euro 22,280 19,875 01-Jul-20 Barclays Bank PLC 2Euro US dollar 215,824 235,648 15-Jul-20 The Bank of
New York Mellon 6,340Euro US dollar 835,742 907,854 15-Jul-20 Royal Bank
of Scotland 29,204Euro US dollar 23,749 25,638 15-Jul-20 UBS AG 990Euro US dollar 112,561 123,522 15-Jul-20 UBS AG 2,685Euro US dollar 2,748,000 3,056,916 15-Jul-20 Citigroup Global
Markets Limited 24,225Euro US dollar 227,299 246,006 15-Jul-20 HSBC Bank plc 8,849Hungarian forint US dollar 38,747,150 120,468 15-Jul-20 HSBC Bank plc 1,383Hungarian forint US dollar 117,746,781 364,770 15-Jul-20 State Street Bank 5,516Hungarian forint US dollar 172,298,968 525,241 15-Jul-20 HSBC Bank plc 16,599Hungarian forint US dollar 73,895,762 230,878 15-Jul-20 State Street Bank 1,507Hungarian forint US dollar 344,872,917 1,079,687 15-Jul-20 State Street Bank 4,857Hungarian forint US dollar 1,370,525,413 4,308,135 15-Jul-20 State Street Bank 1,844Hungarian forint US dollar 73,882,544 232,124 15-Jul-20 State Street Bank 220Hungarian forint US dollar 232,379,726 724,114 15-Jul-20 HSBC Bank plc 6,666Sterling US dollar 91,624 112,373 15-Jul-20 Citigroup Global
Markets Limited 64Sterling US dollar 20,642 25,002 15-Jul-20 Barclays Bank PLC 329Swedish krona US dollar 2,183,181 216,649 15-Jul-20 JPMorgan Chase
Bank 16,410Swedish krona US dollar 4,149,854 412,527 15-Jul-20 JPMorgan Chase
Bank 30,478Swedish krona US dollar 1,452,362 146,137 15-Jul-20 JPMorgan Chase
Bank 8,905US dollar Euro 459,778 406,488 15-Jul-20 HSBC Bank plc 4,011US dollar Euro 208,244 182,921 15-Jul-20 State Street Bank 3,148US dollar Euro 236,635 209,331 15-Jul-20 State Street Bank 1,926US dollar Euro 60,137 53,318 15-Jul-20 State Street Bank 356US dollar Euro 29,949 26,495 15-Jul-20 HSBC Bank plc 242US dollar Euro 92,613 81,777 15-Jul-20 Royal Bank
of Scotland 922US dollar Sterling 553,984 449,194 15-Jul-20 JPMorgan Chase
Bank 2,752US dollar Sterling 35,699,742 29,031,967 15-Jul-20 JPMorgan Chase
Bank 72,966US dollar Sterling 76,778 61,060 15-Jul-20 JPMorgan Chase
Bank 1,848US dollar Sterling 83,813 67,028 15-Jul-20 JPMorgan Chase
Bank 1,559US dollar Sterling 4,419,215 3,594,000 15-Jul-20 JPMorgan Chase
Bank 8,814US dollar Sterling 281,640 228,352 15-Jul-20 JPMorgan Chase
Bank 1,416US dollar Sterling 138,522 110,981 15-Jul-20 Barclays Bank PLC 2,330US dollar Sterling 62,102 50,095 15-Jul-20 Royal Bank
of Scotland 628US dollar Sterling 280,108 226,698 15-Jul-20 JPMorgan Chase
Bank 1,914US dollar Sterling 92,575 73,960 15-Jul-20 Citigroup Global
Markets Limited 1,814US dollar Sterling 97,557 77,882 15-Jul-20 Barclays Bank PLC 1,984US dollar Sterling 113,757 91,510 15-Jul-20 HSBC Bank plc 1,460US dollar Sterling 183,255 147,462 15-Jul-20 JPMorgan Chase
Bank 2,296US dollar Sterling 197,300 158,635 15-Jul-20 Citigroup Global
Markets Limited 2,630Canadian dollar US dollar 788,995 563,121 14-Aug-20 JPMorgan Chase
Bank 13,684Canadian dollar US dollar 56,266 39,884 14-Aug-20 Royal Bank
of Scotland 1,250Canadian dollar US dollar 436,102 309,818 14-Aug-20 Citigroup Global
Markets Limited 9,000Canadian dollar US dollar 1,695,000 1,222,300 14-Aug-20 JPMorgan Chase
Bank 16,850Canadian dollar US dollar 2,882,703 2,058,525 14-Aug-20 UBS AG 48,908Canadian dollar US dollar 798,470 567,330 14-Aug-20 Canadian Imperial
Bank 16,401
03613-1A.indd 221 19/08/2020 19:01

222
Schedule of investments – as at 30 June 2020
BNy MELLON GLOBAL REAL RETURN FUND (USD)
Forward foreign currency contracts cont’d.Unrealised
Gain/(Loss)Buy Sell Amount (B) Amount (S)Settle
Date Counterparty
BNy Mellon Global Real Return Fund (USD) cont’d.US dollar Euro 141,907 130,343 15-Jul-20 JPMorgan Chase
Bank (4,238)US dollar Euro 175,095 160,395 15-Jul-20 Canadian Imperial
Bank (4,744)US dollar Euro 289,469 268,378 15-Jul-20 JPMorgan Chase
Bank (11,446)US dollar Euro 150,733 135,264 15-Jul-20 State Street Bank (929)US dollar Euro 32,269 28,878 15-Jul-20 State Street Bank (110)US dollar Euro 236,244 215,529 15-Jul-20 State Street Bank (5,414)US dollar Euro 85,267 78,755 15-Jul-20 State Street Bank (3,035)US dollar Euro 102,394 94,540 15-Jul-20 State Street Bank (3,607)US dollar Euro 32,722 30,224 15-Jul-20 JPMorgan Chase
Bank (1,167)US dollar Euro 57,385 52,915 15-Jul-20 Royal Bank
of Scotland (1,945)US dollar Euro 26,261,018 24,241,141 15-Jul-20 JPMorgan Chase
Bank (918,884)US dollar Euro 337,898 306,985 15-Jul-20 JPMorgan Chase
Bank (6,303)US dollar Euro 32,566 30,145 15-Jul-20 Canadian Imperial
Bank (1,234)US dollar Euro 52,556 46,903 15-Jul-20 Royal Bank
of Scotland (33)US dollar Euro 239,904 219,601 15-Jul-20 JPMorgan Chase
Bank (6,319)US dollar Hungarian forint 7,161,053 2,424,349,260 15-Jul-20 HSBC Bank plc (462,954)US dollar Sterling 565,941 464,329 15-Jul-20 Barclays Bank PLC (3,864)US dollar Sterling 164,482 134,101 15-Jul-20 Citigroup Global
Markets Limited (81)US dollar Sterling 82,812 67,866 15-Jul-20 State Street Bank (470)US dollar Sterling 96,962 79,230 15-Jul-20 HSBC Bank plc (265)US dollar Swedish krona 1,000,577 10,132,101 15-Jul-20 JPMorgan Chase
Bank (81,044)US dollar Canadian dollar 7,908,157 11,121,249 14-Aug-20 HSBC Bank plc (222,159)US dollar Hong Kong dollar 922,041 7,166,000 14-Aug-20 The Bank of
New York Mellon (2,384)US dollar Hong Kong dollar 6,503,361 50,467,229 14-Aug-20 Barclays Bank PLC (6,994)US dollar New Zealand dollar 5,377,329 8,908,027 14-Aug-20 State Street Bank (327,500)US dollar Swiss franc 404,213 391,411 14-Aug-20 State Street Bank (8,080)US dollar Swiss franc 8,532,455 8,298,614 14-Aug-20 State Street Bank (208,907)Australian dollar US dollar 102,804 71,504 15-Sep-20 JPMorgan Chase
Bank (1,078)US dollar Indian rupee 1,324,131 100,965,000 15-Sep-20 Citigroup Global
Markets Limited (708)
USD (2,598,021)
Net USD (1,695,606)
Forward foreign currency contracts cont’d.Unrealised
Gain/(Loss)Buy Sell Amount (B) Amount (S)Settle
Date Counterparty
BNy Mellon Global Real Return Fund (USD) cont’d.Canadian dollar US dollar 1,332,130 959,549 14-Aug-20 Royal Bank
of Scotland 14,320Canadian dollar US dollar 534,189 383,990 14-Aug-20 JPMorgan Chase
Bank 6,535Canadian dollar US dollar 49,280 35,294 14-Aug-20 State Street Bank 733Hong Kong dollar US dollar 356,966 46,046 14-Aug-20 Canadian Imperial
Bank 3New Zealand dollar US dollar 1,970,289 1,198,142 14-Aug-20 HSBC Bank plc 63,659New Zealand dollar US dollar 655,967 395,069 14-Aug-20 Citigroup Global
Markets Limited 25,021New Zealand dollar US dollar 1,169,600 706,740 14-Aug-20 Citigroup Global
Markets Limited 42,288US dollar Australian dollar 15,876,573 22,701,532 15-Sep-20 HSBC Bank plc 324,942US dollar Danish krone 1,782,358 11,667,000 15-Sep-20 Royal Bank
of Scotland 24,631US dollar Indonesian rupiah 487,214 7,001,272,000 15-Sep-20 State Street Bank 12,101
USD 902,415
US dollar Sterling 112,365 91,624 01-Jul-20 Citigroup Global Markets Limited (62)
Euro US dollar 19,639 22,097 15-Jul-20 The Bank of New York Mellon (78)
Euro US dollar 113,909 127,998 15-Jul-20 UBS AG (279)Euro US dollar 48,838 55,123 15-Jul-20 Royal Bank
of Scotland (365)Euro US dollar 85,716 97,285 15-Jul-20 Canadian Imperial
Bank (1,177)Euro US dollar 579,963 657,256 15-Jul-20 Royal Bank
of Scotland (6,984)Euro US dollar 19,875 22,287 15-Jul-20 Barclays Bank PLC (2)Euro US dollar 68,311 76,624 15-Jul-20 UBS AG (31)Euro US dollar 535,251 600,530 15-Jul-20 JPMorgan Chase
Bank (390)Euro US dollar 53,946 60,701 15-Jul-20 State Street Bank (215)Sterling US dollar 19,729 24,416 15-Jul-20 Canadian Imperial
Bank (205)Sterling US dollar 1,112,000 1,372,067 15-Jul-20 State Street Bank (7,469)Sterling US dollar 63,531 78,858 15-Jul-20 State Street Bank (896)Sterling US dollar 372,564 464,116 15-Jul-20 State Street Bank (6,922)Sterling US dollar 1,641,000 2,039,364 15-Jul-20 The Bank of
New York Mellon (25,600)Sterling US dollar 55,609 69,137 15-Jul-20 The Bank of
New York Mellon (896)Sterling US dollar 13,816 17,353 15-Jul-20 JPMorgan Chase
Bank (399)Sterling US dollar 149,257 183,618 15-Jul-20 JPMorgan Chase
Bank (456)US dollar Euro 5,121,140 4,700,000 15-Jul-20 JPMorgan Chase
Bank (148,642)US dollar Euro 87,673 79,662 15-Jul-20 Canadian Imperial
Bank (1,646)US dollar Euro 184,076 167,537 15-Jul-20 State Street Bank (3,772)US dollar Euro 207,344 188,374 15-Jul-20 State Street Bank (3,867)US dollar Euro 496,169 455,645 15-Jul-20 Barclays Bank PLC (14,714)US dollar Euro 186,480 172,419 15-Jul-20 JPMorgan Chase
Bank (6,841)US dollar Euro 98,788 90,206 15-Jul-20 State Street Bank (2,354)US dollar Euro 592,666 548,962 15-Jul-20 JPMorgan Chase
Bank (22,846)US dollar Euro 117,388 107,516 15-Jul-20 JPMorgan Chase
Bank (3,162)US dollar Euro 892,217 817,958 15-Jul-20 JPMorgan Chase
Bank (24,902)US dollar Euro 296,600 272,385 15-Jul-20 JPMorgan Chase
Bank (8,806)US dollar Euro 155,902 142,050 15-Jul-20 JPMorgan Chase
Bank (3,368)US dollar Euro 188,110 172,033 15-Jul-20 State Street Bank (4,779)
03613-1A.indd 222 19/08/2020 19:01

223
Schedule of investments – as at 30 June 2020
Holdings Description
Fair value
Total net assets
% Holdings Description
Fair value
Total net assets
%
Collective investment schemes
Supranational - 40,036,541 (31 December 2019: 62,778,833) 40,036,541 5.59
40,036,541 Insight Liquidity Funds Plc - ILF USD Liquidity Fund 40,036,541 5.59
Total investments in collective investment schemes 40,036,541 5.59
Bonds
Australia - 26,282,748 (31 December 2019: 30,117,745) 26,282,748 3.67
10,025,000 Barminco Finance Pty Ltd ‘REGS’ 6.625% 15-May-2022 9,931,016 1.39
12,650,000 Emeco Pty Ltd 9.250% 31-Mar-2022 12,776,500 1.78 3,500,000 FMG Resources August 2006 Pty Ltd ‘144A’
4.750% 15-May-2022 3,575,232 0.50
Brazil - 15,780,698 (31 December 2019: 16,399,985) 15,780,698 2.20
15,700,000 MARB BondCo Plc ‘REGS’ 7.000% 15-Mar-2024 15,780,698 2.20
Canada - 6,794,305 (31 December 2019: 34,920,894) 6,794,305 0.95
7,000,000 NOVA Chemicals Corp ‘144A’ 5.250% 01-Aug-2023 6,794,305 0.95
Chile - 10,380,592 (31 December 2019: 6,811,441) 10,380,592 1.45
6,648,000 VTR Finance NV ‘144A’ 6.875% 15-Jan-2024 6,800,372 0.95 3,500,000 VTR Finance NV ‘REGS’ 6.875% 15-Jan-2024 3,580,220 0.50
China - 16,640,331 (31 December 2019: –) 16,640,331 2.32
3,500,000 China Evergrande Group 6.250% 28-Jun-2021 3,370,937 0.47 7,786,000 Kaisa Group Holdings Ltd 6.750% 18-Feb-2021 7,776,269 1.08 5,500,000 Kaisa Group Holdings Ltd 7.875% 09-Jun-2021 5,493,125 0.77
Democratic Republic of Congo - 7,561,415 (31 December 2019: 7,246,211) 7,561,415 1.05
7,450,000 HTA Group Ltd/Mauritius ‘REGS’ 7.000% 18-Dec-2025 7,561,415 1.05
Denmark - 12,110,321 (31 December 2019: 7,468,650) 12,110,321 1.69
7,000,000 DKT Finance ApS ‘144A’ 9.375% 17-Jun-2023 7,061,250 0.99 4,500,000 DKT Finance ApS ‘REGS’ 7.000% 17-Jun-2023 5,049,071 0.70
France - 44,615,014 (31 December 2019: 36,990,401) 44,615,014 6.22
5,000,000 Altice France SA/France ‘REGS’ 2.500% 15-Jan-2025 5,369,091 0.75
9,000,000 Casino Guichard Perrachon SA ‘EMTN’ 1.865% 13-Jun-2022 9,766,970 1.36
1,500,000 CGG Holding US Inc ‘REGS’ 7.875% 01-May-2023 1,716,060 0.24 5,000,000 Constantin Investissement 3 SASU ‘REGS’
5.375% 15-Apr-2025 5,660,442 0.79 8,000,000 Parts Europe SA ‘REGS’ 4.375% 01-May-2022 8,719,715 1.21 4,350,000 Parts Europe SA ‘REGS’ FRN
5.500% 01-May-2022 4,721,942 0.66 3,500,000 Rubis Terminal Infra SAS ‘REGS’
5.625% 15-May-2025 4,072,556 0.57 1,870,000 SPCM SA ‘144A’ 4.875% 15-Sep-2025 1,890,355 0.26
500,000 SPCM SA ‘REGS’ 2.875% 15-Jun-2023 560,142 0.08 3,000,000 Vallourec SA ‘REGS’ 6.625% 15-Oct-2022 2,137,741 0.30
Germany - 28,703,217 (31 December 2019: 11,659,489) 28,703,217 4.00
7,000,000 CeramTec BondCo GmbH ‘REGS’ 5.250% 15-Dec-2025 7,706,233 1.08
2,000,000 Nidda BondCo GmbH ‘REGS’ 5.000% 30-Sep-2025 2,225,895 0.31 1,000,000 Nidda BondCo GmbH ‘REGS’ 7.250% 30-Sep-2025 1,149,611 0.16 7,000,000 Nidda Healthcare Holding GmbH ‘REGS’
3.500% 30-Sep-2024 7,773,443 1.08 5,000,000 Techem Verwaltungsgesellschaft 674 mbH ‘REGS’
6.000% 30-Jul-2026 5,760,048 0.80 1,100,000 thyssenkrupp AG ‘EMTN’ 1.750% 25-Nov-2020 1,237,285 0.17 2,767,000 ZF North America Capital Inc ‘144A’
4.500% 29-Apr-2022 2,850,702 0.40
Ghana - 2,158,140 (31 December 2019: 13,872,525) 2,158,140 0.30
2,945,000 Tullow Oil Plc ‘REGS’ 6.250% 15-Apr-2022 2,158,140 0.30
Hong Kong - 14,690,912 (31 December 2019: 16,765,286) 14,690,912 2.05
14,516,000 Metropolitan Light Co Ltd ‘REGS’ 5.500% 21-Nov-2022 14,690,912 2.05
Indonesia - 8,053,003 (31 December 2019: 5,302,393) 8,053,003 1.12
8,000,000 Medco Strait Services Pte Ltd ‘REGS’ 8.500% 17-Aug-2022 8,053,003 1.12
Italy - 14,498,127 (31 December 2019: 8,806,319) 14,498,127 2.02
5,000,000 Fabric BC SpA ‘REGS’ FRN 4.125% 31-Aug-2026 5,505,154 0.77 9,000,000 Fire BC SpA ‘REGS’ FRN 4.750% 30-Sep-2024 8,992,973 1.25
Luxembourg - 58,323,595 (31 December 2019: 26,724,775) 58,323,595 8.14
5,000,000 Altice Financing SA ‘144A’ 7.500% 15-May-2026 5,250,125 0.73
10,000,000 Altice Financing SA ‘REGS’ 2.250% 15-Jan-2025 10,603,039 1.48 14,000,000 Altice France Holding SA ‘144A’
8.000% 15-May-2027 16,644,204 2.32 2,300,000 Altice France Holding SA ‘144A’
10.500% 15-May-2027 2,543,627 0.36 6,240,000 Altice France Holding SA ‘REGS’
8.000% 15-May-2027 7,438,435 1.04 3,900,000 Groupe Ecore Holding SAS ‘REGS’ FRN
6.250% 15-Nov-2023 2,782,350 0.39 3,640,000 INEOS Group Holdings SA ‘144A’
5.625% 01-Aug-2024 3,532,019 0.49 8,626,000 INEOS Group Holdings SA ‘REGS’
5.375% 01-Aug-2024 9,529,796 1.33
Mexico - 16,023,003 (31 December 2019: 11,453,646) 16,023,003 2.23
4,926,000 Axtel SAB de CV ‘REGS’ 6.375% 14-Nov-2024 5,128,582 0.71 4,772,000 CEMEX Finance LLC ‘144A’ 6.000% 01-Apr-2024 4,737,689 0.66 5,530,000 Petroleos Mexicanos ‘REGS’
3.125% 27-Nov-2020 6,156,732 0.86
FUND 34 – BNyM GLOBAL SHORT-DATED HIGH yIELD BOND
BNY MELLON GLOBAL SHORT-DATED HIGH YIELD BOND FUND
Bonds cont’d.
France cont’d.
USDUSD
03613-1A.indd 223 19/08/2020 19:01
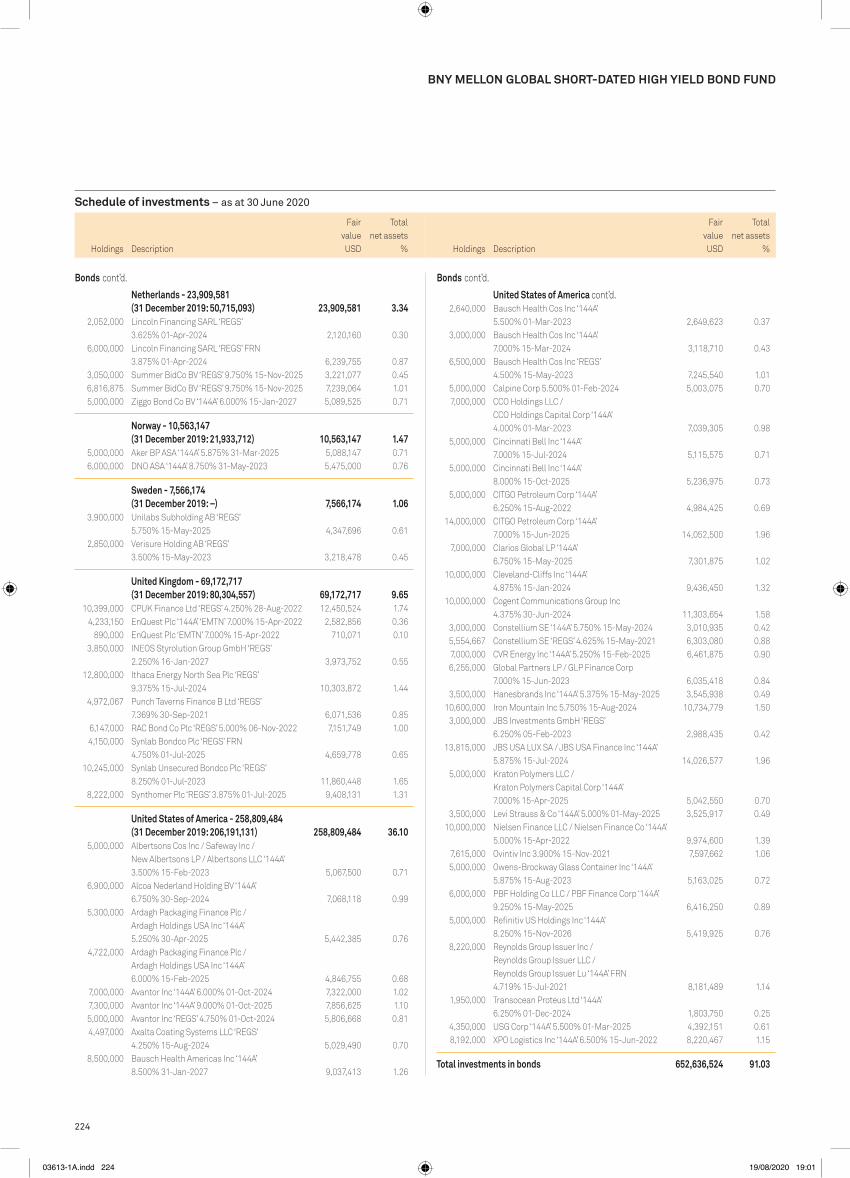
224
Schedule of investments – as at 30 June 2020
Holdings Description
Fair value
Total net assets
% Holdings Description
Fair value
Total net assets
%
BNy MELLON GLOBAL SHORT-DATED HIGH yIELD BOND FUND
Netherlands - 23,909,581 (31 December 2019: 50,715,093) 23,909,581 3.34
2,052,000 Lincoln Financing SARL ‘REGS’ 3.625% 01-Apr-2024 2,120,160 0.30
6,000,000 Lincoln Financing SARL ‘REGS’ FRN 3.875% 01-Apr-2024 6,239,755 0.87
3,050,000 Summer BidCo BV ‘REGS’ 9.750% 15-Nov-2025 3,221,077 0.45 6,816,875 Summer BidCo BV ‘REGS’ 9.750% 15-Nov-2025 7,239,064 1.01 5,000,000 Ziggo Bond Co BV ‘144A’ 6.000% 15-Jan-2027 5,089,525 0.71
Norway - 10,563,147 (31 December 2019: 21,933,712) 10,563,147 1.47
5,000,000 Aker BP ASA ‘144A’ 5.875% 31-Mar-2025 5,088,147 0.71 6,000,000 DNO ASA ‘144A’ 8.750% 31-May-2023 5,475,000 0.76
Sweden - 7,566,174 (31 December 2019: –) 7,566,174 1.06
3,900,000 Unilabs Subholding AB ‘REGS’ 5.750% 15-May-2025 4,347,696 0.61
2,850,000 Verisure Holding AB ‘REGS’ 3.500% 15-May-2023 3,218,478 0.45
United Kingdom - 69,172,717 (31 December 2019: 80,304,557) 69,172,717 9.65
10,399,000 CPUK Finance Ltd ‘REGS’ 4.250% 28-Aug-2022 12,450,524 1.74 4,233,150 EnQuest Plc ‘144A’ ‘EMTN’ 7.000% 15-Apr-2022 2,582,856 0.36 890,000 EnQuest Plc ‘EMTN’ 7.000% 15-Apr-2022 710,071 0.10 3,850,000 INEOS Styrolution Group GmbH ‘REGS’
2.250% 16-Jan-2027 3,973,752 0.55 12,800,000 Ithaca Energy North Sea Plc ‘REGS’
9.375% 15-Jul-2024 10,303,872 1.44 4,972,067 Punch Taverns Finance B Ltd ‘REGS’
7.369% 30-Sep-2021 6,071,536 0.85 6,147,000 RAC Bond Co Plc ‘REGS’ 5.000% 06-Nov-2022 7,151,749 1.00 4,150,000 Synlab Bondco Plc ‘REGS’ FRN
4.750% 01-Jul-2025 4,659,778 0.65 10,245,000 Synlab Unsecured Bondco Plc ‘REGS’
8.250% 01-Jul-2023 11,860,448 1.65 8,222,000 Synthomer Plc ‘REGS’ 3.875% 01-Jul-2025 9,408,131 1.31
United States of America - 258,809,484 (31 December 2019: 206,191,131) 258,809,484 36.10
5,000,000 Albertsons Cos Inc / Safeway Inc / New Albertsons LP / Albertsons LLC ‘144A’ 3.500% 15-Feb-2023 5,067,500 0.71
6,900,000 Alcoa Nederland Holding BV ‘144A’ 6.750% 30-Sep-2024 7,068,118 0.99
5,300,000 Ardagh Packaging Finance Plc / Ardagh Holdings USA Inc ‘144A’ 5.250% 30-Apr-2025 5,442,385 0.76
4,722,000 Ardagh Packaging Finance Plc / Ardagh Holdings USA Inc ‘144A’ 6.000% 15-Feb-2025 4,846,755 0.68
7,000,000 Avantor Inc ‘144A’ 6.000% 01-Oct-2024 7,322,000 1.02 7,300,000 Avantor Inc ‘144A’ 9.000% 01-Oct-2025 7,856,625 1.10 5,000,000 Avantor Inc ‘REGS’ 4.750% 01-Oct-2024 5,806,668 0.81 4,497,000 Axalta Coating Systems LLC ‘REGS’
4.250% 15-Aug-2024 5,029,490 0.70 8,500,000 Bausch Health Americas Inc ‘144A’
8.500% 31-Jan-2027 9,037,413 1.26
Bonds cont’d.
2,640,000 Bausch Health Cos Inc ‘144A’ 5.500% 01-Mar-2023 2,649,623 0.37
3,000,000 Bausch Health Cos Inc ‘144A’ 7.000% 15-Mar-2024 3,118,710 0.43
6,500,000 Bausch Health Cos Inc ‘REGS’ 4.500% 15-May-2023 7,245,540 1.01
5,000,000 Calpine Corp 5.500% 01-Feb-2024 5,003,075 0.70 7,000,000 CCO Holdings LLC /
CCO Holdings Capital Corp ‘144A’ 4.000% 01-Mar-2023 7,039,305 0.98
5,000,000 Cincinnati Bell Inc ‘144A’ 7.000% 15-Jul-2024 5,115,575 0.71
5,000,000 Cincinnati Bell Inc ‘144A’ 8.000% 15-Oct-2025 5,236,975 0.73
5,000,000 CITGO Petroleum Corp ‘144A’ 6.250% 15-Aug-2022 4,984,425 0.69
14,000,000 CITGO Petroleum Corp ‘144A’ 7.000% 15-Jun-2025 14,052,500 1.96
7,000,000 Clarios Global LP ‘144A’ 6.750% 15-May-2025 7,301,875 1.02
10,000,000 Cleveland-Cliffs Inc ‘144A’ 4.875% 15-Jan-2024 9,436,450 1.32
10,000,000 Cogent Communications Group Inc 4.375% 30-Jun-2024 11,303,654 1.58
3,000,000 Constellium SE ‘144A’ 5.750% 15-May-2024 3,010,935 0.42 5,554,667 Constellium SE ‘REGS’ 4.625% 15-May-2021 6,303,080 0.88 7,000,000 CVR Energy Inc ‘144A’ 5.250% 15-Feb-2025 6,461,875 0.90 6,255,000 Global Partners LP / GLP Finance Corp
7.000% 15-Jun-2023 6,035,418 0.84 3,500,000 Hanesbrands Inc ‘144A’ 5.375% 15-May-2025 3,545,938 0.49 10,600,000 Iron Mountain Inc 5.750% 15-Aug-2024 10,734,779 1.50 3,000,000 JBS Investments GmbH ‘REGS’
6.250% 05-Feb-2023 2,988,435 0.42 13,815,000 JBS USA LUX SA / JBS USA Finance Inc ‘144A’
5.875% 15-Jul-2024 14,026,577 1.96 5,000,000 Kraton Polymers LLC /
Kraton Polymers Capital Corp ‘144A’ 7.000% 15-Apr-2025 5,042,550 0.70
3,500,000 Levi Strauss & Co ‘144A’ 5.000% 01-May-2025 3,525,917 0.49 10,000,000 Nielsen Finance LLC / Nielsen Finance Co ‘144A’
5.000% 15-Apr-2022 9,974,600 1.39 7,615,000 Ovintiv Inc 3.900% 15-Nov-2021 7,597,662 1.06 5,000,000 Owens-Brockway Glass Container Inc ‘144A’
5.875% 15-Aug-2023 5,163,025 0.72 6,000,000 PBF Holding Co LLC / PBF Finance Corp ‘144A’
9.250% 15-May-2025 6,416,250 0.89 5,000,000 Refinitiv US Holdings Inc ‘144A’
8.250% 15-Nov-2026 5,419,925 0.76 8,220,000 Reynolds Group Issuer Inc /
Reynolds Group Issuer LLC / Reynolds Group Issuer Lu ‘144A’ FRN 4.719% 15-Jul-2021 8,181,489 1.14
1,950,000 Transocean Proteus Ltd ‘144A’ 6.250% 01-Dec-2024 1,803,750 0.25
4,350,000 USG Corp ‘144A’ 5.500% 01-Mar-2025 4,392,151 0.61 8,192,000 XPO Logistics Inc ‘144A’ 6.500% 15-Jun-2022 8,220,467 1.15
Total investments in bonds 652,636,524 91.03
Bonds cont’d.
United States of America cont’d.
USDUSD
03613-1A.indd 224 19/08/2020 19:01

225
Schedule of investments – as at 30 June 2020
BNy MELLON GLOBAL SHORT-DATED HIGH yIELD BOND FUND
Leveraged loans
Netherlands - 1,117,181 (31 December 2019: –) 1,117,181 0.16
1,000,000 Nielsen Holding & Finance BV Term Loan 0.000% 30-Jun-2025 1,117,181 0.16
Norway - 7,864,506 (31 December 2019: 7,851,904) 7,864,506 1.10
7,000,000 INEOS Rafnes AS 0.000% 08-Nov-2024 7,864,506 1.10
Sweden - 5,483,499 (31 December 2019: –) 5,483,499 0.76
5,000,000 Verisure Holding AB Term Loan 0.000% 10-Oct-2022 5,483,499 0.76
United Kingdom - 9,696,805 (31 December 2019: 4,489,607) 9,696,805 1.35
5,000,000 Froneri Plc Term Loan 0.000% 31-Jan-2028 5,584,726 0.78 3,753,906 INEOS Enterprises Holdings II Ltd
0.000% 03-Sep-2024 4,112,079 0.57
United States of America - 19,810,361 (31 December 2019: 12,683,110) 19,810,361 2.76
7,500,000 Berry Global Inc Term Loan 0.000% 01-Oct-2022 7,331,662 1.02
7,000,000 PG&E Corp Term Loan 0.000% 31-Dec-2020 6,985,405 0.97 4,974,811 Refinitiv US Holdings Inc 0.000% 01-Oct-2025 5,493,294 0.77
Total investments in leveraged loans 43,972,352 6.13 Unrealised gain on forward foreign currency contracts - 1,614,579 (see below) (31 December 2019: 4,062,199) 1,614,579 0.23
Total financial assets at fair value through profit or loss 738,259,996 102.98 Unrealised loss on forward foreign currency contracts - (14,315,792) (see below) (31 December 2019: (3,527,822)) (14,315,792) (2.00)
Total financial liabilities at fair value through profit or loss (14,315,792) (2.00)
Net current liabilities (6,989,561) (0.98)
Total net assets 716,954,643 100.00
Analysis of portfolio % of Total Assets
Transferable securities and money market instruments admitted to official stock exchange listing or traded on a regulated market 91.05Transferable securities and money market instruments other than those admitted to official stock exchange listing or traded on a regulated market 5.78oTC financial derivative instruments 0.21other current assets 2.96
Total assets 100.00
Holdings Description
Fair value USD
Total net assets
%
Forward foreign currency contracts cont’d.Unrealised
Gain/(Loss)Buy Sell Amount (B) Amount (S)Settle
Date Counterparty
BNy Mellon Global Short-Dated High yield Bond FundEuro US dollar 1,844,000 2,066,364 01-Jul-20 Morgan Stanley 5,371Euro US dollar 12,526,000 13,805,090 01-Jul-20 Goldman Sachs 267,881Euro US dollar 6,621,000 7,151,614 01-Jul-20 Bank of America
Merrill Lynch 287,085US dollar Euro 4,095,114 3,636,000 01-Jul-20 Goldman Sachs 10,065Euro US dollar 2,236,000 2,505,134 20-Jul-20 Bank of America
Merrill Lynch 8,065US dollar Euro 2,292,116 2,027,000 20-Jul-20 Citigroup Global
Markets Limited 13,827US dollar Euro 3,425,185 3,006,000 20-Jul-20 Citigroup Global
Markets Limited 46,529US dollar Euro 950,972 840,000 20-Jul-20 Bank of America
Merrill Lynch 6,836US dollar Euro 9,437,243 8,347,000 20-Jul-20 Bank of America
Merrill Lynch 55,460US dollar Euro 235,164 208,000 20-Jul-20 Morgan Stanley 1,379US dollar Sterling 2,411,574 1,905,000 03-Aug-20 Goldman Sachs 50,561US dollar Euro 3,343,802 2,943,000 06-Aug-20 Citigroup Global
Markets Limited 34,672US dollar Euro 5,526,143 4,863,000 06-Aug-20 Bank of America
Merrill Lynch 58,150US dollar Euro 3,288,850 2,921,000 19-Aug-20 Bank of America
Merrill Lynch 3,520US dollar Euro 2,359,470 2,090,000 19-Aug-20 Barclays Bank PLC 8,789US dollar Euro 55,032,782 48,573,000 19-Aug-20 Barclays Bank PLC 401,372US dollar Euro 61,142,350 54,134,000 14-Sep-20 Barclays Bank PLC 220,788
USD 1,480,350
Euro US dollar 1,830,000 2,068,753 01-Jul-20 Bank of America Merrill Lynch (12,746)
Euro US dollar 54,322,000 61,255,117 01-Jul-20 Barclays Bank PLC (224,305)US dollar Euro 8,426,188 7,756,000 01-Jul-20 Bank of America
Merrill Lynch (287,684)US dollar Euro 2,812,165 2,581,000 01-Jul-20 RBC Capital
Markets (87,591)US dollar Euro 49,819,986 45,651,000 01-Jul-20 RBC Capital
Markets (1,468,950)US dollar Euro 4,581,780 4,085,000 01-Jul-20 Citigroup Global
Markets Limited (7,721)US dollar Euro 259,278 232,000 01-Jul-20 Bank of America
Merrill Lynch (1,374)US dollar Euro 11,212,667 10,086,000 01-Jul-20 Bank of America
Merrill Lynch (118,963)US dollar Euro 1,894,980 1,700,000 01-Jul-20 Bank of America
Merrill Lynch (14,972)Euro US dollar 2,063,000 2,332,077 20-Jul-20 Bank of America
Merrill Lynch (13,325)Euro US dollar 400,000 451,716 20-Jul-20 Goldman Sachs (2,128)US dollar Euro 1,987,602 1,805,000 20-Jul-20 Goldman Sachs (41,166)US dollar Euro 16,505,758 15,158,000 20-Jul-20 Bank of America
Merrill Lynch (531,390)US dollar Euro 4,694,683 4,343,000 20-Jul-20 Bank of America
Merrill Lynch (186,722)US dollar Euro 727,533 663,000 20-Jul-20 Bank of America
Merrill Lynch (17,659)US dollar Euro 2,535,666 2,340,000 20-Jul-20 HSBC Bank plc (94,426)US dollar Euro 23,707,449 21,877,000 20-Jul-20 UBS AG (881,659)US dollar Euro 3,251,404 2,963,000 20-Jul-20 Bank of America
Merrill Lynch (78,922)Sterling US dollar 13,309,000 16,849,500 03-Aug-20 RBC Capital
Markets (354,632)US dollar Sterling 40,296,576 33,112,000 03-Aug-20 UBS AG (741,675)US dollar Euro 53,130,256 48,472,000 06-Aug-20 Bank of America
Merrill Lynch (1,372,014)US dollar Euro 2,068,519 1,844,000 19-Aug-20 Morgan Stanley (5,479)
USD (6,545,503)
Net USD (5,065,153)
03613-1A.indd 225 19/08/2020 19:01

226
Schedule of investments – as at 30 June 2020
BNy MELLON GLOBAL SHORT-DATED HIGH yIELD BOND FUND
Forward foreign currency contracts cont’d.Unrealised
Gain/(Loss)Buy Sell Amount (B) Amount (S)Settle
Date Counterparty
BNy Mellon Global Short-Dated High yield Bond Fund CHF W (Acc) (Hedged) Share ClassSwiss franc US dollar 23,768,483 25,046,737 15-Jul-20 The Bank of
New York Mellon 50,336
USD 50,336
CHF 47,691
BNy Mellon Global Short-Dated High yield Bond Fund EUR H (Acc) (Hedged) Share ClassEuro US dollar 94,714 106,340 01-Jul-20 The Bank of
New York Mellon 71US dollar Euro 33,695 29,988 02-Jul-20 The Bank of
New York Mellon 4Euro US dollar 89,804 100,510 15-Jul-20 The Bank of
New York Mellon 416Euro US dollar 7,500 8,419 15-Jul-20 The Bank of
New York Mellon 10US dollar Euro 241,805 213,830 15-Jul-20 The Bank of
New York Mellon 1,494US dollar Euro 170,570 151,465 15-Jul-20 The Bank of
New York Mellon 348US dollar Euro 253,294 225,307 15-Jul-20 The Bank of
New York Mellon 84US dollar Euro 308,004 273,422 15-Jul-20 The Bank of
New York Mellon 722US dollar Euro 39,488 34,879 15-Jul-20 The Bank of
New York Mellon 290US dollar Euro 47,439 42,127 15-Jul-20 The Bank of
New York Mellon 96US dollar Euro 153,104 134,321 15-Jul-20 The Bank of
New York Mellon 2,149US dollar Euro 31,098 27,412 15-Jul-20 The Bank of
New York Mellon 292US dollar Euro 314,514 278,169 15-Jul-20 The Bank of
New York Mellon 1,897US dollar Euro 103,793 92,348 15-Jul-20 The Bank of
New York Mellon 9US dollar Euro 228,235 202,760 15-Jul-20 The Bank of
New York Mellon 365
USD 8,247
EUR 7,340
Euro US dollar 92,348 103,767 02-Jul-20 The Bank of New York Mellon (14)
Euro US dollar 19,990 22,518 15-Jul-20 The Bank of New York Mellon (53)
Euro US dollar 34,636 39,213 15-Jul-20 The Bank of New York Mellon (288)
Euro US dollar 69,748 78,874 15-Jul-20 The Bank of New York Mellon (489)
Euro US dollar 15,000 16,960 15-Jul-20 The Bank of New York Mellon (102)
Euro US dollar 78,770,066 89,485,267 15-Jul-20 The Bank of New York Mellon (960,301)
Euro US dollar 29,988 33,704 15-Jul-20 The Bank of New York Mellon (3)
US dollar Euro 84,715 75,692 15-Jul-20 The Bank of New York Mellon (350)
US dollar Euro 70,162 62,593 15-Jul-20 The Bank of New York Mellon (183)
Forward foreign currency contracts cont’d.Unrealised
Gain/(Loss)Buy Sell Amount (B) Amount (S)Settle
Date Counterparty
BNy Mellon Global Short-Dated High yield Bond Fund EUR H (Acc) (Hedged) Share Class cont’d.US dollar Euro 106,369 94,714 15-Jul-20 The Bank of
New York Mellon (74)US dollar Euro 78,866 70,258 15-Jul-20 The Bank of
New York Mellon (92)
USD (961,949)
EUR (856,207)
Net USD (953,702)
Net EUR (848,867)
BNy Mellon Global Short-Dated High yield Bond Fund EUR H (Inc) (Hedged) Share ClassUS dollar Euro 23,918 21,239 15-Jul-20 The Bank of
New York Mellon 48
USD 48
EUR 43
Euro US dollar 1,876,446 2,131,702 15-Jul-20 The Bank of New York Mellon (22,876)
USD (22,876)
EUR (20,361)
Net USD (22,828)
Net EUR (20,318)
BNy Mellon Global Short-Dated High yield Bond Fund EUR I (Acc) (Hedged) Share ClassEuro US dollar 19,087 21,395 15-Jul-20 The Bank of
New York Mellon 56US dollar Euro 13,180 11,704 15-Jul-20 The Bank of
New York Mellon 27US dollar Euro 6,981 6,124 15-Jul-20 The Bank of
New York Mellon 98US dollar Euro 2,713 2,400 15-Jul-20 The Bank of
New York Mellon 16
USD 197
EUR 175
Euro US dollar 61,224 69,236 15-Jul-20 The Bank of New York Mellon (429)
Euro US dollar 14,201,790 16,133,679 15-Jul-20 The Bank of New York Mellon (173,137)
USD (173,566)
EUR (154,487)
Net USD (173,369)
Net EUR (154,312)
03613-1A.indd 226 19/08/2020 19:01
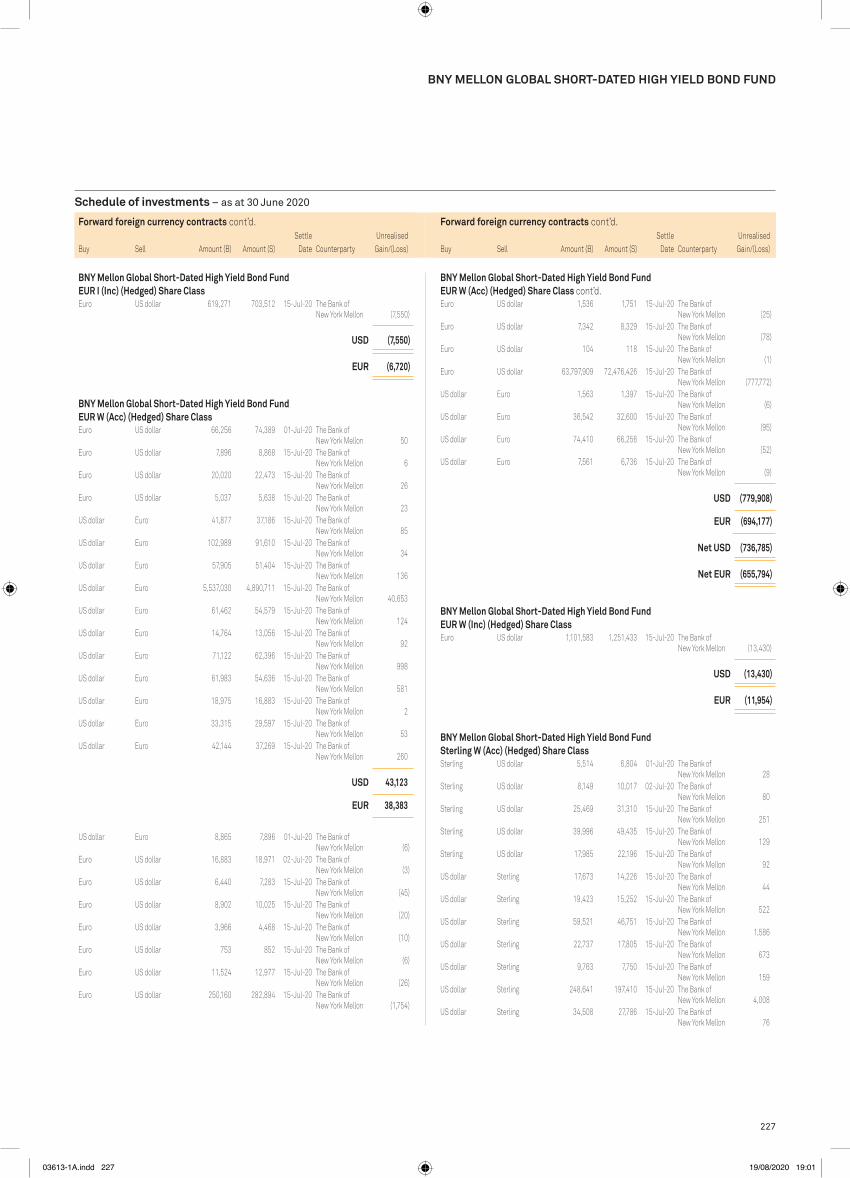
227
Schedule of investments – as at 30 June 2020
BNy MELLON GLOBAL SHORT-DATED HIGH yIELD BOND FUND
Forward foreign currency contracts cont’d.Unrealised
Gain/(Loss)Buy Sell Amount (B) Amount (S)Settle
Date Counterparty
BNy Mellon Global Short-Dated High yield Bond Fund EUR I (Inc) (Hedged) Share ClassEuro US dollar 619,271 703,512 15-Jul-20 The Bank of
New York Mellon (7,550)
USD (7,550)
EUR (6,720)
BNy Mellon Global Short-Dated High yield Bond Fund EUR W (Acc) (Hedged) Share ClassEuro US dollar 66,256 74,389 01-Jul-20 The Bank of
New York Mellon 50Euro US dollar 7,896 8,868 15-Jul-20 The Bank of
New York Mellon 6Euro US dollar 20,020 22,473 15-Jul-20 The Bank of
New York Mellon 26Euro US dollar 5,037 5,638 15-Jul-20 The Bank of
New York Mellon 23US dollar Euro 41,877 37,186 15-Jul-20 The Bank of
New York Mellon 85US dollar Euro 102,989 91,610 15-Jul-20 The Bank of
New York Mellon 34US dollar Euro 57,905 51,404 15-Jul-20 The Bank of
New York Mellon 136US dollar Euro 5,537,030 4,890,711 15-Jul-20 The Bank of
New York Mellon 40,653US dollar Euro 61,462 54,579 15-Jul-20 The Bank of
New York Mellon 124US dollar Euro 14,764 13,056 15-Jul-20 The Bank of
New York Mellon 92US dollar Euro 71,122 62,396 15-Jul-20 The Bank of
New York Mellon 998US dollar Euro 61,983 54,636 15-Jul-20 The Bank of
New York Mellon 581US dollar Euro 18,975 16,883 15-Jul-20 The Bank of
New York Mellon 2US dollar Euro 33,315 29,597 15-Jul-20 The Bank of
New York Mellon 53US dollar Euro 42,144 37,269 15-Jul-20 The Bank of
New York Mellon 260
USD 43,123
EUR 38,383
US dollar Euro 8,865 7,896 01-Jul-20 The Bank of New York Mellon (6)
Euro US dollar 16,883 18,971 02-Jul-20 The Bank of New York Mellon (3)
Euro US dollar 6,440 7,283 15-Jul-20 The Bank of New York Mellon (45)
Euro US dollar 8,902 10,025 15-Jul-20 The Bank of New York Mellon (20)
Euro US dollar 3,966 4,468 15-Jul-20 The Bank of New York Mellon (10)
Euro US dollar 753 852 15-Jul-20 The Bank of New York Mellon (6)
Euro US dollar 11,524 12,977 15-Jul-20 The Bank of New York Mellon (26)
Euro US dollar 250,160 282,894 15-Jul-20 The Bank of New York Mellon (1,754)
Forward foreign currency contracts cont’d.Unrealised
Gain/(Loss)Buy Sell Amount (B) Amount (S)Settle
Date Counterparty
BNy Mellon Global Short-Dated High yield Bond Fund EUR W (Acc) (Hedged) Share Class cont’d.Euro US dollar 1,536 1,751 15-Jul-20 The Bank of
New York Mellon (25)Euro US dollar 7,342 8,329 15-Jul-20 The Bank of
New York Mellon (78)Euro US dollar 104 118 15-Jul-20 The Bank of
New York Mellon (1)Euro US dollar 63,797,909 72,476,426 15-Jul-20 The Bank of
New York Mellon (777,772)US dollar Euro 1,563 1,397 15-Jul-20 The Bank of
New York Mellon (6)US dollar Euro 36,542 32,600 15-Jul-20 The Bank of
New York Mellon (95)US dollar Euro 74,410 66,256 15-Jul-20 The Bank of
New York Mellon (52)US dollar Euro 7,561 6,736 15-Jul-20 The Bank of
New York Mellon (9)
USD (779,908)
EUR (694,177)
Net USD (736,785)
Net EUR (655,794)
BNy Mellon Global Short-Dated High yield Bond Fund EUR W (Inc) (Hedged) Share ClassEuro US dollar 1,101,583 1,251,433 15-Jul-20 The Bank of
New York Mellon (13,430)
USD (13,430)
EUR (11,954)
BNy Mellon Global Short-Dated High yield Bond Fund Sterling W (Acc) (Hedged) Share ClassSterling US dollar 5,514 6,804 01-Jul-20 The Bank of
New York Mellon 28Sterling US dollar 8,149 10,017 02-Jul-20 The Bank of
New York Mellon 80Sterling US dollar 25,469 31,310 15-Jul-20 The Bank of
New York Mellon 251Sterling US dollar 39,996 49,435 15-Jul-20 The Bank of
New York Mellon 129Sterling US dollar 17,985 22,196 15-Jul-20 The Bank of
New York Mellon 92US dollar Sterling 17,673 14,226 15-Jul-20 The Bank of
New York Mellon 44US dollar Sterling 19,423 15,252 15-Jul-20 The Bank of
New York Mellon 522US dollar Sterling 59,521 46,751 15-Jul-20 The Bank of
New York Mellon 1,586US dollar Sterling 22,737 17,805 15-Jul-20 The Bank of
New York Mellon 673US dollar Sterling 9,763 7,750 15-Jul-20 The Bank of
New York Mellon 159US dollar Sterling 248,641 197,410 15-Jul-20 The Bank of
New York Mellon 4,008US dollar Sterling 34,508 27,786 15-Jul-20 The Bank of
New York Mellon 76
03613-1A.indd 227 19/08/2020 19:01

228
Schedule of investments – as at 30 June 2020
BNy MELLON GLOBAL SHORT-DATED HIGH yIELD BOND FUND
Forward foreign currency contracts cont’d.Unrealised
Gain/(Loss)Buy Sell Amount (B) Amount (S)Settle
Date Counterparty
BNy Mellon Global Short-Dated High yield Bond Fund Sterling W (Acc) (Hedged) Share Class cont’d.US dollar Sterling 74,819 59,512 15-Jul-20 The Bank of
New York Mellon 1,071US dollar Sterling 52,842 42,102 15-Jul-20 The Bank of
New York Mellon 669US dollar Sterling 86,762 69,869 15-Jul-20 The Bank of
New York Mellon 179US dollar Sterling 11,764 9,439 15-Jul-20 The Bank of
New York Mellon 68US dollar Sterling 10,822 8,641 15-Jul-20 The Bank of
New York Mellon 115US dollar Sterling 15,424 12,323 15-Jul-20 The Bank of
New York Mellon 153
USD 9,903
GBp 7,992
US dollar Sterling 22,194 17,985 01-Jul-20 The Bank of New York Mellon (92)
US dollar Sterling 31,308 25,469 02-Jul-20 The Bank of New York Mellon (251)
Sterling US dollar 15,052 18,699 15-Jul-20 The Bank of New York Mellon (47)
Sterling US dollar 8,171 10,148 15-Jul-20 The Bank of New York Mellon (22)
Sterling US dollar 49,240 61,631 15-Jul-20 The Bank of New York Mellon (612)
Sterling US dollar 23,451 29,229 15-Jul-20 The Bank of New York Mellon (168)
Sterling US dollar 13,907 17,710 15-Jul-20 The Bank of New York Mellon (476)
Sterling US dollar 29,005 36,405 15-Jul-20 The Bank of New York Mellon (461)
Sterling US dollar 53,892 66,922 15-Jul-20 The Bank of New York Mellon (138)
Sterling US dollar 120,122 151,295 15-Jul-20 The Bank of New York Mellon (2,439)
Sterling US dollar 46,830 58,655 15-Jul-20 The Bank of New York Mellon (622)
Sterling US dollar 1,018,397 1,282,879 15-Jul-20 The Bank of New York Mellon (20,867)
Sterling US dollar 1,519,554 1,940,475 15-Jul-20 The Bank of New York Mellon (57,421)
Sterling US dollar 26,725 34,025 15-Jul-20 The Bank of New York Mellon (907)
Sterling US dollar 28,483 35,809 15-Jul-20 The Bank of New York Mellon (513)
Sterling US dollar 34,421,039 43,749,408 15-Jul-20 The Bank of New York Mellon (1,094,339)
US dollar Sterling 6,804 5,514 15-Jul-20 The Bank of New York Mellon (28)
US dollar Sterling 10,018 8,149 15-Jul-20 The Bank of New York Mellon (80)
US dollar Sterling 8,834 7,147 15-Jul-20 The Bank of New York Mellon (23)
USD (1,179,506)
GBp (951,905)
Net USD (1,169,603)
Net GBp (943,913)
Forward foreign currency contracts cont’d.Unrealised
Gain/(Loss)Buy Sell Amount (B) Amount (S)Settle
Date Counterparty
BNy Mellon Global Short-Dated High yield Bond Fund Sterling W (Inc) (Hedged) Share ClassSterling US dollar 1 2 15-Jul-20 The Bank of
New York Mellon - US dollar Sterling 13,267 10,570 15-Jul-20 The Bank of
New York Mellon 168US dollar Sterling 136,402 108,978 15-Jul-20 The Bank of
New York Mellon 1,355
USD 1,523
GBp 1,229
Sterling US dollar 2,484,886 3,158,309 15-Jul-20 The Bank of New York Mellon (79,001)
USD (79,001)
GBp (63,757)
Net USD (77,478)
Net GBp (62,528)
BNy Mellon Global Short-Dated High yield Bond Fund Sterling x (Acc) (Hedged) Share ClassSterling US dollar 60,309,757 76,654,169 15-Jul-20 The Bank of
New York Mellon (1,917,413)
USD (1,917,413)
GBp (1,547,423)
BNy Mellon Global Short-Dated High yield Bond Fund Sterling y (Acc) (Hedged) Share ClassUS dollar Sterling 120,489 95,689 15-Jul-20 The Bank of
New York Mellon 1,910
USD 1,910
GBp 1,541
Sterling US dollar 8,041,529 10,220,846 15-Jul-20 The Bank of New York Mellon (255,662)
USD (255,662)
GBp (206,329)
Net USD (253,752)
Net GBp (204,788)
03613-1A.indd 228 19/08/2020 19:01
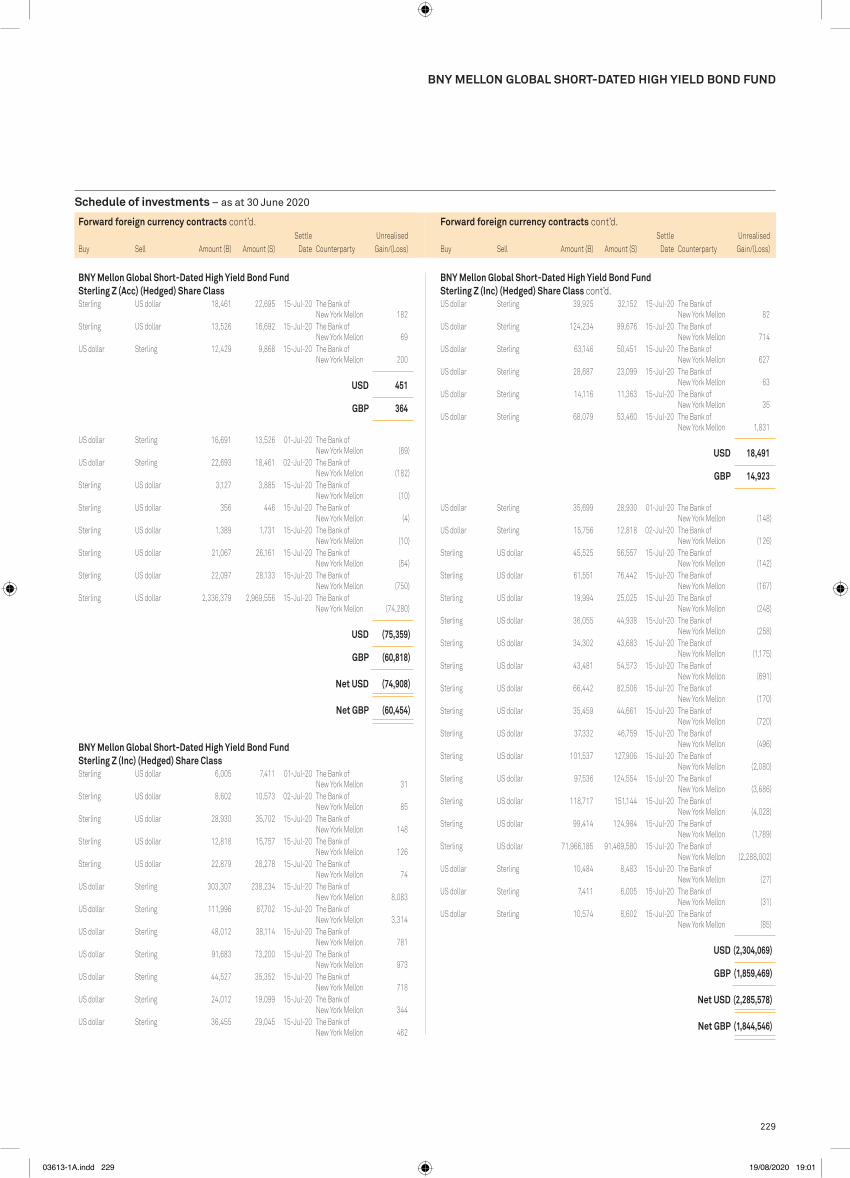
229
Schedule of investments – as at 30 June 2020
BNy MELLON GLOBAL SHORT-DATED HIGH yIELD BOND FUND
Forward foreign currency contracts cont’d.Unrealised
Gain/(Loss)Buy Sell Amount (B) Amount (S)Settle
Date Counterparty
BNy Mellon Global Short-Dated High yield Bond Fund Sterling Z (Acc) (Hedged) Share ClassSterling US dollar 18,461 22,695 15-Jul-20 The Bank of
New York Mellon 182Sterling US dollar 13,526 16,692 15-Jul-20 The Bank of
New York Mellon 69US dollar Sterling 12,429 9,868 15-Jul-20 The Bank of
New York Mellon 200
USD 451
GBp 364
US dollar Sterling 16,691 13,526 01-Jul-20 The Bank of New York Mellon (69)
US dollar Sterling 22,693 18,461 02-Jul-20 The Bank of New York Mellon (182)
Sterling US dollar 3,127 3,885 15-Jul-20 The Bank of New York Mellon (10)
Sterling US dollar 356 446 15-Jul-20 The Bank of New York Mellon (4)
Sterling US dollar 1,389 1,731 15-Jul-20 The Bank of New York Mellon (10)
Sterling US dollar 21,067 26,161 15-Jul-20 The Bank of New York Mellon (54)
Sterling US dollar 22,097 28,133 15-Jul-20 The Bank of New York Mellon (750)
Sterling US dollar 2,336,379 2,969,556 15-Jul-20 The Bank of New York Mellon (74,280)
USD (75,359)
GBp (60,818)
Net USD (74,908)
Net GBp (60,454)
BNy Mellon Global Short-Dated High yield Bond Fund Sterling Z (Inc) (Hedged) Share ClassSterling US dollar 6,005 7,411 01-Jul-20 The Bank of
New York Mellon 31Sterling US dollar 8,602 10,573 02-Jul-20 The Bank of
New York Mellon 85Sterling US dollar 28,930 35,702 15-Jul-20 The Bank of
New York Mellon 148Sterling US dollar 12,818 15,757 15-Jul-20 The Bank of
New York Mellon 126Sterling US dollar 22,879 28,278 15-Jul-20 The Bank of
New York Mellon 74US dollar Sterling 303,307 238,234 15-Jul-20 The Bank of
New York Mellon 8,083US dollar Sterling 111,996 87,702 15-Jul-20 The Bank of
New York Mellon 3,314US dollar Sterling 48,012 38,114 15-Jul-20 The Bank of
New York Mellon 781US dollar Sterling 91,683 73,200 15-Jul-20 The Bank of
New York Mellon 973US dollar Sterling 44,527 35,352 15-Jul-20 The Bank of
New York Mellon 718US dollar Sterling 24,012 19,099 15-Jul-20 The Bank of
New York Mellon 344US dollar Sterling 36,455 29,045 15-Jul-20 The Bank of
New York Mellon 462
Forward foreign currency contracts cont’d.Unrealised
Gain/(Loss)Buy Sell Amount (B) Amount (S)Settle
Date Counterparty
BNy Mellon Global Short-Dated High yield Bond Fund Sterling Z (Inc) (Hedged) Share Class cont’d.US dollar Sterling 39,925 32,152 15-Jul-20 The Bank of
New York Mellon 82US dollar Sterling 124,234 99,676 15-Jul-20 The Bank of
New York Mellon 714US dollar Sterling 63,146 50,451 15-Jul-20 The Bank of
New York Mellon 627US dollar Sterling 28,687 23,099 15-Jul-20 The Bank of
New York Mellon 63US dollar Sterling 14,116 11,363 15-Jul-20 The Bank of
New York Mellon 35US dollar Sterling 68,079 53,460 15-Jul-20 The Bank of
New York Mellon 1,831
USD 18,491
GBp 14,923
US dollar Sterling 35,699 28,930 01-Jul-20 The Bank of New York Mellon (148)
US dollar Sterling 15,756 12,818 02-Jul-20 The Bank of New York Mellon (126)
Sterling US dollar 45,525 56,557 15-Jul-20 The Bank of New York Mellon (142)
Sterling US dollar 61,551 76,442 15-Jul-20 The Bank of New York Mellon (167)
Sterling US dollar 19,994 25,025 15-Jul-20 The Bank of New York Mellon (248)
Sterling US dollar 36,055 44,938 15-Jul-20 The Bank of New York Mellon (258)
Sterling US dollar 34,302 43,683 15-Jul-20 The Bank of New York Mellon (1,175)
Sterling US dollar 43,481 54,573 15-Jul-20 The Bank of New York Mellon (691)
Sterling US dollar 66,442 82,506 15-Jul-20 The Bank of New York Mellon (170)
Sterling US dollar 35,459 44,661 15-Jul-20 The Bank of New York Mellon (720)
Sterling US dollar 37,332 46,759 15-Jul-20 The Bank of New York Mellon (496)
Sterling US dollar 101,537 127,906 15-Jul-20 The Bank of New York Mellon (2,080)
Sterling US dollar 97,536 124,554 15-Jul-20 The Bank of New York Mellon (3,686)
Sterling US dollar 118,717 151,144 15-Jul-20 The Bank of New York Mellon (4,028)
Sterling US dollar 99,414 124,984 15-Jul-20 The Bank of New York Mellon (1,789)
Sterling US dollar 71,966,185 91,469,580 15-Jul-20 The Bank of New York Mellon (2,288,002)
US dollar Sterling 10,484 8,483 15-Jul-20 The Bank of New York Mellon (27)
US dollar Sterling 7,411 6,005 15-Jul-20 The Bank of New York Mellon (31)
US dollar Sterling 10,574 8,602 15-Jul-20 The Bank of New York Mellon (85)
USD (2,304,069)
GBp (1,859,469)
Net USD (2,285,578)
Net GBp (1,844,546)
03613-1A.indd 229 19/08/2020 19:01

230
Schedule of investments – as at 30 June 2020
Holdings Description
Fair value
Total net assets
% Holdings Description
Fair value
Total net assets
%
Collective investment schemes
Ireland - 1,675,623 (31 December 2019: 1,258,661) 1,675,623 7.18
42,260 iShares Physical Gold ETC 1,462,407 6.27 839 iShares USD Corp Bond UCITS ETF - ETF 107,425 0.46 1,014 iShares USD Short Duration Corp Bond
UCITS ETF - ETF 105,791 0.45
Norway - 90,015 (31 December 2019: 96,667) 90,015 0.38
79,906 Aquila European Renewables Income Fund Plc/ The Fund 90,015 0.38
Total investments in collective investment schemes 1,765,638 7.56
Bonds
Australia - 588,902 (31 December 2019: 578,447) 588,902 2.52
280,000 Australia Government Bond 3.000% 21-Mar-2047 244,285 1.05 440,000 New South Wales Treasury Corp
3.000% 20-Mar-2028 344,617 1.47
Austria - 361,623 (31 December 2019: 341,139) 361,623 1.55
190,000 Republic of Austria Government Bond ‘144A’ 3.150% 20-Jun-2044 361,623 1.55
Colombia - 184,260 (31 December 2019: 202,988) 184,260 0.79
608,000,000 Colombia Government International Bond ‘REGS’ 7.500% 26-Aug-2026 184,260 0.79
Germany - 221,301 (31 December 2019: 233,865) 221,301 0.95
100,000 Infineon Technologies AG ‘EMTN’ FRN (Perpetual) 2.875% 01-Jan-2025 109,763 0.47
100,000 Infineon Technologies AG FRN (Perpetual) 3.625% 01-Jan-2028 111,538 0.48
Japan - 106,469 (31 December 2019: 217,738) 106,469 0.46
11,513,202 Japanese Government CPI Linked Bond 0.100% 10-Mar-2028 106,469 0.46
Mexico - 295,465 (31 December 2019: 465,266) 295,465 1.26
3,790,000 Mexican Bonos 8.000% 07-Nov-2047 183,093 0.78 2,200,000 Mexican Bonos 8.500% 31-May-2029 112,372 0.48
New Zealand - 289,293 (31 December 2019: 292,512) 289,293 1.24
320,000 New Zealand Government Inflation Linked Bond 3.000% 20-Sep-2030 289,293 1.24
Spain - 204,514 (31 December 2019: 206,651) 204,514 0.88
130,000 Spain Government Bond ‘144A’ 5.150% 31-Oct-2028 204,514 0.88
United States of America - 2,765,058 (31 December 2019: 3,663,302) 2,765,058 11.84
100,000 American Airlines Inc ‘144A’ 11.750% 15-Jul-2025 95,500 0.41
47,000 T-Mobile USA Inc ‘144A’ 3.875% 15-Apr-2030 52,293 0.22
375,199 United States Treasury Inflation Indexed Bonds 0.500% 15-Apr-2024 394,422 1.69
452,357 United States Treasury Inflation Indexed Bonds 3.375% 15-Apr-2032 674,747 2.89
100,000 United States Treasury Note/Bond 1.500% 15-Aug-2026 106,613 0.46
280,000 United States Treasury Note/Bond 1.500% 15-Feb-2030 303,133 1.30
625,900 United States Treasury Note/Bond 2.000% 15-Feb-2025 675,886 2.89
332,000 United States Treasury Note/Bond 2.375% 15-May-2029 383,694 1.64
60,000 United States Treasury Note/Bond 2.875% 15-May-2043 78,770 0.34
Total investments in bonds 5,016,885 21.49
Equities
Australia - 226,357 (31 December 2019: 308,209) 226,357 0.97
57,328 Insurance Australia Group Ltd 226,357 0.97
Canada - 284,067 (31 December 2019: 704,465) 284,067 1.22
2,428 Intact Financial Corp 227,518 0.98 3,333 Suncor Energy Inc 56,549 0.24
Cayman Islands - 338,617 (31 December 2019: –) 338,617 1.45
1,575 Alibaba Group Holding Ltd ADR 338,617 1.45
China - 327,615 (31 December 2019: 140,795) 327,615 1.40
15,500 Ping An Insurance Group Co of China Ltd ‘H’ 154,898 0.66 1,870 Prosus NV 172,717 0.74
France - 542,182 (31 December 2019: –) 542,182 2.32
6,586 Bureau Veritas SA 139,082 0.59 1,771 Thales SA 144,318 0.62 10,040 Vivendi SA 258,782 1.11
Germany - 930,224 (31 December 2019: 646,376) 930,224 3.99
1,904 Brenntag AG 100,062 0.43 1,678 Continental AG 164,350 0.71 2,036 Fresenius Medical Care AG & Co KGaA 173,147 0.74 3,567 SAP SE 492,665 2.11
Hong Kong - 464,098 (31 December 2019: 601,079) 464,098 1.99
49,800 AIA Group Ltd 464,098 1.99
Ireland - 170,330 (31 December 2019: 169,195) 170,330 0.73
126,106 Greencoat Renewables Plc 170,330 0.73
Japan - 1,492,809 (31 December 2019: 1,889,175) 1,492,809 6.39
12,300 Ebara Corp 288,035 1.23 4,300 M3 Inc 183,291 0.79
BNY MELLON GLOBAL UNCONSTRAINED FUND
FUND 35 – BNy MELLON GLOBAL UNCONSTRAINED FUND / NEW OD DEC.2017
Bonds cont’d.
United States of America cont’d.
USDUSD
03613-1A.indd 230 19/08/2020 19:01

231
Schedule of investments – as at 30 June 2020
Holdings Description
Fair value
Total net assets
% Holdings Description
Fair value
Total net assets
%
BNy MELLON GLOBAL UNCONSTRAINED FUND
3,602 Microsoft Corp 714,871 3.06 3,217 Toll Brothers Inc 101,030 0.43
Total investments in equities 14,870,018 63.69
Equity investment instruments
United Kingdom - 918,341 (31 December 2019: –) 918,341 3.93
126,541 Greencoat UK Wind Plc/Funds 222,505 0.95 488,862 Hipgnosis Songs Fund Ltd/The Fund 695,836 2.98
Total investments in equity investment instruments 918,341 3.93 Unrealised gain on forward foreign currency contracts - 19,249 (see below) (31 December 2019: 377,800) 19,249 0.08
Total financial assets at fair value through profit or loss 22,590,131 96.75 Unrealised loss on forward foreign currency contracts - (484,511) (see below) (31 December 2019: (102,650)) (484,511) (2.07)
Total financial liabilities at fair value through profit or loss (484,511) (2.07)
Net current assets 1,242,958 5.32
Total net assets 23,348,578 100.00
Analysis of portfolio % of Total Assets
Transferable securities and money market instruments admitted to official stock exchange listing or traded on a regulated market 94.65oTC financial derivative instruments 0.08other current assets 5.27
Total assets 100.00
6,300 Recruit Holdings Co Ltd 215,097 0.92 6,100 Sony Corp 417,754 1.79 8,400 Suzuki Motor Corp 285,003 1.22 12,900 Topcon Corp 103,629 0.44
New Zealand - 105,975 (31 December 2019: –) 105,975 0.46
67,133 SKYCITY Entertainment Group Ltd 105,975 0.46
Norway - 163,258 (31 December 2019: 229,236) 163,258 0.70
12,275 DNB ASA 163,258 0.70
Republic of Korea - 805,958 (31 December 2019: 771,443) 805,958 3.45
11,824 Samsung Electronics Co Ltd - Preference 457,586 1.96 1,152 Samsung SDI Co Ltd 348,372 1.49
South Africa - 341,630 (31 December 2019: 305,148) 341,630 1.46
1,870 Naspers Ltd 341,630 1.46
Switzerland - 1,135,069 (31 December 2019: 1,533,640) 1,135,069 4.86
2,774 Alcon Inc 158,902 0.68 4,490 Novartis AG 390,097 1.67 1,239 Roche Holding AG 428,869 1.84 449 Zurich Insurance Group AG 157,201 0.67
Thailand - 86,706 (31 December 2019: –) 86,706 0.37
28,700 Kasikornbank PCL (Foreign Market) 86,706 0.37
United Kingdom - 1,566,950 (31 December 2019: 2,369,460) 1,566,950 6.71
16,952 BAE Systems Plc 101,498 0.43 5,346 CRH Plc 182,756 0.78 4,263 Ferguson Plc 346,078 1.48 28,107 Informa Plc 162,270 0.70 1,332 Linde Plc 281,345 1.21 23,503 Prudential Plc 352,561 1.51 9,202 Royal Dutch Shell Plc 140,442 0.60
United States of America - 5,888,173 (31 December 2019: 4,475,603) 5,888,173 25.22
4,544 Abbott Laboratories 404,507 1.73 1,805 Accenture Plc - Class A 384,050 1.64 2,500 Albemarle Corp 190,888 0.82 359 Alphabet Inc - Class A 501,733 2.15 126 Amazon.com Inc 337,868 1.45 1,623 Apple Inc 587,477 2.52 7,189 Applied Materials Inc 424,618 1.82 7,419 Citigroup Inc 373,213 1.60 1,033 Ecolab Inc 201,993 0.86 1,057 Goldman Sachs Group Inc/The 204,619 0.88 23,686 Laureate Education Inc - Class A 234,847 1.00 2,603 Lennar Corp 158,679 0.68 1,367 Mastercard Inc 400,729 1.72 3,179 Medtronic Plc 286,984 1.23 4,993 Merck & Co Inc 380,067 1.63
Equities cont’d.
United States of America cont’d.
Equities cont’d.
Japan cont’d.
USDUSD
03613-1A.indd 231 19/08/2020 19:01

232
Schedule of investments – as at 30 June 2020
BNy MELLON GLOBAL UNCONSTRAINED FUND
Forward foreign currency contractsUnrealised
Gain/(Loss)Buy Sell Amount (B) Amount (S)Settle
Date Counterparty
BNy Mellon Global Unconstrained FundUS dollar Japanese yen 1,023 109,650 01-Jul-20 Royal Bank
of Scotland 5US dollar Sterling 935,781 761,000 15-Jul-20 JPMorgan Chase
Bank 1,914Hungarian forint US dollar 6,271,819 19,226 14-Aug-20 HSBC Bank plc 492Hungarian forint US dollar 7,180,587 22,130 14-Aug-20 HSBC Bank plc 446Hungarian forint US dollar 4,492,911 13,877 14-Aug-20 The Bank of
New York Mellon 249Hungarian forint US dollar 5,069,554 15,604 14-Aug-20 State Street Bank 335Hungarian forint US dollar 2,786,082 8,601 14-Aug-20 HSBC Bank plc 158US dollar Australian dollar 491,675 703,304 15-Sep-20 HSBC Bank plc 9,879US dollar Japanese yen 223,695 23,970,889 15-Sep-20 HSBC Bank plc 979
USD 14,457
US dollar Euro 610,326 562,945 14-Aug-20 Barclays Bank PLC (21,286)US dollar Hungarian forint 79,654 25,800,952 14-Aug-20 Barclays Bank PLC (1,464)US dollar New Zealand dollar 247,037 409,232 14-Aug-20 State Street Bank (15,041)
USD (37,791)
Net USD (23,334)
BNy Mellon Global Unconstrained Fund CAD x (Acc) (Hedged) Share ClassUS dollar Canadian dollar 722,263 981,469 15-Jul-20 The Bank of
New York Mellon 4,792
USD 4,792
CAD 6,555
Canadian dollar US dollar 825,596 611,030 15-Jul-20 The Bank of New York Mellon (7,505)
Canadian dollar US dollar 32,589,792 24,262,683 15-Jul-20 The Bank of New York Mellon (438,981)
US dollar Canadian dollar 478,599 655,022 15-Jul-20 The Bank of New York Mellon (234)
USD (446,720)
CAD (611,113)
Net USD (441,928)
Net CAD (604,558)
03613-1A.indd 232 19/08/2020 19:01

233
Schedule of investments – as at 30 June 2020
Holdings Description
Fair value
Total net assets
% Holdings Description
Fair value
Total net assets
%
FUND 36 – BNy MELLON JApAN SMALL CAp EQUITy FOCUS FUND
BNY MELLON JAPAN SMALL CAP EQUITY FOCUS FUND
Unrealised loss on forward foreign currency contracts - (15,556,005) (see below) (31 December 2019: (641,256)) (15,556,005) (0.13)
Total financial liabilities at fair value through profit or loss (15,556,005) (0.13)
Net current assets 411,972,219 3.35
Total net assets 12,306,565,258 100.00
Analysis of portfolio % of Total Assets
Transferable securities and money market instruments admitted to official stock exchange listing or traded on a regulated market 96.47oTC financial derivative instruments 0.04other current assets 3.49
Total assets 100.00
Equities
Communication Services - 1,482,054,500 (31 December 2019: 2,126,352,150) 1,482,054,500 12.04
113,900 Atrae Inc 358,500,250 2.91 183,300 Itokuro Inc 245,163,750 1.99 582,900 Vector Inc 507,997,350 4.13 545,900 Vision Inc/Tokyo Japan 370,393,150 3.01
Consumer Discretionary - 1,774,157,950 (31 December 2019: 3,013,585,650) 1,774,157,950 14.42
72,900 Arata Corp 353,565,000 2.87 190,900 Nifco Inc/Japan 438,210,950 3.56 319,300 Resorttrust Inc 444,944,550 3.62 50,200 Tomy Co Ltd 42,720,200 0.35 849,300 Yonex Co Ltd 494,717,250 4.02
Consumer Staples - 494,200,000 (31 December 2019: 535,074,000) 494,200,000 4.02
70,000 Ain Holdings Inc 494,200,000 4.02
Financials - 1,369,854,050 (31 December 2019: 1,556,690,550) 1,369,854,050 11.13
95,000 Anicom Holdings Inc 435,100,000 3.53 255,900 Premium Group Co Ltd 482,243,550 3.92 111,800 Zenkoku Hosho Co Ltd 452,510,500 3.68
Industrials - 1,793,765,900 (31 December 2019: 2,079,165,750) 1,793,765,900 14.57
52,000 BayCurrent Consulting Inc 465,140,000 3.78 160,400 Insource Co Ltd 423,857,000 3.44 372,000 Penta-Ocean Construction Co Ltd 215,946,000 1.76 213,900 Takeuchi Manufacturing Co Ltd 383,094,900 3.11 112,400 Totetsu Kogyo Co Ltd 305,728,000 2.48
Information Technology - 3,592,469,900 (31 December 2019: 3,869,357,500) 3,592,469,900 29.19
161,500 Anritsu Corp 413,278,500 3.36 80,800 BrainPad Inc 370,266,000 3.01 403,000 MCJ Co Ltd 345,371,000 2.81 179,400 m-up Holdings Inc 433,340,700 3.52 235,000 Osaki Electric Co Ltd 118,792,500 0.96 146,900 RS Technologies Co Ltd 506,805,000 4.12 174,800 Sanken Electric Co Ltd 371,275,200 3.02 280,000 TechMatrix Corp 523,320,000 4.25 929,000 Wacom Co Ltd 510,021,000 4.14
Materials - 932,286,900 (31 December 2019: 1,068,275,600) 932,286,900 7.58
124,900 Dowa Holdings Co Ltd 408,423,000 3.32 509,100 Sakata INX Corp 523,863,900 4.26
Utilities - 466,784,000 (31 December 2019: 661,393,500) 466,784,000 3.79
100,600 Nippon Gas Co Ltd 466,784,000 3.79
Total investments in equities 11,905,573,200 96.74 Unrealised gain on forward foreign currency contracts - 4,575,844 (see below) (31 December 2019: 80,379,200) 4,575,844 0.04
Total financial assets at fair value through profit or loss 11,910,149,044 96.78
Description
JPYJPY
03613-1A.indd 233 19/08/2020 19:01

234
Schedule of investments – as at 30 June 2020
BNy MELLON JApAN SMALL CAp EQUITy FOCUS FUND
Forward foreign currency contracts cont’d.Unrealised
Gain/(Loss)Buy Sell Amount (B) Amount (S)Settle
Date Counterparty
BNy Mellon Japan Small Cap Equity Focus Fund CHF E (Acc) (Hedged) Share ClassJapanese yen Swiss franc 9,833,767 86,458 15-Jul-20 The Bank of
New York Mellon 32,120Swiss franc Japanese yen 164,770 18,642,781 15-Jul-20 The Bank of
New York Mellon 37,033Swiss franc Japanese yen 4,200 476,116 15-Jul-20 The Bank of
New York Mellon 19
Jpy 69,172
CHF 610
Japanese yen Swiss franc 10,881,531 96,005 15-Jul-20 The Bank of New York Mellon (2,460)
Japanese yen Swiss franc 774,792 6,839 15-Jul-20 The Bank of New York Mellon (540)
Japanese yen Swiss franc 1,039,935 9,195 15-Jul-20 The Bank of New York Mellon (2,504)
Japanese yen Swiss franc 11,413,576 101,007 15-Jul-20 The Bank of New York Mellon (37,495)
Japanese yen Swiss franc 9,718,559 86,092 15-Jul-20 The Bank of New York Mellon (41,581)
Swiss franc Japanese yen 4,129,190 468,626,568 15-Jul-20 The Bank of New York Mellon (503,471)
Jpy (588,051)
CHF (5,188)
Net Jpy (518,879)
Net CHF (4,578)
BNy Mellon Japan Small Cap Equity Focus Fund EUR G (Acc) (Hedged) Share ClassJapanese yen Euro 2,564,852 21,187 15-Jul-20 The Bank of
New York Mellon 5,807Japanese yen Euro 2,684,856 22,189 15-Jul-20 The Bank of
New York Mellon 4,833Japanese yen Euro 2,316,396 19,170 15-Jul-20 The Bank of
New York Mellon 967Japanese yen Euro 2,310,750 19,036 15-Jul-20 The Bank of
New York Mellon 11,597
Jpy 23,204
EUR 192
Euro Japanese yen 36,226 4,379,414 15-Jul-20 The Bank of New York Mellon (3,995)
Euro Japanese yen 909,768 111,154,508 15-Jul-20 The Bank of New York Mellon (1,271,838)
Jpy (1,275,833)
EUR (10,565)
Net Jpy (1,252,629)
Net EUR (10,373)
Forward foreign currency contracts cont’d.Unrealised
Gain/(Loss)Buy Sell Amount (B) Amount (S)Settle
Date Counterparty
BNy Mellon Japan Small Cap Equity Focus Fund EUR H (Hedged) Share ClassJapanese yen Euro 7,782,538 64,289 15-Jul-20 The Bank of
New York Mellon 17,620Japanese yen Euro 2,874,814 23,775 15-Jul-20 The Bank of
New York Mellon 3,273Japanese yen Euro 8,161,989 67,455 15-Jul-20 The Bank of
New York Mellon 14,693Japanese yen Euro 7,028,284 58,166 15-Jul-20 The Bank of
New York Mellon 2,931Japanese yen Euro 7,020,673 57,836 15-Jul-20 The Bank of
New York Mellon 35,235
Jpy 73,752
EUR 611
Euro Japanese yen 109,693 13,260,903 15-Jul-20 The Bank of New York Mellon (12,095)
Euro Japanese yen 963 117,356 15-Jul-20 The Bank of New York Mellon (1,104)
Euro Japanese yen 2,756,028 336,728,647 15-Jul-20 The Bank of New York Mellon (3,852,874)
Jpy (3,866,073)
EUR (32,013)
Net Jpy (3,792,321)
Net EUR (31,402)
BNy Mellon Japan Small Cap Equity Focus Fund EUR I (Hedged) Share ClassJapanese yen Euro 11,259,552 93,012 15-Jul-20 The Bank of
New York Mellon 25,493Japanese yen Euro 11,786,360 97,409 15-Jul-20 The Bank of
New York Mellon 21,217Japanese yen Euro 10,168,844 84,157 15-Jul-20 The Bank of
New York Mellon 4,241Japanese yen Euro 10,144,043 83,566 15-Jul-20 The Bank of
New York Mellon 50,910
Jpy 101,861
EUR 843
Euro Japanese yen 159,030 19,225,372 15-Jul-20 The Bank of New York Mellon (17,536)
Euro Japanese yen 3,993,829 487,961,832 15-Jul-20 The Bank of New York Mellon (5,583,294)
Jpy (5,600,830)
EUR (46,378)
Net Jpy (5,498,969)
Net EUR (45,535)
03613-1A.indd 234 19/08/2020 19:01

235
Schedule of investments – as at 30 June 2020
BNy MELLON JApAN SMALL CAp EQUITy FOCUS FUND
Forward foreign currency contracts cont’d.Unrealised
Gain/(Loss)Buy Sell Amount (B) Amount (S)Settle
Date Counterparty
BNy Mellon Japan Small Cap Equity Focus Fund EUR W (Acc) (Hedged) Share ClassJapanese yen Euro 1,832,798 15,140 15-Jul-20 The Bank of
New York Mellon 4,150Japanese yen Euro 1,923,910 15,900 15-Jul-20 The Bank of
New York Mellon 3,463Japanese yen Euro 1,660,681 13,744 15-Jul-20 The Bank of
New York Mellon 693Japanese yen Euro 1,656,066 13,643 15-Jul-20 The Bank of
New York Mellon 8,311
Jpy 16,617
EUR 138
Euro Japanese yen 25,985 3,141,299 15-Jul-20 The Bank of New York Mellon (2,866)
Euro Japanese yen 652,435 79,713,799 15-Jul-20 The Bank of New York Mellon (912,091)
Jpy (914,957)
EUR (7,576)
Net Jpy (898,340)
Net EUR (7,438)
BNy Mellon Japan Small Cap Equity Focus Fund NOK H (Acc) (Hedged) Share ClassJapanese yen Norwegian krone 255,553 23,036 15-Jul-20 The Bank of
New York Mellon 590Japanese yen Norwegian krone 269,782 24,162 15-Jul-20 The Bank of
New York Mellon 2,345Japanese yen Norwegian krone 237,341 21,306 15-Jul-20 The Bank of
New York Mellon 1,526Japanese yen Norwegian krone 233,510 20,855 15-Jul-20 The Bank of
New York Mellon 2,680
Jpy 7,141
NOK 645
Norwegian krone Japanese yen 38,653 433,400 15-Jul-20 The Bank of New York Mellon (5,582)
Norwegian krone Japanese yen 981,551 11,365,617 15-Jul-20 The Bank of New York Mellon (501,552)
Jpy (507,134)
NOK (45,814)
Net Jpy (499,993)
Net NOK (45,169)
Forward foreign currency contracts cont’d.Unrealised
Gain/(Loss)Buy Sell Amount (B) Amount (S)Settle
Date Counterparty
BNy Mellon Japan Small Cap Equity Focus Fund NOK W (Acc) (Hedged) Share ClassJapanese yen Norwegian krone 250,346 22,566 15-Jul-20 The Bank of
New York Mellon 578Japanese yen Norwegian krone 268,045 24,007 15-Jul-20 The Bank of
New York Mellon 2,330Japanese yen Norwegian krone 236,380 21,219 15-Jul-20 The Bank of
New York Mellon 1,519Japanese yen Norwegian krone 232,170 20,735 15-Jul-20 The Bank of
New York Mellon 2,665
Jpy 7,092
NOK 641
Norwegian krone Japanese yen 38,594 432,739 15-Jul-20 The Bank of New York Mellon (5,574)
Norwegian krone Japanese yen 979,093 11,337,153 15-Jul-20 The Bank of New York Mellon (500,296)
Jpy (505,870)
NOK (45,699)
Net Jpy (498,778)
Net NOK (45,058)
BNy Mellon Japan Small Cap Equity Focus Fund SEK H (Acc) (Hedged) Share ClassJapanese yen Swedish krona 290,928 25,191 15-Jul-20 The Bank of
New York Mellon 1,240Japanese yen Swedish krona 261,343 22,673 15-Jul-20 The Bank of
New York Mellon 614Swedish krona Japanese yen 42,801 489,902 15-Jul-20 The Bank of
New York Mellon 2,292
Jpy 4,146
SEK 361
Japanese yen Swedish krona 303,849 26,448 15-Jul-20 The Bank of New York Mellon (295)
Japanese yen Swedish krona 262,103 22,793 15-Jul-20 The Bank of New York Mellon (10)
Swedish krona Japanese yen 1,076,820 12,621,716 15-Jul-20 The Bank of New York Mellon (238,808)
Jpy (239,113)
SEK (20,793)
Net Jpy (234,967)
Net SEK (20,432)
03613-1A.indd 235 19/08/2020 19:01

236
Schedule of investments – as at 30 June 2020
BNy MELLON JApAN SMALL CAp EQUITy FOCUS FUND
Forward foreign currency contracts cont’d.Unrealised
Gain/(Loss)Buy Sell Amount (B) Amount (S)Settle
Date Counterparty
BNy Mellon Japan Small Cap Equity Focus Fund SEK W (Acc) (Hedged) Share ClassJapanese yen Swedish krona 285,459 24,718 15-Jul-20 The Bank of
New York Mellon 1,217Japanese yen Swedish krona 260,210 22,575 15-Jul-20 The Bank of
New York Mellon 611Swedish krona Japanese yen 42,797 489,858 15-Jul-20 The Bank of
New York Mellon 2,292
Jpy 4,120
SEK 358
Japanese yen Swedish krona 302,323 26,316 15-Jul-20 The Bank of New York Mellon (294)
Japanese yen Swedish krona 261,420 22,734 15-Jul-20 The Bank of New York Mellon (9)
Swedish krona Japanese yen 1,075,656 12,608,071 15-Jul-20 The Bank of New York Mellon (238,550)
Jpy (238,853)
SEK (20,771)
Net Jpy (234,733)
Net SEK (20,413)
BNy Mellon Japan Small Cap Equity Focus Fund SGD H (Hedged) Share ClassJapanese yen Singapore dollar 1,585,591 20,530 15-Jul-20 The Bank of
New York Mellon 2,810Japanese yen Singapore dollar 174,544 2,262 15-Jul-20 The Bank of
New York Mellon 126Japanese yen Singapore dollar 454,089 5,880 15-Jul-20 The Bank of
New York Mellon 763Singapore dollar Japanese yen 48,707 3,750,211 15-Jul-20 The Bank of
New York Mellon 4,948
Jpy 8,647
SGD 112
Japanese yen Singapore dollar 22,095,579 288,504 15-Jul-20 The Bank of New York Mellon (147,389)
Japanese yen Singapore dollar 2,294,264 29,817 15-Jul-20 The Bank of New York Mellon (4,532)
Japanese yen Singapore dollar 1,992,026 25,847 15-Jul-20 The Bank of New York Mellon (716)
Japanese yen Singapore dollar 1,978,618 25,770 15-Jul-20 The Bank of New York Mellon (8,190)
Singapore dollar Japanese yen 5,116 394,735 15-Jul-20 The Bank of New York Mellon (285)
Singapore dollar Japanese yen 105 8,170 15-Jul-20 The Bank of New York Mellon (42)
Singapore dollar Japanese yen 1,228,262 95,138,569 15-Jul-20 The Bank of New York Mellon (442,505)
Jpy (603,659)
SGD (7,829)
Net Jpy (595,012)
Net SGD (7,717)
Forward foreign currency contracts cont’d.Unrealised
Gain/(Loss)Buy Sell Amount (B) Amount (S)Settle
Date Counterparty
BNy Mellon Japan Small Cap Equity Focus Fund USD E (Acc) (Hedged) Share ClassUS dollar Japanese yen 1,076,281 115,503,064 15-Jul-20 The Bank of
New York Mellon 435,943US dollar Japanese yen 26,871,066 2,891,022,785 15-Jul-20 The Bank of
New York Mellon 3,578,028
Jpy 4,013,971
USD 37,256
Japanese yen US dollar 66,698,399 619,278 15-Jul-20 The Bank of New York Mellon (11,362)
Japanese yen US dollar 69,593,644 648,659 15-Jul-20 The Bank of New York Mellon (281,068)
Japanese yen US dollar 60,357,383 562,465 15-Jul-20 The Bank of New York Mellon (232,361)
Japanese yen US dollar 59,438,580 557,507 15-Jul-20 The Bank of New York Mellon (617,131)
Jpy (1,141,922)
USD (10,599)
Net Jpy 2,872,049
Net USD 26,657
BNy Mellon Japan Small Cap Equity Focus Fund USD H (Hedged) Share ClassUS dollar Japanese yen 1,622 173,865 02-Jul-20 The Bank of
New York Mellon 894US dollar Japanese yen 518,929 55,830,920 15-Jul-20 The Bank of
New York Mellon 69,098US dollar Japanese yen 20,550 2,205,412 15-Jul-20 The Bank of
New York Mellon 8,324
Jpy 78,316
USD 727
Japanese yen US dollar 173,840 1,622 15-Jul-20 The Bank of New York Mellon (889)
Japanese yen US dollar 1,295,176 12,025 15-Jul-20 The Bank of New York Mellon (220)
Japanese yen US dollar 274,931 2,563 15-Jul-20 The Bank of New York Mellon (1,187)
Japanese yen US dollar 1,336,507 12,457 15-Jul-20 The Bank of New York Mellon (5,398)
Japanese yen US dollar 540,579 5,035 15-Jul-20 The Bank of New York Mellon (1,762)
Japanese yen US dollar 1,167,690 10,882 15-Jul-20 The Bank of New York Mellon (4,495)
Japanese yen US dollar 1,152,239 10,807 15-Jul-20 The Bank of New York Mellon (11,964)
Jpy (25,915)
USD (241)
Net Jpy 52,401
Net USD 486
03613-1A.indd 236 19/08/2020 19:01
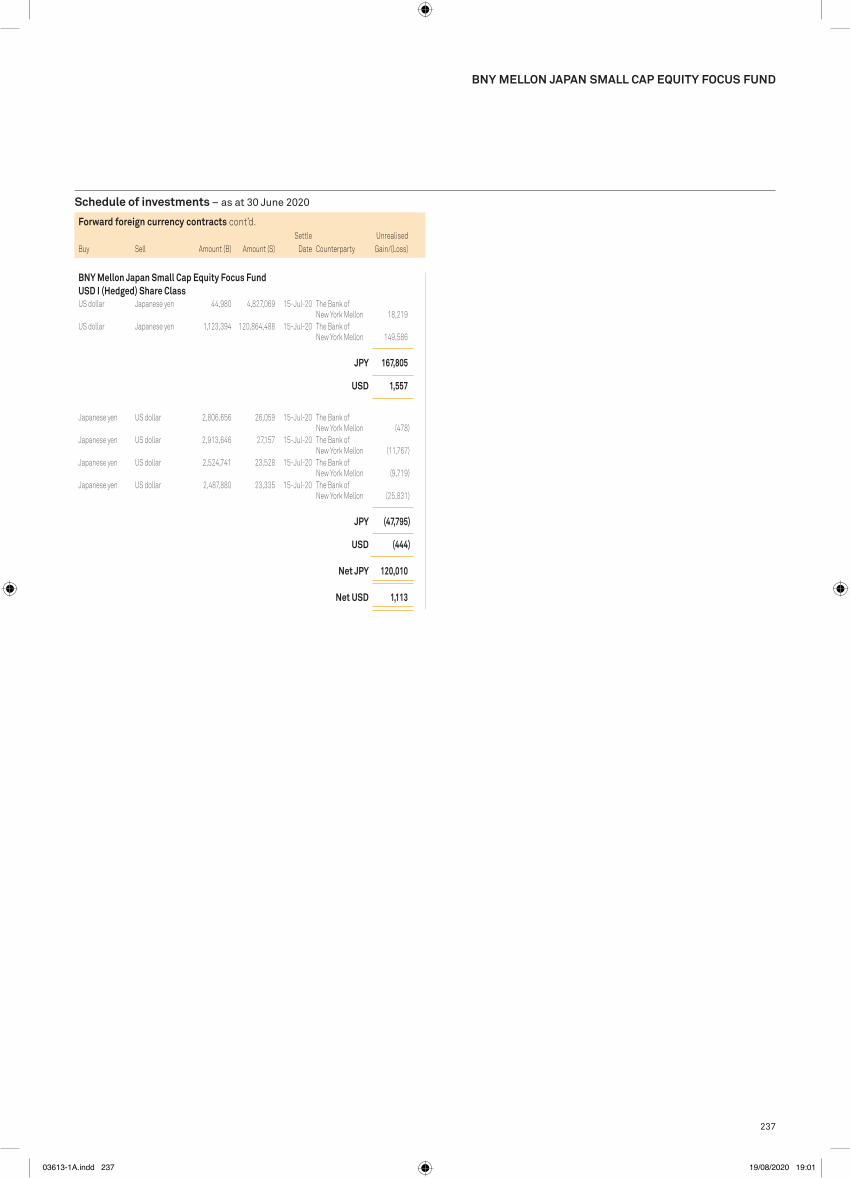
237
Schedule of investments – as at 30 June 2020
BNy MELLON JApAN SMALL CAp EQUITy FOCUS FUND
Forward foreign currency contracts cont’d.Unrealised
Gain/(Loss)Buy Sell Amount (B) Amount (S)Settle
Date Counterparty
BNy Mellon Japan Small Cap Equity Focus Fund USD I (Hedged) Share ClassUS dollar Japanese yen 44,980 4,827,069 15-Jul-20 The Bank of
New York Mellon 18,219US dollar Japanese yen 1,123,394 120,864,488 15-Jul-20 The Bank of
New York Mellon 149,586
Jpy 167,805
USD 1,557
Japanese yen US dollar 2,806,656 26,059 15-Jul-20 The Bank of New York Mellon (478)
Japanese yen US dollar 2,913,646 27,157 15-Jul-20 The Bank of New York Mellon (11,767)
Japanese yen US dollar 2,524,741 23,528 15-Jul-20 The Bank of New York Mellon (9,719)
Japanese yen US dollar 2,487,880 23,335 15-Jul-20 The Bank of New York Mellon (25,831)
Jpy (47,795)
USD (444)
Net Jpy 120,010
Net USD 1,113
03613-1A.indd 237 19/08/2020 19:01

238
Schedule of investments – as at 30 June 2020
Holdings Description
Fair value
Total net assets
% Holdings Description
Fair value
Total net assets
%
FUND 37 – BNy MELLON LONG-TERM GLOBAL EQUITy FUND
BNY MELLON LONG-TERM GLOBAL EQUITY FUND
United States of America - 671,332,915 (31 December 2019: 758,932,227) 671,332,915 47.52
73,290 Adobe Inc 28,387,704 2.01 25,265 Alphabet Inc 31,798,796 2.25 357,272 Amphenol Corp - Class A 30,437,262 2.15 204,979 Automatic Data Processing Inc 27,162,662 1.92 18,029 Booking Holdings Inc 25,581,503 1.81 407,923 Cerner Corp 24,878,383 1.76 823,580 Cisco Systems Inc 34,182,027 2.42 264,997 Cognex Corp 14,083,631 1.00 581,061 Cognizant Technology Solutions Corp 29,371,099 2.08 444,735 Colgate-Palmolive Co 28,995,830 2.05 441,606 Edwards Lifesciences Corp 27,154,720 1.92 563,281 EOG Resources Inc 25,391,495 1.80 728,889 Fastenal Co 27,770,423 1.97 49,900 Illumina Inc 16,440,117 1.16 58,161 Intuitive Surgical Inc 29,489,702 2.09 180,575 Johnson & Johnson 22,570,653 1.60 124,608 Mastercard Inc 32,780,143 2.32 236,147 Microsoft Corp 42,770,215 3.03 358,600 NIKE Inc 31,289,303 2.21 541,518 Oracle Corp 26,634,858 1.89 166,594 Stryker Corp 26,715,816 1.89 120,500 Texas Instruments Inc 13,615,364 0.96 571,982 TJX Cos Inc/The 25,737,898 1.82 261,729 Walt Disney Co/The 25,959,724 1.84 137,871 Waters Corp 22,133,587 1.57
Total investments in equities 1,357,760,571 96.11 Unrealised gain on forward foreign currency contracts - 80,608 (see below) (31 December 2019: 2,327) 80,608 0.01
Total financial assets at fair value through profit or loss 1,357,841,179 96.12 Unrealised loss on forward foreign currency contracts - (1,700) (see below) (31 December 2019: (45,196)) (1,700) (0.00)
Total financial liabilities at fair value through profit or loss (1,700) (0.00)
Net current assets 54,875,458 3.88
Total net assets 1,412,714,937 100.00
Analysis of portfolio % of Total Assets
Transferable securities and money market instruments admitted to official stock exchange listing or traded on a regulated market 95.85oTC financial derivative instruments 0.01other current assets 4.14
Total assets 100.00
Equities
Australia - 25,104,163 (31 December 2019: 30,761,955) 25,104,163 1.78
142,400 CSL Ltd 25,104,163 1.78
Canada - 29,733,761 (31 December 2019: 26,965,547) 29,733,761 2.10
1,064,098 Alimentation Couche-Tard Inc - Class B 29,733,761 2.10
China - 19,874,929 (31 December 2019: 29,677,145) 19,874,929 1.41
20,030,646 CNOOC Ltd 19,874,929 1.41
Denmark - 36,365,789 (31 December 2019: 36,304,786) 36,365,789 2.57
629,500 Novo Nordisk A/S 36,365,789 2.57
Finland - 27,247,296 (31 December 2019: 30,998,899) 27,247,296 1.93
445,800 Kone Oyj - Class B 27,247,296 1.93
France - 55,325,750 (31 December 2019: 54,006,160) 55,325,750 3.92
97,000 L’Oreal SA 27,708,050 1.96 70,733 LVMH Moet Hennessy Louis Vuitton SE 27,617,700 1.96
Germany - 34,377,245 (31 December 2019: 29,671,237) 34,377,245 2.43
276,500 SAP SE 34,377,245 2.43
Hong Kong - 57,714,498 (31 December 2019: 64,979,094) 57,714,498 4.09
3,561,000 AIA Group Ltd 29,536,321 2.09 7,390,069 Hong Kong & China Gas Co Ltd 10,158,733 0.72 485,023 Jardine Matheson Holdings Ltd 18,019,444 1.28
Japan - 117,185,934 (31 December 2019: 111,174,809) 117,185,934 8.29
166,000 FANUC Corp 26,372,391 1.86 120,300 Keyence Corp 44,615,421 3.16 280,100 Shin-Etsu Chemical Co Ltd 29,069,811 2.06 37,700 SMC Corp/Japan 17,128,311 1.21
Spain - 28,112,716 (31 December 2019: 37,545,233) 28,112,716 1.99
1,192,480 Industria de Diseno Textil SA 28,112,716 1.99
Switzerland - 114,493,935 (31 December 2019: 104,086,441) 114,493,935 8.10
301,000 Nestle SA 29,623,222 2.10 400,000 Novartis AG 30,973,426 2.19 118,100 Roche Holding AG 36,424,289 2.58 8,036 SGS SA 17,472,998 1.23
Taiwan - 36,268,791 (31 December 2019: 37,184,539) 36,268,791 2.57
717,837 Taiwan Semiconductor Manufacturing Co Ltd ADR 36,268,791 2.57
United Kingdom - 104,622,849 (31 December 2019: 88,332,719) 104,622,849 7.41
1,394,700 Compass Group Plc 17,112,520 1.21 896,000 Experian Plc 27,862,063 1.97 165,862 Linde Plc 31,316,671 2.22 345,600 Reckitt Benckiser Group Plc 28,331,595 2.01
Equities cont’d.
EUR EUR
03613-1A.indd 238 19/08/2020 19:01

239
Schedule of investments – as at 30 June 2020
BNy MELLON LONG-TERM GLOBAL EQUITy FUND
Forward foreign currency contracts cont’d.Unrealised
Gain/(Loss)Buy Sell Amount (B) Amount (S)Settle
Date Counterparty
BNy Mellon Long-Term Global Equity FundSwiss franc Euro 889,781 834,454 01-Jul-20 The Bank of
New York Mellon 1,444US dollar Euro 19,137,240 17,000,000 01-Jul-20 The Bank of
New York Mellon 33,579
EUR 35,023
Euro US dollar 116,093 130,572 01-Jul-20 The Bank of New York Mellon (126)
Euro US dollar 54,680 61,500 01-Jul-20 The Bank of New York Mellon (59)
EUR (185)
Net EUR 34,838
BNy Mellon Long-Term Global Equity Fund SGD J (Acc) (Hedged) Share ClassSingapore dollar Euro 809,985 513,615 15-Jul-20 The Bank of
New York Mellon 3,571
EUR 3,571
SGD 5,591
Euro Singapore dollar 25,237 39,669 15-Jul-20 The Bank of New York Mellon (92)
Singapore dollar Euro 19,975 12,764 15-Jul-20 The Bank of New York Mellon (10)
EUR (102)
SGD (160)
Net EUR 3,469
Net SGD 5,431
BNy Mellon Long-Term Global Equity Fund SGD W (Acc) (Hedged) Share ClassSingapore dollar Euro 112,566 71,379 15-Jul-20 The Bank of
New York Mellon 497
EUR 497
SGD 778
Euro Singapore dollar 3,503 5,506 15-Jul-20 The Bank of New York Mellon (13)
Singapore dollar Euro 2,787 1,781 15-Jul-20 The Bank of New York Mellon (1)
EUR (14)
SGD (22)
Net EUR 483
Net SGD 756
Forward foreign currency contracts cont’d.Unrealised
Gain/(Loss)Buy Sell Amount (B) Amount (S)Settle
Date Counterparty
BNy Mellon Long-Term Global Equity Fund USD H (Acc) (Hedged) Share ClassUS dollar Euro 105,363 92,777 15-Jul-20 The Bank of
New York Mellon 975
EUR 975
USD 1,095
Euro US dollar 4,526 5,120 15-Jul-20 The Bank of New York Mellon (29)
US dollar Euro 2,575 2,294 15-Jul-20 The Bank of New York Mellon (3)
EUR (32)
USD (36)
Net EUR 943
Net USD 1,059
BNy Mellon Long-Term Global Equity Fund USD I (Acc) (Hedged) Share Class US dollar Euro 107,415 94,584 15-Jul-20 The Bank of
New York Mellon 994
EUR 994
USD 1,117
Euro US dollar 4,607 5,211 15-Jul-20 The Bank of New York Mellon (30)
US dollar Euro 2,639 2,352 15-Jul-20 The Bank of New York Mellon (3)
EUR (33)
USD (37)
Net EUR 961
Net USD 1,080
BNy Mellon Long-Term Global Equity Fund USD W (Hedged) Share ClassEuro US dollar 53,609 60,000 15-Jul-20 The Bank of
New York Mellon 221US dollar Euro 9,985 8,864 15-Jul-20 The Bank of
New York Mellon 21US dollar Euro 4,183,060 3,683,395 15-Jul-20 The Bank of
New York Mellon 38,719US dollar Euro 106,827 94,468 15-Jul-20 The Bank of
New York Mellon 587
EUR 39,548
USD 44,432
03613-1A.indd 239 19/08/2020 19:01

240
Schedule of investments – as at 30 June 2020
BNy MELLON LONG-TERM GLOBAL EQUITy FUND
Forward foreign currency contracts cont’d.Unrealised
Gain/(Loss)Buy Sell Amount (B) Amount (S)Settle
Date Counterparty
BNy Mellon Long-Term Global Equity Fund USD W (Hedged) Share Class cont’d.Euro US dollar 8,843 10,000 15-Jul-20 The Bank of
New York Mellon (55)Euro US dollar 179,336 202,840 15-Jul-20 The Bank of
New York Mellon (1,153)US dollar Euro 102,918 91,703 15-Jul-20 The Bank of
New York Mellon (126)
EUR (1,334)
USD (1,499)
Net EUR 38,214
Net USD 42,933
UWAGA WYWALANie usuwać ost wiersza tabeli dla BNY Mellon Long-Term Global Equity Fund
03613-1A.indd 240 19/08/2020 19:01
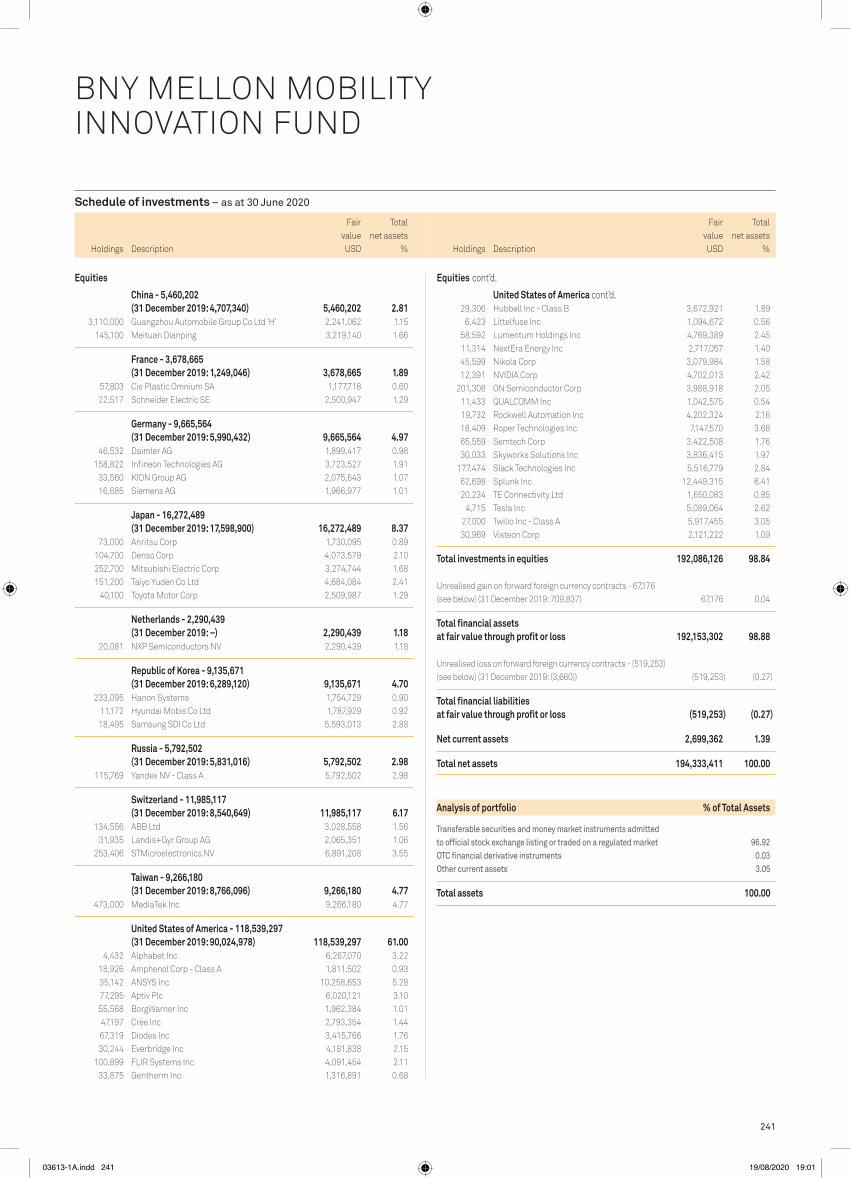
241
Schedule of investments – as at 30 June 2020
Holdings Description
Fair value
Total net assets
% Holdings Description
Fair value
Total net assets
%
Equities
China - 5,460,202 (31 December 2019: 4,707,340) 5,460,202 2.81
3,110,000 Guangzhou Automobile Group Co Ltd ‘H’ 2,241,062 1.15 145,100 Meituan Dianping 3,219,140 1.66
France - 3,678,665 (31 December 2019: 1,249,046) 3,678,665 1.89
57,803 Cie Plastic Omnium SA 1,177,718 0.60 22,517 Schneider Electric SE 2,500,947 1.29
Germany - 9,665,564 (31 December 2019: 5,990,432) 9,665,564 4.97
46,532 Daimler AG 1,899,417 0.98 158,822 Infineon Technologies AG 3,723,527 1.91 33,560 KION Group AG 2,075,643 1.07 16,685 Siemens AG 1,966,977 1.01
Japan - 16,272,489 (31 December 2019: 17,598,900) 16,272,489 8.37
73,000 Anritsu Corp 1,730,095 0.89 104,700 Denso Corp 4,073,579 2.10 252,700 Mitsubishi Electric Corp 3,274,744 1.68 151,200 Taiyo Yuden Co Ltd 4,684,084 2.41 40,100 Toyota Motor Corp 2,509,987 1.29
Netherlands - 2,290,439 (31 December 2019: –) 2,290,439 1.18
20,081 NXP Semiconductors NV 2,290,439 1.18
Republic of Korea - 9,135,671 (31 December 2019: 6,289,120) 9,135,671 4.70
233,095 Hanon Systems 1,754,729 0.90 11,172 Hyundai Mobis Co Ltd 1,787,929 0.92 18,495 Samsung SDI Co Ltd 5,593,013 2.88
Russia - 5,792,502 (31 December 2019: 5,831,016) 5,792,502 2.98
115,769 Yandex NV - Class A 5,792,502 2.98
Switzerland - 11,985,117 (31 December 2019: 8,540,649) 11,985,117 6.17
134,556 ABB Ltd 3,028,558 1.56 31,935 Landis+Gyr Group AG 2,065,351 1.06 253,406 STMicroelectronics NV 6,891,208 3.55
Taiwan - 9,266,180 (31 December 2019: 8,766,096) 9,266,180 4.77
473,000 MediaTek Inc 9,266,180 4.77
United States of America - 118,539,297 (31 December 2019: 90,024,978) 118,539,297 61.00
4,432 Alphabet Inc 6,267,070 3.22 18,926 Amphenol Corp - Class A 1,811,502 0.93 35,142 ANSYS Inc 10,258,653 5.28 77,295 Aptiv Plc 6,020,121 3.10 55,568 BorgWarner Inc 1,962,384 1.01 47,197 Cree Inc 2,793,354 1.44 67,319 Diodes Inc 3,415,766 1.76 30,244 Everbridge Inc 4,181,838 2.15 100,899 FLIR Systems Inc 4,091,454 2.11 33,875 Gentherm Inc 1,316,891 0.68
29,306 Hubbell Inc - Class B 3,672,921 1.89 6,423 Littelfuse Inc 1,094,672 0.56 58,592 Lumentum Holdings Inc 4,769,389 2.45 11,314 NextEra Energy Inc 2,717,057 1.40 45,599 Nikola Corp 3,079,984 1.58 12,391 NVIDIA Corp 4,702,013 2.42 201,308 ON Semiconductor Corp 3,988,918 2.05 11,433 QUALCOMM Inc 1,042,575 0.54 19,732 Rockwell Automation Inc 4,202,324 2.16 18,409 Roper Technologies Inc 7,147,570 3.68 65,559 Semtech Corp 3,422,508 1.76 30,033 Skyworks Solutions Inc 3,836,415 1.97 177,474 Slack Technologies Inc 5,516,779 2.84 62,698 Splunk Inc 12,449,315 6.41 20,234 TE Connectivity Ltd 1,650,083 0.85 4,715 Tesla Inc 5,089,064 2.62 27,000 Twilio Inc - Class A 5,917,455 3.05 30,969 Visteon Corp 2,121,222 1.09
Total investments in equities 192,086,126 98.84 Unrealised gain on forward foreign currency contracts - 67,176 (see below) (31 December 2019: 709,837) 67,176 0.04
Total financial assets at fair value through profit or loss 192,153,302 98.88 Unrealised loss on forward foreign currency contracts - (519,253) (see below) (31 December 2019: (3,660)) (519,253) (0.27)
Total financial liabilities at fair value through profit or loss (519,253) (0.27)
Net current assets 2,699,362 1.39
Total net assets 194,333,411 100.00
Analysis of portfolio % of Total Assets
Transferable securities and money market instruments admitted to official stock exchange listing or traded on a regulated market 96.92oTC financial derivative instruments 0.03other current assets 3.05
Total assets 100.00
BNY MELLON MOBILITY INNOVATION FUND
FUND 38 – BNy MELLON MOBILITy INNOVATION FUND
Equities cont’d.
United States of America cont’d.
USDUSD
03613-1A.indd 241 19/08/2020 19:01

242
Schedule of investments – as at 30 June 2020
BNy MELLON MOBILITy INNOVATION FUND
Forward foreign currency contracts cont’d.Unrealised
Gain/(Loss)Buy Sell Amount (B) Amount (S)Settle
Date Counterparty
BNy Mellon Mobility Innovation FundUS dollar Euro 1,065,479 950,000 01-Jul-20 Citigroup Global
Markets Limited (1,847)US dollar Swiss franc 421,196 400,000 01-Jul-20 UBS AG (990)
USD (2,837)
BNy Mellon Mobility Innovation Fund CHF E (Acc) (Hedged) Share ClassSwiss franc US dollar 12,141 12,810 01-Jul-20 The Bank of
New York Mellon 4Swiss franc US dollar 1,822 1,915 02-Jul-20 The Bank of
New York Mellon 8Swiss franc US dollar 71,205 74,971 15-Jul-20 The Bank of
New York Mellon 215Swiss franc US dollar 480,741 506,183 15-Jul-20 The Bank of
New York Mellon 1,430Swiss franc US dollar 30,776 32,350 15-Jul-20 The Bank of
New York Mellon 146Swiss franc US dollar 5,101 5,370 15-Jul-20 The Bank of
New York Mellon 16Swiss franc US dollar 15,543,103 16,379,002 15-Jul-20 The Bank of
New York Mellon 32,917Swiss franc US dollar 61,305 64,676 15-Jul-20 The Bank of
New York Mellon 56Swiss franc US dollar 6,700 7,071 15-Jul-20 The Bank of
New York Mellon 4Swiss franc US dollar 345,665 364,923 15-Jul-20 The Bank of
New York Mellon 63US dollar Swiss franc 12,303 11,621 15-Jul-20 The Bank of
New York Mellon 32US dollar Swiss franc 905,657 857,041 15-Jul-20 The Bank of
New York Mellon 710
USD 35,601
CHF 33,730
Swiss franc US dollar 47,104 49,947 15-Jul-20 The Bank of New York Mellon (210)
Swiss franc US dollar 247,500 262,606 15-Jul-20 The Bank of New York Mellon (1,272)
Swiss franc US dollar 79,446 84,109 15-Jul-20 The Bank of New York Mellon (222)
US dollar Swiss franc 1,916 1,822 15-Jul-20 The Bank of New York Mellon (8)
US dollar Swiss franc 12,815 12,141 15-Jul-20 The Bank of New York Mellon (5)
US dollar Swiss franc 384,660 364,607 15-Jul-20 The Bank of New York Mellon (327)
US dollar Swiss franc 5,743 5,442 15-Jul-20 The Bank of New York Mellon (3)
US dollar Swiss franc 5,226 4,957 15-Jul-20 The Bank of New York Mellon (7)
US dollar Swiss franc 210,734 200,150 15-Jul-20 The Bank of New York Mellon (604)
US dollar Swiss franc 32,442 30,766 15-Jul-20 The Bank of New York Mellon (43)
US dollar Swiss franc 40,893 38,841 15-Jul-20 The Bank of New York Mellon (119)
USD (2,820)
CHF (2,672)
Net USD 32,781
Net CHF 31,058
Forward foreign currency contracts cont’d.Unrealised
Gain/(Loss)Buy Sell Amount (B) Amount (S)Settle
Date Counterparty
BNy Mellon Mobility Innovation Fund CHF K (Acc) (Hedged) Share ClassSwiss franc US dollar 1,200 1,265 15-Jul-20 The Bank of
New York Mellon 2Swiss franc US dollar 85,161 89,668 15-Jul-20 The Bank of
New York Mellon 253Swiss franc US dollar 2,813,434 2,964,739 15-Jul-20 The Bank of
New York Mellon 5,958Swiss franc US dollar 14,818 15,633 15-Jul-20 The Bank of
New York Mellon 13Swiss franc US dollar 2,374 2,505 15-Jul-20 The Bank of
New York Mellon 1Swiss franc US dollar 61,541 64,970 15-Jul-20 The Bank of
New York Mellon 11US dollar Swiss franc 162,176 153,470 15-Jul-20 The Bank of
New York Mellon 127
USD 6,365
CHF 6,031
US dollar Swiss franc 69,009 65,412 15-Jul-20 The Bank of New York Mellon (59)
US dollar Swiss franc 11,947 11,331 15-Jul-20 The Bank of New York Mellon (17)
USD (76)
CHF (72)
Net USD 6,289
Net CHF 5,959
BNy Mellon Mobility Innovation Fund CHF K (Inc) (Hedged) Share ClassSwiss franc US dollar 5,523 5,815 15-Jul-20 The Bank of
New York Mellon 16Swiss franc US dollar 182,459 192,272 15-Jul-20 The Bank of
New York Mellon 386Swiss franc US dollar 3,989 4,212 15-Jul-20 The Bank of
New York Mellon 1US dollar Swiss franc 10,518 9,953 15-Jul-20 The Bank of
New York Mellon 8
USD 411
CHF 389
US dollar Swiss franc 4,466 4,233 15-Jul-20 The Bank of New York Mellon (4)
USD (4)
CHF (4)
Net USD 407
Net CHF 385
03613-1A.indd 242 19/08/2020 19:01

243
Schedule of investments – as at 30 June 2020
BNy MELLON MOBILITy INNOVATION FUND
Forward foreign currency contracts cont’d.Unrealised
Gain/(Loss)Buy Sell Amount (B) Amount (S)Settle
Date Counterparty
BNy Mellon Mobility Innovation Fund EUR H (Acc) (Hedged) Share Class cont’d.US dollar Euro 30,299 26,708 15-Jul-20 The Bank of
New York Mellon 284US dollar Euro 17,348 15,435 15-Jul-20 The Bank of
New York Mellon 2US dollar Euro 126,752 112,554 15-Jul-20 The Bank of
New York Mellon 258US dollar Euro 621 552 15-Jul-20 The Bank of
New York Mellon 1US dollar Euro 19,590 17,323 15-Jul-20 The Bank of
New York Mellon 121
USD 2,964
EUR 2,638
US dollar Euro 16,827 14,988 01-Jul-20 The Bank of New York Mellon (11)
Euro US dollar 15,435 17,344 02-Jul-20 The Bank of New York Mellon (2)
Euro US dollar 4,988 5,606 15-Jul-20 The Bank of New York Mellon (1)
Euro US dollar 22,959 25,962 15-Jul-20 The Bank of New York Mellon (160)
Euro US dollar 105,779 119,221 15-Jul-20 The Bank of New York Mellon (342)
Euro US dollar 8,131 9,156 15-Jul-20 The Bank of New York Mellon (19)
Euro US dollar 17,475 19,685 15-Jul-20 The Bank of New York Mellon (46)
Euro US dollar 9,986 11,306 15-Jul-20 The Bank of New York Mellon (83)
Euro US dollar 24,988 28,139 15-Jul-20 The Bank of New York Mellon (57)
Euro US dollar 32,982 37,418 15-Jul-20 The Bank of New York Mellon (351)
Euro US dollar 4,988 5,639 15-Jul-20 The Bank of New York Mellon (34)
Euro US dollar 4,723,467 5,366,006 15-Jul-20 The Bank of New York Mellon (57,585)
US dollar Euro 28,716 25,657 15-Jul-20 The Bank of New York Mellon (119)
USD (58,810)
EUR (52,345)
Net USD (55,846)
Net EUR (49,707)
BNy Mellon Mobility Innovation Fund EUR H (Inc) (Hedged) Share ClassEuro US dollar 4,388 4,925 15-Jul-20 The Bank of
New York Mellon 6US dollar Euro 8,960 7,922 15-Jul-20 The Bank of
New York Mellon 57US dollar Euro 3,785 3,361 15-Jul-20 The Bank of
New York Mellon 8
USD 71
EUR 63
Forward foreign currency contracts cont’d.Unrealised
Gain/(Loss)Buy Sell Amount (B) Amount (S)Settle
Date Counterparty
BNy Mellon Mobility Innovation Fund EUR E (Acc) (Hedged) Share ClassEuro US dollar 42,929 48,047 15-Jul-20 The Bank of
New York Mellon 199Euro US dollar 24,138 27,057 15-Jul-20 The Bank of
New York Mellon 70Euro US dollar 397,225 445,832 15-Jul-20 The Bank of
New York Mellon 585US dollar Euro 338,147 300,272 15-Jul-20 The Bank of
New York Mellon 689US dollar Euro 67,779 59,938 15-Jul-20 The Bank of
New York Mellon 419US dollar Euro 40,083 35,583 15-Jul-20 The Bank of
New York Mellon 94US dollar Euro 42,521 37,558 15-Jul-20 The Bank of
New York Mellon 312US dollar Euro 19,762 17,475 15-Jul-20 The Bank of
New York Mellon 123US dollar Euro 805,251 711,989 15-Jul-20 The Bank of
New York Mellon 5,089US dollar Euro 73,210 64,532 15-Jul-20 The Bank of
New York Mellon 686
USD 8,266
EUR 7,357
Euro US dollar 75,438 84,916 15-Jul-20 The Bank of New York Mellon (136)
Euro US dollar 289,204 325,954 15-Jul-20 The Bank of New York Mellon (935)
Euro US dollar 25,841 29,256 15-Jul-20 The Bank of New York Mellon (215)
Euro US dollar 58,328 66,484 15-Jul-20 The Bank of New York Mellon (933)
Euro US dollar 85,554 97,059 15-Jul-20 The Bank of New York Mellon (910)
Euro US dollar 12,930,397 14,689,337 15-Jul-20 The Bank of New York Mellon (157,637)
US dollar Euro 27,241 24,268 15-Jul-20 The Bank of New York Mellon (32)
USD (160,798)
EUR (143,122)
Net USD (152,532)
Net EUR (135,765)
BNy Mellon Mobility Innovation Fund EUR H (Acc) (Hedged) Share ClassUS dollar Euro 5,604 4,988 02-Jul-20 The Bank of
New York Mellon 1Euro US dollar 14,988 16,832 15-Jul-20 The Bank of
New York Mellon 12Euro US dollar 5,988 6,721 15-Jul-20 The Bank of
New York Mellon 8Euro US dollar 28,909 32,355 15-Jul-20 The Bank of
New York Mellon 134Euro US dollar 24,975 27,995 15-Jul-20 The Bank of
New York Mellon 73Euro US dollar 144,847 162,572 15-Jul-20 The Bank of
New York Mellon 213US dollar Euro 293,828 259,798 15-Jul-20 The Bank of
New York Mellon 1,857
03613-1A.indd 243 19/08/2020 19:01

244
Schedule of investments – as at 30 June 2020
BNy MELLON MOBILITy INNOVATION FUND
Forward foreign currency contracts cont’d.Unrealised
Gain/(Loss)Buy Sell Amount (B) Amount (S)Settle
Date Counterparty
BNy Mellon Mobility Innovation Fund EUR K (Acc) (Hedged) Share Class cont’d.Euro US dollar 32,852 36,995 15-Jul-20 The Bank of
New York Mellon (75)Euro US dollar 9,957 11,349 15-Jul-20 The Bank of
New York Mellon (159)Euro US dollar 5,135,655 5,834,265 15-Jul-20 The Bank of
New York Mellon (62,610)
USD (63,517)
EUR (56,535)
Net USD (60,871)
Net EUR (54,180)
BNy Mellon Mobility Innovation Fund EUR K (Inc) (Hedged) Share ClassEuro US dollar 7,718 8,663 15-Jul-20 The Bank of
New York Mellon 11US dollar Euro 14,775 13,063 15-Jul-20 The Bank of
New York Mellon 93US dollar Euro 7,061 6,270 15-Jul-20 The Bank of
New York Mellon 14
USD 118
EUR 105
Euro US dollar 13,298 15,038 15-Jul-20 The Bank of New York Mellon (93)
Euro US dollar 5,650 6,368 15-Jul-20 The Bank of New York Mellon (18)
Euro US dollar 17,271 19,449 15-Jul-20 The Bank of New York Mellon (39)
Euro US dollar 238,192 270,594 15-Jul-20 The Bank of New York Mellon (2,904)
USD (3,054)
EUR (2,718)
Net USD (2,936)
Net EUR (2,613)
BNy Mellon Mobility Innovation Fund EUR W (Acc) (Hedged) Share ClassEuro US dollar 7,667 8,608 01-Jul-20 The Bank of
New York Mellon 6Euro US dollar 336 378 02-Jul-20 The Bank of
New York Mellon - US dollar Euro 51,375 45,722 02-Jul-20 The Bank of
New York Mellon 7Euro US dollar 346,220 388,586 15-Jul-20 The Bank of
New York Mellon 510Euro US dollar 54,824 61,453 15-Jul-20 The Bank of
New York Mellon 160Euro US dollar 94,172 105,398 15-Jul-20 The Bank of
New York Mellon 436Euro US dollar 26,610 29,870 15-Jul-20 The Bank of
New York Mellon 35Euro US dollar 23,100 25,943 15-Jul-20 The Bank of
New York Mellon 18
Forward foreign currency contracts cont’d.Unrealised
Gain/(Loss)Buy Sell Amount (B) Amount (S)Settle
Date Counterparty
BNy Mellon Mobility Innovation Fund EUR H (Inc) (Hedged) Share Class cont’d.Euro US dollar 3,169 3,572 15-Jul-20 The Bank of
New York Mellon (10)Euro US dollar 144,352 163,988 15-Jul-20 The Bank of
New York Mellon (1,760)
USD (1,770)
EUR (1,575)
Net USD (1,699)
Net EUR (1,512)
BNy Mellon Mobility Innovation Fund EUR J (Acc) (Hedged) Share ClassEuro US dollar 22,741 25,524 15-Jul-20 The Bank of
New York Mellon 34US dollar Euro 19,546 17,356 15-Jul-20 The Bank of
New York Mellon 40US dollar Euro 46,310 40,946 15-Jul-20 The Bank of
New York Mellon 293
USD 367
EUR 327
Euro US dollar 16,454 18,545 15-Jul-20 The Bank of New York Mellon (53)
Euro US dollar 746,562 848,117 15-Jul-20 The Bank of New York Mellon (9,101)
USD (9,154)
EUR (8,148)
Net USD (8,787)
Net EUR (7,821)
BNy Mellon Mobility Innovation Fund EUR K (Acc) (Hedged) Share ClassEuro US dollar 120 134 15-Jul-20 The Bank of
New York Mellon 1Euro US dollar 39,194 43,933 15-Jul-20 The Bank of
New York Mellon 114Euro US dollar 158,433 177,820 15-Jul-20 The Bank of
New York Mellon 233US dollar Euro 137,671 122,251 15-Jul-20 The Bank of
New York Mellon 281US dollar Euro 319,114 282,155 15-Jul-20 The Bank of
New York Mellon 2,017
USD 2,646
EUR 2,355
Euro US dollar 2,454 2,775 15-Jul-20 The Bank of New York Mellon (17)
Euro US dollar 115,706 130,409 15-Jul-20 The Bank of New York Mellon (374)
Euro US dollar 33,885 38,363 15-Jul-20 The Bank of New York Mellon (282)
03613-1A.indd 244 19/08/2020 19:01
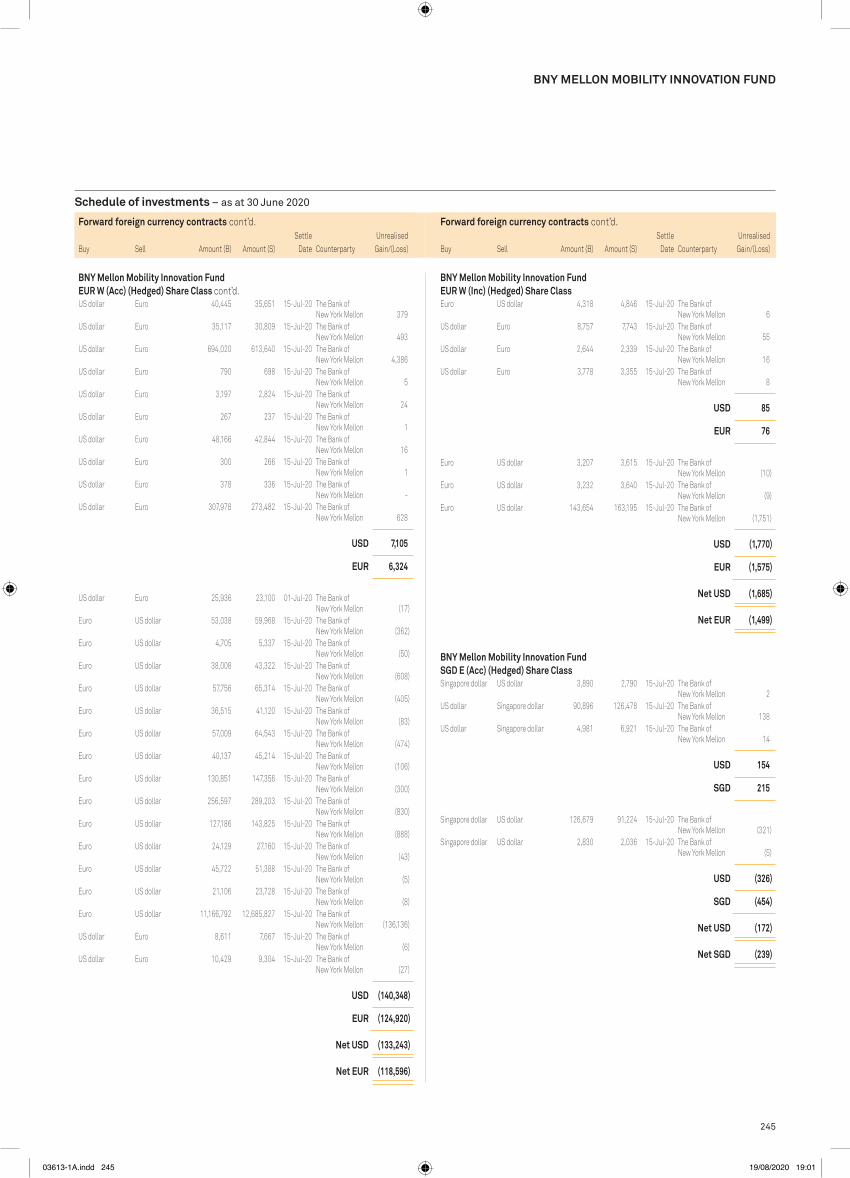
245
Schedule of investments – as at 30 June 2020
BNy MELLON MOBILITy INNOVATION FUND
Forward foreign currency contracts cont’d.Unrealised
Gain/(Loss)Buy Sell Amount (B) Amount (S)Settle
Date Counterparty
BNy Mellon Mobility Innovation Fund EUR W (Acc) (Hedged) Share Class cont’d.US dollar Euro 40,445 35,651 15-Jul-20 The Bank of
New York Mellon 379US dollar Euro 35,117 30,809 15-Jul-20 The Bank of
New York Mellon 493US dollar Euro 694,020 613,640 15-Jul-20 The Bank of
New York Mellon 4,386US dollar Euro 790 698 15-Jul-20 The Bank of
New York Mellon 5US dollar Euro 3,197 2,824 15-Jul-20 The Bank of
New York Mellon 24US dollar Euro 267 237 15-Jul-20 The Bank of
New York Mellon 1US dollar Euro 48,166 42,844 15-Jul-20 The Bank of
New York Mellon 16US dollar Euro 300 266 15-Jul-20 The Bank of
New York Mellon 1US dollar Euro 378 336 15-Jul-20 The Bank of
New York Mellon - US dollar Euro 307,978 273,482 15-Jul-20 The Bank of
New York Mellon 628
USD 7,105
EUR 6,324
US dollar Euro 25,936 23,100 01-Jul-20 The Bank of New York Mellon (17)
Euro US dollar 53,038 59,968 15-Jul-20 The Bank of New York Mellon (362)
Euro US dollar 4,705 5,337 15-Jul-20 The Bank of New York Mellon (50)
Euro US dollar 38,008 43,322 15-Jul-20 The Bank of New York Mellon (608)
Euro US dollar 57,756 65,314 15-Jul-20 The Bank of New York Mellon (405)
Euro US dollar 36,515 41,120 15-Jul-20 The Bank of New York Mellon (83)
Euro US dollar 57,009 64,543 15-Jul-20 The Bank of New York Mellon (474)
Euro US dollar 40,137 45,214 15-Jul-20 The Bank of New York Mellon (106)
Euro US dollar 130,851 147,356 15-Jul-20 The Bank of New York Mellon (300)
Euro US dollar 256,597 289,203 15-Jul-20 The Bank of New York Mellon (830)
Euro US dollar 127,186 143,825 15-Jul-20 The Bank of New York Mellon (888)
Euro US dollar 24,129 27,160 15-Jul-20 The Bank of New York Mellon (43)
Euro US dollar 45,722 51,388 15-Jul-20 The Bank of New York Mellon (5)
Euro US dollar 21,106 23,728 15-Jul-20 The Bank of New York Mellon (8)
Euro US dollar 11,166,792 12,685,827 15-Jul-20 The Bank of New York Mellon (136,136)
US dollar Euro 8,611 7,667 15-Jul-20 The Bank of New York Mellon (6)
US dollar Euro 10,429 9,304 15-Jul-20 The Bank of New York Mellon (27)
USD (140,348)
EUR (124,920)
Net USD (133,243)
Net EUR (118,596)
Forward foreign currency contracts cont’d.Unrealised
Gain/(Loss)Buy Sell Amount (B) Amount (S)Settle
Date Counterparty
BNy Mellon Mobility Innovation Fund EUR W (Inc) (Hedged) Share ClassEuro US dollar 4,318 4,846 15-Jul-20 The Bank of
New York Mellon 6US dollar Euro 8,757 7,743 15-Jul-20 The Bank of
New York Mellon 55US dollar Euro 2,644 2,339 15-Jul-20 The Bank of
New York Mellon 16US dollar Euro 3,778 3,355 15-Jul-20 The Bank of
New York Mellon 8
USD 85
EUR 76
Euro US dollar 3,207 3,615 15-Jul-20 The Bank of New York Mellon (10)
Euro US dollar 3,232 3,640 15-Jul-20 The Bank of New York Mellon (9)
Euro US dollar 143,654 163,195 15-Jul-20 The Bank of New York Mellon (1,751)
USD (1,770)
EUR (1,575)
Net USD (1,685)
Net EUR (1,499)
BNy Mellon Mobility Innovation Fund SGD E (Acc) (Hedged) Share ClassSingapore dollar US dollar 3,890 2,790 15-Jul-20 The Bank of
New York Mellon 2US dollar Singapore dollar 90,896 126,478 15-Jul-20 The Bank of
New York Mellon 138US dollar Singapore dollar 4,981 6,921 15-Jul-20 The Bank of
New York Mellon 14
USD 154
SGD 215
Singapore dollar US dollar 126,679 91,224 15-Jul-20 The Bank of New York Mellon (321)
Singapore dollar US dollar 2,830 2,036 15-Jul-20 The Bank of New York Mellon (5)
USD (326)
SGD (454)
Net USD (172)
Net SGD (239)
03613-1A.indd 245 19/08/2020 19:01

246
Schedule of investments – as at 30 June 2020
BNy MELLON MOBILITy INNOVATION FUND
Forward foreign currency contracts cont’d.Unrealised
Gain/(Loss)Buy Sell Amount (B) Amount (S)Settle
Date Counterparty
BNy Mellon Mobility Innovation Fund Sterling K (Acc) (Hedged) Share ClassUS dollar Sterling 50,100 40,000 15-Jul-20 The Bank of
New York Mellon 532US dollar Sterling 19,527 15,508 15-Jul-20 The Bank of
New York Mellon 310
USD 842
GBp 680
Sterling US dollar 5,303 6,612 15-Jul-20 The Bank of New York Mellon (40)
Sterling US dollar 7,505 9,414 15-Jul-20 The Bank of New York Mellon (114)
Sterling US dollar 282,124 358,581 15-Jul-20 The Bank of New York Mellon (8,969)
US dollar Sterling 6,878 5,591 15-Jul-20 The Bank of New York Mellon (51)
USD (9,174)
GBp (7,404)
Net USD (8,332)
Net GBp (6,724)
Forward foreign currency contracts cont’d.Unrealised
Gain/(Loss)Buy Sell Amount (B) Amount (S)Settle
Date Counterparty
BNy Mellon Mobility Innovation Fund SGD K (Inc) (Hedged) Share ClassSingapore dollar US dollar 4,864 3,488 15-Jul-20 The Bank of
New York Mellon 2US dollar Singapore dollar 2,638 3,676 15-Jul-20 The Bank of
New York Mellon - US dollar Singapore dollar 6,264 8,704 15-Jul-20 The Bank of
New York Mellon 17
USD 19
SGD 26
Singapore dollar US dollar 3,523 2,534 15-Jul-20 The Bank of New York Mellon (6)
Singapore dollar US dollar 159,081 114,558 15-Jul-20 The Bank of New York Mellon (403)
USD (409)
SGD (570)
Net USD (390)
Net SGD (544)
BNy Mellon Mobility Innovation Fund Sterling E (Acc) (Hedged) Share ClassUS dollar Sterling 136,356 108,290 15-Jul-20 The Bank of
New York Mellon 2,162
USD 2,162
GBp 1,745
Sterling US dollar 43,972 54,821 15-Jul-20 The Bank of New York Mellon (331)
Sterling US dollar 60,196 75,510 15-Jul-20 The Bank of New York Mellon (914)
Sterling US dollar 1,972,939 2,507,621 15-Jul-20 The Bank of New York Mellon (62,725)
US dollar Sterling 56,356 45,813 15-Jul-20 The Bank of New York Mellon (416)
USD (64,386)
GBp (51,962)
Net USD (62,224)
Net GBp (50,217)
03613-1A.indd 246 19/08/2020 19:01
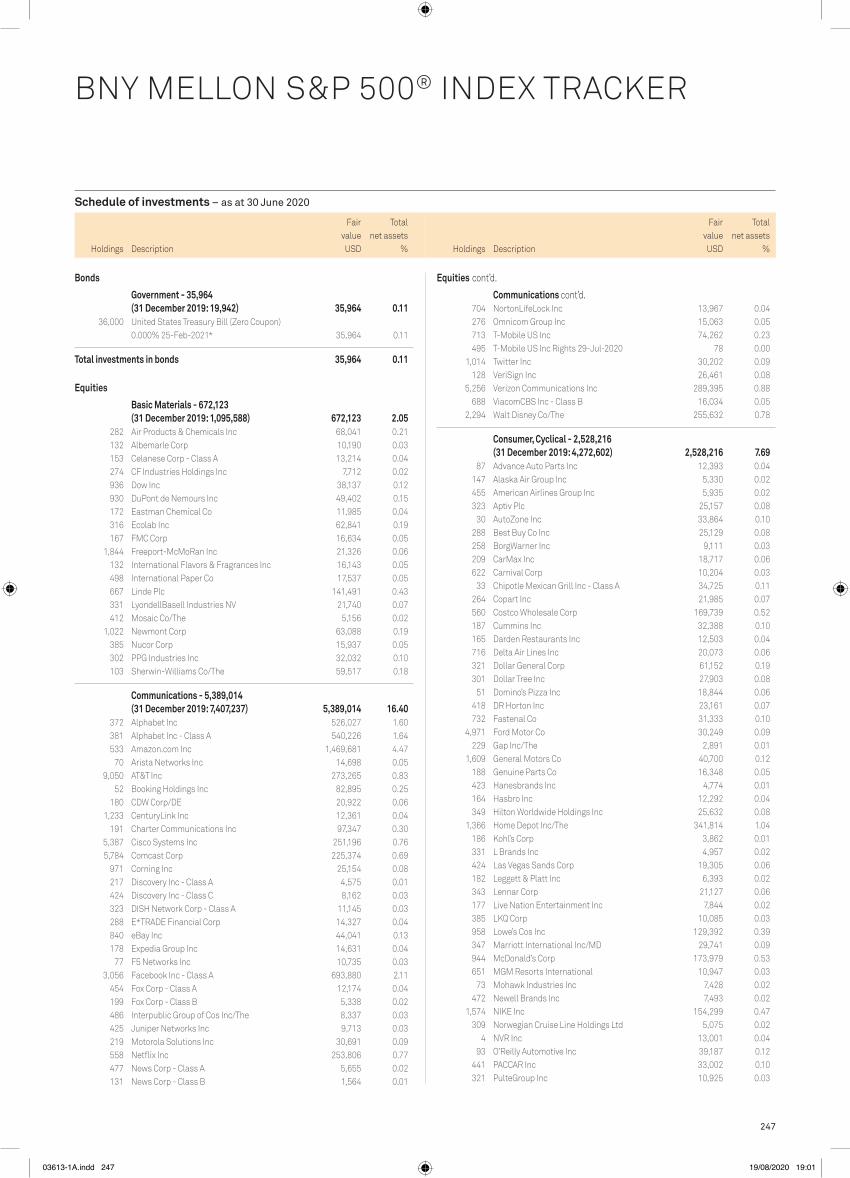
247
Schedule of investments – as at 30 June 2020
Holdings Description
Fair value
Total net assets
% Holdings Description
Fair value
Total net assets
%
FUND 39 – BNy MELLON S&p 500® INDEx TRACKER
BNY MELLON S&P 500® INDEX TRACKER
704 NortonLifeLock Inc 13,967 0.04 276 Omnicom Group Inc 15,063 0.05 713 T-Mobile US Inc 74,262 0.23 495 T-Mobile US Inc Rights 29-Jul-2020 78 0.00 1,014 Twitter Inc 30,202 0.09 128 VeriSign Inc 26,461 0.08 5,256 Verizon Communications Inc 289,395 0.88 688 ViacomCBS Inc - Class B 16,034 0.05 2,294 Walt Disney Co/The 255,632 0.78
Consumer, Cyclical - 2,528,216 (31 December 2019: 4,272,602) 2,528,216 7.69
87 Advance Auto Parts Inc 12,393 0.04 147 Alaska Air Group Inc 5,330 0.02 455 American Airlines Group Inc 5,935 0.02 323 Aptiv Plc 25,157 0.08 30 AutoZone Inc 33,864 0.10 288 Best Buy Co Inc 25,129 0.08 258 BorgWarner Inc 9,111 0.03 209 CarMax Inc 18,717 0.06 622 Carnival Corp 10,204 0.03 33 Chipotle Mexican Grill Inc - Class A 34,725 0.11 264 Copart Inc 21,985 0.07 560 Costco Wholesale Corp 169,739 0.52 187 Cummins Inc 32,388 0.10 165 Darden Restaurants Inc 12,503 0.04 716 Delta Air Lines Inc 20,073 0.06 321 Dollar General Corp 61,152 0.19 301 Dollar Tree Inc 27,903 0.08 51 Domino’s Pizza Inc 18,844 0.06 418 DR Horton Inc 23,161 0.07 732 Fastenal Co 31,333 0.10 4,971 Ford Motor Co 30,249 0.09 229 Gap Inc/The 2,891 0.01 1,609 General Motors Co 40,700 0.12 188 Genuine Parts Co 16,348 0.05 423 Hanesbrands Inc 4,774 0.01 164 Hasbro Inc 12,292 0.04 349 Hilton Worldwide Holdings Inc 25,632 0.08 1,366 Home Depot Inc/The 341,814 1.04 186 Kohl’s Corp 3,862 0.01 331 L Brands Inc 4,957 0.02 424 Las Vegas Sands Corp 19,305 0.06 182 Leggett & Platt Inc 6,393 0.02 343 Lennar Corp 21,127 0.06 177 Live Nation Entertainment Inc 7,844 0.02 385 LKQ Corp 10,085 0.03 958 Lowe’s Cos Inc 129,392 0.39 347 Marriott International Inc/MD 29,741 0.09 944 McDonald’s Corp 173,979 0.53 651 MGM Resorts International 10,947 0.03 73 Mohawk Industries Inc 7,428 0.02 472 Newell Brands Inc 7,493 0.02 1,574 NIKE Inc 154,299 0.47 309 Norwegian Cruise Line Holdings Ltd 5,075 0.02 4 NVR Inc 13,001 0.04 93 O’Reilly Automotive Inc 39,187 0.12 441 PACCAR Inc 33,002 0.10 321 PulteGroup Inc 10,925 0.03
Bonds
Government - 35,964 (31 December 2019: 19,942) 35,964 0.11
36,000 United States Treasury Bill (Zero Coupon) 0.000% 25-Feb-2021* 35,964 0.11
Total investments in bonds 35,964 0.11
Equities
Basic Materials - 672,123 (31 December 2019: 1,095,588) 672,123 2.05
282 Air Products & Chemicals Inc 68,041 0.21 132 Albemarle Corp 10,190 0.03 153 Celanese Corp - Class A 13,214 0.04 274 CF Industries Holdings Inc 7,712 0.02 936 Dow Inc 38,137 0.12 930 DuPont de Nemours Inc 49,402 0.15 172 Eastman Chemical Co 11,985 0.04 316 Ecolab Inc 62,841 0.19 167 FMC Corp 16,634 0.05 1,844 Freeport-McMoRan Inc 21,326 0.06 132 International Flavors & Fragrances Inc 16,143 0.05 498 International Paper Co 17,537 0.05 667 Linde Plc 141,491 0.43 331 LyondellBasell Industries NV 21,740 0.07 412 Mosaic Co/The 5,156 0.02 1,022 Newmont Corp 63,088 0.19 385 Nucor Corp 15,937 0.05 302 PPG Industries Inc 32,032 0.10 103 Sherwin-Williams Co/The 59,517 0.18
Communications - 5,389,014 (31 December 2019: 7,407,237) 5,389,014 16.40
372 Alphabet Inc 526,027 1.60 381 Alphabet Inc - Class A 540,226 1.64 533 Amazon.com Inc 1,469,681 4.47 70 Arista Networks Inc 14,698 0.05 9,050 AT&T Inc 273,265 0.83 52 Booking Holdings Inc 82,895 0.25 180 CDW Corp/DE 20,922 0.06 1,233 CenturyLink Inc 12,361 0.04 191 Charter Communications Inc 97,347 0.30 5,387 Cisco Systems Inc 251,196 0.76 5,784 Comcast Corp 225,374 0.69 971 Corning Inc 25,154 0.08 217 Discovery Inc - Class A 4,575 0.01 424 Discovery Inc - Class C 8,162 0.03 323 DISH Network Corp - Class A 11,145 0.03 288 E*TRADE Financial Corp 14,327 0.04 840 eBay Inc 44,041 0.13 178 Expedia Group Inc 14,631 0.04 77 F5 Networks Inc 10,735 0.03 3,056 Facebook Inc - Class A 693,880 2.11 454 Fox Corp - Class A 12,174 0.04 199 Fox Corp - Class B 5,338 0.02 486 Interpublic Group of Cos Inc/The 8,337 0.03 425 Juniper Networks Inc 9,713 0.03 219 Motorola Solutions Inc 30,691 0.09 558 Netflix Inc 253,806 0.77 477 News Corp - Class A 5,655 0.02 131 News Corp - Class B 1,564 0.01
Equities cont’d.
Communications cont’d.
USDUSD
03613-1A.indd 247 19/08/2020 19:01
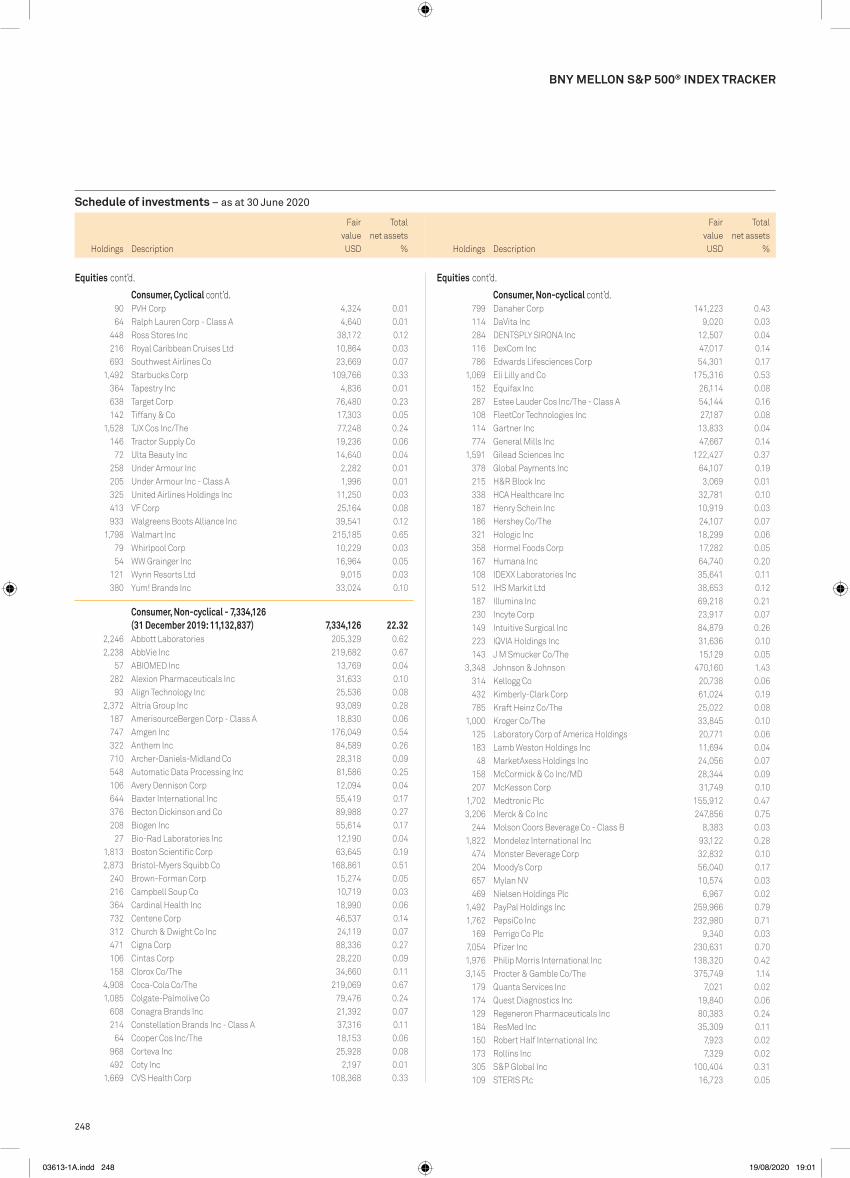
248
Schedule of investments – as at 30 June 2020
Holdings Description
Fair value
Total net assets
% Holdings Description
Fair value
Total net assets
%
BNy MELLON S&p 500® INDEx TRACKER
799 Danaher Corp 141,223 0.43 114 DaVita Inc 9,020 0.03 284 DENTSPLY SIRONA Inc 12,507 0.04 116 DexCom Inc 47,017 0.14 786 Edwards Lifesciences Corp 54,301 0.17 1,069 Eli Lilly and Co 175,316 0.53 152 Equifax Inc 26,114 0.08 287 Estee Lauder Cos Inc/The - Class A 54,144 0.16 108 FleetCor Technologies Inc 27,187 0.08 114 Gartner Inc 13,833 0.04 774 General Mills Inc 47,667 0.14 1,591 Gilead Sciences Inc 122,427 0.37 378 Global Payments Inc 64,107 0.19 215 H&R Block Inc 3,069 0.01 338 HCA Healthcare Inc 32,781 0.10 187 Henry Schein Inc 10,919 0.03 186 Hershey Co/The 24,107 0.07 321 Hologic Inc 18,299 0.06 358 Hormel Foods Corp 17,282 0.05 167 Humana Inc 64,740 0.20 108 IDEXX Laboratories Inc 35,641 0.11 512 IHS Markit Ltd 38,653 0.12 187 Illumina Inc 69,218 0.21 230 Incyte Corp 23,917 0.07 149 Intuitive Surgical Inc 84,879 0.26 223 IQVIA Holdings Inc 31,636 0.10 143 J M Smucker Co/The 15,129 0.05 3,348 Johnson & Johnson 470,160 1.43 314 Kellogg Co 20,738 0.06 432 Kimberly-Clark Corp 61,024 0.19 785 Kraft Heinz Co/The 25,022 0.08 1,000 Kroger Co/The 33,845 0.10 125 Laboratory Corp of America Holdings 20,771 0.06 183 Lamb Weston Holdings Inc 11,694 0.04 48 MarketAxess Holdings Inc 24,056 0.07 158 McCormick & Co Inc/MD 28,344 0.09 207 McKesson Corp 31,749 0.10 1,702 Medtronic Plc 155,912 0.47 3,206 Merck & Co Inc 247,856 0.75 244 Molson Coors Beverage Co - Class B 8,383 0.03 1,822 Mondelez International Inc 93,122 0.28 474 Monster Beverage Corp 32,832 0.10 204 Moody’s Corp 56,040 0.17 657 Mylan NV 10,574 0.03 469 Nielsen Holdings Plc 6,967 0.02 1,492 PayPal Holdings Inc 259,966 0.79 1,762 PepsiCo Inc 232,980 0.71 169 Perrigo Co Plc 9,340 0.03 7,054 Pfizer Inc 230,631 0.70 1,976 Philip Morris International Inc 138,320 0.42 3,145 Procter & Gamble Co/The 375,749 1.14 179 Quanta Services Inc 7,021 0.02 174 Quest Diagnostics Inc 19,840 0.06 129 Regeneron Pharmaceuticals Inc 80,383 0.24 184 ResMed Inc 35,309 0.11 150 Robert Half International Inc 7,923 0.02 173 Rollins Inc 7,329 0.02 305 S&P Global Inc 100,404 0.31 109 STERIS Plc 16,723 0.05
90 PVH Corp 4,324 0.01 64 Ralph Lauren Corp - Class A 4,640 0.01 448 Ross Stores Inc 38,172 0.12 216 Royal Caribbean Cruises Ltd 10,864 0.03 693 Southwest Airlines Co 23,669 0.07 1,492 Starbucks Corp 109,766 0.33 364 Tapestry Inc 4,836 0.01 638 Target Corp 76,480 0.23 142 Tiffany & Co 17,303 0.05 1,528 TJX Cos Inc/The 77,248 0.24 146 Tractor Supply Co 19,236 0.06 72 Ulta Beauty Inc 14,640 0.04 258 Under Armour Inc 2,282 0.01 205 Under Armour Inc - Class A 1,996 0.01 325 United Airlines Holdings Inc 11,250 0.03 413 VF Corp 25,164 0.08 933 Walgreens Boots Alliance Inc 39,541 0.12 1,798 Walmart Inc 215,185 0.65 79 Whirlpool Corp 10,229 0.03 54 WW Grainger Inc 16,964 0.05 121 Wynn Resorts Ltd 9,015 0.03 380 Yum! Brands Inc 33,024 0.10
Consumer, Non-cyclical - 7,334,126 (31 December 2019: 11,132,837) 7,334,126 22.32
2,246 Abbott Laboratories 205,329 0.62 2,238 AbbVie Inc 219,682 0.67 57 ABIOMED Inc 13,769 0.04 282 Alexion Pharmaceuticals Inc 31,633 0.10 93 Align Technology Inc 25,536 0.08 2,372 Altria Group Inc 93,089 0.28 187 AmerisourceBergen Corp - Class A 18,830 0.06 747 Amgen Inc 176,049 0.54 322 Anthem Inc 84,589 0.26 710 Archer-Daniels-Midland Co 28,318 0.09 548 Automatic Data Processing Inc 81,586 0.25 106 Avery Dennison Corp 12,094 0.04 644 Baxter International Inc 55,419 0.17 376 Becton Dickinson and Co 89,988 0.27 208 Biogen Inc 55,614 0.17 27 Bio-Rad Laboratories Inc 12,190 0.04 1,813 Boston Scientific Corp 63,645 0.19 2,873 Bristol-Myers Squibb Co 168,861 0.51 240 Brown-Forman Corp 15,274 0.05 216 Campbell Soup Co 10,719 0.03 364 Cardinal Health Inc 18,990 0.06 732 Centene Corp 46,537 0.14 312 Church & Dwight Co Inc 24,119 0.07 471 Cigna Corp 88,336 0.27 106 Cintas Corp 28,220 0.09 158 Clorox Co/The 34,660 0.11 4,908 Coca-Cola Co/The 219,069 0.67 1,085 Colgate-Palmolive Co 79,476 0.24 608 Conagra Brands Inc 21,392 0.07 214 Constellation Brands Inc - Class A 37,316 0.11 64 Cooper Cos Inc/The 18,153 0.06 968 Corteva Inc 25,928 0.08 492 Coty Inc 2,197 0.01 1,669 CVS Health Corp 108,368 0.33
Equities cont’d.
Consumer, Cyclical cont’d.
Equities cont’d.
Consumer, Non-cyclical cont’d.
USDUSD
03613-1A.indd 248 19/08/2020 19:01
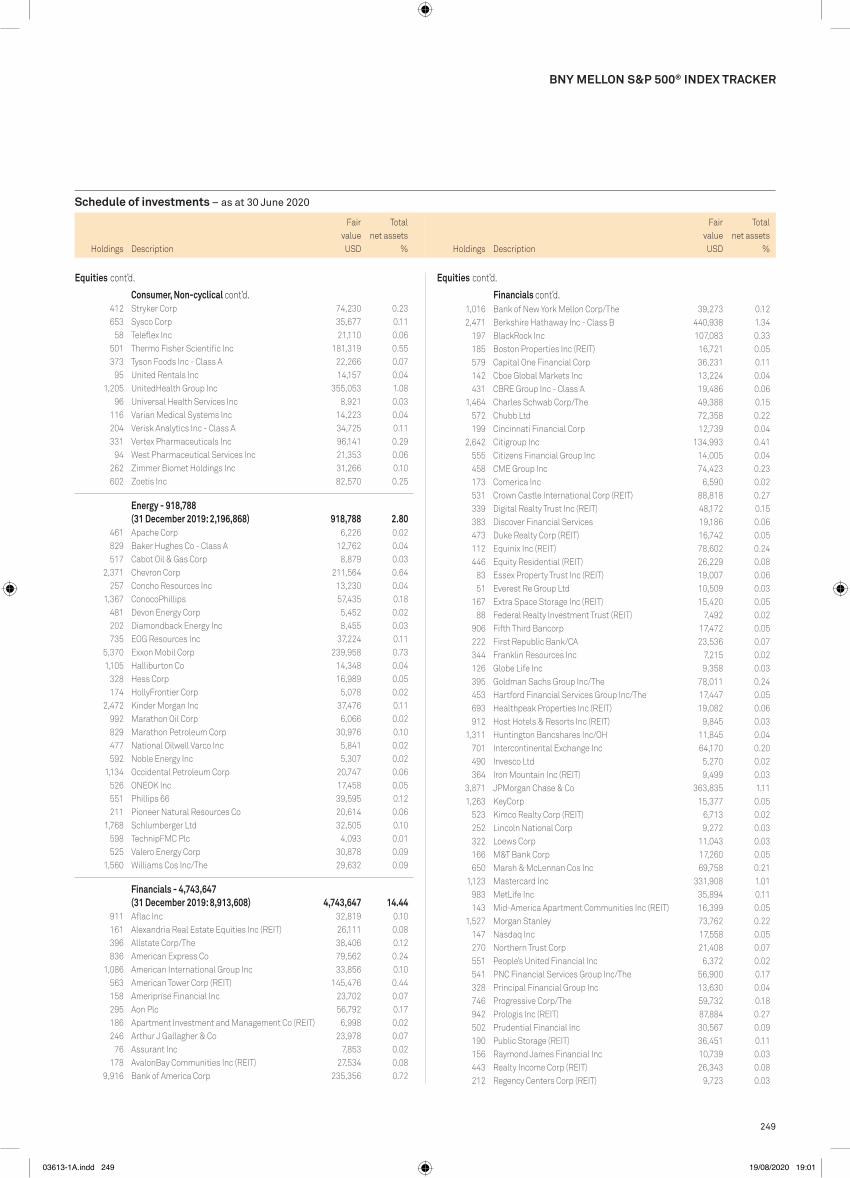
249
Schedule of investments – as at 30 June 2020
Holdings Description
Fair value
Total net assets
% Holdings Description
Fair value
Total net assets
%
BNy MELLON S&p 500® INDEx TRACKER
1,016 Bank of New York Mellon Corp/The 39,273 0.12 2,471 Berkshire Hathaway Inc - Class B 440,938 1.34 197 BlackRock Inc 107,083 0.33 185 Boston Properties Inc (REIT) 16,721 0.05 579 Capital One Financial Corp 36,231 0.11 142 Cboe Global Markets Inc 13,224 0.04 431 CBRE Group Inc - Class A 19,486 0.06 1,464 Charles Schwab Corp/The 49,388 0.15 572 Chubb Ltd 72,358 0.22 199 Cincinnati Financial Corp 12,739 0.04 2,642 Citigroup Inc 134,993 0.41 555 Citizens Financial Group Inc 14,005 0.04 458 CME Group Inc 74,423 0.23 173 Comerica Inc 6,590 0.02 531 Crown Castle International Corp (REIT) 88,818 0.27 339 Digital Realty Trust Inc (REIT) 48,172 0.15 383 Discover Financial Services 19,186 0.06 473 Duke Realty Corp (REIT) 16,742 0.05 112 Equinix Inc (REIT) 78,602 0.24 446 Equity Residential (REIT) 26,229 0.08 83 Essex Property Trust Inc (REIT) 19,007 0.06 51 Everest Re Group Ltd 10,509 0.03 167 Extra Space Storage Inc (REIT) 15,420 0.05 88 Federal Realty Investment Trust (REIT) 7,492 0.02 906 Fifth Third Bancorp 17,472 0.05 222 First Republic Bank/CA 23,536 0.07 344 Franklin Resources Inc 7,215 0.02 126 Globe Life Inc 9,358 0.03 395 Goldman Sachs Group Inc/The 78,011 0.24 453 Hartford Financial Services Group Inc/The 17,447 0.05 693 Healthpeak Properties Inc (REIT) 19,082 0.06 912 Host Hotels & Resorts Inc (REIT) 9,845 0.03 1,311 Huntington Bancshares Inc/OH 11,845 0.04 701 Intercontinental Exchange Inc 64,170 0.20 490 Invesco Ltd 5,270 0.02 364 Iron Mountain Inc (REIT) 9,499 0.03 3,871 JPMorgan Chase & Co 363,835 1.11 1,263 KeyCorp 15,377 0.05 523 Kimco Realty Corp (REIT) 6,713 0.02 252 Lincoln National Corp 9,272 0.03 322 Loews Corp 11,043 0.03 166 M&T Bank Corp 17,260 0.05 650 Marsh & McLennan Cos Inc 69,758 0.21 1,123 Mastercard Inc 331,908 1.01 983 MetLife Inc 35,894 0.11 143 Mid-America Apartment Communities Inc (REIT) 16,399 0.05 1,527 Morgan Stanley 73,762 0.22 147 Nasdaq Inc 17,558 0.05 270 Northern Trust Corp 21,408 0.07 551 People’s United Financial Inc 6,372 0.02 541 PNC Financial Services Group Inc/The 56,900 0.17 328 Principal Financial Group Inc 13,630 0.04 746 Progressive Corp/The 59,732 0.18 942 Prologis Inc (REIT) 87,884 0.27 502 Prudential Financial Inc 30,567 0.09 190 Public Storage (REIT) 36,451 0.11 156 Raymond James Financial Inc 10,739 0.03 443 Realty Income Corp (REIT) 26,343 0.08 212 Regency Centers Corp (REIT) 9,723 0.03
412 Stryker Corp 74,230 0.23 653 Sysco Corp 35,677 0.11 58 Teleflex Inc 21,110 0.06 501 Thermo Fisher Scientific Inc 181,319 0.55 373 Tyson Foods Inc - Class A 22,266 0.07 95 United Rentals Inc 14,157 0.04 1,205 UnitedHealth Group Inc 355,053 1.08 96 Universal Health Services Inc 8,921 0.03 116 Varian Medical Systems Inc 14,223 0.04 204 Verisk Analytics Inc - Class A 34,725 0.11 331 Vertex Pharmaceuticals Inc 96,141 0.29 94 West Pharmaceutical Services Inc 21,353 0.06 262 Zimmer Biomet Holdings Inc 31,266 0.10 602 Zoetis Inc 82,570 0.25
Energy - 918,788 (31 December 2019: 2,196,868) 918,788 2.80
461 Apache Corp 6,226 0.02 829 Baker Hughes Co - Class A 12,762 0.04 517 Cabot Oil & Gas Corp 8,879 0.03 2,371 Chevron Corp 211,564 0.64 257 Concho Resources Inc 13,230 0.04 1,367 ConocoPhillips 57,435 0.18 481 Devon Energy Corp 5,452 0.02 202 Diamondback Energy Inc 8,455 0.03 735 EOG Resources Inc 37,224 0.11 5,370 Exxon Mobil Corp 239,958 0.73 1,105 Halliburton Co 14,348 0.04 328 Hess Corp 16,989 0.05 174 HollyFrontier Corp 5,078 0.02 2,472 Kinder Morgan Inc 37,476 0.11 992 Marathon Oil Corp 6,066 0.02 829 Marathon Petroleum Corp 30,976 0.10 477 National Oilwell Varco Inc 5,841 0.02 592 Noble Energy Inc 5,307 0.02 1,134 Occidental Petroleum Corp 20,747 0.06 526 ONEOK Inc 17,458 0.05 551 Phillips 66 39,595 0.12 211 Pioneer Natural Resources Co 20,614 0.06 1,768 Schlumberger Ltd 32,505 0.10 598 TechnipFMC Plc 4,093 0.01 525 Valero Energy Corp 30,878 0.09 1,560 Williams Cos Inc/The 29,632 0.09
Financials - 4,743,647 (31 December 2019: 8,913,608) 4,743,647 14.44
911 Aflac Inc 32,819 0.10 161 Alexandria Real Estate Equities Inc (REIT) 26,111 0.08 396 Allstate Corp/The 38,406 0.12 836 American Express Co 79,562 0.24 1,086 American International Group Inc 33,856 0.10 563 American Tower Corp (REIT) 145,476 0.44 158 Ameriprise Financial Inc 23,702 0.07 295 Aon Plc 56,792 0.17 186 Apartment Investment and Management Co (REIT) 6,998 0.02 246 Arthur J Gallagher & Co 23,978 0.07 76 Assurant Inc 7,853 0.02 178 AvalonBay Communities Inc (REIT) 27,534 0.08 9,916 Bank of America Corp 235,356 0.72
Equities cont’d.
Consumer, Non-cyclical cont’d.
Equities cont’d.
Financials cont’d.
USDUSD
03613-1A.indd 249 19/08/2020 19:01

250
Schedule of investments – as at 30 June 2020
Holdings Description
Fair value
Total net assets
% Holdings Description
Fair value
Total net assets
%
BNy MELLON S&p 500® INDEx TRACKER
108 JB Hunt Transport Services Inc 12,999 0.04 938 Johnson Controls International plc 32,014 0.10 123 Kansas City Southern 18,362 0.06 237 Keysight Technologies Inc 23,883 0.07 273 L3Harris Technologies Inc 46,319 0.14 315 Lockheed Martin Corp 114,939 0.35 81 Martin Marietta Materials Inc 16,730 0.05 342 Masco Corp 17,168 0.05 31 Mettler-Toledo International Inc 24,972 0.08 326 Norfolk Southern Corp 57,262 0.17 197 Northrop Grumman Corp 60,565 0.18 117 Old Dominion Freight Line Inc 19,836 0.06 517 Otis Worldwide Corp 29,386 0.09 121 Packaging Corp of America 12,075 0.04 164 Parker-Hannifin Corp 30,068 0.09 201 Pentair Plc 7,637 0.02 140 PerkinElmer Inc 13,733 0.04 1,878 Raytheon Technologies Corp 115,675 0.35 266 Republic Services Inc - Class A 21,821 0.07 149 Rockwell Automation Inc 31,733 0.10 132 Roper Technologies Inc 51,251 0.16 184 Sealed Air Corp 6,047 0.02 70 Snap-on Inc 9,690 0.03 194 Stanley Black & Decker Inc 27,035 0.08 419 TE Connectivity Ltd 34,169 0.10 45 Teledyne Technologies Inc 13,985 0.04 276 Textron Inc 9,085 0.03 303 Trane Technologies Plc 26,958 0.08 64 TransDigm Group Inc 28,279 0.09 861 Union Pacific Corp 145,457 0.44 899 United Parcel Service Inc - Class B 99,919 0.30 165 Vulcan Materials Co 19,116 0.06 492 Waste Management Inc 52,076 0.16 80 Waters Corp 14,429 0.04 233 Westinghouse Air Brake Technologies Corp 13,415 0.04 314 Westrock Co 8,867 0.03 224 Xylem Inc/NY 14,547 0.04
Technology - 7,447,717 (31 December 2019: 9,506,933) 7,447,717 22.67
809 Accenture Plc - Class A 173,587 0.53 983 Activision Blizzard Inc 74,585 0.23 612 Adobe Inc 266,324 0.81 1,494 Advanced Micro Devices Inc 78,547 0.24 202 Akamai Technologies Inc 21,638 0.07 471 Analog Devices Inc 57,778 0.18 109 ANSYS Inc 31,819 0.10 5,179 Apple Inc 1,888,367 5.75 1,164 Applied Materials Inc 70,340 0.21 278 Autodesk Inc 66,473 0.20 507 Broadcom Inc 159,951 0.49 147 Broadridge Financial Solutions Inc 18,547 0.06 359 Cadence Design Systems Inc 34,442 0.11 386 Cerner Corp 26,449 0.08 145 Citrix Systems Inc 21,436 0.07 682 Cognizant Technology Solutions Corp 38,731 0.12 310 DXC Technology Co 5,116 0.02 365 Electronic Arts Inc 48,184 0.15 789 Fidelity National Information Services Inc 105,785 0.32
1,231 Regions Financial Corp 13,683 0.04 142 SBA Communications Corp (REIT) - Class A 42,282 0.13 394 Simon Property Group Inc (REIT) 26,940 0.08 101 SL Green Realty Corp (REIT) 4,980 0.02 446 State Street Corp 28,357 0.09 66 SVB Financial Group 14,227 0.04 672 Synchrony Financial 14,888 0.05 289 T Rowe Price Group Inc 35,709 0.11 322 Travelers Cos Inc/The 36,722 0.11 1,718 Truist Financial Corp 64,502 0.20 377 UDR Inc (REIT) 14,088 0.04 259 Unum Group 4,298 0.01 1,747 US Bancorp 64,316 0.20 480 Ventas Inc (REIT) 17,568 0.05 2,144 Visa Inc - Class A 413,653 1.26 208 Vornado Realty Trust (REIT) 7,945 0.02 184 W R Berkley Corp 10,539 0.03 4,734 Wells Fargo & Co 121,072 0.37 539 Welltower Inc (REIT) 27,880 0.09 535 Western Union Co/The 11,569 0.04 960 Weyerhaeuser Co (REIT) 21,552 0.07 164 Willis Towers Watson Plc 32,285 0.10 213 Zions Bancorp NA 7,242 0.02
Industrials - 2,547,661 (31 December 2019: 4,480,051) 2,547,661 7.75
734 3M Co 114,434 0.35 168 A O Smith Corp 7,919 0.02 396 Agilent Technologies Inc 34,991 0.11 119 Allegion plc 12,162 0.04 2,041 Amcor Plc 20,828 0.06 297 AMETEK Inc 26,527 0.08 379 Amphenol Corp - Class A 36,276 0.11 417 Ball Corp 28,971 0.09 681 Boeing Co/The 124,705 0.38 1,037 Carrier Global Corp 23,037 0.07 691 Caterpillar Inc 87,367 0.27 174 CH Robinson Worldwide Inc 13,752 0.04 976 CSX Corp 68,100 0.21 396 Deere & Co 62,218 0.19 179 Dover Corp 17,291 0.05 505 Eaton Corp Plc 44,150 0.14 761 Emerson Electric Co 47,190 0.14 209 Expeditors International of Washington Inc 15,887 0.05 303 FedEx Corp 42,453 0.13 169 FLIR Systems Inc 6,853 0.02 161 Flowserve Corp 4,593 0.01 375 Fortive Corp 25,393 0.08 174 Fortune Brands Home & Security Inc 11,124 0.03 189 Garmin Ltd 18,421 0.06 295 General Dynamics Corp 44,070 0.13 11,158 General Electric Co 76,153 0.23 890 Honeywell International Inc 128,752 0.39 482 Howmet Aerospace Inc 7,637 0.02 51 Huntington Ingalls Industries Inc 8,901 0.03 98 IDEX Corp 15,482 0.05 368 Illinois Tool Works Inc 64,269 0.20 439 Ingersoll Rand Inc 12,347 0.04 164 Jacobs Engineering Group Inc 13,906 0.04
Equities cont’d.
Financials cont’d.
Equities cont’d.
Industrials cont’d.
USDUSD
03613-1A.indd 250 19/08/2020 19:01

251
Schedule of investments – as at 30 June 2020
Holdings Description
Fair value
Total net assets
% Holdings Description
Fair value
Total net assets
%
BNy MELLON S&p 500® INDEx TRACKER
319 NRG Energy Inc 10,388 0.03 143 Pinnacle West Capital Corp 10,481 0.03 980 PPL Corp 25,318 0.08 646 Public Service Enterprise Group Inc 31,748 0.10 370 Sempra Energy 43,358 0.13 1,346 Southern Co/The (Units) 69,770 0.21 403 WEC Energy Group Inc 35,309 0.11 668 Xcel Energy Inc 41,747 0.13
Total investments in equities 32,581,250 99.16
Holdings Description
Underlying exposure
USD
Fair value USD
Total net assets
%
Open futures contracts - 6,655 (31 December 2019: 1,757)
2 E-mini S&P 500 Index Long Futures Contracts Exp Sep-2020 309,025 6,655 0.02
Total open futures contracts 6,655 0.02
Total financial assets at fair value through profit or loss 32,623,869 99.29
Net current assets 234,832 0.71
Total net assets 32,858,701 100.00
* held as collateral by Goldman Sachs in respect of futures contracts held by the Fund. The counterparty for futures contracts is Goldman Sachs.
Analysis of portfolio % of Total Assets
Transferable securities and money market instruments admitted to official stock exchange listing or traded on a regulated market 98.65Financial derivative instruments dealt in on a regulated market 0.02other current assets 1.33
Total assets 100.00
717 Fiserv Inc 69,933 0.21 169 Fortinet Inc 23,192 0.07 1,664 Hewlett Packard Enterprise Co 16,199 0.05 1,803 HP Inc 31,417 0.10 5,379 Intel Corp 321,772 0.98 1,127 International Business Machines Corp 136,046 0.41 333 Intuit Inc 98,631 0.30 45 IPG Photonics Corp 7,222 0.02 99 Jack Henry & Associates Inc 18,209 0.06 197 KLA Corp 38,281 0.12 185 Lam Research Corp 59,786 0.18 175 Leidos Holdings Inc 16,391 0.05 336 Maxim Integrated Products Inc 20,357 0.06 316 Microchip Technology Inc 33,279 0.10 1,418 Micron Technology Inc 73,020 0.22 9,640 Microsoft Corp 1,961,595 5.97 108 MSCI Inc - Class A 36,052 0.11 292 NetApp Inc 12,949 0.04 781 NVIDIA Corp 296,366 0.90 2,641 Oracle Corp 145,942 0.44 410 Paychex Inc 31,053 0.09 62 Paycom Software Inc 19,203 0.06 149 Qorvo Inc 16,462 0.05 1,427 QUALCOMM Inc 130,128 0.40 1,145 salesforce.com Inc 214,636 0.65 297 Seagate Technology Plc 14,372 0.04 243 ServiceNow Inc 98,419 0.30 212 Skyworks Solutions Inc 27,081 0.08 192 Synopsys Inc 37,441 0.11 146 Take-Two Interactive Software Inc 20,361 0.06 1,165 Texas Instruments Inc 147,891 0.45 48 Tyler Technologies Inc 16,642 0.05 390 Western Digital Corp 17,211 0.05 264 Xerox Holdings Corp 4,038 0.01 309 Xilinx Inc 30,387 0.09 69 Zebra Technologies Corp 17,654 0.05
Utilities - 999,958 (31 December 2019: 1,690,376) 999,958 3.04
845 AES Corp/The 12,240 0.04 322 Alliant Energy Corp 15,395 0.05 308 Ameren Corp 21,671 0.07 633 American Electric Power Co Inc 50,406 0.15 230 American Water Works Co Inc 29,581 0.09 153 Atmos Energy Corp 15,236 0.05 701 CenterPoint Energy Inc 13,084 0.04 360 CMS Energy Corp 21,029 0.06 429 Consolidated Edison Inc 30,849 0.09 1,071 Dominion Energy Inc 86,880 0.26 249 DTE Energy Co 26,765 0.08 938 Duke Energy Corp 74,923 0.23 487 Edison International 26,447 0.08 254 Entergy Corp 23,829 0.07 282 Evergy Inc 16,720 0.05 425 Eversource Energy 35,366 0.11 1,231 Exelon Corp 44,667 0.14 689 FirstEnergy Corp 26,723 0.08 621 NextEra Energy Inc 149,133 0.45 479 NiSource Inc 10,895 0.03
Equities cont’d.
Technology cont’d.
Equities cont’d.
Utilities cont’d.
USDUSD
03613-1A.indd 251 19/08/2020 19:01
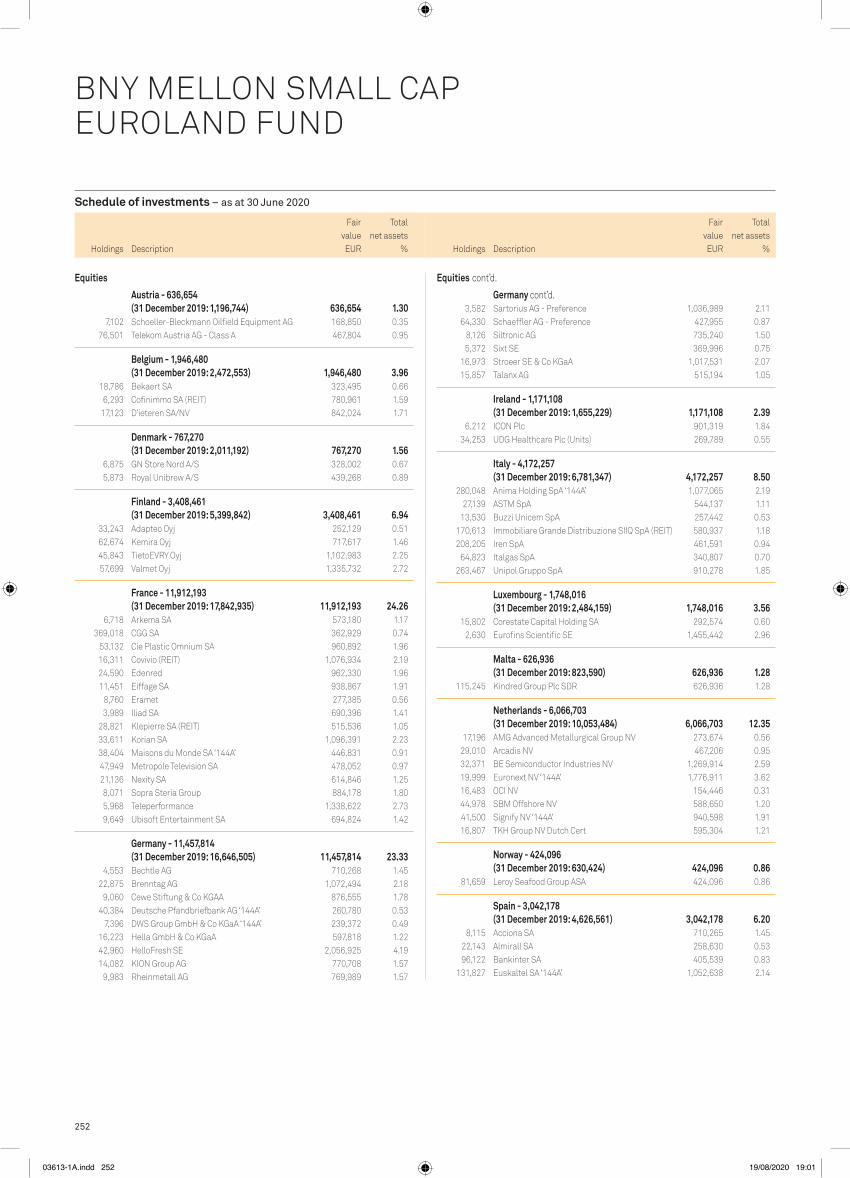
252
Schedule of investments – as at 30 June 2020
Holdings Description
Fair value
Total net assets
% Holdings Description
Fair value
Total net assets
%
FUND 40 – BNy MELLON SMALL CAp EUROLAND FUND
BNY MELLON SMALL CAP EUROLAND FUND
3,582 Sartorius AG - Preference 1,036,989 2.11 64,330 Schaeffler AG - Preference 427,955 0.87 8,126 Siltronic AG 735,240 1.50 5,372 Sixt SE 369,996 0.75 16,973 Stroeer SE & Co KGaA 1,017,531 2.07 15,857 Talanx AG 515,194 1.05
Ireland - 1,171,108 (31 December 2019: 1,655,229) 1,171,108 2.39
6,212 ICON Plc 901,319 1.84 34,253 UDG Healthcare Plc (Units) 269,789 0.55
Italy - 4,172,257 (31 December 2019: 6,781,347) 4,172,257 8.50
280,048 Anima Holding SpA ‘144A’ 1,077,065 2.19 27,139 ASTM SpA 544,137 1.11 13,530 Buzzi Unicem SpA 257,442 0.53 170,613 Immobiliare Grande Distribuzione SIIQ SpA (REIT) 580,937 1.18 208,205 Iren SpA 461,591 0.94 64,823 Italgas SpA 340,807 0.70 263,467 Unipol Gruppo SpA 910,278 1.85
Luxembourg - 1,748,016 (31 December 2019: 2,484,159) 1,748,016 3.56
15,802 Corestate Capital Holding SA 292,574 0.60 2,630 Eurofins Scientific SE 1,455,442 2.96
Malta - 626,936 (31 December 2019: 823,590) 626,936 1.28
115,245 Kindred Group Plc SDR 626,936 1.28
Netherlands - 6,066,703 (31 December 2019: 10,053,484) 6,066,703 12.35
17,196 AMG Advanced Metallurgical Group NV 273,674 0.56 29,010 Arcadis NV 467,206 0.95 32,371 BE Semiconductor Industries NV 1,269,914 2.59 19,999 Euronext NV ‘144A’ 1,776,911 3.62 16,483 OCI NV 154,446 0.31 44,978 SBM Offshore NV 588,650 1.20 41,500 Signify NV ‘144A’ 940,598 1.91 16,807 TKH Group NV Dutch Cert 595,304 1.21
Norway - 424,096 (31 December 2019: 630,424) 424,096 0.86
81,659 Leroy Seafood Group ASA 424,096 0.86
Spain - 3,042,178 (31 December 2019: 4,626,561) 3,042,178 6.20
8,115 Acciona SA 710,265 1.45 22,143 Almirall SA 258,630 0.53 96,122 Bankinter SA 405,539 0.83 131,827 Euskaltel SA ‘144A’ 1,052,638 2.14
Equities
Austria - 636,654 (31 December 2019: 1,196,744) 636,654 1.30
7,102 Schoeller-Bleckmann Oilfield Equipment AG 168,850 0.35 76,501 Telekom Austria AG - Class A 467,804 0.95
Belgium - 1,946,480 (31 December 2019: 2,472,553) 1,946,480 3.96
18,786 Bekaert SA 323,495 0.66 6,293 Cofinimmo SA (REIT) 780,961 1.59 17,123 D’ieteren SA/NV 842,024 1.71
Denmark - 767,270 (31 December 2019: 2,011,192) 767,270 1.56
6,875 GN Store Nord A/S 328,002 0.67 5,873 Royal Unibrew A/S 439,268 0.89
Finland - 3,408,461 (31 December 2019: 5,399,842) 3,408,461 6.94
33,243 Adapteo Oyj 252,129 0.51 62,674 Kemira Oyj 717,617 1.46 45,843 TietoEVRY Oyj 1,102,983 2.25 57,699 Valmet Oyj 1,335,732 2.72
France - 11,912,193 (31 December 2019: 17,842,935) 11,912,193 24.26
6,718 Arkema SA 573,180 1.17 369,018 CGG SA 362,929 0.74 53,132 Cie Plastic Omnium SA 960,892 1.96 16,311 Covivio (REIT) 1,076,934 2.19 24,590 Edenred 962,330 1.96 11,451 Eiffage SA 938,867 1.91 8,760 Eramet 277,385 0.56 3,989 Iliad SA 690,396 1.41 28,821 Klepierre SA (REIT) 515,536 1.05 33,611 Korian SA 1,096,391 2.23 38,404 Maisons du Monde SA ‘144A’ 446,831 0.91 47,949 Metropole Television SA 478,052 0.97 21,136 Nexity SA 614,846 1.25 8,071 Sopra Steria Group 884,178 1.80 5,968 Teleperformance 1,338,622 2.73 9,649 Ubisoft Entertainment SA 694,824 1.42
Germany - 11,457,814 (31 December 2019: 16,646,505) 11,457,814 23.33
4,553 Bechtle AG 710,268 1.45 22,875 Brenntag AG 1,072,494 2.18 9,060 Cewe Stiftung & Co KGAA 876,555 1.78 40,384 Deutsche Pfandbriefbank AG ‘144A’ 260,780 0.53 7,396 DWS Group GmbH & Co KGaA ‘144A’ 239,372 0.49 16,223 Hella GmbH & Co KGaA 597,818 1.22 42,960 HelloFresh SE 2,056,925 4.19 14,082 KION Group AG 770,708 1.57 9,983 Rheinmetall AG 769,989 1.57
Equities cont’d.
Germany cont’d.
EUR EUR
03613-1A.indd 252 19/08/2020 19:01

253
Schedule of investments – as at 30 June 2020
Holdings Description
Fair value
Total net assets
% Holdings Description
Fair value
Total net assets
%
BNy MELLON SMALL CAp EUROLAND FUND
79,003 Mediaset Espana Comunicacion SA 257,866 0.52 782,734 Unicaja Banco SA ‘144A’ 357,240 0.73
United Kingdom - 589,793 (31 December 2019: 424,804) 589,793 1.20
14,890 Dialog Semiconductor Plc 589,793 1.20
Total investments in equities 47,969,959 97.69
Total financial assets at fair value through profit or loss 47,969,959 97.69
Net current assets 1,136,424 2.31
Total net assets 49,106,383 100.00
The counterparty for futures contracts is Goldman Sachs.
Analysis of portfolio % of Total Assets
Transferable securities and money market instruments admitted to official stock exchange listing or traded on a regulated market 97.50other current assets 2.50
Total assets 100.00
Equities cont’d.
Spain cont’d.
EUR EUR
03613-1A.indd 253 19/08/2020 19:01

254
Schedule of investments – as at 30 June 2020
Holdings Description
Fair value
Total net assets
% Holdings Description
Fair value
Total net assets
%
Bonds
Australian Dollar - 10,082,719 (31 December 2019: 8,534,725) 10,082,719 4.58
2,080,000 Australia Government Bond 3.000% 20-Sep-2025 1,858,381 0.84 3,540,000 Australia Government Bond 3.000% 21-Mar-2047 2,755,336 1.25 4,790,000 Treasury Corp of Victoria 1.000% 20-Nov-2023 2,986,563 1.36 3,830,000 Treasury Corp of Victoria 2.250% 20-Nov-2034 2,482,439 1.13
Canadian Dollar - 5,448,952 (31 December 2019: 4,953,445) 5,448,952 2.47
3,530,000 Canada Housing Trust No 1 ‘144A’ 2.100% 15-Sep-2029 2,541,364 1.15
4,210,000 Canada Housing Trust No 1 ‘144A’ 2.350% 15-Sep-2023 2,907,588 1.32
Colombian peso - 2,154,020 (31 December 2019: –) 2,154,020 0.98
8,845,500,000 Colombia Government International Bond ‘REGS’ 6.000% 28-Apr-2028 2,154,020 0.98
Czech Koruna - 2,315,256 (31 December 2019: –) 2,315,256 1.05
59,930,000 Czech Republic Government Bond 1.250% 14-Feb-2025 2,315,256 1.05
Euro - 58,866,068 (31 December 2019: 47,281,943) 58,866,068 26.72
869,000 Akelius Residential Property AB FRN 2.249% 17-May-2081 803,964 0.37
1,325,000 Allied Irish Banks Plc ‘EMTN’ FRN 4.125% 26-Nov-2025 1,330,459 0.60
2,160,000 Asian Development Bank 0.000% 24-Oct-2029 2,189,095 0.99 1,570,000 AT&T Inc 1.875% 04-Dec-2020 1,574,553 0.71 1,100,000 Banco Bilbao Vizcaya Argentaria SA
0.625% 17-May-2021 1,107,991 0.50 1,000,000 Banco Bilbao Vizcaya Argentaria SA FRN (Perpetual)
5.875% 24-May-2022 974,400 0.44 400,000 Banco Santander SA FRN (Perpetual)
5.250% 29-Sep-2023 378,000 0.17 281,000 Banijay Entertainment SASU ‘REGS’
3.500% 01-Mar-2025 269,383 0.12 700,000 Cellnex Telecom SA 1.875% 26-Jun-2029 692,601 0.31 2,510,000 Coventry Building Society 2.500% 18-Nov-2020 2,533,280 1.15 1,100,000 Covivio 1.625% 23-Jun-2030 1,102,233 0.50 1,480,000 Credit Suisse AG/Guernsey ‘EMTN’
1.750% 15-Jan-2021 1,496,731 0.68 890,000 Ecolab Inc 2.625% 08-Jul-2025 984,909 0.45 750,000 Fresenius Medical Care AG & Co KGaA ‘EMTN’
1.000% 29-May-2026 763,939 0.35 3,200,000 German Postal Pensions Securitisation Plc
3.750% 18-Jan-2021 3,286,336 1.49 1,185,000 Hella GmbH & Co KGaA 1.000% 17-May-2024 1,209,778 0.55 500,000 Infineon Technologies AG ‘EMTN’ FRN (Perpetual)
2.875% 01-Jan-2025 489,620 0.22 500,000 Infineon Technologies AG FRN (Perpetual)
3.625% 01-Jan-2028 497,535 0.23 1,038,000 IQVIA Inc ‘REGS’ 2.875% 15-Jun-2028 1,036,703 0.47 3,840,000 Italy Buoni Poliennali Del Tesoro
4.500% 01-May-2023 4,301,210 1.95 4,113,000 Italy Buoni Poliennali Del Tesoro ‘144A’
1.850% 01-Jul-2025 4,347,778 1.97 1,600,000 JCDecaux SA 2.000% 24-Oct-2024 1,619,120 0.74
1,100,000 Linde Finance BV 0.250% 19-May-2027 1,109,785 0.50 970,000 Lloyds Bank Plc ‘EMTN’ 4.875% 13-Jan-2023 1,097,447 0.50 1,146,000 Lloyds Banking Group Plc FRN (Perpetual)
4.947% 27-Jun-2025 1,118,393 0.51 1,215,000 Loxam SAS ‘REGS’ 2.875% 15-Apr-2026 1,047,014 0.48 985,000 Motability Operations Group Plc ‘EMTN’
0.375% 03-Jan-2026 982,336 0.45 1,070,000 Motability Operations Group Plc ‘EMTN’
1.625% 09-Jun-2023 1,120,579 0.51 1,220,000 Nationwide Building Society ‘EMTN’
0.500% 23-Feb-2024 1,253,367 0.57 2,395,000 Nationwide Building Society ‘EMTN’
6.750% 22-Jul-2020 2,403,227 1.09 968,000 Nestle Finance International Ltd ‘EMTN’
0.125% 12-Nov-2027 965,420 0.44 580,000 Netherlands Government Bond ‘144A’
0.500% 15-Jan-2040 644,945 0.29 1,025,000 Orange SA ‘EMTN’ FRN (Perpetual)
4.000% 01-Oct-2021 1,059,220 0.48 1,050,000 Orsted A/S 1.500% 26-Nov-2029 1,153,883 0.52 653,000 PepsiCo Inc 0.250% 06-May-2024 657,731 0.30 225,000 Prologis International Funding II SA ‘EMTN’
1.625% 17-Jun-2032 235,661 0.11 950,000 Province of British Columbia Canada ‘EMTN’
0.875% 08-Oct-2025 1,001,856 0.45 1,062,000 SELP Finance Sarl 1.250% 25-Oct-2023 1,071,080 0.49 481,000 SIG Combibloc PurchaseCo Sarl ‘REGS’
1.875% 18-Jun-2023 488,095 0.22 675,000 Societe Generale SA FRN (Perpetual)
6.750% 07-Apr-2021 673,704 0.31 3,180,000 Spain Government Bond ‘144A’
5.150% 31-Oct-2028 4,463,127 2.03 1,048,000 Summer BC Holdco B SARL ‘REGS’
5.750% 31-Oct-2026 1,011,320 0.46 1,100,000 Telefonica Europe BV FRN (Perpetual)
4.375% 14-Dec-2024 1,137,125 0.52 210,000 UBS AG ‘EMTN’ FRN 4.750% 12-Feb-2026 214,072 0.10 670,000 UniCredit SpA ‘EMTN’ FRN (Perpetual)
3.875% 03-Jun-2027 494,125 0.22 470,000 Vodafone Group Plc FRN 3.100% 03-Jan-2079 VAR 472,938 0.21
Indonesian Rupiah - 3,025,731 (31 December 2019: 1,584,672) 3,025,731 1.37
35,455,000,000 European Bank for Reconstruction & Development ‘GMTN’ 6.450% 13-Dec-2022 2,168,801 0.98
13,800,000,000 European Bank for Reconstruction & Development ‘GMTN’ 8.300% 02-Oct-2020 856,930 0.39
Japanese yen - 10,272,765 (31 December 2019: 13,146,785) 10,272,765 4.66
561,800,000 Japan Government Two Year Bond 0.100% 01-Jun-2021 4,665,072 2.12
543,000,000 Japan Government Two Year Bond 0.100% 01-Apr-2022 4,517,032 2.05
132,199,837 Japanese Government CPI Linked Bond 0.100% 10-Mar-2028 1,090,661 0.49
Malaysian Ringgit - 3,757,208 (31 December 2019: 2,239,092) 3,757,208 1.71
16,888,000 Malaysia Government Bond 3.906% 15-Jul-2026 3,757,208 1.71
FUND 41 – BNy MELLON SUSTAINABLE GLOBAL DyNAMIC BOND FUND
BNY MELLON SUSTAINABLE GLOBAL DYNAMIC BOND FUND
Bonds cont’d.
Euro cont’d.
EUR EUR
03613-1A.indd 254 19/08/2020 19:01

255
Schedule of investments – as at 30 June 2020
Holdings Description
Fair value
Total net assets
% Holdings Description
Fair value
Total net assets
%
BNy MELLON SUSTAINABLE GLOBAL DyNAMIC BOND FUND
450,000 Virgin Media Secured Finance Plc ‘REGS’ 6.250% 28-Mar-2029 521,830 0.24
1,119,000 Virgin Media Vendor Financing Notes III DAC ‘REGS’ 4.875% 15-Jul-2028 1,235,425 0.56
867,000 Vodafone Group Plc FRN 4.875% 03-Oct-2078 989,205 0.45 820,000 Wagamama Finance Plc ‘REGS’
4.125% 01-Jul-2022 803,778 0.36 1,355,000 Yorkshire Building Society FRN
0.664% 19-Nov-2023 1,493,332 0.68
Swedish Krona - 2,199,722 (31 December 2019: 1,797,450) 2,199,722 1.00
22,000,000 Stadshypotek AB 1.500% 01-Mar-2024 2,199,722 1.00
US Dollar - 67,248,467 (31 December 2019: 58,175,438) 67,248,467 30.53
568,000 Apple Inc 1.125% 11-May-2025 517,523 0.24 228,000 Apple Inc 1.700% 11-Sep-2022 209,545 0.10 224,000 Argentine Republic Government International Bond
6.875% 22-Apr-2021 84,857 0.04 2,130,000 Bank of England Euro Note ‘REGS’
0.500% 28-Apr-2023 1,910,811 0.87 1,300,000 Best Buy Co Inc 5.500% 15-Mar-2021 1,185,359 0.54 845,000 Brixmor Operating Partnership LP
4.050% 01-Jul-2030 770,600 0.35 1,030,000 CCO Holdings LLC / CCO Holdings Capital Corp ‘144A’
5.500% 01-May-2026 954,369 0.43 717,000 Comcast Corp 3.300% 01-Apr-2027 719,810 0.33 1,560,000 Commonwealth Bank of Australia ‘REGS’
2.125% 22-Jul-2020 1,393,219 0.63 600,000 Credit Suisse Group AG ‘REGS’ FRN (Perpetual)
7.250% 12-Sep-2025 549,707 0.25 1,150,000 Dell International LLC / EMC Corp ‘144A’
7.125% 15-Jun-2024 1,061,612 0.48 1,140,000 DNB Boligkreditt AS ‘REGS’
2.500% 28-Mar-2022 1,051,139 0.48 900,000 Dominican Republic International Bond ‘REGS’
7.450% 30-Apr-2044 820,999 0.37 303,333 Dominican Republic International Bond ‘REGS’
7.500% 06-May-2021 279,752 0.13 1,250,000 Ecuador Government International Bond ‘REGS’
8.875% 23-Oct-2027 472,555 0.21 634,000 Ethiopia International Bond ‘REGS’
6.625% 11-Dec-2024 568,218 0.26 473,000 European Bank for Reconstruction & Development
1.625% 27-Sep-2024 443,007 0.20 850,000 European Bank for Reconstruction
& Development ‘GMTN’ 2.750% 07-Mar-2023 807,264 0.37 200,000 Fiji Government International Bond
6.625% 02-Oct-2020 178,411 0.08 1,910,000 HSBC Bank Canada ‘REGS’ 0.950% 14-May-2023 1,719,170 0.78 1,620,000 Indonesia Government International Bond ‘REGS’
5.875% 15-Jan-2024 1,642,302 0.75 1,940,000 Inter-American Development Bank
3.125% 18-Sep-2028 2,048,981 0.93 610,000 Inter-American Development Bank FRN
0.341% 16-Sep-2022 542,628 0.25 3,140,000 International Bank for Reconstruction
& Development 1.625% 15-Jan-2025 2,951,897 1.34
Mexican Nuevo peso - 3,549,597 (31 December 2019: 2,306,002) 3,549,597 1.61
44,615,800 Mexican Bonos 7.500% 03-Jun-2027 1,913,673 0.87 35,900,000 Mexican Bonos 8.500% 31-May-2029 1,635,924 0.74
New Zealand Dollar - 3,324,085 (31 December 2019: 5,475,940) 3,324,085 1.51
2,670,000 New Zealand Government Inflation Linked Bond 3.000% 20-Sep-2030 2,153,435 0.98
1,680,000 New Zealand Local Government Funding Agency Bond 3.500% 14-Apr-2033 1,170,650 0.53
Norwegian Krone - 9,056,430 (31 December 2019: 7,431,047) 9,056,430 4.11
52,940,000 Norway Government Bond ‘144A’ 1.750% 17-Feb-2027 5,260,379 2.39
41,000,000 SpareBank 1 Boligkreditt AS ‘GMTN’ 1.500% 16-Jun-2021 3,796,051 1.72
peruvian Nuevo Sol - 2,102,934 (31 December 2019: 1,360,940) 2,102,934 0.95
6,430,000 Peruvian Government International Bond ‘REGS’ 8.200% 12-Aug-2026 2,102,934 0.95
philippine peso - 2,169,562 (31 December 2019: 890,222) 2,169,562 0.99
120,000,000 Philippine Government International Bond 4.950% 15-Jan-2021 2,169,562 0.99
Singapore Dollar - 2,248,567 (31 December 2019: 892,375) 2,248,567 1.02
3,460,000 Singapore Government Bond 2.250% 01-Jun-2021 2,248,567 1.02
Sterling - 20,470,146 (31 December 2019: 15,210,178) 20,470,146 9.29
520,000 Anglian Water Services Financing Plc ‘EMTN’ 1.625% 10-Aug-2025 582,442 0.26
565,000 Clarion Funding Plc ‘EMTN’ 2.625% 18-Jan-2029 677,994 0.31 990,000 Close Brothers Finance Plc ‘EMTN’
2.750% 19-Oct-2026 1,138,033 0.52 455,000 Close Brothers Group Plc FRN
4.250% 24-Jan-2027 510,033 0.23 600,000 CPUK Finance Ltd ‘REGS’ 4.250% 28-Aug-2022 633,011 0.29 470,000 CPUK Finance Ltd ‘REGS’ 4.875% 28-Aug-2025 481,606 0.22 1,135,000 European Investment Bank ‘EMTN’
0.750% 15-Nov-2024 1,273,641 0.58 1,155,046 Gwynt y Mor OFTO Plc 2.778% 17-Feb-2034 1,400,403 0.63 366,000 Hiscox Ltd 2.000% 14-Dec-2022 401,642 0.18 780,000 Iceland Bondco Plc ‘REGS’ 4.625% 15-Mar-2025 767,985 0.35 990,000 Informa Plc ‘EMTN’ 3.125% 05-Jul-2026 1,103,324 0.50 1,940,000 International Bank for Reconstruction
& Development ‘GMTN’ 0.500% 24-Jul-2023 2,144,681 0.97 600,000 Investec Plc ‘EMTN’ FRN (Perpetual)
6.750% 05-Dec-2024 542,816 0.25 1,080,000 Lloyds Banking Group Plc FRN (Perpetual)
5.125% 27-Dec-2024 1,083,409 0.49 370,000 National Express Group Plc 2.375% 20-Nov-2028 389,446 0.18 1,070,000 Nationwide Building Society FRN (Perpetual)
5.875% 20-Dec-2024 1,178,334 0.53 200,000 UBS AG/London ‘EMTN’ 1.250% 10-Dec-2020 219,443 0.10 790,000 UNITE USAF II Plc 3.374% 30-Jun-2023 898,333 0.41
Bonds cont’d.
Sterling cont’d.
Bonds cont’d.
EUR EUR
03613-1A.indd 255 19/08/2020 19:01
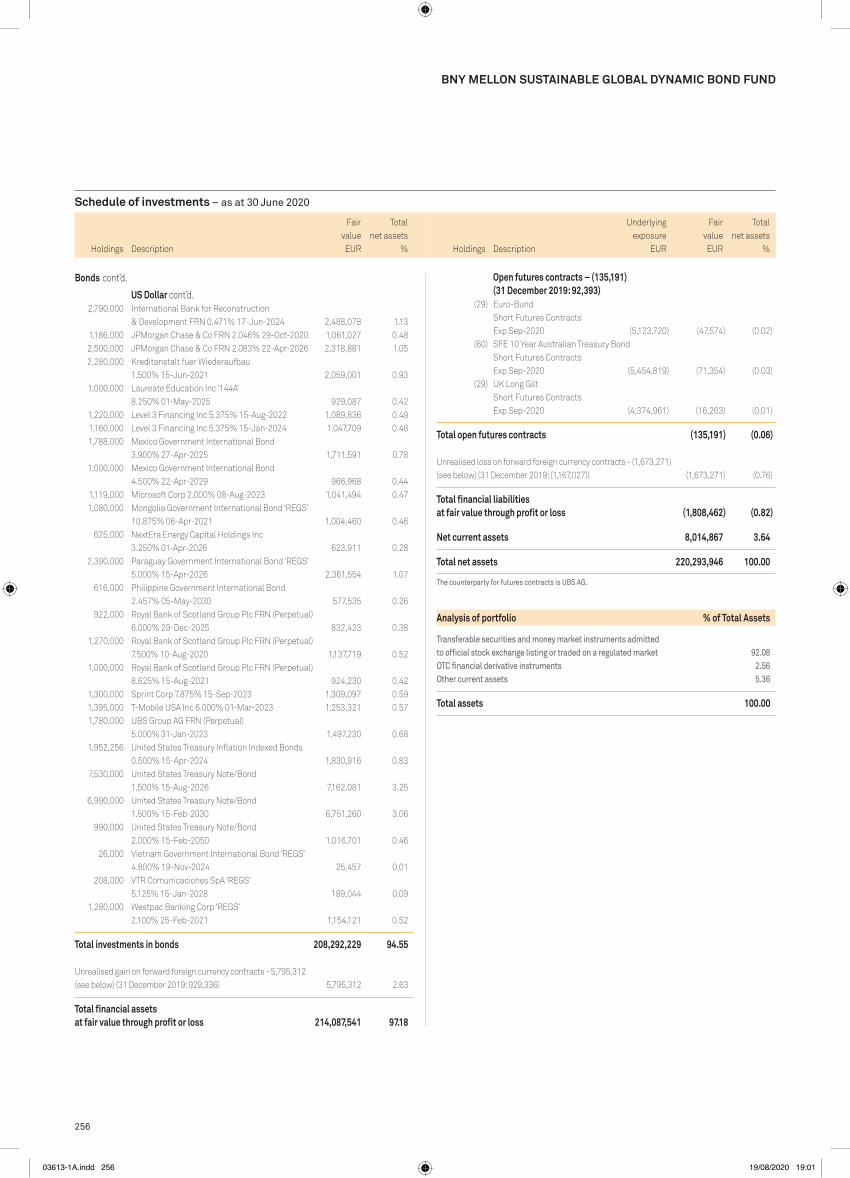
256
Schedule of investments – as at 30 June 2020
Holdings Description
Fair value
Total net assets
% Holdings Description
Fair value
Total net assets
%
BNy MELLON SUSTAINABLE GLOBAL DyNAMIC BOND FUND
2,790,000 International Bank for Reconstruction & Development FRN 0.471% 17-Jun-2024 2,488,078 1.13
1,186,000 JPMorgan Chase & Co FRN 2.046% 29-Oct-2020 1,061,027 0.48 2,500,000 JPMorgan Chase & Co FRN 2.083% 22-Apr-2026 2,318,881 1.05 2,280,000 Kreditanstalt fuer Wiederaufbau
1.500% 15-Jun-2021 2,059,001 0.93 1,000,000 Laureate Education Inc ‘144A’
8.250% 01-May-2025 929,087 0.42 1,220,000 Level 3 Financing Inc 5.375% 15-Aug-2022 1,089,836 0.49 1,160,000 Level 3 Financing Inc 5.375% 15-Jan-2024 1,047,709 0.48 1,788,000 Mexico Government International Bond
3.900% 27-Apr-2025 1,711,591 0.78 1,000,000 Mexico Government International Bond
4.500% 22-Apr-2029 966,968 0.44 1,119,000 Microsoft Corp 2.000% 08-Aug-2023 1,041,494 0.47 1,080,000 Mongolia Government International Bond ‘REGS’
10.875% 06-Apr-2021 1,004,460 0.46 625,000 NextEra Energy Capital Holdings Inc
3.250% 01-Apr-2026 623,911 0.28 2,390,000 Paraguay Government International Bond ‘REGS’
5.000% 15-Apr-2026 2,361,554 1.07 616,000 Philippine Government International Bond
2.457% 05-May-2030 577,535 0.26 922,000 Royal Bank of Scotland Group Plc FRN (Perpetual)
6.000% 29-Dec-2025 832,423 0.38 1,270,000 Royal Bank of Scotland Group Plc FRN (Perpetual)
7.500% 10-Aug-2020 1,137,719 0.52 1,000,000 Royal Bank of Scotland Group Plc FRN (Perpetual)
8.625% 15-Aug-2021 924,230 0.42 1,300,000 Sprint Corp 7.875% 15-Sep-2023 1,309,097 0.59 1,395,000 T-Mobile USA Inc 6.000% 01-Mar-2023 1,253,321 0.57 1,780,000 UBS Group AG FRN (Perpetual)
5.000% 31-Jan-2023 1,497,230 0.68 1,952,256 United States Treasury Inflation Indexed Bonds
0.500% 15-Apr-2024 1,830,916 0.83 7,530,000 United States Treasury Note/Bond
1.500% 15-Aug-2026 7,162,081 3.25 6,990,000 United States Treasury Note/Bond
1.500% 15-Feb-2030 6,751,260 3.06 990,000 United States Treasury Note/Bond
2.000% 15-Feb-2050 1,016,701 0.46 26,000 Vietnam Government International Bond ‘REGS’
4.800% 19-Nov-2024 25,457 0.01 208,000 VTR Comunicaciones SpA ‘REGS’
5.125% 15-Jan-2028 189,044 0.09 1,280,000 Westpac Banking Corp ‘REGS’
2.100% 25-Feb-2021 1,154,121 0.52
Total investments in bonds 208,292,229 94.55 Unrealised gain on forward foreign currency contracts - 5,795,312 (see below) (31 December 2019: 929,336) 5,795,312 2.63
Total financial assets at fair value through profit or loss 214,087,541 97.18
Underlying exposure
EUR
Open futures contracts – (135,191) (31 December 2019: 92,393)
(29) Euro-Bund Short Futures Contracts Exp Sep-2020 (5,123,720) (47,574) (0.02)
(60) SFE 10 Year Australian Treasury Bond Short Futures Contracts Exp Sep-2020 (5,454,819) (71,354) (0.03)
(29) UK Long Gilt Short Futures Contracts Exp Sep-2020 (4,374,961) (16,263) (0.01)
Total open futures contracts (135,191) (0.06)
Unrealised loss on forward foreign currency contracts - (1,673,271) (see below) (31 December 2019: (1,167,027)) (1,673,271) (0.76)
Total financial liabilities at fair value through profit or loss (1,808,462) (0.82)
Net current assets 8,014,867 3.64
Total net assets 220,293,946 100.00
The counterparty for futures contracts is UBS AG.
Analysis of portfolio % of Total Assets
Transferable securities and money market instruments admitted to official stock exchange listing or traded on a regulated market 92.08oTC financial derivative instruments 2.56other current assets 5.36
Total assets 100.00
Bonds cont’d.
US Dollar cont’d.
EUR EUR
03613-1A.indd 256 19/08/2020 19:01
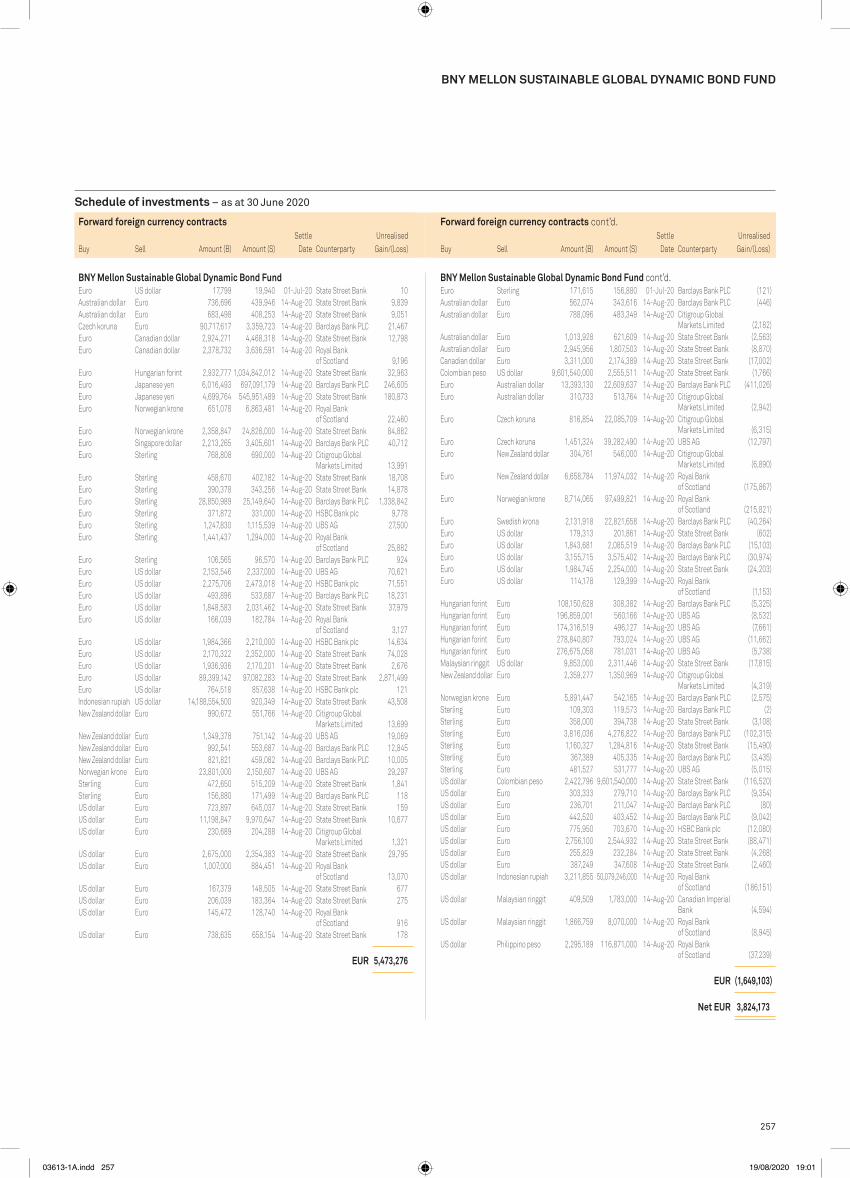
257
Schedule of investments – as at 30 June 2020
BNy MELLON SUSTAINABLE GLOBAL DyNAMIC BOND FUND
Forward foreign currency contracts cont’d.Unrealised
Gain/(Loss)Buy Sell Amount (B) Amount (S)Settle
Date Counterparty
BNy Mellon Sustainable Global Dynamic Bond Fund cont’d.Euro Sterling 171,615 156,880 01-Jul-20 Barclays Bank PLC (121)Australian dollar Euro 562,074 343,616 14-Aug-20 Barclays Bank PLC (446)Australian dollar Euro 788,096 483,349 14-Aug-20 Citigroup Global
Markets Limited (2,182)Australian dollar Euro 1,013,928 621,609 14-Aug-20 State Street Bank (2,563)Australian dollar Euro 2,945,956 1,807,503 14-Aug-20 State Street Bank (8,870)Canadian dollar Euro 3,311,000 2,174,389 14-Aug-20 State Street Bank (17,002)Colombian peso US dollar 9,601,540,000 2,555,511 14-Aug-20 State Street Bank (1,766)Euro Australian dollar 13,393,130 22,609,637 14-Aug-20 Barclays Bank PLC (411,026)Euro Australian dollar 310,733 513,764 14-Aug-20 Citigroup Global
Markets Limited (2,942)Euro Czech koruna 816,854 22,085,709 14-Aug-20 Citigroup Global
Markets Limited (6,315)Euro Czech koruna 1,451,324 39,282,490 14-Aug-20 UBS AG (12,797)Euro New Zealand dollar 304,761 546,000 14-Aug-20 Citigroup Global
Markets Limited (6,890)Euro New Zealand dollar 6,658,784 11,974,032 14-Aug-20 Royal Bank
of Scotland (175,867)Euro Norwegian krone 8,714,065 97,499,821 14-Aug-20 Royal Bank
of Scotland (215,821)Euro Swedish krona 2,131,918 22,821,658 14-Aug-20 Barclays Bank PLC (40,264)Euro US dollar 179,313 201,861 14-Aug-20 State Street Bank (602)Euro US dollar 1,843,681 2,085,519 14-Aug-20 Barclays Bank PLC (15,103)Euro US dollar 3,155,715 3,575,402 14-Aug-20 Barclays Bank PLC (30,974)Euro US dollar 1,984,745 2,254,000 14-Aug-20 State Street Bank (24,203)Euro US dollar 114,178 129,399 14-Aug-20 Royal Bank
of Scotland (1,153)Hungarian forint Euro 108,150,628 308,382 14-Aug-20 Barclays Bank PLC (5,325)Hungarian forint Euro 196,859,001 560,166 14-Aug-20 UBS AG (8,532)Hungarian forint Euro 174,316,519 496,127 14-Aug-20 UBS AG (7,661)Hungarian forint Euro 278,840,807 793,024 14-Aug-20 UBS AG (11,662)Hungarian forint Euro 276,675,058 781,031 14-Aug-20 UBS AG (5,738)Malaysian ringgit US dollar 9,853,000 2,311,446 14-Aug-20 State Street Bank (17,815)New Zealand dollar Euro 2,359,277 1,350,969 14-Aug-20 Citigroup Global
Markets Limited (4,319)Norwegian krone Euro 5,891,447 542,165 14-Aug-20 Barclays Bank PLC (2,575)Sterling Euro 109,303 119,573 14-Aug-20 Barclays Bank PLC (2)Sterling Euro 358,000 394,738 14-Aug-20 State Street Bank (3,108)Sterling Euro 3,816,036 4,276,822 14-Aug-20 Barclays Bank PLC (102,315)Sterling Euro 1,160,327 1,284,816 14-Aug-20 State Street Bank (15,490)Sterling Euro 367,389 405,335 14-Aug-20 Barclays Bank PLC (3,435)Sterling Euro 481,527 531,777 14-Aug-20 UBS AG (5,015)US dollar Colombian peso 2,422,796 9,601,540,000 14-Aug-20 State Street Bank (116,520)US dollar Euro 303,333 279,710 14-Aug-20 Barclays Bank PLC (9,354)US dollar Euro 236,701 211,047 14-Aug-20 Barclays Bank PLC (80)US dollar Euro 442,520 403,452 14-Aug-20 Barclays Bank PLC (9,042)US dollar Euro 775,950 703,670 14-Aug-20 HSBC Bank plc (12,080)US dollar Euro 2,756,100 2,544,932 14-Aug-20 State Street Bank (88,471)US dollar Euro 255,829 232,284 14-Aug-20 State Street Bank (4,268)US dollar Euro 387,249 347,608 14-Aug-20 State Street Bank (2,460)US dollar Indonesian rupiah 3,211,855 50,079,246,000 14-Aug-20 Royal Bank
of Scotland (186,151)US dollar Malaysian ringgit 409,509 1,783,000 14-Aug-20 Canadian Imperial
Bank (4,594)US dollar Malaysian ringgit 1,866,759 8,070,000 14-Aug-20 Royal Bank
of Scotland (8,945)US dollar Philippino peso 2,295,189 116,871,000 14-Aug-20 Royal Bank
of Scotland (37,239)
EUR (1,649,103)
Net EUR 3,824,173
Forward foreign currency contracts cont’d.Unrealised
Gain/(Loss)Buy Sell Amount (B) Amount (S)Settle
Date Counterparty
BNy Mellon Sustainable Global Dynamic Bond FundEuro US dollar 17,799 19,940 01-Jul-20 State Street Bank 10Australian dollar Euro 736,696 439,946 14-Aug-20 State Street Bank 9,839Australian dollar Euro 683,498 408,253 14-Aug-20 State Street Bank 9,051Czech koruna Euro 90,717,617 3,359,723 14-Aug-20 Barclays Bank PLC 21,467Euro Canadian dollar 2,924,271 4,468,318 14-Aug-20 State Street Bank 12,798Euro Canadian dollar 2,378,732 3,636,591 14-Aug-20 Royal Bank
of Scotland 9,196Euro Hungarian forint 2,932,777 1,034,842,012 14-Aug-20 State Street Bank 32,963Euro Japanese yen 6,016,493 697,091,179 14-Aug-20 Barclays Bank PLC 246,605Euro Japanese yen 4,699,764 545,951,489 14-Aug-20 State Street Bank 180,873Euro Norwegian krone 651,078 6,863,481 14-Aug-20 Royal Bank
of Scotland 22,460Euro Norwegian krone 2,358,847 24,828,000 14-Aug-20 State Street Bank 84,882Euro Singapore dollar 2,213,265 3,405,601 14-Aug-20 Barclays Bank PLC 40,712Euro Sterling 768,808 690,000 14-Aug-20 Citigroup Global
Markets Limited 13,991Euro Sterling 458,670 402,182 14-Aug-20 State Street Bank 18,708Euro Sterling 390,378 343,256 14-Aug-20 State Street Bank 14,878Euro Sterling 28,850,989 25,149,640 14-Aug-20 Barclays Bank PLC 1,338,842Euro Sterling 371,872 331,000 14-Aug-20 HSBC Bank plc 9,778Euro Sterling 1,247,830 1,115,539 14-Aug-20 UBS AG 27,500Euro Sterling 1,441,437 1,294,000 14-Aug-20 Royal Bank
of Scotland 25,882Euro Sterling 106,565 96,570 14-Aug-20 Barclays Bank PLC 924Euro US dollar 2,153,546 2,337,000 14-Aug-20 UBS AG 70,621Euro US dollar 2,275,706 2,473,018 14-Aug-20 HSBC Bank plc 71,551Euro US dollar 493,896 533,687 14-Aug-20 Barclays Bank PLC 18,231Euro US dollar 1,848,583 2,031,462 14-Aug-20 State Street Bank 37,979Euro US dollar 166,039 182,784 14-Aug-20 Royal Bank
of Scotland 3,127Euro US dollar 1,984,366 2,210,000 14-Aug-20 HSBC Bank plc 14,634Euro US dollar 2,170,322 2,352,000 14-Aug-20 State Street Bank 74,028Euro US dollar 1,936,936 2,170,201 14-Aug-20 State Street Bank 2,676Euro US dollar 89,399,142 97,082,283 14-Aug-20 State Street Bank 2,871,499Euro US dollar 764,518 857,638 14-Aug-20 HSBC Bank plc 121Indonesian rupiah US dollar 14,188,554,500 920,349 14-Aug-20 State Street Bank 43,508New Zealand dollar Euro 990,672 551,766 14-Aug-20 Citigroup Global
Markets Limited 13,699New Zealand dollar Euro 1,349,378 751,142 14-Aug-20 UBS AG 19,069New Zealand dollar Euro 992,541 553,687 14-Aug-20 Barclays Bank PLC 12,845New Zealand dollar Euro 821,821 459,082 14-Aug-20 Barclays Bank PLC 10,005Norwegian krone Euro 23,801,000 2,150,607 14-Aug-20 UBS AG 29,297Sterling Euro 472,650 515,209 14-Aug-20 State Street Bank 1,841Sterling Euro 156,880 171,499 14-Aug-20 Barclays Bank PLC 118US dollar Euro 723,897 645,037 14-Aug-20 State Street Bank 159US dollar Euro 11,198,847 9,970,647 14-Aug-20 State Street Bank 10,677US dollar Euro 230,689 204,288 14-Aug-20 Citigroup Global
Markets Limited 1,321US dollar Euro 2,675,000 2,354,383 14-Aug-20 State Street Bank 29,795US dollar Euro 1,007,000 884,451 14-Aug-20 Royal Bank
of Scotland 13,070US dollar Euro 167,379 148,505 14-Aug-20 State Street Bank 677US dollar Euro 206,039 183,364 14-Aug-20 State Street Bank 275US dollar Euro 145,472 128,740 14-Aug-20 Royal Bank
of Scotland 916US dollar Euro 738,635 658,154 14-Aug-20 State Street Bank 178
EUR 5,473,276
03613-1A.indd 257 19/08/2020 19:01

258
Schedule of investments – as at 30 June 2020
BNy MELLON SUSTAINABLE GLOBAL DyNAMIC BOND FUND
Forward foreign currency contracts cont’d.Unrealised
Gain/(Loss)Buy Sell Amount (B) Amount (S)Settle
Date Counterparty
BNy Mellon Sustainable Global Dynamic Bond Fund CHF W (Acc) (Hedged) Share ClassEuro Swiss franc 1,646,875 1,751,949 01-Jul-20 The Bank of
New York Mellon 2,582Swiss franc Euro 45 42 02-Jul-20 The Bank of
New York Mellon - Euro Swiss franc 180 192 15-Jul-20 The Bank of
New York Mellon - Euro Swiss franc 1,104 1,176 15-Jul-20 The Bank of
New York Mellon - Euro Swiss franc 42 45 15-Jul-20 The Bank of
New York Mellon - Euro Swiss franc 934 994 15-Jul-20 The Bank of
New York Mellon 2Euro Swiss franc 3,110 3,312 15-Jul-20 The Bank of
New York Mellon 1Swiss franc Euro 970 911 15-Jul-20 The Bank of
New York Mellon - Swiss franc Euro 1,990 1,864 15-Jul-20 The Bank of
New York Mellon 4Swiss franc Euro 21,406 19,980 15-Jul-20 The Bank of
New York Mellon 113Swiss franc Euro 24,759 23,149 15-Jul-20 The Bank of
New York Mellon 91Swiss franc Euro 37,249 34,820 15-Jul-20 The Bank of
New York Mellon 144Swiss franc Euro 3,614 3,362 15-Jul-20 The Bank of
New York Mellon 30Swiss franc Euro 1,221 1,135 15-Jul-20 The Bank of
New York Mellon 11Swiss franc Euro 21,248,538 19,744,827 15-Jul-20 The Bank of
New York Mellon 199,790Swiss franc Euro 33,929 31,840 15-Jul-20 The Bank of
New York Mellon 7Swiss franc Euro 2,654 2,487 15-Jul-20 The Bank of
New York Mellon 5Swiss franc Euro 3,350 3,126 15-Jul-20 The Bank of
New York Mellon 19Swiss franc Euro 1,962 1,842 15-Jul-20 The Bank of
New York Mellon -
EUR 202,799
CHF 216,077
Swiss franc Euro 994 934 01-Jul-20 The Bank of New York Mellon (1)
Euro Swiss franc 31,836 33,929 02-Jul-20 The Bank of New York Mellon (8)
Euro Swiss franc 493 526 15-Jul-20 The Bank of New York Mellon (1)
Euro Swiss franc 4,532 4,838 15-Jul-20 The Bank of New York Mellon (9)
Euro Swiss franc 1,830 1,957 15-Jul-20 The Bank of New York Mellon (7)
Euro Swiss franc 4,163 4,454 15-Jul-20 The Bank of New York Mellon (17)
Euro Swiss franc 1,516 1,625 15-Jul-20 The Bank of New York Mellon (9)
Euro Swiss franc 1,117 1,202 15-Jul-20 The Bank of New York Mellon (11)
Swiss franc Euro 1,751,949 1,647,113 15-Jul-20 The Bank of New York Mellon (2,673)
EUR (2,736)
CHF (2,915)
Net EUR 200,063
Net CHF 213,162
Forward foreign currency contracts cont’d.Unrealised
Gain/(Loss)Buy Sell Amount (B) Amount (S)Settle
Date Counterparty
BNy Mellon Sustainable Global Dynamic Bond Fund CHF E (Acc) (Hedged) Share ClassEuro Swiss franc 51,911 55,223 01-Jul-20 The Bank of
New York Mellon 81Swiss franc Euro 4,982 4,667 15-Jul-20 The Bank of
New York Mellon 9Swiss franc Euro 20,032 18,765 15-Jul-20 The Bank of
New York Mellon 38Swiss franc Euro 24,985 23,311 15-Jul-20 The Bank of
New York Mellon 141Swiss franc Euro 9,808 9,124 15-Jul-20 The Bank of
New York Mellon 82Swiss franc Euro 40,028 37,201 15-Jul-20 The Bank of
New York Mellon 371Swiss franc Euro 11,607,990 10,786,519 15-Jul-20 The Bank of
New York Mellon 109,144Swiss franc Euro 25,010 23,422 15-Jul-20 The Bank of
New York Mellon 53Swiss franc Euro 51,867 48,594 15-Jul-20 The Bank of
New York Mellon 90
EUR 110,009
CHF 117,212
Euro Swiss franc 141,789 151,073 15-Jul-20 The Bank of New York Mellon (13)
Swiss franc Euro 55,223 51,918 15-Jul-20 The Bank of New York Mellon (84)
EUR (97)
CHF (103)
Net EUR 109,912
Net CHF 117,109
BNy Mellon Sustainable Global Dynamic Bond Fund CHF H (Acc) (Hedged) Share ClassSwiss franc Euro 270,492 251,350 15-Jul-20 The Bank of
New York Mellon 2,543
EUR 2,543
CHF 2,709
Euro Swiss franc 17,812 19,015 15-Jul-20 The Bank of New York Mellon (36)
EUR (36)
CHF (38)
Net EUR 2,507
Net CHF 2,671
03613-1A.indd 258 19/08/2020 19:01

259
Schedule of investments – as at 30 June 2020
BNy MELLON SUSTAINABLE GLOBAL DyNAMIC BOND FUND
Forward foreign currency contracts cont’d.Unrealised
Gain/(Loss)Buy Sell Amount (B) Amount (S)Settle
Date Counterparty
BNy Mellon Sustainable Global Dynamic Bond Fund USD W (Acc) (Hedged) Share ClassUS dollar Euro 60,000 53,146 15-Jul-20 The Bank of
New York Mellon 366US dollar Euro 548,224 482,781 15-Jul-20 The Bank of
New York Mellon 6,167
EUR 6,533
USD 7,323
Euro US dollar 53,160 60,000 02-Jul-20 The Bank of New York Mellon (369)
US dollar Euro 36,420 32,488 15-Jul-20 The Bank of New York Mellon (6)
EUR (375)
USD (420)
Net EUR 6,158
Net USD 6,903
Forward foreign currency contracts cont’d.Unrealised
Gain/(Loss)Buy Sell Amount (B) Amount (S)Settle
Date Counterparty
BNy Mellon Sustainable Global Dynamic Bond Fund NOK H (Acc) (Hedged) Share ClassNorwegian krone Euro 884,207 83,879 15-Jul-20 The Bank of
New York Mellon (2,851)
EUR (2,851)
NOK (31,104)
BNy Mellon Sustainable Global Dynamic Bond Fund NOK W (Acc) (Hedged) Share ClassNorwegian krone Euro 890,656 84,491 15-Jul-20 The Bank of
New York Mellon (2,872)
EUR (2,872)
NOK (31,333)
BNy Mellon Sustainable Global Dynamic Bond Fund Sterling W (Acc) (Hedged) Share ClassSterling Euro 116,552 130,762 15-Jul-20 The Bank of
New York Mellon (3,200)
EUR (3,200)
GBp (2,923)
BNy Mellon Sustainable Global Dynamic Bond Fund Sterling W (Inc) (Hedged) Share ClassEuro Sterling 55 50 02-Jul-20 The Bank of
New York Mellon - Euro Sterling 64 57 15-Jul-20 The Bank of
New York Mellon 1Euro Sterling 6,539 5,836 15-Jul-20 The Bank of
New York Mellon 151Sterling Euro 50 55 15-Jul-20 The Bank of
New York Mellon -
EUR 152
GBp 139
Sterling Euro 6,000 6,623 15-Jul-20 The Bank of New York Mellon (57)
Sterling Euro 435,066 488,112 15-Jul-20 The Bank of New York Mellon (11,944)
EUR (12,001)
GBp (10,963)
Net EUR (11,849)
Net GBp (10,824)
03613-1A.indd 259 19/08/2020 19:01

260
Schedule of investments – as at 30 June 2020
Holdings Description
Fair value
Total net assets
% Holdings Description
Fair value
Total net assets
%
FUND 42 - BNy MELLON SUSTAINABLE GLOBAL REAL RETURN FUND (EUR)
Collective investment schemes
Ireland - 3,549,450 3,549,450 14.17 18,697 Amundi Physical Gold ETC 1,178,891 4.71 6,885 Invesco Physical Gold ETC 1,054,002 4.21 42,645 iShares Physical Gold ETC 1,316,557 5.25
Jersey - 455,502 455,502 1.82 1,383 WisdomTree Physical Swiss Gold ETC 210,806 0.84 1,594 Xtrackers Physical Gold ETC 244,695 0.98
United Kingdom - 122,669 122,669 0.49 102,805 Gresham House Energy Storage Fund Plc/The Fund 122,669 0.49
Total investments in collective investment schemes 4,127,621 16.48
Bonds
Australia - 1,004,434 1,004,434 4.01 419,000 Australia Government Bond 3.000% 21-Mar-2047 326,126 1.30 501,000 Australia Government Bond 3.250% 21-Jun-2039 393,840 1.57 94,000 Australia Government Bond 3.750% 21-Apr-2037 77,981 0.31 152,800 New South Wales Treasury Corp
2.750% 20-Nov-2025 141,202 0.56 49,000 Treasury Corp of Victoria 4.250% 20-Dec-2032 39,210 0.16 33,000 Treasury Corp of Victoria 5.500% 17-Nov-2026 26,075 0.11
Cayman Islands - 182,253 182,253 0.73 200,000 Sable International Finance Ltd ‘144A’
5.750% 07-Sep-2027 182,253 0.73
Colombia - 87,276 87,276 0.35 322,800,000 Colombia Government International Bond ‘REGS’
7.500% 26-Aug-2026 87,276 0.35
Ecuador - 75,609 75,609 0.30 200,000 Ecuador Government International Bond ‘REGS’
8.875% 23-Oct-2027 75,609 0.30
France - 202,390 202,390 0.81 200,000 JCDecaux SA 2.000% 24-Oct-2024 202,390 0.81
Germany - 199,014 199,014 0.79 200,000 Infineon Technologies AG FRN (Perpetual)
3.625% 01-Jan-2028 199,014 0.79
Hungary - 135,828 135,828 0.54 44,910,000 Hungary Government Bond 3.000% 21-Aug-2030 135,828 0.54
Indonesia - 146,871 146,871 0.59 2,258,000,000 Indonesia Treasury Bond 8.250% 15-May-2036 146,871 0.59
Ireland - 110,404 110,404 0.44 100,000 Virgin Media Vendor Financing Notes III DAC ‘REGS’
4.875% 15-Jul-2028 110,404 0.44
Italy - 147,500 147,500 0.59 200,000 UniCredit SpA ‘EMTN’ FRN (Perpetual)
3.875% 03-Jun-2027 147,500 0.59
Jersey - 105,502 105,502 0.42 100,000 CPUK Finance Ltd ‘REGS’ 4.250% 28-Aug-2022 105,502 0.42
Luxembourg - 96,500 96,500 0.39 100,000 Summer BC Holdco B SARL ‘REGS’
5.750% 31-Oct-2026 96,500 0.39
Mexico - 385,847 385,847 1.54 3,081,100 Mexican Bonos 7.500% 03-Jun-2027 132,155 0.53 4,067,300 Mexican Bonos 7.750% 29-May-2031 176,919 0.70 1,657,300 Mexican Bonos 10.000% 05-Dec-2024 76,773 0.31
Mongolia - 186,011 186,011 0.74 200,000 Mongolia Government International Bond ‘REGS’
10.875% 06-Apr-2021 186,011 0.74
Netherlands - 97,750 97,750 0.39 100,000 Telefonica Europe BV FRN (Perpetual)
3.000% 04-Sep-2023 97,750 0.39
New Zealand - 237,951 237,951 0.95 131,000 New Zealand Government Bond 2.750% 15-Apr-2037 92,013 0.37 171,000 New Zealand Government Inflation Linked Bond
2.500% 20-Sep-2040 145,938 0.58
Norway - 175,529 175,529 0.70 200,000 DNB Bank ASA FRN (Perpetual)
4.875% 12-Nov-2024 175,529 0.70
Spain - 198,122 198,122 0.79 200,000 Banco Bilbao Vizcaya Argentaria SA FRN (Perpetual)
6.000% 29-Mar-2024 198,122 0.79
United Kingdom - 984,927 984,927 3.93 9,000 Anglian Water Services Financing Plc ‘EMTN’
4.125% 28-Jul-2020 17,338 0.07 19,000 British Telecommunications Plc ‘EMTN’
3.500% 25-Apr-2025 43,103 0.17 100,000 Iceland Bondco Plc ‘REGS’ 4.625% 15-Mar-2025 98,459 0.39 200,000 Investec Plc ‘EMTN’ FRN (Perpetual)
6.750% 05-Dec-2024 180,939 0.72 100,000 Iron Mountain UK Plc ‘REGS’ 3.875% 15-Nov-2025 105,132 0.42 200,000 Scottish Hydro Electric Transmission Plc ‘EMTN’
2.250% 27-Sep-2035 237,081 0.95 44,000 Tesco Plc ‘EMTN’ 3.322% 05-Nov-2025 97,451 0.39 56,863 Tesco Property Finance 3 Plc 5.744% 13-Apr-2040 84,211 0.34 117,000 Vodafone Group Plc FRN 7.000% 04-Apr-2079 121,213 0.48
United States of America - 661,137 661,137 2.64 115,000 Comcast Corp 3.300% 01-Apr-2027 115,451 0.46 120,000 Fiserv Inc 3.500% 01-Jul-2029 120,037 0.48 250,000 JPMorgan Chase & Co FRN 2.083% 22-Apr-2026 231,888 0.93 76,000 Laureate Education Inc ‘144A’
8.250% 01-May-2025 70,611 0.28 31,000 Sprint Capital Corp 8.750% 15-Mar-2032 39,511 0.16 26,000 Sprint Corp 7.125% 15-Jun-2024 26,067 0.10 58,000 T-Mobile USA Inc ‘144A’ 3.875% 15-Apr-2030 57,572 0.23
Total investments in bonds 5,420,855 21.64
Equities
Canada - 118,042 118,042 0.47 1,412 Intact Financial Corp 118,042 0.47
Cayman Islands - 751,592 751,592 3.00 1,175 Alibaba Group Holding Ltd ADR 225,371 0.90 1,701 New Oriental Education & Technology Group Inc ADR 199,213 0.80 3,799 Tencent Holdings Ltd 218,002 0.87 9,218 Tencent Music Entertainment Group ADR 109,006 0.43
BNY MELLON SUSTAINABLE GLOBAL REAL RETURN FUND (EUR)
Bonds cont’d.
^
EUR EUR
03613-1A.indd 260 19/08/2020 19:01

261
Schedule of investments – as at 30 June 2020
Holdings Description
Fair value
Total net assets
% Holdings Description
Fair value
Total net assets
%
BNy MELLON SUSTAINABLE GLOBAL REAL RETURN FUND (EUR)
China - 66,866 66,866 0.27 7,500 Ping An Insurance Group Co of China Ltd ‘H’ 66,866 0.27
Denmark - 334,369 334,369 1.33 1,584 Chr Hansen Holding A/S 145,022 0.58 1,840 Orsted A/S ‘144A’ 189,347 0.75
France - 661,069 661,069 2.64 7,984 Bureau Veritas SA 150,419 0.60 435 L’Oreal SA 124,475 0.50 278 LVMH Moet Hennessy Louis Vuitton SE 108,962 0.43 771 Sanofi 69,752 0.28 9,022 Vivendi SA 207,461 0.83
Germany - 984,318 984,318 3.93 1,762 Continental AG 153,963 0.62 6,608 Deutsche Wohnen SE 263,990 1.05 2,070 LEG Immobilien AG 237,491 0.95 2,669 SAP SE 328,874 1.31
Hong Kong - 472,912 472,912 1.89 35,400 AIA Group Ltd 294,318 1.18 24,500 Link REIT (Units) (REIT) 178,594 0.71
India - 81,815 81,815 0.33 2,010 HDFC Bank Ltd ADR 81,815 0.33
Ireland - 619,840 619,840 2.47 1,419 Accenture Plc - Class A 269,356 1.07 1,321 Linde Plc 248,926 0.99 1,261 Medtronic Plc 101,558 0.41
Japan - 174,125 174,125 0.70 2,400 Ebara Corp 50,140 0.20 17,300 Topcon Corp 123,985 0.50
Jersey - 121,530 121,530 0.48 1,678 Ferguson Plc 121,530 0.48
Netherlands - 560,539 560,539 2.24 383 ASML Holding NV 123,968 0.49 9,959 Relx Plc 204,259 0.82 4,880 Unilever NV 232,312 0.93
Republic of Korea - 191,820 191,820 0.77 711 Samsung SDI Co Ltd 191,820 0.77
South Africa - 156,465 156,465 0.62 960 Naspers Ltd 156,465 0.62
Switzerland - 823,884 823,884 3.29 3,430 Alcon Inc 175,287 0.70 260 Lonza Group AG 121,231 0.49 1,961 Nestle SA 193,584 0.77 210 Roche Holding AG 64,849 0.26 861 Zurich Insurance Group AG 268,933 1.07
Taiwan - 197,611 197,611 0.79 13,000 Elite Material Co Ltd 62,599 0.25 2,683 Taiwan Semiconductor Manufacturing Co Ltd ADR 135,012 0.54
United Kingdom - 989,930 989,930 3.95 8,003 IMI Plc 81,564 0.32 228,870 Impact Healthcare Reit Plc (REIT) 236,514 0.94 20,523 Informa Plc 105,705 0.42 4,503 Johnson Matthey Plc 104,479 0.42 26,792 National Express Group Plc 57,075 0.23 2,993 Persimmon Plc 75,489 0.30 19,210 Prudential Plc 257,082 1.03 5,812 Travis Perkins Plc 72,022 0.29
United States of America - 2,607,000 2,607,000 10.41 1,672 Abbott Laboratories 132,787 0.53 95 Alphabet Inc - Class A 118,450 0.47 60 Amazon.com Inc 143,536 0.57 499 Apple Inc 161,141 0.64 10,721 Brixmor Property Group Inc (REIT) 123,910 0.49 1,365 CMS Energy Corp 70,095 0.28 829 Ecolab Inc 144,618 0.58 1,928 Eversource Energy 142,944 0.57 790 Fidelity National Information Services Inc 92,451 0.37 15,500 General Electric Co 93,962 0.38 1,374 Goldman Sachs Group Inc/The 237,296 0.95 6,270 Laureate Education Inc - Class A 55,462 0.22 851 Mastercard Inc 222,559 0.89 2,691 Merck & Co Inc 182,745 0.73 1,841 Microsoft Corp 325,965 1.30 1,273 NIKE Inc 108,919 0.44 1,043 PepsiCo Inc 122,012 0.49 373 salesforce.com Inc 61,026 0.24 133 Sherwin-Williams Co/The 67,122 0.27
Total investments in equities 9,913,727 39.58
Equity investment instruments
Guernsey - 863,776 863,776 3.45 126,648 International Public Partnerships Ltd 233,611 0.93 91,668 JLEN Environmental Assets Group Ltd 118,914 0.47 69,177 NextEnergy Solar Fund Ltd 81,483 0.33 310,593 Renewables Infrastructure Group Ltd/The 429,768 1.72
Jersey - 215,329 215,329 0.86 178,010 Foresight Solar Fund Ltd 215,329 0.86
Luxembourg - 137,372 137,372 0.55 76,751 BBGI SICAV SA/Fund 137,372 0.55
United Kingdom - 1,043,728 1,043,728 4.17 310,417 BioPharma Credit Plc/The Fund 271,674 1.08 293,000 Greencoat UK Wind Plc/Funds 459,631 1.84 269,242 Sdcl Energy Efficiency Income Trust Plc 312,424 1.25
Total investments in equity investment instruments 2,260,205 9.03
Index options - 484,503 17 CBOE S&P 500 Index Call 17-Dec-2020 3,000.000 377,946 1.51 10 CBOE S&P 500 Index Put 17-Dec-2020 2,650.000 106,557 0.42
Total index options 484,503 1.93
Equities cont’d. Equities cont’d.
EUR EUR
03613-1A.indd 261 19/08/2020 19:01

262
Schedule of investments – as at 30 June 2020
Holdings Description
Fair value
Total net assets
% Holdings Description
Fair value
Total net assets
%
BNy MELLON SUSTAINABLE GLOBAL REAL RETURN FUND (EUR)
Underlying exposure
EUR
Open futures contracts - 54,593 46 U.S. 10 Year Treasury Note
Long Futures Contracts Exp Sep-2020 5,717,806 54,593 0.22
Total open futures contracts 54,593 0.22
Unrealised gain on forward foreign currency contracts - 617,894 (see below) 617,894 2.47
Total financial assets at fair value through profit or loss 22,879,398 91.35
Commodity options - (9,895) (124) iShares Physical Gold ETC Call 17-Jul-2020 35.250 (3,319) (0.01) (81) iShares Physical Gold ETC Call 21-Aug-2020 34.750 (6,576) (0.03)
Total commodity options (9,895) (0.04)
Index options - (148,898) (17) CBOE S&P 500 Index Call 17-Dec-2020 3,300.000 (134,981) (0.54) (4) CBOE S&P 500 Index Put 20-Aug-2020 2,650.000 (13,917) (0.05)
Total index options (148,898) (0.59)
Unrealised loss on forward foreign currency contracts - (67,894) (see below) (67,894) (0.27)
Total financial liabilities at fair value through profit or loss (226,687) (0.90)
Net current assets 2,392,455 9.55
Total net assets 25,045,166 100.00
please refer to Note 18 of the financial statements. The counterparty for commodity options is UBS AG. The counterparty for index options is UBS AG. The counterparty for futures contracts is UBS AG.
Analysis of portfolio % of Total Assets
Transferable securities and money market instruments admitted to official stock exchange listing or traded on a regulated market 84.43Financial derivative instruments dealt in on a regulated market 2.10oTC financial derivative instruments 2.40other current assets 11.07
Total assets 100.00
EUR EUR
Forward foreign currency contracts cont’d.Unrealised
Gain/(Loss)Buy Sell Amount (B) Amount (S)Settle
Date Counterparty
BNy Mellon Sustainable Global Real Return Fund (EUR)Euro Sterling 5,932 5,160 15-Jul-20 Citigroup Global
Markets Limited 284Euro Sterling 12,867 11,231 15-Jul-20 Barclays Bank PLC 574Euro Sterling 2,815 2,458 15-Jul-20 State Street Bank 125Euro Sterling 3,842,844 3,380,365 15-Jul-20 State Street Bank 143,125Euro Sterling 4,874 4,260 15-Jul-20 State Street Bank 212Euro Sterling 8,989 7,888 15-Jul-20 Barclays Bank PLC 356Euro Sterling 111,182 99,500 15-Jul-20 State Street Bank 2,282Euro Sterling 70,996 62,161 15-Jul-20 Canadian Imperial
Bank 2,962Euro Sterling 3,320 2,909 15-Jul-20 Royal Bank
of Scotland 136Euro Sterling 9,147 8,059 15-Jul-20 Citigroup Global
Markets Limited 327Euro Sterling 72,484 64,938 15-Jul-20 Barclays Bank PLC 1,411Euro Sterling 1,459 1,303 15-Jul-20 State Street Bank 33Euro Sterling 5,927 5,257 15-Jul-20 Barclays Bank PLC 174Euro Sterling 12,984 11,403 15-Jul-20 UBS AG 503Sterling Euro 1,526 1,669 15-Jul-20 UBS AG 1Sterling Euro 113,000 123,379 15-Jul-20 UBS AG 297Swedish krona Euro 196,181 17,886 15-Jul-20 Barclays Bank PLC 792Swedish krona Euro 258,000 23,712 15-Jul-20 Barclays Bank PLC 852Swedish krona Euro 373,012 34,081 15-Jul-20 Barclays Bank PLC 1,433Swedish krona Euro 130,577 11,975 15-Jul-20 Barclays Bank PLC 457Euro Canadian dollar 4,007 6,111 14-Aug-20 UBS AG 25Euro Canadian dollar 518,535 788,263 14-Aug-20 Barclays Bank PLC 4,918Euro Hong Kong dollar 70,555 599,000 14-Aug-20 Canadian Imperial
Bank 1,684Euro Hong Kong dollar 28,043 238,845 14-Aug-20 Canadian Imperial
Bank 581Euro Hong Kong dollar 742,524 6,227,378 14-Aug-20 Barclays Bank PLC 26,520Euro Korean won 102,665 135,968,000 14-Aug-20 State Street Bank 1,907Euro Swiss franc 23,890 25,411 14-Aug-20 State Street Bank 33Euro Swiss franc 712,555 749,361 14-Aug-20 Barclays Bank PLC 9,030Euro US dollar 9,955 10,819 14-Aug-20 Canadian Imperial
Bank 313Euro US dollar 25,267 27,419 14-Aug-20 State Street Bank 829Euro US dollar 234,945 254,000 14-Aug-20 State Street Bank 8,559Euro US dollar 23,126 25,020 14-Aug-20 Barclays Bank PLC 827Euro US dollar 60,175 65,000 14-Aug-20 Royal Bank
of Scotland 2,242Euro US dollar 68,678 75,400 14-Aug-20 Barclays Bank PLC 1,476Euro US dollar 207,708 228,491 14-Aug-20 Royal Bank
of Scotland 4,059Euro US dollar 18,757 20,653 14-Aug-20 Canadian Imperial
Bank 349Euro US dollar 61,044 68,000 14-Aug-20 State Street Bank 437Euro US dollar 22,028 23,912 14-Aug-20 Barclays Bank PLC 715Euro US dollar 9,680,218 10,471,183 14-Aug-20 Barclays Bank PLC 347,447Euro US dollar 177,320 192,000 14-Aug-20 Barclays Bank PLC 6,194Euro US dollar 44,170 48,228 14-Aug-20 State Street Bank 1,186Euro US dollar 31,462 34,730 14-Aug-20 Royal Bank
of Scotland 508Euro US dollar 96,541 107,000 14-Aug-20 Canadian Imperial
Bank 1,174Euro US dollar 121,964 136,000 14-Aug-20 Barclays Bank PLC 750Euro US dollar 124,930 140,000 14-Aug-20 Barclays Bank PLC 151Euro US dollar 1,379 1,546 14-Aug-20 Royal Bank
of Scotland 1Euro US dollar 98,016 109,000 14-Aug-20 State Street Bank 866Euro US dollar 73,514 82,000 14-Aug-20 Barclays Bank PLC 429Euro US dollar 73,522 82,000 14-Aug-20 Barclays Bank PLC 437Euro US dollar 26,886 29,137 14-Aug-20 Royal Bank
of Scotland 916Euro US dollar 43,821 47,397 14-Aug-20 State Street Bank 1,577Hong Kong dollar Euro 33,028 3,767 14-Aug-20 Barclays Bank PLC 31Korean won Euro 87,642,000 64,602 14-Aug-20 State Street Bank 345New Zealand dollar Euro 175,735 98,546 14-Aug-20 State Street Bank 1,762
03613-1A.indd 262 19/08/2020 19:01
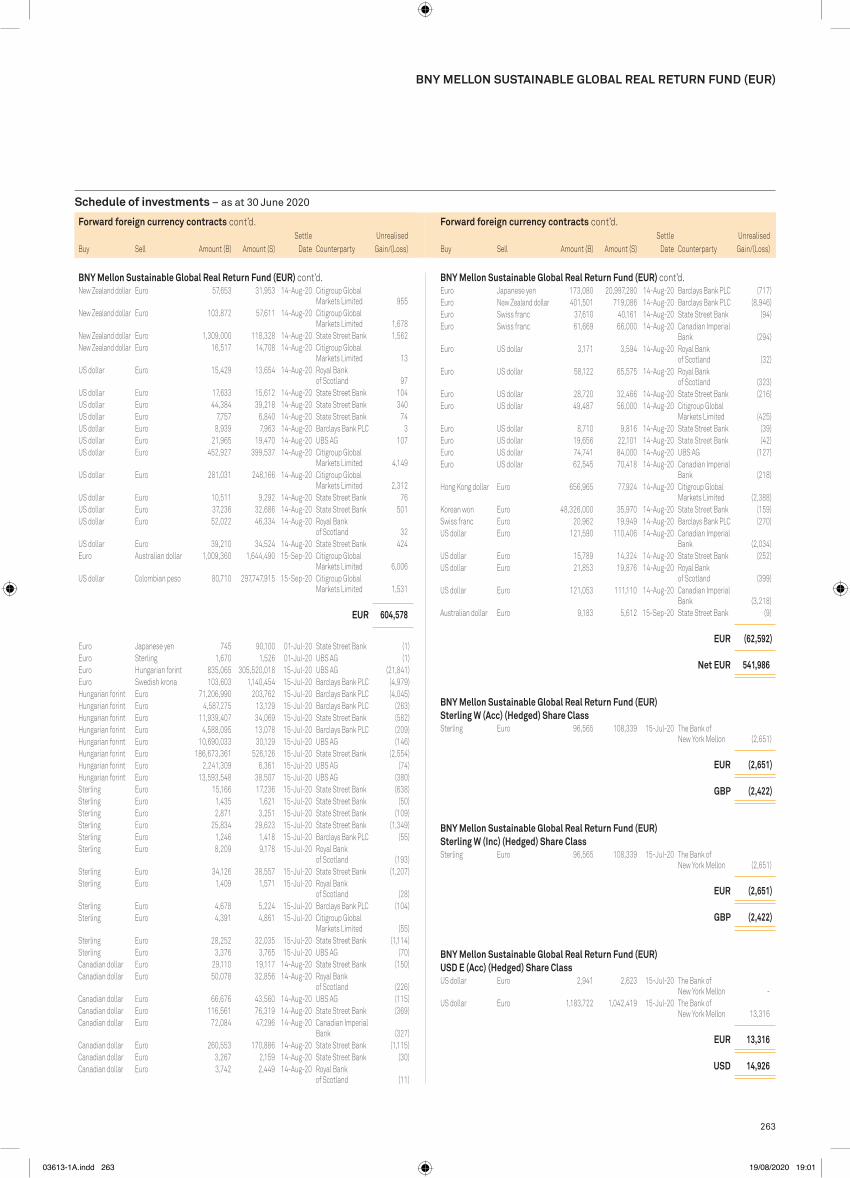
263
Schedule of investments – as at 30 June 2020
BNy MELLON SUSTAINABLE GLOBAL REAL RETURN FUND (EUR)
Forward foreign currency contracts cont’d.Unrealised
Gain/(Loss)Buy Sell Amount (B) Amount (S)Settle
Date Counterparty
BNy Mellon Sustainable Global Real Return Fund (EUR) cont’d.Euro Japanese yen 173,080 20,997,280 14-Aug-20 Barclays Bank PLC (717)Euro New Zealand dollar 401,501 719,086 14-Aug-20 Barclays Bank PLC (8,946)Euro Swiss franc 37,610 40,161 14-Aug-20 State Street Bank (94)Euro Swiss franc 61,669 66,000 14-Aug-20 Canadian Imperial
Bank (294)Euro US dollar 3,171 3,594 14-Aug-20 Royal Bank
of Scotland (32)Euro US dollar 58,122 65,575 14-Aug-20 Royal Bank
of Scotland (323)Euro US dollar 28,720 32,466 14-Aug-20 State Street Bank (216)Euro US dollar 49,487 56,000 14-Aug-20 Citigroup Global
Markets Limited (425)Euro US dollar 8,710 9,816 14-Aug-20 State Street Bank (39)Euro US dollar 19,656 22,101 14-Aug-20 State Street Bank (42)Euro US dollar 74,741 84,000 14-Aug-20 UBS AG (127)Euro US dollar 62,545 70,418 14-Aug-20 Canadian Imperial
Bank (218)Hong Kong dollar Euro 656,965 77,924 14-Aug-20 Citigroup Global
Markets Limited (2,388)Korean won Euro 48,326,000 35,970 14-Aug-20 State Street Bank (159)Swiss franc Euro 20,962 19,949 14-Aug-20 Barclays Bank PLC (270)US dollar Euro 121,590 110,406 14-Aug-20 Canadian Imperial
Bank (2,034)US dollar Euro 15,789 14,324 14-Aug-20 State Street Bank (252)US dollar Euro 21,853 19,876 14-Aug-20 Royal Bank
of Scotland (399)US dollar Euro 121,053 111,110 14-Aug-20 Canadian Imperial
Bank (3,218)Australian dollar Euro 9,183 5,612 15-Sep-20 State Street Bank (9)
EUR (62,592)
Net EUR 541,986
BNy Mellon Sustainable Global Real Return Fund (EUR) Sterling W (Acc) (Hedged) Share ClassSterling Euro 96,565 108,339 15-Jul-20 The Bank of
New York Mellon (2,651)
EUR (2,651)
GBp (2,422)
BNy Mellon Sustainable Global Real Return Fund (EUR) Sterling W (Inc) (Hedged) Share ClassSterling Euro 96,565 108,339 15-Jul-20 The Bank of
New York Mellon (2,651)
EUR (2,651)
GBp (2,422)
BNy Mellon Sustainable Global Real Return Fund (EUR) USD E (Acc) (Hedged) Share ClassUS dollar Euro 2,941 2,623 15-Jul-20 The Bank of
New York Mellon - US dollar Euro 1,183,722 1,042,419 15-Jul-20 The Bank of
New York Mellon 13,316
EUR 13,316
USD 14,926
Forward foreign currency contracts cont’d.Unrealised
Gain/(Loss)Buy Sell Amount (B) Amount (S)Settle
Date Counterparty
BNy Mellon Sustainable Global Real Return Fund (EUR) cont’d.New Zealand dollar Euro 57,653 31,953 14-Aug-20 Citigroup Global
Markets Limited 955New Zealand dollar Euro 103,872 57,611 14-Aug-20 Citigroup Global
Markets Limited 1,678New Zealand dollar Euro 1,309,000 118,328 14-Aug-20 State Street Bank 1,562New Zealand dollar Euro 16,517 14,708 14-Aug-20 Citigroup Global
Markets Limited 13US dollar Euro 15,429 13,654 14-Aug-20 Royal Bank
of Scotland 97US dollar Euro 17,633 15,612 14-Aug-20 State Street Bank 104US dollar Euro 44,384 39,218 14-Aug-20 State Street Bank 340US dollar Euro 7,757 6,840 14-Aug-20 State Street Bank 74US dollar Euro 8,939 7,963 14-Aug-20 Barclays Bank PLC 3US dollar Euro 21,965 19,470 14-Aug-20 UBS AG 107US dollar Euro 452,927 399,537 14-Aug-20 Citigroup Global
Markets Limited 4,149US dollar Euro 281,031 248,166 14-Aug-20 Citigroup Global
Markets Limited 2,312US dollar Euro 10,511 9,292 14-Aug-20 State Street Bank 76US dollar Euro 37,236 32,686 14-Aug-20 State Street Bank 501US dollar Euro 52,022 46,334 14-Aug-20 Royal Bank
of Scotland 32US dollar Euro 39,210 34,524 14-Aug-20 State Street Bank 424Euro Australian dollar 1,009,360 1,644,490 15-Sep-20 Citigroup Global
Markets Limited 6,006US dollar Colombian peso 80,710 297,747,915 15-Sep-20 Citigroup Global
Markets Limited 1,531
EUR 604,578
Euro Japanese yen 745 90,100 01-Jul-20 State Street Bank (1)Euro Sterling 1,670 1,526 01-Jul-20 UBS AG (1)Euro Hungarian forint 835,065 305,520,018 15-Jul-20 UBS AG (21,841)Euro Swedish krona 103,603 1,140,454 15-Jul-20 Barclays Bank PLC (4,979)Hungarian forint Euro 71,206,990 203,762 15-Jul-20 Barclays Bank PLC (4,045)Hungarian forint Euro 4,587,275 13,129 15-Jul-20 Barclays Bank PLC (263)Hungarian forint Euro 11,939,407 34,069 15-Jul-20 State Street Bank (582)Hungarian forint Euro 4,588,095 13,078 15-Jul-20 Barclays Bank PLC (209)Hungarian forint Euro 10,690,033 30,129 15-Jul-20 UBS AG (146)Hungarian forint Euro 186,673,361 526,126 15-Jul-20 State Street Bank (2,554)Hungarian forint Euro 2,241,309 6,361 15-Jul-20 UBS AG (74)Hungarian forint Euro 13,593,548 38,507 15-Jul-20 UBS AG (380)Sterling Euro 15,166 17,236 15-Jul-20 State Street Bank (638)Sterling Euro 1,435 1,621 15-Jul-20 State Street Bank (50)Sterling Euro 2,871 3,251 15-Jul-20 State Street Bank (109)Sterling Euro 25,834 29,623 15-Jul-20 State Street Bank (1,349)Sterling Euro 1,246 1,418 15-Jul-20 Barclays Bank PLC (55)Sterling Euro 8,209 9,178 15-Jul-20 Royal Bank
of Scotland (193)Sterling Euro 34,126 38,557 15-Jul-20 State Street Bank (1,207)Sterling Euro 1,409 1,571 15-Jul-20 Royal Bank
of Scotland (28)Sterling Euro 4,678 5,224 15-Jul-20 Barclays Bank PLC (104)Sterling Euro 4,391 4,861 15-Jul-20 Citigroup Global
Markets Limited (55)Sterling Euro 28,252 32,035 15-Jul-20 State Street Bank (1,114)Sterling Euro 3,376 3,765 15-Jul-20 UBS AG (70)Canadian dollar Euro 29,110 19,117 14-Aug-20 State Street Bank (150)Canadian dollar Euro 50,078 32,856 14-Aug-20 Royal Bank
of Scotland (226)Canadian dollar Euro 66,676 43,560 14-Aug-20 UBS AG (115)Canadian dollar Euro 116,561 76,319 14-Aug-20 State Street Bank (369)Canadian dollar Euro 72,084 47,296 14-Aug-20 Canadian Imperial
Bank (327)Canadian dollar Euro 260,553 170,886 14-Aug-20 State Street Bank (1,115)Canadian dollar Euro 3,267 2,159 14-Aug-20 State Street Bank (30)Canadian dollar Euro 3,742 2,449 14-Aug-20 Royal Bank
of Scotland (11)
03613-1A.indd 263 19/08/2020 19:01

264
Schedule of investments – as at 30 June 2020
Holdings Description
Fair value
Total net assets
% Holdings Description
Fair value
Total net assets
%
Bonds
Belgium - 672,138 (31 December 2019: –) 672,138 0.84
100,000 Anheuser-Busch InBev SA/NV 3.700% 02-Apr-2040 136,733 0.17 475,000 Anheuser-Busch InBev Worldwide Inc
3.500% 01-Jun-2030 535,405 0.67
Brazil - 650,531 (31 December 2019: –) 650,531 0.81
675,000 Brazilian Government International Bond 3.875% 12-Jun-2030 650,531 0.81
Canada - 489,451 (31 December 2019: –) 489,451 0.61
65,000 Nutrien Ltd 1.900% 13-May-2023 67,027 0.08 425,000 Toronto-Dominion Bank/The ‘MTN’ FRN
0.543% 27-Jan-2023 422,424 0.53
Cayman Islands - 250,000 (31 December 2019: –) 250,000 0.31
250,000 Ballyrock CLO 2020-1 Ltd ‘2020-1X A1’ FRN 0.000% 20-Jul-2030 250,000 0.31
Chile - 254,688 (31 December 2019: –) 254,688 0.32
250,000 VTR Comunicaciones SpA ‘REGS’ 5.125% 15-Jan-2028 254,688 0.32
China - 202,047 (31 December 2019: –) 202,047 0.25
200,000 Tencent Holdings Ltd ‘REGS’ 2.390% 03-Jun-2030 202,047 0.25
Croatia - 332,477 (31 December 2019: –) 332,477 0.41
100,000 Croatia Government International Bond 1.500% 17-Jun-2031 112,052 0.14
175,000 Croatia Government International Bond 2.750% 27-Jan-2030 220,425 0.27
Cyprus - 979,268 (31 December 2019: –) 979,268 1.22
110,000 Cyprus Government International Bond ‘EMTN’ 1.250% 21-Jan-2040 121,205 0.15
400,000 Cyprus Government International Bond ‘EMTN’ 2.250% 16-Apr-2050 504,083 0.63
255,000 Cyprus Government International Bond ‘EMTN’ 2.750% 03-May-2049 353,980 0.44
France - 2,869,659 (31 December 2019: –) 2,869,659 3.57
675,000 Airbus SE 2.000% 07-Apr-2028 799,614 0.99 250,000 Credit Agricole SA ‘REGS’ 3.250% 14-Jan-2030 268,833 0.34 100,000 Engie SA ‘EMTN’ 1.750% 27-Mar-2028 121,442 0.15 100,000 Orange SA ‘EMTN’ 1.625% 07-Apr-2032 122,215 0.15 100,000 Sanofi ‘EMTN’ 1.000% 01-Apr-2025 117,077 0.15 500,000 Sanofi ‘EMTN’ 1.500% 01-Apr-2030 623,886 0.78 425,000 Total Capital International SA 3.386% 29-Jun-2060 437,649 0.54 300,000 Total Capital International SA ‘EMTN’
1.994% 08-Apr-2032 378,943 0.47
Germany - 5,848,089 (31 December 2019: –) 5,848,089 7.27
3,600,000 Bundesobligation 0.000% 05-Apr-2024 4,146,952 5.15
675,000 Bundesrepublik Deutschland Bundesanleihe 2.500% 15-Aug-2046 1,275,932 1.59
175,000 E.ON SE ‘EMTN’ 1.000% 07-Oct-2025 203,481 0.25 200,000 Siemens Financieringsmaatschappij NV ‘EMTN’
0.250% 20-Feb-2029 221,724 0.28
Greece - 797,661 (31 December 2019: –) 797,661 0.99
250,000 Hellenic Republic Government Bond ‘144A’ 1.500% 18-Jun-2030 288,412 0.36
425,000 Hellenic Republic Government Bond ‘144A’ 2.000% 22-Apr-2027 509,249 0.63
Hungary - 630,797 (31 December 2019: –) 630,797 0.78
225,000 Hungary Government International Bond 1.625% 28-Apr-2032 253,984 0.32
140,000 Hungary Government International Bond 7.625% 29-Mar-2041 235,633 0.29
125,000 MFB Magyar Fejlesztesi Bank Zrt 1.375% 24-Jun-2025 141,180 0.17
Ireland - 320,057 (31 December 2019: –) 320,057 0.40
175,000 AerCap Ireland Capital DAC / AerCap Global Aviation Trust 2.875% 14-Aug-2024 163,724 0.20
150,000 AerCap Ireland Capital DAC / AerCap Global Aviation Trust 6.500% 15-Jul-2025 156,333 0.20
Israel - 276,494 (31 December 2019: –) 276,494 0.34
250,000 Israel Government International Bond 2.750% 03-Jul-2030 276,494 0.34
Italy - 2,460,756 (31 December 2019: 2,424,717) 2,460,756 3.06
2,125,000 Italy Buoni Poliennali Del Tesoro ‘144A’ 1.650% 01-Dec-2030 2,460,756 3.06
Japan - 252,474 (31 December 2019: –) 252,474 0.31
225,000 Takeda Pharmaceutical Co Ltd 2.000% 09-Jul-2040 252,474 0.31
Lithuania - 328,977 (31 December 2019: –) 328,977 0.41
275,000 Lithuania Government International Bond ‘EMTN’ 0.750% 06-May-2030 328,977 0.41
Macau - 207,886 (31 December 2019: –) 207,886 0.26
200,000 Sands China Ltd ‘REGS’ 4.375% 18-Jun-2030 207,886 0.26
Malaysia - 413,734 (31 December 2019: –) 413,734 0.51
325,000 Petronas Capital Ltd ‘REGS’ 4.550% 21-Apr-2050 413,734 0.51
Mexico - 164,344 (31 December 2019: –) 164,344 0.20
150,000 Banco Santander Mexico SA Institucion de Banca Multiple Grupo Financiero Santand ‘REGS’ 5.375% 17-Apr-2025 164,344 0.20
BNY MELLON TARGETED RETURN BOND FUND
FUND 43 – BNy MELLON TARGETED RETURN BOND FUND
Bonds cont’d.
Germany cont’d.
USDUSD
03613-1A.indd 264 19/08/2020 19:01

265
Schedule of investments – as at 30 June 2020
Holdings Description
Fair value
Total net assets
% Holdings Description
Fair value
Total net assets
%
BNy MELLON TARGETED RETURN BOND FUND
1,100,000 Repsol International Finance BV ‘EMTN’ 2.625% 15-Apr-2030 1,378,891 1.72
1,500,000 Spain Government Bond ‘144A’ 0.600% 31-Oct-2029 1,723,264 2.14
245,000 Spain Government Bond ‘144A’ 1.250% 31-Oct-2030 298,197 0.37
Ukraine - 247,359 (31 December 2019: 154,594) 247,359 0.31
105,000 Ukraine Government International Bond FRN 0.000% 31-May-2040 96,798 0.12
150,000 Ukraine Government International Bond ‘REGS’ 7.750% 01-Sep-2020 150,561 0.19
United Arab Emirates - 206,750 (31 December 2019: 598,907) 206,750 0.26
200,000 Abu Dhabi Government International Bond ‘REGS’ 2.125% 30-Sep-2024 206,750 0.26
United Kingdom - 3,726,705 (31 December 2019: –) 3,726,705 4.63
575,000 Barclays Plc ‘EMTN’ FRN 3.375% 02-Apr-2025 691,213 0.86 525,000 BP Capital Markets Plc 2.822% 07-Apr-2032 676,514 0.84 575,000 BP Capital Markets Plc FRN (Perpetual)
4.375% 22-Jun-2025 583,338 0.72 325,000 HSBC Holdings Plc 4.950% 31-Mar-2030 391,184 0.49 725,000 Lloyds Bank Corporate Markets Plc ‘EMTN’
2.375% 09-Apr-2026 875,553 1.09 75,000 Royal Bank of Scotland Group Plc
6.125% 15-Dec-2022 81,965 0.10 180,000 Unilever NV 1.750% 25-Mar-2030 229,554 0.28 175,000 Vodafone Group Plc FRN 3.100% 03-Jan-2079 197,384 0.25
United States of America - 51,145,822 (31 December 2019: 71,474,603) 51,145,822 63.58
10,000 AES Corp/The 5.125% 01-Sep-2027 10,311 0.01 50,000 AES Corp/The 6.000% 15-May-2026 52,360 0.07 225,000 Air Lease Corp 3.375% 01-Jul-2025 225,423 0.28 45,000 Air Products and Chemicals Inc
1.500% 15-Oct-2025 46,431 0.06 45,000 Air Products and Chemicals Inc
1.850% 15-May-2027 47,158 0.06 200,000 Ally Financial Inc 5.750% 20-Nov-2025 214,909 0.27 125,000 American Electric Power Co Inc
3.250% 01-Mar-2050 130,233 0.16 420,000 American Express Co 2.500% 30-Jul-2024 445,152 0.55 375,000 American International Group Inc
4.375% 30-Jun-2050 434,215 0.54 125,000 American Tower Corp 2.400% 15-Mar-2025 131,588 0.16 350,000 Amgen Inc 2.300% 25-Feb-2031 363,270 0.45 100,000 AT&T Inc 2.050% 19-May-2032 116,872 0.15 600,000 Bank of America Corp ‘MTN’ FRN
4.083% 20-Mar-2051 749,450 0.93 200,000 Berkshire Hathaway Inc 0.000% 12-Mar-2025 222,189 0.28 425,000 Boeing Co/The 5.150% 01-May-2030 472,096 0.59 150,000 Bristol-Myers Squibb Co ‘REGS’
2.875% 15-Aug-2020 150,448 0.19 450,000 Broadcom Inc ‘REGS’ 5.000% 15-Apr-2030 517,616 0.64 225,000 Cameron LNG LLC ‘REGS’ 2.902% 15-Jul-2031 241,597 0.30 425,000 Capital One Bank USA NA FRN 2.014% 27-Jan-2023 430,974 0.54
Netherlands - 712,541 (31 December 2019: –) 712,541 0.89
575,000 Shell International Finance BV ‘EMTN’ 1.875% 07-Apr-2032 712,541 0.89
Norway - 62,238 (31 December 2019: –) 62,238 0.08
60,000 Yara International ASA ‘REGS’ 3.148% 04-Jun-2030 62,238 0.08
panama - 460,691 (31 December 2019: –) 460,691 0.57
375,000 Panama Government International Bond 4.500% 01-Apr-2056 460,691 0.57
peru - 83,404 (31 December 2019: 81,615) 83,404 0.10
65,000 Southern Copper Corp 5.875% 23-Apr-2045 83,404 0.10
philippines - 844,211 (31 December 2019: –) 844,211 1.05
350,000 Philippine Government International Bond 0.000% 03-Feb-2023 385,100 0.48
400,000 Philippine Government International Bond 3.700% 02-Feb-2042 459,111 0.57
portugal - 929,787 (31 December 2019: –) 929,787 1.16
625,000 Portugal Obrigacoes do Tesouro OT ‘144A’ 3.875% 15-Feb-2030 929,787 1.16
Qatar - 285,068 (31 December 2019: –) 285,068 0.35
250,000 Qatar Government International Bond ‘REGS’ 3.750% 16-Apr-2030 285,068 0.35
Republic of Serbia - 235,387 (31 December 2019: –) 235,387 0.29
200,000 Serbia International Bond ‘REGS’ 3.125% 15-May-2027 235,387 0.29
Romania - 121,237 (31 December 2019: –) 121,237 0.15
100,000 Romanian Government International Bond ‘REGS’ 3.624% 26-May-2030 121,237 0.15
Slovakia - 124,633 (31 December 2019: –) 124,633 0.16
100,000 Slovakia Government Bond 1.000% 14-May-2032 124,633 0.16
Slovenia - 395,859 (31 December 2019: –) 395,859 0.49
325,000 Slovenia Government Bond 1.188% 14-Mar-2029 395,859 0.49
South Africa - 195,078 (31 December 2019: 204,779) 195,078 0.24
175,000 Anglo American Capital Plc ‘EMTN’ 1.625% 11-Mar-2026 195,078 0.24
Spain - 3,858,408 (31 December 2019: 853,214) 3,858,408 4.80
100,000 Adif Alta Velocidad ‘EMTN’ 0.550% 30-Apr-2030 111,434 0.14 300,000 Iberdrola Finanzas SA ‘EMTN’ 0.875% 16-Jun-2025 346,622 0.43
Bonds cont’d. Bonds cont’d.
Spain cont’d.
USDUSD
03613-1A.indd 265 19/08/2020 19:01

266
Schedule of investments – as at 30 June 2020
Holdings Description
Fair value
Total net assets
% Holdings Description
Fair value
Total net assets
%
BNy MELLON TARGETED RETURN BOND FUND
40,000 Kraft Heinz Foods Co ‘REGS’ 4.875% 01-Oct-2049 40,646 0.05 15,000 Lamar Media Corp ‘REGS’ 3.750% 15-Feb-2028 14,297 0.02 155,000 Lennar Corp 4.750% 29-Nov-2027 168,704 0.21 185,000 Level 3 Financing Inc ‘REGS’
4.250% 01-Jul-2028 184,352 0.23 200,000 Marathon Petroleum Corp 3.625% 15-Sep-2024 213,328 0.27 125,000 Marriott International Inc/MD
5.750% 01-May-2025 136,153 0.17 50,000 Mastercard Inc 3.300% 26-Mar-2027 56,646 0.07 175,000 Mastercard Inc 3.350% 26-Mar-2030 203,650 0.25 250,000 Mastercard Inc 3.850% 26-Mar-2050 314,310 0.39 50,000 McDonald’s Corp ‘MTN’ 3.600% 01-Jul-2030 57,614 0.07 165,000 McDonald’s Corp ‘MTN’ 4.200% 01-Apr-2050 199,637 0.25 375,000 MetLife Inc 4.550% 23-Mar-2030 468,957 0.58 120,000 Microsoft Corp 2.525% 01-Jun-2050 123,616 0.15 100,000 Molina Healthcare Inc ‘REGS’
4.375% 15-Jun-2028 100,687 0.13 425,000 Morgan Stanley ‘GMTN’ FRN
0.761% 20-Jan-2023 423,712 0.53 400,000 Northrop Grumman Corp 5.250% 01-May-2050 576,768 0.72 200,000 Occidental Petroleum Corp 8.875% 15-Jul-2030 200,500 0.25 125,000 O’Reilly Automotive Inc 4.200% 01-Apr-2030 146,870 0.18 125,000 PayPal Holdings Inc 2.300% 01-Jun-2030 130,309 0.16 575,000 PepsiCo Inc 3.625% 19-Mar-2050 700,666 0.87 35,000 Prologis LP 2.125% 15-Apr-2027 36,882 0.05 115,000 Prologis LP 2.250% 15-Apr-2030 121,396 0.15 200,000 Quicken Loans LLC ‘REGS’ 5.750% 01-May-2025 204,961 0.25 75,000 Sherwin-Williams Co/The 2.300% 15-May-2030 76,367 0.09 150,000 Southern California Edison Co
3.650% 01-Feb-2050 166,874 0.21 200,000 Sprint Spectrum Co LLC / Sprint Spectrum Co II LLC /
Sprint Spectrum Co III LLC ‘REGS’ 4.738% 20-Mar-2025 216,771 0.27
325,000 Starbucks Corp 2.550% 15-Nov-2030 342,497 0.43 40,000 Starbucks Corp 3.500% 15-Nov-2050 42,470 0.05 40,000 Steel Dynamics Inc 2.400% 15-Jun-2025 41,198 0.05 55,000 Steel Dynamics Inc 3.250% 15-Jan-2031 56,044 0.07 65,000 Steel Dynamics Inc 3.450% 15-Apr-2030 68,072 0.08 215,000 Target Corp 2.650% 15-Sep-2030 237,101 0.29 200,000 T-Mobile USA Inc 4.750% 01-Feb-2028 211,097 0.26 175,000 T-Mobile USA Inc ‘REGS’ 3.500% 15-Apr-2025 191,187 0.24 250,000 T-Mobile USA Inc ‘REGS’ 3.750% 15-Apr-2027 276,875 0.34 125,000 United Rentals North America Inc
4.000% 15-Jul-2030 120,686 0.15 1,880,000 United States Treasury Bill (Zero Coupon)
0.000% 30-Jul-2020* 1,879,843 2.34 8,340,000 United States Treasury Floating Rate Note FRN
0.193% 31-Jul-2020 8,340,343 10.37 6,000,000 United States Treasury Note/Bond
1.125% 28-Feb-2025 6,241,523 7.76 1,600,000 United States Treasury Note/Bond
1.125% 28-Feb-2027 1,670,875 2.08 6,545,000 United States Treasury Note/Bond
2.875% 30-Nov-2023 7,142,231 8.88 1,880,000 United States Treasury Note/Bond
3.375% 15-Nov-2048 2,776,048 3.45 100,000 Verizon Communications Inc 3.150% 22-Mar-2030 112,700 0.14 300,000 Verizon Communications Inc 4.000% 22-Mar-2050 380,336 0.47 105,000 Verizon Communications Inc 4.016% 03-Dec-2029 125,260 0.16
155,000 Carrier Global Corp ‘REGS’ 2.493% 15-Feb-2027 157,555 0.20 50,000 Carrier Global Corp ‘REGS’ 2.722% 15-Feb-2030 50,193 0.06 50,000 CCO Holdings LLC / CCO Holdings Capital Corp
4.500% 15-Aug-2030 50,825 0.06 79,000 CCO Holdings LLC / CCO Holdings Capital
Corp ‘REGS’ 4.500% 15-Aug-2030 80,304 0.10 40,000 Centene Corp 3.375% 15-Feb-2030 40,066 0.05 25,000 CenturyLink Inc ‘REGS’ 4.000% 15-Feb-2027 24,269 0.03 225,000 Cigna Corp 3.400% 15-Mar-2050 241,877 0.30 375,000 Citizens Bank NA/Providence RI ‘BKNT’
2.250% 28-Apr-2025 397,337 0.49 150,000 Comcast Corp 0.750% 20-Feb-2032 163,695 0.20 170,000 Comcast Corp 3.750% 01-Apr-2040 200,210 0.25 500,000 Consolidated Edison Co of New York Inc
3.950% 01-Apr-2050 597,743 0.74 55,000 Constellation Brands Inc 2.875% 01-May-2030 58,258 0.07 15,000 Constellation Brands Inc 3.750% 01-May-2050 16,453 0.02 200,000 Crown Americas LLC / Crown Americas
Capital Corp VI 4.750% 01-Feb-2026 204,112 0.25 175,000 Crown Castle International Corp
3.300% 01-Jul-2030 190,562 0.24 200,000 CVS Health Corp 3.750% 01-Apr-2030 229,223 0.28 150,000 CVS Health Corp 4.250% 01-Apr-2050 181,963 0.23 70,000 CVS Health Corp 5.050% 25-Mar-2048 91,130 0.11 100,000 CyrusOne LP / CyrusOne Finance Corp
1.450% 22-Jan-2027 107,963 0.13 100,000 Danaher Corp 2.500% 30-Mar-2030 129,031 0.16 200,000 Digital Dutch Finco BV 1.500% 15-Mar-2030 229,949 0.29 320,000 Dollar General Corp 3.500% 03-Apr-2030 360,829 0.45 115,000 Duke Energy Indiana LLC 2.750% 01-Apr-2050 117,153 0.15 120,000 Elanco Animal Health Inc 5.650% 28-Aug-2028 132,943 0.17 175,000 Enterprise Products Operating LLC
2.800% 31-Jan-2030 183,030 0.23 235,000 EQT Corp 3.000% 01-Oct-2022 221,282 0.28 375,000 Equinix Inc 5.375% 15-May-2027 409,892 0.51 180,000 Exelon Generation Co LLC 3.250% 01-Jun-2025 194,659 0.24 175,000 Exxon Mobil Corp 4.227% 19-Mar-2040 211,569 0.26 250,000 Exxon Mobil Corp 4.327% 19-Mar-2050 314,191 0.39 250,000 First Republic Bank/CA ‘BKNT’ FRN
1.912% 12-Feb-2024 256,500 0.32 40,000 FirstEnergy Corp 2.050% 01-Mar-2025 41,507 0.05 175,000 FirstEnergy Corp 2.650% 01-Mar-2030 182,111 0.23 425,000 Ford Credit Auto Lease Trust 2020-A ‘2020-A B’
2.050% 15-Jun-2023 425,139 0.53 225,000 General Electric Co FRN (Perpetual)
5.000% 21-Jan-2021 176,073 0.22 114,000 Genesis Energy LP / Genesis Energy Finance Corp
7.750% 01-Feb-2028 102,707 0.13 128,000 HCA Inc 3.500% 01-Sep-2030 122,793 0.15 200,000 Home Depot Inc/The 2.700% 15-Apr-2030 219,130 0.27 425,000 Home Depot Inc/The 3.350% 15-Apr-2050 485,113 0.60 350,000 John Deere Cash Management SA ‘EMTN’
2.200% 02-Apr-2032 445,690 0.55 150,000 JPMorgan Chase & Co FRN 2.956% 13-May-2031 158,290 0.20 500,000 JPMorgan Chase & Co FRN 4.493% 24-Mar-2031 610,789 0.76 225,000 KeyCorp ‘MTN’ 2.250% 06-Apr-2027 235,919 0.29 75,000 Kraft Heinz Foods Co 4.625% 30-Jan-2029 80,770 0.10 55,000 Kraft Heinz Foods Co ‘REGS’ 3.875% 15-May-2027 57,595 0.07 45,000 Kraft Heinz Foods Co ‘REGS’ 4.250% 01-Mar-2031 47,478 0.06
Bonds cont’d.
United States of America cont’d.
Bonds cont’d.
United States of America cont’d.
USDUSD
03613-1A.indd 266 19/08/2020 19:01

267
Schedule of investments – as at 30 June 2020
Holdings Description
Fair value
Total net assets
% Holdings Description
Fair value
Total net assets
%
BNy MELLON TARGETED RETURN BOND FUND
24,000 VICI Properties LP / VICI Note Co Inc ‘REGS’ 3.500% 15-Feb-2025 22,484 0.03
325,000 Visa Inc 1.900% 15-Apr-2027 339,533 0.42 85,000 Visa Inc 2.050% 15-Apr-2030 89,369 0.11 400,000 Walt Disney Co/The 4.700% 23-Mar-2050 523,837 0.65 60,000 Western Midstream Operating LP
3.100% 01-Feb-2025 56,776 0.07 350,000 Western Midstream Operating LP
4.050% 01-Feb-2030 334,602 0.42
Uruguay - 64,092 (31 December 2019: –) 64,092 0.08
55,000 Uruguay Government International Bond 4.375% 23-Jan-2031 64,092 0.08
Total investments in bonds 82,100,798 102.06
Credit default swaps - 8,449 (31 December 2019: –)
(825,000) CDS CDX North America Investment Grade Index Series 34 Version 1 1.000% 20-Jun-2025 8,449 0.01
Total credit default swaps 8,449 0.01
Holdings Description
Underlying exposure
USD
Fair value USD
Total net assets
%
Open futures contracts - 84,349 (31 December 2019: 208,229)
67 SFE 10 Year Australian Treasury Bond Long Futures Contracts Exp Sep-2020 6,827,648 78,333 0.10
(42) U.S. 2 Year Treasury Note Short Futures Contracts Exp Sep-2020 (9,274,125) 592 0.00
13 UK Long Gilt Long Futures Contracts Exp Sep-2020 2,198,299 5,424 0.00
Total open futures contracts 84,349 0.10 Unrealised gain on forward foreign currency contracts - 134,448 (see below) (31 December 2019: 365,972) 134,448 0.17
Total financial assets at fair value through profit or loss 82,328,044 102.34
Credit default swaps - (78,590) (31 December 2019: –)
(3,106,500) CDS CDX North America High Yield Index Series 34 Version 1 5.000% 20-Jun-2025 (48,595) (0.06)
(750,000) CDS iTraxx Europe Sub Financials Series 33 Version 1 1.000% 20-Jun-2025 (29,995) (0.04)
Total credit default swaps (78,590) (0.10)
Underlying exposure
USD
Open futures contracts - (454,525) (31 December 2019: (24,316))
(67) Euro-Bobl Short Futures Contracts Exp Sep-2020 (10,138,549) (45,060) (0.05)
(47) Euro-Bund Short Futures Contracts Exp Sep-2020 (9,307,917) (64,598) (0.08)
(12) Euro-Buxl 30 Year Bond Short Futures Contracts Exp Sep-2020 (2,970,746) (78,284) (0.10)
(89) U.S. 10 Year Treasury Note Short Futures Contracts Exp Sep-2020 (12,400,203) (40,065) (0.05)
(36) U.S. 10 Year Ultra Treasury Note Short Futures Contracts Exp Sep-2020 (5,678,437) (45,539) (0.06)
(26) U.S. 5 Year Treasury Note Short Futures Contracts Exp Sep-2020 (3,270,109) (8,551) (0.01)
(10) U.S. Treasury Bond Short Futures Contracts Exp Sep-2020 (1,790,313) (15,937) (0.02)
(44) U.S. Treasury Ultra Bond Short Futures Contracts Exp Sep-2020 (9,644,250) (156,491) (0.19)
Total open futures contracts (454,525) (0.56) Unrealised loss on forward foreign currency contracts - (3,103,223) (see below) (31 December 2019: (125,391)) (3,103,223) (3.86)
Total financial liabilities at fair value through profit or loss (3,636,338) (4.52)
Net current assets 1,749,622 2.18
Total net assets 80,441,328 100.00
* part of the holding is held as collateral by Bank of America Merrill Lynch in respect of futures contracts held by the Fund; and JpMorgan Chase Bank in respect of forward foreign currency contracts held by the Fund.
The counterparty for credit default swaps is Bank of America Merrill Lynch.The counterparty for futures contracts is Bank of America Merrill Lynch.
Analysis of portfolio % of Total Assets
Transferable securities and money market instruments admitted to official stock exchange listing or traded on a regulated market 96.33Financial derivative instruments dealt in on a regulated market 0.10oTC financial derivative instruments 0.17other current assets 3.40
Total assets 100.00
Bonds cont’d.
United States of America cont’d.
USDUSD
03613-1A.indd 267 19/08/2020 19:01
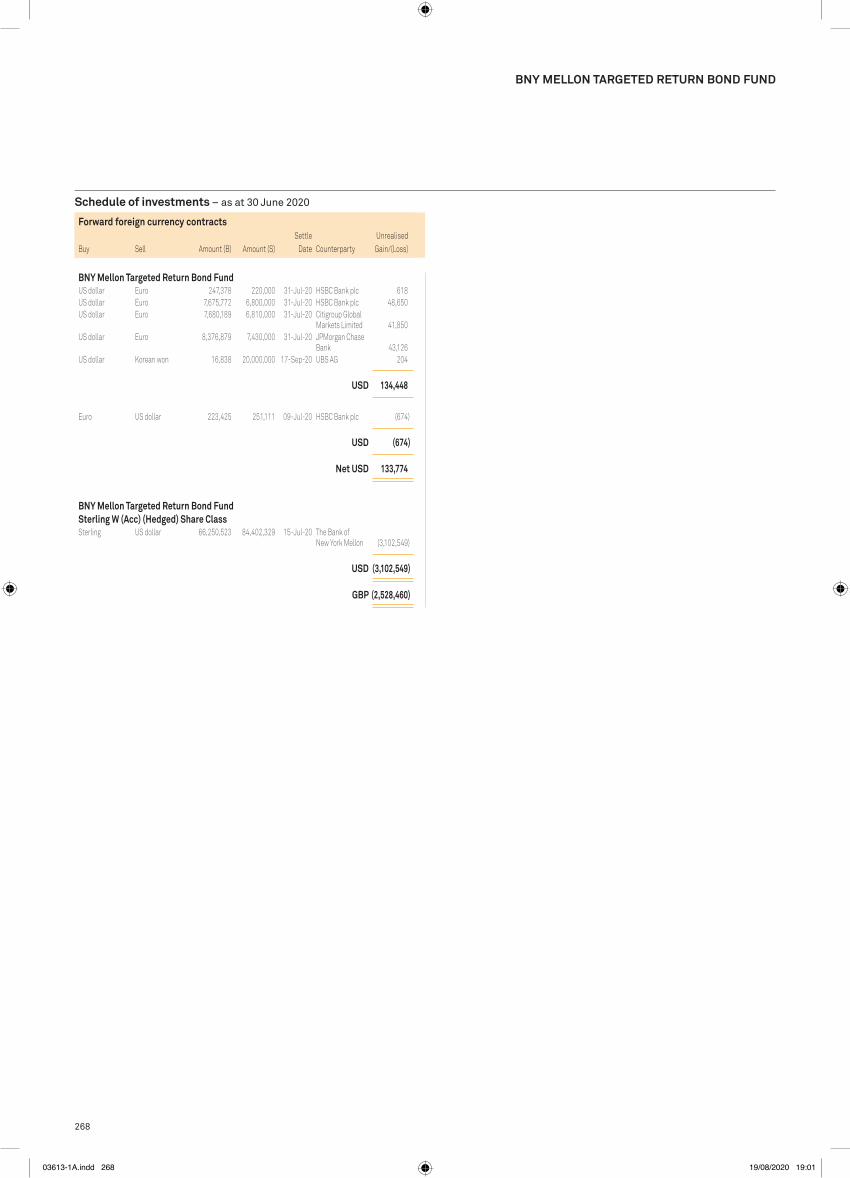
268
Schedule of investments – as at 30 June 2020
BNy MELLON TARGETED RETURN BOND FUND
Forward foreign currency contracts cont’d.Unrealised
Gain/(Loss)Buy Sell Amount (B) Amount (S)Settle
Date Counterparty
BNy Mellon Targeted Return Bond FundUS dollar Euro 247,378 220,000 31-Jul-20 HSBC Bank plc 618US dollar Euro 7,675,772 6,800,000 31-Jul-20 HSBC Bank plc 48,650US dollar Euro 7,680,189 6,810,000 31-Jul-20 Citigroup Global
Markets Limited 41,850US dollar Euro 8,376,879 7,430,000 31-Jul-20 JPMorgan Chase
Bank 43,126US dollar Korean won 16,838 20,000,000 17-Sep-20 UBS AG 204
USD 134,448
Euro US dollar 223,425 251,111 09-Jul-20 HSBC Bank plc (674)
USD (674)
Net USD 133,774
BNy Mellon Targeted Return Bond Fund Sterling W (Acc) (Hedged) Share ClassSterling US dollar 66,250,523 84,402,329 15-Jul-20 The Bank of
New York Mellon (3,102,549)
USD (3,102,549)
GBp (2,528,460)
03613-1A.indd 268 19/08/2020 19:01

269
Schedule of investments – as at 30 June 2020
Holdings Description
Fair value
Total net assets
% Holdings Description
Fair value
Total net assets
%
FUND 44 – BNy MELLON U.S. DyNAMIC VALUE FUND
BNY MELLON U.S. DYNAMIC VALUE FUND
17,810 Morgan Stanley 860,312 2.99 10,582 Mosaic Co/The 132,434 0.46 2,386 Newmont Corp 147,288 0.51 5,562 NextEra Energy Partners LP (Units) 285,136 0.99 794 Northrop Grumman Corp 244,103 0.85 3,132 Omnicom Group Inc 170,929 0.59 2,851 Otis Worldwide Corp 162,051 0.56 2,211 PepsiCo Inc 292,349 1.01 3,861 Philip Morris International Inc 270,270 0.94 6,319 Phillips 66 454,083 1.58 2,231 Pioneer Natural Resources Co 217,958 0.76 32,571 PPL Corp 841,472 2.92 2,329 Proofpoint Inc 258,601 0.90 2,795 PVH Corp 134,286 0.47 1,596 QUALCOMM Inc 145,539 0.50 8,191 Quanta Services Inc 321,292 1.11 3,284 Raytheon Technologies Corp 202,278 0.70 4,604 State Street Corp 292,722 1.02 2,575 Union Pacific Corp 435,020 1.51 11,703 Voya Financial Inc 546,179 1.90 4,868 Vulcan Materials Co 563,982 1.96 3,241 Western Digital Corp 143,025 0.50 6,485 Weyerhaeuser Co (REIT) 145,588 0.50 860 Zebra Technologies Corp 220,040 0.76
Total investments in equities 28,777,108 99.88
Total financial assets at fair value through profit or loss 28,777,108 99.88
Net current assets 35,875 0.12
Total net assets 28,812,983 100.00
Analysis of portfolio % of Total Assets
Transferable securities and money market instruments admitted to official stock exchange listing or traded on a regulated market 98.84other current assets 1.16
Total assets 100.00
Equities
Ireland - 2,066,351 (31 December 2019: 870,233) 2,066,351 7.17
6,457 Eaton Corp Plc 564,503 1.96 2,688 Horizon Therapeutics Plc 149,305 0.52 9,333 Medtronic Plc 854,949 2.97 2,442 Trane Technologies Plc 217,265 0.75 1,424 Willis Towers Watson Plc 280,329 0.97
Netherlands - 213,748 (31 December 2019: –) 213,748 0.74
1,874 NXP Semiconductors NV 213,748 0.74
Switzerland - 776,505 (31 December 2019: 420,587) 776,505 2.70
4,354 Alcon Inc 249,506 0.87 4,166 Chubb Ltd 526,999 1.83
United States of America - 25,720,504 (31 December 2019: 26,894,022) 25,720,504 89.27
5,523 AbbVie Inc 542,138 1.88 359 Alphabet Inc - Class A 509,031 1.77 4,394 American International Group Inc 136,983 0.48 1,203 Anthem Inc 316,028 1.10 814 Apple Inc 296,801 1.03 7,790 Applied Materials Inc 470,750 1.63 10,769 Archer-Daniels-Midland Co 429,522 1.49 4,011 Assurant Inc 414,477 1.44 12,066 Bank of America Corp 286,387 0.99 3,248 Becton Dickinson and Co 777,344 2.70 5,973 Berkshire Hathaway Inc - Class B 1,065,852 3.70 872 Biogen Inc 233,151 0.81 6,877 Bristol-Myers Squibb Co 404,196 1.40 4,002 Capital One Financial Corp 250,425 0.87 12,922 Carrier Global Corp 287,062 1.00 3,765 Centene Corp 239,360 0.83 21,346 CF Industries Holdings Inc 600,783 2.08 7,319 Charles Schwab Corp/The 246,906 0.86 8,025 Cisco Systems Inc 374,206 1.30 8,025 Citigroup Inc 410,037 1.42 6,816 ConocoPhillips 286,374 0.99 12,103 Corning Inc 313,528 1.09 3,265 Dolby Laboratories Inc - Class A 215,147 0.75 1,762 Eli Lilly and Co 288,968 1.00 55,418 Freeport-McMoRan Inc 640,909 2.22 12,681 General Motors Co 320,766 1.11 5,027 Goldman Sachs Group Inc/The 992,807 3.45 10,530 Hess Corp 545,401 1.89 861 Humana Inc 333,780 1.16 9,587 Ingersoll Rand Inc 269,634 0.94 13,618 Intel Corp 814,629 2.83 2,343 International Business Machines Corp 282,835 0.98 12,217 JPMorgan Chase & Co 1,148,276 3.98 1,737 L3Harris Technologies Inc 294,708 1.02 1,368 Laboratory Corp of America Holdings 227,314 0.79 8,797 Las Vegas Sands Corp 400,527 1.39 6,197 Lennar Corp 381,704 1.32 12,176 Louisiana-Pacific Corp 312,254 1.08 3,255 Lowe’s Cos Inc 439,637 1.53 5,224 LPL Financial Holdings Inc 409,666 1.42 12,082 Marathon Petroleum Corp 451,444 1.57 1,389 Microchip Technology Inc 146,283 0.51 2,775 Micron Technology Inc 142,899 0.50 5,530 Mondelez International Inc 282,638 0.98
Equities cont’d.
United States of America cont’d.
USDUSD
03613-1A.indd 269 19/08/2020 19:01

270
Schedule of investments – as at 30 June 2020
Holdings Description
Fair value
Total net assets
% Holdings Description
Fair value
Total net assets
%
Collective investment schemes
United States of America - 2,788,194 (31 December 2019: –) 2,788,194 1.03
9,036 SPDR S&P 500 ETF Trust - ETF 2,788,194 1.03
Total investments in collective investment schemes 2,788,194 1.03
Equities
Ireland - 17,942,281 (31 December 2019: 13,578,611) 17,942,281 6.64
83,131 Eaton Corp Plc 7,267,728 2.69 95,765 Medtronic Plc 8,772,553 3.25 21,378 Trane Technologies Plc 1,902,000 0.70
Switzerland - 4,940,331 (31 December 2019: 6,902,260) 4,940,331 1.83
39,054 Chubb Ltd 4,940,331 1.83
United Kingdom - 2,650,123 (31 December 2019: –) 2,650,123 0.98
166,204 Vodafone Group Plc ADR 2,650,123 0.98
United States of America - 230,002,540 (31 December 2019: 366,976,308) 230,002,540 85.09
127,105 AbbVie Inc 12,476,627 4.62 67,481 American International Group Inc 2,103,720 0.78 78,442 Applied Materials Inc 4,740,250 1.75 91,093 Archer-Daniels-Midland Co 3,633,244 1.34 36,862 Assurant Inc 3,809,135 1.41 90,442 AT&T Inc 2,730,896 1.01 401,156 Bank of America Corp 9,521,438 3.52 87,662 Bristol-Myers Squibb Co 5,152,334 1.91 116,378 Carrier Global Corp 2,585,337 0.96 333,607 CF Industries Holdings Inc 9,389,369 3.47 109,481 Cisco Systems Inc 5,105,099 1.89 146,878 Citigroup Inc 7,504,731 2.78 124,753 Clearway Energy Inc 2,875,557 1.06 113,719 ConocoPhillips 4,777,904 1.77 142,258 Corning Inc 3,685,193 1.36 66,478 CVS Health Corp 4,316,417 1.60 67,974 Dow Inc 2,769,601 1.02 193,031 General Motors Co 4,882,719 1.81 56,890 Goldman Sachs Group Inc/The 11,235,491 4.16 126,689 Hess Corp 6,561,857 2.43 125,126 Intel Corp 7,485,037 2.77 23,943 International Business Machines Corp 2,890,279 1.07 125,178 JPMorgan Chase & Co 11,765,480 4.35 23,195 L3Harris Technologies Inc 3,935,380 1.46 29,559 Lamar Advertising Co (REIT) - Class A 1,972,915 0.73 53,169 Las Vegas Sands Corp 2,420,785 0.89 231,925 Louisiana-Pacific Corp 5,947,717 2.20 29,152 Lowe’s Cos Inc 3,937,415 1.46 204,965 Marathon Petroleum Corp 7,658,517 2.83 30,806 Merck & Co Inc 2,381,612 0.88 234,930 Morgan Stanley 11,348,294 4.20 114,993 NextEra Energy Partners LP (Units) 5,895,116 2.18 57,493 Omnicom Group Inc 3,137,680 1.16 35,520 Otis Worldwide Corp 2,018,957 0.75 25,268 PepsiCo Inc 3,341,061 1.24 38,042 Philip Morris International Inc 2,662,940 0.98 69,434 Phillips 66 4,989,527 1.85 399,917 PPL Corp 10,331,856 3.82 24,037 QUALCOMM Inc 2,191,934 0.81
41,287 State Street Corp 2,625,027 0.97 28,630 Union Pacific Corp 4,836,752 1.79 260,954 US Bancorp 9,607,022 3.55 40,310 Vulcan Materials Co 4,670,115 1.73 93,283 Weyerhaeuser Co (REIT) 2,094,203 0.77
Total investments in equities 255,535,275 94.54
preferred bonds
United States of America - 6,526,048 (31 December 2019: 8,371,664) 6,526,048 2.41
122,394 Becton Dickinson and Co - Preferred Stock 6.000% 01-Jun-2023 6,526,048 2.41
Total investments in preferred bonds 6,526,048 2.41 Unrealised gain on forward foreign currency contracts - 7,518 (see below) (31 December 2019: 25,328) 7,518 0.00
Total financial assets at fair value through profit or loss 264,857,035 97.98 Unrealised loss on forward foreign currency contracts - (57,341) (see below) (31 December 2019: –) (57,341) (0.02)
Total financial liabilities at fair value through profit or loss (57,341) (0.02)
Net current assets 5,502,669 2.04
Total net assets 270,302,363 100.00
Analysis of portfolio % of Total Assets
Transferable securities and money market instruments admitted to official stock exchange listing or traded on a regulated market 97.13oTC financial derivative instruments 0.00other current assets 2.87
Total assets 100.00
FUND 45 – BNy MELLON U.S. EQUITy INCOME FUND
BNY MELLON U.S. EQUITY INCOME FUND
Equities cont’d.
United States of America cont’d.
USDUSD
03613-1A.indd 270 19/08/2020 19:01

271
Schedule of investments – as at 30 June 2020
BNy MELLON U.S. EQUITy INCOME FUND
Forward foreign currency contractsUnrealised
Gain/(Loss)Buy Sell Amount (B) Amount (S)Settle
Date Counterparty
BNy Mellon U.S. Equity Income Fund Sterling E (Inc) (Hedged) Share ClassUS dollar Sterling 39,539 31,814 15-Jul-20 The Bank of
New York Mellon 115US dollar Sterling 141,720 112,519 15-Jul-20 The Bank of
New York Mellon 2,285US dollar Sterling 156,372 124,186 15-Jul-20 The Bank of
New York Mellon 2,479US dollar Sterling 57,342 45,301 15-Jul-20 The Bank of
New York Mellon 1,205US dollar Sterling 47,204 37,014 15-Jul-20 The Bank of
New York Mellon 1,336US dollar Sterling 56,735 45,704 15-Jul-20 The Bank of
New York Mellon 98
USD 7,518
GBp 6,067
Sterling US dollar 50,342 63,148 15-Jul-20 The Bank of New York Mellon (764)
Sterling US dollar 36,149 45,443 15-Jul-20 The Bank of New York Mellon (647)
Sterling US dollar 1,759,196 2,235,952 15-Jul-20 The Bank of New York Mellon (55,930)
USD (57,341)
GBp (46,276)
Net USD (49,823)
Net GBp (40,209)
03613-1A.indd 271 19/08/2020 19:01

272
Schedule of investments – as at 30 June 2020
Holdings Description
Fair value
Total net assets
% Holdings Description
Fair value
Total net assets
%
Bonds Appropriation - 15,706,970
(31 December 2019: –) 15,706,970 3.13 2,110,000 New Jersey Economic Development Authority
3.620% 15-Jun-2028 2,070,891 0.41 3,500,000 Pasco County School Board 5.000% 01-Aug-2035 4,514,457 0.90 7,395,000 Providence Public Building Authority
5.000% 15-Sep-2039 9,121,622 1.82
Bond Bank - 8,564,412 (31 December 2019: 1,026,269) 8,564,412 1.70
1,000,000 Low Income Investment Fund 3.711% 01-Jul-2029 1,047,147 0.21 3,000,000 Michigan Finance Authority 2.366% 01-Sep-2049 2,976,450 0.59 4,500,000 Michigan Finance Authority 2.988% 01-Sep-2049 4,540,815 0.90
Dedicated Tax - 70,093,764 (31 December 2019: 65,204,135) 70,093,764 13.95
1,000,000 Atlanta & Fulton County Recreation Authority 3.379% 15-Dec-2027 1,087,880 0.22
950,000 Birmingham-Jefferson Civic Center Authority 3.375% 01-Jul-2022 972,919 0.19
1,500,000 Birmingham-Jefferson Civic Center Authority 3.550% 01-Jul-2023 1,556,662 0.31
1,555,000 Birmingham-Jefferson Civic Center Authority 3.700% 01-Jul-2024 1,635,168 0.33
1,330,000 Brentwood Infrastructure Financing Authority 3.478% 02-Sep-2025 1,452,307 0.29
1,000,000 City of Fort Worth TX 3.755% 01-Mar-2030 1,023,495 0.20 2,740,000 District of Columbia 4.996% 01-Dec-2026 3,291,329 0.66 5,000,000 Inland Valley Development Agency
5.500% 01-Mar-2033 5,592,850 1.11 1,000,000 Kentucky Economic Development Finance Authority
4.021% 01-Dec-2029 1,121,255 0.22 1,250,000 Kentucky Economic Development Finance Authority
4.121% 01-Dec-2030 1,391,494 0.28 1,840,000 Kentucky Economic Development Finance Authority
4.171% 01-Dec-2031 2,037,414 0.41 750,000 Maryland Economic Development Corp
4.580% 01-Jun-2033 810,810 0.16 1,000,000 Maryland Economic Development Corp
4.790% 01-Jun-2038 1,073,610 0.21 1,000,000 Maryland Economic Development Corp
5.050% 01-Jun-2043 1,071,945 0.21 1,000,000 Metropolitan Transportation Authority
5.989% 15-Nov-2030 1,275,805 0.25 2,825,000 Missouri Highway & Transportation Commission
5.445% 01-May-2033 3,722,531 0.74 1,000,000 New York City Transitional Finance Authority
Future Tax Secured Revenue 3.080% 01-Feb-2026 1,101,405 0.22
1,300,000 New York City Transitional Finance Authority Future Tax Secured Revenue 5.808% 01-Aug-2030 1,304,374 0.26
3,500,000 New York State Urban Development Corp 3.270% 15-Mar-2028 3,814,720 0.76
1,750,000 New York State Urban Development Corp 5.000% 15-Mar-2036 2,297,951 0.46
2,685,000 Pomona Redevelopment Agency Successor Agency 4.506% 01-Feb-2041 2,891,852 0.58
1,365,000 Riverside County Redevelopment Successor Agency 3.000% 01-Oct-2025 1,449,282 0.29
1,445,000 Riverside County Redevelopment Successor Agency 3.125% 01-Oct-2026 1,550,868 0.31
2,000,000 Sales Tax Securitization Corp 2.225% 01-Jan-2024 2,012,550 0.40 3,500,000 Sales Tax Securitization Corp 4.787% 01-Jan-2048 4,329,693 0.86 2,450,000 San Diego Redevelopment Agency Successor Agency
3.750% 01-Sep-2031 2,629,793 0.52 1,000,000 San Francisco City & County Redevelopment Agency
Successor Agency 3.250% 01-Aug-2029 1,041,655 0.21 3,750,000 San Jose Redevelopment Agency Successor Agency
3.250% 01-Aug-2029 4,143,600 0.82 1,000,000 State of Connecticut Special Tax Revenue
5.459% 01-Nov-2030 1,192,680 0.24 5,000,000 State of Illinois 3.750% 15-Jun-2032 4,629,150 0.92 5,675,000 Village Center Community Development District
4.756% 01-Nov-2029 6,586,717 1.31
Education - 69,225,257 (31 December 2019: 45,247,610) 69,225,257 13.78
500,000 Brazos Higher Education Authority Inc 1.789% 01-Apr-2022 504,920 0.10
750,000 Brazos Higher Education Authority Inc 1.870% 01-Apr-2023 762,840 0.15
500,000 Brazos Higher Education Authority Inc 1.931% 01-Apr-2024 511,882 0.10
1,370,000 California Educational Facilities Authority 3.414% 01-Apr-2031 1,494,540 0.30
1,635,000 California Educational Facilities Authority 3.431% 01-Apr-2030 1,746,589 0.35
2,500,000 Delaware County Authority 5.000% 01-Jul-2042 2,601,050 0.52 2,500,000 Florida Higher Educational Facilities Financial
Authority 5.000% 01-Mar-2037 2,676,912 0.53 8,500,000 Illinois Finance Authority 4.000% 01-Apr-2050 9,812,953 1.95 1,000,000 Illinois Finance Authority 5.450% 01-Aug-2038 1,077,160 0.21 1,000,000 Kent State University 2.797% 01-May-2032 1,019,270 0.20 1,000,000 Kentucky Higher Education Student Loan Corp
3.860% 01-Jun-2025 1,107,245 0.22 1,000,000 Kentucky Higher Education Student Loan Corp
3.942% 01-Jun-2026 1,127,990 0.23 2,075,000 Louisiana Public Facilities Authority
5.000% 01-Jul-2042 2,282,469 0.45 2,730,000 Massachusetts Educational Financing Authority
3.455% 01-Jul-2028 2,993,527 0.60 2,110,000 Massachusetts Educational Financing Authority
3.505% 01-Jul-2029 2,317,751 0.46 1,250,000 Metropolitan Government Nashville
& Davidson County Health & Educational Facs Bd 4.409% 01-Oct-2034 1,346,513 0.27
5,500,000 New Jersey Educational Facilities Authority 3.736% 01-Sep-2030 5,570,757 1.11
1,430,000 New Jersey Higher Education Student Assistance Authority 3.350% 01-Dec-2029 1,473,429 0.29
3,370,000 New York State Dormitory Authority 4.850% 01-Jul-2048 3,877,792 0.77
775,000 Northern Illinois University 4.000% 01-Apr-2037 845,444 0.17 1,250,000 Northern Illinois University 4.000% 01-Apr-2039 1,355,025 0.27 2,870,000 Onondaga Civic Development Corp
5.000% 01-Dec-2029 3,875,289 0.77 2,000,000 Red River Education Finance Corp
2.802% 15-Mar-2033 2,168,230 0.43
FUND 46 – BNy MELLON U.S. MUNICIpAL INFRASTRUCTURE DEBT FUND
BNY MELLON U.S. MUNICIPAL INFRASTRUCTURE DEBT FUND
Bonds cont’d.
Dedicated Tax cont’d.
USDUSD
03613-1A.indd 272 19/08/2020 19:01

273
Schedule of investments – as at 30 June 2020
Holdings Description
Fair value
Total net assets
% Holdings Description
Fair value
Total net assets
%
BNy MELLON U.S. MUNICIpAL INFRASTRUCTURE DEBT FUND
500,000 Industrial Development Authority of the City of Phoenix/The 4.125% 01-Jul-2023 528,367 0.10
2,340,000 New York City Housing Development Corp 4.249% 01-May-2030 2,720,484 0.54
Leasing - 11,303,901 (31 December 2019: 16,424,220) 11,303,901 2.25
5,000,000 Commonwealth Financing Authority 4.014% 01-Jun-2033 5,994,500 1.19
1,840,000 New Jersey Transportation Trust Fund Authority 5.754% 15-Dec-2028 2,006,566 0.40
3,000,000 Oklahoma City Economic Development Trust 3.313% 01-Aug-2027 3,302,835 0.66
Local Government - 46,050,442 (31 December 2019: 39,707,540) 46,050,442 9.16
3,000,000 City of New Haven CT 4.834% 01-Aug-2033 3,501,840 0.70 1,000,000 City of New Haven CT 5.000% 01-Aug-2031 1,202,445 0.24 2,380,000 City of New York NY 3.450% 01-Dec-2027 2,620,511 0.52 1,665,000 City of New York NY 3.750% 01-Jun-2028 1,818,621 0.36 4,475,000 City of New York NY 6.646% 01-Dec-2031 4,586,808 0.91 2,500,000 City of Philadelphia PA 2.864% 15-Jul-2031 2,622,200 0.52 6,500,000 Clackamas County School District No 12 North
Clackamas 0.000% 15-Jun-2039 3,282,370 0.65 1,000,000 Clark County School District
5.000% 15-Jun-2035 1,284,105 0.26 5,450,000 Contra Costa Community College District
2.926% 01-Aug-2038 5,550,226 1.11 1,000,000 County of Cook IL 5.000% 15-Nov-2033 1,042,335 0.21 2,500,000 County of Tulare CA 3.859% 01-Jun-2026 2,740,313 0.55 1,000,000 Detroit City School District 6.645% 01-May-2029 1,325,635 0.26 1,750,000 School District of Philadelphia/The
4.000% 01-Sep-2038 2,008,877 0.40 3,270,000 Sycamore Community City School District
4.000% 01-Dec-2028 4,049,290 0.81 4,080,000 Sycamore Community City School District
4.000% 01-Dec-2029 5,079,151 1.01 3,000,000 Town of Hamden CT 3.881% 15-Aug-2026 3,335,715 0.66
Nonprofit Corporation - 2,686,330 (31 December 2019: 2,495,622) 2,686,330 0.53
2,500,000 Conservation Fund A Nonprofit Corp/The 3.474% 15-Dec-2029 2,686,330 0.53
power - 12,727,581 (31 December 2019: 15,070,335) 12,727,581 2.53
1,500,000 American Municipal Power Inc 6.973% 15-Feb-2024 1,778,002 0.35
1,100,000 American Municipal Power Inc 7.334% 15-Feb-2028 1,420,458 0.28
3,500,000 City of Austin TX Electric Utility Revenue 2.837% 15-Nov-2027 3,915,327 0.78
1,000,000 Municipal Electric Authority of Georgia 4.430% 01-Jan-2022 1,040,190 0.21
1,935,000 South Carolina Public Service Authority 5.125% 01-Dec-2043 2,117,219 0.42
1,000,000 South Carolina Public Service Authority 5.784% 01-Dec-2041 1,358,055 0.27
1,000,000 Southern California Public Power Authority 4.208% 01-Jul-2028 1,098,330 0.22
1,775,000 Red River Education Finance Corp 2.892% 15-Mar-2034 1,919,458 0.38
4,185,000 Salvation Army/United States 3.801% 01-Sep-2027 4,730,852 0.94 1,100,000 University of California 3.063% 01-Jul-2025 1,207,112 0.24 2,000,000 University of California 3.349% 01-Jul-2029 2,294,210 0.46 1,000,000 University of Oklahoma/The 3.466% 01-Jul-2028 1,103,150 0.22 2,515,000 University of Pittsburgh-of the Commonwealth
System of Higher Education 3.646% 15-Sep-2036 2,809,129 0.56 2,500,000 University of Southern California
3.226% 01-Oct-2120 2,611,768 0.52
Healthcare - 75,963,804 (31 December 2019: 78,014,814) 75,963,804 15.12
2,750,000 Adventist Health System/West 2.433% 01-Sep-2024 2,857,916 0.57
4,500,000 Adventist Health System/West 2.952% 01-Mar-2029 4,654,708 0.93
1,500,000 Advocate Health & Hospitals Corp 3.829% 15-Aug-2028 1,702,278 0.34
5,000,000 City of Chillicothe OH 5.000% 01-Dec-2047 5,714,725 1.14 5,000,000 City Of South Miami Health Facilities
Authority Inc 5.000% 15-Aug-2047 5,788,550 1.15 400,000 City of Tampa FL 4.000% 01-Jul-2038 452,720 0.09 2,270,000 Development Authority for Fulton County
5.000% 01-Apr-2047 2,548,597 0.51 1,000,000 Dignity Health 3.125% 01-Nov-2022 1,034,769 0.21 3,500,000 Geisinger Authority 5.000% 01-Apr-2043 4,278,050 0.85 3,775,000 Illinois Finance Authority 5.000% 15-Nov-2045 4,225,414 0.84 1,000,000 Louisiana Public Facilities Authority
5.000% 15-May-2046 1,129,210 0.22 1,430,000 Massachusetts Development Finance Agency
3.995% 01-Jun-2024 1,482,953 0.30 4,740,000 Massachusetts Development Finance Agency
4.740% 01-Jul-2038 5,274,909 1.05 4,000,000 Mercy Health/OH 4.302% 01-Jul-2028 4,531,724 0.90 2,000,000 Monroe County Hospital Authority/PA
5.000% 01-Jul-2041 2,299,380 0.46 1,185,000 Montana Facility Finance Authority
4.368% 15-Aug-2038 1,421,135 0.28 2,500,000 Montefiore Obligated Group
4.287% 01-Sep-2050 2,486,229 0.49 2,000,000 New Hampshire Health and Education Facilities
Authority Act 5.000% 01-Jul-2044 2,226,190 0.44 5,925,000 Oklahoma Development Finance Authority
5.450% 15-Aug-2028 6,945,729 1.38 2,000,000 Providence St Joseph Health Obligated Group
2.532% 01-Oct-2029 2,087,947 0.42 3,075,000 SSM Health Care Corp 3.688% 01-Jun-2023 3,304,252 0.66 6,360,000 SSM Health Care Corp 3.823% 01-Jun-2027 7,190,099 1.43 2,000,000 Washington Health Care Facilities Authority
5.000% 01-Jul-2042 2,326,320 0.46
Housing - 12,765,371 (31 December 2019: 12,445,626) 12,765,371 2.54
1,137,237 Arizona Industrial Development Authority ‘2019-2 A’ 3.625% 20-May-2033 1,183,625 0.24
2,000,000 California Housing Finance 3.656% 01-Feb-2029 2,158,400 0.43 4,000,000 Chicago Housing Authority 4.322% 01-Jan-2033 4,689,120 0.93 1,460,000 Industrial Development Authority of the City
of Phoenix/The 3.790% 01-Jul-2021 1,485,375 0.30
Bonds cont’d.
Education cont’d.
Bonds cont’d.
Housing cont’d.
USDUSD
03613-1A.indd 273 19/08/2020 19:01

274
Schedule of investments – as at 30 June 2020
Holdings Description
Fair value
Total net assets
% Holdings Description
Fair value
Total net assets
%
BNy MELLON U.S. MUNICIpAL INFRASTRUCTURE DEBT FUND
1,000,000 County of Miami-Dade FL Aviation Revenue 3.354% 01-Oct-2029 997,175 0.20
4,400,000 County of Miami-Dade FL Aviation Revenue 3.505% 01-Oct-2025 4,617,734 0.92
2,500,000 Grand Parkway Transportation Corp 4.000% 01-Oct-2049 2,888,163 0.57
2,470,000 Illinois State Toll Highway Authority 5.000% 01-Jan-2031 3,180,730 0.63
2,000,000 Kenton County Airport Board 4.689% 01-Jan-2049 2,140,650 0.43
1,750,000 Maryland Economic Development Corp 4.750% 01-Jun-2042 1,877,138 0.37
3,500,000 Metropolitan Washington Airports Authority Dulles Toll Road Revenue 4.000% 01-Oct-2049 3,777,917 0.75
1,000,000 New Jersey Turnpike Authority 7.414% 01-Jan-2040 1,698,735 0.34
3,000,000 New York State Thruway Authority 2.900% 01-Jan-2035 3,227,925 0.64
5,000,000 New York State Thruway Authority 4.000% 01-Jan-2045 5,659,250 1.13
2,500,000 New York Transportation Development Corp 5.250% 01-Jan-2050 2,711,988 0.54
4,500,000 Pennsylvania Turnpike Commission 2.890% 01-Dec-2035 4,558,230 0.91
8,245,000 Pennsylvania Turnpike Commission 3.043% 01-Dec-2033 8,554,971 1.70
9,000,000 Pennsylvania Turnpike Commission 3.416% 01-Dec-2041 9,659,565 1.92
2,385,000 Pennsylvania Turnpike Commission 5.000% 01-Jun-2042 2,738,696 0.54
1,500,000 Port Authority of New York & New Jersey 4.823% 01-Jun-2045 1,687,688 0.34
1,295,000 Port Authority of New York & New Jersey 5.310% 01-Aug-2046 1,435,352 0.29
1,080,000 Port of Corpus Christi Authority of Nueces County 3.699% 01-Dec-2026 1,205,501 0.24
1,135,000 Port of Corpus Christi Authority of Nueces County 3.799% 01-Dec-2028 1,297,174 0.26
1,250,000 State of Connecticut Bradley International Airport CFC Revenue 3.174% 01-Jul-2026 1,233,494 0.24
750,000 State of Connecticut Bradley International Airport CFC Revenue 3.431% 01-Jul-2028 738,412 0.15
2,290,000 State of Ohio 5.000% 31-Dec-2039 2,585,616 0.51 5,600,000 Susquehanna Area Regional Airport Authority
5.000% 01-Jan-2038 5,929,196 1.18 3,000,000 Virginia Small Business Financing Authority
5.000% 31-Dec-2052 3,318,210 0.66
Water - 24,559,969 (31 December 2019: 49,024,331) 24,559,969 4.89
1,650,000 City & County Honolulu HI Wastewater System Revenue 2.316% 01-Jul-2025 1,728,441 0.35
1,000,000 City of Chicago IL Wastewater Transmission Revenue 5.000% 01-Jan-2039 1,094,265 0.22
5,800,000 City of Houston TX Combined Utility System Revenue 2.984% 15-Nov-2042 6,040,178 1.20
5,000,000 County of Miami-Dade FL Water & Sewer System Revenue 2.911% 01-Oct-2032 5,276,125 1.05
prepaid Gas - 7,860,467 (31 December 2019: –) 7,860,467 1.56
3,470,000 Black Belt Energy Gas District 4.000% 01-Oct-2049 4,005,681 0.80
1,160,000 Kentucky Public Energy Authority 4.000% 01-Dec-2050 1,310,516 0.26
2,245,000 Tennessee Energy Acquisition Corp 4.000% 01-Nov-2049 2,544,270 0.50
pre-refunded - 10,379,296 (31 December 2019: 5,072,621) 10,379,296 2.07
4,620,000 City of Chicago IL 7.045% 01-Jan-2029 4,848,251 0.97 5,405,000 New Jersey Transportation Trust Fund Authority
6.104% 15-Dec-2028 5,531,045 1.10
Retirement - 8,772,476 (31 December 2019: 9,642,912) 8,772,476 1.75
265,000 Berks County Industrial Development Authority 3.200% 15-May-2021 265,974 0.05
725,000 Berks County Industrial Development Authority 3.950% 15-May-2024 746,500 0.15
1,000,000 Montgomery County Industrial Development Authority/PA 5.000% 15-Nov-2036 1,133,110 0.23
1,000,000 North Carolina Medical Care Commission 5.000% 01-Oct-2042 1,019,265 0.20
1,000,000 North Carolina Medical Care Commission 5.000% 01-Oct-2047 1,013,850 0.20
1,000,000 Sarasota County Health Facilities Authority 5.000% 01-Jan-2037 1,025,070 0.21
1,000,000 Sarasota County Health Facilities Authority 5.000% 01-Jan-2042 1,016,070 0.20
2,500,000 St Louis County Industrial Development Authority 5.000% 01-Sep-2048 2,552,637 0.51
State Government - 7,064,625 (31 December 2019: 1,175,663) 7,064,625 1.41
5,000,000 State of California 5.250% 01-Aug-2032 7,064,625 1.41
Transportation - 115,086,442 (31 December 2019: 89,511,540) 115,086,442 22.90
10,000,000 Central Texas Turnpike System 3.029% 15-Aug-2041 9,561,800 1.90
1,250,000 Chicago Midway International Airport 3.655% 01-Jan-2025 1,339,019 0.27
1,500,000 Chicago Midway International Airport 3.697% 01-Jan-2026 1,628,850 0.32
1,200,000 Chicago Midway International Airport 3.747% 01-Jan-2027 1,317,702 0.26
900,000 Chicago Midway International Airport 3.797% 01-Jan-2028 986,949 0.20
5,000,000 Chicago O’Hare International Airport 4.472% 01-Jan-2049 6,509,975 1.30
1,500,000 City & County of Denver CO Airport System Revenue 5.000% 01-Dec-2036 2,046,900 0.41
1,500,000 City of Phoenix Civic Improvement Corp 5.000% 01-Jul-2029 1,919,497 0.38
2,000,000 Colorado High Performance Transportation Enterprise 5.000% 31-Dec-2047 2,143,940 0.43
10,000,000 County of Broward FL Airport System Revenue 2.384% 01-Oct-2026 9,912,300 1.97
Bonds cont’d.
Transportation cont’d.
Bonds cont’d.
USDUSD
03613-1A.indd 274 19/08/2020 19:01

275
Schedule of investments – as at 30 June 2020
Holdings Description
Fair value
Total net assets
% Holdings Description
Fair value
Total net assets
%
BNy MELLON U.S. MUNICIpAL INFRASTRUCTURE DEBT FUND
Bonds cont’d.
Water cont’d. 3,000,000 Irvine Ranch Water District
6.622% 01-May-2040 4,691,430 0.93 1,810,000 Metropolitan Water Reclamation District
of Greater Chicago 5.720% 01-Dec-2038 2,621,487 0.52 2,250,000 Ohio Water Development Authority
4.817% 01-Dec-2030 2,750,805 0.55 330,000 State of California Department of Water Resources
3.127% 01-Dec-2029 357,238 0.07
Total investments in bonds 498,811,107 99.27
Unrealised gain on forward foreign currency contracts - 77,682 (see below) (31 December 2019: 2,551,284) 77,682 0.02
Total financial assets at fair value through profit or loss 498,888,789 99.29
Unrealised loss on forward foreign currency contracts - (1,998,832) (see below) (31 December 2019: (116,353)) (1,998,832) (0.40)
Total financial liabilities at fair value through profit or loss (1,998,832) (0.40)
Net current assets 5,566,377 1.11
Total net assets 502,456,334 100.00
Analysis of portfolio % of Total Assets
Transferable securities and money market instruments admitted to official stock exchange listing or traded on a regulated market 98.83oTC financial derivative instruments 0.02other current assets 1.15
Total assets 100.00
USDUSD
Forward foreign currency contracts cont’d.Unrealised
Gain/(Loss)Buy Sell Amount (B) Amount (S)Settle
Date Counterparty
BNy Mellon U.S. Municipal Infrastructure Debt Fund CHF E (Acc) (Hedged) Share ClassSwiss franc US dollar 3,519,984 3,709,286 15-Jul-20 The Bank of
New York Mellon 7,454
USD 7,454
CHF 7,062
BNy Mellon U.S. Municipal Infrastructure Debt Fund CHF W (Acc) (Hedged) Share ClassSwiss franc US dollar 19,520,126 20,569,906 15-Jul-20 The Bank of
New York Mellon 41,339
USD 41,339
CHF 39,167
BNy Mellon U.S. Municipal Infrastructure Debt Fund CHF W (Inc) (Hedged) Share ClassSwiss franc US dollar 6,762,512 7,126,195 15-Jul-20 The Bank of
New York Mellon 14,321
USD 14,321
CHF 13,568
BNy Mellon U.S. Municipal Infrastructure Debt Fund EUR E (Acc) (Hedged) Share ClassEuro US dollar 783,720 877,148 15-Jul-20 The Bank of
New York Mellon 3,628
USD 3,628
EUR 3,229
Euro US dollar 7,926,525 9,004,781 15-Jul-20 The Bank of New York Mellon (96,634)
USD (96,634)
EUR (86,012)
Net USD (93,006)
Net EUR (82,783)
BNy Mellon U.S. Municipal Infrastructure Debt Fund EUR E (Inc) (Hedged) Share ClassEuro US dollar 166,526 186,691 15-Jul-20 The Bank of
New York Mellon 458
USD 458
EUR 408
03613-1A.indd 275 19/08/2020 19:01

276
Schedule of investments – as at 30 June 2020
BNy MELLON U.S. MUNICIpAL INFRASTRUCTURE DEBT FUND
Forward foreign currency contracts cont’d.Unrealised
Gain/(Loss)Buy Sell Amount (B) Amount (S)Settle
Date Counterparty
BNy Mellon U.S. Municipal Infrastructure Debt Fund EUR E (Inc) (Hedged) Share Class cont’d.Euro US dollar 8,099,537 9,201,329 15-Jul-20 The Bank of
New York Mellon (98,743)
USD (98,743)
EUR (87,889)
Net USD (98,285)
Net EUR (87,481)
BNy Mellon U.S. Municipal Infrastructure Debt Fund EUR H (Acc) (Hedged) Share ClassEuro US dollar 3,687 4,140 15-Jul-20 The Bank of
New York Mellon 4US dollar Euro 186,351 163,489 15-Jul-20 The Bank of
New York Mellon 2,615
USD 2,619
EUR 2,331
Euro US dollar 343,268 389,963 15-Jul-20 The Bank of New York Mellon (4,185)
USD (4,185)
EUR (3,725)
Net USD (1,566)
Net EUR (1,394)
BNy Mellon U.S. Municipal Infrastructure Debt Fund EUR H (Inc) (Hedged) Share ClassEuro US dollar 500 563 15-Jul-20 The Bank of
New York Mellon (1)Euro US dollar 100 113 15-Jul-20 The Bank of
New York Mellon (1)Euro US dollar 132,391 150,401 15-Jul-20 The Bank of
New York Mellon (1,614)
USD (1,616)
EUR (1,438)
BNy Mellon U.S. Municipal Infrastructure Debt Fund EUR W (Acc) (Hedged) Share ClassEuro US dollar 125,485 140,860 15-Jul-20 The Bank of
New York Mellon 165
USD 165
EUR 147
Forward foreign currency contracts cont’d.Unrealised
Gain/(Loss)Buy Sell Amount (B) Amount (S)Settle
Date Counterparty
BNy Mellon U.S. Municipal Infrastructure Debt Fund EUR W (Acc) (Hedged) Share Class cont’d.Euro US dollar 61,866 69,639 15-Jul-20 The Bank of
New York Mellon (111)Euro US dollar 10,816,003 12,287,319 15-Jul-20 The Bank of
New York Mellon (131,860)
USD (131,971)
EUR (117,464)
Net USD (131,806)
Net EUR (117,317)
BNy Mellon U.S. Municipal Infrastructure Debt Fund EUR W (Inc) (Hedged) Share ClassEuro US dollar 2,801,490 3,140,729 15-Jul-20 The Bank of
New York Mellon 7,698
USD 7,698
EUR 6,852
Euro US dollar 136,630,061 155,216,036 15-Jul-20 The Bank of New York Mellon (1,665,683)
USD (1,665,683)
EUR (1,482,583)
Net USD (1,657,985)
Net EUR (1,475,731)
03613-1A.indd 276 19/08/2020 19:01

277
03613-1A.indd 277 19/08/2020 19:01

For the financial period ended 30 June 2020
278
Statement oF ComprehenSive inCome
BNY Mellon Absolute
Return Bond Fund
BNY Mellon Absolute
Return Equity
Fund
BNY Mellon Absolute
Return Global Convertible
Fund
BNY Mellon Asia
Rising Stars Fund
BNY Mellon Asian
Equity Fund
BNY Mellon Asian
Income Fund
BNY Mellon Brazil
Equity Fund
BNY Mellon Digital Assets
Fund
BNY Mellon Dynamic
Total Return
Fund
BNY Mellon Dynamic
U.S. Equity
Fund
BNY Mellon Efficient Global IG
Corporate Beta
Fund*
BNY Mellon Efficient
U.S. High Yield
Beta Fund
BNY Mellon Emerging
Markets Corporate
Debt Fund
Notes EUR GBP EUR USD USD USD USD USD USD USD USD USD USD
IncomeBank interest income 4,017 3,389 579 225 3,866 5,173 5,025 88 923 9,803 9 5,453 1,712Dividend income – 2,474,896 96,740 108,338 146,788 629,606 690,885 95,202 28,684 2,432,853 – 115,354 107,241Securities lending income 13 13,155 8,811 – 6,870 8,609 – – – 103 4,156 – 47,924 39,444net gains/(losses) on financial assets/liabilities at fair value through profit or loss
net realised gains/(losses) on financial assets/liabilities held at fair value through profit or loss (14,593,490) 18,292,451 243,427 215,640 1,604,619 27,783 (3,790,579) 107,531 (1,554,532) 1,393,683 437,902 (62,650,399) 2,036,567net change in unrealised gains/(losses) on financial assets/liabilities held at fair value through profit or loss (1,622,464) (4,702,940) 317,728 (933,735) 510,359 (6,033,056) (33,850,605) 246,674 165,210 800,593 609,086 (25,834,052) (20,359,868)
Total income (16,198,782) 16,076,607 658,474 (602,662) 2,274,241 (5,370,494) (36,945,274) 449,495 (1,359,612) 4,641,088 1,046,997 (88,315,720) (18,174,904)
Expensesmanagement fee 3 594,379 1,100,124 81,913 33,171 321,598 110,039 526,992 49,570 90,956 460,664 12,278 311,032 940,821performance fee 3 831 – 44,846 – – – – – – – – – –Depositary fee 5 145,916 65,477 12,434 13,860 46,907 51,408 127,369 11,603 10,137 36,270 9,127 75,907 47,364operating expenses 7 108,244 144,413 16,593 18,428 34,283 14,470 49,762 14,002 12,009 118,310 13,391 287,619 159,606Dividend expense – 1,929,945 33,263 – – – – – – – – – –Finance charges on swaps – 416,421 135,989 – – – – – – – – – –rebate due (from)/to the manager 6 – – (11,106) (11,938) – (52,770) – (18,958) – (29,445) (8,089) (90,185) –
Total expenses 849,370 3,656,380 313,932 53,521 402,788 123,147 704,123 56,217 113,102 585,799 26,707 584,373 1,147,791
Net income/(expense) (17,048,152) 12,420,227 344,542 (656,183) 1,871,453 (5,493,641) (37,649,397) 393,278 (1,472,714) 4,055,289 1,020,290 (88,900,093) (19,322,695)
Finance costsBank interest 41,831 2,271 7,721 – 27 12 3,304 53 59 165 151 789 14,024Distributions 888,329 460,734 – 68,125 – 377,724 189,073 78,793 303,463 1,754,527 21,092 17,667,812 4,389,206
Profit/(loss) for the financial period (17,978,312) 11,957,222 336,821 (724,308) 1,871,426 (5,871,377) (37,841,774) 314,432 (1,776,236) 2,300,597 999,047 (106,568,694) (23,725,925)
Withholding taxes on dividends and other investment income (119,458) 241,948 88 (11,831) (13,114) (55,928) 1,940,808 (24,781) (8,071) (686,384) (2,890) (63,812) (45,496)
Increase/(decrease) in net assets attributable to redeemable participating shareholders from operations (18,097,770) 12,199,170 336,909 (736,139) 1,858,312 (5,927,305) (35,900,966) 289,651 (1,784,307) 1,614,213 996,157 (106,632,506) (23,771,421)
Gains and losses arise solely from continuing operations.There were no gains or losses other than those dealt with in the Statement of Comprehensive Income.
* Please refer to Note 18 of the financial statements.
The accompanying notes form an integral part of these financial statements.
03613-1B.indd 278 19/08/2020 19:04

For the financial period ended 30 June 2020 (cont’d.)
279
BNY MelloN GloBal FuNds, plc
Statement oF ComprehenSive inCome
BNY Mellon Absolute
Return Bond Fund
BNY Mellon Absolute
Return Equity
Fund
BNY Mellon Absolute
Return Global Convertible
Fund
BNY Mellon Asia
Rising Stars Fund
BNY Mellon Asian
Equity Fund
BNY Mellon Asian
Income Fund
BNY Mellon Brazil
Equity Fund
BNY Mellon Digital Assets
Fund
BNY Mellon Dynamic
Total Return
Fund
BNY Mellon Dynamic
U.S. Equity
Fund
BNY Mellon Efficient Global IG
Corporate Beta
Fund*
BNY Mellon Efficient
U.S. High Yield
Beta Fund
BNY Mellon Emerging
Markets Corporate
Debt Fund
Notes EUR GBP EUR USD USD USD USD USD USD USD USD USD USD
IncomeBank interest income 4,017 3,389 579 225 3,866 5,173 5,025 88 923 9,803 9 5,453 1,712Dividend income – 2,474,896 96,740 108,338 146,788 629,606 690,885 95,202 28,684 2,432,853 – 115,354 107,241Securities lending income 13 13,155 8,811 – 6,870 8,609 – – – 103 4,156 – 47,924 39,444net gains/(losses) on financial assets/liabilities at fair value through profit or loss
net realised gains/(losses) on financial assets/liabilities held at fair value through profit or loss (14,593,490) 18,292,451 243,427 215,640 1,604,619 27,783 (3,790,579) 107,531 (1,554,532) 1,393,683 437,902 (62,650,399) 2,036,567net change in unrealised gains/(losses) on financial assets/liabilities held at fair value through profit or loss (1,622,464) (4,702,940) 317,728 (933,735) 510,359 (6,033,056) (33,850,605) 246,674 165,210 800,593 609,086 (25,834,052) (20,359,868)
Total income (16,198,782) 16,076,607 658,474 (602,662) 2,274,241 (5,370,494) (36,945,274) 449,495 (1,359,612) 4,641,088 1,046,997 (88,315,720) (18,174,904)
Expensesmanagement fee 3 594,379 1,100,124 81,913 33,171 321,598 110,039 526,992 49,570 90,956 460,664 12,278 311,032 940,821performance fee 3 831 – 44,846 – – – – – – – – – –Depositary fee 5 145,916 65,477 12,434 13,860 46,907 51,408 127,369 11,603 10,137 36,270 9,127 75,907 47,364operating expenses 7 108,244 144,413 16,593 18,428 34,283 14,470 49,762 14,002 12,009 118,310 13,391 287,619 159,606Dividend expense – 1,929,945 33,263 – – – – – – – – – –Finance charges on swaps – 416,421 135,989 – – – – – – – – – –rebate due (from)/to the manager 6 – – (11,106) (11,938) – (52,770) – (18,958) – (29,445) (8,089) (90,185) –
Total expenses 849,370 3,656,380 313,932 53,521 402,788 123,147 704,123 56,217 113,102 585,799 26,707 584,373 1,147,791
Net income/(expense) (17,048,152) 12,420,227 344,542 (656,183) 1,871,453 (5,493,641) (37,649,397) 393,278 (1,472,714) 4,055,289 1,020,290 (88,900,093) (19,322,695)
Finance costsBank interest 41,831 2,271 7,721 – 27 12 3,304 53 59 165 151 789 14,024Distributions 888,329 460,734 – 68,125 – 377,724 189,073 78,793 303,463 1,754,527 21,092 17,667,812 4,389,206
Profit/(loss) for the financial period (17,978,312) 11,957,222 336,821 (724,308) 1,871,426 (5,871,377) (37,841,774) 314,432 (1,776,236) 2,300,597 999,047 (106,568,694) (23,725,925)
Withholding taxes on dividends and other investment income (119,458) 241,948 88 (11,831) (13,114) (55,928) 1,940,808 (24,781) (8,071) (686,384) (2,890) (63,812) (45,496)
Increase/(decrease) in net assets attributable to redeemable participating shareholders from operations (18,097,770) 12,199,170 336,909 (736,139) 1,858,312 (5,927,305) (35,900,966) 289,651 (1,784,307) 1,614,213 996,157 (106,632,506) (23,771,421)
Gains and losses arise solely from continuing operations.There were no gains or losses other than those dealt with in the Statement of Comprehensive Income.
* Please refer to Note 18 of the financial statements.
The accompanying notes form an integral part of these financial statements.
03613-1B.indd 279 19/08/2020 19:04

For the financial period ended 30 June 2020 (cont’d.)
280
BNY MelloN GloBal FuNds, plc
Statement oF ComprehenSive inCome
BNY Mellon Emerging
Markets Debt Fund
BNY Mellon Emerging
Markets Debt Local Currency
Fund
BNY Mellon Emerging
Markets Debt Opportunistic
Fund
BNY Mellon Emerging
Markets Debt Total
Return Fund
BNY Mellon Euroland
Bond Fund
BNY Mellon European
Credit Fund
BNY Mellon Global
Bond Fund
BNY Mellon Global Credit
Fund
BNY Mellon Global
Dynamic Bond Fund
BNY Mellon Global
Emerging Markets
Fund
BNY Mellon Global Equity
Fund
BNY Mellon Global Equity
Income Fund
BNY Mellon Global
High Yield Bond Fund
Notes USD USD USD USD EUR EUR USD USD USD USD USD USD USD
IncomeBank interest income 766 8,938 400 2,631 4,911 18 54,140 7,681 133,708 2,746 52,084 265,172 15,331Dividend income – – – 58,158 113,859 – 216,396 112,530 180,053 113,457 4,007,144 27,336,387 –Securities lending income 13 1,828 2,897 966 4,149 55,496 2,924 56,413 19,022 52,803 1,656 28,815 152,932 7,804net gains/(losses) on financial assets/liabilities at fair value through profit or loss
net realised gains/(losses) on financial assets/liabilities held at fair value through profit or loss 43,790 (62,869,307) (922,976) 3,254,841 8,207,655 (133,668) 13,688,953 17,638,645 4,170,248 689,851 10,814,390 (41,184,287) (1,334,128)net change in unrealised gains/(losses) on financial assets/liabilities held at fair value through profit or loss (2,084,340) 10,354,538 (1,333,577) (6,244,492) (20,961,092) (1,203,678) 9,725,944 (2,979,249) (4,148,703) 91,310 (28,238,226) (226,121,405) (5,121,118)
Total income (2,037,956) (52,502,934) (2,255,187) (2,924,713) (12,579,171) (1,334,404) 23,741,846 14,798,629 388,109 899,020 (13,335,793) (239,551,201) (6,432,111)
Expensesmanagement fee 3 209,998 1,431,804 3,611 402,086 2,780,420 22,526 1,679,403 49,349 1,192,279 137,428 1,585,775 6,773,709 356,250performance fee 3 – – – – – – – – – – – – –Depositary fee 5 13,493 229,255 30,456 82,755 137,437 17,885 102,396 96,228 97,891 59,002 62,181 177,632 30,192operating expenses 7 24,079 166,868 6,601 83,526 323,628 14,217 277,198 107,597 192,727 39,836 194,784 819,893 43,938Dividend expense – – – – – – – – – – – – –Finance charges on swaps – – – – – – – – – – – – –rebate due (from)/to the manager 6 – – – (21,968) – – – 6,874 – (44,910) – – –
Total expenses 247,570 1,827,927 40,668 546,399 3,241,485 54,628 2,058,997 260,048 1,482,897 191,356 1,842,740 7,771,234 430,380
Net income/(expense) (2,285,526) (54,330,861) (2,295,855) (3,471,112) (15,820,656) (1,389,032) 21,682,849 14,538,581 (1,094,788) 707,664 (15,178,533) (247,322,435) (6,862,491)
Finance costsBank interest 343 3,040 218 2,516 65,175 10,397 434 7,783 1,730 14 258 2,059 2,587Distributions 199,144 4,599,994 843,480 4,895,742 1,316,610 348,768 1,605,722 12,036,242 2,372,663 9,279 2,733,382 18,132,395 1,266,958
Profit/(loss) for the financial period (2,485,013) (58,933,895) (3,139,553) (8,369,370) (17,202,441) (1,748,197) 20,076,693 2,494,556 (3,469,181) 698,371 (17,912,173) (265,456,889) (8,132,036)
Withholding taxes on dividends and other investment income 632 (629,289) (41,387) (302,810) 151,094 2,729 (109,158) (15,845) 22,414 (58,389) (843,011) (6,882,183) (5,843)
Increase/(decrease) in net assets attributable to redeemable participating shareholders from operations (2,484,381) (59,563,184) (3,180,940) (8,672,180) (17,051,347) (1,745,468) 19,967,535 2,478,711 (3,446,767) 639,982 (18,755,184) (272,339,072) (8,137,879)
03613-1B.indd 280 19/08/2020 19:04

For the financial period ended 30 June 2020 (cont’d.)
281
BNY MelloN GloBal FuNds, plc
Statement oF ComprehenSive inCome
BNY Mellon Emerging
Markets Debt Fund
BNY Mellon Emerging
Markets Debt Local Currency
Fund
BNY Mellon Emerging
Markets Debt Opportunistic
Fund
BNY Mellon Emerging
Markets Debt Total
Return Fund
BNY Mellon Euroland
Bond Fund
BNY Mellon European
Credit Fund
BNY Mellon Global
Bond Fund
BNY Mellon Global Credit
Fund
BNY Mellon Global
Dynamic Bond Fund
BNY Mellon Global
Emerging Markets
Fund
BNY Mellon Global Equity
Fund
BNY Mellon Global Equity
Income Fund
BNY Mellon Global
High Yield Bond Fund
Notes USD USD USD USD EUR EUR USD USD USD USD USD USD USD
IncomeBank interest income 766 8,938 400 2,631 4,911 18 54,140 7,681 133,708 2,746 52,084 265,172 15,331Dividend income – – – 58,158 113,859 – 216,396 112,530 180,053 113,457 4,007,144 27,336,387 –Securities lending income 13 1,828 2,897 966 4,149 55,496 2,924 56,413 19,022 52,803 1,656 28,815 152,932 7,804net gains/(losses) on financial assets/liabilities at fair value through profit or loss
net realised gains/(losses) on financial assets/liabilities held at fair value through profit or loss 43,790 (62,869,307) (922,976) 3,254,841 8,207,655 (133,668) 13,688,953 17,638,645 4,170,248 689,851 10,814,390 (41,184,287) (1,334,128)net change in unrealised gains/(losses) on financial assets/liabilities held at fair value through profit or loss (2,084,340) 10,354,538 (1,333,577) (6,244,492) (20,961,092) (1,203,678) 9,725,944 (2,979,249) (4,148,703) 91,310 (28,238,226) (226,121,405) (5,121,118)
Total income (2,037,956) (52,502,934) (2,255,187) (2,924,713) (12,579,171) (1,334,404) 23,741,846 14,798,629 388,109 899,020 (13,335,793) (239,551,201) (6,432,111)
Expensesmanagement fee 3 209,998 1,431,804 3,611 402,086 2,780,420 22,526 1,679,403 49,349 1,192,279 137,428 1,585,775 6,773,709 356,250performance fee 3 – – – – – – – – – – – – –Depositary fee 5 13,493 229,255 30,456 82,755 137,437 17,885 102,396 96,228 97,891 59,002 62,181 177,632 30,192operating expenses 7 24,079 166,868 6,601 83,526 323,628 14,217 277,198 107,597 192,727 39,836 194,784 819,893 43,938Dividend expense – – – – – – – – – – – – –Finance charges on swaps – – – – – – – – – – – – –rebate due (from)/to the manager 6 – – – (21,968) – – – 6,874 – (44,910) – – –
Total expenses 247,570 1,827,927 40,668 546,399 3,241,485 54,628 2,058,997 260,048 1,482,897 191,356 1,842,740 7,771,234 430,380
Net income/(expense) (2,285,526) (54,330,861) (2,295,855) (3,471,112) (15,820,656) (1,389,032) 21,682,849 14,538,581 (1,094,788) 707,664 (15,178,533) (247,322,435) (6,862,491)
Finance costsBank interest 343 3,040 218 2,516 65,175 10,397 434 7,783 1,730 14 258 2,059 2,587Distributions 199,144 4,599,994 843,480 4,895,742 1,316,610 348,768 1,605,722 12,036,242 2,372,663 9,279 2,733,382 18,132,395 1,266,958
Profit/(loss) for the financial period (2,485,013) (58,933,895) (3,139,553) (8,369,370) (17,202,441) (1,748,197) 20,076,693 2,494,556 (3,469,181) 698,371 (17,912,173) (265,456,889) (8,132,036)
Withholding taxes on dividends and other investment income 632 (629,289) (41,387) (302,810) 151,094 2,729 (109,158) (15,845) 22,414 (58,389) (843,011) (6,882,183) (5,843)
Increase/(decrease) in net assets attributable to redeemable participating shareholders from operations (2,484,381) (59,563,184) (3,180,940) (8,672,180) (17,051,347) (1,745,468) 19,967,535 2,478,711 (3,446,767) 639,982 (18,755,184) (272,339,072) (8,137,879)
03613-1B.indd 281 19/08/2020 19:04

For the financial period ended 30 June 2020 (cont’d.)
282
BNY MelloN GloBal FuNds, plc
Statement oF ComprehenSive inCome
BNY Mellon Global
Infrastructure Income
Fund
BNY Mellon Global
Leaders Fund
BNY Mellon Global
Multi-Asset Income
Fund
BNY MellonGlobal
OpportunitiesFund
BNY Mellon Global
Real Return Fund (EUR)
BNY Mellon Global
Real Return Fund (GBP)
BNY Mellon Global
Real Return Fund (USD)
BNY Mellon Global
Short-Dated High Yield
Bond Fund
BNY Mellon Global
Unconstrained Fund
BNY Mellon Japan
Small Cap Equity Focus
Fund
BNY Mellon Long-Term
Global Equity
Fund
BNY Mellon Mobility
Innovation Fund
BNY Mellon S&P
500® Index
Tracker
Notes USD USD EUR USD EUR GBP USD USD USD JPY EUR USD USD
IncomeBank interest income 1,397 926 9 4,087 1,443 1,223 44,975 10,969 7,100 98,127 151,368 1,461 150Dividend income 2,768,644 652,590 389,799 466,503 25,794,901 553,363 2,555,677 350,382 175,534 131,940,502 14,482,448 919,758 399,898Securities lending income 13 – 3,421 – 3,561 269,941 2,780 11,570 153,904 1,212 30,057,465 112,924 – 1,024net gains/(losses) on financial assets/liabilities at fair value through profit or loss
net realised gains/(losses) on financial assets/liabilities held at fair value through profit or loss (6,857,957) 3,931,815 (15,721) (328,660) (44,734,325) (1,553,964) 336,515 (17,502,095) (478,384) (304,365,035) (6,366,652) 279,309 4,867,686net change in unrealised gains/(losses) on financial assets/liabilities held at fair value through profit or loss (1,628,057) (4,884,914) (3,070,008) (4,798,078) (70,297,285) (1,035,397) (7,864,954) (32,132,610) (1,484,024) (1,296,084,367) (82,547,303) 11,381,536 (7,523,140)
Total income (5,715,973) (296,162) (2,695,921) (4,652,587) (88,965,325) (2,031,995) (4,916,217) (49,119,450) (1,778,562) (1,438,353,308) (74,167,215) 12,582,064 (2,254,382)
Expensesmanagement fee 3 241,129 324,499 67,736 368,087 10,713,338 143,429 1,061,998 1,484,871 21 49,912,151 6,937,321 662,871 129,137performance fee 3 – – – – – – – – – – 46,167 – –Depositary fee 5 16,365 12,813 16,119 35,184 510,167 55,942 97,739 73,764 11,919 2,846,105 139,186 65,904 68,021operating expenses 7 53,715 37,751 11,682 21,641 1,188,729 49,369 116,474 278,188 9,385 7,494,570 633,922 82,435 29,035Dividend expense – – – – – – – – – – – – –Finance charges on swaps – – – – – – – – – – – – –rebate due (from)/to the manager 6 (5,856) – (14,791) – – – – (1,337) (3,239) (271,239) – (44,215) (1,384)
Total expenses 305,353 375,063 80,746 424,912 12,412,234 248,740 1,276,211 1,835,486 18,086 59,981,587 7,756,596 766,995 224,809
Net income/(expense) (6,021,326) (671,225) (2,776,667) (5,077,499) (101,377,559) (2,280,735) (6,192,428) (50,954,936) (1,796,648) (1,498,334,895) (81,923,811) 11,815,069 (2,479,191)
Finance costsBank interest 1,741 19 565 413 375,942 255 454 14,377 1 543,134 8,463 3,300 114Distributions 1,786,119 378,972 446,673 10,453 26,779,139 1,161,646 2,001,869 17,294,800 480,699 63,226,899 2,319,581 557,890 19
Profit/(loss) for the financial period (7,809,186) (1,050,216) (3,223,905) (5,088,365) (128,532,640) (3,442,636) (8,194,751) (68,264,113) (2,277,348) (1,562,104,928) (84,251,855) 11,253,879 (2,479,324)
Withholding taxes on dividends and other investment income (544,379) (130,027) (26,292) (97,314) (2,406,649) (56,750) (247,803) (34,166) (27,812) (19,458,097) (2,657,248) (195,095) (109,011)
Increase/(decrease) in net assets attributable to redeemable participating shareholders from operations (8,353,565) (1,180,243) (3,250,197) (5,185,679) (130,939,289) (3,499,386) (8,442,554) (68,298,279) (2,305,160) (1,581,563,025) (86,909,103) 11,058,784 (2,588,335)
03613-1B.indd 282 19/08/2020 19:04

For the financial period ended 30 June 2020 (cont’d.)
283
BNY MelloN GloBal FuNds, plc
Statement oF ComprehenSive inCome
BNY Mellon Global
Infrastructure Income
Fund
BNY Mellon Global
Leaders Fund
BNY Mellon Global
Multi-Asset Income
Fund
BNY MellonGlobal
OpportunitiesFund
BNY Mellon Global
Real Return Fund (EUR)
BNY Mellon Global
Real Return Fund (GBP)
BNY Mellon Global
Real Return Fund (USD)
BNY Mellon Global
Short-Dated High Yield
Bond Fund
BNY Mellon Global
Unconstrained Fund
BNY Mellon Japan
Small Cap Equity Focus
Fund
BNY Mellon Long-Term
Global Equity
Fund
BNY Mellon Mobility
Innovation Fund
BNY Mellon S&P
500® Index
Tracker
Notes USD USD EUR USD EUR GBP USD USD USD JPY EUR USD USD
IncomeBank interest income 1,397 926 9 4,087 1,443 1,223 44,975 10,969 7,100 98,127 151,368 1,461 150Dividend income 2,768,644 652,590 389,799 466,503 25,794,901 553,363 2,555,677 350,382 175,534 131,940,502 14,482,448 919,758 399,898Securities lending income 13 – 3,421 – 3,561 269,941 2,780 11,570 153,904 1,212 30,057,465 112,924 – 1,024net gains/(losses) on financial assets/liabilities at fair value through profit or loss
net realised gains/(losses) on financial assets/liabilities held at fair value through profit or loss (6,857,957) 3,931,815 (15,721) (328,660) (44,734,325) (1,553,964) 336,515 (17,502,095) (478,384) (304,365,035) (6,366,652) 279,309 4,867,686net change in unrealised gains/(losses) on financial assets/liabilities held at fair value through profit or loss (1,628,057) (4,884,914) (3,070,008) (4,798,078) (70,297,285) (1,035,397) (7,864,954) (32,132,610) (1,484,024) (1,296,084,367) (82,547,303) 11,381,536 (7,523,140)
Total income (5,715,973) (296,162) (2,695,921) (4,652,587) (88,965,325) (2,031,995) (4,916,217) (49,119,450) (1,778,562) (1,438,353,308) (74,167,215) 12,582,064 (2,254,382)
Expensesmanagement fee 3 241,129 324,499 67,736 368,087 10,713,338 143,429 1,061,998 1,484,871 21 49,912,151 6,937,321 662,871 129,137performance fee 3 – – – – – – – – – – 46,167 – –Depositary fee 5 16,365 12,813 16,119 35,184 510,167 55,942 97,739 73,764 11,919 2,846,105 139,186 65,904 68,021operating expenses 7 53,715 37,751 11,682 21,641 1,188,729 49,369 116,474 278,188 9,385 7,494,570 633,922 82,435 29,035Dividend expense – – – – – – – – – – – – –Finance charges on swaps – – – – – – – – – – – – –rebate due (from)/to the manager 6 (5,856) – (14,791) – – – – (1,337) (3,239) (271,239) – (44,215) (1,384)
Total expenses 305,353 375,063 80,746 424,912 12,412,234 248,740 1,276,211 1,835,486 18,086 59,981,587 7,756,596 766,995 224,809
Net income/(expense) (6,021,326) (671,225) (2,776,667) (5,077,499) (101,377,559) (2,280,735) (6,192,428) (50,954,936) (1,796,648) (1,498,334,895) (81,923,811) 11,815,069 (2,479,191)
Finance costsBank interest 1,741 19 565 413 375,942 255 454 14,377 1 543,134 8,463 3,300 114Distributions 1,786,119 378,972 446,673 10,453 26,779,139 1,161,646 2,001,869 17,294,800 480,699 63,226,899 2,319,581 557,890 19
Profit/(loss) for the financial period (7,809,186) (1,050,216) (3,223,905) (5,088,365) (128,532,640) (3,442,636) (8,194,751) (68,264,113) (2,277,348) (1,562,104,928) (84,251,855) 11,253,879 (2,479,324)
Withholding taxes on dividends and other investment income (544,379) (130,027) (26,292) (97,314) (2,406,649) (56,750) (247,803) (34,166) (27,812) (19,458,097) (2,657,248) (195,095) (109,011)
Increase/(decrease) in net assets attributable to redeemable participating shareholders from operations (8,353,565) (1,180,243) (3,250,197) (5,185,679) (130,939,289) (3,499,386) (8,442,554) (68,298,279) (2,305,160) (1,581,563,025) (86,909,103) 11,058,784 (2,588,335)
03613-1B.indd 283 19/08/2020 19:04
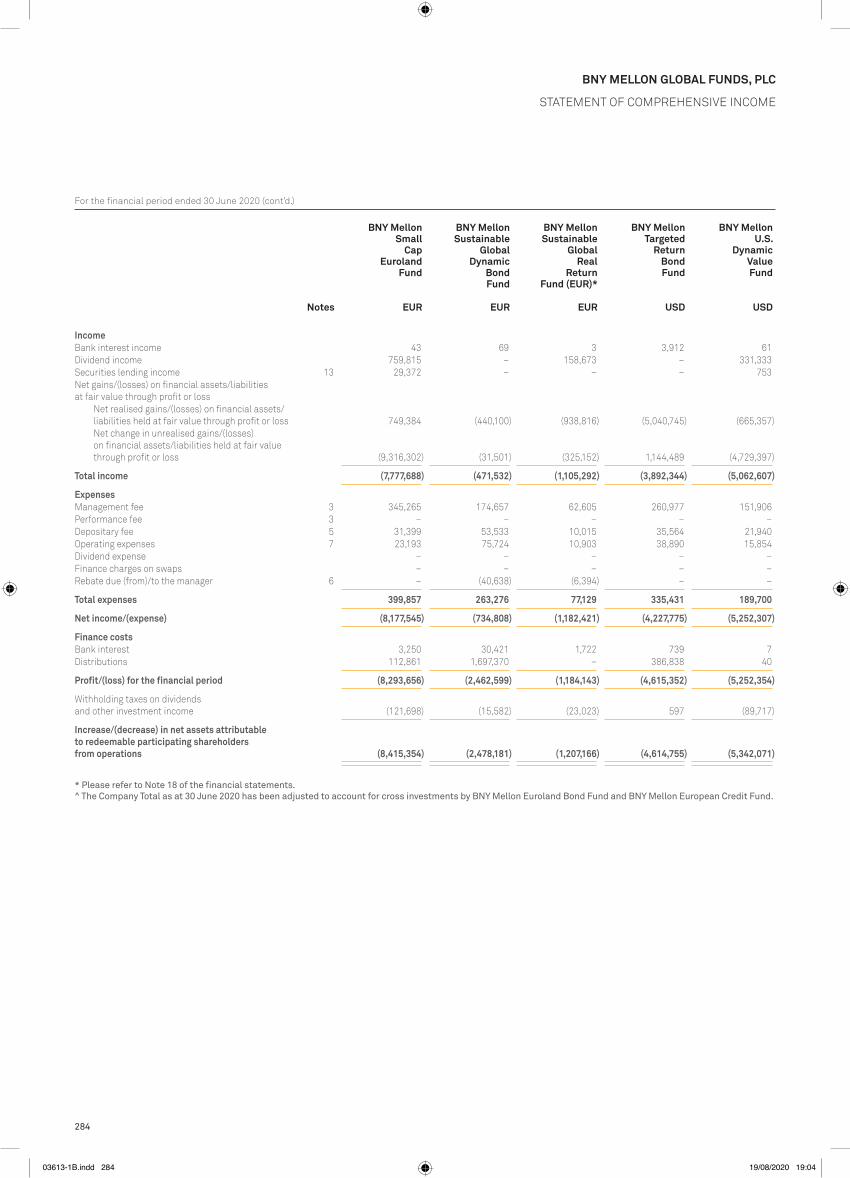
For the financial period ended 30 June 2020 (cont’d.)
284
BNY MelloN GloBal FuNds, plc
Statement oF ComprehenSive inCome
BNY Mellon Small
Cap Euroland
Fund
BNY Mellon Sustainable
Global Dynamic
Bond Fund
BNY Mellon Sustainable
Global Real
Return Fund (EUR)*
BNY Mellon Targeted
Return Bond Fund
BNY Mellon U.S.
Dynamic Value Fund
BNY Mellon U.S.
Equity Income
Fund
BNY Mellon U.S.
Municipal Infrastructure
Debt Fund
Total 30 June
2020^
Notes EUR EUR EUR USD USD USD USD USD
IncomeBank interest income 43 69 3 3,912 61 29,187 2,668 868,462Dividend income 759,815 – 158,673 – 331,333 5,491,694 – 101,569,670Securities lending income 13 29,372 – – – 753 2,926 – 1,439,947net gains/(losses) on financial assets/liabilities at fair value through profit or loss
net realised gains/(losses) on financial assets/liabilities held at fair value through profit or loss 749,384 (440,100) (938,816) (5,040,745) (665,357) (21,752,245) 10,943,543 (197,315,481)net change in unrealised gains/(losses) on financial assets/liabilities held at fair value through profit or loss (9,316,302) (31,501) (325,152) 1,144,489 (4,729,397) (76,649,480) 5,575,886 (689,688,471)
Total income (7,777,688) (471,532) (1,105,292) (3,892,344) (5,062,607) (92,877,918) 16,522,097 (783,125,873)
Expensesmanagement fee 3 345,265 174,657 62,605 260,977 151,906 829,943 990,993 49,207,244performance fee 3 – – – – – – – 101,184Depositary fee 5 31,399 53,533 10,015 35,564 21,940 43,037 37,661 3,293,849operating expenses 7 23,193 75,724 10,903 38,890 15,854 153,977 228,523 6,709,631Dividend expense – – – – – – – 2,467,029Finance charges on swaps – – – – – – – 674,218rebate due (from)/to the manager 6 – (40,638) (6,394) – – – 102 (410,168)
Total expenses 399,857 263,276 77,129 335,431 189,700 1,026,957 1,257,279 62,042,987
Net income/(expense) (8,177,545) (734,808) (1,182,421) (4,227,775) (5,252,307) (93,904,875) 15,264,818 (845,168,860)
Finance costsBank interest 3,250 30,421 1,722 739 7 2,757 305 672,949Distributions 112,861 1,697,370 – 386,838 40 4,338,696 7,493,726 148,259,581
Profit/(loss) for the financial period (8,293,656) (2,462,599) (1,184,143) (4,615,352) (5,252,354) (98,246,328) 7,770,787 (994,101,390)
Withholding taxes on dividends and other investment income (121,698) (15,582) (23,023) 597 (89,717) (1,346,867) 9,398 (16,341,512)
Increase/(decrease) in net assets attributable to redeemable participating shareholders from operations (8,415,354) (2,478,181) (1,207,166) (4,614,755) (5,342,071) (99,593,195) 7,780,185 (1,010,442,902)
* Please refer to Note 18 of the financial statements.^ The Company Total as at 30 June 2020 has been adjusted to account for cross investments by BNY Mellon Euroland Bond Fund and BNY Mellon European Credit Fund.
03613-1B.indd 284 19/08/2020 19:04

For the financial period ended 30 June 2020 (cont’d.)
285
BNY MelloN GloBal FuNds, plc
Statement oF ComprehenSive inCome
BNY Mellon Small
Cap Euroland
Fund
BNY Mellon Sustainable
Global Dynamic
Bond Fund
BNY Mellon Sustainable
Global Real
Return Fund (EUR)*
BNY Mellon Targeted
Return Bond Fund
BNY Mellon U.S.
Dynamic Value Fund
BNY Mellon U.S.
Equity Income
Fund
BNY Mellon U.S.
Municipal Infrastructure
Debt Fund
Total 30 June
2020^
Notes EUR EUR EUR USD USD USD USD USD
IncomeBank interest income 43 69 3 3,912 61 29,187 2,668 868,462Dividend income 759,815 – 158,673 – 331,333 5,491,694 – 101,569,670Securities lending income 13 29,372 – – – 753 2,926 – 1,439,947net gains/(losses) on financial assets/liabilities at fair value through profit or loss
net realised gains/(losses) on financial assets/liabilities held at fair value through profit or loss 749,384 (440,100) (938,816) (5,040,745) (665,357) (21,752,245) 10,943,543 (197,315,481)net change in unrealised gains/(losses) on financial assets/liabilities held at fair value through profit or loss (9,316,302) (31,501) (325,152) 1,144,489 (4,729,397) (76,649,480) 5,575,886 (689,688,471)
Total income (7,777,688) (471,532) (1,105,292) (3,892,344) (5,062,607) (92,877,918) 16,522,097 (783,125,873)
Expensesmanagement fee 3 345,265 174,657 62,605 260,977 151,906 829,943 990,993 49,207,244performance fee 3 – – – – – – – 101,184Depositary fee 5 31,399 53,533 10,015 35,564 21,940 43,037 37,661 3,293,849operating expenses 7 23,193 75,724 10,903 38,890 15,854 153,977 228,523 6,709,631Dividend expense – – – – – – – 2,467,029Finance charges on swaps – – – – – – – 674,218rebate due (from)/to the manager 6 – (40,638) (6,394) – – – 102 (410,168)
Total expenses 399,857 263,276 77,129 335,431 189,700 1,026,957 1,257,279 62,042,987
Net income/(expense) (8,177,545) (734,808) (1,182,421) (4,227,775) (5,252,307) (93,904,875) 15,264,818 (845,168,860)
Finance costsBank interest 3,250 30,421 1,722 739 7 2,757 305 672,949Distributions 112,861 1,697,370 – 386,838 40 4,338,696 7,493,726 148,259,581
Profit/(loss) for the financial period (8,293,656) (2,462,599) (1,184,143) (4,615,352) (5,252,354) (98,246,328) 7,770,787 (994,101,390)
Withholding taxes on dividends and other investment income (121,698) (15,582) (23,023) 597 (89,717) (1,346,867) 9,398 (16,341,512)
Increase/(decrease) in net assets attributable to redeemable participating shareholders from operations (8,415,354) (2,478,181) (1,207,166) (4,614,755) (5,342,071) (99,593,195) 7,780,185 (1,010,442,902)
* Please refer to Note 18 of the financial statements.^ The Company Total as at 30 June 2020 has been adjusted to account for cross investments by BNY Mellon Euroland Bond Fund and BNY Mellon European Credit Fund.
03613-1B.indd 285 19/08/2020 19:04

286
BNY MelloN GloBal FuNds, plc
Statement oF ComprehenSive inCome
For the financial period ended 30 June 2019
BNY Mellon Absolute
Return Bond Fund
BNY Mellon Absolute
Return Equity
Fund
BNY Mellon Absolute
Return GlobalConvertible
Fund*
BNY Mellon Asia
Rising Stars Fund
BNY Mellon Asian
Equity Fund
BNY Mellon Asian
Income Fund
BNY Mellon Brazil
Equity Fund
BNY Mellon Digital Assets Fund*
BNY Mellon Dynamic
Total Return
Fund
BNY Mellon Dynamic
U.S. Equity
Fund
BNY Mellon Emerging
Markets Corporate
Debt Fund
BNY Mellon Emerging
Markets Debt Fund
BNY Mellon Emerging
Markets Debt Local Currency
Fund
Notes EUR GBP EUR USD USD GBP USD USD USD USD USD USD USD
IncomeBank interest income 29,865 11,242 – 1,133 94 51 – 210 12,609 40,363 5,034 4,130 95,286Dividend income – 14,775,107 – 116,648 347,140 285,797 1,884,749 91,752 37,034 980,941 110,987 – –Securities lending income 13 55,642 27,086 – 3,390 382 – – – 372 4,435 34,518 3,935 19,692net gains/(losses) on financial assets/liabilities at fair value through profit or loss
net realised gains/(losses) on financial assets/liabilities held at fair value through profit or loss (47,698,599) (64,739,237) 37,030 (193,015) 397,573 90,534 1,139,453 (47,293) 2,670,314 10,010,441 8,844,069 1,618,692 (15,332,085)net change in unrealised gains/(losses) on financial assets/liabilities held at fair value through profit or loss 40,071,705 40,041,946 77,788 790,124 3,824,548 2,616,696 7,897,857 308,932 424,451 16,660,487 15,609,401 3,463,866 68,587,335
Total income (7,541,387) (9,883,856) 114,818 718,280 4,569,737 2,993,078 10,922,059 353,601 3,144,780 27,696,667 24,604,009 5,090,623 53,370,228
Expensesmanagement fee 3 1,020,302 5,424,331 11,517 38,788 338,017 80,795 822,895 14,758 118,452 102,226 682,499 263,071 2,158,969performance fee 3 – – 15,300 – – – – – – – – – –Depositary fee 5 125,731 113,502 4,023 16,282 25,804 5,734 94,625 5,219 7,778 28,027 31,336 6,573 353,639operating expenses 7 230,463 497,234 2,701 32,106 39,488 10,008 54,191 8,778 15,994 47,269 105,922 24,277 310,169Dividend expense – 15,681,767 – – – – – – – – – – –Finance charges on swaps – 1,657,096 – – – – – – – – – – –rebate due (from)/to the manager 6 – – (4,420) (27,374) – (6,577) – (11,319) (3) (30,122) – – –
Total expenses 1,376,496 23,373,930 29,121 59,802 403,309 89,960 971,711 17,436 142,221 147,400 819,757 293,921 2,822,777
Net income/(expense) (8,917,883) (33,257,786) 85,697 658,478 4,166,428 2,903,118 9,950,348 336,165 3,002,559 27,549,267 23,784,252 4,796,702 50,547,451
Finance costsBank interest 83,829 2,271 – – – – 3,867 39 – – 5,511 1,101 7,006Distributions 901,501 1,651,720 – 84,467 27 285,789 144,045 – 135,110 1,483,640 3,474,802 53,597 9,881,532
Profit/(loss) for the financial period (9,903,213) (34,911,777) 85,697 574,011 4,166,401 2,617,329 9,802,436 336,126 2,867,449 26,065,627 20,303,939 4,742,004 40,658,913
Withholding taxes on dividends and other investment income (17,731) (678,574) (47) (13,577) (34,691) – (1,385,053) (22,034) 2,973 (347,138) (87,137) 3,974 (671,351)
Increase/(decrease) in net assets attributable to redeemable participating shareholders from operations (9,920,944) (35,590,351) 85,650 560,434 4,131,710 2,617,329 8,417,383 314,092 2,870,422 25,718,489 20,216,802 4,745,978 39,987,562
Other than the Funds closed during the financial period, gains and losses arise solely from continuing operations.There were no gains or losses other than those dealt with in the Statement of Comprehensive Income.
* This Fund launched during the financial period.
The accompanying notes form an integral part of these financial statements.
03613-1B.indd 286 19/08/2020 19:04

287
BNY MelloN GloBal FuNds, plc
Statement oF ComprehenSive inCome
For the financial period ended 30 June 2019 (cont’d.)
BNY Mellon Absolute
Return Bond Fund
BNY Mellon Absolute
Return Equity
Fund
BNY Mellon Absolute
Return GlobalConvertible
Fund*
BNY Mellon Asia
Rising Stars Fund
BNY Mellon Asian
Equity Fund
BNY Mellon Asian
Income Fund
BNY Mellon Brazil
Equity Fund
BNY Mellon Digital Assets Fund*
BNY Mellon Dynamic
Total Return
Fund
BNY Mellon Dynamic
U.S. Equity
Fund
BNY Mellon Emerging
Markets Corporate
Debt Fund
BNY Mellon Emerging
Markets Debt Fund
BNY Mellon Emerging
Markets Debt Local Currency
Fund
Notes EUR GBP EUR USD USD GBP USD USD USD USD USD USD USD
IncomeBank interest income 29,865 11,242 – 1,133 94 51 – 210 12,609 40,363 5,034 4,130 95,286Dividend income – 14,775,107 – 116,648 347,140 285,797 1,884,749 91,752 37,034 980,941 110,987 – –Securities lending income 13 55,642 27,086 – 3,390 382 – – – 372 4,435 34,518 3,935 19,692net gains/(losses) on financial assets/liabilities at fair value through profit or loss
net realised gains/(losses) on financial assets/liabilities held at fair value through profit or loss (47,698,599) (64,739,237) 37,030 (193,015) 397,573 90,534 1,139,453 (47,293) 2,670,314 10,010,441 8,844,069 1,618,692 (15,332,085)net change in unrealised gains/(losses) on financial assets/liabilities held at fair value through profit or loss 40,071,705 40,041,946 77,788 790,124 3,824,548 2,616,696 7,897,857 308,932 424,451 16,660,487 15,609,401 3,463,866 68,587,335
Total income (7,541,387) (9,883,856) 114,818 718,280 4,569,737 2,993,078 10,922,059 353,601 3,144,780 27,696,667 24,604,009 5,090,623 53,370,228
Expensesmanagement fee 3 1,020,302 5,424,331 11,517 38,788 338,017 80,795 822,895 14,758 118,452 102,226 682,499 263,071 2,158,969performance fee 3 – – 15,300 – – – – – – – – – –Depositary fee 5 125,731 113,502 4,023 16,282 25,804 5,734 94,625 5,219 7,778 28,027 31,336 6,573 353,639operating expenses 7 230,463 497,234 2,701 32,106 39,488 10,008 54,191 8,778 15,994 47,269 105,922 24,277 310,169Dividend expense – 15,681,767 – – – – – – – – – – –Finance charges on swaps – 1,657,096 – – – – – – – – – – –rebate due (from)/to the manager 6 – – (4,420) (27,374) – (6,577) – (11,319) (3) (30,122) – – –
Total expenses 1,376,496 23,373,930 29,121 59,802 403,309 89,960 971,711 17,436 142,221 147,400 819,757 293,921 2,822,777
Net income/(expense) (8,917,883) (33,257,786) 85,697 658,478 4,166,428 2,903,118 9,950,348 336,165 3,002,559 27,549,267 23,784,252 4,796,702 50,547,451
Finance costsBank interest 83,829 2,271 – – – – 3,867 39 – – 5,511 1,101 7,006Distributions 901,501 1,651,720 – 84,467 27 285,789 144,045 – 135,110 1,483,640 3,474,802 53,597 9,881,532
Profit/(loss) for the financial period (9,903,213) (34,911,777) 85,697 574,011 4,166,401 2,617,329 9,802,436 336,126 2,867,449 26,065,627 20,303,939 4,742,004 40,658,913
Withholding taxes on dividends and other investment income (17,731) (678,574) (47) (13,577) (34,691) – (1,385,053) (22,034) 2,973 (347,138) (87,137) 3,974 (671,351)
Increase/(decrease) in net assets attributable to redeemable participating shareholders from operations (9,920,944) (35,590,351) 85,650 560,434 4,131,710 2,617,329 8,417,383 314,092 2,870,422 25,718,489 20,216,802 4,745,978 39,987,562
Other than the Funds closed during the financial period, gains and losses arise solely from continuing operations.There were no gains or losses other than those dealt with in the Statement of Comprehensive Income.
* This Fund launched during the financial period.
The accompanying notes form an integral part of these financial statements.
03613-1B.indd 287 19/08/2020 19:04

288
BNY MelloN GloBal FuNds, plc
Statement oF ComprehenSive inCome
For the financial period ended 30 June 2019 (cont’d.)
BNY Mellon Emerging
Markets Debt Opportunistic
Fund
BNY Mellon Emerging
Markets Debt Total
Return Fund
BNY Mellon Euroland
Bond Fund
BNY Mellon European
Credit Fund
BNY Mellon Global
Bond Fund
BNY Mellon Global Credit
Fund
BNY Mellon Global
Dynamic Bond Fund
BNY Mellon Global
Emerging Markets
Fund
BNY Mellon Global Equity
Fund
BNY Mellon Global Equity
Income Fund
BNY Mellon Global
High Yield Bond Fund
BNY Mellon Global
Infrastructure Income
Fund
BNY Mellon Global
Leaders Fund
Notes USD USD EUR EUR USD USD USD USD USD USD USD USD USD
IncomeBank interest income 861 2,615 25,825 – 1,101 2,489 50,117 – 679 12,299 3,441 987 5,038Dividend income – 75,143 – – 127,995 95,882 916,224 261,920 4,671,375 31,147,620 55,570 390,800 927,179Securities lending income 13 2,838 5,299 53,425 605 37,964 14,696 20,888 40,093 54,697 145,572 16,971 – 3,445net gains/(losses) on financial assets/liabilities at fair value through profit or loss
net realised gains/(losses) on financial assets/liabilities held at fair value through profit or loss 1,427,043 4,717,965 6,642,452 550,845 9,847,414 16,449,729 4,678,553 (2,152,837) 2,540,171 18,196,168 1,390,864 (237,899) 147,813net change in unrealised gains/(losses) on financial assets/liabilities held at fair value through profit or loss 2,032,435 7,038,619 53,200,720 1,749,100 25,661,643 31,646,616 17,293,962 7,245,700 41,944,943 161,653,078 8,265,203 1,109,807 12,284,563
Total income 3,463,177 11,839,641 59,922,422 2,300,550 35,676,117 48,209,412 22,959,744 5,394,876 49,211,865 211,154,737 9,732,049 1,263,695 13,368,038
Expensesmanagement fee 3 1,681 312,766 2,802,952 19,237 1,545,961 55,263 1,477,890 169,962 1,425,887 5,668,770 266,425 46,051 309,564performance fee 3 – – – – – – – – – – – – –Depositary fee 5 24,518 60,035 96,388 7,237 67,101 64,795 84,367 57,309 51,592 94,571 16,840 7,860 9,187operating expenses 7 7,938 71,207 440,297 10,213 289,259 104,940 248,188 35,393 175,624 553,703 39,705 14,362 41,877Dividend expense – – – – – – – – – – – – –Finance charges on swaps – – – – – – – – – – – – –rebate due (from)/to the manager 6 – (26,991) – – – (200) – (17,185) – – – (13,009) 7,082
Total expenses 34,137 417,017 3,339,637 36,687 1,902,321 224,798 1,810,445 245,479 1,653,103 6,317,044 322,970 55,264 367,710
Net income/(expense) 3,429,040 11,422,624 56,582,785 2,263,863 33,773,796 47,984,614 21,149,299 5,149,397 47,558,762 204,837,693 9,409,079 1,208,431 13,000,328
Finance costsBank interest 145 5,748 47,506 4,890 104 4,424 – 2,529 1,444 3,386 – 12 –Distributions 1,185,098 3,721,729 1,517,953 211,230 620,205 11,931,161 2,254,237 182,469 2,805,762 13,280,840 1,776,025 250,395 492,289
Profit/(loss) for the financial period 2,243,797 7,695,147 55,017,326 2,047,743 33,153,487 36,049,029 18,895,062 4,964,399 44,751,556 191,553,467 7,633,054 958,024 12,508,039
Withholding taxes on dividends and other investment income (21,587) (84,476) (213,053) 1,925 (76,113) (13,958) (44,653) 43 (1,019,689) (5,938,257) (3,546) (80,905) (208,162)
Increase/(decrease) in net assets attributable to redeemable participating shareholders from operations 2,222,210 7,610,671 54,804,273 2,049,668 33,077,374 36,035,071 18,850,409 4,964,442 43,731,867 185,615,210 7,629,508 877,119 12,299,877
03613-1B.indd 288 19/08/2020 19:04

289
BNY MelloN GloBal FuNds, plc
Statement oF ComprehenSive inCome
For the financial period ended 30 June 2019 (cont’d.)
BNY Mellon Emerging
Markets Debt Opportunistic
Fund
BNY Mellon Emerging
Markets Debt Total
Return Fund
BNY Mellon Euroland
Bond Fund
BNY Mellon European
Credit Fund
BNY Mellon Global
Bond Fund
BNY Mellon Global Credit
Fund
BNY Mellon Global
Dynamic Bond Fund
BNY Mellon Global
Emerging Markets
Fund
BNY Mellon Global Equity
Fund
BNY Mellon Global Equity
Income Fund
BNY Mellon Global
High Yield Bond Fund
BNY Mellon Global
Infrastructure Income
Fund
BNY Mellon Global
Leaders Fund
Notes USD USD EUR EUR USD USD USD USD USD USD USD USD USD
IncomeBank interest income 861 2,615 25,825 – 1,101 2,489 50,117 – 679 12,299 3,441 987 5,038Dividend income – 75,143 – – 127,995 95,882 916,224 261,920 4,671,375 31,147,620 55,570 390,800 927,179Securities lending income 13 2,838 5,299 53,425 605 37,964 14,696 20,888 40,093 54,697 145,572 16,971 – 3,445net gains/(losses) on financial assets/liabilities at fair value through profit or loss
net realised gains/(losses) on financial assets/liabilities held at fair value through profit or loss 1,427,043 4,717,965 6,642,452 550,845 9,847,414 16,449,729 4,678,553 (2,152,837) 2,540,171 18,196,168 1,390,864 (237,899) 147,813net change in unrealised gains/(losses) on financial assets/liabilities held at fair value through profit or loss 2,032,435 7,038,619 53,200,720 1,749,100 25,661,643 31,646,616 17,293,962 7,245,700 41,944,943 161,653,078 8,265,203 1,109,807 12,284,563
Total income 3,463,177 11,839,641 59,922,422 2,300,550 35,676,117 48,209,412 22,959,744 5,394,876 49,211,865 211,154,737 9,732,049 1,263,695 13,368,038
Expensesmanagement fee 3 1,681 312,766 2,802,952 19,237 1,545,961 55,263 1,477,890 169,962 1,425,887 5,668,770 266,425 46,051 309,564performance fee 3 – – – – – – – – – – – – –Depositary fee 5 24,518 60,035 96,388 7,237 67,101 64,795 84,367 57,309 51,592 94,571 16,840 7,860 9,187operating expenses 7 7,938 71,207 440,297 10,213 289,259 104,940 248,188 35,393 175,624 553,703 39,705 14,362 41,877Dividend expense – – – – – – – – – – – – –Finance charges on swaps – – – – – – – – – – – – –rebate due (from)/to the manager 6 – (26,991) – – – (200) – (17,185) – – – (13,009) 7,082
Total expenses 34,137 417,017 3,339,637 36,687 1,902,321 224,798 1,810,445 245,479 1,653,103 6,317,044 322,970 55,264 367,710
Net income/(expense) 3,429,040 11,422,624 56,582,785 2,263,863 33,773,796 47,984,614 21,149,299 5,149,397 47,558,762 204,837,693 9,409,079 1,208,431 13,000,328
Finance costsBank interest 145 5,748 47,506 4,890 104 4,424 – 2,529 1,444 3,386 – 12 –Distributions 1,185,098 3,721,729 1,517,953 211,230 620,205 11,931,161 2,254,237 182,469 2,805,762 13,280,840 1,776,025 250,395 492,289
Profit/(loss) for the financial period 2,243,797 7,695,147 55,017,326 2,047,743 33,153,487 36,049,029 18,895,062 4,964,399 44,751,556 191,553,467 7,633,054 958,024 12,508,039
Withholding taxes on dividends and other investment income (21,587) (84,476) (213,053) 1,925 (76,113) (13,958) (44,653) 43 (1,019,689) (5,938,257) (3,546) (80,905) (208,162)
Increase/(decrease) in net assets attributable to redeemable participating shareholders from operations 2,222,210 7,610,671 54,804,273 2,049,668 33,077,374 36,035,071 18,850,409 4,964,442 43,731,867 185,615,210 7,629,508 877,119 12,299,877
03613-1B.indd 289 19/08/2020 19:04
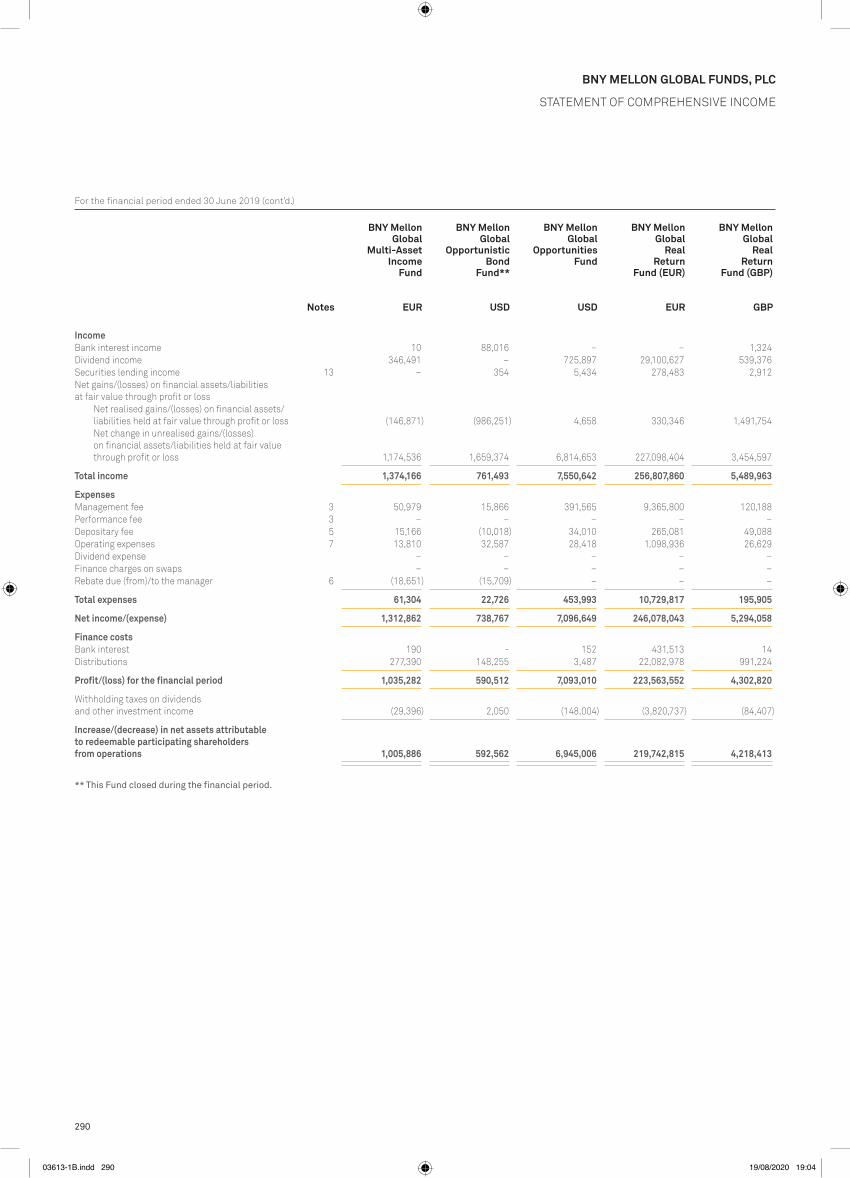
290
BNY MelloN GloBal FuNds, plc
Statement oF ComprehenSive inCome
For the financial period ended 30 June 2019 (cont’d.)
BNY Mellon Global
Multi-Asset Income
Fund
BNY Mellon Global
Opportunistic Bond
Fund**
BNY Mellon Global
Opportunities Fund
BNY Mellon Global
RealReturn
Fund (EUR)
BNY Mellon Global
RealReturn
Fund (GBP)
BNY Mellon Global
RealReturn
Fund (USD)
BNY Mellon Global
Short-Dated High Yield
Bond Fund
BNY Mellon Global
Unconstrained Fund
BNY Mellon Japan
All Cap Equity
Fund**
BNY Mellon Japan
REIT Alpha
Fund**
BNY Mellon Japan
Small Cap Equity Focus
Fund
BNY Mellon Long-Term
Global Equity
Fund
BNY Mellon Mobility
Innovation Fund
Notes EUR USD USD EUR GBP USD USD USD JPY JPY JPY EUR USD
IncomeBank interest income 10 88,016 – – 1,324 16,009 6,414 1,182 34,372 5,858 188,006 113,224 3,823Dividend income 346,491 – 725,897 29,100,627 539,376 2,821,853 308,453 248,540 189,200 4,771,046 158,093,800 20,123,975 607,737Securities lending income 13 – 354 5,434 278,483 2,912 25,340 148,387 1,829 120,348 43,432 20,836,744 175,061 –net gains/(losses) on financial assets/liabilities at fair value through profit or loss
net realised gains/(losses) on financial assets/liabilities held at fair value through profit or loss (146,871) (986,251) 4,658 330,346 1,491,754 6,701,208 9,688,996 238,511 22,223,176 102,217,549 (572,245,070) 9,000,380 (770,203)net change in unrealised gains/(losses) on financial assets/liabilities held at fair value through profit or loss 1,174,536 1,659,374 6,814,653 227,098,404 3,454,597 20,152,482 21,280,912 3,116,764 49,350,721 (44,611,442) 1,060,769,812 270,587,476 7,560,747
Total income 1,374,166 761,493 7,550,642 256,807,860 5,489,963 29,716,892 31,433,162 3,606,826 71,917,817 62,426,443 667,643,292 300,000,116 7,402,104
Expensesmanagement fee 3 50,979 15,866 391,565 9,365,800 120,188 927,641 1,363,526 19 249,367 1,006,304 66,639,130 5,321,263 231,181performance fee 3 – – – – – – – – – – – 631,414 –Depositary fee 5 15,166 (10,018) 34,010 265,081 49,088 87,839 57,438 6,080 274,104 202,590 2,948,333 117,056 29,795operating expenses 7 13,810 32,587 28,418 1,098,936 26,629 123,141 267,790 14,455 1,068,197 981,470 9,597,015 602,570 41,686Dividend expense – – – – – – – – – – – – –Finance charges on swaps – – – – – – – – – – – – –rebate due (from)/to the manager 6 (18,651) (15,709) – – – – (12,525) (2,072) (676,571) – 1,837,448 – (28,669)
Total expenses 61,304 22,726 453,993 10,729,817 195,905 1,138,621 1,676,229 18,482 915,097 2,190,364 81,021,926 6,672,303 273,993
Net income/(expense) 1,312,862 738,767 7,096,649 246,078,043 5,294,058 28,578,271 29,756,933 3,588,344 71,002,720 60,236,079 586,621,366 293,327,813 7,128,111
Finance costsBank interest 190 - 152 431,513 14 198 – – 32,206 48,792 610,314 7,390 3,852Distributions 277,390 148,255 3,487 22,082,978 991,224 1,859,597 16,709,770 399,155 13,295,848 9,186,417 37,298,442 8,610,657 33,658
Profit/(loss) for the financial period 1,035,282 590,512 7,093,010 223,563,552 4,302,820 26,718,476 13,047,163 3,189,189 57,674,666 51,000,870 548,712,610 284,709,766 7,090,601
Withholding taxes on dividends and other investment income (29,396) 2,050 (148,004) (3,820,737) (84,407) (411,905) (3,176) (50,566) (28,380) (715,657) (23,714,071) (4,114,496) (122,088)
Increase/(decrease) in net assets attributable to redeemable participating shareholders from operations 1,005,886 592,562 6,945,006 219,742,815 4,218,413 26,306,571 13,043,987 3,138,623 57,646,286 50,285,213 524,998,539 280,595,270 6,968,513
** This Fund closed during the financial period.
03613-1B.indd 290 19/08/2020 19:04

291
BNY MelloN GloBal FuNds, plc
Statement oF ComprehenSive inCome
For the financial period ended 30 June 2019 (cont’d.)
BNY Mellon Global
Multi-Asset Income
Fund
BNY Mellon Global
Opportunistic Bond
Fund**
BNY Mellon Global
Opportunities Fund
BNY Mellon Global
RealReturn
Fund (EUR)
BNY Mellon Global
RealReturn
Fund (GBP)
BNY Mellon Global
RealReturn
Fund (USD)
BNY Mellon Global
Short-Dated High Yield
Bond Fund
BNY Mellon Global
Unconstrained Fund
BNY Mellon Japan
All Cap Equity
Fund**
BNY Mellon Japan
REIT Alpha
Fund**
BNY Mellon Japan
Small Cap Equity Focus
Fund
BNY Mellon Long-Term
Global Equity
Fund
BNY Mellon Mobility
Innovation Fund
Notes EUR USD USD EUR GBP USD USD USD JPY JPY JPY EUR USD
IncomeBank interest income 10 88,016 – – 1,324 16,009 6,414 1,182 34,372 5,858 188,006 113,224 3,823Dividend income 346,491 – 725,897 29,100,627 539,376 2,821,853 308,453 248,540 189,200 4,771,046 158,093,800 20,123,975 607,737Securities lending income 13 – 354 5,434 278,483 2,912 25,340 148,387 1,829 120,348 43,432 20,836,744 175,061 –net gains/(losses) on financial assets/liabilities at fair value through profit or loss
net realised gains/(losses) on financial assets/liabilities held at fair value through profit or loss (146,871) (986,251) 4,658 330,346 1,491,754 6,701,208 9,688,996 238,511 22,223,176 102,217,549 (572,245,070) 9,000,380 (770,203)net change in unrealised gains/(losses) on financial assets/liabilities held at fair value through profit or loss 1,174,536 1,659,374 6,814,653 227,098,404 3,454,597 20,152,482 21,280,912 3,116,764 49,350,721 (44,611,442) 1,060,769,812 270,587,476 7,560,747
Total income 1,374,166 761,493 7,550,642 256,807,860 5,489,963 29,716,892 31,433,162 3,606,826 71,917,817 62,426,443 667,643,292 300,000,116 7,402,104
Expensesmanagement fee 3 50,979 15,866 391,565 9,365,800 120,188 927,641 1,363,526 19 249,367 1,006,304 66,639,130 5,321,263 231,181performance fee 3 – – – – – – – – – – – 631,414 –Depositary fee 5 15,166 (10,018) 34,010 265,081 49,088 87,839 57,438 6,080 274,104 202,590 2,948,333 117,056 29,795operating expenses 7 13,810 32,587 28,418 1,098,936 26,629 123,141 267,790 14,455 1,068,197 981,470 9,597,015 602,570 41,686Dividend expense – – – – – – – – – – – – –Finance charges on swaps – – – – – – – – – – – – –rebate due (from)/to the manager 6 (18,651) (15,709) – – – – (12,525) (2,072) (676,571) – 1,837,448 – (28,669)
Total expenses 61,304 22,726 453,993 10,729,817 195,905 1,138,621 1,676,229 18,482 915,097 2,190,364 81,021,926 6,672,303 273,993
Net income/(expense) 1,312,862 738,767 7,096,649 246,078,043 5,294,058 28,578,271 29,756,933 3,588,344 71,002,720 60,236,079 586,621,366 293,327,813 7,128,111
Finance costsBank interest 190 - 152 431,513 14 198 – – 32,206 48,792 610,314 7,390 3,852Distributions 277,390 148,255 3,487 22,082,978 991,224 1,859,597 16,709,770 399,155 13,295,848 9,186,417 37,298,442 8,610,657 33,658
Profit/(loss) for the financial period 1,035,282 590,512 7,093,010 223,563,552 4,302,820 26,718,476 13,047,163 3,189,189 57,674,666 51,000,870 548,712,610 284,709,766 7,090,601
Withholding taxes on dividends and other investment income (29,396) 2,050 (148,004) (3,820,737) (84,407) (411,905) (3,176) (50,566) (28,380) (715,657) (23,714,071) (4,114,496) (122,088)
Increase/(decrease) in net assets attributable to redeemable participating shareholders from operations 1,005,886 592,562 6,945,006 219,742,815 4,218,413 26,306,571 13,043,987 3,138,623 57,646,286 50,285,213 524,998,539 280,595,270 6,968,513
** This Fund closed during the financial period.
03613-1B.indd 291 19/08/2020 19:04

292
BNY MelloN GloBal FuNds, plc
Statement oF ComprehenSive inCome
For the financial period ended 30 June 2019 (cont’d.)
BNY Mellon S&P
500® Index
Tracker
BNY Mellon Small Cap
Euroland Fund
BNY Mellon Sustainable
Global Dynamic
Bond Fund*
BNY Mellon Targeted
Return Bond Fund
BNY Mellon U.S.
Dynamic Value Fund
BNY Mellon U.S.
Equity Income
Fund
BNY Mellon U.S.
High Yield BetaFund
BNY Mellon U.S.
Municipal Infrastructure
Debt Fund
BNY Mellon U.S.
Opportunistic Alpha Fund
BNY Mellon US
Opportunities Fund
Total 30 June
2019^
Notes USD EUR EUR USD USD USD USD USD USD USD USD
IncomeBank interest income 2,194 7 549 7,940 807 107,529 5,720 20,005 1,775 1,304 711,019Dividend income 769,919 1,975,508 – – 284,489 6,108,519 – – 2,913 204,034 134,205,345Securities lending income 13 13,999 24,782 – 1,863 3,520 12,679 23,682 – – 3,484 1,543,481net gains/(losses) on financial assets/liabilities at fair value through profit or loss
net realised gains/(losses) on financial assets/liabilities held at fair value through profit or loss 9,252,465 (988,705) 137,302 (1,895,087) (207,133) 2,163,422 (1,477,617) 2,868,641 188,458 (432,781) (30,424,004)net change in unrealised gains/(losses) on financial assets/liabilities held at fair value through profit or loss 2,841,001 12,959,715 3,229,564 3,730,105 3,263,450 48,845,829 10,423,864 17,382,263 (223,093) 5,868,198 1,343,126,508
Total income 12,879,578 13,971,307 3,367,415 1,844,821 3,345,133 57,237,978 8,975,649 20,270,909 (29,947) 5,644,239 1,449,162,349
Expensesmanagement fee 3 198,297 480,709 40,470 261,011 130,756 941,323 139,063 633,067 18,295 116,094 50,669,795performance fee 3 – – – – – – – – – – 730,423Depositary fee 5 37,025 25,907 27,157 29,306 19,833 32,497 16,968 27,919 8,322 7,218 2,512,838operating expenses 7 48,850 35,189 28,613 41,551 10,664 198,888 138,877 171,749 9,186 12,392 6,938,743Dividend expense – – – – – – – – – – 20,289,363Finance charges on swaps – – – – – – – – – – 2,143,982rebate due (from)/to the manager 6 – – (24,593) – – 1,265 (36,405) 638 (13,956) 6,299 (272,051)
Total expenses 284,172 541,805 71,647 331,868 161,253 1,173,973 258,503 833,373 21,847 142,003 83,013,093
Net income/(expense) 12,595,406 13,429,502 3,295,768 1,512,953 3,183,880 56,064,005 8,717,146 19,437,536 (51,794) 5,502,236 1,366,149,256
Finance costsBank interest – 5,064 2,458 76 – 2,104 – 185 – 73 709,474Distributions 50 195,846 61,251 891,481 39 4,421,237 4,621,217 6,820,276 – 5,789 132,245,229
Profit/(loss) for the financial period 12,595,356 13,228,592 3,232,059 621,396 3,183,841 51,640,664 4,095,929 12,617,075 (51,794) 5,496,374 1,233,194,553
Withholding taxes on dividends and other investment income (246,096) (381,016) (46,285) (27,830) (85,540) (1,713,243) (33,357) – (7,751) (58,202) (23,897,114)
Increase/(decrease) in net assets attributable to redeemable participating shareholders from operations 12,349,260 12,847,576 3,185,774 593,566 3,098,301 49,927,421 4,062,572 12,617,075 (59,545) 5,438,172 1,209,297,439
* This Fund launched during the financial period.^ The Company Total as at 30 June 2019 has been adjusted to account for cross investments by BNY Mellon Euroland Bond Fund and BNY Mellon European Credit Fund.
03613-1B.indd 292 19/08/2020 19:04
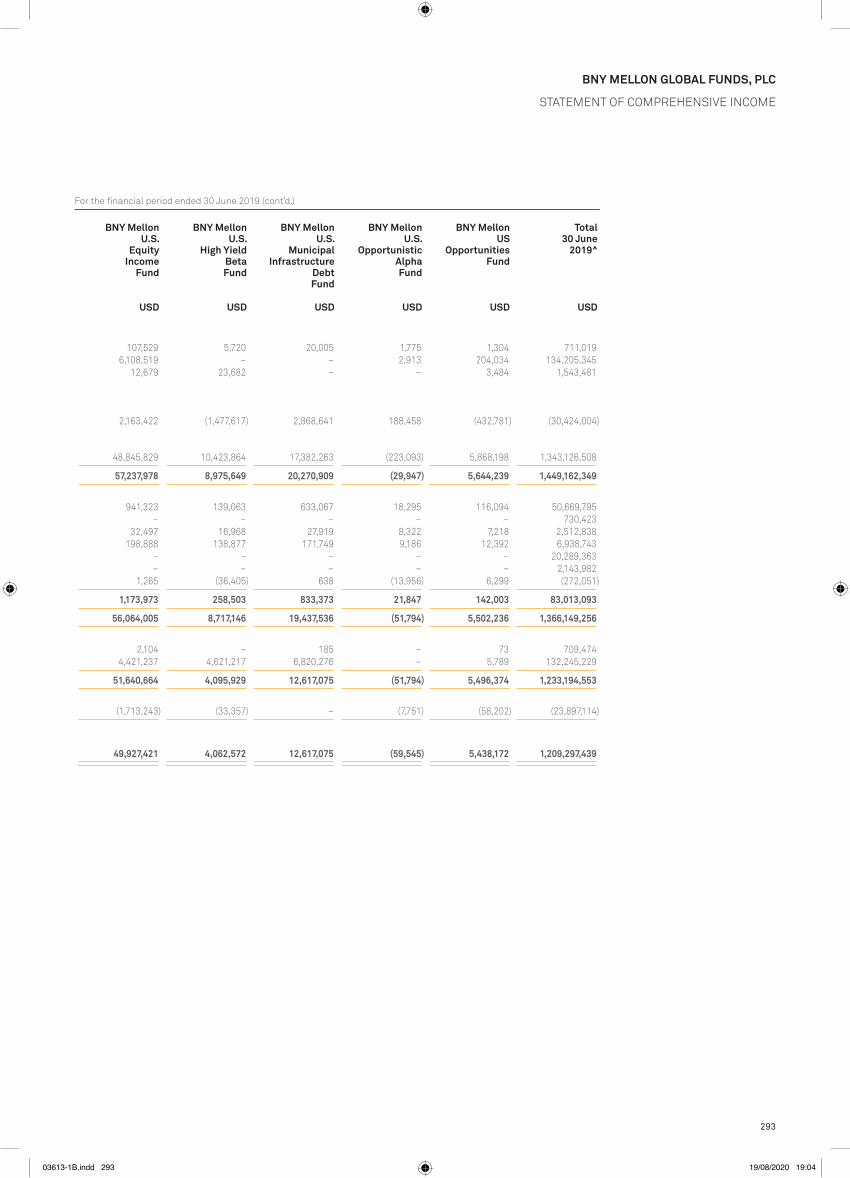
293
BNY MelloN GloBal FuNds, plc
Statement oF ComprehenSive inCome
For the financial period ended 30 June 2019 (cont’d.)
BNY Mellon S&P
500® Index
Tracker
BNY Mellon Small Cap
Euroland Fund
BNY Mellon Sustainable
Global Dynamic
Bond Fund*
BNY Mellon Targeted
Return Bond Fund
BNY Mellon U.S.
Dynamic Value Fund
BNY Mellon U.S.
Equity Income
Fund
BNY Mellon U.S.
High Yield BetaFund
BNY Mellon U.S.
Municipal Infrastructure
Debt Fund
BNY Mellon U.S.
Opportunistic Alpha Fund
BNY Mellon US
Opportunities Fund
Total 30 June
2019^
Notes USD EUR EUR USD USD USD USD USD USD USD USD
IncomeBank interest income 2,194 7 549 7,940 807 107,529 5,720 20,005 1,775 1,304 711,019Dividend income 769,919 1,975,508 – – 284,489 6,108,519 – – 2,913 204,034 134,205,345Securities lending income 13 13,999 24,782 – 1,863 3,520 12,679 23,682 – – 3,484 1,543,481net gains/(losses) on financial assets/liabilities at fair value through profit or loss
net realised gains/(losses) on financial assets/liabilities held at fair value through profit or loss 9,252,465 (988,705) 137,302 (1,895,087) (207,133) 2,163,422 (1,477,617) 2,868,641 188,458 (432,781) (30,424,004)net change in unrealised gains/(losses) on financial assets/liabilities held at fair value through profit or loss 2,841,001 12,959,715 3,229,564 3,730,105 3,263,450 48,845,829 10,423,864 17,382,263 (223,093) 5,868,198 1,343,126,508
Total income 12,879,578 13,971,307 3,367,415 1,844,821 3,345,133 57,237,978 8,975,649 20,270,909 (29,947) 5,644,239 1,449,162,349
Expensesmanagement fee 3 198,297 480,709 40,470 261,011 130,756 941,323 139,063 633,067 18,295 116,094 50,669,795performance fee 3 – – – – – – – – – – 730,423Depositary fee 5 37,025 25,907 27,157 29,306 19,833 32,497 16,968 27,919 8,322 7,218 2,512,838operating expenses 7 48,850 35,189 28,613 41,551 10,664 198,888 138,877 171,749 9,186 12,392 6,938,743Dividend expense – – – – – – – – – – 20,289,363Finance charges on swaps – – – – – – – – – – 2,143,982rebate due (from)/to the manager 6 – – (24,593) – – 1,265 (36,405) 638 (13,956) 6,299 (272,051)
Total expenses 284,172 541,805 71,647 331,868 161,253 1,173,973 258,503 833,373 21,847 142,003 83,013,093
Net income/(expense) 12,595,406 13,429,502 3,295,768 1,512,953 3,183,880 56,064,005 8,717,146 19,437,536 (51,794) 5,502,236 1,366,149,256
Finance costsBank interest – 5,064 2,458 76 – 2,104 – 185 – 73 709,474Distributions 50 195,846 61,251 891,481 39 4,421,237 4,621,217 6,820,276 – 5,789 132,245,229
Profit/(loss) for the financial period 12,595,356 13,228,592 3,232,059 621,396 3,183,841 51,640,664 4,095,929 12,617,075 (51,794) 5,496,374 1,233,194,553
Withholding taxes on dividends and other investment income (246,096) (381,016) (46,285) (27,830) (85,540) (1,713,243) (33,357) – (7,751) (58,202) (23,897,114)
Increase/(decrease) in net assets attributable to redeemable participating shareholders from operations 12,349,260 12,847,576 3,185,774 593,566 3,098,301 49,927,421 4,062,572 12,617,075 (59,545) 5,438,172 1,209,297,439
* This Fund launched during the financial period.^ The Company Total as at 30 June 2019 has been adjusted to account for cross investments by BNY Mellon Euroland Bond Fund and BNY Mellon European Credit Fund.
03613-1B.indd 293 19/08/2020 19:04

as at 30 June 2020 (cont’d.)
294
BNY Mellon Absolute
Return Bond Fund
BNY Mellon Absolute
Return Equity
Fund
BNY Mellon Absolute
Return Global Convertible
Fund
BNY Mellon Asia
Rising Stars Fund
BNY Mellon Asian
Equity Fund
BNY Mellon Asian
Income Fund
BNY Mellon Brazil
Equity Fund
BNY Mellon Digital Assets
Fund
BNY Mellon Dynamic
Total Return
Fund
BNY Mellon Dynamic
U.S. Equity
Fund
BNY Mellon Efficient Global IG
Corporate Beta
Fund*
BNY Mellon Efficient
U.S. High Yield
Beta Fund
BNY Mellon Emerging
Markets Corporate
Debt Fund
Notes EUR GBP EUR USD USD USD USD USD USD USD USD USD USD
Assets (due within one year)Financial assets at fair value through profit or loss 15 284,720,154 256,504,073 30,895,397 6,882,349 37,607,784 28,472,079 59,686,934 10,939,032 22,079,836 376,292,003 62,390,626 1,003,456,106 298,949,848Cash and cash equivalents 8 40,276,306 19,557,173 1,396,091 459,671 1,616,925 1,047,040 3,288,882 71,248 2,776,206 29,742,569 706,322 3,141,670 6,731,593income receivable 1,646,238 570,284 79,506 22,733 25,335 149,245 628,984 3,084 – 189,708 554,332 16,186,235 4,420,029receivable for investments sold 2,226,986 26,867 1,358,238 3,561 – – – – 66,612 – – 41,876 8,288,670rebate receivable from the manager 6 – – 802 2,842 – 11,796 – 4,718 – 9,204 4,124 22,063 –margins on derivatives contracts 8 14,653,164 2,854,394 311,360 – – – – – 1,164,404 – 324,047 3,030,286 1,290,000Cash collateral received from broker 4,484,000 5,300,000 270,000 – – – – – – – – – –Subscriptions receivable 26,562 9,277 – – – – 287 – – 6,026 – 116,420 21,683other receivables 10,204 15,206 590 10,406 51 1,384 507 2,710 58 46,587 12,943 3,572,834 5,564
348,043,614 284,837,274 34,311,984 7,381,562 39,250,095 29,681,544 63,605,594 11,020,792 26,087,116 406,286,097 63,992,394 1,029,567,490 319,707,387
Liabilities (due within one year)Financial liabilities at fair value through profit or loss 15 21,851,410 6,628,499 2,017,561 8,289 568 3 68,926 5,869 347,004 3,595 1,597,971 11,075,652 3,262,058Bank overdraft 8 1,925 – – – – 78,507 – – 893,881 – – – –payable for investments purchased 433,621 176,287 3,094,047 6,133 485,031 10,797 – – – – – 121,516,648 7,655,648redemptions payable 3,654,681 248,572 – – 46 42,296 – – 42,451 – – – 46,039expenses payable 283,168 299,891 41,704 33,384 80,512 30,443 192,904 31,033 23,890 174,235 13,704 191,465 243,633performance fees payable 3 485 – 44,543 – – – – – – – – – –margins on derivatives contracts 8 472,762 – 254,627 – – – – – 666,574 51,860 2,184 – –Cash collateral payable to broker 4,484,000 5,300,000 270,000 – – – – – – – – – –income payable on swaps 341,399 – 5,296 – – – – – – – – 2,376 –Finance charges payable on swaps – 22,812 13,574 – – – – – – – – – –tax payable 9 – – – – – – 2,360,662 – – – – – –other payables – 235,147 – – 145,282 – – – – – – – –
31,523,451 12,911,208 5,741,352 47,806 711,439 162,046 2,622,492 36,902 1,973,800 229,690 1,613,859 132,786,141 11,207,378
Net assets attributable to redeemable participating shareholders 316,520,163 271,926,066 28,570,632 7,333,756 38,538,656 29,519,498 60,983,102 10,983,890 24,113,316 406,056,407 62,378,535 896,781,349 308,500,009
* Please refer to Note 18 of the financial statements.
The accompanying notes form an integral part of these financial statements.
Statement oF FinanCial poSition
03613-1B.indd 294 19/08/2020 19:04

as at 30 June 2020 (cont’d.)
295
BNY MelloN GloBal FuNds, plc
Statement oF FinanCial poSition
BNY Mellon Absolute
Return Bond Fund
BNY Mellon Absolute
Return Equity
Fund
BNY Mellon Absolute
Return Global Convertible
Fund
BNY Mellon Asia
Rising Stars Fund
BNY Mellon Asian
Equity Fund
BNY Mellon Asian
Income Fund
BNY Mellon Brazil
Equity Fund
BNY Mellon Digital Assets
Fund
BNY Mellon Dynamic
Total Return
Fund
BNY Mellon Dynamic
U.S. Equity
Fund
BNY Mellon Efficient Global IG
Corporate Beta
Fund*
BNY Mellon Efficient
U.S. High Yield
Beta Fund
BNY Mellon Emerging
Markets Corporate
Debt Fund
Notes EUR GBP EUR USD USD USD USD USD USD USD USD USD USD
Assets (due within one year)Financial assets at fair value through profit or loss 15 284,720,154 256,504,073 30,895,397 6,882,349 37,607,784 28,472,079 59,686,934 10,939,032 22,079,836 376,292,003 62,390,626 1,003,456,106 298,949,848Cash and cash equivalents 8 40,276,306 19,557,173 1,396,091 459,671 1,616,925 1,047,040 3,288,882 71,248 2,776,206 29,742,569 706,322 3,141,670 6,731,593income receivable 1,646,238 570,284 79,506 22,733 25,335 149,245 628,984 3,084 – 189,708 554,332 16,186,235 4,420,029receivable for investments sold 2,226,986 26,867 1,358,238 3,561 – – – – 66,612 – – 41,876 8,288,670rebate receivable from the manager 6 – – 802 2,842 – 11,796 – 4,718 – 9,204 4,124 22,063 –margins on derivatives contracts 8 14,653,164 2,854,394 311,360 – – – – – 1,164,404 – 324,047 3,030,286 1,290,000Cash collateral received from broker 4,484,000 5,300,000 270,000 – – – – – – – – – –Subscriptions receivable 26,562 9,277 – – – – 287 – – 6,026 – 116,420 21,683other receivables 10,204 15,206 590 10,406 51 1,384 507 2,710 58 46,587 12,943 3,572,834 5,564
348,043,614 284,837,274 34,311,984 7,381,562 39,250,095 29,681,544 63,605,594 11,020,792 26,087,116 406,286,097 63,992,394 1,029,567,490 319,707,387
Liabilities (due within one year)Financial liabilities at fair value through profit or loss 15 21,851,410 6,628,499 2,017,561 8,289 568 3 68,926 5,869 347,004 3,595 1,597,971 11,075,652 3,262,058Bank overdraft 8 1,925 – – – – 78,507 – – 893,881 – – – –payable for investments purchased 433,621 176,287 3,094,047 6,133 485,031 10,797 – – – – – 121,516,648 7,655,648redemptions payable 3,654,681 248,572 – – 46 42,296 – – 42,451 – – – 46,039expenses payable 283,168 299,891 41,704 33,384 80,512 30,443 192,904 31,033 23,890 174,235 13,704 191,465 243,633performance fees payable 3 485 – 44,543 – – – – – – – – – –margins on derivatives contracts 8 472,762 – 254,627 – – – – – 666,574 51,860 2,184 – –Cash collateral payable to broker 4,484,000 5,300,000 270,000 – – – – – – – – – –income payable on swaps 341,399 – 5,296 – – – – – – – – 2,376 –Finance charges payable on swaps – 22,812 13,574 – – – – – – – – – –tax payable 9 – – – – – – 2,360,662 – – – – – –other payables – 235,147 – – 145,282 – – – – – – – –
31,523,451 12,911,208 5,741,352 47,806 711,439 162,046 2,622,492 36,902 1,973,800 229,690 1,613,859 132,786,141 11,207,378
Net assets attributable to redeemable participating shareholders 316,520,163 271,926,066 28,570,632 7,333,756 38,538,656 29,519,498 60,983,102 10,983,890 24,113,316 406,056,407 62,378,535 896,781,349 308,500,009
* Please refer to Note 18 of the financial statements.
The accompanying notes form an integral part of these financial statements.
03613-1B.indd 295 19/08/2020 19:04

as at 30 June 2020 (cont’d.)
296
BNY MelloN GloBal FuNds, plc
Statement oF FinanCial poSition
BNY Mellon Emerging
Markets Debt Fund
BNY Mellon Emerging
Markets Debt Local
Currency Fund
BNY Mellon Emerging
Markets Debt Opportunistic
Fund
BNY Mellon Emerging
Markets Debt Total Return
Fund
BNY Mellon Euroland
Bond Fund
BNY Mellon European
Credit Fund
BNY Mellon Global
Bond Fund
BNY Mellon Global Credit
Fund
BNY Mellon Global
Dynamic Bond Fund
BNY Mellon Global
Emerging Markets
Fund
BNY Mellon Global Equity
Fund
BNY Mellon Global Equity
Income Fund
BNY Mellon Global
High Yield Bond Fund
Notes USD USD USD USD EUR EUR USD USD USD USD USD USD USD
Assets (due within one year)Financial assets at fair value through profit or loss 15 28,957,426 251,010,312 28,954,718 196,700,666 520,608,932 68,697,934 586,424,410 621,220,801 361,079,162 30,063,048 356,893,259 1,184,580,753 108,161,727Cash and cash equivalents 8 525,065 8,013,781 744,641 4,952,400 20,136,581 3,839,515 10,031,702 4,814,045 7,566,683 519,702 7,142,131 26,106,497 3,393,602income receivable 386,759 4,417,684 468,998 2,276,234 3,740,317 372,203 4,002,898 3,406,886 2,426,717 17,743 316,339 2,266,263 1,800,438receivable for investments sold 130,812 2,190,669 – 193,619 15,218,939 198,444 – – 1,451,999 – – 3,546,198 1,946,681rebate receivable from the manager 6 – – – 368 – – – 128 – 26,542 – – –margins on derivatives contracts 8 22,212 – 14,358 1,960,000 27,655,488 771,755 915,674 3,450,879 734,166 – 510,000 – –Cash collateral received from broker – 290,000 – 260,000 2,074,591 – 1,150,000 1,870,000 1,730,000 – – – –Subscriptions receivable – – – – 1,272,523 – 983,847 16,839 252,815 – 852,853 83 113,674other receivables 213 54,200 930 – 342 1,366 1,678 1,903 1,052,841 2,888 13,387 5,236 267
30,022,487 265,976,646 30,183,645 206,343,287 590,707,713 73,881,217 603,510,209 634,781,481 376,294,383 30,629,923 365,727,969 1,216,505,030 115,416,389
Liabilities (due within one year)Financial liabilities at fair value through profit or loss 15 58,442 3,456,911 185,585 5,803,453 2,976,244 43,127 1,267,106 12,505,576 2,490,159 9,635 378,554 570,150 469,320Bank overdraft 8 – 8,048,530 – 7,817 297 – 16,695 91,932 1,324,091 – 231,881 716,465 325,781payable for investments purchased 426,866 555,400 447,170 7,912,976 3,535,006 195,736 – 7,070,553 493,863 85,225 – 3,981,637 3,010,610redemptions payable – 348,500 – – 21,221,782 – 473,924 – 132,361 35,802 2,674,018 7,555,597 –expenses payable 59,317 497,093 17,618 142,075 508,779 19,828 454,617 96,727 308,389 61,349 420,066 1,468,843 104,145performance fees payable 3 – – – – – – – – – – – – –margins on derivatives contracts 8 17,901 – 10,806 – 23,491,884 649,525 – 1,064,993 – – – – –Cash collateral payable to broker – 290,000 – 260,000 2,074,591 – 1,150,000 1,870,000 1,730,000 – – – –income payable on swaps – – – – – – – 121,822 – – – – –Finance charges payable on swaps – – – – – – – – – – – – –tax payable 9 – – – – – – – – – – – – –other payables – – – – – – 707,575 – – – – 622,746 –
562,526 13,196,434 661,179 14,126,321 53,808,583 908,216 4,069,917 22,821,603 6,478,863 192,011 3,704,519 14,915,438 3,909,856
Net assets attributable to redeemable participating shareholders 29,459,961 252,780,212 29,522,466 192,216,966 536,899,130 72,973,001 599,440,292 611,959,878 369,815,520 30,437,912 362,023,450 1,201,589,592 111,506,533
03613-1B.indd 296 19/08/2020 19:04

as at 30 June 2020 (cont’d.)
297
BNY MelloN GloBal FuNds, plc
Statement oF FinanCial poSition
BNY Mellon Emerging
Markets Debt Fund
BNY Mellon Emerging
Markets Debt Local
Currency Fund
BNY Mellon Emerging
Markets Debt Opportunistic
Fund
BNY Mellon Emerging
Markets Debt Total Return
Fund
BNY Mellon Euroland
Bond Fund
BNY Mellon European
Credit Fund
BNY Mellon Global
Bond Fund
BNY Mellon Global Credit
Fund
BNY Mellon Global
Dynamic Bond Fund
BNY Mellon Global
Emerging Markets
Fund
BNY Mellon Global Equity
Fund
BNY Mellon Global Equity
Income Fund
BNY Mellon Global
High Yield Bond Fund
Notes USD USD USD USD EUR EUR USD USD USD USD USD USD USD
Assets (due within one year)Financial assets at fair value through profit or loss 15 28,957,426 251,010,312 28,954,718 196,700,666 520,608,932 68,697,934 586,424,410 621,220,801 361,079,162 30,063,048 356,893,259 1,184,580,753 108,161,727Cash and cash equivalents 8 525,065 8,013,781 744,641 4,952,400 20,136,581 3,839,515 10,031,702 4,814,045 7,566,683 519,702 7,142,131 26,106,497 3,393,602income receivable 386,759 4,417,684 468,998 2,276,234 3,740,317 372,203 4,002,898 3,406,886 2,426,717 17,743 316,339 2,266,263 1,800,438receivable for investments sold 130,812 2,190,669 – 193,619 15,218,939 198,444 – – 1,451,999 – – 3,546,198 1,946,681rebate receivable from the manager 6 – – – 368 – – – 128 – 26,542 – – –margins on derivatives contracts 8 22,212 – 14,358 1,960,000 27,655,488 771,755 915,674 3,450,879 734,166 – 510,000 – –Cash collateral received from broker – 290,000 – 260,000 2,074,591 – 1,150,000 1,870,000 1,730,000 – – – –Subscriptions receivable – – – – 1,272,523 – 983,847 16,839 252,815 – 852,853 83 113,674other receivables 213 54,200 930 – 342 1,366 1,678 1,903 1,052,841 2,888 13,387 5,236 267
30,022,487 265,976,646 30,183,645 206,343,287 590,707,713 73,881,217 603,510,209 634,781,481 376,294,383 30,629,923 365,727,969 1,216,505,030 115,416,389
Liabilities (due within one year)Financial liabilities at fair value through profit or loss 15 58,442 3,456,911 185,585 5,803,453 2,976,244 43,127 1,267,106 12,505,576 2,490,159 9,635 378,554 570,150 469,320Bank overdraft 8 – 8,048,530 – 7,817 297 – 16,695 91,932 1,324,091 – 231,881 716,465 325,781payable for investments purchased 426,866 555,400 447,170 7,912,976 3,535,006 195,736 – 7,070,553 493,863 85,225 – 3,981,637 3,010,610redemptions payable – 348,500 – – 21,221,782 – 473,924 – 132,361 35,802 2,674,018 7,555,597 –expenses payable 59,317 497,093 17,618 142,075 508,779 19,828 454,617 96,727 308,389 61,349 420,066 1,468,843 104,145performance fees payable 3 – – – – – – – – – – – – –margins on derivatives contracts 8 17,901 – 10,806 – 23,491,884 649,525 – 1,064,993 – – – – –Cash collateral payable to broker – 290,000 – 260,000 2,074,591 – 1,150,000 1,870,000 1,730,000 – – – –income payable on swaps – – – – – – – 121,822 – – – – –Finance charges payable on swaps – – – – – – – – – – – – –tax payable 9 – – – – – – – – – – – – –other payables – – – – – – 707,575 – – – – 622,746 –
562,526 13,196,434 661,179 14,126,321 53,808,583 908,216 4,069,917 22,821,603 6,478,863 192,011 3,704,519 14,915,438 3,909,856
Net assets attributable to redeemable participating shareholders 29,459,961 252,780,212 29,522,466 192,216,966 536,899,130 72,973,001 599,440,292 611,959,878 369,815,520 30,437,912 362,023,450 1,201,589,592 111,506,533
03613-1B.indd 297 19/08/2020 19:04

as at 30 June 2020 (cont’d.)
298
BNY MelloN GloBal FuNds, plc
Statement oF FinanCial poSition
BNY Mellon Global
Infrastructure Income
Fund
BNY Mellon Global
Leaders Fund
BNY Mellon Global
Multi-Asset Income
Fund
BNY Mellon Global
Opportunities Fund
BNY Mellon Global
Real Return
Fund (EUR)
BNY Mellon Global
Real Return
Fund (GBP)
BNY Mellon Global
Real Return
Fund (USD)
BNY Mellon Global
Short-Dated High Yield
Bond Fund
BNY Mellon Global
Unconstrained Fund
BNY Mellon Japan
Small Cap Equity Focus
Fund
BNY Mellon Long-Term
Global Equity
Fund
BNY Mellon Mobility
Innovation Fund
BNY Mellon S&P
500® Index
Tracker
Notes USD USD EUR USD EUR GBP USD USD USD JPY EUR USD USD
Assets (due within one year)Financial assets at fair value through profit or loss 15 148,358,700 62,584,391 20,421,067 33,438,108 2,588,228,044 61,020,664 270,571,302 738,259,996 22,590,131 11,910,149,044 1,357,841,179 192,153,302 32,623,869Cash and cash equivalents 8 1,714,693 997,563 257,115 347,092 215,982,305 2,196,229 23,565,012 524,966 1,148,442 409,076,591 29,492,940 2,894,319 283,709income receivable 873,407 38,929 92,413 27,719 5,199,843 164,221 576,190 9,702,221 43,595 9,819,625 1,838,606 22,228 18,311receivable for investments sold – – – – – – – 5,395,332 63,188 10,812,677 – – 134,917rebate receivable from the manager 6 58 – 1,066 – – – – 1,000 72 5,936 – 7,642 1,384margins on derivatives contracts 8 – – – – 8,722,334 584,942 3,004,212 5,907,232 – – – – –Cash collateral received from broker – – – – 61,110,000 – – 750,000 – – – – –Subscriptions receivable 1,794 5,587 3,273 – 4,775,800 109,149 30,252 189,584 – – 27,234,874 3,113,023 –other receivables 7,094 187 44 3 42,759 1,209 5,117 9,661 245 1,686,512 90,781 – 48
150,955,746 63,626,657 20,774,978 33,812,922 2,884,061,085 64,076,414 297,752,085 760,739,992 23,845,673 12,341,550,385 1,416,498,380 198,190,514 33,062,238
Liabilities (due within one year)Financial liabilities at fair value through profit or loss 15 3,365,373 14,845 30,500 6,469 24,645,446 1,369,733 4,634,838 14,315,792 484,511 15,556,005 1,700 519,253 –Bank overdraft 8 – – 84,460 – 56,741 1,159 25,038 92,742 – – – – –payable for investments purchased 256,551 – – – 13,600,497 26,880 41,513 27,623,201 – 6,490,883 835,898 3,061,468 –redemptions payable 41,907 – 27,970 4,733 11,886,688 159,824 704,427 338,600 – 174,759 1,356,933 79,211 140,426expenses payable 86,843 73,912 26,586 82,109 2,485,465 76,331 282,463 364,719 12,584 12,763,480 1,573,919 197,171 60,708performance fees payable 3 – – – – – – – – – – 14,993 – –margins on derivatives contracts 8 – – – – – – – 300,295 – – – – 2,403Cash collateral payable to broker – – – – 61,110,000 – – 750,000 – – – – –income payable on swaps – – – – – – – – – – – – –Finance charges payable on swaps – – – – – – – – – – – – –tax payable 9 – – – – – – – – – – – – –other payables – – – – – – – – – – – – –
3,750,674 88,757 169,516 93,311 113,784,837 1,633,927 5,688,279 43,785,349 497,095 34,985,127 3,783,443 3,857,103 203,537
Net assets attributable to redeemable participating shareholders 147,205,072 63,537,900 20,605,462 33,719,611 2,770,276,248 62,442,487 292,063,806 716,954,643 23,348,578 12,306,565,258 1,412,714,937 194,333,411 32,858,701
03613-1B.indd 298 19/08/2020 19:04

as at 30 June 2020 (cont’d.)
299
BNY MelloN GloBal FuNds, plc
Statement oF FinanCial poSition
BNY Mellon Global
Infrastructure Income
Fund
BNY Mellon Global
Leaders Fund
BNY Mellon Global
Multi-Asset Income
Fund
BNY Mellon Global
Opportunities Fund
BNY Mellon Global
Real Return
Fund (EUR)
BNY Mellon Global
Real Return
Fund (GBP)
BNY Mellon Global
Real Return
Fund (USD)
BNY Mellon Global
Short-Dated High Yield
Bond Fund
BNY Mellon Global
Unconstrained Fund
BNY Mellon Japan
Small Cap Equity Focus
Fund
BNY Mellon Long-Term
Global Equity
Fund
BNY Mellon Mobility
Innovation Fund
BNY Mellon S&P
500® Index
Tracker
Notes USD USD EUR USD EUR GBP USD USD USD JPY EUR USD USD
Assets (due within one year)Financial assets at fair value through profit or loss 15 148,358,700 62,584,391 20,421,067 33,438,108 2,588,228,044 61,020,664 270,571,302 738,259,996 22,590,131 11,910,149,044 1,357,841,179 192,153,302 32,623,869Cash and cash equivalents 8 1,714,693 997,563 257,115 347,092 215,982,305 2,196,229 23,565,012 524,966 1,148,442 409,076,591 29,492,940 2,894,319 283,709income receivable 873,407 38,929 92,413 27,719 5,199,843 164,221 576,190 9,702,221 43,595 9,819,625 1,838,606 22,228 18,311receivable for investments sold – – – – – – – 5,395,332 63,188 10,812,677 – – 134,917rebate receivable from the manager 6 58 – 1,066 – – – – 1,000 72 5,936 – 7,642 1,384margins on derivatives contracts 8 – – – – 8,722,334 584,942 3,004,212 5,907,232 – – – – –Cash collateral received from broker – – – – 61,110,000 – – 750,000 – – – – –Subscriptions receivable 1,794 5,587 3,273 – 4,775,800 109,149 30,252 189,584 – – 27,234,874 3,113,023 –other receivables 7,094 187 44 3 42,759 1,209 5,117 9,661 245 1,686,512 90,781 – 48
150,955,746 63,626,657 20,774,978 33,812,922 2,884,061,085 64,076,414 297,752,085 760,739,992 23,845,673 12,341,550,385 1,416,498,380 198,190,514 33,062,238
Liabilities (due within one year)Financial liabilities at fair value through profit or loss 15 3,365,373 14,845 30,500 6,469 24,645,446 1,369,733 4,634,838 14,315,792 484,511 15,556,005 1,700 519,253 –Bank overdraft 8 – – 84,460 – 56,741 1,159 25,038 92,742 – – – – –payable for investments purchased 256,551 – – – 13,600,497 26,880 41,513 27,623,201 – 6,490,883 835,898 3,061,468 –redemptions payable 41,907 – 27,970 4,733 11,886,688 159,824 704,427 338,600 – 174,759 1,356,933 79,211 140,426expenses payable 86,843 73,912 26,586 82,109 2,485,465 76,331 282,463 364,719 12,584 12,763,480 1,573,919 197,171 60,708performance fees payable 3 – – – – – – – – – – 14,993 – –margins on derivatives contracts 8 – – – – – – – 300,295 – – – – 2,403Cash collateral payable to broker – – – – 61,110,000 – – 750,000 – – – – –income payable on swaps – – – – – – – – – – – – –Finance charges payable on swaps – – – – – – – – – – – – –tax payable 9 – – – – – – – – – – – – –other payables – – – – – – – – – – – – –
3,750,674 88,757 169,516 93,311 113,784,837 1,633,927 5,688,279 43,785,349 497,095 34,985,127 3,783,443 3,857,103 203,537
Net assets attributable to redeemable participating shareholders 147,205,072 63,537,900 20,605,462 33,719,611 2,770,276,248 62,442,487 292,063,806 716,954,643 23,348,578 12,306,565,258 1,412,714,937 194,333,411 32,858,701
03613-1B.indd 299 19/08/2020 19:04

as at 30 June 2020 (cont’d.)
300
BNY MelloN GloBal FuNds, plc
Statement oF FinanCial poSition
BNY Mellon Small Cap
Euroland Fund
BNY Mellon Sustainable
Global Dynamic
Bond Fund
BNY Mellon Sustainable
Global Real
Return Fund (EUR)*
BNY Mellon Targeted
Return Bond Fund
BNY Mellon U.S.
Dynamic Value Fund
BNY Mellon U.S.
Equity Income
Fund
BNY Mellon U.S.
Municipal Infrastructure
Debt Fund
Total 30 June
2020^
Notes EUR EUR EUR USD USD USD USD USD
Assets (due within one year)Financial assets at fair value through profit or loss 15 47,969,959 214,087,541 22,879,398 82,328,044 28,777,108 264,857,035 498,888,789 14,312,469,240Cash and cash equivalents 8 902,903 2,389,260 2,274,992 1,635,854 32,283 5,018,605 213,675 548,603,213income receivable 36,858 1,748,455 60,577 374,225 26,618 436,664 5,125,078 78,877,581receivable for investments sold – 1,133,062 – – 279,124 2,354,858 505,827 49,349,815rebate receivable from the manager 6 – 13,173 1,736 – – – – 110,845margins on derivatives contracts 8 270,946 1,203,741 75,514 889,684 – – – 87,770,725Cash collateral received from broker – 3,820,000 420,000 – – – – 93,709,940Subscriptions receivable 17,472 1,812,435 – – – – – 45,334,630other receivables 1,019 124 14,817 91 3 1,478 46 5,028,578
49,199,157 226,207,791 25,727,034 85,227,898 29,115,136 272,668,640 504,733,415 15,221,254,567
Liabilities (due within one year)Financial liabilities at fair value through profit or loss 15 – 1,808,462 226,687 3,636,338 – 57,341 1,998,832 142,874,023Bank overdraft 8 – 4,397 – 40,330 – – – 12,061,202payable for investments purchased – 185,565 14,205 1,015,242 246,713 2,098,511 – 212,912,188redemptions payable 9,348 975 – – 6,074 – 3,009 56,048,051expenses payable 83,426 94,446 20,976 94,660 49,366 210,425 275,240 12,792,908performance fees payable 3 – – – – – – – 67,434margins on derivatives contracts 8 – – – – – – – 30,057,131Cash collateral payable to broker – 3,820,000 420,000 – – – – 93,709,940income payable on swaps – – – – – – – 513,710Finance charges payable on swaps – – – – – – – 43,517tax payable 9 – – – – – – – 2,360,662other payables – – – – – – – 1,766,974
92,774 5,913,845 681,868 4,786,570 302,153 2,366,277 2,277,081 565,207,740
Net assets attributable to redeemable participating shareholders 49,106,383 220,293,946 25,045,166 80,441,328 28,812,983 270,302,363 502,456,334 14,656,046,827
* Please refer to Note 18 of the financial statements.^ The Company Total as at 30 June 2020 has been adjusted to account for cross investments by BNY Mellon Euroland Bond Fund and BNY Mellon European Credit Fund.
03613-1B.indd 300 19/08/2020 19:04

as at 30 June 2020 (cont’d.)
301
BNY MelloN GloBal FuNds, plc
Statement oF FinanCial poSition
BNY Mellon Small Cap
Euroland Fund
BNY Mellon Sustainable
Global Dynamic
Bond Fund
BNY Mellon Sustainable
Global Real
Return Fund (EUR)*
BNY Mellon Targeted
Return Bond Fund
BNY Mellon U.S.
Dynamic Value Fund
BNY Mellon U.S.
Equity Income
Fund
BNY Mellon U.S.
Municipal Infrastructure
Debt Fund
Total 30 June
2020^
Notes EUR EUR EUR USD USD USD USD USD
Assets (due within one year)Financial assets at fair value through profit or loss 15 47,969,959 214,087,541 22,879,398 82,328,044 28,777,108 264,857,035 498,888,789 14,312,469,240Cash and cash equivalents 8 902,903 2,389,260 2,274,992 1,635,854 32,283 5,018,605 213,675 548,603,213income receivable 36,858 1,748,455 60,577 374,225 26,618 436,664 5,125,078 78,877,581receivable for investments sold – 1,133,062 – – 279,124 2,354,858 505,827 49,349,815rebate receivable from the manager 6 – 13,173 1,736 – – – – 110,845margins on derivatives contracts 8 270,946 1,203,741 75,514 889,684 – – – 87,770,725Cash collateral received from broker – 3,820,000 420,000 – – – – 93,709,940Subscriptions receivable 17,472 1,812,435 – – – – – 45,334,630other receivables 1,019 124 14,817 91 3 1,478 46 5,028,578
49,199,157 226,207,791 25,727,034 85,227,898 29,115,136 272,668,640 504,733,415 15,221,254,567
Liabilities (due within one year)Financial liabilities at fair value through profit or loss 15 – 1,808,462 226,687 3,636,338 – 57,341 1,998,832 142,874,023Bank overdraft 8 – 4,397 – 40,330 – – – 12,061,202payable for investments purchased – 185,565 14,205 1,015,242 246,713 2,098,511 – 212,912,188redemptions payable 9,348 975 – – 6,074 – 3,009 56,048,051expenses payable 83,426 94,446 20,976 94,660 49,366 210,425 275,240 12,792,908performance fees payable 3 – – – – – – – 67,434margins on derivatives contracts 8 – – – – – – – 30,057,131Cash collateral payable to broker – 3,820,000 420,000 – – – – 93,709,940income payable on swaps – – – – – – – 513,710Finance charges payable on swaps – – – – – – – 43,517tax payable 9 – – – – – – – 2,360,662other payables – – – – – – – 1,766,974
92,774 5,913,845 681,868 4,786,570 302,153 2,366,277 2,277,081 565,207,740
Net assets attributable to redeemable participating shareholders 49,106,383 220,293,946 25,045,166 80,441,328 28,812,983 270,302,363 502,456,334 14,656,046,827
* Please refer to Note 18 of the financial statements.^ The Company Total as at 30 June 2020 has been adjusted to account for cross investments by BNY Mellon Euroland Bond Fund and BNY Mellon European Credit Fund.
03613-1B.indd 301 19/08/2020 19:04

as at 31 December 2019 (cont’d.)
302
BNY MelloN GloBal FuNds, plc
Statement oF FinanCial poSition
BNY Mellon Absolute
Return Bond Fund
BNY Mellon Absolute
Return Equity
Fund
BNY Mellon Absolute
Return GlobalConvertible
Fund*
BNY Mellon Asia
Rising Stars Fund
BNY Mellon Asian
Equity Fund
BNY Mellon Asian
Income Fund
BNY Mellon Brazil
Equity Fund
BNY Mellon Digital Assets Fund*
BNY Mellon Dynamic
Total Return
Fund
BNY Mellon Dynamic
U.S. Equity
Fund
BNY Mellon Efficient
U.S. High Yield
Beta Fund*
BNY Mellon Emerging
Markets Corporate
Debt Fund
BNY Mellon Emerging
Markets Debt Fund
Notes EUR GBP EUR USD USD USD USD USD USD USD USD USD USD
Assets (due within one year)Financial assets at fair value through profit or loss 16 383,970,231 383,728,086 28,890,599 7,994,784 37,798,860 30,178,638 105,778,054 11,058,915 24,826,343 168,591,430 697,115,602 348,695,132 50,624,111Cash and cash equivalents 9 13,884,036 324,193 640,948 286,710 457,887 760,875 4,101,600 50,806 2,092,643 13,457,014 6,260,423 3,808,264 1,472,332income receivable 1,996,670 140,797 61,688 7,948 33,098 118,499 727,561 7,263 – 100,553 11,284,397 4,275,174 785,109receivable for investments sold 781,210 391,647 – – – – 285,615 – – – – 3,546,146 –rebate receivable from the manager 6 – – 25,198 18,390 – 6,556 – 18,331 461 9,246 70,647 – –margins on derivatives contracts 9 16,169,915 3,668,992 22,000 – – – – – 529,281 163,796 2,309,638 457,259 138,765Cash collateral received from broker 2,760,000 5,220,000 – – – – – – – – – – –Subscriptions receivable 26,667 83,622 – – – – 555,670 5,721 – 37,211 – 326,778 –other receivables 5,464 154,908 – 10,388 68 616 18 – 262 – – 24 22
419,594,193 393,712,245 29,640,433 8,318,220 38,289,913 31,065,184 111,448,518 11,141,036 27,448,990 182,359,250 717,040,707 361,108,777 53,020,339
Liabilities (due within one year)Financial liabilities at fair value through profit or loss 16 17,540,221 10,356,951 1,152,308 – 6 43 867 21 257,564 514,632 15,359 711,772 123,996Bank overdraft 9 1,005,340 5,016,328 – – 1,413 – – – 2,502 – – – –payable for investments purchased – 151,156 2,232 – – – – – – 129,857 291,629 – –redemptions payable 24,635 770,380 – – 24,001 – 308,231 – – – – 8,495 18,110expenses payable 333,003 419,395 38,090 34,657 90,754 33,603 205,701 28,826 28,639 82,173 241,951 267,853 76,755performance fees payable 3 2 – 53,917 – – – – – – – – – –margins on derivatives contracts 9 588,760 – 3,685 – – – – – 685,429 – – – 128,688Cash collateral payable to broker 2,760,000 5,220,000 – – – – – – – – – – –income payable on swaps – – – – – – – – – – – – –Finance charges payable on swaps – 46,081 – – – – – – – – – – –tax payable 10 – – – – – – 5,339,693 – – – – – –other payables – 228,615 – – – – – – – – – – –
22,251,961 22,208,906 1,250,232 34,657 116,174 33,646 5,854,492 28,847 974,134 726,662 548,939 988,120 347,549
Net assets attributable to redeemable participating shareholders 397,342,232 371,503,339 28,390,201 8,283,563 38,173,739 31,031,538 105,594,026 11,112,189 26,474,856 181,632,588 716,491,768 360,120,657 52,672,790
* This Fund launched during the financial year.
The accompanying notes form an integral part of these financial statements.
03613-1B.indd 302 19/08/2020 19:04

as at 31 December 2019 (cont’d.)
303
BNY MelloN GloBal FuNds, plc
Statement oF FinanCial poSition
BNY Mellon Absolute
Return Bond Fund
BNY Mellon Absolute
Return Equity
Fund
BNY Mellon Absolute
Return GlobalConvertible
Fund*
BNY Mellon Asia
Rising Stars Fund
BNY Mellon Asian
Equity Fund
BNY Mellon Asian
Income Fund
BNY Mellon Brazil
Equity Fund
BNY Mellon Digital Assets Fund*
BNY Mellon Dynamic
Total Return
Fund
BNY Mellon Dynamic
U.S. Equity
Fund
BNY Mellon Efficient
U.S. High Yield
Beta Fund*
BNY Mellon Emerging
Markets Corporate
Debt Fund
BNY Mellon Emerging
Markets Debt Fund
Notes EUR GBP EUR USD USD USD USD USD USD USD USD USD USD
Assets (due within one year)Financial assets at fair value through profit or loss 16 383,970,231 383,728,086 28,890,599 7,994,784 37,798,860 30,178,638 105,778,054 11,058,915 24,826,343 168,591,430 697,115,602 348,695,132 50,624,111Cash and cash equivalents 9 13,884,036 324,193 640,948 286,710 457,887 760,875 4,101,600 50,806 2,092,643 13,457,014 6,260,423 3,808,264 1,472,332income receivable 1,996,670 140,797 61,688 7,948 33,098 118,499 727,561 7,263 – 100,553 11,284,397 4,275,174 785,109receivable for investments sold 781,210 391,647 – – – – 285,615 – – – – 3,546,146 –rebate receivable from the manager 6 – – 25,198 18,390 – 6,556 – 18,331 461 9,246 70,647 – –margins on derivatives contracts 9 16,169,915 3,668,992 22,000 – – – – – 529,281 163,796 2,309,638 457,259 138,765Cash collateral received from broker 2,760,000 5,220,000 – – – – – – – – – – –Subscriptions receivable 26,667 83,622 – – – – 555,670 5,721 – 37,211 – 326,778 –other receivables 5,464 154,908 – 10,388 68 616 18 – 262 – – 24 22
419,594,193 393,712,245 29,640,433 8,318,220 38,289,913 31,065,184 111,448,518 11,141,036 27,448,990 182,359,250 717,040,707 361,108,777 53,020,339
Liabilities (due within one year)Financial liabilities at fair value through profit or loss 16 17,540,221 10,356,951 1,152,308 – 6 43 867 21 257,564 514,632 15,359 711,772 123,996Bank overdraft 9 1,005,340 5,016,328 – – 1,413 – – – 2,502 – – – –payable for investments purchased – 151,156 2,232 – – – – – – 129,857 291,629 – –redemptions payable 24,635 770,380 – – 24,001 – 308,231 – – – – 8,495 18,110expenses payable 333,003 419,395 38,090 34,657 90,754 33,603 205,701 28,826 28,639 82,173 241,951 267,853 76,755performance fees payable 3 2 – 53,917 – – – – – – – – – –margins on derivatives contracts 9 588,760 – 3,685 – – – – – 685,429 – – – 128,688Cash collateral payable to broker 2,760,000 5,220,000 – – – – – – – – – – –income payable on swaps – – – – – – – – – – – – –Finance charges payable on swaps – 46,081 – – – – – – – – – – –tax payable 10 – – – – – – 5,339,693 – – – – – –other payables – 228,615 – – – – – – – – – – –
22,251,961 22,208,906 1,250,232 34,657 116,174 33,646 5,854,492 28,847 974,134 726,662 548,939 988,120 347,549
Net assets attributable to redeemable participating shareholders 397,342,232 371,503,339 28,390,201 8,283,563 38,173,739 31,031,538 105,594,026 11,112,189 26,474,856 181,632,588 716,491,768 360,120,657 52,672,790
* This Fund launched during the financial year.
The accompanying notes form an integral part of these financial statements.
03613-1B.indd 303 19/08/2020 19:04

as at 31 December 2019 (cont’d.)
304
BNY MelloN GloBal FuNds, plc
Statement oF FinanCial poSition
BNY Mellon Emerging
Markets DebtLocal Currency
Fund
BNY Mellon Emerging
Markets DebtOpportunistic
Fund
BNY Mellon Emerging
Markets Debt Total
Return Fund
BNY Mellon Euroland
Bond Fund
BNY Mellon European
Credit Fund
BNY Mellon Global Bond Fund
BNY Mellon Global Credit
Fund
BNY Mellon Global
Dynamic Bond Fund
BNY Mellon Global
Emerging Markets
Fund
BNY Mellon Global Equity
Fund
BNY Mellon Global
Equity Income
Fund
BNY Mellon Global
High Yield Bond Fund
BNY Mellon Global
Infrastructure Income
Fund
Notes USD USD USD EUR EUR USD USD USD USD USD USD USD USD
Assets (due within one year)Financial assets at fair value through profit or loss 16 443,959,585 29,109,055 149,230,371 871,176,356 79,022,756 578,137,443 462,913,372 498,887,444 32,577,234 363,872,149 1,805,477,501 117,878,418 89,115,405Cash and cash equivalents 9 16,381,090 152,453 1,345,983 18,536,860 2,217,013 5,485,281 853,294 9,633,208 564,175 8,234,030 36,345,553 2,650,809 1,721,568income receivable 8,473,903 507,054 2,207,958 7,370,819 506,558 3,441,224 3,391,054 3,317,518 35,979 383,831 3,332,711 1,753,038 234,260receivable for investments sold – – – 599,594 – – – – – – – 1,127,373 –rebate receivable from the manager 6 – – 18,418 – – – 13,141 – 38,435 – – – 10,793margins on derivatives contracts 9 – 68,114 570,000 9,009,582 744,622 750,000 8,831,218 1,264,671 – – – – –Cash collateral received from broker 293,000 – – 283,324 – – 460,000 – – – – – –Subscriptions receivable 33,085 – 132,460 1,108,643 760,000 47,221 – 18,354 – 1,793 673,776 – 26,300other receivables 54,137 912 – 11,626 49 – 116 50 47,574 12,931 8 – –
469,194,800 29,837,588 153,505,190 908,096,804 83,250,998 587,861,169 476,462,195 513,121,245 33,263,397 372,504,734 1,845,829,549 123,409,638 91,108,326
Liabilities (due within one year)Financial liabilities at fair value through profit or loss 16 3,540,846 202,096 1,735,918 3,081,513 251,022 1,824,238 12,431,955 3,304,526 – 136,180 4,284 248,982 2,433Bank overdraft 9 – – 178 318 – 137,947 – 2,144 – 102,889 1,721,346 155,006 –payable for investments purchased – – – – – – – – – 42,624 – 1,348,405 –redemptions payable 92,718 – – 976,658 – 240,422 – 13,077,784 – – 21,959 941 6,314expenses payable 701,544 17,947 133,675 891,465 24,283 500,663 118,300 446,790 69,773 410,229 1,946,919 107,988 46,503performance fees payable 3 – – – – – – – – – – – – –margins on derivatives contracts 9 – 32,294 – 12,638,233 541,628 – 667,407 15,217 – – – – –Cash collateral payable to broker 293,000 – – 283,324 – – 460,000 – – – – – –income payable on swaps – – – – – – – – – – – – –Finance charges payable on swaps – – – – – – – – – – – – –tax payable 10 – – – – – – – – – – – – –other payables – – – – – – – – – – – – –
4,628,108 252,337 1,869,771 17,871,511 816,933 2,703,270 13,677,662 16,846,461 69,773 691,922 3,694,508 1,861,322 55,250
Net assets attributable to redeemable participating shareholders 464,566,692 29,585,251 151,635,419 890,225,293 82,434,065 585,157,899 462,784,533 496,274,784 33,193,624 371,812,812 1,842,135,041 121,548,316 91,053,076
03613-1B.indd 304 19/08/2020 19:04

as at 31 December 2019 (cont’d.)
305
BNY MelloN GloBal FuNds, plc
Statement oF FinanCial poSition
BNY Mellon Emerging
Markets DebtLocal Currency
Fund
BNY Mellon Emerging
Markets DebtOpportunistic
Fund
BNY Mellon Emerging
Markets Debt Total
Return Fund
BNY Mellon Euroland
Bond Fund
BNY Mellon European
Credit Fund
BNY Mellon Global Bond Fund
BNY Mellon Global Credit
Fund
BNY Mellon Global
Dynamic Bond Fund
BNY Mellon Global
Emerging Markets
Fund
BNY Mellon Global Equity
Fund
BNY Mellon Global
Equity Income
Fund
BNY Mellon Global
High Yield Bond Fund
BNY Mellon Global
Infrastructure Income
Fund
Notes USD USD USD EUR EUR USD USD USD USD USD USD USD USD
Assets (due within one year)Financial assets at fair value through profit or loss 16 443,959,585 29,109,055 149,230,371 871,176,356 79,022,756 578,137,443 462,913,372 498,887,444 32,577,234 363,872,149 1,805,477,501 117,878,418 89,115,405Cash and cash equivalents 9 16,381,090 152,453 1,345,983 18,536,860 2,217,013 5,485,281 853,294 9,633,208 564,175 8,234,030 36,345,553 2,650,809 1,721,568income receivable 8,473,903 507,054 2,207,958 7,370,819 506,558 3,441,224 3,391,054 3,317,518 35,979 383,831 3,332,711 1,753,038 234,260receivable for investments sold – – – 599,594 – – – – – – – 1,127,373 –rebate receivable from the manager 6 – – 18,418 – – – 13,141 – 38,435 – – – 10,793margins on derivatives contracts 9 – 68,114 570,000 9,009,582 744,622 750,000 8,831,218 1,264,671 – – – – –Cash collateral received from broker 293,000 – – 283,324 – – 460,000 – – – – – –Subscriptions receivable 33,085 – 132,460 1,108,643 760,000 47,221 – 18,354 – 1,793 673,776 – 26,300other receivables 54,137 912 – 11,626 49 – 116 50 47,574 12,931 8 – –
469,194,800 29,837,588 153,505,190 908,096,804 83,250,998 587,861,169 476,462,195 513,121,245 33,263,397 372,504,734 1,845,829,549 123,409,638 91,108,326
Liabilities (due within one year)Financial liabilities at fair value through profit or loss 16 3,540,846 202,096 1,735,918 3,081,513 251,022 1,824,238 12,431,955 3,304,526 – 136,180 4,284 248,982 2,433Bank overdraft 9 – – 178 318 – 137,947 – 2,144 – 102,889 1,721,346 155,006 –payable for investments purchased – – – – – – – – – 42,624 – 1,348,405 –redemptions payable 92,718 – – 976,658 – 240,422 – 13,077,784 – – 21,959 941 6,314expenses payable 701,544 17,947 133,675 891,465 24,283 500,663 118,300 446,790 69,773 410,229 1,946,919 107,988 46,503performance fees payable 3 – – – – – – – – – – – – –margins on derivatives contracts 9 – 32,294 – 12,638,233 541,628 – 667,407 15,217 – – – – –Cash collateral payable to broker 293,000 – – 283,324 – – 460,000 – – – – – –income payable on swaps – – – – – – – – – – – – –Finance charges payable on swaps – – – – – – – – – – – – –tax payable 10 – – – – – – – – – – – – –other payables – – – – – – – – – – – – –
4,628,108 252,337 1,869,771 17,871,511 816,933 2,703,270 13,677,662 16,846,461 69,773 691,922 3,694,508 1,861,322 55,250
Net assets attributable to redeemable participating shareholders 464,566,692 29,585,251 151,635,419 890,225,293 82,434,065 585,157,899 462,784,533 496,274,784 33,193,624 371,812,812 1,842,135,041 121,548,316 91,053,076
03613-1B.indd 305 19/08/2020 19:04
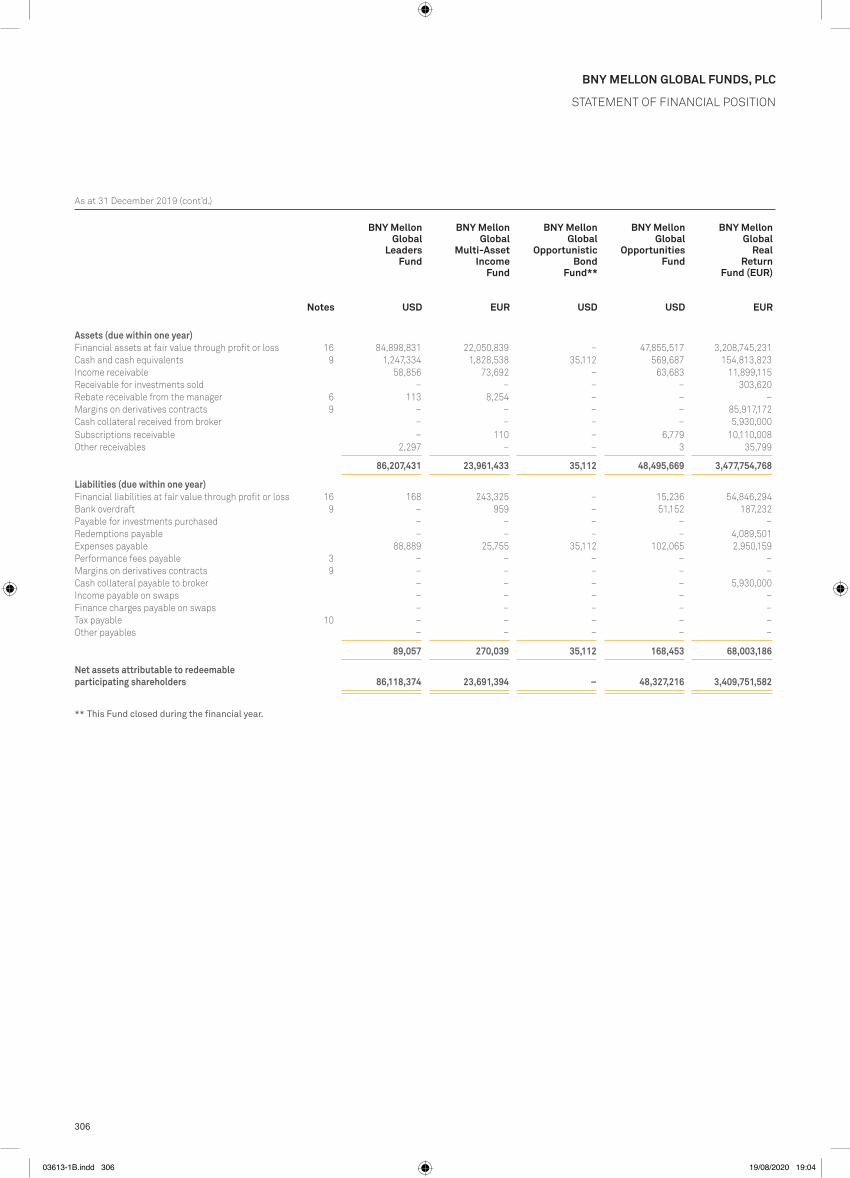
as at 31 December 2019 (cont’d.)
306
BNY MelloN GloBal FuNds, plc
Statement oF FinanCial poSition
BNY Mellon Global
Leaders Fund
BNY Mellon Global
Multi-Asset Income
Fund
BNY Mellon Global
Opportunistic Bond
Fund**
BNY Mellon Global
Opportunities Fund
BNY Mellon Global
Real Return
Fund (EUR)
BNY Mellon Global
Real Return
Fund (GBP)
BNY Mellon Global
Real Return
Fund (USD)
BNY Mellon Global
Short-Dated High Yield
Bond Fund
BNY Mellon Global
Unconstrained Fund
BNY Mellon Japan
All Cap Equity
Fund**
BNY Mellon Japan
REIT Alpha
Fund**
BNY Mellon Japan
Small Cap Equity Focus
Fund
BNY Mellon Long-Term
Global Equity
Fund
Notes USD EUR USD USD EUR GBP USD USD USD JPY JPY JPY EUR
Assets (due within one year)Financial assets at fair value through profit or loss 16 84,898,831 22,050,839 – 47,855,517 3,208,745,231 66,965,643 285,805,646 723,241,103 23,975,559 – – 14,990,273,900 1,440,623,118Cash and cash equivalents 9 1,247,334 1,828,538 35,112 569,687 154,813,823 3,316,861 31,035,695 171,687 1,252,942 1,057,940 895,061 553,405,286 44,656,316income receivable 58,856 73,692 – 63,683 11,899,115 291,896 734,621 11,261,949 51,432 – – 8,247,550 813,877receivable for investments sold – – – – 303,620 5,880 29,872 – – – – – –rebate receivable from the manager 6 113 8,254 – – – – – 19,330 5,430 – – 947,129 –margins on derivatives contracts 9 – – – – 85,917,172 1,258,225 9,105,251 2,325,786 – – – – –Cash collateral received from broker – – – – 5,930,000 1,170,000 – – – – – – –Subscriptions receivable – 110 – 6,779 10,110,008 88,851 3,446,065 145,200 – – – 416,545 1,654,275other receivables 2,297 – – 3 35,799 621 311 3,547 212 – – 293,883 120,885
86,207,431 23,961,433 35,112 48,495,669 3,477,754,768 73,097,977 330,157,461 737,168,602 25,285,575 1,057,940 895,061 15,553,584,293 1,487,868,471
Liabilities (due within one year)Financial liabilities at fair value through profit or loss 16 168 243,325 – 15,236 54,846,294 863,370 7,346,227 3,527,822 102,650 – – 641,256 45,196Bank overdraft 9 – 959 – 51,152 187,232 10,147 114,631 187,935 111 – 1,548 – –payable for investments purchased – – – – – – – 7,428,470 – – – – –redemptions payable – – – – 4,089,501 20,100 – 88,541 – – – 2,041,571 475,631expenses payable 88,889 25,755 35,112 102,065 2,950,159 67,622 310,311 468,674 9,775 1,057,940 893,513 16,190,256 1,682,733performance fees payable 3 – – – – – – – – – – – – 310,146margins on derivatives contracts 9 – – – – – – – 299,280 – – – – –Cash collateral payable to broker – – – – 5,930,000 1,170,000 – – – – – – –income payable on swaps – – – – – – – – – – – – –Finance charges payable on swaps – – – – – – – – – – – – –tax payable 10 – – – – – – – – – – – – –other payables – – – – – – – – – – – – –
89,057 270,039 35,112 168,453 68,003,186 2,131,239 7,771,169 12,000,722 112,536 1,057,940 895,061 18,873,083 2,513,706
Net assets attributable to redeemable participating shareholders 86,118,374 23,691,394 – 48,327,216 3,409,751,582 70,966,738 322,386,292 725,167,880 25,173,039 – – 15,534,711,210 1,485,354,765
** This Fund closed during the financial year.
03613-1B.indd 306 19/08/2020 19:04
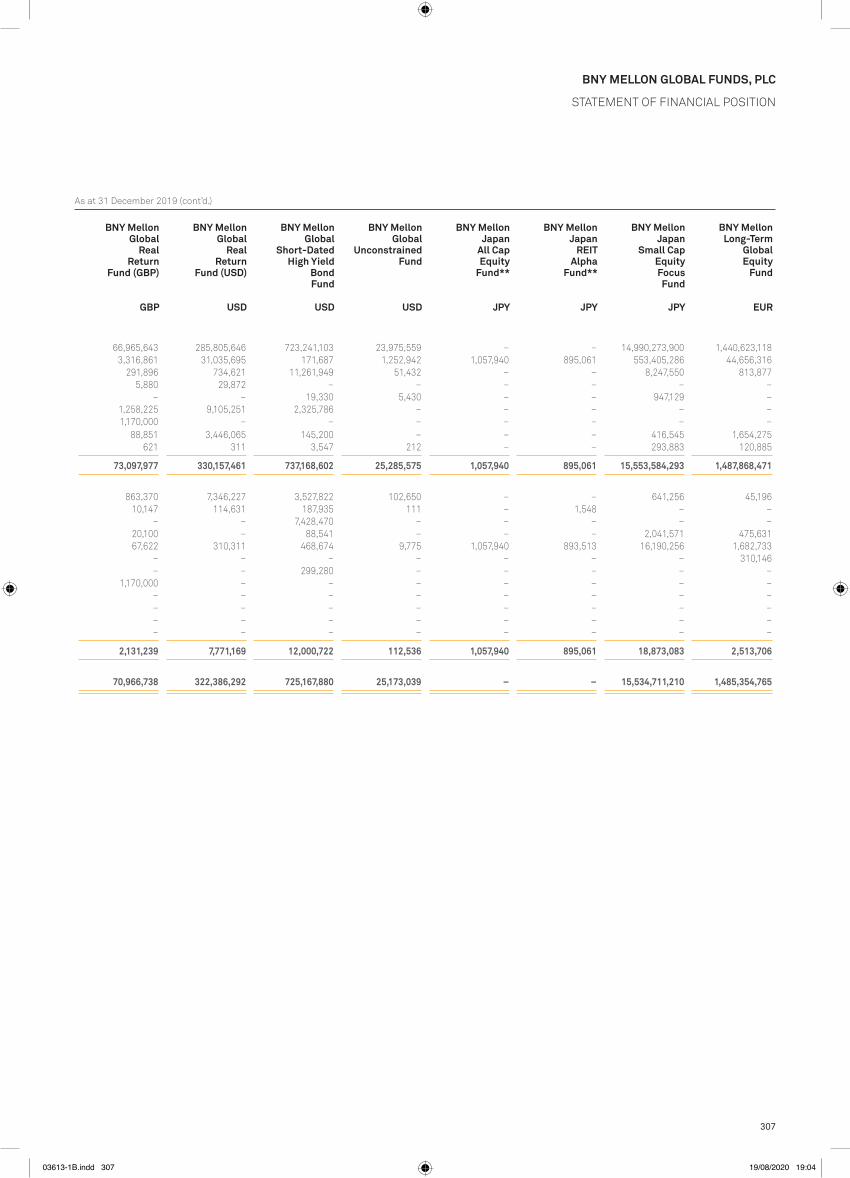
as at 31 December 2019 (cont’d.)
307
BNY MelloN GloBal FuNds, plc
Statement oF FinanCial poSition
BNY Mellon Global
Leaders Fund
BNY Mellon Global
Multi-Asset Income
Fund
BNY Mellon Global
Opportunistic Bond
Fund**
BNY Mellon Global
Opportunities Fund
BNY Mellon Global
Real Return
Fund (EUR)
BNY Mellon Global
Real Return
Fund (GBP)
BNY Mellon Global
Real Return
Fund (USD)
BNY Mellon Global
Short-Dated High Yield
Bond Fund
BNY Mellon Global
Unconstrained Fund
BNY Mellon Japan
All Cap Equity
Fund**
BNY Mellon Japan
REIT Alpha
Fund**
BNY Mellon Japan
Small Cap Equity Focus
Fund
BNY Mellon Long-Term
Global Equity
Fund
Notes USD EUR USD USD EUR GBP USD USD USD JPY JPY JPY EUR
Assets (due within one year)Financial assets at fair value through profit or loss 16 84,898,831 22,050,839 – 47,855,517 3,208,745,231 66,965,643 285,805,646 723,241,103 23,975,559 – – 14,990,273,900 1,440,623,118Cash and cash equivalents 9 1,247,334 1,828,538 35,112 569,687 154,813,823 3,316,861 31,035,695 171,687 1,252,942 1,057,940 895,061 553,405,286 44,656,316income receivable 58,856 73,692 – 63,683 11,899,115 291,896 734,621 11,261,949 51,432 – – 8,247,550 813,877receivable for investments sold – – – – 303,620 5,880 29,872 – – – – – –rebate receivable from the manager 6 113 8,254 – – – – – 19,330 5,430 – – 947,129 –margins on derivatives contracts 9 – – – – 85,917,172 1,258,225 9,105,251 2,325,786 – – – – –Cash collateral received from broker – – – – 5,930,000 1,170,000 – – – – – – –Subscriptions receivable – 110 – 6,779 10,110,008 88,851 3,446,065 145,200 – – – 416,545 1,654,275other receivables 2,297 – – 3 35,799 621 311 3,547 212 – – 293,883 120,885
86,207,431 23,961,433 35,112 48,495,669 3,477,754,768 73,097,977 330,157,461 737,168,602 25,285,575 1,057,940 895,061 15,553,584,293 1,487,868,471
Liabilities (due within one year)Financial liabilities at fair value through profit or loss 16 168 243,325 – 15,236 54,846,294 863,370 7,346,227 3,527,822 102,650 – – 641,256 45,196Bank overdraft 9 – 959 – 51,152 187,232 10,147 114,631 187,935 111 – 1,548 – –payable for investments purchased – – – – – – – 7,428,470 – – – – –redemptions payable – – – – 4,089,501 20,100 – 88,541 – – – 2,041,571 475,631expenses payable 88,889 25,755 35,112 102,065 2,950,159 67,622 310,311 468,674 9,775 1,057,940 893,513 16,190,256 1,682,733performance fees payable 3 – – – – – – – – – – – – 310,146margins on derivatives contracts 9 – – – – – – – 299,280 – – – – –Cash collateral payable to broker – – – – 5,930,000 1,170,000 – – – – – – –income payable on swaps – – – – – – – – – – – – –Finance charges payable on swaps – – – – – – – – – – – – –tax payable 10 – – – – – – – – – – – – –other payables – – – – – – – – – – – – –
89,057 270,039 35,112 168,453 68,003,186 2,131,239 7,771,169 12,000,722 112,536 1,057,940 895,061 18,873,083 2,513,706
Net assets attributable to redeemable participating shareholders 86,118,374 23,691,394 – 48,327,216 3,409,751,582 70,966,738 322,386,292 725,167,880 25,173,039 – – 15,534,711,210 1,485,354,765
** This Fund closed during the financial year.
03613-1B.indd 307 19/08/2020 19:04
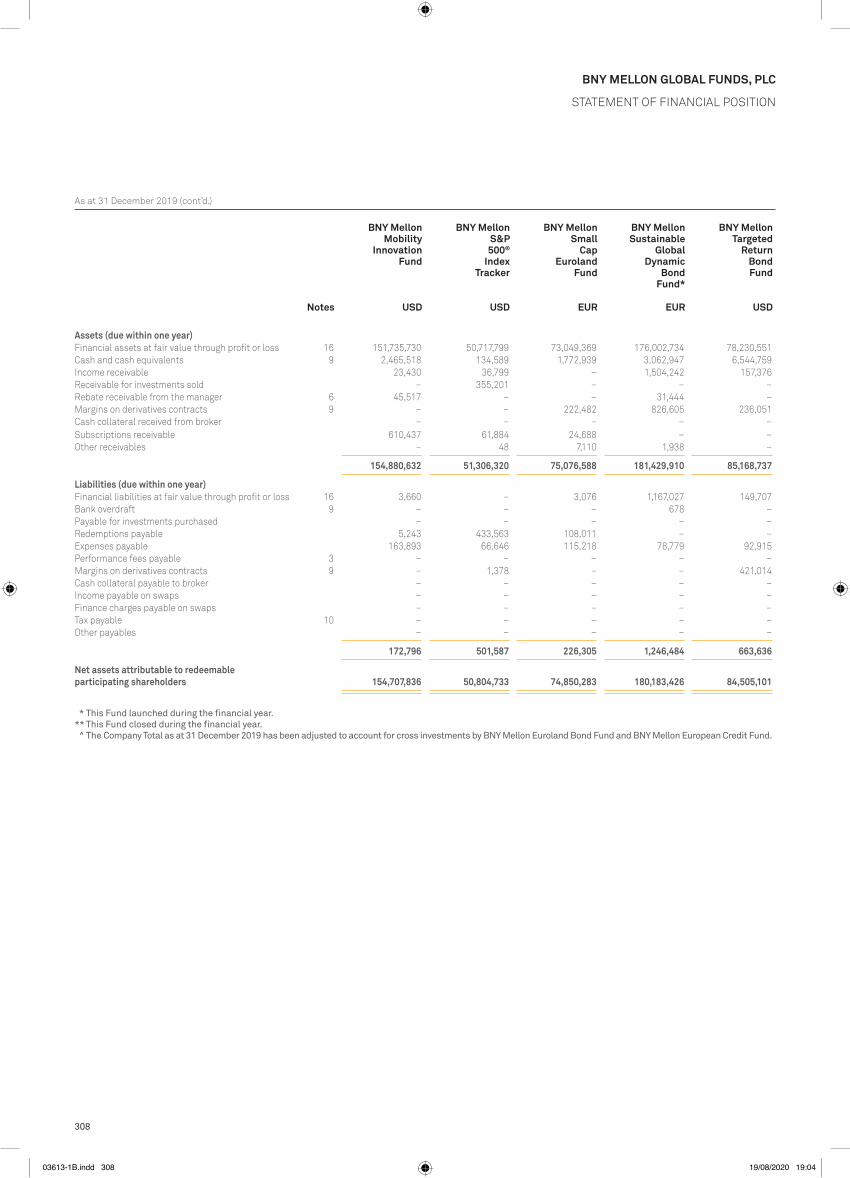
as at 31 December 2019 (cont’d.)
308
BNY MelloN GloBal FuNds, plc
Statement oF FinanCial poSition
BNY Mellon Mobility
Innovation Fund
BNY Mellon S&P
500® Index
Tracker
BNY Mellon Small
Cap Euroland
Fund
BNY Mellon Sustainable
Global Dynamic
Bond Fund*
BNY Mellon Targeted
Return Bond Fund
BNY Mellon U.S.
Dynamic Value Fund
BNY Mellon U.S.
Equity Income
Fund
BNY Mellon U.S.
Municipal Infrastructure
Debt Fund
BNY Mellon U.S.
Opportunistic Alpha
Fund**
BNY Mellon US
Opportunities Fund**
Total 31 December
2019^
Notes USD USD EUR EUR USD USD USD USD USD USD USD
Assets (due within one year)Financial assets at fair value through profit or loss 16 151,735,730 50,717,799 73,049,369 176,002,734 78,230,551 28,821,073 402,302,323 432,614,522 – – 16,109,642,131Cash and cash equivalents 9 2,465,518 134,589 1,772,939 3,062,947 6,544,759 97,121 20,773,359 2,379,890 2,789 6,261 463,560,470income receivable 23,430 36,799 – 1,504,242 157,376 21,577 522,989 3,984,807 – – 89,159,763receivable for investments sold – 355,201 – – – 133,219 – 1,580 – – 7,894,990rebate receivable from the manager 6 45,517 – – 31,444 – – 16,041 9,813 6,870 4,251 393,294margins on derivatives contracts 9 – – 222,482 826,605 236,051 – – – – – 159,930,310Cash collateral received from broker – – – – – – – – – – 19,282,587Subscriptions receivable 610,437 61,884 24,688 – – – – – – – 21,710,815other receivables – 48 7,110 1,938 – 420 6,620 7 – – 554,436
154,880,632 51,306,320 75,076,588 181,429,910 85,168,737 29,073,410 423,621,332 438,990,619 9,659 10,512 16,872,128,796
Liabilities (due within one year)Financial liabilities at fair value through profit or loss 16 3,660 – 3,076 1,167,027 149,707 – – 116,353 – – 139,048,685Bank overdraft 9 – – – 678 – – – – 930 1,033 10,477,210payable for investments purchased – – – – – 162,813 4,179,346 – – – 13,785,869redemptions payable 5,243 433,563 108,011 – – – – – – – 21,757,200expenses payable 163,893 66,646 115,218 78,779 92,915 45,048 317,132 268,496 8,729 9,479 15,277,140performance fees payable 3 – – – – – – – – – – 408,372margins on derivatives contracts 9 – 1,378 – – 421,014 – – – – – 17,699,111Cash collateral payable to broker – – – – – – – – – – 19,282,587income payable on swaps – – – – – – – – – – –Finance charges payable on swaps – – – – – – – – – – 61,039tax payable 10 – – – – – – – – – – 5,339,693other payables – – – – – – – – – – 302,824
172,796 501,587 226,305 1,246,484 663,636 207,861 4,496,478 384,849 9,659 10,512 243,439,730
Net assets attributable to redeemable participating shareholders 154,707,836 50,804,733 74,850,283 180,183,426 84,505,101 28,865,549 419,124,854 438,605,770 – – 16,628,689,066
* This Fund launched during the financial year.** This Fund closed during the financial year. ^ The Company Total as at 31 December 2019 has been adjusted to account for cross investments by BNY Mellon Euroland Bond Fund and BNY Mellon European Credit Fund.
03613-1B.indd 308 19/08/2020 19:04

as at 31 December 2019 (cont’d.)
309
BNY MelloN GloBal FuNds, plc
Statement oF FinanCial poSition
BNY Mellon Mobility
Innovation Fund
BNY Mellon S&P
500® Index
Tracker
BNY Mellon Small
Cap Euroland
Fund
BNY Mellon Sustainable
Global Dynamic
Bond Fund*
BNY Mellon Targeted
Return Bond Fund
BNY Mellon U.S.
Dynamic Value Fund
BNY Mellon U.S.
Equity Income
Fund
BNY Mellon U.S.
Municipal Infrastructure
Debt Fund
BNY Mellon U.S.
Opportunistic Alpha
Fund**
BNY Mellon US
Opportunities Fund**
Total 31 December
2019^
Notes USD USD EUR EUR USD USD USD USD USD USD USD
Assets (due within one year)Financial assets at fair value through profit or loss 16 151,735,730 50,717,799 73,049,369 176,002,734 78,230,551 28,821,073 402,302,323 432,614,522 – – 16,109,642,131Cash and cash equivalents 9 2,465,518 134,589 1,772,939 3,062,947 6,544,759 97,121 20,773,359 2,379,890 2,789 6,261 463,560,470income receivable 23,430 36,799 – 1,504,242 157,376 21,577 522,989 3,984,807 – – 89,159,763receivable for investments sold – 355,201 – – – 133,219 – 1,580 – – 7,894,990rebate receivable from the manager 6 45,517 – – 31,444 – – 16,041 9,813 6,870 4,251 393,294margins on derivatives contracts 9 – – 222,482 826,605 236,051 – – – – – 159,930,310Cash collateral received from broker – – – – – – – – – – 19,282,587Subscriptions receivable 610,437 61,884 24,688 – – – – – – – 21,710,815other receivables – 48 7,110 1,938 – 420 6,620 7 – – 554,436
154,880,632 51,306,320 75,076,588 181,429,910 85,168,737 29,073,410 423,621,332 438,990,619 9,659 10,512 16,872,128,796
Liabilities (due within one year)Financial liabilities at fair value through profit or loss 16 3,660 – 3,076 1,167,027 149,707 – – 116,353 – – 139,048,685Bank overdraft 9 – – – 678 – – – – 930 1,033 10,477,210payable for investments purchased – – – – – 162,813 4,179,346 – – – 13,785,869redemptions payable 5,243 433,563 108,011 – – – – – – – 21,757,200expenses payable 163,893 66,646 115,218 78,779 92,915 45,048 317,132 268,496 8,729 9,479 15,277,140performance fees payable 3 – – – – – – – – – – 408,372margins on derivatives contracts 9 – 1,378 – – 421,014 – – – – – 17,699,111Cash collateral payable to broker – – – – – – – – – – 19,282,587income payable on swaps – – – – – – – – – – –Finance charges payable on swaps – – – – – – – – – – 61,039tax payable 10 – – – – – – – – – – 5,339,693other payables – – – – – – – – – – 302,824
172,796 501,587 226,305 1,246,484 663,636 207,861 4,496,478 384,849 9,659 10,512 243,439,730
Net assets attributable to redeemable participating shareholders 154,707,836 50,804,733 74,850,283 180,183,426 84,505,101 28,865,549 419,124,854 438,605,770 – – 16,628,689,066
* This Fund launched during the financial year.** This Fund closed during the financial year. ^ The Company Total as at 31 December 2019 has been adjusted to account for cross investments by BNY Mellon Euroland Bond Fund and BNY Mellon European Credit Fund.
03613-1B.indd 309 19/08/2020 19:04
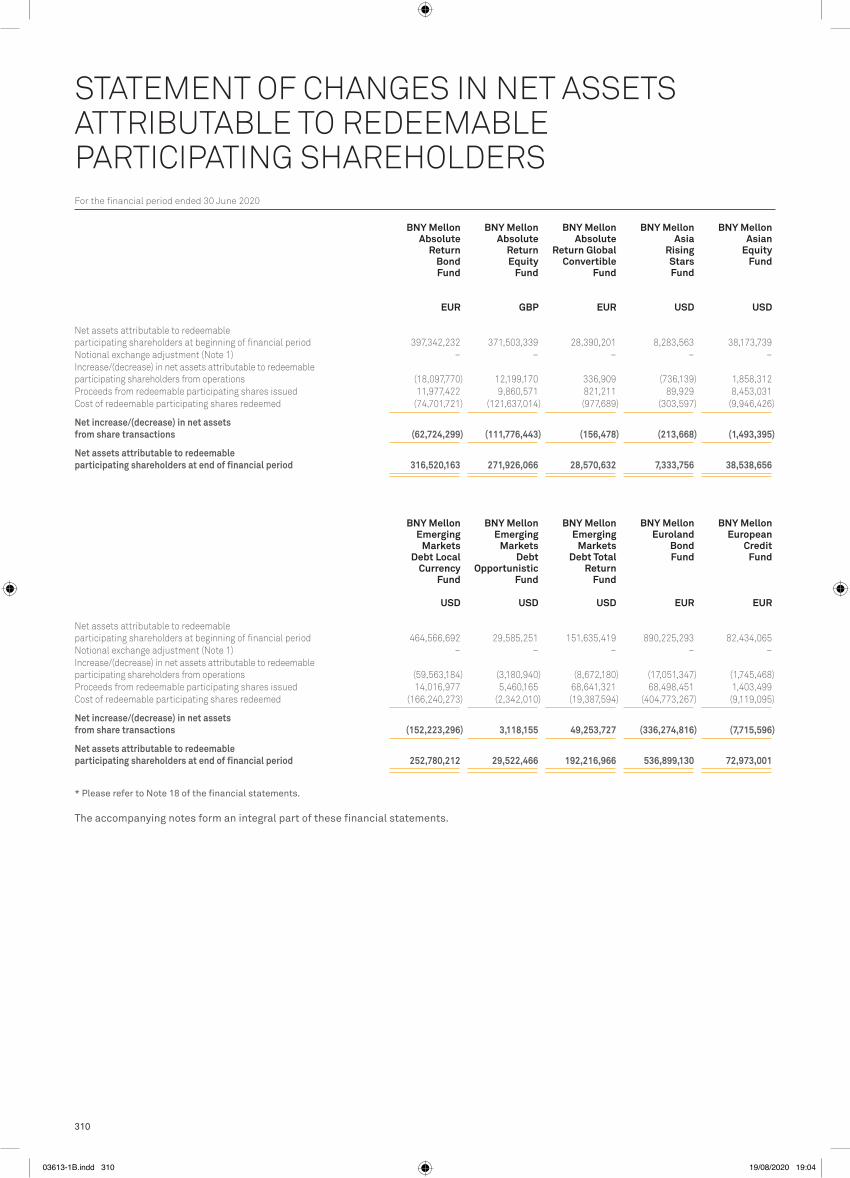
For the financial period ended 30 June 2020 (cont’d.)
310
Statement oF ChanGeS in net aSSetS attriBUtaBle to reDeemaBle partiCipatinG ShareholDerS
BNY Mellon Absolute
Return Bond Fund
BNY Mellon Absolute
Return Equity
Fund
BNY Mellon Absolute
Return Global Convertible
Fund
BNY Mellon Asia
Rising Stars Fund
BNY Mellon Asian
Equity Fund
BNY Mellon Asian
Income Fund*
BNY Mellon Brazil
Equity Fund
BNY Mellon Digital Assets
Fund
BNY Mellon Dynamic
Total Return
Fund
BNY Mellon Dynamic
U.S. Equity
Fund
BNY Mellon Efficient Global IG
Corporate Beta
Fund*
BNY Mellon Efficient
U.S. High Yield
Beta Fund
BNY Mellon Emerging
Markets Corporate
Debt Fund
BNY Mellon Emerging
Markets Debt Fund
EUR GBP EUR USD USD USD USD USD USD USD USD USD USD USD
net assets attributable to redeemable participating shareholders at beginning of financial period 397,342,232 371,503,339 28,390,201 8,283,563 38,173,739 31,031,538 105,594,026 11,112,189 26,474,856 181,632,588 – 716,491,768 360,120,657 52,672,790notional exchange adjustment (note 1) – – – – – – – – – – – – – –increase/(decrease) in net assets attributable to redeemable participating shareholders from operations (18,097,770) 12,199,170 336,909 (736,139) 1,858,312 (5,927,305) (35,900,966) 289,651 (1,784,307) 1,614,213 996,157 (106,632,506) (23,771,421) (2,484,381)proceeds from redeemable participating shares issued 11,977,422 9,860,571 821,211 89,929 8,453,031 6,451,065 33,852,792 823,991 1,685,731 228,443,971 61,596,464 585,038,431 112,823,557 3,739,621Cost of redeemable participating shares redeemed (74,701,721) (121,637,014) (977,689) (303,597) (9,946,426) (2,035,800) (42,562,750) (1,241,941) (2,262,964) (5,634,365) (214,086) (298,116,344) (140,672,784) (24,468,069)
Net increase/(decrease) in net assets from share transactions (62,724,299) (111,776,443) (156,478) (213,668) (1,493,395) 4,415,265 (8,709,958) (417,950) (577,233) 222,809,606 61,382,378 286,922,087 (27,849,227) (20,728,448)
Net assets attributable to redeemable participating shareholders at end of financial period 316,520,163 271,926,066 28,570,632 7,333,756 38,538,656 29,519,498 60,983,102 10,983,890 24,113,316 406,056,407 62,378,535 896,781,349 308,500,009 29,459,961
BNY Mellon Emerging
Markets Debt Local
Currency Fund
BNY Mellon Emerging
Markets Debt
Opportunistic Fund
BNY Mellon Emerging
Markets Debt Total
Return Fund
BNY Mellon Euroland
Bond Fund
BNY Mellon European
Credit Fund
BNY Mellon Global
Bond Fund
BNY Mellon Global Credit
Fund
BNY Mellon Global
Dynamic Bond Fund
BNY Mellon Global
Emerging Markets
Fund
BNY Mellon Global Equity
Fund
BNY Mellon Global Equity
Income Fund
BNY Mellon Global
High Yield Bond Fund
BNY Mellon Global
Infrastructure Income
Fund
BNY Mellon Global
Leaders Fund
USD USD USD EUR EUR USD USD USD USD USD USD USD USD USD
net assets attributable to redeemable participating shareholders at beginning of financial period 464,566,692 29,585,251 151,635,419 890,225,293 82,434,065 585,157,899 462,784,533 496,274,784 33,193,624 371,812,812 1,842,135,041 121,548,316 91,053,076 86,118,374notional exchange adjustment (note 1) – – – – – – – – – – – – – –increase/(decrease) in net assets attributable to redeemable participating shareholders from operations (59,563,184) (3,180,940) (8,672,180) (17,051,347) (1,745,468) 19,967,535 2,478,711 (3,446,767) 639,982 (18,755,184) (272,339,072) (8,137,879) (8,353,565) (1,180,243)proceeds from redeemable participating shares issued 14,016,977 5,460,165 68,641,321 68,498,451 1,403,499 104,954,171 161,982,611 28,364,889 4,655,978 107,442,981 322,464,070 31,953,414 105,039,987 6,511,547Cost of redeemable participating shares redeemed (166,240,273) (2,342,010) (19,387,594) (404,773,267) (9,119,095) (110,639,313) (15,285,977) (151,377,386) (8,051,672) (98,477,159) (690,670,447) (33,857,318) (40,534,426) (27,911,778)
Net increase/(decrease) in net assets from share transactions (152,223,296) 3,118,155 49,253,727 (336,274,816) (7,715,596) (5,685,142) 146,696,634 (123,012,497) (3,395,694) 8,965,822 (368,206,377) (1,903,904) 64,505,561 (21,400,231)
Net assets attributable to redeemable participating shareholders at end of financial period 252,780,212 29,522,466 192,216,966 536,899,130 72,973,001 599,440,292 611,959,878 369,815,520 30,437,912 362,023,450 1,201,589,592 111,506,533 147,205,072 63,537,900
* Please refer to Note 18 of the financial statements.
The accompanying notes form an integral part of these financial statements.
03613-1B.indd 310 19/08/2020 19:04

For the financial period ended 30 June 2020 (cont’d.)
311
BNY MelloN GloBal FuNds, plc
Statement oF ChanGeS in net aSSetS attriBUtaBle to reDeemaBle partiCipatinG ShareholDerS
BNY Mellon Absolute
Return Bond Fund
BNY Mellon Absolute
Return Equity
Fund
BNY Mellon Absolute
Return Global Convertible
Fund
BNY Mellon Asia
Rising Stars Fund
BNY Mellon Asian
Equity Fund
BNY Mellon Asian
Income Fund*
BNY Mellon Brazil
Equity Fund
BNY Mellon Digital Assets
Fund
BNY Mellon Dynamic
Total Return
Fund
BNY Mellon Dynamic
U.S. Equity
Fund
BNY Mellon Efficient Global IG
Corporate Beta
Fund*
BNY Mellon Efficient
U.S. High Yield
Beta Fund
BNY Mellon Emerging
Markets Corporate
Debt Fund
BNY Mellon Emerging
Markets Debt Fund
EUR GBP EUR USD USD USD USD USD USD USD USD USD USD USD
net assets attributable to redeemable participating shareholders at beginning of financial period 397,342,232 371,503,339 28,390,201 8,283,563 38,173,739 31,031,538 105,594,026 11,112,189 26,474,856 181,632,588 – 716,491,768 360,120,657 52,672,790notional exchange adjustment (note 1) – – – – – – – – – – – – – –increase/(decrease) in net assets attributable to redeemable participating shareholders from operations (18,097,770) 12,199,170 336,909 (736,139) 1,858,312 (5,927,305) (35,900,966) 289,651 (1,784,307) 1,614,213 996,157 (106,632,506) (23,771,421) (2,484,381)proceeds from redeemable participating shares issued 11,977,422 9,860,571 821,211 89,929 8,453,031 6,451,065 33,852,792 823,991 1,685,731 228,443,971 61,596,464 585,038,431 112,823,557 3,739,621Cost of redeemable participating shares redeemed (74,701,721) (121,637,014) (977,689) (303,597) (9,946,426) (2,035,800) (42,562,750) (1,241,941) (2,262,964) (5,634,365) (214,086) (298,116,344) (140,672,784) (24,468,069)
Net increase/(decrease) in net assets from share transactions (62,724,299) (111,776,443) (156,478) (213,668) (1,493,395) 4,415,265 (8,709,958) (417,950) (577,233) 222,809,606 61,382,378 286,922,087 (27,849,227) (20,728,448)
Net assets attributable to redeemable participating shareholders at end of financial period 316,520,163 271,926,066 28,570,632 7,333,756 38,538,656 29,519,498 60,983,102 10,983,890 24,113,316 406,056,407 62,378,535 896,781,349 308,500,009 29,459,961
BNY Mellon Emerging
Markets Debt Local
Currency Fund
BNY Mellon Emerging
Markets Debt
Opportunistic Fund
BNY Mellon Emerging
Markets Debt Total
Return Fund
BNY Mellon Euroland
Bond Fund
BNY Mellon European
Credit Fund
BNY Mellon Global
Bond Fund
BNY Mellon Global Credit
Fund
BNY Mellon Global
Dynamic Bond Fund
BNY Mellon Global
Emerging Markets
Fund
BNY Mellon Global Equity
Fund
BNY Mellon Global Equity
Income Fund
BNY Mellon Global
High Yield Bond Fund
BNY Mellon Global
Infrastructure Income
Fund
BNY Mellon Global
Leaders Fund
USD USD USD EUR EUR USD USD USD USD USD USD USD USD USD
net assets attributable to redeemable participating shareholders at beginning of financial period 464,566,692 29,585,251 151,635,419 890,225,293 82,434,065 585,157,899 462,784,533 496,274,784 33,193,624 371,812,812 1,842,135,041 121,548,316 91,053,076 86,118,374notional exchange adjustment (note 1) – – – – – – – – – – – – – –increase/(decrease) in net assets attributable to redeemable participating shareholders from operations (59,563,184) (3,180,940) (8,672,180) (17,051,347) (1,745,468) 19,967,535 2,478,711 (3,446,767) 639,982 (18,755,184) (272,339,072) (8,137,879) (8,353,565) (1,180,243)proceeds from redeemable participating shares issued 14,016,977 5,460,165 68,641,321 68,498,451 1,403,499 104,954,171 161,982,611 28,364,889 4,655,978 107,442,981 322,464,070 31,953,414 105,039,987 6,511,547Cost of redeemable participating shares redeemed (166,240,273) (2,342,010) (19,387,594) (404,773,267) (9,119,095) (110,639,313) (15,285,977) (151,377,386) (8,051,672) (98,477,159) (690,670,447) (33,857,318) (40,534,426) (27,911,778)
Net increase/(decrease) in net assets from share transactions (152,223,296) 3,118,155 49,253,727 (336,274,816) (7,715,596) (5,685,142) 146,696,634 (123,012,497) (3,395,694) 8,965,822 (368,206,377) (1,903,904) 64,505,561 (21,400,231)
Net assets attributable to redeemable participating shareholders at end of financial period 252,780,212 29,522,466 192,216,966 536,899,130 72,973,001 599,440,292 611,959,878 369,815,520 30,437,912 362,023,450 1,201,589,592 111,506,533 147,205,072 63,537,900
* Please refer to Note 18 of the financial statements.
The accompanying notes form an integral part of these financial statements.
03613-1B.indd 311 19/08/2020 19:04

For the financial period ended 30 June 2020 (cont’d.)
312
BNY MelloN GloBal FuNds, plc
Statement oF ChanGeS in net aSSetS attriBUtaBle to reDeemaBle partiCipatinG ShareholDerS
BNY Mellon Global
Multi-Asset Income
Fund
BNY Mellon Global
Opportunities Fund
BNY Mellon Global
Real Return
Fund (EUR)
BNY Mellon Global
Real Return
Fund (GBP)
BNY Mellon Global
Real Return
Fund (USD)
BNY Mellon Global
Short-Dated High Yield
Bond Fund
BNY Mellon Global
Unconstrained Fund
BNY Mellon Japan
Small Cap Equity Focus
Fund
BNY Mellon Long-Term
Global Equity
Fund
BNY Mellon Mobility
Innovation Fund
BNY Mellon S&P
500® Index
Tracker
BNY Mellon Small
Cap Euroland
Fund
BNY Mellon Sustainable
Global Dynamic
Bond Fund
BNY Mellon Sustainable
Global Real
Return Fund (EUR)*
EUR USD EUR GBP USD USD USD JPY EUR USD USD EUR EUR EUR
net assets attributable to redeemable participating shareholders at beginning of financial period 23,691,394 48,327,216 3,409,751,582 70,966,738 322,386,292 725,167,880 25,173,039 15,534,711,210 1,485,354,765 154,707,836 50,804,733 74,850,283 180,183,426 –notional exchange adjustment (note 1) – – – – – – – – – – – – – –increase/(decrease) in net assets attributable to redeemable participating shareholders from operations (3,250,197) (5,185,679) (130,939,289) (3,499,386) (8,442,554) (68,298,279) (2,305,160) (1,581,563,025) (86,909,103) 11,058,784 (2,588,335) (8,415,354) (2,478,181) (1,207,166)proceeds from redeemable participating shares issued 2,105,957 11,502,906 532,184,133 16,394,750 26,349,842 242,512,864 480,699 2,115,250,086 372,942,537 68,882,862 3,005,974 2,588,346 73,388,850 29,971,215Cost of redeemable participating shares redeemed (1,941,692) (20,924,832) (1,040,720,178) (21,419,615) (48,229,774) (182,427,822) – (3,761,833,013) (358,673,262) (40,316,071) (18,363,671) (19,916,892) (30,800,149) (3,718,883)
Net increase/(decrease) in net assets from share transactions 164,265 (9,421,926) (508,536,045) (5,024,865) (21,879,932) 60,085,042 480,699 (1,646,582,927) 14,269,275 28,566,791 (15,357,697) (17,328,546) 42,588,701 26,252,332
Net assets attributable to redeemable participating shareholders at end of financial period 20,605,462 33,719,611 2,770,276,248 62,442,487 292,063,806 716,954,643 23,348,578 12,306,565,258 1,412,714,937 194,333,411 32,858,701 49,106,383 220,293,946 25,045,166
BNY Mellon Targeted
Return Bond Fund
BNY Mellon U.S.
Dynamic Value Fund
BNY Mellon U.S.
Equity Income
Fund
BNY Mellon U.S.
Municipal Infrastructure
Debt Fund
Total 30 June
2020^
USD USD USD USD USD
net assets attributable to redeemable participating shareholders at beginning of financial period 84,505,101 28,865,549 419,124,854 438,605,770 16,628,689,066notional exchange adjustment (note 1) – – – – (47,165,727)increase/(decrease) in net assets attributable to redeemable participating shareholders from operations (4,614,755) (5,342,071) (99,593,195) 7,780,185 (1,010,442,902)proceeds from redeemable participating shares issued 550,982 7,501,639 33,372,255 116,246,731 3,772,967,971Cost of redeemable participating shares redeemed – (2,212,134) (82,601,551) (60,176,352) (4,688,001,581)
Net increase/(decrease) in net assets from share transactions 550,982 5,289,505 (49,229,296) 56,070,379 (915,033,610)
Net assets attributable to redeemable participating shareholders at end of financial period 80,441,328 28,812,983 270,302,363 502,456,334 14,656,046,827
* Please refer to Note 18 of the financial statements.^ The Company Total as at 30 June 2020 has been adjusted to account for cross investments by BNY Mellon Euroland Bond Fund and BNY Mellon European Credit Fund.
03613-1B.indd 312 19/08/2020 19:04
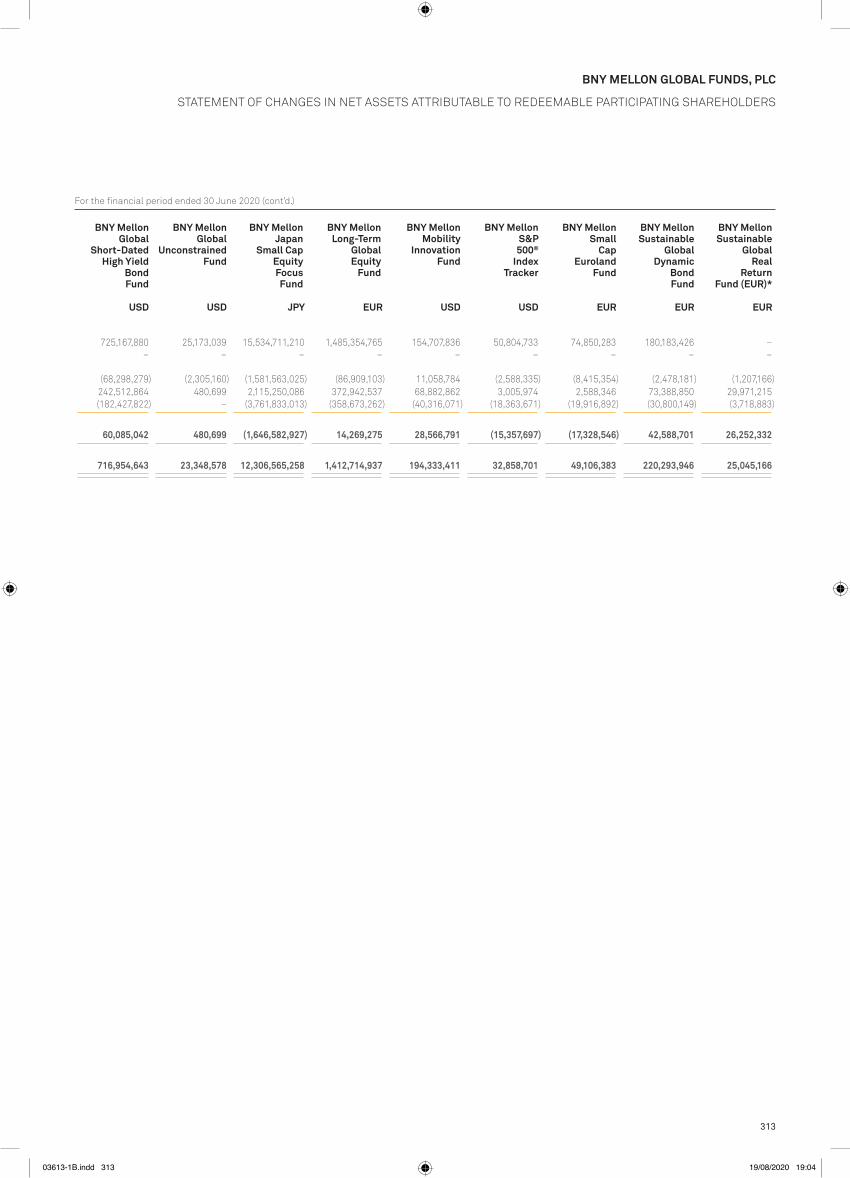
For the financial period ended 30 June 2020 (cont’d.)
313
BNY MelloN GloBal FuNds, plc
Statement oF ChanGeS in net aSSetS attriBUtaBle to reDeemaBle partiCipatinG ShareholDerS
BNY Mellon Global
Multi-Asset Income
Fund
BNY Mellon Global
Opportunities Fund
BNY Mellon Global
Real Return
Fund (EUR)
BNY Mellon Global
Real Return
Fund (GBP)
BNY Mellon Global
Real Return
Fund (USD)
BNY Mellon Global
Short-Dated High Yield
Bond Fund
BNY Mellon Global
Unconstrained Fund
BNY Mellon Japan
Small Cap Equity Focus
Fund
BNY Mellon Long-Term
Global Equity
Fund
BNY Mellon Mobility
Innovation Fund
BNY Mellon S&P
500® Index
Tracker
BNY Mellon Small
Cap Euroland
Fund
BNY Mellon Sustainable
Global Dynamic
Bond Fund
BNY Mellon Sustainable
Global Real
Return Fund (EUR)*
EUR USD EUR GBP USD USD USD JPY EUR USD USD EUR EUR EUR
net assets attributable to redeemable participating shareholders at beginning of financial period 23,691,394 48,327,216 3,409,751,582 70,966,738 322,386,292 725,167,880 25,173,039 15,534,711,210 1,485,354,765 154,707,836 50,804,733 74,850,283 180,183,426 –notional exchange adjustment (note 1) – – – – – – – – – – – – – –increase/(decrease) in net assets attributable to redeemable participating shareholders from operations (3,250,197) (5,185,679) (130,939,289) (3,499,386) (8,442,554) (68,298,279) (2,305,160) (1,581,563,025) (86,909,103) 11,058,784 (2,588,335) (8,415,354) (2,478,181) (1,207,166)proceeds from redeemable participating shares issued 2,105,957 11,502,906 532,184,133 16,394,750 26,349,842 242,512,864 480,699 2,115,250,086 372,942,537 68,882,862 3,005,974 2,588,346 73,388,850 29,971,215Cost of redeemable participating shares redeemed (1,941,692) (20,924,832) (1,040,720,178) (21,419,615) (48,229,774) (182,427,822) – (3,761,833,013) (358,673,262) (40,316,071) (18,363,671) (19,916,892) (30,800,149) (3,718,883)
Net increase/(decrease) in net assets from share transactions 164,265 (9,421,926) (508,536,045) (5,024,865) (21,879,932) 60,085,042 480,699 (1,646,582,927) 14,269,275 28,566,791 (15,357,697) (17,328,546) 42,588,701 26,252,332
Net assets attributable to redeemable participating shareholders at end of financial period 20,605,462 33,719,611 2,770,276,248 62,442,487 292,063,806 716,954,643 23,348,578 12,306,565,258 1,412,714,937 194,333,411 32,858,701 49,106,383 220,293,946 25,045,166
BNY Mellon Targeted
Return Bond Fund
BNY Mellon U.S.
Dynamic Value Fund
BNY Mellon U.S.
Equity Income
Fund
BNY Mellon U.S.
Municipal Infrastructure
Debt Fund
Total 30 June
2020^
USD USD USD USD USD
net assets attributable to redeemable participating shareholders at beginning of financial period 84,505,101 28,865,549 419,124,854 438,605,770 16,628,689,066notional exchange adjustment (note 1) – – – – (47,165,727)increase/(decrease) in net assets attributable to redeemable participating shareholders from operations (4,614,755) (5,342,071) (99,593,195) 7,780,185 (1,010,442,902)proceeds from redeemable participating shares issued 550,982 7,501,639 33,372,255 116,246,731 3,772,967,971Cost of redeemable participating shares redeemed – (2,212,134) (82,601,551) (60,176,352) (4,688,001,581)
Net increase/(decrease) in net assets from share transactions 550,982 5,289,505 (49,229,296) 56,070,379 (915,033,610)
Net assets attributable to redeemable participating shareholders at end of financial period 80,441,328 28,812,983 270,302,363 502,456,334 14,656,046,827
* Please refer to Note 18 of the financial statements.^ The Company Total as at 30 June 2020 has been adjusted to account for cross investments by BNY Mellon Euroland Bond Fund and BNY Mellon European Credit Fund.
03613-1B.indd 313 19/08/2020 19:04

314
For the financial period ended 30 June 2019
BNY MelloN GloBal FuNds, plc
Statement oF ChanGeS in net aSSetS attriBUtaBle to reDeemaBle partiCipatinG ShareholDerS
BNY Mellon Absolute
Return Bond Fund
BNY Mellon Absolute
ReturnEquity
Fund
BNY Mellon Absolute
Return GlobalConvertible
Fund*
BNY Mellon Asia
Rising Stars Fund
BNY Mellon Asian
Equity Fund
BNY Mellon Asian
Income Fund
BNY Mellon Brazil
Equity Fund
BNY Mellon Digital Assets Fund*
BNY Mellon Dynamic
Total Return
Fund
BNY Mellon Dynamic
U.S. Equity
Fund
BNY Mellon Emerging
Markets Corporate
Debt Fund
BNY Mellon Emerging
Markets Debt Fund
BNY Mellon Emerging
Markets DebtLocal Currency
Fund
BNY Mellon Emerging
Markets DebtOpportunistic
Fund
EUR GBP EUR USD USD GBP USD USD USD USD USD USD USD USD
net assets attributable to redeemable participating shareholders at beginning of financial period 998,363,169 1,633,298,086 – 12,686,883 36,483,227 20,730,559 88,425,348 – 33,158,038 143,723,236 237,470,364 49,332,577 715,966,982 33,145,193notional exchange adjustment (note 1) – – – – – – – – – – – – – –increase/(decrease) in net assets attributable to redeemable participating shareholders from operations (9,920,944) (35,590,351) 85,650 560,434 4,131,710 2,617,329 8,417,383 314,092 2,870,422 25,718,489 20,216,802 4,745,978 39,987,562 2,222,210proceeds from redeemable participating shares issued 69,697,099 110,747,538 19,999,905 412,239 4,011,216 1,589,016 78,880,560 7,647,210 1,117,720 15,821,567 124,736,320 17,765,857 166,643,067 1,841,459Cost of redeemable participating shares redeemed (473,669,622) (910,117,402) – (5,842,074) (7,697,111) (1,850,582) (74,725,616) – (11,705,813) (57,973,667) (54,458,208) (33,574,264) (325,416,073) (1,810,197)
Net increase/(decrease) in net assets from share transactions (403,972,523) (799,369,864) 19,999,905 (5,429,835) (3,685,895) (261,566) 4,154,944 7,647,210 (10,588,093) (42,152,100) 70,278,112 (15,808,407) (158,773,006) 31,262
Net assets attributable to redeemable participating shareholders at end of financial period 584,469,702 798,337,871 20,085,555 7,817,482 36,929,042 23,086,322 100,997,675 7,961,302 25,440,367 127,289,625 327,965,278 38,270,148 597,181,538 35,398,665
BNY Mellon Emerging
Markets Debt Total
Return Fund
BNY Mellon Euroland
Bond Fund
BNY Mellon European
Credit Fund
BNY Mellon Global
Bond Fund
BNY Mellon Global Credit
Fund
BNY Mellon Global
Dynamic Bond Fund
BNY Mellon Global
Emerging Markets
Fund
BNY Mellon Global Equity
Fund
BNY Mellon Global Equity
Income Fund
BNY Mellon Global
High Yield Bond Fund
BNY Mellon Global
Infrastructure Income
Fund
BNY Mellon Global
Leaders Fund
BNY Mellon Global
Multi-Asset Income
Fund
BNY Mellon Global
Opportunistic Bond
Fund**
USD EUR EUR USD USD USD USD USD USD USD USD USD EUR USD
net assets attributable to redeemable participating shareholders at beginning of financial period 127,332,704 962,053,446 42,163,584 497,707,995 404,522,874 537,303,757 49,709,170 295,039,594 920,730,755 85,317,396 11,715,822 68,801,755 14,318,867 26,073,901notional exchange adjustment (note 1) – – – – – – – – – – – – – –increase/(decrease) in net assets attributable to redeemable participating shareholders from operations 7,610,671 54,804,273 2,049,668 33,077,374 36,035,071 18,850,409 4,964,442 43,731,867 185,615,210 7,629,508 877,119 12,299,877 1,005,886 592,562proceeds from redeemable participating shares issued 4,835,506 79,709,609 949,536 179,418,970 12,170,199 76,252,712 4,949,090 42,301,129 809,417,812 56,113,383 3,732,407 8,070,605 4,597,746 148,255Cost of redeemable participating shares redeemed (11,839,994) (121,672,106) (8,985,559) (96,498,346) (11,583,152) (156,079,692) (26,026,991) (38,021,479) (338,476,897) (20,851,177) (757,381) (5,179,171) (87,746) (26,814,718)
Net increase/(decrease) in net assets from share transactions (7,004,488) (41,962,497) (8,036,023) 82,920,624 587,047 (79,826,980) (21,077,901) 4,279,650 470,940,915 35,262,206 2,975,026 2,891,434 4,510,000 (26,666,463)
Net assets attributable to redeemable participating shareholders at end of financial period 127,938,887 974,895,222 36,177,229 613,705,993 441,144,992 476,327,186 33,595,711 343,051,111 1,577,286,880 128,209,110 15,567,967 83,993,066 19,834,753 –
* This Fund launched during the financial period. ** This Fund closed during the financial period.
The accompanying notes form an integral part of these financial statements.
03613-1B.indd 314 19/08/2020 19:04

315
For the financial period ended 30 June 2019 (cont’d.)
BNY MelloN GloBal FuNds, plc
Statement oF ChanGeS in net aSSetS attriBUtaBle to reDeemaBle partiCipatinG ShareholDerS
BNY Mellon Absolute
Return Bond Fund
BNY Mellon Absolute
ReturnEquity
Fund
BNY Mellon Absolute
Return GlobalConvertible
Fund*
BNY Mellon Asia
Rising Stars Fund
BNY Mellon Asian
Equity Fund
BNY Mellon Asian
Income Fund
BNY Mellon Brazil
Equity Fund
BNY Mellon Digital Assets Fund*
BNY Mellon Dynamic
Total Return
Fund
BNY Mellon Dynamic
U.S. Equity
Fund
BNY Mellon Emerging
Markets Corporate
Debt Fund
BNY Mellon Emerging
Markets Debt Fund
BNY Mellon Emerging
Markets DebtLocal Currency
Fund
BNY Mellon Emerging
Markets DebtOpportunistic
Fund
EUR GBP EUR USD USD GBP USD USD USD USD USD USD USD USD
net assets attributable to redeemable participating shareholders at beginning of financial period 998,363,169 1,633,298,086 – 12,686,883 36,483,227 20,730,559 88,425,348 – 33,158,038 143,723,236 237,470,364 49,332,577 715,966,982 33,145,193notional exchange adjustment (note 1) – – – – – – – – – – – – – –increase/(decrease) in net assets attributable to redeemable participating shareholders from operations (9,920,944) (35,590,351) 85,650 560,434 4,131,710 2,617,329 8,417,383 314,092 2,870,422 25,718,489 20,216,802 4,745,978 39,987,562 2,222,210proceeds from redeemable participating shares issued 69,697,099 110,747,538 19,999,905 412,239 4,011,216 1,589,016 78,880,560 7,647,210 1,117,720 15,821,567 124,736,320 17,765,857 166,643,067 1,841,459Cost of redeemable participating shares redeemed (473,669,622) (910,117,402) – (5,842,074) (7,697,111) (1,850,582) (74,725,616) – (11,705,813) (57,973,667) (54,458,208) (33,574,264) (325,416,073) (1,810,197)
Net increase/(decrease) in net assets from share transactions (403,972,523) (799,369,864) 19,999,905 (5,429,835) (3,685,895) (261,566) 4,154,944 7,647,210 (10,588,093) (42,152,100) 70,278,112 (15,808,407) (158,773,006) 31,262
Net assets attributable to redeemable participating shareholders at end of financial period 584,469,702 798,337,871 20,085,555 7,817,482 36,929,042 23,086,322 100,997,675 7,961,302 25,440,367 127,289,625 327,965,278 38,270,148 597,181,538 35,398,665
BNY Mellon Emerging
Markets Debt Total
Return Fund
BNY Mellon Euroland
Bond Fund
BNY Mellon European
Credit Fund
BNY Mellon Global
Bond Fund
BNY Mellon Global Credit
Fund
BNY Mellon Global
Dynamic Bond Fund
BNY Mellon Global
Emerging Markets
Fund
BNY Mellon Global Equity
Fund
BNY Mellon Global Equity
Income Fund
BNY Mellon Global
High Yield Bond Fund
BNY Mellon Global
Infrastructure Income
Fund
BNY Mellon Global
Leaders Fund
BNY Mellon Global
Multi-Asset Income
Fund
BNY Mellon Global
Opportunistic Bond
Fund**
USD EUR EUR USD USD USD USD USD USD USD USD USD EUR USD
net assets attributable to redeemable participating shareholders at beginning of financial period 127,332,704 962,053,446 42,163,584 497,707,995 404,522,874 537,303,757 49,709,170 295,039,594 920,730,755 85,317,396 11,715,822 68,801,755 14,318,867 26,073,901notional exchange adjustment (note 1) – – – – – – – – – – – – – –increase/(decrease) in net assets attributable to redeemable participating shareholders from operations 7,610,671 54,804,273 2,049,668 33,077,374 36,035,071 18,850,409 4,964,442 43,731,867 185,615,210 7,629,508 877,119 12,299,877 1,005,886 592,562proceeds from redeemable participating shares issued 4,835,506 79,709,609 949,536 179,418,970 12,170,199 76,252,712 4,949,090 42,301,129 809,417,812 56,113,383 3,732,407 8,070,605 4,597,746 148,255Cost of redeemable participating shares redeemed (11,839,994) (121,672,106) (8,985,559) (96,498,346) (11,583,152) (156,079,692) (26,026,991) (38,021,479) (338,476,897) (20,851,177) (757,381) (5,179,171) (87,746) (26,814,718)
Net increase/(decrease) in net assets from share transactions (7,004,488) (41,962,497) (8,036,023) 82,920,624 587,047 (79,826,980) (21,077,901) 4,279,650 470,940,915 35,262,206 2,975,026 2,891,434 4,510,000 (26,666,463)
Net assets attributable to redeemable participating shareholders at end of financial period 127,938,887 974,895,222 36,177,229 613,705,993 441,144,992 476,327,186 33,595,711 343,051,111 1,577,286,880 128,209,110 15,567,967 83,993,066 19,834,753 –
* This Fund launched during the financial period. ** This Fund closed during the financial period.
The accompanying notes form an integral part of these financial statements.
03613-1B.indd 315 19/08/2020 19:04

316
For the financial period ended 30 June 2019 (cont’d.)
BNY MelloN GloBal FuNds, plc
Statement oF ChanGeS in net aSSetS attriBUtaBle to reDeemaBle partiCipatinG ShareholDerS
BNY Mellon Global
Opportunities Fund
BNY Mellon Global
Real Return
Fund (EUR)
BNY Mellon Global
Real Return
Fund (GBP)
BNY Mellon Global
Real Return
Fund (USD)
BNY Mellon Global
Short-Dated High Yield
Bond Fund
BNY Mellon Global
Unconstrained Fund
BNY Mellon Japan
All Cap Equity
Fund**
BNY Mellon Japan
REIT Alpha
Fund**
BNY Mellon Japan
Small Cap Equity Focus Fund
BNY Mellon Long-Term
Global Equity
Fund
BNY Mellon Mobility
Innovation Fund
BNY Mellon S&P
500® Index
Tracker
BNY Mellon Small
Cap Euroland
Fund
BNY Mellon Sustainable
Global Dynamic
Bond Fund*
USD EUR GBP USD USD USD JPY JPY JPY EUR USD USD EUR EUR
net assets attributable to redeemable participating shareholders at beginning of financial period 45,295,654 2,900,593,648 59,435,370 317,882,822 641,584,834 19,675,797 997,259,890 1,504,017,944 17,781,724,574 1,319,111,050 31,986,385 71,877,432 77,665,450 –notional exchange adjustment (note 1) – – – – – – – – – – – – – –increase/(decrease) in net assets attributable to redeemable participating shareholders from operations 6,945,006 219,742,815 4,218,413 26,306,571 13,043,987 3,138,623 57,646,286 50,285,213 524,998,539 280,595,270 6,968,513 12,349,260 12,847,576 3,185,774proceeds from redeemable participating shares issued 5,814,478 711,131,790 11,329,746 29,701,244 218,703,161 399,155 141,051 3,396 1,991,743,434 485,404,003 72,067,796 4,080,595 12,532,887 162,718,503Cost of redeemable participating shares redeemed (8,841,271) (549,528,902) (9,555,828) (54,950,752) (162,648,943) – (1,055,047,227) (1,554,306,553) (6,064,254,390) (170,095,722) (9,470,587) (12,198,991) (37,047,688) (3)
Net increase/(decrease) in net assets from share transactions (3,026,793) 161,602,888 1,773,918 (25,249,508) 56,054,218 399,155 (1,054,906,176) (1,554,303,157) (4,072,510,956) 315,308,281 62,597,209 (8,118,396) (24,514,801) 162,718,500
Net assets attributable to redeemable participating shareholders at end of financial period 49,213,867 3,281,939,351 65,427,701 318,939,885 710,683,039 23,213,575 – – 14,234,212,157 1,915,014,601 101,552,107 76,108,296 65,998,225 165,904,274
BNY Mellon Targeted
Return Bond Fund
BNY Mellon U.S.
Dynamic Value Fund
BNY Mellon U.S.
Equity Income
Fund
BNY Mellon U.S.
High Yield BetaFund
BNY Mellon U.S.
Municipal Infrastructure
Debt Fund
BNY Mellon U.S.
Opportunistic Alpha Fund
BNY Mellon US
Opportunities Fund
Total 30 June
2019^
USD USD USD USD USD USD USD USD
net assets attributable to redeemable participating shareholders at beginning of financial period 79,396,243 22,164,085 333,162,016 39,253,799 342,360,937 4,811,580 32,803,448 15,938,141,728notional exchange adjustment (note 1) – – – – – – – (35,042,424)increase/(decrease) in net assets attributable to redeemable participating shareholders from operations 593,566 3,098,301 49,927,421 4,062,572 12,617,075 (59,545) 5,438,172 1,209,297,439proceeds from redeemable participating shares issued 1,140,703 2,767,148 65,713,674 303,411,967 47,064,854 – 2,922,934 4,287,033,099Cost of redeemable participating shares redeemed (84,041) (4,448,803) (55,909,839) (19,874,075) (63,903,998) – (30,641,912) (4,531,420,053)
Net increase/(decrease) in net assets from share transactions 1,056,662 (1,681,655) 9,803,835 283,537,892 (16,839,144) – (27,718,978) (244,386,954)
Net assets attributable to redeemable participating shareholders at end of financial period 81,046,471 23,580,731 392,893,272 326,854,263 338,138,868 4,752,035 10,522,642 16,868,009,789
* This Fund launched during the financial period. ** This Fund closed during the financial period. ^ The Company Total as at 30 June 2019 has been adjusted to account for cross investments by BNY Mellon Euroland Bond Fund and BNY Mellon European Credit Fund.
03613-1B.indd 316 19/08/2020 19:04

317
For the financial period ended 30 June 2019 (cont’d.)
BNY MelloN GloBal FuNds, plc
Statement oF ChanGeS in net aSSetS attriBUtaBle to reDeemaBle partiCipatinG ShareholDerS
BNY Mellon Global
Opportunities Fund
BNY Mellon Global
Real Return
Fund (EUR)
BNY Mellon Global
Real Return
Fund (GBP)
BNY Mellon Global
Real Return
Fund (USD)
BNY Mellon Global
Short-Dated High Yield
Bond Fund
BNY Mellon Global
Unconstrained Fund
BNY Mellon Japan
All Cap Equity
Fund**
BNY Mellon Japan
REIT Alpha
Fund**
BNY Mellon Japan
Small Cap Equity Focus Fund
BNY Mellon Long-Term
Global Equity
Fund
BNY Mellon Mobility
Innovation Fund
BNY Mellon S&P
500® Index
Tracker
BNY Mellon Small
Cap Euroland
Fund
BNY Mellon Sustainable
Global Dynamic
Bond Fund*
USD EUR GBP USD USD USD JPY JPY JPY EUR USD USD EUR EUR
net assets attributable to redeemable participating shareholders at beginning of financial period 45,295,654 2,900,593,648 59,435,370 317,882,822 641,584,834 19,675,797 997,259,890 1,504,017,944 17,781,724,574 1,319,111,050 31,986,385 71,877,432 77,665,450 –notional exchange adjustment (note 1) – – – – – – – – – – – – – –increase/(decrease) in net assets attributable to redeemable participating shareholders from operations 6,945,006 219,742,815 4,218,413 26,306,571 13,043,987 3,138,623 57,646,286 50,285,213 524,998,539 280,595,270 6,968,513 12,349,260 12,847,576 3,185,774proceeds from redeemable participating shares issued 5,814,478 711,131,790 11,329,746 29,701,244 218,703,161 399,155 141,051 3,396 1,991,743,434 485,404,003 72,067,796 4,080,595 12,532,887 162,718,503Cost of redeemable participating shares redeemed (8,841,271) (549,528,902) (9,555,828) (54,950,752) (162,648,943) – (1,055,047,227) (1,554,306,553) (6,064,254,390) (170,095,722) (9,470,587) (12,198,991) (37,047,688) (3)
Net increase/(decrease) in net assets from share transactions (3,026,793) 161,602,888 1,773,918 (25,249,508) 56,054,218 399,155 (1,054,906,176) (1,554,303,157) (4,072,510,956) 315,308,281 62,597,209 (8,118,396) (24,514,801) 162,718,500
Net assets attributable to redeemable participating shareholders at end of financial period 49,213,867 3,281,939,351 65,427,701 318,939,885 710,683,039 23,213,575 – – 14,234,212,157 1,915,014,601 101,552,107 76,108,296 65,998,225 165,904,274
BNY Mellon Targeted
Return Bond Fund
BNY Mellon U.S.
Dynamic Value Fund
BNY Mellon U.S.
Equity Income
Fund
BNY Mellon U.S.
High Yield BetaFund
BNY Mellon U.S.
Municipal Infrastructure
Debt Fund
BNY Mellon U.S.
Opportunistic Alpha Fund
BNY Mellon US
Opportunities Fund
Total 30 June
2019^
USD USD USD USD USD USD USD USD
net assets attributable to redeemable participating shareholders at beginning of financial period 79,396,243 22,164,085 333,162,016 39,253,799 342,360,937 4,811,580 32,803,448 15,938,141,728notional exchange adjustment (note 1) – – – – – – – (35,042,424)increase/(decrease) in net assets attributable to redeemable participating shareholders from operations 593,566 3,098,301 49,927,421 4,062,572 12,617,075 (59,545) 5,438,172 1,209,297,439proceeds from redeemable participating shares issued 1,140,703 2,767,148 65,713,674 303,411,967 47,064,854 – 2,922,934 4,287,033,099Cost of redeemable participating shares redeemed (84,041) (4,448,803) (55,909,839) (19,874,075) (63,903,998) – (30,641,912) (4,531,420,053)
Net increase/(decrease) in net assets from share transactions 1,056,662 (1,681,655) 9,803,835 283,537,892 (16,839,144) – (27,718,978) (244,386,954)
Net assets attributable to redeemable participating shareholders at end of financial period 81,046,471 23,580,731 392,893,272 326,854,263 338,138,868 4,752,035 10,522,642 16,868,009,789
* This Fund launched during the financial period. ** This Fund closed during the financial period. ^ The Company Total as at 30 June 2019 has been adjusted to account for cross investments by BNY Mellon Euroland Bond Fund and BNY Mellon European Credit Fund.
03613-1B.indd 317 19/08/2020 19:04

318
1. SUMMARY OF SIGNIFICANT ACCOUNTING POLICIES
The significant accounting policies and estimation techniques applied in the preparation of these financial statements are set out below:
STATEMENT OF COMPLIANCEThe condensed financial statements for the financial period ended 30 June 2020 have been prepared in accordance with Financial Reporting Standard (“FRS”) FRS 104: “Interim Financial Reporting” and Irish statute comprising the European Communities (Undertakings for Collective Investment in Transferable Securities) Regulations, 2011 (as amended) (the “UCITS Regulations”) and the Central Bank (Supervision and Enforcement) Act 2013 (Section 48(1)) (Undertakings for Collective Investment in Transferable Securities Regulations) 2019 (the “Central Bank UCITS Regulations”). The condensed financial statements should be read in conjunction with the annual report and audited financial statements for the financial year ended 31 December 2019 which have been prepared in accordance with FRS 102: “The Financial Reporting Standard applicable in the United Kingdom and the Republic of Ireland” (“FRS 102”) and Irish statute.
BASIS OF PREPARATIONThe financial statements have been prepared on a going concern basis for the Company under the historical cost convention as modified by the revaluation of financial assets and liabilities held at fair value through the profit or loss.
The format and certain wordings of the financial statements has been adapted from those contained in the Companies Act 2014, as amended, so that, in the opinion of the Directors, they more appropriately reflect the nature of the Company’s business as an investment fund.
The Company has availed of the exemption available to open-ended investment funds under Section 7 “Statement of Cash Flows” of FRS 102 not to prepare a cash flow statement on the basis that substantially all of the Company’s investments are highly liquid and carried at fair value, and the Company provides a statement of changes in net assets attributable to redeemable participating shareholders.
CRITICAL ACCOUNTING ESTIMATES AND JUDGEMENTSThe preparation of financial statements requires the use of certain critical accounting estimates. It also requires the Directors to exercise its judgement in the process of applying the Company’s accounting policies. Management makes estimates and assumptions concerning the future. The estimates and assumptions that have a significant risk of causing a material adjustment to the carrying amounts of assets and liabilities are discussed below within “Financial assets and liabilities at fair value through profit or loss – Fair value estimation”. The Company based its assumptions and estimates on parameters available when the financial statements were prepared. However, existing circumstances and assumptions about future developments may change due to market changes or circumstances arising beyond the control of the Company. Such changes are reflected in the assumptions when they occur and are recognised prospectively.
FOREIGN CURRENCY TRANSLATION – FUNCTIONAL AND PRESENTATION CURRENCYItems included in the Company’s financial statements are measured using the currency of the primary economic environment in which each Fund operates (the “functional currency”). The functional currency of each Fund has been evaluated by the Board of Directors based on the currency that most faithfully represents the economic effects of the underlying transactions, events, investors’ base and conditions. The financial statements are presented in US dollar, which is the Company’s presentational currency.
The functional and presentation currency of the Funds are US dollar, Euro, Sterling or Japanese yen as noted in the Statement of Financial Position.
Foreign currency assets and liabilities, including net assets attributable to redeemable participating shareholders are translated into the functional currency using the closing rate applicable at the financial period end date. Foreign currency income and expenses in the Statement of Comprehensive Income are translated into the functional currency at the exchange rates prevailing at the dates of the transactions. Proceeds from redeemable participating shares issued and the cost of redeemable participating shares redeemed are also translated into the functional currency at the exchange rates prevailing at the dates of the transactions. Foreign exchange gains and losses arising from transactions and translations are presented in the Statement of Comprehensive Income within “net gains/losses on financial assets/liabilities at fair value through profit or loss”.
Notes to the FiNaNcial statemeNts
BNY melloN GloBal FuNds, plc
03613-1C.indd 318 19/08/2020 19:02
319
BNY MelloN GloBal FuNds, plc
Notes to the FiNaNcial statemeNts
1. SUMMARY OF SIGNIFICANT ACCOUNTING POLICIES cont’d.
FOREIGN CURRENCY TRANSLATION – FUNCTIONAL AND PRESENTATION CURRENCY cont’d.For Company aggregation purposes, all assets and liabilities together with income and expenses for all classes of shares are translated into US dollar using the closing rate for assets and liabilities and the average rate for income and expenses including subscriptions and redemptions, as this is the currency of the primary economic environment in which the Company operates. A currency adjustment arises from the re-translation of the opening net assets at the financial period end exchange rates, as disclosed in the Statement of Changes in Net Assets Attributable to Redeemable Participating Shareholders. This method of allocation has no effect on the value of net assets allocated to the individual Funds.
FINANCIAL ASSETS AND LIABILITIES AT FAIR VALUE THROUGH PROFIT OR LOSS – CLASSIFICATIONThis category has two sub-categories: financial assets and liabilities held for trading, and those designated at fair value through profit or loss at inception.
A financial asset or liability is classified as held for trading if it is acquired or incurred principally for the purpose of selling or repurchasing in the near term or if on initial recognition is part of a portfolio of identifiable financial investments that are managed together and for which there is evidence of a recent actual pattern of short-term profit taking. Derivatives are also categorised as held for trading.
Financial assets and liabilities designated at fair value through profit or loss at inception are financial instruments that are not classified as held for trading but are managed, and their performance is evaluated on a fair value basis in accordance with the investment strategy of the Funds as documented in the prospectus.
FINANCIAL ASSETS AND LIABILITIES AT FAIR VALUE THROUGH PROFIT OR LOSS – RECOGNITION AND MEASUREMENTRegular purchases and sales of investments are recognised on the trade date – the date on which the Company commits to purchase or sell the investment. Financial assets and liabilities at fair value through profit or loss are initially recognised at fair value. Transaction costs are expensed as incurred in the Statement of Comprehensive Income.
Financial assets are derecognised when the rights to receive cash flows from the investments have expired or the Company has transferred substantially all risks and rewards of ownership.
Subsequent to initial recognition, all financial assets and liabilities at fair value through profit or loss are measured at fair value. Gains and losses arising from changes in the fair value of the “financial assets or financial liabilities at fair value through profit or loss” category are presented in the Statement of Comprehensive Income within “net gains/(losses) on financial assets/liabilities at fair value through profit or loss” in the financial period in which they arise using the average cost method.
For hedge share class level forward foreign currency contracts, the realised and unrealised gains or losses are allocated solely to the relevant share classes. The unrealised gains or losses on hedging activities are reflected in the “financial assets or financial liabilities at fair value through profit or loss” category in the Statement of Financial Position.
FINANCIAL ASSETS AND LIABILITIES AT FAIR VALUE THROUGH PROFIT OR LOSS – FAIR VALUE ESTIMATIONThe fair value of financial assets and liabilities traded in active markets (such as publicly traded derivatives and trading securities) are based on quoted market prices at the financial period end date. In accordance with FRS 102, the Company has applied the recognition and measurement provisions of International Accounting Standards No. 39 “Financial Instruments: Recognition and Measurement” as adopted for use in the European Union. Accordingly, the quoted market price used for financial assets held is the mid-market price. When the Company holds derivatives with offsetting market risks, it uses mid-market prices as a basis for establishing fair values for the offsetting risk positions and applies this mid-market price to the net open position, as appropriate.
If a significant movement in fair value occurs subsequent to the valuation point of the Funds on the financial period end date, valuation techniques will be applied to determine the fair value. A significant event is any event that occurs after the last market price for a security, close of market or close of the foreign exchange, but before the Funds’ valuation time that
03613-1C.indd 319 19/08/2020 19:02

320
BNY MelloN GloBal FuNds, plc
Notes to the FiNaNcial statemeNts
1. SUMMARY OF SIGNIFICANT ACCOUNTING POLICIES cont’d.
FINANCIAL ASSETS AND LIABILITIES AT FAIR VALUE THROUGH PROFIT OR LOSS – FAIR VALUE ESTIMATION cont’d.materially affects the integrity of the closing prices for any security, instrument, currency or securities affected by that event so that they cannot be considered readily available market quotations.
The fair value of financial assets and liabilities that are not traded in an active market (for example over-the-counter derivatives) is determined by using valuation techniques. The Company uses a variety of methods and makes assumptions that are based on market conditions existing at each reporting date. Valuation techniques used include the use of comparable recent arm’s length transactions, reference to other instruments that are substantially the same, discounted cash flow analysis, option pricing models and other valuation techniques commonly used by market participants making the maximum use of market inputs and relying as little as possible on entity-specific inputs.
The carrying value less impairment provision of other receivables and payables are assumed to approximate their fair values.
The main valuation techniques of the Company are as follows:
(a) Financial assets and liabilities listed and regularly traded on a recognised exchange and for which market quotations are readily available or traded on over-the-counter markets shall be valued at the mid-market price accordingly on the principal exchange in the market for such investment.
(b) If the financial assets and liabilities are listed on several recognised exchanges, the mid-market price on the recognised exchange, which, in the opinion of the Directors in consultation with the relevant Investment Manager, constitutes the principal market for such assets, will be used.
(c) If for specific financial assets or liabilities the mid-market price referred to in (a) or (b) above is not available or does not, in the opinion of the Directors in consultation with the relevant Investment Manager, reflect a fair or appropriate value, the value shall be calculated by alternative methods with care and in good faith by the Directors, as appropriate, approved for such purpose by The Bank of New York Mellon SA/NV, Dublin Branch (the “Depositary”), in consultation with the relevant Investment Manager with a view to establishing the probable realisation value for such assets.
(d) In the event that any financial assets or liabilities are not listed or dealt on any recognised exchange, such assets shall be valued by the Directors with care and in good faith and in consultation with the relevant Investment Manager at the probable realisation value. Such probable realisation value may be determined by using a quotation from a broker.
(e) Cash and other liquid assets are valued at their face value with interest accrued, where applicable.(f) Units or shares in collective investment schemes (other than those valued pursuant to (a) or (b) above), are valued
at the latest available net asset value of the relevant collective investment scheme.(g) Derivative instruments dealt on a market are fair valued at the settlement price for such instruments on such
market. Where such derivative instruments are not dealt on a market, their value shall be the daily quotation from independent pricing service or market makers.
(h) Forward foreign currency contracts are fair valued by an independent price source by reference to the price at which a new forward contract of the same size and maturity could be undertaken.
(i) Initial margin deposits are made upon entering into futures contracts and are generally made in cash or cash equivalents. Futures contracts are fair valued based upon their quoted daily settlement prices. Changes in the value of open futures contracts are recognised as unrealised gains or losses on futures contracts until the contracts are terminated, at which time the realised gains and losses are recognised. Unrealised gains or losses on futures contracts are shown in the Schedule of Investments. The variation margin receivable or payable at the reporting date is reported as an asset or liability, as applicable, in the Statement of Financial Position.
(j) The premium on purchased put options exercised is subtracted from the proceeds of the sale of the underlying security or foreign currency in determining the realised gain or loss. The premium on purchased call options exercised is added to the cost of the securities or foreign currencies purchased. Premiums paid from the purchase of options, which expire unexercised are treated as realised losses. The premium on written call options exercised is added to the proceeds from the sale of the underlying security or foreign currency in determining the realised gain or loss. The premium on written put options exercised is subtracted from the cost of the securities or foreign currencies purchased. Premiums received from written options, which expire unexercised are treated as realised gains.
03613-1C.indd 320 19/08/2020 19:02

321
BNY MelloN GloBal FuNds, plc
Notes to the FiNaNcial statemeNts
1. SUMMARY OF SIGNIFICANT ACCOUNTING POLICIES cont’d.
FINANCIAL ASSETS AND LIABILITIES AT FAIR VALUE THROUGH PROFIT OR LOSS – FAIR VALUE ESTIMATION cont’d.(k) Interest rate, credit default and total return swap contracts are fair valued daily based upon quotations from
independent pricing service or market makers and the change in the value if any is recorded as unrealised gains or losses. Payments received or made as a result of the contract termination are recognised net of any upfront payment as realised gains or losses. Income on over-the-counter derivatives accrues to the Funds and is not subject to any returns sharing arrangements with BNY Mellon Fund Management (Luxembourg) S.A. (the “Manager”) or any other parties.
(l) Commercial paper and time deposits are valued at amortised cost, as a best estimate of fair value. The Company may invest in financial instruments that are not traded in an active market, whereby fair value may be determined by applying valuation techniques, such as discounted cash flow analysis and other valuation techniques used by market participants.
(m) Exchange traded funds are fair valued based upon quotations of the net asset value per share from independent pricing sources.
(n) Certain Funds may enter into “TBA” (To Be Announced) purchase commitments to purchase securities for a fixed unit price at a future date beyond customary settlement time. Although the unit price has been established, the principal value has not been finalised. The Funds hold and maintain until settlement date, cash or high grade debt obligations in an amount sufficient to meet the purchase price, or the Funds may enter into offsetting contracts for the forward sale of other securities they own. Income on the securities will not be earned until settlement date. TBA purchase commitments may be considered securities in themselves and involve a risk of loss if the value of the security to be purchased declines prior to settlement date, which is in addition to the risk of decline in the value of the Funds’ other assets. Unsettled TBA purchase commitments are valued at the current market value of the underlying securities. Although the Funds may enter into TBA purchase commitments with the intention of acquiring securities for their portfolios or for delivery pursuant to option contracts that they have entered into, the Funds may dispose of a commitment prior to settlement if the Investment Manager deems it the appropriate action.
(o) Equity swaps are priced in accordance with the pricing basis for the underlying equity positions. Finance charges on equity swaps are accrued daily, reset on a monthly basis and subject to settlement on disposal of equity swaps. Income on equity swaps accrues to the Funds and is not subject to any returns sharing arrangements with the Manager or any other parties.
(p) Loans are fair valued based on valuations provided by the pricing vendor Markit. Fees earned or paid and the receipt of payments of principal are recorded as a component of “net gains/(losses) on financial assets/liabilities at fair value through profit or loss” in the Statement of Comprehensive Income. Where Markit is unable to provide a value for a loan, the loan is fair valued based on a quotation obtained from a loan house. Unsettled loans are fair valued based on the agreed purchase price until a valuation from pricing vendor becomes available.
(q) Certain Funds may use Participatory Notes (“P-Notes”) that are either listed or traded on eligible markets. P-Notes provide the Funds with the opportunity for economic exposure to specific equities in restricted or emerging markets, i.e. India, Sri Lanka, Vietnam, Bangladesh, China and Brazil, where owning local equity or equity related securities might be less efficient that the use of P-Notes, leading to a reduction in costs. P-Notes are valued by reference to the mid-market price of the underlying security.
LOANSCertain Funds of the Company may invest in direct debt instruments which are interests in amounts owed to lenders or lending syndicates by corporate, governmental, or other borrowers. A Fund’s investments in loans may be in the form of participations in loans or assignments of all or a portion of loans from third parties. A loan is often administered by a bank or othe r financial institution (the “lender”) that acts as agent for all holders. The agent administers the terms of the loan, as specified in the loan agreement. A Fund may invest in multiple series or tranches of a loan, which may have varying terms and carry different associated risks. A Fund generally has no right to enforce compliance with the terms of the loan agreement with the borrower. As a result, a Fund may be subject to the credit risk of both the borrower and the lender that is selling the loan agreement.
When a Fund purchases assignments from lenders, it acquires direct rights against the borrower of the loan. When investing in a loan, a Fund has the right to receive payments of principal, interest and any fees to which it is entitled only from the lender selling the loan agreement and only upon receipt of payments by the lender from the borrower.
03613-1C.indd 321 19/08/2020 19:02

322
BNY MelloN GloBal FuNds, plc
Notes to the FiNaNcial statemeNts
1. SUMMARY OF SIGNIFICANT ACCOUNTING POLICIES cont’d.
RECEIVABLESReceivables include income receivable, receivable for investments sold, rebate receivable from management company, margins on derivatives contracts, cash collateral received from broker, subscriptions receivable and other receivables. These amounts are recognised initially at fair value and subsequently measured at amortised cost.
FINANCIAL LIABILITIES AT AMORTISED COSTFinancial liabilities at amortised cost include bank overdraft, payable for investments purchased, redemptions payable, expenses payable, performance fees payable, margins on derivatives contracts, cash collateral payable to broker, income payable on swaps, finance charges payable on swaps, tax payable and other payables. These amounts are recognised initially at fair value and subsequently measured at amortised cost.
OFFSETTING FINANCIAL INSTRUMENTSFinancial assets and liabilities are offset and the net amount reported in the Statement of Financial Position when there is a legally enforceable right to offset the recognised amounts and there is an intention to settle on a net basis or realise the asset and settle the liability simultaneously.
CROSS INVESTMENTAs at 30 June 2020 and 31 December 2019, BNY Mellon Euroland Bond Fund and BNY Mellon European Credit Fund invest in other Funds of the Company. These cross investments have been eliminated in the financial statements of the Company. Where a Fund invests in another Fund or Funds of the Company, these cross investments have been deducted from the total net asset value when calculating the management fees payable. The realised gains and losses, including movements in unrealised gains and losses, on the cross investments have been eliminated in the Total Company amounts disclosed in the Statement of Comprehensive Income.
CASH AND CASH EQUIVALENTS AND BANK OVERDRAFTSCash and cash equivalents are valued at face value, with interest accrued where applicable at relevant valuation point on the relevant business day. Cash equivalents include deposits held at call with banks and other short-term investments in an active market with original maturities of three months or less. Bank overdrafts are shown separately in the Statement of Financial Position.
COLLATERALCash collateral provided by the Funds is identified in the Statement of Financial Position as “margins on derivatives contracts” and is not included as a component of cash and cash equivalents. Cash collateral received by the Funds is identified in the Statement of Financial Position as “cash collateral received from broker”. The obligation to return the cash collateral is identified in the Statement of Financial Position as “cash collateral payable to broker”. Cash collateral received is restricted and does not form part of the Funds’ cash and cash equivalents. For collateral other than cash, if the party to whom the collateral is provided has the right by contract or custom to sell or re-pledge the collateral, the Funds classify that asset in its Statement of Financial Position separately from other assets and identify the asset as pledged collateral. Where the party to whom the collateral is provided does not have the right to sell or re-pledge, a disclosure of the collateral provided is made in the Schedule of Investments, as indicated by a “*” tick mark.
TRANSACTION COSTSTransaction costs are costs incurred to acquire financial assets or liabilities at fair value through profit or loss. They include fees and commissions paid to agents, advisers, brokers and dealers. In respect of equities and financial derivative instruments, the transaction costs, when incurred, are immediately recognised in the Statement of Comprehensive Income as an expense and are included in the “net gains/(losses) on financial assets/liabilities at fair value through profit or loss”. In respect of all other securities, the bid ask spread is embedded in the purchase and sale price of the securities and cannot be separately verified or disclosed.
DIVIDEND INCOMEDividend income from financial assets at fair value through profit or loss is recognised in the Statement of Comprehensive Income within “dividend income” when the right of the Funds to receive payments is established. Dividend income is shown gross of any non-recoverable withholding taxes.
03613-1C.indd 322 19/08/2020 19:02

323
BNY MelloN GloBal FuNds, plc
Notes to the FiNaNcial statemeNts
1. SUMMARY OF SIGNIFICANT ACCOUNTING POLICIES cont’d.
DIVIDEND EXPENSEInterest on short equity swaps is recognised in the Statement of Comprehensive Income as “dividend expense”, which may be subject to change, dependant on periodic resetting and/or final disposal of underlying swap instruments.
INTEREST INCOMEInterest income on interest bearing financial instruments is shown as a component of “net gains/(losses) on financial assets/liabilities at fair value through profit or loss”. Bank interest income is accounted for on a cash receipts basis.
TAXATIONUnder current law and practice, there is no income, gains or other taxes payable by the Funds. The Funds currently incur withholding taxes imposed by certain countries on investment income and capital gains. Withholding taxes are disclosed separately in the Statement of Comprehensive Income and net of any tax credits.
Certain Funds accrue for capital gains tax on net realised and unrealised gains on investments. The capital gains tax is recorded in accordance with the understanding of the change in tax regulations and rates on Irish investors. The capital gains tax expense and the amounts payable at the financial period end are reflected in the “withholding taxes on dividends and other investment income” and “tax payable” figures in the Statement of Comprehensive Income and the Statement of Financial Position, respectively.
EXPENSESExpenses are accounted for on an accruals basis. Any costs associated with the termination of a Fund are paid for by the Manager.
SECURITIES LENDINGThe Company has entered into a securities lending agreement (as amended, assigned, novated and assumed) with The Bank of New York Mellon, London Branch and the Depositary. The Company can lend securities with a value of up to 100% of any one line of stock, to borrowers approved by The Bank of New York Mellon. The Company receives securities, financial instruments or other assets as collateral against the loaned securities. The Company does accept cash as collateral but does not engage in cash collateral reinvestment. Collateral held (and pending) will not be less than 102% of the value of the securities on loan. Securities lending income is accounted for on a cash receipts basis. Details of the securities lending position at the financial period end are contained in Note 13 to the financial statements.
DISTRIBUTIONS TO REDEEMABLE PARTICIPATING SHAREHOLDERSDistributions to redeemable participating shareholders are recognised as “finance costs” in the Statement of Comprehensive Income when they are declared to Euronext Dublin, as detailed in the prospectus.
For non-distributing share classes, all income earned and realised net capital gains after the deduction of expenses will be accumulated and reflected in the net asset value per share.
REDEEMABLE PARTICIPATING SHARESThe Company issues multiple classes of redeemable participating shares within each Fund which are redeemable at the holder’s option and do not have identical rights. Such shares are classified as financial liabilities.
Redeemable participating shares can be put back to the Fund at any time for cash equal to a proportionate share of the Fund’s net asset value attributable to the share class. The redeemable participating shares are carried at the redemption amount that is payable at the financial period end date if the holder exercises the right to put the share back to the Fund.
Redeemable participating shares are issued and redeemed at the holder’s option at prices based on the Fund’s net asset value per share at the time of issue or redemption. The Fund’s net asset value per share is calculated by dividing the net assets attributable to the holders of each class of redeemable participating shares with the total number of outstanding redeemable participating shares for each respective class in accordance with the provisions of the prospectus in determining the net asset value per share for subscriptions and redemptions.
03613-1C.indd 323 19/08/2020 19:02

324
BNY MelloN GloBal FuNds, plc
Notes to the FiNaNcial statemeNts
1. SUMMARY OF SIGNIFICANT ACCOUNTING POLICIES cont’d.
DILUTION ADJUSTMENTTo mitigate the effects of dilution, the Directors may, at their discretion, make a dilution adjustment to the net asset value per share. The Directors will retain the discretion in relation to the circumstances in which to make such a dilution adjustment.
The decision to make a dilution adjustment will depend on the volume of subscriptions or redemptions of shares in the Fund. The Directors may in their discretion make a dilution adjustment if, in their opinion, the existing shareholders, in the case of subscriptions, or remaining shareholders, in the case of redemptions, might otherwise be adversely affected. In particular, the dilution adjustment may be made in the following circumstances:
- where a Fund is in continual decline (i.e. is experiencing a net outflow of redemptions);- if the Fund is experiencing large levels of net subscriptions or net redemptions relevant to its size; and- in any other circumstances where the Directors believe it will be in the interests of shareholders to make a dilution
adjustment.
The dilution adjustment will involve adding to the net asset value per share when the Fund is in a net subscription position, and deducting from the net asset value per share when the Fund is in a net redemption position, such figure as the Directors consider represents an appropriate figure to meet transaction costs, including but not restricted to market spreads, brokerage fees and taxes, to preserve the value of the underlying assets of the relevant Fund and in any other circumstances where the Directors believe it will be in the interests of the shareholders. The resultant amount will be the price rounded to such number of decimal places, as the Directors deem appropriate.
Where a dilution adjustment is made, it will increase the price at which shares shall be issued when there are net subscriptions and decrease the price at which shares shall be redeemed when there are net redemptions. The price at which each class of share shall be issued or redeemed (as appropriate) will be calculated separately but any dilution adjustment will in percentage terms affect the price of each class in an identical manner. Such dilution adjustment will not exceed 2% of the Fund’s net asset value. As dilution is directly related to the inflows and outflows from a Fund, it is not possible to accurately predict whether dilution will occur at any future point in time. Consequently, it is also not possible to accurately predict how frequently the dilution adjustment will be applied.
2. SHARE CAPITAL
AUTHORISED SHARESThe initial authorised share capital of the Company is EUR 38,092 divided into 38,092 subscriber shares of EUR 1.00 each and 25,000,000,000 at no par value initially designated as unclassified shares. The unclassified shares are available for issue as participating shares.
SUBSCRIBER SHARESEffective 31 May 2019, the 38,092 subscriber shares at EUR 1.00 each were all issued as fully paid, which were previously held by BNY Mellon Global Management Limited and nominees of same, were transferred to the Manager. The subscriber shares do not entitle the holders to any dividend and on a winding up, entitle the holders to receive the amount paid up thereon but not otherwise to participate in the assets of the Company. The subscriber shares do not form part of the net asset value of the Company and are thus disclosed in the financial statements by way of this note only. In the opinion of the Directors, this disclosure reflects the nature of the Company’s investment business.
REDEEMABLE PARTICIPATING SHARESRedeemable participating shares carry the right to a proportionate share in the assets of the Funds and the holder of the share is entitled to one vote each on a poll. Shares are redeemed by shareholders at prices based on the value of net assets of the relevant class.
03613-1C.indd 324 19/08/2020 19:02

325
BNY MelloN GloBal FuNds, plc
Notes to the FiNaNcial statemeNts
2. SHARE CAPITAL cont’d.
REDEEMABLE PARTICIPATING SHARES cont’d.The activity on redeemable participating shares for the financial period ended 30 June 2020 is as follows:
Fund Share Class Currency
Shares in issue
at beginning of financial period
Shares issued during
the financial period
Shares redeemed
during the financial period
Shares in issue
at end of financial period
BNY Mellon Absolute Return Bond Fundclass c euR 3,649 – – 3,649
class c (inc) euR 2,085 1,150 (2,000) 1,235class d (acc)^ euR 50 – (50) –
class R euR 83,841 2,678 (16,327) 70,192class R (hedged) usd 53,073 30 (17,554) 35,549
class R (inc) euR 16,160 96 (5,525) 10,731class s euR 471,511 11,834 (404,574) 78,771
class s (inc)^ euR 53 – (53) –class t (hedged) chF 343 – – 343class t (hedged) usd 71,235 17,310 (7,767) 80,778
sterling t (acc) (hedged) GBp 77,650 9,287 (512) 86,425class W (acc) euR 2,527 – (1,289) 1,238
class W (acc) (hedged) usd 33,918 502 (8,641) 25,779class W (inc) (hedged)^ usd 1,036 6 (1,042) –
sterling W (acc) (hedged) GBp 933,165 59,125 (63,155) 929,135sterling W (inc) (hedged) GBp 1,951 – – 1,951
class X euR 1,708,506 – (202,232) 1,506,274class X (acc) (hedged)^ usd 1,000 – (1,000) –
sterling X (acc) (hedged) GBp 86,677 – – 86,677
BNY Mellon Absolute Return Equity Fundclass d (acc) (hedged) euR 212,885 – – 212,885
class R (hedged) chF 50,805 – (33,779) 17,026class R (hedged) euR 83,599,873 1,919,959 (23,605,892) 61,913,940class R (hedged) usd 6,922,055 197,278 (865,594) 6,253,739
class R (inc) (hedged) euR 4,941,271 – (980,333) 3,960,938sterling R (acc) GBp 736,190 160,036 (138,750) 757,476sterling s (acc) GBp 325,042 147,123 (30,008) 442,157
class t (hedged) euR 61,142,372 5,646,061 (24,490,238) 42,298,195class t (hedged) usd 7,632,464 – (7,043,602) 588,862class u (hedged) euR 87,518,455 1,874,324 (16,734,177) 72,658,602class u (hedged) usd 3,149,480 30,282 (1,020,927) 2,158,835
class u (inc) (hedged) euR 105,616 – (105,597) 19sterling u (acc) GBp 6,185,440 220,087 (1,632,204) 4,773,323sterling X (acc) GBp 108,311,163 – (40,641,719) 67,669,444
BNY Mellon Absolute Return Global Convertible Fundclass F (acc) (hedged) usd 3,272,563 107,240 (839,010) 2,540,793
sterling F (acc) (hedged) GBp 100,000 – – 100,000class u (acc) euR 19,881,737 – (86,600) 19,795,137
class u (acc) (hedged)^ usd – 794,568 – 794,568sterling u (acc) (hedged)^ GBp 100,000 – (100,000) –
class X (acc) euR 4,936,321 – – 4,936,321
03613-1C.indd 325 19/08/2020 19:02
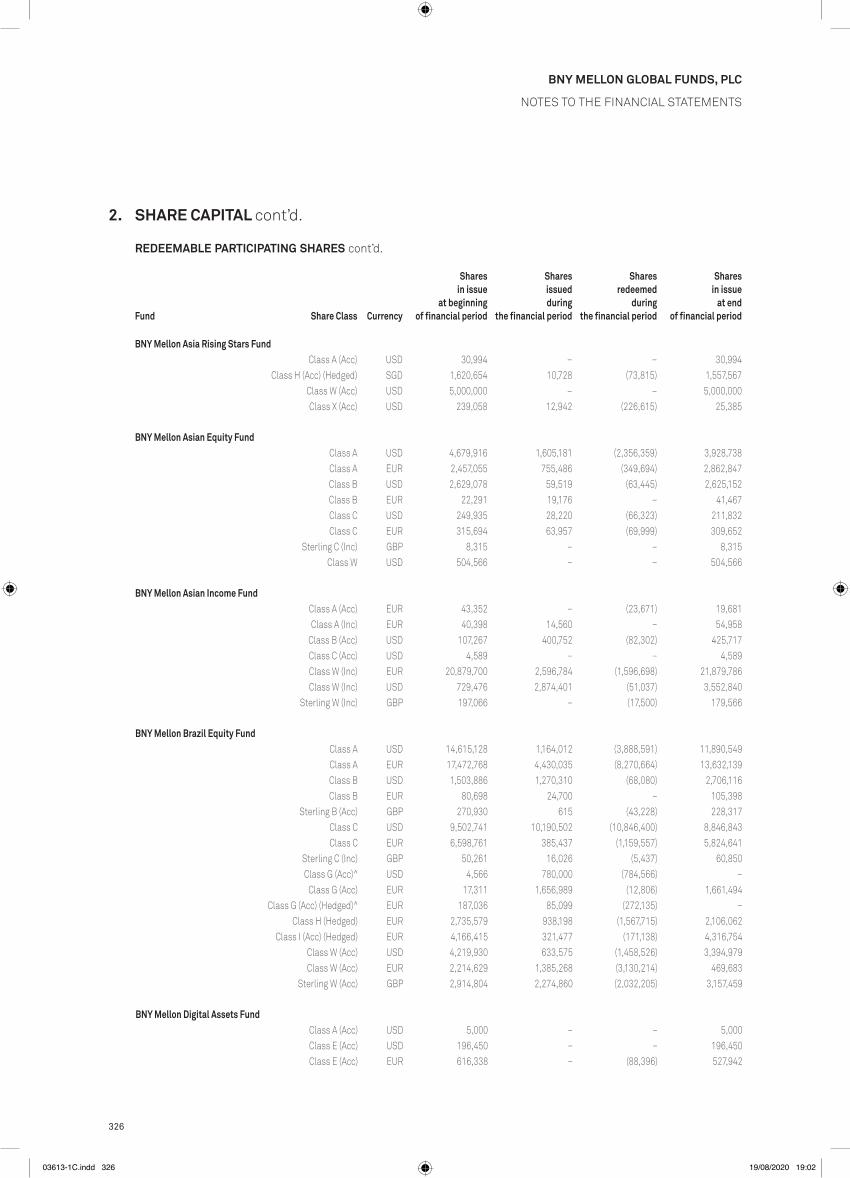
326
BNY MelloN GloBal FuNds, plc
Notes to the FiNaNcial statemeNts
2. SHARE CAPITAL cont’d.
REDEEMABLE PARTICIPATING SHARES cont’d.
Fund Share Class Currency
Shares in issue
at beginning of financial period
Shares issued during
the financial period
Shares redeemed
during the financial period
Shares in issue
at end of financial period
BNY Mellon Asia Rising Stars Fundclass a (acc) usd 30,994 – – 30,994
class h (acc) (hedged) sGd 1,620,654 10,728 (73,815) 1,557,567class W (acc) usd 5,000,000 – – 5,000,000class X (acc) usd 239,058 12,942 (226,615) 25,385
BNY Mellon Asian Equity Fundclass a usd 4,679,916 1,605,181 (2,356,359) 3,928,738class a euR 2,457,055 755,486 (349,694) 2,862,847class B usd 2,629,078 59,519 (63,445) 2,625,152class B euR 22,291 19,176 – 41,467class c usd 249,935 28,220 (66,323) 211,832class c euR 315,694 63,957 (69,999) 309,652
sterling c (inc) GBp 8,315 – – 8,315class W usd 504,566 – – 504,566
BNY Mellon Asian Income Fundclass a (acc) euR 43,352 – (23,671) 19,681class a (inc) euR 40,398 14,560 – 54,958
class B (acc) usd 107,267 400,752 (82,302) 425,717class c (acc) usd 4,589 – – 4,589class W (inc) euR 20,879,700 2,596,784 (1,596,698) 21,879,786class W (inc) usd 729,476 2,874,401 (51,037) 3,552,840
sterling W (inc) GBp 197,066 – (17,500) 179,566
BNY Mellon Brazil Equity Fundclass a usd 14,615,128 1,164,012 (3,888,591) 11,890,549class a euR 17,472,768 4,430,035 (8,270,664) 13,632,139class B usd 1,503,886 1,270,310 (68,080) 2,706,116class B euR 80,698 24,700 – 105,398
sterling B (acc) GBp 270,930 615 (43,228) 228,317class c usd 9,502,741 10,190,502 (10,846,400) 8,846,843class c euR 6,598,761 385,437 (1,159,557) 5,824,641
sterling c (inc) GBp 50,261 16,026 (5,437) 60,850class G (acc)^ usd 4,566 780,000 (784,566) –
class G (acc) euR 17,311 1,656,989 (12,806) 1,661,494class G (acc) (hedged)^ euR 187,036 85,099 (272,135) –
class h (hedged) euR 2,735,579 938,198 (1,567,715) 2,106,062class i (acc) (hedged) euR 4,166,415 321,477 (171,138) 4,316,754
class W (acc) usd 4,219,930 633,575 (1,458,526) 3,394,979class W (acc) euR 2,214,629 1,385,268 (3,130,214) 469,683
sterling W (acc) GBp 2,914,804 2,274,860 (2,032,205) 3,157,459
BNY Mellon Digital Assets Fundclass a (acc) usd 5,000 – – 5,000class e (acc) usd 196,450 – – 196,450class e (acc) euR 616,338 – (88,396) 527,942
03613-1C.indd 326 19/08/2020 19:02
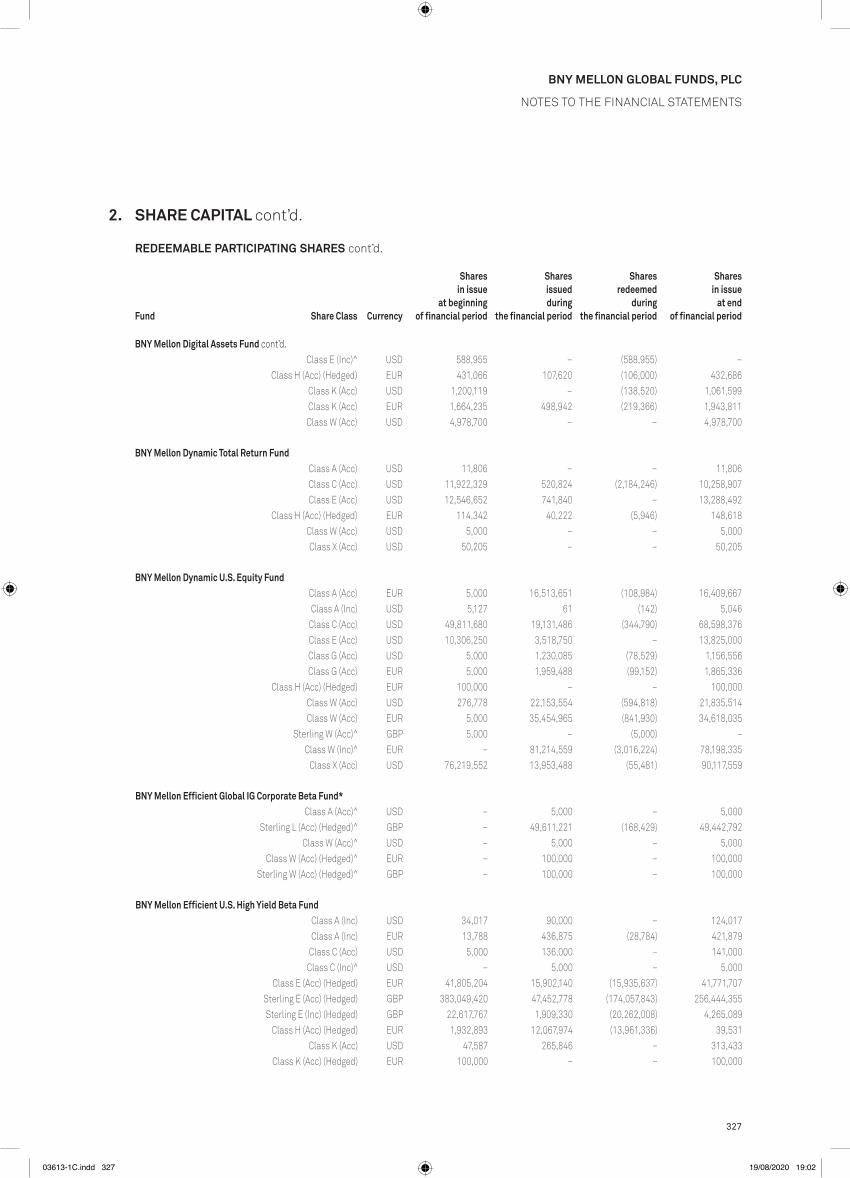
327
BNY MelloN GloBal FuNds, plc
Notes to the FiNaNcial statemeNts
2. SHARE CAPITAL cont’d.
REDEEMABLE PARTICIPATING SHARES cont’d.
Fund Share Class Currency
Shares in issue
at beginning of financial period
Shares issued during
the financial period
Shares redeemed
during the financial period
Shares in issue
at end of financial period
BNY Mellon Digital Assets Fund cont’d.class e (inc)^ usd 588,955 – (588,955) –
class h (acc) (hedged) euR 431,066 107,620 (106,000) 432,686class K (acc) usd 1,200,119 – (138,520) 1,061,599class K (acc) euR 1,664,235 498,942 (219,366) 1,943,811class W (acc) usd 4,978,700 – – 4,978,700
BNY Mellon Dynamic Total Return Fundclass a (acc) usd 11,806 – – 11,806class c (acc) usd 11,922,329 520,824 (2,184,246) 10,258,907class e (acc) usd 12,546,652 741,840 – 13,288,492
class h (acc) (hedged) euR 114,342 40,222 (5,946) 148,618class W (acc) usd 5,000 – – 5,000class X (acc) usd 50,205 – – 50,205
BNY Mellon Dynamic U.S. Equity Fundclass a (acc) euR 5,000 16,513,651 (108,984) 16,409,667class a (inc) usd 5,127 61 (142) 5,046
class c (acc) usd 49,811,680 19,131,486 (344,790) 68,598,376class e (acc) usd 10,306,250 3,518,750 – 13,825,000class G (acc) usd 5,000 1,230,085 (78,529) 1,156,556class G (acc) euR 5,000 1,959,488 (99,152) 1,865,336
class h (acc) (hedged) euR 100,000 – – 100,000class W (acc) usd 276,778 22,153,554 (594,818) 21,835,514class W (acc) euR 5,000 35,454,965 (841,930) 34,618,035
sterling W (acc)^ GBp 5,000 – (5,000) –class W (inc)^ euR – 81,214,559 (3,016,224) 78,198,335
class X (acc) usd 76,219,552 13,953,488 (55,481) 90,117,559
BNY Mellon Efficient Global IG Corporate Beta Fund*class a (acc)^ usd – 5,000 – 5,000
sterling l (acc) (hedged)^ GBp – 49,611,221 (168,429) 49,442,792class W (acc)^ usd – 5,000 – 5,000
class W (acc) (hedged)^ euR – 100,000 – 100,000sterling W (acc) (hedged)^ GBp – 100,000 – 100,000
BNY Mellon Efficient U.S. High Yield Beta Fundclass a (inc) usd 34,017 90,000 – 124,017class a (inc) euR 13,788 436,875 (28,784) 421,879
class c (acc) usd 5,000 136,000 – 141,000class c (inc)^ usd – 5,000 – 5,000
class e (acc) (hedged) euR 41,805,204 15,902,140 (15,935,637) 41,771,707sterling e (acc) (hedged) GBp 383,049,420 47,452,778 (174,057,843) 256,444,355sterling e (inc) (hedged) GBp 22,617,767 1,909,330 (20,262,008) 4,265,089
class h (acc) (hedged) euR 1,932,893 12,067,974 (13,961,336) 39,531class K (acc) usd 47,587 265,846 – 313,433
class K (acc) (hedged) euR 100,000 – – 100,000
03613-1C.indd 327 19/08/2020 19:02

328
BNY MelloN GloBal FuNds, plc
Notes to the FiNaNcial statemeNts
2. SHARE CAPITAL cont’d.
REDEEMABLE PARTICIPATING SHARES cont’d.
Fund Share Class Currency
Shares in issue
at beginning of financial period
Shares issued during
the financial period
Shares redeemed
during the financial period
Shares in issue
at end of financial period
BNY Mellon Efficient U.S. High Yield Beta Fund cont’d.class l (acc) usd 5,000 36,959,367 – 36,964,367
class l (acc) (hedged) euR 100,000 32,791,874 – 32,891,874sterling l (acc) (hedged) GBp 100,000 – – 100,000sterling l (inc) (hedged) GBp 38,762,752 2,843,532 (23,821,276) 17,785,008
class W (acc) usd 13,893,024 50,081,122 (16,765) 63,957,381sterling W (acc) (hedged) GBp 101,072 – – 101,072
class W (inc)^ usd – 5,000 – 5,000class W (inc) (hedged) euR 113,300 1,762,439 (3,806) 1,871,933
sterling W (inc) (hedged)^ GBp – 100,000 – 100,000class X (acc) usd 10,052,088 – (4,964,750) 5,087,338
sterling X (acc) (hedged)^ GBp – 29,047,121 – 29,047,121class X (inc)^ usd – 299,008,761 – 299,008,761
BNY Mellon Emerging Markets Corporate Debt Fundclass a usd 22,690 9,909 (8,947) 23,652class a euR 74,406 44,563 (33,510) 85,459
class a (inc)^ usd – 50 – 50class a (inc) (m)^ hKd – 50 – 50
class B usd 5,310 298 (2,901) 2,707class c usd 452,623 46,069 (233,271) 265,421class c euR 64,171 7,678 (64,338) 7,511
class G (inc) usd 17,748 1,772 (2,715) 16,805class h (hedged) euR 118,970 216,923 (201,637) 134,256
class i (hedged) euR 111,075 114,879 (113,322) 112,632class W usd 274,155 56,760 (140,088) 190,827class W euR 27,862 25,925 (26,436) 27,351
class W (acc) (hedged) chF 109,822 26,240 (10,716) 125,346class W (acc) (hedged) euR 35,047 195,338 (49,215) 181,170class W (inc) (hedged) chF 66,660 – (8,500) 58,160class W (inc) (hedged) euR 102,100 – – 102,100
sterling W (acc) (hedged) GBp 28,576 14,806 (16,593) 26,789sterling W (inc) (hedged)^ GBp 1,000 22 (1,022) –
class X usd 583,150 9,495 (53,609) 539,036sterling X (acc) (hedged) GBp 173,939 – – 173,939
BNY Mellon Emerging Markets Debt Fundclass a usd 1,077,184 71,933 (471,759) 677,358class a euR 5,067,485 1,004,797 (1,306,682) 4,765,600class c usd 7,249,256 140,823 (5,975,688) 1,414,391class c euR 3,514,568 31,343 (342,010) 3,203,901
class c (inc) usd 469,373 – – 469,373class h (acc) (hedged) euR 2,902,391 321,970 (761,103) 2,463,258
class W usd 5,000 – – 5,000class X (inc) usd 5,603,913 252,460 (3,279,791) 2,576,582
03613-1C.indd 328 19/08/2020 19:02

329
BNY MelloN GloBal FuNds, plc
Notes to the FiNaNcial statemeNts
2. SHARE CAPITAL cont’d.
REDEEMABLE PARTICIPATING SHARES cont’d.
Fund Share Class Currency
Shares in issue
at beginning of financial period
Shares issued during
the financial period
Shares redeemed
during the financial period
Shares in issue
at end of financial period
BNY Mellon Emerging Markets Debt Local Currency Fundclass a usd 11,802,086 639,659 (1,651,363) 10,790,382class a euR 24,984,973 1,551,344 (9,333,718) 17,202,599
class a (inc) usd 152,704 20 (10) 152,714class a (inc) euR 1,833,714 180,586 (110,992) 1,903,308
sterling a (acc) GBp 154,941 993 – 155,934sterling B (acc) GBp 2,045 – – 2,045
class c usd 17,422,386 2,222,969 (18,294,238) 1,351,117class c euR 963,211 1,333 (163,606) 800,938
class c (inc) usd 151,500 – – 151,500class c (inc) euR 53,809,499 – (38,326,838) 15,482,661
sterling c (acc) GBp 1,615 – – 1,615sterling c (inc) GBp 237,890 4 (80,327) 157,567
class h (hedged) euR 38,295,447 609,578 (8,709,471) 30,195,554class i (hedged) euR 2,061,752 7,778 (40,772) 2,028,758
sterling J (inc) (hedged) GBp 11,000 – – 11,000class W usd 94,092,016 30,139 (3,867,940) 90,254,215class W euR 12,896,313 405,320 (4,581,585) 8,720,048
class W (hedged) euR 43,764,703 4,089,921 (34,868,632) 12,985,992class W (inc) euR 767,287 – – 767,287
class W (inc) (hedged) euR 87,265,050 – (25,036) 87,240,014sterling W (inc) GBp 30,533,663 2,375,792 (24,943,644) 7,965,811
sterling W (inc) (hedged) GBp 58,536 429 (18,362) 40,603class X^ usd 24,543,479 – (24,543,479) –
BNY Mellon Emerging Markets Debt Opportunistic Fundclass a euR 423,504 – (400,000) 23,504class c usd 256,500 – – 256,500
class W (acc) usd 5,000 – – 5,000class X (inc) usd 27,764,843 5,392,325 (2,113,396) 31,043,772
BNY Mellon Emerging Markets Debt Total Return Fundclass a (acc) usd 5,000 – – 5,000
class e (inc)^ usd 5,438 179 (5,617) –sterling e (inc) (hedged) GBp 61,093,837 62,896,461 (16,362,445) 107,627,853
class h (acc) (hedged) euR 100,000 – – 100,000class W (acc) usd 64,610,852 – – 64,610,852
class W (acc) (hedged) euR 13,618 – (6,269) 7,349sterling W (acc) (hedged) GBp 304,625 65,567 (63,431) 306,761
class X (acc) usd 5,000 – – 5,000
BNY Mellon Euroland Bond Fundclass a euR 231,900,850 23,512,337 (145,458,507) 109,954,680
class a (inc) euR 8,863,753 195,255 (775,433) 8,283,575class B euR 47,258 – (744) 46,514
class B (inc) euR 51,547 – (34,907) 16,640class c euR 55,328,003 2,386,695 (13,990,405) 43,724,293
03613-1C.indd 329 19/08/2020 19:02

330
BNY MelloN GloBal FuNds, plc
Notes to the FiNaNcial statemeNts
2. SHARE CAPITAL cont’d.
REDEEMABLE PARTICIPATING SHARES cont’d.
Fund Share Class Currency
Shares in issue
at beginning of financial period
Shares issued during
the financial period
Shares redeemed
during the financial period
Shares in issue
at end of financial period
BNY Mellon Euroland Bond Fund cont’d.class c (inc) euR 92,244,036 121,409 (19,817,605) 72,547,840
class G (acc) euR 512,630 1,144,479 (3,815) 1,653,294class h (hedged) chF 5,091,303 10,000 (1,229,054) 3,872,249
class i (hedged) chF 1,317,815 – (48,170) 1,269,645class s euR 32,892,612 1,671,728 (17,502,474) 17,061,866
class W (acc) euR 123,506,634 12,288,489 (47,277,469) 88,517,654
BNY Mellon European Credit Fundclass a euR 12,672 839 (1,369) 12,142class c euR 49,536 7,669 (13,753) 43,452
class W (acc) euR 8,347 – (7,500) 847class X euR 553,309 – (49,438) 503,871
BNY Mellon Global Bond Fundclass a usd 28,076,999 5,618,886 (2,353,233) 31,342,652class a euR 19,557,312 5,332,045 (2,725,752) 22,163,605class B usd 809,520 18,540 – 828,060class c usd 101,399,907 4,186,689 (18,017,661) 87,568,935class c euR 69,614,867 24,763,401 (20,014,957) 74,363,311
class c (inc) usd 717,856 25,250 (197,373) 545,733sterling c (inc) GBp 3,115,325 388,117 (435,677) 3,067,765
class h (hedged) euR 1,606,915 769,714 (578,567) 1,798,062class i (hedged) euR 569,671 5,520,621 (723,872) 5,366,420
class W (acc) usd 25,980,034 888,265 (3,921,171) 22,947,128class W (acc) euR 4,546 – – 4,546
class W (acc) (hedged)^ euR 99,147 – (99,147) –sterling W (acc) (hedged)^ GBp – 100,000 (100,000) –sterling W (inc) (hedged)^ GBp – 100,000 (100,000) –
class X usd 9,562,811 – – 9,562,811sterling Z (acc) (hedged)^ GBp – 100,000 – 100,000sterling Z (inc) (hedged)^ GBp – 100,000 – 100,000
BNY Mellon Global Credit Fundclass a (acc)^ usd – 5,000 – 5,000
class h (acc) (hedged) euR 7,905,494 2,052,471 (861,532) 9,096,433class W (acc) usd 526,950 1,436,044 (94,500) 1,868,494
sterling W (acc) (hedged) GBp 100,933 289,560 – 390,493class X (acc) usd 5,000 114,580,279 – 114,585,279
class X (acc) (hedged) cad 479,804,141 – (16,331,863) 463,472,278
BNY Mellon Global Dynamic Bond Fundclass a usd 4,574,656 481,288 (1,028,027) 4,027,917class a euR 1,847,701 618,717 (369,366) 2,097,052
class a (inc) usd 184,772 344 – 185,116class c usd 100,134,674 2,203,830 (33,173,738) 69,164,766
class G (acc) euR 71,517 – (4,397) 67,120
03613-1C.indd 330 19/08/2020 19:02
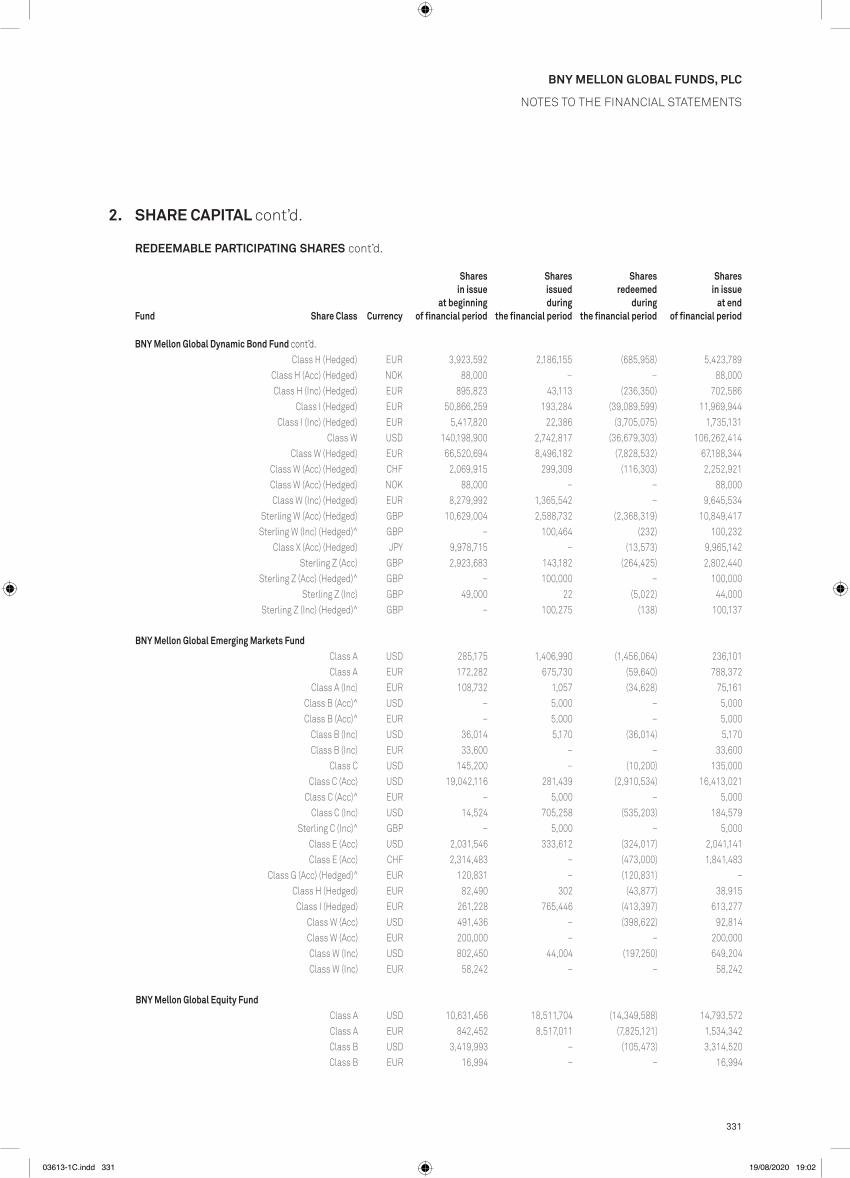
331
BNY MelloN GloBal FuNds, plc
Notes to the FiNaNcial statemeNts
2. SHARE CAPITAL cont’d.
REDEEMABLE PARTICIPATING SHARES cont’d.
Fund Share Class Currency
Shares in issue
at beginning of financial period
Shares issued during
the financial period
Shares redeemed
during the financial period
Shares in issue
at end of financial period
BNY Mellon Global Dynamic Bond Fund cont’d.class h (hedged) euR 3,923,592 2,186,155 (685,958) 5,423,789
class h (acc) (hedged) NoK 88,000 – – 88,000class h (inc) (hedged) euR 895,823 43,113 (236,350) 702,586
class i (hedged) euR 50,866,259 193,284 (39,089,599) 11,969,944class i (inc) (hedged) euR 5,417,820 22,386 (3,705,075) 1,735,131
class W usd 140,198,900 2,742,817 (36,679,303) 106,262,414class W (hedged) euR 66,520,694 8,496,182 (7,828,532) 67,188,344
class W (acc) (hedged) chF 2,069,915 299,309 (116,303) 2,252,921class W (acc) (hedged) NoK 88,000 – – 88,000class W (inc) (hedged) euR 8,279,992 1,365,542 – 9,645,534
sterling W (acc) (hedged) GBp 10,629,004 2,588,732 (2,368,319) 10,849,417sterling W (inc) (hedged)^ GBp – 100,464 (232) 100,232
class X (acc) (hedged) JpY 9,978,715 – (13,573) 9,965,142sterling Z (acc) GBp 2,923,683 143,182 (264,425) 2,802,440
sterling Z (acc) (hedged)^ GBp – 100,000 – 100,000sterling Z (inc) GBp 49,000 22 (5,022) 44,000
sterling Z (inc) (hedged)^ GBp – 100,275 (138) 100,137
BNY Mellon Global Emerging Markets Fundclass a usd 285,175 1,406,990 (1,456,064) 236,101class a euR 172,282 675,730 (59,640) 788,372
class a (inc) euR 108,732 1,057 (34,628) 75,161class B (acc)^ usd – 5,000 – 5,000class B (acc)^ euR – 5,000 – 5,000
class B (inc) usd 36,014 5,170 (36,014) 5,170class B (inc) euR 33,600 – – 33,600
class c usd 145,200 – (10,200) 135,000class c (acc) usd 19,042,116 281,439 (2,910,534) 16,413,021
class c (acc)^ euR – 5,000 – 5,000class c (inc) usd 14,524 705,258 (535,203) 184,579
sterling c (inc)^ GBp – 5,000 – 5,000class e (acc) usd 2,031,546 333,612 (324,017) 2,041,141class e (acc) chF 2,314,483 – (473,000) 1,841,483
class G (acc) (hedged)^ euR 120,831 – (120,831) –class h (hedged) euR 82,490 302 (43,877) 38,915
class i (hedged) euR 261,228 765,446 (413,397) 613,277class W (acc) usd 491,436 – (398,622) 92,814class W (acc) euR 200,000 – – 200,000class W (inc) usd 802,450 44,004 (197,250) 649,204class W (inc) euR 58,242 – – 58,242
BNY Mellon Global Equity Fundclass a usd 10,631,456 18,511,704 (14,349,588) 14,793,572class a euR 842,452 8,517,011 (7,825,121) 1,534,342class B usd 3,419,993 – (105,473) 3,314,520class B euR 16,994 – – 16,994
03613-1C.indd 331 19/08/2020 19:02

332
BNY MelloN GloBal FuNds, plc
Notes to the FiNaNcial statemeNts
2. SHARE CAPITAL cont’d.
REDEEMABLE PARTICIPATING SHARES cont’d.
Fund Share Class Currency
Shares in issue
at beginning of financial period
Shares issued during
the financial period
Shares redeemed
during the financial period
Shares in issue
at end of financial period
BNY Mellon Global Equity Fund cont’d.class c usd 11,002,868 2,093,294 (3,920,882) 9,175,280
class c^ euR 2,456 – (2,456) –class i (hedged) euR 1,617,511 – (1,373,906) 243,605
class W (acc) usd 17,769,421 5,948,349 (3,561,646) 20,156,124class W (acc) euR 174,639,288 19,184,830 (20,308,258) 173,515,860
BNY Mellon Global Equity Income Fundclass a usd 11,331,359 17,333,136 (17,209,461) 11,455,034class a euR 32,322,901 16,434,724 (18,407,567) 30,350,058
class a (inc) usd 4,263,198 1,273,617 (720,215) 4,816,600class a (inc) euR 6,431,195 1,401,832 (1,010,951) 6,822,076
sterling a (acc) GBp 215,865 – (45,465) 170,400class B usd 10,852,644 1,934,655 (5,642,034) 7,145,265class B euR 2,148,358 511,933 (1,031,527) 1,628,764
class B (inc) usd 4,887,512 2,087,959 (784,430) 6,191,041class B (inc) euR 607,167 1,064,771 (68,037) 1,603,901
sterling B (inc) GBp 2,209,438 276,523 (1,287,420) 1,198,541class c usd 44,369,694 13,981,155 (8,852,622) 49,498,227class c euR 7,219,977 1,472,033 (1,261,892) 7,430,118
class c (inc) usd 5,156,783 6,023,895 (2,547,472) 8,633,206class c (inc) euR 25,442,311 10,578,087 (16,996,046) 19,024,352
sterling c (inc) GBp 1,702,260 35,824 (675,360) 1,062,724class G (acc) euR 5,923,161 835,824 (1,356,459) 5,402,526
class h (hedged) euR 12,848,456 3,172,224 (8,120,314) 7,900,366class h (inc) (hedged) euR 8,403,991 361,858 (1,387,809) 7,378,040
class i (hedged) euR 11,958,462 455,964 (1,791,405) 10,623,021class i (inc) (hedged) euR 1,726,498 1,248,553 (495,873) 2,479,178
class W usd 63,581,327 16,481,778 (42,894,013) 37,169,092class W euR 75,985,225 14,760,165 (52,528,236) 38,217,154
class W (acc)^ chF 5,000 – (5,000) –class W (acc) (hedged) euR 1,404,490 1,135,421 (1,513,859) 1,026,052
class W (inc) usd 23,459,085 2,631,506 (11,497,718) 14,592,873class W (inc) euR 492,560,083 48,233,885 (172,142,502) 368,651,466
sterling W (acc) GBp 4,143,453 1,317,706 (2,295,775) 3,165,384sterling W (inc) GBp 28,164,167 4,054,727 (5,569,701) 26,649,193
class Z (acc) usd 14,720,039 2,552,080 (14,807,948) 2,464,171class Z (acc) euR 4,104,633 571,328 (2,414,932) 2,261,029class Z (inc) usd 4,352,535 1,437,210 (3,709,604) 2,080,141class Z (inc) euR 1,712,067 123,482 (1,347,899) 487,650
sterling Z (acc) GBp 5,000 – – 5,000sterling Z (inc) GBp 4,253,594 501,890 (1,293,032) 3,462,452
BNY Mellon Global High Yield Bond Fundclass a euR 6,450,814 1,076,984 (1,711,786) 5,816,012class c usd 26,990,244 14,322,199 (13,761,249) 27,551,194class c euR 735,094 15,552 (733,732) 16,914
class c (inc) usd 398,288 – – 398,288
03613-1C.indd 332 19/08/2020 19:02

333
BNY MelloN GloBal FuNds, plc
Notes to the FiNaNcial statemeNts
2. SHARE CAPITAL cont’d.
REDEEMABLE PARTICIPATING SHARES cont’d.
Fund Share Class Currency
Shares in issue
at beginning of financial period
Shares issued during
the financial period
Shares redeemed
during the financial period
Shares in issue
at end of financial period
BNY Mellon Global High Yield Bond Fund cont’d.class h (hedged) euR 802,962 453,725 (240,313) 1,016,374
class i (hedged) euR 7,396,352 680,582 (426,641) 7,650,293class W (acc) usd 403,386 6,626,353 (8,600) 7,021,139
class W (acc) (hedged)^ euR 100,000 – (100,000) –sterling W (acc) (hedged) GBp 980,220 206,660 (57,000) 1,129,880
class X (inc) usd 26,105,970 138,962 (5,911,243) 20,333,689class X (inc) (hedged) euR 20,735,587 – (891,036) 19,844,551
BNY Mellon Global Infrastructure Income Fundclass a (acc) usd 195,925 – – 195,925class a (inc) usd 1,327,381 1,500 (1,500) 1,327,381class a (inc) euR 5,381 236 (231) 5,386
class B (acc) usd 5,000 83,117 – 88,117class B (acc)^ sGd – 103,469 – 103,469
class B (inc) usd 5,239 1,155,570 (1,399) 1,159,410class B (inc)^ sGd – 1,120,680 – 1,120,680class e (acc) usd 3,334,753 – (53,906) 3,280,847class e (inc) usd 24,894,194 865,252 (24,882,995) 876,451class e (inc) euR 1,645,390 1,841,157 (450,942) 3,035,605
sterling e (inc) (hedged) GBp 37,440,985 92,538,265 (9,476,618) 120,502,632class h (acc) (hedged) euR 134,591 184,175 (9,845) 308,921class h (inc) (hedged) euR 330,792 739,812 – 1,070,604
class J (acc) (hedged)^ sGd – 170,262 – 170,262class J (inc) (hedged)^ sGd – 650,547 (2,738) 647,809
class W (acc) usd 4,361,369 3,369,382 (4,409,378) 3,321,373class W (acc) (hedged) euR 158,000 22,000 – 180,000
class W (inc) usd 5,238 1,286,505 (98) 1,291,645class W (inc) (hedged) euR 104,822 17,903,988 (108,810) 17,900,000
BNY Mellon Global Leaders Fundclass a (acc) usd 1,302,287 8,347 (288,267) 1,022,367class a (acc) euR 5,000 – – 5,000class a (inc) euR 5,000 – – 5,000
class B (acc) usd 5,000 – – 5,000class c (acc) usd 27,617,195 520,725 (336,561) 27,801,359class e (acc) usd 359,181 600,000 – 959,181
sterling e (acc) GBp 14,933,384 1,567,167 (13,172,036) 3,328,515class h (acc) (hedged) dKK 67,000 – – 67,000class h (acc) (hedged) euR 88,020 3,284 (11,584) 79,720class h (acc) (hedged) NoK 88,000 – – 88,000class h (acc) (hedged) seK 97,000 – – 97,000
class W (acc) usd 630,731 498,591 (380,000) 749,322class W (acc) (hedged) dKK 67,000 – – 67,000class W (acc) (hedged) NoK 88,000 – – 88,000class W (acc) (hedged) seK 97,000 – – 97,000
sterling W (acc) GBp 5,264,676 493,193 (571,553) 5,186,316
03613-1C.indd 333 19/08/2020 19:02

334
BNY MelloN GloBal FuNds, plc
Notes to the FiNaNcial statemeNts
2. SHARE CAPITAL cont’d.
REDEEMABLE PARTICIPATING SHARES cont’d.
Fund Share Class Currency
Shares in issue
at beginning of financial period
Shares issued during
the financial period
Shares redeemed
during the financial period
Shares in issue
at end of financial period
BNY Mellon Global Multi-Asset Income Fundclass a (acc) euR 5,000 – – 5,000
class a (inc)^ usd – 5,000 – 5,000class a (inc) euR 1,931,237 735,495 (7,655) 2,659,077
class c (acc) euR 297,855 5,930 (297,855) 5,930class e (inc) euR 9,118,379 1,108,161 (1,820,351) 8,406,189
class W (acc) euR 10,635,492 – – 10,635,492class W (inc)^ euR 5,257 215 (5,472) –
BNY Mellon Global Opportunities Fundclass a usd 3,194,801 2,183,425 (3,222,965) 2,155,261class a euR 9,461,771 1,778,612 (2,771,699) 8,468,684class B usd 788,184 – (590) 787,594class c usd 318,452 2,564 (71,285) 249,731class c euR 1,716,199 43,267 (1,707,050) 52,416
class h (hedged) euR 305,681 36,799 (59,360) 283,120class i (hedged) euR 14,931 – – 14,931
class W (acc) usd 693,988 216,810 (170,000) 740,798class W (acc)^ euR 4,816 – (4,816) –
BNY Mellon Global Real Return Fund (EUR)class a euR 610,174,469 135,670,007 (203,997,013) 541,847,463
class a (inc) euR 16,066,802 2,749,098 (1,803,789) 17,012,111class c euR 173,479,728 47,893,750 (86,409,453) 134,964,025
class c (inc) euR 9,822,944 2,139,330 (7,282,433) 4,679,841class G (acc) euR 6,956,341 3,156,726 (1,223,240) 8,889,827class G (inc) euR 3,882,942 874,192 (279,453) 4,477,681
class h (acc) (hedged) sGd 4,047,620 861,543 (260,334) 4,648,829class h (acc) (hedged) usd 1,807,533 1,271,311 (712,446) 2,366,398
sterling h (acc) (hedged) GBp 911,717 240,936 (27,468) 1,125,185class W euR 830,859,336 156,861,853 (352,914,875) 634,806,314
class W (acc) (hedged) chF 2,808,037 366,736 (1,844,332) 1,330,441class W (acc) (hedged) usd 100,000 2,273,147 (2,202,472) 170,675
class W (inc) euR 996,936 47,833 (5,052) 1,039,717class X euR 773,846,007 27,036,029 (143,668,966) 657,213,070
class Z (acc) euR 68,493,755 278,370 – 68,772,125
BNY Mellon Global Real Return Fund (GBP)sterling B (acc) GBp 1,074,324 85,337 (306,110) 853,551sterling B (inc) GBp 402,024 – – 402,024sterling c (inc) GBp 524,357 193 (252,184) 272,366
sterling W (acc) GBp 13,210,743 7,309,988 (5,849,351) 14,671,380sterling W (inc) GBp 17,900,675 1,109,141 (10,063,644) 8,946,172sterling X (acc) GBp 23,697,167 4,009,337 (2,304,387) 25,402,117
03613-1C.indd 334 19/08/2020 19:02

335
BNY MelloN GloBal FuNds, plc
Notes to the FiNaNcial statemeNts
2. SHARE CAPITAL cont’d.
REDEEMABLE PARTICIPATING SHARES cont’d.
Fund Share Class Currency
Shares in issue
at beginning of financial period
Shares issued during
the financial period
Shares redeemed
during the financial period
Shares in issue
at end of financial period
BNY Mellon Global Real Return Fund (USD)class a usd 63,818,868 6,429,045 (7,839,815) 62,408,098class c usd 28,480,624 2,845,039 (5,341,995) 25,983,668
class c (inc) usd 679,894 – (618,417) 61,477class G (acc) usd 8,500 – (4,250) 4,250class W (acc) usd 16,138,800 2,640,030 (2,104,807) 16,674,023class W (inc) usd 19,660,559 2,960,541 (10,563,454) 12,057,646
class X usd 74,532,954 2,208,168 (7,773,579) 68,967,543
BNY Mellon Global Short-Dated High Yield Bond Fundclass a (acc) usd 8,360,338 1,415,744 (4,513,440) 5,262,642class a (inc) usd 788,187 52,954 (743,666) 97,475
class c (acc) usd 17,364,400 6,331,262 (12,589,032) 11,106,630class G (acc) usd 40,858 193,143 (56,984) 177,017
class h (acc) (hedged) euR 95,677,185 13,855,218 (33,046,212) 76,486,191class h (inc) (hedged) euR 2,547,350 184,122 (601,896) 2,129,576class i (acc) (hedged) euR 15,645,968 3,869,412 (5,593,124) 13,922,256class i (inc) (hedged) euR 2,110,936 600,000 (2,000,000) 710,936
class W (acc) usd 53,095,238 15,689,431 (16,494,008) 52,290,661class W (acc) (hedged) chF 21,474,800 4,280,000 (2,015,050) 23,739,750class W (acc) (hedged) euR 78,653,487 25,736,730 (46,530,905) 57,859,312
class W (inc) usd 30,450,000 – (450,000) 30,000,000class W (inc) (hedged) euR 3,158,511 108,444 (2,003,955) 1,263,000
sterling W (acc) (hedged) GBp 6,643,996 33,863,019 (5,936,609) 34,570,406sterling W (inc) (hedged) GBp 2,898,078 288,261 (584,074) 2,602,265
class X (acc) usd 10,749,954 4,363 (10,749,954) 4,363sterling X (acc) (hedged) GBp 12,447,669 47,357,300 – 59,804,969
class Y (acc) usd 169,466,042 – (899,134) 168,566,908sterling Y (acc) (hedged) GBp 21,084,481 700,525 (14,396,420) 7,388,586sterling Z (acc) (hedged) GBp 1,168,654 1,515,883 (241,468) 2,443,069sterling Z (inc) (hedged) GBp 49,447,095 34,073,865 (6,371,935) 77,149,025
BNY Mellon Global Unconstrained Fundclass W (acc) usd 5,000 – – 5,000
class X (acc) (hedged) cad 28,492,519 – – 28,492,519
BNY Mellon Japan Small Cap Equity Focus Fundclass a (acc) euR 25,001 27,037 (27,037) 25,001
class c JpY 1,202,391 755,598 (723,741) 1,234,248class e (acc)^ euR 27,386 – (27,386) –
class e (acc) (hedged) chF 3,943,013 697,036 (490,170) 4,149,879class e (acc) (hedged) usd 25,597,224 – – 25,597,224
class G (acc)^ euR – 5,000 – 5,000class G (acc) (hedged) euR 998,978 81,937 (63,141) 1,017,774class h (acc) (hedged) sGd 1,111,376 238,187 (734,175) 615,388class h (acc) (hedged) NoK 88,000 – – 88,000
03613-1C.indd 335 19/08/2020 19:02

336
BNY MelloN GloBal FuNds, plc
Notes to the FiNaNcial statemeNts
2. SHARE CAPITAL cont’d.
REDEEMABLE PARTICIPATING SHARES cont’d.
Fund Share Class Currency
Shares in issue
at beginning of financial period
Shares issued during
the financial period
Shares redeemed
during the financial period
Shares in issue
at end of financial period
BNY Mellon Japan Small Cap Equity Focus Fund cont’d.class h (acc) (hedged) seK 97,000 – – 97,000
class h (hedged) euR 2,358,545 230,799 (1,083,378) 1,505,966class h (hedged) usd 260,357 47,762 (55,197) 252,922
class i (hedged) euR 7,918,537 5,460,674 (11,344,879) 2,034,332class i (hedged) usd 525,729 – – 525,729
class W JpY 18,583,198 349,651 (416,676) 18,516,173class W (acc) euR 25,473,131 – (290,421) 25,182,710
class W (acc) (hedged) euR 697,680 – (8,221) 689,459class W (acc) (hedged) NoK 88,000 – – 88,000class W (acc) (hedged) seK 97,000 – – 97,000
sterling W (acc) GBp 3,726,016 609,673 (2,400,651) 1,935,038sterling W (inc) GBp 1,489,425 1,776,523 (315,410) 2,950,538
BNY Mellon Long-Term Global Equity Fundclass a euR 82,971,610 27,568,817 (21,419,541) 89,120,886class a usd 29,632,521 9,489,592 (7,769,909) 31,352,204
class a (inc) euR 2,773,686 1,056,991 (933,341) 2,897,336sterling a (acc) GBp 1,177,509 81,544 (452,529) 806,524
class B euR 1,454,363 681,383 (727,476) 1,408,270class B usd 7,197,878 8,014,323 (5,311,536) 9,900,665
class B (acc) sGd 11,640,390 9,085,172 (8,516,181) 12,209,381class B (inc)^ sGd 5,000 – (5,000) –
sterling B (inc) GBp 337,375 104,094 (157,232) 284,237class c euR 70,722,755 21,995,592 (43,230,507) 49,487,840class c usd 132,499,568 17,337,479 (33,150,993) 116,686,054
class G (acc) euR 2,396,806 2,668,334 (2,946,770) 2,118,370class h (acc) (hedged) usd 100,000 – – 100,000class i (acc) (hedged)^ usd – 100,000 – 100,000class J (acc) (hedged) sGd 350,806 376,225 (82,955) 644,076
class s euR 60,385,404 2,578,978 (11,599,805) 51,364,577class s (acc) 1 usd 31,667,725 – – 31,667,725
class W euR 78,408,878 23,877,767 (17,906,732) 84,379,913class W usd 31,583,576 5,053,003 (1,836,301) 34,800,278
class W (hedged) usd 1,672,704 3,313,991 (3,208,208) 1,778,487class W (acc) (hedged) sGd 100,000 – – 100,000
class W (inc) usd 16,570,366 2,325,538 – 18,895,904class W (inc)^ euR – 66,451,215 – 66,451,215
sterling W (acc) GBp 9,213,718 1,891,194 (551,393) 10,553,519sterling W (inc) GBp 1,930,348 1,182,550 (413,753) 2,699,145
class X (acc) usd 96,371,579 – – 96,371,579sterling X GBp 7,181,908 – (21,298) 7,160,610
BNY Mellon Mobility Innovation Fundclass a (acc) usd 5,978,528 8,739,836 (4,366,783) 10,351,581class a (acc) euR 2,842,218 3,173,571 (893,803) 5,121,986class a (inc) usd 218,952 183,551 (128,724) 273,779
03613-1C.indd 336 19/08/2020 19:02

337
BNY MelloN GloBal FuNds, plc
Notes to the FiNaNcial statemeNts
2. SHARE CAPITAL cont’d.
REDEEMABLE PARTICIPATING SHARES cont’d.
Fund Share Class Currency
Shares in issue
at beginning of financial period
Shares issued during
the financial period
Shares redeemed
during the financial period
Shares in issue
at end of financial period
BNY Mellon Mobility Innovation Fund cont’d.class a (inc) euR 1,591,852 848,398 (574,760) 1,865,490
class B (acc) usd 14,122,797 613,818 (2,591,318) 12,145,297class c (acc) usd 5,000 – – 5,000class c (acc) euR 5,000 2,199,886 (5,000) 2,199,886class c (inc) euR 1,510,100 405,000 (26,100) 1,889,000
class e (acc) usd 26,175,805 8,819,223 (3,796,726) 31,198,302class e (acc) chF 8,209,932 2,271,091 (640,448) 9,840,575class e (acc) euR 5,055,509 935,888 (1,343,520) 4,647,877
class e (acc) (hedged) chF 12,055,197 2,174,349 (1,552,656) 12,676,890class e (acc) (hedged) euR 11,092,883 2,520,338 (3,061,877) 10,551,344
class e (acc) (hedged)^ sGd 199,706 30,000 (229,706) –sterling e (acc) (hedged) GBp 1,736,535 733,593 (609,094) 1,861,034
class G (acc)^ euR – 5,000 – 5,000class h (acc) (hedged) euR 2,876,157 2,481,493 (614,158) 4,743,492class h (inc) (hedged) euR 116,167 41,416 (16,076) 141,507class J (acc) (hedged) euR 615,969 – – 615,969
class K (acc) usd 5,281,336 3,203,733 (868,455) 7,616,614class K (acc) (hedged) chF 1,851,419 586,460 (111,908) 2,325,971class K (acc) (hedged) euR 3,777,563 971,578 (414,554) 4,334,587
class K (inc) usd 363,156 33,233 – 396,389class K (inc) (hedged) chF 156,161 18,000 (23,567) 150,594class K (inc) (hedged) euR 139,571 93,000 (10,000) 222,571class K (inc) (hedged) sGd 127,171 – – 127,171
sterling K (acc) (hedged) GBp 197,511 33,354 (34,453) 196,412class W (acc) usd 21,314,192 17,987,494 (13,167,238) 26,134,448
class W (acc) (hedged) euR 10,663,383 4,241,968 (3,505,750) 11,399,601sterling W (acc)^ GBp 5,000 – (5,000) –
class W (inc) usd 5,004 30 (15) 5,019class W (inc) (hedged) euR 100,080 142,302 (102,975) 139,407
BNY Mellon S&P 500® Index Trackerclass a usd 6,553,151 514,239 (1,655,590) 5,411,800class a euR 1,615,040 587,052 (558,309) 1,643,783class c usd 6,291,236 341 (2,734,863) 3,556,714class c euR 1,829,874 7,532 (1,336,488) 500,918
class G (acc)^ euR 5,000 – (5,000) –
BNY Mellon Small Cap Euroland Fundclass a euR 3,896,276 234,863 (938,709) 3,192,430class a usd 119,230 5,939 (5,939) 119,230class B euR 53,912 – – 53,912class c euR 7,068,545 254,953 (2,546,390) 4,777,108class c usd 19,787 – – 19,787
class W (acc) euR 6,040,065 – – 6,040,065sterling W (acc) GBp 17,713 – (6,449) 11,264
03613-1C.indd 337 19/08/2020 19:02

338
BNY MelloN GloBal FuNds, plc
Notes to the FiNaNcial statemeNts
2. SHARE CAPITAL cont’d.
REDEEMABLE PARTICIPATING SHARES cont’d.
Fund Share Class Currency
Shares in issue
at beginning of financial period
Shares issued during
the financial period
Shares redeemed
during the financial period
Shares in issue
at end of financial period
BNY Mellon Sustainable Global Dynamic Bond Fundclass a (acc) euR 5,000 – – 5,000
class a (acc)^ usd – 25,949 – 25,949class a (inc) euR 5,029 26 (13) 5,042
class c (acc) euR 5,000 – – 5,000class e (acc) euR 47,562,993 37,671,598 – 85,234,591
class e (acc) (hedged) chF 11,504,332 889,371 (629,142) 11,764,561class G (acc) euR 191,825 – – 191,825
class h (acc) (hedged)^ chF – 374,279 (119,279) 255,000class h (acc) (hedged) NoK 88,000 – – 88,000
class W (acc) euR 1,794,555 7,200,774 (108,016) 8,887,313class W (acc) (hedged)^ chF – 23,650,313 (281,109) 23,369,204
class W (acc) (hedged) NoK 88,000 – – 88,000class W (acc) (hedged)^ usd – 746,142 (100,000) 646,142
sterling W (acc) (hedged)^ GBp – 117,500 – 117,500sterling W (inc) (hedged) GBp 100,090 466,981 (127,755) 439,316
class X (acc) euR 113,498,518 582,000 (28,560,000) 85,520,518
BNY Mellon Sustainable Global Real Return Fund (EUR)*class a (acc)^ euR – 5,000 – 5,000class a (inc)^ euR – 5,000 – 5,000
class e (acc)^ euR – 13,697,364 (4,145,465) 9,551,899class e (acc) (hedged)^ usd – 1,311,519 (100,000) 1,211,519
class e (inc)^ euR – 5,000 – 5,000class G (acc)^ euR – 5,000 – 5,000class W (acc)^ euR – 14,884,560 – 14,884,560class W (inc)^ euR – 5,000 – 5,000
sterling W (acc) (hedged)^ GBp – 100,000 – 100,000sterling W (inc) (hedged)^ GBp – 100,000 – 100,000
BNY Mellon Targeted Return Bond Fundclass a (acc) usd 5,000 – – 5,000
sterling W (acc) (hedged) GBp 65,852,584 132,381 – 65,984,965
BNY Mellon U.S. Dynamic Value Fundclass a usd 706,599 3,133 (104,165) 605,567class a euR 492,090 54,207 (85,964) 460,333class B usd 94,858 – – 94,858class c usd 6,608,970 2,631,957 (650,427) 8,590,500class c euR 583 – – 583
class W (acc)^ usd 5,000 – (5,000) –
BNY Mellon U.S. Equity Income Fundclass a (acc) euR 4,677 – – 4,677class B (inc) usd 5,030 130 (65) 5,095class c (inc) usd 908,914 – – 908,914
class e (acc) euR 479,295 111,660 (363,090) 227,865
03613-1C.indd 338 19/08/2020 19:02

339
BNY MelloN GloBal FuNds, plc
Notes to the FiNaNcial statemeNts
2. SHARE CAPITAL cont’d.
REDEEMABLE PARTICIPATING SHARES cont’d.
Fund Share Class Currency
Shares in issue
at beginning of financial period
Shares issued during
the financial period
Shares redeemed
during the financial period
Shares in issue
at end of financial period
BNY Mellon U.S. Equity Income Fund cont’d.class e (inc) usd 5,069,996 – (839,459) 4,230,537class e (inc) euR 337,310 – (107,170) 230,140
sterling e (acc) GBp 62,820,458 3,234,529 (30,741,384) 35,313,603sterling e (inc) GBp 138,802,914 10,444,387 (25,801,356) 123,445,945
sterling e (inc) (hedged) GBp 2,437,935 389,360 (1,142,495) 1,684,800class W (acc) usd 19,594,548 85,051 (433,137) 19,246,462class W (acc) euR 9,444,727 12,744,543 (5,137,281) 17,051,989class W (inc) usd 6,319,049 – (744,049) 5,575,000
sterling W (inc) GBp 31,207,152 231,076 (5,021,789) 26,416,439
BNY Mellon U.S. Municipal Infrastructure Debt Fundclass a (acc)^ usd – 5,000 – 5,000
class c (acc) usd 117,766,628 41,042,327 (22,845,021) 135,963,934class e (acc) usd 27,716,258 720,000 (6,959,000) 21,477,258
class e (acc) (hedged) chF 3,400,000 – (50,000) 3,350,000class e (acc) (hedged) euR 2,244,788 6,435,212 (800,000) 7,880,000class e (inc) (hedged) euR 5,170,252 3,039,302 (94,651) 8,114,903
class h (acc) (hedged) euR 538,026 9,619,873 (9,990,128) 167,771class h (inc) (hedged) euR 133,496 4,859 (2,093) 136,262
class W (acc) usd 16,903,757 7,776,040 (962,370) 23,717,427class W (acc) euR 30,005,000 – (5,000) 30,000,000
class W (acc) (hedged) chF 18,916,551 1,090,000 (1,735,000) 18,271,551class W (acc) (hedged) euR 9,019,000 1,203,628 (230,000) 9,992,628
class W (inc) usd 640,000 16,392,900 (712,300) 16,320,600class W (inc) (hedged) chF 6,574,781 – – 6,574,781class W (inc) (hedged) euR 130,370,454 7,075,563 – 137,446,017
class X (acc) usd 15,000,000 – (7,023,088) 7,976,912
* please refer to Note 18 of the financial statements.^ this share class was launched or closed during the financial period.
The activity on redeemable participating shares for the financial period ended 30 June 2019 was as follows:
Fund Share Class Currency
Shares in issue
at beginning of financial period
Shares issues during
the financial period
Shares redeemed
during the financial period
Shares in issue
at end of financial period
BNY Mellon Absolute Return Bond Fundclass c euR 4,567 122 (676) 4,013
class c (inc) euR 2,085 – – 2,085class R euR 193,971 11,136 (103,372) 101,735
class R (hedged) usd 113,771 154 (53,048) 60,877class R (inc) euR 18,786 4,973 (2,639) 21,120
class s euR 4,414,452 430,392 (3,767,814) 1,077,030class s (inc) euR 17,078 – – 17,078
class t (hedged) chF 23,656 50 (23,065) 641class t (hedged) usd 367,097 14,144 (274,414) 106,827
03613-1C.indd 339 19/08/2020 19:02

340
BNY MelloN GloBal FuNds, plc
Notes to the FiNaNcial statemeNts
2. SHARE CAPITAL cont’d.
REDEEMABLE PARTICIPATING SHARES cont’d.
Fund Share Class Currency
Shares in issue
at beginning of financial period
Shares issues during
the financial period
Shares redeemed
during the financial period
Shares in issue
at end of financial period
BNY Mellon Absolute Return Bond Fund cont’d.sterling t (acc) (hedged) GBp 100,308 711 (24,837) 76,182
class W (acc) euR 2,527 – – 2,527class W (acc) (hedged) usd 8,750 43,238 (6,945) 45,043class W (inc) (hedged) usd 973 1,029 (973) 1,029
sterling W (acc) (hedged) GBp 788,280 143,739 (57,911) 874,108sterling W (inc) (hedged) GBp 5,061 10,268 – 15,329
class X euR 3,266,897 – (297,568) 2,969,329class X (acc) (hedged)^ usd – 1,000 – 1,000
sterling X (acc) (hedged) GBp 91,677 – (5,000) 86,677class Z (acc) euR 519 89 (554) 54
BNY Mellon Absolute Return Equity Fund
class d (acc) (hedged) euR 885,661 234,073 (679,250) 440,484class R (hedged) chF 196,726 – (75,921) 120,805class R (hedged) euR 401,737,652 23,990,352 (225,737,562) 199,990,442class R (hedged) usd 31,082,112 104,395 (22,289,670) 8,896,837
class R (inc) (hedged) euR 8,707,844 304,555 (2,649,465) 6,362,934sterling R (acc) GBp 982,381 6,899 (108,137) 881,143sterling s (acc) GBp 30,830,424 30,674 (13,913,004) 16,948,094
class t (hedged) euR 288,427,387 18,471,319 (195,848,365) 111,050,341class t (hedged) usd 14,160,958 123,629 (2,971,293) 11,313,294class u (hedged) euR 544,084,848 65,223,730 (330,822,877) 278,485,701class u (hedged) usd 28,728,474 4,120,502 (26,719,885) 6,129,091
class u (inc) (hedged) euR 2,987,417 3,103,534 (5,586,446) 504,505sterling u (acc) GBp 167,186,120 4,741,814 (122,909,265) 49,018,669sterling X (acc) GBp 120,416,686 341,401 (7,891,450) 112,866,637
BNY Mellon Absolute Return Global Convertible Bond Fund*
class u (acc)^ euR – 19,881,737 – 19,881,737sterling u (acc) (hedged)^ GBp – 100,000 – 100,000
class X (acc)^ euR – 5,000 – 5,000
BNY Mellon Asia Rising Stars Fundclass a (acc) usd 30,013 736 – 30,749
class h (acc) (hedged) sGd 1,603,195 35,841 (9,008) 1,630,028class W (acc) usd 9,853,400 – (4,853,400) 5,000,000
class W (acc) (hedged)^ sGd 101,100 – (101,100) –class X (acc) usd 6,092 285,273 (19,970) 271,395
BNY Mellon Asian Equity Fund
class a usd 6,180,994 1,214,410 (2,033,521) 5,361,883class a euR 2,983,479 36,596 (358,958) 2,661,117class B usd 2,680,148 – (41,766) 2,638,382class B euR 27,832 – – 27,832class c usd 274,402 – (24,467) 249,935class c euR 311,712 3,982 – 315,694
sterling c (inc) GBp 8,306 17 (8) 8,315class W usd 572,142 – (100) 572,042
03613-1C.indd 340 19/08/2020 19:02

341
BNY MelloN GloBal FuNds, plc
Notes to the FiNaNcial statemeNts
2. SHARE CAPITAL cont’d.
REDEEMABLE PARTICIPATING SHARES cont’d.
Fund Share Class Currency
Shares in issue
at beginning of financial period
Shares issues during
the financial period
Shares redeemed
during the financial period
Shares in issue
at end of financial period
BNY Mellon Asian Income Fundclass a (acc) euR 1,880 99,781 (900) 100,761class a (inc) euR 40,398 – – 40,398
class B (acc) usd 107,267 – – 107,267class c (acc) usd 4,589 – – 4,589
sterling c (acc) GBp 5,000 – – 5,000class W (inc) euR 20,556,852 1,284,496 (1,757,952) 20,083,396class W (inc) usd 443,615 194,800 (50,367) 588,048
sterling W (inc) GBp 222,948 2,767 (3,882) 221,833
BNY Mellon Brazil Equity Fundclass a usd 14,980,918 5,771,246 (5,750,541) 15,001,623class a euR 20,483,356 19,378,589 (17,195,926) 22,666,019class B usd 1,232,007 261,125 (117,375) 1,375,757class B euR 80,698 – – 80,698
sterling B (acc) GBp 340,999 34,363 (77,135) 298,227class c usd 18,123,901 8,081,684 (17,411,055) 8,794,530class c euR 1,813,628 7,262,352 (2,742,598) 6,333,382
sterling c (inc) GBp 17,430 3,141 (11,043) 9,528class G (acc) usd 5,000 87,116 (5,000) 87,116class G (acc) euR 5,000 93,129 (49,806) 48,323
class G (acc) (hedged) euR 100,000 97,903 (40,560) 157,343class h (hedged) euR 3,323,725 6,781,495 (4,757,347) 5,347,873
class i (acc) (hedged) euR 4,347,355 184,309 (335,265) 4,196,399class W (acc) usd 3,460,660 762,649 (1,438,342) 2,784,967class W (acc) euR 950,411 1,076,105 (1,427,350) 599,166
sterling W (acc) GBp 2,116,926 3,667,055 (2,487,745) 3,296,236
BNY Mellon Digital Assets Fund*class a (acc)^ usd – 5,000 – 5,000class B (acc)^ usd – 5,000 – 5,000class e (acc)^ usd – 49,475 – 49,475class e (acc)^ euR – 516,700 – 516,700class e (inc)^ usd – 593,955 – 593,955
class h (acc) (hedged)^ euR – 100,000 – 100,000class K (acc)^ euR – 456,569 – 456,569class K (acc)^ usd – 751,999 – 751,999class W (acc)^ usd – 4,978,700 – 4,978,700
BNY Mellon Dynamic Total Return Fund
class a (acc) usd 20,364 17,064 (20,364) 17,064class c (acc) usd 21,176,116 950,135 (11,524,887) 10,601,364class e (acc) usd 14,005,000 – (5,000) 14,000,000
class h (acc) (hedged) euR 96,526 – – 96,526class W (acc) usd 5,000 – – 5,000class X (acc) usd 50,205 – – 50,205
03613-1C.indd 341 19/08/2020 19:02

342
BNY MelloN GloBal FuNds, plc
Notes to the FiNaNcial statemeNts
2. SHARE CAPITAL cont’d.
REDEEMABLE PARTICIPATING SHARES cont’d.
Fund Share Class Currency
Shares in issue
at beginning of financial period
Shares issues during
the financial period
Shares redeemed
during the financial period
Shares in issue
at end of financial period
BNY Mellon Dynamic U.S. Equity Fundclass a (inc) usd 5,003 42 (21) 5,024
class c (acc) usd 58,684,222 12,031,485 (46,002,392) 24,713,315class e (acc) usd 12,586,250 563,500 (5,137,730) 8,012,020
class h (acc) (hedged)^ euR – 100,000 – 100,000class G (inc)^ usd 5,000 44 (5,044) –class W (acc) usd 1,359,448 – (1,082,670) 276,778class W (acc) euR 1,363,463 – (1,358,463) 5,000
sterling W (acc) GBp 5,000 – – 5,000class X (acc) usd 74,123,803 – (10,970) 74,112,833
BNY Mellon Emerging Markets Corporate Debt Fund
class a usd 29,004 8,567 (17,088) 20,483class a euR 43,070 28,386 (8,173) 63,283class B usd 6,671 219 – 6,890class c usd 357,676 143,038 (68,812) 431,902class c euR 23,739 50,904 (14,404) 60,239
class G (inc) usd 5,966 2,597 (53) 8,510class h (hedged) euR 95,250 26,190 (25,390) 96,050
class i (hedged) euR 112,979 3,432 (34,425) 81,986class W usd 166,782 97,909 (74,362) 190,329class W euR 751 22,988 (178) 23,561
class W (acc) (hedged) chF 64,976 6,628 (2,581) 69,023class W (acc) (hedged) euR 1,079 4,248 – 5,327
class W (inc) (hedged)^ chF – 66,660 – 66,660class W (inc) (hedged) euR 100,000 5,152 – 105,152
sterling W (acc) (hedged) GBp 12,509 15,769 (4,567) 23,711class X usd 664,196 197,816 (109,026) 752,986
sterling X (acc) (hedged)^ GBp – 134,617 – 134,617class Y (acc) usd 50 – – 50
BNY Mellon Emerging Markets Debt Fund
class a usd 626,027 18,832 (16,356) 628,503class a euR 2,866,819 2,371,934 (764,688) 4,474,065class c usd 1,661,085 30,483 (56,473) 1,635,095class c euR 16,629,467 341,489 (12,864,147) 4,106,809
class c (inc) usd 469,373 – – 469,373class h (acc) (hedged) euR 645,728 2,742,555 (745,609) 2,642,674
class W usd 5,000 – – 5,000class X (inc)^ usd – 8,000,000 – 8,000,000
BNY Mellon Emerging Markets Debt Local Currency Fund
class a usd 14,560,273 2,497,488 (3,976,605) 13,081,156class a euR 22,056,946 13,115,118 (5,415,151) 29,756,913
class a (inc) usd 186,179 23 (12) 186,190class a (inc) euR 1,458,547 23,808 (6,723) 1,475,632
sterling a (acc) GBp 154,941 – – 154,941sterling B (acc) GBp 9,171 – (7,126) 2,045
class c usd 23,968,316 31,150,903 (30,673,744) 24,445,475class c euR 1,418,012 544,557 (460,634) 1,501,935
class c (inc) usd 176,500 – – 176,500
03613-1C.indd 342 19/08/2020 19:02

343
BNY MelloN GloBal FuNds, plc
Notes to the FiNaNcial statemeNts
2. SHARE CAPITAL cont’d.
REDEEMABLE PARTICIPATING SHARES cont’d.
Fund Share Class Currency
Shares in issue
at beginning of financial period
Shares issues during
the financial period
Shares redeemed
during the financial period
Shares in issue
at end of financial period
BNY Mellon Emerging Markets Debt Local Currency Fund cont’d.class c (inc) euR 55,759,499 – – 55,759,499
sterling c (acc) GBp 9,395,301 312 (9,393,636) 1,977sterling c (inc) GBp 311,716 56,213 (79,438) 288,491
class h (hedged) euR 35,283,347 27,603,126 (9,990,901) 52,895,572class i (hedged) euR 8,848,372 25,609,114 (7,018,839) 27,438,647
sterling J (inc) (hedged) GBp 11,000 – – 11,000class W usd 87,749,421 7,909,796 (1,347,152) 94,312,065class W euR 27,145,556 10,538,004 (809,509) 36,874,051
class W (hedged) euR 26,519,308 26,147,495 (23,709,004) 28,957,799class W (inc) euR 35,115 – – 35,115
class W (inc) (hedged) euR 87,343,123 24,878 (106,536) 87,261,465sterling W (inc) GBp 28,132,284 2,622,981 (1,135,933) 29,619,332
sterling W (inc) (hedged) GBp 126,391 1,180 (32,738) 94,833class X usd 124,671,046 – (65,360,000) 59,311,046
class X (inc)^ chF 165,602,567 – (165,602,567) –
BNY Mellon Emerging Markets Debt Opportunistic Fundclass a euR 27,041 8,234 (7,329) 27,946class c usd 256,500 – – 256,500class c euR 5,000 – – 5,000
class W (acc) usd 5,000 – – 5,000class X (inc) usd 34,067,895 1,862,975 (1,836,239) 34,094,631
BNY Mellon Emerging Markets Debt Total Return Fund
class a (acc)^ usd 5,000 5,000 (10,000) –class a (inc)^ usd 5,219 304 (5,523) –
class e (inc) usd 31,170,469 – – 31,170,469sterling e (acc) (hedged)^ GBp 5,433,946 – (5,433,946) –
sterling e (inc) (hedged) GBp 22,296,896 1,758,620 (111,205) 23,944,311class G (inc) (hedged)^ euR 103,610 6,151 (109,761) –
class h (acc) (hedged)^ euR 100,000 100,000 (200,000) –class h (inc) (hedged)^ euR 103,611 6,154 (109,765) –
class W (acc) usd 64,610,852 – – 64,610,852class W (acc) (hedged) euR 4,326,964 250,215 (4,551,999) 25,180
sterling W (acc) (hedged) GBp 297,583 83,456 (85,005) 296,034class X (acc) usd 5,000 – – 5,000
BNY Mellon Euroland Bond Fund
class a euR 127,764,082 11,186,353 (16,108,272) 122,842,163class a (inc) euR 10,765,817 653,455 (1,498,235) 9,921,037
class B euR 89,840 – (21,331) 68,509class B (inc) euR 34,907 16,000 – 50,907
class c euR 100,151,746 9,862,323 (9,994,907) 100,019,162class c (inc) euR 103,061,188 70,849 (5,718,773) 97,413,264
class G (acc) euR 763,087 30,000 (250,089) 542,998class h (acc) (hedged)^ usd 177,981 – (177,981) –
class h (hedged) chF 5,155,416 549,698 (714,801) 4,990,313class i (hedged) chF 4,256,339 450,000 (3,174,733) 1,531,606
class s euR 260,256,360 24,848,966 (41,332,488) 243,772,838class W (acc) euR 76,376,091 6,410,217 (8,809,584) 73,976,724
03613-1C.indd 343 19/08/2020 19:02

344
BNY MelloN GloBal FuNds, plc
Notes to the FiNaNcial statemeNts
2. SHARE CAPITAL cont’d.
REDEEMABLE PARTICIPATING SHARES cont’d.
Fund Share Class Currency
Shares in issue
at beginning of financial period
Shares issues during
the financial period
Shares redeemed
during the financial period
Shares in issue
at end of financial period
BNY Mellon European Credit Fundclass a euR 7,105 3,243 (2,522) 7,826class c euR 41,847 1,448 (4,885) 38,410
class W (acc) euR 11,197 1,650 – 12,847class X euR 283,427 – (61,738) 221,689
BNY Mellon Global Bond Fund
class a usd 28,881,146 1,107,441 (3,255,205) 26,733,382class a euR 9,602,043 10,528,689 (2,032,201) 18,098,531class B usd 799,116 – (18,990) 780,126class c usd 80,174,313 31,908,685 (6,516,236) 105,566,762class c euR 52,805,842 27,059,918 (9,387,211) 70,478,549
class c (inc) usd 958,087 394 (59,757) 898,724sterling c (inc) GBp 2,723,870 383,449 (283,186) 2,824,133
class h (hedged) euR 1,811,323 172,982 (168,854) 1,815,451class i (hedged) euR 339,161 36,459 (15,988) 359,632
class W (acc) usd 20,376,759 16,635,918 (6,504,063) 30,508,614class W (acc) euR 19,863,791 3,297,429 (22,187,978) 973,242
class W (acc) (hedged) euR 34,920,339 – (14,794,172) 20,126,167class X usd 9,562,811 – – 9,562,811
BNY Mellon Global Credit Fund
class B (acc)^ usd 4,950 – (4,950) –class c (acc)^ usd 5,000 – (5,000) –
class h (acc) (hedged) euR 11,244,047 7,516 (3,223,601) 8,027,962class W (acc) usd 7,323,402 90,500 (6,992,752) 421,150
class W (acc) (hedged)^ euR 100,000 – (100,000) –sterling W (acc) (hedged) GBp 100,933 – – 100,933
class X (acc) usd 5,000 – – 5,000class X (acc) (hedged) cad 479,804,141 – – 479,804,141
sterling X (acc) (hedged)^ GBp – 100,000 – 100,000
BNY Mellon Global Dynamic Bond Fundclass a usd 4,074,077 433,466 (278,129) 4,229,414class a euR 782,815 2,115,052 (328,016) 2,569,851
class a (inc) usd 176,283 615 – 176,898class c usd 125,936,459 12,620,916 (51,123,840) 87,433,535
class G (acc) euR 75,139 – (5,000) 70,139class h (hedged) euR 3,669,361 372,652 (801,817) 3,240,196
class h (acc) (hedged)^ NoK – 88,000 – 88,000class h (inc) (hedged) euR 434,029 32,010 (8,388) 457,651
class i (hedged) euR 61,342,906 6,840,932 (16,259,481) 51,924,357class i (inc) (hedged) euR 2,780,211 2,714,283 (212,004) 5,282,490
class W usd 145,803,358 15,425,174 (3,906,760) 157,321,772class W (hedged) euR 91,708,915 19,654,655 (50,539,115) 60,824,455
class W (acc) (hedged) chF 5,568,050 592,929 (4,169,410) 1,991,569class W (acc) (hedged)^ NoK – 88,000 – 88,000
class W (inc) (hedged) euR 6,436,995 255,787 (482) 6,692,300sterling W (acc) (hedged) GBp 13,684,414 1,501,105 (2,033,823) 13,151,696
03613-1C.indd 344 19/08/2020 19:02

345
BNY MelloN GloBal FuNds, plc
Notes to the FiNaNcial statemeNts
2. SHARE CAPITAL cont’d.
REDEEMABLE PARTICIPATING SHARES cont’d.
Fund Share Class Currency
Shares in issue
at beginning of financial period
Shares issues during
the financial period
Shares redeemed
during the financial period
Shares in issue
at end of financial period
BNY Mellon Global Emerging Markets Fundclass a usd 1,133,638 1,624,662 (2,561,286) 197,014class a euR 167,443 4,839 – 172,282
class a (inc) euR 137,639 1,023 (4) 138,658class B (inc) usd 36,014 – – 36,014class B (inc) euR 33,600 – – 33,600
class c usd 143,500 10,200 – 153,700class c (acc) usd 22,247,245 2,405,822 (4,312,123) 20,340,944class c (inc) usd 18,012 2,000 (5,488) 14,524
class e (acc) usd 17,322,529 138,310 (15,324,853) 2,135,986class e (acc) chF 3,276,823 27,500 (758,987) 2,545,336
class G (acc) (hedged) euR 1,804,027 – (920,801) 883,226class h (hedged) euR 191,090 1,846 (70,317) 122,619
class i (hedged) euR 261,228 – – 261,228class W (acc) usd 494,989 12,926 (16,479) 491,436class W (acc) euR 205,000 – (5,000) 200,000class W (inc) usd 1,190,770 298,650 (97,900) 1,391,520class W (inc) euR 58,242 – – 58,242
BNY Mellon Global Equity Fund
class a usd 10,733,792 5,109,940 (4,102,152) 11,741,580class a euR 625,472 3,147,302 (2,942,595) 830,179class B usd 3,501,343 – (69,183) 3,432,160class B euR 16,994 – – 16,994class c usd 11,068,196 486,346 (584,360) 10,970,182class c euR 2,456 47 – 2,503
class i (hedged) euR 1,262,025 404,658 (49,172) 1,617,511class W (acc) usd 18,163,040 1,974,259 (2,033,554) 18,103,745class W (acc) euR 173,808,519 12,724,278 (13,733,198) 172,799,599
BNY Mellon Global Equity Income Fund
class a usd 11,369,236 915,359 (1,816,980) 10,467,615class a euR 24,404,523 8,862,624 (6,027,938) 27,239,209
class a (inc) usd 2,346,067 77,125 (424,233) 1,998,959class a (inc) euR 1,891,816 3,142,058 (268,110) 4,765,764
sterling a (acc) GBp 202,391 2,370 (856) 203,905class B usd 14,031,047 37,000 (4,015,720) 10,052,327class B euR 1,317,950 310,407 (175,310) 1,453,047
class B (inc) usd 6,106,549 117,187 (796,628) 5,427,108class B (inc) euR 134,944 562 (1,026) 134,480
sterling B (inc) GBp 2,295,385 108,797 (103,957) 2,300,225class c usd 35,208,188 2,152,907 (42,292) 37,318,803class c euR 5,913,764 2,939,789 (1,258,838) 7,594,715
class c (inc) usd 4,821,787 872,018 (694,438) 4,999,367class c (inc) euR 27,553,948 2,429,946 (4,843,437) 25,140,457
sterling c (inc) GBp 2,017,530 89,933 (268,308) 1,839,155class G (acc) euR 17,378 1,195,117 (7,485) 1,205,010
class h (hedged) euR 6,068,645 6,209,028 (1,242,377) 11,035,296class h (inc) (hedged) euR 7,376,163 546,313 (341,416) 7,581,060
class i (hedged) euR 13,041,945 627,080 (1,005,450) 12,663,575
03613-1C.indd 345 19/08/2020 19:02

346
BNY MelloN GloBal FuNds, plc
Notes to the FiNaNcial statemeNts
2. SHARE CAPITAL cont’d.
REDEEMABLE PARTICIPATING SHARES cont’d.
Fund Share Class Currency
Shares in issue
at beginning of financial period
Shares issues during
the financial period
Shares redeemed
during the financial period
Shares in issue
at end of financial period
BNY Mellon Global Equity Income Fund cont’d.class i (inc) (hedged) euR 8,924,081 3,224,201 (10,406,697) 1,741,585
class W usd 46,772,608 46,439,053 (17,631,671) 75,579,990class W euR 20,511,831 12,734,158 (6,744,875) 26,501,114
class W (acc)^ chF – 5,000 – 5,000class W (acc) (hedged) euR 3,646,621 420,767 (549,295) 3,518,093
class W (inc) usd 8,712,331 8,081,383 (2,615,870) 14,177,844class W (inc) euR 257,671,158 344,455,959 (117,875,820) 484,251,297
sterling W (acc) GBp 3,212,849 1,368,634 (243,889) 4,337,594sterling W (inc) GBp 33,014,634 2,150,440 (8,915,263) 26,249,811
class Z (acc) usd 9,951,943 4,703,924 (721,961) 13,933,906class Z (acc) euR 471,602 830,398 (232,043) 1,069,957class Z (inc) usd 5,000 2,455,841 (48) 2,460,793class Z (inc) euR 5,000 460,743 (48) 465,695
sterling Z (inc) GBp 5,000 4,236,637 (27,892) 4,213,745
BNY Mellon Global High Yield Bond Fundclass a euR 3,112,605 1,994,434 (882,754) 4,224,285class c usd 14,206,074 32,091,013 (1,311,261) 44,985,826class c euR 9,342 1,231,746 (831,354) 409,734
class c (inc) usd 398,288 – – 398,288class h (hedged) euR 571,388 283,315 (105,080) 749,623
class i (hedged) euR 1,701,315 10,960 (447,228) 1,265,047class W (acc) usd 5,000 – – 5,000
class X (inc) usd 33,608,465 4,440,617 (10,219,598) 27,829,484class X (inc) (hedged) euR 25,336,346 – (3,506,817) 21,829,529
BNY Mellon Global Infrastructure Income Fund
class a (acc) usd 5,000 195,925 – 200,925class a (inc) usd 729,700 706,700 (5,134) 1,431,266class a (inc) euR 5,454 850 (106) 6,198
class B (acc) usd 5,000 – – 5,000class B (inc) usd 5,027 190 (95) 5,122class c (inc) euR 5,026 190 (95) 5,121
class e (acc) usd 5,000 604,290 (341,167) 268,123class e (inc) usd 104,527 1,088,996 (5,134) 1,188,389class e (inc) euR 5,026 87,036 (94) 91,968
sterling e (inc) (hedged) GBp 5,419,997 537,607 (306,471) 5,651,133class h (acc) (hedged) euR 100,000 56,016 – 156,016class h (inc) (hedged) euR 100,690 204,190 (1,935) 302,945
class W (acc) usd 4,361,369 – – 4,361,369class W (acc) (hedged) euR 100,000 – – 100,000
class W (inc) usd 5,027 190 (95) 5,122class W (inc) (hedged) euR 100,535 3,859 (1,930) 102,464
BNY Mellon Global Leaders Fund
class a (acc) usd 1,440,796 40,796 (225,711) 1,255,881class a (acc)^ euR – 5,000 – 5,000class a (inc)^ euR – 5,000 – 5,000
class B (acc)^ usd – 5,000 – 5,000class c (acc) usd 27,823,730 288,779 (254,438) 27,858,071
03613-1C.indd 346 19/08/2020 19:02
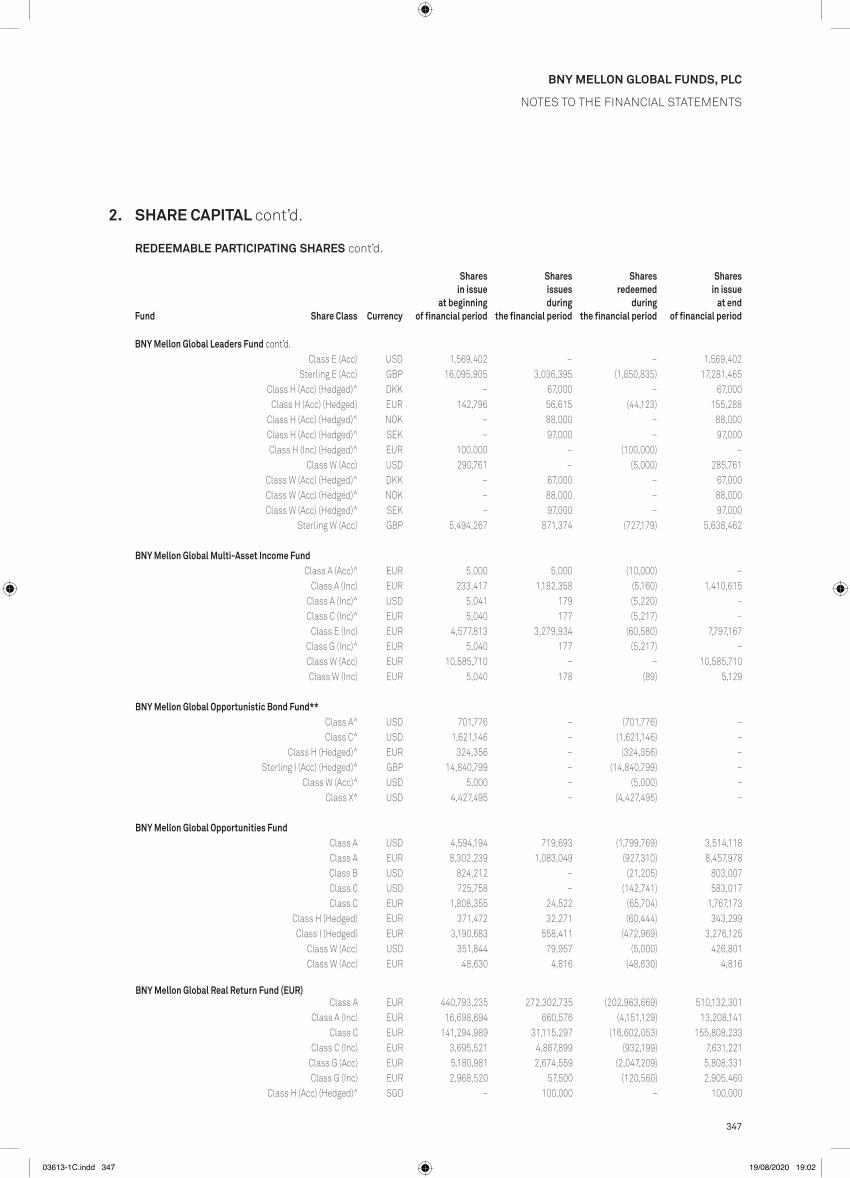
347
BNY MelloN GloBal FuNds, plc
Notes to the FiNaNcial statemeNts
2. SHARE CAPITAL cont’d.
REDEEMABLE PARTICIPATING SHARES cont’d.
Fund Share Class Currency
Shares in issue
at beginning of financial period
Shares issues during
the financial period
Shares redeemed
during the financial period
Shares in issue
at end of financial period
BNY Mellon Global Leaders Fund cont’d.class e (acc) usd 1,569,402 – – 1,569,402
sterling e (acc) GBp 16,095,905 3,036,395 (1,850,835) 17,281,465class h (acc) (hedged)^ dKK – 67,000 – 67,000
class h (acc) (hedged) euR 142,796 56,615 (44,123) 155,288class h (acc) (hedged)^ NoK – 88,000 – 88,000class h (acc) (hedged)^ seK – 97,000 – 97,000class h (inc) (hedged)^ euR 100,000 – (100,000) –
class W (acc) usd 290,761 – (5,000) 285,761class W (acc) (hedged)^ dKK – 67,000 – 67,000class W (acc) (hedged)^ NoK – 88,000 – 88,000class W (acc) (hedged)^ seK – 97,000 – 97,000
sterling W (acc) GBp 5,494,267 871,374 (727,179) 5,638,462
BNY Mellon Global Multi-Asset Income Fundclass a (acc)^ euR 5,000 5,000 (10,000) –
class a (inc) euR 233,417 1,182,358 (5,160) 1,410,615class a (inc)^ usd 5,041 179 (5,220) –class c (inc)^ euR 5,040 177 (5,217) –
class e (inc) euR 4,577,813 3,279,934 (60,580) 7,797,167class G (inc)^ euR 5,040 177 (5,217) –class W (acc) euR 10,585,710 – – 10,585,710class W (inc) euR 5,040 178 (89) 5,129
BNY Mellon Global Opportunistic Bond Fund**
class a^ usd 701,776 – (701,776) –class c^ usd 1,621,146 – (1,621,146) –
class h (hedged)^ euR 324,356 – (324,356) –sterling i (acc) (hedged)^ GBp 14,840,799 – (14,840,799) –
class W (acc)^ usd 5,000 – (5,000) –class X^ usd 4,427,495 – (4,427,495) –
BNY Mellon Global Opportunities Fund
class a usd 4,594,194 719,693 (1,799,769) 3,514,118class a euR 8,302,239 1,083,049 (927,310) 8,457,978class B usd 824,212 – (21,205) 803,007class c usd 725,758 – (142,741) 583,017class c euR 1,808,355 24,522 (65,704) 1,767,173
class h (hedged) euR 371,472 32,271 (60,444) 343,299class i (hedged) euR 3,190,683 558,411 (472,969) 3,276,125
class W (acc) usd 351,844 79,957 (5,000) 426,801class W (acc) euR 48,630 4,816 (48,630) 4,816
BNY Mellon Global Real Return Fund (EUR)
class a euR 440,793,235 272,302,735 (202,963,669) 510,132,301class a (inc) euR 16,698,694 660,576 (4,151,129) 13,208,141
class c euR 141,294,989 31,115,297 (16,602,053) 155,808,233class c (inc) euR 3,695,521 4,867,899 (932,199) 7,631,221
class G (acc) euR 5,180,981 2,674,559 (2,047,209) 5,808,331class G (inc) euR 2,968,520 57,500 (120,560) 2,905,460
class h (acc) (hedged)^ sGd – 100,000 – 100,000
03613-1C.indd 347 19/08/2020 19:02

348
BNY MelloN GloBal FuNds, plc
Notes to the FiNaNcial statemeNts
2. SHARE CAPITAL cont’d.
REDEEMABLE PARTICIPATING SHARES cont’d.
Fund Share Class Currency
Shares in issue
at beginning of financial period
Shares issues during
the financial period
Shares redeemed
during the financial period
Shares in issue
at end of financial period
BNY Mellon Global Real Return Fund (EUR) cont’d.class W euR 775,335,978 176,923,587 (167,466,366) 784,793,199
class W (acc) (hedged) chF 3,079,314 10,055 (105,435) 2,983,934class X euR 912,818,365 51,027,116 (39,019,973) 924,825,508
class Z (acc) euR 62,452,227 1,476,814 – 63,929,041
BNY Mellon Global Real Return Fund (GBP)sterling B (acc) GBp 1,184,832 355,244 (328,695) 1,211,381sterling B (inc) GBp 583,448 12,008 (181,424) 414,032sterling c (inc) GBp 1,350,376 9,066 (989,314) 370,128
sterling W (acc) GBp 5,315,693 3,343,355 (866,657) 7,792,391sterling W (inc) GBp 18,584,287 1,345,196 (2,365,241) 17,564,242sterling X (acc) GBp 26,266,461 4,032,358 (3,637,640) 26,661,179
BNY Mellon Global Real Return Fund (USD)
class a usd 57,871,106 5,449,770 (6,391,402) 56,929,474class c usd 30,009,221 3,850,710 (6,946,321) 26,913,610
class c (inc) usd 1,046,574 – – 1,046,574class G (acc) usd 5,870,198 – (5,861,698) 8,500class W (acc) usd 12,557,978 6,963,774 (1,422,318) 18,099,434class W (inc) usd 17,216,211 3,621,071 (4,806,271) 16,031,011
class X usd 100,331,750 1,404,657 (13,893,108) 87,843,299
BNY Mellon Global Short-Dated High Yield Bond Fundclass a (acc) usd 4,234,324 5,037,344 (735,804) 8,535,864class a (inc) usd 618,421 216,820 (103,946) 731,295
class c (acc) usd 16,323,653 3,434,457 (3,163,903) 16,594,207class G (acc)^ usd – 5,000 – 5,000class G (inc)^ usd 5,149 241 (5,390) –
class G (inc) (hedged)^ euR 103,065 4,902 (107,967) –class h (acc) (hedged) euR 77,076,605 25,079,656 (11,568,618) 90,587,643class h (inc) (hedged) euR 2,278,090 1,885,739 (93,182) 4,070,647class i (acc) (hedged) euR 17,798,788 2,825,150 (4,370,878) 16,253,060class i (inc) (hedged) euR 110,936 5,300,000 – 5,410,936
class W (acc) usd 35,875,223 21,085,061 (10,422,527) 46,537,757class W (acc) (hedged) chF 15,855,012 3,718,200 (62,912) 19,510,300class W (acc) (hedged) euR 71,841,199 37,889,147 (24,605,259) 85,125,087
class W (inc) usd 30,030,000 450,000 – 30,480,000class W (inc) (hedged) euR 5,374,760 25,353 (717,963) 4,682,150
sterling W (acc) (hedged) GBp 7,288,144 1,960,867 (3,217,308) 6,031,703sterling W (inc) (hedged) GBp 453,020 518,742 (161,750) 810,012
class X (acc) usd 11,448,893 – – 11,448,893class X (acc) (hedged)^ euR – 6,307,787 – 6,307,787
sterling X (acc) (hedged)^ GBp – 16,789,632 – 16,789,632class Y (acc) usd 264,596,439 13,840,680 (81,786,993) 196,650,126
sterling Y (acc) (hedged) GBp 14,998,654 – – 14,998,654sterling Z (acc) (hedged)^ GBp – 641,185 (9,434) 631,751sterling Z (inc) (hedged)^ GBp – 23,527,979 (273,368) 23,254,611
BNY Mellon Global Short-Dated High Yield Bond Fund cont’d.
BNY Mellon Global Opportunities Fund cont’d.
BNY Mellon Global Infrastructure Income Fund* cont’d.
BNY Mellon Global Short-Dated High Yield Bond Fund cont’d.
03613-1C.indd 348 19/08/2020 19:02

349
BNY MelloN GloBal FuNds, plc
Notes to the FiNaNcial statemeNts
2. SHARE CAPITAL cont’d.
REDEEMABLE PARTICIPATING SHARES cont’d.
Fund Share Class Currency
Shares in issue
at beginning of financial period
Shares issues during
the financial period
Shares redeemed
during the financial period
Shares in issue
at end of financial period
BNY Mellon Global Unconstrained Fundclass W (acc) usd 5,000 – – 5,000
class X (acc) (hedged) cad 28,492,519 – – 28,492,519
BNY Mellon Japan All Cap Equity Fund**class c^ JpY 127,442 972 (128,414) –
class h (hedged)^ euR 77,065 – (77,065) –class i (hedged)^ usd 2,089,342 – (2,089,342) –
class W^ JpY 5,000 – (5,000) –sterling W (acc)^ GBp 7,922 – (7,922) –
class X (inc)^ JpY 6,466,818 – (6,466,818) –
BNY Mellon Japan REIT Alpha Fund**class c (acc)^ JpY 5,701 – (5,701) –class W (inc)^ JpY 14,705,035 – (14,705,035) –
BNY Mellon Japan Small Cap Equity Focus Fundclass a (acc)^ JpY 4,903 – (4,903) –
class a (acc) euR 20,084 106 (5,000) 15,190class c JpY 853,959 1,973 (299,298) 556,634class c usd 13,591,856 3,291 (13,591,856) 3,291
class c (acc) euR 1,355,000 5,809 (1,355,000) 5,809class e (acc) euR 32,386 – (5,000) 27,386
class e (acc) (hedged) chF 3,756,249 398,070 (102,842) 4,051,477class e (acc) (hedged) usd 20,000,000 5,597,224 – 25,597,224class G (acc) (hedged) euR 1,189,549 248,685 (509,675) 928,559
class G (inc) (hedged)^ euR 2,269,000 – (2,269,000) –class h (acc) (hedged)^ NoK – 88,000 – 88,000class h (acc) (hedged)^ seK – 97,000 – 97,000
class h (acc) (hedged) sGd 1,376,499 86,682 (267,898) 1,195,283class h (hedged) euR 9,797,941 353,090 (7,444,880) 2,706,151class h (hedged) usd 722,578 29,877 (63,433) 689,022
class i (hedged) euR 5,460,717 1,902,208 (1,805,419) 5,557,506class i (hedged) usd 56,244 525,729 (56,244) 525,729
class W JpY 27,879,218 1,760,460 (2,663,501) 26,976,177class W (acc) euR 25,478,131 – (5,000) 25,473,131
class W (acc) (hedged) euR 2,065,927 17,023 (1,509,419) 573,531class W (acc) (hedged)^ NoK – 88,000 – 88,000class W (acc) (hedged)^ seK – 97,000 – 97,000
sterling W (acc) GBp 5,015,726 819,357 (1,991,757) 3,843,326sterling W (inc) GBp 152,500 505,975 – 658,475
BNY Mellon Long-Term Global Equity Fund
class a euR 47,689,940 29,031,678 (13,000,170) 63,721,448class a usd 29,430,916 4,538,659 (4,484,117) 29,485,458
class a (inc) euR 968,402 587,291 (83,172) 1,472,521sterling a (acc) GBp 767,900 476,161 (192,520) 1,051,541
class B euR 92,961 672,555 (95,483) 670,033class B usd 1,840,429 2,368,061 (632,465) 3,576,025
03613-1C.indd 349 19/08/2020 19:02

350
BNY MelloN GloBal FuNds, plc
Notes to the FiNaNcial statemeNts
2. SHARE CAPITAL cont’d.
REDEEMABLE PARTICIPATING SHARES cont’d.
Fund Share Class Currency
Shares in issue
at beginning of financial period
Shares issues during
the financial period
Shares redeemed
during the financial period
Shares in issue
at end of financial period
BNY Mellon Long-Term Global Equity Fund cont’d.class B (acc) sGd 5,000 3,248,321 (123,599) 3,129,722class B (inc) sGd 5,000 – – 5,000
sterling B (inc) GBp 265,658 2,086 (19,708) 248,036class c euR 40,940,930 36,131,036 (12,921,690) 64,150,276class c usd 115,248,632 95,534,250 (12,641,378) 198,141,504
class G (acc)^ euR – 5,000 – 5,000class h (acc) (hedged)^ usd 100,000 – (100,000) –
class J (acc) (hedged) sGd 100,000 180,375 – 280,375class s euR 49,794,445 7,592,708 (2,748,082) 54,639,071
class s (acc)^ usd 30,397,956 – (30,397,956) –class s (acc) 1^ usd – 31,672,725 – 31,672,725
class W euR 43,633,634 25,330,745 (4,683,037) 64,281,342class W usd 29,775,849 6,590,386 (9,826,183) 26,540,052
class W (hedged)^ chF 336,412 – (336,412) –class W (hedged) usd 430,493 290,409 (6,860) 714,042
class W (acc) (hedged)^ sGd – 100,000 – 100,000class W (inc) usd 16,670,856 7,573 (659,908) 16,018,521
sterling W (acc) GBp 9,099,548 2,800,734 (1,220,610) 10,679,672sterling W (inc) GBp 1,843,780 26,106 (24,166) 1,845,720
class X (acc) usd 5,000 – – 5,000sterling X GBp 296,862,264 – (1,935,947) 294,926,317
BNY Mellon Mobility Innovation Fund
class a (acc) usd 5,000 4,983,387 (42,213) 4,946,174class a (acc) euR 5,000 1,549,589 (15,975) 1,538,614class a (inc) usd 5,000 157,072 (5,054) 157,018class a (inc) euR 5,000 1,075,483 (24,483) 1,056,000
class B (acc) usd 1,765,286 9,162,728 (1,445,454) 9,482,560class c (inc) euR 5,000 1,115,000 – 1,120,000
class e (acc) usd 6,974,431 12,540,668 (682,789) 18,832,310class e (acc) chF 1,199,028 6,070,674 (316,561) 6,953,141class e (acc) euR 759,604 2,673,004 (102,256) 3,330,352class e (acc) sGd 5,000 – – 5,000
class e (acc) (hedged)^ chF – 9,489,985 (43,300) 9,446,685class e (acc) (hedged) euR 1,232,073 8,206,665 (449,224) 8,989,514class e (acc) (hedged) sGd 99,706 35,000 – 134,706
sterling e (acc) (hedged) GBp 100,000 926,439 – 1,026,439class h (acc) (hedged) euR 166,440 1,357,467 (156,215) 1,367,692class h (inc) (hedged) euR 100,000 10,764 – 110,764class J (acc) (hedged) euR 160,326 – – 160,326
class K (acc) usd 174,474 3,290,769 (76,500) 3,388,743class K (acc) (hedged) chF 334,021 1,697,464 (251,021) 1,780,464class K (acc) (hedged) euR 448,185 2,249,677 (175,000) 2,522,862class K (acc) (hedged) sGd 100,000 – – 100,000
class K (inc) usd 5,000 238,359 (5,000) 238,359class K (inc) (hedged) chF 110,000 46,161 – 156,161class K (inc) (hedged) euR 142,000 106,770 – 248,770
03613-1C.indd 350 19/08/2020 19:02

351
BNY MelloN GloBal FuNds, plc
Notes to the FiNaNcial statemeNts
2. SHARE CAPITAL cont’d.
REDEEMABLE PARTICIPATING SHARES cont’d.
Fund Share Class Currency
Shares in issue
at beginning of financial period
Shares issues during
the financial period
Shares redeemed
during the financial period
Shares in issue
at end of financial period
BNY Mellon Mobility Innovation Fund cont’d.class K (inc) (hedged) sGd 100,000 27,171 – 127,171
sterling K (acc) (hedged) GBp 100,000 – – 100,000sterling K (inc) (hedged) GBp 100,000 – – 100,000
class W (acc) usd 24,369,274 809,355 (6,495,168) 18,683,461class W (acc) (hedged) euR 197,356 3,481,698 (92,504) 3,586,550
class W (inc) usd 5,000 7 (3) 5,004class W (inc) (hedged) euR 100,000 160 (80) 100,080
BNY Mellon S&P 500® Index Tracker
class a usd 9,384,050 177,142 (2,256,414) 7,304,778class a euR 1,682,321 323,054 (455,743) 1,549,632class c usd 14,744,505 933,847 (1,718,840) 13,959,512class c euR 3,616,491 71,621 (131,572) 3,556,540
class G (acc)^ euR 5,000 – (5,000) –
BNY Mellon Small Cap Euroland Fundclass a euR 5,234,896 538,774 (1,298,251) 4,475,419class a usd 63,689 13,130 (10,661) 66,158class B euR 20,243 115 (1,849) 18,509class c euR 6,543,602 1,737,717 (2,036,713) 6,244,606class c usd 11,040,548 – (11,020,761) 19,787
class W (acc) euR 13,010,249 – (6,810,703) 6,199,546sterling W (acc) GBp 30,165 3,127 (15,579) 17,713
BNY Mellon Sustainable Global Dynamic Bond Fund*
class a (acc)^ euR – 5,000 – 5,000class a (inc)^ euR – 5,006 (3) 5,003
class c (acc)^ euR – 5,000 – 5,000class e (acc)^ euR – 47,502,712 – 47,502,712class G (acc)^ euR – 5,000 – 5,000
class h (acc) (hedged)^ NoK – 88,000 – 88,000class W (acc)^ euR – 5,000 – 5,000
class W (acc) (hedged)^ NoK – 88,000 – 88,000class X (acc)^ euR – 113,503,518 – 113,503,518
BNY Mellon Targeted Return Bond Fund
class a (acc) usd 5,000 – – 5,000sterling W (acc) (hedged) GBp 65,588,972 197,799 (66,573) 65,720,198
BNY Mellon U.S. Dynamic Value Fund
class a usd 763,131 104,106 (86,184) 781,053class a euR 528,152 90,710 (50,080) 568,782class B usd 94,858 – – 94,858class c usd 6,251,934 683,804 (1,245,868) 5,689,870class c euR 583 – – 583
class W (acc) usd 5,000 – – 5,000
03613-1C.indd 351 19/08/2020 19:02

352
BNY MelloN GloBal FuNds, plc
Notes to the FiNaNcial statemeNts
2. SHARE CAPITAL cont’d.
REDEEMABLE PARTICIPATING SHARES cont’d.
Fund Share Class Currency
Shares in issue
at beginning of financial period
Shares issues during
the financial period
Shares redeemed
during the financial period
Shares in issue
at end of financial period
BNY Mellon U.S. Equity Income Fundclass a (acc) euR 18,406 – (5,000) 13,406
class a (inc)^ euR 5,186 125 (5,311) –class B (inc)^ usd – 5,000 – 5,000
class c (acc)^ usd 5,000 – (5,000) –class c (inc) usd 908,914 – – 908,914
class c (inc)^ euR 5,185 125 (5,310) –class e (acc) euR 437,448 16,838 (13,489) 440,797class e (inc) usd 2,970,285 2,258,236 (114,275) 5,114,246class e (inc) euR 423,310 – (75,000) 348,310
sterling e (acc) GBp 50,068,254 11,580,511 (4,163,367) 57,485,398sterling e (inc) GBp 170,420,572 23,410,674 (35,134,347) 158,696,899
sterling e (inc) (hedged) GBp 1,120,050 698,815 (6,500) 1,812,365class h (inc) (hedged)^ euR 103,704 2,553 (106,257) –
class i (inc) (hedged)^ euR 103,695 2,547 (106,242) –class W (acc) usd 20,696,236 327,477 (12,799) 21,010,914
class W (acc)^ euR – 10,731,922 (849,850) 9,882,072class W (inc) usd 4,755,189 500,064 (5,253) 5,250,000
sterling W (inc) GBp 24,005,169 473,445 (698,247) 23,780,367
BNY Mellon U.S. High Yield Beta Fundclass a (inc) usd 5,297 34,868 (682) 39,483class a (inc) euR 10,784 3,586 (5,465) 8,905
class c (acc) usd 5,000 – – 5,000class c (acc) euR 5,000 – – 5,000
class e (acc) (hedged) euR 6,428,477 14,729,166 (560,200) 20,597,443sterling e (acc) (hedged)^ GBp – 212,536,219 (2,709) 212,533,510
class h (acc) (hedged)^ euR – 100,000 – 100,000class i (acc) (hedged) euR 100,000 – – 100,000class i (inc) (hedged) euR 106,183 6,911 (3,455) 109,639
class K (acc) usd 5,000 47,587 – 52,587class K (acc) (hedged) euR 100,000 – – 100,000
class l (acc) usd 5,000 – – 5,000class l (acc) (hedged) euR 100,000 – – 100,000
sterling l (inc) (hedged) GBp 100,866 6,525 (3,263) 104,128class W (acc) usd 31,964,130 – (18,071,106) 13,893,024
class W (inc) (hedged) euR 106,182 6,909 (3,454) 109,637class X (acc) usd 5,000 – – 5,000
BNY Mellon U.S. Municipal Infrastructure Debt Fund
class c (acc) usd 142,904,417 12,511,171 (49,388,017) 106,027,571class c (inc)^ euR 5,220 208 (5,428) –class e (acc) usd 21,706,258 1,500,000 (700,000) 22,506,258
class e (acc) (hedged) chF 3,370,000 180,000 – 3,550,000class e (acc) (hedged) euR 10,034,788 – (120,000) 9,914,788class e (inc) (hedged) euR 4,971,158 205,284 (102,642) 5,073,800
class h (acc) (hedged) euR 100,943 5,194,095 – 5,295,038class h (inc) (hedged) euR 130,742 14,976 (14,369) 131,349
class i (inc) (hedged) euR 1,304,428 103,185 (1,308,740) 98,873class W (acc) usd 17,368,500 1,432,719 (7,467,719) 11,333,500
03613-1C.indd 352 19/08/2020 19:02

353
BNY MelloN GloBal FuNds, plc
Notes to the FiNaNcial statemeNts
2. SHARE CAPITAL cont’d.
REDEEMABLE PARTICIPATING SHARES cont’d.
Fund Share Class Currency
Shares in issue
at beginning of financial period
Shares issues during
the financial period
Shares redeemed
during the financial period
Shares in issue
at end of financial period
BNY Mellon U.S. Municipal Infrastructure Debt Fund cont’d.class W (acc) (hedged) chF 4,700,000 291,800 – 4,991,800class W (acc) (hedged) euR 3,400,000 50,000 – 3,450,000
class W (inc)^ usd – 450,000 – 450,000class W (inc) (hedged)^ chF – 6,574,781 – 6,574,781
class W (inc) (hedged) euR 90,443,325 10,361,622 – 100,804,947sterling W (acc) (hedged)^ GBp 100,000 – (100,000) –sterling W (inc) (hedged)^ GBp 104,430 4,343 (108,773) –
class X (acc) usd 15,000,000 – – 15,000,000
BNY Mellon U.S. Opportunistic Alpha Fundclass a (acc) usd 5,000 – – 5,000class a (acc) euR 5,000 – – 5,000class c (acc) usd 5,000 – – 5,000class e (acc) usd 5,000 – – 5,000class e (inc) usd 5,000 – – 5,000
class G (acc) usd 5,000 – – 5,000class W (acc) usd 4,979,350 – – 4,979,350
BNY Mellon US Opportunities Fund
class a euR 319,585 257,114 (318,563) 258,136class a (inc) euR 10,527 – (6,949) 3,578
class c usd 20,084,225 – (20,042,033) 42,192class c euR 3,355 1,313,402 (1,311,452) 5,305
class W (acc) usd 9,552,190 – (5,000) 9,547,190
* this Fund launched during the financial period. ** this Fund closed during the financial period. this share class was launched or closed during the financial period.
3. MANAGEMENT AND PERFORMANCE FEES
MANAGEMENT FEESThe Manager is entitled to receive out of the assets of a Fund an annual management fee in respect of each class, accruing daily and payable monthly in arrears at an agreed annual rate as set out in the relevant supplement of the prospectus. The table below outlines the range of annual management fee rates for each share class:
Share Class Rate Share Class Rate Share Class Rate
class a 0.40% - 2.00% class h 0.40% - 2.00% class t 0.20% - 2.00%class B 0.75% - 1.50% class i 0.30% - 1.00% class u 0.20% - 1.75%class c 0.30% - 1.00% class J 1.25% - 1.50% class W 0.20% - 1.00%class d 0.50% - 1.00% class K 0.30% - 1.40% class X Noneclass e 0.10% - 1.50% class l 0.16% class Y Noneclass F 0.10% - 0.45% class R 0.60% - 2.75% class Z 0.40% - 0.65%class G 0.30% - 1.00% class s 0.20% - 2.00%
Management fees accrued to the Manager and the amounts due at the financial period end are included in the “Management Fee” and “Expenses Payable” figures in the Statement of Comprehensive Income and the Statement of Financial Position, respectively.
03613-1C.indd 353 19/08/2020 19:02

354
BNY MelloN GloBal FuNds, plc
Notes to the FiNaNcial statemeNts
3. MANAGEMENT AND PERFORMANCE FEES cont’d.
PERFORMANCE FEESIn addition to the annual management fee, the Manager is entitled to an annual performance fee (the “Performance Fee”) in respect of certain classes of the following Funds, as detailed in the relevant supplement of the prospectus. The table below outlines the performance fee rates and benchmarks of the respective share class:
Fund Benchmark Rate
BNY Mellon Absolute Return Bond Fund 3 month euRiBoR / usd liBoR / GBp liBoR / chF liBoR class d, R, s and t – 10.00%
BNY Mellon Absolute Return Equity Fund 1 month euRiBoR / usd liBoR / GBp liBoR / chF liBoR class d, R, s, t and u – 15.00%
BNY Mellon Absolute Return Global Convertible Fund 1 month euRiBoR / GBp liBoR / usd liBoR / chF liBoR / JpY liBoR class F, R, u and X – 15.00%
BNY Mellon Dynamic U.S. Equity Fund s&p 500 Net total Return index in usd terms class u – 10.00%
BNY Mellon Long-Term Global Equity Fund msci World daily (with net dividends reinvested) in euro/usd terms class s – 15.00%
Performance fees accrued to the Manager and the amounts due at the financial period end are included in the “Performance Fee” and “Performance Fees Payable” figures in the Statement of Comprehensive Income and the Statement of Financial Position, respectively.
4. ADMINISTRATION FEES
The Manager pays to BNY Mellon Fund Services (Ireland) Designated Activity Company (the “Administrator”) out of the assets of each Fund an annual fee which shall accrue daily and be payable monthly in arrears as detailed in the prospectus. The annual fee accrued to the Administrator is attributable to all share classes and represents a deduction from the net asset value of the Fund and, accordingly, each class. Fees accrued to the Administrator and the amounts due at the financial period end are included in the “Operating Expenses” and “Expenses Payable” figures in the Statement of Comprehensive Income and the Statement of Financial Position, respectively.
5. DEPOSITARY FEES
The Company pays to the Depositary out of the assets of each Fund an annual fee which shall accrue daily and be payable monthly in arrears as detailed in the prospectus. The annual fee accrued to the Depositary is attributable to all share classes and represents a deduction from the net asset value of the Fund and, accordingly, each class. Fees accrued to the Depositary and the amounts due at the financial period end are included in the “Depositary Fee” and “Expenses Payable” figures in the Statement of Comprehensive Income and the Statement of Financial Position, respectively.
6. REBATE FROM MANAGER
In order to maintain the Total Expense Ratios (“TER”) of particular Funds at a competitive level with regard to the comparable funds in the market place, BNY Mellon Investment Management EMEA Limited and BNY Mellon Fund Management (Luxembourg) S.A. (the “Distributors”) undertook to pay, via the Manager, a sum equivalent to the percentage amount, if any, the TER of the following Funds exceeds an agreed TER limit, effectively structured as an Annual Management Charge (“AMC”) plus a cap arrangement:
Fund Agreed TER Limit
BNY Mellon Absolute Return Global Convertible Fund (capped from launch date of 31 May 2019) teR limit of amc plus 15 basis pointsBNY Mellon Asia Rising Stars Fund teR limit of amc plus 50 basis pointsBNY Mellon Asian Income Fund teR limit of amc plus 9 basis pointsBNY Mellon Dynamic Total Return Fund teR limit of amc plus 22 basis points1
BNY Mellon Digital Assets Fund (capped from launch date of 19 February 2019) teR limit of amc plus 13 basis pointsBNY Mellon Dynamic U.S. Equity Fund teR limit of amc plus 10 basis points2
03613-1C.indd 354 19/08/2020 19:02

355
BNY MelloN GloBal FuNds, plc
Notes to the FiNaNcial statemeNts
6. REBATE FROM MANAGER cont’d.
Fund Agreed TER Limit
BNY Mellon Efficient Global IG Corporate Beta Fund (capped from launch date of 10 March 2020) teR limit of amc plus 10 basis pointsBNY Mellon Efficient U.S. High Yield Beta Fund teR limit of amc plus 9.5 basis points9
BNY Mellon Emerging Markets Debt Total Return Fund teR limit of amc plus 17 basis points3
BNY Mellon Global Credit Fund4
BNY Mellon Global Emerging Markets Fund teR limit of amc plus 30 basis pointsBNY Mellon Global Infrastructure Income Fund teR limit of amc plus 13 basis pointsBNY Mellon Global Leaders Fund teR limit of amc plus 15 basis pointsBNY Mellon Global Multi-Asset Income Fund teR limit of amc plus 12 basis pointsBNY Mellon Global Opportunistic Bond Fund (capped until closure date of 7 March 2019) teR limit of amc plus 20 basis points5
BNY Mellon Global Short-Dated High Yield Bond Fund teR limit of amc plus 6 basis points6
BNY Mellon Global Unconstrained Fund teR limit of amc plus 15 basis points7
BNY Mellon Japan All Cap Equity Fund (capped until closure date of 15 February 2019) teR limit of amc plus 17 basis pointsBNY Mellon Japan Small Cap Equity Focus Fund teR limit of amc plus 17 basis pointsBNY Mellon Mobility Innovation Fund teR limit of amc plus 13 basis pointsBNY Mellon S&P 500® Index Tracker (capped from 24 June 2020) teR limit of amc plus 10 basis pointsBNY Mellon Sustainable Global Dynamic Bond Fund (capped from launch date of 25 February 2019) teR limit of amc plus 13 basis points8
BNY Mellon Sustainable Global Real Return Fund (EUR) (capped from launch date of 6 February 2020) teR limit of amc plus 10 basis pointsBNY Mellon U.S. Equity Income Fund teR limit of amc plus 15 basis pointsBNY Mellon U.S. Municipal Infrastructure Debt Fund teR limit of amc plus 15 basis pointsBNY Mellon U.S. Opportunistic Alpha Fund (capped until closure date of 27 September 2019) teR limit of amc plus 13 basis points10
BNY Mellon US Opportunities Fund (capped until closure date of 29 August 2019) teR limit of amc plus 16 basis points
1 With exception for usd X (acc) and usd X (inc) share classes subject to teR limit of amc plus 17 basis points. 2 With exception for usd X (acc) closed share class subject to teR limit of amc plus 6 basis points. 3 With exception for usd X (acc) share class subject to teR limit of amc plus 13 basis points. 4 cad X (acc) (hedged) and sterling X (acc) (hedge) share classes subject to teR limit of 10 basis points and usd X (acc) share class subject to teR limit of amc plus 7 basis points. 5 With exception for usd X share class subject to teR limit of amc plus 15 basis points. 6 applicable to sterling Y (acc) (hedged) and usd Y (acc) share classes. 7 applicable to cad X (acc) (hedged) share class. 8 With exception of euR u (acc) share class subject to teR limit of amc plus 5 basis points. 9 With exception for usd l (acc), euR l (acc) (hedged), sterling l (inc) (hedged) and usd X (acc) share classes subject to teR limit of amc plus 5.8 basis points. 10 applicable to usd a (acc), euR a (acc), usd c (acc), usd G (acc) and usd W (acc) share classes.
The amount rebated to the Company during the financial period ended 30 June 2020 was USD 410,168 (30 June 2019: USD 272,051).
7. OPERATING EXPENSES
The operating expenses in the Statement of Comprehensive Income comprise of the following:
30 June 2020 30 June 2019Expense USD USD
administration fee 4,527,622 4,384,263audit fee* 218,774 236,218directors’ fee 39,936 45,883other expenses 1,923,299 2,272,379
Total operating expenses 6,709,631 6,938,743
* the audit fee is in respect of the fee payable to the statutory auditors, eY, in respect of the statutory audit of the financial statements.
8. CASH AND CASH EQUIVALENTS
Cash held by the Company is deposited with The Bank of New York Mellon SA/NV, Dublin Branch and held by counterparties (Bank of America Merrill Lynch, Barclays Bank PLC, BNP Paribas, Canadian Imperial Bank of Commerce, Citigroup Global
03613-1C.indd 355 19/08/2020 19:02

356
BNY MelloN GloBal FuNds, plc
Notes to the FiNaNcial statemeNts
8. CASH AND CASH EQUIVALENTS cont’d.
Markets Limited, Credit Suisse AG, Goldman Sachs, HSBC Bank plc, JPMorgan Chase Bank, Lloyds Bank plc, Morgan Stanley, Royal Bank of Canada, Royal Bank of Scotland, State Street Bank, Toronto Dominion Bank and UBS AG) in respect of collateral and margin requirements. Cash balances include cash invested into short-term investment vehicles daily.
Cash account arrangements have been put in place in respect of the Funds as a consequence of the introduction of the new requirements relating to the subscription and redemption collection accounts pursuant to the Central Bank of Ireland (Supervision and Enforcement) Act 2013 (Section 48(i)) Investor Money Regulations 2015 for Fund Service Providers (“Investor Money Regulations”).
These cash accounts, held with The Bank of New York Mellon SA/NV, London Branch (the “Global Sub-Custodian”) for collection of subscriptions and payment of redemptions and distributions for the Funds, are deemed assets of the Funds. The balances on these cash accounts as at 30 June 2020 and 31 December 2019 are deemed immaterial in respect of the relevant Fund to which they are due, with exception for EUR 49,455 held on BNY Mellon Absolute Insight Fund (closed on 1 December 2017), USD 145,282 held on BNY Mellon Asian Equity Fund and EUR 22,226 held on BNY Mellon Pan European Fund (closed on 9 March 2017), as at 30 June 2020. The cash balance on BNY Mellon Asian Equity Fund has been adjusted in “cash and cash equivalents” in the Statement of Financial Position as at 30 June 2020.
9. TAXATION
Under current law and practice, the Company qualifies as an investment undertaking as defined in Section 739B of the Tax Consolidation Acts, 1997, as amended. On that basis, it is not chargeable to Irish tax on its income and gains.
However, Irish tax may arise on the happening of a “chargeable event”. A chargeable event includes any distribution payments to shareholders or any encashment, redemption, cancellation or transfer of shares and the holding of shares at the end of each eight year period beginning with the acquisition of the shares.
No Irish tax will arise on the Company in respect of chargeable events in respect of:
(a) a shareholder who is neither Irish resident nor ordinarily resident in Ireland for tax purposes at the time of the chargeable event, provided appropriate valid declarations in accordance with the provisions of the Taxes Consolidation Act, 1997, as amended, are held by the Company; or the Company has been authorised by the Irish Revenue to make gross payments in the absence of appropriate declarations; and
(b) certain exempted Irish resident investors who have provided the Company with the necessary signed statutory declarations.
Distributions, interest and capital gains (if any) received on investments made by the Company may be subject to withholding taxes imposed by the country from which the investment income/gains are received and such taxes may not be recoverable by the Company or its shareholders.
Certain Funds accrue for Brazilian and Indian capital gains tax on net realised and unrealised gains on investments. As at 30 June 2020, a capital gains tax payable of USD 2,360,662 for BNY Mellon Brazil Equity Fund (31 December 2019: USD 5,339,693) has been recorded in the Statement of Financial Position; an assessment for capital gains tax recoverable of USD 44,734 for BNY Mellon Global Emerging Markets Fund has been recorded and incorporated within “Other receivables” in the Statement of Financial Position as at 31 December 2019.
10. RELATED PARTIES
In the opinion of the Directors, the Manager, and the Investment Managers, Mellon Investments Corporation, Newton Investment Management Limited, Walter Scott & Partners Limited, ARX Investimentos Ltda, Insight Investment Management (Global) Limited, Alcentra NY, LLC, BNY Mellon Asset Management Japan Limited, Alcentra Limited; the
03613-1C.indd 356 19/08/2020 19:02

357
BNY MelloN GloBal FuNds, plc
Notes to the FiNaNcial statemeNts
10. RELATED PARTIES cont’d.
Sub-Investment Managers, Insight North America LLC and Maybank Asset Management Singapore Pte. LTD, and the Distributors are considered as related parties of the Company.
The Manager pays out of the fee received by it, the fees of the Investment Managers and the Distributors at an annual rate agreed between the parties. Fees paid in respect of all other material related party transactions during the financial period are fully disclosed in the Statement of Comprehensive Income and in Note 3 Management and Performance Fees, Note 4 Administration Fees, Note 5 Depositary Fees, Note 6 Rebate from Manager and Note 7 Operating Expenses of the financial statements.
The Directors are related parties of the Company.
The following Directors of the Company also serve as Directors to BNY Mellon Fund Management (Luxembourg) S.A. (the Manager):
• GregBrisk• DavidDillon(Resigned 30 June 2020) • GeraldRehn
Greg Brisk and Gerald Rehn are also Directors of BNY Mellon Investment Management EMEA Limited.
Greg Brisk and Gerald Rehn have waived their right to receive a fee for their services as Directors. Directors’ fees incurred during the financial period are disclosed in Note 7 of the financial statements.
Greg Brisk is also a Director of the following Investment Managers for the Funds:
• AlcentraLimited;• Alcentra NY,LLC;• NewtonInvestmentManagementLimited;• InsightInvestmentManagement(Global)Limited;• MellonInvestmentsCorporation(Resigned 31 December 2019); and• InsightNorthAmerica LLC
Greg Brisk is also a Director of BNY Mellon Investment Management Seed Capital Limited, a related entity of the Company. This entity held a material beneficial interest in the share classes of the Funds listed below as at 30 June 2020 and 31 December 2019.
Investor Name FundBase
Currency30 June
202031 December
2019
BNY Mellon Investment Management Seed Capital Limited BNY mellon absolute Return Global convertible Fund euR 20,489,040 20,403,141BNY mellon digital asset Fund usd 5,777,947 5,672,586BNY mellon dynamic total Return Fund usd 149,134 159,062BNY mellon efficient Global iG corporate Beta Fund* usd 249,661 N/aBNY mellon efficient u.s. high Yield Beta Fund usd 844,775 754,537BNY mellon emerging markets debt total Return Fund usd – 130,273BNY mellon Global emerging markets Fund usd 32,723 120,234BNY mellon Global infrastructure income Fund usd 274,590 5,111,366BNY mellon Global leaders Fund usd 37,981,656 38,299,555BNY mellon Global multi-asset income Fund euR 10,405,833 11,683,801BNY mellon Japan small cap equity Focus Fund JpY 45,370,297 51,530,721BNY mellon mobility innovation Fund usd 346,174 13,115,325BNY mellon sustainable Global Real Return Fund (euR)* euR 14,697,283 N/aBNY mellon u.s. municipal infrastructure debt Fund usd 128,642 126,007
* please refer to Note 18 of the financial statements.
03613-1C.indd 357 19/08/2020 19:02
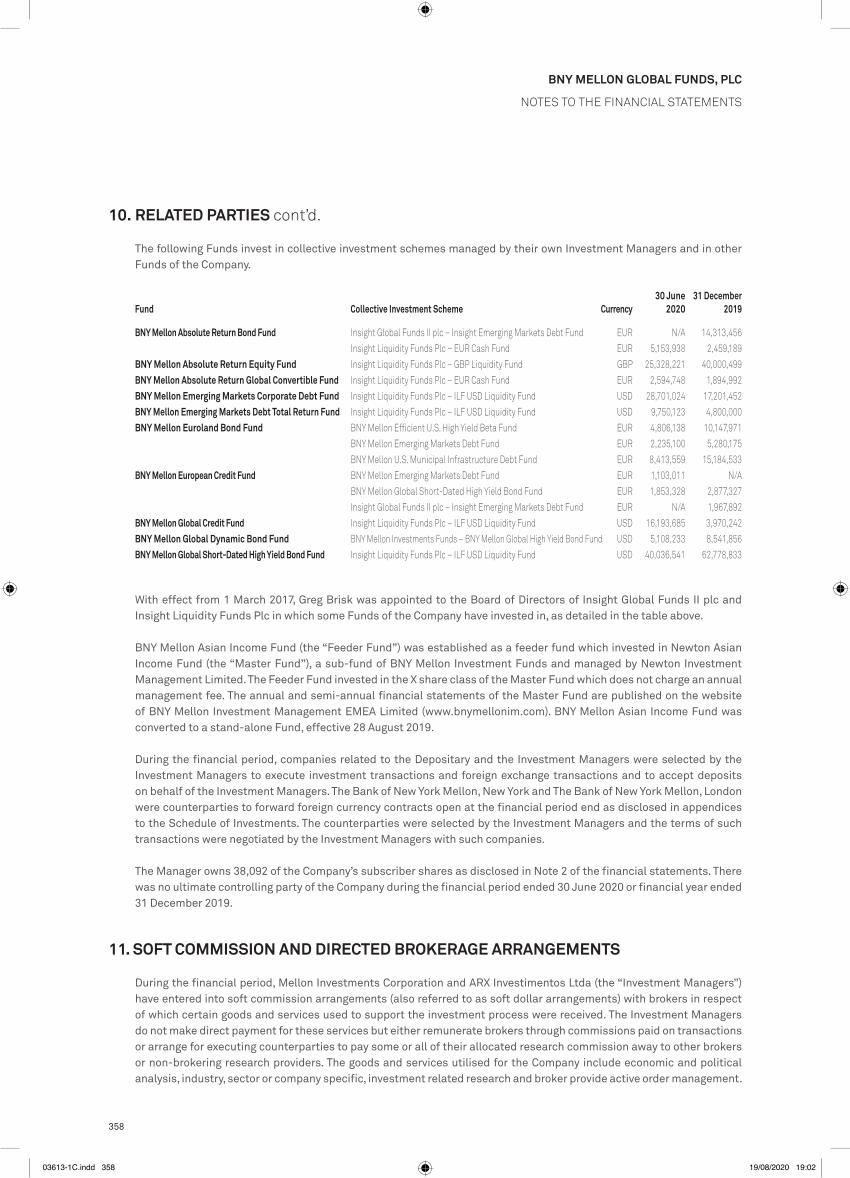
358
BNY MelloN GloBal FuNds, plc
Notes to the FiNaNcial statemeNts
10. RELATED PARTIES cont’d.
The following Funds invest in collective investment schemes managed by their own Investment Managers and in other Funds of the Company.
Fund Collective Investment Scheme Currency30 June
202031 December
2019
BNY Mellon Absolute Return Bond Fund insight Global Funds ii plc – insight emerging markets debt Fund euR N/a 14,313,456insight liquidity Funds plc – euR cash Fund euR 5,153,938 2,459,189
BNY Mellon Absolute Return Equity Fund insight liquidity Funds plc – GBp liquidity Fund GBp 25,328,221 40,000,499BNY Mellon Absolute Return Global Convertible Fund insight liquidity Funds plc – euR cash Fund euR 2,594,748 1,894,992BNY Mellon Emerging Markets Corporate Debt Fund insight liquidity Funds plc – ilF usd liquidity Fund usd 28,701,024 17,201,452BNY Mellon Emerging Markets Debt Total Return Fund insight liquidity Funds plc – ilF usd liquidity Fund usd 9,750,123 4,800,000BNY Mellon Euroland Bond Fund BNY mellon efficient u.s. high Yield Beta Fund euR 4,806,138 10,147,971
BNY mellon emerging markets debt Fund euR 2,235,100 5,280,175BNY mellon u.s. municipal infrastructure debt Fund euR 8,413,559 15,184,533
BNY Mellon European Credit Fund BNY mellon emerging markets debt Fund euR 1,103,011 N/aBNY mellon Global short-dated high Yield Bond Fund euR 1,853,328 2,877,327insight Global Funds ii plc – insight emerging markets debt Fund euR N/a 1,967,892
BNY Mellon Global Credit Fund insight liquidity Funds plc – ilF usd liquidity Fund usd 16,193,685 3,970,242BNY Mellon Global Dynamic Bond Fund BNY mellon investments Funds – BNY mellon Global high Yield Bond Fund usd 5,108,233 8,541,856BNY Mellon Global Short-Dated High Yield Bond Fund insight liquidity Funds plc – ilF usd liquidity Fund usd 40,036,541 62,778,833
With effect from 1 March 2017, Greg Brisk was appointed to the Board of Directors of Insight Global Funds II plc and Insight Liquidity Funds Plc in which some Funds of the Company have invested in, as detailed in the table above.
BNY Mellon Asian Income Fund (the “Feeder Fund”) was established as a feeder fund which invested in Newton Asian Income Fund (the “Master Fund”), a sub-fund of BNY Mellon Investment Funds and managed by Newton Investment Management Limited. The Feeder Fund invested in the X share class of the Master Fund which does not charge an annual management fee. The annual and semi-annual financial statements of the Master Fund are published on the website of BNY Mellon Investment Management EMEA Limited (www.bnymellonim.com). BNY Mellon Asian Income Fund was converted to a stand-alone Fund, effective 28 August 2019.
During the financial period, companies related to the Depositary and the Investment Managers were selected by the Investment Managers to execute investment transactions and foreign exchange transactions and to accept deposits on behalf of the Investment Managers. The Bank of New York Mellon, New York and The Bank of New York Mellon, London were counterparties to forward foreign currency contracts open at the financial period end as disclosed in appendices to the Schedule of Investments. The counterparties were selected by the Investment Managers and the terms of such transactions were negotiated by the Investment Managers with such companies.
The Manager owns 38,092 of the Company’s subscriber shares as disclosed in Note 2 of the financial statements. There was no ultimate controlling party of the Company during the financial period ended 30 June 2020 or financial year ended 31 December 2019.
11. SOFT COMMISSION AND DIRECTED BROKERAGE ARRANGEMENTS
During the financial period, Mellon Investments Corporation and ARX Investimentos Ltda (the “Investment Managers”) have entered into soft commission arrangements (also referred to as soft dollar arrangements) with brokers in respect of which certain goods and services used to support the investment process were received. The Investment Managers do not make direct payment for these services but either remunerate brokers through commissions paid on transactions or arrange for executing counterparties to pay some or all of their allocated research commission away to other brokers or non-brokering research providers. The goods and services utilised for the Company include economic and political analysis, industry, sector or company specific, investment related research and broker provide active order management.
03613-1C.indd 358 19/08/2020 19:02

359
BNY MelloN GloBal FuNds, plc
Notes to the FiNaNcial statemeNts
11. SOFT COMMISSION AND DIRECTED BROKERAGE ARRANGEMENTS cont’d.
The Investment Managers consider these arrangements to be of benefit to its clients and the brokerage rates are not in excess of customary institutional full service brokerage rates.
12. EXCHANGE RATES
The financial statements are prepared in US dollar. The following exchange rates have been used to translate assets and liabilities in other currencies to US dollar:
Currency 30 June 2020 31 December 2019
argentinian peso 70.4576 59.8718australian dollar 1.4491 1.4250Brazilian real 5.4381 4.0227canadian dollar 1.3576 1.2986chilean peso 821.4000 751.9500chinese yuan 7.0707 6.9615chinese yuan renminbi 7.0741 –colombian peso 3,758.0000 3,287.2300czech koruna 23.7232 22.6701danish krone 6.6325 6.6619dominican peso 58.4750 53.3600egyptian pound 16.1400 16.0500euro 0.8901 0.8915hong Kong dollar 7.7505 7.7923hungarian forint 315.1848 295.0567indian rupee 75.5038 71.3782indonesian rupiah 14,285.0000 13,882.5000israeli shekel 3.4640 3.4533Japanese yen 107.9750 108.6550Kazakhstani tenge 405.7300 382.9250Korean won 1,202.8500 1,156.4500malaysian ringgit 4.2850 4.0905mexican peso 22.9845 18.9075New Zealand dollar 1.5497 1.4854Nigerian naira – 362.9200Norwegian krone 9.6253 8.7793peruvian nuevo sol 3.5416 3.3130philippine peso 49.8250 50.6450polish zloty 3.9563 3.7939Romanian leu 4.3047 4.2686Russian rouble 71.1675 62.0663singapore dollar 1.3936 1.3450south african rand 17.3525 14.0060sri lankan rupee 186.2000 181.3750sterling 0.8070 0.7549swedish krona 9.3182 9.3664swiss franc 0.9475 0.9678taiwanese dollar 29.5045 29.9770thai baht 30.9075 29.9538turkish lira 6.8535 5.9490ukrainian hryvnia 26.6950 –uruguayan peso 42.2000 37.4250
03613-1C.indd 359 19/08/2020 19:02

360
BNY MelloN GloBal FuNds, plc
Notes to the FiNaNcial statemeNts
12. EXCHANGE RATES cont’d.
In respect of the aggregation of the Funds’ financial statements, the following exchange rates against the US dollar were used in the preparation of the accounts:
Closing Rate Average Rate30 June 2020 31 December 2019 30 June 2020 30 June 2019
euro 0.8901 0.8915 0.9077 0.8854Japanese yen 107.9750 108.6550 108.2854 110.0632sterling 0.8070 0.7549 0.7941 0.7729
13. EFFICIENT PORTFOLIO MANAGEMENT
The Company and each Fund may invest in Financial Derivative Instruments (“FDIs”) for investment purposes where specified in the relevant supplement to the prospectus. In addition, each Fund may utilise techniques and instruments for efficient portfolio management purposes or to protect against foreign exchange rate risks, subject to the conditions and within the limits laid down by the Central Bank.
Such techniques and instruments include, but are not limited to, futures, options, swaps, warrants, P-Notes, stock lending arrangements, repurchase/reverse repurchase agreements, forward foreign currency contracts and when issued and/or delayed delivery securities.
Efficient portfolio management transactions relating to the assets of a Fund may be entered into with one of the following aims: a reduction of risk, a reduction of cost with no increase or a minimal increase in risk or generation of additional capital or income with no, or an acceptably low level of risk (relative to the expected return). The Company currently invests in futures, options, swaps, forward foreign currency contracts and P-Notes, as evidenced in the relevant Schedule of Investments. Details of all open transactions at the financial period end are disclosed in the Schedule of Investments.
The Company has entered into a securities lending agreement (as amended, assigned, novated and assumed) with The Bank of New York Mellon, London Branch and the Depositary. The securities lending income is currently split between the Company and The Bank of New York Mellon, London Branch in the proportion 80%:20%.
Securities lending transactions and the related collateral are settled and cleared in accordance with the tri-party and bilateral agreements.
The Company earned revenue from securities lending during the financial period ended 30 June 2020, as detailed in the table below:
FundBase
CurrencyGross
Earnings
Direct Costs (Paid to The Bank
of New York Mellon SA/NV)
(20%)
Net Earnings to Company
(80%)^
BNY Mellon Absolute Return Bond Fund euR 16,444 (3,289) 13,155BNY Mellon Absolute Return Equity Fund GBp 11,013 (2,202) 8,811BNY Mellon Asia Rising Stars Fund usd 8,587 (1,717) 6,870BNY Mellon Asian Equity Fund usd 10,761 (2,152) 8,609BNY Mellon Dynamic Total Return Fund usd 129 (26) 103BNY Mellon Dynamic U.S. Equity Fund usd 5,195 (1,039) 4,156BNY Mellon Efficient U.S. High Yield Beta Fund usd 59,905 (11,981) 47,924BNY Mellon Emerging Markets Corporate Debt Fund usd 49,304 (9,860) 39,444BNY Mellon Emerging Markets Debt Fund usd 2,285 (457) 1,828BNY Mellon Emerging Markets Debt Local Currency Fund usd 3,621 (724) 2,897BNY Mellon Emerging Markets Debt Opportunistic Fund usd 1,208 (242) 966
03613-1C.indd 360 19/08/2020 19:02

361
BNY MelloN GloBal FuNds, plc
Notes to the FiNaNcial statemeNts
13. EFFICIENT PORTFOLIO MANAGEMENT cont’d.
FundBase
CurrencyGross
Earnings
Direct Costs (Paid to The Bank
of New York Mellon SA/NV)
(20%)
Net Earnings to Company
(80%)^
BNY Mellon Emerging Markets Debt Total Return Fund usd 5,186 (1,037) 4,149BNY Mellon Euroland Bond Fund euR 69,370 (13,874) 55,496BNY Mellon European Credit Fund euR 3,655 (731) 2,924BNY Mellon Global Bond Fund usd 70,516 (14,103) 56,413BNY Mellon Global Credit Fund usd 23,778 (4,756) 19,022BNY Mellon Global Dynamic Bond Fund usd 66,003 (13,200) 52,803BNY Mellon Global Emerging Markets Fund usd 2,070 (414) 1,656BNY Mellon Global Equity Fund usd 36,018 (7,203) 28,815BNY Mellon Global Equity Income Fund usd 191,165 (38,233) 152,932BNY Mellon Global High Yield Bond Fund usd 9,756 (1,952) 7,804BNY Mellon Global Leaders Fund usd 4,276 (855) 3,421BNY Mellon Global Opportunities Fund usd 4,451 (890) 3,561BNY Mellon Global Real Return Fund (EUR) euR 337,427 (67,486) 269,941BNY Mellon Global Real Return Fund (GBP) GBp 3,475 (695) 2,780BNY Mellon Global Real Return Fund (USD) usd 14,462 (2,892) 11,570BNY Mellon Global Short-Dated High Yield Bond Fund usd 192,380 (38,476) 153,904BNY Mellon Global Unconstrained Fund usd 1,515 (303) 1,212BNY Mellon Japan Small Cap Equity Focus Fund JpY 37,571,831 (7,514,366) 30,057,465BNY Mellon Long-Term Global Equity Fund euR 141,155 (28,231) 112,924BNY Mellon S&P 500® Index Tracker usd 1,280 (256) 1,024BNY Mellon Small Cap Euroland Fund euR 36,714 (7,342) 29,372BNY Mellon U.S. Dynamic Value Fund usd 942 (189) 753BNY Mellon U.S. Equity Income Fund usd 3,657 (731) 2,926
^ disclose as “securities lending income” on the statement of comprehensive income.
The Company earned revenue from securities lending during the financial period ended 30 June 2019, as detailed in the table below:
FundBase
CurrencyGross
Earnings
Direct Costs (Paid to The Bank
of New York Mellon SA/NV)
(20%)
Net Earnings to Company
(80%)^
BNY Mellon Absolute Return Bond Fund euR 69,553 (13,911) 55,642BNY Mellon Absolute Return Equity Fund GBp 33,858 (6,772) 27,086BNY Mellon Asia Rising Stars Fund usd 4,237 (847) 3,390BNY Mellon Asian Equity Fund usd 477 (95) 382BNY Mellon Dynamic Total Return Fund usd 465 (93) 372BNY Mellon Dynamic U.S. Equity Fund usd 5,544 (1,109) 4,435BNY Mellon Emerging Markets Corporate Debt Fund usd 43,147 (8,629) 34,518BNY Mellon Emerging Markets Debt Fund usd 4,919 (984) 3,935BNY Mellon Emerging Markets Debt Local Currency Fund usd 24,615 (4,923) 19,692BNY Mellon Emerging Markets Debt Opportunistic Fund usd 3,548 (710) 2,838BNY Mellon Emerging Markets Debt Total Return Fund usd 6,624 (1,325) 5,299BNY Mellon Euroland Bond Fund euR 66,781 (13,356) 53,425BNY Mellon European Credit Fund euR 756 (151) 605BNY Mellon Global Bond Fund usd 47,455 (9,491) 37,964BNY Mellon Global Credit Fund usd 18,370 (3,674) 14,696BNY Mellon Global Dynamic Bond Fund usd 26,110 (5,222) 20,888
03613-1C.indd 361 19/08/2020 19:02
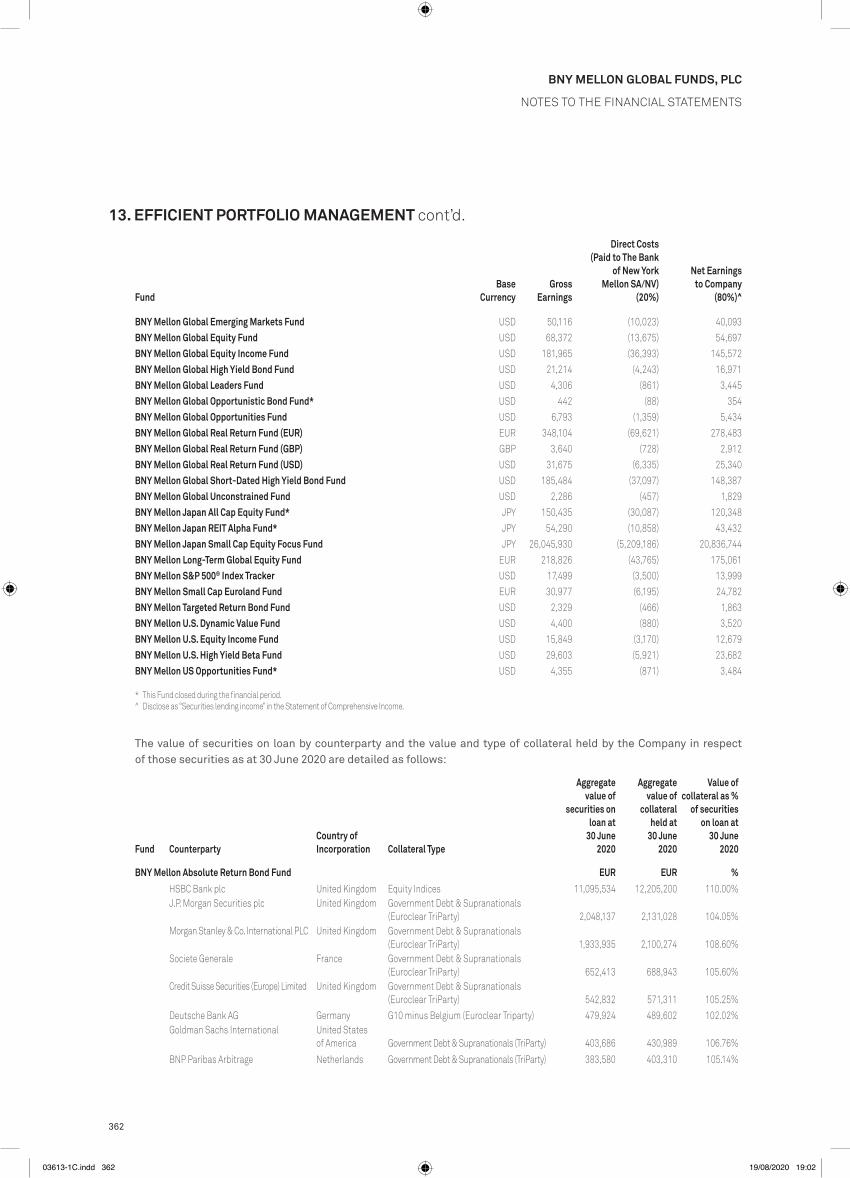
362
BNY MelloN GloBal FuNds, plc
Notes to the FiNaNcial statemeNts
13. EFFICIENT PORTFOLIO MANAGEMENT cont’d.
FundBase
CurrencyGross
Earnings
Direct Costs (Paid to The Bank
of New York Mellon SA/NV)
(20%)
Net Earnings to Company
(80%)^
BNY Mellon Global Emerging Markets Fund usd 50,116 (10,023) 40,093BNY Mellon Global Equity Fund usd 68,372 (13,675) 54,697BNY Mellon Global Equity Income Fund usd 181,965 (36,393) 145,572BNY Mellon Global High Yield Bond Fund usd 21,214 (4,243) 16,971BNY Mellon Global Leaders Fund usd 4,306 (861) 3,445BNY Mellon Global Opportunistic Bond Fund* usd 442 (88) 354BNY Mellon Global Opportunities Fund usd 6,793 (1,359) 5,434BNY Mellon Global Real Return Fund (EUR) euR 348,104 (69,621) 278,483BNY Mellon Global Real Return Fund (GBP) GBp 3,640 (728) 2,912BNY Mellon Global Real Return Fund (USD) usd 31,675 (6,335) 25,340BNY Mellon Global Short-Dated High Yield Bond Fund usd 185,484 (37,097) 148,387BNY Mellon Global Unconstrained Fund usd 2,286 (457) 1,829BNY Mellon Japan All Cap Equity Fund* JpY 150,435 (30,087) 120,348BNY Mellon Japan REIT Alpha Fund* JpY 54,290 (10,858) 43,432BNY Mellon Japan Small Cap Equity Focus Fund JpY 26,045,930 (5,209,186) 20,836,744BNY Mellon Long-Term Global Equity Fund euR 218,826 (43,765) 175,061BNY Mellon S&P 500® Index Tracker usd 17,499 (3,500) 13,999BNY Mellon Small Cap Euroland Fund euR 30,977 (6,195) 24,782BNY Mellon Targeted Return Bond Fund usd 2,329 (466) 1,863BNY Mellon U.S. Dynamic Value Fund usd 4,400 (880) 3,520BNY Mellon U.S. Equity Income Fund usd 15,849 (3,170) 12,679BNY Mellon U.S. High Yield Beta Fund usd 29,603 (5,921) 23,682BNY Mellon US Opportunities Fund* usd 4,355 (871) 3,484
* this Fund closed during the financial period.^ disclose as “securities lending income” in the statement of comprehensive income.
The value of securities on loan by counterparty and the value and type of collateral held by the Company in respect of those securities as at 30 June 2020 are detailed as follows:
Fund CounterpartyCountry of Incorporation Collateral Type
Aggregate value of
securities on loan at
30 June 2020
Aggregate value of
collateral held at
30 June 2020
Value of collateral as %
of securities on loan at
30 June 2020
BNY Mellon Absolute Return Bond Fund EUR EUR %hsBc Bank plc united Kingdom equity indices 11,095,534 12,205,200 110.00%J.p. morgan securities plc united Kingdom Government debt & supranationals
(euroclear triparty) 2,048,137 2,131,028 104.05%morgan stanley & co. international plc united Kingdom Government debt & supranationals
(euroclear triparty) 1,933,935 2,100,274 108.60%societe Generale France Government debt & supranationals
(euroclear triparty) 652,413 688,943 105.60%credit suisse securities (europe) limited united Kingdom Government debt & supranationals
(euroclear triparty) 542,832 571,311 105.25%deutsche Bank aG Germany G10 minus Belgium (euroclear triparty) 479,924 489,602 102.02%Goldman sachs international united states
of america Government debt & supranationals (triparty) 403,686 430,989 106.76%
BNp paribas arbitrage Netherlands Government debt & supranationals (triparty) 383,580 403,310 105.14%
03613-1C.indd 362 19/08/2020 19:02

363
BNY MelloN GloBal FuNds, plc
Notes to the FiNaNcial statemeNts
13. EFFICIENT PORTFOLIO MANAGEMENT cont’d.
Fund CounterpartyCountry of Incorporation Collateral Type
Aggregate value of
securities on loan at
30 June 2020
Aggregate value of
collateral held at
30 June 2020
Value of collateral as %
of securities on loan at
30 June 2020
BNY Mellon Absolute Return Bond Fund cont’d. EUR EUR %deutsche Bank securities inc united states
of america u.s. Government debt (Bilateral) 380,010 393,056 103.43%uBs aG switzerland Government debt & supranationals
(euroclear triparty) 193,761 197,719 102.04%
18,113,812 19,611,432 108.27%
BNY Mellon Absolute Return Equity Fund GBP GBP %citigroup Global markets limited united Kingdom equity indices 19,799,302 21,780,433 110.01%
uK Gilts (euroclear triparty) 5,933,791 6,044,302 101.86%Barclays capital securities ltd. united Kingdom G10 debt (triparty) 314,660 361,810 114.98%uBs aG switzerland G10 debt (triparty) 160,513 184,054 114.67%
equity indices (triparty) 77,090 93,842 121.73%morgan stanley & co. international plc united Kingdom G10 debt (triparty) 9,316 9,862 105.87%merrill lynch international united Kingdom G10 debt (triparty) 443 472 106.18%
26,295,115 28,474,775 108.29%
BNY Mellon Asia Rising Stars Fund USD USD %citigroup Global markets limited united Kingdom G10 debt (triparty) 134,489 141,346 105.10%
equity indices (triparty) 42,566 47,157 110.79%credit suisse securities (europe) limited united Kingdom equity indices (triparty) 30,447 33,604 110.37%J.p. morgan securities plc united Kingdom equity indices (triparty) 14,227 16,022 112.62%macquarie Bank limited australia equity indices (triparty) 12,589 13,915 110.53%uBs aG switzerland equity indices (triparty) 6,666 8,115 121.74%
240,984 260,159 107.96%
BNY Mellon Asian Equity Fund USD USD %uBs aG switzerland equity indices (triparty) 663,937 808,217 121.73%credit suisse securities (europe) limited united Kingdom equity indices (triparty) 49,997 55,181 110.37%
713,934 863,398 120.94%
BNY Mellon Dynamic U.S. Equity Fund USD USD %muFG securities emea plc united Kingdom equity indices (triparty) 4,235,274 4,658,994 110.00%J.p. morgan securities llc united states
of america u.s. Government debt (Bilateral) 2,487,916 2,538,312 102.03%citigroup Global markets limited united Kingdom equity indices (triparty) 1,640,670 1,805,784 110.06%merrill lynch international united Kingdom G10 debt (triparty) 991,539 1,053,154 106.21%credit suisse securities (usa) llc united states
of america u.s. Government debt (Bilateral) 503,358 513,675 102.05%citigroup Global markets inc united Kingdom u.s. Government debt (Bilateral) 35,427 36,666 103.50%J.p. morgan securities plc united Kingdom equity indices (triparty) 1,219 1,362 111.73%
9,895,403 10,607,947 107.20%
03613-1C.indd 363 19/08/2020 19:02

364
BNY MelloN GloBal FuNds, plc
Notes to the FiNaNcial statemeNts
13. EFFICIENT PORTFOLIO MANAGEMENT cont’d.
Fund CounterpartyCountry of Incorporation Collateral Type
Aggregate value of
securities on loan at
30 June 2020
Aggregate value of
collateral held at
30 June 2020
Value of collateral as %
of securities on loan at
30 June 2020
BNY Mellon Efficient U.S. High Yield Beta Fund USD USD %credit suisse securities (usa) llc united states
of america u.s. Government debt (Bilateral) 2,016,947 2,058,285 102.05%BNp paribas France Government debt & supranationals
(euroclear triparty) 210,345 221,294 105.21%J.p. morgan securities llc united states
of america u.s. Government debt (Bilateral) 209,347 213,588 102.03%
2,436,639 2,493,167 102.32%
BNY Mellon Emerging Markets Corporate Debt Fund USD USD %Nomura securities international inc. united states
of america u.s. Government debt (Bilateral) 6,477,629 6,691,199 103.30%credit suisse securities (europe) limited united Kingdom Government debt & supranationals
(euroclear triparty) 4,940,460 5,199,658 105.25%G10 minus Belgium (euroclear triparty) 694,253 730,233 105.18%
Goldman sachs international united states of america Government debt & supranationals (triparty) 5,386,640 5,750,982 106.76%
citigroup Global markets limited united Kingdom Government debt & supranationals (euroclear triparty) 4,909,072 5,166,356 105.24%
Barclays Bank plc united Kingdom Government debt & supranationals (euroclear triparty) 4,015,782 4,245,680 105.72%
morgan stanley & co. international plc united Kingdom Government debt & supranationals (euroclear triparty) 1,723,736 1,899,769 110.21%
BNp paribas France Government debt & supranationals (euroclear triparty) 988,727 1,040,194 105.21%
morgan stanley & co. llc united states of america u.s. Government debt (Bilateral) 734,287 757,997 103.23%
29,870,586 31,482,068 105.39%
BNY Mellon Emerging Markets Debt Fund USD USD %morgan stanley & co. international plc united Kingdom Government debt & supranationals
(euroclear triparty) 677,368 746,543 110.21%Nomura securities international inc. united states
of america u.s. Government debt (Bilateral) 230,935 238,550 103.30%BNp paribas France Government debt & supranationals
(euroclear triparty) 187,161 196,903 105.21%
1,095,464 1,181,996 107.90%
BNY Mellon Emerging Markets Debt Local Currency Fund USD USD %J.p. morgan securities plc united Kingdom G10 minus Belgium (euroclear triparty) 1,098,015 1,215,865 110.73%
1,098,015 1,215,865 110.73%
BNY Mellon Emerging Markets Debt Total Return Fund USD USD %
BNp paribas France G10 minus Belgium (euroclear triparty) 1,090,255 1,144,686 104.99%Government debt & supranationals (euroclear triparty) 1,023,799 1,077,092 105.21%
G10 debt (triparty) 769,195 808,372 105.09%
03613-1C.indd 364 19/08/2020 19:02

365
BNY MelloN GloBal FuNds, plc
Notes to the FiNaNcial statemeNts
13. EFFICIENT PORTFOLIO MANAGEMENT cont’d.
Fund CounterpartyCountry of Incorporation Collateral Type
Aggregate value of
securities on loan at
30 June 2020
Aggregate value of
collateral held at
30 June 2020
Value of collateral as %
of securities on loan at
30 June 2020
BNY Mellon Emerging Markets Debt Total Return Fund cont’d. USD USD %citigroup Global markets limited united Kingdom Government debt & supranationals
(euroclear triparty) 1,325,553 1,395,025 105.24%credit suisse securities (usa) llc united states
of america u.s. Government debt (Bilateral) 375,950 383,655 102.05%credit suisse securities (europe) limited united Kingdom Government debt & supranationals
(euroclear triparty) 320,822 337,654 105.25%
4,905,574 5,146,484 104.91%
BNY Mellon Euroland Bond Fund EUR EUR %merrill lynch international united Kingdom Government debt & supranationals
(euroclear triparty) 13,866,955 14,145,537 102.01%J.p. morgan securities plc united Kingdom Government debt & supranationals
(euroclear triparty) 12,575,539 13,084,490 104.05%Government debt & supranationals (triparty) 315,556 332,947 105.51%
Goldman sachs international united states of america Government debt & supranationals (triparty) 6,225,654 6,646,745 106.76%
Government debt & supranationals (euroclear triparty) 2,587,180 2,639,880 102.04%G10 debt (triparty) 101,195 107,278 106.01%
morgan stanley & co. international plc united Kingdom Government debt & supranationals (euroclear triparty) 8,913,882 9,729,361 109.15%
BNp paribas France Government debt & supranationals (euroclear triparty) 3,834,141 3,911,276 102.01%G10 minus Belgium (euroclear triparty) 1,483,729 1,514,286 102.06%
citigroup Global markets limited united Kingdom G10 debt (euroclear triparty) 3,778,456 3,854,679 102.02%Government debt & supranationals (euroclear triparty) 197,602 201,558 102.00%
Barclays Bank plc united Kingdom u.s. Government debt (Bilateral) 1,860,548 1,920,428 103.22%Government debt & supranationals (euroclear triparty) 1,620,685 1,713,466 105.72%
deutsche Bank aG Germany G10 minus Belgium (euroclear triparty) 3,131,692 3,194,843 102.02%RBc europe limited united Kingdom G10 minus Belgium (euroclear triparty) 1,619,969 1,703,303 105.14%societe Generale France Government debt & supranationals
(euroclear triparty) 742,865 757,740 102.00%the Bank of Nova scotia canada Government debt & supranationals (triparty) 566,490 594,829 105.00%Nomura international plc united Kingdom Government debt & supranationals
(euroclear triparty) 257,151 262,306 102.00%citigroup Global markets inc united Kingdom u.s. Government debt (Bilateral) 36,877 39,920 108.25%
63,716,166 66,354,872 104.14%
BNY Mellon European Credit Fund EUR EUR %deutsche Bank aG Germany G10 minus Belgium (euroclear triparty) 909,563 927,904 102.02%RBc europe limited united Kingdom G10 minus Belgium (euroclear triparty) 428,265 450,295 105.14%BNp paribas France G10 debt (triparty) 201,255 211,505 105.09%credit suisse securities (europe) limited united Kingdom Government debt & supranationals
(euroclear triparty) 99,848 101,942 102.10%
1,638,931 1,691,646 103.22%
03613-1C.indd 365 19/08/2020 19:02

366
BNY MelloN GloBal FuNds, plc
Notes to the FiNaNcial statemeNts
13. EFFICIENT PORTFOLIO MANAGEMENT cont’d.
Fund CounterpartyCountry of Incorporation Collateral Type
Aggregate value of
securities on loan at
30 June 2020
Aggregate value of
collateral held at
30 June 2020
Value of collateral as %
of securities on loan at
30 June 2020
BNY Mellon Global Bond Fund USD USD %hsBc Bank plc united Kingdom equity indices 39,561,922 43,518,513 110.00%citigroup Global markets limited united Kingdom G10 debt (triparty) 9,967,029 10,462,753 104.97%
equity indices 8,905,326 9,796,398 110.01%uBs aG switzerland equity indices 16,295,712 17,926,932 110.01%BNp paribas France Government debt & supranationals
(euroclear triparty) 5,507,773 5,618,579 102.01%Goldman sachs international united states
of americaGovernment debt & supranationals (euroclear triparty) 5,322,750 5,431,171 102.04%
societe Generale France equity/Ftse/s&p/NiKKei 3,024,708 3,327,223 110.00%
88,585,220 96,081,569 108.46%
BNY Mellon Global Credit Fund USD USD %deutsche Bank aG Germany G10 minus Belgium (euroclear triparty) 4,955,703 5,205,997 105.05%citigroup Global markets limited united Kingdom Government debt & supranationals
(euroclear triparty) 1,991,254 2,031,130 102.00%morgan stanley & co. international plc united Kingdom Government debt & supranationals
(euroclear triparty) 1,983,356 2,185,902 110.21%credit suisse securities (europe) limited united Kingdom G10 debt (triparty) 1,159,010 1,219,458 105.22%societe Generale France Government debt & supranationals
(euroclear triparty) 780,118 823,799 105.60%J.p. morgan securities plc united Kingdom Government debt & supranationals
(euroclear triparty) 682,354 709,970 104.05%credit suisse securities (usa) llc united states
of america u.s. Government debt (Bilateral) 21,617 22,060 102.05%
11,573,412 12,198,316 105.40%
BNY Mellon Global Dynamic Bond Fund USD USD %hsBc Bank plc united Kingdom equity indices 14,997,343 16,497,228 110.00%deutsche Bank aG Germany G10 minus Belgium (euroclear triparty) 2,635,032 2,688,168 102.02%
Government debt & supranationals (euroclear triparty) 1,595,369 1,629,213 102.12%
societe Generale France equity/Ftse/s&p/NiKKei 913,940 1,005,348 110.00%citigroup Global markets limited united Kingdom G10 debt (triparty) 760,903 798,748 104.97%Barclays Bank plc united Kingdom Government debt & supranationals
(euroclear triparty) 224,104 236,933 105.72%
21,126,691 22,855,638 108.18%
BNY Mellon Global Emerging Markets Fund USD USD %the Bank of Nova scotia canada equity indices (triparty) 1,055,077 1,163,359 110.26%J.p. morgan securities plc united Kingdom equity indices (triparty) 314,970 354,713 112.62%uBs aG switzerland equity indices (triparty) 214,986 261,705 121.73%
1,585,033 1,779,777 112.29%
03613-1C.indd 366 19/08/2020 19:02

367
BNY MelloN GloBal FuNds, plc
Notes to the FiNaNcial statemeNts
13. EFFICIENT PORTFOLIO MANAGEMENT cont’d.
Fund CounterpartyCountry of Incorporation Collateral Type
Aggregate value of
securities on loan at
30 June 2020
Aggregate value of
collateral held at
30 June 2020
Value of collateral as %
of securities on loan at
30 June 2020
BNY Mellon Global Equity Fund USD USD %citigroup Global markets limited united Kingdom equity indices (triparty) 4,851,026 5,340,418 110.09%
G10 debt (triparty) 2,043,959 2,148,183 105.10%Barclays capital securities ltd. united Kingdom equity indices (triparty) 3,419,629 3,932,817 115.01%societe Generale France equity indices (triparty) 2,881,479 3,178,403 110.30%J.p. morgan securities plc united Kingdom equity indices (triparty) 1,933,865 2,177,884 112.62%uBs aG switzerland equity indices (triparty) 1,324,915 1,612,832 121.73%the Bank of Nova scotia canada equity indices (triparty) 1,032,305 1,138,250 110.26%credit suisse securities (europe) limited united Kingdom equity indices (triparty) 325,979 359,780 110.37%
17,813,157 19,888,567 111.65%
BNY Mellon Global Equity Income Fund USD USD %BNp paribas arbitrage Netherlands equity indices (triparty) 15,741,532 17,345,591 110.19%Barclays Bank plc united Kingdom u.s. Government debt (Bilateral) 7,022,426 7,248,439 103.22%
Government debt & supranationals (triparty) 4,496,546 4,785,021 106.42%
27,260,504 29,379,051 107.77%
BNY Mellon Global High Yield Bond Fund USD USD %Barclays Bank plc united Kingdom u.s. Government debt (Bilateral) 2,396,373 2,473,499 103.22%
Government debt & supranationals (euroclear triparty) 462,154 471,447 102.01%
credit suisse securities (europe) limited united Kingdom Government debt & supranationals (euroclear triparty) 608,262 621,019 102.10%
uBs aG switzerland Government debt & supranationals (euroclear triparty) 557,931 569,326 102.04%
morgan stanley & co. international plc united Kingdom Government debt & supranationals (euroclear triparty) 461,103 508,192 110.21%
citigroup Global markets limited united Kingdom Government debt & supranationals (euroclear triparty) 409,599 431,066 105.24%
societe Generale France Government debt & supranationals (euroclear triparty) 299,425 305,420 102.00%
credit suisse securities (usa) llc united states of america u.s. Government debt (Bilateral) 298,602 304,722 102.05%
5,493,449 5,684,691 103.48%
BNY Mellon Global Leaders Fund USD USD %citigroup Global markets limited united Kingdom equity indices (triparty) 2,277,703 2,506,926 110.06%
2,277,703 2,506,926 110.06%
BNY Mellon Global Opportunities Fund USD USD %Barclays capital securities ltd. united Kingdom equity indices (triparty) 568,973 654,359 115.01%the Bank of Nova scotia canada equity indices (triparty) 174,631 192,554 110.26%citigroup Global markets limited united Kingdom equity indices (triparty) 170,300 188,661 110.78%J.p. morgan securities plc united Kingdom equity indices (triparty) 56,006 63,073 112.62%
969,910 1,098,647 113.27%
03613-1C.indd 367 19/08/2020 19:02

368
BNY MelloN GloBal FuNds, plc
Notes to the FiNaNcial statemeNts
13. EFFICIENT PORTFOLIO MANAGEMENT cont’d.
Fund CounterpartyCountry of Incorporation Collateral Type
Aggregate value of
securities on loan at
30 June 2020
Aggregate value of
collateral held at
30 June 2020
Value of collateral as %
of securities on loan at
30 June 2020
BNY Mellon Global Real Return Fund (EUR) EUR EUR %morgan stanley & co. international plc united Kingdom G10 debt (triparty) 47,918,799 50,727,962 105.86%merrill lynch international united Kingdom G10 debt (triparty) 32,330,951 34,339,998 106.21%citigroup Global markets limited united Kingdom equity indices (triparty) 13,975,958 15,382,467 110.06%BNp paribas arbitrage Netherlands equity indices (triparty) 12,543,960 13,822,187 110.19%Barclays capital securities ltd. united Kingdom equity indices (triparty) 12,358,211 14,212,822 115.01%uBs aG switzerland equity indices (triparty) 5,158,560 6,279,566 121.73%deutsche Bank aG Germany G10 minus Belgium (euroclear triparty) 3,458,420 3,528,159 102.02%credit suisse securities (europe) limited united Kingdom equity indices (triparty) 2,633,534 2,906,610 110.37%
130,378,393 141,199,771 108.30%
BNY Mellon Global Real Return Fund (GBP) GBP GBP %the Bank of Nova scotia canada Government debt & supranationals (triparty) 999,965 1,049,990 105.00%Barclays capital securities ltd. united Kingdom equity indices (triparty) 316,545 364,050 115.01%citigroup Global markets limited united Kingdom equity indices (triparty) 292,080 321,475 110.06%BNp paribas arbitrage Netherlands equity indices (triparty) 290,746 320,373 110.19%credit suisse securities (europe) limited united Kingdom equity indices (triparty) 181,563 200,390 110.37%
2,080,899 2,256,278 108.43%
BNY Mellon Global Real Return Fund (USD) USD USD %citigroup Global markets limited united Kingdom equity indices (triparty) 1,473,978 1,622,315 110.06%BNp paribas arbitrage Netherlands equity indices (triparty) 1,451,076 1,598,941 110.19%credit suisse securities (europe) limited united Kingdom equity indices (triparty) 854,935 943,584 110.37%deutsche Bank aG Germany G10 minus Belgium (euroclear triparty) 369,120 376,564 102.02%
4,149,109 4,541,404 109.45%
BNY Mellon Global Short-Dated High Yield Bond Fund USD USD %credit suisse securities (europe) limited united Kingdom Government debt & supranationals
(euroclear triparty) 12,148,175 12,768,201 105.10%G10 minus Belgium (euroclear triparty) 2,561,792 2,694,556 105.18%
uBs aG switzerland Government debt & supranationals (euroclear triparty) 8,113,464 8,316,141 102.50%Government debt & supranationals (triparty) 1,650,805 1,733,399 105.00%
BNp paribas arbitrage Netherlands Government debt & supranationals (triparty) 7,807,243 8,208,823 105.14%J.p. morgan securities plc united Kingdom Government debt & supranationals
(euroclear triparty) 4,105,711 4,271,875 104.05%societe Generale France Government debt & supranationals
(euroclear triparty) 1,285,256 1,310,991 102.00%morgan stanley & co. international plc united Kingdom Government debt & supranationals
(euroclear triparty) 1,159,681 1,263,042 108.91%BNp paribas France Government debt & supranationals
(euroclear triparty) 481,434 506,495 105.21%G10 debt (triparty) 477,496 501,815 105.09%
the Bank of Nova scotia canada Government debt & supranationals (triparty) 515,135 540,905 105.00%RBc europe limited united Kingdom G10 minus Belgium (euroclear triparty) 317,258 333,578 105.14%
40,623,450 42,449,821 104.50%
03613-1C.indd 368 19/08/2020 19:02

369
BNY MelloN GloBal FuNds, plc
Notes to the FiNaNcial statemeNts
13. EFFICIENT PORTFOLIO MANAGEMENT cont’d.
Fund CounterpartyCountry of Incorporation Collateral Type
Aggregate value of
securities on loan at
30 June 2020
Aggregate value of
collateral held at
30 June 2020
Value of collateral as %
of securities on loan at
30 June 2020
BNY Mellon Global Unconstrained Fund USD USD %BNp paribas France Government debt & supranationals
(euroclear triparty) 357,826 365,025 102.01%societe Generale France equity/Ftse/s&p/NiKKei 304,647 335,116 110.00%J.p. morgan securities llc united states
of america u.s. Government debt (Bilateral) 190,825 194,690 102.03%the Bank of Nova scotia canada equity indices (triparty) 167,099 184,249 110.26%J.p. morgan securities plc united Kingdom equity indices (triparty) 154,980 174,536 112.62%
1,175,377 1,253,616 106.66%
BNY Mellon Japan Small Cap Equity Focus Fund JPY JPY %J.p. morgan securities plc united Kingdom equity indices (triparty) 346,133,514 389,809,186 112.62%uBs aG switzerland equity indices (triparty) 207,722,197 252,862,334 121.73%
G10 debt (triparty) 135,721,336 155,627,283 114.67%societe Generale France equity indices (triparty) 123,417,153 136,134,772 110.30%citigroup Global markets limited united Kingdom equity indices (triparty) 66,133,284 73,266,760 110.79%
G10 debt (triparty) 41,048,856 43,141,951 105.10%merrill lynch international united Kingdom G10 debt (triparty) 87,099,761 92,512,116 106.21%morgan stanley & co. international plc united Kingdom G10 debt (triparty) 63,362,537 67,077,093 105.86%deutsche Bank aG Germany equity indices (triparty) 60,635,305 66,970,954 110.45%macquarie Bank limited australia equity indices (triparty) 46,690,334 51,609,998 110.54%the Bank of Nova scotia canada equity indices (triparty) 6,295,158 6,941,281 110.26%credit suisse securities (europe) limited united Kingdom equity indices (triparty) 1,333,167 1,471,483 110.37%
1,185,592,602 1,337,425,211 112.81%
BNY Mellon Long-Term Global Equity Fund EUR EUR %citigroup Global markets limited united Kingdom equity indices (triparty) 25,755,525 28,347,504 110.06%morgan stanley & co. international plc united Kingdom equity indices (triparty) 5,904,680 6,682,104 113.17%Goldman sachs international united states
of america G10 debt (triparty) 4,220,141 4,473,811 106.01%hsBc Bank plc united Kingdom equity indices (triparty) 3,719,466 4,119,790 110.76%
G10 debt (triparty) 203,365 213,614 105.04%deutsche Bank aG Germany equity indices (triparty) 476,063 525,806 110.45%merrill lynch international united Kingdom G10 debt (triparty) 35,505 37,709 106.21%
40,314,745 44,400,338 110.13%
BNY Mellon S&P 500® Index Tracker USD USD %Barclays Bank plc united Kingdom Government debt & supranationals (triparty) 487,241 518,500 106.42%citigroup Global markets limited united Kingdom equity indices (triparty) 295,123 324,823 110.06%J.p. morgan securities llc united states
of america u.s. Government debt (Bilateral) 217,952 222,367 102.03%credit suisse securities (usa) llc united states
of america u.s. Government debt (Bilateral) 96,030 97,998 102.05%Barclays capital inc united states
of america u.s. Government debt (Bilateral) 66,238 67,578 102.02%uBs aG switzerland equity indices (triparty) 27,483 33,455 121.73%
u.s. Government debt (Bilateral) 1,617 1,734 107.24%
03613-1C.indd 369 19/08/2020 19:02

370
BNY MelloN GloBal FuNds, plc
Notes to the FiNaNcial statemeNts
13. EFFICIENT PORTFOLIO MANAGEMENT cont’d.
Fund CounterpartyCountry of Incorporation Collateral Type
Aggregate value of
securities on loan at
30 June 2020
Aggregate value of
collateral held at
30 June 2020
Value of collateral as %
of securities on loan at
30 June 2020
BNY Mellon S&P 500® Index Tracker cont’d. USD USD %Bofa securities inc. united states
of america u.s. Government debt (Bilateral) 15,200 15,506 102.01%hsBc Bank plc united Kingdom equity indices (triparty) 12,213 13,527 110.76%merrill lynch international united Kingdom G10 debt (triparty) 5,805 6,166 106.22%morgan stanley & co. llc united states
of america u.s. Government debt (Bilateral) 4,607 4,712 102.28%citigroup Global markets inc united Kingdom u.s. Government debt (Bilateral) 2,015 2,086 103.52%
1,231,524 1,308,452 106.25%
BNY Mellon Small Cap Euroland Fund EUR EUR %Goldman sachs international united states
of america G10 debt (triparty) 2,341,964 2,482,738 106.01%equity indices (triparty) 238,011 263,093 110.54%Government debt & supranationals (triparty) 50,401 53,810 106.76%
citigroup Global markets limited united Kingdom equity indices (triparty) 1,295,707 1,426,614 110.10%G10 debt (triparty) 461,979 485,536 105.10%
hsBc Bank plc united Kingdom equity indices (triparty) 1,354,959 1,500,792 110.76%G10 debt (triparty) 164,588 172,883 105.04%
morgan stanley & co. international plc united Kingdom equity indices (triparty) 468,793 530,515 113.17%G10 debt (triparty) 95,529 101,129 105.86%
credit suisse securities (europe) limited united Kingdom equity indices (triparty) 219,355 242,100 110.37%Government debt & supranationals (triparty) 67,413 71,412 105.93%
Barclays capital securities ltd. united Kingdom equity indices (triparty) 111,363 128,075 115.01%G10 debt (triparty) 102,520 117,882 114.98%
the Bank of Nova scotia canada equity indices (triparty) 132,906 146,546 110.26%BNp paribas arbitrage Netherlands equity indices (triparty) 105,658 116,425 110.19%uBs aG switzerland equity indices (triparty) 16,186 19,703 121.73%societe Generale France equity indices (triparty) 13,913 15,347 110.31%merrill lynch international united Kingdom G10 debt (triparty) 13,769 14,622 106.21%
7,255,014 7,889,222 108.74%
BNY Mellon U.S. Dynamic Value Fund USD USD %J.p. morgan securities llc united states
of america u.s. Government debt (Bilateral) 325,343 331,933 102.03%uBs aG switzerland Government debt & supranationals (triparty) 35,079 36,834 105.00%Bofa securities inc. united states
of america u.s. Government debt (Bilateral) 21,745 22,181 102.01%
382,167 390,948 102.30%
03613-1C.indd 370 19/08/2020 19:02

371
BNY MelloN GloBal FuNds, plc
Notes to the FiNaNcial statemeNts
13. EFFICIENT PORTFOLIO MANAGEMENT cont’d.
Fund CounterpartyCountry of Incorporation Collateral Type
Aggregate value of
securities on loan at
30 June 2020
Aggregate value of
collateral held at
30 June 2020
Value of collateral as %
of securities on loan at
30 June 2020
BNY Mellon U.S. Equity Income Fund USD USD %J.p. morgan securities llc united states
of america u.s. Government debt (Bilateral) 3,257,436 3,323,420 102.03%td prime services llc united states
of america u.s. Government debt (Bilateral) 2,648,193 2,701,319 102.01%hsBc Bank plc united Kingdom equity indices (triparty) 235,250 260,570 110.76%credit suisse securities (usa) llc united states
of america u.s. Government debt (Bilateral) 102,907 105,017 102.05%
6,243,786 6,390,326 102.35%
The value of securities on loan by counterparty and the value and type of collateral held by the Company in respect of those securities as at 31 December 2019 are detailed as follows:
Fund CounterpartyCountry of Incorporation Collateral Type
Aggregate value of
securities on loan at
31 December 2019
Aggregate value of
collateral held at
31 December 2019
Value of collateral as %
of securities on loan at
31 December 2019
BNY Mellon Absolute Return Bond Fund EUR EUR %Barclays Bank plc united Kingdom equity/Ftse/s&p/NiKKei 8,519,790 9,371,770 110.00%
G10 minus Belgium (euroclear triparty) 451,459 461,266 102.17%
Government debt & supranationals (euroclear triparty) 207,209 211,359 102.00%
merrill lynch international united Kingdom Government debt & supranationals (triparty) 1,550,404 1,630,987 105.20%Jp morgan securities, plc. united Kingdom Government debt & supranationals
(euroclear triparty) 1,398,658 1,457,965 104.24%morgan stanley & co. international plc united Kingdom Government debt & supranationals
(euroclear triparty) 1,293,724 1,430,837 110.60%Goldman sachs international united Kingdom Government debt & supranationals (triparty) 918,967 1,011,090 110.02%deutsche Bank, aG Germany Government debt & supranationals
(euroclear triparty) 732,126 810,315 110.68%citigroup Global markets limited united Kingdom Government debt & supranationals
(euroclear triparty) 560,621 571,835 102.00%
15,632,958 16,957,424 108.47%
BNY Mellon Absolute Return Equity Fund GBP GBP %deutsche Bank, aG Germany equity indices (triparty) 156,024 177,020 113.46%citigroup Global markets limited united Kingdom G10 debt (triparty) 18,177 19,610 107.89%merrill lynch international united Kingdom G10 debt (triparty) 418 442 105.41%
174,619 197,072 112.86%
03613-1C.indd 371 19/08/2020 19:02

372
BNY MelloN GloBal FuNds, plc
Notes to the FiNaNcial statemeNts
13. EFFICIENT PORTFOLIO MANAGEMENT cont’d.
Fund CounterpartyCountry of Incorporation Collateral Type
Aggregate value of
securities on loan at
31 December 2019
Aggregate value of
collateral held at
31 December 2019
Value of collateral as %
of securities on loan at
31 December 2019
BNY Mellon Asia Rising Stars Fund USD USD %uBs aG switzerland equity indices (triparty) 603,294 691,912 114.69%
G10 debt (triparty) 75,592 80,430 106.40%Jp morgan securities, plc. united Kingdom equity indices (triparty) 479,682 529,952 110.48%macquarie Bank limited australia G10 debt (triparty) 159,611 167,994 105.25%societe Generale France equity indices (triparty) 114,292 132,152 115.63%citigroup Global markets limited united Kingdom equity indices (triparty) 112,456 124,881 111.05%credit suisse securities (europe) limited united Kingdom equity indices (triparty) 29,839 33,787 113.23%
1,574,766 1,761,108 111.83%
BNY Mellon Asian Equity Fund USD USD %Jp morgan securities, plc. united Kingdom equity indices (triparty) 443,507 505,837 114.05%merrill lynch international united Kingdom G10 debt (triparty) 179,193 188,836 105.38%Barclays capital inc. united states
of america u.s. Government debt (Bilateral) 113,514 115,822 102.03%Barclays Bank plc united Kingdom u.s. Government debt (Bilateral) 62,213 63,464 102.01%uBs aG switzerland G10 debt (triparty) 735 782 106.39%
799,162 874,741 109.46%
BNY Mellon Dynamic U.S. Equity Fund USD USD %muFG securities emea plc united Kingdom equity indices (triparty) 1,799,882 1,979,918 110.00%J.p. morgan securities llc united states
of america u.s. Government debt (Bilateral) 1,691,092 1,725,165 102.01%credit suisse securities (usa) llc united states
of america u.s. Government debt (Bilateral) 772,469 788,068 102.02%citigroup Global markets limited united Kingdom equity indices (triparty) 453,721 499,276 110.04%merrill lynch international united Kingdom G10 debt (triparty) 206,175 217,270 105.38%
Government debt & supranationals (triparty) 89,563 94,219 105.20%citigroup Global markets inc. united states
of america u.s. Government debt (Bilateral) 263,846 271,415 102.87%td prime services llc united states
of america u.s. Government debt (Bilateral) 149,730 152,725 102.00%Jp morgan securities, plc. united Kingdom equity indices (triparty) 67,488 76,973 114.05%
5,493,966 5,805,029 105.66%
BNY Mellon Efficient U.S. High Yield Beta Fund USD USD %credit suisse securities (usa) llc united states
of america u.s. Government debt (Bilateral) 3,704,539 3,779,345 102.02%J.p. morgan securities llc united states
of america u.s. Government debt (Bilateral) 3,574,859 3,646,887 102.01%citigroup Global markets inc. united states
of america u.s. Government debt (Bilateral) 1,523,383 1,614,728 106.00%BNp paribas securities corp. united states
of america u.s. Government debt (Bilateral) 858,286 876,489 102.12%
9,661,067 9,917,449 102.65%
03613-1C.indd 372 19/08/2020 19:02

373
BNY MelloN GloBal FuNds, plc
Notes to the FiNaNcial statemeNts
13. EFFICIENT PORTFOLIO MANAGEMENT cont’d.
Fund CounterpartyCountry of Incorporation Collateral Type
Aggregate value of
securities on loan at
31 December 2019
Aggregate value of
collateral held at
31 December 2019
Value of collateral as %
of securities on loan at
31 December 2019
BNY Mellon Emerging Markets Corporate Debt Fund USD USD %citigroup Global markets limited united Kingdom Government debt & supranationals
(euroclear triparty) 6,917,926 7,086,780 102.44%Barclays Bank plc united Kingdom Government debt & supranationals
(euroclear triparty) 2,326,668 2,448,063 105.22%deutsche Bank, aG Germany Government debt & supranationals
(euroclear triparty) 2,167,152 2,398,597 110.68%credit suisse securities (usa) llc united states
of america u.s. Government debt (Bilateral) 2,012,079 2,052,710 102.02%credit suisse securities (europe) limited united Kingdom Government debt & supranationals
(euroclear triparty) 1,539,937 1,616,789 104.99%G10 minus Belgium (euroclear triparty) 444,279 466,734 105.05%
BNp paribas arbitrage France Government debt & supranationals (triparty) 1,155,812 1,215,298 105.15%merrill lynch international united Kingdom Government debt & supranationals
(euroclear triparty) 489,834 514,389 105.01%
17,053,687 17,799,360 104.37%
BNY Mellon Emerging Markets Debt Fund USD USD %deutsche Bank, aG Germany Government debt & supranationals
(euroclear triparty) 1,706,495 1,888,744 110.68%morgan stanley & co. llc united states
of america u.s. Government debt (Bilateral) 442,109 451,373 102.10%morgan stanley & co. international plc united Kingdom Government debt & supranationals
(euroclear triparty) 373,676 413,279 110.60%BNp paribas France G10 minus Belgium (euroclear triparty) 235,197 247,044 105.04%merrill lynch international united Kingdom Government debt & supranationals
(euroclear triparty) 218,020 228,949 105.01%
2,975,497 3,229,389 108.53%
BNY Mellon Emerging Markets Debt Local Currency Fund USD USD %citigroup Global markets limited united Kingdom Government debt & supranationals
(euroclear triparty) 1,380,239 1,448,534 104.95%Jp morgan securities, plc. united Kingdom Government debt & supranationals
(euroclear triparty) 684,685 755,281 110.31%Goldman sachs international united Kingdom Government debt & supranationals (triparty) 587,972 617,439 105.01%societe Generale France equity/Ftse/s&p/NiKKei 1,014 1,115 109.96%
2,653,910 2,822,369 106.35%
BNY Mellon Emerging Markets Debt Opportunistic Fund USD USD %deutsche Bank, aG Germany Government debt & supranationals
(euroclear triparty) 1,075,785 1,190,675 110.68%credit suisse securities (europe) limited united Kingdom Government debt & supranationals
(euroclear triparty) 178,710 187,629 104.99%Jp morgan securities, plc. united Kingdom Government debt & supranationals
(euroclear triparty) 162,273 179,005 110.31%
1,416,768 1,557,309 109.92%
03613-1C.indd 373 19/08/2020 19:02

374
BNY MelloN GloBal FuNds, plc
Notes to the FiNaNcial statemeNts
13. EFFICIENT PORTFOLIO MANAGEMENT cont’d.
Fund CounterpartyCountry of Incorporation Collateral Type
Aggregate value of
securities on loan at
31 December 2019
Aggregate value of
collateral held at
31 December 2019
Value of collateral as %
of securities on loan at
31 December 2019
BNY Mellon Emerging Markets Debt Total Return Fund USD USD %Jp morgan securities, plc. united Kingdom Government debt & supranationals
(euroclear triparty) 604,385 666,701 110.31%Government debt & supranationals (triparty) 370,101 399,684 107.99%
BNp paribas France Government debt & supranationals (euroclear triparty) 282,519 296,772 105.04%
1,257,005 1,363,157 108.44%
BNY Mellon Euroland Bond Fund EUR EUR %Goldman sachs international united Kingdom Government debt & supranationals (triparty) 83,530,121 87,930,009 105.27%
Government debt & supranationals (euroclear triparty) 2,566,370 2,638,245 102.80%
RBc europe limited united Kingdom G10 minus Belgium (euroclear triparty) 22,464,042 23,525,667 104.73%citigroup Global markets limited united Kingdom Government debt & supranationals
(euroclear triparty) 6,180,425 6,304,049 102.00%equity indices 5,996,801 6,600,576 110.07%
Barclays Bank plc united Kingdom G10 minus Belgium (euroclear triparty) 2,997,890 3,063,014 102.17%Government debt & supranationals (euroclear triparty) 1,382,646 1,410,342 102.00%u.s. Government debt (Bilateral) 1,174,579 1,198,202 102.01%
Nomura international plc united Kingdom Government debt & supranationals (euroclear triparty) 2,635,566 2,706,400 102.69%
societe Generale France Government debt & supranationals (euroclear triparty) 2,377,910 2,434,270 102.37%
morgan stanley & co. international plc united Kingdom Government debt & supranationals (euroclear triparty) 1,531,190 1,693,472 110.60%
Jp morgan securities, plc. united Kingdom Government debt & supranationals (euroclear triparty) 1,323,868 1,380,003 104.24%
deutsche Bank, aG Germany Government debt & supranationals (euroclear triparty) 1,323,709 1,465,077 110.68%
credit suisse securities (usa) llc united states of america u.s. Government debt (Bilateral) 720,062 734,602 102.02%
credit suisse securities (europe) limited united Kingdom G10 debt (triparty) 599,608 629,807 105.04%uBs aG switzerland Government debt & supranationals
(euroclear triparty) 221,639 226,579 102.23%
137,026,426 143,940,314 105.05%
BNY Mellon European Credit Fund EUR EUR %uBs aG switzerland Government debt & supranationals
(euroclear triparty) 1,930,569 1,987,450 102.95%citigroup Global markets limited united Kingdom Government debt & supranationals
(euroclear triparty) 448,134 457,098 102.00%deutsche Bank, aG Germany G10 minus Belgium (euroclear triparty) 409,722 417,981 102.02%
2,788,425 2,862,529 102.66%
03613-1C.indd 374 19/08/2020 19:02
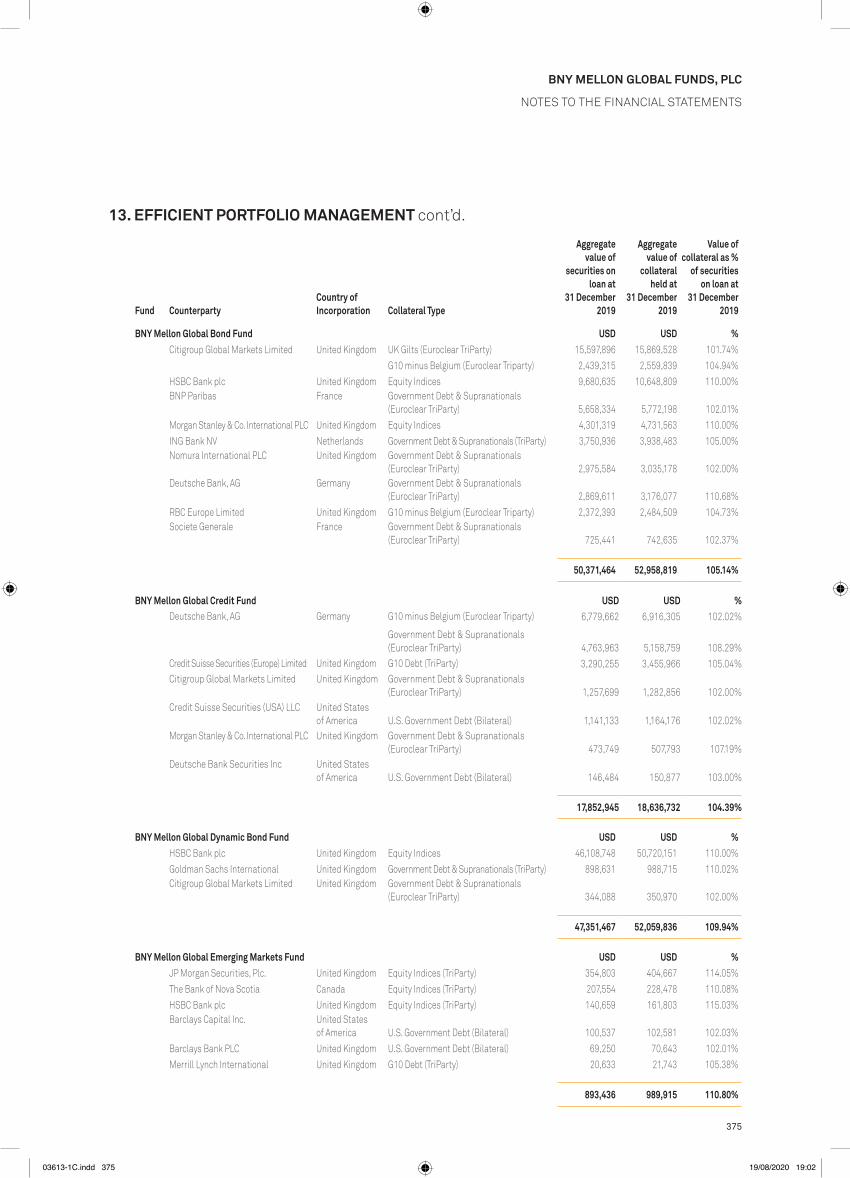
375
BNY MelloN GloBal FuNds, plc
Notes to the FiNaNcial statemeNts
13. EFFICIENT PORTFOLIO MANAGEMENT cont’d.
Fund CounterpartyCountry of Incorporation Collateral Type
Aggregate value of
securities on loan at
31 December 2019
Aggregate value of
collateral held at
31 December 2019
Value of collateral as %
of securities on loan at
31 December 2019
BNY Mellon Global Bond Fund USD USD %citigroup Global markets limited united Kingdom uK Gilts (euroclear triparty) 15,597,896 15,869,528 101.74%
G10 minus Belgium (euroclear triparty) 2,439,315 2,559,839 104.94%hsBc Bank plc united Kingdom equity indices 9,680,635 10,648,809 110.00%BNp paribas France Government debt & supranationals
(euroclear triparty) 5,658,334 5,772,198 102.01%morgan stanley & co. international plc united Kingdom equity indices 4,301,319 4,731,563 110.00%iNG Bank NV Netherlands Government debt & supranationals (triparty) 3,750,936 3,938,483 105.00%Nomura international plc united Kingdom Government debt & supranationals
(euroclear triparty) 2,975,584 3,035,178 102.00%deutsche Bank, aG Germany Government debt & supranationals
(euroclear triparty) 2,869,611 3,176,077 110.68%RBc europe limited united Kingdom G10 minus Belgium (euroclear triparty) 2,372,393 2,484,509 104.73%societe Generale France Government debt & supranationals
(euroclear triparty) 725,441 742,635 102.37%
50,371,464 52,958,819 105.14%
BNY Mellon Global Credit Fund USD USD %deutsche Bank, aG Germany G10 minus Belgium (euroclear triparty) 6,779,662 6,916,305 102.02%
Government debt & supranationals (euroclear triparty) 4,763,963 5,158,759 108.29%
credit suisse securities (europe) limited united Kingdom G10 debt (triparty) 3,290,255 3,455,966 105.04%citigroup Global markets limited united Kingdom Government debt & supranationals
(euroclear triparty) 1,257,699 1,282,856 102.00%credit suisse securities (usa) llc united states
of america u.s. Government debt (Bilateral) 1,141,133 1,164,176 102.02%morgan stanley & co. international plc united Kingdom Government debt & supranationals
(euroclear triparty) 473,749 507,793 107.19%deutsche Bank securities inc united states
of america u.s. Government debt (Bilateral) 146,484 150,877 103.00%
17,852,945 18,636,732 104.39%
BNY Mellon Global Dynamic Bond Fund USD USD %hsBc Bank plc united Kingdom equity indices 46,108,748 50,720,151 110.00%Goldman sachs international united Kingdom Government debt & supranationals (triparty) 898,631 988,715 110.02%citigroup Global markets limited united Kingdom Government debt & supranationals
(euroclear triparty) 344,088 350,970 102.00%
47,351,467 52,059,836 109.94%
BNY Mellon Global Emerging Markets Fund USD USD %Jp morgan securities, plc. united Kingdom equity indices (triparty) 354,803 404,667 114.05%the Bank of Nova scotia canada equity indices (triparty) 207,554 228,478 110.08%hsBc Bank plc united Kingdom equity indices (triparty) 140,659 161,803 115.03%Barclays capital inc. united states
of america u.s. Government debt (Bilateral) 100,537 102,581 102.03%Barclays Bank plc united Kingdom u.s. Government debt (Bilateral) 69,250 70,643 102.01%merrill lynch international united Kingdom G10 debt (triparty) 20,633 21,743 105.38%
893,436 989,915 110.80%
03613-1C.indd 375 19/08/2020 19:02

376
BNY MelloN GloBal FuNds, plc
Notes to the FiNaNcial statemeNts
13. EFFICIENT PORTFOLIO MANAGEMENT cont’d.
Fund CounterpartyCountry of Incorporation Collateral Type
Aggregate value of
securities on loan at
31 December 2019
Aggregate value of
collateral held at
31 December 2019
Value of collateral as %
of securities on loan at
31 December 2019
BNY Mellon Global Equity Fund USD USD %BNp paribas arbitrage France equity indices (triparty) 8,511,524 10,010,963 117.62%citigroup Global markets limited united Kingdom equity indices (triparty) 3,035,464 3,370,850 111.05%Barclays capital securities ltd. united Kingdom equity indices (triparty) 1,392,720 1,535,631 110.26%Nomura international plc united Kingdom equity indices (triparty) 758,866 835,219 110.06%
13,698,574 15,752,663 114.99%
BNY Mellon Global Equity Income Fund USD USD %morgan stanley & co. llc united states
of america u.s. Government debt (Bilateral) 36,516,527 37,251,563 102.01%BNp paribas arbitrage France equity indices (triparty) 3,242,119 3,813,269 117.62%J.p. morgan securities llc united states
of america u.s. Government debt (Bilateral) 1,934,234 1,973,206 102.01%citigroup Global markets inc. united states
of america u.s. Government debt (Bilateral) 1,437,366 1,478,601 102.87%uBs aG switzerland equity indices (triparty) 607,634 696,890 114.69%Barclays Bank plc united Kingdom Government debt & supranationals (triparty) 308,117 334,295 108.50%Barclays capital securities ltd. united Kingdom G10 debt (triparty) 116,859 122,730 105.02%
44,162,856 45,670,554 103.41%
BNY Mellon Global High Yield Bond Fund USD USD %Barclays Bank plc united Kingdom u.s. Government debt (Bilateral) 2,587,751 2,639,795 102.01%credit suisse securities (usa) llc united states
of america u.s. Government debt (Bilateral) 1,937,867 1,976,999 102.02%morgan stanley & co. international plc united Kingdom Government debt & supranationals
(euroclear triparty) 942,464 1,042,350 110.60%Goldman sachs international united Kingdom Government debt & supranationals (triparty) 714,802 786,458 110.02%Goldman sachs & company united states
of america u.s. Government debt (Bilateral) 464,382 487,334 104.94%credit suisse securities (europe) limited united Kingdom Government debt & supranationals
(euroclear triparty) 309,830 316,058 102.01%uBs aG switzerland Government debt & supranationals
(euroclear triparty) 223,958 228,949 102.23%
7,181,054 7,477,943 104.13%
BNY Mellon Global Opportunities Fund USD USD %BNp paribas arbitrage France equity indices (triparty) 1,222,204 1,437,514 117.62%Barclays capital securities ltd. united Kingdom equity indices (triparty) 665,146 733,399 110.26%Barclays Bank plc united Kingdom equity/Ftse/s&p/NiKKei 643,937 708,330 110.00%
2,531,287 2,879,243 113.75%
03613-1C.indd 376 19/08/2020 19:02

377
BNY MelloN GloBal FuNds, plc
Notes to the FiNaNcial statemeNts
13. EFFICIENT PORTFOLIO MANAGEMENT cont’d.
Fund CounterpartyCountry of Incorporation Collateral Type
Aggregate value of
securities on loan at
31 December 2019
Aggregate value of
collateral held at
31 December 2019
Value of collateral as %
of securities on loan at
31 December 2019
BNY Mellon Global Real Return Fund (EUR) EUR EUR %Barclays Bank plc united Kingdom equity/Ftse/s&p/NiKKei 155,988,333 171,587,183 110.00%
G10 minus Belgium (euroclear triparty) 176,398 185,476 105.15%Jp morgan securities, plc. united Kingdom G10 debt (euroclear triparty) 3,075,850 3,200,983 104.07%
Government debt & supranationals (triparty) 2,062,519 2,227,381 107.99%BNp paribas France Government debt & supranationals
(euroclear triparty) 3,061,230 3,122,832 102.01%BNp paribas arbitrage France equity indices (triparty) 1,389,791 1,634,624 117.62%deutsche Bank, aG Germany Government debt & supranationals
(euroclear triparty) 1,031,260 1,054,856 102.29%
166,785,381 183,013,335 109.73%
BNY Mellon Global Real Return Fund (GBP) GBP GBP %Jp morgan securities, plc. united Kingdom G10 minus Belgium (euroclear triparty) 3,597,669 3,965,135 110.21%BNp paribas arbitrage France equity indices (triparty) 411,702 484,229 117.62%
4,009,371 4,449,364 110.97%
BNY Mellon Global Real Return Fund (USD) USD USD %BNp paribas arbitrage France equity indices (triparty) 2,060,176 2,423,108 117.62%Jp morgan securities, plc. united Kingdom G10 debt (euroclear triparty) 311,602 324,279 104.07%BNp paribas France Government debt & supranationals
(euroclear triparty) 310,458 316,705 102.01%
2,682,236 3,064,092 114.24%
BNY Mellon Global Short-Dated High Yield Bond Fund USD USD %Barclays capital inc. united states
of america u.s. Government debt (Bilateral) 11,904,028 12,146,021 102.03%credit suisse securities (europe) limited united Kingdom G10 minus Belgium (euroclear triparty) 11,029,688 11,587,163 105.05%
Government debt & supranationals (euroclear triparty) 8,365,814 8,747,431 104.56%
morgan stanley & co. international plc united Kingdom Government debt & supranationals (euroclear triparty) 6,699,772 7,409,839 110.60%
BNp paribas arbitrage France Government debt & supranationals (triparty) 5,858,100 6,159,601 105.15%uBs aG switzerland Government debt & supranationals
(euroclear triparty) 3,655,997 3,896,101 106.57%J.p. morgan securities llc united states
of america u.s. Government debt (Bilateral) 1,711,217 1,745,696 102.01%citigroup Global markets limited united Kingdom Government debt & supranationals
(euroclear triparty) 887,278 931,181 104.95%BNp paribas France G10 minus Belgium (euroclear triparty) 796,454 836,574 105.04%morgan stanley & co. llc united states
of america u.s. Government debt (Bilateral) 512,440 523,178 102.10%uBs aG switzerland Government debt & supranationals (triparty) 351,486 371,420 105.67%Goldman sachs & company united states
of america u.s. Government debt (Bilateral) 188,308 197,615 104.94%
51,960,582 54,551,820 104.99%
03613-1C.indd 377 19/08/2020 19:03

378
BNY MelloN GloBal FuNds, plc
Notes to the FiNaNcial statemeNts
13. EFFICIENT PORTFOLIO MANAGEMENT cont’d.
Fund CounterpartyCountry of Incorporation Collateral Type
Aggregate value of
securities on loan at
31 December 2019
Aggregate value of
collateral held at
31 December 2019
Value of collateral as %
of securities on loan at
31 December 2019
BNY Mellon Global Unconstrained Fund USD USD %BNp paribas arbitrage France equity indices (triparty) 425,671 500,660 117.62%Jp morgan securities, plc. united Kingdom equity indices (triparty) 163,757 180,918 110.48%
589,428 681,578 115.63%
BNY Mellon Japan Small Cap Equity Focus Fund JPY JPY %merrill lynch international united Kingdom equity indices (triparty) 397,488,023 425,884,681 107.14%
G10 debt (triparty) 166,853,226 175,832,149 105.38%uBs aG switzerland equity indices (triparty) 287,773,419 330,044,669 114.69%
G10 debt (triparty) 75,662,996 80,505,423 106.40%macquarie Bank limited australia equity indices (triparty) 270,976,986 317,684,511 117.24%deutsche Bank, aG Germany equity indices (triparty) 92,676,304 105,147,943 113.46%Jp morgan securities, plc. united Kingdom equity indices (triparty) 76,227,024 84,215,557 110.48%credit suisse securities (europe) limited united Kingdom equity indices (triparty) 37,321,797 42,260,167 113.23%citigroup Global markets limited united Kingdom equity indices (triparty) 28,866,700 32,056,159 111.05%morgan stanley & co. international plc united Kingdom G10 debt (triparty) 9,381,382 9,928,133 105.83%
1,443,227,857 1,603,559,392 111.11%
BNY Mellon Long-Term Global Equity Fund EUR EUR %BNp paribas arbitrage France equity indices (triparty) 16,887,049 19,861,967 117.62%morgan stanley & co. llc united states
of america u.s. Government debt (Bilateral) 13,618,157 13,892,275 102.01%J.p. morgan securities llc united states
of america u.s. Government debt (Bilateral) 11,230,226 11,456,497 102.01%hsBc Bank plc united Kingdom equity indices (triparty) 10,629,562 12,227,443 115.03%
G10 debt (triparty) 229,229 261,934 114.27%Goldman sachs international united Kingdom Government debt & supranationals (triparty) 7,071,959 7,780,891 110.02%credit suisse securities (usa) llc united states
of america u.s. Government debt (Bilateral) 4,619,936 4,713,228 102.02%uBs aG switzerland equity indices (triparty) 2,170,989 2,489,888 114.69%deutsche Bank, aG Germany equity indices (triparty) 342,649 388,760 113.46%merrill lynch international united Kingdom Government debt & supranationals (triparty) 204,904 215,552 105.20%
67,004,660 73,288,435 109.38%
BNY Mellon S&P 500® Index Tracker USD USD %Barclays Bank plc united Kingdom Government debt & supranationals (triparty) 654,283 709,873 108.50%
u.s. Government debt (Bilateral) 2,760 2,815 101.99%morgan stanley & co. llc united states
of america u.s. Government debt (Bilateral) 629,305 641,972 102.01%J.p. morgan securities llc united states
of america u.s. Government debt (Bilateral) 391,143 399,024 102.01%citigroup Global markets limited united Kingdom equity indices (triparty) 246,453 271,198 110.04%uBs aG switzerland equity indices (triparty) 86,558 99,273 114.69%citigroup Global markets inc. united states
of america u.s. Government debt (Bilateral) 85,833 88,296 102.87%
03613-1C.indd 378 19/08/2020 19:03

379
BNY MelloN GloBal FuNds, plc
Notes to the FiNaNcial statemeNts
13. EFFICIENT PORTFOLIO MANAGEMENT cont’d.
Fund CounterpartyCountry of Incorporation Collateral Type
Aggregate value of
securities on loan at
31 December 2019
Aggregate value of
collateral held at
31 December 2019
Value of collateral as %
of securities on loan at
31 December 2019
BNY Mellon S&P 500® Index Tracker cont’d. USD USD %credit suisse securities (usa) llc united states
of america u.s. Government debt (Bilateral) 70,193 71,610 102.02%hsBc Bank plc united Kingdom equity indices (triparty) 49,911 57,414 115.03%
G10 debt (triparty) 12,322 14,080 114.27%merrill lynch international united Kingdom G10 debt (triparty) 60,582 63,843 105.38%td prime services llc united states
of america u.s. Government debt (Bilateral) 43,068 43,929 102.00%Bofaml securities, inc. united states
of america u.s. Government debt (Bilateral) 34,017 34,698 102.00%Barclays capital inc. united states
of america u.s. Government debt (Bilateral) 14,057 14,343 102.03%uBs securities, llc united states
of america u.s. Government debt (Bilateral) 9,335 9,522 102.00%
2,389,820 2,521,890 105.53%
BNY Mellon Small Cap Euroland Fund EUR EUR %Goldman sachs international united Kingdom equity indices (triparty) 2,172,068 2,691,035 123.89%
Government debt & supranationals (triparty) 540,253 594,411 110.02%G10 debt (triparty) 246,612 267,228 108.36%
BNp paribas arbitrage France G10 debt (triparty) 1,534,088 1,646,199 107.31%equity indices (triparty) 987,640 1,161,628 117.62%
hsBc Bank plc united Kingdom equity indices (triparty) 1,478,645 1,700,922 115.03%G10 debt (triparty) 231,689 264,744 114.27%
citigroup Global markets limited united Kingdom equity indices (triparty) 910,966 1,005,818 110.41%the Bank of Nova scotia canada equity indices (triparty) 893,714 983,810 110.08%deutsche Bank, aG Germany G10 debt (triparty) 396,248 430,704 108.70%
equity indices (triparty) 249,172 282,704 113.46%uBs aG switzerland equity indices (triparty) 587,475 673,770 114.69%Barclays capital securities ltd. united Kingdom G10 debt (triparty) 185,984 195,328 105.02%
equity indices (triparty) 52,249 57,611 110.26%credit suisse securities (europe) limited united Kingdom equity indices (triparty) 193,613 219,232 113.23%morgan stanley & co. international plc united Kingdom G10 debt (triparty) 61,519 65,105 105.83%societe Generale France equity indices (triparty) 3,958 4,577 115.63%
10,725,893 12,244,826 114.16%
BNY Mellon U.S. Dynamic Value Fund USD USD %Barclays Bank plc united Kingdom Government debt & supranationals (triparty) 879,251 953,955 108.50%J.p. morgan securities llc united states
of america u.s. Government debt (Bilateral) 631,070 643,784 102.01%Bofaml securities, inc. united states
of america u.s. Government debt (Bilateral) 68,769 70,146 102.00%uBs aG switzerland Government debt & supranationals (triparty) 27,192 28,735 105.67%morgan stanley & co. llc united states
of america u.s. Government debt (Bilateral) 3,398 3,467 102.03%
1,609,680 1,700,087 105.62%
03613-1C.indd 379 19/08/2020 19:03

380
BNY MelloN GloBal FuNds, plc
Notes to the FiNaNcial statemeNts
13. EFFICIENT PORTFOLIO MANAGEMENT cont’d.
Fund CounterpartyCountry of Incorporation Collateral Type
Aggregate value of
securities on loan at
31 December 2019
Aggregate value of
collateral held at
31 December 2019
Value of collateral as %
of securities on loan at
31 December 2019
BNY Mellon U.S. Equity Income Fund USD USD %J.p. morgan securities llc united states
of america u.s. Government debt (Bilateral) 2,633,135 2,686,188 102.01%uBs aG switzerland equity indices (triparty) 272,262 312,255 114.69%credit suisse securities (usa) llc united states
of america u.s. Government debt (Bilateral) 25,045 25,550 102.02%
2,930,442 3,023,993 103.19%
14. NET ASSET VALUE
The net asset value of each class of redeemable participating share is determined by dividing the value of the net assets of the share class by the total number of redeemable participating shares in issue at the financial period end.
The published net asset value of each class of redeemable participating share is as follows:
Fund Share Class Currency 30 June 2020 31 December 2019 30 June 2019
BNY Mellon Absolute Return Bond FundTotal net assets EUR 316,520,163 397,342,232 584,469,702Net asset value per: class c euR 97.8164 99.6501 97.8252
class c (inc) euR 92.6095 94.9534 93.9367class d (acc)^ euR – 100.3946 –
class R euR 96.2751 98.2485 96.6054class R (hedged) usd 104.7863 105.9570 102.7268
class R (inc) euR 93.5544 95.9159 94.8895class s euR 102.9332 104.7596 102.7496
class s (inc)^ euR – 95.5533 94.5427class t (hedged) chF 92.5329 94.4518 92.8976class t (hedged) usd 114.6803 115.6893 111.8678
sterling t (acc) (hedged) GBp 109.2396 111.0150 108.2567class W (acc) euR 93.3637 95.2036 93.5077
class W (acc) (hedged) usd 100.7650 101.7687 98.5345class W (inc) (hedged)^ usd – 99.7297 97.2566
sterling W (acc) (hedged) GBp 98.1865 99.9024 97.5445sterling W (inc) (hedged) GBp 94.6290 96.8591 95.2733
class X euR 109.3680 111.0339 108.6177class X (acc) (hedged)^ usd – 105.1359 101.4000
sterling X (acc) (hedged) GBp 115.7731 117.3278 114.0972class Z (acc) euR – – 93.2000
BNY Mellon Absolute Return Equity FundTotal net assets GBP 271,926,066 371,503,339 798,337,871Net asset value per: class d (acc) (hedged) euR 0.9155 0.9195 0.9297
class R (hedged) chF 0.8745 0.8828 0.8969class R (hedged) euR 1.0372 1.0442 1.0585class R (hedged) usd 1.0425 1.0406 1.0396
03613-1C.indd 380 19/08/2020 19:03

381
BNY MelloN GloBal FuNds, plc
Notes to the FiNaNcial statemeNts
14. NET ASSET VALUE cont’d.
Fund Share Class Currency 30 June 2020 31 December 2019 30 June 2019
BNY Mellon Absolute Return Equity Fund cont’d.Net asset value per: class R (inc) (hedged) euR 0.9040 0.9101 0.9224
sterling R (acc) GBp 1.1108 1.1129 1.1210sterling s (acc) GBp 1.1628 1.1621 1.1676
class t (hedged) euR 1.0845 1.0892 1.1012class t (hedged) usd 1.0796 1.0739 1.0700class u (hedged) euR 0.9649 0.9684 0.9783class u (hedged) usd 1.0667 1.0614 1.0568
class u (inc) (hedged) euR 0.9230 0.9186 0.9285sterling u (acc) GBp 1.1730 1.1714 1.1761sterling X (acc) GBp 1.3180 1.3103 1.3096
BNY Mellon Absolute Return Global Convertible FundTotal net assets EUR 28,570,632 28,390,201 20,085,555Net asset value per: class F (acc) (hedged) usd 1.0291 1.0097 –
sterling F (acc) (hedged) GBp 1.0198 1.0038 –class u (acc) euR 1.0249 1.0142 1.0044
class u (acc) (hedged)^ usd 1.0189 – –sterling u (acc) (hedged)^ GBp – 1.0208 1.0056
class X (acc) euR 1.0377 1.0213 1.0057
BNY Mellon Asia Rising Stars FundTotal net assets USD 7,333,756 8,283,563 7,817,482Net asset value per: class a (acc) usd 1.1702 1.2700 1.1964
class h (acc) (hedged) sGd 1.1299 1.2346 1.1668class W (acc) usd 1.2024 1.2997 1.2195class X (acc) usd 1.0168 1.0953 1.0236
BNY Mellon Asian Equity FundTotal net assets USD 38,538,656 38,173,739 36,929,042Net asset value per: class a usd 3.8366 3.6442 3.2505
class a euR 3.0156 2.8596 2.5159class B usd 4.1589 3.9405 3.5058class B euR 1.5822 1.4966 1.3134class c usd 4.7300 4.4703 3.9671class c euR 3.1457 2.9682 2.5981
sterling c (inc) GBp 3.4322 3.0133 2.7841class W usd 1.3247 1.2505 1.1083
BNY Mellon Asian Income Fund***Total net assets USD/GBP 29,519,498 31,031,538 23,086,322Net asset value per: class a (acc) euR 1.1499 1.3783 1.3200
class a (acc) usd – – 1.1378class a (inc) euR 0.9608 1.1674 –
class B (acc) usd 0.9677 1.1590 1.1213class c (acc) usd 1.0413 1.2440 1.2004
sterling c (acc) GBp – – 1.4905class W (inc) euR 1.0486 1.2661 1.2262class W (inc) usd 0.8559 1.0352 1.0154
sterling W (inc) GBp 1.1778 1.3233 1.3501
03613-1C.indd 381 19/08/2020 19:03

382
BNY MelloN GloBal FuNds, plc
Notes to the FiNaNcial statemeNts
14. NET ASSET VALUE cont’d.
Fund Share Class Currency 30 June 2020 31 December 2019 30 June 2019
BNY Mellon Brazil Equity FundTotal net assets USD 60,983,102 105,594,026 100,997,675Net asset value per: class a usd 0.8735 1.3152 1.1680
class a euR 1.0799 1.6321 1.4273class B usd 0.7488 1.1248 0.9963class B euR 0.9434 1.4216 1.2400
sterling B (acc) GBp 0.9005 1.2788 1.1688class c usd 0.9922 1.4872 1.3141class c euR 1.2291 1.8476 1.6075
sterling c (inc) GBp 1.0557 1.5174 1.3833class G (acc)^ usd – 1.2899 1.1398
class G (acc) euR 0.8651 1.3014 1.1325class G (acc) (hedged)^ euR – 1.2167 1.0907
class h (hedged) euR 0.7567 1.1666 1.0513class i (acc) (hedged) euR 0.7251 1.1116 0.9965
class W (acc) usd 0.8615 1.2895 1.1380class W (acc) euR 1.0024 1.5059 1.3085
sterling W (acc) GBp 1.1214 1.5866 1.4446
BNY Mellon Digital Assets FundTotal net assets USD 10,983,890 11,112,189 7,961,302Net asset value per: class a (acc) usd 1.1284 1.0907 1.0363
class B (acc) usd – – 1.0384class e (acc) usd 1.1625 1.1161 1.0530class e (acc) euR 1.1737 1.1287 1.0505
class e (inc)^ usd – 1.0566 0.9969class h (acc) (hedged) euR 1.0888 1.0686 1.0291
class K (acc) usd 1.1485 1.1076 1.0498class K (acc) euR 1.1598 1.1203 1.0473class W (acc) usd 1.1594 1.1142 1.0523
BNY Mellon Dynamic Total Return FundTotal net assets USD 24,113,316 26,474,856 25,440,367Net asset value per: class a (acc) usd 0.9634 1.0261 0.9876
class c (acc) usd 1.0142 1.0748 1.0292class e (acc) usd 1.0153 1.0732 1.0252
class h (acc) (hedged) euR 0.8810 0.9481 0.9253class W (acc) usd 1.0265 1.0865 1.0392class X (acc) usd 1.0700 1.1279 1.0744
BNY Mellon Dynamic U.S. Equity FundTotal net assets USD 406,056,407 181,632,588 127,289,625Net asset value per: class a (acc) euR 0.9914 1.0095 –
class a (inc) usd 1.2787 1.3057 1.1685class c (acc) usd 1.2969 1.3172 1.1778class e (acc) usd 1.3092 1.3273 1.1847class G (acc) usd 1.0031 1.0188 –class G (acc) euR 0.9925 1.0096 –
class h (acc) (hedged) euR 1.0896 1.1249 1.0204class W (acc) usd 1.3029 1.3220 1.1809class W (acc) euR 1.1714 1.1905 1.0490
sterling W (acc)^ GBp – 1.3060 1.2168class W (inc)^ euR 0.9610 – –
class X (acc) usd 1.3194 1.3357 1.1905
03613-1C.indd 382 19/08/2020 19:03

383
BNY MelloN GloBal FuNds, plc
Notes to the FiNaNcial statemeNts
14. NET ASSET VALUE cont’d.
Fund Share Class Currency 30 June 2020 31 December 2019 30 June 2019
BNY Mellon Efficient Global IG Corporate Beta Fund*Total net assets USD 62,378,535 – –Net asset value per: class a (acc)^ usd 1.0210 – –
sterling l (acc) (hedged)^ GBp 1.0141 – –class W (acc)^ usd 1.0216 – –
class W (acc) (hedged)^ euR 1.0136 – –sterling W (acc) (hedged)^ GBp 1.0134 – –
BNY Mellon Efficient U.S. High Yield Beta FundTotal net assets USD 896,781,349 716,491,768 326,854,263Net asset value per: class a (inc) usd 0.9015 0.9923 0.9886
class a (inc) euR 0.9480 1.0451 1.0272class c (acc) usd 1.0611 1.1279 1.0868class c (acc) euR – – 1.1268
class c (inc)^ usd 1.0327 – –class e (acc) (hedged) euR 0.9879 1.0638 1.0390
sterling e (acc) (hedged) GBp 1.0141 1.0927 1.0612sterling e (inc) (hedged) GBp 0.9180 1.0276 –
class h (acc) (hedged) euR 0.9557 1.0327 1.0100class i (acc) (hedged) euR – – 1.0345class i (inc) (hedged) euR – – 0.9432
class K (acc) usd 1.0359 1.1013 1.0617class K (acc) (hedged) euR 0.9802 1.0565 1.0329
class l (acc) usd 1.0396 1.1042 1.0635class l (acc) (hedged) euR 0.9833 1.0587 1.0341
sterling l (acc) (hedged) GBp 0.9467 1.0197 1.0029sterling l (inc) (hedged) GBp 0.8961 0.9995 –
class W (acc) usd 1.0632 1.1298 1.0886sterling W (acc) (hedged) GBp 0.9551 1.0291 –
class W (inc)^ usd 0.9876 – –class W (inc) (hedged) euR 0.8387 0.9355 0.9448
sterling W (inc) (hedged)^ GBp 0.9874 – –class X (acc) usd 1.0668 1.1323 1.0897
sterling X (acc) (hedged)^ GBp 1.0500 – –class X (inc)^ usd 1.0511 – –
BNY Mellon Emerging Markets Corporate Debt FundTotal net assets USD 308,500,009 360,120,657 327,965,278Net asset value per: class a usd 139.0886 142.4403 135.3314
class a euR 157.6467 161.1662 151.0505class a (inc)^ usd 101.5880 – –
class a (inc) (m)^ hKd 1,000.5330 – –class B usd 153.6000 157.0770 149.0616class c usd 157.4261 160.7062 152.1887class c euR 177.3878 180.9051 168.9868
class G (inc) usd 97.9188 102.4094 99.1414class h (hedged) euR 125.9447 130.9446 126.2115
class i (hedged) euR 131.7836 136.5029 131.1614class W usd 159.9348 163.1225 154.3202class W euR 189.0293 192.4222 179.5566
class W (acc) (hedged) chF 105.4441 109.3395 105.1777class W (acc) (hedged) euR 101.2537 104.7770 100.5524class W (inc) (hedged) chF 98.8368 105.1012 103.4701
03613-1C.indd 383 19/08/2020 19:03

384
BNY MelloN GloBal FuNds, plc
Notes to the FiNaNcial statemeNts
14. NET ASSET VALUE cont’d.
Fund Share Class Currency 30 June 2020 31 December 2019 30 June 2019
BNY Mellon Emerging Markets Corporate Debt Fund cont’d.Net asset value per: class W (inc) (hedged) euR 91.6319 97.2623 95.5651
sterling W (acc) (hedged) GBp 144.7029 149.8278 142.8520sterling W (inc) (hedged)^ GBp – 103.2061 –
class X usd 174.6668 177.5334 167.3701sterling X (acc) (hedged) GBp 107.4991 110.9318 105.3834
class Y (acc) usd – – 111.6158
BNY Mellon Emerging Markets Debt FundTotal net assets USD 29,459,961 52,672,790 38,270,148Net asset value per: class a usd 2.2573 2.3965 2.3186
class a euR 2.0091 2.1365 2.0391class c usd 2.4336 2.5787 2.4887class c euR 2.1615 2.2929 2.1827
class c (inc) usd 0.7831 0.8483 0.8367class h (acc) (hedged) euR 1.1075 1.1938 1.1721
class W usd 1.2287 1.2998 1.2528class X (inc) usd 0.9751 1.0569 1.0320
BNY Mellon Emerging Markets Debt Local Currency FundTotal net assets USD 252,780,212 464,566,692 597,181,538Net asset value per: class a usd 1.0235 1.1309 1.1060
class a euR 1.1341 1.2551 1.2108class a (inc) usd 0.5152 0.5824 0.5882class a (inc) euR 0.7459 0.8446 0.8414
sterling a (acc) GBp 1.0788 1.1152 1.1375sterling B (acc) GBp 1.1161 1.1521 1.1734
class c usd 1.3613 1.5015 1.4645class c euR 1.2135 1.3397 1.2891
class c (inc) usd 0.5529 0.6252 0.6313class c (inc) euR 0.7016 0.7946 0.7915
sterling c (acc) GBp 1.6300 1.6807 1.7102sterling c (inc) GBp 0.8851 0.9362 0.9861
class h (hedged) euR 0.8522 0.9567 0.9490class i (hedged) euR 0.8671 0.9709 0.9614
sterling J (inc) (hedged) GBp 0.4670 0.5360 0.5460class W usd 0.8170 0.8990 0.8753class W euR 0.9400 1.0359 0.9950
class W (hedged) euR 0.7642 0.8540 0.8432class W (inc) euR 0.6148 0.6964 0.6938
class W (inc) (hedged) euR 0.7159 0.8229 0.8433sterling W (inc) GBp 0.6910 0.7311 0.7700
sterling W (inc) (hedged) GBp 0.5223 0.5997 0.6108class X^ usd – 1.7284 1.6770
BNY Mellon Emerging Markets Debt Opportunistic FundTotal net assets USD 29,522,466 29,585,251 35,398,665Net asset value per: class a euR 1.2288 1.3204 1.2624
class c usd 1.0598 1.1341 1.0960class c euR – – 1.2980
class W (acc) usd 1.0040 1.0727 1.0348class X (inc) usd 0.9410 1.0323 1.0285
03613-1C.indd 384 19/08/2020 19:03

385
BNY MelloN GloBal FuNds, plc
Notes to the FiNaNcial statemeNts
14. NET ASSET VALUE cont’d.
Fund Share Class Currency 30 June 2020 31 December 2019 30 June 2019
BNY Mellon Emerging Markets Debt Total Return FundTotal net assets USD 192,216,966 151,635,419 127,938,887Net asset value per: class a (acc) usd 0.9926 1.0325 –
class e (inc)^ usd – 0.9452 0.9515sterling e (inc) (hedged) GBp 0.9513 1.0349 1.0501
class h (acc) (hedged) euR 0.9672 1.0225 –class W (acc) usd 1.0041 1.0423 1.0207
class W (acc) (hedged) euR 0.9269 0.9778 0.9716sterling W (acc) (hedged) GBp 0.9303 0.9813 0.9681
class X (acc) usd 1.0194 1.0553 1.0301
BNY Mellon Euroland Bond FundTotal net assets EUR 536,899,130 890,225,293 974,895,222Net asset value per: class a euR 1.9602 1.9753 1.9732
class a (inc) euR 1.1932 1.2057 1.2074class B euR 1.3777 1.3866 1.3833
class B (inc) euR 1.2000 1.2126 1.2143class c euR 2.1310 2.1420 2.1343
class c (inc) euR 1.3034 1.3172 1.3190class G (acc) euR 1.0373 1.0428 1.0390
class h (hedged) chF 1.2507 1.2627 1.2643class i (hedged) chF 1.3259 1.3354 1.3336
class s euR 1.1909 1.1964 1.1915class W (acc) euR 1.0788 1.0840 1.0798
BNY Mellon European Credit FundTotal net assets EUR 72,973,001 82,434,065 36,177,229Net asset value per: class a euR 121.2219 123.8809 122.5014
class c euR 125.7459 128.1852 126.4353class W (acc) euR 104.2730 106.2977 104.7352
class X euR 130.8848 133.0672 130.8896
BNY Mellon Global Bond FundTotal net assets USD 599,440,292 585,157,899 613,705,993Net asset value per: class a usd 2.4123 2.3299 2.3113
class a euR 1.9200 1.8513 1.8116class B usd 2.4712 2.3850 2.3642class c usd 2.6209 2.5251 2.4986class c euR 2.0989 2.0189 1.9705
class c (inc) usd 1.0064 0.9738 0.9695sterling c (inc) GBp 1.6374 1.4735 1.5282
class h (hedged) euR 1.2586 1.2316 1.2399class i (hedged) euR 1.3302 1.2981 1.3034
class W (acc) usd 1.1165 1.0751 1.0633class W (acc) euR 1.1327 1.0889 1.0622
class W (acc) (hedged)^ euR – 0.9887 0.9923class X usd 2.7703 2.6617 2.6265
sterling Z (acc) (hedged)^ GBp 1.0264 – –sterling Z (inc) (hedged)^ GBp 1.0264 – –
03613-1C.indd 385 19/08/2020 19:03

386
BNY MelloN GloBal FuNds, plc
Notes to the FiNaNcial statemeNts
14. NET ASSET VALUE cont’d.
Fund Share Class Currency 30 June 2020 31 December 2019 30 June 2019
BNY Mellon Global Credit FundTotal net assets USD 611,959,878 462,784,533 441,144,992Net asset value per: class a (acc)^ usd 1.0001 – –
class h (acc) (hedged) euR 1.1546 1.0985 1.0725class W (acc) usd 1.3164 1.2310 1.1814
sterling W (acc) (hedged) GBp 1.2389 1.1740 1.1349class X (acc) usd 1.3272 1.2385 1.1857
class X (acc) (hedged) cad 1.3035 1.2239 1.1752sterling X (acc) (hedged) GBp – – 1.0699
BNY Mellon Global Dynamic Bond FundTotal net assets USD 369,815,520 496,274,784 476,327,186Net asset value per: class a usd 1.2712 1.2631 1.2434
class a euR 1.3195 1.3090 1.2711class a (inc) usd 1.0695 1.0664 1.0569
class c usd 1.3564 1.3445 1.3202class G (acc) euR 1.1427 1.1308 1.0947
class h (hedged) euR 1.0273 1.0312 1.0297class h (acc) (hedged) NoK 10.0936 10.1020 9.9890class h (inc) (hedged) euR 0.9369 0.9437 0.9488
class i (hedged) euR 1.0692 1.0715 1.0673class i (inc) (hedged) euR 0.9377 0.9461 0.9513
class W usd 1.1659 1.1542 1.1319class W (hedged) euR 1.0514 1.0514 1.0459
class W (acc) (hedged) chF 1.0183 1.0201 1.0168class W (acc) (hedged) NoK 10.1718 10.1423 9.9904class W (inc) (hedged) euR 0.9751 0.9823 0.9876
sterling W (acc) (hedged) GBp 1.1106 1.1076 1.0947sterling W (inc) (hedged)^ GBp 0.9945 – –
class X (acc) (hedged) JpY 100.2156 99.9375 –sterling Z (acc) GBp 1.0604 0.9745 –
sterling Z (acc) (hedged)^ GBp 0.9962 – –sterling Z (inc) GBp 1.0539 0.9745 –
sterling Z (inc) (hedged)^ GBp 0.9948 – –
BNY Mellon Global Emerging Markets FundTotal net assets USD 30,437,912 33,193,624 33,595,711Net asset value per: class a usd 1.0111 0.9898 0.9115
class a euR 1.2410 1.2113 1.1004class a (inc) euR 1.0990 1.0726 0.9744
class B (acc)^ usd 1.2378 – –class B (acc)^ euR 1.2156 – –
class B (inc) usd 1.0102 0.9850 0.9049class B (inc) euR 1.1458 1.1155 1.0109
class c usd 1.1993 1.1667 1.0690class c (acc) usd 1.3228 1.2867 1.1791
class c (acc)^ euR 1.2172 – –class c (inc) usd 1.0484 1.0193 0.9340
sterling c (inc)^ GBp 1.2341 – –class e (acc) usd 1.3145 1.2767 1.1664class e (acc) chF 1.1966 1.1810 1.0883
class G (acc) (hedged)^ euR – 0.8871 0.8225
03613-1C.indd 386 19/08/2020 19:03

387
BNY MelloN GloBal FuNds, plc
Notes to the FiNaNcial statemeNts
14. NET ASSET VALUE cont’d.
Fund Share Class Currency 30 June 2020 31 December 2019 30 June 2019
BNY Mellon Global Emerging Markets Fund cont’d.Net asset value per: class h (hedged) euR 0.9179 0.9104 0.8499
class i (hedged) euR 0.9903 0.9771 0.9075class W (acc) usd 1.5380 1.4996 1.3716class W (acc) euR 1.0674 1.0353 0.9345class W (inc) usd 1.0586 1.0293 0.9420class W (inc) euR 1.1795 1.1448 1.0334
BNY Mellon Global Equity FundTotal net assets USD 362,023,450 371,812,812 343,051,111Net asset value per: class a usd 2.4968 2.6195 2.4272
class a euR 2.0092 2.1046 1.9236class B usd 2.6965 2.8220 2.6082class B euR 2.3838 2.4906 2.2706class c usd 2.9362 3.0650 2.8256
class c^ euR – 2.4330 2.2124class i (hedged) euR 1.3492 1.4290 1.3362
class W (acc) usd 1.3256 1.3821 1.2725class W (acc) euR 1.3297 1.3841 1.2570
BNY Mellon Global Equity Income FundTotal net assets USD 1,201,589,592 1,842,135,041 1,577,286,880Net asset value per: class a usd 1.6028 1.8451 1.7475
class a euR 2.1232 2.4403 2.2797class a (inc) usd 1.1868 1.3859 1.3347class a (inc) euR 1.0824 1.2619 1.1988
sterling a (acc) GBp 1.5622 1.6706 1.6472class B usd 1.9545 2.2446 2.1205class B euR 2.1006 2.4084 2.2443
class B (inc) usd 1.4435 1.6814 1.6152class B (inc) euR 1.6711 1.9434 1.8415
sterling B (inc) GBp 1.8404 1.9914 1.9917class c usd 1.8431 2.1114 1.9896class c euR 2.2775 2.6047 2.4210
class c (inc) usd 1.5085 1.7527 1.6794class c (inc) euR 1.6634 1.9295 1.8237
sterling c (inc) GBp 1.9195 2.0718 2.0668class G (acc) euR 1.0381 1.1873 1.1036
class h (hedged) euR 1.2421 1.4511 1.3941class h (inc) (hedged) euR 0.9958 1.1799 1.1529
class i (hedged) euR 1.3390 1.5564 1.4877class i (inc) (hedged) euR 1.0623 1.2523 1.2181
class W usd 1.6222 1.8558 1.7465class W euR 1.8930 2.1617 2.0067
class W (acc)^ chF – 1.0487 0.9952class W (acc) (hedged) euR 0.9532 1.1066 1.0571
class W (inc) usd 1.2820 1.4876 1.4236class W (inc) euR 1.4999 1.7381 1.6407
sterling W (acc) GBp 2.1300 2.2637 2.2179sterling W (inc) GBp 1.6835 1.8148 1.8082
class Z (acc) usd 1.3605 1.5555 1.4632class Z (acc) euR 1.5133 1.7277 1.6030
03613-1C.indd 387 19/08/2020 19:03

388
BNY MelloN GloBal FuNds, plc
Notes to the FiNaNcial statemeNts
14. NET ASSET VALUE cont’d.
Fund Share Class Currency 30 June 2020 31 December 2019 30 June 2019
BNY Mellon Global Equity Income Fund cont’d.Net asset value per: class Z (inc) usd 1.0044 1.1650 1.1143
class Z (inc) euR 1.0218 1.1832 1.1163sterling Z (acc) GBp 0.9611 1.0210 –sterling Z (inc) GBp 1.0485 1.1297 1.1250
BNY Mellon Global High Yield Bond FundTotal net assets USD 111,506,533 121,548,316 128,209,110Net asset value per: class a euR 2.4751 2.6193 2.4888
class c usd 1.3239 1.4011 1.3481class c euR 2.5752 2.7224 2.5838
class c (inc) usd 0.9072 0.9888 0.9781class h (hedged) euR 1.1698 1.2556 1.2268
class i (hedged) euR 1.1977 1.2841 1.2528class W (acc) usd 1.0620 1.1212 1.0760
class W (acc) (hedged)^ euR – 1.0149 –sterling W (acc) (hedged) GBp 0.9668 1.0347 –
class X (inc) usd 0.9385 1.0176 1.0013class X (inc) (hedged) euR 0.8543 0.9386 0.9370
BNY Mellon Global Infrastructure Income FundTotal net assets USD 147,205,072 91,053,076 15,567,967Net asset value per: class a (acc) usd 0.8573 1.0949 1.0194
class a (inc) usd 0.8010 1.0438 0.9942class a (inc) euR 0.8126 1.0608 0.9968
class B (acc) usd 0.8641 1.1012 1.0230class B (acc)^ sGd 1.0733 – –
class B (inc) usd 0.8076 1.0502 0.9981class B (inc)^ sGd 1.0733 – –
class c (inc) euR – – 1.0048class e (acc) usd 0.8897 1.1281 1.0426class e (inc) usd 0.8232 1.0651 1.0069class e (inc) euR 0.8352 1.0823 1.0094
sterling e (inc) (hedged) GBp 0.7776 1.0377 0.9898class h (acc) (hedged) euR 0.8036 1.0494 0.9915class h (inc) (hedged) euR 0.7506 1.0006 0.9673
class J (acc) (hedged)^ sGd 1.0919 – –class J (inc) (hedged)^ sGd 1.0917 – –
class W (acc) usd 0.8760 1.1124 1.0295class W (acc) (hedged) euR 0.8218 1.0666 1.0016
class W (inc) usd 0.8187 1.0608 1.0044class W (inc) (hedged) euR 0.7692 1.0169 0.9772
BNY Mellon Global Leaders FundTotal net assets USD 63,537,900 86,118,374 83,993,066Net asset value per: class a (acc) usd 1.4669 1.4853 1.3497
class a (acc) euR 1.2305 1.2479 1.1185class a (inc) euR 1.2305 1.2479 1.1185
class B (acc) usd 1.1273 1.1386 1.0319class c (acc) usd 1.5204 1.5318 1.3848class e (acc) usd 1.3526 1.3594 1.2260
sterling e (acc) GBp 1.5773 1.4829 1.3947
03613-1C.indd 388 19/08/2020 19:03

389
BNY MelloN GloBal FuNds, plc
Notes to the FiNaNcial statemeNts
14. NET ASSET VALUE cont’d.
Fund Share Class Currency 30 June 2020 31 December 2019 30 June 2019
BNY Mellon Global Leaders Fund cont’d.Net asset value per: class h (acc) (hedged) dKK 10.5189 10.8284 9.9935
class h (acc) (hedged) euR 1.3308 1.3678 1.2609class h (acc) (hedged) NoK 10.4614 10.9288 9.9970class h (acc) (hedged) seK 10.4780 10.8404 9.9949
class W (acc) usd 1.5342 1.5438 1.3939class W (acc) (hedged) dKK 11.2393 11.4980 10.5437class W (acc) (hedged) NoK 10.6033 11.0081 9.9994class W (acc) (hedged) seK 10.6137 10.9126 9.9973
sterling W (acc) GBp 1.5632 1.4714 1.3858
BNY Mellon Global Multi-Asset Income FundTotal net assets EUR 20,605,462 23,691,394 19,834,753Net asset value per: class a (acc) euR 0.9627 1.0856 –
class a (inc) euR 0.9002 1.0368 0.9795class a (inc)^ usd 0.9943 – –class c (acc) euR 0.9547 1.0739 –class e (inc) euR 0.9228 1.0562 0.9915
class W (acc) euR 0.9816 1.1027 1.0124class W (inc)^ euR – 1.0482 0.9866
BNY Mellon Global Opportunities FundTotal net assets USD 33,719,611 48,327,216 49,213,867Net asset value per: class a usd 2.9626 3.2022 2.9422
class a euR 2.3663 2.5521 2.3134class B usd 3.2067 3.4560 3.1673class c usd 3.4370 3.6943 3.3771class c euR 2.7382 2.9379 2.6490
class h (hedged) euR 1.4159 1.5498 1.4439class i (hedged) euR 1.5122 1.6468 1.5313
class W (acc) usd 1.1516 1.2362 1.1286class W (acc)^ euR – 1.1667 1.0507
BNY Mellon Global Real Return Fund (EUR)Total net assets EUR 2,770,276,248 3,409,751,582 3,281,939,351Net asset value per: class a euR 1.3276 1.3636 1.3276
class a (inc) euR 1.0805 1.1181 1.0887class c euR 1.3981 1.4323 1.3904
class c (inc) euR 1.1370 1.1792 1.1452class G (acc) euR 1.0737 1.1001 1.0684class G (inc) euR 1.0459 1.0848 1.0536
class h (acc) (hedged) sGd 1.0120 1.0351 0.9977class h (acc) (hedged) usd 1.0040 1.0233 –
sterling h (acc) (hedged) GBp 0.9916 1.0196 –class W euR 1.2776 1.3076 1.2683
class W (acc) (hedged) chF 1.0343 1.0609 1.0315class W (acc) (hedged) usd 1.0101 1.0212 –
class W (inc) euR 0.9961 1.0247 –class X euR 1.4160 1.4433 1.3942
class Z (acc) euR 1.0736 1.0980 1.0645
03613-1C.indd 389 19/08/2020 19:03

390
BNY MelloN GloBal FuNds, plc
Notes to the FiNaNcial statemeNts
14. NET ASSET VALUE cont’d.
Fund Share Class Currency 30 June 2020 31 December 2019 30 June 2019
BNY Mellon Global Real Return Fund (GBP)Total net assets GBP 62,442,487 70,966,738 65,427,701Net asset value per: sterling B (acc) GBp 1.2129 1.2467 1.2161
sterling B (inc) GBp 1.1293 1.1680 1.1394sterling c (inc) GBp 1.1492 1.1916 1.1594
sterling W (acc) GBp 1.2510 1.2818 1.2456sterling W (inc) GBp 1.1279 1.1711 1.1381sterling X (acc) GBp 1.2674 1.2928 1.2512
BNY Mellon Global Real Return Fund (USD)Total net assets USD 292,063,806 322,386,292 318,939,885Net asset value per: class a usd 1.4955 1.5262 1.4730
class c usd 1.5797 1.6081 1.5482class c (inc) usd 1.2313 1.2722 1.2248
class G (acc) usd 1.1454 1.1659 1.1226class W (acc) usd 1.2926 1.3142 1.2636class W (inc) usd 1.1502 1.1892 1.1434
class X usd 1.7716 1.7941 1.7181
BNY Mellon Global Short-Dated High Yield Bond FundTotal net assets USD 716,954,643 725,167,880 710,683,039Net asset value per: class a (acc) usd 1.0913 1.1434 1.1208
class a (inc) usd 0.9375 1.0033 1.0037class c (acc) usd 1.1108 1.1613 1.1354class G (acc) usd 0.9965 1.0418 1.0186
class h (acc) (hedged) euR 0.9971 1.0579 1.0518class h (inc) (hedged) euR 0.8622 0.9344 0.9488class i (acc) (hedged) euR 1.0143 1.0732 1.0643class i (inc) (hedged) euR 0.8624 0.9355 0.9498
class W (acc) usd 1.1208 1.1702 1.1426class W (acc) (hedged) chF 0.9913 1.0487 1.0408class W (acc) (hedged) euR 1.0026 1.0600 1.0499
class W (inc) usd 0.9415 1.0078 1.0082class W (inc) (hedged) euR 0.8637 0.9361 0.9502
sterling W (acc) (hedged) GBp 1.0579 1.1174 1.0996sterling W (inc) (hedged) GBp 0.9001 0.9749 0.9833
class X (acc) usd 1.1430 1.1902 1.1589class X (acc) (hedged) euR – – 1.0218
sterling X (acc) (hedged) GBp 0.9992 1.0524 1.0328class Y (acc) usd 1.1434 1.1907 1.1592
sterling Y (acc) (hedged) GBp 1.0786 1.1365 1.1152sterling Z (acc) (hedged) GBp 0.9759 1.0302 1.0132sterling Z (inc) (hedged) GBp 0.9246 1.0014 1.0103
BNY Mellon Global Unconstrained FundTotal net assets USD 23,348,578 25,173,039 23,213,575Net asset value per: class W (acc) usd 1.1285 1.1515 1.0685
class X (acc) (hedged) cad 1.1208 1.1502 1.0663
03613-1C.indd 390 19/08/2020 19:03

391
BNY MelloN GloBal FuNds, plc
Notes to the FiNaNcial statemeNts
14. NET ASSET VALUE cont’d.
Fund Share Class Currency 30 June 2020 31 December 2019 30 June 2019
BNY Mellon Japan Small Cap Equity Focus FundTotal net assets JPY 12,306,565,258 15,534,711,210 14,234,212,157Net asset value per: class a (acc) euR 1.0236 1.0989 0.9432
class c JpY 195.3408 211.0813 180.8320class c usd – – 1.4832
class c (acc) euR – – 0.8566class e (acc)^ euR – 1.1275 0.9606
class e (acc) (hedged) chF 0.9472 1.0297 0.8831class e (acc) (hedged) usd 1.0034 1.0802 0.9130
class G (acc)^ euR 0.9908 – –class G (acc) (hedged) euR 0.8533 0.9289 0.7968class h (acc) (hedged) sGd 1.4427 1.5727 1.3429class h (acc) (hedged) NoK 10.6278 11.7303 10.0275class h (acc) (hedged) seK 10.5914 11.6353 10.0258
class h (hedged) euR 1.7314 1.8939 1.6328class h (hedged) usd 1.9232 2.0855 1.7747
class i (hedged) euR 1.8742 2.0399 1.7500class i (hedged) usd 2.0419 2.2033 1.8665
class W JpY 198.7223 214.4722 183.5042class W (acc) euR 0.9554 1.0192 0.8692
class W (acc) (hedged) euR 0.9035 0.9821 0.8414class W (acc) (hedged) NoK 10.6089 11.6384 9.8862class W (acc) (hedged) seK 10.5876 11.5413 9.8820
sterling W (acc) GBp 2.5118 2.5019 2.2443sterling W (inc) GBp 0.9873 0.9904 0.8884
BNY Mellon Long-Term Global Equity FundTotal net assets EUR 1,412,714,937 1,485,354,765 1,915,014,601Net asset value per: class a euR 2.7128 2.8565 2.6228
class a usd 1.9209 2.0194 1.8796class a (inc) euR 1.7411 1.8335 1.6834
sterling a (acc) GBp 2.8833 2.8354 2.7526class B euR 2.5462 2.6741 2.4490class B usd 2.0208 2.1190 1.9673
class B (acc) sGd 1.1978 1.2122 1.1321class B (inc)^ sGd – 1.2122 1.1321
sterling B (inc) GBp 2.4713 2.4246 2.3479class c euR 3.0634 3.2106 2.9328class c usd 2.1708 2.2707 2.1028
class G (acc) euR 1.1204 1.1747 1.0732class h (acc) (hedged) usd 1.0259 1.0709 –class i (acc) (hedged)^ usd 1.0465 – –class J (acc) (hedged) sGd 1.2244 1.2839 1.1646
class s euR 3.1112 3.2559 2.9637class s (acc) 1 usd 1.0812 1.1297 1.0423
class W euR 2.2525 2.3573 2.1506class W usd 1.9510 2.0384 1.8852
class W (hedged) usd 2.3179 2.4048 2.1668class W (acc) (hedged) sGd 1.0965 1.1452 1.0346
class W (inc) usd 1.8531 1.9465 1.8003sterling W (acc) GBp 2.5278 2.4706 2.3833
03613-1C.indd 391 19/08/2020 19:03

392
BNY MelloN GloBal FuNds, plc
Notes to the FiNaNcial statemeNts
14. NET ASSET VALUE cont’d.
Fund Share Class Currency 30 June 2020 31 December 2019 30 June 2019
BNY Mellon Long-Term Global Equity Fund cont’d.Net asset value per: class W (inc)^ euR 1.0039 – –
sterling W (inc) GBp 2.4004 2.3589 2.2755class X (acc) usd 1.1813 1.2295 1.1325
sterling X GBp 2.2550 2.1954 2.1093
BNY Mellon Mobility Innovation FundTotal net assets USD 194,333,411 154,707,836 101,552,107Net asset value per: class a (acc) usd 1.0784 1.0113 0.9212
class a (acc) euR 1.2156 1.1418 1.0260class a (inc) usd 1.0782 1.0111 0.9210class a (inc) euR 1.1194 1.0514 0.9447
class B (acc) usd 1.0877 1.0177 0.9249class c (acc) usd 1.1126 1.0385 –class c (acc) euR 1.0953 1.0240 –class c (inc) euR 1.1377 1.0655 0.9528
class e (acc) usd 1.1087 1.0323 0.9333class e (acc) chF 1.2201 1.1604 1.0583class e (acc) euR 1.1507 1.0731 0.9572class e (acc) sGd – – 1.0683
class e (acc) (hedged) chF 1.2351 1.1688 1.0730class e (acc) (hedged) euR 1.2225 1.1588 1.0627
class e (acc) (hedged)^ sGd – 1.1877 1.0780sterling e (acc) (hedged) GBp 1.0511 1.0011 0.9141
class G (acc)^ euR 1.0224 – –class h (acc) (hedged) euR 1.0117 0.9659 0.8922class h (inc) (hedged) euR 1.0110 0.9654 0.8918class J (acc) (hedged) euR 1.2015 1.1445 1.0548
class K (acc) usd 1.2692 1.1876 1.0792class K (acc) (hedged) chF 1.2019 1.1431 1.0548class K (acc) (hedged) euR 1.2026 1.1456 1.0557class K (acc) (hedged) sGd – – 1.0711
class K (inc) usd 1.2692 1.1876 1.0793class K (inc) (hedged) chF 1.2009 1.1421 1.0540class K (inc) (hedged) euR 1.2012 1.1442 1.0548class K (inc) (hedged) sGd 1.2406 1.1743 1.0711
sterling K (acc) (hedged) GBp 1.2109 1.1591 1.0635sterling K (inc) (hedged) GBp – – 1.0635
class W (acc) usd 1.1022 1.0278 0.9307class W (acc) (hedged) euR 1.0342 0.9817 0.9016
sterling W (acc)^ GBp – 1.0406 –class W (inc) usd 1.0977 1.0269 0.9299
class W (inc) (hedged) euR 1.0289 0.9797 0.8998
BNY Mellon S&P 500® Index TrackerTotal net assets USD 32,858,701 50,804,733 76,108,296Net asset value per: class a usd 2.8195 2.9378 2.6716
class a euR 2.5086 2.6179 2.3485class c usd 3.2162 3.3395 3.0265class c euR 2.7150 2.8231 2.5236
class G (acc)^ euR – 1.1090 –
03613-1C.indd 392 19/08/2020 19:03

393
BNY MelloN GloBal FuNds, plc
Notes to the FiNaNcial statemeNts
14. NET ASSET VALUE cont’d.
Fund Share Class Currency 30 June 2020 31 December 2019 30 June 2019
BNY Mellon Small Cap Euroland FundTotal net assets EUR 49,106,383 74,850,283 65,998,225Net asset value per: class a euR 4.9204 5.6223 5.1197
class a usd 1.1814 1.3523 1.2484class B euR 2.4964 2.8456 2.5847class c euR 5.7448 6.5314 5.9170class c usd 1.2982 1.4785 1.3580
class W (acc) euR 0.9356 1.0625 0.9613sterling W (acc) GBp 1.6403 1.7332 1.6552
BNY Mellon Sustainable Global Dynamic FundTotal net assets EUR 220,293,946 180,183,426 165,904,274Net asset value per: class a (acc) euR 1.0169 1.0259 1.0232
class a (acc)^ usd 1.0036 – –class a (inc) euR 1.0083 1.0199 1.0225
class c (acc) euR 1.0234 1.0300 1.0246class e (acc) euR 1.0329 1.0368 1.0286
class e (acc) (hedged) chF 0.9940 1.0001 –class G (acc) euR 1.0235 1.0300 1.0246
class h (acc) (hedged)^ chF 0.9861 – –class h (acc) (hedged) NoK 10.0516 10.1131 9.9904
class W (acc) euR 1.0293 1.0346 1.0280class W (acc) (hedged)^ chF 0.9891 – –
class W (acc) (hedged) NoK 10.1294 10.1533 9.9918class W (acc) (hedged)^ usd 0.9987 – –
sterling W (acc) (hedged)^ GBp 0.9928 – –sterling W (inc) (hedged) GBp 0.9915 1.0007 –
class X (acc) euR 1.0363 1.0388 1.0294
BNY Mellon Sustainable Global Real Return Fund*Total net assets EUR 25,045,166 – –Net asset value per: class a (acc)^ euR 0.9685 – –
class a (inc)^ euR 0.9686 – –class e (acc)^ euR 0.9729 – –
class e (acc) (hedged)^ euR 0.9772 – –class e (inc)^ euR 0.9725 – –
class G (acc)^ euR 1.0354 – –class W (acc)^ euR 0.9715 – –
sterling W (acc) (hedged)^ GBp 0.9627 – –class W (inc)^ euR 0.9716 – –
sterling W (inc) (hedged)^ GBp 0.9627 – –
BNY Mellon Targeted Return Bond FundTotal net assets USD 80,441,328 84,505,101 81,046,471Net asset value per: class a (acc) usd 1.0154 0.9897 0.9861
sterling W (acc) (hedged) GBp 0.9934 0.9714 0.9719
BNY Mellon U.S. Dynamic Value FundTotal net assets USD 28,812,983 28,865,549 23,580,731Net asset value per: class a usd 2.6124 3.2641 2.9828
class a euR 2.2889 2.8645 2.5822class B usd 1.9197 2.3927 2.1810
03613-1C.indd 393 19/08/2020 19:03

394
BNY MelloN GloBal FuNds, plc
Notes to the FiNaNcial statemeNts
14. NET ASSET VALUE cont’d.
Fund Share Class Currency 30 June 2020 31 December 2019 30 June 2019
BNY Mellon U.S. Dynamic Value Fund cont’d.Net asset value per: class c usd 3.0107 3.7438 3.4037
class c euR 2.8393 3.5342 3.1684class W (acc)^ usd – 1.1876 1.0784
BNY Mellon U.S. Equity Income FundTotal net assets USD 270,302,363 419,124,854 392,893,272Net asset value per: class a (acc) euR 0.9114 1.1773 1.0615
class B (inc) usd 0.8527 1.1123 1.0206class c (inc) usd 0.9318 1.2123 1.1154
class e (acc) euR 0.9419 1.2073 1.0800class e (inc) usd 0.9420 1.2223 1.1214class e (inc) euR 0.9175 1.1923 1.0790
sterling e (acc) GBp 1.0246 1.2265 1.1600sterling e (inc) GBp 0.9504 1.1535 1.1038
sterling e (inc) (hedged) GBp 0.8752 1.1704 1.0824class W (acc) usd 1.0132 1.2985 1.1793class W (acc) euR 0.9094 1.1673 1.0458class W (inc) usd 0.9397 1.2211 1.1220
sterling W (inc) GBp 0.9407 1.1434 1.0959
BNY Mellon U.S. Municipal Infrastructure Debt FundTotal net assets USD 502,456,334 438,605,770 338,138,868Net asset value per: class a (acc)^ usd 1.0009 – –
class c (acc) usd 1.2195 1.1713 1.1465class e (acc) usd 1.1696 1.1223 1.0973
class e (acc) (hedged) chF 1.0711 1.0431 1.0370class e (acc) (hedged) euR 1.1257 1.0941 1.0860class e (inc) (hedged) euR 1.0178 1.0079 1.0194
class h (acc) (hedged) euR 1.0997 1.0730 1.0693class h (inc) (hedged) euR 0.9948 0.9887 1.0035
class i (inc) (hedged) euR – – 1.0131class W (acc) usd 1.2234 1.1745 1.1490class W (acc) euR 1.0265 0.9871 –
class W (acc) (hedged) chF 1.0889 1.0610 1.0552class W (acc) (hedged) euR 1.1224 1.0916 1.0832
class W (inc) usd 1.0829 1.0591 1.0440class W (inc) (hedged) chF 1.0484 1.0405 1.0470class W (inc) (hedged) euR 1.0136 1.0044 1.0163
class X (acc) usd 1.1841 1.1342 1.1071
BNY Mellon U.S. Opportunistic Alpha Fund**Total net assets USD – – 4,752,035Net asset value per: class a (acc) usd – – 0.9420
class a (acc) euR – – 0.9449class c (acc) usd – – 0.9471class e (acc) usd – – 0.9933class e (inc) usd – – 0.9933
class G (acc) usd – – 0.9471class W (acc) usd – – 0.9484
03613-1C.indd 394 19/08/2020 19:03

395
BNY MelloN GloBal FuNds, plc
Notes to the FiNaNcial statemeNts
14. NET ASSET VALUE cont’d.
Fund Share Class Currency 30 June 2020 31 December 2019 30 June 2019
BNY Mellon US Opportunities Fund**Total net assets USD – – 10,522,642Net asset value per: class a euR – – 1.5405
class a (inc) euR – – 1.5152class c usd – – 1.3569class c euR – – 1.6209
class W (acc) usd – – 1.0471
* please refer to Note 18 of the financial statements. ** this Fund closed during the prior financial year. *** the comparatives of BNY mellon asian income Fund for 30 June 2019 are disclosed in sterling. ^ this share class was launched or closed during the financial period.
15. RISK MANAGEMENT OBJECTIVES AND POLICIES
STRATEGY IN USING FINANCIAL INSTRUMENTSThe Company’s investment activities expose it to the various types of risk, which are associated with the financial instruments and markets in which it invests: market risk (including market price risk, interest rate risk and currency risk), credit risk and liquidity risk. The Company has in place risk management programmes that seek to limit the potential adverse effects of these risks on the Funds’ financial performances.
The assets of each Fund will be invested separately in accordance with the investment objectives and policies of the relevant Fund, which are set out in the relevant supplements to the prospectus. Where a Fund maintains in its name reference to a particular currency, country, region, economic sector or type of security, at least three quarters of the assets of that Fund will comprise investments corresponding to the relevant currency, country, region, economic sector or type of security (as appropriate).
The Funds may use FDI for efficient portfolio management purposes or to protect against foreign exchange risks. Some Funds have the facility to use FDI for investment purposes according to the Central Bank UCITS Regulations. In their Risk Management Process (“RMP”), it explains whether each Fund uses the commitment approach or Value at Risk (“VaR”) to calculate its global exposure. The commitment approach measures the leverage effect produced by the use of derivatives and is calculated by converting all derivative positions, whether used as part of the Fund’s general investment policy, for purposes of risk reduction or for the purpose of efficient portfolio management, based on the market values of the underlying assets or contracts. VaR for a pre-defined time horizon measures the threshold loss in value of a portfolio of financial instruments that may be exceeded for a given probability (either Absolute[1] or Relative[2]). The quality of the VaR model forecasts is demonstrated by back-testing. As a complement to VaR, stress testing is used to evaluate the potential impact on portfolio values of extreme, although plausible, events or movements in a set of financial variables.
For a more detailed discussion, the RMP for each of the Funds is available on request.
[1] This is defined as the VaR of the Fund capped as a percentage of NAV.[2] This is defined as the VaR of the Fund divided by the VaR of a benchmark or reference portfolio.
FINANCIAL RISK MANAGEMENT PROCESSIn order to achieve its investment objectives, the Company buys, sells and holds financial assets and liabilities. As a consequence, the Company is exposed to market price risk, interest rate risk, currency risk, credit risk and liquidity risk arising from the financial instruments it holds. The Company’s overall risk management programme focuses on the unpredictability of financial markets and seeks to minimise potential adverse effects on the Company’s financial performance. The Company uses FDI to moderate certain risk exposures.
The risk management policies employed by the Company to manage these risks are discussed below.
03613-1C.indd 395 19/08/2020 19:03

396
BNY MelloN GloBal FuNds, plc
Notes to the FiNaNcial statemeNts
15. RISK MANAGEMENT OBJECTIVES AND POLICIES cont’d.
INVESTMENT RISKActivities of each Fund expose it to a variety of financial risks: market risk (including market price risk, interest rate risk and currency risk), credit risk and liquidity risk.
MARKET RISKMarket risk is the risk that the fair value of a financial instrument will fluctuate because of changes in market prices. Market risk comprises three types of risk: market price risk, interest rate risk and currency risk.
MARKET PRICE RISKMarket price risk is the risk that the fair value of a financial instrument will fluctuate because of changes in market prices (other than those arising from interest rate risk and currency risk), whether those changes are caused by factors specific to individual financial instruments or its issuer, or other factors affecting similar financial instruments traded in the market.
Many of the Funds trade in financial instruments, taking positions in traded securities in the equity and equity derivative markets. The investments of the Funds are subject to market fluctuations and there can be no assurances that investments will appreciate in value, therefore presenting a risk of loss of capital.
The Investment Managers manage market price risk through building diversified investment portfolios across a range of industry and/or geographic sectors as is appropriate for the Funds and in accordance with the Central Bank UCITS Regulations and the investment objectives of the Funds. An analysis of exposures to market price risk is provided in the Schedule of Investments for each Fund. The market positions of the Funds are monitored on a daily basis by the Investment Managers, reviewed on a monthly basis by the Investment Management Oversight Committee and on a quarterly basis by the Board of Directors.
The Company’s market risk strategy is driven by the Company’s investment risk and return objectives. The Board of Directors has instructed the Investment Managers to manage each of the risks in accordance with an established risk management system.
VaR is the risk measurement methodology used to assess the Funds’ leverage and market risk volatility. When the VaR is calculated as a percentage of the net asset value of the Funds (absolute or relative VaR), it may not be greater than the Regulatory limits, as detailed in the prospectus. VaR is calculated on a daily basis using a one-tailed 99% confidence level and pre-determined holding period on either an absolute (where the figure is compared to the net asset value of the fund) or relative basis (where VaR is compared to the benchmark or reference portfolio). The historical observation period will not be less than one year unless a shorter period is justified.
Some limitations of VaR analysis are:
- the models’ methodologies are based on historical data and cannot take account of the fact that future market price movements, correlations between markets and levels of market liquidity in conditions of market stress may bear no relation to historical patterns;
- the market price risk information is a relative estimate of risk rather than a precise and accurate number; and the market price information represents a hypothetical outcome and is not intended to be predictive.
Leverage is calculated as the sum of the notionals of the derivatives used. (This may be supplemented with leverage calculated on the basis of a commitment approach. The creation of leveraged exposure to an index via FDI, or the inclusion of a leverage feature in an index, must also be taken into account in meeting the prospectus disclosure requirements).
INTEREST RATE RISKInterest rate risk is defined as the risk that the fair value of a financial instrument will fluctuate because of changes in market interest rates. This risk arises on financial instruments whose fair value is affected by changes in interest rates.
03613-1C.indd 396 19/08/2020 19:03

397
BNY MelloN GloBal FuNds, plc
Notes to the FiNaNcial statemeNts
15. RISK MANAGEMENT OBJECTIVES AND POLICIES cont’d.
INTEREST RATE RISK cont’d.The majority of the Company’s financial assets and liabilities i.e. those Funds holding substantially equity or equity derivative instruments are non-interest bearing, as a result, these assets are not subject to significant amounts of risk due to fluctuations in the prevailing levels of market interest rates. Any excess cash and cash equivalents are invested at short-term market interest rates.
For those Funds holding primarily interest bearing securities and as such exposed to the risk of fluctuations in the prevailing levels of market interest rates, the Investment Managers monitor the Funds’ exposure to interest fluctuations on a daily basis. Whilst primarily an investment decision, the Investment Managers employ proprietary systems and processes to best position the Funds to benefit from or limit the risk of any fluctuations in the prevailing market levels of market interest rates.
The Investment Managers will endeavour to acquire interest bearing securities in liquid markets. However, not all securities invested by the Funds will be listed or rated and consequently liquidity may be low. Moreover the accumulation and disposal of holdings in some securities may be time consuming and need to be conducted at unfavourable prices. The Funds may also encounter difficulties in disposing of assets at their fair price due to adverse market conditions leading to limited liquidity. The financial markets of emerging market countries in general, are less liquid than those of the more developed nations. Purchases and sales of investments may take longer than would otherwise be expected on developed stock markets and transactions may need to be conducted at unfavourable prices.
CURRENCY RISKCurrency risk is the risk that a fair value of a financial instrument will fluctuate because of changes in foreign exchange rates. The risk arises on financial instruments that are denominated in a currency other than the functional currency in which they are measured.
The Investment Managers monitor the Company’s currency position on a daily basis and may act to manage the Company’s currency exposure through the use of FDI such as forward foreign currency contracts or options. The Investment Managers of hedged non-base share classes may also use derivative instruments such as forward foreign currency contracts or options as a key component of their operating strategy. Currency risk does not arise from financial instruments denominated in the functional currency.
CREDIT RISKCredit risk is the risk that one party to a financial instrument will cause a financial loss for the other party by failing to discharge an obligation. This includes counterparty risk and issuer risk. Financial assets, which potentially expose the Company to credit risk, consist principally of interest bearing securities such as bonds, financial derivative instruments and investments in cash balances and deposits with and receivable from brokers.
The extent of the Company’s exposure to credit risk in respect of these financial assets approximates their carrying values as recorded in the Statement of Financial Position.
The Investment Managers manage issuer risk through building diversified portfolios with a limited concentration of exposure (10%) to any one issuer in accordance with the Central Bank UCITS Regulations and the investment objectives of the Funds. Additionally, if required the Investment Managers will limit ownership of debt instruments to those instruments carrying a credit rating equal to or in excess of that provided for in the individual investment objectives of the Funds.
Substantially all of the assets of the Company are held by the Depositary. Bankruptcy or insolvency of the Depositary may cause the Company’s rights with respect to securities and other positions held by the Depositary to be delayed or limited.
The Company only transacts with depositaries that are regulated entities subject to prudential supervision, or with high credit ratings assigned by international credit-rating agencies. The Directors monitor the credit quality of the Depositary, The Bank of New York Mellon SA/NV, Dublin Branch, on a quarterly basis in order to mitigate risk. Its long-term senior debt and long-term deposit rating by Standard & Poor’s is AA- (31 December 2019: AA-) as at the end of the financial period.
03613-1C.indd 397 19/08/2020 19:03

398
BNY MelloN GloBal FuNds, plc
Notes to the FiNaNcial statemeNts
15. RISK MANAGEMENT OBJECTIVES AND POLICIES cont’d.
CREDIT RISK cont’d.The Company’s securities and other positions are segregated from the assets of either the Depositary or its agents. Thus in the event of insolvency or bankruptcy of the Depositary, the Company’s securities and other positions are segregated from those of the Depositary or its agents. The Company will, however, be exposed to the credit risk of the Depositary, or any custodian used by the Depositary, in relation to the Company’s cash held by the Depositary and the subscription and redemption cash collection accounts held by the Global Sub-Custodian. In the event of insolvency or bankruptcy of the Depositary, the Company will be treated as a general creditor of the Depositary in relation to cash holdings of the Company.
Counterparty/issuer risk is monitored in the following manner:
- Each Investment Manager maintains an Approved Broker list which is subject to ongoing monitoring. The trading system only permits trading with approved brokers. New brokers are added, subject to a formal review process that includes a review of the broker’s creditworthiness and financial strength.
- Measurement and monitoring of counterparty or issuer trade exposure is conducted daily and consists of reviewing all outstanding positions held.
The permanent risk function of the Company oversees this process as well as performing independent checks.
For Funds using the cash sweep management, cash balances are automatically swept into the short-term investment vehicle daily before the designated dealing time for the Funds. The cash investment auto-sweep is part of the daily cash management procedure. All money market funds available through the cash sweep management are triple-A rated by Standard & Poor’s and Moody’s and maintains a stable net asset value. US dollar, Euro and Sterling prime and treasury funds are available for investments, in addition to a number of funds in additional currencies, depending on the domicile of the investor and the tax implications.
All transactions in listed securities are settled or paid upon delivery using approved brokers. The risk of broker default is considered minimal as delivery of securities sold is only made once the broker has received payment. Payment is made on a purchase once the securities have been received by the broker.
Credit default swaps provide a measure of protection against defaults of debt issuers. The use of credit default swaps does not assure their use will be effective or will have the desired result. The credit events are specified in the contract and are intended to identify the occurrence of a significant deterioration in the creditworthiness of the reference asset. As a seller of protection on credit default swaps, the Funds will generally receive from the buyer of protection a fixed rate of income throughout the term of the swap provided that there is no credit event. As the seller, the Funds would effectively add leverage to their portfolios because, in addition to their total net assets, the Funds would be subject to investment exposure on the notional amounts of the swaps.
The maximum potential amount of future payments (undiscounted) that a Fund as a seller of protection could be required to make under a credit default swap equals the notional amount of the agreement. These potential amounts would be partially offset by any recovery values of the respective referenced obligations, upfront payments received upon entering into the agreement, or net amounts received from the settlement of buy protection credit default swap entered into by the Funds for the same referenced entity or entities.
Where possible the Company restricts its exposure to credit losses on the trading derivative instruments it holds by entering into master netting arrangements which is a bilateral agreement between the Funds and the counterparties (approved brokers) with whom the Funds undertake a significant volume of over-the-counter derivative transactions (including total return swaps). Derivatives are held with counterparties on an unsegregated basis. Master netting arrangements do not result in an offset of balance sheet assets and liabilities, as transactions are usually settled on a gross basis. However, the credit risk associated with favourable contracts is reduced by a master netting arrangement to the extent that if an event of default occurs, all amounts with the counterparty are terminated and settled on a net basis. The Company’s overall exposure to credit risk on derivative instruments subject to a master netting arrangement can change substantially within a short period, as it is affected by each transaction subject to the arrangement.
03613-1C.indd 398 19/08/2020 19:03

399
BNY MelloN GloBal FuNds, plc
Notes to the FiNaNcial statemeNts
15. RISK MANAGEMENT OBJECTIVES AND POLICIES cont’d.
CREDIT RISK cont’d.Certain over-the-counter derivatives are cleared through central clearing houses. Under this arrangement, over-the-counter trades entered with counterparties are given up to clearing houses, which after acceptance effectively replace the counterparty for the risk aspects of the trade.
The Company employs a risk management process which will enable it to measure, monitor and manage the risks attached to financial derivative positions and details of this process have been provided to the Central Bank.
For the purpose of providing margin or collateral in respect of transactions in financial derivative instruments, the Funds of the Company may transfer, mortgage, charge or encumber any assets or cash forming part of the Funds. The Funds may also be exposed to a credit risk in relation to the counterparties with whom they transact or place margin or collateral in respect of transactions in financial derivative instruments and may bear the risk of counterparty default.
The Funds may receive cash and eligible non-cash collateral in relation to derivative trading to reduce counterparty exposure. Cash collateral received by each Fund is shown as an asset in the Statement of Financial Position, which is offset by a corresponding liability.
Those Funds entering into securities lending arrangements are also exposed to counterparty risk. To minimise such risk, collateral is held, exceeding in value the amount of securities on loan. Details of these are provided in Note 13 of the financial statements.
A number of Funds have investments in leveraged loans which are held on an unsegregated basis with the agent banks. These loans are not held with the Depositary and accordingly the Funds are subject to the credit risk of the borrower. The Funds are also subject to the credit risk of the agent banks.
LIQUIDITY RISKLiquidity risk is the risk that the Company may not be able to generate sufficient cash resources to settle its obligations in full as they fall due or can only do so on terms that are materially disadvantageous.
The Company is exposed to the daily settlement of margin calls on derivatives and to daily cash redemptions of redeemable participating shares. Each Fund therefore invests the majority of its assets in investments that are traded in an active market and can be readily disposed of; it invests only a limited proportion of its assets in investments not actively traded on a listed exchange. Listed securities of each Fund are considered readily realisable, as they are listed on a regulated stock exchange.
The Investment Managers utilise derivative instruments and debt securities, if appropriate, such as exchange traded index future contracts to allow exposure to markets whilst maintaining sufficient liquidity.
Where any Fund acquires securities on the over-the-counter markets, there is no guarantee that the Fund will be able to realise the fair value of such securities due to their tendency to have limited liquidity and comparatively high price volatility.
The Company has the ability to borrow in the short term to ensure settlement. An overdraft facility is in place and has been utilised for settlement liquidity purposes. The Depositary shall be entitled to use available cash in the Fund’s account and to liquidate securities in the account as is necessary to meet the Fund’s obligations in connection with the provision of an overdraft facility to the Fund and/or unpaid amounts.
The Company’s financial assets and liabilities are held for trading and are acquired principally for the purpose of selling in the short term. As these securities are not expected to be held to maturity or termination, the current market value represents the estimated cash flow that may be required to dispose of the securities. Future cash flows of the Funds and realised liabilities may differ from current liabilities based on changes in market conditions.
03613-1C.indd 399 19/08/2020 19:03

400
BNY MelloN GloBal FuNds, plc
Notes to the FiNaNcial statemeNts
15. RISK MANAGEMENT OBJECTIVES AND POLICIES cont’d.
LIQUIDITY RISK cont’d.Redeemable shares are redeemed on demand at the holders’ option. However, the Directors do not envisage that the contractual maturity will be representative of the actual cash outflows, as holders of these instruments typically retain them for the medium to long term.
In order to manage the Company’s overall liquidity and to facilitate an orderly disposition of securities, the Directors are able to refuse to repurchase any shares in excess of one tenth of the shares in issue in a Fund on any one valuation day by way of the provisions in the prospectus.
NUMBER OF SHAREHOLDERSThe Company did not have less than 10 redeemable participating shareholders at the end of the current financial period and prior financial period.
CAPITAL RISK MANAGEMENTThe capital of the Funds is represented by the net assets at the end of the financial period. The amount of net assets can change significantly on a daily basis as the Funds are subject to daily subscriptions and redemptions at the discretion of shareholders. The Funds’ objective when managing capital is to safeguard the Funds’ ability to continue as a going concern in order to provide returns for shareholders and benefits for other stakeholders and to maintain a strong capital base to support the development of the investment activities of the Funds.
In order to maintain or adjust the capital structure, it is part of the Company’s policy to perform the following:
- The level of daily subscriptions and redemptions relative to the assets it expects to be able to liquidate is monitored and the amount of distributions payable to redeemable participating shareholders is adjusted accordingly.
- Redeemable participating shares are issued and redeemed in accordance with the prospectus and supplements of the Funds, which include the ability to restrict redemptions and requirement for certain minimum holdings and subscriptions.
FAIR VALUE ESTIMATIONThe Company has classified fair value measurements using a fair value hierarchy that reflects the significance of the inputs used in making the measurements. The fair value hierarchy has the following levels:
Level 1: Quoted prices (unadjusted) in active markets for identical assets or liabilities.
Level 2: Inputs other than quoted prices included within level 1 that are observable for the asset or liability, either directly (that is, as prices) or indirectly (that is, derived from prices).
Level 3: Inputs for the asset or liability that are not based on observable market data (that is, unobservable inputs).
Instruments whose values are based on quoted market prices in active markets, and therefore classified within level 1, include active listed equities, exchange traded funds and derivatives, highly liquid government bonds (G7 countries), certificate of deposit and other quoted securities. The Company does not adjust the quoted price for these instruments.
Financial instruments that trade in markets that are not considered to be active but are valued based on quoted market prices, dealer quotations or alternative pricing sources supported by observable inputs are classified within level 2. These include investment-grade government (non-G7 countries) and corporate bonds, over-the-counter derivatives, collective investment schemes, money market instruments, P-Notes and certain listed equities. As level 2 investments include positions that are not traded in active markets and/or are subject to transfer restrictions, valuations may be adjusted to reflect illiquidity and/or non-transferability, which are generally based on available market information.
Investments classified within level 3 have significant unobservable inputs, as they trade infrequently. Level 3 instruments include leveraged loans and corporate debt securities which are priced at costs or fair valued using single broken quote.
03613-1C.indd 400 19/08/2020 19:03
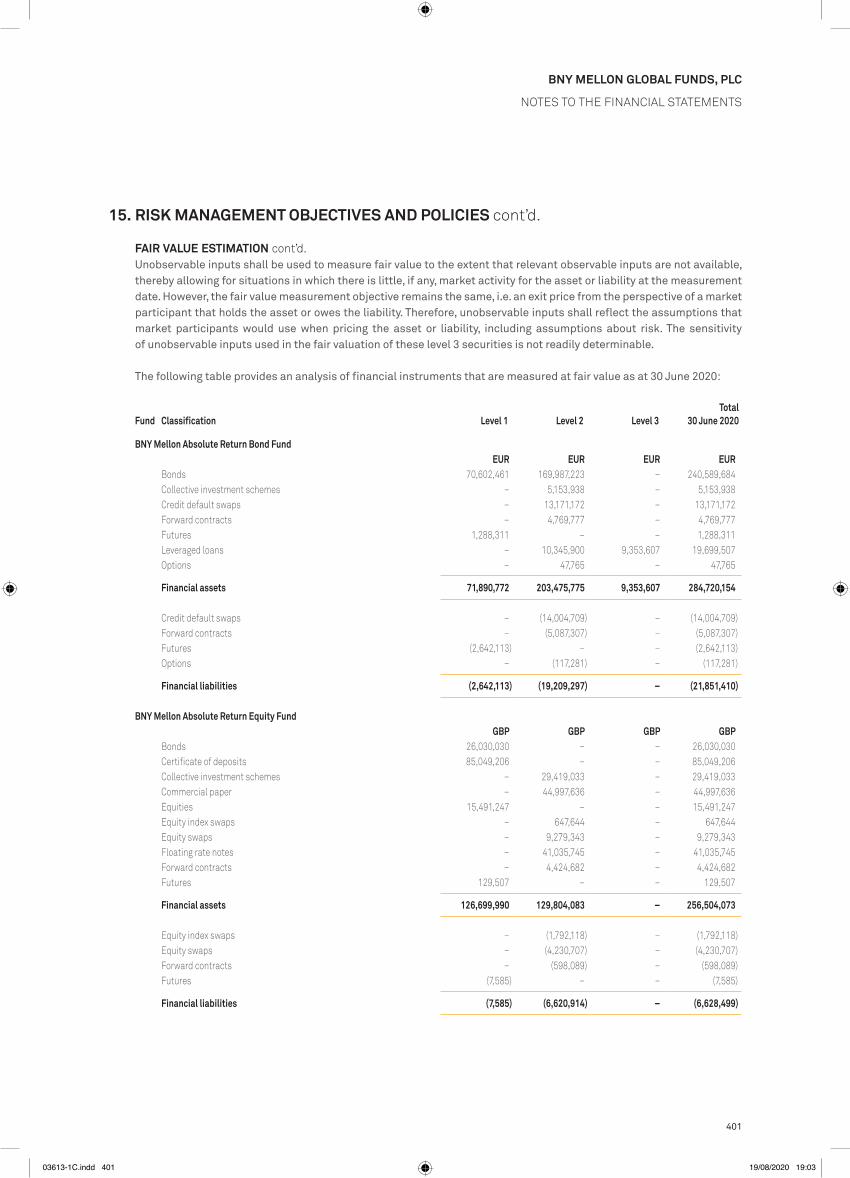
401
BNY MelloN GloBal FuNds, plc
Notes to the FiNaNcial statemeNts
15. RISK MANAGEMENT OBJECTIVES AND POLICIES cont’d.
FAIR VALUE ESTIMATION cont’d.Unobservable inputs shall be used to measure fair value to the extent that relevant observable inputs are not available, thereby allowing for situations in which there is little, if any, market activity for the asset or liability at the measurement date. However, the fair value measurement objective remains the same, i.e. an exit price from the perspective of a market participant that holds the asset or owes the liability. Therefore, unobservable inputs shall reflect the assumptions that market participants would use when pricing the asset or liability, including assumptions about risk. The sensitivity of unobservable inputs used in the fair valuation of these level 3 securities is not readily determinable.
The following table provides an analysis of financial instruments that are measured at fair value as at 30 June 2020:
Fund Classification Level 1 Level 2 Level 3Total
30 June 2020
BNY Mellon Absolute Return Bond FundEUR EUR EUR EUR
Bonds 70,602,461 169,987,223 – 240,589,684collective investment schemes – 5,153,938 – 5,153,938credit default swaps – 13,171,172 – 13,171,172Forward contracts – 4,769,777 – 4,769,777Futures 1,288,311 – – 1,288,311leveraged loans – 10,345,900 9,353,607 19,699,507options – 47,765 – 47,765
Financial assets 71,890,772 203,475,775 9,353,607 284,720,154
credit default swaps – (14,004,709) – (14,004,709)Forward contracts – (5,087,307) – (5,087,307)Futures (2,642,113) – – (2,642,113)options – (117,281) – (117,281)
Financial liabilities (2,642,113) (19,209,297) – (21,851,410)
BNY Mellon Absolute Return Equity FundGBP GBP GBP GBP
Bonds 26,030,030 – – 26,030,030certificate of deposits 85,049,206 – – 85,049,206collective investment schemes – 29,419,033 – 29,419,033commercial paper – 44,997,636 – 44,997,636equities 15,491,247 – – 15,491,247equity index swaps – 647,644 – 647,644equity swaps – 9,279,343 – 9,279,343Floating rate notes – 41,035,745 – 41,035,745Forward contracts – 4,424,682 – 4,424,682Futures 129,507 – – 129,507
Financial assets 126,699,990 129,804,083 – 256,504,073
equity index swaps – (1,792,118) – (1,792,118)equity swaps – (4,230,707) – (4,230,707)Forward contracts – (598,089) – (598,089)Futures (7,585) – – (7,585)
Financial liabilities (7,585) (6,620,914) – (6,628,499)
03613-1C.indd 401 19/08/2020 19:03

402
BNY MelloN GloBal FuNds, plc
Notes to the FiNaNcial statemeNts
15. RISK MANAGEMENT OBJECTIVES AND POLICIES cont’d.
FAIR VALUE ESTIMATION cont’d.
Fund Classification Level 1 Level 2 Level 3Total
30 June 2020
BNY Mellon Absolute Return Global Convertible FundEUR EUR EUR EUR
Bonds 17,138,376 6,221,152 – 23,359,528collective investment schemes – 2,594,748 – 2,594,748equity swaps – 244,051 – 244,051Forward contracts – 37,686 – 37,686Futures 14,419 – – 14,419preferred bonds – 2,307,341 – 2,307,341total return swaps – 2,337,624 – 2,337,624
Financial assets 17,152,795 13,742,602 – 30,895,397
equity swaps – (1,875,470) – (1,875,470)Forward contracts – (4,594) – (4,594)Futures (10,347) – – (10,347)total return swaps – (127,150) – (127,150)
Financial liabilities (10,347) (2,007,214) – (2,017,561)
BNY Mellon Asia Rising Stars FundUSD USD USD USD
equities 6,004,993 168,111 – 6,173,104Forward contracts – 128 – 128p-Notes – 709,117 – 709,117
Financial assets 6,004,993 877,356 – 6,882,349
Forward contracts – (8,289) – (8,289)
Financial liabilities – (8,289) – (8,289)
BNY Mellon Asian Equity FundUSD USD USD USD
equities 37,417,306 190,330 – 37,607,636Forward contracts – 148 – 148
Financial assets 37,417,306 190,478 – 37,607,784
Forward contracts – (568) – (568)
Financial liabilities – (568) – (568)
BNY Mellon Asian Income FundUSD USD USD USD
collective investment schemes – 1,076,297 – 1,076,297equities 24,064,650 3,331,127 – 27,395,777Forward contracts – 5 – 5
Financial assets 24,064,650 4,407,429 – 28,472,079
Forward contracts – (3) – (3)
Financial liabilities – (3) – (3)
03613-1C.indd 402 19/08/2020 19:03

403
BNY MelloN GloBal FuNds, plc
Notes to the FiNaNcial statemeNts
15. RISK MANAGEMENT OBJECTIVES AND POLICIES cont’d.
FAIR VALUE ESTIMATION cont’d.
Fund Classification Level 1 Level 2 Level 3Total
30 June 2020
BNY Mellon Brazil Equity FundUSD USD USD USD
equities 51,756,103 7,923,679 – 59,679,782Forward contracts – 7,152 – 7,152
Financial assets 51,756,103 7,930,831 – 59,686,934
Forward contracts – (68,926) – (68,926)
Financial liabilities – (68,926) – (68,926)
BNY Mellon Digital Assets FundUSD USD USD USD
equities 10,938,881 – – 10,938,881Forward contracts – 151 – 151
Financial assets 10,938,881 151 – 10,939,032
Forward contracts – (5,869) – (5,869)
Financial liabilities – (5,869) – (5,869)
BNY Mellon Dynamic Total Return FundUSD USD USD USD
Bonds 17,594,381 – – 17,594,381collective investment schemes 2,212,974 – – 2,212,974Forward contracts – 120,229 – 120,229Futures 222,601 – – 222,601options 1,929,651 – – 1,929,651
Financial assets 21,959,607 120,229 – 22,079,836
Forward contracts – (159,607) – (159,607)Futures (84,197) – – (84,197)options (103,200) – – (103,200)
Financial liabilities (187,397) (159,607) – (347,004)
BNY Mellon Dynamic U.S. Equity FundUSD USD USD USD
Bonds 30,488,824 – – 30,488,824equities 342,199,156 – – 342,199,156Forward contracts – 78 – 78Futures 266,364 – – 266,364options 3,337,581 – – 3,337,581
Financial assets 376,291,925 78 – 376,292,003
Forward contracts – (1,383) – (1,383)Futures (2,212) – – (2,212)
Financial liabilities (2,212) (1,383) – (3,595)
03613-1C.indd 403 19/08/2020 19:03
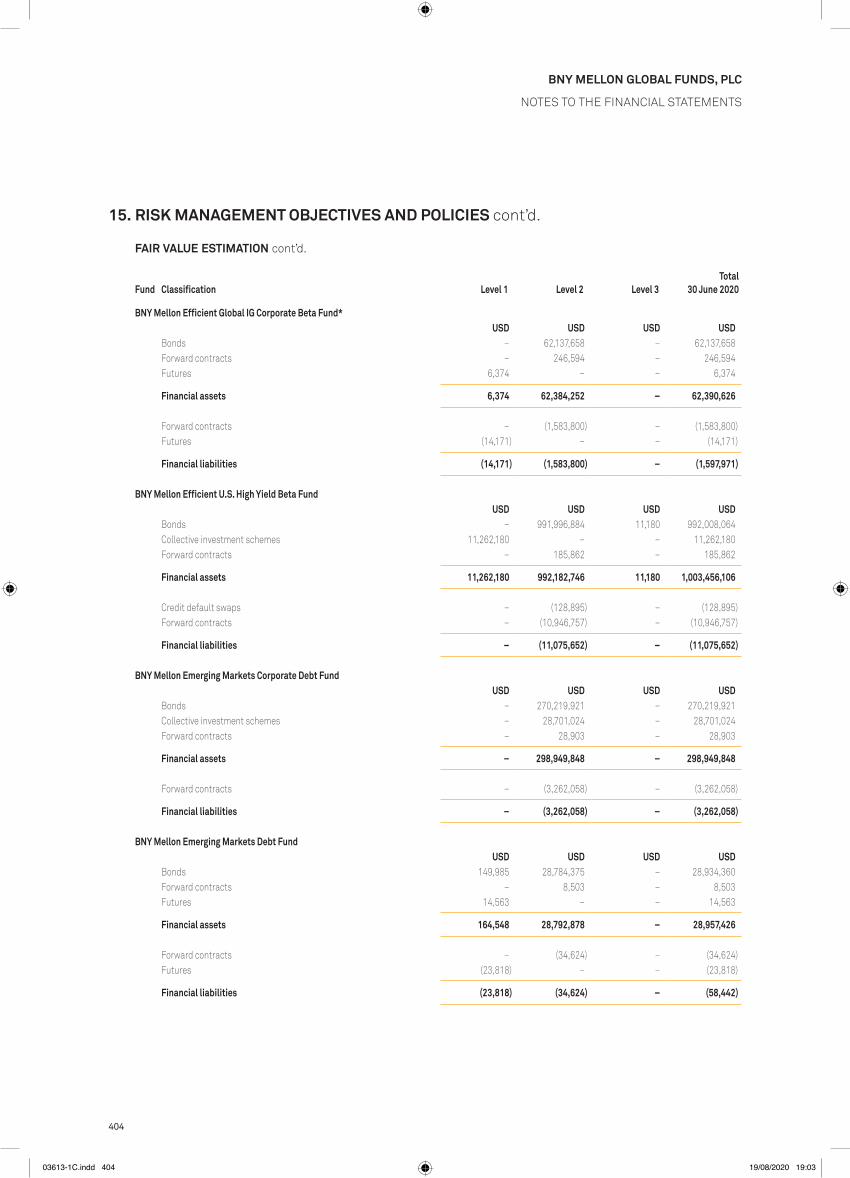
404
BNY MelloN GloBal FuNds, plc
Notes to the FiNaNcial statemeNts
15. RISK MANAGEMENT OBJECTIVES AND POLICIES cont’d.
FAIR VALUE ESTIMATION cont’d.
Fund Classification Level 1 Level 2 Level 3Total
30 June 2020
BNY Mellon Efficient Global IG Corporate Beta Fund*USD USD USD USD
Bonds – 62,137,658 – 62,137,658Forward contracts – 246,594 – 246,594Futures 6,374 – – 6,374
Financial assets 6,374 62,384,252 – 62,390,626
Forward contracts – (1,583,800) – (1,583,800)Futures (14,171) – – (14,171)
Financial liabilities (14,171) (1,583,800) – (1,597,971)
BNY Mellon Efficient U.S. High Yield Beta FundUSD USD USD USD
Bonds – 991,996,884 11,180 992,008,064collective investment schemes 11,262,180 – – 11,262,180Forward contracts – 185,862 – 185,862
Financial assets 11,262,180 992,182,746 11,180 1,003,456,106
credit default swaps – (128,895) – (128,895)Forward contracts – (10,946,757) – (10,946,757)
Financial liabilities – (11,075,652) – (11,075,652)
BNY Mellon Emerging Markets Corporate Debt FundUSD USD USD USD
Bonds – 270,219,921 – 270,219,921collective investment schemes – 28,701,024 – 28,701,024Forward contracts – 28,903 – 28,903
Financial assets – 298,949,848 – 298,949,848
Forward contracts – (3,262,058) – (3,262,058)
Financial liabilities – (3,262,058) – (3,262,058)
BNY Mellon Emerging Markets Debt FundUSD USD USD USD
Bonds 149,985 28,784,375 – 28,934,360Forward contracts – 8,503 – 8,503Futures 14,563 – – 14,563
Financial assets 164,548 28,792,878 – 28,957,426
Forward contracts – (34,624) – (34,624)Futures (23,818) – – (23,818)
Financial liabilities (23,818) (34,624) – (58,442)
03613-1C.indd 404 19/08/2020 19:03

405
BNY MelloN GloBal FuNds, plc
Notes to the FiNaNcial statemeNts
15. RISK MANAGEMENT OBJECTIVES AND POLICIES cont’d.
FAIR VALUE ESTIMATION cont’d.
Fund Classification Level 1 Level 2 Level 3Total
30 June 2020
BNY Mellon Emerging Markets Debt Local Currency FundUSD USD USD USD
Bonds 2,410,767 247,038,063 – 249,448,830Forward contracts – 1,540,732 – 1,540,732options – 20,750 – 20,750
Financial assets 2,410,767 248,599,545 – 251,010,312
Forward contracts – (3,086,226) – (3,086,226)options – (370,685) – (370,685)
Financial liabilities – (3,456,911) – (3,456,911)
BNY Mellon Emerging Markets Debt Opportunistic FundUSD USD USD USD
Bonds 19,998 28,797,830 – 28,817,828Forward contracts – 134,312 – 134,312Futures 250 – – 250options – 2,328 – 2,328
Financial assets 20,248 28,934,470 – 28,954,718
Forward contracts – (150,817) – (150,817)Futures (3,472) – – (3,472)options – (31,296) – (31,296)
Financial liabilities (3,472) (182,113) – (185,585)
BNY Mellon Emerging Markets Debt Total Return FundUSD USD USD USD
Bonds – 185,721,421 – 185,721,421collective investment schemes – 9,750,123 – 9,750,123Forward contracts – 1,229,122 – 1,229,122
Financial assets – 196,700,666 – 196,700,666
Forward contracts – (5,803,453) – (5,803,453)
Financial liabilities – (5,803,453) – (5,803,453)
BNY Mellon Euroland Bond FundEUR EUR EUR EUR
Bonds 81,855,731 418,887,595 – 500,743,326collective investment schemes – 15,454,797 – 15,454,797credit default swaps – 91,146 – 91,146Forward contracts – 204,079 – 204,079Futures 1,622,386 – – 1,622,386interest rate swaps – 2,492,707 – 2,492,707options – 491 – 491
Financial assets 83,478,117 437,130,815 – 520,608,932
credit default swaps – (498,200) – (498,200)Forward contracts – (877,792) – (877,792)Futures (1,600,252) – – (1,600,252)
Financial liabilities (1,600,252) (1,375,992) – (2,976,244)
03613-1C.indd 405 19/08/2020 19:03

406
BNY MelloN GloBal FuNds, plc
Notes to the FiNaNcial statemeNts
15. RISK MANAGEMENT OBJECTIVES AND POLICIES cont’d.
FAIR VALUE ESTIMATION cont’d.
Fund Classification Level 1 Level 2 Level 3Total
30 June 2020
BNY Mellon European Credit FundEUR EUR EUR EUR
Bonds – 65,554,285 – 65,554,285collective investment schemes – 2,956,339 – 2,956,339credit default swaps – 11,984 – 11,984Forward contracts – 135,276 – 135,276Futures 40,050 – – 40,050
Financial assets 40,050 68,657,884 – 68,697,934
Forward contracts – (18,887) – (18,887)Futures (24,240) – – (24,240)
Financial liabilities (24,240) (18,887) – (43,127)
BNY Mellon Global Bond FundUSD USD USD USD
Bonds 262,026,501 306,234,442 – 568,260,943collective investment schemes 16,781,381 – – 16,781,381Forward contracts – 1,382,086 – 1,382,086
Financial assets 278,807,882 307,616,528 – 586,424,410
Forward contracts – (938,251) – (938,251)Futures (328,855) – – (328,855)
Financial liabilities (328,855) (938,251) – (1,267,106)
BNY Mellon Global Credit FundUSD USD USD USD
Bonds 152,224,233 444,372,591 – 596,596,824collective investment schemes – 16,193,685 – 16,193,685credit default swaps – 6,453,434 – 6,453,434Forward contracts – 1,708,121 – 1,708,121Futures 229,747 – – 229,747options – 38,990 – 38,990
Financial assets 152,453,980 468,766,821 – 621,220,801
credit default swaps – (6,924,496) – (6,924,496)Forward contracts – (5,102,579) – (5,102,579)Futures (460,407) – – (460,407)options – (18,094) – (18,094)
Financial liabilities (460,407) (12,045,169) – (12,505,576)
03613-1C.indd 406 19/08/2020 19:03

407
BNY MelloN GloBal FuNds, plc
Notes to the FiNaNcial statemeNts
15. RISK MANAGEMENT OBJECTIVES AND POLICIES cont’d.
FAIR VALUE ESTIMATION cont’d.
Fund Classification Level 1 Level 2 Level 3Total
30 June 2020
BNY Mellon Global Dynamic Bond FundUSD USD USD USD
Bonds 73,391,474 277,657,650 – 351,049,124collective investment schemes 1,810,749 5,108,233 – 6,918,982Forward contracts – 3,111,056 – 3,111,056
Financial assets 75,202,223 285,876,939 – 361,079,162
Forward contracts – (2,266,757) – (2,266,757)Futures (223,402) – – (223,402)
Financial liabilities (223,402) (2,266,757) – (2,490,159)
BNY Mellon Global Emerging Markets FundUSD USD USD USD
equities 29,834,742 228,094 – 30,062,836Forward contracts – 212 – 212
Financial assets 29,834,742 228,306 – 30,063,048
Forward contracts – (9,635) – (9,635)
Financial liabilities – (9,635) – (9,635)
BNY Mellon Global Equity FundUSD USD USD USD
equities 354,442,141 2,451,028 – 356,893,169Forward contracts – 90 – 90
Financial assets 354,442,141 2,451,118 – 356,893,259
Forward contracts – (378,554) – (378,554)
Financial liabilities – (378,554) – (378,554)
BNY Mellon Global Equity Income FundUSD USD USD USD
collective investment schemes – 15,323,634 – 15,323,634equities 1,129,219,369 40,016,011 – 1,169,235,380Forward contracts – 21,739 – 21,739
Financial assets 1,129,219,369 55,361,384 – 1,184,580,753
Forward contracts – (570,150) – (570,150)
Financial liabilities – (570,150) – (570,150)
BNY Mellon Global High Yield Bond FundUSD USD USD USD
Bonds – 106,515,228 650,559 107,165,787Forward contracts – 74,188 – 74,188leveraged loans – 921,752 – 921,752
Financial assets – 107,511,168 650,559 108,161,727
Forward contracts – (469,320) – (469,320)
Financial liabilities – (469,320) – (469,320)
03613-1C.indd 407 19/08/2020 19:03

408
BNY MelloN GloBal FuNds, plc
Notes to the FiNaNcial statemeNts
15. RISK MANAGEMENT OBJECTIVES AND POLICIES cont’d.
FAIR VALUE ESTIMATION cont’d.
Fund Classification Level 1 Level 2 Level 3Total
30 June 2020
BNY Mellon Global Infrastructure Income FundUSD USD USD USD
equities 148,088,993 – – 148,088,993Forward contracts – 269,707 – 269,707
Financial assets 148,088,993 269,707 – 148,358,700
Forward contracts – (3,365,373) – (3,365,373)
Financial liabilities – (3,365,373) – (3,365,373)
BNY Mellon Global Leaders FundUSD USD USD USD
equities 62,584,169 – – 62,584,169Forward contracts – 222 – 222
Financial assets 62,584,169 222 – 62,584,391
Forward contracts – (14,845) – (14,845)
Financial liabilities – (14,845) – (14,845)
BNY Mellon Global Multi-Asset Income FundEUR EUR EUR EUR
Bonds 721,602 3,820,656 – 4,542,258collective investment schemes – 1,827,601 – 1,827,601equities 9,795,832 629,029 – 10,424,861equity investment instruments – 3,241,635 – 3,241,635Forward contracts – 356,165 – 356,165preferred bonds – 28,547 – 28,547
Financial assets 10,517,434 9,903,633 – 20,421,067
Forward contracts – (30,500) – (30,500)
Financial liabilities – (30,500) – (30,500)
BNY Mellon Global Opportunities FundUSD USD USD USD
Bonds 1,274,657 – – 1,274,657equities 31,809,101 332,020 – 32,141,121Forward contracts – 22,330 – 22,330
Financial assets 33,083,758 354,350 – 33,438,108
Forward contracts – (6,469) – (6,469)
Financial liabilities – (6,469) – (6,469)
03613-1C.indd 408 19/08/2020 19:03
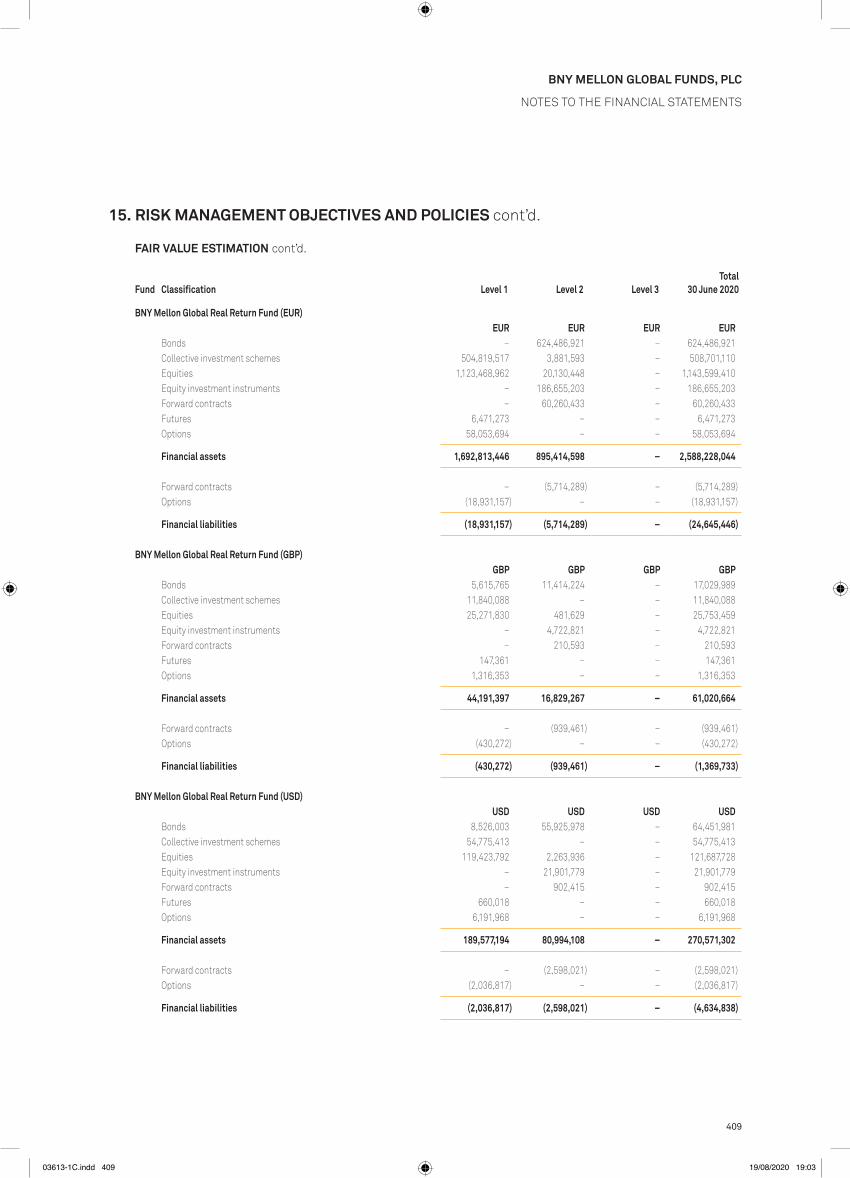
409
BNY MelloN GloBal FuNds, plc
Notes to the FiNaNcial statemeNts
15. RISK MANAGEMENT OBJECTIVES AND POLICIES cont’d.
FAIR VALUE ESTIMATION cont’d.
Fund Classification Level 1 Level 2 Level 3Total
30 June 2020
BNY Mellon Global Real Return Fund (EUR)EUR EUR EUR EUR
Bonds – 624,486,921 – 624,486,921collective investment schemes 504,819,517 3,881,593 – 508,701,110equities 1,123,468,962 20,130,448 – 1,143,599,410equity investment instruments – 186,655,203 – 186,655,203Forward contracts – 60,260,433 – 60,260,433Futures 6,471,273 – – 6,471,273options 58,053,694 – – 58,053,694
Financial assets 1,692,813,446 895,414,598 – 2,588,228,044
Forward contracts – (5,714,289) – (5,714,289)options (18,931,157) – – (18,931,157)
Financial liabilities (18,931,157) (5,714,289) – (24,645,446)
BNY Mellon Global Real Return Fund (GBP)GBP GBP GBP GBP
Bonds 5,615,765 11,414,224 – 17,029,989collective investment schemes 11,840,088 – – 11,840,088equities 25,271,830 481,629 – 25,753,459equity investment instruments – 4,722,821 – 4,722,821Forward contracts – 210,593 – 210,593Futures 147,361 – – 147,361options 1,316,353 – – 1,316,353
Financial assets 44,191,397 16,829,267 – 61,020,664
Forward contracts – (939,461) – (939,461)options (430,272) – – (430,272)
Financial liabilities (430,272) (939,461) – (1,369,733)
BNY Mellon Global Real Return Fund (USD)USD USD USD USD
Bonds 8,526,003 55,925,978 – 64,451,981collective investment schemes 54,775,413 – – 54,775,413equities 119,423,792 2,263,936 – 121,687,728equity investment instruments – 21,901,779 – 21,901,779Forward contracts – 902,415 – 902,415Futures 660,018 – – 660,018options 6,191,968 – – 6,191,968
Financial assets 189,577,194 80,994,108 – 270,571,302
Forward contracts – (2,598,021) – (2,598,021)options (2,036,817) – – (2,036,817)
Financial liabilities (2,036,817) (2,598,021) – (4,634,838)
03613-1C.indd 409 19/08/2020 19:03

410
BNY MelloN GloBal FuNds, plc
Notes to the FiNaNcial statemeNts
15. RISK MANAGEMENT OBJECTIVES AND POLICIES cont’d.
FAIR VALUE ESTIMATION cont’d.
Fund Classification Level 1 Level 2 Level 3Total
30 June 2020
BNY Mellon Global Short-Dated High Yield Bond FundUSD USD USD USD
Bonds – 652,636,524 – 652,636,524collective investment schemes – 40,036,541 – 40,036,541Forward contracts – 1,614,579 – 1,614,579leveraged loans – 43,972,352 – 43,972,352
Financial assets – 738,259,996 – 738,259,996
Forward contracts – (14,315,792) – (14,315,792)
Financial liabilities – (14,315,792) – (14,315,792)
BNY Mellon Global Unconstrained FundUSD USD USD USD
Bonds 2,723,734 2,293,151 – 5,016,885collective investment schemes 1,675,623 90,015 – 1,765,838equities 14,325,726 544,292 – 14,870,018equity investment instruments – 918,341 – 918,341Forward contracts – 19,249 – 19,249
Financial assets 18,725,083 3,865,048 – 22,590,131
Forward contracts – (484,511) – (484,511)
Financial liabilities – (484,511) – (484,511)
BNY Mellon Japan Small Cap Equity Focus FundJPY JPY JPY JPY
equities 11,905,573,200 – – 11,905,573,200Forward contracts – 4,575,844 – 4,575,844
Financial assets 11,905,573,200 4,575,844 – 11,910,149,044
Forward contracts – (15,556,005) – (15,556,005)
Financial liabilities – (15,556,005) – (15,556,005)
BNY Mellon Long-Term Global Equity FundEUR EUR EUR EUR
equities 1,357,760,571 – – 1,357,760,571Forward contracts – 80,608 – 80,608
Financial assets 1,357,760,571 80,608 – 1,357,841,179
Forward contracts – (1,700) – (1,700)
Financial liabilities – (1,700) – (1,700)
BNY Mellon Mobility Innovation FundUSD USD USD USD
equities 192,086,126 – – 192,086,126Forward contracts – 67,176 – 67,176
Financial assets 192,086,126 67,176 – 192,153,302
Forward contracts – (519,253) – (519,253)
Financial liabilities – (519,253) – (519,253)
03613-1C.indd 410 19/08/2020 19:03
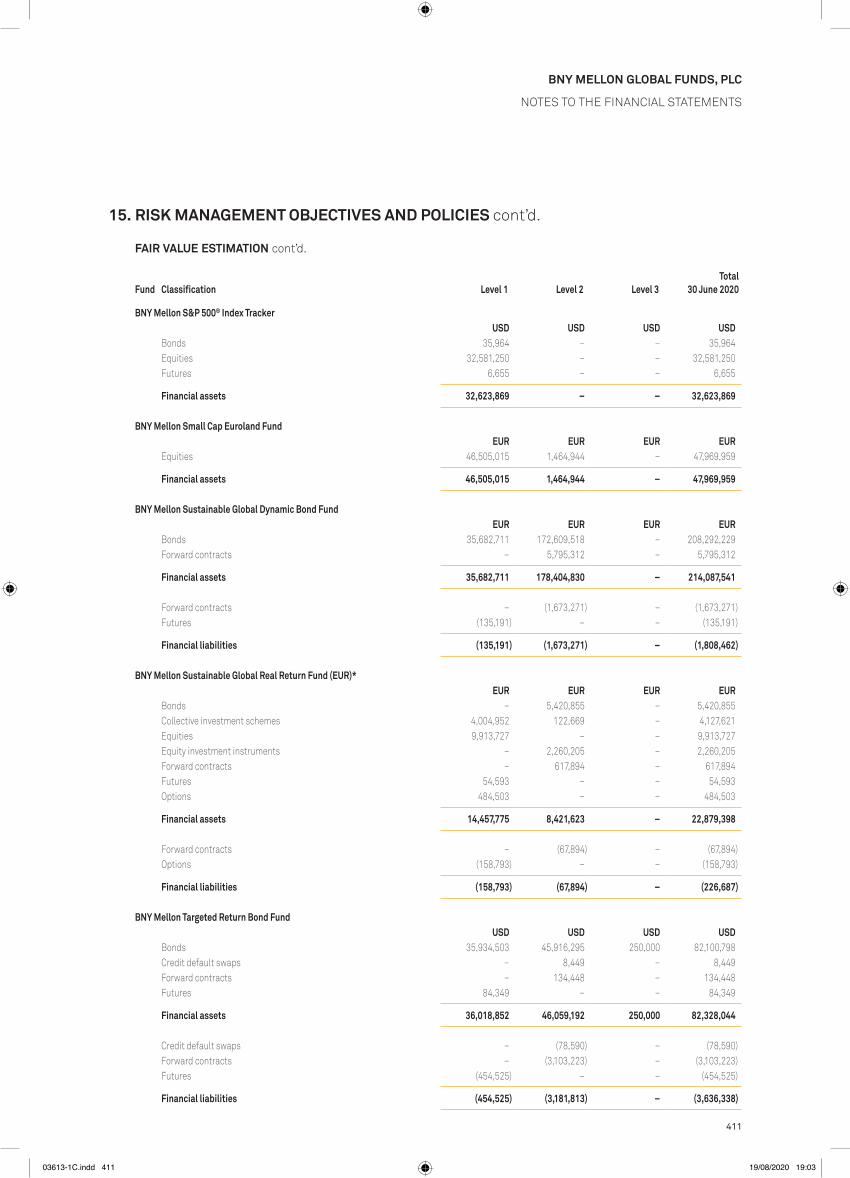
411
BNY MelloN GloBal FuNds, plc
Notes to the FiNaNcial statemeNts
15. RISK MANAGEMENT OBJECTIVES AND POLICIES cont’d.
FAIR VALUE ESTIMATION cont’d.
Fund Classification Level 1 Level 2 Level 3Total
30 June 2020
BNY Mellon S&P 500® Index TrackerUSD USD USD USD
Bonds 35,964 – – 35,964equities 32,581,250 – – 32,581,250Futures 6,655 – – 6,655
Financial assets 32,623,869 – – 32,623,869
BNY Mellon Small Cap Euroland FundEUR EUR EUR EUR
equities 46,505,015 1,464,944 – 47,969,959
Financial assets 46,505,015 1,464,944 – 47,969,959
BNY Mellon Sustainable Global Dynamic Bond FundEUR EUR EUR EUR
Bonds 35,682,711 172,609,518 – 208,292,229Forward contracts – 5,795,312 – 5,795,312
Financial assets 35,682,711 178,404,830 – 214,087,541
Forward contracts – (1,673,271) – (1,673,271)Futures (135,191) – – (135,191)
Financial liabilities (135,191) (1,673,271) – (1,808,462)
BNY Mellon Sustainable Global Real Return Fund (EUR)*EUR EUR EUR EUR
Bonds – 5,420,855 – 5,420,855collective investment schemes 4,004,952 122,669 – 4,127,621equities 9,913,727 – – 9,913,727equity investment instruments – 2,260,205 – 2,260,205Forward contracts – 617,894 – 617,894Futures 54,593 – – 54,593options 484,503 – – 484,503
Financial assets 14,457,775 8,421,623 – 22,879,398
Forward contracts – (67,894) – (67,894)options (158,793) – – (158,793)
Financial liabilities (158,793) (67,894) – (226,687)
BNY Mellon Targeted Return Bond FundUSD USD USD USD
Bonds 35,934,503 45,916,295 250,000 82,100,798credit default swaps – 8,449 – 8,449Forward contracts – 134,448 – 134,448Futures 84,349 – – 84,349
Financial assets 36,018,852 46,059,192 250,000 82,328,044
credit default swaps – (78,590) – (78,590)Forward contracts – (3,103,223) – (3,103,223)Futures (454,525) – – (454,525)
Financial liabilities (454,525) (3,181,813) – (3,636,338)
03613-1C.indd 411 19/08/2020 19:03
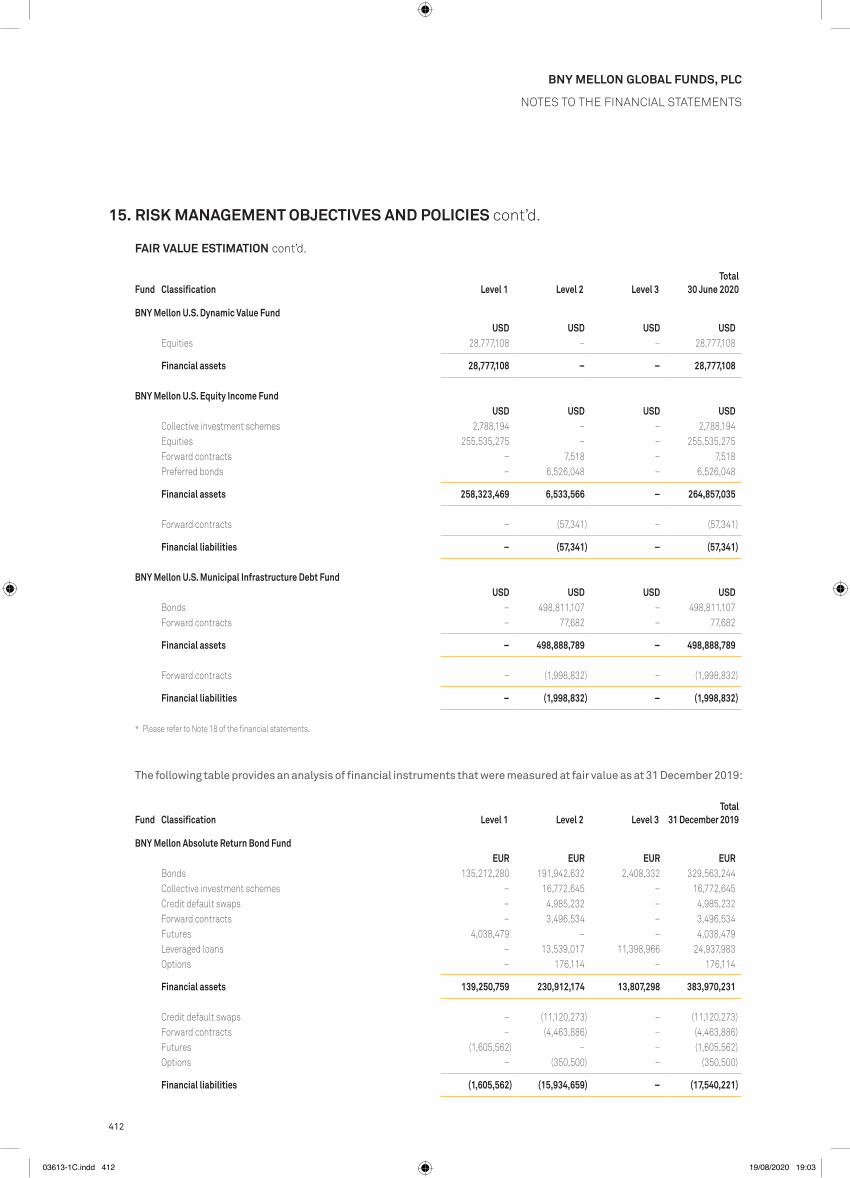
412
BNY MelloN GloBal FuNds, plc
Notes to the FiNaNcial statemeNts
15. RISK MANAGEMENT OBJECTIVES AND POLICIES cont’d.
FAIR VALUE ESTIMATION cont’d.
Fund Classification Level 1 Level 2 Level 3Total
30 June 2020
BNY Mellon U.S. Dynamic Value FundUSD USD USD USD
equities 28,777,108 – – 28,777,108
Financial assets 28,777,108 – – 28,777,108
BNY Mellon U.S. Equity Income FundUSD USD USD USD
collective investment schemes 2,788,194 – – 2,788,194equities 255,535,275 – – 255,535,275Forward contracts – 7,518 – 7,518preferred bonds – 6,526,048 – 6,526,048
Financial assets 258,323,469 6,533,566 – 264,857,035
Forward contracts – (57,341) – (57,341)
Financial liabilities – (57,341) – (57,341)
BNY Mellon U.S. Municipal Infrastructure Debt FundUSD USD USD USD
Bonds – 498,811,107 – 498,811,107Forward contracts – 77,682 – 77,682
Financial assets – 498,888,789 – 498,888,789
Forward contracts – (1,998,832) – (1,998,832)
Financial liabilities – (1,998,832) – (1,998,832)
* please refer to Note 18 of the financial statements.
The following table provides an analysis of financial instruments that were measured at fair value as at 31 December 2019:
Fund Classification Level 1 Level 2 Level 3Total
31 December 2019
BNY Mellon Absolute Return Bond FundEUR EUR EUR EUR
Bonds 135,212,280 191,942,632 2,408,332 329,563,244collective investment schemes – 16,772,645 – 16,772,645credit default swaps – 4,985,232 – 4,985,232Forward contracts – 3,496,534 – 3,496,534Futures 4,038,479 – – 4,038,479leveraged loans – 13,539,017 11,398,966 24,937,983options – 176,114 – 176,114
Financial assets 139,250,759 230,912,174 13,807,298 383,970,231
credit default swaps – (11,120,273) – (11,120,273)Forward contracts – (4,463,886) – (4,463,886)Futures (1,605,562) – – (1,605,562)options – (350,500) – (350,500)
Financial liabilities (1,605,562) (15,934,659) – (17,540,221)
03613-1C.indd 412 19/08/2020 19:03

413
BNY MelloN GloBal FuNds, plc
Notes to the FiNaNcial statemeNts
15. RISK MANAGEMENT OBJECTIVES AND POLICIES cont’d.
FAIR VALUE ESTIMATION cont’d.
Fund Classification Level 1 Level 2 Level 3Total
31 December 2019
BNY Mellon Absolute Return Equity FundGBP GBP GBP GBP
Bonds 30,070,509 – – 30,070,509certificate of deposits 88,424,318 – – 88,424,318collective investment schemes – 47,391,584 – 47,391,584commercial paper – 60,933,075 – 60,933,075equities 25,172,419 – – 25,172,419equity index swaps – 152,138 – 152,138equity swaps – 13,783,427 – 13,783,427Floating rate notes – 115,083,219 – 115,083,219Forward contracts – 2,662,866 – 2,662,866Futures 54,531 – – 54,531
Financial assets 143,721,777 240,006,309 – 383,728,086
equity index swaps – (1,954,263) – (1,954,263)equity swaps – (8,271,104) – (8,271,104)Forward contracts – (115,097) – (115,097)Futures (16,487) – – (16,487)
Financial liabilities (16,487) (10,340,464) – (10,356,951)
BNY Mellon Absolute Return Global Convertible Fund*EUR EUR EUR EUR
Bonds 11,422,862 10,100,031 – 21,522,893collective investment schemes – 1,894,992 – 1,894,992equity swaps – 109,042 – 109,042Forward contracts – 50,991 – 50,991Futures 4,298 – – 4,298preferred bonds – 4,032,654 – 4,032,654total return swaps – 1,275,729 – 1,275,729
Financial assets 11,427,160 17,463,439 – 28,890,599
equity swaps – (1,042,241) – (1,042,241)Forward contracts – (39,971) – (39,971)total return swaps – (70,096) – (70,096)
Financial liabilities – (1,152,308) – (1,152,308)
BNY Mellon Asia Rising Stars FundUSD USD USD USD
equities 6,794,347 275,836 – 7,070,183Forward contracts – 11,466 – 11,466p-Notes – 913,135 – 913,135
Financial assets 6,794,347 1,200,437 – 7,994,784
03613-1C.indd 413 19/08/2020 19:03

414
BNY MelloN GloBal FuNds, plc
Notes to the FiNaNcial statemeNts
15. RISK MANAGEMENT OBJECTIVES AND POLICIES cont’d.
FAIR VALUE ESTIMATION cont’d.
Fund Classification Level 1 Level 2 Level 3Total
31 December 2019
BNY Mellon Asian Equity FundUSD USD USD USD
equities 37,598,053 200,807 – 37,798,860
Financial assets 37,598,053 200,807 – 37,798,860
Forward contracts – (6) – (6)
Financial liabilities – (6) – (6)
BNY Mellon Asian Income FundUSD USD USD USD
collective investment schemes – 1,257,223 – 1,257,223equities 25,374,427 3,546,988 – 28,921,415
Financial assets 25,374,427 4,804,211 – 30,178,638
Forward contracts – (43) – (43)
Financial liabilities – (43) – (43)
BNY Mellon Brazil Equity FundUSD USD USD USD
equities 75,233,576 30,465,011 – 105,698,587Forward contracts – 79,467 – 79,467
Financial assets 75,233,576 30,544,478 – 105,778,054
Forward contracts – (867) – (867)
Financial liabilities – (867) – (867)
BNY Mellon Digital Assets Fund*USD USD USD USD
equities 11,054,505 – – 11,054,505Forward contracts – 4,410 – 4,410
Financial assets 11,054,505 4,410 – 11,058,915
Forward contracts – (21) – (21)
Financial liabilities – (21) – (21)
03613-1C.indd 414 19/08/2020 19:03

415
BNY MelloN GloBal FuNds, plc
Notes to the FiNaNcial statemeNts
15. RISK MANAGEMENT OBJECTIVES AND POLICIES cont’d.
FAIR VALUE ESTIMATION cont’d.
Fund Classification Level 1 Level 2 Level 3Total
31 December 2019
BNY Mellon Dynamic Total Return FundUSD USD USD USD
Bonds 20,910,671 – – 20,910,671collective investment schemes 2,513,813 – – 2,513,813Forward contracts – 171,752 – 171,752Futures 172,119 – – 172,119options 1,057,988 – – 1,057,988
Financial assets 24,654,591 171,752 – 24,826,343
Forward contracts – (202,197) – (202,197)Futures (22,617) – – (22,617)options (32,750) – – (32,750)
Financial liabilities (55,367) (202,197) – (257,564)
BNY Mellon Dynamic U.S. Equity FundUSD USD USD USD
Bonds 24,159,866 – – 24,159,866equities 141,151,034 – – 141,151,034Forward contracts – 1,372 – 1,372Futures 382,208 – – 382,208options 2,896,950 – – 2,896,950
Financial assets 168,590,058 1,372 – 168,591,430
Futures (514,632) – – (514,632)
Financial liabilities (514,632) – – (514,632)
BNY Mellon Efficient U.S. High Yield Beta Fund*USD USD USD USD
Bonds – 691,150,317 11,034 691,161,351credit default swaps – 1,430,980 – 1,430,980Forward contracts – 4,523,271 – 4,523,271
Financial assets – 697,115,602 11,034 697,115,602
Forward contracts – (15,359) – (15,359)
Financial liabilities – (15,359) – (15,359)
BNY Mellon Emerging Markets Corporate Debt FundUSD USD USD USD
Bonds – 330,323,251 – 330,323,251collective investment schemes – 17,201,452 – 17,201,452Forward contracts – 1,170,429 – 1,170,429
Financial assets – 348,695,132 – 348,695,132
credit default swaps – (222,809) – (222,809)Forward contracts – (488,963) – (488,963)
Financial liabilities – (711,772) – (711,772)
03613-1C.indd 415 19/08/2020 19:03

416
BNY MelloN GloBal FuNds, plc
Notes to the FiNaNcial statemeNts
15. RISK MANAGEMENT OBJECTIVES AND POLICIES cont’d.
FAIR VALUE ESTIMATION cont’d.
Fund Classification Level 1 Level 2 Level 3Total
31 December 2019
BNY Mellon Emerging Markets Debt FundUSD USD USD USD
Bonds 209,073 50,310,517 – 50,519,590Forward contracts – 40,417 – 40,417Futures 64,104 – – 64,104
Financial assets 273,177 50,350,934 – 50,624,111
Forward contracts – (40,535) – (40,535)Futures (83,461) – – (83,461)
Financial liabilities (83,461) (40,535) – (123,996)
BNY Mellon Emerging Markets Debt Local Currency FundUSD USD USD USD
Bonds 2,070,823 437,381,685 – 439,452,508Forward contracts – 3,788,873 – 3,788,873options – 718,204 – 718,204
Financial assets 2,070,823 441,888,762 – 443,959,585
Forward contracts – (3,356,348) – (3,356,348)options – (184,498) – (184,498)
Financial liabilities – (3,540,846) – (3,540,846)
BNY Mellon Emerging Markets Debt Opportunistic FundUSD USD USD USD
Bonds 19,912 28,929,168 – 28,949,080Forward contracts – 107,376 – 107,376Futures 4,666 – – 4,666options – 47,933 – 47,933
Financial assets 24,578 29,084,477 – 29,109,055
Forward contracts – (172,735) – (172,735)Futures (1,079) – – (1,079)interest rate swaps – (15,026) – (15,026)options – (13,256) – (13,256)
Financial liabilities (1,079) (201,017) – (202,096)
BNY Mellon Emerging Markets Debt Total Return FundUSD USD USD USD
Bonds – 142,282,680 – 142,282,680collective investment schemes – 4,800,000 – 4,800,000Forward contracts – 2,147,691 – 2,147,691
Financial assets – 149,230,371 – 149,230,371
Forward contracts – (1,735,918) – (1,735,918)
Financial liabilities – (1,735,918) – (1,735,918)
03613-1C.indd 416 19/08/2020 19:03

417
BNY MelloN GloBal FuNds, plc
Notes to the FiNaNcial statemeNts
15. RISK MANAGEMENT OBJECTIVES AND POLICIES cont’d.
FAIR VALUE ESTIMATION cont’d.
Fund Classification Level 1 Level 2 Level 3Total
31 December 2019
BNY Mellon Euroland Bond FundEUR EUR EUR EUR
Bonds 358,198,086 472,370,945 – 830,569,031collective investment schemes – 30,612,679 – 30,612,679credit default swaps – 1,691,286 – 1,691,286Forward contracts – 2,292,120 – 2,292,120Futures 3,626,095 – – 3,626,095interest rate swaps – 2,014,460 – 2,014,460options 78,104 292,581 – 370,685
Financial assets 361,902,285 509,274,071 – 871,176,356
Forward contracts – (1,806,177) – (1,806,177)Futures (571,150) – – (571,150)interest rate swaps – (506,723) – (506,723)options (76,586) (120,877) – (197,463)
Financial liabilities (647,736) (2,433,777) – (3,081,513)
BNY Mellon European Credit FundEUR EUR EUR EUR
Bonds – 74,079,576 – 74,079,576collective investment schemes – 4,845,219 – 4,845,219credit default swaps – 26,176 – 26,176Forward contracts – 38,116 – 38,116Futures 33,669 – – 33,669
Financial assets 33,669 78,989,087 – 79,022,756
credit default swaps – (172,210) – (172,210)Forward contracts – (54,727) – (54,727)Futures (24,085) – – (24,085)
Financial liabilities (24,085) (226,937) – (251,022)
BNY Mellon Global Bond FundUSD USD USD USD
Bonds 293,184,838 277,762,806 – 570,947,644collective investment schemes 5,873,761 – – 5,873,761Forward contracts – 699,600 – 699,600options 616,438 – – 616,438
Financial assets 299,675,037 278,462,406 – 578,137,443
Forward contracts – (1,824,238) – (1,824,238)
Financial liabilities – (1,824,238) – (1,824,238)
03613-1C.indd 417 19/08/2020 19:03

418
BNY MelloN GloBal FuNds, plc
Notes to the FiNaNcial statemeNts
15. RISK MANAGEMENT OBJECTIVES AND POLICIES cont’d.
FAIR VALUE ESTIMATION cont’d.
Fund Classification Level 1 Level 2 Level 3Total
31 December 2019
BNY Mellon Global Credit FundUSD USD USD USD
Bonds 30,365,098 413,957,504 927,221 445,249,823collective investment schemes – 3,970,242 – 3,970,242credit default swaps – 3,381,524 – 3,381,524Forward contracts – 8,892,272 – 8,892,272Futures 1,158,877 – – 1,158,877options – 260,634 – 260,634
Financial assets 31,523,975 430,462,176 927,221 462,913,372
credit default swaps – (8,235,966) – (8,235,966)Forward contracts – (2,636,877) – (2,636,877)Futures (1,028,254) – – (1,028,254)options – (530,858) – (530,858)
Financial liabilities (1,028,254) (11,403,701) – (12,431,955)
BNY Mellon Global Dynamic Bond FundUSD USD USD USD
Bonds 158,704,175 293,554,808 – 452,258,983collective investment schemes 34,797,050 8,541,856 – 43,338,906Forward contracts – 2,557,717 – 2,557,717Futures 169,291 – – 169,291options 562,547 – – 562,547
Financial assets 194,233,063 304,654,381 – 498,887,444
Forward contracts – (3,304,526) – (3,304,526)
Financial liabilities – (3,304,526) – (3,304,526)
BNY Mellon Global Emerging Markets FundUSD USD USD USD
equities 32,393,676 177,656 – 32,571,332Forward contracts – 5,902 – 5,902
Financial assets 32,393,676 183,558 – 32,577,234
BNY Mellon Global Equity FundUSD USD USD USD
equities 363,788,556 – – 363,788,556Forward contracts – 83,593 – 83,593
Financial assets 363,788,556 83,593 – 363,872,149
Forward contracts – (136,180) – (136,180)
Financial liabilities – (136,180) – (136,180)
03613-1C.indd 418 19/08/2020 19:03

419
BNY MelloN GloBal FuNds, plc
Notes to the FiNaNcial statemeNts
15. RISK MANAGEMENT OBJECTIVES AND POLICIES cont’d.
FAIR VALUE ESTIMATION cont’d.
Fund Classification Level 1 Level 2 Level 3Total
31 December 2019
BNY Mellon Global Equity Income FundUSD USD USD USD
collective investment schemes – 25,124,445 – 25,124,445equities 1,725,997,571 53,663,955 – 1,779,661,526Forward contracts – 691,530 – 691,530
Financial assets 1,725,997,571 79,479,930 – 1,805,477,501
Forward contracts – (4,284) – (4,284)
Financial liabilities – (4,284) – (4,284)
BNY Mellon Global High Yield Bond FundUSD USD USD USD
Bonds – 109,915,159 – 109,915,159collective investment schemes 2,491,376 – – 2,491,376Forward contracts – 436,070 – 436,070leveraged loans – 5,035,813 – 5,035,813
Financial assets 2,491,376 115,387,042 – 117,878,418
Forward contracts – (248,982) – (248,982)
Financial liabilities – (248,982) – (248,982)
BNY Mellon Global Infrastructure Income FundUSD USD USD USD
equities 88,725,250 – – 88,725,250Forward contracts – 390,155 – 390,155
Financial assets 88,725,250 390,155 – 89,115,405
Forward contracts – (2,433) – (2,433)
Financial liabilities – (2,433) – (2,433)
BNY Mellon Global Leaders FundUSD USD USD USD
equities 84,883,294 – – 84,883,294Forward contracts – 15,537 – 15,537
Financial assets 84,883,294 15,537 – 84,898,831
Forward contracts – (168) – (168)
Financial liabilities – (168) – (168)
03613-1C.indd 419 19/08/2020 19:03

420
BNY MelloN GloBal FuNds, plc
Notes to the FiNaNcial statemeNts
15. RISK MANAGEMENT OBJECTIVES AND POLICIES cont’d.
FAIR VALUE ESTIMATION cont’d.
Fund Classification Level 1 Level 2 Level 3Total
31 December 2019
BNY Mellon Global Multi-Asset Income FundEUR EUR EUR EUR
Bonds 838,071 3,550,714 – 4,388,785collective investment schemes – 5,844,945 – 5,844,945equities 10,914,995 806,663 – 11,721,658Forward contracts – 63,698 – 63,698preferred bonds – 31,753 – 31,753
Financial assets 11,753,066 10,297,773 – 22,050,839
Forward contracts – (243,325) – (243,325)
Financial liabilities – (243,325) – (243,325)
BNY Mellon Global Opportunities FundUSD USD USD USD
Bonds 1,820,030 – – 1,820,030equities 46,018,606 – – 46,018,606Forward contracts – 6,918 – 6,918options 9,963 – – 9,963
Financial assets 47,848,599 6,918 – 47,855,517
Forward contracts – (15,236) – (15,236)
Financial liabilities – (15,236) – (15,236)
BNY Mellon Global Real Return Fund (EUR)EUR EUR EUR EUR
Bonds 181,170,871 1,090,990,670 – 1,272,161,541collective investment schemes 485,246,460 234,215,182 – 719,461,642equities 1,116,386,126 41,670,968 – 1,158,057,094Forward contracts – 13,820,040 – 13,820,040options 45,244,914 – – 45,244,914
Financial assets 1,828,048,371 1,380,696,860 – 3,208,745,231
Forward contracts – (31,765,155) – (31,765,155)Futures (3,246,464) – – (3,246,464)options (19,433,873) (400,802) – (19,834,675)
Financial liabilities (22,680,337) (32,165,957) – (54,846,294)
03613-1C.indd 420 19/08/2020 19:03

421
BNY MelloN GloBal FuNds, plc
Notes to the FiNaNcial statemeNts
15. RISK MANAGEMENT OBJECTIVES AND POLICIES cont’d.
FAIR VALUE ESTIMATION cont’d.
Fund Classification Level 1 Level 2 Level 3Total
31 December 2019
BNY Mellon Global Real Return Fund (GBP)GBP GBP GBP GBP
Bonds 12,906,798 14,347,391 – 27,254,189collective investment schemes 9,083,500 5,530,347 – 14,613,847equities 21,880,815 848,688 – 22,729,503Forward contracts – 1,481,737 – 1,481,737options 886,367 – – 886,367
Financial assets 44,757,480 22,208,163 – 66,965,643
Forward contracts – (413,007) – (413,007)Futures (66,559) – – (66,559)options (383,804) – – (383,804)
Financial liabilities (450,363) (413,007) – (863,370)
BNY Mellon Global Real Return Fund (USD)USD USD USD USD
Bonds 33,310,330 70,341,760 – 103,652,090collective investment schemes 42,173,540 25,167,660 – 67,341,200equities 106,023,557 3,958,637 – 109,982,194Forward contracts – 425,999 – 425,999options 4,404,163 – – 4,404,163
Financial assets 185,911,590 99,894,056 – 285,805,646
Forward contracts – (5,145,422) – (5,145,422)Futures (313,055) – – (313,055)options (1,887,750) – – (1,887,750)
Financial liabilities (2,200,805) (5,145,422) – (7,346,227)
BNY Mellon Global Short-Dated High Yield Bond FundUSD USD USD USD
Bonds – 631,373,513 – 631,373,513collective investment schemes – 62,778,833 – 62,778,833equities 1,937 – – 1,937Forward contracts – 4,062,199 – 4,062,199leveraged loans – 25,024,621 – 25,024,621
Financial assets 1,937 723,239,166 – 723,241,103
Forward contracts – (3,527,822) – (3,527,822)
Financial liabilities – (3,527,822) – (3,527,822)
03613-1C.indd 421 19/08/2020 19:03

422
BNY MelloN GloBal FuNds, plc
Notes to the FiNaNcial statemeNts
15. RISK MANAGEMENT OBJECTIVES AND POLICIES cont’d.
FAIR VALUE ESTIMATION cont’d.
Fund Classification Level 1 Level 2 Level 3Total
31 December 2019
BNY Mellon Global Unconstrained FundUSD USD USD USD
Bonds 3,881,040 3,130,834 – 7,011,874collective investment schemes 1,258,661 1,134,408 – 2,393,069equities 13,607,224 536,600 – 14,143,824Forward contracts – 377,800 – 377,800options 48,992 – – 48,992
Financial assets 18,795,917 5,179,642 – 23,975,559
Forward contracts – (102,650) – (102,650)
Financial liabilities – (102,650) – (102,650)
BNY Mellon Japan Small Cap Equity Focus FundJPY JPY JPY JPY
equities 14,909,894,700 – – 14,909,894,700Forward contracts – 80,379,200 – 80,379,200
Financial assets 14,909,894,700 80,379,200 – 14,990,273,900
Forward contracts – (641,256) – (641,256)
Financial liabilities – (641,256) – (641,256)
BNY Mellon Long-Term Global Equity FundEUR EUR EUR EUR
equities 1,440,620,791 – – 1,440,620,791Forward contracts – 2,327 – 2,327
Financial assets 1,440,620,791 2,327 – 1,440,623,118
Forward contracts – (45,196) – (45,196)
Financial liabilities – (45,196) – (45,196)
BNY Mellon Mobility Innovation FundUSD USD USD USD
equities 151,025,893 – – 151,025,893Forward contracts – 709,837 – 709,837
Financial assets 151,025,893 709,837 – 151,735,730
Forward contracts – (3,660) – (3,660)
Financial liabilities – (3,660) – (3,660)
BNY Mellon S&P 500® Index TrackerUSD USD USD USD
Bonds 19,942 – – 19,942equities 50,696,100 – – 50,696,100Futures 1,757 – – 1,757
Financial assets 50,717,799 – – 50,717,799
03613-1C.indd 422 19/08/2020 19:03

423
BNY MelloN GloBal FuNds, plc
Notes to the FiNaNcial statemeNts
15. RISK MANAGEMENT OBJECTIVES AND POLICIES cont’d.
FAIR VALUE ESTIMATION cont’d.
Fund Classification Level 1 Level 2 Level 3Total
31 December 2019
BNY Mellon Small Cap Euroland FundEUR EUR EUR EUR
equities 71,398,386 1,650,983 – 73,049,369
Financial assets 71,398,386 1,650,983 – 73,049,369
Futures (3,076) – – (3,076)
Financial liabilities (3,076) – – (3,076)
BNY Mellon Sustainable Global Dynamic Bond Fund*EUR EUR EUR EUR
Bonds 44,613,148 130,169,335 – 174,782,483Forward contracts – 929,336 – 929,336Futures 92,393 – – 92,393options 198,522 – – 198,522
Financial assets 44,904,063 131,098,671 – 176,002,734
Forward contracts – (1,167,027) – (1,167,027)
Financial liabilities – (1,167,027) – (1,167,027)
BNY Mellon Targeted Return Bond FundUSD USD USD USD
Bonds 70,564,109 7,092,241 – 77,656,350Forward contracts – 365,972 – 365,972Futures 208,229 – – 208,229
Financial assets 70,772,338 7,458,213 – 78,230,551
Forward contracts – (125,391) – (125,391)Futures (24,316) – – (24,316)
Financial liabilities (24,316) (125,391) – (149,707)
BNY Mellon U.S. Dynamic Value FundUSD USD USD USD
collective investment schemes 289,233 – – 289,233equities 28,531,840 – – 28,531,840
Financial assets 28,821,073 – – 28,821,073
BNY Mellon U.S. Equity Income FundUSD USD USD USD
equities 393,905,331 – – 393,905,331Forward contracts – 25,328 – 25,328preferred bonds – 8,371,664 – 8,371,664
Financial assets 393,905,331 8,396,992 – 402,302,323
03613-1C.indd 423 19/08/2020 19:03

424
BNY MelloN GloBal FuNds, plc
Notes to the FiNaNcial statemeNts
15. RISK MANAGEMENT OBJECTIVES AND POLICIES cont’d.
FAIR VALUE ESTIMATION cont’d.
Fund Classification Level 1 Level 2 Level 3Total
31 December 2019
BNY Mellon U.S. Municipal Infrastructure Debt FundUSD USD USD USD
Bonds – 430,063,238 – 430,063,238Forward contracts – 2,551,284 – 2,551,284
Financial assets – 432,614,522 – 432,614,522
Forward contracts – (116,353) – (116,353)
Financial liabilities – (116,353) – (116,353) * this Fund launched during the financial year.
The following table presents the movement in level 3 investments for the financial period ended 30 June 2020:
BNY Mellon Absolute Return Bond Fund
ParticularsBonds
Leveraged loans Total
EUR EUR EUR
opening balance 2,408,332 11,398,966 13,807,298purchases – – –sales (2,420,812) (712,405) (3,133,217)transfers into level 3 – – –transfers out of level 3 – – –Net gains/(losses) recognised in other net changes in fair value on financial assets and financial liabilities at fair value through profit or loss
Realised gains/(losses) 188,806 (15,917) 172,889unrealised losses (176,326) (1,317,037) (1,493,363)
Closing balance – 9,353,607 9,353,607
BNY Mellon Efficient U.S. High Yield Bond Fund
Particulars Bonds TotalUSD USD
opening balance 11,034 11,034purchases – –sales – –transfers into level 3 – –transfers out of level 3 – –Net gains/(losses) recognised in other net changes in fair value on financial assets and financial liabilities at fair value through profit or loss
Realised gains/(losses) – –unrealised gains 146 146
Closing balance 11,180 11,180
03613-1C.indd 424 19/08/2020 19:04

425
BNY MelloN GloBal FuNds, plc
Notes to the FiNaNcial statemeNts
15. RISK MANAGEMENT OBJECTIVES AND POLICIES cont’d.
FAIR VALUE ESTIMATION cont’d.
BNY Mellon Global Credit Fund
Particulars Bonds TotalUSD USD
opening balance 927,221 927,221purchases – –sales – –transfers into level 3 – –transfers out of level 3 (927,221) (927,221)Net gains/(losses) recognised in other net changes in fair value on financial assets and financial liabilities at fair value through profit or loss
Realised gains/(losses) – –unrealised gains/(losses) – –
Closing balance – –
BNY Mellon Global High Yield Bond Fund
Particulars Bonds TotalUSD USD
opening balance – –purchases 699,895 699,895sales – –transfers into level 3 – –transfers out of level 3 – –Net gains/(losses) recognised in other net changes in fair value on financial assets and financial liabilities at fair value through profit or loss
Realised gains/(losses) – –unrealised losses (49,336) (49,336)
Closing balance 650,559 650,559
BNY Mellon Targeted Return Bond Fund
Particulars Bonds TotalUSD USD
opening balance – –purchases 250,000 250,000sales – –transfers into level 3 – –transfers out of level 3 – –Net gains/(losses) recognised in other net changes in fair value on financial assets and financial liabilities at fair value through profit or loss
Realised gains/(losses) – –unrealised gains/(losses) – –
Closing balance 250,000 250,000
03613-1C.indd 425 19/08/2020 19:04

426
BNY MelloN GloBal FuNds, plc
Notes to the FiNaNcial statemeNts
15. RISK MANAGEMENT OBJECTIVES AND POLICIES cont’d.
FAIR VALUE ESTIMATION cont’d.The following table presents the movement in level 3 investments for the financial year ended 31 December 2019:
BNY Mellon Absolute Return Bond Fund
ParticularsBonds
Leveraged loans Total
EUR EUR EUR
opening balance 4,978,178 26,686,142 31,664,320purchases – 1,442,647 1,442,647sales (2,316,483) (17,838,487) (20,154,970)transfers into level 3 – – –transfers out of level 3 (326,485) – (326,485)Net gains/(losses) recognised in other net changes in fair value on financial assets and financial liabilities at fair value through profit or loss
Realised gains/(losses) 99,537 (33,058) 66,479unrealised gains/(losses) (26,415) 1,141,722 1,115,307
Closing balance 2,408,332 11,398,966 13,807,298
BNY Mellon Absolute Return Equity Fund
Particulars Equity swaps TotalGBP GBP
opening balance 35,768 35,768purchases – –sales (35,768) (35,768)transfers into level 3 – –transfers out of level 3 – –Net gains recognised in other net changes in fair value on financial assets and financial liabilities at fair value through profit or loss
Realised gains 35,768 35,768unrealised losses (35,768) (35,768)
Closing balance – –
BNY Mellon Efficient U.S. High Yield Bond Fund
Particulars P-Notes TotalUSD USD
opening balance – –purchases 11,037 11,037sales – –transfers into level 3 – –transfers out of level 3 – –Net losses recognised in other net changes in fair value on financial assets and financial liabilities at fair value through profit or loss
Realised gains/(losses) – –unrealised losses (3) (3)
Closing balance 11,034 11,034
03613-1C.indd 426 19/08/2020 19:04

427
BNY MelloN GloBal FuNds, plc
Notes to the FiNaNcial statemeNts
15. RISK MANAGEMENT OBJECTIVES AND POLICIES cont’d.
FAIR VALUE ESTIMATION cont’d.
BNY Mellon Global Credit Fund
Particulars Bonds TotalUSD USD
opening balance – –purchases 922,391 922,391sales – –transfers into level 3 – –transfers out of level 3 – –Net gains/(losses) recognised in other net changes in fair value on financial assets and financial liabilities at fair value through profit or loss
Realised gains/(losses) – –unrealised gains 4,830 4,830
Closing balance 927,221 927,221
BNY Mellon Global Short-Dated High Yield Bond Fund
Particulars Leveraged loans Total
USD USD
opening balance 3,746,280 3,746,280purchases – –sales (3,677,799) (3,677,799)transfers into level 3 – –transfers out of level 3 – –Net gains/(losses) recognised in other net changes in fair value on financial assets and financial liabilities at fair value through profit or loss
Realised gains 142,906 142,906unrealised losses (211,387) (211,387)
Closing balance – –
BNY Mellon Targeted Return Bond Fund
Particulars Bonds TotalUSD USD
opening balance 175,000 175,000purchases – –sales (175,013) (175,013)transfers into level 3 – –transfers out of level 3 – –Net gains/(losses) recognised in other net changes in fair value on financial assets and financial liabilities at fair value through profit or loss
Realised gains 13 13unrealised gains/(losses) – –
Closing balance – –
Transfers are deemed to occur at the beginning of the financial period.
16. COMMITMENTS AND CONTINGENCIES
There are no commitments or contingencies as at 30 June 2020 or 31 December 2019.
03613-1C.indd 427 19/08/2020 19:04

428
BNY MelloN GloBal FuNds, plc
Notes to the FiNaNcial statemeNts
17. SEGREGATED LIABILITY
The Company avails of the segregated liability provisions of Section 1405 (1) of the Companies Act 2014. As such, under Irish Law the Company generally will not be liable as a whole to third parties and there generally will not be the potential for cross liability between the Funds.
18. SIGNIFICANT EVENTS
BNY Mellon Sustainable Global Real Return Fund (EUR) was launched on 6 February 2020.
On 5 February 2020, shareholders were notified of the reinsertion of “Long/Short” wording by addendum, effective 7 February 2020.
BNY Mellon Efficient EM Debt Local Currency Beta Fund was approved by the Central Bank on 7 February 2020.
BNY Mellon Efficient Global IG Corporate Beta Fund was launched on 10 March 2020.
Shareholders were notified of additional disclosures relating to Loss Absorption Products to BNY Mellon Emerging Corporate Debt Fund, effective 22 May 2020.
On 23 June 2020, shareholders of BNY Mellon Asian Rising Stars Fund were notified of intention to close the sub-fund on 2 September 2020.
David Dillon resigned as a Director of the Manager, effective 30 June 2020.
NOTE ON COVID-19The global outbreak of COVID-19 in the first quarter of 2020 has had a significant negative impact on the global financial markets. Market volatility has increased significantly and may continue for some time. The extent of the impact to the financial performance of the Sub-Funds’ investments and the Sub-Funds will depend on future developments, including (i) the duration and spread of the outbreak, (ii) Government interventions or other limitations or bans introduced by regulatory authorities or exchanges and trading venues, (iii) the effects on the global financial markets, and (iv) the effects on the economy overall.
Other than disclosed above, there were no other significant events affecting the Company during the financial period end.
19. SUBSEQUENT EVENTS
The Company declared the following distributions on 1 July 2020:
Fund Share Class Currency 1 July 2020
BNY Mellon Absolute Return Bond Fund class c (inc) euR 0.3937class R (inc) euR 0.3184
class t (hedged) chF 0.4278class t (hedged) usd 0.5408
sterling t (acc) (hedged) GBp 0.5151class W (acc) euR 0.3748
class W (acc) (hedged) usd 0.4128sterling W (acc) (hedged) GBp 0.4022sterling W (inc) (hedged) GBp 0.3877sterling X (acc) (hedged) GBp 0.7030
BNY Mellon Asian Income Fund class a (acc) euR 0.0148class a (inc) euR 0.0124
class B (acc) usd 0.0124class c (acc) usd 0.0134
03613-1C.indd 428 19/08/2020 19:04

429
BNY MelloN GloBal FuNds, plc
Notes to the FiNaNcial statemeNts
19. SUBSEQUENT EVENTS cont’d.
Fund Share Class Currency 1 July 2020
BNY Mellon Asian Income Fund cont’d. class W (inc) euR 0.0135class W (inc) usd 0.0110
sterling W (inc) GBp 0.0150BNY Mellon Efficient Global IG Corporate Beta Fund class a (acc) usd 0.0039
sterling l (acc) (hedged) GBp 0.0046class W (acc) usd 0.0044
class W (acc) (hedged) euR 0.0043sterling W (acc) (hedged) GBp 0.0043
BNY Mellon Efficient U.S. High Yield Beta Fund class a (inc) usd 0.0143class a (inc) euR 0.0151
class c (acc) usd 0.0169class c (inc) usd 0.0131
class e (acc) (hedged) euR 0.0154sterling e (acc) (hedged) GBp 0.0161sterling e (inc) (hedged) GBp 0.0145
class h (acc) (hedged) euR 0.0149class K (acc) usd 0.0165
class K (acc) (hedged) euR 0.0153class l (acc) usd 0.0165
class l (acc) (hedged) euR 0.0153sterling l (acc) (hedged) GBp 0.0150sterling l (inc) (hedged) GBp 0.0142
class W (acc) usd 0.0169sterling W (acc) (hedged) GBp 0.0151
class W (inc) usd 0.0020class W (inc) (hedged) euR 0.0131
sterling W (inc) (hedged) GBp 0.0020class X (acc) usd 0.0170
sterling X (acc) (hedged) GBp 0.0107class X (inc) usd 0.0107
BNY Mellon Emerging Markets Corporate Debt Fund class a (inc) usd 0.2590class a (inc) (m) hKd 1.0928
class G (inc) usd 1.1992class W (acc) (hedged) chF 1.3177class W (acc) (hedged) euR 1.2638class W (inc) (hedged) chF 1.2353class W (inc) (hedged) euR 1.1438
sterling W (acc) (hedged) GBp 1.8401class X usd 2.4962
sterling X (acc) (hedged) GBp 1.5381BNY Mellon Emerging Markets Debt Fund class c (inc) usd 0.0063
class h (acc) (hedged) euR 0.0075class X (inc) usd 0.0102
BNY Mellon Emerging Markets Debt Local Currency Fund class a (inc) usd 0.0061class a (inc) euR 0.0088
sterling a (acc) GBp 0.0126sterling B (acc) GBp 0.0138
class c (inc) usd 0.0072class c (inc) euR 0.0091
sterling c (acc) GBp 0.0211sterling c (inc) GBp 0.0114
sterling J (inc) (hedged) GBp 0.0057class W (hedged) euR 0.0103
class W (inc) euR 0.0085
03613-1C.indd 429 19/08/2020 19:04

430
BNY MelloN GloBal FuNds, plc
Notes to the FiNaNcial statemeNts
19. SUBSEQUENT EVENTS cont’d.
Fund Share Class Currency 1 July 2020
BNY Mellon Emerging Markets Debt Local Currency Fund cont’d. class W (inc) (hedged) euR 0.0097sterling W (inc) GBp 0.0095
sterling W (inc) (hedged) GBp 0.0072BNY Mellon Emerging Markets Debt Opportunistic Fund class W (acc) usd 0.0133
class X (inc) usd 0.0124BNY Mellon Emerging Markets Debt Total Return Fund class a (acc) usd 0.0138
sterling e (inc) (hedged) GBp 0.0131class h (acc) (hedged) euR 0.0131
class W (acc) usd 0.0139class W (acc) (hedged) euR 0.0126
sterling W (acc) (hedged) GBp 0.0128class X (acc) usd 0.0141
BNY Mellon Euroland Bond Fund class a (inc) euR 0.0025class B (inc) euR 0.0032class c (inc) euR 0.0043
class G (acc) euR 0.0034class W (acc) euR 0.0037
BNY Mellon European Credit Fund class W (acc) euR 0.1641class X euR 0.3476
BNY Mellon Global Bond Fund class c usd 0.0101class c (inc) usd 0.0023
sterling c (inc) GBp 0.0062class W (acc) usd 0.0048class W (acc) euR 0.0049
sterling W (inc) (hedged) GBp 0.0036sterling Z (inc) (hedged) GBp 0.0036
BNY Mellon Global Dynamic Bond Fund class a (inc) usd 0.0015class c usd 0.0035
class G (acc) euR 0.0029class h (acc) (hedged) NoK 0.0134class h (inc) (hedged) euR 0.0013
class i (hedged) euR 0.0027class i (inc) (hedged) euR 0.0024
class W usd 0.0037class W (acc) (hedged) chF 0.0032class W (acc) (hedged) NoK 0.0314class W (inc) (hedged) euR 0.0031
sterling W (acc) (hedged) GBp 0.0036sterling W (inc) (hedged) GBp 0.0032
class X (acc) (hedged) JpY 0.4532sterling Z (acc) GBp 0.0037
sterling Z (acc) (hedged) GBp 0.0036sterling Z (inc) GBp 0.0037
sterling Z (inc) (hedged) GBp 0.0036BNY Mellon Global Equity Income Fund class a euR 0.0171
class a (inc) usd 0.0095class a (inc) euR 0.0087
sterling a (acc) GBp 0.0124class B usd 0.0157class B euR 0.0169
class B (inc) usd 0.0116class B (inc) euR 0.0134
sterling B (inc) GBp 0.0146
03613-1C.indd 430 19/08/2020 19:04

431
BNY MelloN GloBal FuNds, plc
Notes to the FiNaNcial statemeNts
19. SUBSEQUENT EVENTS cont’d.
Fund Share Class Currency 1 July 2020
BNY Mellon Global Equity Income Fund cont’d. class c (inc) usd 0.0121class c (inc) euR 0.0134
sterling c (inc) GBp 0.0152class G (acc) euR 0.0083
class h (inc) (hedged) euR 0.0079class i (inc) (hedged) euR 0.0084
class W usd 0.0130class W (acc) (hedged) euR 0.0075
class W (inc) usd 0.0103class W (inc) euR 0.0120
sterling W (acc) GBp 0.0169sterling W (inc) GBp 0.0134
class Z (acc) usd 0.0109class Z (acc) euR 0.0121class Z (inc) usd 0.0081class Z (inc) euR 0.0082
sterling Z (acc) GBp 0.0076sterling Z (inc) GBp 0.0083
BNY Mellon Global High Yield Bond Fund class c (inc) usd 0.0128class W (acc) usd 0.0150
sterling W (acc) (hedged) GBp 0.0137class X (inc) usd 0.0133
class X (inc) (hedged) euR 0.0119BNY Mellon Global Infrastructure Income Fund class a (acc) usd 0.0104
class a (inc) usd 0.0097class a (inc) euR 0.0099
class B (acc) usd 0.0105class B (acc) sGd 0.0128class B (inc) usd 0.0098class B (inc) sGd 0.0128
class e (acc) usd 0.0108class e (inc) usd 0.0100class e (inc) euR 0.0101
sterling e (inc) (hedged) GBp 0.0094class h (acc) (hedged) euR 0.0097class h (inc) (hedged) euR 0.0090class J (acc) (hedged) sGd 0.0129class J (inc) (hedged) sGd 0.0129
class W (acc) usd 0.0107class W (acc) (hedged) euR 0.0099
class W (inc) usd 0.0100class W (inc) (hedged) euR 0.0092
BNY Mellon Global Multi-Asset Income Fund class a (acc) euR 0.0100class a (inc) euR 0.0093class a (inc) usd 0.0010class e (inc) euR 0.0095
class W (acc) euR 0.0101BNY Mellon Global Short-Dated High Yield Bond Fund class a (acc) usd 0.0108
class a (inc) usd 0.0093class c (acc) usd 0.0124class G (acc) usd 0.0111
class h (acc) (hedged) euR 0.0097class h (inc) (hedged) euR 0.0084
BNY Mellon Global Dynamic Bond Fund cont’d.
BNY Mellon Global Infrastructure Income Fund cont’d.
03613-1C.indd 431 19/08/2020 19:04

432
BNY MelloN GloBal FuNds, plc
Notes to the FiNaNcial statemeNts
19. SUBSEQUENT EVENTS cont’d.
Fund Share Class Currency 1 July 2020
BNY Mellon Global Short-Dated High Yield Bond Fund cont’d. class i (acc) (hedged) euR 0.0111class i (inc) (hedged) euR 0.0094
class W (acc) usd 0.0131class W (acc) (hedged) euR 0.0115class W (acc) (hedged) chF 0.0114
class W (inc) usd 0.0110class W (inc) (hedged) euR 0.0099
sterling W (acc) (hedged) GBp 0.0123sterling W (inc) (hedged) GBp 0.0105
class X (acc) usd 0.0149sterling X (acc) (hedged) GBp 0.0130
class Y (acc) usd 0.0149sterling Y (acc) (hedged) GBp 0.0140sterling Z (acc) (hedged) GBp 0.0116sterling Z (inc) (hedged) GBp 0.0110
BNY Mellon Sustainable Global Dynamic Bond Fund class a (acc) euR 0.0007class a (acc) usd 0.0007class a (inc) euR 0.0007
class c (acc) euR 0.0020class e (acc) euR 0.0033
class e (acc) (hedged) chF 0.0032class G (acc) euR 0.0020
class h (acc) (hedged) chF 0.0007class h (acc) (hedged) NoK 0.0069
class W (acc) euR 0.0026class W (acc) (hedged) chF 0.0025class W (acc) (hedged) NoK 0.0251class W (acc) (hedged) usd 0.0026
sterling W (acc) (hedged) GBp 0.0026sterling W (inc) (hedged) GBp 0.0026
class X (acc) euR 0.0040BNY Mellon Targeted Return Bond Fund class a (acc) usd 0.0006
sterling W (acc) (hedged) GBp 0.0027BNY Mellon U.S. Equity Income Fund class a (acc) euR 0.0063
class B (inc) usd 0.0059class c (inc) usd 0.0064
class e (acc) euR 0.0065class e (inc) usd 0.0065class e (inc) euR 0.0063
sterling e (acc) GBp 0.0070sterling e (inc) GBp 0.0065
sterling e (inc) (hedged) GBp 0.0060class W (acc) usd 0.0070class W (acc) euR 0.0063class W (inc) usd 0.0065
sterling W (inc) GBp 0.0065BNY Mellon U.S. Municipal Infrastructure Debt Fund class c (acc) usd 0.0204
class e (acc) usd 0.0195class e (acc) (hedged) chF 0.0176class e (acc) (hedged) euR 0.0185class e (inc) (hedged) euR 0.0167
class G (acc) euR 0.0120class h (acc) (hedged) euR 0.0181class h (inc) (hedged) euR 0.0164
class W (acc) usd 0.0204class W (acc) euR 0.0171
03613-1C.indd 432 19/08/2020 19:04

433
BNY MelloN GloBal FuNds, plc
Notes to the FiNaNcial statemeNts
19. SUBSEQUENT EVENTS cont’d.
Fund Share Class Currency 1 July 2020
BNY Mellon U.S. Municipal Infrastructure Debt Fund cont’d. class W (acc) (hedged) chF 0.0179class W (acc) (hedged) euR 0.0184
class W (inc) usd 0.0181class W (inc) (hedged) chF 0.0173class W (inc) (hedged) euR 0.0167
class X (acc) usd 0.0198
Other than disclosed above, there were no other significant events affecting the Company since the financial period end.
20. APPROVAL OF FINANCIAL STATEMENTS
The financial statements were approved by the Directors on 18 August 2020.
03613-1C.indd 433 19/08/2020 19:04

434
SIGNIFICANT PORTFOLIO MOVEMENTS
Insight Liquidity Funds Plc - EUR Cash Fund 79,822,971 78,492,000United States Treasury Inflation Indexed Bonds 1.000% 15-Feb-2049 40,227,418 46,449,852Insight Global Funds II plc - Insight Emerging Markets Debt Fund 867,581 12,577,026United States Treasury Inflation Indexed Bonds 1.000% 15-Feb-2048 10,960,624 11,568,985United States Treasury Bill 1.536% 31-Jan-2020 12,600,000 11,416,658United States Treasury Bill (Zero Coupon) 0.000% 30-Jan-2020 9,960,000 9,013,676United States Treasury Bill (Zero Coupon) 0.000% 27-Feb-2020 9,560,000 8,697,574United States Treasury Bill (Zero Coupon) 0.000% 09-Jan-2020 9,560,000 8,608,732Bundesrepublik Deutschland Bundesanleihe 0.000% 12-Jun-2020 7,855,000 7,866,154France Treasury Bill BTF (Zero Coupon) 0.000% 01-Jul-2020 7,855,000 7,862,954United States Treasury Bill (Zero Coupon) 0.000% 23-Jan-2020 8,610,000 7,763,047Credit Agricole SA/London ‘EMTN’ FRN 0.149% 16-Jan-2022 7,800,000 7,640,100United States Treasury Floating Rate Note FRN 0.529% 30-Apr-2021 7,500,000 6,755,191France Government Bond OAT 3.500% 25-Apr-2020 6,325,000 6,337,903Italy Buoni Poliennali Del Tesoro ‘144A’ 2.800% 01-Mar-2067 4,636,000 5,395,748Bundesrepublik Deutschland Bundesanleihe 3.000% 04-Jul-2020 5,124,000 5,159,819ABN AMRO Bank NV ‘144A’ FRN 0.939% 27-Aug-2021 5,400,000 4,991,514PPL Capital Funding Inc 4.125% 15-Apr-2030 4,302,000 4,396,758Bundesrepublik Deutschland Bundesanleihe (Zero Coupon) 0.000% 13-Mar-2020 3,900,000 3,900,000Spain Government Bond ‘144A’ 2.700% 31-Oct-2048 2,219,000 3,212,934
Insight Liquidity Funds Plc - GBP Liquidity Fund 20,587,794 20,587,794Euroclear Bank SA/NV (Zero Coupon) 0.000% 08-Jan-2020 CD 16,500,000 16,500,000United Kingdom Treasury Bill (Zero Coupon) 0.000% 17-Feb-2020 15,100,000 15,100,000ABN AMRO Bank NV ‘EMTN’ FRN 1.143% 29-May-2020 15,000,000 15,000,000ASB Finance Ltd ‘EMTN’ FRN 1.287% 22-May-2020 15,000,000 15,000,000Banco Santander S.A. (Zero Coupon) 0.000% 12-Feb-2020 CP 15,000,000 15,000,000BRED Banque Populaire SA (Zero Coupon) 0.000% 10-Feb-2020 CP 15,000,000 15,000,000Regie Autonome des Transports Parisiens (Zero Coupon) 0.000% 15-Jan-2020 CP 15,000,000 15,000,000Sumitomo Mitsui Banking Corporation (Zero Coupon) 0.000% 02-Mar-2020 CD 15,000,000 15,000,000Toronto-Dominion Bank (Zero Coupon) 0.000% 01-Jun-2020 CD 15,000,000 15,000,000United Kingdom Treasury Bill (Zero Coupon) 0.000% 24-Feb-2020 15,000,000 15,000,000United Kingdom Treasury Bond 4.750% 07-Mar-2020 15,000,000 15,000,000European Investment Bank ‘EMTN’ FRN 1.040% 17-Feb-2020 14,000,000 14,000,000HSBC Bank Plc ‘EMTN’ FRN 0.983% 09-Mar-2020 12,000,000 12,000,000Mizuho Bank Ltd (Zero Coupon) 0.000% 26-Feb-2020 CD 12,000,000 12,000,000Banco Santander S.A. (Zero Coupon) 0.000% 18-May-2020 CP 10,000,000 10,000,000Deutsche Bank AG (Zero Coupon) 0.000% 10-Mar-2020 CP 10,000,000 10,000,000FMS Wertmanagement (Zero Coupon) 0.000% 07-May-2020 CP 10,000,000 10,000,000La Banque Postale Asset Management (Zero Coupon) 0.000% 09-Apr-2020 CP 10,000,000 10,000,000Mizuho Bank (Zero Coupon) 0.000% 28-May-2020 CD 10,000,000 10,000,000MUFG Bank Ltd (Zero Coupon) 0.000% 09-Mar-2020 CD 10,000,000 10,000,000Overseas-Chinese Banking Corporation (Zero Coupon) 0.000% 11-May-2020 CD 10,000,000 10,000,000Sumitomo Mitsui Trust Bank (Zero Coupon) 0.000% 09-Jun-2020 CD 10,000,000 10,000,000United Kingdom Treasury Bill (Zero Coupon) 0.000% 06-Apr-2020 10,000,000 10,000,000United Kingdom Treasury Index-Linked 2.500% 16-Apr-2020 2,800,000 9,844,540Banque Federative du Credit Mutuel SA ‘EMTN’ FRN 1.014% 16-Jan-2020 9,000,000 9,000,000Grifols SA ADR 417,603 7,272,346DBS Bank Ltd (Zero Coupon) 0.000% 18-Jun-2020 CP 6,000,000 6,000,000National Australia Bank Ltd ‘GMTN’ FRN 1.060% 17-Jul-2020 5,000,000 5,005,300BNP Paribas 0.850% 14-Apr-2020 CD 5,000,000 5,000,000United Kingdom Treasury Bill (Zero Coupon) 0.000% 30-Mar-2020 5,000,000 5,000,000
Insight Liquidity Funds Plc - EUR Cash Fund 82,573,834 81,210,643United States Treasury Inflation Indexed Bonds 1.000% 15-Feb-2049 18,544,554 19,995,212United States Treasury Bill (Zero Coupon) 0.000% 27-Feb-2020 9,560,000 8,574,175France Treasury Bill BTF (Zero Coupon) 0.000% 01-Jul-2020 7,855,000 7,872,581Bundesrepublik Deutschland Bundesanleihe (Zero Coupon) 0.000% 12-Jun-2020 7,855,000 7,869,751Bundesrepublik Deutschland Bundesanleihe 3.000% 04-Jul-2020 6,340,000 6,415,700France Government Bond OAT 3.500% 25-Apr-2020 6,325,000 6,376,421Goldman Sachs Group Inc/The ‘EMTN’ FRN 0.277% 09-Sep-2022 5,000,000 5,024,500PPL Capital Funding Inc 4.125% 15-Apr-2030 4,302,000 3,930,121Bundesrepublik Deutschland Bundesanleihe 0.000% 13-Mar-2020 3,900,000 3,903,003Wells Fargo Bank NA ‘BKNT’ FRN 0.989% 27-May-2022 3,551,000 3,272,782Spain Government Bond ‘144A’ 2.700% 31-Oct-2048 2,219,000 3,118,339BNP Paribas SA ‘144A’ FRN (Perpetual) 4.500% 25-Feb-2030 3,347,000 3,091,915Volkswagen Financial Services AG ‘EMTN’ 3.375% 06-Apr-2028 2,916,000 2,900,341Standard Chartered PLC ‘REGS’ FRN 4.644% 01-Apr-2031 3,128,000 2,854,144Boeing Co/The 5.150% 01-May-2030 2,825,000 2,597,342BP Capital Markets Plc 2.822% 07-Apr-2032 2,493,000 2,493,000Credit Suisse Group AG ‘REGS’ FRN 4.194% 01-Apr-2031 2,606,000 2,367,475Coral-U.S. Co-Borrower LLC Term Loan 0.000% 31-Jan-2028 2,500,000 2,256,521Banco Santander SA FRN (Perpetual) 4.375% 14-Apr-2169 2,200,000 2,200,000
United Kingdom Gilt 2.000% 22-Jul-2020 26,000,000 26,143,000United Kingdom Treasury Bond 4.750% 07-Mar-2020 15,000,000 15,019,800MUFG Bank Ltd 0.540% 09-Sep-2020 CD 10,000,000 10,000,000Agence Centrale des Organismes de Securite Sociale (Zero Coupon) 0.000% 13-Jul-2020 CP 10,000,000 9,995,601United Kingdom Treasury Bill (Zero Coupon) 0.000% 06-Apr-2020 10,000,000 9,995,062La Banque Postale Asset Management (Zero Coupon) 0.000% 09-Apr-2020 CP 10,000,000 9,992,198Banque Federative du Credit Mutuel SA (Zero Coupon) 0.000% 07-Aug-2020 CD 10,000,000 9,987,665FMS Wertmanagement (Zero Coupon) 0.000% 07-May-2020 CP 10,000,000 9,984,135Overseas-Chinese Banking Corporation (Zero Coupon) 0.000% 11-May-2020 CD 10,000,000 9,982,974Mizuho Bank Ltd (Zero Coupon) 0.000% 28-May-2020 CD 10,000,000 9,980,504Banco Santander S.A. (Zero Coupon) 0.000% 18-May-2020 CP 10,000,000 9,979,003Dexia Credit Local (Zero Coupon) 0.000% 15-Jul-2020 CP 10,000,000 9,968,048Euroclear Bank SA/NV (Zero Coupon) 0.000% 08-Jul-2020 CD 10,000,000 9,957,795United Kingdom Treasury Index-Linked 2.500% 16-Apr-2020 2,800,000 9,851,100Barclays Plc 0.360% 24-Aug-2020 CD 9,000,000 9,000,000Nordea Bank Abp (Zero Coupon) 0.000% 15-Jul-2020 CP 9,000,000 8,964,929BNP Paribas SA 0.880% 07-Jul-2020 CD 8,000,000 8,001,133Sumitomo Mitsui Trust Bank Ltd 0.170% 09-Sep-2020 CD 8,000,000 8,000,000UBS AG 0.820% 14-Aug-2020 CD 8,000,000 8,000,000Mizuho Bank Ltd (Zero Coupon) 0.000% 28-Aug-2020 CD 8,000,000 7,995,163Banco Santander SA (Zero Coupon) 0.000% 24-Aug-2020 CP 8,000,000 7,987,775Transport For London (Zero Coupon) 0.000% 15-Jul-2020 CP 8,000,000 7,986,758Insight Liquidity Funds Plc - GBP Liquidity Fund 5,915,517 5,915,517BNP Paribas 0.850% 14-Apr-2020 CD 5,000,000 5,000,574United Kingdom Treasury Bill (Zero Coupon) 0.000% 30-Mar-2020 5,000,000 4,997,561National Bank of Abu Dhabi 0.420% 18-Dec-2020 CD 4,000,000 4,000,000Caisse Des Depots Et Consignations (Zero Coupon) 0.000% 06-May-2020 CP 3,000,000 2,994,849
BNY Mellon Absolute Return Equity Fund for the financial period ended 30 June 2020
BNY Mellon Absolute Return Bond Fund for the financial period ended 30 June 2020
BNY MELLON GLOBAL FUNDS, PLC
Major Purchases NominalCost EUR Major Sales and Maturities Nominal
Proceeds EUR
Major Purchases NominalCost GBP Major Sales and Maturities Nominal
Proceeds GBP
03613-1D.indd 434 19/08/2020 19:02

435
BNY MelloN GloBal FuNds, plc
SIGNIFICANT PORTFOLIO MOVEMENTS
UWAGAprzy kolejnym wydaniu dla MAJOR SALES szer 55mm a NOMINAL 14 mm z groszami - poprawic bo psuje w jezykach
BrainPad Inc 2,200 116,206Takeuchi Manufacturing Co Ltd 6,100 102,323Baidu Inc ADR 510 75,043LG Household & Health Care Ltd 70 73,075Tencent Holdings Ltd 1,300 71,419Industri Jamu Dan Farmasi Sido Muncul Tbk PT 700,000 65,380Vision Inc/Tokyo Japan 7,200 61,186British American Tobacco Malaysia Bhd 23,000 52,295Tingyi Cayman Islands Holding Corp 30,000 48,727Orion Corp/Republic of Korea 400 44,164China Feihe Ltd ‘144A’ 24,000 42,605Insource Co Ltd 2,100 40,927Dowa Holdings Co Ltd 1,400 40,644Sichuan Languang Justbon Services Group Co Ltd ‘H’ 8,000 40,585Nifco Inc/Japan 1,800 36,464NeoPharm Co Ltd 1,000 36,098Venture Corp Ltd 3,000 35,448Taiwan Semiconductor Manufacturing Co Ltd ADR 600 35,426Resorttrust Inc 3,200 34,562TeamSpirit Inc 1,600 34,022Totetsu Kogyo Co Ltd 1,200 30,765Hengan International Group Co Ltd 4,000 29,962China Maple Leaf Educational Systems Ltd 100,000 28,946Sakata INX Corp 2,900 27,914Yonex Co Ltd 5,100 26,825Vector Inc 3,500 26,403China Resources Cement Holdings Ltd 20,000 26,182RS Technologies Co Ltd 1,200 24,802Zenkoku Hosho Co Ltd 700 23,663Want Want China Holdings Ltd 30,000 23,650China Medical System Holdings Ltd 20,000 22,772Anicom Holdings Inc 600 21,325Tianjin ZhongXin Pharmaceutical Group Corp Ltd 30,000 20,870Mega Lifesciences PCL NVDR 20,000 18,005Carabao Group PCL NVDR 5,000 15,302
Major Purchases NominalCost USD Major Sales Nominal
Proceeds USD
Nichias Corp 5,000 120,903TechMatrix Corp 3,600 103,776LG Household & Health Care Ltd 89 103,667V-Cube Inc 12,000 101,158Tomy Co Ltd 10,300 85,787BayCurrent Consulting Inc 1,100 83,503MCJ Co Ltd 9,500 66,548Anicom Holdings Inc 1,800 65,968British American Tobacco Malaysia Bhd 23,000 64,903Birla Carbon Thailand PCL NVDR 46,000 59,442eGuarantee Inc 3,900 58,435Open Door Inc 5,100 57,577ANTA Sports Products Ltd 6,000 54,169Nippon Gas Co Ltd 1,600 49,903Arata Corp 1,200 48,384Saha Pathanapibul PCL NVDR 29,100 47,334Anritsu Corp 2,500 46,252Industri Jamu Dan Farmasi Sido Muncul Tbk PT 523,500 45,940China Resources Cement Holdings Ltd 34,000 42,519Baidu Inc ADR 160 35,368Nomura Bank International PLC 7,646 28,515Uni-Charm Indonesia Tbk PT 239,300 28,201Astra Graphia Tbk PT 562,700 27,760Nomura Bank International PLC 6,262 27,460Wacom Co Ltd 6,100 25,606Totetsu Kogyo Co Ltd 900 25,489Huaneng Renewables Corp Ltd 64,000 24,919Sanken Electric Co Ltd 900 23,663Sarana Menara Nusantara Tbk PT 410,100 23,622A-Living Services Co Ltd ‘H’ ‘144A’ 5,000 23,023Insource Co Ltd 700 22,149XL Axiata Tbk PT 90,000 21,912Alibaba Group Holding Ltd ADR 100 21,901Zenkoku Hosho Co Ltd 500 21,744Chlitina Holding Ltd 3,000 20,095
BNY Mellon Asia Rising Stars Fund for the financial period ended 30 June 2020
BNY Mellon Absolute Return Global Convertible Fund for the financial period ended 30 June 2020
France Treasury Bill BTF (Zero Coupon) 0.000% 08-Jul-2020 3,500,000 3,504,163France Treasury Bill BTF (Zero Coupon) 0.000% 01-Jul-2020 3,400,000 3,401,892France Treasury Bill BTF (Zero Coupon) 0.000% 26-Aug-2020 3,000,000 3,009,003United States Treasury Bill (Zero Coupon) 0.000% 17-Mar-2020 3,300,000 2,999,317United States Treasury Bill (Zero Coupon) 0.000% 28-Apr-2020 3,300,000 2,953,272France Treasury Bill BTF (Zero Coupon) 0.000% 19-Aug-2020 2,900,000 2,902,405Bundesrepublik Deutschland Bundesanleihe (Zero Coupon) 0.000% 12-Jun-2020 2,800,000 2,801,064Airbus SE (Zero Coupon) 0.000% 14-Jun-2021 2,700,000 2,738,200Insight Liquidity Funds Plc - EUR Cash Fund 2,700,721 2,655,132France Treasury Bill BTF (Zero Coupon) 0.000% 13-May-2020 2,650,000 2,653,156France Treasury Bill BTF (Zero Coupon) 0.000% 10-Jun-2020 2,500,000 2,504,402French Republic Government Bond OAT (Zero Coupon) 0.000% 25-May-2020 2,500,000 2,503,575France Treasury Bill BTF (Zero Coupon) 0.000% 11-Mar-2020 2,490,000 2,491,388France Treasury Bill BTF (Zero Coupon) 0.000% 16-Sep-2020 2,400,000 2,402,703United States Treasury Bill (Zero Coupon) 0.000% 10-Mar-2020 2,450,000 2,208,468Bayer AG 0.050% 15-Jun-2020 2,200,000 2,192,350Eni SpA (Zero Coupon) 0.000% 13-Apr-2022 2,000,000 2,032,500French Republic Government Bond OAT 2.500% 25-Oct-2020 2,000,000 2,025,180Bundesrepublik Deutschland Bundesanleihe (Zero Coupon) 0.000% 13-Mar-2020 2,000,000 2,001,040America Movil SAB de CV (Zero Coupon) 0.000% 28-May-2020 2,000,000 1,985,000France Treasury Bill BTF (Zero Coupon) 0.000% 29-Jul-2020 1,900,000 1,904,993Bilibili Inc ‘144A’ 1.250% 15-Jun-2027 2,000,000 1,812,397Amadeus IT Group SA 1.500% 09-Apr-2025 1,600,000 1,600,000Broadcom Inc - Preferred Stock 8.000% 30-Sep-2022 1,500 1,564,638Boston Scientific Corp - Preferred Stock 5.500% 01-Jun-2023 15,000 1,419,914France Treasury Bill BTF (Zero Coupon) 0.000% 27-May-2020 1,415,000 1,417,101Slack Technologies Inc ‘144A’ 0.500% 15-Apr-2025 1,500,000 1,382,456United States Treasury Bill (Zero Coupon) 0.000% 30-Apr-2020 1,500,000 1,329,652France Government Bond OAT 3.500% 25-Apr-2020 1,300,000 1,310,452
Major Purchases NominalCost EUR Major Sales and Maturities Nominal
Proceeds EUR
French Republic Government Bond OAT (Zero Coupon) 0.000% 25-Feb-2020 6,685,000 6,685,220France Treasury Bill BTF (Zero Coupon) 0.000% 05-Feb-2020 4,600,000 4,600,821Airbus SE (Zero Coupon) 0.000% 14-Jun-2021 3,700,000 3,670,700Broadcom Inc - Preferred Stock 8.000% 30-Sep-2022 3,500 3,599,373United States Treasury Bill (Zero Coupon) 0.000% 28-Apr-2020 3,300,000 3,056,044United States Treasury Bill (Zero Coupon) 0.000% 17-Mar-2020 3,300,000 2,999,726Stanley Black & Decker Inc - Preferred Stock 5.250% 15-Nov-2022 30,000 2,908,997Bundesrepublik Deutschland Bundesanleihe (Zero Coupon) 0.000% 12-Jun-2020 2,800,000 2,800,170France Treasury Bill BTF (Zero Coupon) 0.000% 13-May-2020 2,650,000 2,650,618France Treasury Bill BTF (Zero Coupon) 0.000% 10-Jun-2020 2,500,000 2,500,275French Republic Government Bond OAT (Zero Coupon) 0.000% 25-May-2020 2,500,000 2,500,084France Treasury Bill BTF (Zero Coupon) 0.000% 11-Mar-2020 2,490,000 2,490,000United States Treasury Bill (Zero Coupon) 0.000% 10-Mar-2020 2,450,000 2,210,461Bayer AG 0.050% 15-Jun-2020 2,200,000 2,200,000France Treasury Bill BTF (Zero Coupon) 0.000% 08-Jul-2020 2,000,000 2,000,483Bundesrepublik Deutschland Bundesanleihe (Zero Coupon) 0.000% 13-Mar-2020 2,000,000 2,000,000America Movil SAB de CV (Zero Coupon) 0.000% 28-May-2020 2,000,000 1,999,000Safran SA (Zero Coupon) 0.000% 21-Jun-2023 12,000 1,966,500Insight Liquidity Funds Plc - EUR Cash Fund 1,983,531 1,949,854Eni SpA (Zero Coupon) 0.000% 13-Apr-2022 2,000,000 1,934,000Eliott Capital Sarl (Zero Coupon) 0.000% 30-Dec-2022 2,000,000 1,907,000Atos SE (Zero Coupon) 0.000% 06-Nov-2024 1,500,000 1,860,250Bilibili Inc ‘144A’ 1.250% 15-Jun-2027 2,000,000 1,807,807Amadeus IT Group SA 1.500% 09-Apr-2025 1,600,000 1,600,000adidas AG 0.050% 12-Sep-2023 1,400,000 1,476,780JPMorgan Chase Bank NA (Zero Coupon) 0.000% 18-Sep-2022 1,300,000 1,473,950France Treasury Bill BTF (Zero Coupon) 0.000% 27-May-2020 1,415,000 1,415,111Slack Technologies Inc ‘144A’ 0.500% 15-Apr-2025 1,500,000 1,401,485United States Treasury Bill (Zero Coupon) 0.000% 30-Apr-2020 1,500,000 1,389,089France Government Bond OAT 3.500% 25-Apr-2020 1,300,000 1,302,820
03613-1D.indd 435 19/08/2020 19:02

436
BNY MelloN GloBal FuNds, plc
SIGNIFICANT PORTFOLIO MOVEMENTS
BNY Mellon Asian Equity Fund for the financial period ended 30 June 2020
Meituan Dianping 88,953 1,120,140Asian Paints Ltd 28,453 658,703Iljin Materials Co Ltd 19,588 626,855Ping An Insurance Group Co of China Ltd ‘H’ 54,500 551,721Tencent Music Entertainment Group ADR 38,599 496,092Housing Development Finance Corp Ltd 19,407 461,135Tencent Holdings Ltd 7,958 436,970Samsung SDI Co Ltd 1,794 421,204Elite Material Co Ltd 93,000 375,268Info Edge India Ltd 10,553 347,071Alibaba Group Holding Ltd ADR 1,520 327,873Kasikornbank PCL (Foreign Market) 74,900 294,729Vale Indonesia Tbk PT 1,666,755 294,395PVR Ltd 11,090 285,660Bank Central Asia Tbk PT 153,500 284,860Maruti Suzuki India Ltd 3,603 253,358Titan Co Ltd 16,262 240,041New Oriental Education & Technology Group Inc ADR 1,591 207,894AIA Group Ltd 20,800 198,689Jubilant Foodworks Ltd 7,553 175,848Taiwan Semiconductor Manufacturing Co Ltd 16,000 170,950Galaxy Resources Ltd 319,428 158,671China Yongda Automobiles Services Holdings Ltd 169,500 153,813IRB InvIT Fund ‘144A’ 225,000 140,838GSX Techedu Inc ADR 3,063 132,188CSL Ltd 628 130,622ASML Holding NV 434 127,208Autohome Inc ADR 1,540 119,80251job Inc ADR 1,672 104,523
Major Purchases NominalCost USD Major Sales Nominal
Proceeds USD
Taiwan Semiconductor Manufacturing Co Ltd 96,000 944,133Applied Materials Inc 17,024 847,035Samsung SDI Co Ltd 2,806 656,927New Oriental Education & Technology Group Inc ADR 4,776 577,570Alibaba Group Holding Ltd ADR 2,823 574,910Godrej Consumer Products Ltd 73,594 566,357CSL Ltd 2,858 561,313AIA Group Ltd 59,000 551,819Tencent Holdings Ltd 10,986 545,822Maruti Suzuki India Ltd 6,417 508,169Fisher & Paykel Healthcare Corporation Limited 24,742 428,582Samsung Electronics Co Ltd 8,506 420,029Autohome Inc ADR 5,127 401,453GSX Techedu Inc ADR 7,461 303,890Housing Development Finance Corp Ltd 11,643 302,159Hindustan Unilever Ltd 10,554 301,873IDP Education Ltd 27,743 279,356Meituan Dianping 19,422 252,973Xero Ltd 4,795 243,297Iljin Materials Co Ltd 6,501 216,065Edelweiss Financial Services Ltd 163,818 214,632Info Edge India Ltd 6,366 211,100Titan Co Ltd 14,006 203,368Kasikornbank PCL (Foreign Market) 51,800 158,315Jubilant Foodworks Ltd 6,979 150,226LG Household & Health Care Ltd 147 148,557Apollo Hospitals Enterprise Ltd 7,190 148,099SEEK Ltd 9,623 134,413Ping An Insurance Group Co of China Ltd ‘H’ 13,000 134,188Asian Paints Ltd 5,825 132,300
BNY Mellon Asian Income Fund for the financial period ended 30 June 2020
Ping An Insurance Group Co of China Ltd ‘H’ 73,000 785,153Samsung Electronics Co Ltd - Preference 12,701 517,726Taiwan Semiconductor Manufacturing Co Ltd 44,000 474,418United Overseas Bank Ltd 18,100 317,836Elite Material Co Ltd 75,000 309,987Link REIT (Units) (REIT) 30,000 288,632Insurance Australia Group Ltd 64,793 286,403DBS Group Holdings Ltd 15,600 267,227CLP Holdings Ltd 23,000 240,962Singapore Technologies Engineering Ltd 80,600 229,720Dexus (Units) (REIT) 25,907 205,880China Mobile Ltd 25,000 203,139Jiangsu Expressway Co Ltd ‘H’ 141,467 188,283Bangkok Bank PCL (Foreign Market) 41,100 178,239Spark New Zealand Ltd 56,740 170,747Venture Corp Ltd 14,100 168,108BHP Group Plc 7,143 150,247Sands China Ltd 30,000 146,078SATS Ltd 49,400 145,090ITC Ltd GDR 48,181 138,029Meridian Energy Ltd 37,558 125,516Star Entertainment Grp Ltd/The 52,941 120,399Singapore Telecommunications Ltd 52,800 116,948Hong Kong Exchanges & Clearing Ltd 3,228 111,931SKYCITY Entertainment Group Ltd 53,745 103,191Telekomunikasi Indonesia Persero Tbk PT 356,120 91,240Scentre Group (REIT) 38,872 87,349Mercury NZ Ltd 26,800 87,100Transurban Group 7,818 81,289Mapletree North Asia Commercial Trust (Units) (REIT) 101,100 79,319
Major Purchases NominalCost USD Major Sales Nominal
Proceeds USD
Quanta Computer Inc 285,000 576,170 Sydney Airport 116,085 558,879 Samsung Electronics Co Ltd - Preference 10,084 434,944 Spark New Zealand Ltd 167,790 405,799 Taiwan Mobile Co Ltd 115,000 379,285 Taiwan Semiconductor Manufacturing Co Ltd 14,000 161,028 United Overseas Bank Ltd 8,700 156,878 Macquarie Korea Infrastructure Fund 15,463 145,711
The above constitutes the full sales detail for the Fund during the financial period.
03613-1D.indd 436 19/08/2020 19:02

437
BNY MelloN GloBal FuNds, plc
SIGNIFICANT PORTFOLIO MOVEMENTS
BNY Mellon Brazil Equity Fund for the financial period ended 30 June 2020
Banco Bradesco SA ADR 763,505 2,870,452Gerdau SA ADR 1,102,100 2,509,033YDUQS Participacoes SA 212,944 2,497,478Itau Unibanco Holding SA ADR 327,400 1,500,877Banco do Brasil SA 196,789 1,500,402B2W Cia Digital 74,000 1,234,563Vale SA ADR - Class B 80,800 1,032,852Marfrig Global Foods SA 340,194 882,593B3 SA - Brasil Bolsa Balcao 81,700 869,392Petroleo Brasileiro SA ADR 65,000 865,740Petroleo Brasileiro SA ADR 93,450 834,958Cia Paranaense de Energia ADR 50,300 817,001JBS SA 179,555 715,991Metalurgica Gerdau SA - Preference 294,200 712,557Atacadao SA 126,600 677,608Hapvida Participacoes e Investimentos SA ‘144A’ 42,100 644,853Bradespar SA - Preference 113,500 622,631BR Malls Participacoes SA 224,706 594,165Embraer SA ADR 34,550 591,523Usinas Siderurgicas de Minas Gerais SA Usiminas - Preference 384,899 588,146Itausa - Investimentos Itau SA - Preference 166,300 564,993Lojas Americanas SA 102,000 524,279Santos Brasil Participacoes SA 284,600 520,700EDP - Energias do Brasil SA 102,900 513,656Petrobras Distribuidora SA 76,100 509,401Telefonica Brasil SA ADR 34,200 443,741Cia Brasileira de Distribuicao - Preference 19,400 424,681Sul America SA (Units) 28,400 404,584Linx SA 49,400 397,697Cia Energetica de Sao Paulo - Preference 52,400 389,056
Major Purchases NominalCost USD Major Sales Nominal
Proceeds USD
B2W Cia Digital 258,063 3,900,397Metalurgica Gerdau SA - Preference 2,456,097 2,962,543Itausa - Investimentos Itau SA - Preference 1,388,185 2,459,289B3 SA - Brasil Bolsa Balcao 199,361 1,910,225Cia Paranaense de Energia ADR 120,700 1,888,887Marfrig Global Foods SA 692,331 1,669,411Vale SA ADR - Class B 135,835 1,472,609Banco Bradesco SA - Preference 425,605 1,442,497CCR SA 261,296 1,187,716Embraer SA ADR 85,300 1,061,560Atacadao SA 204,100 1,001,195Usinas Siderurgicas de Minas Gerais SA Usiminas - Preference 563,969 948,617Banco Bradesco SA ADR 138,400 927,379Banco do Brasil SA 90,800 907,161Hapvida Participacoes e Investimentos SA ‘144A’ 67,900 831,715Itau Unibanco Holding SA ADR 112,900 796,943Lojas Americanas SA 165,200 794,438EDP - Energias do Brasil SA 165,900 771,874Telefonica Brasil SA ADR 56,800 745,008Petrobras Distribuidora SA 122,400 729,450Santos Brasil Participacoes SA 459,200 664,426Cia Brasileira de Distribuicao - Preference 33,100 636,796Petroleo Brasileiro SA - Preference 125,000 628,744Petroleo Brasileiro SA ADR 46,500 618,948Cia Energetica de Sao Paulo - Preference 84,600 598,959BR Malls Participacoes SA 156,500 579,549YDUQS Participacoes SA 52,300 572,014Sul America SA (Units) 45,700 566,049Linx SA 79,400 558,491Petroleo Brasileiro SA ADR 42,250 514,498Petroleo Brasileiro SA 136,399 476,492Tupy SA 129,853 400,406
BNY Mellon Digital Assets Fund for the financial period ended 30 June 2020
OneConnect Financial Technology Co Ltd ADR 49,013 684,998Alphabet Inc - Class A 347 495,632Alibaba Group Holding Ltd ADR 1,572 340,869Quest Diagnostics Inc 2,264 241,098Merck & Co Inc 2,736 225,910Baidu Inc ADR 1,783 211,013Change Healthcare Inc 15,819 204,892Humana Inc 526 203,401Emerson Electric Co 3,221 200,392General Motors Co 6,723 186,001JD.com Inc ADR 4,278 165,994Square Inc 2,462 153,830Tencent Holdings Ltd 2,300 149,253NVIDIA Corp 469 118,645AP Moller - Maersk A/S - Class B 87 107,563Splunk Inc 697 98,396Intel Corp 1,536 92,579ING Groep NV 8,661 61,725Facebook Inc - Class A 266 54,443International Business Machines Corp 383 51,813
Major Purchases NominalCost USD Major Sales Nominal
Proceeds USD
XPO Logistics Inc 4,767 440,464Continental AG 2,569 285,988Nasdaq Inc 2,392 269,885Walmart Inc 2,304 265,880Rakuten Inc 30,300 240,347Carrefour SA 12,250 200,848FleetCor Technologies Inc 905 197,741DocuSign Inc - Class A 2,236 194,466OneConnect Financial Technology Co Ltd ADR 12,911 193,323EPAM Systems Inc 796 181,198Baidu Inc ADR 1,783 180,784Ping An Insurance Group Co of China Ltd ‘H’ 14,000 169,458JPMorgan Chase & Co 1,163 156,318Square Inc 2,170 147,943Broadridge Financial Solutions Inc 1,131 132,817Samsung SDS Co Ltd 876 129,656Swisscom AG 216 111,163LVMH Moet Hennessy Louis Vuitton SE 241 106,855NVIDIA Corp 378 100,459Enel SpA 11,006 93,920Nestle SA 877 93,124Taiwan Semiconductor Manufacturing Co Ltd ADR 1,596 88,361Singapore Exchange Ltd 13,100 78,809TMX Group Ltd 807 66,928ING Groep NV 10,800 63,761SVB Financial Group 370 61,896
03613-1D.indd 437 19/08/2020 19:02

438
BNY MelloN GloBal FuNds, plc
SIGNIFICANT PORTFOLIO MOVEMENTS
The above constitutes the full purchases detail for the Fund during the financial period.
BNY Mellon Dynamic Total Return Fund for the financial period ended 30 June 2020
United States Treasury Bill (Zero Coupon) 0.000% 08-Oct-2020 5,971,000 5,967,446United States Treasury Bill (Zero Coupon) 0.000% 16-Jul-2020 4,440,000 4,408,806United States Treasury Bill (Zero Coupon) 0.000% 22-Oct-2020 3,000,000 2,998,340United States Treasury Bill (Zero Coupon) 0.000% 13-Aug-2020 2,845,000 2,823,289United States Treasury Bill (Zero Coupon) 0.000% 05-Nov-2020 2,239,000 2,237,421United States Treasury Bill (Zero Coupon) 0.000% 19-Nov-2020 1,888,000 1,886,621United States Treasury Bill (Zero Coupon) 0.000% 18-Jun-2020 1,632,000 1,627,279United States Treasury Bill (Zero Coupon) 0.000% 25-Feb-2021 1,478,000 1,476,276United States Treasury Bill (Zero Coupon) 0.000% 17-Dec-2020 1,382,000 1,380,781SPDR Bloomberg Barclays 1-10 Year U.S. Corporate Bond UCITS ETF - ETF 33,981 1,072,655United States Treasury Bill (Zero Coupon) 0.000% 07-May-2020 704,000 703,968iShares Diversified Commodity Swap UCITS ETF - ETF 113,844 455,490United States Treasury Bill (Zero Coupon) 0.000% 12-Mar-2020 414,000 413,384United States Treasury Bill (Zero Coupon) 0.000% 10-Sep-2020 92,000 91,999SPDR Bloomberg Barclays Short Term High Yield Bond ETF - ETF 1,748 42,970
Major Purchases NominalCost USD Major Sales and Maturities Nominal
Proceeds USD
United States Treasury Bill (Zero Coupon) 0.000% 30-Jan-2020 4,440,000 4,440,000United States Treasury Bill (Zero Coupon) 0.000% 18-Jun-2020 3,173,000 3,172,999United States Treasury Bill (Zero Coupon) 0.000% 08-Oct-2020 3,000,000 2,998,593United States Treasury Bill (Zero Coupon) 0.000% 13-Feb-2020 2,845,000 2,845,000United States Treasury Bill (Zero Coupon) 0.000% 21-May-2020 2,579,000 2,579,042United States Treasury Bill (Zero Coupon) 0.000% 30-Apr-2020 2,564,000 2,563,529United States Treasury Bill (Zero Coupon) 0.000% 23-Apr-2020 2,457,000 2,456,878United States Treasury Bill (Zero Coupon) 0.000% 16-Apr-2020 2,363,000 2,362,918United States Treasury Bill (Zero Coupon) 0.000% 07-May-2020 2,239,000 2,239,000United States Treasury Bill (Zero Coupon) 0.000% 16-Jul-2020 1,823,000 1,815,190United States Treasury Bill (Zero Coupon) 0.000% 12-Mar-2020 1,082,000 1,081,671iShares Diversified Commodity Swap UCITS ETF - ETF 252,242 982,034United States Treasury Bill (Zero Coupon) 0.000% 13-Aug-2020 688,000 686,967SPDR Bloomberg Barclays 1-10 Year U.S. Corporate Bond UCITS ETF - ETF 15,547 512,638United States Treasury Bill (Zero Coupon) 0.000% 25-Feb-2021 130,000 129,850United States Treasury Bill (Zero Coupon) 0.000% 10-Sep-2020 92,000 91,898SPDR Bloomberg Barclays Short Term High Yield Bond ETF - ETF 2,646 66,612
BNY Mellon Dynamic U.S. Equity Fund for the financial period ended 30 June 2020
Microsoft Corp 61,042 10,553,085Apple Inc 33,392 9,909,720Amazon.com Inc 3,393 7,276,935United States Treasury Bill (Zero Coupon) 0.000% 08-Oct-2020 6,000,000 5,996,184United States Treasury Bill (Zero Coupon) 0.000% 16-Jul-2020 5,853,000 5,811,879United States Treasury Bill (Zero Coupon) 0.000% 17-Sep-2020 5,000,000 4,997,957United States Treasury Bill (Zero Coupon) 0.000% 17-Dec-2020 5,000,000 4,995,589United States Treasury Bill (Zero Coupon) 0.000% 19-Mar-2020 5,000,000 4,989,127Facebook Inc - Class A 19,414 3,813,738Alphabet Inc - Class A 2,425 3,265,410Alphabet Inc 2,392 3,224,155Berkshire Hathaway Inc - Class B 15,668 3,155,215Johnson & Johnson 21,279 3,094,683United States Treasury Bill (Zero Coupon) 0.000% 06-Aug-2020 3,000,000 2,999,274United States Treasury Bill (Zero Coupon) 0.000% 05-Nov-2020 3,000,000 2,997,884United States Treasury Bill (Zero Coupon) 0.000% 13-Aug-2020 3,000,000 2,977,106JPMorgan Chase & Co 25,078 2,779,957United States Treasury Bill (Zero Coupon) 0.000% 10-Sep-2020 2,625,000 2,624,987Visa Inc - Class A 13,705 2,534,191United States Treasury Bill (Zero Coupon) 0.000% 19-Nov-2020 2,500,000 2,498,174
Major Purchases NominalCost USD Major Sales and Maturities Nominal
Proceeds USD
United States Treasury Bill (Zero Coupon) 0.000% 30-Jan-2020 5,853,000 5,853,000United States Treasury Bill (Zero Coupon) 0.000% 18-Jun-2020 5,695,000 5,695,000United States Treasury Bill (Zero Coupon) 0.000% 19-Mar-2020 5,000,000 5,000,000United States Treasury Bill (Zero Coupon) 0.000% 13-Feb-2020 3,000,000 3,000,000United States Treasury Bill (Zero Coupon) 0.000% 16-Apr-2020 3,000,000 3,000,000United States Treasury Bill (Zero Coupon) 0.000% 23-Apr-2020 3,000,000 3,000,000United States Treasury Bill (Zero Coupon) 0.000% 07-May-2020 3,000,000 3,000,000United States Treasury Bill (Zero Coupon) 0.000% 16-Jul-2020 2,853,000 2,852,508United States Treasury Bill (Zero Coupon) 0.000% 10-Sep-2020 2,625,000 2,624,202United States Treasury Bill (Zero Coupon) 0.000% 30-Apr-2020 2,500,000 2,500,000United States Treasury Bill (Zero Coupon) 0.000% 21-May-2020 2,500,000 2,500,000Allergan Plc 2,417 466,523Apple Inc 937 327,682Nielsen Holdings Plc 4,268 95,088United States Treasury Bill (Zero Coupon) 0.000% 12-Mar-2020 85,000 85,000JPMorgan Chase & Co 869 84,997Alphabet Inc 57 81,606Bank of America Corp 2,959 74,720Intel Corp 1,112 66,298Citigroup Inc 1,108 58,637
The above constitutes the full sales and maturities detail for the Fund during the financial period.
03613-1D.indd 438 19/08/2020 19:02

439
BNY MelloN GloBal FuNds, plc
SIGNIFICANT PORTFOLIO MOVEMENTS
As detailed in the Prospectus, the Fund is established as a feeder fund which invests in BNY Mellon Asian Income Fund (formerly Newton Asian Income Fund) (the “Master Fund”), a sub-fund of BNY Mellon Investments Funds, on a permanent basis. Hence, the above constitutes the full purchases and sales detail for the Fund during the financial period.
BNY Mellon Efficient Global IG Corporate Beta Fund* for the financial period ended 30 June 2020
Cooperatieve Rabobank UA ‘BKNT’ 3.750% 21-Jul-2026 250,000 252,203International Business Machines Corp 3.500% 15-May-2029 200,000 227,890HSBC Holdings Plc FRN 3.262% 13-Mar-2023 200,000 204,542Sumitomo Mitsui Financial Group Inc 2.724% 27-Sep-2029 200,000 193,042GlaxoSmithKline Capital Plc ‘EMTN’ 4.250% 18-Dec-2045 100,000 183,589BAT Capital Corp 3.557% 15-Aug-2027 155,000 156,023Heathrow Funding Ltd ‘EMTN’ 6.750% 03-Dec-2026 100,000 153,132Marsh & McLennan Cos Inc 4.375% 15-Mar-2029 130,000 146,452GlaxoSmithKline Capital Inc 3.875% 15-May-2028 125,000 142,071Philip Morris International Inc 3.125% 03-Jun-2033 100,000 134,096Merck & Co Inc 2.500% 15-Oct-2034 100,000 131,103AXA SA ‘EMTN’ FRN 5.125% 04-Jul-2043 100,000 128,649Cooperatieve Rabobank UA 3.875% 08-Feb-2022 120,000 125,074Muenchener Rueckversicherungs-Gesellschaft AG in Muenchen FRN 3.250% 26-May-2049 100,000 124,661Verizon Communications Inc 1.875% 26-Oct-2029 100,000 124,396Liberty Living Finance Plc 2.625% 28-Nov-2024 100,000 123,415BHP Billiton Finance Ltd 3.250% 24-Sep-2027 100,000 122,891Australia Pacific Airports Melbourne Pty Ltd ‘EMTN’ 3.125% 26-Sep-2023 100,000 122,744ASTM SpA ‘EMTN’ 3.375% 13-Feb-2024 100,000 121,884Credit Suisse Group AG FRN 2.125% 12-Sep-2025 100,000 121,535
Major Purchases NominalCost USD Major Sales Nominal
Proceeds USD
BAT Capital Corp 3.557% 15-Aug-2027 155,000 158,726GlaxoSmithKline Capital Inc 3.875% 15-May-2028 125,000 141,853AbbVie Inc 2.300% 14-May-2021 115,000 116,304International Business Machines Corp 3.500% 15-May-2029 100,000 109,266Societe Generale SA 0.750% 25-Jan-2027 100,000 104,074Orange SA ‘EMTN’ 8.125% 20-Nov-2028 50,000 93,548Heathrow Funding Ltd ‘REGS’ 6.450% 10-Dec-2031 50,000 86,183Corporate Office Properties LP 3.700% 15-Jun-2021 85,000 84,856BAT Capital Corp 3.222% 15-Aug-2024 80,000 82,876Sumitomo Mitsui Financial Group Inc 3.748% 19-Jul-2023 75,000 79,365Anthem Inc 3.125% 15-May-2022 75,000 77,938Sumitomo Mitsui Financial Group Inc 3.944% 19-Jul-2028 70,000 77,881Brookfield Finance Inc 4.850% 29-Mar-2029 70,000 76,851Bank of Nova Scotia/The 2.200% 03-Feb-2025 75,000 76,643Northern Gas Networks Finance Plc 4.875% 30-Jun-2027 50,000 76,387Heathrow Funding Ltd ‘EMTN’ 6.750% 03-Dec-2026 50,000 75,660Royal Bank of Canada ‘GMTN’ 2.750% 01-Feb-2022 70,000 72,793JPMorgan Chase & Co 4.625% 10-May-2021 70,000 72,596Legal & General Group Plc ‘EMTN’ FRN 10.000% 23-Jul-2041 50,000 67,307Stryker Corp 3.375% 01-Nov-2025 60,000 67,187
* Please refer to Note 18 of the financial statements.
BNY Mellon Efficient U.S. High Yield Beta Fund for the financial period ended 30 June 2020
iShares iBoxx High Yield Corporate Bond ETF - ETF 620,000 50,002,326TransDigm Inc ‘144A’ 6.250% 15-Mar-2026 3,963,000 4,027,896Kraft Heinz Foods Co 3.950% 15-Jul-2025 3,240,000 3,422,217Kraft Heinz Foods Co 4.375% 01-Jun-2046 3,595,000 3,365,483Centene Corp 4.625% 15-Dec-2029 2,825,000 3,011,071Kraft Heinz Foods Co 3.000% 01-Jun-2026 2,755,000 2,764,764Ford Motor Co 9.000% 22-Apr-2025 2,600,000 2,665,074Sprint Capital Corp 6.875% 15-Nov-2028 2,131,000 2,619,218Ford Motor Credit Co LLC 3.813% 12-Oct-2021 2,600,000 2,508,326Centene Corp 4.250% 15-Dec-2027 2,235,000 2,350,421HCA Inc 3.500% 01-Sep-2030 2,415,000 2,307,455Kraft Heinz Foods Co 5.000% 04-Jun-2042 2,285,000 2,305,733SBA Communications Corp ‘144A’ 3.875% 15-Feb-2027 2,195,000 2,249,647Altice France SA/France ‘144A’ 7.375% 01-May-2026 2,106,000 2,221,112Solera LLC / Solera Finance Inc ‘144A’ 10.500% 01-Mar-2024 2,075,000 2,142,394Ford Motor Co 8.500% 21-Apr-2023 2,000,000 2,097,690Kraft Heinz Foods Co 5.200% 15-Jul-2045 2,010,000 2,093,787PetSmart Inc ‘144A’ 7.125% 15-Mar-2023 2,130,000 2,078,720CCO Holdings LLC / CCO Holdings Capital Corp ‘144A’ 4.500% 15-Aug-2030 2,035,000 2,076,980ESH Hospitality Inc ‘144A’ 5.250% 01-May-2025 2,055,000 2,033,080
Major Purchases NominalCost USD Major Sales Nominal
Proceeds USD
iShares iBoxx High Yield Corporate Bond ETF - ETF 482,000 39,036,190TransDigm Inc ‘144A’ 5.500% 15-Nov-2027 2,960,000 2,712,310Centene Corp ‘144A’ 4.625% 15-Dec-2029 2,440,000 2,545,779TransDigm Inc ‘144A’ 6.250% 15-Mar-2026 2,460,000 2,401,037CSC Holdings LLC ‘144A’ 5.750% 15-Jan-2030 1,785,000 1,827,871KFC Holding Co/Pizza Hut Holdings LLC/Taco Bell of America LLC ‘144A’ 5.000% 01-Jun-2024 1,480,000 1,445,149Zayo Group LLC / Zayo Capital Inc ‘144A’ 5.750% 15-Jan-2027 1,445,000 1,443,227Sprint Capital Corp 6.875% 15-Nov-2028 1,345,000 1,428,485Solera LLC / Solera Finance Inc ‘144A’ 10.500% 01-Mar-2024 1,350,000 1,427,018Ardagh Packaging Finance Plc / Ardagh Holdings USA Inc ‘144A’ 6.000% 15-Feb-2025 1,364,000 1,421,970ESH Hospitality Inc ‘144A’ 5.250% 01-May-2025 1,482,000 1,408,047Barclays Plc 4.836% 09-May-2028 1,200,000 1,327,923Western Digital Corp 4.750% 15-Feb-2026 1,450,000 1,309,790HCA Inc 5.625% 01-Sep-2028 1,185,000 1,293,963Kraft Heinz Foods Co 3.950% 15-Jul-2025 1,340,000 1,277,139Altice Financing SA ‘144A’ 6.625% 15-Feb-2023 1,248,000 1,270,907Freeport-McMoRan Inc 3.550% 01-Mar-2022 1,238,000 1,256,190Ortho-Clinical Diagnostics Inc / Ortho-Clinical Diagnostics SA ‘144A’ 6.625% 15-May-2022 1,279,000 1,249,944RegionalCare Hospital Partners Holdings Inc / LifePoint Health Inc ‘144A’ 9.750% 01-Dec-2026 1,300,000 1,238,707WestJet Airlines Ltd ‘144A’ 3.500% 16-Jun-2021 1,188,000 1,211,784
03613-1D.indd 439 19/08/2020 19:02
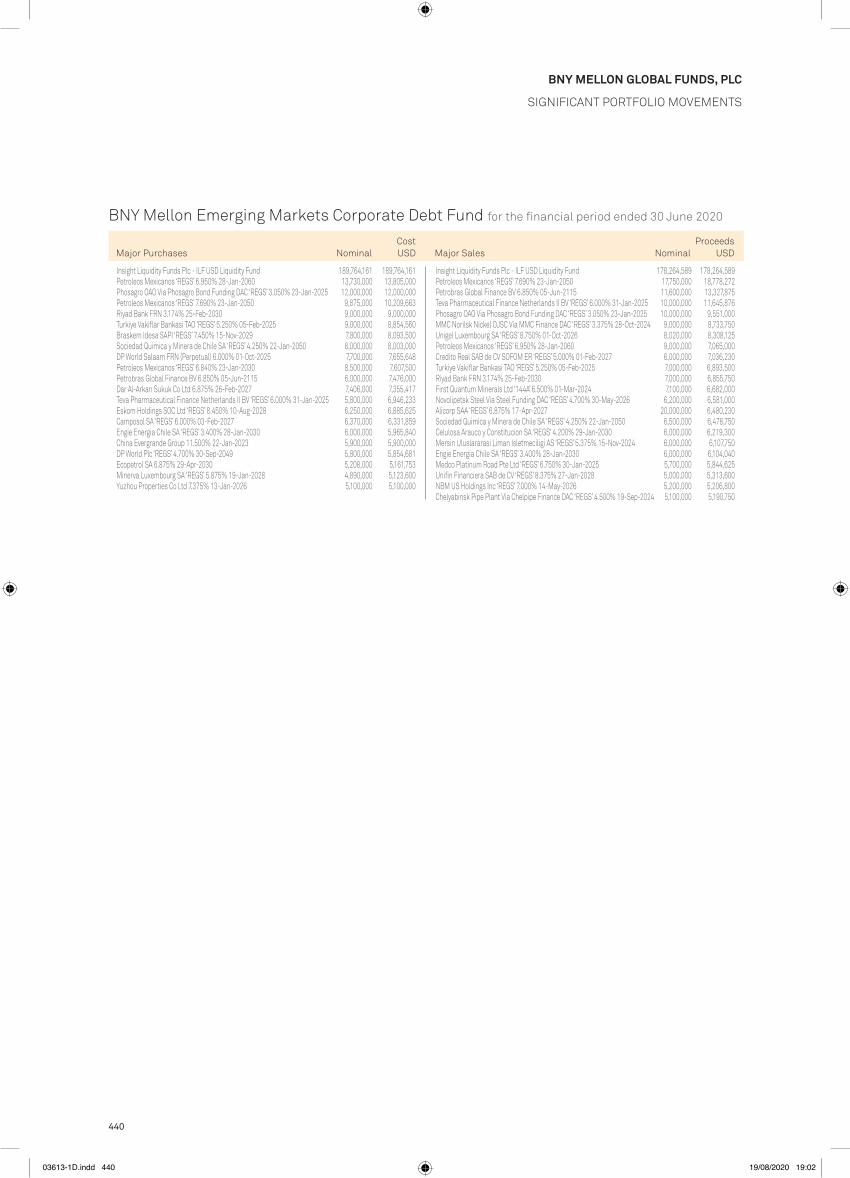
440
BNY MelloN GloBal FuNds, plc
SIGNIFICANT PORTFOLIO MOVEMENTS
BNY Mellon Emerging Markets Corporate Debt Fund for the financial period ended 30 June 2020
Insight Liquidity Funds Plc - ILF USD Liquidity Fund 189,764,161 189,764,161Petroleos Mexicanos ‘REGS’ 6.950% 28-Jan-2060 13,730,000 13,805,000Phosagro OAO Via Phosagro Bond Funding DAC ‘REGS’ 3.050% 23-Jan-2025 12,000,000 12,000,000Petroleos Mexicanos ‘REGS’ 7.690% 23-Jan-2050 9,875,000 10,209,663Riyad Bank FRN 3.174% 25-Feb-2030 9,000,000 9,000,000Turkiye Vakiflar Bankasi TAO ‘REGS’ 5.250% 05-Feb-2025 9,000,000 8,854,560Braskem Idesa SAPI ‘REGS’ 7.450% 15-Nov-2029 7,800,000 8,093,500Sociedad Quimica y Minera de Chile SA ‘REGS’ 4.250% 22-Jan-2050 8,000,000 8,003,000DP World Salaam FRN (Perpetual) 6.000% 01-Oct-2025 7,700,000 7,655,648Petroleos Mexicanos ‘REGS’ 6.840% 23-Jan-2030 8,500,000 7,607,500Petrobras Global Finance BV 6.850% 05-Jun-2115 6,000,000 7,476,000Dar Al-Arkan Sukuk Co Ltd 6.875% 26-Feb-2027 7,406,000 7,355,417Teva Pharmaceutical Finance Netherlands II BV ‘REGS’ 6.000% 31-Jan-2025 5,800,000 6,946,233Eskom Holdings SOC Ltd ‘REGS’ 8.450% 10-Aug-2028 6,250,000 6,885,625Camposol SA ‘REGS’ 6.000% 03-Feb-2027 6,370,000 6,331,859Engie Energia Chile SA ‘REGS’ 3.400% 28-Jan-2030 6,000,000 5,965,840China Evergrande Group 11.500% 22-Jan-2023 5,900,000 5,900,000DP World Plc ‘REGS’ 4.700% 30-Sep-2049 5,800,000 5,854,681Ecopetrol SA 6.875% 29-Apr-2030 5,208,000 5,161,753Minerva Luxembourg SA ‘REGS’ 5.875% 19-Jan-2028 4,890,000 5,123,600Yuzhou Properties Co Ltd 7.375% 13-Jan-2026 5,100,000 5,100,000
Major Purchases NominalCost USD Major Sales Nominal
Proceeds USD
Insight Liquidity Funds Plc - ILF USD Liquidity Fund 178,264,589 178,264,589Petroleos Mexicanos ‘REGS’ 7.690% 23-Jan-2050 17,750,000 18,778,272Petrobras Global Finance BV 6.850% 05-Jun-2115 11,600,000 13,327,875Teva Pharmaceutical Finance Netherlands II BV ‘REGS’ 6.000% 31-Jan-2025 10,000,000 11,645,876Phosagro OAO Via Phosagro Bond Funding DAC ‘REGS’ 3.050% 23-Jan-2025 10,000,000 9,551,000MMC Norilsk Nickel OJSC Via MMC Finance DAC ‘REGS’ 3.375% 28-Oct-2024 9,000,000 8,733,750Unigel Luxembourg SA ‘REGS’ 8.750% 01-Oct-2026 8,020,000 8,308,125Petroleos Mexicanos ‘REGS’ 6.950% 28-Jan-2060 9,000,000 7,065,000Credito Real SAB de CV SOFOM ER ‘REGS’ 5.000% 01-Feb-2027 6,000,000 7,036,230Turkiye Vakiflar Bankasi TAO ‘REGS’ 5.250% 05-Feb-2025 7,000,000 6,893,500Riyad Bank FRN 3.174% 25-Feb-2030 7,000,000 6,855,750First Quantum Minerals Ltd ‘144A’ 6.500% 01-Mar-2024 7,100,000 6,682,000Novolipetsk Steel Via Steel Funding DAC ‘REGS’ 4.700% 30-May-2026 6,200,000 6,581,000Alicorp SAA ‘REGS’ 6.875% 17-Apr-2027 20,000,000 6,480,230Sociedad Quimica y Minera de Chile SA ‘REGS’ 4.250% 22-Jan-2050 6,500,000 6,478,750Celulosa Arauco y Constitucion SA ‘REGS’ 4.200% 29-Jan-2030 6,000,000 6,219,300Mersin Uluslararasi Liman Isletmeciligi AS ‘REGS’ 5.375% 15-Nov-2024 6,000,000 6,107,750Engie Energia Chile SA ‘REGS’ 3.400% 28-Jan-2030 6,000,000 6,104,040Medco Platinum Road Pte Ltd ‘REGS’ 6.750% 30-Jan-2025 5,700,000 5,844,625Unifin Financiera SAB de CV ‘REGS’ 8.375% 27-Jan-2028 5,000,000 5,313,600NBM US Holdings Inc ‘REGS’ 7.000% 14-May-2026 5,200,000 5,206,800Chelyabinsk Pipe Plant Via Chelpipe Finance DAC ‘REGS’ 4.500% 19-Sep-2024 5,100,000 5,190,750
03613-1D.indd 440 19/08/2020 19:02

441
BNY MelloN GloBal FuNds, plc
SIGNIFICANT PORTFOLIO MOVEMENTS
BNY Mellon Emerging Markets Debt Fund for the financial period ended 30 June 2020
Mexico Government International Bond 3.250% 16-Apr-2030 696,000 692,297Saudi Arabian Oil Co ‘REGS’ 3.500% 16-Apr-2029 630,000 665,438Dominican Republic International Bond ‘REGS’ 4.500% 30-Jan-2030 640,000 611,306Petroleos Mexicanos ‘REGS’ 5.950% 28-Jan-2031 575,000 477,250Rede D'or Finance Sarl ‘REGS’ 4.500% 22-Jan-2030 435,000 435,000Ghana Government International Bond ‘REGS’ 7.625% 16-May-2029 450,000 412,275Banco Santander Chile ‘REGS’ 2.700% 10-Jan-2025 400,000 400,000Petroleos Mexicanos ‘REGS’ 6.950% 28-Jan-2060 400,000 400,000Philippine Government International Bond 2.457% 05-May-2030 385,000 385,000MDGH - GMTN BV ‘REGS’ 3.700% 07-Nov-2049 400,000 361,800Export-Import Bank of India ‘REGS’ 3.250% 15-Jan-2030 345,000 343,423Ivory Coast Government International Bond Step-Up Coupon ‘REGS’ 5.750% 31-Dec-2032 320,625 294,275Petroleos Mexicanos ‘REGS’ 6.490% 23-Jan-2027 325,000 281,531Petroleos Mexicanos ‘REGS’ 7.690% 23-Jan-2050 325,000 279,988Colombia Government International Bond 3.000% 30-Jan-2030 275,000 271,997Kenya Government International Bond ‘REGS’ 7.250% 28-Feb-2028 240,000 265,200Hungary Government International Bond 1.625% 28-Apr-2032 230,000 242,413TMK OAO Via TMK Capital SA 4.300% 12-Feb-2027 230,000 230,000Perusahaan Perseroan Persero PT Perusahaan Listrik Negara ‘REGS’ 5.250% 24-Oct-2042 200,000 228,240Turkey Government International Bond 4.250% 13-Mar-2025 230,000 227,919Petroleos Mexicanos 5.625% 23-Jan-2046 305,000 224,938Oman Government International Bond ‘REGS’ 6.000% 01-Aug-2029 265,000 222,600Pakistan Government International Bond ‘REGS’ 6.875% 05-Dec-2027 200,000 216,500Mexico Government International Bond 4.500% 31-Jan-2050 200,000 215,746Millicom International Cellular SA ‘REGS’ 6.625% 15-Oct-2026 225,000 214,875Ukraine Government International Bond FRN 31-May-2040 215,000 213,925Jamaica Government International Bond 6.750% 28-Apr-2028 200,000 207,250Ukraine Government International Bond ‘REGS’ 4.375% 27-Jan-2030 185,000 205,211CBB International Sukuk Programme Co SPC ‘REGS’ 6.250% 14-Nov-2024 200,000 200,000Egypt Government International Bond ‘REGS’ 7.625% 29-May-2032 200,000 200,000Globo Comunicacao e Participacoes SA ‘REGS’ 4.875% 22-Jan-2030 200,000 200,000Guatemala Government Bond ‘REGS’ 5.375% 24-Apr-2032 200,000 200,000MEGlobal Canada ULC ‘REGS’ 5.875% 18-May-2030 200,000 200,000Panama Government International Bond 4.500% 01-Apr-2056 200,000 200,000Petronas Capital Ltd ‘REGS’ 4.550% 21-Apr-2050 200,000 200,000Central American Bank for Economic Integration ‘REGS’ 2.000% 06-May-2025 200,000 199,972Colombia Government International Bond 3.125% 15-Apr-2031 200,000 199,274DP World Salaam FRN (Perpetual) 6.000% 01-Oct-2025 200,000 198,848Mongolia Government International Bond ‘REGS’ 10.875% 06-Apr-2021 200,000 198,500Abu Dhabi Government International Bond ‘REGS’ 2.500% 16-Apr-2025 200,000 198,410Ghana Government International Bond ‘REGS’ 7.875% 11-Feb-2035 200,000 197,920Sri Lanka Government International Bond ‘REGS’ 7.550% 28-Mar-2030 200,000 196,900Kenya Government International Bond ‘REGS’ 6.875% 24-Jun-2024 200,000 184,500Oman Government International Bond ‘REGS’ 6.750% 17-Jan-2048 200,000 174,700Serbia International Bond ‘REGS’ 3.125% 15-May-2027 160,000 170,382Ecuador Government International Bond ‘REGS’ 10.750% 28-Mar-2022 200,000 166,900Banco Santander Mexico SA Institucion de Banca Multiple Grupo Financiero Santand ‘REGS’ 5.375% 17-Apr-2025 165,000 165,000Serbia International Bond ‘REGS’ 1.500% 26-Jun-2029 150,000 150,788United States Treasury Bill (Zero Coupon) 0.000% 30-Jul-2020 150,000 149,957United States Treasury Bill (Zero Coupon) 0.000% 16-Apr-2020 145,000 144,868
Major Purchases NominalCost USD Major Sales and Maturities Nominal
Proceeds USD
KazMunayGas National Co JSC ‘REGS’ 5.750% 19-Apr-2047 830,000 900,925Ivory Coast Government International Bond ‘REGS’ 5.250% 22-Mar-2030 690,000 775,056Turkey Government International Bond 5.750% 22-Mar-2024 730,000 736,388Saudi Government International Bond ‘REGS’ 4.500% 26-Oct-2046 655,000 717,974Mexico Government International Bond 3.750% 11-Jan-2028 660,000 691,984Corp Financiera de Desarrollo SA ‘REGS’ 4.750% 08-Feb-2022 630,000 652,050Vnesheconombank Via VEB Finance Plc 6.902% 09-Jul-2020 630,000 638,568Sinopec Group Overseas Development 2018 Ltd ‘REGS’ 2.950% 08-Aug-2029 580,000 613,199Egypt Government International Bond ‘REGS’ 6.588% 21-Feb-2028 595,000 592,173African Export-Import Bank/The ‘REGS’ 3.994% 21-Sep-2029 520,000 544,433Mexico Government International Bond ‘MTN’ 4.750% 08-Mar-2044 460,000 536,613Ecopetrol SA 5.875% 28-May-2045 585,000 509,258Perusahaan Penerbit SBSN Indonesia III ‘REGS’ 3.400% 29-Mar-2022 500,000 507,923Oman Government International Bond ‘REGS’ 5.625% 17-Jan-2028 650,000 502,225Russian Foreign Bond - Eurobond ‘REGS’ 2.875% 04-Dec-2025 400,000 497,392Saudi Government International Bond ‘REGS’ 4.375% 16-Apr-2029 420,000 484,355Industrias Penoles SAB de CV ‘REGS’ 5.650% 12-Sep-2049 485,000 482,575Saudi Government International Bond ‘REGS’ 0.750% 09-Jul-2027 420,000 478,075Petroleos Mexicanos ‘REGS’ 7.690% 23-Jan-2050 444,000 476,821Turkey Government International Bond 5.125% 17-Feb-2028 480,000 467,568Comision Federal de Electricidad ‘REGS’ 4.875% 26-May-2021 450,000 464,625Petroleos Mexicanos 6.500% 23-Jan-2029 6.500% 23-Jan-2029 450,000 460,688Rede D'or Finance Sarl ‘REGS’ 4.500% 22-Jan-2030 435,000 441,935Mexico Government International Bond 3.250% 16-Apr-2030 450,000 437,970VEON Holdings BV ‘REGS’ 4.000% 09-Apr-2025 405,000 419,175Uruguay Government International Bond 4.975% 20-Apr-2055 330,000 418,040Development Bank of Kazakhstan JSC ‘REGS’ 4.125% 10-Dec-2022 400,000 408,760Philippine Government International Bond 2.457% 05-May-2030 385,000 404,635Dominican Republic International Bond ‘REGS’ 4.500% 30-Jan-2030 440,000 404,078Ukraine Government International Bond ‘REGS’ 7.375% 25-Sep-2032 360,000 401,436Petroleos Mexicanos ‘REGS’ 6.950% 28-Jan-2060 400,000 395,248GUSAP III LP ‘REGS’ 4.250% 21-Jan-2030 370,000 389,518Egypt Government International Bond ‘REGS’ 8.500% 31-Jan-2047 400,000 389,000Nigeria Government International Bond ‘REGS’ 7.696% 23-Feb-2038 400,000 388,000Banque Ouest Africaine de Developpement ‘REGS’ 5.000% 27-Jul-2027 330,000 359,766United States Treasury Bill (Zero Coupon) 0.000% 16-Apr-2020 355,000 354,801Bank of Georgia JSC ‘REGS’ 6.000% 26-Jul-2023 6.000% 26-Jul-2023 375,000 350,625Ecuador Government International Bond ‘REGS’ 8.875% 23-Oct-2027 470,000 347,985Petrobras Global Finance BV 6.900% 19-Mar-2049 355,000 347,545Oman Government International Bond ‘REGS’ 6.750% 17-Jan-2048 410,000 330,195GMR Hyderabad International Airport Ltd ‘REGS’ 4.250% 27-Oct-2027 460,000 330,050
03613-1D.indd 441 19/08/2020 19:02

442
BNY MelloN GloBal FuNds, plc
SIGNIFICANT PORTFOLIO MOVEMENTS
BNY Mellon Emerging Markets Debt Local Currency Fund for the financial period ended 30 June 2020
Mexican Bonos 8.500% 31-May-2029 200,600,000 9,401,720China Government Bond 3.290% 23-May-2029 57,830,000 8,606,558United States Treasury Bill (Zero Coupon) 0.000% 30-Jul-2020 7,420,000 7,418,742Brazil Notas do Tesouro Nacional Serie F 10.000% 01-Jan-2031 23,100,000 6,904,752Mexican Udibonos 4.000% 15-Nov-2040 119,042,161 6,898,022Mexican Bonos 7.500% 03-Jun-2027 132,500,000 5,988,675United States Treasury Bill (Zero Coupon) 0.000% 16-Apr-2020 5,619,000 5,609,456Bonos de la Tesoreria de la Republica en pesos ‘144A’ 4.700% 01-Sep-2030 3,385,000,000 5,184,943China Government Bond 3.250% 06-Jun-2026 26,100,000 3,855,108Czech Republic Government Bond 2.750% 23-Jul-2029 74,700,000 3,294,415Mexican Bonos 7.750% 13-Nov-2042 83,200,000 3,288,910Republic of Poland Government Bond 2.750% 25-Oct-2029 11,470,000 2,921,764Peru Government Bond ‘144A’ 5.940% 12-Feb-2029 8,850,000 2,678,977Romania Government Bond 4.750% 24-Feb-2025 10,760,000 2,642,738China Government Bond 3.120% 05-Dec-2026 18,000,000 2,586,416Indonesia Treasury Bond 7.500% 15-Jun-2035 36,450,000,000 2,081,260Russian Federal Bond - OFZ 7.700% 23-Mar-2033 127,281,000 1,973,461Brazil Notas do Tesouro Nacional Serie F 10.000% 01-Jan-2029 5,380,000 1,595,757Indonesia Treasury Bond 7.000% 15-Sep-2030 24,110,000,000 1,358,423Argentine Republic Government International Bond FRN 5.830% 31-Dec-2033 6,743,000 1,276,737Argentina Treasury Bond BONCER 2.250% 28-Apr-2020 27,892,000 972,210
Major Purchases NominalCost USD Major Sales and Maturities Nominal
Proceeds USD
Peru Government Bond ‘144A’ 5.940% 12-Feb-2029 30,025,000 9,930,402Colombian TES 7.000% 04-May-2022 36,367,000,000 9,719,383Mexican Udibonos 4.500% 04-Dec-2025 194,815,076 9,463,209Republic of South Africa Government Bond 7.000% 28-Feb-2031 173,980,000 9,043,826Brazil Notas do Tesouro Nacional Serie F 10.000% 01-Jan-2025 36,450,000 8,564,514Republic of Poland Government Bond 2.500% 25-Jul-2026 31,220,000 8,277,892Brazil Notas do Tesouro Nacional Serie F 10.000% 01-Jan-2027 33,850,000 7,778,653United States Treasury Bill (Zero Coupon) 0.000% 16-Apr-2020 7,699,000 7,691,500Russian Federal Bond - OFZ 7.000% 16-Aug-2023 542,250,000 7,633,822Indonesia Treasury Bond 8.250% 15-Jun-2032 86,050,000,000 6,438,852Thailand Government Bond 4.875% 22-Jun-2029 137,890,000 5,813,164Brazil Notas do Tesouro Nacional Serie F 9.761% 01-Jan-2023 21,455,000 5,766,858Romania Government Bond 5.800% 26-Jul-2027 22,080,000 5,516,911Russian Federal Bond - OFZ 7.050% 19-Jan-2028 396,320,000 5,468,779Argentine Republic Government International Bond FRN 5.830% 31-Dec-2033 27,418,000 5,117,869Mexican Udibonos 4.000% 15-Nov-2040 119,042,161 5,060,143United States Treasury Bill (Zero Coupon) 0.000% 30-Jul-2020 5,009,000 5,006,200Thailand Government Bond 3.400% 17-Jun-2036 129,685,000 4,892,297Mexican Bonos 10.000% 20-Nov-2036 70,921,600 4,889,802Indonesia Treasury Bond 8.250% 15-May-2036 72,500,000,000 4,568,119Thailand Government Bond 2.125% 17-Dec-2026 135,160,000 4,362,128Republic of South Africa Government Bond 10.500% 21-Dec-2026 70,200,000 4,360,577Transnet SOC Ltd ‘REGS’ 9.500% 13-May-2021 74,300,000 4,294,495Argentina Treasury Bond BONCER 2.500% 22-Jul-2021 98,480,000 4,253,150Republic of South Africa Government Bond 8.750% 28-Feb-2048 97,550,000 4,049,606Turkey Government Bond 11.000% 24-Feb-2027 29,325,000 3,927,363Bonos de la Tesoreria de la Republica en pesos 5.000% 01-Mar-2035 2,800,000,000 3,847,056Malaysia Government Bond 4.893% 08-Jun-2038 14,385,000 3,770,314Turkey Government Bond 10.600% 11-Feb-2026 25,600,000 3,599,835Romania Government Bond 5.850% 26-Apr-2023 14,400,000 3,413,548Thailand Government Bond 3.650% 20-Jun-2031 83,100,000 3,267,175Indonesia Treasury Bond 6.125% 15-May-2028 57,482,000,000 3,260,173Petroleos Mexicanos ‘REGS’ 7.190% 12-Sep-2024 98,650,000 3,213,613Peru Government Bond ‘144A’ 6.150% 12-Aug-2032 9,000,000 2,700,460Russian Federal Bond - OFZ 8.150% 03-Feb-2027 167,500,000 2,657,214Bonos de la Tesoreria de la Republica en pesos 4.500% 01-Mar-2026 1,910,000,000 2,636,806Czech Republic Government Bond 2.750% 23-Jul-2029 52,620,000 2,596,309Malaysia Government Bond 4.181% 15-Jul-2024 10,435,000 2,533,668Indonesia Treasury Bond 7.000% 15-May-2027 35,810,000,000 2,507,081Malaysia Government Bond 3.844% 15-Apr-2033 11,035,000 2,408,318Colombian TES 7.750% 18-Sep-2030 9,985,000,000 2,358,835
03613-1D.indd 442 19/08/2020 19:02

443
BNY MelloN GloBal FuNds, plc
SIGNIFICANT PORTFOLIO MOVEMENTS
BNY Mellon Emerging Markets Debt Opportunistic Fund for the financial period ended 30 June 2020
Mexican Bonos 8.500% 31-May-2029 14,650,000 686,616China Government Bond 3.290% 23-May-2029 3,870,000 575,332Russian Federal Bond - OFZ 7.700% 23-Mar-2033 28,423,000 450,458Bonos de la Tesoreria de la Republica en pesos ‘144A’ 4.700% 01-Sep-2030 285,000,000 435,716MDGH - GMTN BV ‘REGS’ 3.700% 07-Nov-2049 400,000 361,800Indonesia Treasury Bond 7.000% 15-May-2027 5,160,000,000 348,838Republic of Poland Government Bond 2.750% 25-Oct-2029 1,240,000 322,074United States Treasury Bill (Zero Coupon) 0.000% 30-Jul-2020 318,000 317,918Mexican Udibonos 4.000 15-Nov-2040 5,430,918 316,449AI Candelaria Spain SLU ‘REGS’ 7.500% 15-Dec-2028 250,000 286,600Indonesia Treasury Bond 7.500% 15-Jun-2035 4,900,000,000 279,944Peru Government Bond ‘144A’ 5.940% 12-Feb-2029 900,000 272,440Thailand Government Bond 4.875% 22-Jun-2029 6,100,000 258,107Indonesia Treasury Bond 7.500% 15-Aug-2032 3,527,000,000 257,843Malaysia Government Bond 3.885% 15-Aug-2029 980,000 255,202Russian Federal Bond - OFZ 8.150% 03-Feb-2027 15,400,000 231,118Mexican Bonos 7.750% 13-Nov-2042 5,800,000 229,275Egypt Government International Bond ‘REGS’ 7.600 01-Mar-2029 200,000 227,800Prosus NV ‘REGS’ 5.500% 21-Jul-2025 200,000 225,440Vnesheconombank Via VEB Finance Plc ‘REGS’ 5.942% 21-Nov-2023 200,000 222,300Kenya Government International Bond ‘REGS’ 7.250% 28-Feb-2028 200,000 221,000Pakistan Government International Bond ‘REGS’ 6.875% 05-Dec-2027 200,000 218,000Saudi Arabian Oil Co ‘REGS’ 3.500% 16-Apr-2029 200,000 212,678Mexican Bonos 7.500% 03-Jun-2027 4,850,000 212,532Rede D'or Finance Sarl ‘REGS’ 4.500% 22-Jan-2030 210,000 210,000Development Bank of Kazakhstan JSC ‘REGS’ 4.125% 10-Dec-2022 200,000 209,200CBB International Sukuk Programme Co SPC ‘REGS’ 6.250% 14-Nov-2024 200,000 200,000Panama Government International Bond 4.500% 01-Apr-2056 200,000 200,000VF Ukraine PAT via VFU Funding Plc ‘REGS’ 6.200% 11-Feb-2025 200,000 200,000VTR Comunicaciones SpA ‘REGS’ 5.125% 15-Jan-2028 200,000 200,000Export-Import Bank of India ‘REGS’ 3.250% 15-Jan-2030 200,000 199,086DP World Salaam FRN (Perpetual) 6.000% 01-Oct-2025 200,000 198,848Abu Dhabi Government International Bond ‘REGS’ 2.500% 16-Apr-2025 200,000 198,410Perusahaan Perseroan Persero PT Perusahaan Listrik Negara ‘REGS’ 3.000% 30-Jun-2030 200,000 198,292Turkey Government International Bond 4.250% 13-Mar-2025 200,000 198,190Ghana Government International Bond ‘REGS’ 7.875% 11-Feb-2035 200,000 197,920Petronas Capital Ltd ‘REGS’ 3.500% 21-Apr-2030 200,000 197,472Empresas Publicas de Medellin ESP ‘REGS’ 7.625% 10-Sep-2024 625,000,000 191,845Ghana Government International Bond ‘REGS’ 7.625% 16-May-2029 200,000 185,400VTR Finance NV ‘REGS’ 6.875% 15-Jan-2024 200,000 180,000Russian Federal Bond - OFZ 7.050% 19-Jan-2028 10,600,000 171,724Oman Government International Bond ‘REGS’ 6.000% 01-Aug-2029 200,000 168,000Petroleos Mexicanos ‘REGS’ 7.690% 23-Jan-2050 195,000 167,993Ecuador Government International Bond ‘REGS’ 10.750% 28-Mar-2022 200,000 166,900Romania Government Bond 4.750% 24-Feb-2025 650,000 159,645Argentine Republic Government International Bond 3.750% 31-Dec-2038 380,000 151,430Banco Santander Mexico SA Institucion de Banca Multiple Grupo Financiero Santand ‘REGS’ 5.375% 17-Apr-2025 150,000 150,000Dominican Republic International Bond ‘REGS’ 4.500% 30-Jan-2030 150,000 148,809China Government Bond 3.250% 06-Jun-2026 1,000,000 147,705China Government Bond 3.120% 05-Dec-2026 1,000,000 143,690Serbia International Bond ‘REGS’ 1.500% 26-Jun-2029 140,000 140,736Czech Republic Government Bond 2.750% 23-Jul-2029 3,200,000 140,536
Major Purchases NominalCost USD Major Sales Nominal
Proceeds USD
Nexa Resources SA ‘REGS’ 5.375% 04-May-2027 400,000 430,000Peru Government Bond ‘144A’ 5.940% 12-Feb-2029 1,260,000 420,568Egypt Government International Bond ‘REGS’ 7.600% 01-Mar-2029 400,000 406,800Argentina Treasury Bond BONCER 2.500% 22-Jul-2021 7,940,000 348,452HTA Group Ltd/Mauritius ‘REGs’ 9.125% 08-Mar-2022 340,000 347,755Romania Government Bond 5.800% 26-Jul-2027 1,280,000 313,266DP World Plc ‘REGS’ 6.850% 02-Jul-2037 250,000 304,375United States Treasury Bill (Zero Coupon) 0.000% 30-Jul-2020 298,000 297,936Russian Federal Bond - OFZ 7.000% 16-Aug-2023 21,000,000 290,473Malaysia Government Bond 3.885% 15-Aug-2029 1,250,000 290,397GMR Hyderabad International Airport Ltd ‘REGS’ 4.250% 27-Oct-2027 390,000 279,825Nigeria Government International Bond ‘REGS’ 6.500% 28-Nov-2027 275,000 276,375Argentine Republic Government International Bond FRN 5.830% 31-Dec-2033 1,339,000 254,295KazTransGas JSC ‘REGS’ 4.375% 26-Sep-2027 260,000 251,290NMC Healthcare Sukuk Ltd (Defaulted) 5.950% 21-Nov-2023 250,000 250,625Mexican Udibonos 4.000% 15-Nov-2040 5,430,918 228,880ICL Group Ltd ‘144A’ 6.375% 31-May-2038 200,000 220,000Senegal Government International Bond ‘REGS’ 6.250% 23-May-2033 200,000 216,400Turkey Government Bond 10.600% 11-Feb-2026 1,615,000 216,069Turkey Government International Bond 6.350% 10-Aug-2024 200,000 214,146Industrias Penoles SAB de CV ‘REGS’ 5.650% 12-Sep-2049 215,000 213,925Angolan Government International Bond ‘REGS’ 8.250% 09-May-2028 200,000 212,300Petronas Capital Ltd ‘REGS’ 3.500% 21-Apr-2030 200,000 212,174Mexico Government International Bond 4.500% 22-Apr-2029 200,000 208,106Abu Dhabi Government International Bond ‘REGS’ 2.500% 16-Apr-2025 200,000 207,000Oman Government International Bond ‘REGS’ 6.000% 01-Aug-2029 220,000 203,500Thailand Government Bond 4.875% 22-Jun-2029 4,925,000 200,999Indonesia Treasury Bond 7.500% 15-Aug-2032 2,740,000,000 197,569MHP Lux SA ‘REGS’ 6.250% 19-Sep-2029 200,000 195,140Tullow Oil PLC ‘REGS’ 7.000% 01-Mar-2025 210,000 169,092Dominican Republic International Bond ‘REGS’ 6.000% 19-Jul-2028 150,000 167,220Banco Santander Mexico SA Institucion de Banca Multiple Grupo Financiero Santand ‘REGS’ 5.375% 17-Apr-2025 150,000 165,000Indonesia Treasury Bond 11.000% 15-Sep-2025 2,162,000,000 161,389Czech Republic Government Bond 2.750% 23-Jul-2029 3,200,000 157,890Romania Government Bond 4.750% 24-Feb-2025 665,000 157,041Serbia International Bond ‘REGS’ 1.500% 26-Jun-2029 140,000 149,998Thailand Government Bond 2.125% 17-Dec-2026 4,350,000 148,186Ecuador Government International Bond ‘REGS’ 0.000% 23-Jan-2028 200,000 140,000Indonesia Treasury Bond 6.125% 15-May-2028 2,425,000,000 137,537Brazil Notas do Tesouro Nacional Serie F 10.000% 01-Jan-2025 450,000 126,686Transnet SOC Ltd ‘REGS’ 9.500% 13-May-2021 2,200,000 121,392
03613-1D.indd 443 19/08/2020 19:02

444
BNY MelloN GloBal FuNds, plc
SIGNIFICANT PORTFOLIO MOVEMENTS
BNY Mellon Emerging Markets Debt Total Return Fund for the financial period ended 30 June 2020
BNY Mellon Euroland Bond Fund for the financial period ended 30 June 2020
Insight Liquidity Funds Plc - ILF USD Liquidity Fund 141,589,935 141,589,935Brazil Notas do Tesouro Nacional Serie F 10.000% 01-Jan-2025 30,000,000 6,604,938Turkey Government International Bond 5.250% 13-Mar-2030 6,200,000 5,801,022Republic of South Africa Government Bond 8.000% 31-Jan-2030 111,575,016 5,748,078Romanian Government International Bond ‘REGS’ 3.375% 28-Jan-2050 4,785,000 5,260,866Brazil Notas do Tesouro Nacional Serie F 10.000% 01-Jan-2027 20,000,000 4,962,546Republic of South Africa Government Bond 10.500% 21-Dec-2026 74,425,032 4,646,867Petrobras Global Finance BV 6.850% 05-Jun-2115 4,675,000 4,623,650Mexico Government International Bond 3.900% 27-Apr-2025 4,157,000 4,370,884Indonesia Treasury Bond 8.125% 15-May-2024 63,000,000,000 4,208,237Ecopetrol SA 6.875% 29-Apr-2030 4,232,000 4,206,580Chile Government International Bond 3.500% 25-Jan-2050 3,900,000 4,066,803United States Treasury Bill (Zero Coupon) 0.000% 28-Apr-2020 4,000,000 4,000,030Dominican Republic International Bond ‘REGS’ 6.500% 15-Feb-2048 4,100,000 3,973,050Perusahaan Perseroan Persero PT Perusahaan Listrik Negara ‘REGS’ 3.000% 30-Jun-2030 4,000,000 3,965,840Peru Government Bond ‘144A’ 5.350% 12-Aug-2040 12,500,000 3,912,768Abu Dhabi Government International Bond ‘REGS’ 2.500% 30-Sep-2029 3,900,000 3,883,300Romania Government Bond 3.650% 24-Sep-2031 17,700,000 3,839,957Saudi Government International Bond ‘REGS’ 2.000% 09-Jul-2039 3,300,000 3,807,101DP World Salaam FRN (Perpetual) 6.000% 01-Oct-2025 3,800,000 3,778,112
French Republic Government Bond OAT ‘144A’ 0.700% 25-Jul-2030 29,326,583 34,548,760French Republic Government Bond OAT ‘144A’ 2.000% 25-May-2048 14,875,000 19,671,146United States Treasury Bill (Zero Coupon) 0.000% 30-Jul-2020 17,332,000 16,018,813Repsol International Finance BV ‘EMTN’ 2.625% 15-Apr-2030 11,900,000 11,887,624Bundesrepublik Deutschland Bundesanleihe 2.500% 15-Aug-2046 7,300,000 11,547,870Latvia Government International Bond 0.375% 07-Oct-2026 10,000,000 9,980,100Portugal Obrigacoes do Tesouro OT ‘144A’ 3.875% 15-Feb-2030 7,325,000 9,979,903Societe Du Grand Paris EPIC 1.700% 25-May-2050 8,000,000 9,399,520Societe Du Grand Paris EPIC ‘EMTN’ 1.700% 25-May-2050 8,000,000 9,394,292Spain Government Bond ‘144A’ 0.600% 31-Oct-2029 8,975,000 9,368,998Lloyds Bank Corporate Markets Plc ‘EMTN’ 2.375% 09-Apr-2026 7,425,000 7,376,292Airbus SE 2.000% 07-Apr-2028 7,000,000 6,973,890Barclays Plc ‘EMTN’ FRN 3.375% 02-Apr-2025 6,100,000 6,079,382Shell International Finance BV ‘EMTN’ 1.875% 07-Apr-2032 6,000,000 5,968,140Bank of America Corp ‘MTN’ FRN 4.083% 20-Mar-2051 6,500,000 5,908,552PepsiCo Inc 3.625% 19-Mar-2050 6,350,000 5,741,839Exxon Mobil Corp 4.327% 19-Mar-2050 6,300,000 5,726,750Bundesobligation 0.000% 05-Apr-2024 5,300,000 5,461,809BP Capital Markets Plc 2.822% 07-Apr-2032 5,400,000 5,400,000Hellenic Republic Government Bond ‘144A’ 2.000% 22-Apr-2027 4,725,000 4,721,031Sanofi 1.500% 01-Apr-2030 4,300,000 4,581,177Hungary Government International Bond 1.625% 28-Apr-2032 4,675,000 4,570,140Italy Buoni Poliennali Del Tesoro 3.000% 01-Aug-2029 4,000,000 4,475,160Nestle Finance International Ltd 0.375% 12-May-2032 4,500,000 4,417,065
Major Purchases NominalCost USD Major Sales and Maturities Nominal
Proceeds USD
Major Purchases NominalCost EUR Major Sales and Maturities Nominal
Proceeds EUR
Insight Liquidity Funds Plc - ILF USD Liquidity Fund 136,639,811 136,639,811Turkey Government International Bond 5.250% 13-Mar-2030 6,200,000 5,675,768Republic of South Africa Government Bond 8.000% 31-Jan-2030 111,575,016 5,405,204Petrobras Global Finance BV 6.850% 05-Jun-2115 5,100,000 5,401,675Romanian Government International Bond ‘REGS’ 3.375% 28-Jan-2050 4,085,000 4,765,624Ecopetrol SA 6.875% 29-Apr-2030 4,232,000 4,661,754Chile Government International Bond 3.500% 25-Jan-2050 4,500,000 4,633,133Mexican Bonos 8.500% 31-May-2029 85,070,000 4,323,276Colombia Government International Bond 4.500% 15-Mar-2029 4,050,000 4,261,875Brazil Notas do Tesouro Nacional Serie F 10.000% 01-Jan-2027 18,000,000 4,034,531United States Treasury Bill (Zero Coupon) 0.000% 28-Apr-2020 4,000,000 4,000,113Egypt Government International Bond ‘REGS’ 8.700% 01-Mar-2049 3,650,000 3,941,938Saudi Government International Bond ‘REGS’ 2.000% 09-Jul-2039 3,300,000 3,795,873Bonos de la Tesoreria de la Republica en pesos ‘144A’ 4.700% 01-Sep-2030 2,500,000,000 3,657,603Angolan Government International Bond ‘REGS’ 8.000% 26-Nov-2029 3,703,000 3,546,483Romania Government Bond 3.650% 24-Sep-2031 17,700,000 3,536,435Peru Government Bond ‘144A’ 5.350% 12-Aug-2040 12,500,000 3,511,033Ukraine Government International Bond ‘REGS’ 7.750% 01-Sep-2025 3,100,000 3,259,250Ghana Government International Bond ‘REGS’ 7.875% 11-Feb-2035 3,220,000 2,985,178Petroleos Mexicanos ‘REGS’ 7.690% 23-Jan-2050 2,714,000 2,962,866
French Republic Government Bond OAT 0.750% 25-May-2028 75,015,000 81,022,613French Republic Government Bond OAT ‘144A’ 2.000% 25-May-2048 46,125,000 61,950,956Bundesrepublik Deutschland Bundesanleihe 4.750% 04-Jul-2028 28,075,000 40,510,790Bundesrepublik Deutschland Bundesanleihe 2.500% 15-Aug-2046 22,745,000 37,982,436Bundesobligation 0.000% 05-Apr-2024 33,300,000 34,197,174Italy Buoni Poliennali Del Tesoro 4.750% 01-Sep-2021 29,145,000 30,774,377Japanese Government CPI Linked Bond 0.100% 10-Mar-2027 2,609,586,615 21,545,699Russian Federal Bond - OFZ 7.050% 19-Jan-2028 1,811,775,000 20,639,206Spain Government Bond ‘144A’ 4.400 31-Oct-2023 17,280,000 19,918,658Italy Buoni Poliennali Del Tesoro 1.350% 15-Apr-2022 18,150,000 18,530,028Spain Government Bond ‘144A’ 2.900% 31-Oct-2046 11,550,000 15,500,686French Republic Government Bond OAT ‘144A’ 0.700% 25-Jul-2030 14,717,380 15,446,429Korea Treasury Bond 2.375% 10-Dec-2028 17,128,800,000 14,069,697Kingdom of Belgium Government Bond ‘144A’ 1.600% 22-Jun-2047 10,135,000 12,126,138Kingdom of Belgium Government Bond ‘144A’ 2.600% 22-Jun-2024 10,325,000 11,600,917Spain Government Bond 1.400% 31-Jan-2020 11,510,000 11,510,000United States Treasury Bill (Zero Coupon) 0.000% 16-Apr-2020 10,700,000 9,887,975Australia Government Bond 3.000% 21-Mar-2047 12,050,000 9,444,674Societe Du Grand Paris EPIC 1.700% 25-May-2050 8,000,000 9,394,292BNY Mellon U.S. Municipal Infrastructure Debt Fund 7,023,088 7,300,264
03613-1D.indd 444 19/08/2020 19:02

445
BNY MelloN GloBal FuNds, plc
SIGNIFICANT PORTFOLIO MOVEMENTS
BNY Mellon Global Bond Fund for the financial period ended 30 June 2020
United States Treasury Note/Bond 2.375% 15-May-2029 28,340,000 31,186,524United States Treasury Note/Bond 1.500% 15-Feb-2030 23,490,000 25,345,593Denmark Government Bond ‘144A’ 0.500% 15-Nov-2029 97,100,000 15,228,745United States Treasury Note/Bond 1.500% 15-Aug-2026 12,620,000 13,334,374United Kingdom Gilt Inflation Linked 0.125% 22-Mar-2026 7,696,610 11,678,824United States Treasury Note/Bond 0.500% 15-Mar-2023 11,470,000 11,452,367iShares China CNY Bond UCITS ETF - ETF 2,120,159 11,071,211Italy Buoni Poliennali Del Tesoro ‘144A’ 1.850% 01-Jul-2025 10,020,000 10,902,958United States Treasury Note/Bond 1.125% 28-Feb-2022 10,420,000 10,567,540Japan Government Two Year Bond 0.100% 01-Jun-2021 973,500,000 8,897,556New South Wales Treasury Corp 3.000% 20-Mar-2028 11,430,000 8,855,391Japan Government Two Year Bond 0.100% 01-Apr-2022 941,000,000 8,843,861United States Treasury Note/Bond 3.000% 15-Nov-2045 7,190,000 8,535,251Canada Housing Trust No 1 ‘144A’ 2.100% 15-Sep-2029 10,790,000 8,462,824Canada Housing Trust No 1 ‘144A’ 2.350% 15-Sep-2023 9,720,000 7,289,000United States Treasury Note/Bond 2.000% 15-Feb-2050 5,990,000 6,682,106Ireland Government Bond 1.100% 15-May-2029 4,930,000 6,321,836Japan Government Ten Year Bond 0.100% 20-Dec-2029 630,650,000 6,181,021Treasury Corp of Victoria 1.000% 20-Nov-2023 9,150,000 6,137,522Italy Buoni Poliennali Del Tesoro 4.500% 01-May-2023 4,780,000 6,022,012Norway Government Bond ‘144A’ 1.375% 19-Aug-2030 55,620,000 6,002,247Czech Republic Government Bond 2.750% 23-Jul-2029 128,170,000 5,879,820Italy Buoni Poliennali Del Tesoro 6.500% 01-Nov-2027 3,800,000 5,879,235Mexican Bonos 8.500% 31-May-2029 95,710,000 5,840,514Spain Government Bond 5.750% 30-Jul-2032 3,290,000 5,761,488Colombia Government International Bond ‘REGS’ 6.000% 28-Apr-2028 18,453,200,000 5,540,397Qatar Government International Bond ‘REGS’ 3.400% 16-Apr-2025 5,288,000 5,476,625Peruvian Government International Bond ‘REGS’ 8.200% 12-Aug-2026 12,680,000 4,821,095Italy Buoni Poliennali Del Tesoro ‘144A’ 2.450% 01-Sep-2050 4,990,000 4,754,830Malaysia Government Bond 3.906% 15-Jul-2026 18,858,000 4,698,771Japan Government Twenty Year Bond 0.400% 20-Mar-2040 489,950,000 4,664,258Abu Dhabi Government International Bond ‘REGS’ 2.500% 16-Apr-2025 4,433,000 4,504,693Peruvian Government International Bond 2.392% 23-Jan-2026 4,400,000 4,430,590Australia Government Bond 3.000% 20-Sep-2025 4,990,000 4,352,240Mexico Government International Bond 3.900% 27-Apr-2025 4,288,000 4,273,006United States Treasury Inflation Indexed Bonds 0.500% 15-Apr-2024 3,961,283 3,925,331
Major Purchases NominalCost USD Major Sales and Maturities Nominal
Proceeds USD
Japan Government Two Year Bond 0.100% 01-Jun-2021 3,107,400,000 29,329,996United States Treasury Note/Bond 1.500% 15-Feb-2030 20,710,000 22,093,909United Kingdom Gilt 4.250% 07-Dec-2027 12,200,000 20,489,143United States Treasury Note/Bond 2.375% 15-May-2029 17,784,300 19,838,305Canada Housing Trust No 1 ‘144A’ 2.650% 15-Mar-2028 23,800,000 19,198,631Japan Government Two Year Bond 0.100% 15-Apr-2020 1,888,450,000 17,625,869Italy Buoni Poliennali Del Tesoro 4.500% 01-Mar-2024 13,170,000 15,985,663United States Treasury Inflation Indexed Bonds 0.750% 15-Jul-2028 13,840,005 14,851,584United States Treasury Note/Bond 2.875% 15-May-2043 11,240,000 14,377,649Hungary Government Bond 2.500% 24-Oct-2024 4,377,210,000 13,998,812Norway Government Bond ‘144A’ 1.750% 17-Feb-2027 125,610,000 13,793,630United Kingdom Gilt Inflation Linked 0.125% 22-Mar-2026 7,696,610 10,974,206New Zealand Local Government Funding Agency Bond 4.500% 15-Apr-2027 14,500,000 10,829,526United States Treasury Note/Bond 3.000% 15-Nov-2045 8,260,000 10,428,438Italy Buoni Poliennali Del Tesoro 6.500% 01-Nov-2027 6,970,000 10,382,621United States Treasury Note/Bond 0.125% 15-Apr-2020 9,065,925 9,075,807United States Treasury Note/Bond 1.500% 15-Aug-2026 7,730,000 8,093,254Kreditanstalt fuer Wiederaufbau 1.500% 20-Apr-2020 7,800,000 7,798,440Singapore Government Bond 2.750% 01-Mar-2046 7,050,000 6,580,365Japanese Government CPI Linked Bond 0.100% 10-Mar-2028 640,781,339 6,199,965Italy Buoni Poliennali Del Tesoro ‘144A’ 3.850% 01-Sep-2049 4,400,000 5,520,153Dexia Credit Local SA/New York NY ‘REGS’ 1.875% 29-Jan-2020 4,850,000 4,850,000Peruvian Government International Bond 2.392% 23-Jan-2026 4,400,000 4,566,888United States Treasury Inflation Indexed Bonds 1.000% 15-Feb-2046 2,887,652 3,651,954
BNY Mellon European Credit Fund for the financial period ended 30 June 2020
BNY Mellon Emerging Markets Debt Fund 9,495 1,562,837UniCredit SpA FRN 2.731% 15-Jan-2032 1,112,000 1,119,608Repsol International Finance BV FRN 4.500% 25-Mar-2075 950,000 1,096,490Exxon Mobil Corp 0.142% 26-Jun-2024 820,000 820,000Verizon Communications Inc 1.850% 18-May-2040 783,000 782,867Banco BPM SpA ‘EMTN’ 1.625% 18-Feb-2025 651,000 650,468International Business Machines Corp 1.950% 15-May-2030 700,000 641,201BPCE SA 0.625% 28-Apr-2025 600,000 597,120JPMorgan Chase & Co ‘EMTN’ FRN 0.389% 24-Feb-2028 589,000 589,000UBS AG/London ‘EMTN’ 0.750% 21-Apr-2023 585,000 585,020BNP Paribas SA ‘EMTN’ 0.125% 04-Sep-2026 600,000 576,492Barclays Plc ‘EMTN’ FRN 0.750% 09-Jun-2025 540,000 540,491Oracle Corp 3.600% 01-Apr-2050 587,000 528,451Fidelity National Information Services Inc 0.125% 03-Dec-2022 530,000 527,933Volkswagen Financial Services AG ‘EMTN’ 0.250% 16-Oct-2020 530,000 527,505Anheuser-Busch InBev SA/NV 3.700% 02-Apr-2040 499,000 518,374Goldman Sachs Group Inc/The 3.375% 27-Mar-2025 493,000 503,390ING Bank NV FRN 3.625% 25-Feb-2026 500,000 503,125Engie SA ‘EMTN’ 0.500% 13-Mar-2022 500,000 501,250Credit Agricole SA ‘EMTN’ FRN 1.625% 05-Jun-2030 500,000 499,975Siemens Financieringsmaatschappij NV ‘EMTN’ 0.250% 20-Feb-2029 500,000 499,200Credit Suisse Group AG ‘EMTN’ FRN 0.650% 14-Jan-2028 500,000 498,705CaixaBank SA ‘EMTN’ 0.375% 03-Feb-2025 500,000 498,530BMW Finance NV ‘EMTN’ 0.000% 14-Apr-2023 473,000 472,877Intesa Sanpaolo Vita SpA FRN (Perpetual) 4.750% 17-Dec-2168 400,000 454,950
Major Purchases NominalCost EUR Major Sales Nominal
Proceeds EUR
Insight Global Funds II plc - Insight Emerging Markets Debt Fund 119,280 1,990,054UniCredit SpA FRN 2.731% 15-Jan-2032 1,112,000 1,113,390Repsol International Finance BV FRN (Perpetual) 3.875% 25-Mar-2169 950,000 989,235JPMorgan Chase & Co ‘EMTN’ FRN 1.090% 11-Mar-2027 960,000 944,835BNY Mellon Global Short-Dated High Yield Bond Fund 899,134 908,968UniCredit SpA ‘EMTN’ FRN 2.000% 23-Sep-2029 912,000 906,063Cooperatieve Rabobank UA ‘GMTN’ 0.750% 29-Aug-2023 800,000 820,128Belfius Bank SA 0.375% 13-Feb-2026 800,000 795,400Aviva Plc ‘EMTN’ FRN 6.125% 05-Jul-2043 600,000 705,132VIVAT NV 2.375% 17-May-2024 630,000 656,132Repsol International Finance BV FRN 4.500% 25-Mar-2075 637,000 644,963International Business Machines Corp 1.950% 15-May-2030 700,000 630,554Criteria Caixa SA ‘EMTN’ 1.375% 10-Apr-2024 600,000 620,052Bayer Capital Corp BV 0.625% 15-Dec-2022 600,000 610,836Raytheon Technologies Corp 1.125% 15-Dec-2021 589,000 600,309ArcelorMittal SA 6.250% 25-Feb-2022 620,000 598,071JPMorgan Chase & Co ‘EMTN’ FRN 0.389% 24-Feb-2028 589,000 570,822Intesa Sanpaolo SpA ‘EMTN’ 4.000% 30-Oct-2023 489,000 556,991Anheuser-Busch InBev SA/NV ‘EMTN’ 2.875% 25-Sep-2024 500,000 546,400Volkswagen Financial Services AG ‘EMTN’ 0.250% 16-Oct-2020 530,000 529,332
03613-1D.indd 445 19/08/2020 19:02

446
BNY MelloN GloBal FuNds, plc
SIGNIFICANT PORTFOLIO MOVEMENTS
BNY Mellon Global Credit Fund for the financial period ended 30 June 2020
Insight Liquidity Funds Plc - ILF USD Liquidity Fund 233,126,373 233,126,373Bundesobligation (Zero Coupon) 0.000% 11-Apr-2025 25,377,777 29,482,750United States Treasury Bill (Zero Coupon) 0.000% 10-Sep-2020 27,710,000 27,703,538United States Treasury Note/Bond 0.125% 30-Jun-2022 26,782,400 26,752,061United States Treasury Note/Bond 0.375% 30-Apr-2025 24,203,600 24,272,050AT&T Inc 2.750% 01-Jun-2031 14,770,000 14,746,220United States Treasury Note/Bond 1.125% 15-May-2040 13,720,900 13,584,025United States Treasury Note/Bond 0.250% 31-May-2025 11,425,700 11,301,178JPMorgan Chase & Co FRN 2.522% 22-Apr-2031 10,919,000 10,919,000Bank of Montreal ‘EMTN’ FRN 0.105% 14-Mar-2022 8,000,000 8,830,764Societe Generale SA ‘EMTN’ FRN 0.057% 06-Mar-2023 7,900,000 8,774,489PPL Capital Funding Inc 4.125% 15-Apr-2030 8,641,000 8,638,062Citigroup Inc ‘EMTN’ FRN 0.111% 21-Mar-2023 7,500,000 8,172,677BPCE SA ‘MTN’ FRN 1.243% 31-May-2022 7,900,000 7,992,272BP Capital Markets Plc 2.822% 07-Apr-2032 6,649,000 7,214,501National Australia Bank Ltd ‘REGS’ FRN 2.251% 13-Dec-2022 7,000,000 7,000,000Anheuser-Busch InBev SA/NV 3.700% 02-Apr-2040 5,604,000 6,644,326Intesa Sanpaolo SpA ‘EMTN’ 1.750% 20-Mar-2028 5,300,000 6,157,548Barclays Plc FRN 2.558% 10-Aug-2021 6,000,000 6,153,682United States Treasury Bill (Zero Coupon) 0.000% 03-Sep-2020 6,100,000 6,098,667
Major Purchases NominalCost USD Major Sales Nominal
Proceeds USD
Insight Liquidity Funds Plc - ILF USD Liquidity Fund 220,902,931 220,902,931United States Treasury Note/Bond 1.559% 30-Apr-2020 15,900,000 15,898,685Bank of Montreal ‘EMTN’ FRN 0.011% 14-Mar-2022 10,308,000 11,165,981Societe Generale SA ‘EMTN’ FRN 0.462% 01-Apr-2022 7,900,000 8,880,303BP Capital Markets Plc 2.822% 07-Apr-2032 6,649,000 8,801,057Bank of America Corp ‘EMTN’ FRN 0.400% 07-Feb-2022 8,042,000 8,621,180BNP Paribas SA ‘EMTN’ FRN 0.457% 22-Sep-2022 8,000,000 8,461,979Societe Generale SA ‘EMTN’ FRN 06-Mar-2023 7,900,000 8,422,531Credit Agricole SA/London ‘EMTN’ FRN 0.407% 20-Apr-2022 7,800,000 8,318,469BPCE SA ‘MTN’ FRN 1.243% 31-May-2022 8,200,000 8,305,370Wells Fargo Bank NA ‘BKNT’ FRN 1.659% 09-Sep-2022 8,500,000 8,252,395Goldman Sachs Group Inc/The ‘EMTN’ FRN 0.161% 09-Sep-2022 7,054,000 7,587,335National Australia Bank Ltd ‘REGS’ FRN 1.182% 13-Dec-2022 7,000,000 6,775,650Intesa Sanpaolo SpA ‘EMTN’ 1.750% 20-Mar-2028 5,300,000 6,173,471Commonwealth Bank of Australia ‘144A’ FRN 2.590% 10-Mar-2022 6,096,000 6,156,899Schlumberger Holdings Corp ‘144A’ 4.300% 01-May-2029 5,520,000 6,124,661European Investment Bank ‘EMTN’ 1.750% 15-Sep-2045 4,137,000 6,059,783Imperial Brands Finance Plc ‘144A’ 3.500% 26-Jul-2026 5,692,000 6,052,133HSBC Holdings Plc FRN 2.256% 13-Nov-2026 4,395,000 5,857,428Walmart Inc 3.950% 28-Jun-2038 4,850,000 5,825,529
BNY Mellon Global Dynamic Bond Fund for the financial period ended 30 June 2020
United States Treasury Note/Bond 0.500% 15-Mar-2023 15,170,000 15,146,679United States Treasury Note/Bond 1.500% 15-Feb-2030 12,850,000 13,860,325Japan Government Two Year Bond 0.100% 01-Apr-2022 1,170,000,000 10,990,178United States Treasury Note/Bond 2.375% 15-May-2029 9,120,000 10,061,858United Kingdom Gilt Inflation Linked 0.125% 22-Mar-2026 6,493,434 9,867,485United States Treasury Note/Bond 1.500% 15-Aug-2026 8,700,000 9,118,702iShares J.P. Morgan USD EM Bond UCITS ETF - ETF 67,508 7,697,714Italy Buoni Poliennali Del Tesoro ‘144A’ 1.850% 01-Jul-2025 6,280,000 6,909,701United States Treasury Note/Bond 1.125% 28-Feb-2022 6,530,000 6,609,329United States Treasury Note/Bond 3.000% 15-Nov-2045 4,900,000 5,813,691SPDR Bloomberg Barclays Emerging Markets Local Bond UCITS ETF - ETF 77,957 5,616,272iShares USD Short Duration Corp Bond UCITS ETF 52,306 5,416,362Treasury Corp of Victoria 1.000% 20-Nov-2023 8,010,000 5,372,847Canada Housing Trust No 1 ‘144A’ 2.350% 15-Sep-2023 7,100,000 5,359,847Canada Housing Trust No 1 ‘144A’ 2.100% 15-Sep-2029 5,980,000 4,690,240New South Wales Treasury Corp 3.000% 20-Mar-2028 5,950,000 4,599,009Italy Buoni Poliennali Del Tesoro 6.500% 01-Nov-2027 2,900,000 4,486,785Mexican Bonos 8.500% 31-May-2029 73,180,000 4,465,665Ireland Government Bond 1.100% 15-May-2029 3,390,000 4,347,063Colombia Government International Bond ‘REGS’ 6.000% 28-Apr-2028 14,336,100,000 4,304,277Singapore Government Bond 2.250% 01-Jun-2021 5,870,000 4,268,554United States Treasury Note/Bond 2.875% 15-May-2043 3,200,000 4,254,842Kreditanstalt fuer Wiederaufbau 1.500% 15-Jun-2021 4,020,000 4,065,393United States Treasury FRN 1.665% 31-Jan-2022 4,050,000 4,049,610iShares USD Corp Bond UCITS ETF 29,701 3,724,666Dexia Credit Local SA 0.500% 22-Jul-2023 3,000,000 3,690,564International Bank for Reconstruction & Development FRN 0.471% 17-Jun-2024 3,680,000 3,680,000Czech Republic Government Bond 1.250% 14-Feb-2025 87,750,000 3,605,276Qatar Government International Bond ‘REGS’ 3.400% 16-Apr-2025 3,291,000 3,408,350United States Treasury Note/Bond 2.000% 15-Feb-2050 3,050,000 3,350,125Spain Government Bond ‘144A’ 5.150% 31-Oct-2028 2,180,000 3,340,716United States Treasury Inflation Indexed Bonds 0.750% 15-Jul-2028 2,993,779 3,145,282
Major Purchases NominalCost USD Major Sales and Maturities Nominal
Proceeds USD
United States Treasury Note/Bond 1.125% 30-Sep-2021 34,850,000 34,842,950Japan Government Two Year Bond 0.100% 01-Jun-2021 3,673,000,000 33,944,950United Kingdom Gilt Inflation Linked 0.750% 15-Jul-2028 20,257,136 22,030,891United States Treasury Note/Bond 1.500% 15-Aug-2026 17,460,000 18,263,974SPDR Bloomberg Barclays Emerging Markets Local Bond UCITS ETF - ETF 214,978 14,411,612Italy Buoni Poliennali Del Tesoro 4.500% 01-Mar-2024 10,880,000 13,387,556iShares USD High Yield Corp Bond UCITS ETF 118,601 12,262,182iShares EUR High Yield Corp Bond UCITS ETF - ETF 104,475 11,992,432United States Treasury FRN 1.641% 31-Jan-2021 10,120,000 10,121,702United States Treasury Note/Bond 2.375% 15-May-2029 9,120,000 10,078,651Hungary Government Bond 2.500% 24-Oct-2024 2,909,720,000 9,403,461United Kingdom Gilt Inflation Linked 0.125% 22-Mar-2026 6,493,434 9,379,533iShares J.P. Morgan USD EM Bond UCITS ETF - ETF 67,508 7,778,312Vietnam Government International Bond ‘REGS’ 6.750% 29-Jan-2020 7,470,000 7,470,000Canada Housing Trust No 1 ‘144A’ 1.250% 15-Jun-2021 9,750,000 7,328,693United States Treasury Inflation Indexed Bonds 0.500% 15-Apr-2024 6,668,285 6,836,724United States Treasury Note/Bond 1.125% 28-Feb-2022 6,530,000 6,639,345Australia Government Bond 5.750% 15-May-2021 10,370,000 6,586,846Canada Housing Trust No 1 ‘144A’ 2.650% 15-Mar-2028 8,000,000 6,453,740United States Treasury Note/Bond 3.000% 15-Nov-2045 4,900,000 6,216,980New Zealand Local Government Funding Agency Bond 4.500% 15-Apr-2027 8,285,000 6,210,449United States Treasury Note/Bond 0.500% 15-Mar-2023 5,900,000 5,938,719Australia Government Bond 3.000% 21-Mar-2047 6,785,000 5,626,607iShares USD Short Duration Corp Bond UCITS ETF 52,306 5,391,818Inter-American Development Bank ‘GMTN’ 3.875% 28-Oct-2041 3,443,000 4,735,335New South Wales Treasury Corp 3.000% 20-Mar-2028 5,950,000 4,558,189Italy Buoni Poliennali Del Tesoro 6.500% 01-Nov-2027 2,900,000 4,357,692
03613-1D.indd 446 19/08/2020 19:02

447
BNY MelloN GloBal FuNds, plc
SIGNIFICANT PORTFOLIO MOVEMENTS
BNY Mellon Global Emerging Markets Fund for the financial period ended 30 June 2020
Asian Paints Ltd 31,559 759,186Iljin Materials Co Ltd 17,894 681,252Meituan Dianping 48,228 629,647New Oriental Education & Technology Group Inc ADR 4,029 519,906Prosus NV 6,884 483,738Alibaba Group Holding Ltd ADR 1,872 403,944Samsung SDI Co Ltd 1,422 386,530Ping An Insurance Group Co of China Ltd ‘H’ 30,500 337,187EPAM Systems Inc 1,623 308,388Globant SA 2,809 300,660Housing Development Finance Corp Ltd 10,774 289,342AIA Group Ltd 26,600 281,473Taiwan Semiconductor Manufacturing Co Ltd 26,000 279,851HeadHunter Group Plc ADR 11,529 254,341Vale Indonesia Tbk PT 1,267,976 249,067Elite Material Co Ltd 61,000 243,184Tencent Music Entertainment Group ADR 18,421 236,930Kasikornbank PCL (Foreign Market) 54,000 218,811Info Edge India Ltd 6,104 209,500Titan Co Ltd 12,820 206,994Tencent Holdings Ltd 3,530 186,812Jubilant Foodworks Ltd 7,822 185,885Maruti Suzuki India Ltd 2,393 184,874Livent Corp 24,257 170,198IDP Education Ltd 12,198 157,525Laureate Education Inc - Class A 10,243 151,219ASML Holding NV 454 141,155GSX Techedu Inc ADR 2,823 118,008MercadoLibre Inc 169 114,786Discovery Ltd 21,715 114,511Autohome Inc ADR 1,248 103,169
Major Purchases NominalCost USD Major Sales Nominal
Proceeds USD
Samsung SDI Co Ltd 5,319 1,388,104Samsung Electronics Co Ltd 14,452 693,041New Oriental Education & Technology Group Inc ADR 5,109 640,507Naspers Ltd 3,835 630,701Alibaba Group Holding Ltd ADR 3,075 622,336Godrej Consumer Products Ltd 70,718 563,619Globant SA 4,126 535,668Taiwan Semiconductor Manufacturing Co Ltd 46,000 476,456Applied Materials Inc 9,777 436,282Maruti Suzuki India Ltd 4,884 399,470AIA Group Ltd 37,800 368,404Autohome Inc ADR 4,581 355,222CVC Brasil Operadora e Agencia de Viagens SA 38,100 321,551Tencent Holdings Ltd 6,105 311,672Housing Development Finance Corp Ltd 10,003 298,529Hindustan Unilever Ltd 10,083 294,116British American Tobacco Plc 6,387 282,069GSX Techedu Inc ADR 8,057 280,790Delivery Hero SE ‘144A’ 3,113 256,505Unilever NV 4,027 226,461LG Household & Health Care Ltd 205 212,791Iljin Materials Co Ltd 5,070 196,895Titan Co Ltd 12,023 194,208Discovery Ltd 31,093 191,398Edelweiss Financial Services Ltd 136,820 179,99951job Inc ADR 2,432 179,018Info Edge India Ltd 4,590 168,227Clicks Group Ltd 11,147 166,945Meituan Dianping 12,099 157,937EPAM Systems Inc 684 157,493China Harmony New Energy Auto Holding Ltd 324,000 148,796Prosus NV 1,955 147,840Apollo Hospitals Enterprise Ltd 6,570 137,963Jubilant Foodworks Ltd 5,947 137,737
BNY Mellon Global Equity Fund for the financial period ended 30 June 2020
Alibaba Group Holding Ltd ADR 34,479 7,028,996Lennar Corp 78,653 4,864,806Ping An Insurance Group Co of China Ltd ‘H’ 374,000 4,502,608Citigroup Inc 78,278 4,094,712Goldman Sachs Group Inc/The 17,548 3,671,224Taiwan Semiconductor Manufacturing Co Ltd ADR 69,248 3,553,092Kasikornbank PCL (Foreign Market) 830,300 3,465,569Continental AG 27,304 2,761,253Deutsche Post AG 91,152 2,725,214Applied Materials Inc 45,213 2,488,745Mastercard Inc 7,680 2,071,502Amazon.com Inc 769 1,827,931Lonza Group AG 3,761 1,545,410Cisco Systems Inc 31,603 1,413,519Suzuki Motor Corp 37,300 1,300,296Apple Inc 4,053 1,213,702Alphabet Inc - Class A 758 1,004,010Informa Plc 175,861 982,129Abbott Laboratories 10,339 939,927General Electric Co 127,581 939,366AIA Group Ltd 97,800 937,162SAP SE 6,758 861,570Roche Holding AG 2,489 843,481Relx Plc 35,382 828,724Accenture Plc - Class A 3,889 733,961Novartis AG 8,090 718,509Dollar General Corp 4,049 717,353
Major Purchases NominalCost USD Major Sales Nominal
Proceeds USD
Wolters Kluwer NV 99,957 6,449,154Alphabet Inc - Class A 4,400 5,434,472Microsoft Corp 23,764 4,365,986Ferguson Plc 45,143 3,051,205Intact Financial Corp 28,021 2,995,285Gilead Sciences Inc 32,291 2,304,590Walgreens Boots Alliance Inc 42,653 2,143,945AIA Group Ltd 231,000 2,106,223Seven & i Holdings Co Ltd 55,900 2,034,499L'Oreal SA 6,762 1,876,484Amazon.com Inc 814 1,876,224Novartis AG 20,636 1,753,473DNB ASA 120,126 1,724,725Roche Holding AG 4,983 1,714,763Deutsche Wohnen SE 44,696 1,407,703Apple Inc 4,173 1,239,878ConocoPhillips 25,440 1,215,566Lennar Corp 23,195 1,214,790Alcon Inc 18,140 1,131,587Dollar General Corp 6,045 1,058,840Relx Plc 45,003 1,042,161Japan Tobacco Inc 50,500 1,019,494Goldman Sachs Group Inc/The 3,999 964,098Costco Wholesale Corp 3,152 952,553Citigroup Inc 19,003 940,683Merck & Co Inc 11,311 894,495AIB Group Plc 298,856 742,495
03613-1D.indd 447 19/08/2020 19:02

448
BNY MelloN GloBal FuNds, plc
SIGNIFICANT PORTFOLIO MOVEMENTS
BNY Mellon Global Equity Income Fund for the financial period ended 30 June 2020
KDDI Corp 1,141,700 34,469,182Ping An Insurance Group Co of China Ltd ‘H’ 1,581,500 16,755,839Continental AG 139,412 13,372,443Citigroup Inc 188,130 9,700,700Merck & Co Inc 121,138 9,451,933Informa Plc 1,640,053 8,886,119Unilever Plc 154,484 8,703,813Principal Financial Group Inc 239,928 8,627,955Emerson Electric Co 155,351 8,556,620Zurich Insurance Group AG 24,116 7,285,074Cisco Systems Inc 147,546 5,858,253Novartis AG 54,622 4,921,989Ferguson Plc 56,998 4,295,890Industria de Diseno Textil SA 136,830 4,069,217QUALCOMM Inc 24,629 2,010,934PepsiCo Inc 10,294 1,474,491Maxim Integrated Products Inc 22,203 1,295,018Bayer AG 16,080 1,217,742Samsung Electronics Co Ltd - Preference 30,432 1,196,194Infosys Ltd ADR 101,817 1,131,525
Major Purchases NominalCost USD Major Sales Nominal
Proceeds USD
QUALCOMM Inc 498,063 40,889,505Gilead Sciences Inc 383,572 29,476,947Western Union Co/The 1,077,471 23,770,550Cisco Systems Inc 530,523 22,515,093Orkla ASA 2,285,772 20,360,973Harley-Davidson Inc 801,795 19,137,538Coty Inc 3,788,051 18,032,363PepsiCo Inc 122,651 16,011,403Maxim Integrated Products Inc 264,569 14,402,861Vodafone Group Plc 7,550,652 13,049,385Samsung Electronics Co Ltd - Preference 362,621 12,958,606Bayer AG 191,608 12,703,917Sanofi 133,433 12,556,757Eversource Energy 142,522 12,188,785Roche Holding AG 35,952 12,036,679Unilever Plc 229,268 11,842,171Zurich Insurance Group AG 34,520 11,601,196CMS Energy Corp 188,552 11,446,325Novartis AG 132,428 11,417,201British American Tobacco Plc 295,612 11,056,803Infosys Ltd ADR 1,213,231 10,941,246Merck & Co Inc 136,590 10,827,549BAE Systems Plc 1,548,697 10,284,246Procter & Gamble Co/The 86,881 10,054,936Cie Financiere Richemont SA 152,657 9,128,803Nestle SA 85,320 9,096,781Svenska Handelsbanken AB 1,001,156 8,891,752Industria de Diseno Textil SA 323,126 8,839,766Omnicom Group Inc 152,372 8,718,141Macquarie Korea Infrastructure Fund 886,062 8,460,548Informa Plc 1,316,797 8,412,743Principal Financial Group Inc 206,680 8,403,744Television Francaise 1 1,522,801 8,219,354Hennes & Mauritz AB 543,212 7,865,460KDDI Corp 256,300 7,528,548Paychex Inc 102,980 7,162,096Link REIT (Units) (REIT) 673,500 5,952,217TOTAL SA 142,078 5,455,143Royal Dutch Shell Plc 284,461 5,374,703
03613-1D.indd 448 19/08/2020 19:02

449
BNY MelloN GloBal FuNds, plc
SIGNIFICANT PORTFOLIO MOVEMENTS
BNY Mellon Global High Yield Bond for the financial period ended 30 June 2020
BNY Mellon Global Infrastructure Income Fund for the financial period ended 30 June 2020
iShares USD High Yield Corp Bond UCITS ETF - ETF 29,400 3,055,836Tenet Healthcare Corp ‘144A’ 6.250% 01-Feb-2027 850,000 873,900TEGNA Inc ‘144A’ 5.000% 15-Sep-2029 705,000 692,288INEOS Styrolution Group GmbH ‘REGS’ 2.250% 16-Jan-2027 610,000 675,819Kraft Heinz Foods Co 5.200% 15-Jul-2045 590,000 638,938Lions Gate Capital Holdings LLC ‘144A’ 6.375% 01-Feb-2024 675,000 635,625Colt Merger Sub Inc ‘144A’ 6.250% 01-Jul-2025 630,000 630,000Covanta Holding Corp 6.000% 01-Jan-2027 595,000 607,788Pinewood Finance Co Ltd ‘REGS’ 3.250% 30-Sep-2025 490,000 597,780Banijay Group SAS ‘REGS’ 6.500% 01-Mar-2026 560,000 593,236Synlab Bondco Plc ‘REGS’ FRN 4.750% 01-Jul-2025 545,000 584,630Grand Harbour CLO 2019-1 DAC ‘2019-1X D' FRN 4.100% 15-Mar-2032 500,000 564,950Centrica Plc FRN 5.250% 10-Apr-2075 451,000 558,232Carlyle Euro CLO 2019-1 DAC ‘2019-1X D' FRN 6.120% 15-Mar-2032 500,000 555,185ARD Finance SA ‘REGS’ 5.000% 30-Jun-2027 490,000 552,161Griffon Corp 5.750% 01-Mar-2028 555,000 547,000Arconic Corp ‘144A’ 6.125% 15-Feb-2028 550,000 530,500Clarios Global LP ‘144A’ 6.750% 15-May-2025 515,000 527,875Verisure Midholding AB ‘REGS’ 5.750% 01-Dec-2023 460,000 513,334Polaris Intermediate Corp ‘144A’ 8.500% 01-Dec-2022 550,000 512,738
PPL Corp 432,250 11,568,250ONEOK Inc 320,208 11,354,546Aena SME SA ‘144A’ 74,955 10,664,665Enagas SA 415,661 9,996,753Orange SA 800,690 9,888,098Dominion Energy Inc 124,059 9,875,238Enbridge Inc 274,905 8,808,185SSE Plc 485,016 8,685,050Vinci SA 102,729 8,217,912ACS Actividades de Construccion y Servicios SA 318,296 7,864,705Medical Properties Trust Inc (REIT) 383,149 7,110,986Exelon Corp 208,253 7,060,307Endesa SA 302,761 7,013,239Bouygues SA 214,672 6,489,997Italgas SpA 1,136,348 6,326,620Red Electrica Corp SA 367,623 6,209,691Enel SpA 940,643 6,165,238Deutsche Post AG 238,667 6,076,217SFL Corp Ltd 531,115 4,984,219Inter Pipeline Ltd 582,414 4,918,744Atlantia SpA 287,223 4,073,075NextEra Energy Partners LP 96,892 3,783,239Eiffage SA 42,304 3,360,067Public Service Enterprise Group Inc 82,583 3,247,968Proximus SADP 131,922 2,926,609E.ON SE 267,667 2,912,619Jiangsu Expressway Co Ltd ‘H’ 2,190,000 2,601,932Clearway Energy Inc 131,635 2,550,770Engie SA 136,300 2,093,459Omega Healthcare Investors Inc (REIT) 65,831 2,031,020
Major Purchases NominalCost USD Major Sales Nominal
Proceeds USD
Major Purchases NominalCost USD Major Sales Nominal
Proceeds USD
iShares USD High Yield Corp Bond UCITS ETF - ETF 53,455 5,512,693ARD Finance SA ‘REGS’ 5.000% 30-Jun-2027 1,245,000 1,332,688Altice Luxembourg SA ‘REGs’ 8.000% 15-May-2027 860,000 1,066,208eircom Finance DAC 2.625% 15-Feb-2027 905,000 988,055Eagle Holding Co II LLC ‘144A’ 7.625% 15-May-2022 920,000 931,979Sprint Corp 7.875% 15-Sep-2023 800,000 870,625CCO Holdings LLC / CCO Holdings Capital Corp ‘144A’ 5.500% 01-May-2026 690,000 728,439Tempur Sealy International Inc 5.500% 15-Jun-2026 705,000 718,979Brookfield Property REIT Inc / BPR Cumulus LLC / BPR Nimbus LLC / GGSI Sellco LL ‘144A’ 5.750% 15-May-2026 775,000 690,777INEOS Styrolution Group GmbH ‘REGS’ 2.250% 16-Jan-2027 610,000 671,716Fire BC SpA ‘REGS’ FRN 4.750% 30-Sep-2024 755,000 640,439First Quality Finance Co Inc ‘144A’ 5.000% 01-Jul-2025 605,000 631,302Scotts Miracle-Gro Co/The ‘144A’ 4.500% 15-Oct-2029 616,000 626,043LSF10 Wolverine Investments SCA ‘REGS’ 5.000% 15-Mar-2024 540,000 621,546Eldorado Resorts Inc 6.000% 01-Apr-2025 560,000 585,913Centene Corp ‘144A’ 5.375% 01-Jun-2026 550,000 585,563Plantronics Inc ‘144A’ 5.500% 31-May-2023 640,000 583,088Everi Payments Inc ‘144A’ 7.500% 15-Dec-2025 675,000 570,033Ortho-Clinical Diagnostics Inc / Ortho-Clinical Diagnostics SA ‘144A’ 6.625% 15-May-2022 570,000 570,000Connect Finco SARL / Connect US Finco LLC ‘144A’ 6.750% 01-Oct-2026 515,000 546,663
Dominion Energy Inc 108,305 8,883,741Enel SpA 1,026,036 8,077,758Inter Pipeline Ltd 617,768 6,455,518Omega Healthcare Investors Inc (REIT) 208,193 6,163,035NextEra Energy Partners LP 118,617 5,888,308Enagas SA 218,353 5,089,618E.ON SE 468,624 5,002,636Engie SA 354,362 4,977,287SSE Plc 271,443 4,860,328Orange SA 382,141 4,857,316Exelon Corp 108,968 4,413,374PPL Corp 137,788 4,277,677National Grid Plc 314,615 4,178,370Vinci SA 42,556 3,949,716Medical Properties Trust Inc (REIT) 236,637 3,927,291Aena SME SA ‘144A’ 29,171 3,737,965Italgas SpA 621,707 3,660,291Atlantia SpA 203,916 3,598,732Deutsche Post AG 116,190 3,583,442Southern Co/The 50,188 3,499,737Royal Mail Plc 1,297,639 2,934,913Clearway Energy Inc 137,517 2,877,661ACS Actividades de Construccion y Servicios SA 158,490 2,824,285Targa Resources Corp 119,011 2,766,450Endesa SA 112,527 2,401,932ONEOK Inc 45,937 2,198,087Edison International 27,506 2,090,308bpost SA 140,297 1,493,276EnLink Midstream LLC 574,450 1,468,475
03613-1D.indd 449 19/08/2020 19:02

450
BNY MelloN GloBal FuNds, plc
SIGNIFICANT PORTFOLIO MOVEMENTS
BNY Mellon Global Leaders Fund for the financial period ended 30 June 2020
Illumina Inc 6,300 1,574,936Texas Instruments Inc 14,200 1,459,693ASML Holding NV 5,400 1,431,640Edwards Lifesciences Corp 5,600 985,176Cognizant Technology Solutions Corp 6,300 431,797Microsoft Corp 2,500 399,231Automatic Data Processing Inc 2,400 377,517
Major Purchases NominalCost USD Major Sales Nominal
Proceeds USD
Gilead Sciences Inc 34,300 2,466,109Air Liquide SA 14,530 2,062,160CSL Ltd 9,600 1,892,049Johnson & Johnson 15,000 1,867,208Roche Holding AG 5,000 1,748,580Colgate-Palmolive Co 24,100 1,746,759Reckitt Benckiser Group Plc 18,800 1,663,266Novo Nordisk A/S 25,700 1,662,509Starbucks Corp 23,000 1,457,681NIKE Inc 11,100 1,136,053Keyence Corp 2,600 1,083,635Taiwan Semiconductor Manufacturing Co Ltd ADR 16,000 868,719Mastercard Inc 2,800 855,974Alphabet Inc 550 786,703Adobe Inc 1,900 738,520LVMH Moet Hennessy Louis Vuitton SE 1,600 706,209FANUC Corp 3,800 688,390TJX Cos Inc/The 12,000 673,288Schlumberger Ltd 46,000 671,305SAP SE 5,000 668,416L'Oreal SA 2,200 656,363Amphenol Corp - Class A 3,800 399,702Industria de Diseno Textil SA 11,881 362,291AIA Group Ltd 38,600 354,992Intuitive Surgical Inc 600 350,214Cognizant Technology Solutions Corp 5,100 296,850
BNY Mellon Global Multi-Asset Income Fund for the financial period ended 30 June 2020
Mexican Bonos 8.500% 31-May-2029 8,868,200 499,030United States Treasury Inflation Indexed Bonds 0.750% 15-Jul-2028 491,874 485,640Jiangsu Expressway Co Ltd ‘H’ 250,241 290,994Ping An Insurance Group Co of China Ltd ‘H’ 28,000 285,671CSN Islands XI Corp ‘REGS’ 6.750% 28-Jan-2028 226,000 204,503Bayer AG 3,241 200,073Cemex SAB de CV ‘REGS’ 6.125% 05-May-2025 200,000 187,422ING Groep NV FRN (Perpetual) 6.750% 16-Apr-2024 200,000 183,426Continental AG 1,748 168,212UniCredit SpA ‘EMTN’ FRN (Perpetual) 3.875% 03-Jun-2027 200,000 160,500Royal Dutch Shell Plc 5,271 157,688Informa Plc 21,133 124,327Kasikornbank PCL (Foreign Market) 33,300 122,939Summer BC Holdco B SARL ‘REGS’ 5.750% 31-Oct-2026 116,000 122,053B&M European Value Retail SA ‘REGS’ 4.125% 01-Feb-2022 100,000 119,361Samsonite International SA ‘144A’ 49,791 108,340American Airlines Inc ‘144A’ 11.750% 15-Jul-2025 116,000 101,543Anglo American Plc 6,366 100,355Akelius Residential Property AB FRN 2.249% 17-May-2081 100,000 96,775JLEN Environmental Assets Group Ltd 68,251 95,814Imperial Brands Plc 3,973 90,570Citigroup Inc 1,594 74,774Renewables Infrastructure Group Ltd/The 54,763 73,161Star Entertainment Grp Ltd/The 32,777 71,353GCP Infrastructure Investments Ltd 60,000 70,012Trip.com Group Ltd 1.000% 01-Jul-2020 75,000 66,280Gresham House Energy Storage Fund Plc/The Fund 42,184 50,465
Major Purchases NominalCost EUR Major Sales Nominal
Proceeds EUR
United States Treasury Note/Bond 2.000% 15-Feb-2025 558,300 532,257Mexican Bonos 8.000% 07-Nov-2047 6,555,500 372,958Greencoat UK Wind Plc/Funds 104,563 165,805Royal Dutch Shell Plc 5,271 157,688TP ICAP Plc ‘EMTN’ 5.250% 26-Jan-2024 100,000 131,924Mexican Bonos 6.500% 09-Jun-2022 2,464,100 122,195BBGI SICAV SA/Fund 64,081 121,862Hikma Pharmaceuticals Plc 4,285 116,721Virgin Media Receivables Financing Notes I DAC ‘REGS’ 5.500% 15-Sep-2024 101,000 114,735Octopus Renewables Infrastructure Trust Plc 93,631 110,145AIA Group Ltd 13,000 101,646Reynolds Group Issuer Inc / Reynolds Group Issuer LLC / Reynolds Group Issuer Lu 5.750% 15-Oct-2020 110,478 100,230Apple Inc 291 88,408Royal Bank of Canada 1.875% 05-Feb-2020 85,000 77,115United States Treasury Inflation Indexed Bonds 0.750% 15-Jul-2028 80,974 76,804Deutsche Wohnen SE 1,928 70,797Gilead Sciences Inc 960 57,606Samsung SDI Co Ltd 183 50,373Microsoft Corp 313 49,369Sprint Corp 7.125% 15-Jun-2024 53,000 49,146CCR SA 13,341 49,109Applied Materials Inc 886 46,939Post Holdings Inc ‘144A’ 5.500% 01-Mar-2025 49,000 45,887Antero Resources Corp 5.625% 01-Jun-2023 73,000 45,491VPC Specialty Lending Investments Plc/Fund 57,716 45,004Schlumberger Ltd 3,363 40,727Centrica Plc 38,279 38,773United States Treasury Inflation Indexed Bonds 2.375% 15-Jan-2025 38,818 36,241New South Wales Treasury Corp 3.000% 20-Mar-2028 61,400 35,702M&G Plc 11,754 34,021
The above constitutes the full purchases detail for the Fund during the financial period.
03613-1D.indd 450 19/08/2020 19:02

451
BNY MelloN GloBal FuNds, plc
SIGNIFICANT PORTFOLIO MOVEMENTS
BNY Mellon Global Opportunities Fund for the financial period ended 30 June 2020
United States Treasury Bill (Zero Coupon) 0.000% 21-May-2020 1,984,400 1,976,782United States Treasury Bill (Zero Coupon) 0.000% 17-Sep-2020 1,275,000 1,274,442Continental AG 10,012 1,025,501Lennar Corp 13,850 858,508Alibaba Group Holding Ltd ADR 4,388 841,708Kasikornbank PCL (Foreign Market) 155,000 666,586Ping An Insurance Group Co of China Ltd ‘H’ 40,000 408,048Mastercard Inc 1,531 396,306Vivendi SA 13,056 288,881Unilever NV 5,351 276,731Diageo Plc 7,409 269,501Citigroup Inc 4,715 250,061Cisco Systems Inc 5,510 234,690Medtronic Plc 1,930 193,823Microsoft Corp 1,107 185,155Informa Plc 28,574 180,908Bayer AG 2,625 180,754Alphabet Inc - Class A 124 166,675Rolls-Royce Holdings Plc 22,008 153,672AIA Group Ltd 15,600 152,447Accenture Plc - Class A 772 150,272SAP SE 1,215 148,945Novartis AG 1,657 146,252Apple Inc 494 145,829Goldman Sachs Group Inc/The 677 144,125
Major Purchases NominalCost USD Major Sales and Maturities Nominal
Proceeds USD
United States Treasury Bill (Zero Coupon) 0.000% 21-May-2020 1,984,400 1,983,116Gilead Sciences Inc 18,549 1,391,784United States Treasury Bill (Zero Coupon) 0.000% 23-Jan-2020 1,028,900 1,028,900Microsoft Corp 5,723 933,387United States Treasury Bill (Zero Coupon) 0.000% 12-Mar-2020 794,500 794,302Apple Inc 2,730 777,762Lennar Corp 13,850 714,529Alphabet Inc - Class A 547 667,900DNB ASA 51,041 612,880Goldman Sachs Group Inc/The 2,608 535,460Accenture Plc - Class A 2,841 522,114Novartis AG 6,049 516,579Roche Holding AG 1,522 503,979Intact Financial Corp 5,030 499,098Brenntag AG 10,721 478,787Samsung SDI Co Ltd 1,996 478,199Medtronic Plc 4,297 410,731Cisco Systems Inc 9,865 401,831Eversource Energy 4,586 392,794AIA Group Ltd 43,400 388,986Applied Materials Inc 7,431 388,340Japan Tobacco Inc 21,000 386,591Relx Plc 17,696 385,803Mastercard Inc 1,446 380,907Ferguson Plc 5,356 364,522SAP SE 3,089 358,225Diageo Plc 10,552 345,206Rolls-Royce Holdings Plc 78,616 340,510Vivendi SA 14,865 326,543Bayer AG 5,117 322,731Wolters Kluwer NV 4,594 322,598Unilever NV 5,903 290,742Costco Wholesale Corp 983 290,421Suzuki Motor Corp 9,200 268,375Altria Group Inc 6,842 264,556Royal Dutch Shell Plc 15,274 264,197Citigroup Inc 5,522 259,527Associated British Foods Plc 11,023 259,228Valeo SA 10,691 248,847Lonza Group AG 576 240,797
03613-1D.indd 451 19/08/2020 19:02

452
BNY MelloN GloBal FuNds, plc
SIGNIFICANT PORTFOLIO MOVEMENTS
BNY Mellon Global Real Return Fund (EUR) for the financial period ended 30 June 2020
BNY Mellon Global Real Return Fund (GBP) for the financial period ended 30 June 2020
United States Treasury Note/Bond 1.750% 31-Dec-2026 171,305,600 155,529,248iShares Physical Gold ETC 5,437,648 148,334,286Amundi Physical Gold ETC 2,265,286 134,565,435iShares USD Corp Bond UCITS ETF - ETF 997,862 114,842,452iShares JP Morgan EM Local Government Bond UCITS ETF - ETF 1,774,151 96,981,512Invesco Physical Gold ETC 631,371 91,189,844Hellenic Republic Treasury Bill (Zero Coupon) 0.000% 28-Aug-2020 70,000,000 70,017,500Hellenic Republic Treasury Bill (Zero Coupon) 0.000% 28-Feb-2020 70,000,000 70,003,208Hellenic Republic Treasury Bill (Zero Coupon) 0.000% 14-Apr-2020 60,000,000 60,013,200Hellenic Republic Treasury Bill (Zero Coupon) 0.000% 08-May-2020 59,000,000 59,015,340Banco Bilbao Vizcaya Argentaria SA FRN (Perpetual) 6.750% 29-Dec-2049 36,000,000 36,231,114Xtrackers Physical Gold ETC 187,387 28,214,620Diageo Plc 822,556 26,281,464Australia Government Bond 3.250% 21-Jun-2039 29,576,000 23,808,826Alibaba Group Holding Ltd ADR 102,411 19,521,619Lennar Corp 306,069 17,408,262Hungary Government Bond 5.500% 24-Jun-2025 4,796,190,000 17,243,475Apple Inc 57,800 16,713,521Hellenic Republic Treasury Bill (Zero Coupon) 0.000% 07-Aug-2020 15,000,000 14,999,104ING Groep NV FRN (Perpetual) 4.875% 16-May-2029 15,841,000 14,641,155
United Kingdom Gilt 2.000% 22-Jul-2020 11,950,000 12,021,920United Kingdom Gilt 4.750% 07-Mar-2020 4,600,000 4,625,904United States Treasury Note/Bond 1.750% 31-Dec-2026 4,570,900 3,518,529Amundi Physical Gold ETC 59,951 3,187,554iShares Physical Gold ETC 130,301 3,042,422iShares USD Corp Bond UCITS ETF - ETF 24,201 2,429,949iShares JP Morgan EM Local Government Bond UCITS ETF - ETF 51,853 2,400,542Invesco Physical Gold ETC 18,286 2,222,571United Kingdom Gilt 3.750% 07-Sep-2020 2,000,000 2,018,360Australia Government Bond 3.250% 21-Jun-2039 925,000 625,598Xtrackers Physical Gold ETC 4,699 617,699Diageo Plc 17,404 506,033WisdomTree Physical Swiss Gold ETC 3,793 498,172Alibaba Group Holding Ltd ADR 2,511 411,511Lennar Corp 8,043 390,675ING Groep NV FRN (Perpetual) 4.875% 16-May-2029 500,000 387,477Hungary Government Bond 5.500% 24-Jun-2025 127,990,000 381,978Apple Inc 1,400 375,143Anglo American Plc 21,291 340,204Alphabet Inc - Class A 308 330,267
Major Purchases NominalCost EUR Major Sales and Maturities Nominal
Proceeds EUR
Major Purchases NominalCost GBP Major Sales and Maturities Nominal
Proceeds GBP
Invesco Physical Gold ETC 1,458,754 202,652,324United States Treasury Note/Bond 2.375% 15-May-2029 177,418,300 179,237,079United States Treasury Note/Bond 1.750% 31-Dec-2026 171,305,600 164,693,264iShares JP Morgan EM Local Government Bond UCITS ETF - ETF 2,991,331 141,592,836Spain Government Bond ‘144A’ 0.250% 30-Jul-2024 100,963,000 102,862,006Hellenic Republic Treasury Bill (Zero Coupon) 0.000% 07-Feb-2020 89,674,000 89,674,000Portugal Obrigacoes do Tesouro OT ‘144A’ 5.650% 15-Feb-2024 70,055,493 86,514,002Hellenic Republic Treasury Bill (Zero Coupon) 0.000% 28-Feb-2020 70,000,000 70,000,000iShares J.P. Morgan USD EM Bond EUR Hedged UCITS ETF Dist - ETF 710,243 67,572,625Hellenic Republic Treasury Bill (Zero Coupon) 0.000% 14-Apr-2020 60,000,000 60,000,000Hellenic Republic Treasury Bill (Zero Coupon) 0.000% 08-May-2020 59,000,000 59,000,000SPDR Bloomberg Barclays Emerging Markets Local Bond UCITS ETF - ETF 1,012,573 57,795,983Canada Housing Trust No 1 ‘144A’ 0.000% 15-Jun-2027 77,875,000 55,776,111iShares EUR High Yield Corp Bond UCITS ETF - ETF 624,456 55,591,514Hellenic Republic Treasury Bill (Zero Coupon) 0.000% 31-Jan-2020 50,714,000 50,714,000Hungary Government Bond 5.500% 24-Jun-2025 13,617,860,000 46,530,906Brazilian Government International Bond 4.875% 22-Jan-2021 38,760,000 36,040,307Banco Bilbao Vizcaya Argentaria SA FRN (Perpetual) 6.750 29-Dec-2049 36,000,000 36,000,000New Zealand Government Bond 4.500% 15-Apr-2027 37,497,000 26,638,455iShares EUR Corp Bond 1-5yr UCITS ETF - ETF 240,471 26,083,237Xtrackers Physical Gold ETC 168,344 24,989,283Anglo American Plc 1,001,001 24,183,052Australia Government Bond 3.000% 21-Mar-2047 31,896,000 23,540,007
United Kingdom Gilt 4.750% 07-Mar-2020 14,183,385 14,193,838United Kingdom Gilt 2.000% 22-Jul-2020 8,352,300 8,399,577United States Treasury Note/Bond 1.750% 31-Dec-2026 4,570,900 3,997,708Invesco Physical Gold ETC 32,120 3,883,358iShares JP Morgan EM Local Government Bond UCITS ETF - ETF 81,882 3,435,996United States Treasury Note/Bond 3.375% 15-Nov-2048 2,100,800 1,992,514iShares J.P. Morgan USD EM Bond UCITS ETF - ETF 16,299 1,430,504United Kingdom Treasury Bill (Zero Coupon) 0.000% 27-Jan-2020 1,337,521 1,337,521SPDR Bloomberg Barclays Emerging Markets Local Bond UCITS ETF - ETF 25,077 1,273,583Canada Housing Trust No 1 ‘144A’ 2.350% 15-Jun-2027 1,865,000 1,175,466Hungary Government Bond 5.500% 24-Jun-2025 337,720,000 1,028,257iShares Physical Gold ETC 34,308 863,242New Zealand Government Bond 4.500% 15-Apr-2027 1,214,000 750,037Brazilian Government International Bond 4.875% 22-Jan-2021 877,000 689,980iShares EUR High Yield Corp Bond UCITS ETF - ETF 7,320 564,729Xtrackers Physical Gold ETC 4,207 557,680Anglo American Plc 25,700 528,158Cisco Systems Inc 16,378 452,581Australia Government Bond 3.000% 21-Mar-2047 704,000 449,068Australia Government Bond 3.250% 21-Jun-2039 572,000 361,770
03613-1D.indd 452 19/08/2020 19:02

453
BNY MelloN GloBal FuNds, plc
SIGNIFICANT PORTFOLIO MOVEMENTS
BNY Mellon Global Real Return Fund (USD) for the financial period ended 30 June 2020
BNY Mellon Global Short-Dated High Yield Bond Fund for the financial period ended 30 June 2020
United States Treasury Note/Bond 2.500% 31-May-2020 26,800,000 26,883,563United States Treasury Note/Bond 2.250% 31-Mar-2020 21,000,000 21,034,453iShares Physical Gold ETC 512,092 15,587,000United States Treasury Note/Bond 1.750% 31-Dec-2026 14,606,400 14,605,351Amundi Physical Gold ETC 209,767 13,601,309iShares USD Corp Bond UCITS ETF - ETF 93,266 11,709,107iShares JP Morgan EM Local Government Bond UCITS ETF - ETF 153,557 9,263,648Invesco Physical Gold ETC 57,755 9,155,137United States Treasury Note/Bond 2.750% 30-Sep-2020 7,000,000 7,068,813Xtrackers Physical Gold ETC 17,149 2,803,778WisdomTree Physical Swiss Gold ETC 16,058 2,642,167Australia Government Bond 3.250% 21-Jun-2039 2,501,000 2,221,433Diageo Plc 61,833 2,189,303Alibaba Group Holding Ltd ADR 8,665 1,809,176Lennar Corp 25,499 1,619,260Hungary Government Bond 5.500% 24-Jun-2025 404,910,000 1,575,850Apple Inc 5,000 1,575,000Alphabet Inc - Class A 1,041 1,423,251Anglo American Plc 69,723 1,326,407Amazon.com Inc 646 1,275,062
Insight Liquidity Funds Plc - ILF USD Liquidity Fund 299,162,708 299,162,708Altice Luxembourg SA 8.000% 15-May-2027 14,000,000 17,570,084Ypso Finance Bis SA 8.000% 15-May-2027 14,000,000 17,566,242Altice France Holding SA ‘144A’ 8.000% 15-May-2027 14,000,000 17,153,738CITGO Petroleum Corp ‘144A’ 7.000% 15-Jun-2025 14,000,000 14,216,525Altice Financing SA ‘REGS’ 2.250% 15-Jan-2025 10,000,000 11,149,906Cogent Communications Group Inc 4.375% 30-Jun-2024 10,000,000 10,871,376Infor US Inc 5.750% 15-May-2022 10,000,000 10,817,506Nidda Healthcare Holding GmbH ‘REGS’ 3.500% 30-Sep-2024 9,750,000 10,438,688Fire BC SpA ‘REGS’ FRN 4.750% 30-Sep-2024 9,000,000 10,055,132ZF North America Capital Inc 4.000% 29-Apr-2020 10,000,000 9,962,500Bausch Health Americas Inc ‘144A’ 8.500% 31-Jan-2027 8,500,000 9,670,000INEOS Group Holdings SA ‘REGS’ 5.375% 01-Aug-2024 8,626,000 9,650,894Synthomer Plc ‘REGS’ 3.875% 01-Jul-2025 8,222,000 9,341,436APX Group Inc 7.625% 01-Sep-2023 9,000,000 8,852,500Parts Europe SA ‘REGS’ 4.375% 01-May-2022 8,000,000 8,735,840Marathon Petroleum Corp 4.500% 01-May-2023 8,699,000 8,693,868Explorer II AS 3.375% 24-Feb-2025 7,400,000 8,231,956Summer BidCo BV ‘REGS’ 9.750% 15-Nov-2025 6,816,875 8,154,513Delphi Technologies PLC 5.000% 01-Oct-2025 7,000,000 7,796,250
Major Purchases NominalCost USD Major Sales and Maturities Nominal
Proceeds USD
Major Purchases NominalCost USD Major Sales and Maturities Nominal
Proceeds USD
United States Treasury Note/Bond 2.500% 31-May-2020 26,800,000 26,867,859United States Treasury Bill (Zero Coupon) 0.000% 23-Jan-2020 22,514,800 22,512,974United States Treasury Note/Bond 2.250% 31-Mar-2020 21,000,000 21,012,877Invesco Physical Gold ETC 134,618 20,943,057United States Treasury Note/Bond 1.750% 31-Dec-2026 14,606,400 15,336,718iShares JP Morgan EM Local Government Bond UCITS ETF - ETF 258,239 13,508,533United States Treasury Note/Bond 3.375% 15-Nov-2048 7,127,500 8,778,335iShares J.P. Morgan USD EM Bond UCITS ETF - ETF 56,818 6,501,674SPDR Bloomberg Barclays Emerging Markets Local Bond UCITS ETF - ETF 89,065 5,570,336Canada Housing Trust No 1 ‘144A’ 2.350% 15-Jun-2027 7,005,000 5,505,597Hungary Government Bond 5.500% 24-Jun-2025 1,189,750,000 4,466,471Brazilian Government International Bond 4.875% 22-Jan-2021 3,930,000 4,043,970Xtrackers Physical Gold ETC 15,365 2,552,908iShares EUR High Yield Corp Bond UCITS ETF - ETF 24,963 2,525,988New Zealand Government Bond 4.500% 15-Apr-2027 3,264,000 2,509,773Anglo American Plc 81,795 2,212,333Cisco Systems Inc 52,984 1,838,375Macquarie Korea Infrastructure Fund 173,607 1,650,184CMS Energy Corp 25,560 1,646,512Barrick Gold Corp 63,525 1,415,186
Insight Liquidity Funds Plc - ILF USD Liquidity Fund 321,905,000 321,905,000Altice Luxembourg SA 8.000% 15-May-2027 14,000,000 17,566,242Ypso Finance Bis SA 8.000% 15-May-2027 14,000,000 17,153,738Virgin Media Receivables Financing Notes I DAC 5.500% 15-Sep-2024 12,700,000 16,657,715Aker BP ASA 6.000% 01-Jul-2022 11,801,000 12,149,130TransDigm Inc 6.500% 15-May-2025 13,000,000 11,915,000UPCB Finance IV Ltd 5.375% 15-Jan-2025 11,079,000 11,376,804Infor US Inc 5.750% 15-May-2022 10,000,000 10,984,002Altice Luxembourg SA 7.625% 15-Feb-2025 10,500,000 10,900,365Citgo Holding Inc 9.250% 01-Aug-2024 11,000,000 10,890,000VZ Vendor Financing BV 2.500% 31-Jan-2024 9,000,000 10,114,676ZF North America Capital Inc 4.000% 29-Apr-2020 10,000,000 10,000,000Tullow Oil Plc ‘REGS’ 6.250% 15-Apr-2022 10,055,000 9,060,015Marathon Petroleum Corp 4.500% 01-May-2023 8,699,000 8,998,111EVOCA SpA ‘REGS’ FRN 01-Nov-2026 10,000,000 8,428,138Altice France SA/France 5.875% 01-Feb-2027 7,000,000 8,324,855UPC Holding BV 5.500% 15-Jan-2028 8,300,000 8,149,875Evraz PLC 8.250% 28-Jan-2021 7,698,000 8,118,832CITGO Petroleum Corp ‘144A’ 6.250% 15-Aug-2022 8,000,000 8,010,000DNO ASA 8.750% 18-Jun-2020 8,000,000 8,000,000
03613-1D.indd 453 19/08/2020 19:02

454
BNY MelloN GloBal FuNds, plc
SIGNIFICANT PORTFOLIO MOVEMENTS
BNY Mellon Global Unconstrained Fund for the financial period ended 30 June 2020
United States Treasury Inflation Indexed Bonds 3.375% 15-Apr-2032 288,348 397,168United States Treasury Note/Bond 2.375% 15-May-2029 332,000 378,986United States Treasury Inflation Indexed Bonds 0.500% 15-Apr-2024 378,622 378,886Alibaba Group Holding Ltd ADR 1,575 315,058United States Treasury Note/Bond 1.500% 15-Feb-2030 280,000 303,931Royal Dutch Shell Plc 9,202 279,481Amazon.com Inc 126 242,459United States Treasury Inflation Indexed Bonds 0.750% 15-Jul-2028 223,727 242,253Mastercard Inc 825 211,327Vivendi SA 10,040 211,048Goldman Sachs Group Inc/The 1,057 198,286Thales SA 1,771 190,533Ping An Insurance Group Co of China Ltd ‘H’ 15,500 179,692Lennar Corp 2,860 179,067Laureate Education Inc - Class A 11,957 173,992Fresenius Medical Care AG & Co KGaA 2,036 161,581Continental AG 1,678 161,408Bureau Veritas SA 6,586 147,749Alphabet Inc - Class A 98 136,043Kasikornbank PCL (Foreign Market) 28,700 131,007Toll Brothers Inc 3,217 123,599Apple Inc 423 122,118Medtronic Plc 1,357 118,801SKYCITY Entertainment Group Ltd 67,133 112,104Microsoft Corp 670 110,883United States Treasury Note/Bond 1.500% 15-Aug-2026 100,000 106,406iShares USD Short Duration Corp Bond UCITS ETF - ETF 1,014 104,032iShares USD Corp Bond UCITS ETF - ETF 839 103,985American Airlines Inc ‘144A’ 11.750% 15-Jul-2025 100,000 99,000Brenntag AG 1,904 85,950United States Treasury Note/Bond 2.875% 15-May-2043 60,000 80,763Merck & Co Inc 929 75,230Abbott Laboratories 822 61,854
Major Purchases NominalCost USD Major Sales and Maturities Nominal
Proceeds USD
United States Treasury Note/Bond 3.000% 15-May-2045 890,000 1,114,760United States Treasury Inflation Indexed Bonds 0.125% 15-Apr-2020 867,617 866,438United States Treasury Inflation Indexed Bonds 0.750% 15-Jul-2028 449,257 454,140United States Treasury Inflation Indexed Bonds 2.500% 31-May-2020 450,000 450,000Norway Government Bond ‘144A’ 1.500% 19-Feb-2026 3,270,000 333,276ABB Ltd 12,336 294,542Royal Dutch Shell Plc 9,202 279,481United States Treasury Inflation Indexed Bonds 0.500% 15-Apr-2024 242,783 246,589Suncor Energy Inc 8,318 143,213M&G Plc 44,812 141,323Deutsche Wohnen SE 4,043 130,156Sony Corp 1,800 128,411Gilead Sciences Inc 1,812 126,445Hungary Government Bond 2.500% 24-Oct-2024 34,900,000 111,607Japanese Government CPI Linked Bond 0.100% 10-Mar-2028 11,525,028 111,507Apple Inc 334 105,397Peruvian Government International Bond ‘REGS’ 5.700% 12-Aug-2024 334,000 105,288BAE Systems Plc 16,230 101,738Peruvian Government International Bond ‘REGS’ 6.350% 12-Aug-2028 328,000 100,943Applied Materials Inc 1,424 88,256Mexican Bonos 8.000% 07-Nov-2047 2,000,000 86,134Greencoat UK Wind Plc/Funds 43,263 73,447AIA Group Ltd 7,400 66,610Argentine Republic Government International Bond 6.875% 22-Apr-2021 150,000 63,188Samsung Electronics Co Ltd - Preference 1,837 61,676
BNY Mellon Japan Small Cap Equity Focus Fund for the financial period ended 30 June 2020
m-up Holdings Inc 179,400 495,566,411BrainPad Inc 83,300 485,652,435Takeuchi Manufacturing Co Ltd 217,600 386,825,274Premium Group Co Ltd 110,800 201,166,677Vision Inc/Tokyo Japan 195,100 192,181,674Insource Co Ltd 76,100 168,165,878Resorttrust Inc 113,400 139,989,771Vector Inc 137,700 129,480,041Dowa Holdings Co Ltd 33,200 104,909,051Nifco Inc/Japan 44,400 101,754,120RS Technologies Co Ltd 42,200 99,884,088Sakata INX Corp 84,900 96,024,433Anicom Holdings Inc 21,700 85,328,084Yonex Co Ltd 130,000 82,162,940Atrae Inc 21,800 66,291,296Zenkoku Hosho Co Ltd 14,100 62,432,805Ain Holdings Inc 7,500 51,946,061Arata Corp 8,900 41,951,194Nippon Gas Co Ltd 11,400 41,109,609MCJ Co Ltd 52,200 40,784,377Sanken Electric Co Ltd 13,400 39,443,242Anritsu Corp 16,700 35,264,325Wacom Co Ltd 84,900 33,626,758
Major Purchases NominalCost JPY Major Sales Nominal
Proceeds JPY
TechMatrix Corp 147,800 464,192,825Nichias Corp 156,400 413,457,031MCJ Co Ltd 487,100 362,161,319Arata Corp 82,100 357,952,322Nippon Gas Co Ltd 99,500 342,921,220Tomy Co Ltd 294,200 252,762,533BayCurrent Consulting Inc 34,200 244,337,797Open Door Inc 193,800 241,781,682Anicom Holdings Inc 59,000 222,300,924Anritsu Corp 105,000 206,983,803Wacom Co Ltd 429,700 178,865,004Zenkoku Hosho Co Ltd 36,500 148,545,860Sanken Electric Co Ltd 52,400 137,528,906Atrae Inc 47,400 123,238,628Totetsu Kogyo Co Ltd 40,700 113,605,035V-Cube Inc 172,000 110,196,294Insource Co Ltd 33,000 108,906,255Ain Holdings Inc 14,600 91,718,326Sakata INX Corp 89,200 81,323,939Yonex Co Ltd 157,000 80,587,715Nifco Inc/Japan 33,000 76,141,488Premium Group Co Ltd 42,700 69,850,008Dowa Holdings Co Ltd 20,900 66,807,389Vector Inc 68,000 62,277,782Resorttrust Inc 34,600 49,374,553
03613-1D.indd 454 19/08/2020 19:02
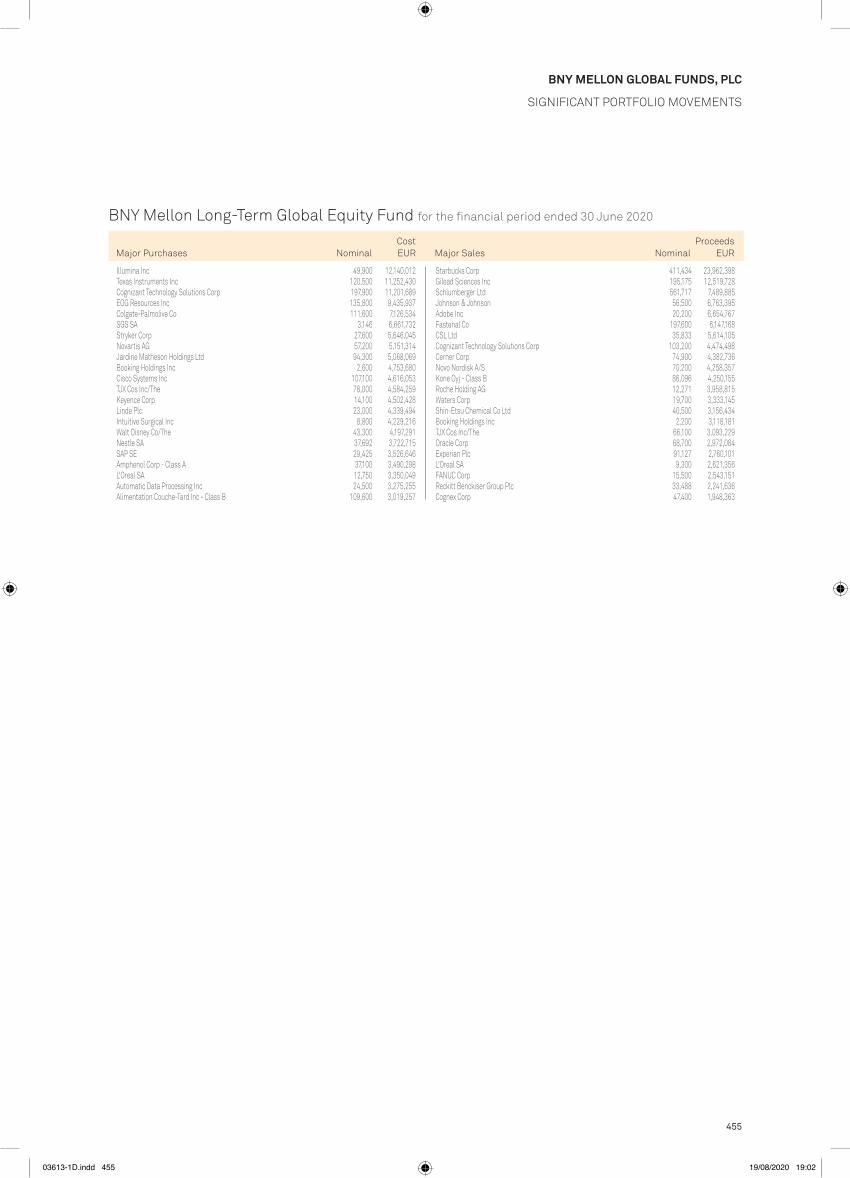
455
BNY MelloN GloBal FuNds, plc
SIGNIFICANT PORTFOLIO MOVEMENTS
BNY Mellon Long-Term Global Equity Fund for the financial period ended 30 June 2020
Illumina Inc 49,900 12,140,012Texas Instruments Inc 120,500 11,252,430Cognizant Technology Solutions Corp 197,900 11,201,689EOG Resources Inc 135,800 9,435,937Colgate-Palmolive Co 111,600 7,126,534SGS SA 3,146 6,661,732Stryker Corp 27,600 5,646,045Novartis AG 57,200 5,151,314Jardine Matheson Holdings Ltd 94,300 5,068,069Booking Holdings Inc 2,600 4,753,680Cisco Systems Inc 107,100 4,616,053TJX Cos Inc/The 78,000 4,584,259Keyence Corp 14,100 4,502,428Linde Plc 23,000 4,339,494Intuitive Surgical Inc 8,800 4,229,216Walt Disney Co/The 43,300 4,197,291Nestle SA 37,692 3,722,715SAP SE 29,425 3,526,646Amphenol Corp - Class A 37,100 3,490,298L'Oreal SA 12,750 3,350,049Automatic Data Processing Inc 24,500 3,275,255Alimentation Couche-Tard Inc - Class B 109,600 3,019,257
Major Purchases NominalCost EUR Major Sales Nominal
Proceeds EUR
Starbucks Corp 411,434 23,962,398Gilead Sciences Inc 195,175 12,519,728Schlumberger Ltd 561,717 7,489,885Johnson & Johnson 56,500 6,763,395Adobe Inc 20,200 6,654,767Fastenal Co 197,600 6,147,168CSL Ltd 35,833 5,614,105Cognizant Technology Solutions Corp 103,200 4,474,498Cerner Corp 74,900 4,382,736Novo Nordisk A/S 70,200 4,258,357Kone Oyj - Class B 86,096 4,250,155Roche Holding AG 12,271 3,958,815Waters Corp 19,700 3,333,145Shin-Etsu Chemical Co Ltd 40,500 3,156,434Booking Holdings Inc 2,200 3,118,181TJX Cos Inc/The 66,100 3,093,229Oracle Corp 68,700 2,972,084Experian Plc 91,127 2,760,101L'Oreal SA 9,300 2,621,356FANUC Corp 15,500 2,543,151Reckitt Benckiser Group Plc 33,488 2,241,636Cognex Corp 47,400 1,948,363
03613-1D.indd 455 19/08/2020 19:02

456
BNY MelloN GloBal FuNds, plc
SIGNIFICANT PORTFOLIO MOVEMENTS
BNY Mellon Mobility Innovation Fund for the financial period ended 30 June 2020
Yandex NV - Class A 168,222 6,373,268NVIDIA Corp 12,391 3,132,634Slack Technologies Inc 108,526 2,967,782Splunk Inc 15,757 2,590,751ANSYS Inc 9,438 2,568,949Aptiv Plc 35,460 2,436,904Alphabet Inc 1,752 2,397,111NXP Semiconductors NV 20,081 2,162,664Nikola Corp 55,630 1,976,570Visteon Corp 30,969 1,957,545Daimler AG 46,532 1,841,565ABB Ltd 87,195 1,827,777STMicroelectronics NV 63,686 1,775,848Rockwell Automation Inc 8,858 1,752,950Schneider Electric SE 22,517 1,749,889Roper Technologies Inc 4,627 1,736,110MediaTek Inc 119,000 1,727,154Samsung SDI Co Ltd 6,520 1,702,839KION Group AG 33,560 1,628,672Hubbell Inc - Class B 11,039 1,430,764Twilio Inc - Class A 10,643 1,430,679QUALCOMM Inc 14,650 1,303,366Infineon Technologies AG 61,440 1,248,666Lumentum Holdings Inc 14,727 1,179,947Taiyo Yuden Co Ltd 37,900 1,170,866FLIR Systems Inc 22,800 1,119,327ON Semiconductor Corp 50,593 1,085,631Denso Corp 26,300 1,074,920Landis+Gyr Group AG 13,391 1,020,644Tesla Inc 1,521 1,006,973Mitsubishi Electric Corp 69,300 957,761Diodes Inc 16,920 895,272BorgWarner Inc 24,615 879,701Semtech Corp 16,477 841,875Guangzhou Automobile Group Co Ltd ‘H’ 782,000 829,285Everbridge Inc 8,002 816,953Skyworks Solutions Inc 6,790 810,076NextEra Energy Inc 2,995 757,031
Major Purchases NominalCost USD Major Sales Nominal
Proceeds USD
Yandex NV - Class A 186,561 7,297,655QUALCOMM Inc 64,466 4,543,073Keysight Technologies Inc 31,265 2,991,087Xilinx Inc 34,456 2,959,063Tesla Inc 3,563 2,540,514Suzuki Motor Corp 56,000 1,975,394Delta Electronics Inc 422,000 1,965,587Prysmian SpA 102,558 1,951,026ANSYS Inc 6,345 1,720,564MediaTek Inc 124,000 1,692,687Corning Inc 57,187 1,637,099FleetCor Technologies Inc 6,998 1,385,587Hino Motors Ltd 170,100 1,021,892Cubic Corp 25,881 974,007Continental AG 10,021 959,965TE Connectivity Ltd 9,976 940,136Nikola Corp 10,031 682,641Amphenol Corp - Class A 6,384 660,634Mitsubishi Electric Corp 49,500 642,257Hella GmbH & Co KGaA 20,072 463,743
03613-1D.indd 456 19/08/2020 19:02

457
BNY MelloN GloBal FuNds, plc
SIGNIFICANT PORTFOLIO MOVEMENTS
BNY Mellon S&P 500® Index Tracker for the financial period ended 30 June 2020
Microsoft Corp 428 70,867Amazon.com Inc 31 68,905Apple Inc 232 66,353DexCom Inc 122 51,353United States Treasury Bill (Zero Coupon) 0.000% 25-Feb-2021 36,000 35,956T-Mobile US Inc 349 35,321Facebook Inc - Class A 166 31,725Johnson & Johnson 207 29,250United States Treasury Bill (Zero Coupon) 0.000% 18-Jun-2020 29,000 28,973Paycom Software Inc 86 26,773BlackRock Inc 52 26,216Berkshire Hathaway Inc - Class B 134 25,589Alphabet Inc - Class A 19 24,498JPMorgan Chase & Co 222 22,406Alphabet Inc 17 21,604West Pharmaceutical Services Inc 99 20,840Procter & Gamble Co/The 172 20,067Domino’s Pizza Inc 51 19,252Walt Disney Co/The 161 18,600UnitedHealth Group Inc 62 17,643Regeneron Pharmaceuticals Inc 32 17,168Visa Inc - Class A 93 16,571Tyler Technologies Inc 48 15,994Prologis Inc (REIT) 174 15,952Pfizer Inc 437 15,526Verizon Communications Inc 265 15,013
Major Purchases NominalCost USD Major Sales Nominal
Proceeds USD
Microsoft Corp 5,241 909,580Apple Inc 2,965 876,783Amazon.com Inc 287 639,583Facebook Inc - Class A 1,667 324,572Alphabet Inc 210 279,538Johnson & Johnson 1,842 273,945Alphabet Inc - Class A 205 271,962Berkshire Hathaway Inc - Class B 1,367 270,074JPMorgan Chase & Co 2,290 240,996Visa Inc - Class A 1,189 214,909Procter & Gamble Co/The 1,747 209,448UnitedHealth Group Inc 649 187,542Intel Corp 3,093 185,515Mastercard Inc 606 170,622Home Depot Inc/The 767 169,855AT&T Inc 5,166 169,378Verizon Communications Inc 2,835 163,886Bank of America Corp 5,937 155,152Walt Disney Co/The 1,278 148,103Merck & Co Inc 1,775 147,341
03613-1D.indd 457 19/08/2020 19:02

458
BNY MelloN GloBal FuNds, plc
SIGNIFICANT PORTFOLIO MOVEMENTS
The above constitutes the full purchases detail for the Fund during the financial period.
BNY Mellon Small Cap Euroland Fund for the financial period ended 30 June 2020
Klepierre SA (REIT) 31,706 769,242Iren SpA 259,015 739,486Bechtle AG 4,553 715,483Iliad SA 3,989 628,571Bekaert SA 23,369 602,062Arcadis NV 32,467 581,038Unicaja Banco SA ‘144A’ 859,401 577,819CGG SA 159,771 466,611Dialog Semiconductor Plc 9,559 460,248Buzzi Unicem SpA 16,831 367,547DWS Group GmbH & Co KGaA ‘144A’ 7,396 242,094Schaeffler AG - Preference 29,466 207,671
Major Purchases NominalCost EUR Major Sales Nominal
Proceeds EUR
HelloFresh SE 45,177 1,428,312BE Semiconductor Industries NV 39,745 1,405,181Koninklijke Vopak NV 18,304 902,442Sartorius AG - Preference 2,847 775,550Royal Unibrew A/S 9,585 774,244Sixt SE 10,001 752,102Stroeer SE & Co KGaA 9,531 635,959Cramo Oyj 43,339 595,911Talanx AG 13,052 562,834Siltronic AG 6,406 560,480Euskaltel SA ‘144A’ 70,731 559,656Maire Tecnimont SpA 218,442 541,038GN Store Nord A/S 10,934 477,620Euronext NV ‘144A’ 6,074 465,243Covivio (REIT) 4,952 456,013K+S AG 42,807 441,643Teleperformance 1,817 397,994Korian SA 10,209 397,729OCI NV 21,804 381,346Eurofins Scientific SE 798 379,973TietoEVRY Oyj 13,930 367,364Valmet Oyj 17,524 363,457Unipol Gruppo SpA 80,037 344,108Edenred 7,467 339,898Sopra Steria Group 2,454 336,663Anima Holding SpA ‘144A’ 85,073 336,104Cie Plastic Omnium SA 16,141 334,038Signify NV ‘144A’ 12,604 330,126Eiffage SA 3,479 329,861Brenntag AG 6,946 308,489D'ieteren SA/NV 5,205 283,263Immobiliare Grande Distribuzione SIIQ SpA (REIT) 51,831 276,808ICON Plc 1,888 276,261Cewe Stiftung & Co KGAA 2,751 276,190Rheinmetall AG 3,031 265,718Cofinimmo SA (REIT) 1,915 264,357Nexity SA 6,416 257,382Acciona SA 2,467 250,261Kemira Oyj 19,036 230,386
03613-1D.indd 458 19/08/2020 19:02

459
BNY MelloN GloBal FuNds, plc
SIGNIFICANT PORTFOLIO MOVEMENTS
BNY Mellon Sustainable Global Dynamic Bond Fund for the financial period ended 30 June 2020
United States Treasury Note/Bond 1.500% 15-Aug-2026 10,480,000 9,692,661United States Treasury Note/Bond 1.500% 15-Feb-2030 9,195,000 9,094,421United States Treasury Floating Rate Note FRN 1.665% 31-Jan-2022 9,810,000 8,924,214United States Treasury Note/Bond 3.000% 15-Nov-2045 4,700,000 5,193,067United States Treasury Note/Bond 2.375% 15-May-2029 5,130,000 5,160,645Italy Buoni Poliennali Del Tesoro ‘144A’ 1.850% 01-Jul-2025 4,673,000 4,705,717Japan Government Two Year Bond 0.100% 01-Apr-2022 543,000,000 4,697,314United Kingdom Gilt Inflation Linked 0.125% 22-Mar-2026 3,217,492 4,385,727United States Treasury Inflation Indexed Bonds 0.750% 15-Jul-2028 4,074,782 3,949,266United States Treasury Note/Bond 0.500% 15-Mar-2023 4,100,000 3,729,677Japan Government Two Year Bond 0.100% 01-Jun-2021 447,250,000 3,696,311Colombia Government International Bond ‘REGS’ 6.000% 28-Apr-2028 11,978,500,000 3,300,305International Bank for Reconstruction & Development 1.625% 15-Jan-2025 3,670,000 3,281,958Spain Government Bond ‘144A’ 5.150% 31-Oct-2028 2,300,000 3,215,644Malaysia Government Bond 3.906% 15-Jul-2026 13,735,000 3,066,524Canada Housing Trust No 1 ‘144A’ 2.350% 15-Sep-2023 4,210,000 2,925,512Treasury Corp of Victoria 1.000% 20-Nov-2023 4,790,000 2,850,227Mexican Bonos 8.500% 31-May-2029 51,480,000 2,791,642Peruvian Government International Bond ‘REGS’ 8.200% 12-Aug-2026 7,400,000 2,564,030Canada Housing Trust No 1 ‘144A’ 2.100% 15-Sep-2029 3,530,000 2,490,019International Bank for Reconstruction & Development FRN 0.471% 17-Jun-2024 2,790,000 2,473,293Paraguay Government International Bond ‘REGS’ 5.000% 15-Apr-2026 2,390,000 2,356,672United States Treasury Inflation Indexed Bonds 0.500% 15-Apr-2024 2,510,005 2,318,122Ireland Government Bond 1.100% 15-May-2029 2,050,000 2,300,577JPMorgan Chase & Co FRN 2.083% 22-Apr-2026 2,500,000 2,292,000Italy Buoni Poliennali Del Tesoro 6.500% 01-Nov-2027 1,600,000 2,287,968Peruvian Government International Bond 2.392% 23-Jan-2026 2,450,000 2,283,198Singapore Government Bond 2.250% 01-Jun-2021 3,460,000 2,263,650Czech Republic Government Bond 1.250% 14-Feb-2025 59,930,000 2,259,277New South Wales Treasury Corp 3.000% 20-Mar-2028 3,200,000 2,230,110United States Treasury Note/Bond 2.875% 15-May-2043 1,900,000 2,229,655International Bank for Reconstruction & Development ‘GMTN’ 0.500% 24-Jul-2023 1,940,000 2,220,660United States Treasury Note/Bond 2.000% 15-Feb-2050 2,250,000 2,193,979JCDecaux SA 2.000% 24-Oct-2024 2,200,000 2,191,170UBS Group AG FRN (Perpetual) 5.000% 31-Jan-2023 2,300,000 2,156,746Kreditanstalt fuer Wiederaufbau 1.500% 15-Jun-2021 2,280,000 2,152,789
Major Purchases NominalCost EUR Major Sales and Maturities Nominal
Proceeds EUR
Japan Government Two Year Bond 0.100% 01-Jun-2021 1,269,850,000 10,628,567United States Treasury Inflation Indexed Bonds 0.750% 15-Jul-2028 9,518,276 9,597,629United States Treasury Note/Bond 1.500% 15-Aug-2026 9,410,000 9,054,455United States Treasury Floating Rate Note FRN 1.312% 31-Jan-2022 9,810,000 8,716,303United States Treasury Note/Bond 1.125% 30-Sep-2021 8,590,000 7,730,754Italy Buoni Poliennali Del Tesoro 4.500% 01-Mar-2024 5,580,000 6,213,161United States Treasury Note/Bond 3.000% 15-Nov-2045 4,700,000 5,389,434United States Treasury Note/Bond 2.375% 15-May-2029 5,130,000 5,136,655United Kingdom Gilt Inflation Linked 0.125% 22-Mar-2026 3,217,492 4,243,506Hungary Government Bond 2.500% 24-Oct-2024 1,426,840,000 4,221,393United States Treasury Note/Bond 0.500% 15-Mar-2023 4,100,000 3,654,158Canada Housing Trust No 1 ‘144A’ 1.250% 15-Jun-2021 4,760,000 3,223,762Australia Government Bond 5.750% 15-May-2021 4,980,000 2,909,421United States Treasury Inflation Indexed Bonds 0.500% 15-Apr-2024 3,098,271 2,900,388Canada Housing Trust No 1 ‘144A’ 2.650% 15-Mar-2028 3,890,000 2,865,816United States Treasury Floating Rate Note FRN 1.641% 31-Jan-2021 3,160,000 2,839,735New Zealand Local Government Funding Agency Bond 4.500% 15-Apr-2027 3,870,000 2,658,587Banco Santander SA FRN (Perpetual) 5.250% 29-Sep-2023 2,400,000 2,486,350German Postal Pensions Securitisation Plc 3.750% 18-Jan-2021 2,300,000 2,353,199Inter-American Development Bank ‘GMTN’ 3.875% 28-Oct-2041 1,867,000 2,332,898Peruvian Government International Bond 2.392% 23-Jan-2026 2,450,000 2,302,255Australia Government Bond 3.000% 21-Mar-2047 2,980,000 2,246,501Ireland Government Bond 1.100% 15-May-2029 2,050,000 2,233,865New South Wales Treasury Corp 3.000% 20-Mar-2028 3,200,000 2,218,062United States Treasury Note/Bond 2.875% 15-May-2043 1,900,000 2,201,808Italy Buoni Poliennali Del Tesoro 6.500% 01-Nov-2027 1,600,000 2,179,025UBS Group AG FRN (Perpetual) 7.125% 29-Dec-2049 2,330,000 2,159,006United States Treasury Note/Bond 1.500% 15-Feb-2030 15-Feb-2030 2,205,000 2,099,189Skandinaviska Enskilda Banken AB ‘EMTN’ 1.500% 25-Feb-2020 1,960,000 1,960,000Georgia Government International Bond ‘REGS’ 6.875% 12-Apr-2021 1,960,000 1,908,004Export-Import Bank of Korea FRN 1.866% 25-Jan-2022 2,110,000 1,878,747Clarion Funding PLC ‘EMTN’ 1.875% 22-Jan-2035 1,546,000 1,877,782European Investment Bank FRN 1.040% 17-Feb-2020 1,480,000 1,761,213
03613-1D.indd 459 19/08/2020 19:02

460
BNY MelloN GloBal FuNds, plc
SIGNIFICANT PORTFOLIO MOVEMENTS
BNY Mellon Sustainable Global Real Return Fund (EUR)* for the financial period ended 30 June 2020
iShares Physical Gold ETC 46,870 1,309,270Invesco Physical Gold ETC 9,440 1,307,718Hungary Government Bond 1.500% 24-Aug-2022 430,000,000 1,294,957United States Treasury Note/Bond 1.750% 31-Dec-2026 1,315,700 1,213,584Amundi Physical Gold ETC 19,534 1,156,598Xtrackers Physical Gold ETC 4,320 656,558Greencoat UK Wind Plc/Funds 338,060 578,551Renewables Infrastructure Group Ltd/The 310,593 502,756Australia Government Bond 3.000% 21-Mar-2047 624,000 493,227Canada Housing Trust No 1 ‘144A’ 2.350% 15-Jun-2027 660,000 472,222Microsoft Corp 2,766 462,680Australia Government Bond 3.250% 21-Jun-2039 574,000 461,241AIA Group Ltd 45,200 424,030SAP SE 2,903 355,321Hungary Government Bond 5.500% 24-Jun-2025 97,820,000 354,279Sdcl Energy Efficiency Income Trust Plc 269,242 348,648Prudential Plc 20,720 334,556Zurich Insurance Group AG 909 323,076Alibaba Group Holding Ltd ADR 1,596 315,968Goldman Sachs Group Inc/The 1,467 295,367
Major Purchases NominalCost EUR Major Sales Nominal
Proceeds EUR
United States Treasury Note/Bond 1.750% 31-Dec-2026 1,315,700 1,267,620Hungary Government Bond 1.500% 24-Aug-2022 430,000,000 1,211,168Canada Housing Trust No 1 ‘144A’ 2.350% 15-Jun-2027 660,000 473,081Xtrackers Physical Gold ETC 2,726 404,237Invesco Physical Gold ETC 2,555 361,519Hungary Government Bond 5.500% 24-Jun-2025 97,820,000 331,128New Zealand Government Bond 4.500% 15-Apr-2027 321,000 225,139European Bank for Reconstruction & Development ‘GMTN’ 6.450% 13-Dec-2022 3,475,600,000 189,428Morocco Government International Bond ‘REGS’ 4.250% 11-Dec-2022 200,000 178,787Costa Rica Government International Bond ‘REGS’ 4.250% 26-Jan-2023 200,000 163,071Cisco Systems Inc 4,987 155,174Microsoft Corp 925 150,318Australia Government Bond 3.000% 21-Mar-2047 205,000 137,902Banco Santander SA FRN (Perpetual) 4.750% 19-Jun-2169 200,000 126,000Peruvian Government International Bond ‘REGS’ 5.700% 12-Aug-2024 410,000 120,044Samsung SDI Co Ltd 469 115,363iShares Physical Gold ETC 4,225 113,665Malaysia Government Bond 3.906% 15-Jul-2026 503,000 107,774InterXion Holding NV ‘REGS’ 4.750% 15-Jun-2025 100,000 107,628Swedbank AB 10,560 107,180Peruvian Government International Bond ‘REGS’ 6.350% 12-Aug-2028 353,000 96,169Ferguson Plc 1,551 94,860Clicks Group Ltd 7,857 89,280Hungary Government Bond 3.000% 21-Aug-2030 29,310,000 83,608
BNY Mellon Targeted Return Bond Fund for the financial period ended 30 June 2020
United States Treasury Bill (Zero Coupon) 0.000% 31-Mar-2020 8,300,000 8,282,670United States Treasury Bill (Zero Coupon) 0.000% 07-Apr-2020 8,250,000 8,246,391United States Treasury Bill (Zero Coupon) 0.000% 11-Feb-2020 8,200,000 8,190,497United States Treasury Bill (Zero Coupon) 0.000% 10-Mar-2020 8,200,000 8,190,201United States Treasury Bill (Zero Coupon) 0.000% 21-Apr-2020 8,000,000 7,981,580United States Treasury Bill (Zero Coupon) 0.000% 09-Apr-2020 7,500,000 7,477,688United States Treasury Note/Bond 1.125% 28-Feb-2025 7,025,000 7,249,561Bundesobligation (Zero Coupon) 0.000% 05-Apr-2024 3,600,000 4,005,540Italy Buoni Poliennali Del Tesoro ‘144A’ 1.650% 01-Dec-2030 2,125,000 2,369,106United States Treasury Bill (Zero Coupon) 0.000% 30-Jul-2020 1,880,000 1,879,505United States Treasury Note/Bond 1.125% 28-Feb-2027 1,600,000 1,645,188United States Treasury FRN 0.193% 31-Jul-2020 1,375,000 1,375,017Bundesrepublik Deutschland Bundesanleihe 2.500% 15-Aug-2046 675,000 1,259,164Repsol International Finance BV ‘EMTN’ 2.625% 15-Apr-2030 1,100,000 1,186,930Portugal Obrigacoes do Tesouro OT ‘144A’ 3.875% 15-Feb-2030 625,000 946,480Spain Government Bond ‘144A’ 0.600% 31-Oct-2029 750,000 870,218Lloyds Bank Corporate Markets Plc ‘EMTN’ 2.375% 09-Apr-2026 725,000 786,471Airbus SE 2.000% 07-Apr-2028 675,000 736,267Brazilian Government International Bond 3.875% 12-Jun-2030 675,000 668,095Barclays Plc ‘EMTN’ FRN 3.375% 02-Apr-2025 575,000 628,042
Major Purchases NominalCost USD Major Sales and Maturities Nominal
Proceeds USD
United States Treasury Note/Bond 2.875% 30-Nov-2023 8,350,000 9,062,016United States Treasury Bill (Zero Coupon) 0.000% 31-Mar-2020 8,300,000 8,300,000United States Treasury Bill (Zero Coupon) 0.000% 07-Apr-2020 8,250,000 8,250,000United States Treasury Bill (Zero Coupon) 0.000% 14-Jan-2020 8,200,000 8,200,000United States Treasury Bill (Zero Coupon) 0.000% 11-Feb-2020 8,200,000 8,200,000United States Treasury Bill (Zero Coupon) 0.000% 10-Mar-2020 8,200,000 8,200,000United States Treasury Bill (Zero Coupon) 0.000% 30-Jan-2020 8,000,000 8,000,000United States Treasury Bill (Zero Coupon) 0.000% 27-Feb-2020 8,000,000 8,000,000United States Treasury Bill (Zero Coupon) 0.000% 21-Apr-2020 8,000,000 8,000,000United States Treasury Bill (Zero Coupon) 0.000% 18-Feb-2020 7,600,000 7,600,000United States Treasury Bill (Zero Coupon) 0.000% 09-Apr-2020 7,500,000 7,500,000United States Treasury Bill (Zero Coupon) 0.000% 04-Feb-2020 7,200,000 7,200,000United States Treasury FRN 1.536% 31-Jan-2020 3,825,000 3,825,000Italy Buoni Poliennali Del Tesoro 3.000% 01-Aug-2029 1,875,000 2,371,682United States Treasury Note/Bond 1.125% 28-Feb-2025 1,025,000 1,064,959Fannie Mae Pool 2.500% 01-Sep-2028 800,958 801,896United States Treasury Bill (Zero Coupon) 0.000% 16-Apr-2020 640,000 640,001Fannie Mae Pool 3.000% 01-Dec-2049 449,352 465,779Senegal Government International Bond ‘REGS’ 4.750% 13-Mar-2028 500,000 464,080TJX Cos Inc/The 3.500% 15-Apr-2025 400,000 431,398
* Please refer to Note 18 of the financial statements.
03613-1D.indd 460 19/08/2020 19:02

461
BNY MelloN GloBal FuNds, plc
SIGNIFICANT PORTFOLIO MOVEMENTS
BNY Mellon U.S. Dynamic Value Fund for the financial period ended 30 June 2020
iShares Russell 1000 Value ETF - ETF 10,198 1,208,610Intel Corp 13,909 884,432Eaton Corp Plc 6,457 574,266Las Vegas Sands Corp 8,797 505,059AbbVie Inc 5,654 497,339PPL Corp 16,798 480,544JPMorgan Chase & Co 3,859 420,607Goldman Sachs Group Inc/The 2,131 384,887Cisco Systems Inc 8,025 360,505CF Industries Holdings Inc 10,782 358,629Lowe's Cos Inc 3,255 350,652State Street Corp 4,733 340,302Alphabet Inc - Class A 249 340,149Becton Dickinson and Co 1,391 338,688Philip Morris International Inc 3,916 338,023Morgan Stanley 7,457 329,025Union Pacific Corp 1,823 312,531Louisiana-Pacific Corp 12,176 312,288Bristol-Myers Squibb Co 4,885 301,162Proofpoint Inc 2,395 290,765Freeport-McMoRan Inc 31,153 283,482NextEra Energy Partners LP (Units) 5,562 277,982Eli Lilly and Co 1,855 273,566Mondelez International Inc 5,582 273,317Alcon Inc 4,461 265,332ConocoPhillips 6,816 259,951Laboratory Corp of America Holdings 1,454 251,688Centene Corp 3,765 244,690Berkshire Hathaway Inc - Class B 1,108 237,637Hess Corp 4,726 227,338Omnicom Group Inc 3,177 224,698NXP Semiconductors NV 1,874 220,496Western Digital Corp 4,229 220,280Weyerhaeuser Co (REIT) 7,585 214,119Lennar Corp 4,126 211,423Marathon Petroleum Corp 5,334 210,989Zebra Technologies Corp 902 203,032Dolby Laboratories Inc - Class A 3,265 197,877Kellogg Co 2,793 188,195
Major Purchases NominalCost USD Major Sales Nominal
Proceeds USD
iShares Russell 1000 Value ETF - ETF 12,317 1,433,138AT&T Inc 15,132 568,852Edison International 6,738 481,402Martin Marietta Materials Inc 2,352 455,899Bank of America Corp 16,095 446,739E*TRADE Financial Corp 9,230 442,598US Bancorp 7,350 422,956Pfizer Inc 11,030 417,737Newmont Corp 7,512 395,026Colgate-Palmolive Co 5,546 385,369ConocoPhillips 6,720 384,880QUALCOMM Inc 4,432 364,918Citigroup Inc 4,645 346,687Broadcom Inc 1,164 325,074Alphabet Inc - Class A 254 323,914Conagra Brands Inc 9,906 289,699Honeywell International Inc 1,529 272,843Hartford Financial Services Group Inc/The 4,512 267,154Merck & Co Inc 3,195 262,497Western Digital Corp 4,870 238,299Lennar Corp 3,327 224,640Cigna Corp 1,170 214,871Comcast Corp 4,880 214,804CVS Health Corp 3,200 200,166Gilead Sciences Inc 2,502 190,441Delta Air Lines Inc 8,352 180,058PepsiCo Inc 1,256 175,156American International Group Inc 5,090 167,562Concho Resources Inc 2,934 166,824Kellogg Co 2,793 163,092Willis Towers Watson Plc 874 163,083Microchip Technology Inc 1,843 155,976Marathon Petroleum Corp 3,707 155,471Texas Instruments Inc 1,146 149,042Hess Corp 3,086 145,744Raytheon Technologies Corp 2,500 139,761Raymond James Financial Inc 1,531 139,314Omnicom Group Inc 1,736 136,851Valero Energy Corp 1,436 134,578
03613-1D.indd 461 19/08/2020 19:02

462
BNY MelloN GloBal FuNds, plc
SIGNIFICANT PORTFOLIO MOVEMENTS
BNY Mellon U.S. Equity Income Fund for the financial period ended 30 June 2020
AbbVie Inc 137,814 12,129,353Intel Corp 144,837 9,206,641CF Industries Holdings Inc 184,185 6,845,790Western Digital Corp 119,114 6,817,809Bristol-Myers Squibb Co 104,768 6,644,904Becton Dickinson and Co - Preferred Stock 6.000% 01-Jun-2023 122,394 6,221,291Las Vegas Sands Corp 83,640 5,622,187SPDR S&P 500 ETF Trust - ETF 17,906 5,431,815Eaton Corp Plc 53,657 4,991,013International Business Machines Corp 30,021 4,288,232L3Harris Technologies Inc 23,195 4,200,781Philip Morris International Inc 47,031 4,193,604State Street Corp 50,243 3,914,092Gilead Sciences Inc 45,069 3,112,731JPMorgan Chase & Co 24,748 3,056,793Louisiana-Pacific Corp 135,932 2,997,135Vodafone Group Plc ADR 166,204 2,904,731Goldman Sachs Group Inc/The 16,591 2,887,283Lowe's Cos Inc 33,552 2,649,621General Motors Co 73,829 2,560,702NextEra Energy Partners LP (Units) 54,313 2,383,192Union Pacific Corp 12,969 2,319,191Hess Corp 39,633 2,305,532Lamar Advertising Co (REIT) - Class A 30,521 2,084,922Delta Air Lines Inc 31,970 1,736,624Cisco Systems Inc 40,518 1,704,593PPL Corp 64,624 1,696,610Citigroup Inc 25,135 1,600,329Morgan Stanley 33,552 1,584,529
Major Purchases NominalCost USD Major Sales Nominal
Proceeds USD
AT&T Inc 286,483 9,785,105Merck & Co Inc 116,256 9,733,536Pfizer Inc 224,282 8,534,224Becton Dickinson and Co 29,727 7,339,130Edison International 85,898 6,095,030Nutrien Ltd 135,513 5,651,175Citigroup Inc 81,222 5,283,499QUALCOMM Inc 62,068 5,237,832Western Digital Corp 119,114 5,130,179Raytheon Technologies Corp 88,591 4,904,177Exxon Mobil Corp 69,192 4,584,961Conagra Brands Inc 148,674 4,199,095PepsiCo Inc 29,331 4,181,214JPMorgan Chase & Co 38,017 4,110,327Comcast Corp 89,335 3,932,285US Bancorp 91,185 3,838,250Bank of America Corp 136,359 3,672,456Target Corp 32,061 3,664,232Lamar Advertising Co (REIT) - Class A 37,984 3,544,931Gilead Sciences Inc 45,069 3,474,639Outfront Media Inc (REIT) 214,036 3,040,951Texas Instruments Inc 23,051 2,997,880Capital One Financial Corp 48,493 2,969,769Weyerhaeuser Co (REIT) 143,798 2,908,745Delta Air Lines Inc 120,787 2,875,496Schlumberger Ltd 180,810 2,844,838PPL Corp 107,606 2,759,981Applied Materials Inc 46,640 2,718,559SPDR S&P 500 ETF Trust - ETF 8,870 2,671,679Goldman Sachs Group Inc/The 13,737 2,647,100Medtronic Plc 27,266 2,451,974Vulcan Materials Co 18,602 2,274,034Morgan Stanley 44,960 1,755,886
03613-1D.indd 462 19/08/2020 19:02
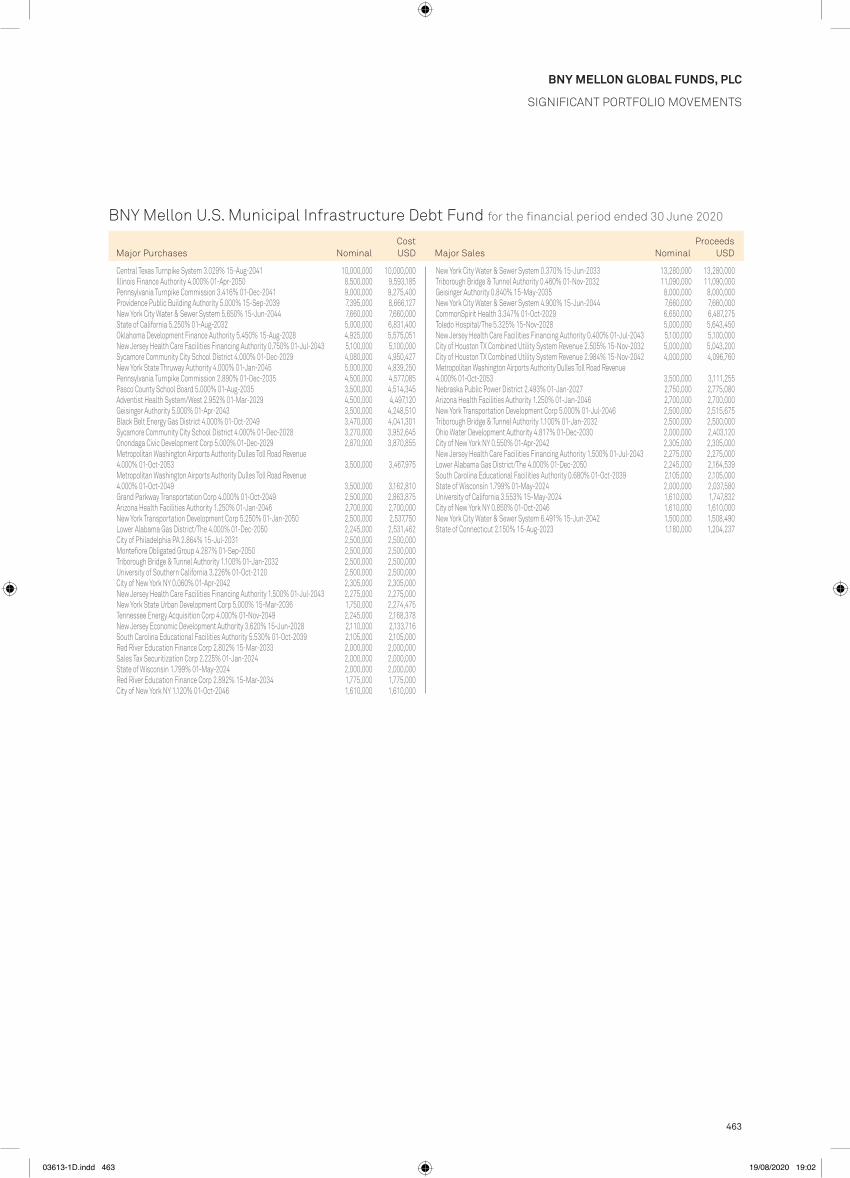
463
BNY MelloN GloBal FuNds, plc
SIGNIFICANT PORTFOLIO MOVEMENTS
BNY Mellon U.S. Municipal Infrastructure Debt Fund for the financial period ended 30 June 2020
Central Texas Turnpike System 3.029% 15-Aug-2041 10,000,000 10,000,000Illinois Finance Authority 4.000% 01-Apr-2050 8,500,000 9,593,185Pennsylvania Turnpike Commission 3.416% 01-Dec-2041 9,000,000 9,275,400Providence Public Building Authority 5.000% 15-Sep-2039 7,395,000 8,666,127New York City Water & Sewer System 5.650% 15-Jun-2044 7,660,000 7,660,000State of California 5.250% 01-Aug-2032 5,000,000 6,831,400Oklahoma Development Finance Authority 5.450% 15-Aug-2028 4,925,000 5,575,051New Jersey Health Care Facilities Financing Authority 0.750% 01-Jul-2043 5,100,000 5,100,000Sycamore Community City School District 4.000% 01-Dec-2029 4,080,000 4,950,427New York State Thruway Authority 4.000% 01-Jan-2045 5,000,000 4,839,250Pennsylvania Turnpike Commission 2.890% 01-Dec-2035 4,500,000 4,577,085Pasco County School Board 5.000% 01-Aug-2035 3,500,000 4,514,345Adventist Health System/West 2.952% 01-Mar-2029 4,500,000 4,497,120Geisinger Authority 5.000% 01-Apr-2043 3,500,000 4,248,510Black Belt Energy Gas District 4.000% 01-Oct-2049 3,470,000 4,041,301Sycamore Community City School District 4.000% 01-Dec-2028 3,270,000 3,952,645Onondaga Civic Development Corp 5.000% 01-Dec-2029 2,870,000 3,870,855Metropolitan Washington Airports Authority Dulles Toll Road Revenue 4.000% 01-Oct-2053 3,500,000 3,467,975Metropolitan Washington Airports Authority Dulles Toll Road Revenue 4.000% 01-Oct-2049 3,500,000 3,162,810Grand Parkway Transportation Corp 4.000% 01-Oct-2049 2,500,000 2,863,875Arizona Health Facilities Authority 1.250% 01-Jan-2046 2,700,000 2,700,000New York Transportation Development Corp 5.250% 01-Jan-2050 2,500,000 2,537,750Lower Alabama Gas District/The 4.000% 01-Dec-2050 2,245,000 2,531,462City of Philadelphia PA 2.864% 15-Jul-2031 2,500,000 2,500,000Montefiore Obligated Group 4.287% 01-Sep-2050 2,500,000 2,500,000Triborough Bridge & Tunnel Authority 1.100% 01-Jan-2032 2,500,000 2,500,000University of Southern California 3.226% 01-Oct-2120 2,500,000 2,500,000City of New York NY 0.060% 01-Apr-2042 2,305,000 2,305,000New Jersey Health Care Facilities Financing Authority 1.500% 01-Jul-2043 2,275,000 2,275,000New York State Urban Development Corp 5.000% 15-Mar-2036 1,750,000 2,274,475Tennessee Energy Acquisition Corp 4.000% 01-Nov-2049 2,245,000 2,168,378New Jersey Economic Development Authority 3.620% 15-Jun-2028 2,110,000 2,133,716South Carolina Educational Facilities Authority 5.530% 01-Oct-2039 2,105,000 2,105,000Red River Education Finance Corp 2.802% 15-Mar-2033 2,000,000 2,000,000Sales Tax Securitization Corp 2.225% 01-Jan-2024 2,000,000 2,000,000State of Wisconsin 1.799% 01-May-2024 2,000,000 2,000,000Red River Education Finance Corp 2.892% 15-Mar-2034 1,775,000 1,775,000City of New York NY 1.120% 01-Oct-2046 1,610,000 1,610,000
Major Purchases NominalCost USD Major Sales Nominal
Proceeds USD
New York City Water & Sewer System 0.370% 15-Jun-2033 13,280,000 13,280,000Triborough Bridge & Tunnel Authority 0.460% 01-Nov-2032 11,090,000 11,090,000Geisinger Authority 0.840% 15-May-2035 8,000,000 8,000,000New York City Water & Sewer System 4.900% 15-Jun-2044 7,660,000 7,660,000CommonSpirit Health 3.347% 01-Oct-2029 6,650,000 6,487,275Toledo Hospital/The 5.325% 15-Nov-2028 5,000,000 5,643,450New Jersey Health Care Facilities Financing Authority 0.400% 01-Jul-2043 5,100,000 5,100,000City of Houston TX Combined Utility System Revenue 2.505% 15-Nov-2032 5,000,000 5,043,200City of Houston TX Combined Utility System Revenue 2.984% 15-Nov-2042 4,000,000 4,096,760Metropolitan Washington Airports Authority Dulles Toll Road Revenue 4.000% 01-Oct-2053 3,500,000 3,111,255Nebraska Public Power District 2.493% 01-Jan-2027 2,750,000 2,775,080Arizona Health Facilities Authority 1.250% 01-Jan-2046 2,700,000 2,700,000New York Transportation Development Corp 5.000% 01-Jul-2046 2,500,000 2,515,675Triborough Bridge & Tunnel Authority 1.100% 01-Jan-2032 2,500,000 2,500,000Ohio Water Development Authority 4.817% 01-Dec-2030 2,000,000 2,403,120City of New York NY 0.550% 01-Apr-2042 2,305,000 2,305,000New Jersey Health Care Facilities Financing Authority 1.500% 01-Jul-2043 2,275,000 2,275,000Lower Alabama Gas District/The 4.000% 01-Dec-2050 2,245,000 2,164,539South Carolina Educational Facilities Authority 0.680% 01-Oct-2039 2,105,000 2,105,000State of Wisconsin 1.799% 01-May-2024 2,000,000 2,037,580University of California 3.553% 15-May-2024 1,610,000 1,747,832City of New York NY 0.850% 01-Oct-2046 1,610,000 1,610,000New York City Water & Sewer System 6.491% 15-Jun-2042 1,500,000 1,508,490State of Connecticut 2.150% 15-Aug-2023 1,180,000 1,204,237
03613-1D.indd 463 19/08/2020 19:02
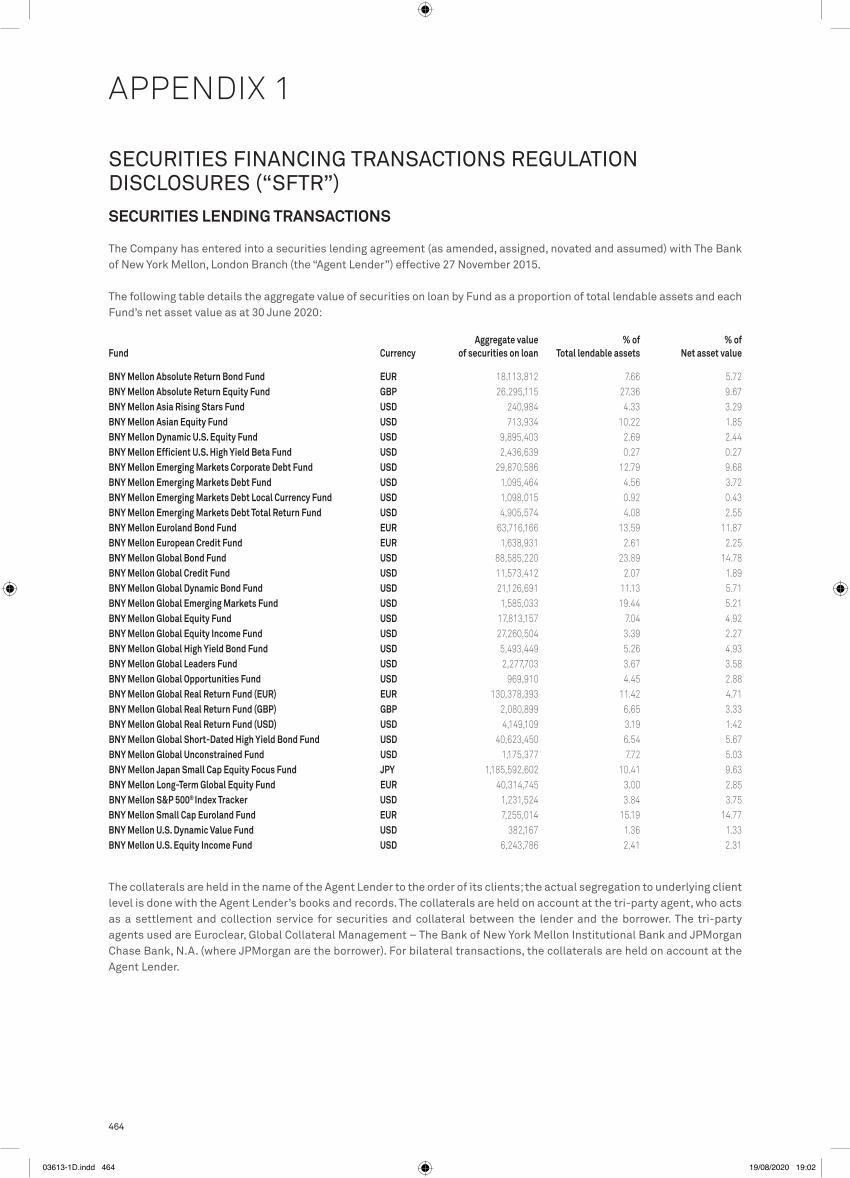
464
APPENDIX 1
SECURITIES FINANCING TRANSACTIONS REGULATION DISCLOSURES (“SFTR”)SECURITIES LENDING TRANSACTIONS
The Company has entered into a securities lending agreement (as amended, assigned, novated and assumed) with The Bank of New York Mellon, London Branch (the “Agent Lender”) effective 27 November 2015.
The following table details the aggregate value of securities on loan by Fund as a proportion of total lendable assets and each Fund’s net asset value as at 30 June 2020:
Fund CurrencyAggregate value
of securities on loan% of
Total lendable assets% of
Net asset value
BNY Mellon Absolute Return Bond Fund EUR 18,113,812 7.66 5.72BNY Mellon Absolute Return Equity Fund GBP 26,295,115 27.36 9.67BNY Mellon Asia Rising Stars Fund USD 240,984 4.33 3.29BNY Mellon Asian Equity Fund USD 713,934 10.22 1.85BNY Mellon Dynamic U.S. Equity Fund USD 9,895,403 2.69 2.44BNY Mellon Efficient U.S. High Yield Beta Fund USD 2,436,639 0.27 0.27BNY Mellon Emerging Markets Corporate Debt Fund USD 29,870,586 12.79 9.68BNY Mellon Emerging Markets Debt Fund USD 1,095,464 4.56 3.72BNY Mellon Emerging Markets Debt Local Currency Fund USD 1,098,015 0.92 0.43BNY Mellon Emerging Markets Debt Total Return Fund USD 4,905,574 4.08 2.55BNY Mellon Euroland Bond Fund EUR 63,716,166 13.59 11.87BNY Mellon European Credit Fund EUR 1,638,931 2.61 2.25BNY Mellon Global Bond Fund USD 88,585,220 23.89 14.78BNY Mellon Global Credit Fund USD 11,573,412 2.07 1.89BNY Mellon Global Dynamic Bond Fund USD 21,126,691 11.13 5.71BNY Mellon Global Emerging Markets Fund USD 1,585,033 19.44 5.21BNY Mellon Global Equity Fund USD 17,813,157 7.04 4.92BNY Mellon Global Equity Income Fund USD 27,260,504 3.39 2.27BNY Mellon Global High Yield Bond Fund USD 5,493,449 5.26 4.93BNY Mellon Global Leaders Fund USD 2,277,703 3.67 3.58BNY Mellon Global Opportunities Fund USD 969,910 4.45 2.88BNY Mellon Global Real Return Fund (EUR) EUR 130,378,393 11.42 4.71BNY Mellon Global Real Return Fund (GBP) GBP 2,080,899 6.65 3.33BNY Mellon Global Real Return Fund (USD) USD 4,149,109 3.19 1.42BNY Mellon Global Short-Dated High Yield Bond Fund USD 40,623,450 6.54 5.67BNY Mellon Global Unconstrained Fund USD 1,175,377 7.72 5.03BNY Mellon Japan Small Cap Equity Focus Fund JPY 1,185,592,602 10.41 9.63BNY Mellon Long-Term Global Equity Fund EUR 40,314,745 3.00 2.85BNY Mellon S&P 500® Index Tracker USD 1,231,524 3.84 3.75BNY Mellon Small Cap Euroland Fund EUR 7,255,014 15.19 14.77BNY Mellon U.S. Dynamic Value Fund USD 382,167 1.36 1.33BNY Mellon U.S. Equity Income Fund USD 6,243,786 2.41 2.31
The collaterals are held in the name of the Agent Lender to the order of its clients; the actual segregation to underlying client level is done with the Agent Lender’s books and records. The collaterals are held on account at the tri-party agent, who acts as a settlement and collection service for securities and collateral between the lender and the borrower. The tri-party agents used are Euroclear, Global Collateral Management – The Bank of New York Mellon Institutional Bank and JPMorgan Chase Bank, N.A. (where JPMorgan are the borrower). For bilateral transactions, the collaterals are held on account at the Agent Lender.
03613-1D.indd 464 19/08/2020 19:02

465
APPENDIX 1
SECURITIES FINANCING TRANSACTIONS REGULATION DISCLOSURES (“SFTR”) cont’d.
SECURITIES LENDING TRANSACTIONS cont’d.
Fund Collateral agentAggregate value
of collateral held
BNY Mellon Emerging Markets Debt Total Return Fund USDEuroclear Triparty 5,146,484
5,146,484
BNY Mellon Euroland Bond Fund EURThe Bank of New York Mellon, London Branch 7,348,853The Bank of New York Mellon Institutional Bank 1,960,347Euroclear Triparty 56,712,725JPMorgan Chase Bank, N.A. 332,947
66,354,872
BNY Mellon European Credit Fund EURThe Bank of New York Mellon, London Branch 211,505Euroclear Triparty 1,480,141
1,691,646
BNY Mellon Global Bond Fund USDThe Bank of New York Mellon, London Branch 85,031,818Euroclear Triparty 11,049,751
96,081,569
BNY Mellon Global Credit Fund USDThe Bank of New York Mellon, London Branch 1,219,458The Bank of New York Mellon Institutional Bank 22,060Euroclear Triparty 10,956,798
12,198,316
BNY Mellon Global Dynamic Bond Fund USDThe Bank of New York Mellon, London Branch 18,301,323Euroclear Triparty 4,554,315
22,855,638
BNY Mellon Global Emerging Markets Fund USDThe Bank of New York Mellon, London Branch 1,425,064JPMorgan Chase Bank, N.A. 354,713
1,779,777
BNY Mellon Global Equity Fund USDThe Bank of New York Mellon, London Branch 17,710,682JPMorgan Chase Bank, N.A. 2,177,885
19,888,567
BNY Mellon Global Equity Income Fund USDThe Bank of New York Mellon, London Branch 22,130,612The Bank of New York Mellon Institutional Bank 7,248,439
29,379,051
Fund Collateral agentAggregate value
of collateral held
BNY Mellon Absolute Return Bond Fund EURThe Bank of New York Mellon, London Branch 13,039,499The Bank of New York Mellon Institutional Bank 393,056Euroclear Triparty 6,178,877
19,611,432
BNY Mellon Absolute Return Equity Fund GBPThe Bank of New York Mellon, London Branch 22,430,473Euroclear Triparty 6,044,302
28,474,775
BNY Mellon Asia Rising Stars Fund USDThe Bank of New York Mellon, London Branch 244,137JPMorgan Chase Bank, N.A. 16,022
260,159
BNY Mellon Asian Equity Fund USDThe Bank of New York Mellon, London Branch 863,398
863,398
BNY Mellon Dynamic U.S. Equity Fund USDThe Bank of New York Mellon, London Branch 7,517,931The Bank of New York Mellon Institutional Bank 3,088,654JPMorgan Chase Bank, N.A. 1,362
10,607,947
BNY Mellon Efficient U.S. High Yield Beta Fund USDThe Bank of New York Mellon Institutional Bank 2,271,873Euroclear Triparty 221,294
2,493,167
BNY Mellon Emerging Markets Corporate Debt Fund USDThe Bank of New York Mellon, London Branch 5,750,983The Bank of New York Mellon Institutional Bank 7,449,196Euroclear Triparty 18,281,889
31,482,068
BNY Mellon Emerging Markets Debt Fund USDThe Bank of New York Mellon Institutional Bank 238,550Euroclear Triparty 943,446
1,181,996
BNY Mellon Emerging Markets Debt Local Currency Fund USDEuroclear Triparty 1,215,865
1,215,865
The following tables provide an analysis of the amounts held at each collateral agent as non-cash collateral received in respect of securities lending transactions as at 30 June 2020:
03613-1D.indd 465 19/08/2020 19:02