Evaluating the Effect of Coarse Rubber Particles on Asphalt Concrete Mixtures

“Urban air quality: the challenge of non-exhaust emissions"
11-12 July Barcelona (BDEBATE - IDAEA)
Urban air quality:
from ultrafine to coarse particles (focus on Southern Europe)

Critical air quality parameters
The problem of PM
PM temporal trends
UFP, NH3, BC, Coarse PM
Non exhaust PM in Spain
Measuring urban exopsure: Urban background or traffic?
CONTENT
CON TRIBUTORS TO THE STUDIES
IDAEA-CSIC
UNIVERSITY OF HUELVA
CREAL-UPF
CIEMAT
TNO
PAUL SCHERRER INSTITUTE
UNIVERSITY OF FLORENCE
EMPA
UNIVERSITY OF BIRMINGHAMM
UNIVERSITY OF AVEIRO
MINISTRY OF AGRICULTURE, FOOD AND ENVIRONMENT OF SPAIN
AJUNTAMENT DE BARCELONA
GENERALITAT DE CATALUNYA
JUNTA DE ANDALUCÍA
DIPUTACIÓ DE BARCELONA
BARCELONA NETA
SPRINGER - CITY OF KLAGENFURT
SPRINGER

Review of the air quality policy: Ultrafine Particles, NH3, Black Carbon, Coarse PM
Critical parameters (exceedances)
293
K , 101,3 kPa,
Directive 2008/50/EC, RD 102/2011 except PM and metals, Evriron. Cond.
Hourly 350 µg/m3 SO2 24 times per year
Daily 125 µg/m3 SO2 3 times per year
Annual prot. ecos. 20 µg/m3 SO2 not exceeding annual & mean 1 Oct-31 Mar
Hourly 200 µg/m3 NO2 18 times per year
Annual 40 µg/m3 NO2 not exceeding
Annual prot. vegetation 30 µg/m3 NOx (reported as NO2) not exceeding
Annual 30 (5) µg/m3 Benzene not exceeding
Mean 8-h max. in a day 10 mg/m3 CO not exceeding
Annual 500 ng/m3 Pb not exceeding
Annual 40 µg/m3 PM10 not exceeding
Daily 50 µg/m3 PM10 n<35 per year
Annual (25 and 20 (18) µg/m3 PM2.5) not exceeding
2010-2020 (reducing 20% PM2.5 triennial for mean of urban background)
CRITICAL AIR QUALITY PARAMETRES
2004/107/EC, RD 102/2011
Annual 6 ng/m3 As not exceeding
Annual 20 ng/m3 Ni not exceeding
Annual 5 ng/m3 Cd not exceeding
Annual 1 ng/m3 Benzo[]pirene not exceeding

0
20
40
60
80
PM
10 (
µg
/m3)
268 estaciones de vigilancia y control calidad del aire (España 2006), 25% superan VLA
Remotas
Rurales regionales
y próximas a ciudades
Sub-urbanas de fondo
Sub-urbanas de tráficoUrbanas de tráfico
Urbanas de fondo9%
35%
42%
Rurales y urbanas, 2006
4%
27%
0
20
40
60
80
PM
10 (
µg
/m3)
294 estaciones de vigilancia y control calidad del aire (España 2007), 20% superan VLA
Remotas
Rurales regionales
y próximas a ciudades
Sub-urbanas de fondo
Sub-urbanas de tráfico
Urbanas de tráficoUrbanas de fondo16%
29%
26%
Rurales y urbanas, 2007
30%
0
20
40
60
80
PM
10 (
µg
/m3)
293 estaciones de vigilancia y control calidad del aire (España 2008), 11% superan VLA
Remotas
Rurales regionales
y próximas a ciudades
Sub-urbanas de fondo
Sub-urbanas de tráfico
Urbanas de tráficoUrbanas de fondo
10%
21%
15%
Rurales y urbanas, 2008
11%
0
20
40
60
80
PM
10 (
µg
/m3)
177 estaciones de vigilancia y control calidad del aire (España 2006), 24% superan el VLA
Regionales-industriales
y próximas a ciudades-industriales
Sub-urbanas industrialesUrbanas Industriales
5% 6%
29%
40%
Industriales, 2006
0
20
40
60
80
PM
10 (
µg
/m3)
175 estaciones de vigilancia y control calidad del aire (España 2007), 19% superan el VLA
Regionales-industriales
y próximas a ciudades-industriales
Sub-urbanas industrialesUrbanas Industriales
2%
21% 43%
Industriales, 2007
0
20
40
60
80
PM
10 (
µg
/m3)
188 estaciones de vigilancia y control calidad del aire (España 2008), 10% superan el VLA
Regionales-industriales
y próximas a ciudades-industriales
Sub-urbanas industrialesUrbanas Industriales
13%
13% 10%
Industriales, 2008
Exceedances in 2010
VLA: Avilés2, Avilés3
VLD: Torrejón, Alcalá, Murcia, Aviles1, Avilés2, Avilés 3, Gijón, Camargo,
Puertollano
Exceedances in 2011
VLA: Avilés2
VLD: Sevilla, Granada, Córdoba, Villanueva del Arz., Huelva, Bailén, Alfaro,
Bilbao, Puertollano, Avilés, Gijón, St. Vicenç Horts, Sta Pertétua de la M.,
Granollers, Lleida, Vic, Barcelona, A Coruña
THE PROBLEM OF PM

EMEP Cusack et al., 2012. Atmospheric Chemistry and Physics
THE PROBLEM OF PM

SPAIN (2002 –
2012); PM2.5
[mg/m3]

Pey J., et al. 2009. Atmospheric Environment
N13-20 (2336 cm-3
)
1253; 54%536; 23%
336; 14%
97; 4%56; 2%
59; 3%
Tráfico
Crustal
Industrial
Marino
Fotoquímica
Regional / F. Urbano
Comb. Fuel-Oil
N50-200 (14813 cm-3
)
4261; 85%
85; 2%
68; 1%
159; 3%
319; 6% 76; 2%
29; 1%
Tráfico
Crustal
Industrial
Marino
Fotoquímica
Regional / F. Urbano
Comb. Fuel-Oil
0.10 µm 1.00 µm
Nu
mb
er
of
part
icle
s
Nucleation Aitken Accumulation CoarseNucleation Aitken Accumulation Coarse
0.01 µm 10.00 µm
N400-800 (22 cm-3
)
10; 52%
2; 8%
2; 10%
0,1; 1%
0,1; 1%
5; 26%
0,4; 2%Tráfico
Crustal
Industrial
Marino
Fotoquímica
Regional / F. Urbano
Comb. Fuel-Oil
ORIGIN OF ULTRAFINE PARTICLES: BARCELONA
Traffic
Crustal
Industrial
Marine
Photochemical
Regional / Urban back.
Fuel-Oil combustion
THE PROBLEM OF PM

BC & ULTRAFINE PARTICLES
Reche et al., 2011. Atmospheric Chemistry and Physics
0 2 4 6 8 10 12 14 16 18 20 22
Hour (UTC)
0.0
0.5
1.0
1.5
2.0
2.5
3.0
3.5
4.0
Bla
ck
Ca
rbo
n (µ
g/m
3)
N (>2.5nm) BC
0
5000
10000
15000
20000
25000
30000
35000
40000
45000
50000
0 2 4 6 8 10 12 14 16 18 20 22
Hour (UTC)
Nu
mb
er
of
pa
rtic
les
(n
/cm
3) N (>2.5nm) BC
0
5000
10000
15000
20000
25000
30000
35000
40000
45000
50000
0 2 4 6 8 10 12 14 16 18 20 22
Hour (UTC)
Nu
mb
er
of
pa
rtic
les
(n
/cm
3)
0
2
4
6
8
10
12
Bla
ck
Ca
rbo
n (µ
g/m
3)
N (>7nm) BC
0
5000
10000
15000
20000
25000
30000
35000
40000
45000
50000
0 2 4 6 8 10 12 14 16 18 20 22
Hour (UTC)
Nu
mb
er
of
pa
rtic
les
(n
/cm
3)
0
1
2
3
4
5
6
Bla
ck
Ca
rbo
n (µ
g/m
3)
N (>7nm) BC
0 2 4 6 8 10 12 14 16 18 20 22Hour (UTC)
0.0
0.5
1.0
1.5
2.0
2.5
3.0
3.5
4.0B
lac
k C
arb
on
(µg
/m3)
N (>7nm) BC
0 2 4 6 8 10 12 14 16 18 20 22
Hour (UTC)
N (>7nm) BC
0
5000
10000
15000
20000
25000
30000
35000
40000
45000
50000
0 2 4 6 8 10 12 14 16 18 20 22
Hour (UTC)
Nu
mb
er
of
pa
rtic
les
(n
/cm
3) N (>5nm) BC
BCN LUG
BERN
NK
HU SCO
MR
0 2 4 6 8 10 12 14 16 18 20 22
Hour (UTC)
0.0
0.5
1.0
1.5
2.0
2.5
3.0
3.5
4.0
Bla
ck
Ca
rbo
n (µ
g/m
3)
N (>2.5nm) BC
0
5000
10000
15000
20000
25000
30000
35000
40000
45000
50000
0 2 4 6 8 10 12 14 16 18 20 22
Hour (UTC)
Nu
mb
er
of
pa
rtic
les
(n
/cm
3) N (>2.5nm) BC
0
5000
10000
15000
20000
25000
30000
35000
40000
45000
50000
0 2 4 6 8 10 12 14 16 18 20 22
Hour (UTC)
Nu
mb
er
of
pa
rtic
les
(n
/cm
3)
0
2
4
6
8
10
12
Bla
ck
Ca
rbo
n (µ
g/m
3)
N (>7nm) BC
0
5000
10000
15000
20000
25000
30000
35000
40000
45000
50000
0 2 4 6 8 10 12 14 16 18 20 22
Hour (UTC)
Nu
mb
er
of
pa
rtic
les
(n
/cm
3)
0
1
2
3
4
5
6
Bla
ck
Ca
rbo
n (µ
g/m
3)
N (>7nm) BC
0 2 4 6 8 10 12 14 16 18 20 22Hour (UTC)
0.0
0.5
1.0
1.5
2.0
2.5
3.0
3.5
4.0
Bla
ck
Ca
rbo
n (µ
g/m
3)
N (>7nm) BC
0 2 4 6 8 10 12 14 16 18 20 22
Hour (UTC)
N (>7nm) BC
0
5000
10000
15000
20000
25000
30000
35000
40000
45000
50000
0 2 4 6 8 10 12 14 16 18 20 22
Hour (UTC)
Nu
mb
er
of
pa
rtic
les
(n
/cm
3) N (>5nm) BC
BCN LUG
BERN
NK
HU SCO
MR
THE PROBLEM OF PM

0
1
2
3
4
5
6
7
8
9
10
BCN MAD ACOR VAL STCT HUEL
NH
3 u
g/m
3
Winter Summer
NO3- (µg/m3) PM10
<11-22-33-4
4-5>5
EMEP
130 mNH3 (µgm-3)
130 m130 mNH3 (µgm-3)
URBAN NH3
Reche et al. (2013) Atmospheric Environment, submitted
THE PROBLEM OF PM

0.0
0.5
1.0
1.5
2.0
2.5
3.0
3.5
4.0
4.5
5.0
5.5
6.0
6.5
EC
(µg
/m3)
REMOTE RURAL SUB-URBAN INDUSTRIAL/RURAL INDUSTRIAL/URBAN URBAN TRAFFIC
0.0
0.5
1.0
1.5
2.0
2.5
3.0
3.5
4.0
4.5
5.0
5.5
6.0
6.5
OC
(µ
g/m
3)
OCEC
x 30 for EC x 5 for OC
OC & EC
Querol et al. (2013) Atmospheric Chemistry and Physics
THE PROBLEM OF PM

OC & EC
y = 3.43x0.356
R² = 0.83
0
1
2
3
4
5
6
0 1 2 3 4 5
OC
(µ
g/m
3)
EC (µg/m3)
y=3.43x0.356
R2=0.83
PM10PM2.5
Remote & Regional Back.Industrial-RuralIndustrial-UrbanUrban BackgroundTraffic
y = 3.72x0.493
R² = 0.45
0
5
10
15
20
0 1 2 3 4 5 6 7 8
OC
(µ
g/m
3)
EC (µg/m3)
Remote & Regional Back.Urban, traffic, industrial
Traffic sites Portugal
Biomass burning influenced sitefrom Portugal
Biomass burning influenced sitesFrom central Europe and Portugal
Urban background sites
with high traffic influence
y = 3.42x-0.644
R² = 0.94
0
5
10
15
20
25
0 1 2 3 4 5
OC
/E
C (
µg
/m
3)
EC (µg/m3)
PM10PM2.5
Remote & Regional Back.Industrial-RuralIndustrial-UrbanUrban BackgroundTraffic
y=3.42x-0.644
R2=0.94
y = 3.62x-0.498
R² = 0.79
0
5
10
15
20
0 20 40 60 80 100 120 140 160 180 200
OC
/ E
C (
µg
/m3)
EC (µg/m3)
y = 3.62x-0.507
R² = 0.76
0
5
10
15
20
0 1 2 3 4 5 6 7 8
OC
/ E
C (
µg
/m3)
EC (µg/m3)
y=3.62x-0.498
R2=0.79Traffic sites Portugal
Traffic tunnel Portugal
Biomass burning influenced sitesfrom central Europe and Portugal
Remote clean sitesSpain
Remote & Regional Back.Urban, traffic, industrial
Querol et al. (2013) Atmospheric Chemistry and Physics
THE PROBLEM OF PM

Eeftens et al. (2012) Atmospheric Environment
ESCAPE
THE IMPORTANCE OF THE COARSE FRACTION
THE PROBLEM OF PM

Mineral matter (µg/m3) PM10
J F M A M J J A S O N D
Seasonal trend
African contribution
Low re-suspension
Influence from Traffic
Influence from Traffic
<3
3-5
5-7
7-10
10-15
15-18
>18

Obras
Salida Puerto
Ronda de Dalt
Ronda Litoral
Plaça Cerdá
Meridiana
3-9 mg/m2
10-20 mg/m2
21-40 mg/m2
41-80 mg/m2
>81 mg/m2
Masa PM10
3-9 mg/m2
10-20 mg/m2
21-40 mg/m2
41-80 mg/m2
>81 mg/m2
Masa PM10
Av. Diagonal
Centre City C4
0.01
0.10
1.00
10.00
100.00
OC
EC
CO
3=
Al2
OC
a K Fe P S
SO
NO
3-
NH
4+
Ti V Cr
Mn
Co
Ni
Cu
Zn
As
R
b Sr
Zr
M
o
Cd
S
n
Sb
B
aP
b
Mas
s p
erce
nt
PhD F. Amato
ROAD DUST
THE PROBLEM OF PM

Obres
Sortida Port
Ronda de Dalt
Ronda Litoral
Plaça Cerdà
Meridiana
Sb ( µg/g PM10)
Sb (µg/ g PM 10)
0
20
40
60
80
100
120
140
1

Brake pads Tires
Ferodo (A) Bendix Road House Bosch Ferodo (B) Bridgeston Michelin
C tot 28 26 28 32 - 83 79 Al 0.4 2.3 0.8 0.9 1.0 0.06 0.06 Ca 0.4 1.8 3.6 1.7 0.3 1.31 0.46 K <0.1 0.4 <0.1 <0.1 <0.1 0.04 0.06 Na <0.1 1.0 0.1 0.1 <0.1 0.03 0.03 Mg 1.0 4.1 0.5 0.8 0.8 0.04 0.01 Fe 50 16 33 30 26 0.02 0.03 S 2.2 2.6 3.6 3.1 1.9 1.17 1.32
%
P <0.1 <0.1 0.1 <0.1 <0.1 <0.1 <0.1
Li 1.8 4.4 2.4 1.1 2.2 1.4 0.1 Sc 1 4 1 1 3 <0.1 <0.1 Ti 605 744 567 209 335 31 17 V 173 16 30 42 40 5 4 Cr 210 170 1270 49 2834 1 2 Mn 1783 1703 12636 1464 1827 3 3 Co 26 13 14 19 10 80 94 Ni 51 61 78 74 33 <0.1 <0.1 Cu 82.3 24493 270 13732 117551 4.8 6.9 Zn 66.6 4083 3462 1118 14862 19849 15073 Ga 9.8 5.7 4.1 3.1 6.2 <0.1 <0.1 Ge 2.8 1.4 1.2 0.8 4.1 <0.1 <0.1 As 4.0 5.0 4.6 42 8.4 0.8 0.7 Se 5.0 7.6 3.5 11.0 7.1 <0.1 <0.1 Rb 30.5 38.5 14.3 1.2 4.9 1.1 3.1 Sr 1007 857 818 1773 26 17.8 3.1 Y 0.9 15.5 6.5 1.2 16.4 <0.1 <0.1 Zr 4.4 1260 70.3 12.0 945 1.2 <0.1 Nb <0.1 <0.1 65.8 1.7 <0.1 <0.1 0.8 Mo 3.1 5.4 16 162 3093 0.4 0.6 Cd 0.5 1.6 0.6 1.9 23 2.7 1.5 Sn 2.4 31 40 147 10 2.5 2.1 Sb 2.1 1293 14.8 7.5 6944 11.5 2.0 Cs 1.0 1.7 0.7 <0.1 1 <0.1 <0.1 Ba 69343 67291 39013 37213 772 10.2 15.5 La 2.3 6.9 32.3 <0.1 5 1.8 3.5 Ce 4.2 14.9 50.7 2.1 11.5 0.5 0.6 Pr <0.1 1.2 4.0 <0.1 1.2 <0.1 <0.1 Nd 2.8 8.5 17.0 0.8 5.2 21.0 22.9 Hf <0.1 49.5 1.7 <0.1 36 <0.1 <0.1 Ta <0.1 <0.1 5.7 <0.1 <0.1 <0.1 0.9 W <0.1 <0.1 18.7 0.6 <0.1 <0.1 <0.1 Tl <0.1 <0.1 0.9 <0.1 <0.1 <0.1 <0.1 Pb 253 173 42.0 292 6.6 20.0 25.8 Bi <0.1 23.6 0.0 12.2 <0.1 <0.1 0.6 Th <0.1 4.1 4.1 <0.1 4 <0.1 <0.1
ppm
U <0.1 4.7 1.5 <0.1 4 <0.1 <0.1

SOURCES OF ROAD DUST
Amato et al., 2013 ATMENV
THE PROBLEM OF PM

ROAD DUST EMISSION FACTORS IN BARCELONA
0
50
100
150
200
250
300
350
400
0:00
1:00
2:00
3:00
4:00
5:00
6:00
7:00
8:00
9:00
10:0
0
11:0
0
12:0
0
13:0
0
14:0
0
15:0
0
16:0
0
17:0
0
18:0
0
19:0
0
20:0
0
21:0
0
22:0
0
23:0
0
VAL1 VAL2 COR
0
10
20
30
40
50
60
70
80
90
0:00
1:00
2:00
3:00
4:00
5:00
6:00
7:00
8:00
9:00
10:0
0
11:0
0
12:0
0
13:0
0
14:0
0
15:0
0
16:0
0
17:0
0
18:0
0
19:0
0
20:0
0
21:0
0
22:0
0
23:0
0
VAL1 VAL2 COR
0
50
100
150
200
250
300
350
400
0:00
1:00
2:00
3:00
4:00
5:00
6:00
7:00
8:00
9:00
10:0
0
11:0
0
12:0
0
13:0
0
14:0
0
15:0
0
16:0
0
17:0
0
18:0
0
19:0
0
20:0
0
21:0
0
22:0
0
23:0
0
VAL1 VAL2 COR
0
10
20
30
40
50
60
70
80
90
0:00
1:00
2:00
3:00
4:00
5:00
6:00
7:00
8:00
9:00
10:0
0
11:0
0
12:0
0
13:0
0
14:0
0
15:0
0
16:0
0
17:0
0
18:0
0
19:0
0
20:0
0
21:0
0
22:0
0
23:0
0
VAL1 VAL2 COR
µg/m
3µ
g/m
3
0
50
100
150
200
250
300
350
400
0:00
1:00
2:00
3:00
4:00
5:00
6:00
7:00
8:00
9:00
10:0
0
11:0
0
12:0
0
13:0
0
14:0
0
15:0
0
16:0
0
17:0
0
18:0
0
19:0
0
20:0
0
21:0
0
22:0
0
23:0
0
VAL1 VAL2 COR
0
10
20
30
40
50
60
70
80
90
0:00
1:00
2:00
3:00
4:00
5:00
6:00
7:00
8:00
9:00
10:0
0
11:0
0
12:0
0
13:0
0
14:0
0
15:0
0
16:0
0
17:0
0
18:0
0
19:0
0
20:0
0
21:0
0
22:0
0
23:0
0
VAL1 VAL2 COR
NOx
PM10
0
50
100
150
200
250
300
350
400
0:00
1:00
2:00
3:00
4:00
5:00
6:00
7:00
8:00
9:00
10:0
0
11:0
0
12:0
0
13:0
0
14:0
0
15:0
0
16:0
0
17:0
0
18:0
0
19:0
0
20:0
0
21:0
0
22:0
0
23:0
0
VAL1 VAL2 COR
0
10
20
30
40
50
60
70
80
90
0:00
1:00
2:00
3:00
4:00
5:00
6:00
7:00
8:00
9:00
10:0
0
11:0
0
12:0
0
13:0
0
14:0
0
15:0
0
16:0
0
17:0
0
18:0
0
19:0
0
20:0
0
21:0
0
22:0
0
23:0
0
VAL1 VAL2 COR
0
50
100
150
200
250
300
350
400
0:00
1:00
2:00
3:00
4:00
5:00
6:00
7:00
8:00
9:00
10:0
0
11:0
0
12:0
0
13:0
0
14:0
0
15:0
0
16:0
0
17:0
0
18:0
0
19:0
0
20:0
0
21:0
0
22:0
0
23:0
0
VAL1 VAL2 COR
0
10
20
30
40
50
60
70
80
90
0:00
1:00
2:00
3:00
4:00
5:00
6:00
7:00
8:00
9:00
10:0
0
11:0
0
12:0
0
13:0
0
14:0
0
15:0
0
16:0
0
17:0
0
18:0
0
19:0
0
20:0
0
21:0
0
22:0
0
23:0
0
VAL1 VAL2 COR
µg/m
3µ
g/m
3
0
50
100
150
200
250
300
350
400
0:00
1:00
2:00
3:00
4:00
5:00
6:00
7:00
8:00
9:00
10:0
0
11:0
0
12:0
0
13:0
0
14:0
0
15:0
0
16:0
0
17:0
0
18:0
0
19:0
0
20:0
0
21:0
0
22:0
0
23:0
0
VAL1 VAL2 COR
0
10
20
30
40
50
60
70
80
90
0:00
1:00
2:00
3:00
4:00
5:00
6:00
7:00
8:00
9:00
10:0
0
11:0
0
12:0
0
13:0
0
14:0
0
15:0
0
16:0
0
17:0
0
18:0
0
19:0
0
20:0
0
21:0
0
22:0
0
23:0
0
VAL1 VAL2 COR
NOx
PM10
DUST LOAD
<10µm
(mg m-2)
* Amato et al., (2009) ATM ENV
** Amato et al., (2010) STOTEN
***Bukowiecki et al. (2010) ATM ENV
EMISSION RATE
mixed fleet
(mg veh-1 km-1)
Barcelona
Zürich
82**
27***
8.9*
0.7
THE PROBLEM OF PM
Amato et al. STOTEN, 2010

EFFECT OF ROAD MOISTURE
Barcelona
Utrecht
1a
1b
2a
2b
3a
3b
4a
4b
5a
5b
6a
6b
7a
7b
..a
..b
0,000
0,001
0,002
0,003
0,004
0,005
0,006
0,007
0,008
0 50 100 150 200 250 300
t (hours after rain)
Du
st
load
ing
s (
g m
-2)
Barcelona
Utrecht
0,000
0,001
0,002
0,003
0,004
0,005
0,006
0,007
0,008
0 50 100 150 200 250 300
t (hours after rain)D
ust
load
ing
s (
g m
-2)
Barcelona
Utrecht
0,000
0,200
0,400
0,600
0,800
1,000
1,200
0 50 100 150 200 250 300
t (hours after rain)
No
rma
lize
d d
us
t lo
ad
ing
s (
g m
-2)
Barcelona
Utrecht)1(max
tr
t eEFEF
Amato et al., 2013 ATMENV
THE PROBLEM OF PM

Vehicle Exhaust;
4.4; 30%
Nitrate; 2.8; 19%
Road dust; 0.3; 2%Heavy oil; 0.6; 4%
Industrial; 0.5; 3%
Sulfate; 5.6; 38%
Mineral; 0.2; 1%
Sea salt; 0.2; 1%
African dust; 0.3;
2%
Vehicle Exhaust;
6.6; 25%
Nitrate; 4.0; 16%
Road dust; 2.9;
11%Heavy oil; 0.8; 3%
Industrial; 0.9; 3%
Sulfate; 7.0; 28%
Mineral; 1.9; 7%
Sea salt; 1.0; 4%
African dust; 0.9;
3%Vehicle Exhaust;
7.5; 18%
Nitrate; 4.5; 11%
Road dust; 8.8;
22%Heavy oil; 1.0; 2%Industrial; 1.0; 2%
Sulfate; 6.7; 17%
Mineral; 5.6; 14%
Sea salt; 4.1; 10%
African dust; 1.5;
4%
PM10 PM2.5
PM1
ROAD DUST CONTRIBUTIONS, BARCELONA (2003-2010)
Road traffic 48% Road traffic 49%
Road traffic 46%
Shipping 2% Shipping 3%
Shipping 4%
Non road
resuspension 14%
Non road
resuspension 4%
Non road
resuspension 1%
THE PROBLEM OF PM

ROAD DUST CONTRIBUTIONS, ANDALUCÍA (2003-2010)
THE PROBLEM OF PM
RB
RB
TR
TR
TR

Motor exhaust Road dust
Trend of source contributions (Algeciras Bay 2005-2010)
Amato et al., in prep.
THE PROBLEM OF PM
ROAD DUST CONTRIBUTIONS, ANDALUCÍA (2003-2010)

Glories
0
10
20
30
40
50
60
015
3045
60
75
90
105
120
135
150
165
180195210225
240
255
270
285
300
315
330345
% frecuencia viento
STREET WASHING
THE PROBLEM OF PM

Daily mean reduction
At the cleaning site: - 8.8 µg m-3
At the reference sites: - 3.7-4.9 µg m-3
StC-induced reduction: - 4-5 µg m-3 (7-10%)
EFFECT OF WASHING ON PM10
Monitoring site StC days
(µg m-3)
no-StC days
(µg m-3)
Kerbside Cleaning site 44.4 53.2
Kerbside Reference site 50.3 54.0
Urban background Reference site 38.9 43.8
Urban background Reference site 38.6 42.3
Urban background Reference site 42.2 44.3
Urban background Reference site 38.1 38.2
Reference sites
- 3-5 µg m-3
0
10
20
30
40
50
60
70
80
90
0 1 2 3 4 5 6 7 8 9
10
11
12
13
14
15
16
17
18
19
20
21
22
23
Local time
PM
10 (
µg
m-3
)
no-StC days StC days
Cleaning site
- 8.8 µg m-3
10
20
30
40
50
60
70
80
90
0 1 2 3 4 5 6 7 8 9
10
11
12
13
14
15
16
17
18
19
20
21
22
23
Local time
PM
10 (
µg
m-3
)
no-StC days StC days
THE PROBLEM OF PM

0
30
60
90
7.4.08
8.4.08
9.4.08
10.4.0
8
11.4.0
8
12.4.0
8
13.4.0
8
14.4.0
8
15.4.0
8
16.4.0
8
17.4.0
8
18.4.0
8
19.4.0
8
20.4.0
8
21.4.0
8
22.4.0
8
23.4.0
8
24.4.0
8
25.4.0
8
26.4.0
8
27.4.0
8
28.4.0
8
29.4.0
8
30.4.0
8
1.5.08
2.5.08
3.5.08
4.5.08
Ti
(ng
/m3)
0
4
8
12
16
Pre
p.(
mm
)
Street cleaning Precipitation Downwind site Upwind site
Mineral dust
0
10
20
30
7.4.08
8.4.08
9.4.08
10.4.0
8
11.4.0
8
12.4.0
8
13.4.0
8
14.4.0
8
15.4.0
8
16.4.0
8
17.4.0
8
18.4.0
8
19.4.0
8
20.4.0
8
21.4.0
8
22.4.0
8
23.4.0
8
24.4.0
8
25.4.0
8
26.4.0
8
27.4.0
8
28.4.0
8
29.4.0
8
30.4.0
8
1.5.08
2.5.08
3.5.08
4.5.08
Sb
(n
g/m
3)
0
4
8
12
16
Pre
p.(
mm
)
Street cleaning Precipitation Downwind site Upwind site
Brake dust
010
2030
405060
7080
90100
7.4.08
8.4.08
9.4.08
10.4.0
8
11.4.0
8
12.4.0
8
13.4.0
8
14.4.0
8
15.4.0
8
16.4.0
8
17.4.0
8
18.4.0
8
19.4.0
8
20.4.0
8
21.4.0
8
22.4.0
8
23.4.0
8
24.4.0
8
25.4.0
8
26.4.0
8
27.4.0
8
28.4.0
8
29.4.0
8
30.4.0
8
1.5.08
2.5.08
3.5.08
4.5.08
V (
ng
/m3)
0
4
8
12
16
Pre
p.(
mm
)
Street cleaning Precipitation Downwind site Upwind site
Fuel oil comb.
0
10
20
7.4.08
8.4.08
9.4.08
10.4.0
8
11.4.0
8
12.4.0
8
13.4.0
8
14.4.0
8
15.4.0
8
16.4.0
8
17.4.0
8
18.4.0
8
19.4.0
8
20.4.0
8
21.4.0
8
22.4.0
8
23.4.0
8
24.4.0
8
25.4.0
8
26.4.0
8
27.4.0
8
28.4.0
8
29.4.0
8
30.4.0
8
1.5.08
2.5.08
3.5.08
4.5.08
EC
(µ
g/m
3)
0
4
8
12
16
Pre
p.(
mm
)
Street cleaning Precipitation Downwind site Upwind site
EC
0
5
10
7.4.08
8.4.08
9.4.08
10.4.0
8
11.4.0
8
12.4.0
8
13.4.0
8
14.4.0
8
15.4.0
8
16.4.0
8
17.4.0
8
18.4.0
8
19.4.0
8
20.4.0
8
21.4.0
8
22.4.0
8
23.4.0
8
24.4.0
8
25.4.0
8
26.4.0
8
27.4.0
8
28.4.0
8
29.4.0
8
30.4.0
8
1.5.08
2.5.08
3.5.08
4.5.08
Cl- (
µg
/m3)
0
4
8
12
16P
rep
.(m
m)
Street cleaning Precipitation Downwind site Upwind site
Sea salt
0
2
4
6
8
10
12
7.4.08
8.4.08
9.4.08
10.4.0
8
11.4.0
8
12.4.0
8
13.4.0
8
14.4.0
8
15.4.0
8
16.4.0
8
17.4.0
8
18.4.0
8
19.4.0
8
20.4.0
8
21.4.0
8
22.4.0
8
23.4.0
8
24.4.0
8
25.4.0
8
26.4.0
8
27.4.0
8
28.4.0
8
29.4.0
8
30.4.0
8
1.5.08
2.5.08
3.5.08
4.5.08
NO
3- (
µg
/m3)
0
4
8
12
16
Pre
p.(
mm
)
Street cleaning Precipitation Downwind site Upwind site
Nitrate
Amato et al., Atm. Env. 2009
Cleaning site Control site Cleaning site Control site
THE PROBLEM OF PM
EFFECT OF WASHING ON AEROSOL TYPES

EFFECTIVENESS OF CMA AND MGCL2 IN BARCELONA
• Four kerbside monitoring vans, one background monitoring station
• CMA and MgCl2 applications at 6 am (dosages 10-15 g m-2 )
• Friction tests
• Conductivity tests
THE PROBLEM OF PM

MODELING CONTRIBUTION FROM ROAD DUST EMISSIONS
• Yearly average 2010
in Barcelona
(URBIS model)
Amato et al., in prep
THE PROBLEM OF PM
PM10
Road dust

SPATIAL VALIDATION
With resuspension
R2 = 0.6432
0
10
20
30
40
50
0 10 20 30 40 50
Observed PM10
Mo
de
lled
PM
10
Kerbside
Background
Without resuspension
R2 = 0.5751
0
10
20
30
40
50
0 10 20 30 40 50
Observed PM10M
od
elle
d P
M1
0
Kerbside
Background
THE PROBLEM OF PM

TEMPORAL VALIDATION (1-HOUR) VS COARSE PM INCREMENT
THE PROBLEM OF PM

• Levels if air pollutants in 39 schools
• 2 weeks measurements at each school
• Indoor and outdoor simultaneoulsy
• A UB reference site
Reference Station
NO2 (µg·m3)
< 40
40 – 60 > 60
EC (µg·m3)
< 1.5 1.5 – 2.3
> 2.3
PM2.5 (µg·m3)
< 35 35 – 60
> 60
N (103 pt·cm3)
< 17 17 - 27
> 27
BREATHE Schools EC levels perimeter
Low High
URBAN BACKGROUND OR TRAFFIC EXPOSURE?

INDOOR OUTDOOR REFERENCE STATION
Mean SD Mean SD Mean SD
NO2
(µg·m-3) 32 13 50 19 42 20
PM2.5 (µg·m-3) 52 16 43 24 19 8
N (pt·cm-3)
17371 6673 22972 9514 16081 6034
BC (µg·m-3) 2.4 0.9 2.5 1.1 1.7 0.8
Levels
NO2 outdoor levels for the rest of schools in Barcelona = 50 µg·m-3
• Very high levels of PM2.5 in schools Local focus of PM2.5
• Pollutants levels found at schools more similar to traffic sites than
to urban background
URBAN BACKGROUND OR TRAFFIC EXPOSURE?

Conclusions
1. Air Quality has markedly improved in the last decade concerning PM
2. The concentration of ultrafine particles in our cities is greatly affected by the
photochemical processes from the center of Europe, not only by primary traffic emissions
3. Urban NH3 may contribute to increase difficulty of abating PM2.5 in some cities. It is
important to control these emissions
4. Except in specific areas, in Spain residential biomass burning does not contribute to
increase levels of PM and PAHs in a large proportion as it occurs in central Europe
5. Road dust contributes 20-35% to urban PM10 in Spain, causing high number of
exceedances
6. Road dust emission potential in Spain is governed by mineral particles (road wear, soil,
works) and meteorology
7. Road washing showed decrease at kerbside up to 7-10% of daily PM10
8. First results on CMA and MgCl2 in Mediterranean cities will be available soon (AIRUSE)
9. The population of our cities (with reference to the schools) is subject to pollutant exposure
levels intermediate between stations traffic and urban background

Thanks for your attention!
BDEBATE, MAGRAMA-LIFE+AIRUSE-BREATHE-ERC Ministerio de Economía y Competitividad del Gobierno de España
Departamentos Calidad del Aire: Generalitat de Catalunya, Andalucía, Aragón, Asturias, Baleares, Canarias, Cantabria, Castilla la Mancha, Castilla León, Euskadi, Extremadura, Galicia, Generalitat Valenciana, Madrid, Melilla, Murcia, Ayuntamientos de Madrid y Barcelona
ACKNOWLEDGEMENTS

Motor exhaust Other mineral
Trend of source contributions (Córdoba 2007-2010)
Amato et al., in prep.
Road dust
THE PROBLEM OF PM
ROAD DUST CONTRIBUTIONS, ANDALUCÍA (2003-2010)

Querol et al. (2012) Atmospheric Chemistry and Physics
Exposure during commuting
Car Bus Pedestrian Motorbike Cycle Taxi Metro Mexico PM2.5
1 -- 70 -- -- -- -- 61
PM2.52 -- 51 -- -- -- -- 33
Houston PM3.5
3 35 -- -- -- -- -- --
New York PM2.5
4 -- -- -- -- -- -- 62
London PM2.5
5 -- -- -- -- -- 33 246
London PM2.5
6 36 39 -- -- 30 -- 202
Southampton, UK PM3.5
7 -- -- -- -- 135 -- --
Manchester, UK PM4
8, 9 42 338 -- -- 54 -- --
Belgian cities PM10
10 35-75 -- -- -- 42-78 -- --
Dublin PM2.5
11 83 128 63 -- 88 -- --
Florence PM2.5
12 -- 33-75 -- -- -- 20-70 --
Munich PM10
13 -- 137 -- -- -- -- --
Taipei PM10
14 42 70 -- 113 -- -- 65
PM2.514
22 39 -- 68 -- -- 35 PM1
14 16 31 -- 48 -- -- 26
Hong Kong PM10
15 -- 97 -- -- -- 58 50
PM2.515
-- 71 -- -- -- -- 33 Guanzhou PM10
16 -- 156 -- -- -- 104 67
PM2.516
-- 123 -- -- -- 89 44 Barcelona Mean PM10 -- -- -- -- -- -- 83 PM2.5 -- -- -- -- -- -- 27 PM1 -- -- -- -- -- -- 25 Barcelona L9 PM10 -- -- -- -- -- -- 60 PM2.5 -- -- -- -- -- -- 19 PM1 -- -- -- -- -- -- 16
0
100
200
300
400
500
600
700
05/07
6:00
06/07
6:00
07/07
6:00
08/07
6:00
09/07
6:00
10/07
6:00
11/07
6:00
12/07
6:00
13/07
6:00
14/07
6:00
15/07
6:00
16/07
6:00
17/07
6:00
18/07
6:00
19/07
6:00
20/07
6:00
21/07
6:00
22/07
6:00
23/07
6:00
24/07
6:00
25/07
6:00
PM
x (
µg
/m3)
PM10 PM2.5 PM1
SAGRERA STATION (L9) 05-25 July 2011

10
0
30
20
50
40
60
Fondo
rural
Fondo
urbano
Fondo
industrial
Hotspot
tráfico/
industrial
PM
10
µg/m
3
10
0
20
40
30
Fondo
rural
Fondo
urbano
Fondo
industrial
Hotspot
tráfico/
industrial
PM
2.5
µg/m
3
PM10PM2.5
Fondo
suburbano
Fondo
suburbano
10
0
30
20
50
40
60
Fondo
rural
Fondo
urbano
Fondo
industrial
Hotspot
tráfico/
industrial
PM
10
µg/m
3
10
0
20
40
30
Fondo
rural
Fondo
urbano
Fondo
industrial
Hotspot
tráfico/
industrial
PM
2.5
µg/m
3
PM10PM2.5
Fondo
suburbano
Fondo
suburbano
1999-2007 2009-2010 1999-2007 2009-2010
THE PROBLEM OF PM

0
1
2
3
4
5
6
Ba
rce
lon
a
Ma
dri
d
Va
lèn
cia
Am
ste
rda
m
Be
lgra
de
Be
rlin
Be
rn
Bo
log
na
Bu
da
pe
st
Sto
ckh
olm
Fire
nze
Fra
nk
furt
Ge
no
a
Ha
mb
urg
He
lsin
ki
Lon
do
n2
00
7
Luxe
mb
urg
Mil
an
Mu
nic
h
Na
po
li
Osl
o
Pra
ha
Ro
ma
To
rin
o
Wie
n
Zu
rich
Cars x 1000 / km2
Alta densidad de vehículos (#/km2),
Además >50% de los vehículos circulantes en la ciudad don externoa a la misma
0
500
1000
1500
2000
2500
3000
Ba
rce
lon
a
Ma
dri
d
Va
lèn
cia
Am
ste
rda
mB
elg
rad
e
Be
rlin
Be
rnB
olo
gn
a
Bu
da
pe
st
Sto
ckh
olm
Fire
nze
Fra
nk
furt
Ge
no
a
Ha
mb
urg
He
lsin
ki
Lon
do
n2
00
7
Luxe
mb
urg
Mil
an
Mu
nic
h
Na
po
li
Osl
o
Pra
ha
Ro
ma
To
rin
o
Wie
n
Zu
rich
Cars x1000
THE PROBLEM OF NO2

Ámsterdam
Madrid
Barcelona
500m
Napoli
THE PROBLEM OF NO2

Reche et al. (2013) Atmospheric Environment, submitted
URBAN NH3
THE PROBLEM OF PM
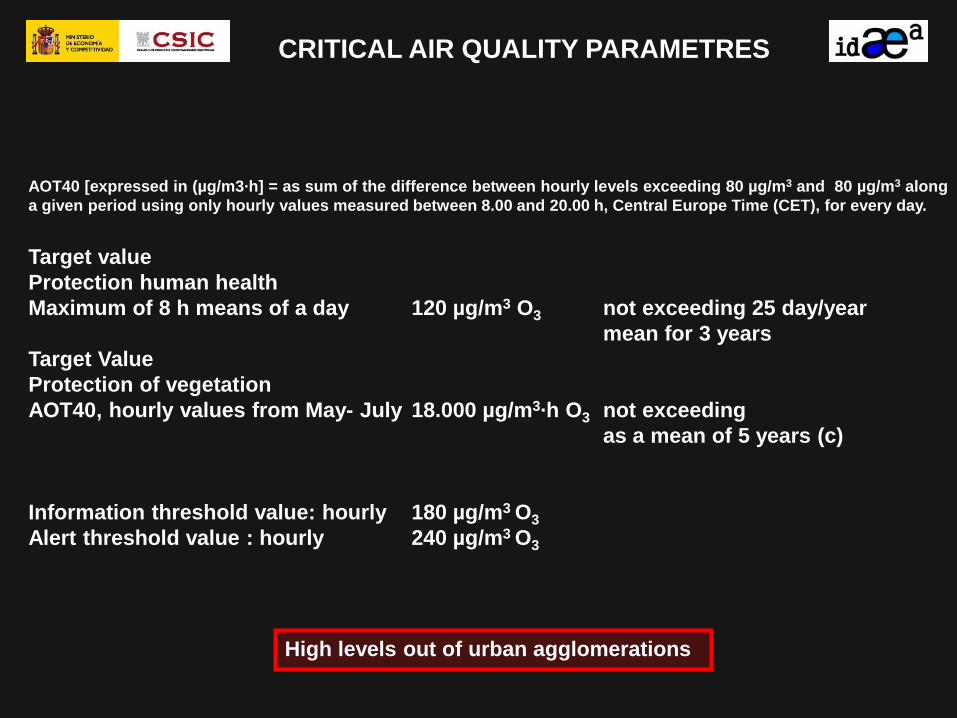
AOT40 [expressed in (µg/m3·h] = as sum of the difference between hourly levels exceeding 80 µg/m3 and 80 µg/m3 along
a given period using only hourly values measured between 8.00 and 20.00 h, Central Europe Time (CET), for every day.
Target value
Protection human health
Maximum of 8 h means of a day 120 µg/m3 O3 not exceeding 25 day/year
mean for 3 years
Target Value
Protection of vegetation
AOT40, hourly values from May- July 18.000 µg/m3·h O3 not exceeding
as a mean of 5 years (c)
Information threshold value: hourly 180 µg/m3 O3
Alert threshold value : hourly 240 µg/m3 O3
High levels out of urban agglomerations
CRITICAL AIR QUALITY PARAMETRES