UK Cystic Fibrosis Registry
56
UK Cystic Fibrosis Registry Annual Data Report 2017 Scotland
Transcript of UK Cystic Fibrosis Registry

UK Cystic Fibrosis RegistryAnnual Data Report 2017
Scotland


3cysticfibrosis.org.uk
UK Cystic Fibrosis Registry 2017 Annual Data Report - Scotland
Report prepared by
With assistance from
The UK Cystic Fibrosis Registry Steering Committee
AcknowledgementsFirst and foremost, the UK Cystic Fibrosis Registry team would like to thank people with cystic fibrosis and their
families for their support, as well as anyone who has generously donated to the Cystic Fibrosis Trust. We would
also like to express our gratitude to the UK cystic fibrosis centres and clinics for their continued dedication to
obtaining consent and submitting data to the Registry.
Contact informationFor more information about this report, or the UK Cystic Fibrosis Registry, please contact us:
@CFTrust
The content of this report may not be used or reproduced in publications without permission
of the Cystic Fibrosis Trust.
Chloe Ainsley Lead Graphic Designer Cystic Fibrosis Trust
Elaine Gunn Registry Data Manager Cystic Fibrosis Trust
Kieran Earlam Registry Administrator Cystic Fibrosis Trust
Andrew Lee Statistician Cystic Fibrosis Trust
Susan Charman Senior Statistician Cystic Fibrosis Trust
Rebecca Cosgriff Director of Data & Quality Improvement Cystic Fibrosis Trust

4 UK Cystic Fibrosis Registry 2017 Annual Data Report - Scotland
Contents Report prepared by 3
Acknowledgements 3
Contact information 3
Introduction 6
Cystic fibrosis 6
UK Cystic Fibrosis Registry 6
Governance 7
Data collection 7
Where can I find more information? 7
Section 1: Scotland-wide analysis 8
1.1 Summary of the UK Cystic Fibrosis Registry 8
1.2 Age distribution by gender 9
1.3 Height percentiles of children and young people (<20 years) 10
1.4 Weight percentiles of children and young people (<20 years) 11
1.5 Body Mass Index (BMI) percentiles in children and young people (<20 years) 12
1.6 Body Mass Index (BMI) in adults (>20 years) 13
1.7 Education and employment in adults (>16 years) 14
1.8 Pregnancy 14
Diagnosis of cystic fibrosis 15
1.9 Age at diagnosis and screening in children under 16 in 2017 15
1.10 Age at diagnosis and screening in adults aged 16 and over in 2017 16
1.11 Mode of presentation 17
Lung health 18
1.12 FEV1% predicted (GLI equations) in patients aged six years and older who have not had 19
a lung transplant
1.13 Best FEV1% predicted (GLI equations) in patients aged six years and older who 20
have not had a lung transplant
1.14 FEV1% predicted (GLI equations) and BMI in people 20 years and older who have 21
not had a lung transplant
Lung infections 22
1.15 Lung infections in 2017 22
1.16 Lung infections in 2017 23
1.17 Nontuberculous mycobacteria (NTM) or atypical mycobacteria 25
1.18 Lung infections over time 25
Complications 27
1.19 Prevalence of complications 27

5cysticfibrosis.org.uk
1.20 Incidence of complications 28
1.21 CF-related diabetes 28
Antibiotics 29
1.22 Intravenous (IV) antibiotics 29
1.23 Inhaled antibiotic use among patients with chronic Pseudomonas aeruginosa 30
1.24 Long-term azithromycin use 30
1.25 Prophylactic flucloxacillin use 31
Muco-active therapies 32
1.26 Mannitol 32
1.27 DNase 32
1.28 Hypertonic saline 33
1.29 Burden of treatment 33
Other Therapies 34
1.30 CFTR modifiers 34
1.31 Oxygen and non-invasive ventilation 34
1.32 Physiotherapy 35
1.33 Feeding 35
1.34 Transplants 35
Genotypes 36
1.35 Genotypes in the UK population 36
Section 2: Centre-level analysis 38
A guide to the charts 39
Box plots 39
Section 2a: Paediatric centre analysis 40
2.1 Median FEV1% predicted among patients aged 6 years and older by paediatric centre/clinic 40
2.2 Median BMI percentile among patients aged 2–15 years by paediatric centre/clinic 40
2.3 Data completeness by paediatric centre/clinic 41
2.4 Proportion of patients with chronic P. aeruginosa by paediatric centre/clinic 41
2.5 Proportion of patients receiving DNase treatment by paediatric centre/clinic 42
2.6 Proportion of patients receiving hypertonic saline by paediatric centre/clinic 42
Section 2b: Adult centre analysis 43
2.7 Median age (years) by adult service 43
2.8 Median FEV1% predicted by adult service (without a history of lung transplant) 43
2.9 Median BMI among patients aged 16 years and older by adult service 44
2.10 Proportion of patients with chronic P. aeruginosa by adult service 44
2.11 Inhaled antibiotic use for patients with chronic P. aeruginosa 45
2.12 Data completeness by adult service 45
2.13 Proportion of patients receiving DNase treatment by adult service 46
2.14 Proportion of patients receiving hypertonic saline treatment by adult service 46
Appendices 47
Appendix 1: Centre-level data tables 48
Paediatric centres/clinics providing data in 2017 48
Adult centres/clinics providing data in 2017 48
Glossary 52
Appendix 2: UK Cystic Fibrosis Registry Steering Committee Structure 54

6 UK Cystic Fibrosis Registry 2017 Annual Data Report - Scotland
Introduction
This report is aimed at anyone who is interested in the health, care, and outcomes of people with cystic fibrosis (CF) in the UK. This includes people with CF, their families and clinical teams, healthcare managers, commissioners, and policy makers.
You can find a glossary of scientific and clinical terms on page 53.
Cystic fibrosis
Cystic fibrosis is an inherited disease caused by a faulty gene known as ‘CFTR’. The gene and the protein it makes help control the movement of salt and water in and out of cells. When the gene is faulty, it can cause thicker mucus. One of the main areas affected is the lungs; over time this thick mucus blocks and damages airways, leading to infections and making it hard to breathe. People with CF may develop other problems, such as liver disease or CF-related diabetes (CFRD). Around 85% of people with CF also have difficulty digesting food effectively.
UK Cystic Fibrosis Registry The UK CF Registry has been sponsored and hosted by the Cystic Fibrosis Trust since 2007. It is a database of consenting people with CF in the UK. The Registry collects demographic, treatment and health outcomes data. You can find a full list of the data items we collect at www.cysticfibrosis.org.uk/registry.
The purpose of the UK CF Registry is to improve the health of people with cystic fibrosis. This is done in a number of ways:
Helping people with CF and their families understand CF, and make informed decisions.
Providing data for research to find out the best ways of treating and beating cystic fibrosis.
Giving clinical teams the evidence they need to improve the quality of care.
Helping commissioners provide funding to NHS CF centres that is proportionate to their patients’ disease severity.
Monitoring the safety and effectiveness of new treatments for cystic fibrosis.

7cysticfibrosis.org.uk
Governance
The Registry Steering Committee (RSC) is responsible for making sure that the UK CF Registry is compliant with data protection legislation, and its Research Ethics Committee-approved Study Protocol. It also makes recommendations about the future development of the Registry. A sub-committee of the RSC, the Registry Research Committee, assesses applications for data and guides the Registry research strategy.
Please see Appendix 1: UK CF Registry Committee Structure.
Data are only recorded on the UK CF Registry if explicit written consent is given by the person with CF or, for a child, their parent or guardian.
When data are provided to third parties such as the NHS or university researchers, they are either anonymised (all identifiable data removed completely) or pseudonymised (all identifiable data replaced with a unique identification number). Pseudonymisation is used so that data can be traced back to what is in the ‘live’ database by the Registry team for the purposes of updating the data or answering queries. This means that the Registry data used for research, and the results that come from it, cannot identify the people whose data are stored on the UK CF Registry.
If requests from pharmaceutical companies are granted, for research or submissions to regulators or the NHS, the data are analysed and aggregated by Registry statisticians and only summary data are provided.
Data collection
Data are entered onto the UK CF Registry by NHS employees at CF centres in the UK using a secure web portal.
Where can I find more information?
You can find out more about CF, and the UK CF Registry, at www.cysticfibrosis.org.uk/registry.i

8 UK Cystic Fibrosis Registry 2017 Annual Data Report - Scotland
Section 1: UK-wide analysisThis section provides an overview of the cystic fibrosis (CF) population, health outcomes, and care in the United Kingdom, including CF centres in England, Northern Ireland, Scotland, and Wales.
1.1 Summary of the UK Cystic Fibrosis Registry
2017UK Scotland
CF patients registered1 10,469 923
Excluding diagnoses that year 10,255 915
CF patients with an annual review; n(%)2 9,887 (96%) 858 (93%)
Age in years; median3 20 20
All newly diagnosed patients (newborn screening and other)4 214 8
Number of patients born identified by newborn screening4 172 7
Age at diagnosis in months; median3 2 3
Adults aged 16 years and over; %3 60.6 61.4
Males; %3 53.3 54.2
Genotyped; %3
(both mutations identified) 98.4 99.4
Total deaths reported (%)5 132 (1.3%) 19 (2.1%)
Age at death in years; median (95% CI)5 31 (29, 35) 32 (27, 35)
Notes:1 Number of patients diagnosed with CF, seen in the past two years, and alive at 1 January in the given year. This number reduced in 2016 as a result of a data cleaning exercise. We followed up on patients who were registered but did not have data submitted in 2016. If they were no longer being cared for within the NHS (eg they had moved abroad), they were marked as ‘inactive’ and excluded from this number.
2 As patients newly diagnosed in a given year may not have their first annual review in the same year, the proportion with an annual review is calculated from the total registered excluding those diagnosed in the given year.
3 Calculated from patients with an annual review in the given year (see footnote 2 above).4 Calculated from all patients registered on the database. Some diagnosis data are added after the data entry closure each year, so figures from previous years have been updated for this report.
5 Calculated from all registered patients who died in the given year.
Annual review: A Registry Annual Review form contains a combination of data relating to a person with CF’s once yearly ‘annual review’ appointment at their CF centre, and their clinical care and health over the past 12 months.

9cysticfibrosis.org.uk
1.2 Age distribution by genderN=858The following chart shows the mix of ages and genders in the CF population in Scotland.
0
2
4
6
8
10
12
14
0–3 4–7 8–11 12–15 16–19 20–23 24–27 28–31 32–35 36–39 40–43 44–47 48–51 52–55 56–59 60+
Pro
po
rtio
n (%
)
Age (years)
Overall
Females
Males
Age All; n (%) Females; n (%) Males; n (%)
0-3 60 (7.0) 28 (7.1) 32 (6.9)
4-7 85 (9.9) 36 (9.2) 49 (10.5)
8-11 97 (11.3) 49 (12.5) 48 (10.3)
12-15 78 (9.1) 35 (8.9) 43 (9.2)
16-19 66 (7.7) 34 (8.7) 32 (6.9)
20-23 100 (11.7) 48 (12.2) 52 (11.2)
24-27 88 (10.3) 41 (10.4) 47 (10.1)
28-31 65 (7.6) 31 (7.9) 34 (7.3)
32-35 64 (7.5) 27 (6.9) 37 (8.0)
36-39 45 (5.2) 16 (4.1) 29 (6.2)
40-43 27 (3.1) 12 (3.1) 15 (3.2)
44-47 20 (2.3) 8 (2.0) 12 (2.6)
48-51 22 (2.6) 9 (2.3) 13 (2.8)
52-55 23 (2.7) 10 (2.5) 13 (2.8)
56-59 5 (0.6) <5 <5
60+ 13 (1.5) 7 (1.8) 6 (1.3)
<16 320 (37.3) 148 (37.7) 172 (37.0)
≥16 538 (62.7) 245 (62.3) 293 (63.0)
<18 348 (40.6) 166 (42.2) 182 (39.1)
≥18 510 (59.4) 227 (57.8) 283 (60.9)
Overall 858 - -

10 UK Cystic Fibrosis Registry 2017 Annual Data Report - Scotland
Overall Female Male
Age n Median IQR n Median IQR n Median IQR1 17 45.2 29.0-60.1 7 51.3 25.7-62.8 10 43.1 29.0-60.1
2 18 35.2 20.3-64.5 9 20.3 10.9-51.5 9 43.6 31.7-82.6
3 17 55.6 31.8-72.6 7 35.0 22.2-56.0 10 62.7 38.1-76.1
4 14 30.3 15.2-62.5 7 18.5 15.2-69.1 7 39.5 6.8-62.5
5 23 53.8 17.7-70.7 12 56.1 30.2-70.9 11 53.8 10.7-70.6
6 30 36.8 19.3-53.1 12 32.8 18.8-43.4 18 38.8 19.3-61.0
7 18 39.0 16.3-57.6 5 57.1 38.8-74.4 13 31.3 6.8-53.9
8 31 32.3 11.4-58.5 19 26.1 12.1-50.2 12 50.3 8.4-77.1
9 15 46.7 21.4-68.6 6 56.8 22.1-68.6 9 42.8 18.7-63.0
10 17 60.8 9.3-73.6 7 61.5 5.9-83.0 10 60.0 31.1-73.6
11 34 54.1 20.0-79.3 17 66.2 19.1-79.3 17 53.2 35.5-79.2
12 21 65.4 36.5-78.3 9 54.7 21.2-80.7 12 68.7 45.8-77.9
13 26 55.8 17.5-75.7 13 54.0 13.4-75.7 13 57.5 25.5-70.5
14 18 61.3 39.9-81.3 6 52.7 8.8-72.7 12 61.3 42.0-81.9
15 13 48.8 14.9-62.1 7 48.8 14.9-91.1 6 38.3 13.4-62.1
16 14 23.0 11.2-60.9 ≥5 14.6 11.2-60.9 <5 - -
17 14 51.5 28.1-69.8 7 46.2 27.7-69.8 7 65.0 49.8-76.7
18 20 39.0 16.7-82.1 9 27.4 17.8-59.0 11 60.7 15.6-83.6
19 18 29.2 13.6-48.3 7 13.6 13.6-71.1 11 31.6 18.2-48.3
Overall 378* 45.7 17.8-70.6 - 38.8 14.9-68.6 - 49.8 25.6-73.6
Overall Females Males
0
10
20
30
40
50
60
70
80
Med
ian
heig
ht p
erce
ntile
Age (years)
1 2 3 4 5 6 7 8 9 10 11 12 13 14 15 16 17 18 19
1.3 Height percentiles of children and young people (<20 years)6
N=386
The following chart and table show the height percentiles of people with CF, aged 19 and under,in relation to UK growth data for the general population. If a person with CF is on the 40th percentile, only 40% of people the same age are their height or shorter; 60% are taller.
*Number with non-missing data6 Based on UK-WHO growth charts, 1990 (updated 1996)

11cysticfibrosis.org.uk
Overall Female Male
Age n Median IQR n Median IQR n Median IQR1 17 47.6 21.9-61.6 7 50.6 14.3-56.5 10 40.3 21.9-65.5
2 19 52.6 24.0-84.9 10 46.5 17.0-52.6 9 65.2 60.2-84.9
3 17 55.3 39.5-67.6 7 53.0 30.0-59.2 10 59.9 39.5-68.7
4 14 44.0 20.6-63.8 7 36.9 6.2-63.8 7 52.4 20.6-74.6
5 23 59.6 18.9-77.5 12 62.1 34.3-76.7 11 38.5 13.7-80.8
6 30 40.1 23.0-61.7 12 37.7 14.8-58.0 18 41.2 27.5-61.7
7 18 51.3 22.7-90.0 5 54.3 53.6-92.2 13 37.6 22.7-77.5
8 31 50.4 20.6-66.7 19 44.3 17.3-61.3 12 63.3 31.3-69.8
9 15 51.0 25.6-85.0 6 54.7 16.0-85.0 9 51.0 27.2-74.5
10 17 54.4 19.4-65.4 7 21.9 7.5-89.9 10 55.0 35.9-65.4
11 34 55.6 33.5-70.4 17 54.3 33.5-65.4 17 55.7 38.9-70.6
12 21 60.8 38.6-68.1 9 63.8 38.6-67.5 12 57.9 38.4-71.1
13 26 61.3 34.9-79.4 13 63.4 40.9-79.4 13 48.8 29.7-72.2
14 18 50.8 23.6-68.7 6 60.7 20.5-64.2 12 48.8 23.7-71.8
15 13 66.8 29.8-78.6 7 55.9 16.4-79.5 6 70.3 29.8-78.6
16 14 30.0 5.8-53.7 ≥5 42.5 12.7-69.8 <5 - -
17 14 26.5 18.4-73.0 7 24.2 19.0-76.2 7 28.8 16.2-73.0
18 20 53.7 28.8-87.8 9 54.4 44.6-62.5 11 51.1 19.9-99.5
19 18 46.3 14.6-70.9 7 21.7 10.5-46.0 11 57.9 39.0-70.9
Overall 379* 51.6 24.0-70.4 - 51.1 21.6-66.7 - 52.4 27.2-72.1
Overall Females Males
0
10
20
30
40
50
60
70
80
Med
ian
wei
ght
per
cent
ile
Age (years)1 2 3 4 5 6 7 8 9 10 11 12 13 14 15 16 17 18 19
1.4 Weight percentiles of children and young people (<20 years)6
N=386
The following chart and table show the weight of people with CF, aged 19 and under, in relation to the UK growth data for the general population. If a person with CF is on the 40th percentile, only 40% of people the same age are their weight or lower; 60% weigh more.
*Number with non-missing data6 Based on UK-WHO growth charts, 1990 (updated 1996)

12 UK Cystic Fibrosis Registry 2017 Annual Data Report - Scotland
1.5 Body Mass Index (BMI) percentiles in children and young people (<20 years)6
N=386
The following chart and table show the BMI percentiles of people with CF, aged 19 and under, in relation to the UK growth data for the general population. If a person with CF is on the 40th percentile, it means that only 40% of the population at the same age are their BMI or lower; so 60% have a higher BMI.
Overall Female Male
Age n Median IQR n Median IQR n Median IQR1 17 39.8 20.7-55.2 7 43.5 12.9-55.2 10 31.0 20.7-64.12 18 69.0 45.9-80.6 9 69.7 49.8-80.4 9 68.3 45.3-80.63 17 56.2 33.0-68.8 7 62.0 17.2-74.5 10 44.4 33.0-68.84 14 61.4 19.7-78.0 7 54.2 19.7-72.1 7 74.5 9.1-88.85 23 62.0 32.3-85.0 12 70.7 38.7-77.6 11 59.9 10.8-89.06 30 50.0 34.4-68.9 12 50.8 32.1-64.6 18 45.3 34.4-73.47 18 70.6 41.2-87.3 5 61.6 49.4-87.3 13 79.5 41.2-86.68 31 51.0 35.7-65.3 19 50.8 32.2-63.5 12 57.3 44.4-67.19 15 53.8 35.5-84.8 6 61.4 21.1-88.3 9 49.1 43.4-80.110 17 44.9 23.8-66.8 7 34.5 19.0-96.4 10 46.3 23.8-66.811 34 51.3 32.1-74.0 17 50.4 32.1-65.1 17 54.3 33.5-74.012 21 50.7 32.8-74.2 9 50.7 41.0-72.7 12 45.3 21.0-83.713 26 55.0 34.5-84.5 13 55.1 25.3-86.9 13 47.8 42.3-71.414 18 41.2 27.9-59.7 6 53.0 33.9-64.3 12 38.1 19.0-55.715 13 62.7 36.9-76.0 7 54.2 31.8-88.0 6 74.0 56.9-76.016 14 39.4 5.7-64.5 ≥5 53.9 32.0-74.9 <5 - -17 14 39.2 18.0-64.0 7 40.0 34.9-73.5 7 28.1 7.0-64.018 20 63.3 39.7-87.3 9 65.3 61.7-73.9 11 46.8 29.4-98.319 18 64.9 16.0-86.8 7 45.3 6.5-71.7 11 71.8 18.2-91.8Overall 378* 51.7 32.2-74.3 - 52.9 33.6-72.4 - 51.4 30.6-74.8
Overall Females Males
0
10
20
30
40
50
60
70
80
90
Med
ian
BM
I per
cent
ile
Age (years)
1 2 3 4 5 6 7 8 9 10 11 12 13 14 15 16 17 18 19
*Number with non-missing data6 Based on UK-WHO growth charts, 1990 (updated 1996)

13cysticfibrosis.org.uk
1.6 Body Mass Index (BMI) in adults (20 years and over)N=472
The following chart and table show the BMI of people with CF aged 20 and over in relation to the target BMI for adults; 22 for women and 23 for men7.
Overall Female Male
Age n Median IQR n Median IQR n Median IQR20-23 100 21.4 19.1-23.8 48 21.9 18.8-24.4 52 21.4 19.3-23.024-27 83 21.5 19.8-23.6 40 21.0 18.9-23.1 43 21.9 20.3-24.028-31 64 23.4 21.1-25.2 31 22.9 21.0-25.2 33 23.6 21.8-25.232-35 60 23.2 20.7-25.3 24 22.4 21.1-25.5 36 23.6 20.5-25.136-39 45 22.9 21.4-25.0 16 22.8 21.1-24.7 29 23.1 21.5-26.440-43 26 23.0 22.2-25.7 12 22.9 21.9-25.7 14 23.5 22.5-25.744-47 18 24.5 22.3-26.3 7 23.7 20.3-25.9 11 25.4 23.7-30.048-51 20 25.4 22.5-26.9 9 26.8 20.7-27.8 11 25.2 23.3-26.052-55 22 24.0 21.1-28.0 10 24.0 19.8-30.0 12 24.1 21.3-27.556-59 5 23.9 23.8-27.8 <5 - - <5 - -60+ 13 28.1 26.6-29.1 7 27.0 24.9-28.7 6 29.1 26.8-30.0Overall 456 22.9 20.5-25.3 - 22.6 19.8-24.8 - 23.1 21.0-25.7
Overall Females Males
19
21
23
25
27
29
31
Med
ian
BM
I
Age (years)
20-23 24-27 28-31 32-35 36-39 40-43 44-47 48-51 52-55 56-59 60+
Target (male): 23
Target (female): 22
*Number with non-missing data7 Stallings et al, J Am Diet Assoc. 2008;108:832-839

14 UK Cystic Fibrosis Registry 2017 Annual Data Report - Scotland
1.7 Education and employment in adults (16 years and over)N=538The following table shows how people with CF reported their education and employment status in 2017. Please note that the groups are not mutually exclusive; someone may be a student as well as working part-time, for example.
1.8 Pregnancy
Number of patients n (%)
Number who completed questionnaire; n (%) 525 (97.6)
Full-time employment; n (%) 189 (35.1)
Part-time employment; n (%) 95 (17.7)
Student; n (%) 78 (14.5)
Homemaker; n (%) 16 (3.0)
Unemployed; n (%) 101 (18.8)
Disabled; n (%) 20 (3.7)
Retired; n (%) 15 (2.8)
Unknown entered; n (%) 11 (2.0)
No data recorded; n (%) -*
No. in work or study; n (%) 362 (69.0)
*‘No data recorded’ is no longer available to select.
8 women with cystic fibrosis had babies in 2017
7 men with cystic fibrosis became fathers in 2017

15cysticfibrosis.org.uk
Diagnosis of cystic fibrosis
1.9 Age at diagnosis and screening in children under 16 in 2017N=320 Newborn screening for CF has been done routinely in the whole of the UK since mid-2007. It is part of the heel prick blood spot testing done at 5-7 days of age. The blood sample is tested for a number of conditions, including cystic fibrosis. This means that more babies born after 2007 receive an early diagnosis than those born before.
Age at diagnosis All patients <16; n (%) Patients aged 10 years; n (%)
Patients aged 5 years; n (%)
Prenatal 0 (0) 0 (0) 0 (0)
Birth-3 months 281 (88.9) 17 (100.0) 21 (91.3)
4-6 months 9 (2.8) - <5
7-12 months 8 (2.5) - -
1 yr <5 - -
2 yrs 8 (2.5) - <5
3 yrs <5 - -
4 yrs <5 - -
5 yrs - - -
6 yrs - - -
7 yrs - - -
8 yrs - - -
9 yrs - - -
10 yrs <5 - -
11 yrs <5 - -
12 yrs - - -
13 yrs - - -
14 yrs - - -
15 yrs - - -
Overall 316* 17 23
The median (range) age at diagnosis for patients aged under 16 in 2017 is 46 days (0-192 months).
Diagnosis in the first three months of life is more common in children aged five years in 2017(born after the UK-wide newborn screening programme was in place) than in children aged 10 years in 2017 (born during the final year of the introduction of universal newborn screening in the UK).
A total of 7 patients born in 2017 were identified by newborn screening (including those without complete data). As there is a delay between newborn screening tests being performed and the results entering the Registry, these statistics are updated retrospectively each year to take updated data into account. Therefore the number of patients identified in 2017 is higher (6) in this report than was recorded in the previous. It is likely that the 2017 figure will be updated in the next annual report in 2019.
*Number with non-missing data

16 UK Cystic Fibrosis Registry 2017 Annual Data Report - Scotland
1.10 Age at diagnosis and screening in adults aged 16 and over in 2017 N=538 The table below shows the age at diagnosis for people aged 16 and over in 2017. People aged 16 or over in 2017 were born when newborn screening was carried out done in a few areas of the UK, before it became universal in mid-2007.
Age at diagnosis n (%)
Birth-3 months 186 (34.7)
4-6 months 50 (9.3)
7-12 months 33 (6.2)
1 year 40 (7.5)
2 years 35 (6.5)
3 years 25 (4.7)
4 years 17 (3.2)
5 years 10 (1.9)
6 years 7 (1.3)
7 years 7 (1.3)
8 years 8 (1.5)
9 years 6 (1.1)
10 years <5
11 years 6 (1.1)
12 years 6 (1.1)
13 years 4 (0.7)
14 years <5
15 years 7 (1.3)
16-19 years 14 (2.6)
20-23 years 9 (1.7)
24-27 years 10 (1.9)
28-31 years 16 (3.0)
32-35 years 11 (2.1)
36-39 years 8 (1.5)
40-43 years <5
44-47 years <5
48-51 years <5
52-55 years <5
56-59 years <5
60+ years <5
Overall 536*
Overall, 85 (14.5%) adults with CF in the Registry in 2017 were diagnosed at age 16 or over.
In 2017, 5 people aged 16 or over were newly diagnosed with cystic fibrosis
*Number with non-missing data
17cysticfibrosis.org.uk
1.11 Mode of presentation The following table shows the number of patients diagnosed through each mode of presentation. Patients may present with multiple symptoms. The Venn diagram below shows the three most common modes of presentation excluding newborn screening (NBS), and the combinations of them.
*Age stratified figures are presented only for those with non-missing diagnosis date. This means that the number of people in <16 and ≥16 age groups will not necessarily add up to the ‘All patients’ number, which is shown for all patients, even if the diagnosis date is missing.
All patients Age <16 at diagnosis* Age ≥16 at diagnosis*
Total patients 858 767 91
Number diagnosed by NBS 242 242 0
Total non-NBS 614 526 90
Mode of presentation (excluding NBS)
All patients (n=614)
Age <16 at diagnosis* (n=526)
Age ≥16 at diagnosis* (n=86)
Persistent or acute respiratory infection 230 (37.6) 182 (34.6) 48 (55.8)
Failure to thrive/malnutrition 167 (27.3) 167 (31.7) 0 (0)
Abnormal stools/fatty stool (steatorrhea)/malabsorption
132 (21.6) 127 (24.1) 5 (5.8)
Meconium ileus 102 (16.7) 102 (19.4) 0 (0)
Family history 86 (14.1) 74 (14.1) 12 (14.0)
Genotype 29 (4.7) 21 (4.0) 8 (9.3)
Unknown 45 (7.4) 33 (6.3) 10 (11.6)
Rectal prolapse 18 (2.9) 18 (3.4) 0 (0)
Nasal polyps 5 (0.8) <5 <5
Electrolyte imbalance 24 (3.9) ≥5 <5
Prenatal <5 <5 <5
Bronchiectasis 7 (1.1) <5 ≥5
Liver disease <5 <5 <5
Fertility <5 <5 <5
Pancreatitis <5 <5 <5
Oedema <5 <5 <5
41(6.7%)
59(9.6%)
136(22.1%)
25(4.1%)
43(7.0%)
40(6.5%)
26(4.2%)
Top three non-NBS presentation routes
Abnormal stools/fatty stool (steatorrhea)/malabsorption
Failure to thrive/malnutrition
Persistent or acute respiratory infection
Other: 242 (39.6%)
Patients (%)

18 UK Cystic Fibrosis Registry 2017 Annual Data Report - Scotland
Lung health
For people with CF, mucus in the lungs is linked to repeat or chronic infections. This can cause permanent damage, making it harder to breathe.
In CF the condition of the lungs is often measured using FEV1; the Forced Expiratory Volume of air in the first second of a forced exhaled breath. In this report, an FEV1% predicted is based on the FEV1 we would expect for a person without CF of the same age, gender, height, and ethnicity.
A person with CF who has FEV1% predicted of 100% can breathe out the same amount of air in the first second of an exhaled breath as we would expect from a comparable person without cysticfibrosis. A person with FEV1% predicted of 50% breathes out half the volume of air as a comparable person without cystic fibrosis.
For people with CF, an FEV1% predicted of 85% or higher is the target, as this indicates normal or near-normal lung health. Each individual with CF will have their own FEV1 target, based on their own lung function results and trends.
An aim of CF care is to prevent FEV1% predicted from falling as much as possible, for as long as possible. This is often a team effort between people with CF, their family, and their medical team, which can include doctors, nurses, physiotherapists, dietitians, and psychologists.
The FEV1% predicted values shown in this report are calculated using an equation called Global Lungs Initiative, or ‘GLI’8
8 Quanjer PH et al. Eur respir J. 2012 Dec; 40(6):1324-1343

19cysticfibrosis.org.uk
*Number with non-missing data
1.12 FEV1% predicted (GLI equations) in patients aged six years and older who have not had a lung transplantN=761
People with CF who have had lung transplants are excluded, as their new ‘non-CF’ lungs may have lung health similar to a person without cystic fibrosis.
For the best FEV1 calculation, where best FEV1% was missing or less than the FEV1% at annual review, the annual review FEV1% was used.
Overall Female MaleAge (yrs) n Median IQR n Median IQR n Median IQR6-7 42 91.4 83.3-100.3 14 85.9 80.1-90.7 28 97.5 86.6-104.3
8-9 44 90.2 81.6-96.8 24 88.6 81.7-100.7 20 90.9 81.6-95.1
10-11 50 93.4 80.2-98.8 23 94.6 82.1-100.4 27 93.0 78.9-98.0
12-15 76 87.8 77.6-97.5 35 92.2 79.7-98.1 41 87.4 75.4-93.4
16-19 64 81.9 60.2-93.5 34 81.0 63.6-89.4 30 86.8 51.1-94.8
20-23 94 62.7 42.2-83.9 44 60.0 33.5-82.5 50 63.4 46.5-85.3
24-27 78 59.2 42.7-77.8 37 64.4 50.7-77.8 41 55.1 40.2-77.5
28-31 57 66.5 44.2-79.6 25 70.5 54.0-80.8 32 60.6 40.8-77.1
32-35 56 58.8 41.1-74.8 22 64.2 49.6-75.0 34 55.6 35.9-74.6
36-39 39 52.5 39.5-87.4 15 52.5 35.4-88.9 24 52.7 39.7-80.1
40-43 24 61.7 43.9-78.9 11 52.2 43.3-72.3 13 66.4 56.3-84.7
44-47 15 60.6 34.2-76.9 6 55.9 30.7-66.9 9 64.1 51.6-82.6
48-51 19 56.8 42.8-76.7 9 56.7 53.7-71.9 10 56.9 40.1-80.3
52-55 19 63.5 48.3-78.4 10 53.6 48.3-73.6 9 70.0 48.6-84.5
56-59 <5 - - <5 - - <5 - -
60+ 12 52.9 37.9-72.3 6 44.3 25.3-55.6 6 61.3 49.4-81.2
<16 212 89.8 80.1-98.3 96 88.6 81.2-98.6 116 90.0 79.5-98.2
≥16 481 63.5 43.6-83.2 220 64.8 47.6-81.0 261 61.5 41.1-84.5
<18 239 88.5 79.4-97.9 114 87.8 79.6-97.8 125 89.9 79.1-97.9
≥18 454 62.6 42.7-81.7 202 63.8 46.9-79.8 252 60.9 40.9-83.8
Overall 693* 75.3 52.2-91.1 316 75.6 53.0-89.5 377 74.3 51.5-92.1
40
50
60
80
90
100
6-7
8-9
10-11
12-15
16-19
20-23
24-27
28-31
32-35
36-39
40-43
44-47
48-51
52-55
56-59
60+
Age (years)
Med
ian
FE
V1%
pre
dic
ted Overall Best Overall Females Males

20 UK Cystic Fibrosis Registry 2017 Annual Data Report - Scotland
1.13 Best FEV1% predicted (GLI equations) in patients aged six years and older who have not had a lung transplantN=761
*Number with non-missing data
* Where Best FEV1% was missing or less than the FEV1% at annual review, annual review FEV1% was used instead.
Overall Female MaleAge (yrs) n Median IQR n Median IQR n Median IQR6-7 44 99.9 88.0-103.9 15 90.7 80.1-99.5 29 100.8 96.3-107.4
8-9 44 95.4 85.5-104.6 24 95.1 86.4-106.2 20 95.6 84.9-102.7
10-11 51 96.9 85.4-103.8 24 97.3 84.4-104.6 27 96.9 85.5-102.3
12-15 78 92.4 85.0-102.2 35 93.9 85.0-103.1 43 89.9 83.5-97.5
16-19 65 88.6 72.2-95.7 34 86.8 76.8-94.3 31 90.4 60.0-102.6
20-23 97 69.9 47.3-87.3 46 68.2 45.8-86.5 51 70.5 52.3-91.1
24-27 78 68.7 51.3-86.3 37 72.3 55.6-80.7 41 62.8 45.1-86.3
28-31 59 73.5 52.2-83.2 27 75.3 62.4-86.0 32 68.0 43.6-80.0
32-35 56 62.8 45.2-81.0 22 66.8 57.6-76.5 34 56.9 42.5-83.3
36-39 39 61.9 49.0-87.4 15 63.7 47.2-88.9 24 60.4 49.6-82.3
40-43 24 65.7 48.0-89.0 11 53.4 44.5-89.7 13 72.8 62.2-88.4
44-47 15 65.1 51.6-76.9 6 57.9 36.2-66.9 9 66.1 54.5-85.4
48-51 19 62.9 47.6-80.3 9 64.3 56.7-78.1 10 58.5 44.3-80.3
52-55 19 63.8 49.9-83.2 10 62.7 49.0-75.4 9 79.7 50.9-87.2
56-59 <5 - - <5 - - <5 - -
60+ 12 60.3 42.2-76.6 6 52.4 29.7-62.9 6 70.7 56.6-81.2
<16 217 94.9 85.4-103.4 98 94.1 85.0-103.2 119 95.8 85.9-103.6
≥16 487 70.3 50.8-87.5 224 70.9 53.5-87.1 263 69.3 47.5-88.4
<18 244 93.9 84.6-102.9 116 92.8 83.3-102.5 128 95.3 85.5-103.3
≥18 460 68.4 50.1-87.1 206 68.2 52.9-86.0 254 68.7 47.2-87.4
Overall 704* 80.2 59.0-95.8 322 80.1 61.6-94.3 382 80.3 57.5-96.6

21cysticfibrosis.org.uk
*Due to missing data, medians are calculated from a population of 417. Each point represents the median FEV1 % predicted of patients for each given BMI value. Due to the wide range of BMIs in this population with a value of 30 of more, these are grouped into one.
1.14 FEV1% predicted (GLI equations) and BMI in people aged 20 years and over who have not had a transplantN=417*
The goal BMI for adults is 22 for women, and 23 for men. The chart below shows the relationship between BMI and FEV1% predicted. A healthy BMI can protect people with CF against lung infection and help to preserve lung health. This chart excludes people who have had a lung transplant.
0
10
20
30
40
50
60
70
80
90
100
15 16 17 18 19 20 21 22 23 24 25 26 27 28 29 30+
Med
ian
FEV
% p
red
icte
d
Target – female 22 Target – male 23
Females Males
BMI

22 UK Cystic Fibrosis Registry 2017 Annual Data Report - Scotland
Lung infections
Lung infections can permanently reduce lung function in people with cystic fibrosis. Some lung infections can become ‘chronic’, meaning that they can’t ever be removed completely using medicines. All other infections are reported if they have occurred at least once as a positive growth in the 12 months prior to the patient’s annual review data set.
1.15 Lung infections in 2017N=858
Chronic Staphylococcus aureas
Chronic Pseudomonas aeruginosa
Burkholderia cepacia complex
Haemophilus influenzae
Aspergillus
Intermittent Staphylococcus aureas
Intermittent Pseudomonas aeruginosa
Methicillin-resistant Staphylococcus aureus
Non tuberculosis mycobacterium
0
10
20
30
40
50
60
0-3
4-7
8-11
12-15
16-19
20-23
24-27
28-31
32-35
36-39
40-43
44-47
48-51
52-55
56-59
60+
Pro
po
rtio
n o
f p
atie
nts
(%)
Age (years)

23cysticfibrosis.org.uk
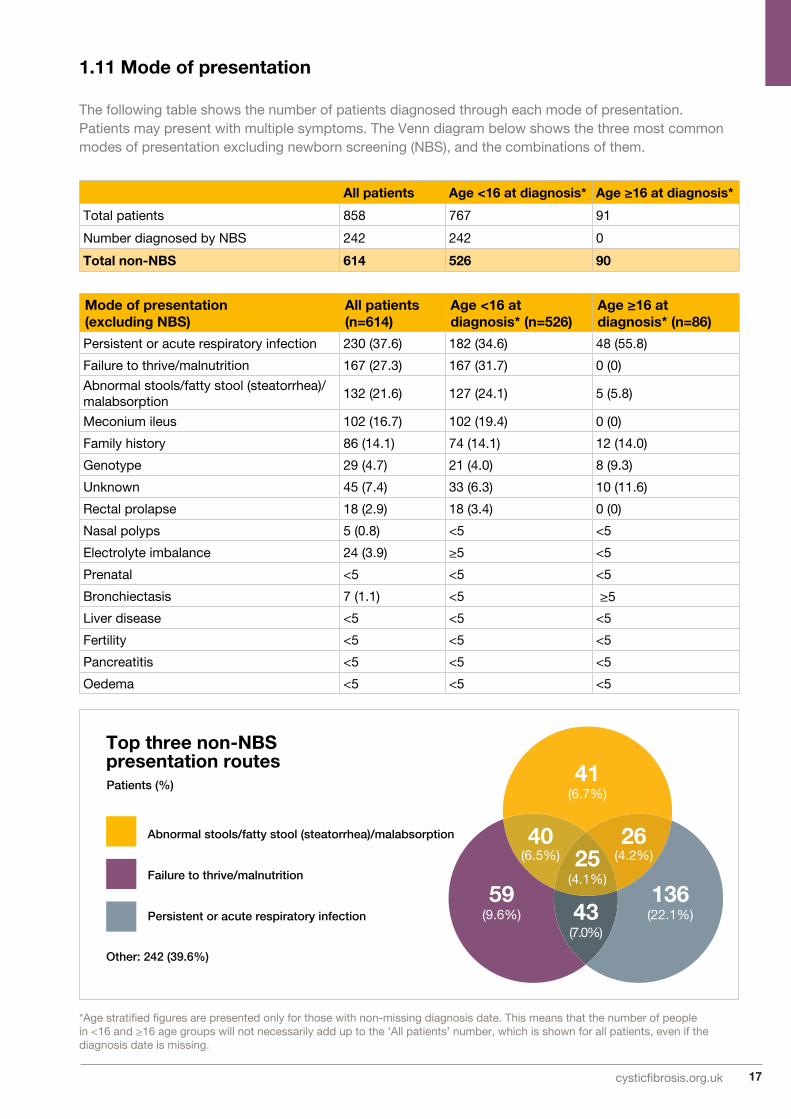
1.16 Lung infections in 2017<16 years N=320; ≥16 years N=538
Infections in this table reflect bugs grown in the 12 months prior to the 2017 annual review. The UK CF Registry definition of ‘chronic’ is three or more isolates in the last 12 months.
Paediatric age range (years) Overall
0-3 4-7 8-11 12-15Paediatric (<16 years)
Number in age range 60 85 97 78 320
Number who had culture taken 59 85 96 78 318
Chronic S. aureus n (%) <5 13 (15.3) 19 (19.8) 17 (21.8) 51 (16.0)
Intermittent S. aureus n (%) 15 (25.4) 17 (20.0) 19 (19.8) 15 (19.2) 66 (20.8)
Chronic P. aeruginosa n (%) <5 <5 <5 8 (10.3) 14 (4.4)
Intermittent P. aeruginosa n (%) 7 (11.9) 10 (11.8) 12 (12.5) 8 (10.3) 37 (11.6)
B. cepacia complex n (%) <5 <5 <5 <5 6 (1.9)
B. cenocepacia n (%) <5 <5 <5 <5 <5
B. multivorans n (%) <5 <5 <5 <5 <5
B. cepacia (other) n (%) <5 <5 <5 <5 <5
MRSA n (%) <5 <5 <5 <5 <5
H. influenza n (%) 21 (35.6) 44 (51.8) 28 (29.2) 16 (20.5) 109 (34.3)
NTM n (%) <5 <5 <5 <5 6 (1.9)
Aspergillus n (%) <5 <5 9 (9.4) 6 (7.7) 18 (5.7)
24 UK Cystic Fibrosis Registry 2017 Annual Data Report - Scotland
Adult Age Range (Years) Overall
16-19 20-23 24-27 28-31 32-35 36-39Adults (≥16 years)
Number in age range 66 100 88 65 64 45 538
Number who had culture taken
61 97 76 59 54 42 478
Chronic S. aureus n (%) 25 (41.0) 44 (45.4) 27 (35.5) 23 (39.0) 21 (38.9) 21 (50.0) 189 (39.5)
Intermittent S. aureus n (%) 9 (14.8) 15 (15.5) 12 (15.8) 6 (10.2) 7 (13.0) 6 (14.3) 60 (12.6)
Chronic P. aeruginosa n (%) 14 (23.0) 39 (40.2) 38 (50.0) 29 (49.2) 24 (44.4) 19 (45.2) 209 (43.7)
Intermittent P. aeruginosa n (%)
<5 10 (10.3) 10 (13.2) <5 5 (9.3) <5 37 (7.7)
B. cepacia complex n (%) <5 9 (9.3) 7 (9.2) 5 (8.5) 6 (11.1) <5 44 (9.2)
B. cenocepacia n (%) <5 <5 <5 <5 <5 <5 11 (2.3)
B. multivorans n (%) <5 <5 <5 <5 <5 <5 25 (5.2)
B. cepacia (other) n (%) <5 <5 <5 <5 <5 <5 5 (1.0)
MRSA n (%) <5 <5 <5 <5 <5 <5 10 (2.1)
H. influenza n (%) 6 (9.8) 13 (13.4) 9 (11.8) 10 (16.9) 6 (11.1) 6 (14.3) 61 (12.8)
NTM n (%) 7 (11.5) 13 (13.4) <5 <5 <5 <5 32 (6.7)
Aspergillus n (%) 8 (13.1) 7 (7.2) 5 (6.6) 6 (10.2) <5 <5 43 (9.0)
Adult Age Range (Years) Overall
40-43 44-47 48-51 52-55 56-59 60+Adults (≥16 years)
Number in age range 27 20 22 23 5 13 538
Number who had culture taken
23 14 19 18 <5 11 478
Chronic S. aureus n (%) 7 (30.4) <5 8 (42.1) 6 (33.3) <5 <5 189 (39.5)
Intermittent S. aureus n (%) <5 <5 <5 <5 <5 <5 60 (12.6)
Chronic P. aeruginosa n (%) 13 (56.5) 7 (50.0) 8 (42.1) 10 (55.6) <5 6 (54.5) 209 (43.7)
Intermittent P. aeruginosa n (%)
<5 <5 <5 <5 <5 <5 37 (7.7)
B. cepacia complex n (%) 5 (21.7) <5 <5 <5 <5 <5 44 (9.2)
B. cenocepacia n (%) <5 <5 <5 <5 <5 <5 11 (2.3)
B. multivorans n (%) <5 <5 <5 <5 <5 <5 25 (5.2)
B. cepacia (other) n (%) <5 <5 <5 <5 <5 <5 5 (1.0)
MRSA n (%) <5 <5 <5 <5 <5 <5 10 (2.1)
H. influenza n (%) <5 <5 <5 <5 <5 <5 61 (12.8)
NTM n (%) <5 <5 <5 <5 <5 <5 32 (6.7)
Aspergillus n (%) <5 <5 <5 <5 <5 <5 43 (9.0)

25cysticfibrosis.org.uk
2015 (n=795) 2016 (n=829) 2017 (n=858)
NTM Prevalence (%) 37 (4.7%) 44 (5.3%) 38 (4.4%)
On NTM treatment in the given year (% of NTM prevalence in given year)
12 (32%) 16 (36%) 11 (29%)
NTM Incidence 20 20 12
M. abscessus prevalence 23 25 26
M. abscessus incidence* - 7 10
1.17 Nontuberculous mycobacteria (NTM) or atypical mycobacteria
Non-tuberculous mycobacterium is slow to grow and takes time to treat. It may be present for several years before eradication, or may never be cleared. In the table below, ‘prevalence’ represents all people reported in that year as having a positive culture. ‘Incidence’ represents all positive cultures in individuals that have not reported having any in the previous two years of data.
1.18 Lung infections over timeN=429 in 2008, N=809 in 2013, N=858 in 2017
*M. abscessus incidence cannot be evaluated prior to 2016 as enhanced NTM reporting was not available before 2014.
0
10
20
30
40
50
60
70
80
90
100
0-3
4-7
8-11
12-15
16-19
20-23
24-27
28-31
32-35
36-39
40-43
44-47
48-51
52-55
56-59
60+
Age group (years)
Pro
po
rtio
n o
f p
atie
nts
(%)
Chronic Staphylococcus aureus (2008)
Chronic Staphylococcus aureus (2013)
Chronic Staphylococcus aureus (2017)
Chronic Pseudomonas aeruginosa (2008)
Chronic Pseudomonas aeruginosa (2013)
Chronic Pseudomonas aeruginosa (2017)

26 UK Cystic Fibrosis Registry 2017 Annual Data Report - Scotland
Chronic Staphylococcus aureus
2008 (%) 2013 (%) 2017 (%) p-value
0-3 0.0 3.6 3.4 0.960
4-7 4.1 12.2 15.3 0.517
8-11 4.8 11.4 19.8 0.076
12-15 11.2 25.9 21.8 0.698
16-19 24.1 35.2 41.0 0.653
20-23 44.4 34.7 45.4 0.175
24-27 23.1 42.1 35.5 0.129
28-31 28.6 44.4 39.0 0.311
32-35 71.4 37.8 38.9 0.652
36-39 71.4 21.4 50.0 0.018
40-43 50.0 31.6 30.4 0.758
44-47 40.0 33.3 21.4 - *
48-51 0.0 26.3 42.1 0.491
52-55 0.0 55.6 33.3 0.115
56-59 0.0 0.0 25.0 - *
60+ 0.0 12.5 27.3 - *
<16 years 5.1 13.1 16.0 N/A
≥16 years 34.9 35.9 39.5 N/A
<18 years 6.0 15.0 17.1 N/A
≥18 years 41.0 36.9 40.1 N/A
Chronic Pseudomonas aeruginosa
2008 (%) 2013 (%) 2017 (%) p-value
0-3 2.3 5.5 0.0 0.087
4-7 1.4 3.3 2.4 0.716
8-11 11.1 3.8 4.2 0.799
12-15 20.2 10.3 10.3 0.935
16-19 27.6 31.9 23.0 0.163
20-23 44.4 50.5 40.2 0.101
24-27 61.5 51.3 50.0 0.298
28-31 71.4 45.8 49.2 0.945
32-35 57.1 48.9 44.4 0.279
36-39 42.9 42.9 45.2 0.848
40-43 50.0 52.6 56.5 0.900
44-47 80.0 45.8 50.0 0.467
48-51 50.0 31.6 42.1 0.747
52-55 0.0 55.6 55.6 0.538
56-59 0.0 33.3 50.0 - *
60+ 100.0 75.0 54.5 0.195
<16 years 9.0 5.3 4.4 N/A
≥16 years 47.0 45.4 43.7 N/A
<18 years 10.2 8.0 5.8 N/A
≥18 years 54.1 47.5 45.0 N/A
*Sample size too low for hypothesis test

27cysticfibrosis.org.uk
Please note that in 2017 the data entry pathway for complications changed, which has resulted in a drop in prevalence for several complications. Results in 2017 should be interpreted with caution until 2018, when we will confirm whether this is a true decrease.
Complications
1.19 Prevalence of complications
The number shown is for a complication that has been present in the preceding 12 months.
2016 2017*Overall (n=795)
<16 years (n=298)
≥16 years (n=497
Overall (n=858)
<16 years (n=320)
≥16 years (N=538)
Respiratory relatedNasal polyps requiring surgery - <5 9 (1.7) - <5 16 (3.0)
Sinus disease - <5 164 (31.5) - <5 122 (22.7)
Asthma 79 (9.5) 14 (4.5) 64 (12.5) 63 (7.3) 9 (2.8) 54 (10.0)Allergic bronchopulmonary aspergillo-sis (ABPA)
- <5 33 (6.3) 37 (4.3) 7 (2.2) 30 (5.6)
Any haemoptysis 23 (2.8) 0 23 (4.4) - <5 25 (4.6)
Massive haemoptysis - - - -
Pneumothorax requiring chest tube 0 0 0 0 0 0
Pancreas & hepatobiliary diseaseRaised liver enzymes - <5 25 (4.8) 41 (4.8) 14 (4.4) 27 (5.0)
Liver disease 104 (12.5) 23 (7.4 81 (15.6) 68 (7.9) 18 (5.6) 50 (9.3)
Cirrhosis with no portal hypertension - <5 12 (2.3) - <5 13 (2.4)
Cirrhosis with portal hypertension 19 (2.3) 6 (1.9) 13 (2.5) - <5 13 (2.4)
Gall bladder disease requiring surgery <5 <5 <5 - <5 <5
Pancreatitis - <5 7 (1.3) - <5 10 (1.9)
Upper gastrointestinalGastroeosophageal reflux disease (GERD)
- <5 99 (19.0) - <5 113 (21.0)
Peptic ulcer 0 0 0 0 0 0
GI bleed (varices as source) 0 0 0 0 0 0
GI bleed (non varices as source) - 0 <5 - <5 <5
Lower gastrointestinalIntestinal obstruction 0 0 0 - <5 0
Distal intestinal obstruction syndrome - - - - <5 94 (17.5)
Fibrosing colonopathy/colonic stricture - <5 88 (16.9) 0 0 0
Rectal prolapse 0 0 0 - <5 <5
RenalKidney stones - <5 <5 - 0 <5
Renal failure 13 (1.6) 0 13 (2.5) 13 (1.5) 0 13 (2.4)
Musculo-skeletalArthritis - <5 <5 5 (0.6) 0 5 (0.9)
Arthropathy 33 (4.0) 0 44 (6.3) 32 (3.7) 0 32 (5.9)
Bone fracture 0 0 0 - 0 <5
Osteopenia 107 (12.9) 0 107 (20.6) 107 (12.5) 0 107 (19.9)
Osteoporosis 42 (5.1) 0 42 (8.1) 40 (4.7) 0 40 (7.4)
OtherCancer confirmed by histology 0 0 0 - <5 <5
Port inserted or replaced - <5 <5 18 (2.1) 6 (1.9) 12 (2.2)
Depression 21 (2.5) 0 21 (4.0) 19 (2.2) 0 19 (3.5)
Hearing loss - <5 9 (1.7) - <5 7 (1.3)
Hypertension 17 (2.1) 0 17 (3.3) 17 (2.0) 0 17 (3.2)

28 UK Cystic Fibrosis Registry 2017 Annual Data Report - Scotland
1.20 Incidence of complications
The table below describes new cases of a complication that have not been reported for an individual in at least the previous two years.
Newly identified in 2016 Newly identified in 2017
Overall (n=829)
<16 years (n=309)
≥16 years (n=520)
Overall (n=858)
<16 years (n=320)
≥16 years (n=538)
Allergic bronchopulmonary aspergillosis (ABPA); n (%)
11 (1.3) <5 ≥5 10 (1.2) <5 ≥5
Cirrhosis - no portal hypertension; n (%) 13 (1.6) <5 ≥5 9 (1.0) <5 ≥5
Cirrhosis - with portal hypertension; n (%) 7 (0.8) <5 <5 6 (0.7) <5 ≥5
Cancer confirmed by histology; n (%) <5 <5 <5 <5 <5 5
All ≥10 years (n=667) 10-15 years (n=129) ≥16 years (n=538)On CFRD treatment; n (%) 150 (22.5) 7 (5.4) 143 (26.6)
CFRD screening; n (%)Yes 354 (53.1) 115 (89.1) 239 (44.4)
No 133 (19.9) 6 (4.7) 127 (23.6)
Existing CFRD diagnosis 152 (22.8) 7 (5.4) 145 (27.0)
Unknown 9 (1.3) <5 ≥5
1.21 CF-related diabetesN=667
Cystic fibrosis-related diabetes (CFRD) is common in adults and adolescents with cystic fibrosis. This is because, for many people with CF, the pancreas does not work properly. This can mean that not enough insulin is produced, or it may not work properly, causing CFRD. CFRD is different from type 1 and type 2 diabetes, but has features of both.

29cysticfibrosis.org.uk
Antibiotics
1.22 Intravenous (IV) antibiotics N=858
When someone with CF becomes unwell with an infection, they might be prescribed intravenous (IV) antibiotics. IV antibiotics are given to the patient through their veins. This treatment can take a number of days and might take place as a hospital inpatient, or at home.
Home Hospital Total
Age NPatients n (%)
Median days (IQR)
Patients n (%)
Median days (IQR)
Patients n (%)
Median days (IQR)
0-3 60 <5 - 11 (18.3) 13 (13-13) 11 (18.3) 14 (7-18)
4-7 85 5 (5.9) 25 (12-34) 18 (21.2) 14 (12-34) 20 (23.5) 15 (14-40)
8-11 97 9 (9.3) 40 (28-47) 28 (28.9) 15 (28-47) 30 (30.9) 35 (14-68)
12-15 78 8 (10.3) 26 (23-45) 23 (29.5) 17 (23-45) 27 (34.6) 26 (14-42)
16-19 66 13 (19.7) 18 (14-37) 19 (28.8) 16 (14-37) 24 (36.4) 26 (14-49)
20-23 100 33 (33.0) 14 (10-28) 42 (42.0) 14 (10-28) 52 (52.0) 25 (14-44)
24-27 88 26 (29.5) 14 (14-35) 29 (33.0) 14 (14-35) 38 (43.2) 26 (14-42)
28-31 65 18 (27.7) 27 (10-42) 18 (27.7) 15 (10-42) 24 (36.9) 33 (25-51)
32-35 64 12 (18.8) 25 (14-39) 16 (25.0) 19 (14-39) 22 (34.4) 29 (14-42)
36-39 45 15 (33.3) 16 (13-49) 7 (15.6) 25 (13-49) 16 (35.6) 37 (14-52)
40-43 27 9 (33.3) 17 (14-28) 8 (29.6) 13 (14-28) 14 (51.9) 14 (13-36)
44-47 20 <5 - <5 16 (10-31) 5 (25.0) 14 (13-44)
48-51 22 <5 - <5 41 (49-68) 5 (22.7) 61 (55-63)
52-55 23 5 (21.7) 14 (12-14) 9 (39.1) 14 (12-14) 11 (47.8) 14 (14-14)
56-59 5 0 (0.0) - <5 - <5 -
60+ 13 <5 9 (4-32) 6 (46.2) 10 (4-32) 6 (46.2) 14 (14-39)
<16 320 23 (7.2) 28 (22-41) 80 (25.0) 14 (22-41) 88 (27.5) 23 (14-43)
≥16 538 142 (26.4) 18 (13-39) 161 (29.9) 14 (13-39) 218 (40.5) 27 (14-44)
<18 348 29 (8.3) 27 (18-40) 89 (25.6) 14 (18-40) 100 (28.7) 23 (14-42)
≥18 510 136 (26.7) 17 (13-40) 152 (29.8) 14 (13-40) 206 (40.4) 27 (14-45)
Overall 858 165 (19.2) 21 (13-40) 241 (28.1) 14 (13-40) 306 (35.7) 26 (14-44)

30 UK Cystic Fibrosis Registry 2017 Annual Data Report - Scotland
1.23 Inhaled antibiotic use among people with chronic Pseudomonas aeruginosa
1.24 Long-term azithromycin use
Azithromycin is an antibiotic with some anti-inflammatory properties. It is recommended for long-term use as a prophylactic antibiotic in people with chronic Pseudomonas aeruginosa infection.
2008 2013 2017
Overall<16 years
≥16 years
Overall<16 years
≥16 years
Overall<16 years
≥16 years
Patients with chronic P. aeruginosa
67 28 39 241 17 224 223 14 209
Tobramycin solution; n (%)
6 (9.0) <5 <5 48 (19.9) <5 ≥5 34 (15.2) <5 ≥5
Other aminoglycoside; n (%) 0 0 0 0 0 0 <5 0 <5
Colistin; n (%) 21 (31.3) 15 (53.6) 6 (15.4) 92 (38.2) 13 (76.5) 79 (35.3) 55 (24.7) 6 (42.9) 49 (23.4)
Promixin; n (%) <5 0 <541 (17.0)
<5 ≥5 35 (15.7) 5 (35.7) 30 (14.4)
Aztreonam; n (%) - - - <5 0 <517(7.6)
017(8.1)
Colistimethate (DPI); n (%) - - - - - -54(24.2)
<5 ≥5
Tobramycin Inhalation Powder; n (%)
- - - - - - 64 (28.7) 0 64 (30.6)
At least one of the above; n (%)
28 (41.8) 17 (60.7) 11 (28.2) 151 (62.7) 15 (88.2) 136 (60.7) 183 (82.1) 12 (85.7) 171 (81.8)
The consensus view in the UK is that 90% of people chronically infected with P. aeruginosa should be prescribed at least one of the above inhaled antibiotics.
*In 2013, this includes Aztreonam. In 2017 it includes Aztreonam, Colistimethate and Tobramycin Inhalation Powder.
Patients with chronic P. aeruginosa; n (%)
Patients without chronic P. aeruginosa; n (%)
2008 Overall (n=429) 29 (46.0) 34 (54.0)0-3 years (n=91) <5 <5
4-15 years (n=236) 12 (35.3) 22 (64.7)
≥16 years n=(102) 17 (60.7) 11 (39.3)
2013 Overall (n=809) 185 (49.9) 186 (50.1)0-3 years (n=70) <5 <5
4-15 years (n=244) 8 (17.0) 39 (83.0)
≥16 years (n=495) 176 (54.7) 146 (45.3)
2017 Overall (n=858) 190 (43.0) 252 (57.0)0-3 years (n=60) 0 (0) <5
4-15 years (n=260) 11 (13.3) 72 (86.7)
≥16 years (n=538) 179 (50.1) 178 (49.9)

31cysticfibrosis.org.uk
Age Total patients Patients on Flucloxacilin; n (%)0-3 58 32 (55.2)
4-7 82 28 (34.1)
8-11 92 31 (33.7)
12-15 77 26 (33.8)
16-19 64 20 (31.3)
20-23 100 29 (29.0)
24-27 82 17 (20.7)
28-31 64 8 (12.5)
32-35 59 7 (11.9)
36-39 42 <5
40-43 25 <5
44-47 17 <5
48-51 19 <5
52-55 22 <5
56-59 5 0
60+ 13 0
<16 years 309 117 (37.9)
≥16 years 512 89 (17.4)
<18 years 337 121 (35.9)
≥18 years 484 85 (17.6)
Overall 821 206 (25.1)
1.25 Flucloxacillin
Flucloxacillin is an antibiotic, that is used prophylactically to prevent infection with bacteria.

32 UK Cystic Fibrosis Registry 2017 Annual Data Report - Scotland
Muco-active therapies
1.26 Mannitol
1.27 DNase
Age Total patients Patients on Mannitol; n (%)0-3 58 04-7 82 08-11 92 012-15 77 016-19 64 020-23 100 <524-27 82 <528-31 64 <532-35 59 <536-39 42 <540-43 25 044-47 17 <548-51 19 <552-55 22 056-59 5 060+ 13 0<16 years 309 0≥16 years 512 10 (2.0)<18 years 337 0≥18 years 484 10 (2.1)Overall 821 10 (1.2)
2008 2013 2017
AgeTotal patients
Patients on DNase; n (%)
Total patients
Patients on DNase; n (%)
Total patients
Patients on DNase; n (%)
0-3 91 <5 70 <5 58 <54-7 78 9 (11.5) 101 11 (10.9) 82 18 (22.0)8-11 66 15 (22.7) 82 22 (26.8) 92 42 (45.7)12-15 92 33 (35.9) 61 27 (44.3) 77 38 (49.4)16-19 32 12 (37.5) 99 41 (41.4) 64 33 (51.6)20-23 14 <5 97 42 (43.3) 100 61 (61.0)24-27 14 <5 75 29 (38.7) 82 41 (50.0)28-31 11 <5 67 25 (37.3) 64 30 (46.9)32-35 8 <5 49 12 (24.5) 59 25 (42.4)36-39 9 <5 26 7 (26.9) 42 14 (33.3)40-43 5 <5 19 <5 25 12 (48.0)44-47 5 <5 22 7 (31.8) 17 7 (41.2)48-51 <5 0 20 6 (30.0) 19 8 (42.1)52-55 <5 0 7 <5 22 7 (31.8)56-59 <5 0 7 0 5 <560+ <5 0 7 <5 13 <5<16 years 327 60 (18.3) 314 63 (20.1) 309 99 (32.0)≥16 years 102 23 (22.5) 495 179 (36.2) 512 242 (47.3)<18 years 350 71 (20.3) 363 86 (23.7) 337 112 (33.2)≥18 years 79 12 (15.2) 446 156 (35.0) 484 229 (47.3)Overall 429 83 (19.3) 809 242 (29.9) 821 341 (41.5)
33cysticfibrosis.org.uk
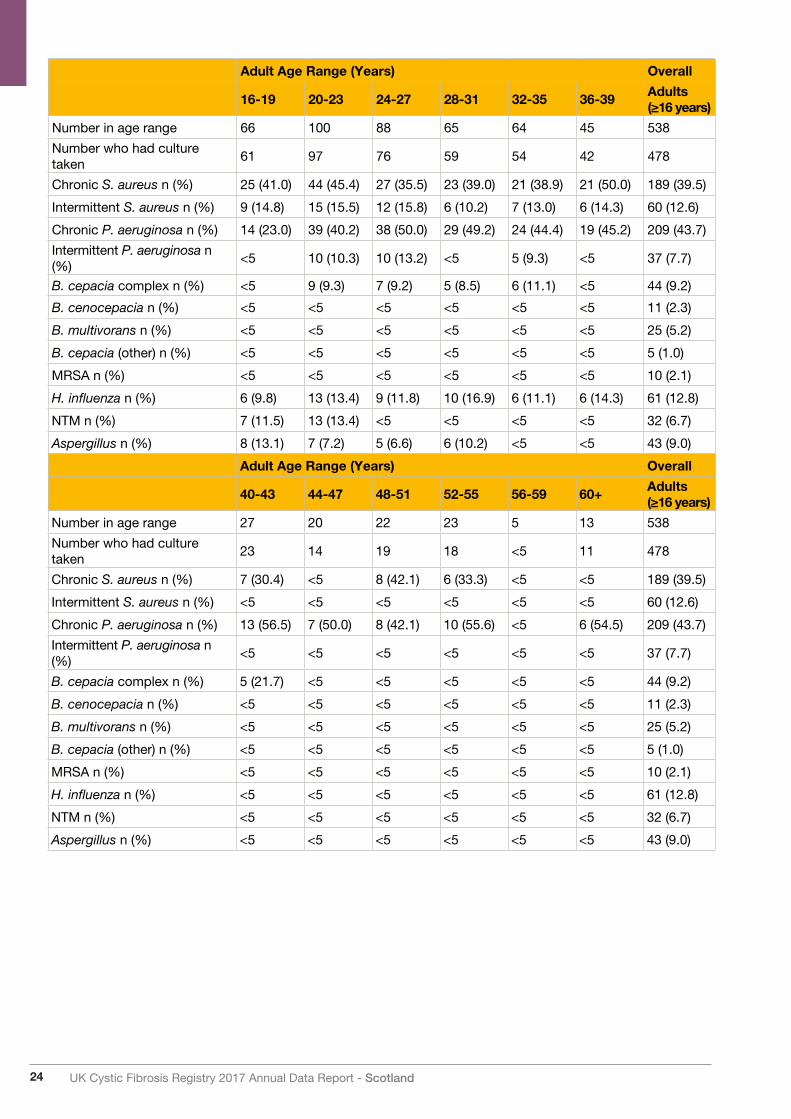
2008 2013 2017
Age Total patientsPatients on hypertonic saline; n (%)
Total patientsPatients on hypertonic saline; n (%)
Total pa-tients
Patients on hypertonic saline; n (%)
0-3 91 0 70 <5 58 6 (10.3)4-7 78 0 101 6 (5.9) 82 12 (14.6)8-11 66 <5 82 10 (12.2) 92 22 (23.9)12-15 92 <5 61 12 (19.7) 77 25 (32.5)16-19 32 0 99 26 (26.3) 64 19 (29.7)20-23 14 0 97 25 (25.8) 100 24 (24.0)24-27 14 0 75 9 (12.0) 82 14 (17.1)28-31 11 <5 67 7 (10.4) 64 16 (25.0)32-35 8 0 49 5 (10.2) 59 11 (18.6)36-39 9 0 26 0 42 5 (11.9)40-43 5 0 19 <5 25 <544-47 5 0 22 <5 17 <548-51 <5 0 20 <5 19 <552-55 <5 <5 7 <5 22 <556-59 <5 0 7 0 5 060+ <5 0 7 <5 13 <5<16 years 327 <5 314 29 (9.2) 309 65 (21.0)≥16 years 102 <5 495 81 (16.4) 512 100 (19.5)<18 years 350 <5 363 46 (12.7) 337 74 (22.0)≥18 years 79 <5 446 64 (14.3) 484 91 (18.8)Overall 429 <5 809 110 (13.6) 821 165 (20.1)
1.28 Hypertonic saline
This treatment helps to thin mucus so that it is easier to cough out of the body.
1.29 Burden of treatment
The Venn diagram shows how many people with CF are on one or more inhaled therapies and the combinations they take. A total of 451 (54.9%) people in Scotland are on no inhaled therapies.
Inhaled antibiotics
DNase
Hypertonic saline or mannitol
96(11.7%)
96(11.7%)
41(5.0%)
61(7.4%)
145(17.6%)
39(4.7%)
30(3.6%)
No inhaled therapy:451 (54.9%)

34 UK Cystic Fibrosis Registry 2017 Annual Data Report - Scotland
Other Therapies
1.30 CFTR modifiers
Ivacaftor
Ivacaftor was first approved for use on the NHS in England in January 2013. Soon after, it was made available in Wales, Scotland and Northern Ireland. Since this time, ivacaftor’s license has expanded across age ranges and mutation types. At the time of writing, ivacaftor is approved for use on the NHS across the UK for people aged two and older with a least one copy of nine specific CFTR mutations, known as ‘gating’ mutations. Ivacaftor is additionally approved for use on the NHS in Wales for people aged 18 and over with the R117H mutation.
People with CF tend to have a higher amount of chloride in their sweat than a person without cystic fibrosis. This measurement is called ‘sweat chloride’ and is measured in mmol/litre.
Ivacaftor/Lumacaftor
Ivacaftor/Lumacaftor is licensed for use in patients aged 12 and over with two copies of the F508del mutation. In 2017 it was available to specific people with CF in the UK through a named patient access scheme. In Scotland, seven people received this drug in 2017.
Number of patients on ivacaftor in Scotland 70
Sweat chloride before ivacaftor 99 (95-104)
Sweat chloride 6-8 weeks after ivacaftor 49 (40-67)
FEV1% before ivacaftor 62.5 (47.5-79.8)
FEV1% 6-8 weeks after ivacaftor 72.5 (53.2-81.6)
Number of patients stopped ivacaftor ever 7
1.31 Oxygen and non-invasive ventilation
Overall (n=858)
<16 years (n=320)
≥16 years (n=538)
<18 years (n=348)
≥18 years (n=510)
Non-invasive ventilation (NIV); n (%) 9 (1.0) <5 ≥5 <5 ≥5
Long-term oxygen; n (%) 44 (5.1) 5 (1.6) 39 (7.2) 6 (1.7) 38 (7.5)
Among those who have long-term oxygen:
Continuously 10 (22.7) <5 ≥5 < 5 ≥5
Nocturnal or with exertion 12 (27.3) 0 (0.0) 12 (30.8) 0 (0.0) 12 (31.6)
As required (PRN) 7 (15.9) 0 (0.0) 7 (17.9) <5 ≥5
With exacerbation 15 (34.1) <5 ≥5 <5 ≥5

35cysticfibrosis.org.uk
1.32 Physiotherapy
Physiotherapy helps people with CF clear sticky mucus from their lungs.
Overall (n=858)
<16 years (n=320)
≥16 years (n=538)
<18 years (n=348)
≥18 years (n=510)
Active cycle of breathing tech-niques; n (%)
137 (16.0) 23 (7.2) 114 (21.2) 29 (8.3) 108 (21.2)
Autogenic drainage (including assisted autogenic drainage); n (%)
380 (44.3) 73 (22.8) 307 (57.1) 86 (24.7) 294 (57.6)
Postural drainage; n (%) 7 (0.8) ≥5 <5 ≥5 <5
Any form of positive expiratory pressure (PEP); n (%)
421 (49.1) 268 (83.8) 153 (28.4) 284 (81.6) 137 (26.9)
VEST; n (%) <5 <5 <5 <5 <5
Exercise; n (%) 457 (53.3) 141 (44.1) 316 (58.7) 155 (44.5) 302 (59.2)
Other; n (%) 188 (21.9) 138 (43.1) 50 (9.3) 143 (41.1) 45 (8.8)
1.33 FeedingSupplementary feeding, often using a nasogastric (via the nose) or gastrostomy (via the abdomen) tube directly to the stomach, is considered when a person with CF has poor weight gain, or progressive weight loss, despite efforts to increase oral intake.
1.34 TransplantsLung transplantation has been available to people with CF for almost 30 years. Today, the most common operation carried out is a double-lung transplant, or ‘Bilateral Sequential Lung Transplant’. The following table gives information about transplant activity over time.
Note that these techniques are not mutually exclusive and represent primary and secondary forms of physiotherapy.
Overall (n=858)
<16 years (n=320)
≥16 years (n=538)
<18 years (n=348)
≥18 years (n=510)
Any supplemental feeding; n (%) 191 (22.3) 67 (20.9) 124 (23.0) 70 (20.1) 121 (23.7)
Nasogastric tube; n (%) 15 (1.7) 5 (1.6) 10 (1.9) 5 (1.4) 10 (2.0)
Gastrostomy tube/button; n (%) 26 (3.0) 13 (4.1) 13 (2.4) 13 (3.7) 13 (2.5)
Jejunal; n (%) 0 (0.0) 0 (0.0) 0 (0.0) 0 (0.0) 0 (0.0)
Total parenteral nutrition (TPN); n (%) <5 0 (0.0) <5 0 (0.0) <5
2013 2014 2015 2016 2017
Number evaluated 21 17 19 18 22
Number accepted 11 12 6 8 11
Number receiving transplants <5 6 <5 6 <5
Bilateral lung <5 6 <5 <5 <5
Heart and lung 0 0 0 0 0
Liver 0 0 0 0 0
Other 0 0 0 <5 <5

36 UK Cystic Fibrosis Registry 2017 Annual Data Report - Scotland
Genotypes
Genotypes are part of the genetic makeup of an individual that usually control a particular characteristic, known as a phenotype. For people with CF, their genotype reveals which mutations of the CF gene causes their cystic fibrosis. Everyone living with CF has two mutations of the gene for CFTR; one on each allele. One is inherited from their mother, and one from their father. If both mutations (or genotypes) are the same, the person is said to be homozygous. Someone who has two different variants is heterozygous.
852 (99.3%) patients have been genotyped with at least one recorded value.
F508del Mutations: n (%)
Homozygous F508del: 365 (42.8%)
Heterozygous F508del: 399 (46.8%)
1.35 Genotypes in the UK population
The table below shows the number of people with CF who carry at least one of each mutation. The groups are not mutually exclusive, as people with heterozygous mutations appear twice in the table.
Nucleotide Protein Legacy name N %
c.1521_1523delCTT p.Phe508del F508del 765 89.2
c.1652G->A p.Gly551Asp G551D 91 10.6
c.350G->A p.Arg117His R117H 71 8.3
c.1624G->T p.Gly542X G542X 62 7.2
c.200C->T p.Pro67Leu P67L 35 4.1
c.1679G->C p.Arg560Thr R560T 17 2.0
c.1585-1G->A 1717-1G->A 14 1.6
c.1477C->T p.Gln493X Q493X 14 1.6
c.3454G->C p.Asp1152His D1152H 12 1.4
c.489+1G->T 621+1G->T 12 1.4
c.3909C->G p.Asn1303Lys N1303K 12 1.4
c.2657+5G->A 2789+5G->A 10 1.2
c.3528delC p.Lys1177SerfsX15 3659delC 10 1.2
c.178G->T p.Glu60X E60X 8 0.9
c.1558G->T p.Val520Phe V520F 7 0.8
c.1210-12[5](AJ574948.1:g.152T[5]) 5T 6 0.7
c.948delT p.Phe316LeufsX12 1078delT 6 0.7
c.3717+12191C->T 3849+10kbC->T 5 0.6
c.1705T->G p.Tyr569Asp Y569D 5 0.6
c.1364C->A p.Ala455Glu A455E 5 0.6
c.1519_1521delATC p.Ile507del I507del <5 -
c.1766+1G->A 1898+1G->A <5 -
c.3140-26A->G 3272-26A->G <5 -
c.2657+2_2657+3insA 2789+2insA <5 -
c.254G->A p.Gly85Glu G85E <5 -

37cysticfibrosis.org.uk
Nucleotide Protein Legacy name N %
c.3846G->A p.Trp1282X W1282X <5 -
c.223C->T p.Arg75X R75X <5 -
c.2988G->A 3120G->A <5 -
c.2988+1G->A 3120+1G->A <5 -
c.2012delT p.Leu671X 2143delT <5 -
c.1657C->T p.Arg553X R553X <5 -
c.3196C->T p.Arg1066Cys R1066C <5 -
c.273+1G->A 405+1G->A <5 -
c.274G->A p.Glu92Lys E92K <5 -
c.579+3A->G 711+3A->G <5 -
c.2583delT p.Phe861LeufsX3 2711delT <5 -
c.3266G->A p.Trp1089X W1089X <5 -
c.3884_3885insT p.Ser1297PhefsX5 4016insT <5 -
c.443T->C p.Ile148Thr I148T <5 -
c.3484C->T p.Arg1162X R1162X <5 -
c.1466C->A p.Ser489X S489X <5 -
c.1000C->T p.Arg334Trp R334W <5 -
c.2490+1G->A 2622+1G->A <5 -
c.579+1G->T 711+1G->T <5 -
c.1753G->T p.Glu585X E585X <5 -
c.1209+1G->A 1341+1G->A <5 -
c.3705T->G p.Ser1235Arg S1235R <5 -
c.3276C->A p.Tyr1092X Y1092X(C->A) <5 -
c.2052delA p.Lys684AsnfsX38 2184delA <5 -
Other selected 107 12.5

38 UK Cystic Fibrosis Registry 2017 Annual Data Report - Scotland
Paediatric Adult Total
Centres 5 3 8
Stand-alone clinics 2 0 2
Section 2: Centre-level analysisCystic fibrosis care in Scotland is led by eight regional centres, two stand-alone clinics and three networked clinics. The breakdown of centres and clinics delivering paediatric and adult care is shown below:
Section 2 shows analysis of data for individual CF centres. This allows people with CF, their families, and healthcare providers, to review a centre’s use of some medications and outcome data alongside national averages. This transparency is intended to help improve standards of care overall.
If a person with CF or a member of their family has questions about the results for their CF centre or clinic, they should discuss this with their CF team.
Full tables of the data are shown in appendix 2 on page 62.
Key
Paediatric centre Adult centre
Lots of different factors can affect the outcomes of people with CF in centres, not all of which are within a centre’s control. This might include the economic profile of the area, the age at which the person with CF was diagnosed and referred to the centre and certain patient characteristics such as their gender, as well as facilities, care pathways, and the medical team providing care.

39cysticfibrosis.org.uk
A guide to the chartsSome of the data in this section are shown as ‘box plots’. We also show the data in ‘funnel plots’.
Box plots
This line shows the upper quartile.
This line shows the median.
This line shows the lower quartile.
The width of the box shows the interquartile range.
This whisker shows the lowest value.
This whisker shows the highest value.
The ‘box’ shows the middle half of the data for that centre, going from the first quartile to the third quartile. The longer the box, the more varied the data for that centre.
The horizontal line within the box shows the median result for that centre.
The ‘whiskers’ above and below the box show the highest and lowest values for that centre, excluding any outliers.
The position of the box between the whiskers shows any skew in the data. If a box is towards the top of the whisker, more of the people for this centre were recorded at the high end of the scale.

40 UK Cystic Fibrosis Registry 2017 Annual Data Report - Scotland
Section 2a Paediatric centre analysis
This section shows results for the six paediatric centres with their network clinics, and one stand-alone clinic.
2.1 Median FEV1 % predicted among patients aged 6 and older by paediatric centre/clinic (without a history of lung transplant) (GLI equations)
2550
7510
012
515
020
017
5
Centre/clinic ID
FE
V1%
pre
dic
ted
1 3 8 15 17 22 25 29 30 32 56 59 60 62 71 72 90 94 96 97 98 104
107
139
143
144
162
UK
SC
31*
73*
75*
111*
170*
170*
020
4060
8010
0B
MI p
erce
ntile
1 3 8 15 17 22 25 29 30 32 56 59 60 62 71 72 73 75 90 94 96 97 98 104
107
111
139
143
144
162
170
UK
SC
31*
Centre/clinic ID
The median FEV1 % predicted of patients attending paediatric centres/clinics in Scotland is 89.5% predicted (IQR: 80.0-98.2).
2.2 Median Body Mass Index (BMI) percentile among patients aged 2-15 years by paediatric centre/clinic
The median BMI percentile of patients attending paediatric centres/clinics in Scotland is 52 (IQR: 34-75).
Services in the UK
Services in Scotland
Services in the UK
Services in Scotland
Key
Key

41cysticfibrosis.org.uk
2.3 Data completeness by paediatric centre/clinic
020
4060
8010
0
Dat
a co
mp
lete
ness
(%)
31 56 73 170 UK SC75 143 162
Centre/clinic ID
Pro
po
rtio
n (%
)0
2015
105
1 3 8 15 17 22 25 29 30 31*
32 56 59 60 62 71 72 73 75 90 94 96 97 98 104
107
111
139
143
144
162
170
UK
SC
Centre/clinic ID
The mean data completeness for Annual Review FEV1% predicted across Scottish paediatric centres is 95%. The mean data completeness for Best FEV1 % predicted across Scottish paediatric centres is 77%.
2.4 Proportion of patients with chronic P. aeruginosa by paediatric centre/clinic
4.8% of paediatric patients attending clinics in Scotland during 2017 were infected with chronic P. aeruginosa.
Annual Review FEV1
Best FEV1
Services in the UK
Services in Scotland
Key
Key

42 UK Cystic Fibrosis Registry 2017 Annual Data Report - Scotland
2.5 Proportion of patients receiving DNase treatment by paediatric centre/clinic
Pro
po
rtio
n (%
)0
8060
4020
1 3 8 15 17 22 25 29 30 31*
32 56 59 60 62 71 72 73 75 90 94 96 97 98 104
107
111
139
143
144
162
170
UK
SC
Centre/clinic ID
Pro
po
rtio
n (%
)0
8090
6070
4050
2030
10
1 3 8 15 17 22 25 29 30 31*
32 56 59 60 62 71 72 73 75 90 94 96 97 98 104
107
111
139
143
144
162
170
UK
SC
Centre/clinic ID
Services in the UK
Services in Scotland
Services in the UK
Services in Scotland
Key
Key
The proportion of patients attending paediatric centres/clinics in Scotland receiving DNase treatment is 31.5%.
2.6 Proportion of patients receiving hypertonic saline treatment by paediatric centre/clinic
The proportion of patients attending paediatric centres/clinics in Scotland receiving DNase treatment is 20.9%.

43cysticfibrosis.org.uk
The median age of patients attending adult services in Scotland is 28 years (IQR: 22-37).
2.8 Median FEV1 % predicted by adult service (without a history of lung transplant) (GLI equations)
The median FEV1 % predicted of patients attending adult services in Scotland is 63% (IQR: 43 – 82).
Section 2b Adult centre analysis
This section shows results for the three adult centres with their network clinics.
2.7 Median age (years) by adult service
010
2030
4050
6070
8090
Ag
e (Y
ears
)
5 9 12 14 19 27 34 42 44 51 64 65 66 68 70 74 79 92 101
102
105
106
110
114
128
129
142
171
UK
SC
Centre/clinic ID
050
100
150
FE
V1%
pre
dic
ted
5 9 12 14 19 27 34 42 44 51 64 65 66 68 70 74 79 92 101
102
105
106
110
114
128
129
142
171
UK
SC
Centre/clinic ID
Services in the UK
Services in Scotland
Services in the UK
Services in Scotland
Key
Key

44 UK Cystic Fibrosis Registry 2017 Annual Data Report - Scotland
2.9 Median BMI among patients aged 16 years and older by adult service
1020
3040
50
BM
I
5 9 12 14 19 27 34 42 44 51 64 65 66 68 70 74 79 92 101
102
105
106
110
114
128
129
142
171
UK
SC
Centre/clinic ID
Services in the UK
Services in Scotland
Key
The median BMI of patients attending adult services in Scotland is 23 (IQR: 20 – 25).
2.10 Proportion of patients with chronic P. aeruginosa by adult service
The proportion of patients attending adult services in Scotland during 2017 with chronic P. aeruginosa is 39%.
Prop
ortio
n (%
)0
6040
20
Centre/clinic ID
5 9 12 14 19 27 34 42 44 51 64 65 66 68 70 74 79 92 101
102
105
106
110
114
128
129
142
171
UK
SC
Services in the UK
Services in Scotland
Key

45cysticfibrosis.org.uk
2.11 Inhaled antibiotic use for patients with chronic P. aeruginosa by adult service
The proportion of chronic P. aeruginosa patients attending clinics in Scotland during 2017 is 81.6%.
2.12 Data completeness by adult service
The mean data completeness for Annual Review FEV1% predicted across Scottish adult centres in 2017 is 95%. The mean data completeness for Best FEV1 % predicted across adult Scottish centres is 91%.
Pro
po
rtio
n (%
)0
6080
100
4020
Centre/clinic ID
5 9 12 14 19 27 34 42 44 51 64 65 66 68 70 74 79 92 101
102
105
106
110
114
128
129
142
171
UK
SC
Services in the UK
Services in Scotland
Key
020
4060
8010
0
Dat
a co
mp
lete
ness
(%)
44 70 79 UK SC
Centre/clinic ID or location
Annual Review FEV1
Best FEV1
Key

46 UK Cystic Fibrosis Registry 2017 Annual Data Report - Scotland
2.13 Proportion of patients receiving DNase treatment by adult service
The proportion of patients attending adult services in Scotland during 2017 receiving DNase treatment is 44.8%.
2.14 Proportion of patients receiving hypertonic saline treatment by adult service
The proportion of patients attending adult services in Scotland during 2017 receiving hypertonic saline treatment is 18%.
Pro
po
rtio
n (%
)0
5060
8070
9030
4020
10
Centre/clinic ID
5 9 12 14 19 27 34 42 44 51 64 65 66 68 70 74 79 92 101
102
105
106
110
114
128
129
142
171
UK
SC
Pro
po
rtio
n (%
)0
5060
8070
9030
4020
10
Centre/clinic ID
5 9 12 14 19 27 34 42 44 51 64 65 66 68 70 74 79 92 101
102
105
106
110
114
128
129
142
171
UK
SC
Services in the UK
Services in Scotland
Services in the UK
Services in Scotland
Key
Key

47cysticfibrosis.org.uk
Appendices

48 UK Cystic Fibrosis Registry 2017 Annual Data Report - Scotland
*Where ‘best’ values were missing, or lower than FEV1% predicted taken at annual review, the annual review value was used.**For data completeness, ‘best’ values were taken to be valid if they were not missing and the percent predicted was not more than 0.5% lower than FEV1% predicted taken at annual review.† Adjusted for age - please see full UK CF Annual Report 2017.
Appendix 1: Centre-level data tables
Paediatric centres/clinics providing data in 2017 – ordered alphabetically
Adult centres/clinics providing data in 2017 – ordered alphabetically
Location Name IDTotal active
Number with
annual review
Age
FEV1% predicted at annual review
Best FEV1 % predicted Data completeness for FEV1
Mean Median NumberMean
unadjustedMean
adjusted †Median Number*
Mean unadjusted
Mean
adjusted †Median
Number with valid best FEV1**
Percentage with valid best FEV1
Number with FEV1 at annual
review
Percentage with FEV1 at annual
review
Scotland
Aberdeen Royal Aberdeen Children's Hospital
75 31 22 8.7 9.1 12 72.2 73.1 72.8 15 84.8 85.2 89.3 9 60.0 12 80.0
Ayr University Hospital Crosshouse
170 26 26 8.7 8.6 17 87.7 88.4 87.9 17 97.6 98.2 101.8 16 94.1 17 100.0
Dundee Ninewells Hospital 73 25 25 8.1 7.2 16 84.7 83.9 86.3 16 90.6 89.7 95.8 15 78.9 16 84.2
Edinburgh Royal Hospital for Sick Children
143 131 128 8.9 9.0 93 90.6 90.0 90.7 94 103.6 103.0 93.0 57 60.0 93 97.9
Glasgow Royal Hospital for Sick Children
56 95 68 8.5 8.8 45 89.8 89.7 91.5 45 96.0 95.7 96.8 43 93.5 45 97.8
Inverness Raigmore Hospital 31 18 17 8.0 8.9 10 88.4 88.5 88.1 10 94.3 94.4 94.0 10 90.9 10 90.9
Lanarkshire Wishaw General Hospital
162 48 44 8.3 7.7 29 91.2 90.4 91.4 30 95.8 94.8 96.4 29 96.7 29 96.7
Location Name IDTotal active
Number with
annual review
Age
FEV1% predicted at annual review
Best FEV1 % predicted Data completeness for FEV1
Mean Median NumberMean
unadjustedMean
adjusted †Median Number*
Mean unadjusted
Mean
adjusted †Median
Number with valid best FEV1**
Percentage with valid best FEV1
Number with FEV1 at annual
review
Percentage with FEV1 at annual
review
Scotland
Aberdeen Aberdeen Royal Infirmary
70 67 64 32.6 31.5 57 56.2 56.8 50.2 57 60.8 61.5 57.8 50 78.1 64 100.0
Edinburgh Western General Hospital
44 245 238 32.1 29.9 209 63.6 63.4 64.0 209 70.8 70.6 70.3 221 92.9 227 95.4
Glasgow Gartnavel General Hospital
79 237 226 31.6 27.7 205 64.9 64.6 65.3 211 70.9 70.5 72.4 207 91.6 210 92.9

49cysticfibrosis.org.uk
Location Name IDTotal active
Number with
annual review
Age
FEV1% predicted at annual review
Best FEV1 % predicted Data completeness for FEV1
Mean Median NumberMean
unadjustedMean
adjusted †Median Number*
Mean unadjusted
Mean
adjusted †Median
Number with valid best FEV1**
Percentage with valid best FEV1
Number with FEV1 at annual
review
Percentage with FEV1 at annual
review
Scotland
Aberdeen Royal Aberdeen Children's Hospital
75 31 22 8.7 9.1 12 72.2 73.1 72.8 15 84.8 85.2 89.3 9 60.0 12 80.0
Ayr University Hospital Crosshouse
170 26 26 8.7 8.6 17 87.7 88.4 87.9 17 97.6 98.2 101.8 16 94.1 17 100.0
Dundee Ninewells Hospital 73 25 25 8.1 7.2 16 84.7 83.9 86.3 16 90.6 89.7 95.8 15 78.9 16 84.2
Edinburgh Royal Hospital for Sick Children
143 131 128 8.9 9.0 93 90.6 90.0 90.7 94 103.6 103.0 93.0 57 60.0 93 97.9
Glasgow Royal Hospital for Sick Children
56 95 68 8.5 8.8 45 89.8 89.7 91.5 45 96.0 95.7 96.8 43 93.5 45 97.8
Inverness Raigmore Hospital 31 18 17 8.0 8.9 10 88.4 88.5 88.1 10 94.3 94.4 94.0 10 90.9 10 90.9
Lanarkshire Wishaw General Hospital
162 48 44 8.3 7.7 29 91.2 90.4 91.4 30 95.8 94.8 96.4 29 96.7 29 96.7
Location Name IDTotal active
Number with
annual review
Age
FEV1% predicted at annual review
Best FEV1 % predicted Data completeness for FEV1
Mean Median NumberMean
unadjustedMean
adjusted †Median Number*
Mean unadjusted
Mean
adjusted †Median
Number with valid best FEV1**
Percentage with valid best FEV1
Number with FEV1 at annual
review
Percentage with FEV1 at annual
review
Scotland
Aberdeen Aberdeen Royal Infirmary
70 67 64 32.6 31.5 57 56.2 56.8 50.2 57 60.8 61.5 57.8 50 78.1 64 100.0
Edinburgh Western General Hospital
44 245 238 32.1 29.9 209 63.6 63.4 64.0 209 70.8 70.6 70.3 221 92.9 227 95.4
Glasgow Gartnavel General Hospital
79 237 226 31.6 27.7 205 64.9 64.6 65.3 211 70.9 70.5 72.4 207 91.6 210 92.9

50 UK Cystic Fibrosis Registry 2017 Annual Data Report - Scotland
Appendix 1: Centre-level data tables
Paediatric centres/clinics providing data in 2017 – ordered alphabetically
Adult centres/clinics providing data in 2017 – ordered alphabetically
Location Name ID
BMI percentile Chronic pseudomonas Having at least 1 IV day Receiving DNase treatmentReceiving hypertonic saline
treatment
Inhaled antibiotic use among patients with
chronic pseudomonas
NumberMean
unadjustedMean
adjusted †Median Number
Proportion (%)
NumberProportion
(%)Number
Proportion (%)
NumberProportion
(%)Number
Proportion (%)
Scotland
Aberdeen Royal Aberdeen Children's Hospital
75 19 47.9 48.2 39.9 0 0 6 27.3 5 22.7 <5 4.5 0 0
Ayr University Hospital Crosshouse
170 17 67.4 67.7 70.5 0 0 6 23.1 5 19.2 6 23.1 0 0
Dundee Ninewells Hospital 73 19 43.7 43.3 44.7 <5 12 6 24.0 6 24.0 11 44.0 <5 100
Edinburgh Royal Hospital for Sick Children
143 111 56.3 56.4 54.3 8 6.3 30 23.4 67 52.3 16 12.5 7 87.5
Glasgow Royal Hospital for Sick Children
56 62 52.9 52.9 51.8 0 0 28 41.2 14 20.6 23 33.8 0 0
Inverness Raigmore Hospital 31 10 58.0 57.9 61.5 <5 17.6 <5 23.5 <5 11.8 <5 5.9 <5 66.7
Lanarkshire Wishaw General Hospital
162 32 52.5 52.3 55.0 <5 4.5 11 25.0 5 11.4 11 25.0 <5 100
Location Name ID
BMI Chronic pseudomonas Having at least 1 IV day Receiving DNase treatmentReceiving hypertonic saline
treatment
Inhaled antibiotic use among patients with
chronic pseudomonas
NumberMean
unadjustedMean
adjusted †Median Number
Proportion (%)
NumberProportion
(%)Number
Proportion (%)
NumberProportion
(%)Number
Proportion (%)
Scotland
Aberdeen Aberdeen Royal Infirmary
70 64 23.7 23.5 22.6 27 42.2 26 40.6 27 42.2 23 35.9 26 96.3
Edinburgh Western General Hospital
44 229 22.7 22.6 22.5 88 37.0 101 42.4 101 42.4 43 18.1 58 65.9
Glasgow Gartnavel General Hospital
79 218 22.7 22.8 22.7 92 40.7 88 38.9 109 48.2 30 13.3 85 92.4
† Adjusted for age - please see full UK CF Annual Report 2017.

51cysticfibrosis.org.uk
Location Name ID
BMI percentile Chronic pseudomonas Having at least 1 IV day Receiving DNase treatmentReceiving hypertonic saline
treatment
Inhaled antibiotic use among patients with
chronic pseudomonas
NumberMean
unadjustedMean
adjusted †Median Number
Proportion (%)
NumberProportion
(%)Number
Proportion (%)
NumberProportion
(%)Number
Proportion (%)
Scotland
Aberdeen Royal Aberdeen Children's Hospital
75 19 47.9 48.2 39.9 0 0 6 27.3 5 22.7 <5 4.5 0 0
Ayr University Hospital Crosshouse
170 17 67.4 67.7 70.5 0 0 6 23.1 5 19.2 6 23.1 0 0
Dundee Ninewells Hospital 73 19 43.7 43.3 44.7 <5 12 6 24.0 6 24.0 11 44.0 <5 100
Edinburgh Royal Hospital for Sick Children
143 111 56.3 56.4 54.3 8 6.3 30 23.4 67 52.3 16 12.5 7 87.5
Glasgow Royal Hospital for Sick Children
56 62 52.9 52.9 51.8 0 0 28 41.2 14 20.6 23 33.8 0 0
Inverness Raigmore Hospital 31 10 58.0 57.9 61.5 <5 17.6 <5 23.5 <5 11.8 <5 5.9 <5 66.7
Lanarkshire Wishaw General Hospital
162 32 52.5 52.3 55.0 <5 4.5 11 25.0 5 11.4 11 25.0 <5 100
Location Name ID
BMI Chronic pseudomonas Having at least 1 IV day Receiving DNase treatmentReceiving hypertonic saline
treatment
Inhaled antibiotic use among patients with
chronic pseudomonas
NumberMean
unadjustedMean
adjusted †Median Number
Proportion (%)
NumberProportion
(%)Number
Proportion (%)
NumberProportion
(%)Number
Proportion (%)
Scotland
Aberdeen Aberdeen Royal Infirmary
70 64 23.7 23.5 22.6 27 42.2 26 40.6 27 42.2 23 35.9 26 96.3
Edinburgh Western General Hospital
44 229 22.7 22.6 22.5 88 37.0 101 42.4 101 42.4 43 18.1 58 65.9
Glasgow Gartnavel General Hospital
79 218 22.7 22.8 22.7 92 40.7 88 38.9 109 48.2 30 13.3 85 92.4

52 UK Cystic Fibrosis Registry 2017 Annual Data Report - Scotland
Word/Phrase Meaning
2017 1 January 2017 – 31 December 2017
ABPA (allergic bronchopulmonary aspergillosis)
When a person develops a respiratory allergic reaction to Aspergillus fumigatus.
Arthritis A condition causing pain and inflammation in the joints.
Arthropathy A condition causing pain in the joints.
AsthmaA respiratory condition causing reversible episodes of difficulty breathing, often associated with wheezing.
B. cepacia complexBurkholderia cepacia complex are a group of bacteria, some of which threaten the health of people with cystic fibrosis.
BMI (Body Mass Index) A measure designed to show whether a person is a healthy weight for their height.
CF Cystic fibrosis
CFTR (cystic fibrosis transmembrane conductance regulator)
A protein at the cell surface that controls the salt and water balance across a cell. The gene that causes cystic fibrosis is the blueprint for the CFTR protein. Everyone has two copies of the gene for CFTR. To be born with cystic fibrosis, both CFTR genes must be affected by a CF-causing mutation.
Chronic Persistent, or long-lasting.
Cirrhosis A chronic liver disease.
CI (confidence interval)
A way of expressing how certain we are about our statistical estimates of a clinical measure (eg BMI). It gives a range of results that is likely to include the ‘true’ value for the population. A narrow confidence interval indicates a more precise estimate. A wide confidence interval indicates more uncertainty about the true value of the clinical measure - often because a small group of patients has been studied. The confidence interval is usually stated as ‘95% CI’, which means that the range of values has a 95 in 100 chance of including the ‘true’ value.
EnzymesBiological molecules that help complex reactions, such as digestion of food, occur in the body.
FEV1 (forced expiratory volume in one second)
This is the amount of air that a person can blow out of the lungs in the first second of a forced exhaled breath. People with healthy lungs can blow out most of the air held in this time.
FEV1% predictedThe FEV1 can be converted from absolute litres of air blown out into a predicted percentage (%). A healthy range for % predicted is calculated from a very large population sample, and is normally considered to be between 80-120% predicted.
Fibrosing colonopathy A condition causing narrowing of part of the colon.
Gall bladderThe small sac-shaped organ under the liver that stores bile after it is secreted by the liver, before it is released into the intestine.
GI (Gastrointestinal)The GI tract is the organ system responsible for digesting food, absorbing nutrients and expelling waste.
GenotypePart of the genetic makeup of a cell, organism or individual that usually controls a particular characteristic (known as a phenotype).
GERD (gastroesophageal reflux disease)
A chronic symptom of damage caused by stomach acid coming up from the stomach into the oesophagus.
GI bleed Bleeding in the gastrointestinal tract.
GLI equationsGlobal Lung Initiative, the equation used for calculating FEV1% predicted from absolute FEV1 that takes into account age, gender, height and ethnicity.
H. influenza Haemophilus influenza is a bacterium that can cause serious illness.
Haemoptysis The coughing up of blood.
Hepatobiliary disease A liver or biliary disorder.
HeterozygousEveryone living with cystic fibrosis has two mutations of the gene for CFTR, one inherited from their mother and one from their father. Someone who has two different mutations is heterozygous.
Glossary

53cysticfibrosis.org.uk
Word/Phrase Meaning
HomozygousEveryone living with cystic fibrosis has two mutations of the gene for CFTR, one inherited from their mother and one from their father. If both mutations (or genotypes) are the same, the person is said to be homozygous.
Hypertension High blood pressure.
Incidence The number of people newly diagnosed with a condition in the given year.
IQR (Interquartile range)Also called the mid-spread, or middle fifty, IQR is a measure of the spread of data. It shows the difference between the upper and lower quartiles. IQR = Q3 − Q1.
MeanA type of average, calculated by adding up all the values and dividing by the number of values.
Median The middle number, when all numbers are arranged from smallest to largest.
Median age of deathMedian age of death is based on the people with CF who died in any given year. So in 2017 the median age of the 132 people who died was 31.
Median predicted survivalA mathematical formula predicts how long we expect half of people with CF born today will live. Half of people born today are predicted to live to at least 47 years. Half of people are therefore predicted to die before they reach that age.
MRSAMethicillin-resistant Staphylococcus aureus is a type of bacteria that is resistant to a number of widely used antibiotics.
Mutation
A mutation is a change in a gene. When both of a child’s parents are carriers of a CF-causing mutation there is a 25% chance that the child will have cystic fibrosis. There are over 1,400 different mutations of the CFTR gene that can cause cystic fibrosis.
Nasal polypsSmall, sac-like growths of inflamed mucus caused by chronic inflammation of the nasal lining.
NBS (newborn screening)Newborn screening is part of the heel prick blood spot testing done at 5-7 days of age. The blood sample is tested for a number of conditions, including cystic fibrosis.
NTM (Nontuberculous Mycobacteria)
A mycobacterium that does not cause tuberculosis, but which can cause respiratory infection. There are several types known.
OsteopeniaA medical condition less severe than osteoporosis, where the mineral content of bone is reduced.
Osteoporosis A condition where the bones become brittle from loss of tissue.
Pancreas An organ in the digestive system that produces insulin and digestive enzymes.
Pancreatitis Inflammation of the pancreas.
Peptic ulcer Or, stomach ulcer, is an open sore that develops in the lining of the stomach.
PercentileA percentile shows where a value stands, relative to the rest of the data. If a value is higher than 90% of the rest of the data, it is at the 90th percentile.
PneumothoraxA collection of air in the cavity between the lungs and the chest wall causing collapse of the lung on the affected side.
Portal hypertensionHigh blood pressure in the portal vein system, which is the blood system of the liver.
Prenatal Before birth, while the baby is still in the womb.
Prevalence The overall number of people with the condition in the last 12 months.
Pseudomonas aeruginosaA tough bacterial strain. Rarely affecting healthy people, it can cause a wide range of infections, particularly in those with a weakened immune system.
Rectal prolapse When the rectal wall slides through the anus.
Renal Relating to the kidneys.
Staphylococcus aureus Staphylococcus aureus is a bacterium that can cause disease if it enters the body.
Sinus diseaseWhen the sinuses, which are usually filled with air, are typically full of thick sticky mucus.
Statistically significantThis phrase means that after careful calculations there is a definite difference between two groups, which is not simply a result of chance.

54 UK Cystic Fibrosis Registry 2017 Annual Data Report - Scotland
Appendix 2: UK CF Registry Steering Committee structure UK CF Registry Steering Committee
Role Forename Surname Organisation
Pharmacovigilance PIDiana Bilton Royal Brompton Hospital
CF physician – adults (retired)
Registry consultant Noreen Caine Cystic Fibrosis Trust
Pharmacovigilance PISiobhán Carr Royal Brompton Hospital
CF physician - paediatrics
Senior Statistician † Susan Charman Cystic Fibrosis Trust
Director of Data & Quality Improvement Rebecca Cosgriff Cystic Fibrosis Trust
Pharmacovigilance PISteve Cunningham
Royal Hospital for Sick ChildrenCF physician - paediatrics
Parent representative Marian Dmochowska N/A
Registry Clinical Data Manager † Elaine Gunn Cystic Fibrosis Trust
Person with CF Dominic Kavanagh Cystic Fibrosis Trust
Pharmacovigilance PINicholas Simmonds Royal Brompton Hospital
CF physician - adults
CF physician - adults*# Martin Wildman Northern General Hospital
Registry Development Manager † Mary Yip Cystic Fibrosis Trust
*Chair † Non-voting member # Caldicott guardian
Role Forename Surname Organisation
Director of Impact † Keith Brownlee Cystic Fibrosis Trust
CF physician – paediatrics* Siobhán Carr Royal Brompton Hospital
Senior Statistician † Susan Charman Cystic Fibrosis Trust
Director of Data & Quality Improvement
Rebecca Cosgriff Cystic Fibrosis Trust
Cystic fibrosis centre data manager Lance Dennard Lewisham Hospital
CF physician - paediatrics Iolo Doull Children’s Hospital for Wales
CF physician - adults Caroline Elston King’s College Hospital
Commissioner, England Kathy Blacker NHS England
Registry Clinical Data Manager † Elaine Gunn Cystic Fibrosis Trust
Registry Development Manager † Mary Yip Cystic Fibrosis Trust
Commissioner, Wales † Claire Nelson NHS Wales
Allied health professional Alan Peres Royal Brompton Hospital
CF physician - adults Simon Range Glenfield Hospital
Commissioner, Scotland David Steele NHS Scotland
Person with CF James Thomson N/A
Parent representative Grant Valentine N/A
Chair of the Research Committee # Martin Wildman Northern General Hospital
UK CF Registry Research Committee

55cysticfibrosis.org.uk

© Cystic Fibrosis Trust 2018. Registered as a charity in England and Wales (1079049) and in Scotland (SC040196). A company limited by guarantee, registered in England and Wales number 3880213. Registered office: 2nd Floor, One Aldgate, London EC3N 1RE.
cysticfibrosis.org.uk
Fighting for a Life Unlimited