UH-60A Airloads Wind Tunnel Data Update Tom Norman Airloads Workshop Feb 28 – Mar 1, 2013.
14
UH-60A Airloads Wind Tunnel Data Update Tom Norman Airloads Workshop Feb 28 – Mar 1, 2013
-
Upload
emerald-spencer -
Category
Documents
-
view
236 -
download
5
Transcript of UH-60A Airloads Wind Tunnel Data Update Tom Norman Airloads Workshop Feb 28 – Mar 1, 2013.

UH-60A Airloads Wind Tunnel Data Update
Tom Norman
Airloads Workshop
Feb 28 – Mar 1, 2013
2
Outline
• Current NASA Activities• Recent/Upcoming Airloads Publications• Data Storage Uncertainties• Recent Test Information
– Section moment integration error– Mean lag comparisons with analysis
3
Current NASA Activities
• Continuing data evaluation/reduction efforts for rotor data, Blade Displacement, PIV, and RBOS– Internal Govt meeting held Dec. 2012 to discuss data
reduction status and future plans– Still have some work to do on data reduction process –
work with CFD analysts providing valuable insights– Current goal to provide validated, accessible results for
key points by early fall• Continuing evaluation of slowed-rotor data with
CAMRAD• Continuing CFD validation efforts with both
OVERFLOW and FUN3D
• Completed AIAA paper showing effects of wind tunnel and LRTA models on rotor loads and performance (Chang)
• Continuing modeling in-board blade shank for better performance calculations (Romander/Lim)
• Continuing comparisons between CFD and blade deflection measurements (Romander)
• Performing computations for comparison with PIV measurements (Ahmad)
4May 3, 2011
NASA Activities - OVERFLOW
• Completed coupling of hi-res CAMRAD and RCAS with FUN3D
• Completing thrust- and speed-sweep computations– With and without LRTA– Free air vs tunnel– Trim tab vs no trim tab
• Performed computations for blade deflection pt (R42P60)– Compared airloads and pressures– Deflections yet to be examined
5May 3, 2011
NASA Activities - FUN3D
6
Recent/Upcoming Airloads Publications
• January AIAA Mtg (2) – “Analysis of the UH-60A Rotor Loads Using Wind Tunnel Data”,
Marpu et al– “Airloads Correlation of the UH- 60A Rotor Inside the 40- by 80- Foot
Wind Tunnel”, Chang et al
• AHS Forum (3)– “Wind Tunnel Measurements of the Wake of a Full-Scale UH-60A
Rotor in Forward Flight”, Wadcock et al– “Retroreflective Background Oriented Schlieren of Tip
Vortex Visualization and Mapping for UH-60 Airloads”, Schairer et al– “FUN3D Airload Predictions for the Full-Scale UH-60A Airloads
Rotor in a Wind Tunnel”, Lee-Rausch et al
• Summer AIAA Mtg (1)– “Comparison of Computed and Measured Vortex Evolution for a UH-
60A Rotor in Forward Flight”, Ahmad et al
7
Data Storage Uncertainties
• Selected wind tunnel data available to Workshop participants since Nov 2011 through NASA’s NSC Knowledge Now website
• Nov 2012 hack of NSCKN site prompted NASA to alter its security approach– Starting April 2013, all NSCKN users must have a “NASA
Identity” in order to access site– NASA Identify typically requires formal application, Govt
background check, IT security training, etc
• Looking for alternative method for data distribution (or streamlined NSCKN process)– Similar issue for distribution sites for OVERLOW and FUN3D
8
Section Moment Integration Error
• Numerical integration scheme for wind tunnel section loads is equivalent to that used for UH-60A Airloads flight test– 2nd order integration of pressures using mapped coordinates
• Although integrated pressures can theoretically be absolute or gage (p-pstatic), it was recently determined that choice can affect mean section moments– Differences noted when xducer locations on top and bottom surfaces are
different– Magnitude of differences dependent on location/magnitude of working
xducers as well as magnitude of static pressure– Does not affect normal or chord forces– Numerical integration errors minimized if use gage pressure
• Wind tunnel data reduction used absolute pressures for integration (flight test used gage)– Will re-reduce all WT data using gage pressures for best results
9
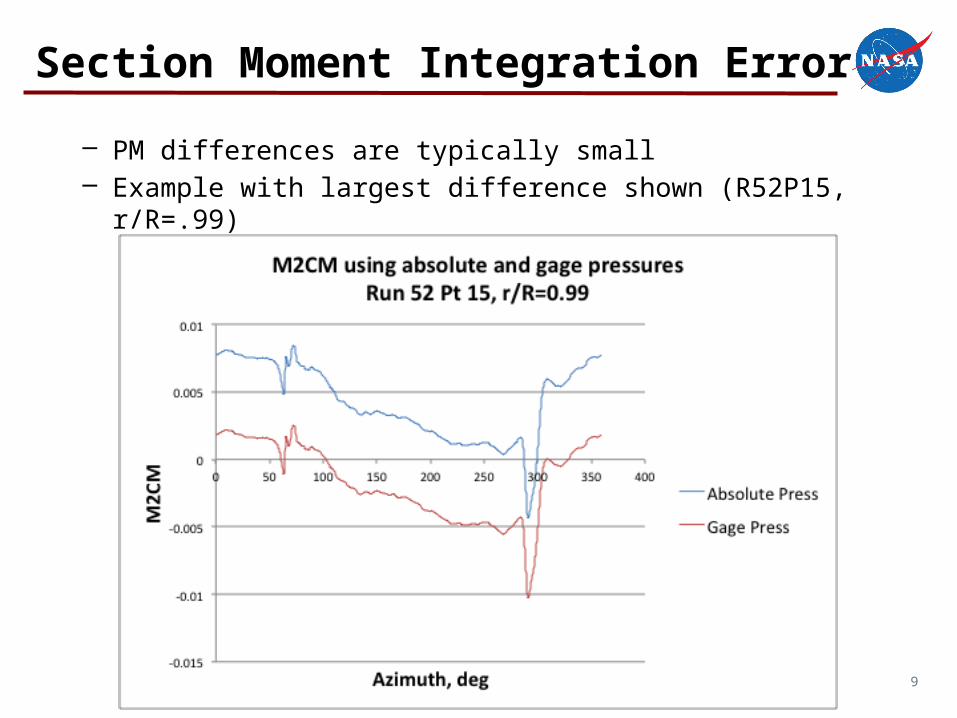
Section Moment Integration Error
– PM differences are typically small– Example with largest difference shown (R52P15, r/R=.99)
10
Mean Lag Comparisons
• Two independent systems (crabarm, laser) used to measure blade root motion during WT test
• Test data showed blade to blade and method to method differences especially for the mean– Have identified a number of possible causes for the
differences (amplifier drift, offsets, RPM/CF effects) – Still evaluating which corrections to apply
• Working with analysis, BD, and PIV data to help guide decision
11
Mean Lag Comparisons
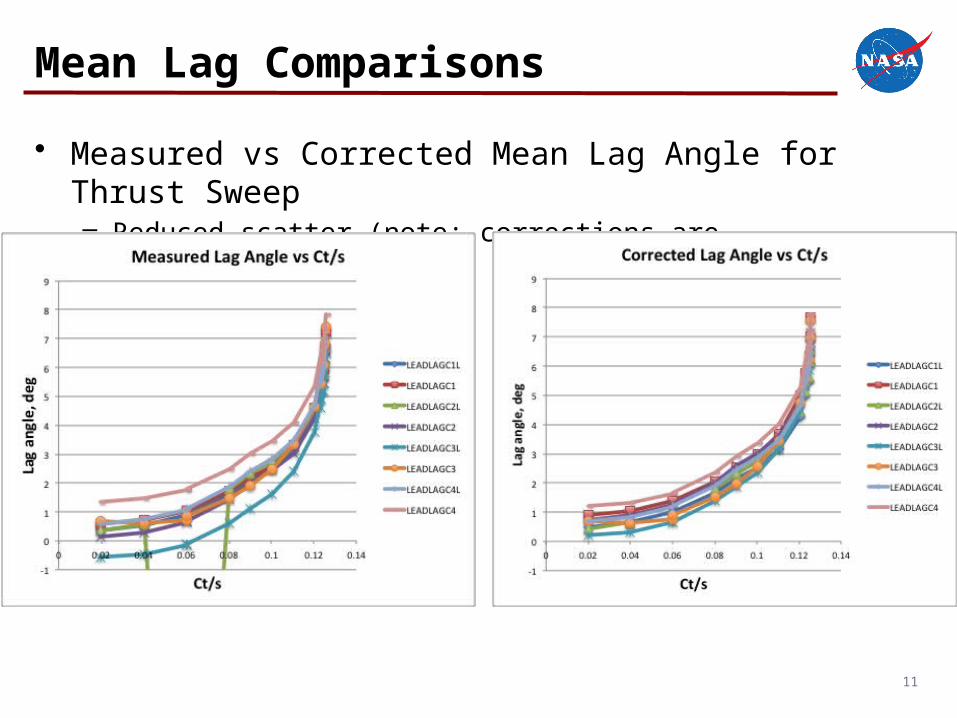
• Measured vs Corrected Mean Lag Angle for Thrust Sweep– Reduced scatter (note: corrections are preliminary)
12
Mean Lag Comparisons
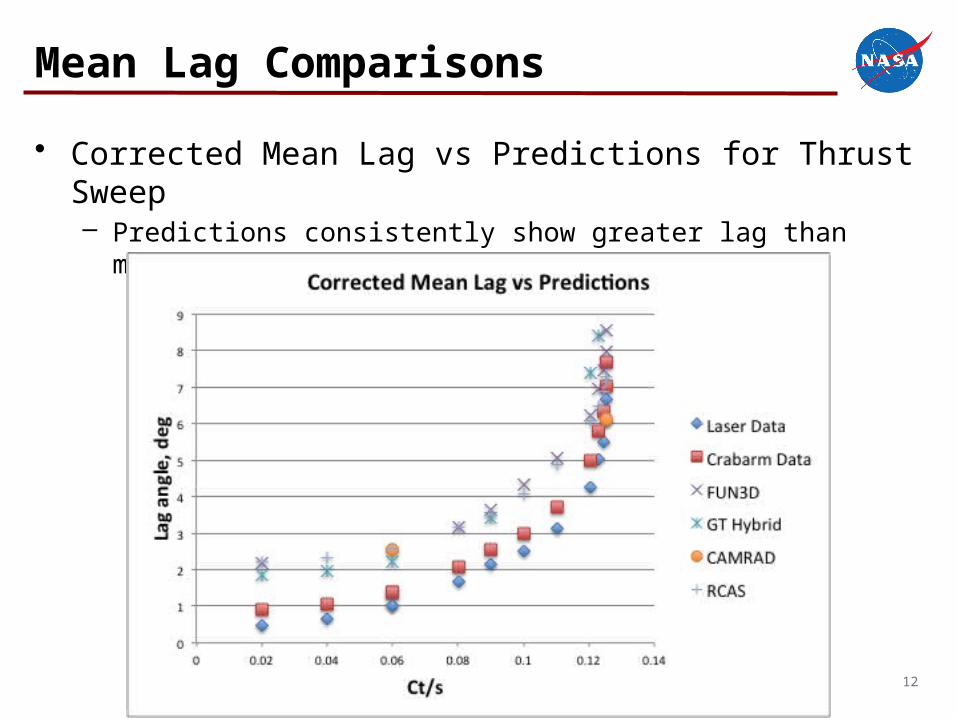
• Corrected Mean Lag vs Predictions for Thrust Sweep– Predictions consistently show greater lag than measurements
13
Mean Lag Comparisons
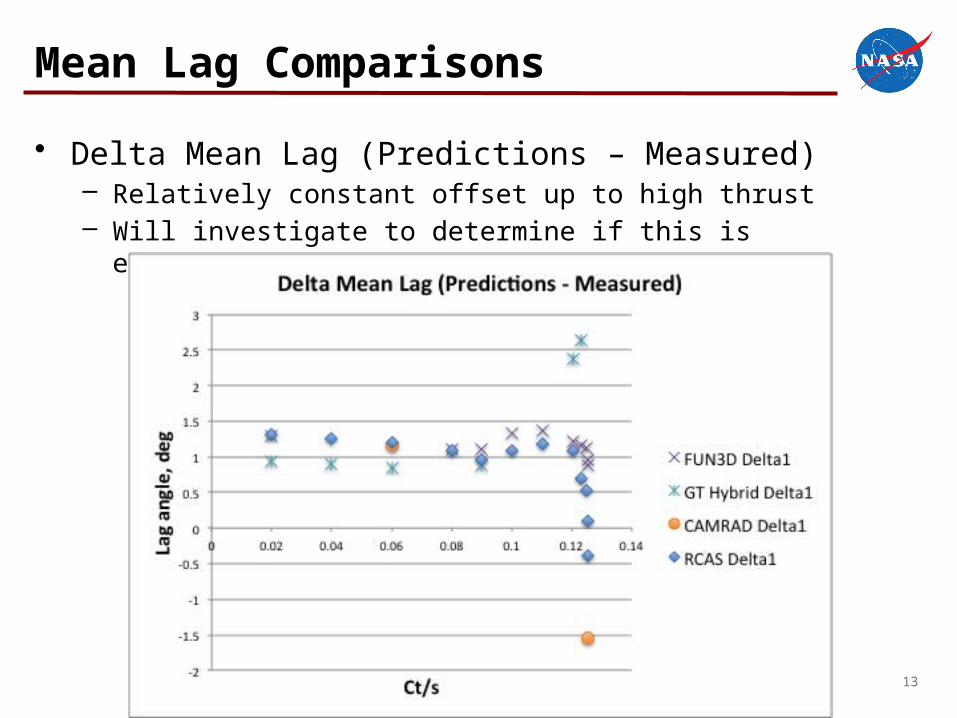
• Delta Mean Lag (Predictions – Measured)– Relatively constant offset up to high thrust – Will investigate to determine if this is experimental or analytical error

14