uestioni di Economia e Finanza - bancaditalia.it · uestioni di Economia e Finanza ccasional...
38
Questioni di Economia e Finanza (Occasional Papers) Italian banks and market-based corporate financing by Giorgio Albareto and Giuseppe Marinelli Number 432 March 2018
Transcript of uestioni di Economia e Finanza - bancaditalia.it · uestioni di Economia e Finanza ccasional...

Questioni di Economia e Finanza(Occasional Papers)
Italian banks and market-based corporate financing
by Giorgio Albareto and Giuseppe Marinelli
Num
ber 432M
arch
201
8


Questioni di Economia e Finanza(Occasional Papers)
Number 432 – March 2018
Italian banks and market-based corporate financing
by Giorgio Albareto and Giuseppe Marinelli

The series Occasional Papers presents studies and documents on issues pertaining to
the institutional tasks of the Bank of Italy and the Eurosystem. The Occasional Papers appear
alongside the Working Papers series which are specifically aimed at providing original contributions
to economic research.
The Occasional Papers include studies conducted within the Bank of Italy, sometimes
in cooperation with the Eurosystem or other institutions. The views expressed in the studies are those of
the authors and do not involve the responsibility of the institutions to which they belong.
The series is available online at www.bancaditalia.it .
ISSN 1972-6627 (print)ISSN 1972-6643 (online)
Printed by the Printing and Publishing Division of the Bank of Italy

ITALIAN BANKS AND MARKET-BASED CORPORATE FINANCING
by Giorgio Albareto* and Giuseppe Marinelli*
Abstract
The recent financial crisis has induced firms to turn increasingly to financing sources other than bank credit, and banks to boost their income from non-lending services. This paper examines the placement market for Italian corporate securities and finds that it offers Italian banks considerable opportunity for expansion as their current share amounts to a third of total placements. In the last decade the ratio of total placement fees to total interest income of Italian banks slightly rose. Returns diminished progressively until 2008 and were then virtually unchanged in the following years; the decrease was less than that in returns on loans or on securities holdings. When firms entered the stock and bond markets, bank credit was partially crowded-out and interest rates dropped for both first-time issuers and risky firms. However, when banks also played a major role both in placing corporate issues and in financing corporate issuers, lending relationships did not weaken.
JEL Classification: G21, G24, G30, G32. Keywords: stock and bond issues, securities placement, banks’ profitability, corporate financing.
Contents
1. Introduction ...........................................................................................................................5
2. The literature .........................................................................................................................5
3. The market for placement of corporate securities issues ......................................................7
3.1 An international comparison ..........................................................................................7
3.2 The Italian market ..........................................................................................................9
4. Issuers and bookrunners: characteristics and matching ......................................................11
5. Returns on placement services provided by Italian banks ..................................................12
6. Access to capital market financing and credit relationships ...............................................17
7. Conclusions .........................................................................................................................23
Statistical appendix ..................................................................................................................25
References ................................................................................................................................33
Methodological appendix.........................................................................................................35
_______________________________________
* Bank of Italy, Directorate General for Economics, Statistics and Research – Statistical Analysis Directorate.


1. Introduction *
The recent financial crisis has highlighted the flaws of a corporate financing model centred largely on bank credit, pointing to a need for action on two fronts: firms should turn more to the market as a source of finance and banks should seek alternative sources of income to lending. Thus, banks and firms share a common interest: banks could increase their supply of financial services to firms and broaden their sources of income, while firms could diversify their sources of financing by entering the financial markets (Panetta, 2013; Rossi, 2013; Signorini, 2015). To assess how realistic this scenario is, on the bank side we need to analyse the profitability (direct benefits) and the effect on lending of supplying such services (indirect costs and benefits). This paper provides some evidence on the banks’ offering of financial services to firms that will be useful in assessing whether such a scenario is likely to take hold over the next few years. Our analysis focuses on the placement of stocks and bonds issued by Italian firms, which accounts for the largest share of financial services to the corporate sector.
The literature on investment banking tends to consider the viewpoint of firms, as the short survey in the next section illustrates. This paper instead looks at the question from the banks’ side, quantifying the direct benefits (profitability) and the indirect costs and benefits for banks (effect on lending) of placing corporate issues. A comprehensive assessment should take account of the indirect benefits of establishing new credit relationships with the firms using placement services, as well as of improving corporate financial soundness, earning capacity and growth prospects, potentially leading to a broader offering of products and services. Moreover, providing securities placement services is less demanding in terms of capital absorption and may therefore be a good solution in times of tighter prudential requirements.
The paper is organised as follows. Section 2 contains a brief overview of the literature. Next, after describing how securities placement services have developed in Italy over the last years, including in comparison with the leading economies, we look at the characteristics of the banks offering such services, the firms using them, and the relationship between the two. To conclude, we offer some elements for assessing the advantages for banks of expanding their supply of services to the corporate sector: we examine the return on supplying such services and compare it with the return on other types of banking activities, assessing the potential cost of weakening credit relationships with corporate issuers.
2. The literature
The literature on investment banking1 privileges the point of view of the corporate sector over that of the banks. Some research from the United States examines the possibility of commercial banks engaging in investment banking (Puri, 1996 and 1999; Gande, Puri, Saunders and Walter, 1997; Narayanan, K.P. Rangan and N.K. Rangan, 2001). The advantages of doing so lie in the economies of scope realised in collecting information on individual clients for use in both lending and placement activity. Against these advantages, if commercial banks were to provide underwriting services, which are a normal adjunct of placement, conflicts of interest could arise from the incentive to make improper use of proprietary information: a bank might
1 This includes securities placement.
5
* We thank Massimiliano Affinito, Andrea Brandolini and Riccardo De Bonis for their comments on a previous draft of this paper.

further its own interests by asserting that a firm with poor prospects is of good quality, underwriting its securities and selling them to clients;2 alternatively, it could grant investors loans to use in order to prop up the issue price of securities; finally, a bank might only grant finance or negotiate a favourable interest rate if the firm uses its underwriting services.
Other studies have looked at whether the terms and conditions of placement services depend on the type of agent (investment bank, commercial bank or securities house). They examine the effects of lending, and its information content, on the terms of underwriting services and on a firm’s choice of bank (Hamao and Hoshi, 2000; Guazzarotti, 2002; Yasuda, 2005; Drucker and Puri, 2005). Drucker and Puri (2005) show that if firms use the same bank for loans and for placement and underwriting services, they pay less in fees and commissions and the interest rates on loans are lower than for an equivalent amount granted by banks not offering such services. This is because of the information-related economies of scope associated with combining financing and placement/underwriting. Firms with greater leverage and a lower credit rating benefit the most from the potential efficiency gains of using the same bank for borrowing and for capital market access.
Several studies have found that reputation is a key factor in the issuer’s choice of issue manager. Johnson and Miller (1988) and Carter and Manaster (1990) empirically test a theoretical model in which that choice sends a signal to the market: banks of better reputation signal lower-risk issuance, which has advantages for the firms in fixing the issue price. Later studies have noted that the long-term performance of corporate issuers is positively correlated to the reputation of the banks they use as issue managers (Carter et al., 1998; Carter et al., 2010). Jones and Swaleheen (2010) take these results one step further, making the choice of bank an endogenous variable linked to the characteristics of the issuer: less (more) risky issuers use banks with a better (worse) reputation.
Access to capital market financing may supplant bank credit for firms. Some studies have examined the substitution and complementarity between capital market financing (bond issues in particular) and bank loans, which may help in assessing the indirect costs and benefits of banks acting as issue managers. For Italy, Panetta (2001) looks at the evolution of the cost and quantity of credit used by a group of firms issuing euro-bonds for the first time, concluding that bond finance and bank credit are complementary. Finaldi Russo and Guazzarotti (2014) show that during the crisis the possibility of accessing the bond market allowed corporate issuers to eliminate a substantial part of their bank debt. These studies do not assess the effects of access to capital market financing on the issuers’ individual credit relationships with banks that do and do not provide placement services.
Very few studies on investment banking have been conducted in Italy and most of them have focused on Mediobanca’s role in the financial system (De Cecco and Ferri, 1996). On the broader topic of the role that banks play in the reallocation of corporate ownership in Italy, Pesaresi (1996) looks at the acquisition by banks of company shareholdings, which is often part of assisting a firm’s entry to the capital market.
2 This risk led to the introduction of the Glass Steagall Act in the US (Kroszner and Rajan, 1994).
6

3. The market for placement of corporate securities issues
3.1 An international comparison
The size of the market for placement services varies considerably from country to country. According to data from Dealogic3 on the value of equity and debt security placements, in 2000-2016 the US market was significantly larger than that of the other leading economies, followed by the UK; although the market was smaller in the main European countries, it was growing steadily (Table a1). The median value of non-financial companies’ issues in the UK, Japan and, to a smaller extent, the US is lower than in Italy, France and Spain, where fewer firms, usually large corporations, have access to capital market financing (Table a2).
The market for placements of corporate issues is not significantly concentrated4 and it became even less so during the financial crisis. According to the Herfindahl-Hirschman index, in 2000-2016 the concentration diminished above all in Germany, Spain and the US; in the UK, market concentration was already low in 2000 (Table a3). The Japanese market, on the other hand, is more highly concentrated and the level did not change during the period considered. From 2000 to 2016 more than 70 per cent of placement volumes in the five leading European economies, Japan and the US was handled by just ten banks; the top five, with a market share of 45 per cent, were US investment banks. Italian banks, which tend to operate exclusively on the domestic market, placed on average 1.6 per cent of the total volume of issues by non-financial companies in the seven countries listed. The three largest groups had a non negligible market share not only in Italy but also in Germany (on average 5 per cent in the debt securities segment and 3 per cent in the equity securities segment in the period considered) and, in the debt securities segment only, also in France and Spain (1 and 2 per cent respectively). Italian banks increased their market share in all three countries during the six years considered as they gradually expanded their presence abroad; they placed no share issues by UK, Japanese or US firms.
In the majority of debt security issues more than one bank acts as bookrunner, collecting investors’ orders, estimating the demand curve on which to derive the equilibrium issue price of the securities, and arranging the placement syndicate. Instead, most equity security issues are handled by a single bookrunner bank. Part of the reason for the difference may be that equity issues have a lower average value and hence there is less need for multiple sales networks. In 2000-2016 the average number of bookrunners in placement syndicates for securities issued in the leading economies increased in both segments: from 1.4 to 4.2 for debt securities and from 1.2 to 2 for equity securities (Table a5). This trend confirms that concentration is diminishing in the placement services market.
3 Dealogic data on issues relate to the issuer’s country of residence or that of the parent company of an issuer belonging to a group headed by a non-financial company. 4 The US Federal Trade Commission (FTC) defines a market as not concentrated if the Herfindahl index is below 0.15, moderately concentrated it is between 0.15 and 0.25, and highly concentrated above 0.25. The European Commission assesses the effect of mergers and acquisitions on competition according to the level of the index after the merger and the change with respect to the preceding period; the situation is not prejudicial to competition if the Herfindahl index post-operation is below 0.1 or if it falls between 0.1 and 0.2 and the change is less than 0.025.
7

Placement fees vary considerably from country to country and year to year. Those for share issues are systematically higher than for bonds, and placement costs in the US and Japan are higher than in Europe. In 2000-2016 placement fees for share issues, calculated as the ratio of total fees to the face value of the shares, ranged from a median of 5 per cent in the US to close to 6 per cent in Japan; in Europe it was about 3 per cent (Figure 1a). This is consistent with the evidence on IPOs in Europe and the US presented by Abrahamson et al. (2010). In the debt security segment fees are generally lower (under 1 per cent) and show less dispersal around the median (Figure 1b) because of the lower intrinsic riskiness of such instruments compared with equity securities and the lower frequency of underwriting in the segment.5
Figure 1: Distribution of placement fees by country (2000-2016) (per cent)
a. Equity securities b. Debt securities
Source: Dealogic. Percentage fees based on the face value of issues by non-financial companies resident in the country stated or by non-financial companies belonging to a group whose parent company is resident in the country stated. See the heading ‘Issuers’ in the Methodological Appendix for details of issuer classification and database characteristics. The horizontal lines in each boxplot represent, from bottom up, the 5th, 25th, 50th (bold line), 75th and 95th distribution percentiles.
The cross-country differences in placement fees can be put down to institutional factors, as well as to the nature of demand and supply. The cost of national disclosure and transparency requirements, legal expenses, litigiousness and court efficiency are institutional factors that may affect fees. Supply-side factors include the structure of the sales network and the presence of underpricing.6 On the demand side, the main factors are the size of the corporate issuer and the amount of the issue, which are usually closely correlated. Returns are negatively correlated to the total value of the issue: issues with a higher face value produce lower fees. Figure 2 shows,
5 Financial accounts data on security placements by banks resident in Italy indicate that about one fifth of all debt securities placed are collateralised (and may be underwritten by the issue manager banks) against almost three quarters of equity issues. 6 At the time of underwriting, bookrunners try to buy the securities at a lower price than indicated by the issuer’s fundamentals in order to gain the difference when the security is offered to the public. Banks can price placement services in such a way that fees rise if they stand to make less profit because the stock is underpriced at issue. This strategy is more common in the US than in Europe, which may go some way towards explaining the difference in placement fees (regarding IPOs see Abrahamson et al., cit.).
8

for firms issuing stocks or bonds in 2000-2016, the negative relationship between returns percentage fees on security placements and the nominal amount of the issue for the equity and debt segments: an OLS estimate of a simple linear regression and a local regression estimate of a curve highlighting any non-linear links. Issues of debt securities with a low face value carry fees in excess of 1 per cent while for those with a face value over €10 million the fees are around 0.5 per cent. On the other hand, fees for equity securities are around 6.5 per cent for all issues of low face value, falling sharply as the latter rises. These findings confirm that small firms are at a competitive disadvantage in accessing capital markets.
Figure 2: Placement percentage fees and total issue value (2000-2016)
a. Equity securities b. Debt securities
Source: Estimated using Dealogic data. Non-parametric estimates are made using the robust local regression method (see Cleveland, 1979): anomalous values are identified by a global interactive process and are weighted ∈ 0. 1 lower in the local regression curve estimate. The straight lines and the regression curves are obtained by estimating the ratio of the percentage fee applied by banks to the logarithm of the value of the securities issued.
Differences between countries in security placement fees also reflect differences in the riskiness of the corporate issuers: while the US market offers a wide range of securities, from those rated AAA to C-rated junk-bonds, the markets in other countries are more concentrated in the medium-to-high rating segments (see Figure 3 for debt securities).
3.2 The Italian market
Italian banks have offered security placement services since 1987, that is for less time than the leading international banks present on the market.7 From 2000 to 2016 the average annual value
7 Italian banks were authorised, albeit indirectly, to place and underwrite securities at issue by the 1987 amendments to the legislation (Inter-ministerial Committee for Credit and Saving Decision of 6/2/1987 and related instructions issued by the Bank of Italy on 9/3/1987). Previously, such operations were conducted mainly by the ‘special credit institutions’ or by Mediobanca (Pesaresi, 1994).
9
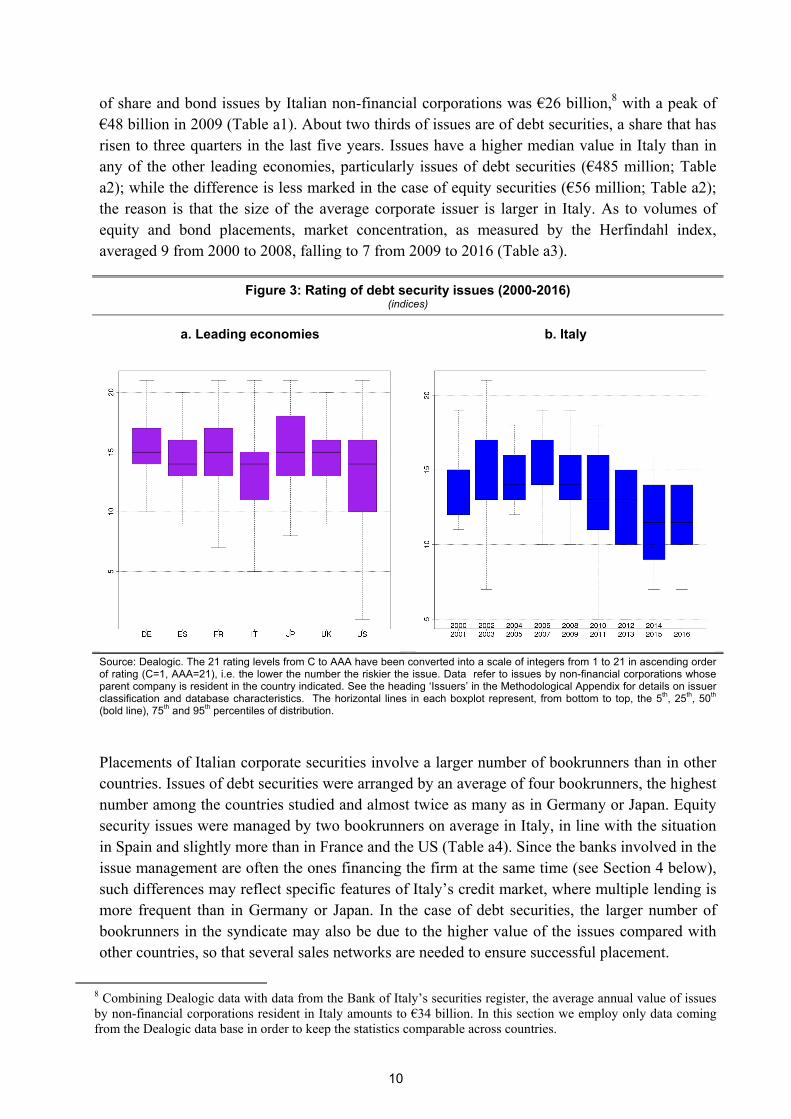
of share and bond issues by Italian non-financial corporations was €26 billion,8 with a peak of €48 billion in 2009 (Table a1). About two thirds of issues are of debt securities, a share that has risen to three quarters in the last five years. Issues have a higher median value in Italy than in any of the other leading economies, particularly issues of debt securities (€485 million; Table a2); while the difference is less marked in the case of equity securities (€56 million; Table a2); the reason is that the size of the average corporate issuer is larger in Italy. As to volumes of equity and bond placements, market concentration, as measured by the Herfindahl index, averaged 9 from 2000 to 2008, falling to 7 from 2009 to 2016 (Table a3).
Figure 3: Rating of debt security issues (2000-2016) (indices)
a. Leading economies b. Italy
Source: Dealogic. The 21 rating levels from C to AAA have been converted into a scale of integers from 1 to 21 in ascending order of rating (C=1, AAA=21), i.e. the lower the number the riskier the issue. Data refer to issues by non-financial corporations whose parent company is resident in the country indicated. See the heading ‘Issuers’ in the Methodological Appendix for details on issuer classification and database characteristics. The horizontal lines in each boxplot represent, from bottom to top, the 5th, 25th, 50th (bold line), 75th and 95th percentiles of distribution.
Placements of Italian corporate securities involve a larger number of bookrunners than in other countries. Issues of debt securities were arranged by an average of four bookrunners, the highest number among the countries studied and almost twice as many as in Germany or Japan. Equity security issues were managed by two bookrunners on average in Italy, in line with the situation in Spain and slightly more than in France and the US (Table a4). Since the banks involved in the issue management are often the ones financing the firm at the same time (see Section 4 below), such differences may reflect specific features of Italy’s credit market, where multiple lending is more frequent than in Germany or Japan. In the case of debt securities, the larger number of bookrunners in the syndicate may also be due to the higher value of the issues compared with other countries, so that several sales networks are needed to ensure successful placement.
8 Combining Dealogic data with data from the Bank of Italy’s securities register, the average annual value of issues by non-financial corporations resident in Italy amounts to €34 billion. In this section we employ only data coming from the Dealogic data base in order to keep the statistics comparable across countries.
10

Issues by Italian non-financial corporations are generally rated lower than those in the other leading European countries, particularly since 2011. This is partly due to shifts in the perception of sovereign risk, which has at times outweighed the rating of the single private issuers (Pianeselli and Zaghini, 2014; Zaghini, 2017).
From 2000 to 2016 the percentage placement fees charged to Italian firms for equity securities (3 per cent) were higher than for debt securities issues, similar to those charged in the leading European markets but lower than in the US and Japan (Fig. 1a). Fees for placement of debt securities averaged 0.5 per cent, similar to those paid by firms resident in the other main European countries and again lower than in the US (Fig. 1b). The average fees for Italian non-financial corporations’ securities issues placed by syndicates whose members were at least half Italian banks showed no statistically significant difference in either market segment with respect to the fees imposed by syndicates made up of a majority of foreign banks.
All the leading Italian banking groups offer placement services, sometimes through specialised financial intermediaries. In the period under study, the top three Italian groups in terms of security issues management handled on average €7.6 billion a year, for a total of around 29 per cent of securities issues in the period 2000-2016. The remaining Italian banking groups offering placement services for Italian firms each accounted for less than 1 per cent of the market, with less than €500 million per annum.
Overall, Italian banks hold a minority share of the placement services market, with a small gap between the debt and equity security segments. In the debt security segment that share was about a quarter, rising to over 30 per cent in the last five years. In the equity security segment Italian banks acted as bookrunner for 39 per cent of issues, dropping to a third in the last five years.
4. Issuers and bookrunners: characteristics and matching
Generally, firms raising funds on the financial markets and using the services of banks tend to be large, in terms both of assets and of employees; they also have higher net revenue, gross operating profit, per capita value added and level of internationalisation (export revenue over total assets) than other firms, as well as lower leverage and a lower ratio of net interest expense to Ebitda, and they are older. The difference in ROE is minimal (Tab. A5).9 The Z-score calculated by the Company Accounts Data Service indicates that since 2008 firms entering the markets are also higher-risk, although the difference with respect to other firms is not significant; however, their bad debts to loans ratio is much lower.10
9 The balance sheet information on corporate issuers relates to about half of the total. 10 The inconsistency of these two findings is due to the time lag between the borrower firm’s financial situation deteriorating and the potential impact on its ability to repay bank loans. Moreover, banks may delay before reporting an insolvent borrower, particularly if the firm is large. Lastly, the score calculated by the Company Accounts Data Service is a discrete variable with values ranging from 1 to 9, while the ratio of bad debts to total loans is a continuous variable.
11

Banks’ supervisory reporting11 for the last ten years show that around thirty Italian non-financial companies issued securities each year using the services of banks resident in Italy (Table a6).12 For around half of them this was their first issuance.13 The average number of banking groups or stand-alone banks providing placement services was just under thirty. Most of the issuers using the placement services of an Italian banking group had an outstanding loan with one or more of the banks in the group; their issuance accounted for about four fifths of the total value of securities issued between 2004 and 2016. The banking groups lending to corporate issuers also handled the largest issues in terms of volume.14
Large firms tend to use Italian banks for share and bond placements.15 Those that use the services of lender banks are generally more productive and more profitable, in terms of per capita value added and ROE (Table a5). They are also financially sounder than other corporate issuers (based on the ratio of interest expense to Ebitda), less export-oriented (ratio of foreign sales revenue to total assets) and have higher leverage, particularly compared with firms using the placement services of Italian non-lending banks. Firms’ riskiness, measured by the ratio of bad debts to total loans reported to the Central Credit Register, is lower for firms using the placement services of lender banks. About a quarter of the banks providing placement services to firms are also their main lender; just under half of all loans are granted by the leading banks.
These findings, based on descriptive statistics relating to each of the categories of firms listed in Table a5, are corroborated by the estimates of a logit model in which the dependent variable is the firm’s decision to place its issuance through a lender bank. The largest firms in terms of total assets, most profitable (in terms of ROE), with less leverage and a lower risk rating are more likely to use the services of the banks that also finance them (Table a7).
Overall, there is evidence that firms using the placement services of lender banks are sounder and more profitable than those that use other banks. This might indicate that the bookrunner and lender banks are better able to select which firms to assist, based on information collected for lending purposes.
5. Returns on placement services provided by Italian banks
The income from security placement services is fairly limited. In 2000-2016 placement fees earned by Italian banks ranged between €4 and €6 billion a year (except in 2011; Figure 4a).
11 The only Italian issuers listed in supervisory reporting are non-financial companies resident in Italy. Instead, in the Dealogic data Italian issuers include all firms belonging to a group headed by an Italian non-financial company. 12 Banks resident in Italy include branches and subsidiaries of foreign banks; issuance placed by foreign banks is not considered. The findings described in this section therefore relate to about 30 per cent, on average, of issuance during the period (see Section 2). 13 First issuance is any issue made for the first time after January 1999. See the heading ‘First time issuers’ in the Methodological Appendix for details. 14 The large number of placements made by banks (usually small institutions) not financing the issuer firm may in part be the result of reporting errors by the banks, which record placements with retail customers, a service that differs from that offered by banks operating as part of a syndicate. 15 Small firms tend instead to use foreign bookrunners. However, this finding may be due partly to the reporting banks’ failure to enter small placements. In such cases, the issue, which is recorded in the securities register but does not appear in the placement reports of Italian resident banks, is classified as placed by a foreign bank.
12

The supervisory financial reporting scheme (Matrice dei conti) shows the amount of fee income from placement services but does not give a breakdown by type of security or sector of issuer. In the period in question, non-financial companies issued about 4 per cent of the total value of securities placed by Italian banks. Assuming that percentage fees do not differ according to the issuer’s sector, the placement of non-financial companies’ securities issuance yielded total yearly fees of around €200 million; this is not a true estimate, however, as it refers only to about a third of the Italian market (see footnote 12, Section 4) and does not take account of any underpricing and the additional fees levied as a result (see footnote 6). About 70 per cent of placement fees are earned by banks belonging to the top five banking groups. This share has dwindled from 80 per cent at the beginning of the period to an average of just over 60 per cent in the last five years (Figure 4b). The reduction in the leading banks’ market share is consistent with our earlier finding about the diminishing concentration of securities placement services in recent years (see Section 2.1). Foreign banks have seen their market share expand the most, while for large and medium-sized banks and small and minor ones the increase has been less substantial.
Figure 4: Placement fees (2000-2016) (€ million and per cent)
a. Placement fees b. Share of placement fees by category of
bank
Source: Supervisory reporting.
The ratio of placement fees to total interest income increased steadily in the ten years considered, from 5.1 per cent in 2006 to 8.8 per cent in December 2016 (Figure 5a), particularly in the case of banks belonging to the top five banking groups (from 6.1 to 12.6 per cent), whose interest income was substantially reduced as a result of the trend in lending and market interest rates. Foreign banks saw a similar increase in the ratio of placement fees, while for large and medium-sized banks and small and minor banks the growth was less substantial (Figure 5b).
13

For the largest banks placement fees represent a substantial part of their total fee income, ranging from 15 to 20 per cent in the period 2006-2016. Considering only those banks that provide placement services, the share of such fees averaged 14 per cent for large and medium-sized banks and 9 per cent for small and minor banks (Figure 5b). Placement fees represent a particularly large share of total fees for branches of foreign banks, with an average ratio of over 20 per cent in the period studied (Figure 5b).16 This is because foreign banks specialise more in the provision of placement services than other banking groups, whose activity is more widely diversified.
Percentage placement fees are estimated on the basis of supervisory reporting by computing the ratio of the amount of fees for security placements to the face value of securities placed on the market by Italian banks.17 This estimate allows us to view the progress of fees over a period of time, even though it is not limited to issuance of equity and debt securities of non-financial companies but includes other types of instrument and other issuer sectors.18
Returns from securities placement fell from 2.1 to 1.6 per cent in 2003-2008,19 but were virtually stable in the following years, unlike the trend in market interest rates (Figure 6a).20 While returns declined until 2008, competition in the securities placement market increased steadily over the whole period under study: market concentration diminished during that time in terms of both value of securities placed (see Section 2) and fees (Figure 6a).21 Although average placement income was stable from 2008 on, the distribution per bank shifted downwards and dispersion diminished from 2012 to 2015, moving back upwards in 2016 (Figure 6b). This trend in the distribution of placement income occurred mainly among the smaller banks and had little impact on the banking system average.
16 The sharp increase in the ratio of placement fees to total fees among foreign banks from 2012 on is mainly due to the fact that only a very small number recorded positive fees (about 10) and that two banks with a low placement fee ratio ceased operations. 17 Dealogic data show that there is no significant difference between percentage fees according to the issuer firm’s sector. We can therefore reasonably assume that the percentage fees for placement of corporate securities estimated using data from supervisory reporting are fairly accurate, even though the reports relate to aggregate placements, without distinguishing by type of security or issuer’s sector. 18 The estimate takes account of the specific category of government securities (representing about 12 per cent of the face value of securities placed), for which placement fees are assumed not to exceed 0.3 per cent. This is the figure set out in the Ministerial Decree on transparency in the placement of government securities (Ministerial Decree of 19 October 2009). 19 The reduction in placement income can also be put down, in part, to a composition effect: the increase in the share of issues of debt securities, which carry lower fees (see Section 2.1 and Figure 1), led to a reduction in the total amount of fees and corresponding returns per issue. 20 Over the whole period under study (2003-2016), the estimated return per issue based on Dealogic data for total securities was 1.4 per cent, some 30 basis points lower than the figure calculated from supervisory reporting. Several factors might explain the difference, small though it may be, between the two estimates. As noted earlier, data based on the supervisory financial reporting scheme (Matrice dei conti) relate to total securities issued and incorporate all instruments and all issuer sectors. Additionally, the average value of the issues recorded in the Dealogic database is higher as it only contains information of the highest-value issues, which carry lower fees. See the heading ‘Calculation of securities placement income’ in the Methodological Appendix for details of how returns per issue are computed. 21 The two concentration indices relate, respectively, to all banks providing placement services for issues of Italian firms (therefore including non-resident banks) and only banks resident in Italy. The Herfindahl index of placement fees is invariably below 0.15, while the concentration index for the value of securities placed is always less than 0.1.
14

Figure 5: Distribution of placement fees as a ratio of interest income and total fees (2006-2016) (1) (per cent)
a. Ratio of placement fees to total interest income
b. Ratio of placement fees to total fees
Source: Supervisory reporting. (1) The boxplot distributions include only banks reporting positive fees in the reference period. The horizontal lines in each boxplot represent, from the bottom up, the 5th, 25th, 50th (black line), 75th and 95th distribution percentiles.
The level of returns, and to a lesser extent their trend, can be attributed, at least partly, to a shift in the incidence of underwriting. Usually, in such cases, since part of the securities issued are underwritten by the bank, the fees are higher. During the period under study, about 20 per cent of all securities issues placed by Italian banks were underwritten (Figure 7a). This proportion has decreased with time: in the years leading up to the collapse of Lehman Brothers, the percentage of securities underwriting fell below 20 per cent, a shift that may have been at least partly due to less willingness on the part of banks to shoulder the attendant risk during the
15

financial crisis. After adjusting placement income to take account of securities underwriting,22 returns fluctuate around 1 per cent, except in the last three years of the period when it slowly rose to 1.5 per cent (Figure 6a).23
Figure 6: Returns on securities placements (2003-2016) (per cent)
a. Average returns b. Distribution of returns per bank
Source: Based on supervisory reporting and ECB. See the headings ‘Calculation of placement income’ and ‘Placement income adjusted for underwriting’ in the Methodological Appendix for details of the method used to estimate placement income and adjust it for underwriting. The horizontal lines in each boxplot represent, from the bottom up, the 5th, 25th, 50th (black line), 75th and 95th distribution percentiles.
The financial crisis led to a sharp drop in returns on loans and on holdings of securities adjusted for risk: from 2003 to 2016 the gap between these returns and those on securities placement narrowed considerably, eventually turning negative in the case of securities investment (Figure 7b). As a result, placement services became progressively more profitable than the other two sources of income. It is worth noting that placement services are generally regarded as a financial service for which the bank receives a fee, at the time it renders the service, that is proportionate to the face value of the issue. In the case of securities underwriting, placement also entails the investment of raised funds. Lending and holdings of securities, on the other hand, always represent a method of investing funds that allows the bank to earn interests or dividends through future cash flows. So, it is not entirely correct to compare placement income with the income from lending or from portfolio investment. However, comparing the returns on these three types of activity does offer some indication of the relative economic advantage of the different business lines in which banks can invest.
22 Placement income is adjusted for underwriting by subtracting from the ratio of placement fees to face value of the securities the share of securities underwriting multiplied by the return per issue on the securities portfolio. It is implicitly assumed that the fee paid to the banks for underwriting the securities is equal to the average return on the securities portfolio. 23 The increase during the last three years was caused in part by a squeezing of the return on the banks’ securities portfolios following the adoption of non-conventional monetary policy measures.
16

Figure 7: Share of securities underwriting and comparison of returns (per cent)
a. Share of securities underwriting (1) b. Comparison of returns
Source: Supervisory reporting. See the headings ‘Calculation of placement income’ and ‘Placement income adjusted for underwriting’ in the Methodological Appendix for details of the method used to estimate placement income and adjust it for underwriting. (1) Three-year moving average centred on the last year.
For a more accurate comparison of the returns on these various activities an adjustment should be made for risk and production costs, which is hard to do in the case of securities placement.24 Such correction should also narrow the gap between the different returns described above; it is reasonable to assume that placement income has outperformed at least investment income in recent years. Also to be taken into account is the fact that placement services absorb a low level of capital and liquidity, thus they have advantages over other activities characterized by higher regulatory requirements, as in the wake of the recent financial crisis. For these reasons, and assuming that returns on lending and investment will pick up in the future, the incentive for banks to expand their placement activity is probably greater than before the financial crisis as firms continue to demand such services.25
6. Access to capital market financing and credit relationships
Access to capital market financing can affect the quantity of credit granted to firms. In the first place, access to the market may represent a form of ‘certification’ of the firm’s quality and credit rating and therefore lead to an overall increase in the credit they are granted; on the other
24 Returns on loans and security holdings are adjusted for risk, but don’t take account of production costs. The risk adjustment to placement largely concerns securities underwriting. 25 As the provision of corporate financial services becomes increasingly profitable for banks, so it might become too expensive for firms. Thus, according to some experts the banks’ role is alternative rather than complementary to market finance (see, for example, the article by Marco Onado in Sole24Ore, 8 June 2013).
17

hand, capital market financing may replace credit, at least in part.26 As regards interest rates, the ‘certification’ effect should lead to their reduction in the post-issuance period (Pagano, Panetta and Zingales, 1998). The effects on volume and interest rates may also vary according to whether the loan is granted by the bank acting as issue manager or by other lender banks. We can assume, a priori, that if there were a substitution effect between capital market financing and credit, it would relate initially to credit relationships with the banks not acting as issue manager. As pointed out in Section 2, the scarce empirical evidence available to date is not consistent on the matter of the substitution/complementarity between credit and capital market financing.
In theory, three types of effect on existing credit relationships stem from firms’ access to capital market financing:27
i) access to capital market financing displaces bank credit, weakening the relationship with the bank acting as issue manager;
ii) access to capital market financing reduces recourse to bank credit but strengthens to relationship with the bank acting as issue manager;
iii) access to capital market financing does not lead to any reduction in bank credit because it is complementary.
Only in the first case do we need to assess jointly the ‘direct’ benefit to banks of providing placement services and the ‘indirect’ cost of a weaker credit relationship with the firms whose securities are placed. In the other cases the overall effect should be positive.
In 2003-2016 lending to non-financial issuers was more volatile in the case of firms that used lending banks as their issue manager,28 increasing sharply in 2007-2009 and decreasing considerably in 2010-2012 (Figure 8a). The interest rates applied by the banks that placed the securities were lower than those applied by other banks (Figure 8b). The difference between the interest rates applied to issuers that used the same bank for credit and to access the capital market and the interest rates applied to the remainder of issuers was greater at the height of the sovereign debt crisis and the subsequent credit squeeze from 2011 to 2013.
Provisional indications regarding the impact of access to capital market financing on non-financial firms’ credit relationships can be gained from the change in volumes and interest rates before and after issuances. Considering total non-financial issuers, the gap between the twelve-month growth rate in lending to firms that issued securities and that in lending to all firms narrows to about 7 percentage points compared with the period prior to issuance, suggesting there is a substitution effect between credit and capital market financing (Figure 9a). At the same time the spread between the interest rates applied by banks to corporate issuers and to all non-financial firms widens by 45 basis points compared with the period prior to issuance, increasing theissuers’ advantage in terms of cost of credit (Figure 9b).
26 The substitutability between credit and market finance mainly relates to the bond component. 27 We do not consider the other potential benefits to banks, such as the wider range of products and services offered to firms whose security placement they handled or the improved financial situation and growth prospects of corporate borrowers as a result of market access. 28 The greater volatility is due to the smaller number of such firms (and hence the smaller number of credit relationships).
18

Figure 8: Bank loans and interest rates to issuers by category of issue manager (€ million and per cent)
a. Loans b. Interest rates
Source: Estimated using data from the Central Credit Register, supervisory reporting and the Securities Register. See the heading ‘Issuers’ in the Methodological Appendix for details of issuer classification.
The ‘certification’ effect should be greater for firms issuing securities for the first time, which represent on average 50 per cent of corporate issuers; an analysis of changes in volumes and interest rates before and after the securities issuance, compared with those for total non-financial corporations, confirms this hypothesis (Figures 9a and 9b). The other firms whose credit relationships should benefit considerably from market access are the very risky ones:29 in their case capital market access should indicate an improvement in their financial situation and growth prospects and increase their credit rating. A comparison between the periods before and after placement shows that for risky firms securities issuance is associated with a similar reduction in interest rates to that enjoyed by other firms and a smaller decrease in the credit amount granted by banks.
Firms’ access to capital markets may have different effects on credit relationships with the bank acting as issue manager and with other banks. By assisting the non-financial firm in accessing the capital markets through the placement of securities, the lending bank can strengthen its credit relationship with the firm by exploiting the informational economies of scope associated with performing the two tasks. This is important when banks assess whether it is to their advantage to expand the supply of placement services. The results for total corporate issuers indicate that, after placement, credit increases, albeit only to a limited extent, where there is a credit relationship with the banks that acted as issue managers, while it decreases considerably otherwise. On the other hand, the reduction in interest rates concerns both credit relationships
29 Risky firms are classified as those with a CEBIL z-score above or equal to 7.
19

with banks that did not act as issue managers and those with other banks (Figures 9a and 9b). Thus assisting corporate issuers does not weaken banks’ credit relationship with them: this remains unchanged in terms of amounts granted and interest rate applied. By contrast, banks that do not act as issue managers are more likely to be crowded out but offer favourable interest rates to the same extent as banks placing securities.
Figure 9: Impact of securities issuance on credit relationships (per cent; basis points)
a. Loans (1) b. Interest rates (2)
Source: Estimated using data from Central Credit Register, supervisory reporting and Securities Register. See the heading ‘Issuers’ in the Methodological Appendix for details of issuer classification. (1) Difference in growth rates of credit granted to the issuer before and after issuance of securities. – (2) Difference in interest rates applied to issuers before and after issuance of securities. For details see the heading ‘Impact of securities issue on credit relationships’ in the Methodological Appendix. The statistical evidence above does not explain the multidimensional interactions between the variables because it only considers two, or at most three, factors at a time, without taking into account the idiosyncratic effects associated with firm or bank characteristics. A regression analysis will overcome these problems and, as well as being easier to interpret, identifies the variables that are statistically significant.
We therefore ran an OLS estimation of the following linear model with multidimensional fixed effects à la Gaure (2013):
, , = ′ , + + + + + , + , , + ∗ , + , , ++ , , + , , ∗ , , + , , (1)
where the variable outcome , , can be either the difference , , − ̅ between the interest
rate applied to non-financial issuer i by bank b in quarter t and the average interest rate for the
non-financial corporation sector in the same quarter, or the difference , , − ̅ between the
growth in bank b’s loans to issuer i and the growth in total bank lending to total non-financial firms in the same period. The dummy variable takes the value 1 in the four quarters
20

following issuance by the firm and nil in the previous four quarters, while and represent the corporate and bank fixed effects. Another dummy identifies the effects attributable to the type of security issued by the firm (equity or debt security). These effects may vary as financial market regulations impose stricter disclosure requirements for equity securities issuance than for debt securities, resulting in a greater certification effect for issues of equity securities.30 Bonds are a closer substitute for bank debt; we can therefore assume that the effect of crowding out bank credit will be greater after a bond issue. The model estimated does not include time fixed effects since the outcome variables, which are specified as a difference with respect to the aggregate sector-level counterparts, include by construction a control for the cycle and the trend and for any other aggregate shock occurring over time. The control variables , at firm level include the logarithm of assets, the ratio of export value to assets,
financial leverage, the ratio of interest expense to Ebitda, ROE, value added per employee, the ratio of cash flows to assets, the issuer’s age and the concentration of exposure to the banking system measured by the Herfindahl index. These variables, referring to the preceding period, isolate credit demand effects and mitigate the possible endogenous nature of some of them.
Specification (1) includes a vector , of firm characteristics interacted with dummy to
identify any different effects following recourse to the capital market. In particular, we analyse the effect of issuance in the case of first-time recourse to the capital market by the issuer and where the issuer is risky. We also identify the credit relationships in which the bank is also leading issue manager: the dummy , , takes the value 1 if the bank places more than 30 per
cent of the firm issue and zero otherwise. Several studies (Sharpe, 1990) underline how relationship banking can, in the medium-to-long term, help banks to ‘capture’ customers initially offering them better credit conditions that then worsen as the credit relationship continues. We isolate the relationship banking effect on changes in interest rates and the amount of credit granted using the share , , of loans by the bank b in total lending to the
firm i, assuming that higher values indicate stronger credit relationships between bank and firm.
The interaction between the dummy variable , identifying the periods before and after security issuance (four quarters each way), and the characteristics of the firm and of the credit relationship (parameters and ) indicates the different effects of securities issuance
according to those characteristics. The parameter identifies the base effect of recourse to the
market by the firm in the case where the bank does not play a major role in placing the securities, while the parameter captures the effects of the bank’s role in placing the
securities as the intensity of the credit relationship with the issuer varies.
The results of the regression analysis on the determinants of the loan growth rate show that the latter increases as the issuer’s cash flows and age rise and leverage decreases (Table a8). By contrast, bank credit to firms with the largest volume of assets grew less during the period examined. This is because large firms are able to better diversify their sources of financing as
30 The Consolidated Law on Finance and Consob regulations set out greater disclosure requirement for firms listed on the stock exchange than for those issuing bonds. The financial reason for this is that equity securities have less seniority than debt securities and are therefore more sensitive to private information (see Myers and Majluf, 1984; Bolton and Freixas, 2006).
21

they can turn to the capital market instead of using banks (Freixas and Bolton, 2000). The riskiest firms and first-time issuers are penalised as the rate of growth in their bank loans is lower. Securities issuance has a crowding out effect on bank credit (negative coefficient ) that increases with the strength of the credit relationship when the bank does not play a major role in placement. However, if the bank does play such a role and also provides a substantial share of total lending to the issuer, then access to capital market financing does not crowd out bank credit and instead increases it in the four months after placement. In this case, being the issue manager strengthens the credit relationship with the issuer.
These estimates can be used to calculate the marginal effects of recourse to the market. Figure 10a shows the effects of issuance on the change in loans (y-axis) depending on the strength of the credit relationship (x-axis) in the case of banks that played a key role in placement (blue line) and for the others (red line). While banks not significantly involved in securities placement always experience a crowding out effect, for those that act as significant issue managers and are at the same time key-lenders (with over 48 per cent of total lending to the firm) the credit they grant is not crowded out by their clients’ access to capital market financing. Since the median value of the share of loans granted by the main bank is about 55 per cent for the firms in the sample (Figure 10b), the positive effects of access to the capital markets are spread among the banks that play an important role in financing the issuers.
Figure 10: Marginal effects of security placement on the amount of bank credit (per cent)
a. Change in bank credit after issuance b. Distribution of the share of leading banks’ loans by firm
Source: Estimates based on supervisory reporting, Central Credit Register and Securities Register. (1) Change in bank credit (y-axis) in relation to the original share of the bank’s loans in total bank credit to the issuer based on the results of the econometric estimates shown in column 1 of Table a8 for the coefficients , and – (2) Distribution of the percentage of loans granted by the leading bank per issuer. The horizontal lines of each boxplot represent, from bottom up, the 5th, 25th, 50th (black line), 75th and 95th distribution percentiles.
22

The regression analysis on interest rates shows that the rates applied to issuers are lower the stronger their credit relationship, approximated by the share of loans granted by the bank in total bank lending to the firm (Table a8). Issuers with a higher level of productivity (value added per employee) and of liquidity (ratio of cash flows to total assets) obtain lower interest rates, which instead rise as the concentration of exposure to the banking system increases. In line with the results illustrated in the literature, first-time issuers and the riskiest firms obtain less favourable interest rates from the banks (respectively 26 and 32 basis points higher). The base effect of issuance is not significant, but it does become significant for first-time issuers and very risky firms, for which interest rates decrease by 10 and 18 basis points respectively. This finding is in line with the theory about the certification effect of the access to capital markets. On the other hand, no significant effects are found with the increasing strength of the credit relationship.
Overall, the foregoing results indicate that access to the capital markets partially crowds out bank credit and improves borrowing conditions, particularly for first-time issuers and riskier firms. The crowding out of credit only occurs in the case of credit relationships with banks not playing a key role in placing the securities. On the other hand, credit relationships with banks playing a major role in placing the firm’s securities are strengthened, provided that the credit relationship was strong enough before the issuance.
7. Conclusions
The analysis of the market for placement of Italian firms’ issues shows that there is ample opportunity for Italian banks to expand. Their share of the market averaged about a third in the period examined, well below that of foreign banks. Firms using the services of Italian banks to access the financial markets tend to be large sized and more profitable and financially sound than other firms. The majority of issuers using the services of Italian banks have a credit relationship with one or more banks in the group; the banking groups that also grant credit to issuers handle the largest issues in volume terms. The firms that use the placement services of the banks that finance them are sounder and more profitable than those that use other banks, presumably because lending banks that also place securities issuances can better select the firms to assist on the basis of information gathered as part of the lending process.
In the last decade, placement fees have represented only a small proportion of total interest income, although that share is increasing, especially for the banks belonging to the top five groups. The return on this type of activity declined progressively until 2008 and was largely stable in the following years. However, the decrease was less than that in the returns on lending and on holdings of securities, thus narrowing the gap with them; the returns on security placement services therefore became increasingly more profitable. The direct benefits of providing placement services can be supplemented by the advantage of increasing the growth prospects of the issuers and enlarging the range of products and services offered to them.
Access to the market generally has positive effects on credit to firms, particularly first-time issuers and very risky firms. These types of firm, for which interest rates on loans are usually higher and credit growth rates lower, experienced an improvement in both interest rates and
23

volume of credit after issuing bonds or equities. The access to capital markets did not weaken the credit relationship with the banks that also provided placement services to the issuer. Banks that were significantly involved in the placement of securities increased their lending to the issuing firms in the year after placement while other banks experienced a crowding out of their loans to the firms concerned. Overall, continuing the pressure on firms to further diversify their financing sources, this paper presents some positive evidence regarding a future expansion of the services supplied by Italian banks to firms seeking capital market financing. As other types of activity become less profitable, even within the field of investment banking, it is increasingly to the advantage of commercial banks to expand their supply of corporate financial services (Mc Kinsey & Company, 2012; Ernst & Young, 2016). The barriers to entry and to expanding activity in the securities placement market are considerable, however. It is a highly specialised market, heavily dominated by foreign banks, which have built up their reputation over the decades and are more likely to be chosen by corporate issuers hoping to be perceived as less risky by the market. Italian banks, which comparatively have only recently entered this market, are at a disadvantage with respect to foreign investment banks. They need to properly invest in order to increase their competitiveness in this market.
24

Statistical Appendix
Table a1
Total value of securities issued by issuer’s country of residence (2000-2016) (€ billion; per cent)
France Ger-many Italy Spain UK Japan US France Ger-
many Italy Spain UK Japan US
Debt securities
of which: share placed by Italian banks 2000 30.5 31.9 9.5 16.1 57.0 49.3 374.9 0.0 1.6 31.6 0.0 0.0 0.0 0.0
2001 49.7 37.8 18.8 10.2 48.7 58.7 531.7 0.0 0.3 32.4 0.0 0.0 0.0 0.2
2002 22.5 42.1 13.7 4.8 34.9 45.3 367.3 2.2 1.9 38.7 0.0 0.3 0.0 0.2
2003 34.7 28.1 13.9 11.4 46.5 38.7 319.8 0.0 2.8 25.9 0.0 0.2 0.0 0.1
2004 22.6 19.6 19.6 2.6 23.0 25.9 262.1 0.0 2.0 26.0 0.0 0.0 0.0 0.2
2005 24.3 18.7 11.0 3.6 31.5 31.2 227.0 0.0 5.3 17.3 0.0 0.0 0.0 0.4
2006 27.9 31.1 9.3 16.9 53.4 28.9 283.7 0.0 1.3 12.9 0.0 0.4 0.0 0.4
2007 25.6 21.7 14.7 8.8 47.5 35.5 308.7 0.0 3.2 16.3 3.4 0.2 0.0 0.2
2008 28.2 36.7 3.7 5.1 50.2 38.8 265.8 0.0 8.7 21.6 0.0 0.4 0.0 0.1
2009 52.9 78.2 34.9 23.8 56.5 55.5 370.8 0.0 5.5 20.3 1.7 1.2 0.0 0.4
2010 41.4 33.1 17.3 13.1 35.2 46.9 388.4 1.7 7.3 42.2 0.0 1.1 0.0 0.2
2011 45.6 28.4 15.4 12.5 48.3 42.3 359.3 1.3 5.6 38.3 3.2 0.4 0.0 0.4
2012 54.9 68.5 29.7 17.6 76.5 47.5 535.1 1.8 4.8 31.0 5.7 0.3 0.0 0.1
2013 54.3 61.0 24.9 22.5 65.5 47.5 530.6 3.1 7.2 30.1 6.7 0.0 0.0 0.3
2014 77.5 59.2 26.2 17.8 76.2 38.4 550.4 2.3 5.6 24.0 2.8 2.1 0.0 0.1
2015 54.8 52.0 21.9 14.6 66.9 37.6 793.9 4.4 6.0 23.3 8.2 0.9 0.0 0.2
2016 76.7 65.9 19.3 21.7 68.7 50.2 798.2 3.0 8.5 30.1 7.8 1.0 0.0 0.9
Equity securities
of which: share placed by Italian banks 2000 33.4 42.3 13.2 9.9 46.6 52.8 234.7 0.0 3.5 46.2 0.0 0.0 0.0 0.0
2001 41.4 6.8 12.0 4.4 35.2 24.8 200.4 0.0 4.4 45.0 0.0 0.0 0.0 0.0
2002 25.3 4.3 6.1 3.5 25.2 18.7 119.6 0.0 0.0 27.9 0.0 0.0 0.0 0.0
2003 31.6 4.6 8.8 1.2 13.4 22.7 117.9 0.0 4.3 40.9 0.0 0.0 0.0 0.0
2004 26.5 13.1 13.4 4.1 18.7 40.4 108.3 0.0 0.8 35.8 0.0 0.0 0.0 0.0
2005 32.7 17.6 12.5 4.0 22.6 27.8 89.9 0.0 5.7 31.2 0.0 0.0 0.0 0.0
2006 19.7 21.7 9.0 3.2 22.7 35.8 124.4 0.0 2.3 32.2 0.0 0.0 0.0 0.0
2007 21.4 18.7 7.4 13.6 26.0 12.6 131.8 0.0 2.7 56.8 0.0 0.0 0.0 0.0
2008 5.0 3.1 1.6 2.1 16.6 7.0 59.7 0.0 3.2 43.8 0.0 0.0 0.0 0.0
2009 16.1 12.2 13.1 7.8 34.4 20.1 80.8 0.0 8.2 54.2 0.0 0.3 0.0 0.0
2010 7.4 13.1 4.8 4.5 15.7 22.4 96.8 0.0 3.1 37.5 4.4 0.0 0.0 0.0
2011 5.2 18.8 3.7 3.4 6.0 9.6 88.2 0.0 5.9 54.1 0.0 0.0 0.0 0.0
2012 8.6 15.0 3.1 4.3 11.8 15.5 111.1 0.0 3.3 22.6 0.0 0.0 0.0 0.0
2013 21.1 13.1 8.0 4.5 19.2 25.1 161.6 0.0 2.3 32.5 2.2 0.0 0.0 0.0
2014 23.8 24.0 7.6 18.2 34.0 22.1 146.6 0.8 0.8 30.3 1.6 0.0 0.0 0.0
2015 19.8 23.9 12.4 19.1 34.3 31.7 177.9 0.5 0.4 29.8 0.0 0.0 0.0 0.0
2016 18.9 13.8 6.3 5.5 29.2 16.3 147.0 1.6 3.6 41.3 0.0 0.0 0.0 0.0
Source: Dealogic. The data relate to issue by non-financial companies or by companies belonging to a group headed by a non-financial company. Issuers are those resident in Italy, France, Germany, Spain, UK, US and Japan. See the heading ‘Market share’ in the Methodological Appendix for details of how market share is computed.
25

Table a2
Value per issue by issuer’s country of residence (2000-2016) (average values; € million)
France Germany Italy Spain UK Japan US
Debt securities
2000 150 127 150 95 106 98 121
2001 250 100 150 188 160 92 166
2002 200 102 150 100 150 86 115
2003 175 100 300 150 215 77 133
2004 150 75 750 117 93 74 135
2005 300 85 587 130 204 107 142
2006 300 160 706 298 200 70 207
2007 300 125 813 340 186 66 248
2008 200 124 635 112 146 118 239
2009 500 300 732 500 137 145 226
2010 400 150 500 500 114 118 227
2011 456 95 750 550 246 96 250
2012 240 150 550 341 275 101 292
2013 297 150 300 300 207 82 267
2014 200 205 300 250 216 73 289
2015 188 265 450 312 276 75 439
2016 300 418 500 253 153 87 448
Average 271 161 490 267 181 92 232
Equity securities 2000 40 47 34 111 22 22 125
2001 124 30 37 78 12 16 146
2002 290 46 89 268 7 15 109
2003 279 86 80 119 5 16 90
2004 120 54 75 194 7 17 71
2005 70 22 104 78 9 15 66
2006 10 49 59 92 9 15 53
2007 12 21 36 125 7 11 46
2008 3 14 14 125 5 6 9
2009 18 6 68 90 5 8 20
2010 16 15 31 57 3 7 14
2011 5 11 12 27 2 8 16
2012 26 15 114 160 5 10 69
2013 127 50 62 114 7 24 90
2014 30 53 26 296 15 23 83
2015 20 37 46 97 16 22 90
2016 22 16 24 103 7 15 58
Average 71 34 54 126 8 15 68
Source: Dealogic. The data relate to issue by non-financial companies or by companies belonging to a group headed by a non-financial company. Issuers are those resident in Italy, France, Germany, Spain, UK, US and Japan.
26

Table a3
Market concentration of securities placement by issuer’s country of residence (2000-2016) (Herfindahl-Hirschman index x 100)
France Germany Italy Spain UK Japan US
2000 7.7 15.0 9.4 10.5 7.2 15.3 11.6
2001 8.4 10.9 10.2 11.1 8.1 14.9 12.7
2002 8.5 8.2 8.9 15.7 8.5 15.0 10.8
2003 6.9 8.2 8.5 8.0 8.3 15.1 10.4
2004 7.7 8.5 9.2 8.3 5.6 14.9 9.6
2005 8.8 11.3 11.6 8.5 6.3 14.6 9.0
2006 8.2 8.3 8.4 7.6 7.6 14.9 8.7
2007 7.9 8.4 6.8 8.0 6.4 17.4 9.3
2008 7.3 6.4 11.0 7.0 7.8 16.3 8.6
2009 9.6 7.1 6.7 5.6 6.4 18.2 8.5
2010 7.2 6.6 8.6 6.1 5.8 17.0 7.9
2011 6.0 9.0 8.5 5.9 5.3 16.1 7.8
2012 6.4 5.4 6.0 4.6 5.5 15.0 7.6
2013 5.9 5.7 6.8 4.6 5.5 15.2 7.1
2014 5.6 5.2 5.4 5.1 4.3 16.0 6.9
2015 6.5 5.1 6.2 5.5 5.1 14.9 7.0
2016 5.5 4.9 6.6 4.7 4.5 15.7 6.1
Average 7.3 7.9 8.2 7.5 6.4 15.7 8.8
Source: Dealogic. The data relate to issue by non-financial companies or by companies belonging to a group headed by a non-financial company. Issuers are those resident in Italy, France, Germany, Spain, UK, US and Japan.
27

Table a4
Number of bookrunners per issue (2000-2016) (average values)
France Germany Italy Spain UK Japan US
Debt securities
2000 1.5 1.3 1.6 1.6 1.2 1.1 1.5
2001 1.9 1.4 1.6 2.0 1.4 1.2 1.6
2002 1.7 1.4 1.9 1.8 1.6 1.3 1.5
2003 2.1 1.6 2.3 2.0 1.6 1.2 1.7
2004 1.7 1.5 3.9 1.9 1.6 1.2 1.8
2005 2.1 1.6 3.1 2.1 1.8 1.5 1.8
2006 2.1 2.0 3.6 2.0 1.8 1.4 2.1
2007 2.1 1.8 4.2 2.4 2.0 1.5 2.4
2008 2.0 1.7 3.7 2.1 1.9 1.9 2.6
2009 2.9 2.3 5.0 3.4 2.4 2.2 3.0
2010 3.6 2.8 5.1 4.3 2.8 2.0 3.1
2011 4.1 1.9 4.4 4.5 3.2 2.1 3.3
2012 3.5 2.3 5.5 4.1 3.5 2.2 3.8
2013 3.4 2.5 5.1 4.8 3.5 2.5 3.8
2014 3.6 3.3 4.7 3.9 3.8 2.5 4.0
2015 3.7 3.4 4.3 4.3 3.7 2.7 4.6
2016 4.3 4.1 5.7 4.0 3.6 2.8 4.7
Average 2.7 2.2 3.9 3.0 2.4 1.8 2.8
Equity securities 2000 1.5 1.1 1.8 2.1 1.1 1.1 1.1
2001 1.6 1.1 2.2 2.3 1.1 1.1 1.2
2002 1.5 1.1 1.9 2.6 1.2 1.0 1.2
2003 2.4 1.2 2.0 1.9 1.1 1.0 1.3
2004 1.8 1.3 1.8 2.5 1.1 1.1 1.3
2005 1.9 1.3 1.9 1.2 1.1 1.0 1.4
2006 1.5 1.4 1.7 1.6 1.1 1.1 1.4
2007 1.5 1.4 1.7 2.4 1.1 1.1 1.5
2008 1.4 1.3 2.4 2.5 1.3 1.0 1.5
2009 1.9 1.6 2.0 2.2 1.4 1.2 1.8
2010 1.4 1.5 2.3 1.6 1.2 1.2 1.8
2011 1.5 1.5 1.7 1.3 1.3 1.1 1.9
2012 1.7 1.4 1.6 1.5 1.3 1.2 2.3
2013 2.2 1.5 2.2 1.8 1.4 1.3 2.5
2014 2.2 1.8 2.4 2.7 1.6 1.4 2.6
2015 2.0 1.8 2.1 2.5 1.6 1.4 2.3
2016 2.1 1.8 2.4 1.7 1.5 1.3 2.1
Average 1.8 1.4 2.0 2.0 1.3 1.2 1.7
Source: Dealogic. The data relate to issues by non-financial companies or by companies belonging to a group headed by a non-financial company. Issuers are those resident in Italy, France, Germany, Spain, UK, US and Japan.
28

Table a5
Corporate issuers and non-issuers: balance sheet indicators (2005-2015) (average values)
Indicator Period Non-issuer Issuers with foreign banks (1)
Issuers with Italian non-lender banks
Issuers with Italian lender banks
Assets (2) 2005-2008 5.7 28.4 128.7 212.8
2009-2011 5.6 32.0 122.2 250.4
2012-2015 7.7 36.3 133.2 263.1
Leverage (3) 2005-2008 5.3 4.1 2.2 2.7
2009-2011 4.3 3.5 2.3 2.6
2012-2015 3.9 3.2 2.2 2.6
Interest expense / Ebitda (3)
2005-2008 12.9 15.9 1.0 5.6
2009-2011 9.7 13.2 1.9 4.3
2012-2015 8.2 11.9 2.0 6.3
ROE (3) 2005-2008 5.5 4.1 6.7 5.6
2009-2011 3.8 2.1 2.5 4.0
2012-2015 4.7 3.4 4.2 3.9
Value added per employee (2)
2005-2008 57.5 67.1 76.9 81.5
2009-2011 58.8 67.9 69.6 83.0
2012-2015 64.1 72.1 70.3 82.1
Cash-flow / assets (3)
2005-2008 4.7 4.9 6.5 5.8
2009-2011 4.1 3.9 4.4 4.5
2012-2015 4.4 4.4 4.6 4.4
Share of exportss (3)
2005-2008 6.9 18.5 14.3 18.3
2009-2011 5.2 16.7 10.0 13.3
2012-2015 7.9 17.8 12.8 13.5
Rating (4) 2005-2008 4.8 4.8 4.1 4.9
2009-2011 4.7 4.8 4.7 5.0
2012-2015 4.4 4.6 4.6 5.0
Bad debts / loans (3) (5)
2005-2008 4.9 0.1 0.1 0.0
2009-2011 7.3 1.0 1.6 0.0
2012-2015 16.9 1.3 1.6 0.2
Number of firms (6)
2005-2008 90.168 752 82 162
2009-2011 86.229 724 71 159
2012-2015 79.754 700 74 151Source: Company Accounts Data Service, supervisory reporting and Central Credit Register. (1) Issuers placing their securities through foreign banks are calculated as a residual by comparing securities issues according to the Bank of Italy’s Securities Register against banks’ reports of placements. Issuers whose issuance is recorded in the Securities Register but not reported by the banks as placed in their supervisory financial reporting are classified as residual. (2) Million euros. – (3) Per cent. – (4) Scale of increasing risk from 1 to 9. – (5) Data on non-issuers relate to the universe of non-financial companies recorded in the Central Credit Register, net of those classified as issuers. –– (6) On average about half of the roughly 2,000 issuers recorded in the securities register are also present in the Company Accounts Data Service. See the heading ‘Issuers’ in Appendix for details on the characteristics of the firms registered on each database.
29

Table a6
Characteristics of the relationships between corporate issuers and placement banks (2004-2016) (1) (average yearly values)
Year Number of
banks Number of issuers
Number of banks in the syndicate per issue
First-time issuers
(%) share of first-time issuers
2004-2008 26 22 1.2 17 77
2009-2011 36 10 3.6 3 33
2012-2016 24 17 1.4 7 42
Year Number of firm/bank
relationships
Number of firm/bank relationships where
the bank lends to the firm
(%) share of firm/bank relationships in which the bank lends to the
firm
Security issue value
Amounts placed through lender banks
Amounts placed with
leading issue manager
2004-2008 52 36 69 3,428 2,969 2,682
2009-2011 42 18 42 6,294 4,998 4,613
2012-2016 37 23 60 3,207 2,773 2,503
Source: Supervisory reporting and Central Credit Register. Security placements reported by banks in the supervisory financial reporting scheme (Matrice dei conti). The data relate only to issue by non-financial companies resident in Italy with a nominal face value placed of €1 million. See the heading ‘Issuers’ in the Methodological Appendix for details of the characteristics of issuers in each database.
30

Table a7
Issuers’ decision to use placement services of lender bank (1)
Variable Coefficient SE Z-value P (3) Marginal effect
Log(Assets) 0.4928 0.0641 7.6920 0.0000 *** 7.69
Cash flow -0.0363 0.0321 -1.1320 0.2576 -0.48
ROE 0.0270 0.0104 2.6000 0.0093 *** 0.36
Company age -0.0097 0.0045 -2.1360 0.0327 ** -0.13
Leverage -0.1264 0.0619 -2.0410 0.0412 ** -1.61
Value added per employee -0.0002 0.0003 -0.8820 0.3778 0.00
Proportion of exports -0.0034 0.0028 -1.1970 0.2314 -0.05
Interest expense /GOI 0.0002 0.0002 0.8120 0.4166 0.00
Average risk rating (2) 0.1370 0.2848 0.4810 0.6305 1.91
High risk rating (2) -0.8389 0.4202 -1.9970 0.0459 ** -8.29
Loans 0.0000 0.0000 -3.4730 0.0005 *** 0.00
Time fixed effects Yes
N 919
Source: Central Credit Register, Securities Register and Company Accounts Data Service. (1) Logit regression in which the dependent variable is the likelihood that a corporate issuer will decide to use the placement services of an Italian bank with which it has a credit relationship. The marginal effect is the increase (decrease) in the likelihood that the firm will use a lender bank when there is a 1 % increase in the independent variable. (2) Dummy variables for the risk rating of the corporate issuer. The rating taken from the Company Accounts Data Service is reclassified into three risk groups: low (rating from 1 to 3), average (rating from 4 to 6) and high (rating from 7 to 9). (3) The symbols *, ** and *** indicate a significance level of 10, 5 and 1 per cent respectively.
31

Table a8
Effects of recourse to the capital markets on bank loans and on interest rates
(%) change in loans (1) Interest rates (2)
Coefficient SE Coefficient SE
Log(assets) -0.1050*** 0.0164 -0.0296 0.0600 Proportion of exports 0.0002 0.0002 0.0011 0.0008 Leverage -0.0033*** 0.0008 0.0040 0.0031 Interest expense / Ebitda 0.0000 0.0000 0.0000 0.0000 ROE 0.0001 0.0003 0.0017 0.0012 Value added per employee 0.0000 0.0000 -0.0003*** 0.0001 Cash-flow / assets 0.0024* 0.0013 -0.0124** 0.0050
Concentration of exposure to banks -1.2213*** 0.0805 0.5832*** 0.1072 (Concentration of exposure to banks)^2 0.5745*** 0.0694 0.0003 0.0694 Log(bank loans) -0.0493*** 0.0026 First-time issuer -0.0870*** 0.0155 0.2579*** 0.0551 Risky firm -0.0602*** 0.0174 0.3189*** 0.0582 Share of bank loans 0.0169*** 0.0004 -0.0130*** 0.0012 Issue -0.0812*** 0.0102 0.0350 0.0371 Issue * (First-time issuer) 0.0672*** 0.0123 -0.0951** 0.0431 Issue * (Risky firm) 0.0484*** 0.0153 -0.1844*** 0.0536 Issue * (Share of bank loans) -0.0032*** 0.0005 0.0003 0.0012 Issue * (Leading issue manager) 0.5077*** 0.0852 0.1757 0.2484
Issue * (Share of bank loans) * (Leading issue manager) 0.0137*** 0.0030 0.0047 0.0070 Bank fixed effects Yes Yes Firm fixed effects Yes Yes Security fixed effects Yes Yes N 125,777 32,678 R2 0.0794 0.4135 Adjusted R2 0.0713 0.3987 Source: Central Credit Register, Securities Register and Company Accounts Data Service. (1) Difference between the growth rate of the bank’s loans to the firm and the average rate of growth of bank loans to non-financial companies in a given quarter. – (2) Difference between the interest rate applied by the bank to the firm and the average weighted interest rate applied by the banking system to non-financial companies in a given quarter. – (3) The symbols *, ** and *** indicate a significance level of 10, 5 and 1 per cent respectively.
32

References Abrahamson M., T. Jenkinson and H. Jones (2011), ‘Why don’t US issuers demand European fees for IPOs?’, The Journal of Finance, 66:6, 2055-2082.
Carter R., F.H. Dark and T.R.A. Sapp (2010), ‘Underwriter Reputation and IPO Issuer Alignment 1981-2005’, The Quarterly Review of Economics and Finance, 50, 443–455.
Carter R., F. Dark and A. Singh (1998), ‘Underwriter Reputation, Initial Returns, and the Long Run Performance of IPO Stocks’, The Journal of Finance, 53, 285-311.
Carter R. and S. Manaster (1990), ‘Initial Public Offerings and Underwriter Reputation’, The Journal of Finance, 45:4, 1045-1067.
Cleveland W. S. (1979), ‘Robust Locally Weighted Regression and Smoothing Scatterplots’, Journal of the American Statistical Association, 74, 829-836.
De Cecco M. and G. Ferri (1996), Le banche d’affari in Italia, Il Mulino, Bologna. Drucker S. and M. Puri (2005), ‘On the Benefits of Concurrent Lending and Underwriting’, The Journal of Finance, 60:6, 2763-2799. Ernst & Young (2016), Capital Markets: building the investment bank of the future. Finaldi Russo P. and G. Guazzarotti (2014), ‘Le emissioni obbligazionarie delle imprese italiane nell’ultimo decennio’, mimeo. Freixas X. and P. Bolton (2000), ‘Equity, Bonds, and Bank Debt: Capital Structure and Financial Market Equilibrium under Asymmetric Information’, Journal of Political Economy, 108:2. Gande A., M. Puri, A. Saunders and I. Walter (1997), ‘Bank Underwriting of Debt Securities: Modern Evidence’, The Review of Financial Studies, 10:4, 1175-1202.
Gaure S. (2013), ‘OLS with Multiple High Dimensional Category Variables’, Computational Statistics and Data Analysis, 66:8–18, 2013.
Guazzarotti G. (2002), ‘Debt securities on the international market: yield at issue and the role of universal banks’, mimeo.
Hamao Y. and T. Hoshi (2000), ‘Bank underwriting of corporate bonds: evidence from Japan after the financial system reform of 1993’, mimeo.
Johnson J. and R. Miller (1988), ‘Investment Banker Prestige and the Underpricing of Initial Public Offerings’, Financial Management, 17: 2, 19-29.
Jones T.L. and M. Swaleheen (2010), ‘Endogenous examination of underwriter reputation and IPO returns’, Managerial Finance, 36:4, 284 – 293.
33

Kroszner R.S. and R.G. Rajan (1994), ‘Is the Glass-Steagall Act Justified? A Study of the U.S. Experience with Universal Banking before 1933’, The American Economic Review, 84:4, 810-832.
Onado M. (2013), ‘Una soluzione di sistema’, article published in Il Sole 24 Ore, 8 June.
Mc Kinsey & Company (2012), Global Corporate and Investment Banking. An Agenda for Change.
Myers S. and N. Majluf (1984), ‘Corporate financing and investment decisions when firms have information that investors do not have’, Journal of Financial Economics, 13, 157-187.
Narayanan R.P., K.P. Rangan and N.K. Rangan (2001), ‘Commercial bank underwriting: conflict of interest and credible commitment’, mimeo.
Pagano M., F. Panetta and L. Zingales (1998), ‘Why Do Companies Go Public?’, The Journal of Finance, 53:1, February.
Panetta F. (2001), ‘Le banche e i servizi finanziari alle imprese’, address to the Associazione per lo Sviluppo degli Studi di banca e Borsa in collaboration with Università Cattolica del Sacro Cuore of Milan.
Panetta F. (2013), ‘Banks, Finance and Growth’, address to the Associazione per lo Sviluppo degli Studi di banca e Borsa in collaboration with Università Cattolica del Sacro Cuore of Milan.
Pesaresi N. (1994), ‘Aspetti economici e normativi dell’attività degli enti creditizi rilevante per la riallocazione della proprietà’, in Banca d’Italia, Il mercato della proprietà e del controllo delle imprese: aspetti teorici e istituzionali, Rome.
Pianeselli D. and A. Zaghini (2014), ‘The cost of firms’ debt financing and the global financial crisis’, Banca d’Italia, Temi di Discussione (Working Papers), 950, February.
Puri M. (1996), ‘Commercial banks as underwriters: implications for the going public process’, Journal of Financial Economics, 54, 133-163.
Puri M. (1999), ‘Commercial banks in investment banking. Conflict of interest or certification role?’, Journal of Financial Economics, 40, 373-401.
Rossi S. (2013), ‘Finanza e crescita dopo la crisi’, closing address at the CIB 2013 Management Executive Program of SDA Bocconi.
Signorini F. (2015), ‘Sulla crescita delle piccole imprese: il ruolo della finanza’, address at Università degli Studi di Torino, 4 November.
Yasuda A. (2005), ‘Do Bank Relationships Affect the Firm’s Underwriter Choice in the Corporate-Bond Underwriting Market?’, The Journal of Finance, 60:3.
Zaghini A. (2017), ‘A tale of fragmentation: corporate funding in the euro-area bond market’, Banca d’Italia, Temi di Discussione (Working Papers), 1104, February.
34

Methodological Appendix Issuers
The Dealogic data refer to issuers that are non-financial firms or belong to a group headed by a non-financial firm. Seven countries are included: Italy, France, Germany, Spain, United Kingdom, Japan and United States. Data from the Anagrafe Titoli (Securities Register) and the Matrice dei conti (supervisory financial reporting scheme) relate to non-financial companies resident in Italy regardless of sector or parent company country of residence. Dealogic data include issues by other financial intermediaries (OFIs) not resident in Italy and belonging to a group headed by a non-financial company resident in Italy. Dealogic data mainly cover very large issues, while Matrice dei conti data include small offerings. Issuers are classified as ‘issuers using foreign banks’ if the securities recorded in the Securities Register are not reported as ‘securities underwritten’ by banks resident in Italy in the Matrice dei conti. ‘Issuers using (non-)lender banks’ are non-financial firms whose issues are recorded as ‘securities underwritten’ by banks resident in Italy with which they also (do not) have borrowing arrangements.
Market shares
The market share by nationality of bank (Table 1) is calculated assuming that the face value of the issue is equally distributed between all the bookrunners. For example, a €100 million issue handled by four bookrunners of which one is Italian gives a 25 per cent market share for Italian banks.
First time issuers
First time issuers are those issuing securities for the first time since January 1999. As a result the figure may be distorted by the left truncation of the reference period; however, the distortion is minimized by the fact that all the statistics were based on post-2004 data. A further distortion may be due to the nature of the Bank of Italy’s register of issuers: following a reorganisation or other corporate event, some firms may be given new ID codes that show them on the list of issuers for the first time whereas in reality they have already issued equity or debt instruments in the past.
Calculation of returns on security placements
Returns on security placements are estimated on the basis of Dealogic data and of data from the Matrice dei conti (Bank supervision reporting). In the first case, total fees are calculated as a ratio of the face value of securities issued for the sub-group of issuers consisting of non-financial companies or companies belonging to a group headed by a non-financial company. In the case of data from the Matrice dei conti, the profit and loss statement item ‘underwriting fees’ is calculated as a ratio of the volume of securities placed by the banks at face value: = . Therefore, since the profit and loss item cannot be broken
down by issuer sector, the estimated return on placement includes all securities placed by the banks regardless of the issuer’s sector and of the type of instrument (equity instrument, debt instrument, investment fund unit, etc.).
35

Returns on security placements adjusted for underwriting are estimated by deducting from the ratio of placement fees to face value of the securities placed the share of securities underwriting multiplied by the return per portfolio security. This assumes that the fee received by the banks for placing the security is equal to the average return on the portfolio. In fact, if the placement fee without underwriting is r and the underwriting risk premium is equal to at least the guaranteed return per portfolio security then ϕ = r , the observed return will be a weighted average of the base return and the return with underwriting: r = q r + ϕ + 1 − q r
where q , the share of securities placed and underwritten by the bank, is estimated as the ratio of the amount of underwritten securities placed to total placements. Making this explicit with respect to the base income r we have: r = r − q ϕ
Returns on placements adjusted for underwriting are therefore estimated by deducting from the ratio of placement fees to the face value of securities underwritten that share of underwritten securities multiplied by the return per portfolio security. It is assumed that the fee to the banks for underwriting the securities is equal to the average return on the securities portfolio.
Impact of issuance on credit relationships
Data on changes in credit recorded in the Central Credit Register (CCR) and the Analytical Survey on interest rates applied by banks (TAXIA) are observed four quarters before and after securities issuance. The impact of issues at time t on corporate issuer i is measured as the difference in the spread of growth rates in credit (per cent) and interest rates on credit received (in basis points) from bank b compared with the system as a whole:
= 1 − ̅ − 1 − ̅
where is the interest rate or the rate of growth of loans relating to the credit relationship between bank b and corporate issuer i before (between t-4 and t-1) and after (from t+1 to t+4) the securities issuance at time t. ̅ is the interest rate or credit growth rate for the whole banking system estimated from TAXIA or CCR data, while is the number of observations.
36