UCLA Nov 2014 lecture
33
Southern California Regional Watershed Supply Opportunities Richard Atwater, Executive Director Southern California Water Committee Water 101 Water Education Foundation October 2, 2014
-
Upload
richard-atwater -
Category
Documents
-
view
112 -
download
1
Transcript of UCLA Nov 2014 lecture
Southern California
Regional Watershed
Supply Opportunities
Richard Atwater, Executive Director
Southern California Water Committee
Water 101
Water Education Foundation
October 2, 2014
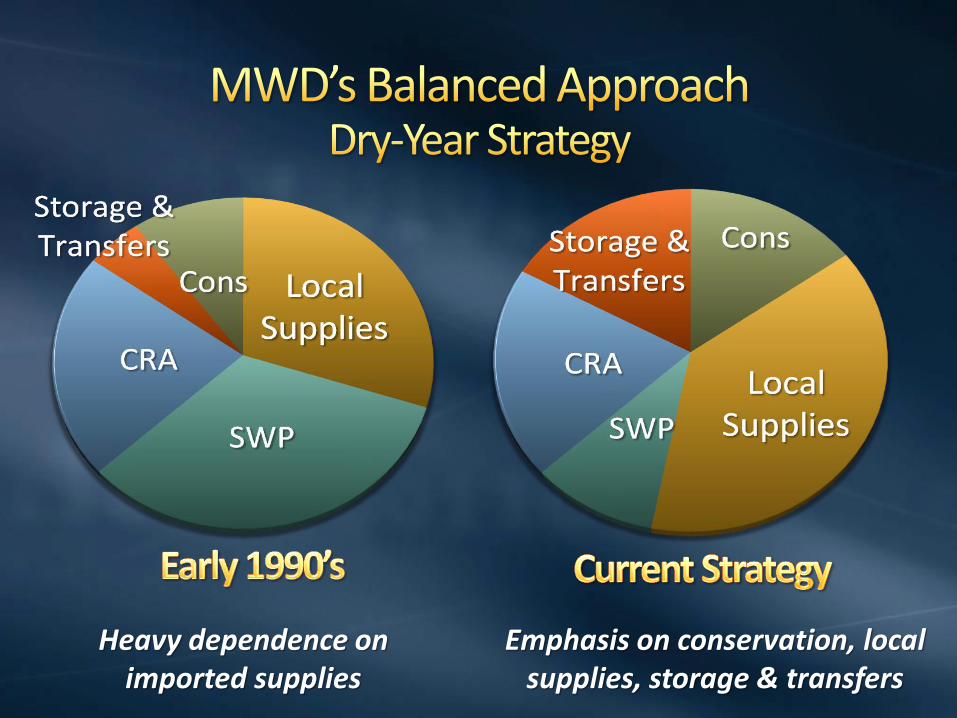
Heavy dependence on imported supplies
Emphasis on conservation, local supplies, storage & transfers
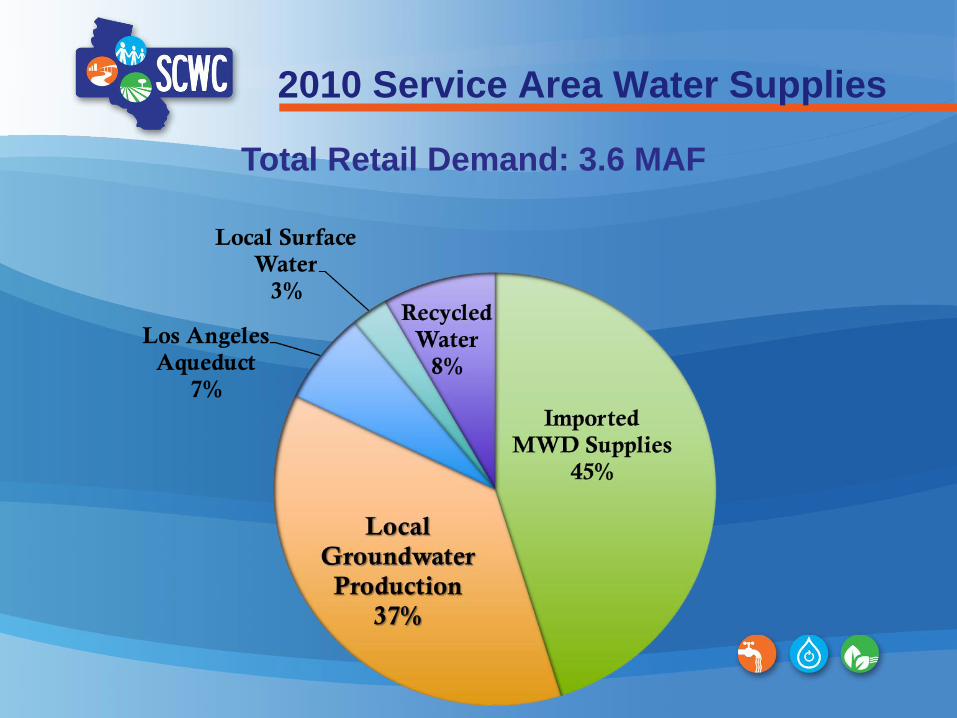
2010 Service Area Water Supplies
Total Retail Demand: 3.6 MAF
120
130
140
150
160
170
180
190
200
210
220
1996 1998 2000 2002 2004 2006 2008 2010 2012 2014 2016 2018 2020
Gal
lon
s p
er
Cap
ita
pe
r D
ay (
GP
CD
)
Regional GPCD
1996-2005 Average = 177 GPCD
2020 goal = 141 GPCD
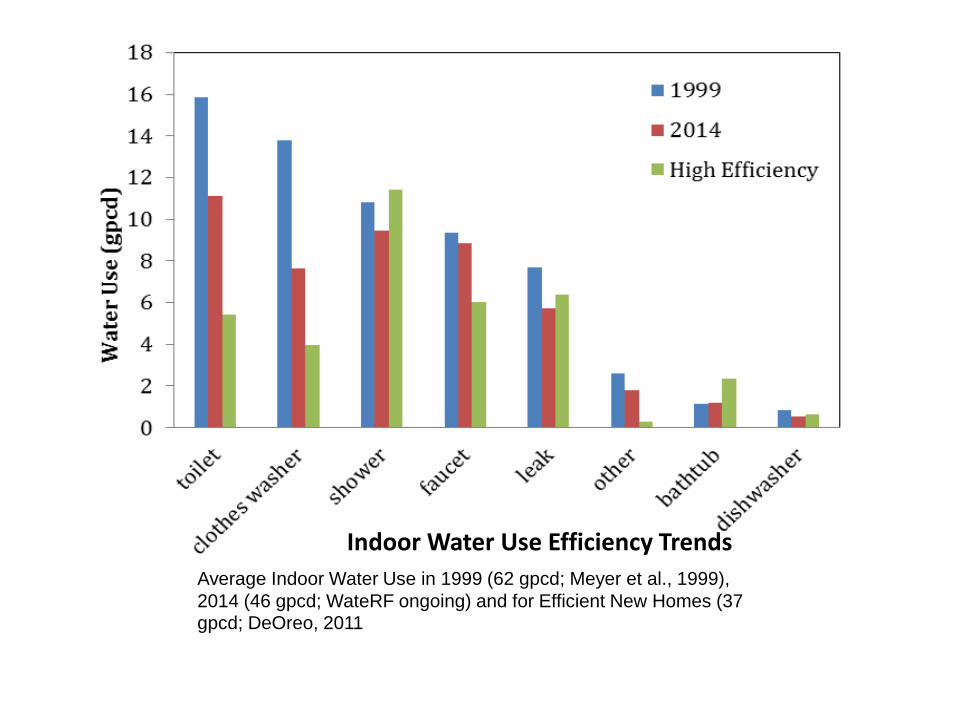
Indoor Water Use Efficiency Trends
Average Indoor Water Use in 1999 (62 gpcd; Meyer et al., 1999),
2014 (46 gpcd; WateRF ongoing) and for Efficient New Homes (37 gpcd; DeOreo, 2011
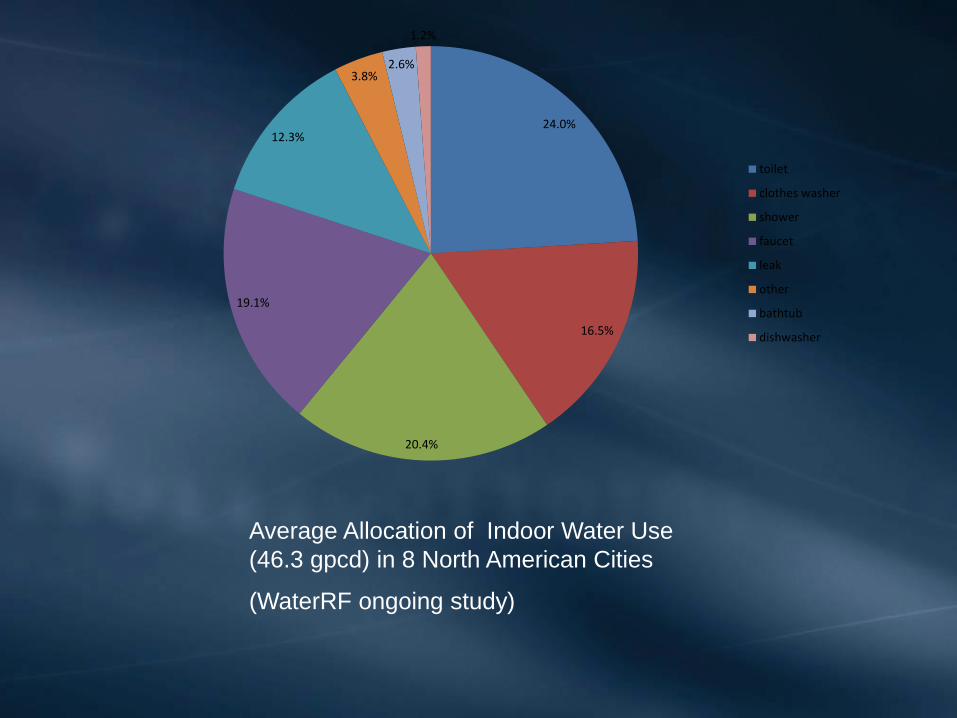
24.0%
16.5%
20.4%
19.1%
12.3%
3.8% 2.6%
1.2%
toilet
clothes washer
shower
faucet
leak
other
bathtub
dishwasher
Average Allocation of Indoor Water Use
(46.3 gpcd) in 8 North American Cities
(WaterRF ongoing study)
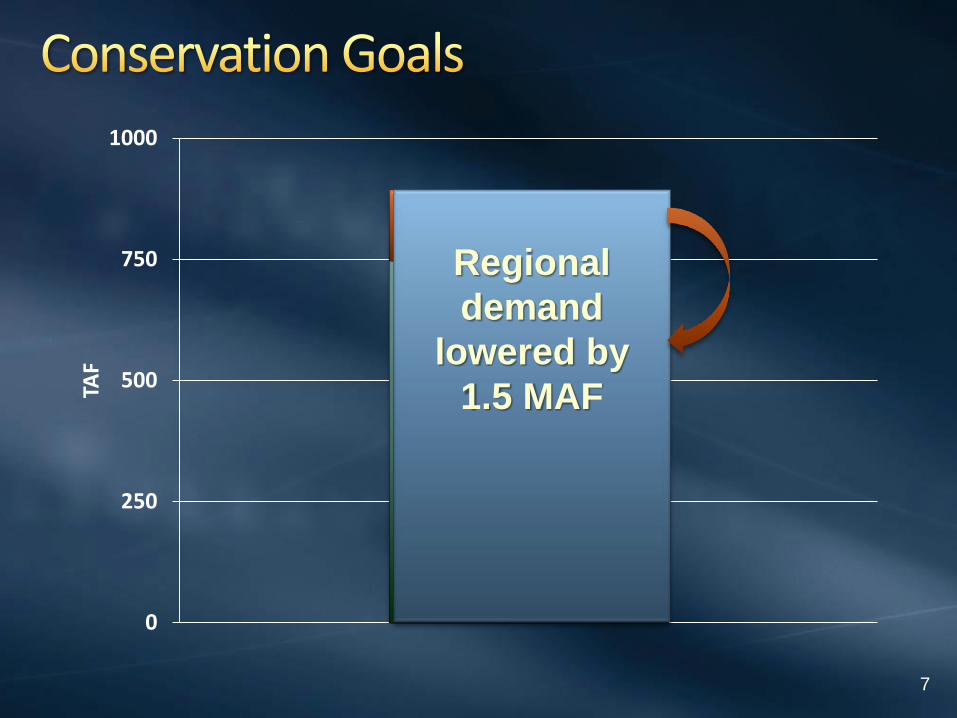
0
250
500
750
1000
TAF
Incentives
17%
Non-incentives
83%
Regional
demand
lowered by
1.5 MAF
7
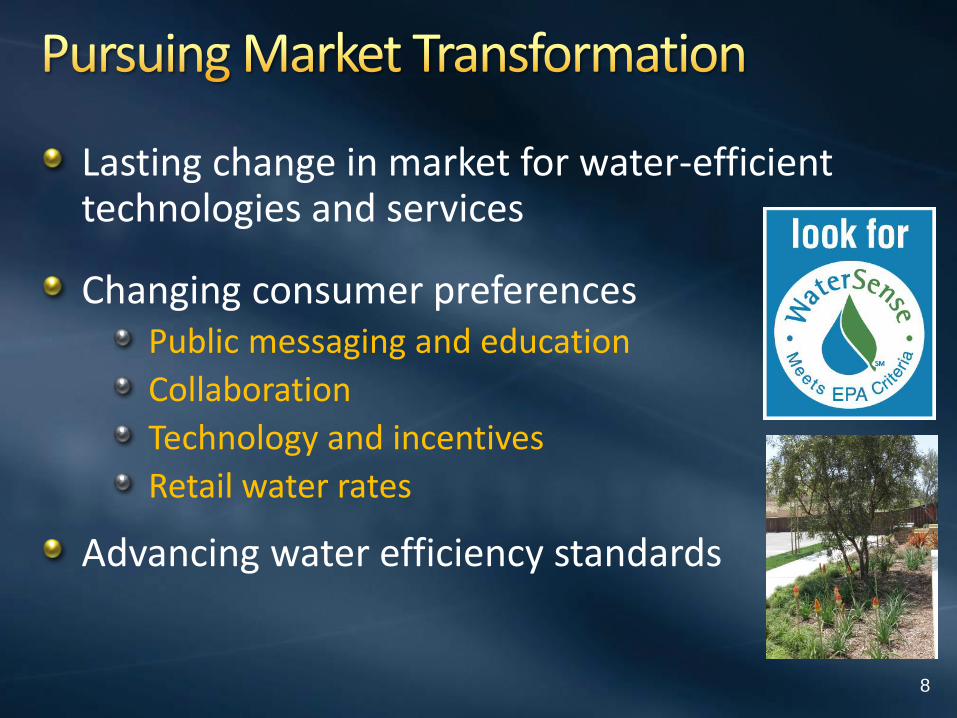
Lasting change in market for water-efficient technologies and services
Changing consumer preferences Public messaging and education
Collaboration
Technology and incentives
Retail water rates
Advancing water efficiency standards
8
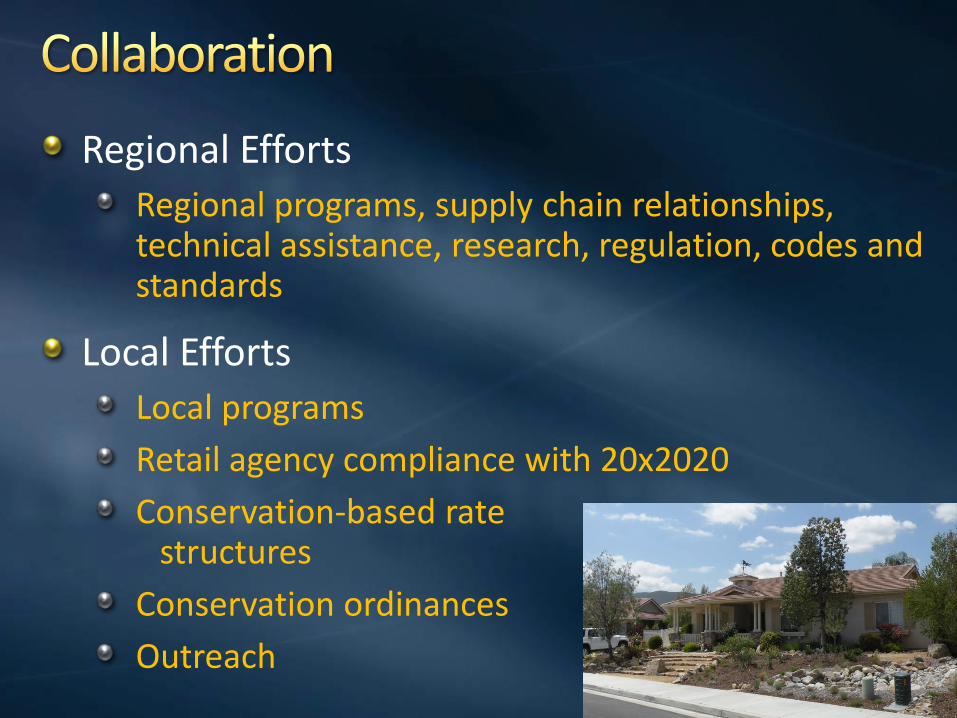
Regional Efforts
Regional programs, supply chain relationships, technical assistance, research, regulation, codes and standards
Local Efforts
Local programs
Retail agency compliance with 20x2020
Conservation-based rate structures
Conservation ordinances
Outreach 9
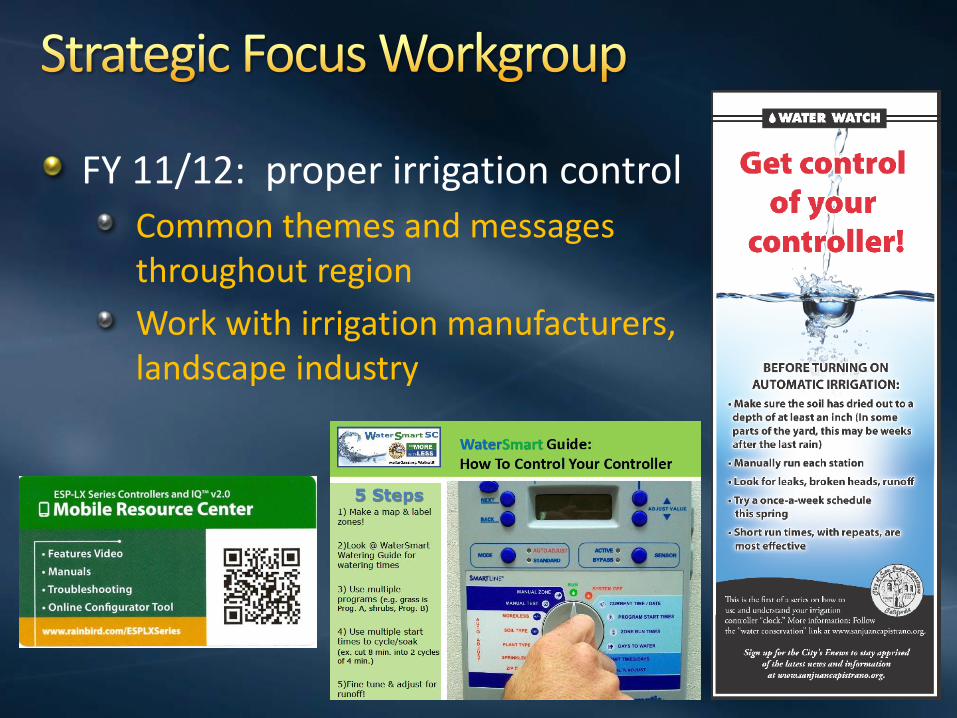
FY 11/12: proper irrigation control
Common themes and messages throughout region
Work with irrigation manufacturers, landscape industry
10
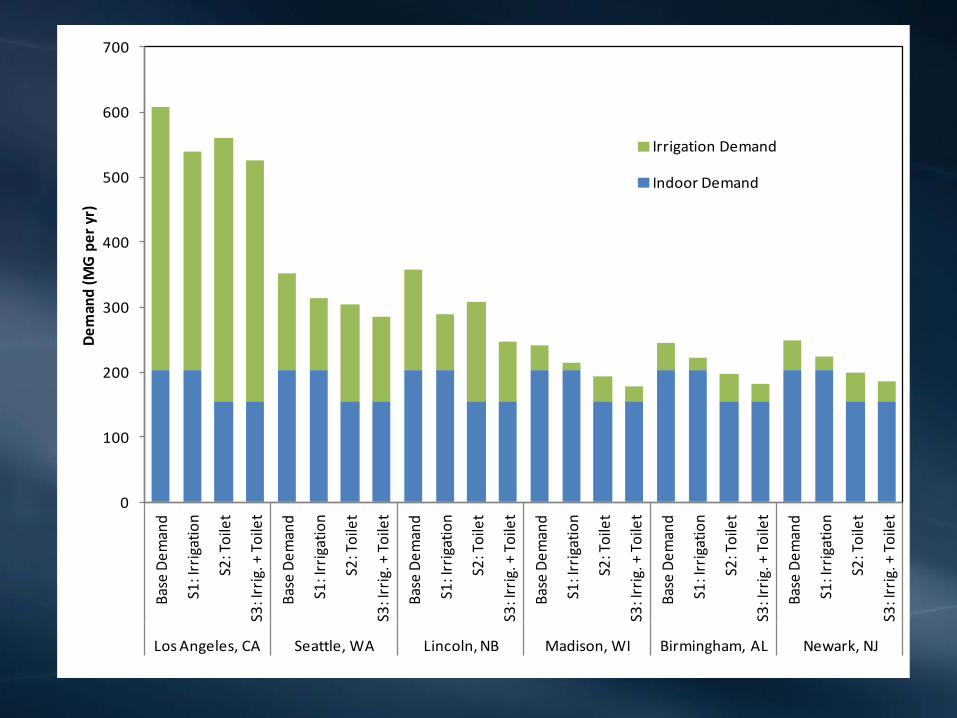
“it never rain in the summer”
0
100
200
300
400
500
600
700
Bas
e D
em
and
S1: I
rrig
atio
n
S2: T
oile
t
S3: I
rrig
. + T
oile
t
Bas
e D
em
and
S1: I
rrig
atio
n
S2: T
oile
t
S3: I
rrig
. + T
oile
t
Bas
e D
em
and
S1: I
rrig
atio
n
S2: T
oile
t
S3: I
rrig
. + T
oile
t
Bas
e D
em
and
S1: I
rrig
atio
n
S2: T
oile
t
S3: I
rrig
. + T
oile
t
Bas
e D
em
and
S1: I
rrig
atio
n
S2: T
oile
t
S3: I
rrig
. + T
oile
t
Bas
e D
em
and
S1: I
rrig
atio
n
S2: T
oile
t
S3: I
rrig
. + T
oile
t
Los Angeles, CA Seattle, WA Lincoln, NB Madison, WI Birmingham, AL Newark, NJ
De
man
d (
MG
pe
r yr
)
Irrigation Demand
Indoor Demand
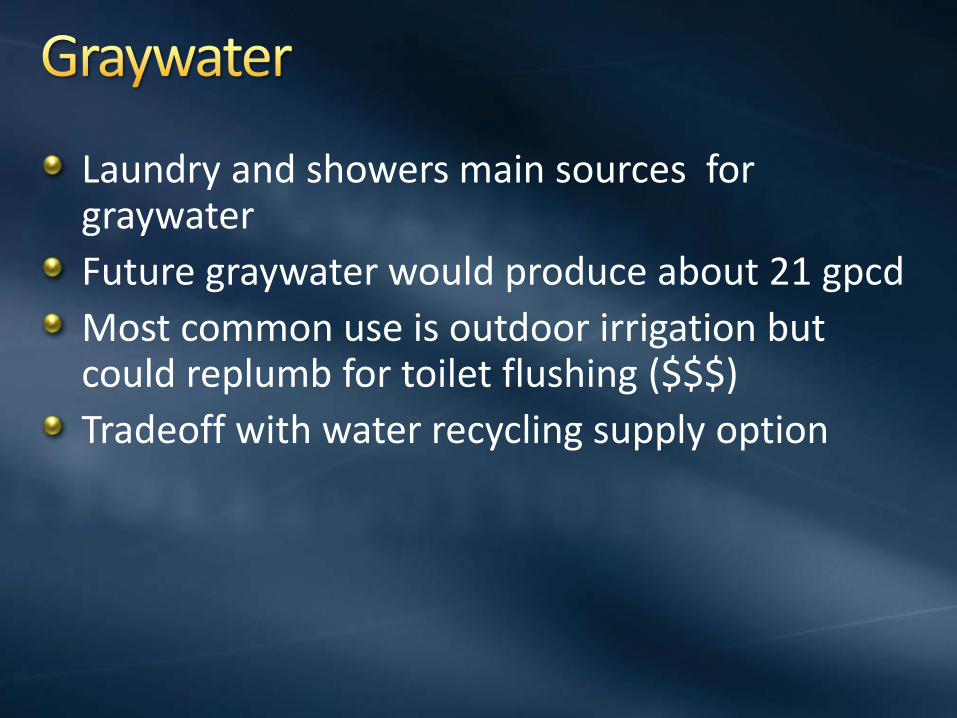
Laundry and showers main sources for graywater
Future graywater would produce about 21 gpcd
Most common use is outdoor irrigation but could replumb for toilet flushing ($$$)
Tradeoff with water recycling supply option
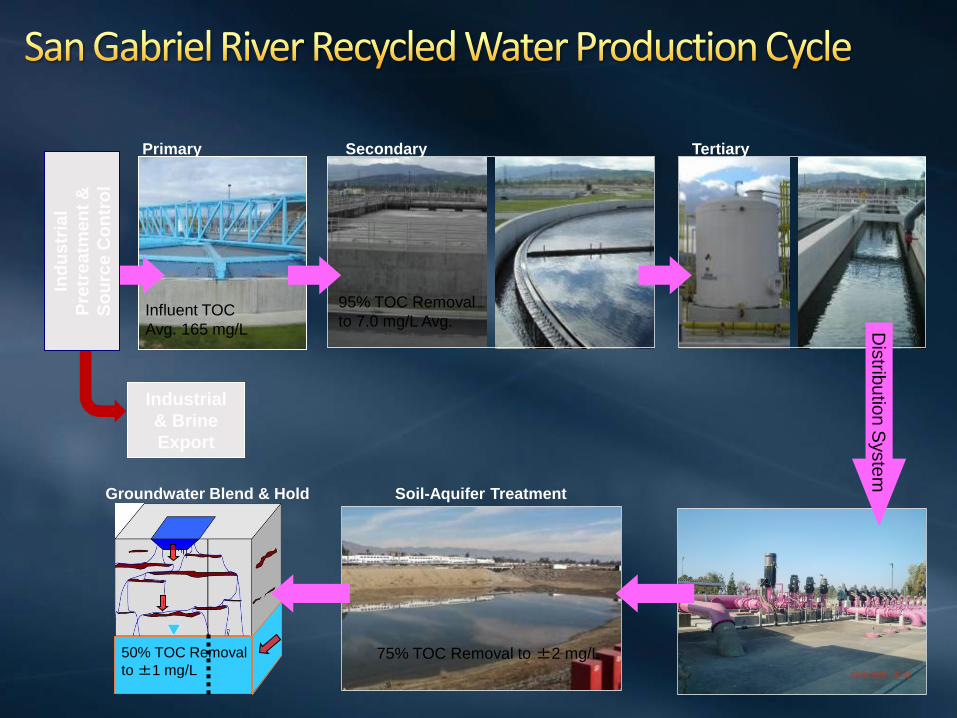
Secondary Tertiary
Soil-Aquifer Treatment
Primary
Groundwater Blend & Hold
Dis
tribu
tion S
yste
m
Industrial
& Brine
Export
95% TOC Removal
to 7.0 mg/L Avg.
75% TOC Removal to ±2 mg/L
Ind
us
tria
l
Pre
tre
atm
en
t &
So
urc
e C
on
tro
l
Influent TOC
Avg. 165 mg/L
50% TOC Removal
to ±1 mg/L
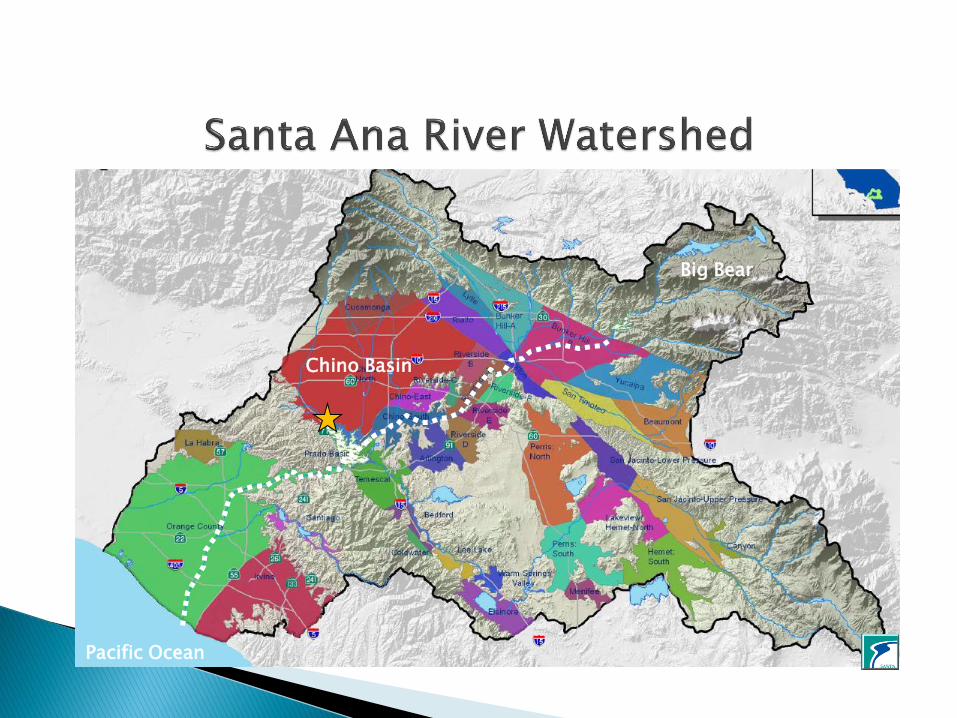
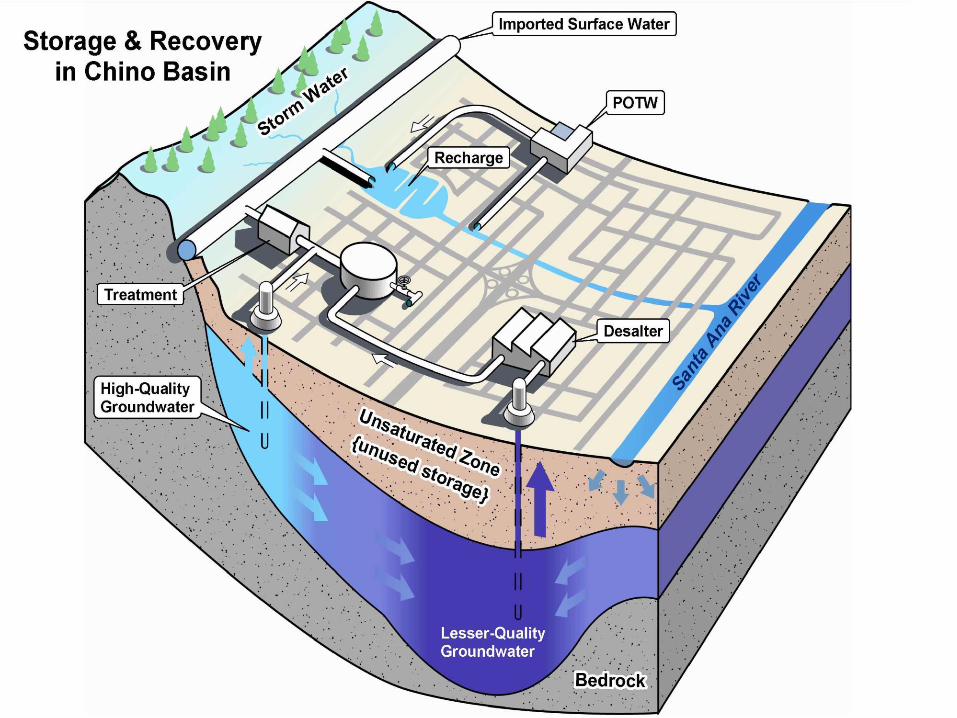
Chino Basin
Big Bear
Pacific Ocean
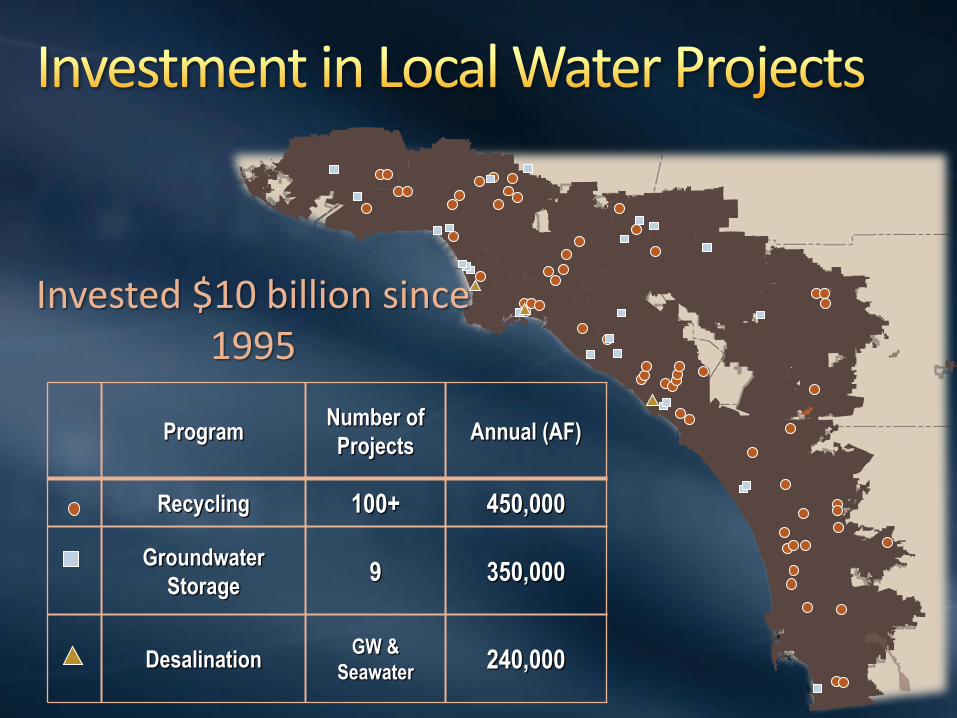
Program Number of
Projects Annual (AF)
Recycling 100+ 450,000
Groundwater
Storage 9 350,000
Desalination GW &
Seawater 240,000
Invested $10 billion since 1995
Current as of 9/22/10
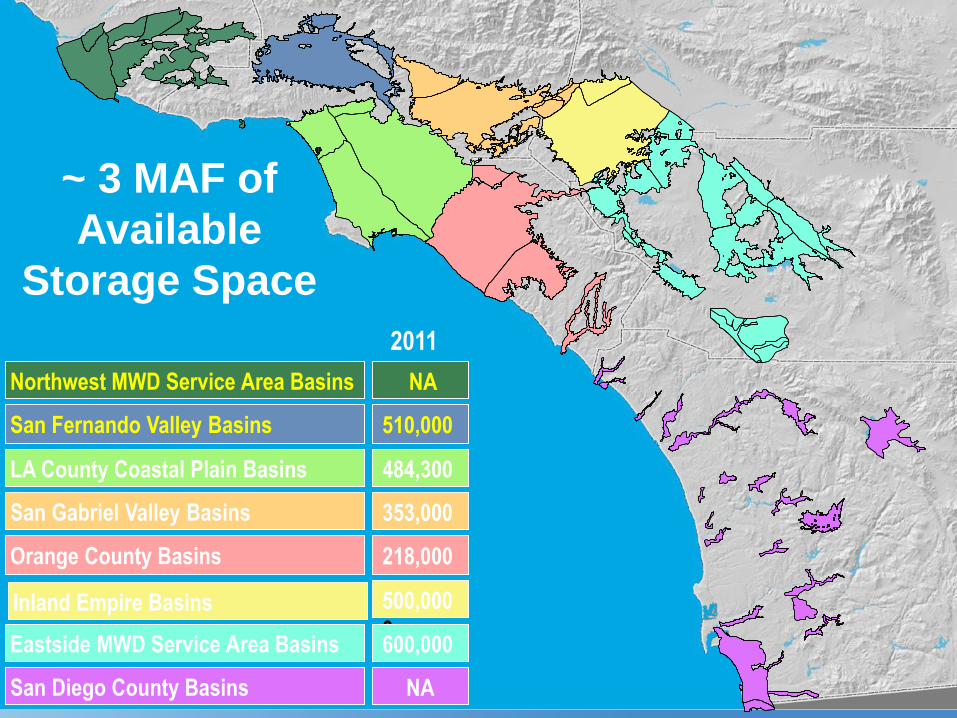
Northwest MWD Service Area Basins
San Fernando Valley Basins
LA County Coastal Plain Basins
San Gabriel Valley Basins
Orange County Basins
Inland Empire Basins
Eastside MWD Service Area Basins
San Diego County Basins
~ 3 MAF of
Available
Storage Space
NA
510,000
484,300
353,000
218,000
500,000
0 600,000
NA
2011
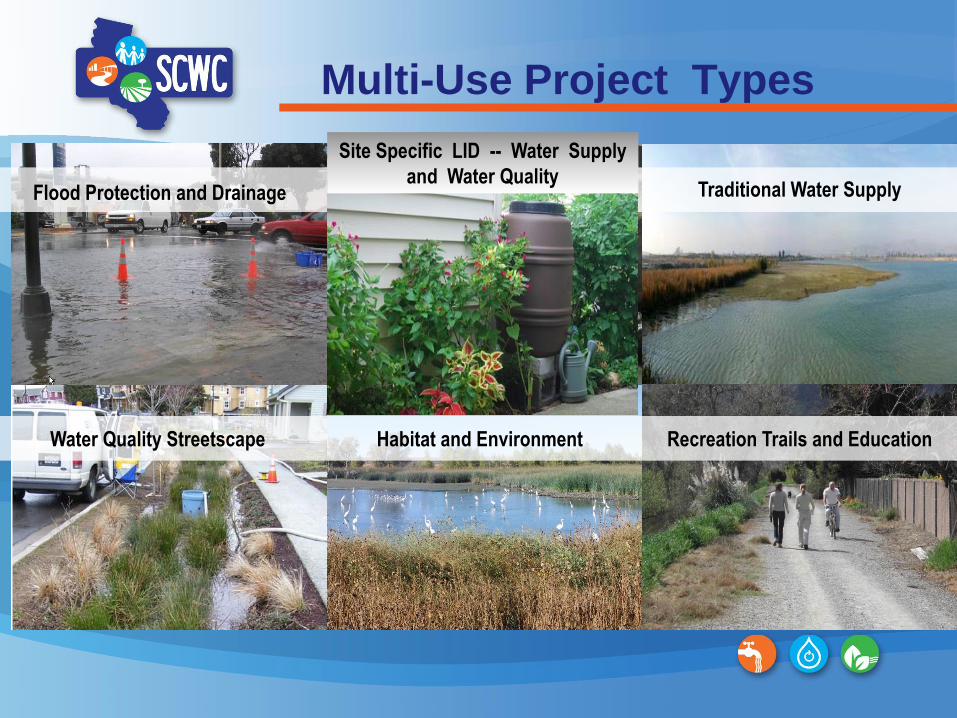
Multi-Use Project Types
Flood Protection and Drainage Erosion and Sedimentation Traditional Water Supply
Water Quality Streetscape Habitat and Environment Recreation Trails and Education
Site Specific LID -- Water Supply
and Water Quality
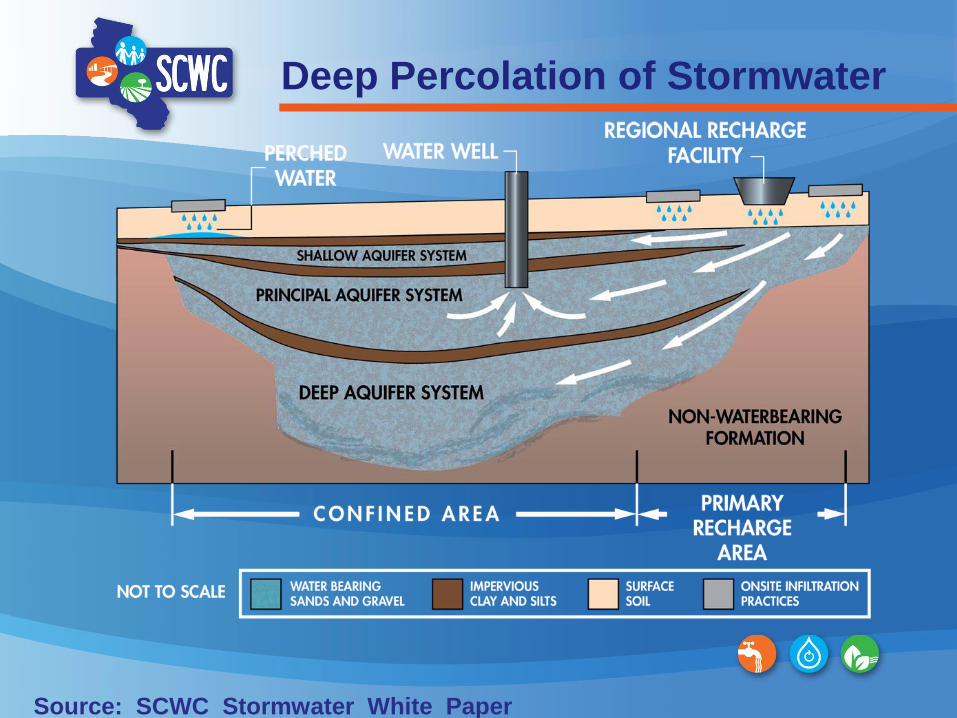
Deep Percolation of Stormwater
Source: SCWC Stormwater White Paper
Stormwater:
A Smart & Sensible Solution
• 450,000 acre-feet of stormwater is currently captured and
recharged into So Cal groundwater basins per year
(enough water for 3 million people/year)
• Billions of gallons are lost every year because we
don’t have enough stormwater capture systems
• Capturing stormwater is viable, cost-effective and
environmentally preferable
• Capturing stormwater provides numerous benefits, including:
• Creating more local water supplies
• Reducing polluted run-off
• Providing a cost-effective water supply option
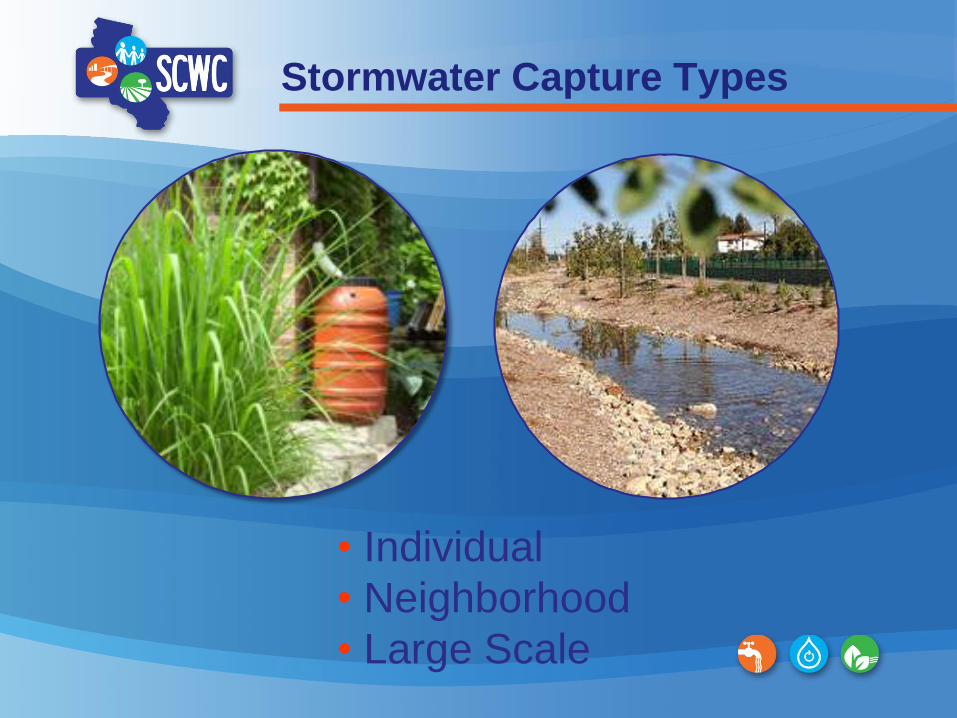
Stormwater Capture Types
• Individual
• Neighborhood
• Large Scale
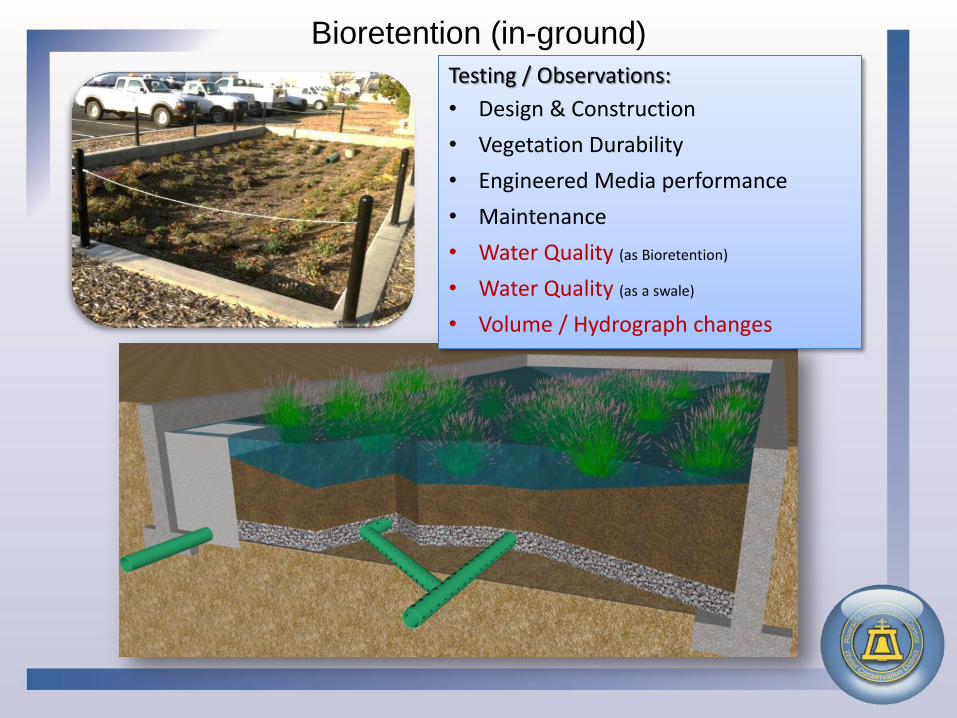
Bioretention (in-ground)
Testing / Observations:
• Design & Construction
• Vegetation Durability
• Engineered Media performance
• Maintenance
• Water Quality (as Bioretention)
• Water Quality (as a swale)
• Volume / Hydrograph changes
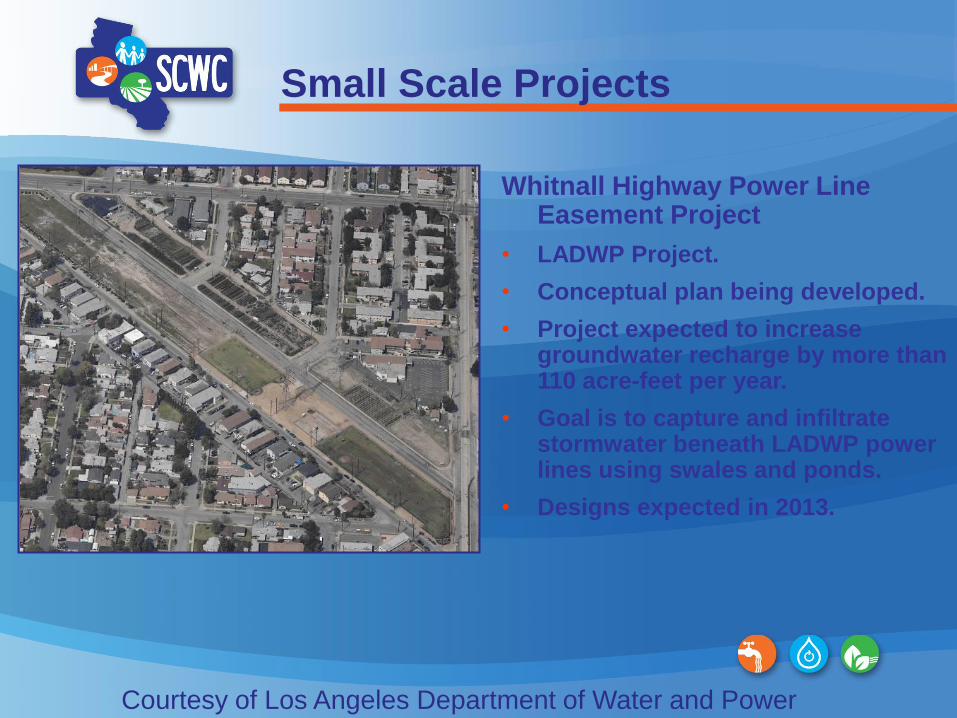
Whitnall Highway Power Line Easement Project
• LADWP Project.
• Conceptual plan being developed.
• Project expected to increase groundwater recharge by more than 110 acre-feet per year.
• Goal is to capture and infiltrate stormwater beneath LADWP power lines using swales and ponds.
• Designs expected in 2013.
Small Scale Projects
Courtesy of Los Angeles Department of Water and Power
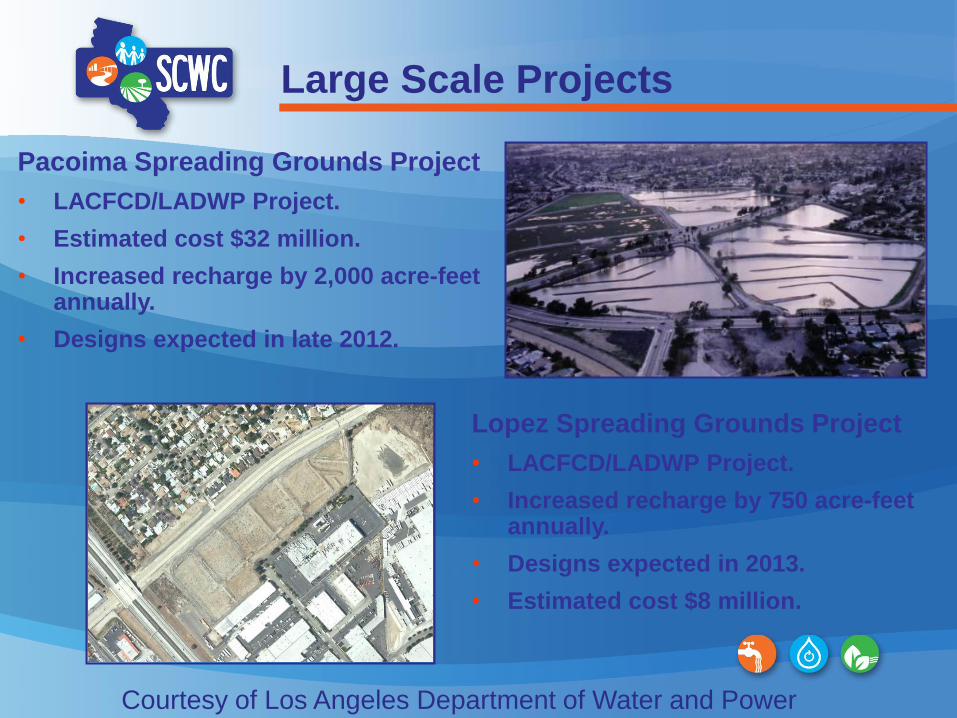
Pacoima Spreading Grounds Project
• LACFCD/LADWP Project.
• Estimated cost $32 million.
• Increased recharge by 2,000 acre-feet annually.
• Designs expected in late 2012.
Large Scale Projects
Lopez Spreading Grounds Project
• LACFCD/LADWP Project.
• Increased recharge by 750 acre-feet annually.
• Designs expected in 2013.
• Estimated cost $8 million.
Courtesy of Los Angeles Department of Water and Power
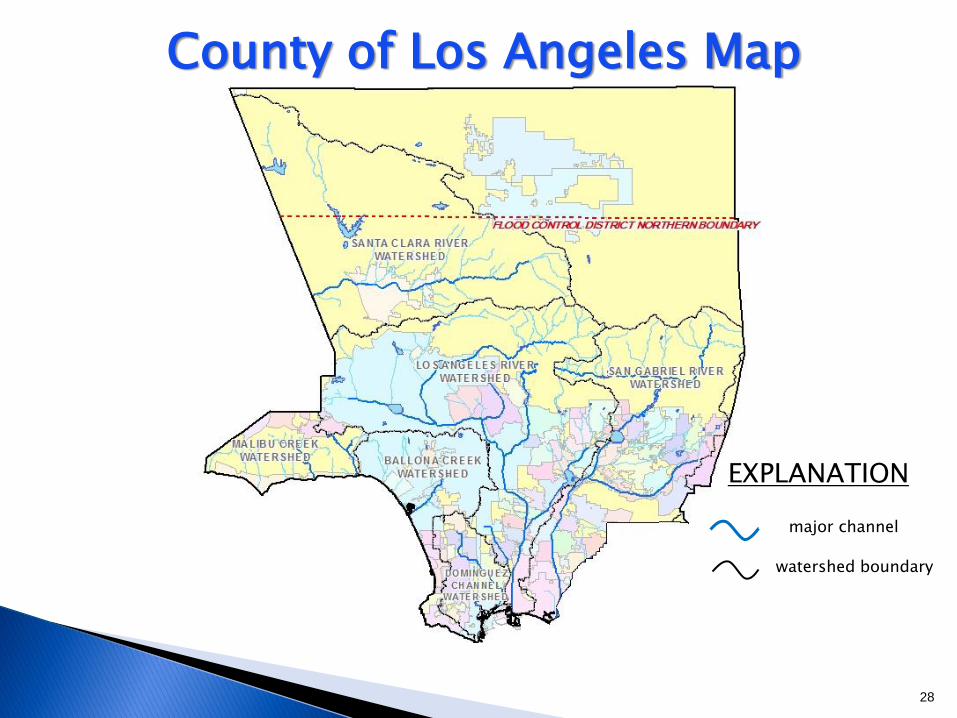
28
major channel
watershed boundary
County of Los Angeles Map
EXPLANATION
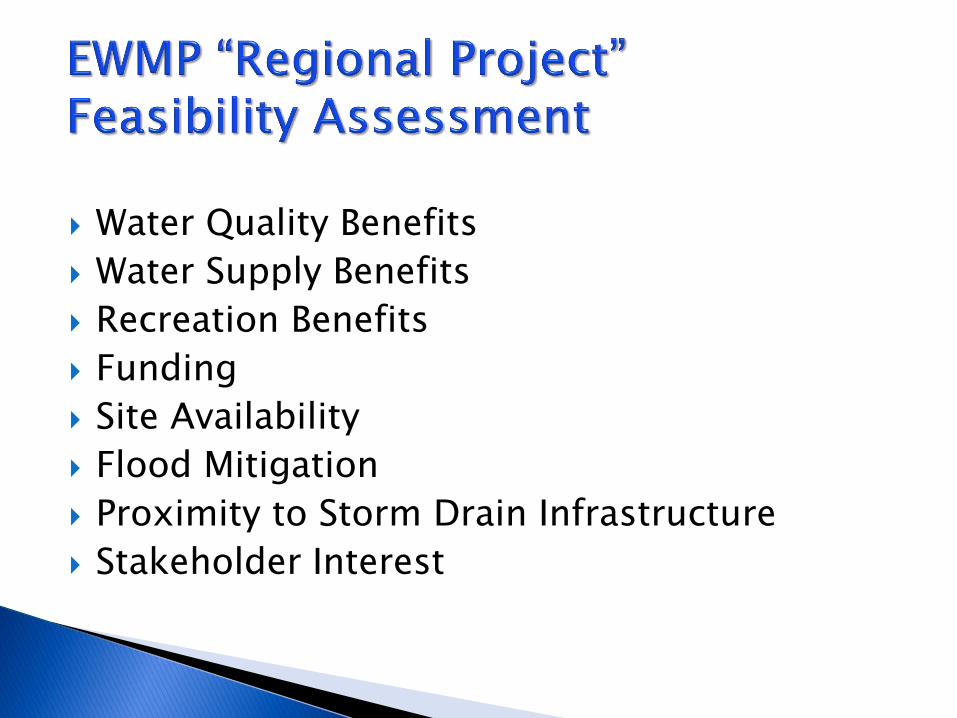
Water Quality Benefits
Water Supply Benefits
Recreation Benefits
Funding
Site Availability
Flood Mitigation
Proximity to Storm Drain Infrastructure
Stakeholder Interest
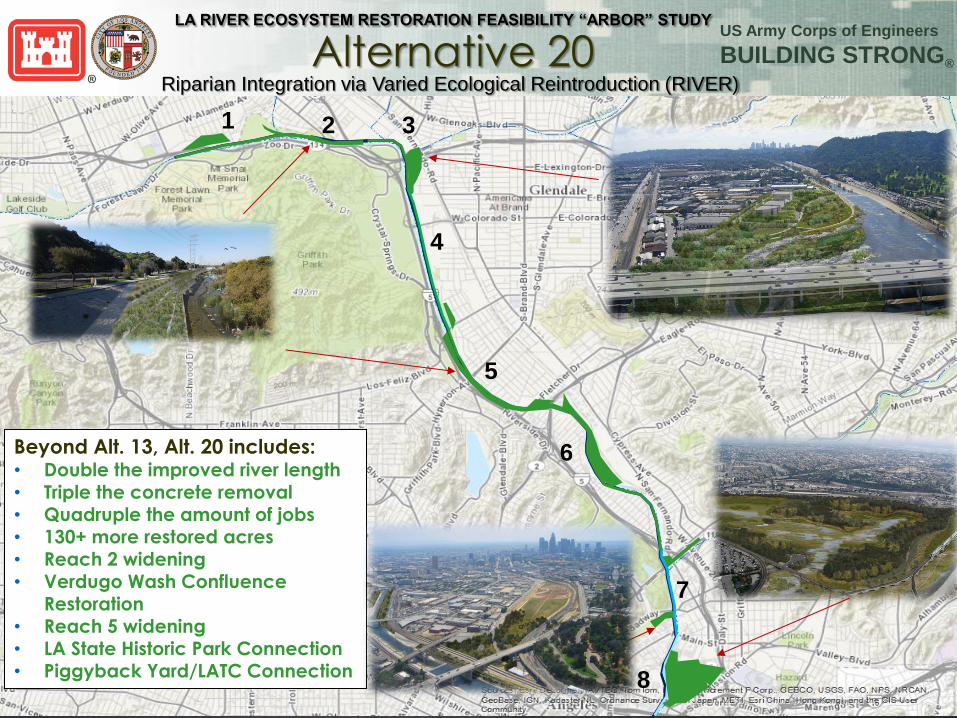
US Army Corps of Engineers
BUILDING STRONG®
1
4
2 3
5
7
8
6 Beyond Alt. 13, Alt. 20 includes: • Double the improved river length • Triple the concrete removal • Quadruple the amount of jobs • 130+ more restored acres • Reach 2 widening • Verdugo Wash Confluence
Restoration • Reach 5 widening • LA State Historic Park Connection • Piggyback Yard/LATC Connection
Alternative 20 LA RIVER ECOSYSTEM RESTORATION FEASIBILITY “ARBOR” STUDY
Riparian Integration via Varied Ecological Reintroduction (RIVER)
8
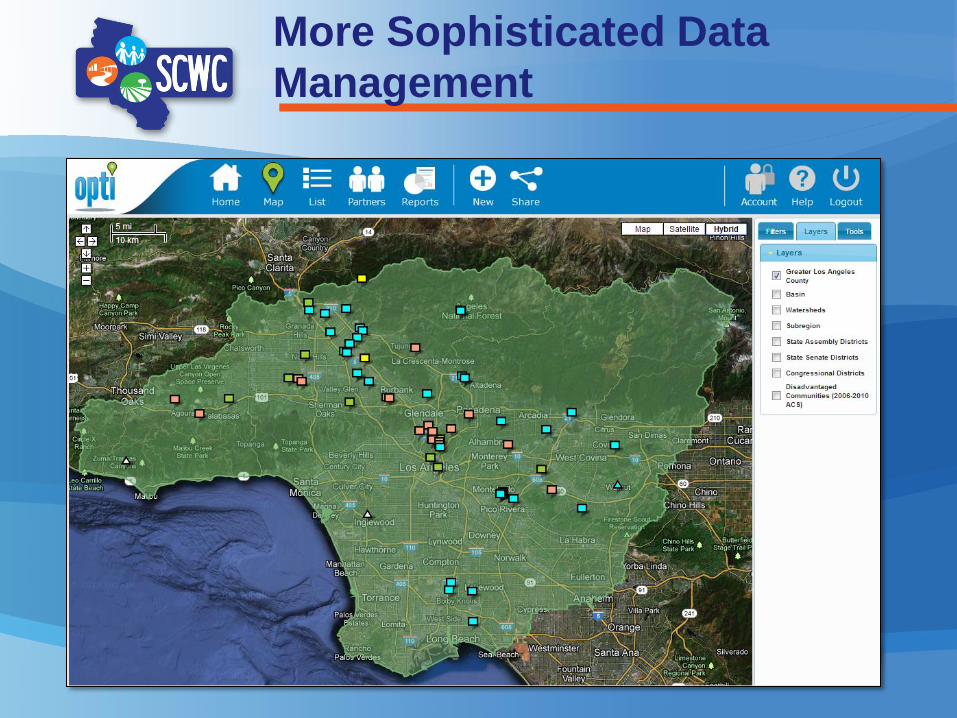
More Sophisticated Data
Management
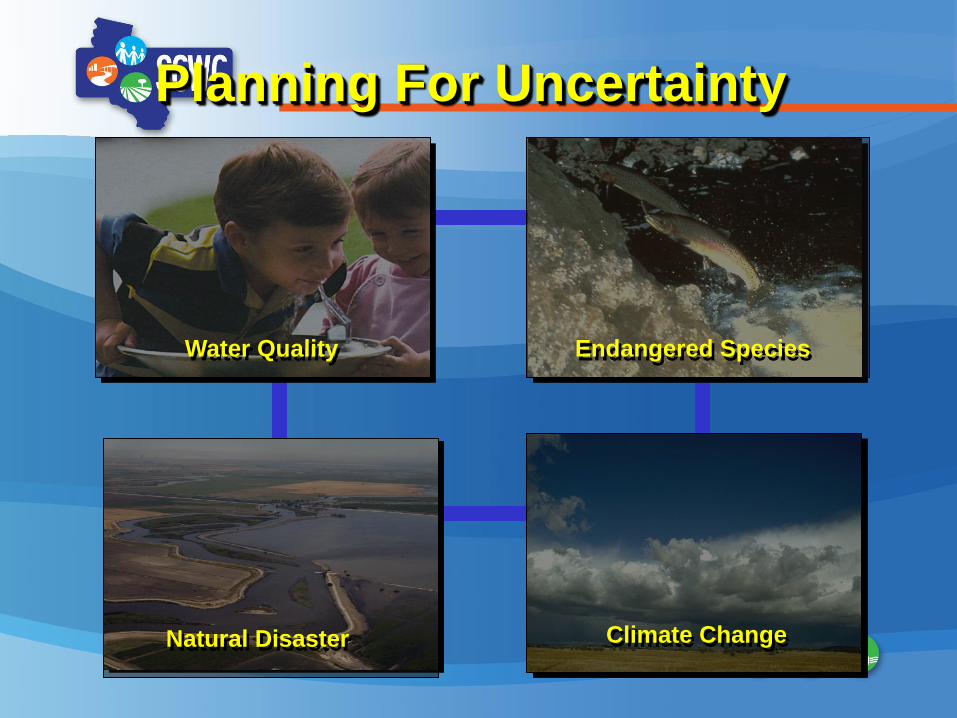
Planning For Uncertainty
Natural Disaster
Water Quality
Climate Change
Endangered Species
Thank You!
Richard Atwater
Southern California Water Committee