
UBS House View - Business Transitions Forum · 2016-10-21 · NOVEMBER 2016 UBS HOUSE VIEW 3...
44
Investment Strategy Guide a b CIO Wealth Management Research US edition UBS House View November 2016 The debate that wasn’t In Context: Fact-checking our assumptions In Focus : Shiſting probabilities Videos : Jeremy Zirin on positioning for rising inflation
Transcript of UBS House View - Business Transitions Forum · 2016-10-21 · NOVEMBER 2016 UBS HOUSE VIEW 3...

Investment Strategy Guide
ab
CIO Wealth Management Research
US edition
UBS House ViewNovember 2016
The debate that wasn’tIn Context: Fact-checking our assumptionsIn Focus: Shifting probabilitiesVideos: Jeremy Zirin on positioning for rising inflation

A MESSAGE FROM THE REGIONAL CIO
This report has been prepared by UBS AG, UBS Switzerland AG, and UBS Financial Services Inc.Please see important disclaimers and disclosures at the end of this document.
1 Tactical preferences
2 Feature The debate that wasn’t by Mark Haefele
8 In context Fact-checking our assumptions by Jeremy Zirin
10 Preferred investment views
11 At a glance
11 Month in review
12 Top themes spotlight Of MLPs and senior loans by Stephen Freedman and Laura Kane
14 Global economic outlook
16 Asset classes overview Equities Fixed income Commodities Foreign exchange
22 In focus Shifting probabilities by Mike Ryan and Tom McLoughlin
24 Top themes overview
26 Key forecasts
27 Detailed asset allocation
34 Performance measurement
37 Appendix
41 Publication details
CONTENTS
Dear reader,
Counting from the first candidacy announcement, the 2016 US elec-tion season has already lasted 578
days. In addition to being one of the lon-gest campaigns in history, the vitriolic tone of this year’s contest has made it all the more wearying. But the end is merci-fully now in sight, with early voting hav-ing already started across much of the country and Election Day now only 18 days away.
In the Feature article, we imagine what a drama-free presidential debate might have looked like, exploring the substan-tive drivers underlying the candidates’ worldviews and policy prescriptions. These range from the issues of income inequality, to immigration, to free and fair trade. One can only look back upon the lack of substantive debate on these critical issues as yet another lost opportu-nity of this election.
Shifting gears a bit to more practical matters, this month’s In Context article outlines our most recent Tactical As-set Allocation (TAA) changes, where we are introducing a position in US Treasury Inflation Protected Securities (TIPS), an overweight to financials (along with a re-duction to our industrials allocation), and a return to a neutral allocation for non-US developed market bonds. We also perform some fact-checking on two key assumptions – namely accelerating infla-tion and a weakening US dollar – that underpin our thesis.
The Top Themes Spotlight focuses on two changes this month: upgrading US senior loans to Top Theme status and in-creasing the Master Limited Partnerships (MLPs) allocation within our North Ameri-can energy independence: reenergized theme. Both changes reflect our belief that accelerating growth and inflation will support Federal Reserve rate hikes. In the In Focus we return to the issue of domestic politics with an update on the US election, where the race has taken yet another quirky turn amid some additional missteps by Donald Trump. But while we have increased the probability of a Clinton presidency, we still expect market-friendly gridlock in the form of a divided Congress.
With many voters (most, if you count the candidates’ unfavorable ratings) likely to be unhappy regardless of the outcome, it will be a relief to put this election behind us. But if this election proves anything, it is the timeless wisdom of our founding fa-thers for never entrusting the care of this great republic to any individual or single institution.
And that, at last, is something we can all agree upon and be grateful for in this election…
Mike Ryan, CFAChief Investment Strategist, WMA
We want to hear from you
Please click on one of the three links below to share your thoughts about this report. Are you....
Mostly satisfied?Neutral?Mostly dissatisfied?
An email message will open, where we encourage you to write additional comments. Thank you!

NOVEMBER 2016 UBS HOUSE VIEW 1
Cas
h
Eq
uitie
s
Fixed income Comm
odities Non traditional Foreign exchange
La
rge
cap
Lar
ge c
ap
U
S
US
Dev
elope
d
Emerg
ing
US IG US HY Developed Emerging
US
US
Int’
l
Int’l T
otal
Tot
al
G
row
th
Val
ue
M
id ca
p
Small
cap
Mark
ets
M
arkets
T
otal US Gov’t US Muni Corp Corp Markets Markets Total Total USD
TACTICAL PREFERENCES
We prefer US equities, corporate bonds, and TIPS vs. Treasuries, and favor emerging markets over Swiss equities.
Currencies
We favor a basket of emerging market versus developed market currencies.
Equities We remain overweight US and emerging markets, and underweight Swiss stocks.
Fixed income We introduce an overweight on US inflation-linked bonds and upgrade non-US developed bonds to neutral.
Each bar represents a +/- 2% tactical tilt or part thereof (i.e., one bar = 0.5% to 2%, 2 bars = 2.5% to 4%, 3 bars = over 4%). NOTE: TACTICAL TIME HORIZON IS APPROXIMATELY SIX MONTHS
Neutral: Tactical recommen-dation to hold the asset class in line with its weight in the moderate risk strategic asset allocation (see page 25)
Underweight: Tactical recom-mendation to hold less of the asset class than specified in the moderate risk strategic asset allocation (see page 25)
Overweight: Tactical recom-mendation to hold more of the asset class than specified in the moderate risk strategic asset allocation (see page 25)
Asset classesTactical asset allocation
LEGEND

2 UBS HOUSE VIEW NOVEMBER 2016
“This was expected to be the most watched debate ever. The ratings were expected to rank up with the finale of Cheers, and the finale of M.A.S.H. Makes sense, in a way this election feels like the series finale of America.” –Jimmy Kimmel, US talk show host.
The underlying economic themes in this presidential race – weak real wage growth, high levels of government debt, rising inequality, and an aging population – are not problems that were created by any single US president. Nor will they be solved by the next. So we should moderate our expectations for the impact – positive or negative – that Donald Trump or Hillary Clinton might have on the story of our age.
The divisive US election campaign highlights different visions for how the US should address its economic problems, and we can expect the debates to continue long after 8 November. Furthermore, divergent economic choices are being debated by nations all around the world. As we are learning from Brexit and other political events, differing visions of how to organize societies may impact investors who are too concentrated in one currency or asset class. Faced with this challenge in the years ahead, I believe global diversification is an investor’s best defense against any single nation’s social and political decisions.
In our tactical asset allocation, we have opened an overweight position in US infla-tion-linked bonds against conventional government debt. The market is underpri-cing the risk of higher inflation, in our view. Tightening job markets should support wages and prices, and this month Federal Reserve Chair Janet Yellen indicated a tolerance for above-target inflation to improve labor participation. We are also over-weight US equities versus government bonds, and emerging market equities versus Swiss stocks. In addition we favor a basket of emerging market currencies versus a group of developed market peers.
Mark HaefeleGlobal Chief Investment Officer
Wealth Management
FEATURE
The debate that wasn’t
US election A divisive US presidential race has not always done justice to the policy choices the nation faces. In this letter, I imagine what a more rigorous TV debate might have sounded like.
Diversification More polarized policy debates around the world have underlined the importance of a diversified investment approach, to limit exposure to the political and social choices of any single nation.
Inflation We are introducing an overweight position in US Treasury Inflation Protected Securities versus standard government bonds. Mar-kets are underestimating the outlook for inflation in the US.
Asset allocation We are overweight US equities versus government bonds. We are also overweight emerging market equities versus Swiss equities.
Follow me on LinkedInlinkedin.com/in/markhaefele

NOVEMBER 2016 UBS HOUSE VIEW 3
FEATURE
Fig. 1: The US has recovered from the financial crisis…hasn’t it?
Source: US Federal Reserve Bank of St Louis, UBS. Data as of end second quarter 2016.
US real gross domestic product (GDP), trillions of chained 2009 USD, seasonally adjusted annual rate.
1996 2006
US real gross domestic product (trillions of USD)
Pre-crisis peak (Q3 2007)
2016
10
12
16
14
18
Fig. 2: For half of US workers, security of well-paid jobs is a critical election issue.
Source: US Census Bureau, UBS. Data as of 18 October 2016.
Personal incomes for US workers aged 15 and above, cumulative distribution by labor earnings in 2015, in %.
USD0
USD13,750
USD28,750
USD43,750
USD58,750
USD73,750
USD88,750
% of US workers aged 15+ at or below income thresholds
US individual personal income in 2015
Median 2015 personal income: USD 30,240
0
20
60
80
40
100
What could have beenIn this presidential campaign, it has not been easy to look beyond the rhetoric. But as stewards of wealth, the CIO has a responsibility to identify the key issues affecting the world economy, the policy choices these issues create, and the potential impact and likelihood of subsequent political decisions.
In this vein, I wondered what a debate focused on the issues might look like, strip-ped of the “drama.” What follows is a light take on how we imagine the two candi-dates would have answered debate questions on a range of topics.
Moderator: Mr. Trump, the US economy is now 10% larger in real terms than it was before the financial crisis (Fig. 1), and a net 5.7 million jobs have been created. Why do we need to change course?
Donald Trump: These economic figures only tell part of the story. Ordinary working Americans have not been feeling this apparent prosperity. The economy has grown and jobs have been added, but the median wage is still just USD 30,240, and real wage growth for the average worker has been just 3% since 2009, according to the US Census Bureau and the Bureau of Labor Statistics. The reason I’m here rather than a more traditional Republican candidate is because I realized that this election could be decided by the half of the people in this country who have seen almost no real wage growth in the past decade, and earn below that median1 (Fig. 2).
My rich friends around the world might not want to face it, but the fate of this elec-tion will be determined by people far less wealthy than they imagine. And this issue extends beyond the US. Almost every developed nation faces a version of the same problem2.
I believe that globalization is costing us. Unfair global competition is the key contrib-uting factor to stagnant wages, and I want to level the playing field. Maybe if every
1 U.S. Census Bureau, Current Population Survey, 2016 Annual Social and Economic Supplement.2 Edward Luce, “The Life and Death of Trumpian America,” Financial Times, October 9, 2016, https://
www.ft.com/content/96ff6958-8d7d-11e6-8df8-d3778b55a923
4 UBS HOUSE VIEW NOVEMBER 2016
FEATURE
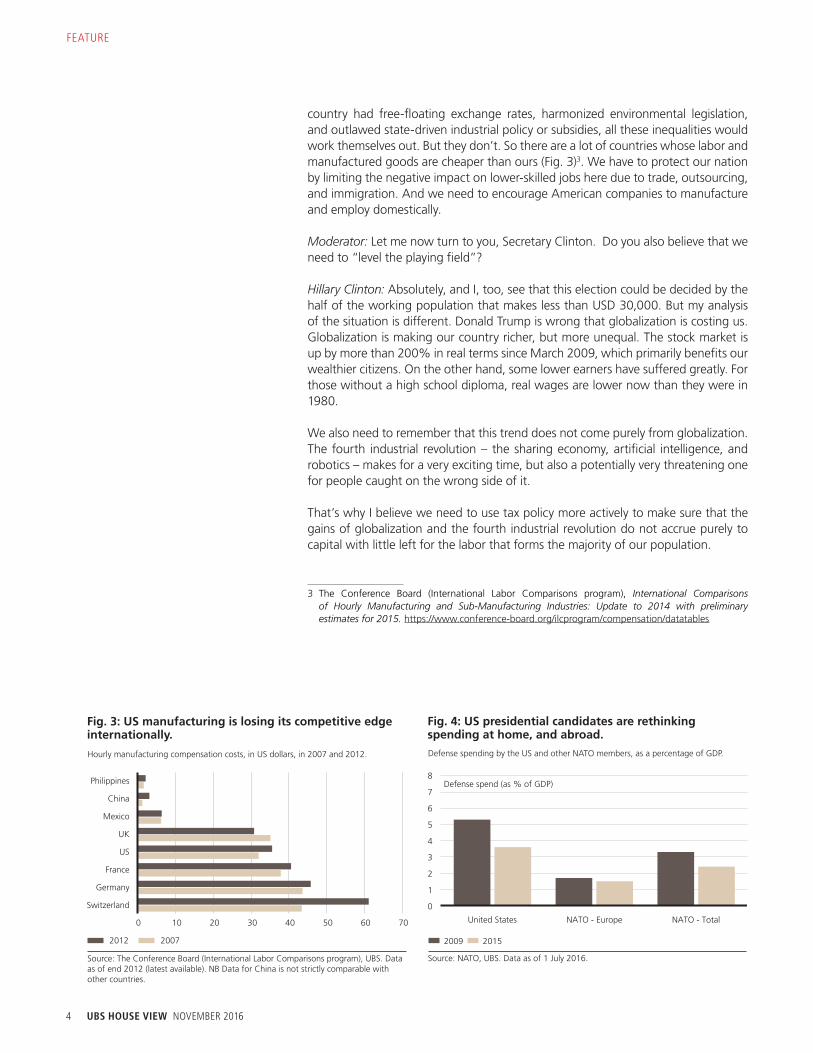
country had free-floating exchange rates, harmonized environmental legislation, and outlawed state-driven industrial policy or subsidies, all these inequalities would work themselves out. But they don’t. So there are a lot of countries whose labor and manufactured goods are cheaper than ours (Fig. 3)3. We have to protect our nation by limiting the negative impact on lower-skilled jobs here due to trade, outsourcing, and immigration. And we need to encourage American companies to manufacture and employ domestically.
Moderator: Let me now turn to you, Secretary Clinton. Do you also believe that we need to “level the playing field”?
Hillary Clinton: Absolutely, and I, too, see that this election could be decided by the half of the working population that makes less than USD 30,000. But my analysis of the situation is different. Donald Trump is wrong that globalization is costing us. Globalization is making our country richer, but more unequal. The stock market is up by more than 200% in real terms since March 2009, which primarily benefits our wealthier citizens. On the other hand, some lower earners have suffered greatly. For those without a high school diploma, real wages are lower now than they were in 1980.
We also need to remember that this trend does not come purely from globalization. The fourth industrial revolution – the sharing economy, artificial intelligence, and robotics – makes for a very exciting time, but also a potentially very threatening one for people caught on the wrong side of it.
That’s why I believe we need to use tax policy more actively to make sure that the gains of globalization and the fourth industrial revolution do not accrue purely to capital with little left for the labor that forms the majority of our population.
3 The Conference Board (International Labor Comparisons program), International Comparisons of Hourly Manufacturing and Sub-Manufacturing Industries: Update to 2014 with preliminary estimates for 2015. https://www.conference-board.org/ilcprogram/compensation/datatables
Fig. 3: US manufacturing is losing its competitive edge internationally.
Source: The Conference Board (International Labor Comparisons program), UBS. Data as of end 2012 (latest available). NB Data for China is not strictly comparable with other countries.
Hourly manufacturing compensation costs, in US dollars, in 2007 and 2012.
Philippines
China
Mexico
UK
US
France
Germany
Switzerland
2012 2007
0 10 20 30 40 50 60 70
Fig. 4: US presidential candidates are rethinking spending at home, and abroad.
Source: NATO, UBS. Data as of 1 July 2016.
Defense spending by the US and other NATO members, as a percentage of GDP.
Defense spend (as % of GDP)
United States NATO - Europe NATO - Total
0
1
2
3
4
5
6
7
8
2009 2015

NOVEMBER 2016 UBS HOUSE VIEW 5
FEATURE
Trump: I’m not surprised she is the favored candidate outside the US – her policy is to tax Americans, while I want to make our allies and trading partners pay more. Taxing companies can help in the short term, but a free world means they can in-creasingly choose to leave the US and locate anywhere. And there are simply not enough rich Americans to bear a greater tax burden – the top 2.7% of earners already pay 51.6% of individual income taxes4. So in the end most of her spending proposals would be paid for by the middle class.
We can also look at some of the things we offer the rest of the world “for free.” We spend 3.5% of GDP on defense, whereas our NATO allies pay an average of 2.4% (Fig. 4). And Europe still has countries where workers can retire before Americans can. We have to fix these structural imbalances to make every tax dollar count.
Moderator: Now what about the domestic economy? One clear area of difference between your visions of the future is in your attitudes toward the Federal Reserve.
Trump: After so many years of an almost free-money policy that has failed to ma-terially improve conditions for most Americans, we don’t know how the Fed will deal with future recessions – start buying equities as the Bank of Japan has done, in effect nationalizing the stock market? And the Fed’s forecasting has been terrible, continually marking down its forecasts toward the market price (Fig. 5). So what makes us think that it has the right policy now?
We’re supposed to have an independent central bank to help protect us from gov-ernments that want to give away free money to win elections. Well that’s exactly what the Fed, European Central Bank, and Bank of Japan are doing. I don’t think we should end up like Japan; the government can spend whatever it wants, and the central bank will hold 10-year interest rates at 0%. It’s all about letting the govern-ment increase the national debt.
Clinton: It’s true that the Fed’s forecasts haven’t been great. But at least they listen
4 http://www.pewresearch.org/fact-tank/2016/04/13/high-income-americans-pay-most-income-taxes-but-enough-to-be-fair/
The fiscal plans proposed by both candidates, if imple-mented, would increase budget deficits, according to independ-ent studies.
Fig. 5: Fed rate forecasts have consistently fallen.
Source: Bloomberg Finance L.P., Federal Reserve, UBS. Data as of 17 October 2016.
Fed funds futures and dots from FOMC Summary of Economic Projections, in %.
0.0
0.5
1.0
1.5
2.0
2.5
3.0
3.5
Dec-15 Dec-16 Dec-17 Dec-18 Dec-19
Fed Funds rate (%)
December 2015 FOMC median dot March 2016 FOMC median dot
June 2016 FOMC median dot Fed Funds futures
September 2016 FOMC median
Fig. 6: Both candidates are expected to increase US debt and deficit levels.
Source: Committee for a Responsible Federal Budget, UBS. Data as of 22 September 2016. All figures rounded to the nearest USD 50 billion.
Announced fiscal policies of both US Presidential candidates and expected impact, in billions of USD.
Hillary Clinton Donald Trump
1500 1650 50
–200 –1200
700
–5300
–8000
–6000
–4000
–2000
0
2000
4000
Fiscal revenue Primary spending Interest Surplus (positivenumber)/ deficit
(negative number)
–5800

6 UBS HOUSE VIEW NOVEMBER 2016
FEATURE
to the market and to economic data. What if the market is right, and a Fed move to raise rates causes slower economic growth or recession? Then neither of us could run the policies we want. If we don’t work with the Fed, you can’t cut taxes, I can’t spend on social policy, and neither of us can spend on infrastructure. Both of our economic plans are, according to independent sources, likely to increase budget deficits in the short and medium term (Fig. 6)5. The “side effect” of the Fed’s poli-cies – a soaring stock market and a “fix” for rich people with capital to invest – may not be optimal. But it may be something we can live with if we redistribute more of the wealth.
Moderator: Thank you, both. Unfortunately, we’re out of time. This debate shows there are important economic, societal, and financial consequences to the way we, and other nations, adapt to a lower-growth “new normal.”6, 7 I’m glad we were able to discuss these important issues objectively, clearly, and openly. In one of the world’s most closely watched unpopularity contests (Fig. 7), may the least bad can-didate win.8
Tactical asset allocation Over our tactical six-month horizon, we believe a moderate risk-on positioning is warranted. Leading indicators are improving, US job creation is strong, averaging 200,000 per month, and US consumption spending is still solid.
We have opened an overweight position in US Treasury Inflation Protected Securi-ties (TIPS) versus standard government bonds. Fed officials seem willing to accept a period of above-target inflation to ensure that economic growth and job market momentum is maintained. This was underlined in Yellen’s comments on 14 October that the Fed was considering “temporarily running a ‘high-pressure economy.’”
5 Committee for a Responsible Federal Budget, Promises and price tags: A Preliminary Update, 22 Sep-tember 2016. http://crfb.org/papers/promises-and-price-tags-preliminary-update
6 Governor Lael Brainard, “The ‘New Normal’ and What It Means for Monetary Policy.” Speech at the Chicago Council on Global Affairs, September 12, 2016. https://www.federalreserve.gov/|newsevents/speech/brainard20160912a.htm
7 Marc Levinson, “Why the Economy Doesn’t Roar Anymore,” Wall Street Journal, October 14, 2016, http://www.wsj.com/articles/why-the-economy-doesnt-roar-anymore-1476458742
8 Huffpost Pollster, average of 10 last polls, as of October 18, 2016. http://elections.huffingtonpost.com/pollster/
We are introducing an overweight in US Treasury Inflation Protected Securities versus government bonds.
Fig. 7: The race for the White House still an unpopularity contest.
Source: Huffpost Pollster, UBS. Data as of 18 October 2016.
Net favorability scores for Hillary Clinton and Donald Trump, ten poll moving average.
Feb 16 Mar 16 Apr 16 May 16 Jun 16 Jul 16 Aug 16 Sep 16 Oct 16
Net favorability rating
–35
–30
–25
–15
–10
–5
–20
0
Trump Clinton

NOVEMBER 2016 UBS HOUSE VIEW 7
FEATURE
The market is currently pricing medium-term inflation at around 1.4% to 1.6%. The Fed’s inflation target of 2% is referenced to the personal consumption expenditures (PCE) index, while TIPS are linked to the consumer price index for all urban consum-ers (CPI-U), which typically runs 0.3 of a percentage point higher. As long as PCE inflation runs above 1.25% or so, TIPS should outperform nominal bonds. Given the steady economic backdrop and the Fed’s attitude, we believe this is likely.
We are overweight US equities versus government bonds. The third-quarter earn-ings season is now under way, and we expect S&P 500 earnings per share to rise year on year for the first time since the second quarter of 2015, thanks to more favorable US dollar and oil base effects. This should mark the start of an earnings recovery.
We are also overweight emerging market equities versus Swiss equities. Economic and earnings indicators in emerging markets improved over the past month. Easy global financial conditions and stronger demand should underpin an ongoing re-covery in emerging market earnings. Swiss equities are tilted toward less growth-sensitive sectors, and may underperform as global economic momentum improves.
In currencies, we favor a basket of emerging market currencies (the Brazilian real, Indian rupee, Russian ruble, and South African rand) against a basket of developed market currencies (the Australian dollar, Canadian dollar, and Swedish krona) given the attractive relative carry of emerging market currencies in a low-interest-rate world. The emerging market leg of this trade is roughly flat since we initiated the position. Diversification has helped offset a politically driven fall in the rand. Among the developed market currencies there has been a fall in the krona, due to lower inflation and declining industrial production in Sweden.
Mark HaefeleGlobal Chief Investment OfficerWealth Management
We are overweight US equities versus government bonds. We expect the third-quarter earnings season to register the first year on year earnings per share increase since mid-2015.
UBS Investor Forum InsightsAt this monthly gathering, we invite thought leaders to debate the key topics affecting financial markets, and to challenge the UBS House View.
• The US presidential election was a key focus topic this month. A victory for Donald Trump was seen as unlikely. Should this occur, however, most participants felt markets would experience heightened volatility.
• A victory for Hillary Clinton was considered the base case by all participants. Should the Democrats also win the House of Representatives and the Senate, the potential for more significant policy shifts would increase.
Follow Mark Haefele on Linkedin and Twitter
linkedin.com/in/markhaefele
twitter.com/UBS_CIO

8 UBS HOUSE VIEW NOVEMBER 2016
IN CONTEXT
Jeremy Zirin, CFAHead of CIO Investment StrategyWealth Management US
The distance between facts and state-ments from politicians has grown so uncomfortably wide that fact-check-
ing websites have become a growth indus-try. But I promise that this comment and the reference to our second president in the above quote will be the only mention of politics or the current US presidential election in this article. (Hopefully, some of you will find that as refreshing to read as I did to write.)
Amid this backdrop, investors need to re-main focused on the facts, current market fundamentals and their portfolio implica-tions. At the end of the day, whether talk-ing about politics or financial markets, the facts matter.
For the remainder of this article, we high-light two facts and how they currently in-fluence our market views and asset alloca-tion positioning. I’m highly confident that neither of these facts will be labeled as “pants on fire” by Politifact or another fact-checking site.
Fact #1: Inflation is low, but rising.Over the past several years in the post-GFC (Great Financial Crisis) era, inflation has re-mained stubbornly low, sparking fears of outright deflation. Despite the fact that central banks cut interest rates to zero (and in some cases, outside of the US, into neg-ative territory) and have aggressively bought longer-duration bonds, inflation in developed markets has remained well be-low policymaker targets. Deflationary forces, such as household sector deleverag-ing, high labor market slack, collapsing oil prices, and slowing Chinese industrial
Fact-checking our assumptions
activity, have been the driving forces spark-ing deflationary concerns.
But the data show that leading indicators, as well as actual readings of domestic in-flation are rising. Headline CPI rose by 1.5% in September, its highest reading in 22 months. To be sure, the base effects from slumping oil prices in late 2015 are lifting year-over-year comparisons. But the increase in inflation appears to be genuine and corroborated by other inflation mea-sures that exclude energy prices. The Fed-eral Reserve’s preferred inflation gauge, the change in the US personal consump-tion expenditure core price index is at 1.7% – its highest level since late 2014 – and has moved close to the Fed’s 2% tar-get over the course of 2016.
Going forward, deflationary forces appear to be abating. US labor markets have tightened, as evidenced by the drop in the unemployment rate from 10.1% in Octo-ber 2009 to 5.0% today. Wage growth is finally starting to rise as well. Monthly readings of US average hourly earnings have increased by at least 2.3% in each of the last 12 months after failing to surpass that level since the financial crisis. The combination of reduced labor market slack, rebounding commodity prices, and increasing evidence of a “soft landing” in China gives us confidence that inflation should cyclically rise over the next several months.
Fact #2: Dollar appreciation recently has already been “yuge.”Kidding aside, the trade-weighted dollar major currency index has appreciated by
Facts are stubborn things; and whatever may be our wishes, our inclinations, or the dictates of our passions, they cannot alter the state of facts and evidence.– John Adams, 1770

NOVEMBER 2016 UBS HOUSE VIEW 9
IN CONTEXT
over 30% since mid-2011, making the current dollar bull run the third strongest in the past 50 years. With the US current account deficit once again widening, the ECB more actively discussing its exit strategy from its asset purchase pro-gram, and the US dollar already trading well above our (and the OECD’s) esti-mate of fair value versus most curren-cies, our currency strategy team now be-lieves that the dollar bull market is over.
Among the major currency pairs, we now expect: • the euro to appreciate from 1.09 to
1.14 in six months, and to 1.20 in 12 months (versus fair value of 1.25)
• the pound sterling to appreciate from 1.23 to 1.28 in six months, and to 1.36 in 12 months (versus fair value of 1.58)
• the yen to appreciate from 103 to 102 in six months, and to 98 in 12 months (versus fair value of 78)
Investment implicationsWe look for headline CPI inflation in the US to continue to rise over the next sev-eral quarters. Markets are skeptical of
this development; market-derived inter-mediate-term inflation breakeven levels remain well below 2.0%. As Mark Hae-fele discussed in his monthly letter, we have opened a position in US Treasury Inflation Protected Securities (TIPS) to take advantage of this mispricing.
A related portfolio shift is our upgrade of the US financial sector to a moderate overweight stance (from neutral) in our US sector strategy. Low inflation and near-zero short-term interest rates have been significant headwinds for the fi-nancial sector’s earnings power since higher-yielding assets mature and are replaced with lower-yielding assets. Since 2010, there has been an 80% cor-relation between the relative perfor-mance of financials versus the S&P 500 and the US 10-year government bond yield. With inflation rising, we look for the Fed to raise short-term interest rates by 25 basis points in its December FOMC meeting and twice in 2017. This should drive stronger earnings for US fi-nancials, particularly relative to subdued expectations with the sector trading at a price-earnings ratio (P/E) of just 12.2 times forward earnings.
To offset our financial sector over-weight, we downgrade the industrial sector to a moderate underweight as global industrial end-markets remain soft, earnings growth is weak, and valu-ations appear full.
Finally, a weaker outlook for the dollar increases the appeal of non-dollar assets for US investors. As such, we close our underweight on non-US developed mar-ket bonds.
Source: Bloomberg, UBS, as of 19 October 2016
3
0
201620152014201320122011201020092008
2
1
Fig. 1: Accelerating wage inflation to prompt Fed hikes…
Average hourly earnings, 12m moving average, in %
4
2017
Note: Momentum defined as positive less negative revisions to forward one-year consensus estimates as a percent of total revisions, last 3 monthsSource: Bloomberg, UBS, as of 19 October 2016
10
–60
20152013201120092007
0
–10
–20
–30
–40
–50
Fig. 2: … and Fed rate hikes to li Financials earnings
S&P 500 financials sector earnings momentum, in %
20
2017
Video feature Jeremy Zirin discusses this article. Click to play.

Preferred investment views Recent upgrades
Recent downgrades
As of 20 October 2016
Most preferred
Equities• US• Emerging markets • North American energy independence• Transformation technologies• e-Commerce• Golden years for Baby Boomers
Bonds• US investment grade • US TIPS 1–10 years • US senior loans • Avoid Counties at risk
Currencies
Cash
Least preferred
Equities• Switzerland
• US rth American energy independerIndia• REITs• e-Commerce
• US government bonds •
•
• US mid-c
10 UBS HOUSE VIEW NOVEMBER 2016

NOVEMBER 2016 UBS HOUSE VIEW 11
EconomyWe expect the global economic recovery to continue at a gradual but relatively solid pace. With the US labor market continuing to tighten, credit spreads signifi-cantly lower than a year ago, and financial markets relatively stable, we expect the Fed to continue its gradual tightening before year-end. This is in our view ap-propriately priced in financial markets. Additionally, US earnings are expected to start growing soon, and we maintain tactical overweight positions in US equities and US investment grade bonds against government bonds. We furthermore pre-fer emerging market (EM) equities over Swiss stocks and a basket of EM curren-cies over developed market (DM) currencies. We are opening an overweight in US Treasury Inflation-Protected Securities (TIPS) against government bonds.
EquitiesOur overweight in US equities remains supported by solid US data. In particular, US private consumption is holding up well, while leading business indicators recov-ered significantly over the past month. In addition to our overweight in US equi-ties, we hold an overweight in EM against Swiss stocks. Earnings of EM companies have turned positive over the past six months, while economic data in the region has stabilized. Meanwhile, Swiss equities are likely to underperform due to their defensive sector mix and the ongoing drag of negative interest rates on financials’ earnings.
Fixed incomeGovernment bonds remain a key diversifier of our global portfolios, but tactically we find better opportunities in US investment grade bonds, providing a yield of 2.4%. We furthermore recommend shifting some government bond exposure into US Treasury Inflation-Protected Securities (TIPS) as we think inflation is un-derpriced. Qualified investors, who can tolerate somewhat lower liquidity, should overweight US senior loans, offering an average yield of 6% and floating interest rates.
Foreign exchangeWe favor a basket of EM currencies (BRL, INR, RUB, ZAR) over DM currencies (AUD, CAD, SEK) to harvest the attractive interest rate carry. The cyclical nature of our DM basket helps to reduce the risk of this position to some extent (e.g., com-pared to using the USD).
US economic data was mixed this month. The ISM Non-Manufac-turing PMI jumped to 57.1 in Sep-tember from 51.4 in the previous month, a new record month-over-month increase. Nonfarm payrolls increased by 156,000 month-over-month in September, below the 172,000 consensus. The unem-ployment rate ticked up to 5.0% despite robust job growth as more people joined the labor force.
Deutsche Bank dominated the headlines in Europe early this month following news that the US Department of Justice was seek-ing a USD 14 billion fine over al-legations of mortgage mis-selling. Pressure eased on reports that the bank will negotiate a smaller pen-alty. Sterling tumbled more than 6% in September on speculation that the UK could be heading to-ward a “hard” Brexit, the currency having previously hit a 31-year low earlier in the month.
In Asia, Chinese FX stockpiles hit their lowest point since 2011, down 0.6% to USD 3.17tr, com-ing in below consensus and mark-ing the third consecutive month of contraction. The Caixin China PMI edged up to 50.1 in September from 50 in August, indicating an expansion.
WTI crude rose to a 15-month high on October 19 after a US En-ergy Information Administration (EIA) report showed that US crude inventories decreased by 5.25mn bbl the previous week. Oil fluctu-ated near USD 50/bbl throughout the month amid uncertainty about whether OPEC will be able to im-plement an accord to reduce out-put at its next official meeting on 30 November.
Month in Review
At a Glance

12 UBS HOUSE VIEW NOVEMBER 2016
This month, US senior loans replaces Beyond benchmark: fixed income investing on our Top themes list,
and we increase our exposure to MLPs within the North American energy inde-pendence: reenergized theme.
Upgrading US senior loansThe US credit market has broadly ben-efitted from a continued search for yield since the middle of the first quarter, as global monetary policy remains accom-modative and US macro data points to resilient economic growth despite late-cycle trends, including tightening lending standards. Against this backdrop, we see several reasons to expect demand for US senior loans to remain strong, and deem current valuations as attractive relative to other fixed income assets, in part due to their higher coupon payments.
Most US loans have a LIBOR floor of 98 basis points on average, which is a trend that emerged after the financial crisis. With LIBOR rates under that floor over the past few years, loans have exhibited some fixed duration behavior, and cou-pon cash flows have not reset higher. This is set to change with LIBOR poised to rise above this 0.98% floor (see Fig 1). LIBOR has crept up to 0.88% after the Fed’s first rate hike in December 2015 and due to money market reform rules. We expect the Fed to raise rates this De-cember and look for two more rate hikes
Stephen Freedman, PhD, Head of Thematic and Sustainable Investing Strategy
Laura Kane, CFA, Thematic and Sustainable Investing Strategist
Of MLPs and senior loans
next year. We forecast for LIBOR to rise toward 1.4% over the next six months, which should support loan demand.
The US loan market is primarily owned by retail funds and separately fed by in-stitutional demand through collateralized loan obligations (CLOs). CLO demand has firmed from the levels seen earlier in the year. We believe CLO issuance should re-main steady enough to maintain supply and demand in balance, even as manag-ers consolidate due to new risk retention rules that go into effect next year. Retail flows, the other main source of US loan demand, have also shown modest in-flows recently.
Loans also exhibit lower volatility than high yield bonds and equities, which may be beneficial during potentially disruptive upcoming market events, including Fed tightening and the US presidential elec-tion. For example, loans outperformed during the 2013 taper tantrum with a 1% drawdown versus 5% for high yield bonds. Loans were also identified in our report, “Global risk radar: Event season and US election,” as an asset class that can perform well in either election out-come scenario.
Over the next 12 months, we expect senior loans to deliver total returns of 3-5%, driven mostly by coupon income. Even if interest rates were to remain at
TOP THEMES SPOTLIGHT
Stephen Freedman, PhD, CFAHead of Thematic and
Sustainable Investing Strategy
Laura KaneThematic and Sustainable
Investing Strategist

NOVEMBER 2016 UBS HOUSE VIEW 13
their current low levels for longer, we be-lieve that loan valuations are attractive at current levels versus other fixed income segments. For example, they offer a yield pickup of 4% over investment grade cor-porate bonds with maturities of 1 to 5 years.
Overall, we think that senior loans are an attractive addition to a diversified tax-able fixed income portfolio, providing for strong risk-adjusted returns, an appealing yield, and diversification benefits. Due to the speculative-grade nature of the issu-ers that borrow in the loan market, we recommend that senior loans only be considered by investors with an adequate risk profile, and some tolerance for illi-quidity, as secondary markets can be il-liquid at times.
The US senior loans theme will replace Be-yond benchmark: fixed income investing on our Top themes list. While we still ad-vocate the benefits of diversification and flexibility in fixed income portfolios over the long term, we have greater conviction in senior loans over the next 12 months.
Increasing our exposure to MLPs Turning to our equity themes, we
identified another opportunity to ac-cess higher yields and position portfolios for a changing market landscape. This month, we are increasing our exposure to energy infrastructure – master limited partnerships (MLPs) specifically – within our theme North American energy inde-pendence: reenergized, which highlights investment opportunities stemming from North America’s declining reliance on foreign energy sources (see Fig 2). While the oil price downturn has put significant pressure on US producers over the past couple of years, oil market fundamentals appear to be improving, and commod-ity prices are rising. Over the next 12 to 18 months, these trends should support resumption of growth in all phases of the US oil and gas business, which will necessitate more investment in energy infrastructure.
While the pace of growth in the energy infrastructure subsector will unlikely re-turn to levels of the recent past, infra-structure providers play a vital role in gathering, storing, processing and trans-porting crude, natural gas, and other energy products throughout North America. We target MLPs that have competitive advantages in the basins
Source: S&P LCD, UBS, as of 14 October 2016
60
40
20
0
100
120
Sep-17Sep-16Sep-15Sep-14Sep-13
80
Average LIBOR floor 3m LIBOR (actual)
3m LIBOR (CIO forecast)
Fig 1: 3m LIBOR should soon exceed floor values
In basis points
140
160
they serve. We focus on basins where infrastructure capacity remains tight, and where resumption of drilling ac-tivity will require more infrastructure development.
Our increased exposure to MLPs within this theme is in line with our overall fa-vorable view of the MLP sector. We expect fundamentals to continue to improve, supporting infrastructure in-vestment, and cash flow and distribution growth. This positive outlook underpins our belief that investors seeking attrac-tive current income, a double-digit to-tal return (yield plus growth) prospect, exposure to improving energy indus-try fundamentals, and tax advantages should consider incremental exposure to the MLP sector.
TOP THEMES SPOTLIGHT
Source: UBS, as of 19 October 2016
Fig 2: We are increasing our exposure to energy infrastructure
Subsector allocation within North American Energy Independence stock list
Energy E&P
Energy services
Energy infrastructure
Alternative energy
Industrial
14 UBS HOUSE VIEW NOVEMBER 2016
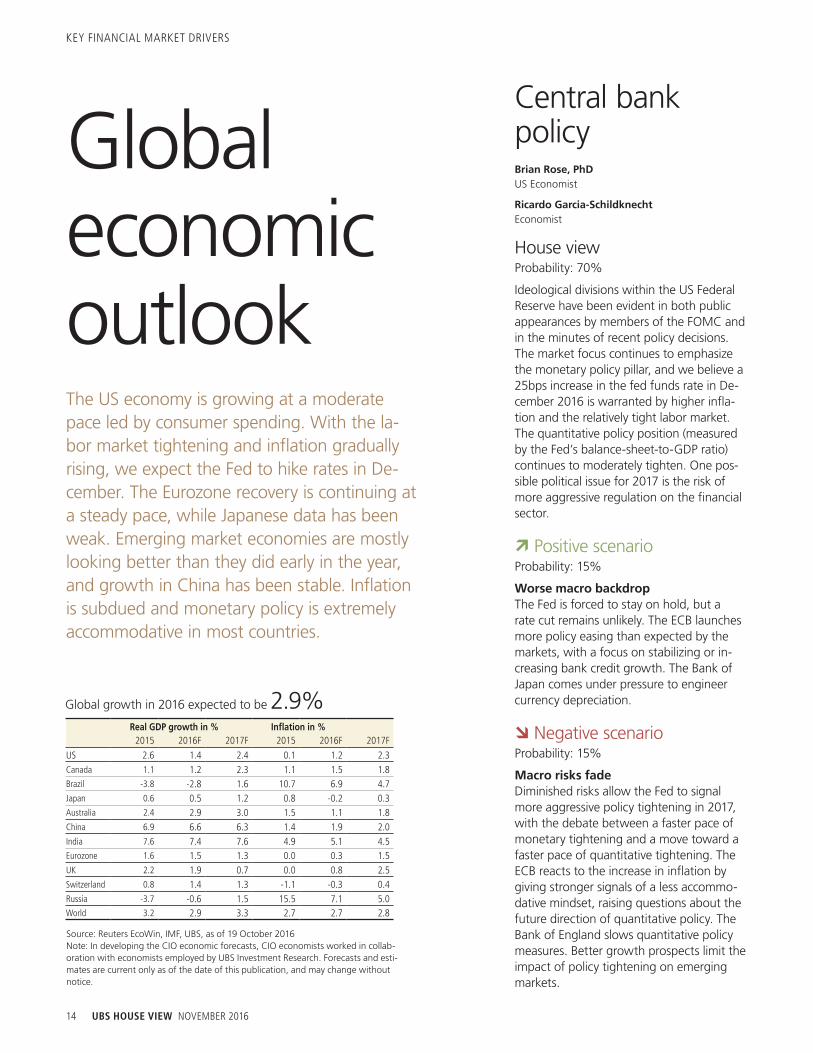
Global economic outlookThe US economy is growing at a moderate pace led by consumer spending. With the la-bor market tightening and inflation gradually rising, we expect the Fed to hike rates in De-cember. The Eurozone recovery is continuing at a steady pace, while Japanese data has been weak. Emerging market economies are mostly looking better than they did early in the year, and growth in China has been stable. Inflation is subdued and monetary policy is extremely accommodative in most countries.
Central bank policyBrian Rose, PhD US Economist
Ricardo Garcia-SchildknechtEconomist
House viewProbability: 70%
Ideological divisions within the US Federal Reserve have been evident in both public appearances by members of the FOMC and in the minutes of recent policy decisions. The market focus continues to emphasize the monetary policy pillar, and we believe a25bps increase in the fed funds rate in De-cember 2016 is warranted by higher infla-tion and the relatively tight labor market. The quantitative policy position (measured by the Fed’s balance-sheet-to-GDP ratio) continues to moderately tighten. One pos-sible political issue for 2017 is the risk of more aggressive regulation on the financial sector.
Positive scenarioProbability: 15%
Worse macro backdropThe Fed is forced to stay on hold, but a rate cut remains unlikely. The ECB launches more policy easing than expected by the markets, with a focus on stabilizing or in-creasing bank credit growth. The Bank of Japan comes under pressure to engineer currency depreciation.
Negative scenarioProbability: 15%
Macro risks fadeDiminished risks allow the Fed to signal more aggressive policy tightening in 2017, with the debate between a faster pace of monetary tightening and a move toward a faster pace of quantitative tightening. The ECB reacts to the increase in inflation by giving stronger signals of a less accommo-dative mindset, raising questions about the future direction of quantitative policy. The Bank of England slows quantitative policy measures. Better growth prospects limit the impact of policy tightening on emerging markets.
KEY FINANCIAL MARKET DRIVERS
Real GDP growth in % Inflation in %2015 2016F 2017F 2015 2016F 2017F
US 2.6 1.4 2.4 0.1 1.2 2.3Canada 1.1 1.2 2.3 1.1 1.5 1.8Brazil -3.8 -2.8 1.6 10.7 6.9 4.7Japan 0.6 0.5 1.2 0.8 -0.2 0.3Australia 2.4 2.9 3.0 1.5 1.1 1.8China 6.9 6.6 6.3 1.4 1.9 2.0India 7.6 7.4 7.6 4.9 5.1 4.5Eurozone 1.6 1.5 1.3 0.0 0.3 1.5UK 2.2 1.9 0.7 0.0 0.8 2.5Switzerland 0.8 1.4 1.3 -1.1 -0.3 0.4Russia -3.7 -0.6 1.5 15.5 7.1 5.0World 3.2 2.9 3.3 2.7 2.7 2.8
Source: Reuters EcoWin, IMF, UBS, as of 19 October 2016Note: In developing the CIO economic forecasts, CIO economists worked in collab-oration with economists employed by UBS Investment Research. Forecasts and esti-mates are current only as of the date of this publication, and may change without notice.
Global growth in 2016 expected to be 2.9%

NOVEMBER 2016 UBS HOUSE VIEW 15
28 October 2016GDP for 3Q 2016GDP growth appears to have accel-erated in the third quarter as con-sumer spending has continued to rise at a robust pace, while head-winds from inventories and energy sector investment have abated.
28 October 2016Employment Cost Index for 3Q 2016Average hourly earnings is the most commonly used measure of wage growth, but the Employment Cost Index has the advantage of adjusting for the changing compo-sition of the labor market.
31 October 2016Personal income and spending for SeptemberIn addition to the important data on income and spending, this re-port includes the personal con-sumption expenditures (PCE) price index, the primary inflation mea-sure on which the Fed focuses.
1 November 2016ISM Manufacturing PMI for OctoberThe ISM Manufacturing PMI re-bounded back above 50 in Sep-tember, a reassuring sign that the sector will at least not act as a drag on growth.
2 November 2016FOMC rate decisionComing just six days before the elections, we expect the Fed to re-main on hold. However, the Fed may use the FOMC statement to hint at a December rate hike.
Key dates Crude oil market rebalancingGiovanni Staunovo Analyst
Dominic Schnider Analyst
Wayne Gordon Analyst
House viewProbability: 70%
OPEC surprised us and the market in late September by departing from its volume-maximizing strategy in favor of actively man-aging supply. The deal faces many hurdles, some of which could be fatal, such as a lack of information on how a cut would be split among members. Even if an agreement is reached, we don’t expect the deal to be im-plemented before 1Q17. Until then, we ex-pect OPEC supply to stay high. Meanwhile, non-OPEC supply is expected to rise from 3Q16 to 4Q16. We expect improved supply availability to result in an inventory build in 4Q16. Therefore we remain cautious on oil prices in the short term.
Positive scenarioProbability: 10–20%
Sharper-than-expected contractionPrices could rise quicker than expected due to destabilizing geopolitical events in oil-exporting regions like Venezuela, Africa, or the Middle East, thus triggering additional outages, a faster contraction in US crude production, and/or a full-endorsed OPEC production cut. On the demand side, a cold winter could stimulate demand growth.
Negative scenarioProbability: 10%
Resilient productionMore resilient non-OPEC production, or fewer OPEC production outages, could keep the market oversupplied. A lasting ceasefire in Nigeria and Libya could result in a return of 1mbpd or more of disrupted supply. Cost reductions and ongoing efficiency gains could lead to more resilient US tight oil pro-duction, while the latest oil price increase could moderate US production declines and/or stimulate supply growth early next year. On the demand side, a broader economic crisis in Asia (particularly in China) could slow incremental demand for oil and keep the market in surplus.
US earnings growth to resumeJeremy Zirin, CFAHead, Investment Strategy, WMA
David Lefkowitz, CFASenior Equity Strategist
House viewProbability: 60%
Earnings growth is improving as the huge drags from poor energy sector re-sults and the strong dollar begin to dis-sipate. Earnings fell 6% in 1Q, but only 2% in 2Q. We look for growth to turn positive after more than a year of flat-to-down earnings. We are currently expect-ing an increase of 3% in 3Q.
Positive scenarioProbability: 20%
Business confidence accelerates
Higher interest rates and rising com-modity prices, driven by improving global growth prospects, could produce stronger-than-anticipated S&P 500 EPS growth as energy and financials experi-ence meaningful gains. Increased confi-dence in the global economic expansion could spur greater capital investment, improving the outlook for industrials. Regardless of the November presidential election outcome, tax reform momen-tum is expected to build. Lower taxation on repatriated foreign earnings could boost S&P 500 EPS via higher share buybacks.
Negative scenarioProbability: 20%
Growth slump or stagnation
A downturn in US and global growth could lead to weaker-than-projected rev-enues for S&P 500 companies. Wage pressures, unaccompanied by improving consumer and business demand, could pressure profit margins and earnings growth rates. Persistently low short-term interest rates and continued declines in long-term interest rates could pressure financial sector earnings.
NOVEMBER 2016 UBS HOUSE VIEW 15

16 UBS HOUSE VIEW NOVEMBER 2016
ASSET CLASSES OVERVIEW
Performance has been mixed year-to-date. US equities are near record highs, and emerging markets (EM) have surged, but the stronger yen has restrained the Japanese market, nega-tive interest rates have weighed on Eurozone financials, and the weaker pound has hurt UK returns when measured in dollars. We are overweight US and EM equities, and under-weight Swiss equities. Easier comparisons from oil prices and the dollar should help S&P 500 earnings-per-share (EPS) advance in the quarters ahead.
Equities
Eurozone neutral
We are neutral Eurozone equities. Solid domestic consumer demand and ongoing monetary easing support a continued economic recovery. Leading economic indicators – especially for manufacturing activity – have stabilized in expansionary territory. While currency depreciation supported earnings last year, the euro has appreciated modestly this year. Earnings dynamics remain rather weak compared to other regions. Our most preferred sectors are energy, materials, technology, and utilities.
UK neutral
We are neutral on the UK. We expect a weakening economic backdrop for the UK into next year, which may lead to down-grades in the earnings of cyclical and domestic areas, includ-ing financials. However, the bigger near-term drive has and will continue to be international companies, which are seeing upgrades to earnings based on the benefits from the weaker pound. We believe the FTSE 100 has a 10% currency boost to earnings from the pound’s decline. Earnings are likely to be slightly negative this year, but we expect them to return to a double-digit growth rate next year.
Emerging markets overweight
We are overweight on emerging market equities in our global portfolio. EM economic activity numbers are stabilizing, and manufacturing sentiment is turning more positive from low levels. Corporate earnings growth is improving, especially com-pared with several developed markets. The recent rise in com-modity prices is encouraging, and the global liquidity backdrop remains supportive. Also, EM equities are trading at a discount to their developed market counterparts. We prefer China, Bra-zil, South Korea, and India to the Philippines and Taiwan.
EURO STOXX (index points, current: 330) Six-month target
House view 340
Positive scenario 375
Negative scenario 270
FTSE 100 (index points, current: 7022) Six-month target
House view 7225
Positive scenario 7800
Negative scenario 5750
MSCI EM (index points, current: 913) Six-month target
House view 950
Positive scenario 1075
Negative scenario 725
Japan neutral
We are neutral on Japanese equities. We expect earnings growth of 3% in FY16 (which ends in March 2017) and in the low single digits in FY17. The yen has strengthened by over 15% this year, and USDJPY is currently trading around 104. We believe that the downside risk for the Japanese equity market is somewhat mitigated by the relatively large purchases from domestic investors like the Bank of Japan (BoJ). The BoJ has maintained its easy monetary policy with a new focus on yield curve control. We prefer share-buyback and high-dividend-yield stocks.
TOPIX (index point, current: 1,357) Six-month target
House view 1400
Positive scenario 1500
Negative scenario 1100
Jeremy Zirin, CFA; David Lefkowitz, CFA; Markus Irngartinger, PhD, CFA
Note: Current values as of 19 October 2016

NOVEMBER 2016 UBS HOUSE VIEW 17
US equities – styleWe maintain our neutral view between growth and value stocks. Value has outperformed growth by 4.3% year-to-date (after growth outperformed by 9.5% in 2015), but we do not believe that the stage is set for an extended outperformance cycle for value. Our sector strategy – particularly our overweight allocation to technology, healthcare, and consumer discretion-ary – supports a growth tilt. However our upgrade of financials should benefit the broader value index.
US equities overview overweight
Third quarter S&P 500 earnings-per-share (EPS) should rise by 3%, marking the first quarter of positive growth since mid-2015. With domestic economic activity resilient and the profit headwinds from low oil prices and the strong dollar fading, we expect earnings growth to accelerate in Q4 and for S&P 500 EPS to reach USD 130 in 2017. Valuations are somewhat above long-term averages, but do not appear excessive in a moder-ate growth and low inflation environment. Election uncertainty may spark bouts of market volatility over the next few weeks, but a divided government (our base case) should ultimately be favorable for markets. We maintain our six-month S&P 500 price target of 2,225.
US sectorsSince 30 June 2016, the tech sector has delivered the stron-gest gains. We continue to overweight tech as valuations appear reasonable and earnings growth should be well-sup-ported by solid enterprise technology spending and consumer demand for tech products. This month, we upgrade finan-cials to a moderate overweight. Earnings momentum is im-proving as capital market activity has picked up and interest rates have started to climb. Despite sluggish industrial end-markets, the industrial sector has outperformed in 2016. We downgrade industrials to a moderate underweight, expecting global manufacturing to remain soft.
US equities – sizeWe spread our tactical overweight to US equities equally across size segments. Thus far in 2016, small- and mid-cap stocks have very modestly outperformed large-caps. While a benign credit environment and stronger relative earnings growth should favor smaller sized segments, above-average downside risks also exist for small-caps given their higher leverage.
Source: Bloomberg, UBS, as of 19 October 2016
0.6
0.4
0.2
0.0
1.0
1.2
Dec-17Oct-17Aug-17Jun-17Apr-17Feb-17Dec-16Oct-16
0.8
UBS CIO
Fed funds futures
Fig. 2: Fed fund rate hikes (which could be greater than expected) should boost financial sector earnings
Fed funds: UBS estimates and futures prices, in %
1.4
Source: UBS as of 19 October 2016
40
20
0
Unified governmentDivided government
60
Clinton, Senate: R, House: R
Clinton, Senate: D, House: R
Clinton, Senate: D, House: D
Trump, Senate: R, House: R
Fig. 1: High likelihood of divided government limits policy uncertainty
UBS CIO election outcome probabilities, in %
80
US equitiesWe are overweight US equities. US stocks look poised to benefit from a resumption of cor-porate earnings growth as headwinds from the rout in energy prices and the strong dollar begin to fade and as consumer fundamentals remain healthy. A slow normalization of inter-est rates by the “data-dependent” Fed should not derail the economic expansion or the US bull market. Within sectors, we upgrade financials and downgrade industrials this month.
S&P 500 (index points, current: 2,144) Six-month target
House view 2225
Positive scenario 2450
Negative scenario 1875
Note: Current values as of 19 October 2016

18 UBS HOUSE VIEW NOVEMBER 2016
ASSET CLASSES OVERVIEW
We expect yields to move modestly higher as the US economy grows and as the Fed gradu-ally raises rates. A healthy labor market and steady consumer spending suggest that the economy is in good shape, and inflation should reach the Fed’s target. Risks include market disruptions due to the implementation of Brexit or a slowing Chinese economy. Somewhat higher rates will result in minimal returns to US Treasuries. We are underweight US govern-ment bonds versus US equities and US IG corporate bonds.
Bonds
Government bonds underweight
Interest rate sentiment has shifted since the summer with the 10-year yield reaching 1.82%, the highest level since early June. The recent strength in the economic data, such as ISM and the payroll report, leaves investors reexamining the lower for longer view. Although CIO does not anticipate a large rise in interest rates, with the Fed on track to hike come December, we see a neutral duration view as the prudent strategy.
Emerging market bonds neutral
Stable-to-improving emerging market (EM) economic funda-mentals and accommodative global liquidity should continue to support the asset class. However, relatively tight valuations and lingering EM-specific and macro risks limit the room for further spread tightening, in our view. We believe EM sovereign and corporate credit spreads will trend sideways to slightly tighter in the next six months, and recommend a neutral allocation within globally diversified portfolios. That said, the HY segment should outperform its IG counterpart due to yield carry and positive idiosyncratic developments.
US investment grade corporate bonds overweight
US investment grade corporate bonds outperformed Treasuries over the month as a narrowing of credit spreads partially off-set the rise in US Treasury yields. We maintain a tactical over-weight position. The global search for yield will keep foreign demand elevated as overseas investors take advantage of the scale and liquidity that US IG offers. Among IG sectors, we see better relative value in US IG financials where spreads are wide relative to their lower duration. Along the IG curve, we favor intermediate credit maturities in the 5- to 10-year range.
US 10-YEAR YIELD (Current: 1.7%) Six-month target
House view 1.7%
Positive scenario 1.2–1.5%
Negative scenario 1.9–2.1%
EMBIG div / CEMBI div SPREAD (Current: 337bps / 335bps)
Six-month target
House view 320bps / 320bps
Positive scenario 280bps / 280bps
Negative scenario 500bps / 530bps
US IG SPREAD (Current: 135bps*) Six-month target
House view 150bps
Positive scenario 125bps
Negative scenario 275bps*Data based on BAML IG corporate index
US high yield corporate bonds neutral
We keep a neutral position on US high yield (HY), which has returned a very strong 16% year-to-date and 12% ex-commodities. While price gains are unlikely to be repeated, we look for HY to deliver coupon-driven returns over the next six months. Moody’s trailing 12-month default rate was down to 5.4% in September from 5.7% in August, which was the highest rate since 2010. We expect this rate to de-cline to 3-4% over the next 12 months as defaults outside of the troubled commodities sectors remain relatively low, while commodity sector defaults to gradually decline.
USD HY SPREAD (Current: 466bps*) Six-month target
House view 550bps
Positive scenario 400bps
Negative scenario 1,100bps
Leslie Falconio; Kathleen McNamara, CFA, CFP; Barry McAlinden, CFA; Philipp Schoettler; Frank Sileo
*Data based on BAML High Yield indexes
Note: Current values as of 19 October 2016

NOVEMBER 2016 UBS HOUSE VIEW 19
Preferred securitiesThrough mid-month, preferred valuation had improved some-what, although spreads appear to be rapidly tightening again. As the Fed normalizes rate policy, volatility may occur. This could lead to spread widening. Meanwhile, although they’ve slowed, ETF flows remain positive. A shift toward outflows could exacerbate pressure. We maintain a neutral outlook given the potential for rate and spread volatility, and tight valu-ation. We continue to favor preferreds with call protection and either fixed-to-floating rate coupons and high back-end spreads or high coupon fixed-rates.
Municipal bonds neutral
Following a lengthy period where powerful technical factors pushed muni prices higher, the market is now exhibiting some price weakness. Over the past two months, munis have lost over 1.0%, reducing the sector’s year-to-date total return to 3.1%. We attribute the weaker performance in large part to robust new issuance. Meanwhile, municipal mutual funds con-tinue to attract assets, but at a slower pace. At current levels, tax-exempt paper holds value versus US Treasuries, in our view. Current AAA 10-year muni-to-Treasury yield ratio: 98.9% (last month: 93.0%).
Treasury inflation-protected securities (TIPS)TIPS breakeven inflation rates finally caught up to the market’s belief that inflation will slowly grind higher. The recent rise in oil prices has pushed 5-year and 10-year breakeven inflation rates to their four-month high. CIO has opened an overweight on 1–10 year TIPS against government bonds. We are now more positive on the asset class as we look for inflation to rise into 2017. Current 10-year breakeven inflation rate is 1.69% (1.48% last month).
Non-US developed fixed income neutral
Over the past month, bond yields moved modestly higher in most countries outside of the US, and overall, the dollar gained against other major currencies, hurting the value of non-US as-sets when measured in dollars. As a result, non-US developed fixed income generated negative returns. Non-US bond yields remain at very unattractive levels with many bonds offering negative yields. However, we expect the dollar to weaken over the next 6-12 months, offsetting the yield disadvantage. We therefore recommend a neutral position on the asset class.
Additional US taxable fixed income (TFI) segments
Source: BAML, UBS, as of 18 October 2016
2
1
0
–1
4
Duration
76543210
Senior loans
8
3
US fixed income opportunity set
Yield, in %, and duration, in years
6
5
7
IG 1-5 yearAgencies
TIPS
IG corps
HY corps
Mortgages CMBS
Preferreds
Treasuries
Mortgage-backed securities (MBS)Since the beginning of 2016, we cited that the fair value spread band for MBS is 95bps to 115bps. The current coupon MBS spread versus the underlying Treasury has remained in this band for all of 2016, shielded from declining yields, volatile oil prices, referendums, or politics. We have advised investors to buy MBS at 115bps and sell MBS at a spread of 95bps – a successful strat-egy we deployed last year. Currently, we are holding our neu-tral stance as we head into year-end. Current spread is +96bps to the 5-year and 10-year Treasury blend (versus +100bps last publication).
Agency bondsThe Agency market had held in over the past few weeks as volatility has increased. Year-to-date, Agency debt has re-turned 3.3%, a respectable return for a low-risk asset class. Investors await an increase in volatility to reenter the callable market and to pick up incremental yield. CIO remains over-weight spread product versus the safe haven of Agency debt. The recent rise in interest rates has left the longer end of the Agency market underperforming Treasuries, with the demand remaining in the 1- to 5-year. Current spread is +13bps to the 5-year (versus +18bps last month).
Note: Current values as of 19 October 2016
CIO WMR interest rate forecast
Americas 19-Oct-16 3 mths 6 mths 12 mths
USD 3M Libor 0.9 1.3 1.4 1.6
USD 2Y Treas. 0.8 0.9 1.0 1.1
USD 5Y Treas. 1.2 1.2 1.3 1.5
USD 10Y Treas. 1.7 1.5 1.7 1.9
USD 30Y Treas. 2.5 2.3 2.5 2.7
Source: UBS, as of 19 October 2016

20 UBS HOUSE VIEW NOVEMBER 2016
ASSET CLASSES OVERVIEW
Broad-based commodity indices have failed to perform since May. Our near-term outlook remains cautious: We forecast a mid-single-digit negative return due to a modest spot de-cline and negative roll yield returns over the coming three months. Most of the weakness relates to energy; we expect temporary crude oil and US natural gas price setbacks of about 10-15%. Near-term softness may also come from agriculture due to oversupply and insuf-ficient demand in grains, and in precious metals, as a pending US Federal Reserve rate hike will continue to weigh on the sector in the short run.
Commodities and other asset classes
Commodities neutral
Precious metals Gold prices have benefitted from three fac-tors this year: higher financial market volatility, political un-certainties, and lower US real rates. More recently, the rising probability of a Fed rate hike in December and the reduction of elevated speculative positioning weighed heavily on gold. That said, we still like its insurance qualities and see longer term prices as better supported with US real rates dipping further into negative territory. As a result, we expect gold to trade at USD 1,350/oz in six and 12 months..GOLD (Current USD 1,269/oz) Six-month target
House view USD 1,350/oz
Positive scenario USD 1,450/oz
Negative scenario USD 1,150/oz
Crude oil We remain cautious on oil prices in the short term. OPEC’s production cuts are all talk and no action for now. Sep-tember crude output rose to a record 33.6mbpd, and October production could approach 34mbpd. In the medium to longer term, we remain confident that a combination of contract-ing non-OPEC supply and rising oil demand in emerging mar-kets will result in a balanced oil market next year. This should prompt Brent oil prices of USD 55/bbl or higher in 12 months. Hence, we like to sell downside protection for a premium ver-sus money market rates, with strikes close to USD 40/bbl.
BRENT (Current: USD 52.7/bbl) Six-month target
House view USD 45/bbl
Positive scenario USD 70/bbl
Negative scenario USD 30/bbl
Dominic Schnider, CFA, CAIA; Giovanni Staunovo; Thomas Veraguth; Wayne Gordon
Agriculture Agriculture’s fundamentals remain heavy as benign US weather and a step-up in Brazil soybean planting keeps soybean prices under pressure. Wheat’s spectacular net-short positioning leaves the grain in a precarious position, given the elevated weather risks as we approach the Austra-lian harvest. Heavy rainfall is threatening grain quality along the eastern seaboard; any downgrades would be a bullish sig-nal for prices despite the near-record inventories.
Base metals An expected pickup in economic activity glob-ally sets the stage for tighter market balances across the base metal sector. Base metals that are supply challenged, like zinc,
Other asset classesListed real estate Expected earnings growth remains solid at 4.7% p.a. for 2016-18. A 4.0% dividend yield makes an 8% full-year return possible provided overall bond yields stay low amid weak economic growth. Listed real estate has delivered a 6% annualized return this year. It trades at a 6% discount to net asset value compared to -6.4% historically, which gives some support to valuations. We have judged financing condi-tions for real estate as stable and favorable despite some grad-ual worsening. The contraction of property yields versus bond yield spreads presents the biggest risk at these extremely low bond yields.
FTSE EPRA/ NAREIT Developed TR USD (Current: 4,545) Six-month target
House view USD 4,500
Positive scenario USD 4,800
Negative scenario USD 4,000
Note: Current values as of 19 October 2016
nickel, and lead, should see another 10-15% rise in prices. Supply considerations call for an underperformance of copper and aluminum, but the underlying stories for both metals are improving; any price setbacks in either metal should be short-lived and worth a buy considering next year’s outlook for the almost balanced copper and aluminum markets.

NOVEMBER 2016 UBS HOUSE VIEW 21
USD neutral We continue to expect the Fed to hike interest
rates in December. Thereafter, the market should not expect another rate hike to come too soon, and the USD should start to fall back closer to its fair value. Our working assumption is that Hillary Clinton will win the presidential election. A Donald Trump victory may strengthen the safe-haven function of the USD in the very short term, but is likely to lead to an even faster depreciation than we currently expect.
EUR neutral Sometime in 2017, we expect the European Central
Bank to discuss the exit strategy for its current quantitative easing (QE) program. Right now, with many open questions concerning Brexit, the US election risk, and other risk factors impacting markets, we think it is still too early for the ECB to do so. However, once the ECB announces any plans to taper or to end its QE, we would expect the euro to enter an ap-preciation path. This should be very similar to the US dollar’s appreciation when the Fed tapered its own QE program.
GBP neutral The UK is preparing for exit negotiations with the EU.
The prime minister has announced an intention to trigger Article 50 by March 2017. By then, we would expect more clarity about Brexit’s impact on the British economy. At current levels, the pound is so strongly undervalued that we see some rebound potential against the USD and a stabilization against the euro over the next 12 months.
CHF neutral The CHF is near equilibrium against the USD, but
it is strongly overvalued against other G10 currencies. We see some room for the USD to rise this year, as the Fed is ex-pected to tighten. In the coming year, we expect the USDCHF exchange rate to remain in the 0.95–1.00 range, and both to weaken against the EUR.
Foreign exchangeThomas Flury
The events in the upcoming months will be crucial for the USD. The US elections and the Fed monetary policy decision could expose the greenback to larger swings. We continue to expect the Fed to hike interest rates in December, while money markets are only fully pric-ing in a rate hike for 2Q17. We continue to expect the AUD and NZD to weaken in the near term, as the Australian and New Zealand central banks ease policy to keep their currencies weak against the USD.
UBS CIO FX forecasts
3M 6M 12M PPP*
EURUSD 1.10 1.14 1.20 1.25
USDJPY 104 102 98 78
USDCAD 1.30 1.28 1.25 1.21
AUDUSD 0.72 0.74 0.74 0.70
GBPUSD 1.22 1.28 1.36 1.58
NZDUSD 0.68 0.71 0.71 0.61
USDCHF 0.98 0.98 0.97 1.00
EURCHF 1.08 1.12 1.16 1.25
GBPCHF 1.20 1.26 1.31 1.59
EURJPY 114 116 118 98
EURGBP 0.90 0.89 0.88 0.79
EURSEK 9.50 9.30 9.00 8.99
EURNOK 9.00 8.70 8.70 9.83Source: Thomson Reuters, UBS, as of 19 October 2016Note: Past performance is not an indication of future returns.*PPP = Purchasing Power Parity
JPY neutral The Bank of Japan fixed the yield curve by setting the
target for the 10-year rate close to zero and by keeping the pol-icy rate at negative 10 basis points. In our view, asset purchases are a better tool to influence the exchange rate than steering the yield curve, simply because manipulating the prices of bonds reduces business opportunities. In particular, it does not promote yen carry trades, which normally would weaken the currency.
Other developed market currencies neutral We expect the AUD to weaken when the Fed raises
rates in December and as coal and iron ore prices fall on rising supply. In light of low Australian inflation, Reserve Bank of Aus-tralia (RBA) policy should remain on a dovish tilt. However, the AUD’s attractive carry should keep the AUDUSD around 0.74 over the next 12 months. We have closed the preference for the NOK against the EUR as we believe the risks of Norges Bank pushing back against the NOK’s strength have increased.
ASSET CLASSES OVERVIEW

22 UBS HOUSE VIEW NOVEMBER 2016
IN FOCUS
With less than three weeks to go, this year’s campaign sea-son is finally drawing to a close
amidst widespread voter fatigue. Unfor-tunately, the incendiary rhetoric has esca-lated to a level rarely seen in presidential campaigns, while the quality of the policy debate has deteriorated.
We believe the probability of a victory by Hillary Clinton in the November election has increased markedly in recent weeks. Concerns regarding her health have dis-sipated in the wake of unforced errors by Donald Trump. His vulgar comments re-garding unwelcome sexual contact with women over the years undermined ef-forts to broaden his political base and overshadowed the release of embarrass-ing e-mails from Hillary Clinton to her ad-visors. Barring the release of information that would disqualify Secretary Clinton from a national security perspective, we now believe that she will handily defeat Mr. Trump on 8 November.
No sweepHowever, we do not expect that a Clin-ton victory will presage a Democratic sweep of Congress. Republicans have their largest majority in the House of Representatives since 1929. In order for the Democrats to control the House, they would need to win in almost all of the 30 or so competitive congressional districts. This would be a pretty tall task even with a stronger candidate at the top of the ticket. But with Secretary Clinton’s high unfavorable ratings and her inability to fully energize the coalition of millenni-als and minorities who swept President Obama into office, it’s likely that her “coattails” will be fairly short ones.
But it’s also important to note that there appears to be an impulse to
“split-the-ticket” that is clearly reflected in a recent survey of voter preferences. In one poll, a majority of voters said that they would prefer a Republican Congress as a check on a Clinton Administration. This would presumably serve as a means of limiting any tendency to lurch further left after the election and suggests there will be less of a willingness to simply vote the straight party line on 8 November. So while we do expect the GOP to lose some seats in the House, the party can withstand significant losses before their practical control of the legislative agenda is threatened.
The outlook for the Senate is far less certain. Many races are still too close to call. Regardless of which party ekes out a majority, the upper chamber of Con-gress will be narrowly divided. Taken to-gether, we still believe the prospects for a divided government are exceptionally high. So despite recent speculation that Trump’s missteps could open the door for a Democratic “sweep,” we still see only a 10% probability that Democrats will gain control of both the executive and legis-lative branches following the November election. This view is largely validated by the election betting markets, which show an 83% probability of Republicans hold-ing the House.
The Gender Gap widensWhile both candidates have ardent sup-porters, neither is highly regarded by a majority of the American electorate. Sec-retary Clinton is better positioned than Donald Trump, but as we alluded to ear-lier, recent polling data suggests that most voters still hold negative views of both individuals. According to the RCP average poll results, Clinton’s net favor-ability rating is -10; Trump’s is an extraor-dinary -26.
Shifting probabilities
Mike Ryan, CFAChief Investment Strategist, WMA
Tom McLoughlinCo-head of Fundamental Research, WMA

NOVEMBER 2016 UBS HOUSE VIEW 23
IN FOCUS
Clinton derives an advantage, at least on a relative basis, from a larger base of sup-port among female voters. According to the Pew Research Center, women have voted for Democratic presidential candi-dates at greater rates than men for the past 35 years. While the disparity in vot-ing preferences has varied over time, Pew reports that women are more likely to support the Democratic ticket by an aver-age margin of eight percentage points. And that ‘gender gap’ is poised to widen further in this election, to the detriment of the Republican candidate.
One recent poll, whose results were pub-lished in The Atlantic, showed a 33-point gap among likely female voters. The ab-sence of support for Mr. Trump was par-ticularly stark among women with college degrees. But even among women with-out a post-secondary education, he gar-ners no more support than does Hillary Clinton. The impact on this year’s election is also greater because women vote in
greater numbers than do men. The pro-portion of eligible female voters who ac-tually turned up at the polls has exceeded the rate at which men vote by four per-centage points in the last two presiden-tial elections.
The impact is still limitedDespite market concerns of a Demo-cratic sweep, it remains our view that the two parties will still share power follow-ing the November elections. And as we discussed in recent editions of Election-Watch, that is not necessarily a bad thing for investors. Since there will be only a few policy areas where the two parties can find common ground, the prospects for abrupt policy shifts that would under-mine market stability are also limited.
For more information on how the scenar-ios in the table below could potentially impact asset classes and sectors, go to our click here.
Scenario ProbabilityCurrent Previous
President Senate House US equities US fixed income
1 42.5% 45.0% Clinton D R + ++
2 15.0% 30.0% Trump R R – – – –
3 10.0% 5.0% Clinton D D – – –
4 32.5% 19.0% Clinton R R n n
5 0.0% 1.0% Trump D R – +
6 0.0% 0.0% Trump D D – +
Legend
++ Positive
+ Modest positive
n Neutral
– Modest negative
– – Negative
Summary of the six election outcomes and their impact analyzed in our ElectionWatch series
Note: UBS, as of 21 October 2016. UBS US Office of Public Policy, which is separate from UBS CIO Wealth Management Research, provided both the scenarios and the legislative agenda. A probability of 0% is meant to convey our view that the likelihood of this scenario occurring is negligible.

24 UBS HOUSE VIEW NOVEMBER 2016
e-Commerce: Beyond Amazon As consumers of traditional retail shift their shopping and spending online, opportuni-ties abound for true omnichannel retailers and related companies. We believe that long-term positive drivers of digital growth, including the rapid adoption of mobile devices, will continue to hasten market share shifts online. We recommend taking a look at select opportunities in consumer-focused industries that take an omnichannel approach and that utilize digital marketing strategies to complement their online efforts.
Short Medium Long Decade
Click for full report
e-Commerce: Beyond Amazon
Golden years for Baby BoomersThe Baby Boomers – who represent almost a quarter of the US population – are aging and entering their retirement years. This generation, by its sheer size, has always had an outsized influence on society. As the Boomers enter into their hard-earned retirement and set out to enjoy their golden years, we expect various segments of the economy to benefit disproportionately, particularly in the healthcare, consumer, and financial sectors.
Short Medium Long Decade
Click for full report
Golden years for Baby Boomers
India – A land of many (re)turnsWe believe that Indian equities have the potential to outperform broader emerging mar-kets over the next year. Recent economic data points to a gradual pickup in growth, which should create an environment conducive for a corporate profit revival. Further, valuations look attractive, as markets have priced out any major benefits from reform efforts. We see the potential for a moderate re-rating in recognition of the many cred-ible efforts that the Narendra Modi-led government has already made.
Short Medium
Click for full report
India – A land of many (re)turns
North American energy independence: ReenergizedWe see investment opportunities around North America’s emerging energy inde-pendence. The oil price downturn has been deep and long, but we believe that US producers are competitive on the global stage. We focus on the strongest, best-posi-tioned operators. Oil market fundamentals appear to be improving, which in time, should support resumption of growth in all phases of the US oil and gas business, including energy infrastructure, where capacity is lacking in some regions. Alternative energy suppliers and developers of technologies designed to consume energy more efficiently should also continue to experience growth.
Short Medium Long Decade
Click for full report
North American energy indepen-dence: Reenergized
Transformational technologiesWe believe there are two areas of technological innovation that will be driving forces behind productivity gains during the next decade. The first is the set of business opportu-nities around the explosion of digital data. The second is automation and robotics. Both have the potential to transform the structure of our economy, disrupt existing business models, and create opportunities for those well-positioned to participate. Security under-pins both digital data and industrial automation, and in our view, is the key enabling technology for the next wave of innovation across both information technology and the industrial sector.
Short Medium Long Decade
Click for full report
Transformational technologies
Top themes overviewOur Top themes list represents our currently recommended thematic ideas

NOVEMBER 2016 UBS HOUSE VIEW 25
Counties at riskWe believe that heightened attention to US local government credits is warranted in an era when the growth in fixed costs associated with pensions and employee healthcare benefits often outpaces revenue growth. While we expect credit ratings to be stable for most county governments as long as the economy continues to grad-ually grow, we find the credit risks to be unevenly distributed. We recommend repo-sitioning portfolios to limit exposure to county governments with narrow financial positions whose credit may be deteriorating.
Short Medium Long
A copy of this report can be found on the Online Services Research website under Thematic Research.
NEW US senior loansOur outlook for gradually rising LIBOR rates provides the backdrop for senior loans to perform well in the current environment. Ninety percent of US loans have a LIBOR floor of 98bps, on average. Coupon rates should soon adjust higher as LIBOR increases above that threshold, based on CIO’s forecasts (current level: 88bps, six-month fore-cast of 1.4%). Loans offer a yield of 5.5%, which compares favorably with other fixed income alternatives. Loans also exhibit lower volatility than high yield bonds and equi-ties, which may be beneficial amidst both the upcoming US election and the central bank meetings.
Short Medium
Click for full report
US senior loans
Top themes overview
Drivers behind Top themes
Resources/Environment
Innovation/Technology
Demographics/Society
Int’l trade and investment
Government/Regulation
Cyclical factors Financial industry trends
Theme name
e-Commerce: Beyond Amazon P P P
India – A land of many (re)turns P P P P
North American energy independence: reenergized P P P P P
Transformational technologies P P P
US senior loans
P P
Golden years for Baby Boomers P P P
Counties at risk
P P P
Source: UBS

Overweight
Neutral
Underweight
Key forecastsAs of 19 October 2016
6-month forecast
Asset class TAA1 Change Benchmark Value m/m perf.
in %2 House View Positive
scenarioNegative scenario
EQUITIES
US – S&P 500 2144 -1.0% 2225 2450 1875
Eurozone – Euro Stoxx 330 0.5% 340 375 270
UK – FTSE 100 7022 -0.4% 7225 7800 5750
Japan – Topix 1357 4.4% 1400 1500 1100
Switzerland – SMI 8094 1.2% 8300 9000 7000
Emerging Markets – MSCI EM 913 -0.5% 950 1075 725
BONDS –
US Government bonds 10yr Treasury yield 1.7% -0.4% 1.7% 1.2 - 1.5% 1.9 - 2.1%
US Corporate bonds – BAML IG spread 135 bps -0.6% 150 bps 125 bps 275 bps
US High yield bonds – BAML US HY spread 466 bps 0.0% 550 bps 400 bps 1100 bps
EM Sovereign – EMBI Diversified spread 337 bps -0.6% 320 bps 280 bps 500 bps
EM Corporate – CEMBI Diversified spread 335 bps -1.6% 320 bps 280 bps 530 bps
OTHER ASSET CLASSES
Gold – Spot price 1269 /oz. -0.6% 1350 1450 1150
Brent crude oil – Spot price 52.67 /bbl. -8.0% 45 70 30
Listed real estate – RUGL Index 4545 -1.7% 4500 4800 4000
CURRENCIES Currency pair
USD – NA NA NA NA NA
EUR* EURUSD 1.10 -1.2% 1.14 NA NA
GBP – GBPUSD 1.22 -0.3% 1.28 NA NA
JPY – USDJPY 104 0.1% 102 NA NA
CHF – USDCHF 0.98 1.4% 0.98 NA NA
Source: Bloomberg, UBS1 TAA = Tactical asset allocation, 2 Month over month*See CIO Note: Close Norwegian krone vs. euro position, 4 Octoboer 2016Note: Current values as of 19 October 2016. Norwegian krone vs. euro position closed on 4 October 2016.Past performance is no indication of future performance. Forecasts are not a reliable indicator of future performance.
26 UBS HOUSE VIEW NOVEMBER 2016

NOVEMBER 2016 UBS HOUSE VIEW 27
DETAILED ASSET ALLOCATION
Detailed asset allocation taxable with non-traditional assets
Source: UBS and WMA AAC, 20 October 2016. See appendix for information regarding sources of strategic asset allocations and their suitability, investor risk profiles, and the interpretation of the suggested tactical deviations from the strategic asset allocations.
Investor risk profile
Conservative Moderately conservative
Moderate Moderately ag-gressive
Aggressive
Chan
ge t
his
mon
th
All figures in %
Stra
tegi
c as
set a
lloca
tion
CIO
tact
ical d
evia
tion
Chan
ge th
is m
onth
Curre
nt a
lloca
tion1
Stra
tegi
c as
set a
lloca
tion
CIO
tact
ical d
evia
tion
Chan
ge th
is m
onth
Curre
nt a
lloca
tion1
Stra
tegi
c as
set a
lloca
tion
CIO
tact
ical d
evia
tion
Chan
ge th
is m
onth
Curre
nt a
lloca
tion1
Stra
tegi
c as
set a
lloca
tion
CIO
tact
ical d
evia
tion
Chan
ge th
is m
onth
Curre
nt a
lloca
tion1
Stra
tegi
c as
set a
lloca
tion
CIO
tact
ical d
evia
tion
Chan
ge th
is m
onth
Curre
nt a
lloca
tion1
Cash 0.0 +0.0 0.0 0.0 +0.0 0.0 0.0 +0.0 0.0 0.0 +0.0 0.0 0.0 +0.0 0.0
Fixed Income 69.0 -2.0 67.0 57.0 -2.0 55.0 46.5 -2.0 44.5 41.0 -2.0 39.0 33.0 -2.0 31.0
q US Fixed Income 62.0 -2.0 -2.0 60.0 51.0 -2.0 -2.0 49.0 40.5 -2.0 -2.0 38.5 34.0 -2.0 -2.0 32.0 26.0 -2.0 -2.0 24.0
q US Gov’t 7.0 -4.0 -3.0 3.0 5.5 -5.5 -4.0 0.0 4.0 -4.0 -2.0 0.0 3.5 -3.5 -1.5 0.0 2.0 -2.0 0.0
p US TIPS 1–10 years 0.0 +1.0 +1.0 1.0 0.0 +2.0 +2.0 2.0 0.0 +2.0 +2.0 2.0 0.0 +2.0 +2.0 2.0 0.0 +2.0 +2.0 2.0
q US Municipal 50.0 +0.0 50.0 39.0 +0.0 39.0 30.0 -2.0 -2.0 28.0 24.0 -2.5 -2.0 21.5 17.0 -4.0 -4.0 13.0
US IG Corp 4.0 +1.0 5.0 3.5 +1.5 5.0 3.0 +2.0 5.0 2.5 +2.0 4.5 2.0 +2.0 4.0
US HY Corp 1.0 +0.0 1.0 3.0 +0.0 3.0 3.5 +0.0 3.5 4.0 +0.0 4.0 5.0 +0.0 5.0
p Int’l Fixed Income 7.0 +0.0 +2.0 7.0 6.0 +0.0 +2.0 6.0 6.0 +0.0 +2.0 6.0 7.0 +0.0 +2.0 7.0 7.0 +0.0 +2.0 7.0
p Int’l Developed Markets 6.0 +0.0 +2.0 6.0 4.0 +0.0 +2.0 4.0 3.0 +0.0 +2.0 3.0 3.0 +0.0 +2.0 3.0 2.0 +0.0 +2.0 2.0
Emerging Markets 1.0 +0.0 1.0 2.0 +0.0 2.0 3.0 +0.0 3.0 4.0 +0.0 4.0 5.0 +0.0 5.0
Equity 16.0 +2.0 18.0 27.0 +2.0 29.0 34.5 +2.0 36.5 45.0 +2.0 47.0 55.0 +2.0 57.0
US Equity 9.0 +2.0 11.0 15.0 +2.0 17.0 20.0 +2.0 22.0 26.0 +2.0 28.0 31.0 +2.0 33.0
US Large cap Growth 2.5 +0.5 3.0 4.5 +0.5 5.0 6.0 +0.5 6.5 8.0 +0.5 8.5 9.5 +0.5 10.0
US Large cap Value 2.5 +0.5 3.0 4.5 +0.5 5.0 6.0 +0.5 6.5 8.0 +0.5 8.5 9.5 +0.5 10.0
US Mid cap 3.0 +0.5 3.5 4.0 +0.5 4.5 5.0 +0.5 5.5 7.0 +0.5 7.5 8.0 +0.5 8.5
US Small cap 1.0 +0.5 1.5 2.0 +0.5 2.5 3.0 +0.5 3.5 3.0 +0.5 3.5 4.0 +0.5 4.5
International Equity 7.0 +0.0 7.0 12.0 +0.0 12.0 14.5 +0.0 14.5 19.0 +0.0 19.0 24.0 +0.0 24.0
Int’l Developed Markets 4.0 -0.5 3.5 7.0 -1.0 6.0 8.5 -1.0 7.5 11.0 -1.0 10.0 14.0 -1.0 13.0
Emerging Markets 3.0 +0.5 3.5 5.0 +1.0 6.0 6.0 +1.0 7.0 8.0 +1.0 9.0 10.0 +1.0 11.0
Commodities 4.0 +0.0 4.0 4.0 +0.0 4.0 4.0 +0.0 4.0 5.0 +0.0 5.0 5.0 +0.0 5.0
Non-traditional 11.0 +0.0 11.0 12.0 +0.0 12.0 15.0 +0.0 15.0 9.0 +0.0 9.0 7.0 +0.0 7.0
Hedge Funds 11.0 +0.0 11.0 12.0 +0.0 12.0 10.0 +0.0 10.0 3.0 +0.0 3.0 0.0 +0.0 0.0
Private Equity 0.0 +0.0 0.0 0.0 +0.0 0.0 5.0 +0.0 5.0 6.0 +0.0 6.0 7.0 +0.0 7.0
Private Real Estate 0.0 +0.0 0.0 0.0 +0.0 0.0 0.0 +0.0 0.0 0.0 +0.0 0.0 0.0 +0.0 0.0
“WMR tactical deviation” legend: Overweight Underweight Neutral “Change” legend: p Upgrade q Downgrade *Refers to moderate-risk profile. 1The current allocation column is the sum of the strategic asset allocation and the tactical deviation column.

28 UBS HOUSE VIEW NOVEMBER 2016
DETAILED ASSET ALLOCATION
Detailed asset allocationtaxable without non-traditional assets
Investor risk profile
Conservative Moderately conservative
Moderate Moderately ag-gressive
Aggressive
Chan
ge t
his
mon
th
All figures in %
Stra
tegi
c as
set a
lloca
tion
CIO
tact
ical d
evia
tion
Chan
ge th
is m
onth
Curre
nt a
lloca
tion1
Stra
tegi
c as
set a
lloca
tion
CIO
tact
ical d
evia
tion
Chan
ge th
is m
onth
Curre
nt a
lloca
tion1
Stra
tegi
c as
set a
lloca
tion
CIO
tact
ical d
evia
tion
Chan
ge th
is m
onth
Curre
nt a
lloca
tion1
Stra
tegi
c as
set a
lloca
tion
CIO
tact
ical d
evia
tion
Chan
ge th
is m
onth
Curre
nt a
lloca
tion1
Stra
tegi
c as
set a
lloca
tion
CIO
tact
ical d
evia
tion
Chan
ge th
is m
onth
Curre
nt a
lloca
tion1
Cash 0.0 +0.0 0.0 0.0 +0.0 0.0 0.0 +0.0 0.0 0.0 +0.0 0.0 0.0 +0.0 0.0
Fixed Income 80.0 -2.0 78.0 66.0 -2.0 64.0 54.5 -2.0 52.5 44.0 -2.0 42.0 33.0 -2.0 31.0
q US Fixed Income 72.0 -2.0 -2.0 70.0 58.0 -2.0 -2.5 56.0 47.0 -2.0 -2.0 45.0 36.0 -2.0 -2.0 34.0 26.0 -2.0 -2.0 24.0
q US Gov’t 8.0 -4.0 -3.0 4.0 7.0 -5.5 -4.0 1.5 5.0 -5.0 -3.0 0.0 3.0 -3.0 -1.0 0.0 2.0 -2.0 0.0
p US TIPS 1–10 years 0.0 +1.0 +1.0 1.0 0.0 +1.5 +1.5 1.5 0.0 +2.0 +2.0 2.0 0.0 +2.0 +2.0 2.0 0.0 +2.0 +2.0 2.0
q US Municipal 58.0 +0.0 58.0 45.0 +0.0 45.0 35.0 -1.0 -1.0 34.0 26.0 -3.0 -3.0 23.0 16.0 -4.0 -4.0 12.0
US IG Corp 4.0 +1.0 5.0 3.0 +2.0 5.0 3.0 +2.0 5.0 2.0 +2.0 4.0 1.0 +2.0 3.0
US HY Corp 2.0 +0.0 2.0 3.0 +0.0 3.0 4.0 +0.0 4.0 5.0 +0.0 5.0 7.0 +0.0 7.0
p Int’l Fixed Income 8.0 +0.0 +2.0 8.0 8.0 +0.0 +2.5 8.0 7.5 +0.0 +2.0 7.5 8.0 +0.0 +2.0 8.0 7.0 +0.0 +2.0 7.0
p Int’l Developed Markets 6.0 +0.0 +2.0 6.0 5.0 +0.0 +2.5 5.0 4.0 +0.0 +2.0 4.0 3.0 +0.0 +2.0 3.0 2.0 +0.0 +2.0 2.0
Emerging Markets 2.0 +0.0 2.0 3.0 +0.0 3.0 3.5 +0.0 3.5 5.0 +0.0 5.0 5.0 +0.0 5.0
Equity 16.0 +2.0 18.0 30.0 +2.0 32.0 40.5 +2.0 42.5 51.0 +2.0 53.0 62.0 +2.0 64.0
US Equity 9.0 +2.0 11.0 18.0 +2.0 20.0 23.0 +2.0 25.0 29.0 +2.0 31.0 36.0 +2.0 38.0
US Large cap Growth 3.0 +0.5 3.5 5.0 +0.5 5.5 7.0 +0.5 7.5 9.0 +0.5 9.5 11.0 +0.5 11.5
US Large cap Value 3.0 +0.5 3.5 5.0 +0.5 5.5 7.0 +0.5 7.5 9.0 +0.5 9.5 11.0 +0.5 11.5
US Mid cap 2.0 +0.5 2.5 5.0 +0.5 5.5 6.0 +0.5 6.5 7.0 +0.5 7.5 9.0 +0.5 9.5
US Small cap 1.0 +0.5 1.5 3.0 +0.5 3.5 3.0 +0.5 3.5 4.0 +0.5 4.5 5.0 +0.5 5.5
International Equity 7.0 +0.0 7.0 12.0 +0.0 12.0 17.5 +0.0 17.5 22.0 +0.0 22.0 26.0 +0.0 26.0
Int’l Developed Markets 4.0 -0.5 3.5 7.0 -1.0 6.0 10.0 -1.0 9.0 12.5 -1.0 11.5 15.0 -1.0 14.0
Emerging Markets 3.0 +0.5 3.5 5.0 +1.0 6.0 7.5 +1.0 8.5 9.5 +1.0 10.5 11.0 +1.0 12.0
Commodities 4.0 +0.0 4.0 4.0 +0.0 4.0 5.0 +0.0 5.0 5.0 +0.0 5.0 5.0 +0.0 5.0
“WMR tactical deviation” legend: Overweight Underweight Neutral “Change” legend: p Upgrade q Downgrade *Refers to moderate-risk profile. 1The current allocation column is the sum of the strategic asset allocation and the tactical deviation column.
Source: UBS and WMA AAC, 20 October 2016. See appendix for information regarding sources of strategic asset allocations and their suitability, investor risk profiles, and the interpretation of the sug-gested tactical deviations from the strategic asset allocations.

NOVEMBER 2016 UBS HOUSE VIEW 29
DETAILED ASSET ALLOCATION
Investor risk profile
Conservative Moderately conservative
Moderate Moderately ag-gressive
Aggressive
Chan
ge t
his
mon
th
All figures in %
Stra
tegi
c as
set a
lloca
tion
CIO
tact
ical d
evia
tion
Chan
ge th
is m
onth
Curre
nt a
lloca
tion1
Stra
tegi
c as
set a
lloca
tion
CIO
tact
ical d
evia
tion
Chan
ge th
is m
onth
Curre
nt a
lloca
tion1
Stra
tegi
c as
set a
lloca
tion
CIO
tact
ical d
evia
tion
Chan
ge th
is m
onth
Curre
nt a
lloca
tion1
Stra
tegi
c as
set a
lloca
tion
CIO
tact
ical d
evia
tion
Chan
ge th
is m
onth
Curre
nt a
lloca
tion1
Stra
tegi
c as
set a
lloca
tion
CIO
tact
ical d
evia
tion
Chan
ge th
is m
onth
Curre
nt a
lloca
tion1
Cash 0.0 +0.0 0.0 0.0 +0.0 0.0 0.0 +0.0 0.0 0.0 +0.0 0.0 0.0 +0.0 0.0
Fixed Income 80.0 -2.0 78.0 66.0 -2.0 64.0 54.5 -2.0 52.5 44.0 -2.0 42.0 33.0 -2.0 31.0
q US Fixed Income 72.0 -2.0 -2.0 70.0 58.0 -2.0 -2.5 56.0 47.0 -2.0 -2.0 45.0 36.0 -2.0 -2.0 34.0 26.0 -2.0 -2.0 24.0
q US Gov’t 8.0 -4.0 -3.0 4.0 7.0 -5.5 -4.0 1.5 5.0 -5.0 -3.0 0.0 3.0 -3.0 -1.0 0.0 2.0 -2.0 0.0
p US TIPS 1–10 years 0.0 +1.0 +1.0 1.0 0.0 +1.5 +1.5 1.5 0.0 +2.0 +2.0 2.0 0.0 +2.0 +2.0 2.0 0.0 +2.0 +2.0 2.0
q US Municipal 58.0 +0.0 58.0 45.0 +0.0 45.0 35.0 -1.0 -1.0 34.0 26.0 -3.0 -3.0 23.0 16.0 -4.0 -4.0 12.0
US IG Corp 4.0 +1.0 5.0 3.0 +2.0 5.0 3.0 +2.0 5.0 2.0 +2.0 4.0 1.0 +2.0 3.0
US HY Corp 2.0 +0.0 2.0 3.0 +0.0 3.0 4.0 +0.0 4.0 5.0 +0.0 5.0 7.0 +0.0 7.0
p Int’l Fixed Income 8.0 +0.0 +2.0 8.0 8.0 +0.0 +2.5 8.0 7.5 +0.0 +2.0 7.5 8.0 +0.0 +2.0 8.0 7.0 +0.0 +2.0 7.0
p Int’l Developed Markets 6.0 +0.0 +2.0 6.0 5.0 +0.0 +2.5 5.0 4.0 +0.0 +2.0 4.0 3.0 +0.0 +2.0 3.0 2.0 +0.0 +2.0 2.0
Emerging Markets 2.0 +0.0 2.0 3.0 +0.0 3.0 3.5 +0.0 3.5 5.0 +0.0 5.0 5.0 +0.0 5.0
Equity 16.0 +2.0 18.0 30.0 +2.0 32.0 40.5 +2.0 42.5 51.0 +2.0 53.0 62.0 +2.0 64.0
US Equity 9.0 +2.0 11.0 18.0 +2.0 20.0 23.0 +2.0 25.0 29.0 +2.0 31.0 36.0 +2.0 38.0
US Large cap Growth 3.0 +0.5 3.5 5.0 +0.5 5.5 7.0 +0.5 7.5 9.0 +0.5 9.5 11.0 +0.5 11.5
US Large cap Value 3.0 +0.5 3.5 5.0 +0.5 5.5 7.0 +0.5 7.5 9.0 +0.5 9.5 11.0 +0.5 11.5
US Mid cap 2.0 +0.5 2.5 5.0 +0.5 5.5 6.0 +0.5 6.5 7.0 +0.5 7.5 9.0 +0.5 9.5
US Small cap 1.0 +0.5 1.5 3.0 +0.5 3.5 3.0 +0.5 3.5 4.0 +0.5 4.5 5.0 +0.5 5.5
International Equity 7.0 +0.0 7.0 12.0 +0.0 12.0 17.5 +0.0 17.5 22.0 +0.0 22.0 26.0 +0.0 26.0
Int’l Developed Markets 4.0 -0.5 3.5 7.0 -1.0 6.0 10.0 -1.0 9.0 12.5 -1.0 11.5 15.0 -1.0 14.0
Emerging Markets 3.0 +0.5 3.5 5.0 +1.0 6.0 7.5 +1.0 8.5 9.5 +1.0 10.5 11.0 +1.0 12.0
Commodities 4.0 +0.0 4.0 4.0 +0.0 4.0 5.0 +0.0 5.0 5.0 +0.0 5.0 5.0 +0.0 5.0
“WMR tactical deviation” legend: Overweight Underweight Neutral “Change” legend: p Upgrade q Downgrade *Refers to moderate-risk profile. 1The current allocation column is the sum of the strategic asset allocation and the tactical deviation column.
Detailed asset allocation non-taxable with non-traditional assets
Investor risk profile
Conservative Moderately conservative
Moderate Moderately ag-gressive
Aggressive
Chan
ge t
his
mon
th
All figures in %
Stra
tegi
c as
set a
lloca
tion
CIO
tact
ical d
evia
tion
Chan
ge th
is m
onth
Curre
nt a
lloca
tion1
Stra
tegi
c as
set a
lloca
tion
CIO
tact
ical d
evia
tion
Chan
ge th
is m
onth
Curre
nt a
lloca
tion1
Stra
tegi
c as
set a
lloca
tion
CIO
tact
ical d
evia
tion
Chan
ge th
is m
onth
Curre
nt a
lloca
tion1
Stra
tegi
c as
set a
lloca
tion
CIO
tact
ical d
evia
tion
Chan
ge th
is m
onth
Curre
nt a
lloca
tion1
Stra
tegi
c as
set a
lloca
tion
CIO
tact
ical d
evia
tion
Chan
ge th
is m
onth
Curre
nt a
lloca
tion1
Cash 0.0 +0.0 0.0 0.0 +0.0 0.0 0.0 +0.0 0.0 0.0 +0.0 0.0 0.0 +0.0 0.0
Fixed Income 68.0 -2.0 66.0 56.0 -2.0 54.0 46.5 -2.0 44.5 39.0 -2.0 37.0 33.0 -2.0 31.0
q US Fixed Income 60.0 -2.0 -2.0 58.0 49.0 -2.0 -2.0 47.0 40.0 -2.0 -2.0 38.0 32.5 -2.0 -2.0 30.5 26.0 -2.0 -2.0 24.0
q US Gov’t 47.0 -4.0 -3.0 43.0 36.0 -5.0 -3.5 31.0 28.0 -6.0 -4.0 22.0 19.5 -6.0 -4.0 13.5 13.0 -6.0 -4.0 7.0
p US TIPS 1–10 years 0.0 +1.0 +1.0 1.0 0.0 +1.5 +1.5 1.5 0.0 +2.0 +2.0 2.0 0.0 +2.0 +2.0 2.0 0.0 +2.0 +2.0 2.0
US Municipal 0.0 +0.0 0.0 0.0 +0.0 0.0 0.0 +0.0 0.0 0.0 +0.0 0.0 0.0 +0.0 0.0
US IG Corp 9.0 +1.0 10.0 7.0 +1.5 8.5 5.0 +2.0 7.0 4.0 +2.0 6.0 2.0 +2.0 4.0
US HY Corp 4.0 +0.0 4.0 6.0 +0.0 6.0 7.0 +0.0 7.0 9.0 +0.0 9.0 11.0 +0.0 11.0
p Int’l Fixed Income 8.0 +0.0 +2.0 8.0 7.0 +0.0 +2.0 7.0 6.5 +0.0 +2.0 6.5 6.5 +0.0 +2.0 6.5 7.0 +0.0 +2.0 7.0
p Int’l Developed Markets 6.0 +0.0 +2.0 6.0 4.0 +0.0 +2.0 4.0 3.5 +0.0 +2.0 3.5 2.5 +0.0 +2.0 2.5 2.0 +0.0 +2.0 2.0
Emerging Markets 2.0 +0.0 2.0 3.0 +0.0 3.0 3.0 +0.0 3.0 4.0 +0.0 4.0 5.0 +0.0 5.0
Equity 17.0 +2.0 19.0 28.0 +2.0 30.0 34.5 +2.0 36.5 42.0 +2.0 44.0 53.0 +2.0 55.0
US Equity 10.0 +2.0 12.0 16.0 +2.0 18.0 20.5 +2.0 22.5 24.0 +2.0 26.0 31.0 +2.0 33.0
US Large cap Growth 3.0 +0.5 3.5 5.0 +0.5 5.5 6.0 +0.5 6.5 7.5 +0.5 8.0 9.5 +0.5 10.0
US Large cap Value 3.0 +0.5 3.5 5.0 +0.5 5.5 6.0 +0.5 6.5 7.5 +0.5 8.0 9.5 +0.5 10.0
US Mid cap 2.5 +0.5 3.0 4.0 +0.5 4.5 5.5 +0.5 6.0 6.0 +0.5 6.5 8.0 +0.5 8.5
US Small cap 1.5 +0.5 2.0 2.0 +0.5 2.5 3.0 +0.5 3.5 3.0 +0.5 3.5 4.0 +0.5 4.5
International Equity 7.0 +0.0 7.0 12.0 +0.0 12.0 14.0 +0.0 14.0 18.0 +0.0 18.0 22.0 +0.0 22.0
Int’l Developed Markets 4.0 -0.5 3.5 7.0 -1.0 6.0 8.0 -1.0 7.0 10.0 -1.0 9.0 13.0 -1.0 12.0
Emerging Markets 3.0 +0.5 3.5 5.0 +1.0 6.0 6.0 +1.0 7.0 8.0 +1.0 9.0 9.0 +1.0 10.0
Commodities 4.0 +0.0 4.0 4.0 +0.0 4.0 4.0 +0.0 4.0 5.0 +0.0 5.0 5.0 +0.0 5.0
Non-traditional 11.0 +0.0 11.0 12.0 +0.0 12.0 15.0 +0.0 15.0 14.0 +0.0 14.0 9.0 +0.0 9.0
Hedge Funds 11.0 +0.0 11.0 12.0 +0.0 12.0 10.0 +0.0 10.0 8.0 +0.0 8.0 3.0 +0.0 3.0
Private Equity 0.0 +0.0 0.0 0.0 +0.0 0.0 5.0 +0.0 5.0 6.0 +0.0 6.0 6.0 +0.0 6.0
Private Real Estate 0.0 +0.0 0.0 0.0 +0.0 0.0 0.0 +0.0 0.0 0.0 +0.0 0.0 0.0 +0.0 0.0
“WMR tactical deviation” legend: Overweight Underweight Neutral “Change” legend: p Upgrade q Downgrade *Refers to moderate-risk profile. 1The current allocation column is the sum of the strategic asset allocation and the tactical deviation column.
Source: UBS and WMA AAC, 20 October 2016. See appendix for information regarding sources of strategic asset allocations and their suitability, investor risk profiles, and the interpretation of the suggested tactical deviations from the strategic asset allocations.

30 UBS HOUSE VIEW NOVEMBER 2016
DETAILED ASSET ALLOCATION
Detailed asset allocation non-taxable without non-traditional assets
Source: UBS and WMA AAC, 20 October 2016. See appendix for information regarding sources of strategic asset allocations and their suitability, investor risk profiles, and the interpretation of the suggested tactical deviations from the strategic asset allocations.
Investor risk profile
Conservative Moderately conservative
Moderate Moderately ag-gressive
Aggressive
Chan
ge t
his
mon
th
All figures in %
Stra
tegi
c as
set a
lloca
tion
CIO
tact
ical d
evia
tion
Chan
ge th
is m
onth
Curre
nt a
lloca
tion1
Stra
tegi
c as
set a
lloca
tion
CIO
tact
ical d
evia
tion
Chan
ge th
is m
onth
Curre
nt a
lloca
tion1
Stra
tegi
c as
set a
lloca
tion
CIO
tact
ical d
evia
tion
Chan
ge th
is m
onth
Curre
nt a
lloca
tion1
Stra
tegi
c as
set a
lloca
tion
CIO
tact
ical d
evia
tion
Chan
ge th
is m
onth
Curre
nt a
lloca
tion1
Stra
tegi
c as
set a
lloca
tion
CIO
tact
ical d
evia
tion
Chan
ge th
is m
onth
Curre
nt a
lloca
tion1
Cash 0.0 +0.0 0.0 0.0 +0.0 0.0 0.0 +0.0 0.0 0.0 +0.0 0.0 0.0 +0.0 0.0
Fixed Income 78.0 -2.0 76.0 65.0 -2.0 63.0 55.0 -2.0 53.0 46.0 -2.0 44.0 36.0 -2.0 34.0
q US Fixed Income 69.0 -2.0 -2.0 67.0 57.0 -2.0 -2.0 55.0 47.0 -2.0 -2.0 45.0 38.0 -2.0 -2.0 36.0 29.0 -2.0 -2.0 27.0
q US Gov’t 55.0 -4.0 -3.0 51.0 42.0 -5.0 -3.5 37.0 32.0 -6.0 -4.0 26.0 23.0 -6.0 -4.0 17.0 13.0 -6.0 -4.0 7.0
p US TIPS 1–10 years 0.0 +1.0 +1.0 1.0 0.0 +1.5 +1.5 1.5 0.0 +2.0 +2.0 2.0 0.0 +2.0 +2.0 2.0 0.0 +2.0 +2.0 2.0
US Municipal 0.0 +0.0 0.0 0.0 +0.0 0.0 0.0 +0.0 0.0 0.0 +0.0 0.0 0.0 +0.0 0.0
US IG Corp 10.0 +1.0 11.0 8.0 +1.5 9.5 6.0 +2.0 8.0 4.0 +2.0 6.0 3.0 +2.0 5.0
US HY Corp 4.0 +0.0 4.0 7.0 +0.0 7.0 9.0 +0.0 9.0 11.0 +0.0 11.0 13.0 +0.0 13.0
p Int’l Fixed Income 9.0 +0.0 +2.0 9.0 8.0 +0.0 +2.0 8.0 8.0 +0.0 +2.0 8.0 8.0 +0.0 +2.0 8.0 7.0 +0.0 +2.0 7.0
p Int’l Developed Markets 7.0 +0.0 +2.0 7.0 5.0 +0.0 +2.0 5.0 4.0 +0.0 +2.0 4.0 3.0 +0.0 +2.0 3.0 2.0 +0.0 +2.0 2.0
Emerging Markets 2.0 +0.0 2.0 3.0 +0.0 3.0 4.0 +0.0 4.0 5.0 +0.0 5.0 5.0 +0.0 5.0
Equity 18.0 +2.0 20.0 31.0 +2.0 33.0 41.0 +2.0 43.0 50.0 +2.0 52.0 59.0 +2.0 61.0
US Equity 10.0 +2.0 12.0 18.0 +2.0 20.0 23.0 +2.0 25.0 28.0 +2.0 30.0 33.0 +2.0 35.0
US Large cap Growth 3.0 +0.5 3.5 5.5 +0.5 6.0 7.0 +0.5 7.5 8.5 +0.5 9.0 10.0 +0.5 10.5
US Large cap Value 3.0 +0.5 3.5 5.5 +0.5 6.0 7.0 +0.5 7.5 8.5 +0.5 9.0 10.0 +0.5 10.5
US Mid cap 3.0 +0.5 3.5 5.0 +0.5 5.5 6.0 +0.5 6.5 7.0 +0.5 7.5 9.0 +0.5 9.5
US Small cap 1.0 +0.5 1.5 2.0 +0.5 2.5 3.0 +0.5 3.5 4.0 +0.5 4.5 4.0 +0.5 4.5
International Equity 8.0 +0.0 8.0 13.0 +0.0 13.0 18.0 +0.0 18.0 22.0 +0.0 22.0 26.0 +0.0 26.0
Int’l Developed Markets 4.0 -0.5 3.5 8.0 -1.0 7.0 10.0 -1.0 9.0 12.0 -1.0 11.0 14.0 -1.0 13.0
Emerging Markets 4.0 +0.5 4.5 5.0 +1.0 6.0 8.0 +1.0 9.0 10.0 +1.0 11.0 12.0 +1.0 13.0
Commodities 4.0 +0.0 4.0 4.0 +0.0 4.0 4.0 +0.0 4.0 4.0 +0.0 4.0 5.0 +0.0 5.0
“WMR tactical deviation” legend: Overweight Underweight Neutral “Change” legend: p Upgrade q Downgrade *Refers to moderate-risk profile. 1The current allocation column is the sum of the strategic asset allocation and the tactical deviation column.

NOVEMBER 2016 UBS HOUSE VIEW 31
DETAILED ASSET ALLOCATION
Detailed asset allocation all equity and all fixed income models
Publication note The All Equity and All Fixed Income portfolios complement our balanced portfolios and offer more granular im-plementation of our House View. While we generally do not recommend that investors hold portfolios consisting of only stocks or only bonds, the All Equity and All Fixed Income portfolios can be used by investors who want to comple-ment their existing holdings. It is also possible to combine the All Equity port-folio with one of the All Fixed Income portfolios to generate a balanced port-folio. The tactical tilts in the portfolios are based on the corresponding tilts in our balanced portfolios (moderate risk profile, without alternative investments).
A special feature of the All Equity port-folio is that it includes “carve-outs”: 3% allocations to our preferred sectors within US large-caps as well as our pre-ferred countries within both interna-tional developed markets and the emerging markets. A maximum of two sectors/countries of each type may be selected for carve-outs. The amount of cash in the All Equity portfolio will vary one-for-one with the overall over-weight/underweight on equities in the balanced portfolio, subject to a 3% maximum. This allows us to express a tactical preference between stocks and bonds.
The All Fixed Income portfolios include both taxable and non-taxable versions. These are based on the fixed income portion of the balanced portfolios, with the non-taxable version incorporating an additional allocation to Mortgage Backed Securities. In addition, the All Fixed Income portfolios include alloca-tions to government bonds (Munis in the taxable version, Treasuries in the non-taxable version) of different ma-turities, allowing views on duration to be expressed. Cash is set at 5% of the portfolios, with small deviations pos-sible due to rounding.
Source: UBS and WMA AAC, 20 October 2016. See appendix for information regarding sources of strategic asset allocations and their suitability, investor risk profiles and the interpretation of the suggested tactical deviations from the strategic asset allocations.
All equity All fixed income, tax-able
All fixed income, non-taxable
All figures in %
Stra
tegi
c as
set a
lloca
tion
CIO
tact
ical d
evia
tion
Chan
ge th
is m
onth
Curre
nt a
lloca
tion1
Stra
tegi
c as
set a
lloca
tion
CIO
tact
ical d
evia
tion
Chan
ge th
is m
onth
Curre
nt a
lloca
tion1
Stra
tegi
c as
set a
lloca
tion
CIO
tact
ical d
evia
tion
Chan
ge th
is m
onth
Curre
nt a
lloca
tion1
Cash 5.0 -2.0 3.0 5.0 +0.0 5.0 5.0 +0.0 q 5.0
Fixed Income 0.0 +0.0 0.0 95.0 +0.0 95.0 95.0 +0.0 p 95.0
US Fixed Income 0.0 +0.0 0.0 82.0 +0.0 q 82.0 81.0 +0.0 q 81.0
US Gov’t – total market 0.0 +0.0 0.0 9.0 -9.0 q 0.0 16.0 -2.5 q 13.5
US Gov’t – 1~3 years 0.0 +0.0 0.0 0.0 +0.0 0.0 6.0 -1.5 4.5
US Gov’t – 3~7 years 0.0 +0.0 0.0 0.0 +0.0 0.0 14.0 -2.5 11.5
US Gov’t – 7~10 years 0.0 +0.0 0.0 0.0 +0.0 0.0 10.0 -1.5 8.5
US TIPS 1~10 years 0.0 +0.0 0.0 0.0 +4.0 p 4.0 0.0 +4.0 p 4.0
US MBS 0.0 +0.0 0.0 0.0 +0.0 0.0 9.0 +0.0 9.0
US Munis – total market 0.0 +0.0 0.0 28.0 +0.0 q 28.0 0.0 +0.0 0.0
US Munis – short duration 0.0 +0.0 0.0 11.0 +0.0 11.0 0.0 +0.0 0.0
US Munis – long duration 0.0 +0.0 0.0 22.0 +1.0 23.0 0.0 +0.0 0.0
US Investment Grade 0.0 +0.0 0.0 5.0 +4.0 9.0 10.5 +4.0 14.5
US High Yield 0.0 +0.0 0.0 7.0 +0.0 7.0 15.5 +0.0 15.5
Int’l Fixed Income 0.0 +0.0 0.0 13.0 +0.0 p 13.0 14.0 +0.0 p 14.0
Int’l Developed Markets 0.0 +0.0 0.0 7.0 +0.0 p 7.0 7.0 +0.0 p 7.0
Emerging Markets 0.0 +0.0 0.0 6.0 +0.0 6.0 7.0 +0.0 7.0
Equity 95.0 +2.0 97.0 0.0 +0.0 0.0 0.0 +0.0 0.0
US Equity 54.0 +2.0 56.0 0.0 +0.0 0.0 0.0 +0.0 0.0
US Large-cap Growth 7.0 +0.5 7.5 0.0 +0.0 0.0 0.0 +0.0 0.0
US Large-cap Value 7.0 +0.5 7.5 0.0 +0.0 0.0 0.0 +0.0 0.0
US Large-cap Total Market 19.0 -3.0 16.0 0.0 +0.0 0.0 0.0 +0.0 0.0
Healthcare 0.0 +3.0 3.0 0.0 +0.0 0.0 0.0 +0.0 0.0
US Mid-cap Equity 14.0 +0.5 14.5 0.0 +0.0 0.0 0.0 +0.0 0.0
US Small-cap Equity 7.0 +0.5 7.5 0.0 +0.0 0.0 0.0 +0.0 0.0
International Equity 41.0 +0.0 41.0 0.0 +0.0 0.0 0.0 +0.0 0.0
Int’l Developed Markets 23.5 -1.0 22.5 0.0 +0.0 0.0 0.0 +0.0 0.0
Global EM Equity 17.5 -5.0 12.5 0.0 +0.0 0.0 0.0 +0.0 0.0
China 0.0 +3.0 3.0 0.0 +0.0 0.0 0.0 +0.0 0.0
India 0.0 +3.0 3.0 0.0 +0.0 0.0 0.0 +0.0 0.0
“WMR tactical deviation” legend: Overweight Underweight Neutral 1The current allocation column is the sum of the strategic asset allocation and the tactical deviation column.

32 UBS HOUSE VIEW NOVEMBER 2016
In order to create the analysis shown, the rates of return for each asset class are combined in the same proportion as the asset allocations illustrated (e.g., if the asset allocation indi-cates 40% equities, then 40% of the results shown for the al-location will be based upon the estimated hypothetical return and standard deviation assumptions shown below).
You should understand that the analysis shown and assump-tions used are hypothetical estimates provided for your gen-eral information. The results are not guarantees and pertain to the asset allocation and/or asset class in general, not the performance of specific securities or investments. Your actual results may vary significantly from the results shown in this report, as can the performance of any individual security or investment.
Portfolio analyticsThe portfolio analytics shown for each risk profile’s bench-mark allocations are based on estimated forward-looking return and standard deviation assumptions (capital market as-sumptions), which are based on UBS proprietary research. The development process includes a review of a variety of factors, including the return, risk, correlations and historical perfor-mance of various asset classes, inflation and risk premium. These capital market assumptions do not assume any particu-lar investment time horizon. The process assumes a situation where the supply and demand for investments is in balance, and in which expected returns of all asset classes are a reflec-tion of their expected risk and correlations regardless of time frame. Please note that these assumptions are not guaran-tees and are subject to change. UBS has changed its risk and return assumptions in the past and may do so in the future. Neither UBS nor your Financial Advisor is required to provide you with an updated analysis based upon changes to these or other underlying assumptions.
Risk Profile ==>> Conservative
Moderately conservative
Moderate
Moderately aggressive
Aggressive
Taxable with non-traditional assets
Estimated Return 4.4% 5.1% 5.9% 6.4% 7.0%
Estimated Risk 5.6% 7.4% 9.6% 11.5% 13.5%
Taxable without non-traditional assets
Estimated Return 4.0% 4.8% 5.5% 6.1% 6.8%
Estimated Risk 5.4% 7.5% 9.5% 11.5% 13.5%
Non-taxable with non-traditional assets
Estimated Return 4.3% 5.0% 5.8% 6.4% 7.0%
Estimated Risk 5.5% 7.4% 9.5% 11.4% 13.4%
Non-taxable without non-traditional assets
Estimated Return 4.0% 4.8% 5.5% 6.1% 6.8%
Estimated Risk 5.4% 7.5% 9.5% 11.4% 13.5%
Asset Class Capital Market Assumptions
Annual total return Annual risk
US Cash 2.5% 0.5%
US Government Fixed Income 2.2% 4.3%
US Municipal Fixed Income 2.9% 4.7%
US Corporate Investment Grade Fixed Income 3.5% 5.9%
US Corporate High Yield Fixed Income 5.6% 11.7%
International Developed Markets Fixed Income 4.0% 9.0%
Emerging Markets Fixed Income 4.9% 9.1%
US Large-cap Equity 7.5% 16.8%
US Mid-cap Equity 8.4% 19.6%
US Small-cap Equity 8.6% 21.8%
International Developed Markets Equity 8.5% 19.7%
Emerging Markets Equity 10.0% 25.5%
Commodities 6.4% 18.9%
Hedge Funds 6.2% 6.7%
Private Equity 11.8% 24.4%
Private Real Estate 8.5% 11.8%

NOVEMBER 2016 UBS HOUSE VIEW 33
Asset Class Capital Market Assumptions
Annual total return Annual risk
US Cash 2.5% 0.5%
US Government Fixed Income 2.2% 4.3%
US Municipal Fixed Income 2.9% 4.7%
US Corporate Investment Grade Fixed Income 3.5% 5.9%
US Corporate High Yield Fixed Income 5.6% 11.7%
International Developed Markets Fixed Income 4.0% 9.0%
Emerging Markets Fixed Income 4.9% 9.1%
US Large-cap Equity 7.5% 16.8%
US Mid-cap Equity 8.4% 19.6%
US Small-cap Equity 8.6% 21.8%
International Developed Markets Equity 8.5% 19.7%
Emerging Markets Equity 10.0% 25.5%
Commodities 6.4% 18.9%
Hedge Funds 6.2% 6.7%
Private Equity 11.8% 24.4%
Private Real Estate 8.5% 11.8%
DETAILED ASSET ALLOCATION
Additional asset allocation models
International developed markets (non-US) equity module, in %
Benchmark CIO WMR tactical deviation2 Current allocation3
allocation1 Previous Current
EMU / Eurozone 28.0 +2.0 +2.0 30.0
UK 20.0 +2.0 +2.0 22.0
Japan 19.0 +2.0 +2.0 21.0
Australia 7.0 +2.0 +2.0 9.0
Canada 9.0 +0.0 +0.0 9.0
Switzerland 8.0 -8.0 -8.0 0.0
Other 9.0 +0.0 +0.0 9.0
Source: UBS, as of 20 October 2016
International developed markets (non-US) fixed income module, in %
The US Taxable Fixed Income Allocation table appears in Fixed Income Strategist, which is published on a monthly basis and can be found in the Fixed Income section of the Online Services Research website.
Benchmark CIO WMR tactical deviation2 Current allocation3
allocation1 Previous Current
EMU / Eurozone 42.0 -5.0 +0.0 42.0
UK 9.0 +0.0 +0.0 9.0
Japan 32.0 +0.0 +0.0 32.0
Other 17.0 +5.0 +0.0 17.0
Source: UBS, as of 20 October 2016
Footnotes1 For the first table on this page, the benchmark allocation is based on S&P 500 weights. For the second and third tables on this page, the benchmark allocation refers to a moderate risk profile and represents the relative market capitalization weights of each country or region.2 See “Deviations from strategic asset allocation or benchmark allocation” in the appendix for an explanation regarding the interpretation of the suggested tactical de-viations from benchmark. The “current” column refers to the tactical deviation that applies as of the date of this publication. The “previous” column refers to the tacti-cal deviation that was in place at the date of the previous edition of UBS House View or the last UBS House View Update.3 The current allocation column is the sum of the CIO WMR tactical deviation columns and (the S&P 500 benchmark allocation for the first table on this page) (the benchmark allocation for the second and third tables on this page).
US equity sector allocation, in %
For US equity subsector recommendations please see the “Equity Preference List” for each sector. These reports are published on a monthly basis and can be found on the Online Services website in the Research > Equities section.
S&P 500 CIO WMR tactical deviation2 CurrentBenchmark Numeric Symbol allocation3
allocation1 Previous Current Previous Current
Consumer Discretionary 12.5 +1.0 +1.0 + + 13.5
Consumer Staples 9.8 -1.0 -1.0 – – 8.8
Energy 7.4 +1.0 +1.0 + + 8.4
Financials 13.1 +0.0 +1.0 n + 14.1
Health Care 14.4 +2.0 +2.0 ++ ++ 16.4
Industrials 9.7 +0.0 -1.0 n – 8.7
Information Technology 21.4 +1.0 +1.0 + + 22.4
Materials 2.9 +0.0 +0.0 n n 2.9
Real Estate 3.0 +0.0 +0.0 n n 3.0
Telecom 2.6 -2.0 -2.0 – – – – 0.6
Utilities 3.3 -2.0 -2.0 – – – – 1.3
Source: S&P, UBS, as of 20 October 2016Note: The benchmark allocation, as well as the tactical deviations, are intended to be applicable to the US equity portion of a portfolio across investor risk profiles.

34 UBS HOUSE VIEW NOVEMBER 2016
The performance calculations shown in Table A commence on 25 January 2013, the first date upon which the Investment Strategy Guide was published following the release of the new UBS WMA strategic asset allocation (SAA) models. The performance is based on the SAA without non-traditional assets for a moderate risk pro-file investor, and the SAA with the tactical shift (see detailed asset allocation tables where the SAA with the tactical shift is referred to as “current allocation”). Performance is calculated utilizing the returns of the indices identified in Table B as applied to the respec-tive allocations in the SAA and the SAA with the tactical shift. For example, if US Mid Cap Equity is allocated 10% in the SAA and 12% in the SAA with the tactical shift, the US Mid Cap Eq-uity index respectively contributed to 10% and 12% of the results shown. Prior to 25 January 2013, CIO WMR published tactical as-set allocation recommendations in the Investment Strategy Guide using a different set of asset classes and sectors. The performance of these tactical recommendations is reflected in Table C.
The performance attributable to the CIO WMR tactical deviations is reflected in the column in Tables A and C labeled “Excess re-turn,” which shows the difference between the performance of the SAA and the performance of the SAA with the tactical shift. The “Information ratio” is a risk-adjusted performance measure,
Tactical asset allocation performance measurement
which adjusts the excess returns for the tracking error risk of the tactical deviations. Specifically the information ratio is calculated as the ratio of the annualized excess return over a given time pe-riod and the annualized standard deviation of daily excess returns over the same period. Additional background information regard-ing the computation of the information ratio figures provided be-low are available upon request.
The calculations assume that the portfolios are rebalanced when-ever changes are made to tactical deviations, typically upon pub-lication of the Investment Strategy Guide on a monthly basis. Occasionally, changes in the tactical deviations are made intra-month when warranted by market conditions and communicated through an Investment Strategy Guide Update. The computations assume portfolio rebalancing upon such intra-month changes as well. Performance shown is based on total returns, but does not include transaction costs, such as commissions, fees, margin in-terest, and interest charges. Actual total returns adjusted for such transaction costs will be reduced. A complete record of all the recommendations upon which this performance report is based is available from UBS Financial Services Inc. upon written request. Past performance is not an indication of future results.
Table A: Moderate risk profile performance measurement (25 January 2013 to present)
SAA SAA withtactical shift
Excessreturn
Information ratio
(annualized)
Russell 3000stock index
(total return)
Barclays CapitalUS Aggregate bondindex (total return)
25 January 2013 to 31 March 2013 0.79% 0.83% 0.04% +0.9 5.59% 0.11%
2Q 2013 -2.18% -2.14% 0.04% +0.3 2.69% -2.33%
3Q 2013 3.60% 3.86% 0.26% +2.4 6.35% 0.57%
4Q 2013 3.05% 3.23% 0.18% +2.9 10.10% -0.14%
1Q 2014 2.56% 2.53% -0.03% -0.2 1.97% 1.84%
2Q 2014 3.44% 3.49% 0.05% +0.3 4.87% 2.04%
3Q 2014 -1.54% -1.71% -0.16% -1.2 0.01% 0.17%
4Q 2014 0.47% 0.73% 0.26% +1.3 5.24% 1.79%
1Q 2015 1.38% 1.69% 0.31% +2.1 1.80% 1.61%
2Q 2015 -0.18% -0.19% -0.01% -0.1 0.14% -1.68%
3Q 2015 -4.67% -5.08% -0.41% -2.4 -7.25% 1.23%
4Q 2015 1.61% 1.67% 0.06% +0.5 6.27% -0.57%
1Q 2016 2.11% 1.72% -0.39% -3.7 0.97% 3.03%
2Q 2016 2.81% 2.88% 0.08% +1.1 2.63% 2.21%
3Q 2016 2.50% 2.60% 0.10% +1.5 4.40% 0.46%
4Q 2016 to date -0.79% -0.73% 0.06% +6.4 -1.16% -0.39%
2016 year to date 6.74% 6.59% -0.16% -0.6 6.92% 5.38%
Since inception (25 January 2013) 15.57% 16.03% 0.46% +0.2 53.53% 10.26%
Source: UBS, as of 19 October 2016
PERFORMANCE MEASUREMENT
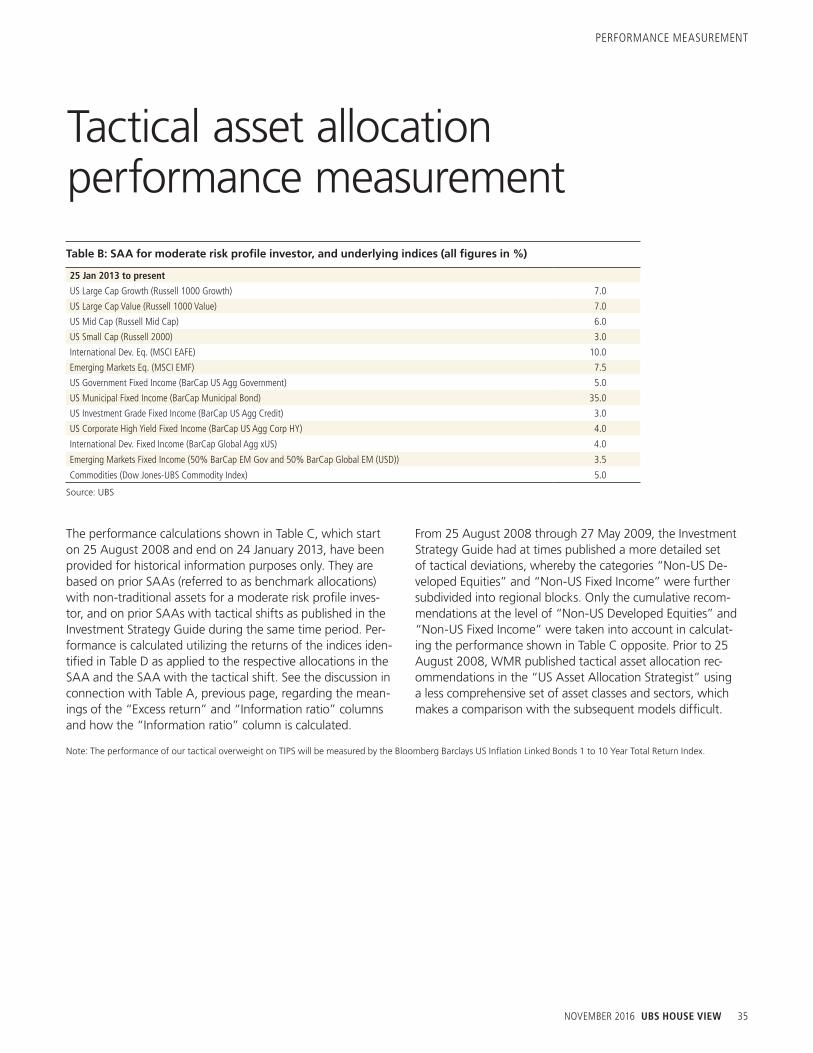
NOVEMBER 2016 UBS HOUSE VIEW 35
PERFORMANCE MEASUREMENT
Table B: SAA for moderate risk profile investor, and underlying indices (all figures in %)
25 Jan 2013 to present
US Large Cap Growth (Russell 1000 Growth) 7.0
US Large Cap Value (Russell 1000 Value) 7.0
US Mid Cap (Russell Mid Cap) 6.0
US Small Cap (Russell 2000) 3.0
International Dev. Eq. (MSCI EAFE) 10.0
Emerging Markets Eq. (MSCI EMF) 7.5
US Government Fixed Income (BarCap US Agg Government) 5.0
US Municipal Fixed Income (BarCap Municipal Bond) 35.0
US Investment Grade Fixed Income (BarCap US Agg Credit) 3.0
US Corporate High Yield Fixed Income (BarCap US Agg Corp HY) 4.0
International Dev. Fixed Income (BarCap Global Agg xUS) 4.0
Emerging Markets Fixed Income (50% BarCap EM Gov and 50% BarCap Global EM (USD)) 3.5
Commodities (Dow Jones-UBS Commodity Index) 5.0
Source: UBS
The performance calculations shown in Table C, which start on 25 August 2008 and end on 24 January 2013, have been provided for historical information purposes only. They are based on prior SAAs (referred to as benchmark allocations) with non-traditional assets for a moderate risk profile inves-tor, and on prior SAAs with tactical shifts as published in the Investment Strategy Guide during the same time period. Per-formance is calculated utilizing the returns of the indices iden-tified in Table D as applied to the respective allocations in the SAA and the SAA with the tactical shift. See the discussion in connection with Table A, previous page, regarding the mean-ings of the “Excess return” and “Information ratio” columns and how the “Information ratio” column is calculated.
Tactical asset allocation performance measurement
From 25 August 2008 through 27 May 2009, the Investment Strategy Guide had at times published a more detailed set of tactical deviations, whereby the categories “Non-US De-veloped Equities” and “Non-US Fixed Income” were further subdivided into regional blocks. Only the cumulative recom-mendations at the level of “Non-US Developed Equities” and “Non-US Fixed Income” were taken into account in calculat-ing the performance shown in Table C opposite. Prior to 25 August 2008, WMR published tactical asset allocation rec-ommendations in the “US Asset Allocation Strategist” using a less comprehensive set of asset classes and sectors, which makes a comparison with the subsequent models difficult.
Note: The performance of our tactical overweight on TIPS will be measured by the Bloomberg Barclays US Inflation Linked Bonds 1 to 10 Year Total Return Index.

36 UBS HOUSE VIEW NOVEMBER 2016
PERFORMANCE MEASUREMENT
Tactical asset allocation performance measurementTable C: Moderate risk profile performance measurement (25 August 2008 to 24 January 2013)
Benchmark Allocations (SAA)
Benchmark Allocation (SAA)
with tactical shift
Excessreturn
Information ratio(annualized)
Russell 3000stock index
(total return)
Barclays CapitalUS Aggregate bondindex (total return)
25 Aug 08 to 31 Dec 08 -16.59% -15.64% 0.96% +2.0 -29.00% 3.33%
2009 Q1 -5.52% -5.45% 0.07% +0.3 -10.80% 0.12%
2009 Q2 11.18% 11.37% 0.18% +1.0 16.82% 1.78%
2009 Q3 10.44% 11.07% 0.63% +2.1 16.31% 3.74%
2009 Q4 2.99% 3.30% 0.31% +1.1 5.90% 0.20%
2010 Q1 2.74% 2.56% -0.18% -0.9 5.94% 1.78%
2010 Q2 -4.56% -4.87% -0.31% -1.4 -11.32% 3.49%
2010 Q3 8.34% 7.99% -0.35% -2.1 11.53% 2.48%
2010 Q4 5.18% 5.17% -0.01% -0.1 11.59% -1.30%
2011 Q1 3.23% 3.15% -0.08% -0.4 6.38% 0.42%
2011 Q2 0.62% 0.47% -0.16% -0.9 -0.03% 2.29%
2011 Q3 -7.65% -8.56% -0.90% -2.5 -15.28% 3.82%
2011 Q4 4.66% 4.39% -0.27% -0.8 12.12% 1.12%
2012 Q1 5.89% 5.41% -0.48% -2.3 12.87% 0.30%
2012 Q2 -1.59% -1.57% 0.02% +0.2 -3.15% 2.06%
2012 Q3 4.18% 4.08% -0.10% -1.1 6.23% 1.59%
2012 Q4 0.69% 0.65% -0.04% -0.7 0.25% 0.21%
01 Jan 13 to 24 Jan 13 2.17% 2.20% 0.03% +2.5 5.19% -0.23%
Since inception 24.86% 24.10% -0.76% -0.1 31.81% 30.76%
Source: UBS
Table D: SAAs for moderate risk profile investor, and underlying indices (all figures in %)
25 Aug 2008 to 23 Feb 2009 24 Feb 2009 to 24 Jan 2013
US Large Cap Value (Russell 1000 Value) 12.5 US Large Cap Value (Russell 1000 Value) 11.0
US Large Cap Growth (Russell 1000 Growth) 12.5 US Large Cap Growth (Russell 1000 Growth) 11.0
US Small Cap Value (Russell 2000 Value) 2.0 US Mid Cap (Russell Midcap) 5.0
US Small Cap Growth (Russell 2000 Growth) 2.0 US Small Cap (Russell 2000) 3.0
US REITs (FTSE NAREIT All REITs) 1.5 US REITs (FTSE NAREIT All REITs) 2.0
Non-US Dev. Eq. (MSCI Gross World ex-US) 10.5 Developed Markets (MSCI Gross World ex-US) 10.0
Emerging Markets Eq. (MSCI Gross EM USD) 2.0 Emerging Markets (MSCI Gross EM USD) 2.0
US Fixed Income (BarCap US Aggregate) 30.0 US Fixed Income (BarCap US Aggregate) 29.0
Non-US Fixed Income (BarCap Global Aggregate ex-USD) 8.0 Non-US Fixed Income (BarCap Global Aggregate ex-USD) 8.0
Cash (JP Morgan Cash Index USD 1 month) 2.0 Cash (JP Morgan Cash Index USD 1 month) 2.0
Commodities (DJ UBS total return index) 5.0 Commodities (DJ UBS total return index) 5.0
Alternative Investments (HFRX Equal Weighted Strategies) 12.0 Alternative Investments (HFRX Equal Weighted Strategies) 12.0
Source: UBS

NOVEMBER 2016 UBS HOUSE VIEW 37
APPENDIX
Global Investment Process and Committee descriptionThe UBS investment process is designed to achieve replica-ble, high quality results through applying intellectual rigor, strong process governance, clear responsibility and a culture of challenge.
Based on the analyses and assessments conducted and vetted throughout the investment process, the Chief Investment Offi-cer (CIO) formulates the UBS Wealth Management Investment House View (e.g., overweight, neutral, underweight stance for asset classes and market segments relative to their benchmark allocation) at the Global Investment Committee (GIC). Senior investment professionals from across UBS, complemented by selected external experts, debate and rigorously challenge the investment strategy to ensure consistency and risk control.
Global Investment Committee compositionThe GIC is comprised of 12 members, representing top market and investment expertise from across all divisions of UBS:
• Mark Haefele (Chair)• Mark Andersen• Jorge Mariscal• Mads Pedersen• Mike Ryan• Simon Smiles• Tan Min Lan• Themis Themistocleous• Paul Donovan• Dawn Fitzpatrick (*)• Bruno Marxer (*)• Andreas Koester (*)
(*) Business areas distinct from Chief Investment Office/Wealth Management Research
Investment committee
WMA Asset Allocation Committee descriptionWe recognize that a globally derived house view is most ef-fective when complemented by local perspective and applica-tion. As such, UBS has formed a Wealth Management Ameri-cas Asset Allocation Committee (WMA AAC). WMA AAC is responsible for the development and monitoring of UBS WMA’s strategic asset allocation models and capital market assumptions. The WMA AAC sets parameters for the CIO WMR Americas Investment Strategy Group to follow during the translation process of the GIC’s House Views and the in-corporation of US-specific asset class views into the US-spe-cific tactical asset allocation models.
WMA Asset Allocation Committee compositionThe WMA Asset Allocation Committee is comprised of five members:
• Mike Ryan • Michael Crook • Richard Hollmann (*) • Jeremy Zirin• Stephen Freedman
(*) Business areas distinct from Chief Investment Office/Wealth Management Research
38 UBS HOUSE VIEW NOVEMBER 2016
APPENDIX
Explanations about asset classes
Scale for tactical deviation charts
Symbol Description/Definition Symbol Description/Definition Symbol Description/Definition
+ moderate overweight vs. benchmark – moderate underweight vs. benchmark n neutral, i.e., on benchmark
++ overweight vs. benchmark – – underweight vs. benchmark n/a not applicable
+++ strong overweight vs. benchmark – – – strong underweight vs. benchmark
Source: UBS
Sources of strategic asset allocations and investor risk profilesStrategic asset allocations represent the longer-term allocation of assets that is deemed suitable for a particular investor. The strategic asset alloca-tion models discussed in this publication, and the capital market assump-tions used for the strategic asset allocations, were developed and ap-proved by the WMA AAC.
The strategic asset allocations are provided for illustrative purposes only and were designed by the WMA AAC for hypothetical US investors with a total return objective under five different Investor Risk Profiles ranging from conservative to aggressive. In general, strategic asset allocations will differ among investors according to their individual circumstances, risk tolerance, return objectives and time horizon. Therefore, the strategic as-set allocations in this publication may not be suitable for all investors or investment goals and should not be used as the sole basis of any invest-ment decision. Minimum net worth requirements may apply to allocations to non-traditional assets. As always, please consult your UBS Financial Advisor to see how these weightings should be applied or modified ac-cording to your individual profile and investment goals.
The process by which the strategic asset allocations were derived is de-scribed in detail in the publication entitled “UBS WMA’s Capital Markets Model: Explained, Part II: Methodology,” published on 22 January 2013. Your Financial Advisor can provide you with a copy.
Deviations from strategic asset allocation or benchmark allocationThe recommended tactical deviations from the strategic asset allocation or benchmark allocation are provided by the Global Investment Committee and the Investment Strategy Group within CIO Wealth Management Research Americas. They reflect the short- to medium-term assessment of market op-portunities and risks in the respective asset classes and market segments. Positive/zero/negative tactical deviations correspond to an overweight/neu-tral/underweight stance for each respective asset class and market segment relative to their strategic allocation. The current allocation is the sum of the strategic asset allocation and the tactical deviation.
Note that the regional allocations on the Equities and Bonds pages in UBS House View are provided on an unhedged basis (i.e., it is assumed that in-vestors carry the underlying currency risk of such investments) unless other-wise stated. Thus, the deviations from the strategic asset allocation reflect the views of the underlying equity and bond markets in combination with the assessment of the associated currencies. The detailed asset allocation tables integrate the country preferences within each asset class with the asset class preferences in UBS House View.

NOVEMBER 2016 UBS HOUSE VIEW 39
APPENDIX
Nontraditional AssetsNontraditional asset classes are alternative investments that include hedge funds, private equity, real estate, and man-aged futures (collectively, alternative investments). Interests of alternative investment funds are sold only to qualified investors, and only by means of offering documents that include information about the risks, performance and expenses of alternative invest-ment funds, and which clients are urged to read carefully before subscribing and retain. An investment in an alternative investment fund is speculative and involves significant risks. Specifically, these investments (1) are not mutual funds and are not subject to the same regulatory requirements as mutual funds; (2) may have per-formance that is volatile, and investors may lose all or a substantial amount of their investment; (3) may engage in leverage and other speculative investment practices that may increase the risk of in-vestment loss; (4) are long-term, illiquid investments; there is gen-erally no secondary market for the interests of a fund, and none is expected to develop; (5) interests of alternative investment funds typically will be illiquid and subject to restrictions on transfer; (6) may not be required to provide periodic pricing or valuation infor-mation to investors; (7) generally involve complex tax strategies and
Appendix
Emerging Market InvestmentsInvestors should be aware that Emerging Market assets are subject to, among others, potential risks linked to currency volatility, abrupt changes in the cost of capital and the economic growth outlook, as well as regulatory and sociopolitical risk, interest rate risk and higher credit risk. Assets can sometimes be very illiquid and liquid-ity conditions can abruptly worsen. WMR generally recommends only those securities it believes have been registered under Federal US registration rules (Section 12 of the Securities Exchange Act of 1934) and individual State registration rules (commonly known as “Blue Sky” laws). Prospective investors should be aware that to the extent permitted under US law, WMR may from time to time rec-ommend bonds that are not registered under US or State securities laws. These bonds may be issued in jurisdictions where the level of required disclosures to be made by issuers is not as frequent or complete as that required by US laws.
For more background on emerging markets generally, see the WMR Education Notes “Investing in Emerging Markets (Part 1): Equities,” 27 August 2007, “Emerging Market Bonds: Understanding Emerg-ing Market Bonds,” 12 August 2009 and “Emerging Markets Bonds: Understanding Sovereign Risk,” 17 December 2009.
Investors interested in holding bonds for a longer period are advised to select the bonds of those sovereigns with the highest credit rat-ings (in the investment-grade band). Such an approach should de-crease the risk that an investor could end up holding bonds on which the sovereign has defaulted. Subinvestment-grade bonds are recom-mended only for clients with a higher risk tolerance and who seek to hold higher-yielding bonds for shorter periods only.
there may be delays in distributing tax information to investors; (8) are subject to high fees, including management fees and other fees and expenses, all of which will reduce profits.
Interests in alternative investment funds are not deposits or obliga-tions of, or guaranteed or endorsed by, any bank or other insured depository institution, and are not federally insured by the Federal Deposit Insurance Corporation, the Federal Reserve Board, or any other governmental agency. Prospective investors should understand these risks and have the financial ability and willingness to accept them for an extended period of time before making an investment in an alternative investment fund, and should consider an alternative investment fund as a supplement to an overall investment program.
In addition to the risks that apply to alternative investments gener-ally, the following are additional risks related to an investment in these strategies:
• Hedge Fund Risk: There are risks specifically associated with investing in hedge funds, which may include risks associated with investing in short sales, options, small-cap stocks, “junk bonds,” derivatives, distressed securities, non-US securities and illiquid investments.
• Managed Futures: There are risks specifically associated with investing in managed futures programs. For example, not all managers focus on all strategies at all times, and managed fu-tures strategies may have material directional elements.
• Real Estate: There are risks specifically associated with investing in real estate products and real estate investment trusts. They involve risks associated with debt, adverse changes in general economic or local market conditions, changes in governmental, tax, real estate and zoning laws or regulations, risks associated with capital calls and, for some real estate products, the risks associated with the ability to qualify for favorable treatment un-der the federal tax laws.
• Private Equity: There are risks specifically associated with in-vesting in private equity. Capital calls can be made on short no-tice, and the failure to meet capital calls can result in significant adverse consequences including, but not limited to, a total loss of investment.
• Foreign Exchange/Currency Risk: Investors in securities of is-suers located outside of the United States should be aware that even for securities denominated in US dollars, changes in the exchange rate between the US dollar and the issuer’s “home” currency can have unexpected effects on the market value and liquidity of those securities. Those securities may also be affected by other risks (such as political, economic or regulatory changes) that may not be readily known to a US investor.

40 UBS HOUSE VIEW NOVEMBER 2016
APPENDIX
Chief Investment Office (CIO) Wealth Management (WM) Research is published by UBS Wealth Management and UBS Wealth Manage-ment Americas, Business Divisions of UBS AG (UBS) or an affiliate thereof. CIO WM Research reports published outside the US are branded as Chief Investment Office WM. In certain countries UBS AG is referred to as UBS SA. This publication is for your information only and is not intended as an offer, or a solicitation of an offer, to buy or sell any investment or other specific product. The analysis contained herein does not constitute a personal recommendation or take into account the particular investment objectives, invest-ment strategies, financial situation and needs of any specific recipi-ent. It is based on numerous assumptions. Different assumptions could result in materially different results. We recommend that you obtain financial and/or tax advice as to the implications (including tax) of investing in the manner described or in any of the products mentioned herein. Certain services and products are subject to le-gal restrictions and cannot be offered worldwide on an unrestricted basis and/or may not be eligible for sale to all investors. All informa-tion and opinions expressed in this document were obtained from sources believed to be reliable and in good faith, but no represen-tation or warranty, express or implied, is made as to its accuracy or completeness (other than disclosures relating to UBS and its affili-ates). All information and opinions as well as any prices indicated are current only as of the date of this report, and are subject to change without notice. Opinions expressed herein may differ or be contrary to those expressed by other business areas or divisions of UBS as a result of using different assumptions and/or criteria. At any time, investment decisions (including whether to buy, sell or hold securi-ties) made by UBS AG, its affiliates, subsidiaries and employees may differ from or be contrary to the opinions expressed in UBS research publications. Some investments may not be readily realizable since the market in the securities is illiquid and therefore valuing the in-vestment and identifying the risk to which you are exposed may be difficult to quantify. UBS relies on information barriers to control the flow of information contained in one or more areas within UBS, into other areas, units, divisions or affiliates of UBS. Futures and op-tions trading is considered risky. Past performance of an investment is no guarantee for its future performance. Some investments may be subject to sudden and large falls in value and on realization you may receive back less than you invested or may be required to pay more. Changes in FX rates may have an adverse effect on the price, value or income of an investment. This report is for distribution only under such circumstances as may be permitted by applicable law.
Distributed to US persons by UBS Financial Services Inc. or UBS Securities LLC, subsidiaries of UBS AG. UBS Switzerland AG, UBS Deutschland AG, UBS Bank, S.A., UBS Brasil Administradora de Va-lores Mobiliarios Ltda, UBS Asesores Mexico, S.A. de C.V., UBS Se-curities Japan Co., Ltd, UBS Wealth Management Israel Ltd and UBS Menkul Degerler AS are affiliates of UBS AG. UBS Financial Services Incorporated of PuertoRico is a subsidiary of UBS Financial Services Inc. UBS Financial Services Inc. accepts responsibility for the content of a report prepared by a non-US affiliate when it dis-tributes reports to US persons. All transactions by a US person in the securities mentioned in this report should be effected through a US-registered broker dealer affiliated with UBS, and not through a non-US affiliate. The contents of this report have not been and will not be approved by any securities or investment authority in the United States or elsewhere. UBS Financial Services Inc. is not acting as a municipal advisor to any municipal entity or obligated person within the meaning of Section 15B of the Securities Exchange Act (the “Municipal Advisor Rule”) and the opinions or views contained herein are not intended to be, and do not constitute, advice within the meaning of the Municipal Advisor Rule.
UBS specifically prohibits the redistribution or reproduction of this material in whole or in part without the prior written permission of UBS and UBS accepts no liability whatsoever for the actions of third parties in this respect.
Version as per September 2015.
© UBS 2016. The key symbol and UBS are among the registered and unregistered trademarks of UBS. All rights reserved.
Disclaimer

Publication detailsPublisherUBS Financial Services Inc. Wealth Management Research 1285 Avenue of the Americas, 20th Floor New York, NY 10019
This report was published on 21 October 2016.
Lead authors Mark HaefeleMike Ryan
Authors (in alphabetical order)Leslie FalconioThomas FluryStephen FreedmanRicardo Garcia-SchildknechtWayne GordonMarkus IrngartingerLaura KaneDavid LefkowitzBarry McAlindenTom McLoughlinKathleen McNamaraBrian RoseDominic SchniderPhilipp SchoettlerFrank SileoGiovanni StaunovoThomas VeraguthJustin WaringJeremy Zirin
EditorsRoslyn Myers
Project Management Paul LeemingJohn Collura Matt Siegel
Desktop PublishingGeorge StilabowerCognizant Group – Basavaraj Gudihal, Srinivas Addugula, Pavan Mekala and Virender Negi

ab
©2016 UBS Financial Services Inc. All rights reserved. Member SIPC. All other trademarks, registered trademarks, service marks and registered service marks are of their respective companies.
UBS Financial Services Inc.www.ubs.com/financialservicesinc
UBS Financial Services Inc. is a subsidiary of UBS AG.
UBS House View Monthly CallA unique opportunity to hear the House View explained and to interact directly with CIO WMR’s thought leaders. The next call will be on:Thursday, November 3 at 1:00 PM ET / 10:00 AM PT
Dial in: 1-877-200-4456Passcode: 46502#
Also from CIO WMR
ab
Long-term careWhat to do now
Your Wealth & LifePersonal strategies for wealth managementCIO Wealth Management Research
Debate prep
ab
ElectionWatchPerspectives on the 2016 US elections from UBS CIO Wealth Management Research
This report has been prepared by UBS Financial Services Inc. Please see important disclaimer on page 14.
20 September 2016
As the two leading candidates prepare to face each other in their first debate, the presidential race has tightened dra-
matically. Hillary Clinton’s lead in national polls has diminished to within the ‘margin of error’ as concerns regarding her physical health have dominated the headlines. State-specific polls, which tend to be a better barometer of a can-didate’s probability of winning, also suggest a closer election. Donald Trump gained ground in two critical swing states, Ohio and Florida, dur-ing Clinton’s absence from the campaign trail.
The candidates’ personalities, and the strong feelings they elicit among the voting public, make this election unique in many respects. Both Clinton and Trump have exceptionally low ‘net favorability’ ratings. While both have ardent supporters, a greater number of voters view one or the other with distaste. And two other candidates who will not appear on the debate stage, Gary Johnson and Jill Stein, will garner enough votes to ensure that the next president is elected with far less than 50% of the popular vote.
Presidential debates have the ability to nudge undecided voters in one direction or another, but we do not expect them to alter the views of most Americans. However, they do offer a glimpse of the candidates’ governing philoso-phy and the degree to which they are ade-quately prepared for the duties of the office. We expect two public policy priorities to domi-nate the debates once again this year, namely national security and economic growth, which will be front and center in voters’ minds, as they have been so often in the past.
The two explosions in New York and New Jer-sey this past weekend, and the attack by a knife-wielding assailant in Minnesota, have reinforced the issue of national security as an
important campaign theme. In a recent poll, the Pew Research Center asked voters to iden-tify which subjects would be allocated the most amount of time if they served as a mod-erator of this year’s presidential debates. The respondents said they would devote the most amount of time to the subject of terrorism and homeland security. We expect they will get their wish.
In this month’s edition of ElectionWatch, we place this year’s presidential debates in an historical context, offering a viewer’s guide to assess the likely success of the candidates’ policies, and to discuss the impact of the elec-tion on monetary policy. We also include the first of two interviews with the Head of our US Office of Public Policy, John Savercool. This month’s interview focuses on domestic pol-icy options for the next president. A second interview on foreign policy will appear in next month’s edition.
Contents
02 Inside the Beltway
04 Managing expectations
05 Reality bites
07 Lessons learned
09 Viewer’s guide
10 Putting promises into practice
12 Monetary policy
14 Disclaimer
Video Tom McLoughlin talks about highlights in this report. Click to watch.