UAP HOLDINGS LIMITED 01 -...
108
BUSINESS REVIEW CORPORATE GOVERNANCE FINANCIAL STATEMENTS NOTES TO THE FINANCIALS ADDITIONAL INFORMATION UAP HOLDINGS LIMITED 01 Contents Business Review 02 Vision, Mission & Values 03 Corporate Information 04 Board of Directors 08 Directors of Subsidiary Companies 12 UAP Executive Mangement 16 Chairman’s Report 20 Group Managing Director’s Report 28 Sustainability and Corporate Social Responsibility Report 32 Five Year Financial Highlights Corporate Governance 34 Corporate Governance Statement 38 Notice of Annual General Meeting 39 Directors’ Report 40 Statement of Directors’ Repsonsibility 41 Report of the Independent Auditor Financial Statements 42 Consolidated Statement of Profit or Loss 43 Consolidated Statement of Comprehensive Income 44 Consolidated Statement of Financial Position 45 Company Statement of Financial Position 46 Consolidated Statement of Changes in Equity 48 Company Statement of Changes in Equity 49 Consolidated Statement of Cash flows 50 Notes to the Financial Statements Essential Reads Chairman’s Report Page 16 Group MD’s Report Page 20 Business Review Page 32 Future Outlook Page 15 Sustainability Report Page 28 Financial Statements Page 42 CORPORATE GOVERNANCE FINANCIAL STATEMENTS THE FINANCIALS Notes 2012 Kshs’000 2011 Kshs’000 Profit for the year 1,381,031 919,684 Other comprehensive income / (loss) Items that will be recycled to profit or loss Exchange differences on translating foreign operations (82,142) (31,345) Total items that will be recycled to profit or loss (82,142) (31,345) Items that will not be recycled to profit or loss Gains/(losses) on revaluation of equity investments; - - Listed ordinary shares 24 756,192 (660,941) Unlisted ordinary shares 24 18,889 816 Total items that will not be recycled to profit or loss 775,081 (660,125) Other comprehensive income for the year, net of tax 692,939 (691,470) Total comprehensive income for the year 2,073,969 228,214 Total comprehensive income attributable to: Owners of the Company 1,999,362 211,377 Non-controlling interests 74,607 16,837 Total 2,073,969 228,214 The notes on pages 50 to 106 are an integral part of these financial statements 200 400 600 800 1,000 1,200 1,400 1,600 1,800 2,000 414 2008 267 2009 790 2010 1,210 2011 1,748 2012 0 Profit Before tax (Shs M) Profit Before Tax(Shs M) 45% CAGR About us UAP Group (UAP) is a Pan-african Financial Services Group with interests in Insurance, Investment Management, Property Development and Investments, Securities Brokerage and Financial Advisory. Currently, UAP Group has 12 businesses operating in Kenya, Uganda, South Sudan, Democratic Republic of Congo and Rwanda, and is concluding a transaction to enter the Tanzania market. Better. Simple. Life CONTENTS ANNUAL REPORT & FINANCIAL STATEMENTS - 2012
Transcript of UAP HOLDINGS LIMITED 01 -...

BU
SIN
ES
S R
EV
IEW
CO
RP
OR
AT
E G
OV
ER
NA
NC
EF
INA
NC
IAL
STA
TE
ME
NT
SN
OT
ES
TO
TH
E F
INA
NC
IAL
SA
DD
ITIO
NA
L IN
FO
RM
AT
ION
UAP HOLDINGS LIMITED 01
Contents
Business Review
02 Vision, Mission & Values
03 Corporate Information
04 Board of Directors
08 Directors of Subsidiary Companies
12 UAP Executive Mangement
16 Chairman’s Report
20 Group Managing Director’s Report
28 Sustainability and Corporate Social
Responsibility Report
32 Five Year Financial Highlights
Corporate Governance
34 Corporate Governance Statement
38 Notice of Annual General Meeting
39 Directors’ Report
40 Statement of Directors’ Repsonsibility
41 Report of the Independent Auditor
Financial Statements
42 Consolidated Statement of Profi t or Loss
43 Consolidated Statement of Comprehensive
Income
44 Consolidated Statement of Financial Position
45 Company Statement of Financial Position
46 Consolidated Statement of Changes in Equity
48 Company Statement of Changes in Equity
49 Consolidated Statement of Cash fl ows
50 Notes to the Financial Statements
Essential Reads
Chairman’s Report Page 16
Group MD’s Report Page 20
Business Review Page 32
Future Outlook Page 15
Sustainability Report Page 28
Financial Statements Page 42
CO
RP
OR
AT
E G
OV
ER
NA
NC
EF
INA
NC
IAL
STA
TE
ME
NT
ST
HE
FIN
AN
CIA
LS
Notes2012
Kshs’000 2011
Kshs’000
Profit for the year 1,381,031 919,684
Other comprehensive income / (loss)
Items that will be recycled to profit or loss
Exchange differences on translating foreign operations (82,142) (31,345)
Total items that will be recycled to profit or loss (82,142) (31,345)
Items that will not be recycled to profit or loss
Gains/(losses) on revaluation of equity investments; - -
Listed ordinary shares 24 756,192 (660,941)
Unlisted ordinary shares 24 18,889 816
Total items that will not be recycled to profit or loss 775,081 (660,125)
Other comprehensive income for the year, net of tax 692,939 (691,470)
Total comprehensive income for the year 2,073,969 228,214
Total comprehensive income attributable to:
Owners of the Company 1,999,362 211,377
Non-controlling interests 74,607 16,837
Total 2,073,969 228,214
The notes on pages 50 to 106 are an integral part of these financial statements
200400600800
1,0001,2001,4001,6001,8002,000
414
2008
267
2009
790
2010
1,210
2011
1,748
20120
Profit Before tax (Shs M)
Profit Before Tax(Shs M)
45% CAGR
About us
UAP Group (UAP) is a Pan-african Financial Services Group
with interests in Insurance, Investment Management, Property
Development and Investments, Securities Brokerage and
Financial Advisory. Currently, UAP Group has 12 businesses
operating in Kenya, Uganda, South Sudan, Democratic Republic
of Congo and Rwanda, and is concluding a transaction to enter
the Tanzania market.
Better. Simple. Life
CONTENTSANNUAL REPORT & FINANCIAL STATEMENTS - 2012

This is the Annual Report of UAP Holdings Limited for the year ended 31 December 2012. The Annual Report is made available to all shareholders on UAP Holdings Limited’s website (www.uapgroup.com). The content of the company’s website and the Financial Statements should not be considered to form a part of or be incorporated into this document. This report includes names of UAP Holdings Limited’s products, which constitute trademarks or trade names which UAP Holdings Limited owns or which others own and license to UAP Holdings Limited for use In this report, the term ‘company’ refers to UAP Holdings Limited and terms ‘group’ and ‘UAP Holdings Limited’ refer to the company and its consolidated subsidiaries, except as the context otherwise requires. A glossary of terms used in this report is included at the end of the document.UAP Holdings Limited’s consolidated financial statements have been prepared in accordance with International Financial Reporting Standards (IFRS). Unless otherwise indicated, all financial information contained in this document has been prepared in accordance with IFRS.
© 2013 UAP Holdings Limited
Who We areOur mission, vision and values outline who we are, what we aim to achieve, and how we intend to achieve it.
They provide a clear direction for our company and help ensure that we are all working toward the same goals.
Our Vision
To be Africa’s revolutionary fi nancial services group.
Our MissionTo enhance quality of life by delivering peace of mind and fi nancial freedom through an exceptionally motivated team that
delivers what customers want - when and where they want it.
Our Corporate Values
• We build life long relationships
• We do what we say and say what we do
• We are a pleasure to deal with
• We are passionate about our work - and it shows!
GO ONLINE!
Visit our 2012 Annual Report &
Financial Statements at:
www.uap-group.com
Register to receive all future
shareholder communications online:
www.uap-group.com
GO ONLINEQUICK
EFFICIENTGREEN
80yrsOur origins can be traced back
over 80 years.
DR Congo Rwanda South Sudan Uganda Kenya
BU
SIN
ES
S R
EV
IEW
CO
RP
OR
AT
E G
OV
ER
NA
NC
EF
INA
NC
IAL
STA
TE
ME
NT
SN
OT
ES
TO
TH
E F
INA
NC
IAL
SA
DD
ITIO
NA
L IN
FO
RM
AT
ION
UAP HOLDINGS LIMITED 03
KENYA - BRANCHES
REGISTERED OFFICE
BISHOPS GARDEN TOWERS,
BISHOPS ROAD
P. O. Box 43013 - 00100,
Nairobi, Kenya
T: (+254 20) 2850000
F: (+254 20) 2719030
Website: www.uap-group.com
QUEENSWAY - NAIROBI
Customer Care Centre
Queensway Hse
3rd Floor Kaunda Street
P. O. Box 43013 - 00100
T: +254 20 2228070,
T: +254 20 2229521
F: +254 20 222 7659
MOMBASA
Biashara Bank Building,
Nyerere Road,
P. O. Box 81612 - 80100
Mombasa, Kenya
T: +254 041 - 2223777
T: +254 041 - 2223778
F: +254 041- 2315888
NYERI
Sohan Plaza
P. O. Box 1231 - 10100
Nyeri, Kenya
T: +254 061- 2030660
T: +254 061- 2034722
F: +254 061- 2032941
NAKURU
Prestige Mall
P. O. Box 14116 - 20100
Nakuru, Kenya
T: +254 051- 2212910
F: +254 051- 2214563
ELDORET
Kiptagich House,
Uganda Road
P. O. Box 707 - 30100
Eldoret Kenya
T: +245 053 - 2061437/8
F: +254 053 - 2061437
KISUMU
Al Imran Plaza
P. O. Box 3379 - 40100
Kisumu, Kenya
T: +254 057 - 2020119
F: +254 057 - 2024488
MERU
Mwalimu Plaza, Ground Floor
P. O. Box 3258 - 60200
Meru, Kenya
T: +254 064 - 30089
F: +254 064 - 30094
W: +254 020 - 2423190
MACHAKOS
KCB Building,
Machakos, Kenya
P. O. Box 1092 - 90100
T: +254 020 2054611
THIKA
Twin Oak Plaza - 1st Floor,
Kwame Nkrumah Road
P. O. Box 4280 01000,
Thika, Kenya
T: +254 020 2486803/4/5
KISII
Ouru Complex - Ground Floor
P. O. Box 209 40200,
Kisii, Kenya
T: +254 058-31851,
020-8075777
UGANDA - BRANCHES
HEAD OFFICE
KAMPALA HEAD OFFICE
UAP Insurance Building,
Plot 1 Kimathi Avenue
P. O. Box 7185,
Kampala - Uganda
T: +256 - 414 - 332700
F: +256 - 414 - 256388
COMMUNICATIONS HOUSE,
1ST FLOOR
P.O. Box 1610 Kampala -Uganda
T: (+256) 312 370 290
F: (+256) 414 256 388
E: fi [email protected]
JINJA
Plot 32/34 Main Street
P. O. Box 1747,
T: +256 0434 -120047
LIRA
Plot 18 Olwol Road
P. O. Box 423,
T: +256 04734 - 20616
MBARARA
Plot 23 High Street
P. O. Box 1171,
T: +256 04854 - 21422
MBALE
Plot 58 Republic Street
P. O. Box 915,
T: +256 0454 - 34568
GULU
Plot 16 Aewich Road
T: +256 0471 - 432017
ARUA
Plot 24 Avenue Road
Mobile: +256 0772903442
SOUTH SUDAN
BRANCHES
HEAD OFFICE - JUBA
UAP Plaza, Hai Cinema
Opposite Al-Sabah Children
Hospital
P.O. Box 201 Juba, South Sudan
T: +211 959 000000/977 296555
WAU
Opposite Ivory Bank
T: +211 – 955 028518,
South Sudan
NAMULE
Opposite Ivory Bank
T: +211 959 100052,
SOUTH SUDAN
YAMBIO
Opposite Yambio fm
T: +211 959 000001,
South Sudan
BENTIU
Kalibelek Market
T: +211 959 000003,
South Sudan
BOR
Marol Market
T: +211 959 100050,
South Sudan
RUMBEK
Next to police Station
opposite Freedom Square
T: +211 959 100051,
South Sudan
SERVICE PROVIDERS
BANKERS
Kenya Commercial Bank Limited.
Bank of Africa Kenya Limited.
CFC Stanbic Bank
Chase Bank.
AUDITOR
PricewaterhouseCoopers,
PricewaterhouseCoopers Tower,
P. O. Box 43963, Nairobi, 00100,
Kenya.
ACTUARIES
QED Actuaries and Consultants
(Pty) Limited,
The Place, Sandton Drive,
Sandhurst,
Sundton 2196 South Africa.
LAWYERS
Coulson Harney
Unit A, Nairobi Business Park,
Ngong Road,
P. O. Box 10643, Nairobi, 00100,
Kenya.
VALUERS
Knight Frank Kenya Ltd,
Lion Place,
P. O. Box 39773, Nairobi 00623,
Kenya.
Corporate Information
CONTACT INFORMATIONANNUAL REPORT & FINANCIAL STATEMENTS - 2012

PE
RFO
RM
AN
CE
SU
MM
AR
YB
US
INE
SS
RE
VIE
WC
OR
PO
RA
TE
GO
RV
ER
NA
NC
EA
DD
ITIO
NA
L IN
FO
RM
AT
ION
FIN
AN
CIA
L S
TA
TE
ME
NT
S
Bo
ard
of
Dir
ect
ors
SIT
TIN
G •
LE
FT
TO
RIG
HT
: C
an
dy O
kob
oi
| D
r. C
hri
s J K
iru
bi E
BS
| D
r. JB
Wa
nju
i CB
S |
Jam
es
Mu
gu
iyi
| S
usa
n O
ma
ng
a
STA
ND
ING
• L
EF
T T
O R
IGH
T:
A.K
. Ma
ina
| D
avin
de
r S
ika
nd
|
Pet
er
G. N
joka
|
Jon
as
Arm
toft
|
Jam
es
Mw
ori
a
| G
eo
rge
Od
o
| Ska
nd
er
Ou
esl
ati |
Do
mIn
ic K
iari
e
INS
ET
: L
otfi
B
acc
ou
che
| S
usa
n G
ith
uku
|
Sir. G
ord
on
Wav
am
un
no

BU
SIN
ES
S R
EV
IEW
CO
RP
OR
AT
E G
OV
ER
NA
NC
EF
INA
NC
IAL
STA
TE
ME
NT
SN
OT
ES
TO
TH
E F
INA
NC
IAL
SA
DD
ITIO
NA
L IN
FO
RM
AT
ION
UAP HOLDINGS LIMITED 05
Dr. J. B. Wanjui CBS (Chairman) 76
Dr. J.B.Wanjui, the Chairman of the Board has a long and
illustrious career in the Kenyan corporate scene, the most
prominent being the Chief Executive and Chairman of East
Africa Industries Limited (later became Unilever). He is
a graduate of Ohio Wesleyan University, (BA Physics and
Mathematics) and Columbia University, (MSC Engineering).
He is the Chancellor of the University of Nairobi and is a past
Chairman of the Board of Directors of CfC Stanbic Bank Kenya.
He is also Chairman and Board member of a number of other
Kenyan and international organisations. Dr Wanjui has been a
director of the Company since 2007. He has been a Director
of UAP Insurance Company Limited since 1986 and Chairman
of the Board of Directors since 1998. In recognition of his
exemplary service in making positive contribution in social
and commercial sectors in Kenya, President Mwai Kibaki
honoured Dr Wanjui with the prestigious Chief of the Order of
the Burning Spear (CBS) of the Republic of Kenya
Dr. Chris J Kirubi EBS (Non - Executive Director) 72
Dr. Chris J. Kirubi is a leading Kenya entrepreneur who has vast
Investments In the manufacturing, property management,
media, insurance and Investment sectors of the economy.
He is an alumnus of INSEAD Institute, France, Handles
University in Sweden and Havard Business School, USA.
He holds an honorary Masters in Business Administration
from the Swiss Management Academy. He is the Chairman
of Haco Tiger Brands Limited, The Capital Media Group,
International House Limited, Kiruma International Limited,
DHL Worldwide Express Limited, Nairobi Bottlers Limited and
Smart Applications International Limited.
He serves as Vice Chairman of Coca Cola Juices Limited and
Chairman of UAP Properties Uganda Limited. He is also a non-
executive Director in Centum Investment Company Limited,
Bayer East Africa Limited, UAP Insurance Company Limited
and UAP Insurance Uganda Limited. Dr. Kirubi is passionate
about making a difference in the lives of disenfranchised
groups and is also involved in a number of social causes and
sits on the Board of the Global Business Coalition on HIV /
AIDS, Tuberculosis & Malaria. In recognition of his exemplary
contributions to positive change in society, he has received
the following awards: Elder of the Order of the Burning Spear
of the Republic of Kenya (1999) and the National Order of
Merit medal - French Government (2004).
James Muguiyi (Non - Executive Director) 69
James Muguiyi is the immediate past Managing Director of the
Company, and the immediate past Group Managing Director.
He was previously the Managing Director of UAP Insurance
Company Limited, a position he held since 2001 and is now
a non-executive Director, following his retirement. During his
tenure as Group Managing Director, James oversaw the growth
of the Group’s business and operations in Kenya, Uganda and
South Sudan. He was also instrumental in the establishment of
new operations in Rwanda, the Democratic Republic of Congo
and Tanzania. James was responsible for the development of
the property investments business within the Group which has
seen the on-going developments in Kampala Uganda (UAP
Nakawa Business Park), Equatoria Towers, Juba South Sudan
and the iconic 31 storey UAP Towers in Nairobi.
As a promulgator of the establishment of the Group Holdings
Company, James played a crucial role in overall business
consolidation and better corporate governance. Between 1988
and 2001, as the Deputy Managing Director, he oversaw the
merger of Provincial Insurance with Union Insurance to form
UAP in 1994. James is a director of several companies in the
East African region and Chairman of the Centum Investment
Company Limited. He is a Fellow of the Institute of Certifi ed
Public Accountants of Kenya (FCPA (K)) where he was one time
the Chairman. He is also a Certifi ed Public Secretary (CPS (K))
and a Chartered Management Accountant (ACMA).
Prof. Gordon Wavamunno
(Non - Executive Director) 69
Professor Gordon Wavamunno joined the Board as non-
executive Director in 2009 and has been the Chairman
of UAP Insurance Uganda since 1988 (previously United
Assurance Company Limited). He is a prominent international
businessman who sits on several local and international boards
and is a pioneer entrepreneur in Uganda, having successfully
managed leading businesses including Spear Motors Limited,
WBS Television and Wavah Water Limited. Prof. Wavamunno
is also a recipient of several international awards including the
Knight of Justice by HM The Queen of England, a honorary
Doctorate in Business Administration (Nkumba University),
honorary Research Fellow of Makerere University Kampala
and a First Class Order of Merit of the Federal Republic of
Germany, emeritus ward from the Republic of Hungary for his
contribution to international economy and he was also included
in the International Who’s Who of USA for the year 2012.
Board of Directors’ (Biographies)
BOARD OF DIRECTORSANNUAL REPORT & FINANCIAL STATEMENTS - 2012

BU
SIN
ES
S R
EV
IEW
CO
RP
OR
AT
E G
OV
ER
NA
NC
EF
INA
NC
IAL
STA
TE
ME
NT
SN
OT
ES
TO
TH
E F
INA
NC
IAL
SA
DD
ITIO
NA
L IN
FO
RM
AT
ION
UAP HOLDINGS LIMITED06
He is the Honorary Counsel to Uganda of the Republic of
Hungary, Chancellor of Nkumba University and President of
the National Urban Forum.
James Mworia (Non - Executive Director) 35
James Mworia is the Chief Executive Offi cer of Centum
Investment Company Limited, the largest listed investment
Company in East Africa. In 2011 he was the recipient of
the Africa Young Business Leader of the year award. He
is a CFA Charter holder, an Advocate of the High Court of
Kenya, a Certifi ed Public Accountant and a Chartered Global
Management Accountant. He is a member of the CFA Institute,
Institute of Certifi ed Public Accountants of Kenya, Law
Society of Kenya and the Chartered Institute of Management
Accountants. In addition to UAP Holdings, James serves on
several Boards and committees including the Capital Markets
Authority Corporate Governance Committee and the Board of
the Central Depository and Settlements Corporation.
Philip Coulson (Non - Executive Director) 46
Philip Coulson joined the Board of UAP Holdings Limited
during the course of 2010. He is an Advocate of the High
Court of Kenya and is also a qualifi ed English solicitor. He
practices as a commercial lawyer in Nairobi with Coulson
Harney, Advocates, specialising in mergers and acquisitions.
From 1994 to 2008 he worked with Kaplan and Stratton,
Advocates. He is a member of the Law societies of Kenya and
England and Wales and is also a member of the International
Bar Association. Following the entry of the 3 major investors
and the public offer by the Company, the Group’s boards have
been reorganised and Mr Coulson will be serving the Board of
UAP Insurance South Sudan Limited.
Peter G. Njoka (Non - Executive Director) 42
Peter G. Njoka was appointed to the Board in April 2012. He is a
Managing Director at The Abraaj Group and has over 16 years’
experience in private equity and corporate fi nance in East
Africa. Peter Njoka has been at the forefront of recommending
investments and working with a number of companies across
various sectors in which Funds managed by The Abraaj Group
have participated. He is the Chairman of Deacons Kenya
Limited, a Director of Athi River Steel Plant Limited and Seven
Seas Technologies Limited, amongst other private companies.
He also represents Aureos Kenya Managers Ltd (which is now
part of The Abraaj Group) on the Board of Brookside Dairy
Limited. He holds a Bachelor of Science Degree in Mathematics
and Physics from the University of Nairobi.
Skander Oueslati (Non - Executive Director) 41
Skander Oueslati was appointed to the Board in May 2012
and is a Senior Partner with AfricInvest Tuninvest Group,
a Pan-African private equity fund manager with primary
responsibility for East Africa. He joined AfricaInvest in 2008
and prior to that was the Head of Structured Finance at BMCE
International in London. Before his work in the UK, he served
for 8 years with the International Finance Corporation (IFC)
in Washington DC. During his tenure at the IFC, Skander
Oueslati focussed on investments in telecommunications,
and infrastructure and executed IFC’s fi rst CFA denominated
bond issue in West Africa. He holds a Master’s Degree from
Massachusetts Institute of Technology (MIT) based in
Cambridge USA and Engineering Degrees from France’s Ecole
Polytechnique and Ecole Nationale de Ponts et Chausees.
Lotfi Baccouche (Non - Executive Director) 50
Lotfi Baccouche was appointed to the Board in September
2012. He is a partner at Parker Fitzgerald UK and a seasoned
insurance executive with over 25 years of professional
experience in Australia, Bermuda, Europe, Tunisia, UK and
the USA. He has worked with both the European and the
United Kingdom insurance regulators and has advised
senior management teams and boards of major insurance
companies in Europe. Lotfi Baccouche holds a Master of
Engineering in Operations Research & Industrial Engineering
from Cornell University, New York USA, and a BSc in Industrial
and Operations Engineering from the University of Michigan
USA.
Susan Nkirote Omanga (Non - Executive Director) 53
Susan is the CEO and founder of Exclamation Marketing Ltd.
She previously served in senior marketing positions at Colgate
Palmolive, Boots Kenya, Barclays Bank, and Standard Chartered.
From 2004 - 2012 she served as a non-executive Director in
the Group Board of KCB where she was also Chairman of KCB
Foundation, Director S & L Mortgages for 2 years and Director
KCB Uganda for 4 years. Susan sits on the Board of Longhorn
Publishers and Coffee Board of Kenya. She is also an advisory
board Member at the University of Nairobi’s Green Horn
Mentorship programme, a member of the Marketing Society
of Kenya, the Public Relations Society of Kenya (PRSK) and the
International Advertising Association (IAA). Susan holds an
Associate of Applied Science Degree in Business Management
from North West Community College, Powel, Wyoming and a
Bachelor of Science Degree in Business Management with a
Minor in Advertising from Rocky Mountain College in Billings
Montana.
Board of Directors’ (Biographies Continued)
ANNUAL REPORT & FINANCIAL STATEMENTS - 2012 SUBSIDIARY DIRECTORS
BU
SIN
ES
S R
EV
IEW
CO
RP
OR
AT
E G
OV
ER
NA
NC
EF
INA
NC
IAL
STA
TE
ME
NT
SN
OT
ES
TO
TH
E F
INA
NC
IAL
SA
DD
ITIO
NA
L IN
FO
RM
AT
ION
UAP HOLDINGS LIMITED 07
Board of Directors’ (Biographies Continued)
Jonas Armtoft (Non - Executive Director) 50
Jonas was appointed to the Board in March 2013 as an
additional director. Jonas is a senior investment manager
at Swedfund International AB and is currently heading the
Swedfund Regional Offi ce in Nairobi, Kenya. Jonas has a legal
background and holds a Masters of Laws degree (LLM) from
the University of Lund and a Law degree from the Queen
Mary and Westfi eld College in London. Jonas has been
working with investments and project fi nance since 1994
primarily in Kenya and Ethiopia but also in Latin America and
Eastern Europe.
Susan Wakhungu-Githuku 53(Non - Executive Director)
Susan, a former Fortune 100 Corporate Executive turned
entrepreneur, is the Founder and CEO of Human Performance
Dynamics Africa, a boutique Organizational Development
& Human Resources consulting fi rm based in Nairobi,
Kenya. Before establishing HPD Africa, Susan worked at
the Coca-Cola Company and was until December 2008 the
Eurasia & Africa Group Director for Coca-Cola University.
Prior to this role, she served as the Coca-Cola Africa Group
HR Director based in London and Johannesburg. Susan
spent 10 years working at a senior level in international non-
governmental agencies including CARE, AERC and USAID
and is knowledgeable in this sector. She is also the Founder
and Publisher of Footprints Press Limited, an independent
Kenyan based publishing house specializing in photographic
coffee table books on Africa. She holds a Master’s Degree
in Development Economics from Strathclyde University,
Glasgow, Scotland and Bachelor’s Degrees in Economics and
Psychology from St. Lawrence University, New York, USA. She
serves on the Board of Diageo - East Africa Breweries and
previously served on the Board of Kenya Women’s Finance
Trust and Zawadi Educational Trust. Susan is the Chairman of
the Remuneration and Human Resource Committee.
Dominic Kiarie (Group Managing Director) 42
Dominic Kiarie was appointed as Managing Director of UAP
Holdings Limited and Group Managing Director of the UAP
Group on 1 January 2013 having served as Deputy Group
Managing Director for the Group since August 2011. He
was appointed as an Executive Director of the Company in
September 2012. Prior to that, he worked with the British-
American Group (now Britam) for 7 years as founding Chief
Executive and Managing Director of British-American Asset
Managers. Before that, Dominic worked in the investment
banking and investment management fi elds in the United
Kingdom, South Africa and Kenya, and in various Executive
Directorship roles. He holds a Masters Degree in Finance
from the University of Cambridge (UK), a Bachelor of Science
Degree in Actuarial Science from The Sir John Cass Business
School, City University, London, a Diploma in Actuarial
Techniques and a Certifi cate in Finance and Investments
both from the Institute of Actuaries, London. He has also
attended numerous courses locally and abroad on leadership,
strategy, corporate fi nance and investments. Dominic is the
former founding Chairman of the Association of Collective
Investment Schemes of Kenya (ACIS) and a member of the
Council of the Fund Managers Association.
George Odo 46(Non - Executive Director)-Alternate
George Odo is the Managing Director of AfricInvest in East
Africa and the alternate director to Skander Oueslati. He
was appointed to the Board in May 2012 and carries over 20
years’ experience in the fi elds of fi nancial services, private
equity, venture capital, agri-business and small and medium
enterprise (SME) development. He serves on several Boards
across various sectors including Brookhouse International
School Limited Kenya, Alios Leasing Finance Zambia, Abacus
Parenteral Drugs Limited Uganda, Kiboko Enterprise Limited
Uganda, EFC MFI Tanzania, and the Danish Refugee Council
for the Horn of Africa. George Odo holds an executive MBA
from USIU/Columbia University, and a Bachelor of Commerce
degree from Rani Durgavati in India. He is a Certifi ed
Public Accountant of Kenya and holds a Partnership Broker
Accreditation from the United Kingdom.
Davinder Sikand 54(Non - Executive Director)-Alternate
Davinder is an Alternate Director to Peter Njoka in the Board.
He is a Partner – with The Abraaj Group. Currently investing
the US$381m Aureos Africa Fund primarily focused on growth
companies across Sub-Saharan Africa and the Africa Health
Fund with current commitment of US$105.4 Also managing
US$ 40 million Aureos East Africa Fund, fully invested with
14 investments across East Africa and now in exit mode.
Previously managed the Acacia Fund, a US$20 million fund for
SME’s in Kenya. Davinder has been with the company since its
inception in 2001 and has over 24 years’ experience in private
equity and investment banking gained in the United States,
Europe and East Africa. He holds an MBA from Kellogg School
of Business, Northwestern University, USA and qualifi ed with
Association of Chartered Certifi ed Accountants (UK).
SUBSIDIARY DIRECTORSANNUAL REPORT & FINANCIAL STATEMENTS - 2012

BU
SIN
ES
S R
EV
IEW
CO
RP
OR
AT
E G
OV
ER
NA
NC
EF
INA
NC
IAL
STA
TE
ME
NT
SN
OT
ES
TO
TH
E F
INA
NC
IAL
SA
DD
ITIO
NA
L IN
FO
RM
AT
ION
UAP HOLDINGS LIMITED08
The Subsidiary Directors’
Philip Coulson Peace Uwase Masozera Kamau Kuria Wainaina Kenyanjui
Joseph Lesiew Hannah Gitonga Mwangi Prof. Patrick G.O. Weke Richard Mugisha
Patrick Kanyingi Prof. Scopas Dima Lony Duop Jerim Otieno
Dr. William S Kalema Zipporah Mungai Andrew Kasirye Dr. George Mutema
James Wambugu Hon. Ngenye Kariuki Prof. Joseph Kimura Betty Ann Mboche
ANNUAL REPORT & FINANCIAL STATEMENTS - 2012 SUBSIDIARY DIRECTORS

BU
SIN
ES
S R
EV
IEW
CO
RP
OR
AT
E G
OV
ER
NA
NC
EF
INA
NC
IAL
STA
TE
ME
NT
SN
OT
ES
TO
TH
E F
INA
NC
IAL
SA
DD
ITIO
NA
L IN
FO
RM
AT
ION
UAP HOLDINGS LIMITED 09
James Wambugu (Managing Director) 47
UAP Insurance Kenya
James Wambugu joined UAP in July 2003 and has been involved
in the development of the Company’s quality management
systems, business expansion and strategy development.
He previously worked for PricewaterhouseCoopers in Kenya
and the UK, Lonrho Africa and African Lakes Corporation
in the fi elds of audit, transaction structuring and support
and risk management. He has extensive experience across
many countries in Africa. He holds an MBA and Bachelor
of Commerce degrees from the University of Nairobi and a
diploma in Advanced Management Programme (AMP) from
IESE Business School, Barcelona and Strathmore Business
School, Nairobi. He is a Qualifi ed Risk Manager (MIRM) and
a Certifi ed Public Accountant of Kenya (CPA (K)).
Prof Joseph Kimura 68
Non - Executive Director - UAP Insurance Kenya
Professor Kimura is an academician of high standing in the
region. He holds a PhD in Accounting from University of
California, Los Angeles, MBA from University of Alberta,
Edmonton, Canada and a Bachelor of Commerce from
University of East Africa. He is also a Fellow of the Institute
of Certifi ed Public Accountants of Kenya (FCPA (K). He is
currently the Dean of School of Business, United States
International University Africa and between 1999 and 2003 he
was the director/CEO of the College of Insurance. Previously
he worked with the Institute of Policy Analysis and Research,
Institute of Accountancy, Arusha, Tanzania and was the Dean
of the Faculty of Commerce, University of Nairobi. Professor
Kimura is also a director of several other prominent companies
among them BAT Kenya Limited and Development Bank of
Kenya Ltd. He is also the Chairman of NDEKA, a conservation
initiative for the Ndakaini Dam which supplies over 70% of
water to the City of Nairobi.
Betty-Ann Mboche 48
Non - Executive Director - UAP Insurance Kenya
Betty-Ann Mboche is a graduate in Accounting from Ohio
Wesleyan University, USA. She is currently the Chairperson of
Bawan Group of companies. She has worked for Bawan as an
accountant before briefl y acting as Projects Manager and later
Managing Director. During this tenure, she was instrumental
in the growth of the portfolio of the business.
Hon. Ngenye Kariuki, CBS 67
Non - Executive Director - UAP Insurance Kenya
Hon. Kariuki is a shareholder of Ngenye Kariuki & Co Ltd. stock
broking members of the Nairobi Securities Exchange (NSE).
He has a Bachelor of Commerce (Finance option) degree from
the University of Nairobi. He is a former Member of Parliament
and a Cabinet Minister in the Government of Kenya.
He is the Chairman of board of Trustees of UAP Pension Fund.
Before establishing Ngenye Kariuki & Co he worked in senior
positions in Dyer and Blair (stock brokers), Family Planning
Association and Kenya Engineering Industries. Hon. Kariuki
was the Chairman of NSE for 12 years and is a director of
many companies.
Zipporah Mungai (Managing Director) 43
UAP Insurance Uganda
Zipporah Mungai joined UAP Insurance Uganda in 2012 as
the Managing Director. She holds a MSc Finance from the
University Of Illinois at Urbana Champaign and a Bachelor’s
degree in Commerce (Insurance) from the University of
Nairobi. She is a Chartered Insurer-Chartered Insurance
Institute UK, Risk Manager- Chartered Institute of Risk
Managers UK, She has over 20 years’ experience in the
Insurance industry in the Kenya and Tanzania markets.
Andrew Kasirye (Executive Director ) 52
UAP Insurance and Properties - Uganda
Andrew Kasirye joined the Insurance Board in April 2005 and
the Properties Board in July 2008. He holds a Bachelor of Laws
degree from Makerere University and is a senior partner at
Kasirye, Byaruhanga and Company Advocates. He is a past
President of the Uganda Law Society, Vice-President of the
East Africa Law Society and a Member of Parliament of the
Buganda Kingdom. Currently, Mr. Kasirye is the Chairman
of the Uganda Retirement Benefi ts Authority of Uganda,
charged with overseeing a liberal and competitive retirement
benefi ts sector in Uganda.
Dr. William S Kalema (Non-Executive Director) 61
UAP Insurance and Properties - Uganda
Dr. William S Kalema joined the Board in April 2005 and the
Properties Board in July 2008. He is a business consultant and
Country Managing Director of BDO East Africa. Among other
roles, he is Chairman of African Agricultural Capital Limited,
a Trustee of the Shell Foundation and a Trustee of the
Investment Climate Facility for Africa. He holds Masters and
Bachelor’s degrees in chemical engineering from Cambridge
University and a Ph.D. degree in chemical engineering from
California Institute of Technology. From 1984 to 1991, he
worked as a research engineer and as a business analyst in
several divisions of the Du Pont Company based in Delaware,
USA.
Dr. George Mutema (Non-Executive Director) 48
UAP Insurance Uganda
Dr. George Mutema joined the Board in May 2012. He holds
a medical degree from Makerere University and a Ph.D. in
Biomedical Science from Marshall University, West Virginia,
USA and is a trained Oncologic Surgical Pathologist from
Memorial Sloan Kettering Cancer Center, in New York.
The Subsidiary Directors’(Biographies)
SUBSIDIARY DIRECTORSANNUAL REPORT & FINANCIAL STATEMENTS - 2012

BU
SIN
ES
S R
EV
IEW
CO
RP
OR
AT
E G
OV
ER
NA
NC
EF
INA
NC
IAL
STA
TE
ME
NT
SN
OT
ES
TO
TH
E F
INA
NC
IAL
SA
DD
ITIO
NA
L IN
FO
RM
AT
ION
UAP HOLDINGS LIMITED10
The Subsidiary Directors’(Biographies continued)
He is a partner at Southern Ohio Pathology Consultants, a
16-physician private practice in Cincinnati, Ohio. He is also a
member of the Kampala Hospital Board.
Patrick Kanyingi (Managing Director) 61
UAP Insurance South Sudan
Patrick was appointed Managing Director in July 2006. He
was previously Finance and Administration Manager, UAP
Provincial Insurance Kenya since 1991 and Company Secretary
since 2001. Prior to joining UAP he had worked for Tana and
Athi Rivers Development Authority (TARDA), the National
Irrigation Board and Githongo and Company Certifi ed Public
Accountants. Patrick is a member of the Institute of Certifi ed
Public Accountants of Kenya CPA (K) and the Certifi ed Public
Secretaries of Kenya CPS (K). He holds an MBA in Strategic
Management from Newport University, USA.
Prof. Scopas Dima (Non-Executive Director) 66
UAP Insurance South Sudan
Professor Dima is an academic of high standing in the
Eastern, Central and Southern Africa region. He holds a PhD
in Agricultural Economics from Reading University England,
UK, an MSc in Agricultural Engineering and Economics from
Makerere University Uganda and a BSc (Agric) Honours from
Makerere University, Uganda. He is currently an advisor to
the Ministry of Agriculture of the Government of Southern
Sudan. He has previously taught in various universities
including University of Juba Sudan, Makerere University
Uganda, Moi University Kenya, National University of Lesotho
and University of Namibia. Professor Dima has also worked for
various organizations and projects including being Principal
Economist, Central Cabinet Economic Committee, Kampala
Uganda; Director, Directorate of Agricultural Planning and
Statistics, Ministry of Agriculture and Natural Resources,
Equatorial Region Southern Sudan; General Manager,
Equatorial Trading Corporation Equatorial Region, Southern
Sudan, Juba. He is a director of various companies in Southern
Sudan and Uganda.
Lony Duop (Non-Executive Director) 38
UAP Insurance South Sudan
Lony Duop has a diploma in International Relations from
Sudan University of Science and Technology. He is currently
working in the offi ce of the Vice president, Government of
Southern Sudan. He has previously worked with the Southern
Sudan Government departments including Relief Assistance
for South Sudan Head Offi ce in Nairobi, Sudan Relief and
Rehabilitation Commission (SRRC)
Jerim Otieno (Managing Director) 43
UAP Life Assurance Kenya
Jerim Otieno was appointed the Managing Director of UAP
Life in October 2010. Between 2005 and 2008 he worked in
UAP Insurance in various positions where he was involved in
product innovation and systems implementation in the life
department. Subsequently, he moved to UAP Life when the life
business was spun off UAP Insurance in 2009. Prior to that, he
headed the life operations in ICEA Uganda and worked for the
Insurance Training and Education Trust and Jubilee Insurance.
He is a Chartered Insurer, holds a Diploma in Life and Disability
Underwriting from the Assurance Medical Society of London
and a Certifi cate in Pensions Administration from the World
Bank Institute. He is a graduate of the University of Nairobi
with the Bachelor of Commerce degree and a graduate of
the Advanced Management Program (AMP) of IESE Business
School Barcelona and Strathmore Business School, Nairobi.
Joseph Lesiew (Non-Executive Director) 75
UAP Life Assurance Kenya
Joseph Lesiew is a business entrepreneur and farmer based
in Eldoret. He is a life member of the Agricultural Society of
Kenya, Red Cross and the Flying Doctors. He has previously
served in the Local Government for over 18 years in
various capacities including his tenure as Mayor of Eldoret
Town during which various major business ventures were
commenced in this region. He has received certifi cations from
the Birmingham University and Strathmore Business School.
He has been involved in various community projects over the
years as the leader in institutions promoting the improvement
of education, local infrastructure and community welfare. He
is the current chairman of Kaptagat Girls High School and
St. Patrick’s High School among others and founder of the
Eldoret Special School for mentally retarded children.
Hannah Gitonga Mwangi (Non-Executive Director) 40
UAP Life Assurance Kenya
Hannah joined the Board of UAP Life in July 2011. With over
15 years’ experience as an advocate of the High Court of
Kenya, she is the proprietor of Gitonga Mwangi & Company
Advocates, a property and commercial law fi rm, and a
founding partner of Jiwe Registrars. Hannah holds a Bachelors
of Laws Degree with honours from the University of Nairobi.
She is also a practising Certifi ed Secretary and a Fellow of the
Institute of certifi ed Public Secretaries of Kenya (ICPSK). She
has been, and continues to be involved in land law reform in
the Country. Other areas of interest and involvement include
mentoring of young people and leadership development.
Prof. Patrick G.O. Weke (Non-Executive Director) 40
(Non-Executive Director - UAP Life Assurance Kenya)
Professor Weke is an academician of high standing in the
region. He holds a PhD in mathematical statistics from Harbin
Institute of Technology, China, MSc from University of Nairobi
and City University, London and a BSc in Mathematics,
Statistics and computer science from the University of
Nairobi. He is currently the Head of Actuarial Science and
Financial Mathematics Divisions at the University of Nairobi
School Of Mathematics.
ANNUAL REPORT & FINANCIAL STATEMENTS - 2012 SUBSIDIARY DIRECTORS

BU
SIN
ES
S R
EV
IEW
CO
RP
OR
AT
E G
OV
ER
NA
NC
EF
INA
NC
IAL
STA
TE
ME
NT
SN
OT
ES
TO
TH
E F
INA
NC
IAL
SA
DD
ITIO
NA
L IN
FO
RM
AT
ION
UAP HOLDINGS LIMITED 11
The Subsidiary Directors’(Biographies continued)
He sits in the Board of Trustees of the University Staff pension
Scheme and is a member of the life Insurance Council
Standing Committee on Kenyan mortality investigation. Prof.
Weke is also the coordinator of East African Universities’
Mathematics Programme. He is a member of the Institute
of Actuaries (UK), Member, Actuarial Education Network,
Member of International Biometric Society and also Member
of The Actuarial Society of Kenya (TASK).
Richard Mugisha (Non-Executive Director) 43
UAP Insurance Rwanda
Richard is the Managing Partner of Trust Law Chambers,
a leading Law Firm in Rwanda specializing in Corporate/
Commercial work, Commercial Litigation and Conveyancing.
He is the partner in charge of transactions in Energy and
Banking and Finance. Richard previously worked as the
Procurement & Policy Manager, National Tender Board of the
Republic of Rwanda. Richard holds a Masters in Laws (LLM)
from the New York University School of Law, Bachelors of
laws Degree and a Bachelors of Arts Degree from the National
University of Lesotho. He previously served as the Chairman
of the Business law Reform Commission of Rwanda, a
member of the Financial Sector Development Plan Steering
Committee, Member of the National Committee for Regional
Integration and Member of the Disciplinary Committee of the
Institute of Certifi ed Public Accountants of Rwanda. Richard is
a member of the Rwanda Bar Association and the East Africa
Law Society. He is a fellow of the Africa Leadership Initiative
and the Aspen Global Leadership Network.
Philip Coulson (Non-Executive Director) 46
Philip Coulson joined the Board of UAP Holdings Limited
during the course of 2010. He is an Advocate of the High
Court of Kenya and is also a qualifi ed English solicitor. He
practices as a commercial lawyer in Nairobi with Coulson
Harney, Advocates, specialising in mergers and acquisitions.
From 1994 to 2008 he worked with Kaplan and Stratton,
Advocates. He is a member of the Law societies of Kenya and
England and Wales and is also a member of the International
Bar Association. Following the entry of the 3 major investors
and the public offer by the Company, the Group’s boards have
been reorganised and Mr Coulson will be serving the Board of
UAP Insurance South Sudan Limited.
Peace Masozera Uwase (Non-Executive Director) 35
UAP Insurance Rwanda
Peace is a fi nance & management consultant with over 11
years’ experience in Banking, Finance, Accounting, Auditing
and Administration. Peace started her career with PwC
in Uganda where she served as an auditor for over three
years before joining the Bank of Commerce, Development
and Industry (BCDI) IN Rwanda as Head of Finance &
Administration.
The bank was later acquired by Ecobank and she stayed
on as Chief Finance Offi cer. She was seconded to Ecobank
Guinea Bissau where she served in the same capacity
before returning to Rwanda working as Finance Manager
for Kivu Watt Limited. Since leaving Kivu Watt, Peace set
up a management consulting fi rm, PAM Business Advisory,
which majors in accounting & fi nance, tax, risk management
& internal audit support as well as strategic planning. Peace
holds a Bachelors of Commerce degree (Accounting) from
Makerere University and is an ACCA Member, Certifi ed
Accountant. She is a founding member of the Institute of
Public Accountants of Rwanda (ICPAR) where she currently
serves as the Vice President of the Governing Council.
Kamau Kuria (Non-Executive Director) 52
Kamau Kuria is the Managing Director of Corporate
Transformations Limited (CTL), a strategy execution
and performance consultancy fi rm. He is a management
consultancy professional and prior to founding CTL, he held
positions as the University Secretary at Strathmore University
and as the Head of Change for Barclays Bank of Kenya Limited.
Prior to that he was the Managing Director of Quantum
Consultants Limited, an independent consultancy company
he founded in 1996. Before founding Quantum, Kamau was
a Senior Manager in the Price Waterhouse East and Central
Africa Consultancy practice. He is a member of the Institute
of Certifi ed Public Accountants of Kenya. Kamau holds a
Master’s degree in Business Administration from Concordia
University, Canada and a Bachelor’s degree in Electronic
Engineering from Essex University, UK. Following the entry of
3 major investors and the public offer by the Company, the
Group’s boards have been reorganised and Kamau is serving
as the Chairman of UAP Life Assurance Limited.
Wainaina Kenyanjui (Non-executive Director) 49
UAP Insurance and UAP Properties South Sudan
Wainaina is an entrepreneur with a demonstrated track record
of leading real estate development companies’ which focus
on development of residential and commercial buildings in
Kenya. Wainaina sits on various Boards and has previously
served as a director of the Kenya Railways Corporation for
4 years. He also served as a director of the Privatization
Commission of Kenya which presided over the privatization of
Government ownership in Safaricom Limited, one of the most
profi table companies in East Africa. Wainaina is a member
and Chairman of the Bundume Investments Company
Limited, a private equity fund in Kenya. Mr. Kenyanjui has a
commitment to professional development and maintains
affi liations with the Kenya National Chamber of Commerce
and Industry, American Chamber of Commerce in Kenya, and
Kenya Property Developers Association.
SUBSIDIARY DIRECTORSANNUAL REPORT & FINANCIAL STATEMENTS - 2012

BU
SIN
ES
S R
EV
IEW
CO
RP
OR
AT
E G
OV
ER
NA
NC
EF
INA
NC
IAL
STA
TE
ME
NT
SN
OT
ES
TO
TH
E F
INA
NC
IAL
SA
DD
ITIO
NA
L IN
FO
RM
AT
ION
UAP HOLDINGS LIMITED12
5
7
9
6
8
3 4
1 2
UAP Executive ManagementUAP Holdings
7
3 4
1 2
5 6
8
9
UAP Uganda
UAP UGANDA
1. Zipporah Mungai - MD
2. Anthony Githuka
3. Linus Letting
4. Paul Nagemi
5. Allan Mafabi
6. Paul Muhame
7. David Serunkuma
8. Deborah Maitum
9. Patrick Ndonye - CEO, UAP FS
UAP HOLDINGS
1. Dominic Kiarie - Group MD
2. AK Maina
3. Jackson Theuri
4. Carolyn Munyua
5. Gerishon Mwangi
6. Rosemary Brainerd
7. Wycliffe Obutu
8. Eric Kisaka
9. Candy O’koboi
ANNUAL REPORT & FINANCIAL STATEMENTS - 2012 EXECUTIVE MANAGEMENT

BU
SIN
ES
S R
EV
IEW
CO
RP
OR
AT
E G
OV
ER
NA
NC
EF
INA
NC
IAL
STA
TE
ME
NT
SN
OT
ES
TO
TH
E F
INA
NC
IAL
SA
DD
ITIO
NA
L IN
FO
RM
AT
ION
UAP HOLDINGS LIMITED 13
UAP Executive Management3
1
5 76
42
5 6
3 4
1 2
1
3
2
UAP INVESTMENTS
1. Anthony Mwithiga - GM
2. Joyce Gitau
3. Felistus Karanja
UAP Insurance
UAP Investments
1. James Wambugu - MD
2. Michael Oduor
3. Joseph Kamiri
4. Isaac Nzyoka
5. Agnes Mutahi
6. Rose Wahome
7. Winrose Kirima
UAP Life Assurance
1. Jerim Otieno - MD
2. Richard Marisin
3. Evans Ndirangu
4. Mwanzo Moseti
5. Wanja Kung’u
6. Samuel Aduke
EXECUTIVE MANAGEMENTANNUAL REPORT & FINANCIAL STATEMENTS - 2012

BU
SIN
ES
S R
EV
IEW
CO
RP
OR
AT
E G
OV
ER
NA
NC
EF
INA
NC
IAL
STA
TE
ME
NT
SN
OT
ES
TO
TH
E F
INA
NC
IAL
SA
DD
ITIO
NA
L IN
FO
RM
AT
ION
UAP HOLDINGS LIMITED14
UAP Executive Management
UAP South Sudan
2
4 5
3
1
UAP SOUTH SUDAN
1. Patrick Kanyingi - MD
2. Antony Mwangi
3. Kris Mbaya
4. John Kiruti
5. Nicholas Malesi
UAP Rwanda
2 3
1
4 5
UAP RWANDA
1. Pauline Wanjohi - CEO
2. John Njihia
3. Annie Nibishaka
4. Claudine Mukakibibi
5. Jackson Koome
ANNUAL REPORT & FINANCIAL STATEMENTS - 2012 EXECUTIVE MANAGEMENT

The future aheada glimpse of the 31 storey UAP Tower coming soon

BU
SIN
ES
S R
EV
IEW
CO
RP
OR
AT
E G
OV
ER
NA
NC
EF
INA
NC
IAL
STA
TE
ME
NT
SN
OT
ES
TO
TH
E F
INA
NC
IAL
SA
DD
ITIO
NA
L IN
FO
RM
AT
ION
UAP HOLDINGS LIMITED16
BU
BU
IIS
INE
NE
NS
SS
SS
RRE
VE
VIE
WC
OR
PPO
RO
RA
TA
TE
E
GO
GO
GO
GV
EV
EVV
RN
RNN
AN
AN
CE
CE
CE
CE
FI
FI
FIN
AN
ANN
AAN
CN
CCN
CN
IAIAALL
L
L
ST
ST
SSTA
TA
TA
EM
EM
EM
EM
EM
EE
NE
NE
NE
TS
TS
TS
NO
NOO
NO
TE
TE
TE
S
ST
OOT
OTT
HE
HE
FFININ
ANNN
AN
CI
CI
CCA
LA
LSSSSSSSSS
ADD
DI
DIT
IT
IT
ION
ON
ON
ON
AL
AL
AL
IINF
NFO
RRRO
RM
AM
AMM
TI
TIO
NO
NO
NO
N
UAAAAPP HOHOLDDINNNIINNGSGSGSSGG LLIMIMITTEDED11666
The Group’s profi t after tax and non-controlling interest is Shs 1,282 million. During the year, the Company paid an interim dividend of Shs 0.85 per share to its shareholders who were on the shareholders register at 30 June 2012. Based on the annual performance, the board recommends a fi nal dividend of Shs 1.50 per share.”
Dr. JB Wanjui CBS, Chairman

BU
SIN
ES
S R
EV
IEW
CO
RP
OR
AT
E G
OV
ER
NA
NC
EF
INA
NC
IAL
STA
TE
ME
NT
SN
OT
ES
TO
TH
E F
INA
NC
IAL
SA
DD
ITIO
NA
L IN
FO
RM
AT
ION
UAP HOLDINGS LIMITED 17
BU
SIN
ES
S R
EV
IEW
CO
RP
OR
AT
E G
OV
ER
NA
NC
EF
INA
NC
IAL
STA
TE
ME
NT
SN
OT
ES
TO
TH
E F
INA
NC
IAL
SA
DD
ITIO
NA
L IN
FO
RM
AT
ION
Chairman’s Statement
Introduction
I am delighted to present to you the UAP Group 2012 annual
report and fi nancial statements. We achieved signifi cant
milestones in the execution of the Group’s pan-African
expansion vision. We completed a very successful fund
raising processes which enabled us raise the necessary
capital to support the geographic and business expansion of
the Group. We increased the Group’s share capital from Shs
600 million to over Shs 5.6 billion.
UAP Holdings also became a public company with the
shareholder base of the Group increasing from 25 to over
950 shareholders. I take this opportunity to extend a special
welcome our new shareholders.
We also concluded the entry into the Rwanda and DRC markets
through the establishment of a general insurance company,
Union Insurance Rwanda Limited and an insurance brokerage
company, UAP SPRL RDC, respectively. We are at an advanced
stage of completing our entry into the Tanzania market
through an acquisition of an existing Insurance company. We
are therefore on course to double our geographic footprint
from 3 countries in 2011 to 6 countries.
Highlights
I would like to refl ect on the key aspects that shaped our 2012
fi nancial performance and provide an overview of the overall
strategic direction that the group will take going forward.
Global view of economic and business environment
More than four years after the global fi nancial crisis hit, high-
income countries continue to struggle to restructure their
economies and regain fi scal sustainability. The Global Real GDP
growth reduced to 2.3% in 2012 from 2.7% in 2011 mainly as
a result of reduced growth in the high income and developing
countries. Mature economies are still healing the scars of
the 2008-2009 crisis. But unlike in 2010 and 2011, emerging
markets did not pick up the slack in 2012. Weaknesses in
the major developed economies are at the root of the global
economic slowdown.
Most of the major developed economies, particularly those in
Europe, are trapped in a vicious cycle of high unemployment,
fi nancial sector fragility, heightened sovereign risks, fi scal
austerity and low growth. Several European economies and
the euro zone as a whole are already in recession. Euro zone
unemployment increased further to a record high of almost 12
per cent In 2012. Also, the US economy slowed signifi cantly.
Defl ationary conditions continue to prevail in Japan. The
economic woes in Europe, Japan and the United States are
spilling over to developing countries through weaker demand
for their exports and heightened volatility in capital fl ows and
commodity prices. The larger developing economies also
face home-grown problems, however, with some (including
China) facing much weakened investment demand because
of fi nancing constraints in some sectors of the economy and
excess production capacity elsewhere. Most low-income
countries have held up relatively well so far, but are now also
facing intensifi ed adverse spillover effects from the slowdown
in both developed and major middle-income countries
Africa continues to make its mark as the new frontier
of global economic growth
African economies continued to outperform the more
developed economies. The sub-saharan Africa region real
GDP grew at 4.6% in 2012 compared to 4.5% in 2011.
The GDP Growth in the Greater Eastern and Central African countries that we operate
in was relatively stronger than the rate of the Global Economic growth. The countries
that we operate in were relatively stable with Kenya (4.3%), Uganda (3.4%) South Sudan
(3%), Rwanda (7.7%), DRC (6.6%) and Tanzania (6.5%) all recording growth.
From left: former UAP Group Managing Director - James Muguiyi; Peter Njoka- Managing Director Abraal Group, Dr Joe B Wanjui CBS - Chairman - UAP Holdings Ltd; and Dr. Chris J Kirubi EBS - Non Executive Director - UAP Holdings Ltd.
CHAIRMAN’S STATEMENTANNUAL REPORT & FINANCIAL STATEMENTS - 2012

BU
SIN
ES
S R
EV
IEW
CO
RP
OR
AT
E G
OV
ER
NA
NC
EF
INA
NC
IAL
STA
TE
ME
NT
SN
OT
ES
TO
TH
E F
INA
NC
IAL
SA
DD
ITIO
NA
L IN
FO
RM
AT
ION
UAP HOLDINGS LIMITED18
This is signifi cantly higher than the global real GDP growth
of 2.3%. Major factors underpinning the continued growth
trajectory of the African economies include the strong
performance of oil-exporting countries, continued fi scal
spending on infrastructure projects, and expanding economic
ties with Asian economies.
The GDP Growth in the Greater Eastern and Central African
countries that we operate in was relatively stronger than the
rate of the Global Economic growth. The countries that we
operate in were relatively stable with Kenya (4.3%), Uganda
(3.4%) South Sudan (3%), Rwanda (7.7%), DRC (6.6%) and
Tanzania (6.5%) all recording growth. This growth presents
a signifi cant opportunity for continued expansion of our
businesses.
Overall performance
The Group continues to record growth in revenues and
profi tability from both its core insurance operations and the
related fi nancial services, including investment in property.
The Group recorded a 25% growth in total insurance premium
from Shs 7.2 billion to Shs 9.1 billion. Total income increased
by 40% from Shs 6.8 billion to Shs 9.5 billion. Profi t before tax
increased by 44% from Shs 1.2 billion to Shs 1.7 billion. Our
core insurance operations continue to be very profi table. This
profi tability has been complemented by good performance of
our investment portfolios which indicates that the business
diversifi cation strategy that we have implemented continues
to benefi t our shareholders.
The Group’s total comprehensive income increased from Shs
228 million to Shs 2.1 billion after taking into account the
fair value gains on our general business equity investment
portfolios which are classifi ed at fair value through other
comprehensive income. This was a 45% return on opening
shareholders’ funds.
From a segmental perspective, our general insurance business
insurance gross premiums grew by 23% from Shs 6.6 billion
to Shs 8.1 billion whilst the Life Assurance gross premiums
grew by 44% from Shs 634 million to Shs 916 million. Total
income from our new property segment increased by 60%
from 281 million to Shs 450 million following the completion
of the UAP Nakawa Business Park in Kampala.
Old property developments in the group continue to be carried
as part of investment portfolios of the respective insurance
businesses. The Group’s net assets increased from Shs 4.7
billion to Shs 11.6 billion as a result of the good fi nancial
performance during the year and the capital injection during
the year.
Governance and board performance
Your board has continued to discharge its duties diligently
with the support of the company’s subsidiary company
boards. All the boards effectively carried out their board work
plan for 2012 in accordance with the board charter and work
plan for each board.
In recognition of the increased complexity of the Group’s
business, 7 new directors joined the UAP Holdings board. The
new directors include Dominic Kiarie, UAP Group Managing
Director; Peter Njoka, a partner at Aureos Kenya; Skander
Oueslati, a senior partner at AfricInvest Tunivest Group;
Jonas Armtoft, Senior Investment Manager, Swedefund
International AB; Lotfi Baccouche, senior partner-Insurance
Markets at Parker Fitzgerald, UK; Susan Omanga, CEO of
Exclamation marketing Limited and Susan Wakhungu-
Githuku, CEO of Human Performance Dynamics Africa. The
new directors bring a signifi cant wealth and diversity of skills
and experience to your board of directors which will come
in handy as we execute the next phase of growth in the
company’s business. The profi les of the new directors are set
out on page 5.
Chairman’s Statement (Continued)
Toasting to UAP OTC market launch: From left, Dominic Kiarie - Dr Joe B Wanjui CBS, Paul Muthaura, James Muguiyi and Phillip Coulson.
ANNUAL REPORT & FINANCIAL STATEMENTS - 2012 CHAIRMAN’S STATEMENT

BU
SIN
ES
S R
EV
IEW
CO
RP
OR
AT
E G
OV
ER
NA
NC
EF
INA
NC
IAL
STA
TE
ME
NT
SN
OT
ES
TO
TH
E F
INA
NC
IAL
SA
DD
ITIO
NA
L IN
FO
RM
AT
ION
UAP HOLDINGS LIMITED 19
We have also embarked on a project to review and modernise
our board charter for UAP Holdings and all its subsidiary
undertakings to take into account global best practices in
order to prepare UAP Group to become a major international
player in the fi nancial services industry. Your board recognises
that UAP Group is now a multinational Group growing out
of Africa and hence needs to adopt international governance
best practices at board level in addition to management best
practices in order to become a successful global company.
All the directors have been provided with relevant training on
corporate governance. More details on the operations of the
board is provided in the statement on Corporate governance
on page 34.
Results and dividends
The Group’s profi t after tax and non-controlling interest is Shs 1,282
million. During the year, the Company paid an interim dividend of
Shs 0.85 per share to its shareholders who were on the shareholders
register at 30 June 2012. Based on the annual performance, the
board recommends a fi nal dividend of Shs 1.50 per share. The
total dividend payout for the year will therefore be Shs 2.35 per
share (2011: Shs 1.7 per share) amounting to Shs 419,130 (2011;
Shs 204,000). This is based on your board’s assessment that we
need to continue providing a cash return to our shareholders while
retaining enough resources in the business to fund expected growth.
Therefore Shs 863 million will be retained in the business for this
purpose.
Future prospects and strategy
The continued growth in the Sub-saharan African region that we
operate in provides a good opportunity for our business to grow. We
have aligned our pan-African expansion strategy to take advantage
of the emerging opportunities in the region. We will therefore
continue to expand our operations across Africa. Towards this, we
have commenced the process of evaluating and prioritising the next
phase of future geographical markets that we intend to expand
to. Our core business will remain insurance and related fi nancial
services, including property investments.
We will continue to expand our full range of products and services
across all the markets that we operate in. We have also set up an
investment management company in Kenya, UAP Investments and
have staffed the company with very talented individuals to not only
enhance the management of our internal investment portfolios, but
to also offer innovative investment solutions to our customers.
We are in the process of obtaining an operating license for this
business from the Capital Markets Authority. We will continue with
the development of our fl agship property developments in Kenya
(UAP Tower) and South Sudan (Equatoria Tower). Our property
development in Uganda was substantially complete by end of 2012
and we are in the process of letting offi ce space to interested parties.
We will continue to continuously review our operating structure and
processes as part of continuous improvement. Our goal is to ensure
that we continue to provide world class services to our customers
and other stake-holders.
We also continue to build a team to support the growth strategy
that we have in place. Towards this goal, we launched a graduate
management trainee programme in early 2013 which is geared
towards growing leaders for current and future UAP businesses. This
programme has been implemented across all the markets that we
operate in.
Appreciation
I would like to thank our shareholders for their continued support,
my fellow directors for their wise counsel and the Management and
staff for their hard work that is taking our Group forward.
I would also like to record special thanks to Mr James Muguiyi, the
immediate former Group Managing Director of UAP Holdings, who
retired at the end of 2012. James has been with UAP for over 30
years and led the group through a period of signifi cant growth
and achievement. James remains part of the UAP family as a non-
executive director of UAP Holdings and a number of our subsidiaries.
As part of the Group’s succession planning, James has been working
with his successor, Dominic Kiarie for the last 1 1/2 years. Having
interacted with Dominic, I have no doubt that he will be able to lead
the UAP Group Management Team through the next phase of its
growth.
Dr. JB Wanjui CBS
Chairman
26 April 2013
Chairman’s Statement (Continued)
Flexing muscles: UAP staff during a Sports day event
CHAIRMAN’S STATEMENTANNUAL REPORT & FINANCIAL STATEMENTS - 2012

BU
SIN
ES
S R
EV
IEW
CO
RP
OR
AT
E G
OV
ER
NA
NC
EF
INA
NC
IAL
STA
TE
ME
NT
SN
OT
ES
TO
TH
E F
INA
NC
IAL
SA
DD
ITIO
NA
L IN
FO
RM
AT
ION
UAP HOLDINGS LIMITED20
UB
US
IS
INE
NE
SS
SS
RRE
VE
VIE
WWC
OOOOC
OR
PR
PRR
OR
OA
TE
GO
VEE
RN
RN
AN
CE
CE
FI
FIN
AN
AN
CN
CIAIA
L S
TA
TE
ME
ME
NE
NT
SSST
SN
OOT
ET
ET
SS T
OT
OTT
HE
HE
FFININN
AN
ANN
AN
CI
CI
CI
CA
LA
LA
LSSS
DA
DD
IDD
TI
TI
NO
NO
NO
AL
AL
AL
AL
IINF
NFO
RO
RM
AM
AM
AT
IT
ION
ON
O
UAUAUAAPPPP HOHOLDL INGS LIMITEDD222000
During the year, the Group successfully completed a capital raising of US$ 55 million (Kshs 4.7 billion) from 3 private equity investors and an additional US$ 9 million (Kshs 750 million) through a Public Offer of UAP shares which closed in December 2012 with a 130% subscription.
Dominic Kiarie, Group Managing Director

BU
SIN
ES
S R
EV
IEW
CO
RP
OR
AT
E G
OV
ER
NA
NC
EF
INA
NC
IAL
STA
TE
ME
NT
SN
OT
ES
TO
TH
E F
INA
NC
IAL
SA
DD
ITIO
NA
L IN
FO
RM
AT
ION
UAP HOLDINGS LIMITED 21
BU
SIN
ES
S R
EV
IEW
CO
RP
OR
AT
E G
OV
ER
NA
NC
EF
INA
NC
IAL
STA
TE
ME
NT
SN
OT
ES
TO
TH
E F
INA
NC
IAL
SA
DD
ITIO
NA
L IN
FO
RM
AT
ION
Group Managing Director’s Report
I am delighted to present to you a review of the Group’s
performance and operations during the year 2012.
Strong Performance
Despite a challenging business environment, the performance
of the Group was strong with the highest level of the revenues
and profi tability achieved to date. In particular:
• Gross insurance premium revenue was up 25% to
Kshs 9.1 billion from Kshs 7.2 billion.
• Total income increased by 40% to Kshs 9.5 billion from
Kshs 6.8 billion.
• Total insurance business contribution increased to
Kshs 2 billion.
• Total assets were up 70% to Kshs 24.6 billion.
• Profi t before tax increased by 44% to Kshs 1.75 billion.
• Earnings per share increased by 34% to Kshs 9.83 per
share from Kshs 7.35 per share in 2011.
As a result of the strong performance and enhanced balance
sheet, the dividend payout increased by 55% with the
dividend per share increasing by 38% from Kshs 1.70 per
share in 2011 to Kshs 2.35 per share in 2012. During the last
5 years, the Group has achieved a 25% compounded annual
growth rate (CAGR) in gross insurance premium revenues,
while total income grew at 32% CAGR over the same period.
The above performance has been driven by enhanced and
prudent underwriting of insurance risks, robust investment
strategy and control of expenses.
It also re-affi rms that our business and geographical
diversifi cation strategy, which was supported by the capital
raised in 2012, is yielding positive benefi ts. However,
Management team will continue to enhance execution of the
corporate and business unit’s strategies to continue delivering
strong and sustained growth in revenues and earnings in
future.
Integrated Financial Services Group
The transformation of the UAP Group from a general insurance
underwriter to an integrated pan-African Financial Services
Group, a journey which begun over 8 years ago, is on track.
During the last 18 months, the execution of the pan-African
expansion strategy has been accelerated with entry into the
Rwanda and Democratic Republic of Congo (DRC) markets
completed during the year. Currently, the Group is in the fi nal
stages of entering the Tanzania market.
In December 2011, the Group Board approved a 3 year
corporate strategy which provided clarity on areas of business
focus, growth into new markets and leveraging of synergies
amongst all subsidiary companies. The key areas of business
focus for the Group is in 3 key segments of the fi nancial
services industry: Insurance, Investment Management and
related Financial Services, including Property Investments and
Developments. The focus for our insurance business includes
general insurance (property and casualty insurance), medical
insurance and life insurance and savings.
Currently, the Group owns 11 subsidiaries operating in the 5
markets which we currently have a presence i.e. Kenya, Uganda,
South Sudan, Rwanda and DRC.
20%
40%
60%
80%
100%
120%
140%
0%
2012 growth (%)
5 years CAGR (%)
25% 25%
41%32%
10%16%
8%
41%
52%45%
121%
58%
Gross written
premium
growth
Investment
and other
income
growth
Total income
growth
Insurance
business
contribution
to profit
General
insurance
underwriting
profit growth
Profit before
tax
OUR OUTLINED KEY PERFORMANCE HIGHLIGHTS
GROUP MD’S STATEMENTANNUAL REPORT & FINANCIAL STATEMENTS - 2012
BU
SIN
ES
S R
EV
IEW
CO
RP
OR
AT
E G
OV
ER
NA
NC
EF
INA
NC
IAL
STA
TE
ME
NT
SN
OT
ES
TO
TH
E F
INA
NC
IAL
SA
DD
ITIO
NA
L IN
FO
RM
AT
ION
22
The subsidiaries which transact insurance business companies
are 5, Investments 3, Property 3 and one insurance brokerage in
DRC.During 2012, we incorporated a wholly-owned investment
management subsidiary, UAP Investments, which will provide
fund management and investment advisory services to
the Group’s businesses and third party clients. As a Group
with a core focus in insurance business, it is critical that we
develop strong capabilities in investment management to be
able to deliver strong returns on all investment portfolios for
our operating subsidiaries. An initial team has been recruited
together with a General Manager, and we are now awaiting
the issuance of a license by Capital Markets Authority in order
to commence operations.
The Group has a core focus on property developments and
investments as part of the Group’s Investment Strategy. A key
plank of this strategy is to achieve diversifi cation amongst key
asset classes and ensure a balanced and optimal investment
portfolio. Property, as an asset class, delivers strong and stable
returns and acts as a hedge against infl ation. Currently, the
Group’s is undertaking 3 landmark property developments
in Kenya, Uganda and South Sudan at different stages of
completion. Going forward, a comprehensive Real Estate
Strategy is being put together to ensure the Group takes
advantage of strong opportunities in key segments of the
property market including commercial, industrial, housing,
hotel developments, amongst other. A strong structure is being
put together to ensure effi cient execution of the real estate
strategy and deliver on the both the development side and
funding for potential future projects.
The Group has exposure to stockbroking business through
UAP Financial Services, a business based in Kampala, Uganda,
which was acquired in end of 2010. UAP Financial Services has
a seat on the Uganda Securities Exchange and is licensed by
the Capital Markets Authority. The Management team has
been implementing a turn-around strategy approved by the
Board to refocus the business to both stockbroking and fund
management opportunities in Uganda. Stockbroking business
is complementary to the fund management business and the
intention is to carefully review opportunities of establishing
stockbroking business in markets where we have an established
fund management operations. As we pursue the execution
of an integrated Financial Services model, where customers
will consider UAP as a one-stop-shop for all their fi nancial
services needs, we are strengthening our relationships with
key banks in all markets which we are operating. We believe
that over the long term a potential partnership with a bank
to take advantage of Bancassurance opportunities can be
strengthened through acquisition of a strategic stake in
a bank with a regional presence. We therefore continue
to review potential acquisition opportunities and hope to
conclude a transaction in the next 12 months.
Strategy in Action
The leadership team continues to ensure effi cient execution
of the Group’s corporate strategy and the operating
subsidiaries’ business unit strategies to deliver on the
commitments made and business objectives.
During the year, we focused on 3 new market entries as
part of the Group’s strategy to enter one new geographical
market every 18 months. We obtained an operating licence
to enter Rwanda in August 2012 and began operations in
November 2012, while in December 2012 we obtained a
license to transact insurance brokerage business in DRC.
We are currently in the fi nal stages of setting up in DRC and
intend to commence operations shortly. We also worked on
an acquisition opportunity to enter the Tanzanian market and
are currently in the fi nal stages of closing the transaction.
The Group Management, working with the leadership teams
of the various subsidiaries, have worked to refocus each of the
operating subsidiary and to ensure alignment and leverage
of synergies. Key focus has been on the turn-around of the
Life Insurance business in Kenya and Uganda by developing
strong capabilities in individual life distribution, operational
effi ciencies and enhancing the product range; refocus of the
UAP Financial Services business in Uganda to take advantage
of emerging opportunities in fund management and
stockbroking; and setting up of a Life Insurance operation for
UAP Insurance South Sudan to begin offering life insurance
products and services in the South Sudan market.
During the year, the Group successfully completed a capital
raising of US$ 55 million (Kshs 4.7 billion) from 3 private
equity investors and an additional US$ 9 million (Kshs 750
million) through a Public Offer of UAP shares which closed in
December 2012 with a 130% subscription.
ANNUAL REPORT & FINANCIAL STATEMENTS - 2012 GROUP MD’S STATEMENT

BU
SIN
ES
S R
EV
IEW
CO
RP
OR
AT
E G
OV
ER
NA
NC
EF
INA
NC
IAL
STA
TE
ME
NT
SN
OT
ES
TO
TH
E F
INA
NC
IAL
SA
DD
ITIO
NA
L IN
FO
RM
AT
ION
UAP HOLDINGS LIMITED 23
The capital raised has strengthened the Group’s balance sheet
while laying a stronger foundation for strong and sustainable
growth of the Group’s businesses.
As part of managing cost and leveraging synergies, the
Group operates a Shares Services Centre which ensures
that common services required by the operating subsidiaries
are provided centrally and not replicated in each company.
During the year, concerted efforts were made to streamline
key support functions to enhance delivery of services. These
included Actuarial, Risk & Compliance, Internal Audit and
Legal Services. A comprehensive review of the Information
and Communication Technology (ICT) function is being
carried out to ensure the function is strongly positioned to
support the Group’s businesses in all key areas.
A review of the Human Resource function is underway
to ensure it is strengthened to deliver on the Group’s HR
strategy of recruiting, developing and retaining talent and
being the employer of choice in all the markets we operate in.
The Group Marketing and Corporate Affairs function is also
being streamlined through recruitment of dedicated resource
to support the function.
Leveraging on key IT platforms and applications is critical in
driving strong operational effi ciency and therefore delivering
high levels of customer service. During the year, an Enterprise
Resource Planning (ERP) system, Microsoft Dynamics,
was commissioned. Certain challenges were experienced
during the implementation; however, key learnings will be
incorporated in future deployment of IT systems. The ERP
system, which currently has three modules for fi nancial,
customer relationship management and human resources, is
expected to enhance operational effi ciencies in the three core
functions.
Currently a strategic review is being carried out on the core
insurance application systems to ensure that the systems are
adequate to support the growing businesses in the medium
to long term.
The execution of the 3 landmark real estate developments in
Kenya, Uganda and South Sudan is on track with expected
completion in May 2013 for UAP Nakawa Business Park in
Kampala, Uganda and UAP Apartments in Juba, South Sudan.
In 2011, UAP Properties was set up as separate business
unit of the Group to provide focus and scale in real estate
developments. Prior to that, property developments and
investments were held on the balance sheet of the insurance
subsidiaries, which constrained the scale and scope of future
developments. Each property development is under a Special
Purpose Vehicle (SPV) domiciled in the country where the
development is taking place.
In Kenya, UAP Properties Kenya is the developer to UAP
Tower, a 31 storey landmark commercial development in the
Upper Hill area of Nairobi. The development has progressed
reasonably well with on-going engagement of the entire
team of consultants and main contractor to ensure successful
completion of the project.
In Uganda, UAP Properties Uganda is the developer to UAP
Nakawa Business Park, an 8 storey of 4 towers commercial
development. During the year, we substantially completed the
development, currently the largest business park in Kampala,
Uganda. Final completion is expected in May 2013 and we
are currently fi nalising engagement with prospective tenants.
In South Sudan, UAP Properties South Sudan is the developer
of UAP Equatoria Tower, a 15 storey commercial development
in Juba, South Sudan. Signifi cant progress was made on the
development despite initial challenges of mobilization which
has now been fully resolved. The development is expected
to be substantially completed in October 2013 with fi nal
completion following fi t outs expected by end of 1st quarter
2014.
The above property developments are expected to contribute
additional income to the Group and provide additional
diversifi cation of the Group’s revenues.
Segmental Performance
General Insurance
Currently, UAP operates stand-alone and composite insurance
companies transacting general insurance business in Kenya,
Uganda, South Sudan and Rwanda. The Uganda business is a
composite insurer but currently going through a demerger of
the Life Insurance operations as required by regulations. This
demerger is expected to be completed before end of 2013.
The Group Managing Director’s Report(Continued)
GROUP MD’S STATEMENTANNUAL REPORT & FINANCIAL STATEMENTS - 2012

BU
SIN
ES
S R
EV
IEW
CO
RP
OR
AT
E G
OV
ER
NA
NC
EF
INA
NC
IAL
STA
TE
ME
NT
SN
OT
ES
TO
TH
E F
INA
NC
IAL
SA
DD
ITIO
NA
L IN
FO
RM
AT
ION
UAP HOLDINGS LIMITED24
The Group’s general insurance businesses performed reasonably well with 23% growth in gross written premiums. UAP
Insurance Kenya contributed Kshs 5.93 million or 73% of total general insurance premiums of Kshs 8.14 billion.
The growth of the general insurance business was driven mainly by prudent underwriting, roll-out of innovative products and
services, and enhanced customer service.
During 2012, our insurance businesses in Kenya and Uganda won industry awards namely General Insurer of the Year Award and
Best Insurance Service Provider of the Year Award respectively.
The key performance highlights of our insurance business are set out below:
GROSS INSURANCE PREMIUM REVENUE UNDERWRITING PROFIT
General Insurance
2012
Shs’000
2011
Shs’000 % Growth
2012
Shs’000
2011
Shs’000 % Growth
UAP Kenya 5,925,796 4,715,514 26% 561,882 501,225 12%
UAP Uganda 1,382,030 1,272,604 9% 66,351 121,628 -45%
UAP South Sudan 827,333 630,543 31% 61,208 17,099 258%
UAP Rwanda 6,498 - - 1,098 - -
Total general insurance 8,141,657 6,618,661 23% 690,539 639,952 8%
Life Insurance
Life Insurance business is currently carried out in Kenya by UAP Life Assurance and in Uganda through UAP Insurance Uganda.
A key focus during the year was the turn-around of the life Insurance business and enhancing its core capabilities in order to
compete effectively in the market. The performance of the Group Life Insurance business was good; however, more effort will
be made to strengthen the core capabilities of the Individual Life business by enhancing the distribution capabilities, operations
and product range.
The Life Insurance operations of UAP Insurance Uganda will be demerged in line with Ugandan insurance regulations which
require separation of life and general insurance business. A Working Group was formed in 2012 to facilitate the demerger
process and has made progress on the process. We expect the entire process to be fully completed by the end of the year with
the life insurance company operating as a stand-alone entity.
Efforts are being made to continue refocusing the life insurance operations and ensure critical mass is developed quickly. These
include development of new profi table products, enhancement of client services, development of strong distribution capabilities,
amongst others.
The Kenya Life Insurance business contributed 82% of the total life insurance gross premiums. Plans are underway to establish
fully-fl edged life insurance operations in South Sudan and Rwanda.
The Group Managing Director’s Report(Continued)
ANNUAL REPORT & FINANCIAL STATEMENTS - 2012 GROUP MD’S STATEMENT

BU
SIN
ES
S R
EV
IEW
CO
RP
OR
AT
E G
OV
ER
NA
NC
EF
INA
NC
IAL
STA
TE
ME
NT
SN
OT
ES
TO
TH
E F
INA
NC
IAL
SA
DD
ITIO
NA
L IN
FO
RM
AT
ION
UAP HOLDINGS LIMITED 25
Outlined below is the performance of the life insurance business:
GROSS PREMIUM REVENUE PROFIT BEFORE TAX
Life Assurance
2012
Shs’000
2011
Shs’000 % Growth
2012
Shs’000
2011
Shs’000 % Growth
UAP Life Kenya 749,879 455,093 65% 245,645 (336,160) 173%
UAP Life Uganda 165,879 179,386 -8% (22,217) (1)
Total Life Assurance 915,758 634,479 44% 223,428 (336,161) 166%
Investment Management
The Group’s Investment Management business is carried out
through UAP Financial Services in Uganda. As outlined above,
we have also incorporated an investment management
subsidiary in Kenya, UAP Investments Limited. We are in
the process of obtaining a fund management license from
the Capital Markets Authority (CMA) in order to commence
operations in Kenya. UAP Investments will leverage on
opportunities in the market to provide a range of investment
products and services across all markets which UAP Group is
operating.
During the year, we re-organized UAP Financial Services
and injected additional capital in the business and we are in
the process acquired a controlling interest in the business.
Consequently, UAP Financial Services is now a subsidiary
of UAP Holdings. We intend to re-launch this business to
take advantage of the signifi cant opportunities in Uganda’s
Financial Services industry.
Investment management business recorded a loss of Kshs 27
million in our 2012 fi nancial statements. This is mainly as a
result of initial set up costs of the business and costs of setting
up critical resources and systems to place the business on a
strong platform for future growth and profi tability.
Property Investments and Development
In 2012, we substantially completed the development of UAP
Nakawa Business Park (a development of 4 8-storey blocks
of prime offi ce space), the largest business park in Kampala,
Uganda. We also progressed the development of property
projects in Nairobi, 31-storey UAP Tower, and in Juba, 15-storey
Equatoria Tower, which will be the largest commercial
development in Juba. Equatoria Tower and UAP Tower will be
completed in early 2014 and early 2015 respectively.
When complete, these land mark properties will have a lettable
space of over 650,000 square feet and will provide further
diversifi cation to the Group’s income streams. In addition, the
UAP Properties arm will continue identifying other suitable
opportunities to add value to the property market in all the
countries that we operate in, including improvements to our
current property portfolio.
Our property business contributed Kshs 427 million (2011; Kshs 280 million) to our profi t before tax.”
Operating Performance
Customer Experience
We place a huge emphasis on the level of our customer
experience. Our philosophy is that customers are willing to pay
for competitively priced products and services which deliver
value. Our view is that the rate undercutting experienced in
the general insurance industry is not sustainable over the long
term. We therefore continue to invest heavily in improving our
customer service experience. Key initiatives implemented in
this regard include development of innovative products and
services, enhancing operational effi ciency to deliver strong
customer service, amongst others.
During the year, we launched three new medical insurance
product; Afya Imara County, Afya Imara Seniors and Afya
Imara Junior in response to customer demands for solutions
currently not being offered by the market to certain segment
of the population. In addition, we continue to enhance and
simplify a number of our insurance solutions to make them
easier for our customers.
The Group Managing Director’s Report(Continued)
GROUP MD’S STATEMENTANNUAL REPORT & FINANCIAL STATEMENTS - 2012

BU
SIN
ES
S R
EV
IEW
CO
RP
OR
AT
E G
OV
ER
NA
NC
EF
INA
NC
IAL
STA
TE
ME
NT
SN
OT
ES
TO
TH
E F
INA
NC
IAL
SA
DD
ITIO
NA
L IN
FO
RM
AT
ION
UAP HOLDINGS LIMITED26
To enhance the delivery of our products nationally, we have
increased our branch network and enhanced our distribution
model across our markets in Kenya, Uganda, South Sudan
and Rwanda. We have also spent considerable time and
resources supporting our intermediary partners with training
and support in order to assist them reach more clients.
Through our innovation center, we are constantly looking for
ways to improve delivery of our solutions to our customers.
We are currently working on revamping our mobile phone
distribution platform for SalamaSure, to deliver more products
and services and enhance choices to our customers.
To improve on the level of customer experience, we have
invested in a new Customer Relationship Management (CRM)
system which was commissioned in February 2012. Coupled
with our paperless offi ce which is now fully established
we should see not only more effi ciency but a signifi cant
Improvement in our customers’ experience. We shall continue
listening to our customers and investing to improve their
experience.
Expenses Management
We continued the rollout of various initiatives to enhance
effi ciency of our operations including use of shared services,
paperless offi ce and simplifi cation of processes to remove
wastage. These initiatives contributed positively to the
execution of our strategy on management of expenses, and
resulted in cost savings without compromising on the quality
of our business controls and customer experience.
Our People
We believe that our people are a key pillar to the successful
execution of our group strategy. Talent management is
therefore a key area of focus by the Group’s Board and
Management. Many of our managers and staff have received
high quality training both locally and overseas through our
elaborate training plan for all staff. We have also developed
and roll-out a performance management system that sets
key performance benchmarks which when achieved result in
enhancement of business performance and reward to staff
aligned to the performance achieved. We shall continue to
invest in our people to ensure they achieve their maximum
potential whilst working for the UAP Group. In early 2013, we
launched a Graduate Development Program (GDP) which
involves recruitment of new graduates from universities in
all the markets we operate in and putting them through an
accelerated 18-months development programme.
We are also fi nalising the development of a Management
Development Programme (MDP) and a Leadership
Development Programme (LDP) for UAP Staff.
Key Achievements
We continued to record various achievements with some of
the highlights in 2012 being;
• We maintained our upgraded management system
during the year and maintained certifi cation to the
higher ISO 9000:2008 standard in Kenya. The Uganda
business ISO certifi cation was also maintained.
• In Kenya, we retained our strong credit rating; AA-
by Global Credit Rating (GCR), which is the highest
rating in the region on which our customers should
draw confi dence. Our Uganda business retained its
strong A+ rating whilst in South Sudan, we retained a
strong A- rating on claims payment ability from Global
Credit Rating and we remain the only rated insurance
Company in South Sudan.
I would like to highlight the following awards that the UAP
teams across the region won during the year 2012:
1. Kilimo Salama, our weather index insurance product, won
the Technology in Sustainable Finance Award during the
2012 Financial Times/International Finance Corporation
Sustainable Finance Awards held in London.
2. Development of mobile telephony distribution in Africa
as a result of our Salamasure insurance cover.
3. UAP Insurance Uganda won Best Insurance Service
Provider of the Year award during the 2013 Uganda
Responsible Investment Award. This was in recognition
of our contribution towards the attainment of United
Nations (UN) Millennium Development Goals in Uganda
and promoting and upholding International Best
Practices and Standards.
4. Our Kenya Insurance Business won the following awards
during the Kenya Best Insurance Company Awards:
• Winner of General Insurer of the Year Award
• Winner of ICT User of the Year Award
• 2nd Runners-up- Medical Underwriter of the Year
These awards demonstrate UAP team’s commitment to
continuously improving our customer experience.
The Group Managing Director’s Report(Continued)
ANNUAL REPORT & FINANCIAL STATEMENTS - 2012 GROUP MD’S STATEMENT

BU
SIN
ES
S R
EV
IEW
CO
RP
OR
AT
E G
OV
ER
NA
NC
EF
INA
NC
IAL
STA
TE
ME
NT
SN
OT
ES
TO
TH
E F
INA
NC
IAL
SA
DD
ITIO
NA
L IN
FO
RM
AT
ION
UAP HOLDINGS LIMITED 27
The Group Managing Director’s Report(Continued)
Leadership Transition
On 31 December 2012, Mr. James Muguiyi retired as the
Group Managing Director after giving distinguished service to
the Group for over 30 years. However, he continues to serve
the Group in various capacities as a non-Executive Director.
On behalf of the management team, I would like to pay
tribute to the support, guidance and immense contribution
he has made to the business over the years.
I was humbled and honoured when the Board gave me the
opportunity to serve the Group as the next Group Managing
Director effective 1 January 2013. No doubt, the task ahead
of us is immense, however, I am very committed to ensuring
we build an outstanding pan-African Financial Services Group
that is second to none in pursuit of our vision of being the
most revolutionary Financial Services Group in Africa. I look
forward to working with the entire leadership team, both
management and the Board, to make this vision a reality and
to deliver outstanding value to all our shareholders.
Future Prospects and Strategic Initiatives
We see exciting opportunities to grow our business in all the
markets that we operate in. In particular we will continue to
take advantage of the comparatively higher growth in key
markets in Africa by continuing to expand our business to
such markets.
We have put in place a process of continuously evaluating
geographical markets that the UAP Group should expand to
in the next fi ve years. We also have in place a robust strategic
plan that not only identifi es the criteria for entering each
market, but also sets out the time frames and resources
required for each market. We plan to complete our entry into
the Tanzania market by May 2013 through an acquisition of
an existing insurance business.
We will also continue investing in system and process
improvements to enhance our customer experience and also
ensure that we continue to operate effi ciently.
The key focus in the fi rst part of 2013 will be the integration of
new businesses in Rwanda, DRC and Tanzania into the group,
including the streamlining and simplifi cation of processes and
controls across all group entities as part of our continuous
improvement. As part of this, we will pay special attention to
the full rollout of our CRM platform, which is a key pillar of our
overall customer experience strategy.
We will also focus on strengthening the new businesses in
the Group, including Investment Management and Property
businesses in order to enhance their capability to maximize
future shareholder value in the Group. We are in the process
of implementing a best of breed Investment Management
System to provide our highly skilled Investment Management
Team with adequate tools to provide world-class customer
experience and highly innovative investment management
solutions.
We are also in the process of strengthening our management
capacity in the Property Division in order to execute effi ciently
our real estate strategy and take full advantage of the
signifi cant opportunities available to the property business in
the region.
We will continue to recruit, develop and retain highly talented
staff to ensure that we have suffi cient resource pool to
support the continued expansion of our business.
Appreciation
I would like to thank all our staff for the support, commitment
and effort made in achieving the good performance. I also
recognise and appreciate the Board’s input, guidance and wise
counsel in running our business. I would like to pay tribute to
all our business partners including our intermediaries who
continue to support us in a great way. We appreciate this and
assure them of our best service at all times.
I also wish to thank all our esteemed customers for the faith
they have in the UAP brand and the support provided during
the year. We look forward to meeting and exceeding all your
expectations.
Finally, I wish to appreciate and thank all our shareholders for
their continued support to the growth of our businesses and
assure them of our strong commitment to deliver outstanding
value on their investment.
Dominic Kiarie
Group Managing Director
26 April 2013
GROUP MD’S STATEMENTANNUAL REPORT & FINANCIAL STATEMENTS - 2012

UAP HOLDINGS LIMITED28
BU
SIN
ES
S R
EV
IEW
CO
RP
OR
AT
E G
OV
ER
NA
NC
EF
INA
NC
IAL
STA
TE
ME
NT
SN
OT
ES
TO
TH
E F
INA
NC
IAL
SA
DD
ITIO
NA
L IN
FO
RM
AT
ION
The UAP Group of companies believes that
sustainability is a journey and not a destination.
We prioritize the quality of the relationships we
have with our customers, our employees, and
our partners and suppliers. It is a combination of respectful
relationships and positive actions that we engage in to
establish a foundation for sustainable business practice.
We continue to integrate the broader meaning of the word
“sustainability” into every aspect of our business and try
to make changes each and every day that will benefi t the
community. We recognize and perform the obligations we
have towards our people, investors, customers, suppliers,
industry players and the community as a whole. We believe
our reputation, together with the trust and confi dence of
those with whom we deal, to be one of our most valuable
assets. In doing so, we always assess the probable impact of
all our decisions and activities on these stakeholders beyond
profi ts, dividends and other fi nancial factors in the short,
medium and long term.
Industry sustainability
Over the years, the UAP Group has grown in both brand and
business stature to be considered a key industry infl uencer
in the East African region. We consider the critical duty of
bringing up a sustainable industry primary because that way,
themes related to our core businesses become central drivers
of social and economic thinking and behavior.
We continue to attach a high level of importance to
compliance and cooperation with industry regulators and
umbrella associations for the common good of our people,
the community and the economy.
We fully support the initiatives by the industry regulator
including those aimed at strengthening the insurance
profession and building national capacity by growing the
talent pool of trained insurance agents. Our brand mantra is
about simplicity and in remaining true everything about our
products, processes and people is simple.
We continue to decode the technical policy document by
simplifying the language and demystify insurance by listening
to the market and developing solutions that respond to
customer needs.
We have taken to replicating the customer experience center
located at the head offi ce across the branch offi ces in the
major cities and towns to deliver a consistent service and feel
wherever our customers are.
Public education and consumer outreach is still central to our
sustainability mission. We encourage members of the public
to live their lives in a manner that is always cognizant of risk.
We fi rmly believe that an overall focus on risk averseness
is important in bringing down the overall economic cost of
remedy thereby enabling us to channel these resources to
more productive use.
It is our fi rm belief that our fellow industry players will see the
need as well and follow suit so that we can together entrench
it in the social fabric.
Ethics and integrity
UAP believes that integrity is the cornerstone of our collective
common sense and lends great credence to the skills,
abilities and commitments of our people. We strive to deal
ethically and transparently with our clients, staff, partners and
suppliers.
In this regard we are committed to increasing customer
satisfaction by providing them with quality products and
services that we innovate to respond to their needs and
enhance the quality of their lives. We treat our suppliers fairly,
objectively and honestly. We believe in treating our employees
in a fair and even handed manner while fostering a culture
rich in diversity but based on teamwork, integrity, trust and
mutual respect. As a business we aggressively pursue growth
and profi tability while maintaining ethical standards in all our
activities.
Health safety and Employee Welfare
The Group places great importance to the health and safety
of employees, customers and members of the public.
While we subscribe to the highest possible level of practical
standards of health and safety, these are continuously
reviewed to ensure that they meet modern standards.
In addition we also appreciate the need to proactively manage
issues of HIV/AIDS, where we have put in place a structured
awareness and wellness policy and integrated it within our
Human Resources Policies.
Our Corporate Social ResponsibilitySustainability
ANNUAL REPORT & FINANCIAL STATEMENTS - 2012 SUSTAINABILITY

BU
SIN
ES
S R
EV
IEW
CO
RP
OR
AT
E G
OV
ER
NA
NC
EF
INA
NC
IAL
STA
TE
ME
NT
SN
OT
ES
TO
TH
E F
INA
NC
IAL
SA
DD
ITIO
NA
L IN
FO
RM
AT
ION
UAP HOLDINGS LIMITED 29
BUUUU
BBBBS
IS
ISS
NE
NE
NE
NEE
NNS
SSS
SS
SSSS
RRRV
EV
EV
EV
IEEIEIWW
CO
CO
CR
PR
PR
PO
RO
ROO
TTA
TA
E
EEG
OG
OG
OG
VE
VE
VE
VE
VE
VVVVR
NNNNR
NNR
NNN
ANN
AAAEEE
CE
CE
CCF
IFFFF
NA
NA
NA
NCC
NCC
NC
NC
IAIAAAL
LL
TTTS
TS
AT
AT
AAAE
ME
MNN
EN
EN
TS
TS
NO
NO
NO
NE
TE
TE
TE
TTTS
S
SSS
TOOO
TO
TTTTTTTTT
HEE
HE
HE
HE
HHFFF
NNINNA
NA
NA
NA
NA
NA
NC
IC
IC
IC
ILLL
AL
AL
AL
AL
AASSS
AD
AD
AD
AD
AD
AD
AD
AD
AD
AD
ADDDD
AD
AD
ADD
AD
AD
AD
AD
AD
AD
AD
AD
AD
ADD
AD
AD
ADDD
AD
ADD
AD
ADD
ADDDD
ADD
AAAAAAAAAAAAAD
ID
ID
ID
IID
ID
ID
ID
ID
ID
ID
ID
ID
ID
ID
IDDDDDDDDDDDDDDDDDDDDDDDDDDDDDD
TI
TI
TI
TI
TI
TI
TI
TI
TII
TI
TTTTTTTTTTO
NO
NO
NO
NO
NO
NO
NNO
NO
NO
NNO
NO
NO
NO
NNO
NNNNO
NO
NO
NO
NNNO
NO
NO
NO
NO
NO
NO
NNO
NO
NNNNNO
NO
NOOOOOOOOOOOOOOOOOOOOOOOOOOOOOOOOO
ALLLLLLLLLLLLLLLLLLLLL
ALLL
AL
ALLLLL
AL
ALL
AL
AL
AL
AL
AL
ALL
AAAAAAAAAAAAAAAAAAAAAIIIIIIIIIN
FFFFN
FN
FN
FN
FN
FNNNNNNNNNN
OR
OR
OR
OR
ORR
ORR
OR
OR
ORRRR
ORRRRRRRRR
OR
OR
ORRRR
ORRRRRRRRRRRRRR
ORRRR
OR
OOOOOOOOOOOOOOOOOOOOOOOOOOOOOOOOOOOOOOOOOOOOOOOOOOOOOOM
AM
AM
AM
TI
TI
TO
NNNNOO
UAUAUAUAPPP HOHOHHHOLDLLDININGSSGS LLIMIMITTEDED 22299999
Our Corporate Social ResponsibilitySustainability
A Deserving Prize: James Wambugu - Managing Director UAP Insurance Kenya presents an award to the top 2012 Direct Sales Agent Eric Asiba
Rehabilitation and beautifi cation of Nairobi Road Island: Kenyatta Avenue, Uhuru Highway Roundabout.
The 2012 UAP Ndakaini Half Marathon winner cross the fi nish line in style on a record time of 1 hour 20 minutes.
We recognize and perform the obligations we have towards our people, investors, customers, suppliers, industry players and the community as a whole.
UAP Staff and their children in a tree planting exercise at the Ndakaini Dam Mrs. Triza Njeri Kamau (widow of the late Marathon Champion Kamau Samuel Wanjiru) with her children Shiro and Simon plant a tree during the UAP 2013 tree planting exercise.
SUSTAINABILITYANNUAL REPORT & FINANCIAL STATEMENTS - 2012
BU
SIN
ES
S R
EV
IEW
CO
RP
OR
AT
E G
OV
ER
NA
NC
EF
INA
NC
IAL
STA
TE
ME
NT
SN
OT
ES
TO
TH
E F
INA
NC
IAL
SA
DD
ITIO
NA
L IN
FO
RM
AT
ION
UAP HOLDINGS LIMITED30
The total annual cost of this program has been maintained
at Shs 5 million and it is built on the principal of non-
discrimination.
We also maintain a policy of an equal opportunity employer,
giving all qualifi ed people a chance to join UAP and once
they are on board, ensure that they all have fair terms of
engagement and are exposed to quality training.
Being a publicly listed company, we are in the process of
setting up an Employee Share Ownership Scheme (ESOP) for
our employees to further inculcate affi nity and ownership to
the brand.
Corporate Social Responsibility
We aim to minimize the impact of our business on the
environment, have a positive effect on society and the
environment, and seek to work with other organizations that
embrace these objectives.
We aim to use natural resources responsibly, work with
communities and encourage and educate our employees on
these goals.
We recognize that our Company has the potential to make
a signifi cant impact on its staff, customers, society and the
environment.
We aim to comply with and where possible, exceed all current
environmental legislation and meet all other requirements to
which we subscribe.
We are committed to a process of continual improvement,
including the ongoing assessment and reduction in use of
paper and reduction of pollution.
We inform our customers and suppliers of our activities and
where possible, work with them to achieve the desired aims.
We seek to work with other local organizations to share ideas
and help develop our management systems.
We act as a responsible member of the local community and
consider our impact on it, in particular with regard to our offi ce
location and employees’ movements to and from the offi ce,
and seek to recruit new staff and work with new suppliers
where the local community will benefi t most strongly.
Environmental Conservation
Our aim is to contribute to the sustainable conservation of
our environment. To this end we have for the past 10 years
been planting trees around the Ndakaini Dam in Gatanga
Constituency of Muranga County. This dam provides over
70% of clean drinking water to Nairobi’s three million residents.
In an annual exercise that involves our staff, the local
community and our partners we have so far planted over
150,000 trees. Our target is to plant 250,000 trees in the area.
Every year in the month of April, our staff and with involvement
of the local community converge around the Ndakaini dam to
plant trees. We did this for 2012 and are in the process of
integrating the donors in our annual fundraising initiatives to
participate in this highlight exercise.
While we are involved in these initiatives from a business
perspective, it is important to note that the scarcity of water
has both an economic and social cost and as an insurance
company we are aware of the need to mitigate any risks that
may exacerbate these costs.
UAP Ndakaini Half Marathon
The tree planting exercise we engage in annually is closely
tied to the fl agship annual UAP Ndakaini Half-Marathon
that is now set to take place September. This calendar event
serves to highlight the plight of the Ndakani Dam and draw
support by other organizations by fundraising towards the
conservation program.
We also aim to use the marathon as an instrument of
building sports talent and supporting our youth to reach
their potential. The event, in its ninth year has proven very
successful, attracting increasingly larger numbers of athletes
and spectators.
It has produced great talent including renowned London
Olympic Marathon silver medalist Abel Kirui. Kirui is now the
offi cial UAP Ndakaini Half Marathon Ambassador and we
work very closely with him and other athletes to mentor the
young and upcoming runners.
Our Corporate Social Responsibility (Continued)Sustainability
ANNUAL REPORT & FINANCIAL STATEMENTS - 2012 SUSTAINABILITY

BU
SIN
ES
S R
EV
IEW
CO
RP
OR
AT
E G
OV
ER
NA
NC
EF
INA
NC
IAL
STA
TE
ME
NT
SN
OT
ES
TO
TH
E F
INA
NC
IAL
SA
DD
ITIO
NA
L IN
FO
RM
AT
ION
UAP HOLDINGS LIMITED 31
Supporting Rugby Development
For the last fi ve years, UAP has supported the Bamburi Super
Series Rugby tournament, which brings together teams from
around the East African region to grow the 15’s game. As a
sport that continues to attract more youth, we are glad to
participate in its development and to be associated. Indeed
this is the other sport that has fi rmly placed Kenya on the
global map following the successes and growing popularity
of its national 7’s team. In 2012 we upped our sponsorship
for the tournament to Ksh 1.5 million even as we maintained
kit sponsorship of the winning Rhino team.
Education Scholarships
UAP is a fi rm believer in educating children. As such, we have
a deliberate policy to support needy and bright children to
get an education. We have largely supported children at
secondary school level for over ten years. We support a
needy student each at Starehe Boys and Starehe Girls
Centres every year and on a case-by-case basis of other
students in other schools. The students we have supported
have gone on to make great achievements in life and one
was admitted to a prestigious university overseas. Last year
we extended our educational support to two children at
primary school level. We intend to build on this program to
reach more deserving cases in future.
Lollipop Project
This is a signature program that we run each year in association
with the Lollipop Project to promote safe road use. The
program primarily works with children of primary school going
age around the country and has over the last fi ve years served
as an important platform to impart road safety tips to both
pedestrians and motorists. The program involves stationing
uniformed marshals at designated pedestrians crossing points
that are often located next to the school.
Urban Renewal
Following the successful road islands ‘adoption’ program in
Nairobi, we have extended it to include the Kenyatta Avenue
roundabout in Nairobi’s Central Business District and expect to
add one more in Kisii County in 2013. This program serves to
beautify the road islands by maintaining the fl owers and grass
and generally ensuring that they are aesthetically appealing to
residents.
Other Charities
We were also involved in other philanthropic activities in which
we supported various charities during the year. These included
supporting the fund raising golf tournament for the Nyeri
Hospice, donating and participating in the Kenya Diabetes
Management Center Diabetes Walk and Golf and The Nairobi
Hospital Children’s Charity Heart Fund. The UAP Group also
sponsored the Mater Hospital Heart Run, the Diocese of Mt
Kenya Boys School’s medical camp and golf tournaments in
Nyahururu, Nyeri, Kisii, Nanyuki, Kitale and Muthaiga respectively.
Our Corporate Social Responsibility (Continued)Sustainability
UAP Staff during a team building event
ANNUAL REPORT & FINANCIAL STATEMENTS - 2012 SUSTAINABILITY • END
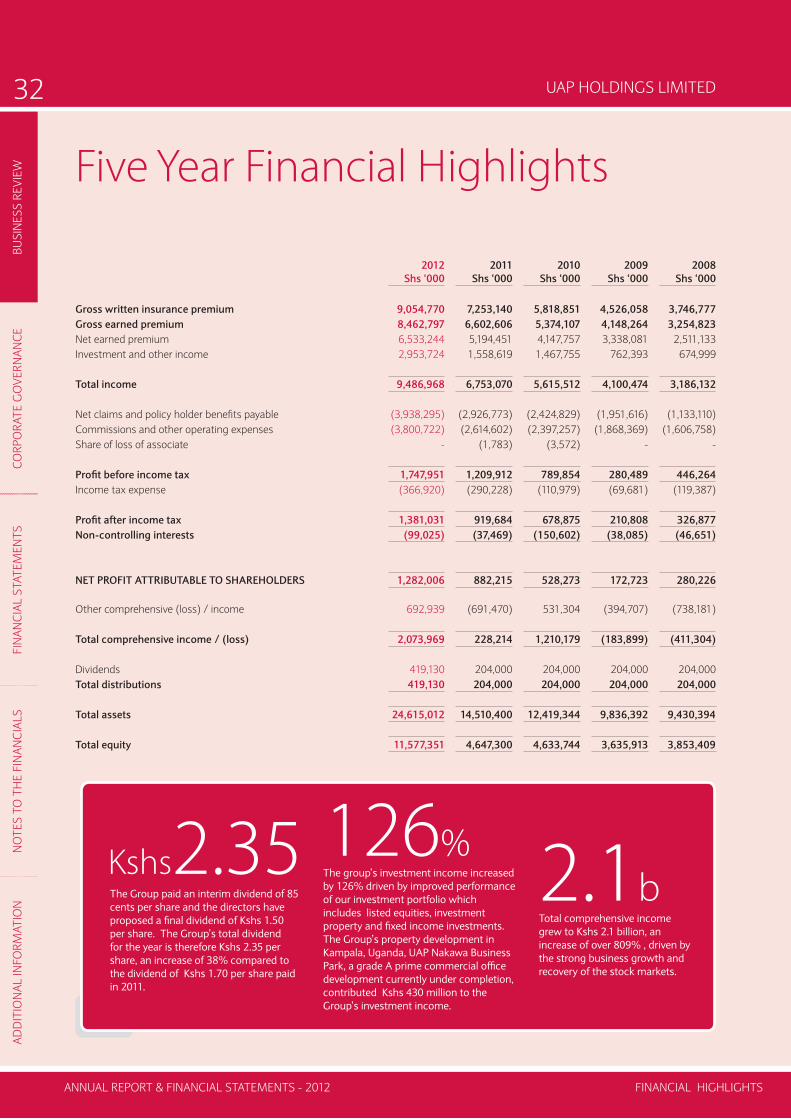
BU
SIN
ES
S R
EV
IEW
CO
RP
OR
AT
E G
OV
ER
NA
NC
EF
INA
NC
IAL
STA
TE
ME
NT
SN
OT
ES
TO
TH
E F
INA
NC
IAL
SA
DD
ITIO
NA
L IN
FO
RM
AT
ION
UAP HOLDINGS LIMITED32
Five Year Financial Highlights
2012
Shs ‘000
2011
Shs ‘000
2010
Shs ‘000
2009
Shs ‘000
2008
Shs ‘000
Gross written insurance premium 9,054,770 7,253,140 5,818,851 4,526,058 3,746,777
Gross earned premium 8,462,797 6,602,606 5,374,107 4,148,264 3,254,823
Net earned premium 6,533,244 5,194,451 4,147,757 3,338,081 2,511,133
Investment and other income 2,953,724 1,558,619 1,467,755 762,393 674,999
Total income 9,486,968 6,753,070 5,615,512 4,100,474 3,186,132
Net claims and policy holder benefi ts payable (3,938,295) (2,926,773) (2,424,829) (1,951,616) (1,133,110)
Commissions and other operating expenses (3,800,722) (2,614,602) (2,397,257) (1,868,369) (1,606,758)
Share of loss of associate - (1,783) (3,572) - -
Profi t before income tax 1,747,951 1,209,912 789,854 280,489 446,264
Income tax expense (366,920) (290,228) (110,979) (69,681) (119,387)
Profi t after income tax 1,381,031 919,684 678,875 210,808 326,877
Non-controlling interests (99,025) (37,469) (150,602) (38,085) (46,651)
NET PROFIT ATTRIBUTABLE TO SHAREHOLDERS 1,282,006 882,215 528,273 172,723 280,226
Other comprehensive (loss) / income 692,939 (691,470) 531,304 (394,707) (738,181)
Total comprehensive income / (loss) 2,073,969 228,214 1,210,179 (183,899) (411,304)
Dividends 419,130 204,000 204,000 204,000 204,000
Total distributions 419,130 204,000 204,000 204,000 204,000
Total assets 24,615,012 14,510,400 12,419,344 9,836,392 9,430,394
Total equity 11,577,351 4,647,300 4,633,744 3,635,913 3,853,409
The group’s investment income increased
by 126% driven by improved performance
of our investment portfolio which
includes listed equities, investment
property and fi xed income investments.
The Group’s property development in
Kampala, Uganda, UAP Nakawa Business
Park, a grade A prime commercial offi ce
development currently under completion,
contributed Kshs 430 million to the
Group’s investment income.
126%The Group paid an interim dividend of 85
cents per share and the directors have
proposed a fi nal dividend of Kshs 1.50
per share. The Group’s total dividend
for the year is therefore Kshs 2.35 per
share, an increase of 38% compared to
the dividend of Kshs 1.70 per share paid
in 2011.
Kshs2.35Total comprehensive income
grew to Kshs 2.1 billion, an
increase of over 809% , driven by
the strong business growth and
recovery of the stock markets.
2.1b
FINANCIAL HIGHLIGHTSANNUAL REPORT & FINANCIAL STATEMENTS - 2012
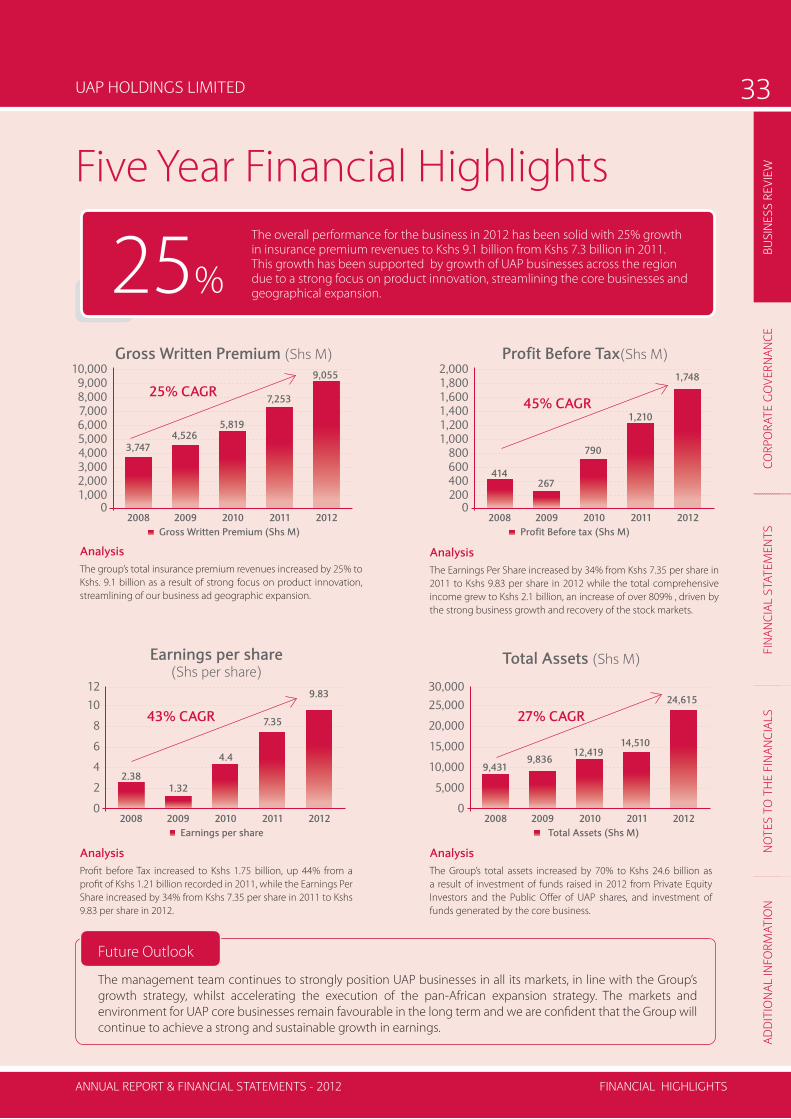
BU
SIN
ES
S R
EV
IEW
CO
RP
OR
AT
E G
OV
ER
NA
NC
EF
INA
NC
IAL
STA
TE
ME
NT
SN
OT
ES
TO
TH
E F
INA
NC
IAL
SA
DD
ITIO
NA
L IN
FO
RM
AT
ION
UAP HOLDINGS LIMITED 33
Five Year Financial Highlights
1,0002,0003,0004,0005,0006,0007,0008,0009,000
10,000
3,747
2008
4,526
2009
5,819
2010
7,253
2011
9,055
20120
Gross Written Premium (Shs M)
Gross Written Premium (Shs M)
25% CAGR
2
4
6
8
10
12
2.38
2008
1.32
2009
4.4
2010
7.35
2011
9.83
20120
Earnings per share
Earnings per share(Shs per share)
43% CAGR
200400600800
1,0001,2001,4001,6001,8002,000
414
2008
267
2009
790
2010
1,210
2011
1,748
20120
Profit Before tax (Shs M)
Profit Before Tax(Shs M)
45% CAGR
5,000
10,000
15,000
20,000
25,000
30,000
9,431
2008
9,836
2009
12,419
2010
14,510
2011
24,615
2012Total Assets (Shs M)
Total Assets (Shs M)
27% CAGR
0
Analysis
The Group’s total assets increased by 70% to Kshs 24.6 billion as
a result of investment of funds raised in 2012 from Private Equity
Investors and the Public Off er of UAP shares, and investment of
funds generated by the core business.
Analysis
The group’s total insurance premium revenues increased by 25% to
Kshs. 9.1 billion as a result of strong focus on product innovation,
streamlining of our business ad geographic expansion.
Analysis
Profi t before Tax increased to Kshs 1.75 billion, up 44% from a
profi t of Kshs 1.21 billion recorded in 2011, while the Earnings Per
Share increased by 34% from Kshs 7.35 per share in 2011 to Kshs
9.83 per share in 2012.
Analysis
The Earnings Per Share increased by 34% from Kshs 7.35 per share in
2011 to Kshs 9.83 per share in 2012 while the total comprehensive
income grew to Kshs 2.1 billion, an increase of over 809% , driven by
the strong business growth and recovery of the stock markets.
Future Outlook
The management team continues to strongly position UAP businesses in all its markets, in line with the Group’s
growth strategy, whilst accelerating the execution of the pan-African expansion strategy. The markets and
environment for UAP core businesses remain favourable in the long term and we are confi dent that the Group will
continue to achieve a strong and sustainable growth in earnings.
The overall performance for the business in 2012 has been solid with 25% growth in insurance premium revenues to Kshs 9.1 billion from Kshs 7.3 billion in 2011. This growth has been supported by growth of UAP businesses across the region due to a strong focus on product innovation, streamlining the core businesses and geographical expansion. 25%
ANNUAL REPORT & FINANCIAL STATEMENTS - 2012 FINANCIAL HIGHLIGHTS

BU
SIN
ES
S R
EV
IEW
CO
RP
OR
AT
E G
OV
ER
NA
NC
EF
INA
NC
IAL
STA
TE
ME
NT
SN
OT
ES
TO
TH
E F
INA
NC
IAL
SA
DD
ITIO
NA
L IN
FO
RM
AT
ION
UAP HOLDINGS LIMITED34
Following the major capital raising initiatives through
private placement and public offer during the year
and in keeping with the Company’s commitment
to adhering to the highest standards of corporate
governance, the Board embarked on a comprehensive
corporate governance review, with the objective of enhancing
corporate governance standards and practices desirable for
a public company. This has resulted to reorganization of the
Board, appointment of new directors and revamping of the
various Board committees.
Board of Directors
The Board’s main objective is to establish and monitor
the strategic direction for the Company and the Group,
ensuring competent management of the business; establish
and oversee adequate internal control systems, monitor
compliance with laws and regulations and report performance
to shareholders. During the reporting period, a number of
changes were made to the Board to enable fair representation
of all major shareholders (particularly the private equity
partners) and to obtain the requisite skill mix. These changes
led to an increase of the Board membership from 7 to 12. Of
the twelve directors, the Chairman and 10 members are non-
executives directors, and three of these are independent non-
executive directors.
Board Charter
During the year, a consultant was appointed to undertake
a Board Evaluation and review the existing board charter in
order to take care of the new changes in the Company. The
new Board Charter is currently being fi nalised and should be
adopted by the Board shortly. Key components of the Charter
include terms of reference of the Board, authorities of the
Board and structure. The terms of reference of the Chairman
of the Board and those of the Managing Director have been
provided for. Board committees and their terms of reference,
procedures for dealing with confl ict of Interest, related party
transactions and independence of directors have been
defi ned. Other outputs from the process include standardized
board documents and detailed Board meeting procedures
which will be applicable across the group’s subsidiaries.
Board appointments
Appointments to the Board are premised on a good mix of
appropriate skills, competencies in relevant fi elds, gender
balance and the ability to promote the objectives of the
Company.
All directors have a fi xed tenure of offi ce and are required to
retire at least every three years with a provision for re-election
subject to a favourable performance evaluation by the Board.
Board meetings; information to directors and board
performance evaluation
The Board meets at least once every quarter but the business
may warrant the convening of special meetings from time
to time. All Board meetings are scheduled in advance of the
respective year through an Annual Calendar Board Meetings
including a rolling calendar, which facilitates planning and
availability of the members. Board Committee meetings
are scheduled in advance of the Board Meeting so that all
technical matters are appropriately addressed and reported
to the Board for ratifi cation or approval.
The directors are given appropriate and timely information
on key activities of the business regularly and on request in
order to carry out their roles. Specifi cally the directors are
provided with all available information in respect of items to
be discussed at a meeting of the Board or committee prior to
the meeting. They may also seek independent professional
advice, at Company expense, concerning the affairs of the
Group in consultation with the Group Managing Director and
the Group Company Secretary.
The Board regularly commissions a board performance
evaluation that is done independently by a certifi ed
professional organisation and the report is used to improve
the Board’s performance. A Consultant was appointed in the
fourth quarter of 2012 and a report was submitted in the 1st
quarter of 2013.
Separation of role of chairman from chief executive
The Group Chairman is responsible for managing the Board
and providing leadership to the Group while the Group
Managing Director is responsible to the Board for strategically
overseeing and managing the business units in the UAP
Group in accordance with instructions given by the Board.
Committees of the board
The Board is fully cognizant of the fact that it is ultimately
responsible for ensuring that the Company remains a going
concern at all times. That it must exercise full control of the
Company and direct and control the management in the
implementation of key decisions affecting the Company or its
business. The Board has an approved annual work plan and
a Board Charter that enumerates the roles, responsibilities
and powers of the Board and provides for the delegation of
authority to the Committees of the Board.
Corporate Governance Statement
GOVERNANCEANNUAL REPORT & FINANCIAL STATEMENTS - 2012

BU
SIN
ES
S R
EV
IEW
CO
RP
OR
AT
E G
OV
ER
NA
NC
EF
INA
NC
IAL
STA
TE
ME
NT
SN
OT
ES
TO
TH
E F
INA
NC
IAL
SA
DD
ITIO
NA
L IN
FO
RM
AT
ION
UAP HOLDINGS LIMITED 35
Corporate Governance Report(Continued)
The Board Committees have been reorganised and
reconstituted as follows:-
1. Audit
2. Risk & Governance
3. Group Information Communication & Technology
4. Finance & Investments Committee
5. Nominations, Remuneration Committee and Human
Resources,
The members of the Committees and their Chairmen are
elected by the Board for a period of one year, and may be
re-elected thereafter. The Board may appoint acknowledged
experts in relevant fi elds as members of any Committee (“the
Expert Member”). The Expert Member will be independent
and his/her appointment will satisfy the following criteria:
• Members of the Board constitute the majority of
Committee members;
• A member acts as the chair of the Committee;
• An expert who is not a director may be appointed to
serve in a committee; the Expert Member agrees to be
bound by the Board Charter.
The composition of each Committee shall seek to refl ect
the need for knowledge and experience regarding the
Committee’s sphere of competence, provided that the above
membership requirements are met. In order to discharge
its mandates and responsibilities effectively, the Board has
delegated certain tasks to its Committees.
The Management of the Company including the subsidiaries,
the Group Company Secretary and the Group’s auditors are
under clear instructions to provide information, explanations
or documents required by the Committees in order to ensure
that they cover their mandates to the extent necessary for
informed decision making. During the period under review,
the following Committees were in place.
1. Audit Committee
George Odo Chairman
Kamau Kuria Member
Lotfi Baccouche Member
2. Risk & Governance Committee
Lotfi Baccouche Chairman
Peter Njoka Member
George Odo Member
Dominic Kiarie Member
James Wambugu Ex-Offi cio
Zipporah Mungai Ex-Offi cio
3. Group Information Communication & Technology
James Mworia Chairman
Kamau Kuria Member
Peter Njoka Member
Joseph Mucheru Member
Dominic Kiarie Ex-Offi cio
4. Finance & Investments Committee
James Mworia Chairman
Susan Omanga Member
Dr. Chris Kirubi Member
James Muguiyi Member
Skander Oueslati Member
Davinder Sikand Member
Dominic Kiarie Member
5. Human Resources, Remunerations & Nominations
Committee
Susan Wakhungu - Githuku Chairperson
Dr. JB Wanjui Member
Philip Coulson Member
Jonas Armtoft Member
Skander Oueslati Member
Peter Njoka Member
Dominic Kiarie Member
ANNUAL REPORT & FINANCIAL STATEMENTS - 2012 GOVERNANCE

BU
SIN
ES
S R
EV
IEW
CO
RP
OR
AT
E G
OV
ER
NA
NC
EF
INA
NC
IAL
STA
TE
ME
NT
SN
OT
ES
TO
TH
E F
INA
NC
IAL
SA
DD
ITIO
NA
L IN
FO
RM
AT
ION
UAP HOLDINGS LIMITED36
Corporate Governance Statement(Continued)
Conduct of Business and Performance Reporting
The Group’s business is conducted in accordance with a
carefully formulated strategy, annual business plans and
budgets which set out very clear objectives. Roles and
responsibilities have been clearly defi ned with approved
authority being delegated. Performance against the objectives
is reviewed and discussed monthly and quarterly by the
management teams in the Group. The Chief Executives and
their respective Management teams prepare annual business
review report which is presented to the Group Board during it’s
annual retreat for consideration and approval. Each subsidiary
board is expected to monitor the performance of each
subsidiary. consolidations are undertaken on a quarterly basis
and presented to the Board. This way performance trends,
forecasts as well as actual performance against budgets and
prior periods are closely monitored.
Compliance with laws
The Board is satisfi ed that the Group has, to the best of their
knowledge, complied with all applicable laws and conducted
its business affairs in accordance within the law. To the
knowledge of the Board no director, employee or agent of
the Group acted or committed any indictable offence under
the Anti-Corruption laws in conducting the business of
the Group nor been involved or been used as a conduit for
money laundering or any other activity incompatible with the
relevant laws.
Group Company Secretary
All members of the Board have direct access to the Group
Company Secretary and in his absence the Deputy Group
Company Secretary, who is responsible for ensuring that all
board procedures, corporate governance policies, rules and
regulations are followed.
Accountability, audit and shareholder relations
The Board recognises its responsibility to present a balanced
and understandable assessment of the Group’s fi nancial
position and prospects. The Group’s fi nancial statements are
prepared in accordance with International Financial Reporting
Standards (IFRS) and the requirements of the Companies Act
and are audited in accordance with International Auditing
Standards. The directors recognise and have confi rmed
their responsibility over the fi nancial statements and have
provided other information in this annual report that they
consider useful to shareholders and other stakeholders. All
shareholders are invited to the Annual General Meeting and
are free to put questions to the Board and the auditors on
matters concerning operations and fi nancial statements of
the Group.
During the year the Board held a shareholders’ briefi ng session
which is intended to be a regular event so as to explain the
direction the Company is taking and obtain shareholders
views and ideas. This has enriched the company in a great
way.
Shareholding
At 31 December 2012, the top ten shareholders in the Company were:No. of
shares
Holdings
%
1 BAWAN LTD 43,008,299 20.34%
2 AFRICINVEST FUND II LIMITED 29,660,547 14.03%
3 CENTUM INVESTMENT COMPANY LTD 29,070,637 13.75%
4 AUREOS AFRICA FUND LLC 28,796,810 13.62%
5 CHRISTOPHER JOHN KIRUBI 20,261,808 9.58%
6 SWEDFUND INTERNATIONAL 14,901,179 7.05%
7 JAMES NGATIA MUGUIYI 12,611,247 5.97%
8 AFRICINVEST FINANCIAL SECTOR FUND LIMITED 5,561,353 2.63%
9 WILLIAM KIMUTAI MARTIN 3,495,480 1.65%
10 ANDREW STEPHEN GRAY SMITH 1,789,189 0.85%
GOVERNANCEANNUAL REPORT & FINANCIAL STATEMENTS - 2012

BU
SIN
ES
S R
EV
IEW
CO
RP
OR
AT
E G
OV
ER
NA
NC
EF
INA
NC
IAL
STA
TE
ME
NT
SN
OT
ES
TO
TH
E F
INA
NC
IAL
SA
DD
ITIO
NA
L IN
FO
RM
AT
ION
UAP HOLDINGS LIMITED 37
Shareholding
The shareholders profi le as at 31 December 2012 was as follows:
No. of
Shareholders
No. of
Shares
Holdings
%
Shares Range
10,001 to 100,000 910 5,446,871 2.58%
100,001 to 1,000,000 29 11,535,303 5.46%
Above 1,000,000 14 194,437,715 92%
953 211,419,889 100%
Individual investors
Kenyan 763 49,871,160 23.59%
East African 35 108,100 0.05%
Foreign 14 123,400 0.06%
812 50,102,660 23.70%
Corporate investors
Kenyan 138 161,275,629 76.28%
East African 3 41,600 0.02%
141 161,317,229 76.30%
The directors’ direct and indirect interest in the ordinary share capital of the Company on 31 December 2012 was as follows:
1 Dr JB Wanjui CBS 43,008,299 20.34%
2 Centum Investment Company Limited 29,070,637 13.75%
3 Dr. CJ Kirubi EBS 20,261,808 9.58%
4 JN Muguiyi 12,611,247 5.97%
The total number of shareholders at 31 December 2012 was 953 (2011: 25).
Corporate Governance Report(Continued)
ANNUAL REPORT & FINANCIAL STATEMENTS - 2012 GOVERNANCE

BU
SIN
ES
S R
EV
IEW
CO
RP
OR
AT
E G
OV
ER
NA
NC
EF
INA
NC
IAL
STA
TE
ME
NT
SN
OT
ES
TO
TH
E F
INA
NC
IAL
SA
DD
ITIO
NA
L IN
FO
RM
AT
ION
UAP HOLDINGS LIMITED38
Ordinary Business
1. The Secretary to read the notice convening the meeting,
table the proxies and confi rm the presence of a quorum.
2. To confi rm the Minutes of the fourth Annual General
Meeting held on 11th May 2012 and the Minutes of the
Extraordinary General Meeting held on 16th July 2012.
3. To receive, consider and if thought fi t, adopt the audited
fi nancial statements for the year ended 31st December
2012 together with the Chairman’s, Directors’ and
Auditors’ Reports thereon.
4. To consider and if thought fi t, adopt the recommendation
to pay a fi nal dividend of Kes 1.50/= (interim Kes 0.85/=
paid in October 2012) for each ordinary share of Kes 5/=
on the issued share capital of the Company in respect of
the year ended 31 December 2012.
5. To approve the directors’ remuneration for the year
ended 31 December 2012 as provided for in the Financial
Statements.
6. Election of Directors –
(a) During the year, the Board undertook reorganization
of its structure and size and pursuant to Articles 99 of the
Company’s Articles of Association:-
(i) Ms. Susan Githuku, appointed as a director to fi ll a
casual vacancy, retires by rotation at the dissolution
of the meeting and being eligible, offers herself for
re-election.
(ii) Ms. Susan Omanga, appointed as a director to fi ll a
casual vacancy, retires by rotation at the dissolution
of the meeting and being eligible, offers herself for
re-election.
(b) In accordance with Article 99 of the Company’s
Articles of Association:-
(i) Mr. Lotfi Baccouche, appointed as an additional
director retires by rotation at the dissolution of the
meeting and being eligible, offers himself for re-
election.
(ii) Mr. Peter Gichuru Njoka, appointed as an additional
director retires by rotation at the dissolution of the
meeting and being eligible, offers himself for re-
election.
(iii) Mr. Skander Khalil Oueslati, appointed as an
additional director retires by rotation at the
dissolution of the meeting and being eligible, offers
himself for re-election.
(iv) Mr. Jonas Armtoft, appointed as an additional
director retires by rotation at the dissolution of the
meeting and being eligible, offers himself for re-
election.
Special Business
(c) Dr. J.B. Wanjui, and Dr. C.J. Kirubi who have attained
the age of 70 years each, retire by rotation in accordance
with Article 101 of the Company’s Articles of Association
and Section 186 (2) of the Companies Act (Cap 486).
Special Notices have been received by the Company
pursuant to Section 142 of the Companies Act (Cap 486)
that the following resolutions be proposed in accordance
with Section 186 (5) of the said Act, and if thought fi t, be
passed by the members:
(i) “That Dr J. B. Wanjui CBS, a director who has attained
the age of 70 years, be and is hereby re-elected to
serve as a Director of the Company until he next
comes up for retirement by rotation under the
Company’s Articles of Association”;
(ii) “That Dr C. J. Kirubi EBS, a director who has
attained the age of 70 years, be and is hereby re-
elected to serve as a Director of the Company until
he next comes up for retirement by rotation under
the Company’s Articles of Association.”
7. To note that PricewaterhouseCoopers continue as
auditors of the Company in accordance with Section
159 (2) of the Companies’ Act CAP 486 and to authorize
the directors to fi x their remuneration.
8. To transact any other business which may be properly
transacted at an annual general meeting and for which
a valid notice has been issued in accordance with the
Company’s Articles of Association.
By order of the Board
A.K. MainaSecretary24 May 2013
Note: In accordance with Section 136(2) of the Companies Act (Cap. 486) every member entitled to vote at the above meeting is entitled to appoint a proxy to attend and vote on his/her behalf. A proxy need not be a member of the Company.
A form of proxy is enclosed and should be returned to the Company Secretary, P.O. Box 43013 – 00100, Nairobi, to arrive no later than 48 hours before the meeting or any adjournment thereof.
Annual General Meeting
NOTICE IS HEREBY GIVEN that the fi fth annual general meeting of the shareholders of UAP Holdings Limited will be held at
Sarova Panafric Hotel, Nairobi on Friday 21 June 2013 at 10.00. a.m. for the following purposes:
AGM NOTICEANNUAL REPORT & FINANCIAL STATEMENTS - 2012

BU
SIN
ES
S R
EV
IEW
CO
RP
OR
AT
E G
OV
ER
NA
NC
EF
INA
NC
IAL
STA
TE
ME
NT
SN
OT
ES
TO
TH
E F
INA
NC
IAL
SA
DD
ITIO
NA
L IN
FO
RM
AT
ION
UAP HOLDINGS LIMITED 39
The directors submit their report together with the audited
fi nancial statements for the year ended 31 December 2011
which disclose the state of affairs of the Company and the
Group.
Principal activities
The Group is engaged in the business of insurance, premium
fi nancing, investment management, insurance brokerage,
and property and stock broking services. These activities are
carried out through the Group’s subsidiaries in Kenya, Uganda
and Southern Sudan, Rwanda and the Democratic Republic
of Congo (DRC). These activities are briefl y described below:
Insurance business:- The Company has four subsidiary
undertakings that underwrite all classes of life and non-life
insurance risks as defi ned by the Kenyan Insurance Act, other
than industrial life insurance. They also issue investment
contracts to provide their customers with asset management
solutions for their savings and retirement needs, and provide
premium fi nancing services. These operations are carried out
in Kenya, Uganda, South Sudan and Rwanda. The Group is
in the process of applying for a license to start an insurance
brokerage business in the Democratic Republic of Congo.
Premium Financing: - One of the Company’s subsidiaries,
UAP Credit Services Limited, provides insurance premium
fi nancing services to the customers of the Group’s Kenyan
insurance subsidiaries.
Stock broking: - The Company has in an investment in UAP
Financial Services Limited, a Ugandan based Company that
provides stock broking services.
Insurance brokerage services - The Company has procured
an insurance brokerage business to operate in the Democratic
Republic of Congo
Property: - The Company holds investments in three property
companies based In Kenya, Uganda and South Sudan.
Groups results 2012
Shs ’000
2011
Shs ’000
Profi t for the year 1,381,031 919,684
Profi t attributable to shareholders of
the company 1,282,006 882,215
During the year, the company paid an interim dividend of
Shs 102 million (2011: Nil). The directors recommend the
payment of a fi nal dividend of Shs 317 Million. (December
2011: Shs 204 million)
Directors
The directors of the Company, who held offi ce to the date of
this report, are:-
Dr. JB Wanjui CBS Chairman
Mr. JN Muguiyi Managing Director
Dr. CJ Kirubi EBS -
Sir. G Wavamunno -
Mr. James Mworia -
Mr. Kamau Kuria Resigned on 21st March 2013
Mr. Philip Coulson Resigned on 21st March 2013
Mr. Skander Oueslati Appointed on 7th May 2012
Mr. Peter Njoka Appointed on 12th April 2012
Mr. Lotfi Baccouche Appointed on 7th September 2012
Mr. Dominic Kiarie Appointed on 7th September 2012 (Executive)
Mrs. Susan Wakhungu - Githuku
Appointed on 21st March 2013
Mrs. Susan Nkirote Omanga Appointed on 21st March 2013
Mr. Jonas Armtoft Appointed on 21st March 2013
Auditor
The Company’s auditor, PricewaterhouseCoopers, continues
in offi ce in accordance with Section 159(2) of the Companies
Act.
By order of the Board
AK Maina
Secretary
26 April 2013
Directors’ report
ANNUAL REPORT & FINANCIAL STATEMENTS - 2012 DIRECTOR’S REPORT

BU
SIN
ES
S R
EV
IEW
CO
RP
OR
AT
E G
OV
ER
NA
NC
EF
INA
NC
IAL
STA
TE
ME
NT
SN
OT
ES
TO
TH
E F
INA
NC
IAL
SA
DD
ITIO
NA
L IN
FO
RM
AT
ION
UAP HOLDINGS LIMITED40
Statement of director’s responsibilities
The Kenyan Companies Act requires the directors to
prepare fi nancial statements for each fi nancial year
that gives a true and fair view of the state of affairs
of the Company as at the end of the fi nancial year
and of its profi t or loss. It also requires the directors to ensure
that the Company and its subsidiaries keep proper accounting
records that disclose, with reasonable accuracy, the fi nancial
position of the Company and its subsidiaries. They are also
responsible for safeguarding the assets of the Company and
its subsidiaries.
The directors accept responsibility for the annual fi nancial
statements, which have been prepared using appropriate
accounting policies supported by reasonable estimates, in
conformity with International Financial Reporting Standards
and the requirements of the Companies Act.
The directors are of the opinion that the fi nancial statements
give a true and fair view of the state of the fi nancial affairs
of the Company and its subsidiaries and of its profi t in
accordance with International Financial Reporting Standards.
The directors further accept responsibility for the
maintenance of accounting records that may be relied upon in
the preparation of fi nancial statements, as well as designing,
implementing and maintaining internal control relevant to the
preparation and fair presentation of fi nancial statements that
are free from material misstatement.
Nothing has come to the attention of the directors to indicate
that the Company and its subsidiaries will not remain a going
concern for at least twelve months from the date of this
statement.
Dr JB Wanjui CBS Dominic Kiarie
Chairman Managing Director
DIRECTOR’S RESPONSIBILITYANNUAL REPORT & FINANCIAL STATEMENTS - 2012
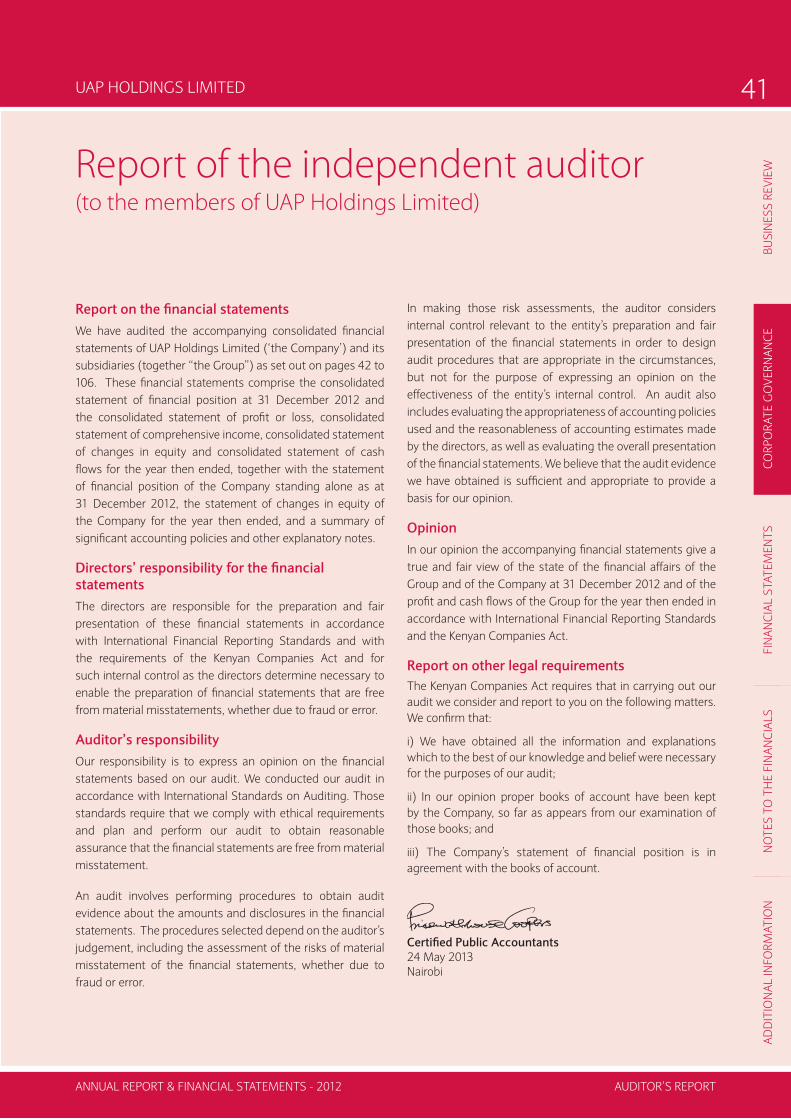
BU
SIN
ES
S R
EV
IEW
CO
RP
OR
AT
E G
OV
ER
NA
NC
EF
INA
NC
IAL
STA
TE
ME
NT
SN
OT
ES
TO
TH
E F
INA
NC
IAL
SA
DD
ITIO
NA
L IN
FO
RM
AT
ION
UAP HOLDINGS LIMITED 41
Report on the fi nancial statements
We have audited the accompanying consolidated fi nancial
statements of UAP Holdings Limited (‘the Company’) and its
subsidiaries (together “the Group”) as set out on pages 42 to
106. These fi nancial statements comprise the consolidated
statement of fi nancial position at 31 December 2012 and
the consolidated statement of profi t or loss, consolidated
statement of comprehensive income, consolidated statement
of changes in equity and consolidated statement of cash
fl ows for the year then ended, together with the statement
of fi nancial position of the Company standing alone as at
31 December 2012, the statement of changes in equity of
the Company for the year then ended, and a summary of
signifi cant accounting policies and other explanatory notes.
Directors’ responsibility for the fi nancial
statements
The directors are responsible for the preparation and fair
presentation of these fi nancial statements in accordance
with International Financial Reporting Standards and with
the requirements of the Kenyan Companies Act and for
such internal control as the directors determine necessary to
enable the preparation of fi nancial statements that are free
from material misstatements, whether due to fraud or error.
Auditor’s responsibility
Our responsibility is to express an opinion on the fi nancial
statements based on our audit. We conducted our audit in
accordance with International Standards on Auditing. Those
standards require that we comply with ethical requirements
and plan and perform our audit to obtain reasonable
assurance that the fi nancial statements are free from material
misstatement.
An audit involves performing procedures to obtain audit
evidence about the amounts and disclosures in the fi nancial
statements. The procedures selected depend on the auditor’s
judgement, including the assessment of the risks of material
misstatement of the fi nancial statements, whether due to
fraud or error.
In making those risk assessments, the auditor considers
internal control relevant to the entity’s preparation and fair
presentation of the fi nancial statements in order to design
audit procedures that are appropriate in the circumstances,
but not for the purpose of expressing an opinion on the
effectiveness of the entity’s internal control. An audit also
includes evaluating the appropriateness of accounting policies
used and the reasonableness of accounting estimates made
by the directors, as well as evaluating the overall presentation
of the fi nancial statements. We believe that the audit evidence
we have obtained is suffi cient and appropriate to provide a
basis for our opinion.
Opinion
In our opinion the accompanying fi nancial statements give a
true and fair view of the state of the fi nancial affairs of the
Group and of the Company at 31 December 2012 and of the
profi t and cash fl ows of the Group for the year then ended in
accordance with International Financial Reporting Standards
and the Kenyan Companies Act.
Report on other legal requirements
The Kenyan Companies Act requires that in carrying out our
audit we consider and report to you on the following matters.
We confi rm that:
i) We have obtained all the information and explanations
which to the best of our knowledge and belief were necessary
for the purposes of our audit;
ii) In our opinion proper books of account have been kept
by the Company, so far as appears from our examination of
those books; and
iii) The Company’s statement of fi nancial position is in
agreement with the books of account.
Certifi ed Public Accountants
24 May 2013
Nairobi
Report of the independent auditor(to the members of UAP Holdings Limited)
ANNUAL REPORT & FINANCIAL STATEMENTS - 2012 AUDITOR’S REPORT

BU
SIN
ES
S R
EV
IEW
CO
RP
OR
AT
E G
OV
ER
NA
NC
EF
INA
NC
IAL
STA
TE
ME
NT
SN
OT
ES
TO
TH
E F
INA
NC
IAL
SA
DD
ITIO
NA
L IN
FO
RM
AT
ION
UAP HOLDINGS LIMITED42
Consolidated statement of profi t or lossfor the year ended 31 December
Notes
2012
Kshs’000
2011
Kshs’000
Gross written premium 5 (b) 9,054,770 7,253,140
Gross earned premium 5 (b) 8,462,797 6,602,606
Reinsurance ceded (1,929,553) (1,408,155)
Net earned premium - 6,533,244 5,194,451
Investment income 6 2,439,796 1,068,311
Commissions earned - 427,598 390,037
Other income 7 86,330 100,271
Total Income 9,486,968 6,753,070
Claims and policy owners’ benefi ts payable 8 (4,709,456) (3,099,398)
Less: Amount recoverable from reinsurers - 771,161 172,625
Net claims payable - (3,938,295) (2,926,773)
Operating and other expenses 9 (2,580,485) (1,698,134)
Commissions payable - (1,058,761) (864,216)
Total expenses & commissions (3,639,246) (2,562,350)
Finance costs 36 (a) (161,476) (52,252)
Share of associates loss - - (1,783)
Profi t before tax - 1,747,951 1,209,912
Income tax expense 11 (366,920) (290,228)
Profi t for the year (of which 39,195,000, 2011: Shs 192,296,000) has been dealt with in
the accounts of the company)
- 1,381,031 919,684
Profi t attributable to:
Owners of the parent - 1,282,006 882,215
Non-controlling interests - 99,025 37,469
Profi t for the year - 1,381,031 919,684
Basic and diluted EPS 12 9.83 7.35
The notes on pages 50 to 106 are an integral part of these fi nancial statements
PROFIT OR LOSSANNUAL REPORT & FINANCIAL STATEMENTS - 2012

BU
SIN
ES
S R
EV
IEW
CO
RP
OR
AT
E G
OV
ER
NA
NC
EF
INA
NC
IAL
STA
TE
ME
NT
SN
OT
ES
TO
TH
E F
INA
NC
IAL
SA
DD
ITIO
NA
L IN
FO
RM
AT
ION
UAP HOLDINGS LIMITED 43
Notes
2012
Kshs’000
2011
Kshs’000
Profi t for the year 1,381,031 919,684
Other comprehensive income / (loss)
Items that will be recycled to profi t or loss
Exchange differences on translating foreign operations (82,142) (31,345)
Total items that will be recycled to profi t or loss (82,142) (31,345)
Items that will not be recycled to profi t or loss
Gains/(losses) on revaluation of equity investments; - -
Listed ordinary shares 24 756,192 (660,941)
Unlisted ordinary shares 24 18,889 816
Total items that will not be recycled to profi t or loss 775,081 (660,125)
Other comprehensive income for the year, net of tax 692,939 (691,470)
Total comprehensive income for the year 2,073,970 228,214
Total comprehensive income attributable to:
Owners of the Company 1,999,364 211,377
Non-controlling interests 74,606 16,837
Total 2,073,970 228,214
The notes on pages 50 to 106 are an integral part of these fi nancial statements
Consolidated statement comprehensive incomefor the year ended 31 December
ANNUAL REPORT & FINANCIAL STATEMENTS - 2012 COMPREHENSIVE INCOME

BU
SIN
ES
S R
EV
IEW
CO
RP
OR
AT
E G
OV
ER
NA
NC
EF
INA
NC
IAL
STA
TE
ME
NT
SN
OT
ES
TO
TH
E F
INA
NC
IAL
SA
DD
ITIO
NA
L IN
FO
RM
AT
ION
UAP HOLDINGS LIMITED44
Notes
2012
Kshs’000
2011
Kshs’000
CAPITAL EMPLOYED
Share capital 13 1,057,099 600,000
Share premium 13 4,612,626 -
Fair value reserve for equity investments 14 1,367,361 591,773
Retained earnings 15 3,647,353 2,849,641
Proposed dividend 16 317,130 204,000
Translation reserve (166,105) (107,875)
Statutory reserve 17 136,563 115,088
Shareholders’ funds 10,972,027 4,252,627
Non-controlling Interest 605,324 394,674
Total equity 11,577,351 4,647,301
REPRESENTED BY:
Assets
Goodwill 18 65,667 50,545
Property and equipment 19 (a) 176,063 174,141
Intangible assets 20 (a) 216,658 209,516
Investment properties 21 (a) 8,119,908 5,126,783
Deferred income tax asset 22 47,991 28,884
Retirement benefi t asset 23 147,739 128,378
Equity investment at fair value through other comprehensive income 24 (a) 2,699,667 1,889,088
Equity investment at fair value through profi t or loss 24 (b) 806,764 617,753
Mortgage loans receivable 26 147,367 134,421
Current income tax recoverable 11 50,941 26,672
Reinsurers share of insurance liabilities 27 1,524,681 1,315,945
Deferred acquisition cost 28 258,863 216,328
Receivables arising out of direct insurance arrangements 1,867,900 1,038,578
Receivables arising out of reinsurance arrangements 485,929 134,952
Other receivables 29 (a) 487,671 194,351
Corporate bonds 426,683 136,137
Government securities 30 3,208,574 1,692,919
Deposits with fi nancial institutions 31 2,911,339 752,894
Cash and Bank balances 31 964,607 642,113
Total assets 24,615,012 14,510,398
Liabilities
Deferred income tax liability 22 243,891 125,726
Insurance contract liabilities 32 3,393,835 2,801,057
Payable under deposit administration contracts 33 2,202,817 1,712,685
Unit-linked investment contracts 34 847,364 658,841
Borrowings 36 (a) 1,017,036 1,153,153
Provision for unearned premium 37 3,378,507 2,769,805
Current income tax payable 11 9,269 62,082
Creditors arising from reinsurance arrangements 1,069,623 370,630
Other payables 38 (a) 875,319 209,118
Total liabilities 13,037,661 9,863,097
Net Assets 11,577,351 4,647,301
The notes on pages 50 to 106 are an integral part of these fi nancial statements
The fi nancial statements on pages 42 to 106 were approved for issue by the board of directors on 26 April 2013 and signed on
its behalf by:
Dr JB Wanjui CBS (Chairman) Dominic Kiarie (Managing Director)
Consolidated statement of fi nancial positonas at 31 December

BU
SIN
ES
S R
EV
IEW
CO
RP
OR
AT
E G
OV
ER
NA
NC
EF
INA
NC
IAL
STA
TE
ME
NT
SN
OT
ES
TO
TH
E F
INA
NC
IAL
SA
DD
ITIO
NA
L IN
FO
RM
AT
ION
UAP HOLDINGS LIMITED 45
2012 2011
Notes Kshs’000 Kshs’000
CAPITAL EMPLOYED
Share capital 13 1,057,099 600,000
Share premium 13 4,612,626 -
Retained earnings 228,743 608,678
Proposed Dividend 16 317,130 204,000
Total equity 6,215,598 1,412,678
REPRESENTED BY:
Assets
Property and equipment 19 (b) 32,389 53,398
Intangible assets 20 (b) 215,130 209,516
Investment properties 21 (b) 1,520,000 1,000,000
Investment in associate 25 (a) - 3,255
Investment in subsidiaries 25 (b) 2,261,979 1,626,708
Amounts due from subsidiaries 43 1,266,041 492,783
Other receivables 29 (b) 13,181 69,065
Deposits with Financial institutions 31 2,529,780 -
Cash and Bank balances 31 97,360 31,863
Total assets 7,935,860 3,486,588
Liabilities
Borrowings 36 (b) - 890,000
Deferred income tax 3,141 3,141
Amounts due to subsidiaries 43 1,405,155 1,115,853
Other payables 38 (b) 311,966 64,916
Total liabilities 1,720,262 2,073,910
Net assets 6,215,598 1,412,678
The notes on pages 50 to 106 are an integral part of these fi nancial statements
Company statement of fi nancial positionas at 31 December
ANNUAL REPORT & FINANCIAL STATEMENTS - 2012 FINANCIAL POSITION
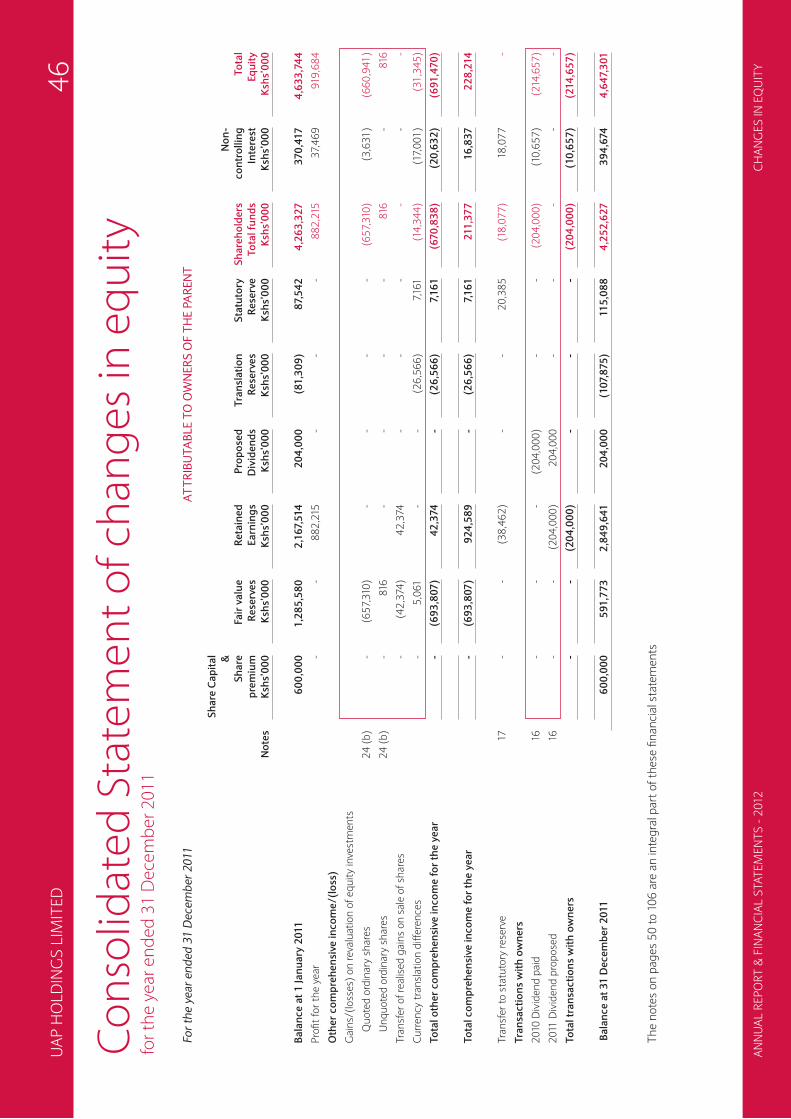
UA
P H
OL
DIN
GS
LIM
ITE
D4
6
Co
nso
lidat
ed
Sta
tem
en
t o
f ch
ang
es
in e
qu
ity
for
the
ye
ar e
nd
ed
31
De
cem
be
r 2
01
1
For
the
ye
ar
en
de
d 3
1 D
ece
mb
er
20
11
A
TT
RIB
UT
AB
LE
TO
OW
NE
RS
OF
TH
E P
AR
EN
T
No
tes
Sh
are
Ca
pit
al &
Sh
are
pre
miu
m
Ksh
s’0
00
Fa
ir v
alu
e
Re
serv
es
Ksh
s’0
00
Re
tain
ed
Ea
rnin
gs
Ksh
s’0
00
Pro
po
sed
Div
ide
nd
s
Ksh
s’0
00
Tra
nsl
ati
on
Re
serv
es
Ksh
s’0
00
Sta
tuto
ry
Re
serv
e
Ksh
s’0
00
Sh
are
ho
lde
rs
To
tal
fun
ds
Ksh
s’0
00
No
n-
co
ntr
oll
ing
Inte
rest
Ksh
s’0
00
To
tal
Eq
uit
y
Ksh
s’0
00
Ba
lan
ce
at
1 J
an
ua
ry 2
01
1
6
00
,00
0
1,2
85
,58
0
2,1
67,
51
4
20
4,0
00
(8
1,3
09
)8
7,5
42
4
,26
3,3
27
3
70
,41
7
4,6
33
,74
4
Pro
fi t
for
the
ye
ar
--
88
2,2
15
--
-8
82
,215
3
7,4
69
9
19,6
84
Oth
er
co
mp
reh
en
sive
in
co
me
/(l
oss
)
Ga
ins/
(lo
sse
s) o
n r
eva
luat
ion
of
eq
uit
y in
vest
me
nts
Qu
ote
d o
rdin
ary
sh
are
s 2
4 (
b)
- (6
57,
310
)-
- -
- (6
57,
310
)(3
,63
1)
(66
0,9
41
)
Un
qu
ote
d o
rdin
ary
sh
are
s 2
4 (
b)
- 8
16
- -
- -
816
-
816
Tra
nsf
er
of
rea
lise
d g
ain
s o
n s
ale
of
sha
res
- (4
2,3
74
)4
2,3
74
-
- -
- -
-
Cu
rre
ncy
tra
nsl
atio
n d
iffe
ren
ces
- 5
,06
1
- -
(26
,56
6)
7,16
1
(14
,34
4)
(17,
00
1)
(31
,34
5)
To
tal
oth
er
co
mp
reh
en
sive
in
co
me
fo
r th
e y
ea
r -
(69
3,8
07
)4
2,3
74
-
(26
,56
6)
7,1
61
(6
70
,83
8)
(20
,63
2)
(69
1,4
70
)
To
tal
co
mp
reh
en
sive
in
co
me
fo
r th
e y
ea
r
- (6
93
,80
7)
92
4,5
89
-
(26
,56
6)
7,1
61
2
11
,37
7
16
,83
7
22
8,2
14
Tra
nsf
er
to s
tatu
tory
re
serv
e
1
7
- -
(38
,46
2)
- -
20
,38
5
(18
,07
7)
18,0
77
-
Tra
nsa
cti
on
s w
ith
ow
ne
rs
20
10 D
ivid
en
d p
aid
16
-
- -
(20
4,0
00
)-
- (2
04
,00
0)
(10
,65
7)
(214
,65
7)
20
11 D
ivid
en
d p
rop
ose
d
1
6
- -
(20
4,0
00
)2
04
,00
0
- -
- -
-
To
tal
tra
nsa
cti
on
s w
ith
ow
ne
rs
- -
(20
4,0
00
)-
- -
(20
4,0
00
)(1
0,6
57
)(2
14
,65
7)
Ba
lan
ce
at
31
De
ce
mb
er
20
11
60
0,0
00
5
91
,77
3
2,8
49
,64
1
20
4,0
00
(1
07,
87
5)
11
5,0
88
4
,25
2,6
27
3
94
,67
4
4,6
47,
30
1
Th
e n
ote
s o
n p
ag
es
50
to
10
6 a
re a
n in
teg
ral p
art
of
the
se fi
na
nci
al s
tate
me
nts
CH
AN
GE
S IN
EQ
UIT
YA
NN
UA
L R
EP
OR
T &
FIN
AN
CIA
L S
TA
TE
ME
NT
S -
20
12

UA
P H
OL
DIN
GS
LIM
ITE
D4
7
AT
TR
IBU
TA
BL
E T
O O
WN
ER
S O
F T
HE
PA
RE
NT
No
tes
Sh
are
Ca
pit
al &
Sh
are
pre
miu
m
Ksh
s’0
00
Fa
ir v
alu
e
Re
serv
es
Ksh
s’0
00
Re
tain
ed
Ea
rnin
gs
Ksh
s’0
00
Pro
po
sed
Div
ide
nd
s
Ksh
s’0
00
Tra
nsl
ati
on
Re
serv
es
Ksh
s’0
00
Sta
tuto
ry
Re
serv
e
Ksh
s’0
00
To
tal
Ksh
s’0
00
No
n-
co
ntr
oll
ing
Inte
rest
Ksh
s’0
00
To
tal
Ksh
s’0
00
Ba
lan
ce
at
1 J
an
ua
ry 2
01
2
6
00
,00
0
59
1,7
73
2
,84
9,6
41
2
04
,00
0
(10
7,8
75
)1
15
,08
8
4,2
52
,62
7
39
4,6
74
4
,64
7,3
01
Pro
fi t
for
the
ye
ar
--
1,2
82
,00
6
--
-1
,28
2,0
06
9
9,0
25
1
,38
1,0
31
Oth
er
co
mp
reh
en
sive
in
co
me
/(l
oss
)
Ga
ins/
(lo
sse
s) o
n r
eva
lua
tio
n o
f e
qu
ity
inve
stm
en
ts
Qu
ote
d o
rdin
ary
sh
are
s 2
4 (
b)
- 7
56
,69
9
- -
- -
75
6,6
99
(5
07
)7
56
,19
2
Un
qu
ote
d o
rdin
ary
sh
are
s 2
4 (
b)
- 18
,88
9
- -
- -
18,8
89
-
18,8
89
Inco
me
ta
x o
n o
the
r co
mp
reh
en
sive
inco
me
-
- -
- -
- -
- -
Cu
rre
ncy
tra
nsl
atio
n d
iffe
ren
ces
- -
- -
(58
,23
0)
- (5
8,2
30
)(2
3,9
12)
(82
,14
2)
To
tal
oth
er
co
mp
reh
en
sive
in
co
me
fo
r th
e y
ea
r -
77
5,5
88
-
- (5
8,2
30
)-
71
7,3
58
(2
4,4
19
)6
92
,93
9
To
tal
co
mp
reh
en
sive
in
co
me
fo
r th
e y
ea
r -
77
5,5
88
1
,28
2,0
06
-
(58
,23
0)
- 1
,99
9,3
64
7
4,6
06
2
,07
3,9
70
Tra
nsf
er
to s
tatu
tory
re
serv
e
1
7
- -
(40
,52
2)
- -
21
,47
5
(19
,04
7)
19,0
47
-
Tra
nsa
cti
on
s w
ith
ow
ne
rs
Issu
e o
f sh
are
s
13
5
,06
9,7
25
-
- -
- -
5,0
69
,72
5
- 5
,06
9,7
25
No
n-c
on
tro
llin
g in
tere
st a
cqu
ire
d in
th
e y
ea
r 2
5 (
a)
- -
(24
,64
2)
- -
- (2
4,6
42
)13
1,3
33
10
6,6
91
20
11 D
ivid
en
d p
aid
16
-
- (2
04
,00
0)
- -
(20
4,0
00
)(1
4,3
36
)(2
18,3
36
)
20
12 In
teri
m d
ivid
en
d p
aid
16
-
- (1
02
,00
0)
- -
- (1
02
,00
0)
- (1
02
,00
0)
20
12 F
ina
l div
ide
nd
pro
po
sed
16
-
- (3
17,1
30
)3
17,1
30
-
- -
--
To
tal
tra
nsa
cti
on
s w
ith
ow
ne
rs
5,0
69
,72
5
- (4
43
,77
2)
11
3,1
30
-
- 4
,73
9,0
83
1
16
,99
7
4,8
56
,08
0
Ba
lan
ce
at
31
De
ce
mb
er
20
12
5,6
69
,72
5
1,3
67,
36
1
3,6
47,
35
3
31
7,1
30
(1
66
,10
5)
13
6,5
63
1
0,9
72
,02
7
60
5,3
24
1
1,5
77,
35
1
Th
e n
ote
s o
n p
ag
es
50
to
10
6 a
re a
n in
teg
ral p
art
of
the
se fi
na
nci
al s
tate
me
nts
Co
nso
lidat
ed
Sta
tem
en
t o
f ch
ang
es
in e
qu
ity
for
the
ye
ar e
nd
ed
31
De
cem
be
r 2
01
2
INC
OM
E S
TA
TE
ME
NT
AN
NU
AL
RE
PO
RT
& F
INA
NC
IAL
STA
TE
ME
NT
S -
20
12

BU
SIN
ES
S R
EV
IEW
CO
RP
OR
AT
E G
OV
ER
NA
NC
EF
INA
NC
IAL
STA
TE
ME
NT
SN
OT
ES
TO
TH
E F
INA
NC
IAL
SA
DD
ITIO
NA
L IN
FO
RM
AT
ION
UAP HOLDINGS LIMITED48
Notes
Share Capital
&
Share
premium
Kshs’000
Retained
Earnings
Kshs’000
Proposed
Dividends
Kshs’000
Total
Kshs’000
Balance at 1 January 2011 600,000 620,382 204,000 1,424,382
Profi t for the year - 192,296 - 192,296
Other comprehensive income - - - -
Total comprehensive income for the year - 192,296 - 192,296
Transactions with owners
2010 Dividend paid 16 (204,000) (204,000)
2011 Dividend proposed 16 (204,000) 204,000 -
Total transactions with owners - (204,000) - (204,000)
Balance at 31 December 2011 600,000 608,678 204,000 1,412,678
Balance at 1 January 2012 600,000 608,678 204,000 1,412,678
Profi t for the year - 39,195 - 39,195
Other comprehensive income/(loss) - - - -
Total comprehensive income for the year - 39,195 - 39,195
Transactions with owners
Issue of shares 13 5,069,725 - - 5,069,725
2011 Dividend paid 16 - - (204,000) (204,000)
2012 Interim dividend paid 16 - (102,000) - (102,000)
2012 Final dividend proposed 16 - (317,130) 317,130 -
Total transactions with owners 5,069,725 (419,130) 113,130 4,763,725
Balance at 31 December 2012 5,669,725 228,743 317,130 6,215,598
The notes on pages 50 to 106 are an integral part of these fi nancial statements
Company statement of changes in equityfor the year ended 31 December
CHANGES IN EQUITYANNUAL REPORT & FINANCIAL STATEMENTS - 2012
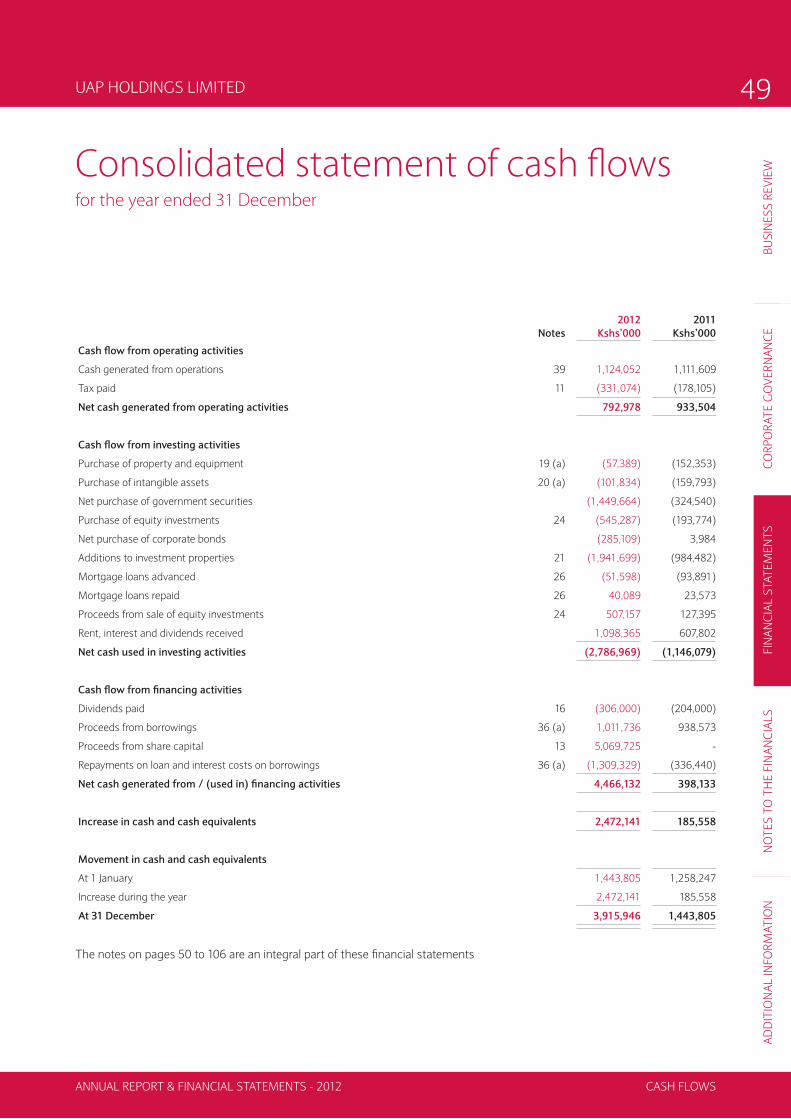
BU
SIN
ES
S R
EV
IEW
CO
RP
OR
AT
E G
OV
ER
NA
NC
EF
INA
NC
IAL
STA
TE
ME
NT
SN
OT
ES
TO
TH
E F
INA
NC
IAL
SA
DD
ITIO
NA
L IN
FO
RM
AT
ION
UAP HOLDINGS LIMITED 49
for the year ended 31 December
Notes
2012
Kshs’000
2011
Kshs’000
Cash fl ow from operating activities
Cash generated from operations 39 1,124,052 1,111,609
Tax paid 11 (331,074) (178,105)
Net cash generated from operating activities 792,978 933,504
Cash fl ow from investing activities
Purchase of property and equipment 19 (a) (57,389) (152,353)
Purchase of intangible assets 20 (a) (101,834) (159,793)
Net purchase of government securities (1,449,664) (324,540)
Purchase of equity investments 24 (545,287) (193,774)
Net purchase of corporate bonds (285,109) 3,984
Additions to investment properties 21 (1,941,699) (984,482)
Mortgage loans advanced 26 (51,598) (93,891)
Mortgage loans repaid 26 40,089 23,573
Proceeds from sale of equity investments 24 507,157 127,395
Rent, interest and dividends received 1,098,365 607,802
Net cash used in investing activities (2,786,969) (1,146,079)
Cash fl ow from fi nancing activities
Dividends paid 16 (306,000) (204,000)
Proceeds from borrowings 36 (a) 1,011,736 938,573
Proceeds from share capital 13 5,069,725 -
Repayments on loan and interest costs on borrowings 36 (a) (1,309,329) (336,440)
Net cash generated from / (used in) fi nancing activities 4,466,132 398,133
Increase in cash and cash equivalents 2,472,141 185,558
Movement in cash and cash equivalents
At 1 January 1,443,805 1,258,247
Increase during the year 2,472,141 185,558
At 31 December 3,915,946 1,443,805
The notes on pages 50 to 106 are an integral part of these fi nancial statements
Consolidated statement of cash fl ows
ANNUAL REPORT & FINANCIAL STATEMENTS - 2012 CASH FLOWS

BU
SIN
ES
S R
EV
IEW
CO
RP
OR
AT
E G
OV
ER
NA
NC
EF
INA
NC
IAL
STA
TE
ME
NT
SN
OT
ES
TO
TH
E F
INA
NC
IAL
SA
DD
ITIO
NA
L IN
FO
RM
AT
ION
UAP HOLDINGS LIMITED50
Notes to the fi nancial statementsFor the year ended 31 December 2012 - continuedNotes to the fi nancial statementsFor the year ended 31 December 2012
1. General information
The Company is incorporated in Kenya under the
Companies Act as a limited liability company, and is
domiciled in Kenya. The address of its registered offi ce
is Bishops Garden Towers, Bishops Road, P.O. Box
43013 - 00100 Nairobi.
The Company has fi ve subsidiary companies that
operate as insurance companies and one subsidiary
company, UAP Credit Services Limited that provides
insurance premiums fi nancing services. The Company
also holds investments in three property holding
Companies listed in Kenya, Uganda and South Sudan.
Three of the Company’s insurance subsidiaries are
short term (“general”) insurance companies, one is
a long term (“life”) insurance company and one is a
composite insurance company selling both general
and life insurance. Long term business comprises life
assurance business, deposit administration business
and investment contracts. Life assurance business
relates to the underwriting of risks relating to death
of an insured person, and includes contracts subject
to the payment of premiums for a term dependent on
the termination or continuance of the life of an insured
person. Short term (general) insurance business
relates to all other categories of short term insurance
business, analysed into several sub-classes of business
based on the nature of the assumed risks. UAP Credit
Services Limited provides premium fi nancing services
to policyholders of the Group’s Kenyan insurance
companies. The Group has a subsidiary UAP Financial
Services Limited, a Ugandan based Company that
provides stock broking services. UAP Properties
(Kenya) Limited; UAP Properties (Uganda) Limited
and UAP Properties (South Sudan) Limited are
property holding companies for UAP Tower, Nakawa
Business Park and Equitorial Towers which are located
in Nairobi, Kampala and South Sudan respectively.
2. Summary of signifi cant accounting policies
The principal accounting policies adopted in the
preparation of these fi nancial statements are set out
below. These policies have been consistently applied
to all years presented, unless otherwise stated.
(a) Basis of preparation
The fi nancial statements are prepared in compliance
with International Financial Reporting Standards
(IFRS). The measurement basis applied is the
historical cost basis, except where otherwise stated
in the accounting policies below. The fi nancial
statements are presented in the functional currency
of the company Kenya Shillings (Shs), rounded to the
nearest thousand.
The preparation of fi nancial statements in
conformity with IFRS requires the use of estimates
and assumptions. It also requires management to
exercise its judgement in the process of applying the
Company’s accounting policies. The areas involving a
higher degree of judgement or complexity, or where
assumptions and estimates are signifi cant to the
fi nancial statements, are disclosed in Note 3.
Adoption of new and revised standards
(i) Standards early adopted in 2012 (Financial Statement)
IFRS 9 ‘Financial Instruments’- effective 1 January 2015.
In 2009, the Group early adopted IFRS 9 provisions
relating to the classifi cation and measurement of
fi nancial assets. In 2010, IFRS 9 provisions relating
to the classifi cation and measurement of fi nancial
liabilities were released and early adopted by the
Group. The early adoption of the provisions relating
to the classifi cation and measurement of fi nancial
liabilities did not have a material impact on the Group’s
fi nancial statements for 2011 as the classes remained
similar to those under IAS 39, fi nancial instruments,
as previously applied by the Group.
IAS 1, ‘Presentation of fi nancial statements -
effective 1 July 2012
In 2011 the group early adopted IAS 1. The amendment
changed the disclosure of items presented in other
comprehensive income (OCI) in the statement of
comprehensive income. Entities are required to
separate items presented in other comprehensive
income (OCI) into two groups, based on whether or
not they may be recycled to profi t or loss in the future.
NOTES TO THE FINANACIAL STATEMENTS ANNUAL REPORT & FINANCIAL STATEMENTS - 2012

BU
SIN
ES
S R
EV
IEW
CO
RP
OR
AT
E G
OV
ER
NA
NC
EF
INA
NC
IAL
STA
TE
ME
NT
SN
OT
ES
TO
TH
E F
INA
NC
IAL
SA
DD
ITIO
NA
L IN
FO
RM
AT
ION
UAP HOLDINGS LIMITED 51
Notes to the fi nancial statementsFor the year ended 31 December 2012 - continued
2. Summary of signifi cant accounting policies
(continued)
(a) Basis of preparation (continued)
Adoption of new and revised standards
(continued)
Items that will not be recycled will be presented
separately from items that may be recycled in the
future. Entities that choose to present OCI items
before tax will be required to show the amount of tax
related to the two groups separately. The title used
by IAS 1 for the statement of comprehensive income
has changed to ‘statement of profi t or loss and other
comprehensive income’, though IAS 1 still permits
entities to use other titles. The early adoption of the
amendments to IAS 1 by the Group did not have a
material impact in the fi nancial statements
(ii) Standards, amendments and interpretations to
existing standards that are not yet effective and have
not been early adopted by the Group
A number of new standards and amendments to
standards and interpretations are effective for annual
periods beginning after 1 January 2012, and have not
been applied in preparing these fi nancial statements.
None of these is expected to have a signifi cant effect
on the fi nancial statements of the Group,
(iii) Standards, amendments and interpretations to
existing standards that are not yet effective and have
not been early adopted by the Group
IFRS 13, ‘Fair value measurement’, aims to improve
consistency and reduce complexity by providing a
precise defi nition of fair value and a single source of fair
value measurement and disclosure requirements for
use across IFRSs. The requirements, which are largely
aligned between IFRSs and US GAAP, do not extend
the use of fair value accounting but provide guidance
on how it should be applied where its use is already
required or permitted by other standards within IFRSs
or US GAAP. The application of IFRS 13 may enhance
fair value disclosures in certain circumstances.
IAS 19, ‘Employee benefi ts’, was amended in June 2012.
The impact on the Company will be as follows:
to immediately recognise all past service costs; and
to replace interest cost and expected return on plan
assets with a net interest amount that is calculated by
applying the discount rate to the net defi ned benefi t
liability (asset). The directors are yet to assess the full
impact of the amendments.
There are no other IFRS’s or IFRIC interpretations that
are not yet effective that would be expected to have
material impact on the Group.
(b) Insurance contracts
Classifi cation
The Group issues contracts that transfer insurance
risk. Insurance contracts are those contracts that
transfer signifi cant insurance risk. As a general
guideline, the group defi nes as signifi cant insurance
risk, the possibility of having to pay benefi ts on the
occurrence of an insured event that are at least 10%
more than the benefi ts payable if the insured event
did not occur.
Insurance contracts are classifi ed into two main
categories, depending on the duration of risk and
as per the provisions of the Insurance Act: long
term insurance business and short term insurance
business.
i) Long term insurance business
Includes business of all or any of the following classes,
namely; group life business, ordinary life business,
deposit administration business and unit linked
business. Life insurance business means the business
of, or in relation to, the issuing of, or the undertaking
of liability to pay money on death (not being death
by accident or in specifi ed sickness only) or on the
happening of any contingency dependent on the
termination or continuance of human life (either with
or without provision for a benefi t under a continuous
disability insurance contract), and include a contract
which is subject to the payment of premiums for
NOTES TO THE FINANACIAL STATEMENTSANNUAL REPORT & FINANCIAL STATEMENTS - 2012

BU
SIN
ES
S R
EV
IEW
CO
RP
OR
AT
E G
OV
ER
NA
NC
EF
INA
NC
IAL
STA
TE
ME
NT
SN
OT
ES
TO
TH
E F
INA
NC
IAL
SA
DD
ITIO
NA
L IN
FO
RM
AT
ION
UAP HOLDINGS LIMITED52
Notes to the fi nancial statementsFor the year ended 31 December 2012 - continued
2. Summary of signifi cant accounting policies
(continued)
(b) Insurance contracts (continued)
term dependent on the termination or continuance
of human life and any contract securing the grant
of an annuity for a term dependent upon human
life. Superannuation business means life assurance
business, being business of, or in relation to, the
issuing of or the undertaking of the liability under
superannuation, group life and permanent health
insurance policy.
ii) Short term insurance business
Means insurance business of any class or classes
not being long term insurance business. Classes
of general insurance include aviation insurance,
engineering insurance, fi re insurance - domestic
risks, fi re insurance - industrial and commercial risks,
liability insurance, marine insurance, motor insurance-
private vehicles, motor insurance - commercial
vehicles, personal accident insurance, theft insurance,
workmen’s compensation and employer’s liability
insurance and miscellaneous insurance (i.e. class of
business not included under those listed above)
Motor insurance business means the business of
affecting and carrying out contracts of insurance
against loss of, or damage to, or arising out of or in
connection with the use of, motor vehicles, inclusive
of third party risks but exclusive of transit risks.
Personal accident insurance business means the
business of affecting and carrying out contracts
of insurance against risks of the persons insured
sustaining injury as the result of an accident or of an
accident of a specifi ed class or dying as the result of
an accident or of an accident of a specifi ed class or
becoming incapacitated in consequence of disease or
of disease of a specifi ed class.
Fire insurance business means the business of
affecting and carrying out contracts of insurance,
otherwise than incidental to some other class of
insurance business against loss or damage to property
due to fi re, explosion, storm and other occurrences
customarily included among the risks insured against
in the fi re insurance business.
Recognition and measurement
i) Premium income
For long term insurance business, premiums are
recognised as revenue when they become payable
by the contract holder. Premiums are shown before
deduction of commission.
For short term insurance business, premium income
is recognised on assumption of risks, and includes
estimates of premiums due but not yet received less
unearned premium. Unearned premiums represent
the proportion of the premiums written in periods up
to the accounting date that relates to the unexpired
terms of policies in force at the fi nancial reporting date,
and is computed using the 365ths method. Premiums
are shown before deduction of commission and are
gross of any taxes or duties levied on premiums.
ii) Claims
For long term insurance business, benefi ts are
recorded as an expense when they are incurred.
Claims arising on maturing policies are recognised
when the claim becomes due for payment. Death
claims are accounted for on notifi cation. Surrenders
are accounted for on payment.
For short term insurance business, claims incurred
comprise claims paid in the year and changes in
the provision for outstanding claims. Claims paid
represent all payments made during the year, whether
arising from events during that or earlier years.
Outstanding claims represent the estimated ultimate
cost of settling all claims arising from incidents
occurring prior to the fi nancial reporting date, but not
settled at that date.
Outstanding claims are computed on the basis of the
best information available at the time the records for
the year are closed, and include provisions for claims
incurred but not reported (“IBNR”). Outstanding
claims are not discounted.
NOTES TO THE FINANACIAL STATEMENTS ANNUAL REPORT & FINANCIAL STATEMENTS - 2012

BU
SIN
ES
S R
EV
IEW
CO
RP
OR
AT
E G
OV
ER
NA
NC
EF
INA
NC
IAL
STA
TE
ME
NT
SN
OT
ES
TO
TH
E F
INA
NC
IAL
SA
DD
ITIO
NA
L IN
FO
RM
AT
ION
UAP HOLDINGS LIMITED 53
Notes to the fi nancial statementsFor the year ended 31 December 2012 - continued
2. Summary of signifi cant accounting policies
(continued)
(b) Insurance contracts (continued)
Recognition and measurement (continued)
iii) Commissions payable and deferred acquisition costs
(“DAC”)
Commissions payable are based on the premium
written and are recorded as an expense in the period
in which they are incurred.
A proportion of commissions payable is deferred
and amortised over the period in which the related
premium is earned. Deferred acquisition costs
represent a proportion of acquisition costs that relate
to policies that are in force at the period end.
iv) Liability adequacy test
At each fi nancial reporting date, liability adequacy
tests are performed to ensure the adequacy of the
insurance contract liabilities net of related DAC. In
performing these tests, current best estimates of
future contractual cash fl ows and claims handling
and administration expenses, as well as investment
income from the assets backing such liabilities, are
used. Any defi ciency is immediately charged to profi t
or loss.
v) Reinsurance contracts held
Contracts entered into by the Group with reinsurers
under which the Group is compensated for losses on
one or more contracts issued by the Group and that
meet the classifi cation requirements for insurance
contracts are classifi ed as reinsurance contracts
held. Contracts that do not meet these classifi cation
requirements are classifi ed as fi nancial assets.
Insurance contracts entered into by the Group under
which the contract holder is another insurer (inwards
reinsurance) are included with insurance contracts.
The benefi ts to which the Group is entitled under
its reinsurance contracts held are recognised as
reinsurance assets. These assets consist of short-
term balances due from reinsurers, as well as longer
term receivables that are dependent on the expected
claims and benefi ts arising under the related reinsured
insurance contracts. Amounts recoverable from or
due to reinsurers are measured consistently with the
amounts associated with the reinsured insurance
contracts and in accordance with the terms of each
reinsurance contract. Reinsurance liabilities are
primarily premiums payable for reinsurance contracts
and are recognised as an expense when due.
The Group assesses its reinsurance assets for
impairment on a quarterly basis. If there is objective
evidence that the reinsurance asset is impaired, the
Group reduces the carrying amount of the reinsurance
asset to its recoverable amount and recognises that
impairment loss in profi t or loss. The Group gathers
the objective evidence that a reinsurance asset is
impaired using the same process adopted for fi nancial
assets held at amortised cost. The impairment loss is
also calculated following the same method used for
these fi nancial assets. These processes are set out
under Note 2(j)
vi) Receivables and payables related to insurance
contracts and investment contracts
Receivables and payables are recognised when due.
These include amounts due to and from agents,
brokers and insurance contract holders.
If there is objective evidence that the insurance
receivable is impaired, the Group reduces the carrying
amount of the insurance receivable accordingly
and recognises that impairment loss in the income
statement. The Group gathers the objective evidence
that an insurance receivable is impaired using the
same process adopted for fi nancial assets classifi ed at
amortised cost. The impairment loss is also calculated
under the same method used for these fi nancial assets.
These processes are described under Note 2 (j).
vii) Salvage and subrogation reimbursements
Some insurance contracts permit the Group to sell
(usually damaged) property acquired in settling a
claim (for example, salvage).
NOTES TO THE FINANACIAL STATEMENTSANNUAL REPORT & FINANCIAL STATEMENTS - 2012

BU
SIN
ES
S R
EV
IEW
CO
RP
OR
AT
E G
OV
ER
NA
NC
EF
INA
NC
IAL
STA
TE
ME
NT
SN
OT
ES
TO
TH
E F
INA
NC
IAL
SA
DD
ITIO
NA
L IN
FO
RM
AT
ION
UAP HOLDINGS LIMITED54
Notes to the fi nancial statementsFor the year ended 31 December 2012 - continued
2. Summary of signifi cant accounting policies
(continued)
(b) Insurance contracts (continued)
The Group may also have the right to pursue third
parties for payment of some or all costs (for example,
subrogation).
Estimates of salvage recoveries are included as an
allowance in the measurement of the insurance liability
for claims, and salvage property is recognised in other
assets when the liability is settled. The allowance is
the amount that can reasonably be recovered from
the disposal of the property.
Subrogation reimbursements are also considered as
an allowance in the measurement of the insurance
liability for claims and are recognised in other assets
when the liability is settled. The allowance is the
assessment of the amount that can be recovered from
the action against the liable third party.
(c) Revenue recognition
i) Insurance premium revenue
The revenue recognition policy relating to insurance
contracts is set out under note 2 (b) above
ii) Commissions
Commissions receivable are recognised as income in
the period in which they are earned.
iii) Interest income
Interest income is recognised on a time proportion
basis that takes into account the effective yield on
the asset. When a receivable is impaired, the Group
reduces the carrying amount to its recoverable
amount, being the estimated future cash fl ow
discounted at the original effective interest rate of the
instrument, and continues unwinding the discount as
interest income.
iv) Dividend income
Dividends are recognised as income in the period in
which the right to receive payment is established.
v) Rental income
Rental income is recognised as income in the period in
which it is earned. All investment income is stated net
of investment expenses.
vi) Fee income
Fee income consists primarily of administration fees
arising from services rendered in relation to the issue
and management of deposit administration and
investment contracts. Fees are recognised in the
accounting period in which the services are rendered
and are presented in the income statement within
‘other income’.
(d) Investment contracts
The Group issues investment contracts without fi xed
terms (unit-linked) and investment contracts with
fi xed and guaranteed terms (fi xed interest rate). The
investment contracts include funds administered for a
number of retirement benefi t schemes.
Investment contracts without fi xed terms are
fi nancial liabilities whose fair value is dependent on
the fair value of underlying fi nancial assets, and are
designated at inception as at fair value through profi t
or loss.
The Group designates these investment contracts to
be measured at fair value through profi t or loss because
it eliminates or signifi cantly reduces a measurement
or recognition inconsistency (sometimes referred to as
‘an accounting mismatch’) that would otherwise arise
from measuring assets or liabilities or recognising the
gains and losses on them on different bases.
The best evidence of the fair value of these fi nancial
liabilities at initial recognition is the transaction price
(i.e. the fair value received) unless the fair value of that
instrument is evidenced by comparison with other
observable current market transactions in the same
instrument or based on a valuation technique whose
variables include only data from observable markets.
When such evidence exists, the Group recognises
profi t at inception.
NOTES TO THE FINANACIAL STATEMENTS ANNUAL REPORT & FINANCIAL STATEMENTS - 2012
BU
SIN
ES
S R
EV
IEW
CO
RP
OR
AT
E G
OV
ER
NA
NC
EF
INA
NC
IAL
STA
TE
ME
NT
SN
OT
ES
TO
TH
E F
INA
NC
IAL
SA
DD
ITIO
NA
L IN
FO
RM
AT
ION
UAP HOLDINGS LIMITED 55
Notes to the fi nancial statementsFor the year ended 31 December 2012 - continued
2. Summary of signifi cant accounting policies
(continued)
(d) Investment contracts (continued)
The fair value of fi nancial liabilities for investment
contracts without fi xed terms is determined using
the current unit values in which the contractual
benefi ts are denominated. These unit values refl ect
the fair values of the fi nancial assets contained within
the Group’s unitised investment funds linked to the
fi nancial liability. The fair value of the fi nancial liabilities
is obtained by multiplying
the number of units attributed to each contract holder
at the fi nancial reporting date by the unit value for the
same date.
For investment contracts with fi xed and guaranteed
terms, the amortised cost basis is used. In this case,
the liability is initially measured at its fair value less
transaction costs that are incremental and directly
attributable to the acquisition or issue of the contract.
Subsequent measurement of investment contracts
at amortised cost uses the effective interest method.
This method requires the determination of an interest
rate (the effective interest rate) that exactly discounts
to the net carrying amount of the fi nancial liability, the
estimated future cash payments or receipts through
the expected life of the fi nancial instrument or, when
appropriate, a shorter period if the holder has the
option to redeem the instrument earlier than maturity.
The Group re-estimates at each reporting date the
expected future cash fl ows and recalculates the
carrying amount of the fi nancial liability by computing
the present value of estimated future cash fl ows using
the fi nancial liability’s original effective interest rate.
Any adjustment is immediately recognised as income
or expense in the income statement.
(e) Property and equipment
All categories of property and equipment are initially
recorded at cost and subsequently stated at historical
cost less depreciation. Historical cost includes
expenditure that is directly attributable to the
acquisition of the items.
Subsequent costs are included in the asset’s
carrying amount or recognised as a separate asset,
as appropriate, only when it is probable that future
economic benefi ts associated with the item will fl ow to
the Group and the cost of the item can be measured
reliably. All other repairs and maintenance costs are
charged to the income statement during the fi nancial
period in which they are incurred.
Depreciation is calculated using the straight line
method to write down their cost to their residual
values over their estimated useful lives, as follows:
• Computer equipment - 3 years
• Motor vehicles - 4 years
• Other furniture and equipment - 5-8 years
The assets’ residual values and useful lives are
reviewed, and adjusted if appropriate, at each fi nancial
reporting date.
An asset’s carrying amount is written down
immediately to its estimated recoverable amount if the
asset’s carrying amount is greater than its estimated
recoverable amount.
Gains and losses on disposal of property and
equipment are determined by comparing proceeds
with carrying amount and are included in the income
statement.
(f ) Investment properties
Buildings, or part of a building, (freehold or held under
a fi nance lease) and land (freehold or held under
an operating lease) held for long term rental yields
and/or capital appreciation and are not occupied
by the Group are classifi ed as investment property
under non-current assets. Investment property is
carried at fair value, representing open market value
determined annually by external valuers. Properties
under construction and development sites with
projected use as Investment properties are valued
at projected fair values taking into account current
market conditions, outstanding investment costs and
a risk loading according to the progress of the project.
Changes in fair values are included in investment
income in the statement of profi t or loss.
NOTES TO THE FINANACIAL STATEMENTSANNUAL REPORT & FINANCIAL STATEMENTS - 2012

BU
SIN
ES
S R
EV
IEW
CO
RP
OR
AT
E G
OV
ER
NA
NC
EF
INA
NC
IAL
STA
TE
ME
NT
SN
OT
ES
TO
TH
E F
INA
NC
IAL
SA
DD
ITIO
NA
L IN
FO
RM
AT
ION
UAP HOLDINGS LIMITED56
Notes to the fi nancial statementsFor the year ended 31 December 2012 - continued
2. Summary of signifi cant accounting policies
(continued)
(g) Intangible assets
The Group’s intangible assets relate to computer
software and goodwill (note 2(v)).
Acquired computer software licences are capitalised on
the basis of the costs incurred to acquire and bring to
use the specifi c software. These costs are amortised
over their estimated useful lives of three years.
Development costs that are directly associated with
the production of identifi able and unique software
products controlled by the Group, and that will
probably generate economic benefi ts exceeding costs
beyond one year, are recognised as intangible assets
if:-
• It is technically feasible to complete the software
product so that it will be available for use;
• Management intends to complete the software
product and use or sell it;
• There is an ability to use or sell the software product;
• It can be demonstrated how the software product
will generate probable future economic benefi ts;
• Adequate technical, fi nancial and other resources
to complete the development and use or sell it are
available; and,
• The expenditure attributable to the software product
during its development can be reliably measured.
Direct costs include the software development,
employee costs and an appropriate portion of relevant
overheads. Other development expediture that do not
meet these criteria are recognised as an expense as
incurred. Development costs that have been expensed
are not recognised as an asset in a subsequent period.
Computer software development costs recognised as
assets are amortised over their estimated useful lives
(not exceeding three years). Costs associated with
maintaining computer software programmes are
recognised as an expense as incurred.
(h) Impairment of non-fi nancial assets
Assets that have an indefi nite useful life are not
subject to amortisation and are tested annually for
impairment. Assets that are subject to amortisation
are reviewed for impairment whenever events or
changes in circumstances indicate that the carrying
amount may not be recoverable. An impairment loss
is recognised for the amount by which the asset’s
carrying amount exceeds its recoverable amount.
The recoverable amount is the higher of an asset’s
fair value less costs to sell and value in use. For the
purposes of assessing impairment, assets are grouped
at the lowest levels for which there are separately
identifi able cash fl ows (cash-generating units). Non-
fi nancial assets other than goodwill that suffered an
impairment are reviewed for possible reversal of the
impairment at each reporting date.
(i) Financial assets
Classifi cation and measurement
The Group classifi es its fi nancial assets as
subsequently measured at either amortised cost or
fair value on the basis of both the Group’s business
model for managing the fi nancial assets and the
contractual cash fl ow characteristics of the fi nancial
asset. A fi nancial asset is measured at amortised cost
if both of the following conditions are met:
• the asset is held within a business model whose
objective is to hold assets in order to collect
contractual cash fl ows.
• the contractual terms of the fi nancial asset give
rise on specifi ed dates to cash fl ows that are solely
payments of principal and interest on the principal
amount outstanding.
The Group’s corporate bonds, government securities,
receivables, mortgage loans, cash at bank and
deposits with fi nancial institutions are classifi ed
at amortised cost. The carrying values of various
categories of Financial asset and Financial liabilities
are shown in note 42. All fi nancial assets that do not
meet the above criteria are measured at fair value.
Equity investments for life business are classifi ed at
fair value through profi t or loss.
NOTES TO THE FINANACIAL STATEMENTS ANNUAL REPORT & FINANCIAL STATEMENTS - 2012
BU
SIN
ES
S R
EV
IEW
CO
RP
OR
AT
E G
OV
ER
NA
NC
EF
INA
NC
IAL
STA
TE
ME
NT
SN
OT
ES
TO
TH
E F
INA
NC
IAL
SA
DD
ITIO
NA
L IN
FO
RM
AT
ION
UAP HOLDINGS LIMITED 57
Notes to the fi nancial statementsFor the year ended 31 December 2012 - continued
2. Summary of signifi cant accounting policies
(continued)
(i) Financial assets (continued)
Equity investment for non life business are classifi ed
at fair value through other comprehensive income
(note 24).
Financial assets are recognised when the Group
becomes a party to the contractual provisions of the
asset.
Initial recognition of fi nancial asset is at fair value plus,
for all fi nancial assets except those carried at fair value
through profi t or loss, transaction costs. Financial
assets are derecognised when the rights to receive
cash fl ows from the fi nancial assets have expired or
where the Group has transferred substantially all risks
and rewards of ownership.
Equity investments are carried at fair value. Gains and
losses arising from changes in the fair value of equity
investments are recognised in other comprehensive
income. When equity investments are derecognised,
the cumulative gain or loss previously recognised
in other comprehensive income are transferred to
retained earnings. Dividends on equity instruments
are recognised in the income statement when the
Group’s right to receive payment is established.
Fair values of quoted investments in active markets
are based on current bid prices. Fair values for unlisted
equity securities are estimated using valuation
techniques. These include the use of recent arm’s
length transactions, discounted cash fl ow analysis
and other valuation techniques commonly used by
market participants.
(j) Impairment of fi nancial assets
Assets carried at amortised cost:
The Group assesses at each fi nancial reporting date
whether there is objective evidence that a fi nancial
asset or a group of fi nancial assets measured at
amortised cost is impaired. A fi nancial asset or a
group of fi nancial assets is impaired and impairment
losses are incurred only if there is objective evidence
of impairment as a result of one or more events that
occurred after initial recognition of the asset (a ‘loss
event’) and that loss event (or events) has an impact
on the estimated future cash fl ows of the fi nancial
asset or group of fi nancial assets that can be reliably
estimated. Objective evidence that a fi nancial asset or
group of assets is impaired includes observable data
that comes to the attention of the Group about the
following loss events:.
• signifi cant fi nancial diffi culty of the borrower;
• a breach of contract, such as default or delinquency
in interest or principal repayments;
• the Group granting to the borrower, for economic
or legal reasons relating to the borrower’s fi nancial
diffi culty, a concession that the Group would not
otherwise consider;
• it becoming probable that the borrower will enter
bankruptcy or other fi nancial reorganisation;
• the disappearance of an active market for that
fi nancial asset because of fi nancial diffi culties; or
observable data indicating that there is a measurable
decrease in the estimated future cash fl ows from a
group of fi nancial assets since the initial recognition
of those assets, although the decrease cannot yet be
identifi ed with the individual fi nancial assets in the
Group, including:
• adverse changes in the payment status of borrowers
in the Group; or
• national or local economic conditions that correlate
with defaults on the assets in the Group
The estimated period between a loss occurring and its
identifi cation is determined by management for each
identifi ed portfolio.
The Group fi rst assesses whether objective evidence
of impairment exists individually for fi nancial assets
that are individually signifi cant, and individually or
collectively for fi nancial assets that are not individually
signifi cant. If the Group determines that no objective
evidence of impairment exists for an individually
assessed fi nancial asset, whether signifi cant or not,
it includes the asset in a group of fi nancial assets
with similar credit risk characteristics and collectively
assesses them for impairment.
NOTES TO THE FINANACIAL STATEMENTSANNUAL REPORT & FINANCIAL STATEMENTS - 2012

BU
SIN
ES
S R
EV
IEW
CO
RP
OR
AT
E G
OV
ER
NA
NC
EF
INA
NC
IAL
STA
TE
ME
NT
SN
OT
ES
TO
TH
E F
INA
NC
IAL
SA
DD
ITIO
NA
L IN
FO
RM
AT
ION
UAP HOLDINGS LIMITED58
Notes to the fi nancial statementsFor the year ended 31 December 2012 - continued
2. Summary of signifi cant accounting policies
(continued)
(j) Impairment of fi nancial assets (continued)
Assets that are individually assessed for impairment
and for which an impairment loss is or continues to be
recognised are not included in a collective assessment
of impairment.
If there is objective evidence that an impairment
loss on fi nancial assets carried at amortised cost has
been incurred, the amount of the loss is measured as
the difference between the asset’s carrying amount
and the present value of estimated future cash fl ows
(excluding future credit losses that have not been
incurred) discounted at the fi nancial instrument’s
original effective interest rate.
The carrying amount of the asset is reduced through
the use of an allowance account and the amount of
the loss is recognised in the income statement. If
a loan has a variable interest rate, the discount rate
for measuring any impairment loss is the current
effective interest rate determined under the contract.
As a practical expedient, the Group may measure
impairment on the basis of an instrument’s fair value
using an observable market price.
The calculation of the present value of the estimated
future cash fl ows of a collateralised fi nancial asset
refl ects the cash fl ows that may result from foreclosure
less costs for obtaining and selling the collateral,
whether or not foreclosure is probable.
For the purposes of a collective evaluation of
impairment, fi nancial assets are grouped on the basis
of similar credit risk characteristics (i.e. on the basis
of the Group’s grading process that considers asset
type, industry, geographical location, collateral type,
past-due status and other relevant factors). Those
characteristics are relevant to the estimation of future
cash fl ows for groups of such assets by being indicative
of the debtors’ ability to pay all amounts due according
to the contractual terms of the assets being evaluated.
Future cash fl ows in a group of fi nancial assets that are
collectively evaluated for impairment are estimated on
the basis of the contractual cash fl ows of the assets
in the Group and historical loss experience for assets
with credit risk characteristics similar to those in the
Group. Historical loss experience is adjusted on the
basis of current observable data to refl ect the effects
of current conditions that did not affect the period
on which the historical loss experience is based and
to remove the effects of conditions in the historical
period that do not exist currently.
When a loan is uncollectible, it is written off against
the related provision for loan impairment. Such loans
are written off after all the necessary procedures
have been completed and the amount of the loss
has been determined. Subsequent recoveries of
amounts previously written off decrease the amount
of the provision for loan impairment in the income
statement.
If, in a subsequent period, the amount of the
impairment loss decreases and the decrease can be
related objectively to an event occurring after the
impairment was recognised (such as an improvement
in the debtor’s credit rating), the previously recognised
impairment loss is reversed by adjusting the allowance
account. The amount of the reversal is recognised in
the income statement.
Loans that are either subject to collective impairment
assessment or individually signifi cant and whose terms
have been renegotiated are no longer considered to be
past due but are treated as new loans. In subsequent
years, the renegotiated terms apply in determining
whether the asset is considered to be past due.
(k) Accounting for leases
Leases of property and equipment where the Group
assumes substantially all the risks and rewards of
ownership are classifi ed as fi nance leases. Assets
acquired under fi nance leases are capitalised at the
inception of the lease at the lower of their fair value and
the estimated present value of the underlying lease
payments.
NOTES TO THE FINANACIAL STATEMENTS ANNUAL REPORT & FINANCIAL STATEMENTS - 2012

BU
SIN
ES
S R
EV
IEW
CO
RP
OR
AT
E G
OV
ER
NA
NC
EF
INA
NC
IAL
STA
TE
ME
NT
SN
OT
ES
TO
TH
E F
INA
NC
IAL
SA
DD
ITIO
NA
L IN
FO
RM
AT
ION
UAP HOLDINGS LIMITED 59
Notes to the fi nancial statementsFor the year ended 31 December 2012 - continued
2. Summary of signifi cant accounting policies
(continued)
(k) Accounting for leases (continued)
Each lease payment is allocated between the liability
and fi nance charges so as to achieve a constant rate
on the fi nance balance outstanding. The corresponding
rental obligations, net of fi nance charges, are included
in non-current liabilities. The interest element of the
fi nance charge is charged to the income statement
over the lease period.
Property and equipment acquired under fi nance
leases is depreciated over the estimated useful life of
the asset.
Leases in which a signifi cant portion of the risks and
rewards of ownership are retained by the lessor are
classifi ed as operating leases. Payments made under
operating leases are charged to the income statement
on a straight-line basis over the period of the lease.
(l) Cash and cash equivalents
Cash and cash equivalents includes cash in hand,
deposits held at call with banks, other short term
highly liquid investments with original maturities of
three months or less, and bank overdrafts.
(m) Employee benefi ts
i) Retirement benefi t obligations
The Group operates a defi ned benefi t scheme for
employees. A defi ned benefi t plan is a pension
plan that defi nes an amount of pension benefi t
that an employee will receive on retirement, usually
dependent on one or more factors such as age, years
of service and compensation. A defi ned contribution
plan is a pension plan under which the Group pays
fi xed contributions into a separate entity. The Group
has no legal or constructive obligations to pay further
contributions if the fund does not hold suffi cient
assets to pay all employees the benefi ts relating to
employee service in the current and prior periods.
The assets of the scheme are held in separate trustee
administered funds, which are funded by contributions
from both the Group and employees.
The Group and all its employees also contribute to
the appropriate National Social Security Fund, which
are defi ned contribution schemes. The Group’s
contributions to the defi ned contribution schemes are
charged to the income statement in the year to which
they relate.
The liability recognised in the statement of fi nancial
position in respect of defi ned benefi t pension plans is
the present value of the defi ned benefi t obligation at
the fi nancial reporting date less the fair value of plan
assets, together with adjustments for unrecognised
actuarial gains or losses and past service costs. The
defi ned benefi t obligation is calculated annually by
independent actuaries using the projected unit credit
method.
The present value of the defi ned benefi t obligation is
determined by discounting the estimated future cash
outfl ows using interest rates of high-quality corporate
bonds that are denominated in the currency in which
the benefi ts will be paid, and that have terms to
maturity approximating to the terms of the related
pension liability. Actuarial gains and losses arising
from experience adjustments and changes in actuarial
assumptions in excess of the greater of 10% of the
value of plan assets or 10% of the defi ned benefi t
obligation are charged or credited to income over the
employees’ expected average remaining working lives.
Past-service costs are recognised immediately in
income, unless the changes to the pension plan are
conditional on the employees remaining in service
for a specifi ed period of time (the vesting period). In
this case, the past-service costs are amortised on a
straight-line basis over the vesting period.
ii) Other entitlements
Employee entitlements to long service awards are
recognised when they accrue to employees. A
provision is made for the estimated liability for such
entitlements as a result of services rendered by
employees up to the fi nancial reporting date. The
estimated monetary liability for employees’ accrued
annual leave entitlement at the fi nancial reporting
date is recognised as an expense accrual.
NOTES TO THE FINANACIAL STATEMENTSANNUAL REPORT & FINANCIAL STATEMENTS - 2012
BU
SIN
ES
S R
EV
IEW
CO
RP
OR
AT
E G
OV
ER
NA
NC
EF
INA
NC
IAL
STA
TE
ME
NT
SN
OT
ES
TO
TH
E F
INA
NC
IAL
SA
DD
ITIO
NA
L IN
FO
RM
AT
ION
UAP HOLDINGS LIMITED60
Notes to the fi nancial statementsFor the year ended 31 December 2012 - continued
2. Summary of signifi cant accounting policies
(continued)
(n) Current and deferred income tax
The tax expense for the period comprises current and
deferred income tax. Tax is recognised in the profi t
or loss except to the extent that it relates to items
recognised in other comprehensive income or directly
in equity. In this case, the tax is also recognised in other
comprehensive income or directly in equity, respectively.
The current income tax charge is calculated on the
basis of the tax enacted or substantively enacted at the
reporting date. Management periodically evaluates
positions taken in tax returns with respect to
situations in which applicable tax regulation is subject
to interpretation. It establishes provisions where
appropriate on the basis of amounts expected to be
paid to the tax authorities.
Deferred income tax is recognised, using the liability
method, on temporary differences arising between
the tax bases of assets and liabilities and their
carrying values in the fi nancial statements. However,
if the deferred tax liabilities are not recognised if they
arise from the initial recognition of goodwill; deferred
income tax is not accounted for if it arises from initial
recognition of an asset or liability in a transaction
other than a business combination that at the time of
the transaction affects neither accounting nor taxable
profi t or loss. Deferred income tax is determined
using tax rates and laws that have been enacted or
substantively enacted at the reporting date and are
expected to apply when the related deferred income
tax liability is settled.
Deferred income tax assets are recognised only to the
extent that it is probable that future taxable profi ts will
be available against which the temporary differences
can be utilised. Deferred income tax is provided on
temporary differences arising on investments in
subsidiaries and associates, except where the timing
of the reversal of the temporary difference is controlled
by the Group and it is probable that the temporary
difference will not reverse in the foreseeable future.
Deferred income tax assets and liabilities are offset
when there is a legally enforceable right to offset
current tax assets against current tax liabilities and
when the deferred income taxes assets and liabilities
relate to income taxes levied by the same taxation
authority on either the same taxable entity or different
taxable entities where there is an intention to settle
the balances on a net basis.
(o) Functional currency and translation of foreign
currencies
i) Functional and presentation currency
Items included in the fi nancial statements of each of
the Group’s entities are measured using the currency of
the primary economic environment in which the entity
operates (‘the functional currency’). The consolidated
fi nancial statements are presented in ‘Kenyan Shillings
(Kshs), which is the Group’s presentation currency.
ii) Transactions and balances
Foreign currency transactions are translated into the
functional currency using exchange rates prevailing at
the dates of the transactions or valuation where items
are re-measured. Foreign exchange gains and losses
resulting from the settlement of such transactions
and from the translation at year-end exchange rates
of monetary assets and liabilities denominated in
foreign currencies are recognised in profi t or loss.
Foreign exchange gains and losses that relate to
borrowings and cash and cash equivalents are
presented in profi t or loss within ‘fi nance income or
cost’. All other foreign exchange gains and losses are
presented in profi t or loss within ‘other income’ or
‘other expenses’.
Translation differences related to changes in
amortised cost are recognised in profi t or loss, and
other changes in carrying amount are recognised in
other comprehensive income. Translation differences
on non-monetary fi nancial assets and liabilities, such
as equities held at fair value through profi t or loss,
are recognised in profi t or loss as part of the fair
value gain or loss. Translation differences on non-
monetary fi nancial assets, such as equities classifi ed
as available-for-sale fi nancial assets, are included in
other comprehensive income.
NOTES TO THE FINANACIAL STATEMENTS ANNUAL REPORT & FINANCIAL STATEMENTS - 2012

BU
SIN
ES
S R
EV
IEW
CO
RP
OR
AT
E G
OV
ER
NA
NC
EF
INA
NC
IAL
STA
TE
ME
NT
SN
OT
ES
TO
TH
E F
INA
NC
IAL
SA
DD
ITIO
NA
L IN
FO
RM
AT
ION
UAP HOLDINGS LIMITED 61
Notes to the fi nancial statementsFor the year ended 31 December 2012 - continued
2. Summary of signifi cant accounting policies
(continued)
(o) Functional currency and translation of foreign
currencies (continued)
iii) Group balances
The results and fi nancial position of all the Group
entities (none of which has the currency of a
hyperinfl ationary economy) that have a functional
currency different from the presentation currency are
translated into the presentation currency as follows:
(1) assets and liabilities for each statement of fi nancial
position presented are translated at the closing rate at
the end of the reporting period;
(2) income and expenses for each income statement
amount are translated at average exchange rates
(unless this average is not a reasonable approximation
of the cumulative effect of the rates prevailing on the
transaction dates, in which case income and expenses
are translated at the dates of the transactions); and
(3) all resulting exchange differences are recognised in
other comprehensive income.
Goodwill and fair value adjustments arising on the
acquisition of a foreign entity are treated as assets
and liabilities of the foreign entity and translated at
the closing rate. Exchange differences arising are
recognised in equity.
(p) Dividends
Dividends payable to the Group’s shareholders are
charged to equity in the period in which they are
declared. Proposed dividends are shown as a separate
component of equity until declared.
(q) Consolidation of subsidiaries
i) Subsidiaries
Subsidiaries are all entities over which the Group
has the power to govern the fi nancial and operating
policies generally accompanying a shareholding of
more than one half of the voting rights. The existence
and effect of potential voting rights that are currently
exercisable or convertible are considered when
assessing whether the Group controls another entity.
The Group also assesses existence of control where it
does not have more than 50% of the voting power but
is able to govern the fi nancial and operating policies
by virtue of de-facto control.
De-facto control may arise in circumstances where
the size of the group’s voting rights relative to the
size and dispersion of holdings of other shareholders
give the group the power to govern the fi nancial and
operating policies, etc.
Subsidiaries are fully consolidated from the date on
which control is transferred to the Group. They are
de-consolidated from the date the control ceases.
The Group uses the acquisition method of
accounting to account for business combinations.
The consideration transferred for the acquisition of a
subsidiary is the fair values of the assets transferred,
the liabilities incurred and the equity interests issued
by the Group. The consideration transferred includes
the fair value of any asset or liability resulting from a
contingent consideration arrangement. Identifi able
assets acquired and liabilities and contingent liabilities
assumed in a business combination are measured
initially at their fair values at the acquisition date.
The Group recognises any non-controlling interest in
the acquiree on an acquisition- by-acquisition basis,
either at fair value or at the non-controlling interest’s
proportionate share of the recognised amounts of
acquiree’s identifi able net assets.
Acquisition-related costs are expensed as incurred. If
the business combination is achieved in stages, the
acquisition date fair value of the acquirer’s previously
held equity interest in the acquiree is remeasured to
fair value at the acquisition date through profi t or loss.
Any contingent consideration to be transferred by the
group is recognised at fair value at the acquisition
date. Subsequent changes to the fair value of the
contingent consideration that is deemed to be an
asset or liability is recognised in accordance with
IAS 39 either in profi t or loss or as a change to other
comprehensive income. Contingent consideration
that is classifi ed as equity is not remeasured, and its
subsequent settlement is accounted for within equity.
Goodwill is initially measured as the excess of the
aggregate of the consideration transferred and the
fair value of non-controlling interest over the net
identifi able assets acquired and liabilities assumed. If
this consideration is lower than the fair value of the
net assets of the subsidiary acquired, the difference is
recognised in profi t or loss.
NOTES TO THE FINANACIAL STATEMENTSANNUAL REPORT & FINANCIAL STATEMENTS - 2012

BU
SIN
ES
S R
EV
IEW
CO
RP
OR
AT
E G
OV
ER
NA
NC
EF
INA
NC
IAL
STA
TE
ME
NT
SN
OT
ES
TO
TH
E F
INA
NC
IAL
SA
DD
ITIO
NA
L IN
FO
RM
AT
ION
UAP HOLDINGS LIMITED62
Notes to the fi nancial statementsFor the year ended 31 December 2012 - continued
2. Summary of signifi cant accounting policies
(continued)
(q) Consolidation of subsidiaries (continued)
Inter-company transactions, balances and unrealised
gains on transactions between Group companies
are eliminated. Unrealised losses are also eliminated
unless the transaction provides evidence of an
impairment of the asset transferred. Accounting
policies of subsidiaries have been changed where
necessary to ensure consistency with the policies
adopted by the Group.
Investments in subsidiaries are accounted for at cost
less impairment. Cost is adjusted to refl ect changes
in consideration arising from contingent consideration
amendments. Cost also includes direct attributable
costs of investment.
ii) Changes in ownership interests in subsidiaries
without change of control
Transactions with non-controlling interests that do
not result in loss of control are accounted for as equity
transactions – that is, as transactions with the owners
in their capacity as owners. The difference between
fair value of any consideration paid and the relevant
share acquired of the carrying value of net assets of
the subsidiary is recorded in equity. Gains or losses
on disposals to non-controlling interests are also
recorded in equity.
iii) Disposal of subsidiaries
When the Group ceases to have control, any retained
interest in the entity is remeasured to its fair value
at the date when control is lost, with the change in
carrying amount recognised in profi t or loss. The fair
value is the initial carrying amount for the purposes
of subsequently accounting for the retained interest
as an associate, joint venture or fi nancial asset.
In addition, any amounts previously recognised
in other comprehensive income in respect of that
entity are accounted for as if the Group had directly
disposed of the related assets or liabilities. This may
mean that amounts previously recognised in other
comprehensive income are reclassifi ed to profi t or
loss.
iv) Associates
Associates are all entities over which the Group
has signifi cant infl uence but not control, generally
accompanying a shareholding of between 20% and
50% of the voting rights. Investments in associates
are accounted for by the equity method of accounting
. Under the equity method, the investments are
initially recognised at cost, and the carrying amount
is increased or decreased to recognise the investor’s
share of the profi t or loss of the investee after the date
of acquisition. The Group’s investment in associates
includes goodwill identifi ed on acquisition.
If the ownership interest in an associate is reduced but
signifi cant infl uence is retained, only a proportionate
share of the amounts previously recognised in other
comprehensive income is reclassifi ed to profi t or loss
as appropriate.
The Group’s share of its associates’ post-acquisition
profi ts or losses is recognised in profi t or loss, and
its share of post-acquisition movements in other
comprehensive income is recognised in other
comprehensive income, with a corresponding
adjustment to the carrying amount of the investment.
When the Group’s share of losses in an associate
equals or exceeds its interest in the associate, including
any other unsecured receivables, the Group does not
recognise further losses, unless it has incurred legal or
constructive obligations or made payments on behalf
of the associate.
The Group determines at each reporting date whether
there is any objective evidence that the investment in
the associate is impaired. If this is the case, the Group
calculates the amount of impairment as the difference
between the recoverable amount of the associate and
its carrying value and recognises the amount adjacent
to ‘share of profi t/(loss) of an associate’ in the income
statement. Profi ts and losses resulting from upstream
and downstream transactions between the group and
its associate are recognised in the Group’s fi nancial
statements only to the extent of unrelated investor’s
interests in the associates.
NOTES TO THE FINANACIAL STATEMENTS ANNUAL REPORT & FINANCIAL STATEMENTS - 2012

BU
SIN
ES
S R
EV
IEW
CO
RP
OR
AT
E G
OV
ER
NA
NC
EF
INA
NC
IAL
STA
TE
ME
NT
SN
OT
ES
TO
TH
E F
INA
NC
IAL
SA
DD
ITIO
NA
L IN
FO
RM
AT
ION
UAP HOLDINGS LIMITED 63
Notes to the fi nancial statementsFor the year ended 31 December 2012 - continued
2. Summary of signifi cant accounting policies
(continued)
(q) Consolidation of subsidiaries (continued)
Unrealised losses are eliminated unless the transaction
provides evidence of an impairment of the asset
transferred. Accounting policies of associates have
been changed where necessary to ensure consistency
with the policies adopted by the Group. Dilution gains
and losses arising from investments in associates are
recognised in profi t or loss.
(r) Goodwill
Goodwill arises on the acquisition of subsidiaries,
associates and joint ventures and represents the excess
of the consideration transferred over the Company’s
interest in net fair value of the net identifi able assets,
liabilities and contingent liabilities of the acquiree and
the fair value of the non-controlling interest in the
acquiree.
For the purpose of impairment testing, goodwill
acquired in a business combination is allocated to
each of the CGUs, or groups of CGUs, that is expected
to benefi t from the synergies of the combination.
Each unit or group of units to which the goodwill
is allocated represents the lowest level within the
entity at which the goodwill is monitored for internal
management purposes. Goodwill is monitored at the
operating segment level.
Goodwill impairment reviews are undertaken
annually or more frequently if events or changes
in circumstances indicate a potential impairment.
The carrying value of goodwill is compared to the
recoverable amount, which is the higher of value in use
and the fair value less costs to sell. Any impairment
is recognised immediately as an expense and is not
subsequently reversed.
(s) Segmental reporting
Operating segments are reported in a manner
consistent with the internal reporting provided to the
chief operating decision- maker (CODM). The CODM
is the person or group that allocates resources to and
assesses the performance of the operating segments
of an entity.
The group has determined the UAP Holdings Board of
Directors to be its CODM. This function is executed
through the Board’s Finance and Investment
Committee (FIC)
All transactions between business segments are
conducted on an arm’s length basis, with intra-
segment revenue and costs being eliminated in head
offi ce. Income and expenses directly associated with
each segment are included in determining business
segment performance.
3. Critical accounting estimates and judgments
in applying accounting policies
The Group makes estimates and assumptions
that affect the reported amounts of assets and
liabilities within the next fi nancial year. Estimates
and judgements are continually evaluated and based
on historical experience and other factors, including
expectations of future events that are believed to be
reasonable under the circumstances.
i) Future benefi t payments from long-term insurance
contracts
The estimation of future benefi t payments from
long-term insurance contracts is one of the Group’s
most critical accounting estimates. There are several
sources of uncertainty that need to be considered
in the estimate of the liability that the Group will
ultimately pay for such claims. Note 32 contains
further details on this process.
The determination of the liabilities under long-term
insurance contracts is dependent on estimates
made by the Group. Estimates are made as to the
expected number of deaths for each of the years in
which the Group is exposed to risk. The Group bases
these estimates on standard mortality tables that
refl ect historical mortality experience. The estimated
number of deaths determines the value of the benefi t
payments and the value of the valuation premiums.
The main source of uncertainty is that epidemics
such as AIDS could result in future mortality being
signifi cantly worse than in the past for the age
groups in which the Group has signifi cant exposure
to mortality risk.
NOTES TO THE FINANACIAL STATEMENTSANNUAL REPORT & FINANCIAL STATEMENTS - 2012

BU
SIN
ES
S R
EV
IEW
CO
RP
OR
AT
E G
OV
ER
NA
NC
EF
INA
NC
IAL
STA
TE
ME
NT
SN
OT
ES
TO
TH
E F
INA
NC
IAL
SA
DD
ITIO
NA
L IN
FO
RM
AT
ION
UAP HOLDINGS LIMITED64
Notes to the fi nancial statementsFor the year ended 31 December 2012 - continued
3. Critical accounting estimates and judgments
in applying accounting policies (continued)
i) Future benefi t payments from long-term insurance
contracts (continued)
However, continuing improvements in medical care
and social conditions could result in improvements
in longevity in excess of those allowed for in the
estimates used to determine the liability for contracts
where the Group is exposed to longevity risk. For
contracts without fi xed terms and with discretionary
participation in profi ts, it is assumed that the Group
will be able to increase mortality risk charges in future
years in line with emerging mortality experience.
Estimates are also made as to future investment
income arising from the assets backing long-term
insurance contracts. These estimates are based on
current market returns as well as expectations about
future economic and fi nancial developments. The
average estimated rate of investment return is 12.25%
p.a.(2011:13.5% p.a)
ii) Claims reserving and determination of IBNR
The estimation of future contractual cash fl ows in
relation to reported losses and losses incurred but not
reported is a key accounting estimate. There are several
sources of uncertainty that need to be considered in the
estimate of the liability that the Group will ultimately
pay for such claims. Case estimates are computed on
the basis of the best information available at the time
the records for the year are closed. Further details on
the process used to estimate claims incurred but not
reported and amounts recorded as liabilities at the
end of the current and previous year are set out in
note 32 of the fi nancial statements.
iii) Fair value of fi nancial assets
Fair values of certain fi nancial assets recognised in the
fi nancial statements are determined using valuation
techniques based on assumptions that are not
supported by prices from current market transactions
or observable market data.
The fair values of fi nancial instruments that are not
quoted in active markets are determined by using
valuation techniques. Where valuation techniques (for
example models) are used to determine fair values,
they are validated and periodically independently
reviewed by qualifi ed senior personnel.
All models are certifi ed before they are used, and
models are calibrated to ensure that outputs refl ect
actual data and comparative market prices. To the
extent practical, models use observable data, however,
areas such as credit risk (both own and counterparty),
volatilities and correlations require management to
make estimates.
iv) Recoverable amount of receivables
Critical estimates are made by the directors in
determining the recoverable amount of impaired
receivables. This process is set out in note 2(j). The
carrying amounts of receivables are shown on note
4(b)
v) Goodwill impairment
Critical estimates have been made by directors in
determining whether the goodwill is impaired. These
assumptions are disclosed on note 18.
4. Risk Governance and Risk Management
System
Risk management objectives
Risk management is a central part of the Group’s
strategic management process hence we continuously
seek to enhance the risk management capabilities of
the Group.
It is anticipated that our risk management practices will
increase the probability of success, and reduce both
the potential of failure and the uncertainty associated
with achieving the group’s overall objectives.
The objectives of the Group’s risk management
activities are to achieve sustained competitive
advantage via a rigorous, group wide risk management
system that is fully aligned to the Group values,
strategic business initiatives and processes. At a
strategic level, our risk management objectives are to:
• Identify the Group’s signifi cant risks in relation to the
corporate strategies pursued;
• Formulate the Group’s risk appetite and ensure that
business profi le and plans are consistent with it;
NOTES TO THE FINANACIAL STATEMENTS ANNUAL REPORT & FINANCIAL STATEMENTS - 2012

BU
SIN
ES
S R
EV
IEW
CO
RP
OR
AT
E G
OV
ER
NA
NC
EF
INA
NC
IAL
STA
TE
ME
NT
SN
OT
ES
TO
TH
E F
INA
NC
IAL
SA
DD
ITIO
NA
L IN
FO
RM
AT
ION
UAP HOLDINGS LIMITED 65
Notes to the fi nancial statementsFor the year ended 31 December 2012 - continued
4. Risk Governance and Risk Management
System (continued)
• Optimise risk/return decisions by taking them as
closely as possible to the business, while establishing
strong and independent review and challenge
structures;
• Ensure that business growth plans are properly
supported by effective risk infrastructure;
• Manage risk profi le to ensure that specifi c fi nancial
deliverables remain possible under a range of adverse
business conditions; and
• Help executives improve the control and co-
ordination of risk taking across the business.
Our risk management strategy defi nes the extent of
the risks we are prepared to incur for our clients and
shareholders. The development of our risk strategy
is embedded in the annual planning cycle and
hence in our business strategy. That is, Integrating
Strategy, Risk and Performance management takes
place at strategy setting, fi rst with a full Executive
management consensus on clearly defi ned business
objectives. Once Executive management have defi ned
the objectives, they then identify the key risks that
may present an opportunity to pursue those business
objectives, or impede their ability to achieve them.
Organisational structure
To ensure that our risk management operates effi ciently and
effectively, we have established a specifi c risk management
function within UAP Global Services as a Shared Service
for the entire Group. Our Risk Management supervises risk
management Group-wide with the support of decentralised
structures in all units of the Group. It is headed by the Group
Risk and Compliance Manager (GCRM), who is supported
by interdisciplinary teams of highly qualifi ed staff. Our Group
Risk The Group’s activities expose it to a variety of risks,
including insurance risk and fi nancial risk.
The Group’s overall risk management programme focuses
on the identifi cation and management of risks and seeks
to minimise potential adverse effects on its fi nancial
performance, by use of underwriting guidelines and capacity
limits, reinsurance planning, credit policy governing the
acceptance of clients, and defi ned criteria for the approval of
intermediaries and reinsurers.
Investment policies are in place which help manage liquidity,
and seek to maximise return within an acceptable level of
interest rate risk. Management Framework ensure that staff in
our risk management structure and the Group as a whole are
kept informed of our risk strategy, organisation and processes,
enabling the risks incurred to be actively controlled.
Risk Management Framework
In order to achieve its mission and objectives, the
Group has developed an Enterprise Risk management
framework to provide a guide within which key
risks affecting the group are identifi ed, measured
and managed. This risk management framework
also provides management with proven risk
management guidelines that support their decision-
making responsibilities and processes, together with
managing the risks that impact on the objectives of
the Group.
At the heart of the risk management framework is
a governance process with clear responsibilities for
taking, managing, monitoring and reporting risks.
The Group articulates the roles and responsibilities for
risk management throughout the organization, from
the Board of Directors and the Chief Executive Offi cer
(CEO) to its businesses and functional areas, thus
embedding risk management in the business
The UAP Risk Management Framework is the
Group’s main risk governance document; it specifi es
the Group’s Target Risk Management Operating
Model including Risk management authorities
and responsibilities, procedures and reporting
requirements. The risk management framework also
classifi es the risks the Group faces into broad risk
categories. The Group regularly enhances the ERM
Framework to refl ect new insights and changes in the
Group’s environment. One of the key elements of the
Group’s risk management framework is to foster risk
transparency by establishing risk reporting standards
throughout the Group. The Group regularly reports on
its risk profi le, current risk issues, adherence to its risk
policies and improvement actions both at a local and
on a Group level.
NOTES TO THE FINANACIAL STATEMENTSANNUAL REPORT & FINANCIAL STATEMENTS - 2012
BU
SIN
ES
S R
EV
IEW
CO
RP
OR
AT
E G
OV
ER
NA
NC
EF
INA
NC
IAL
STA
TE
ME
NT
SN
OT
ES
TO
TH
E F
INA
NC
IAL
SA
DD
ITIO
NA
L IN
FO
RM
AT
ION
UAP HOLDINGS LIMITED66
Notes to the fi nancial statementsFor the year ended 31 December 2012 - continued
4. Risk Governance and Risk Management
System (continued)
Risk Management Framework (continued)
The Group has procedures in place for the timely
referral of risk issues to senior management and the
Board of Directors.
The implementation of the framework is driven by
a risk management culture and awareness that
permeates throughout the Group and is supported
by a set of policies and procedures; Tools; and A
robust reporting mechanisms The Group continues to
consciously take risks for which it expects an adequate
return. This approach requires sound judgment and an
acceptance that certain risks can and will materialize
in the future.
Signifi cant risks
According to our classifi cation, signifi cant risks are risks
that could have a long-term adverse effect on the Group’s
assets, fi nancial situation or profi tability. We have applied this
defi nition consistently to the individual business units and
legal entities, taking account of their individual risk tolerance.
The section below summarises the signifi cant risks faced by
the group and how they are managed.
(a) Insurance risk
The risk under any one insurance contract is the
possibility that the insured event occurs and the
uncertainty of the amount of the resulting claim. By
the very nature of an insurance contract, this risk is
random and therefore unpredictable.
For a portfolio of insurance contracts where the theory
of probability is applied to pricing and provisioning,
the principal risk that the Group faces under its
insurance contracts is that the actual claims and
benefi t payments exceed the carrying amount of the
insurance liabilities. This could occur because the
frequency or severity of claims and benefi ts are greater
than estimated. Insurance events are random and the
actual number and amount of claims and benefi ts
will vary from year to year from the level established
using statistical techniques. Experience shows that
the larger the portfolio of similar insurance contracts,
the smaller the relative variability about the expected
outcome will be. In addition, a more diversifi ed
portfolio is less likely to be affected by a change in any
subset of the portfolio. The group has developed its
insurance underwriting strategy to diversify the type
of insurance risks accepted and within each of these
categories to achieve a suffi ciently large population of
risks to reduce the variability of the expected outcome.
Factors that aggravate insurance risk include lack of
risk diversifi cation in terms of type and amount of risk,
geographical location and type of industry covered.
The following tables disclose the concentration
of insurance risk by the class of business in which
the contract holder operates and by the maximum
insured loss limit included in the terms of the policy.
The amounts are the maximum insured loss limit of
the insurance liabilities (gross and net of reinsurance)
arising from insurance contracts.
NOTES TO THE FINANACIAL STATEMENTS ANNUAL REPORT & FINANCIAL STATEMENTS - 2012

BU
SIN
ES
S R
EV
IEW
CO
RP
OR
AT
E G
OV
ER
NA
NC
EF
INA
NC
IAL
STA
TE
ME
NT
SN
OT
ES
TO
TH
E F
INA
NC
IAL
SA
DD
ITIO
NA
L IN
FO
RM
AT
ION
UAP HOLDINGS LIMITED 67
Notes to the fi nancial statementsFor the year ended 31 December 2012 - continued
4. Risk Governance and Risk Management System (continued)
Signifi cant Risks (continued)
(a) Insurance risk
Year ended 31 December 2012 Maximum insured loss Total
Class of business
(Amounts presented in Shs ‘000) Kshs 0-15m Kshs 15-250m Kshs 250-1000m Kshs’000
General insurance business
Motor Gross 28,565,744 55,950,026 - 84,515,770
Net 28,326,865 40,911,344 - 69,238,209
Fire Gross 39,045,837 115,529,368 906,832,945 1,061,408,150
Net 50,318,042 95,124,290 281,227,147 426,669,479
Accident Gross 73,965,743 81,312,254 87,090,160 242,368,157
Net 38,771,026 53,670,635 82,037,354 174,479,015
Other Gross 30,055,519 84,305,730 100,002,449 214,363,698
Net 22,615,575 29,942,375 27,499,035 80,056,985
Life assurance business
Ordinary life Gross 2,596,307 - - 2,596,307
Net 2,596,307 - - 2,596,307
Group life Gross 350,093 3,256,984 272,088,403 275,695,480
Net 211,909 2,281,432 128,987,397 131,480,738
Total Gross 174,579,243 340,354,362 1,366,013,957 1,880,947,562
Net 142,839,724 221,930,076 519,750,933 884,520,733
The concentration by sector or maximum insured loss at the end of the year is broadly consistent with the prior year.
Year ended 31 December 2011 Maximum insured loss Total
Class of business
(Amounts presented in Shs ‘000) Kshs 0-15m Kshs 15-250m Kshs 250-1000m Kshs’000
General insurance business
Motor Gross 28,651,180 8,538,829 2,078,346 39,268,355
Net 27,568,789 7,710,831 1,610,147 36,889,767
Fire Gross 26,863,340 94,661,994 1,426,269,902 1,547,795,236
Net 27,539,173 84,844,726 77,693,442 190,077,341
Accident Gross 41,365,052 109,106,677 47,354,692 197,826,421
Net 21,001,035 46,247,419 15,887,235 83,135,689
Other Gross 18,092,075 52,783,575 299,508,097 370,383,747
Net 16,874,001 23,621,042 8,383,921 48,878,964
Life assurance business
Ordinary life Gross 2,743,164 - - 2,743,164
Net 2,743,164 - - 2,743,164
Group life Gross 37,068,133 10,258,268 366,480 47,692,881
Net 29,513,595 2,268,078 153,840 31,935,513
Total Gross 154,782,944 275,349,343 1,775,577,517 2,205,709,804
Net 125,239,757 164,692,096 103,728,585 393,660,438
NOTES TO THE FINANACIAL STATEMENTSANNUAL REPORT & FINANCIAL STATEMENTS - 2012

BU
SIN
ES
S R
EV
IEW
CO
RP
OR
AT
E G
OV
ER
NA
NC
EF
INA
NC
IAL
STA
TE
ME
NT
SN
OT
ES
TO
TH
E F
INA
NC
IAL
SA
DD
ITIO
NA
L IN
FO
RM
AT
ION
UAP HOLDINGS LIMITED68
Notes to the fi nancial statementsFor the year ended 31 December 2012 - continued
4. Risk Governance and Risk Management
System (continued)
Signifi cant Risks (continued)
(b) Financial risk
The Group is exposed to fi nancial risk through its
fi nancial assets, fi nancial liabilities (investment
contracts and borrowings), reinsurance assets and
insurance liabilities. In particular the key fi nancial
risk is that the proceeds from its fi nancial assets are
not suffi cient to fund the obligations arising from
its insurance and investment contracts. The most
important types of risk are credit risk, liquidity risk and
market risk. Market risk includes currency risk, interest
rate risk, equity price risk and other price risks.
These risks arise from open positions in interest rate,
currency and equity prices, all of which are exposed
to general and specifi c market movements. The risks
that the Group primarily faces due to the nature of
its investments and liabilities are liquidity rate risk and
equity price risk.
The Group manages these risks through policies set
out by the Finance and Investment Committee of the
Board (FIC). These policies have been developed to
achieve long-term investment returns in excess of the
Group’s obligations under insurance and investment
contracts. The principal technique is to match assets
to the liabilities arising from insurance and investment
contracts by reference to the type of benefi ts payable
to contract holders. For each distinct category of
liabilities, a separate portfolio of assets is maintained.
Market risk
i) Foreign exchange risk
The group underwrites some short term insurance
policies contracted in US dollars and maintains foreign
currency denominated current accounts with local
banks. Additionally, the group invests in offshore stock
exchange markets and places deposits in local fi nancial
institutions denominated in foreign currencies. This
exposes the group to onward foreign exchange risk
arising from the various currency exposures, primarily
with respect to the Uganda shillings, US dollar, Euro
and Sterling Pound. Foreign exchange risk arises from
future commercial transactions and recognised assets
and liabilities.
At 31 December 2012, if the Shilling had weakened/
strengthened by 10% against the US dollar with all
other variables held constant, the post-tax profi t
for the years would have been Shs 59.20 million
(31 December 2011: Shs 35.85 million) higher/
lower, mainly as a result of US dollar bank balances.
At 31 December 2012, and 31 December 2011, the
company had no signifi cant exposure with respect to
Uganda Shillings, Euro and the Sterling Pound.
ii) Price risk
The group is exposed to equity securities price risk
because of investments in quoted and unquoted
shares classifi ed either as fair value through profi t or
loss or other comprehensive income. The group is not
exposed to commodity price risk. To manage its price
risk arising from investments in equity securities, the
group diversifi es its portfolio. Diversifi cation of the
portfolio is done in accordance with policies set out
by the Finance & Investment committee of Board. All
quoted shares held by the group are traded on the
Nairobi Securities Exchange (NSE) and Uganda Stock
Exchange (USE).
At 31 December 2012, if the NSE Index had increased/
decreased by 10% with all other variables held
constant and all the Company’s equity instruments
moved according to the historical correlation to the
index, total comprehensive income and equity would
have been Shs 339 million higher/ lower (31 December
2011: Shs 247 million). Movement in the USE would
not have had a material impact on the company’s
equity 31 December 2012 and 31 December 2011
as investments in the USE Index are not material.
Investment in shares of Centum Investment Company
Limited and Kenya Commercial Bank Limited at 31
December 2012 comprised of 13% (31 December
2011: 17%) and 48% (31 December 2011: 37%)
respectively of the Group’s total equity portfolio. There
was no other concentration of price risk.
NOTES TO THE FINANACIAL STATEMENTS ANNUAL REPORT & FINANCIAL STATEMENTS - 2012

BU
SIN
ES
S R
EV
IEW
CO
RP
OR
AT
E G
OV
ER
NA
NC
EF
INA
NC
IAL
STA
TE
ME
NT
SN
OT
ES
TO
TH
E F
INA
NC
IAL
SA
DD
ITIO
NA
L IN
FO
RM
AT
ION
UAP HOLDINGS LIMITED 69
Notes to the fi nancial statementsFor the year ended 31 December 2012 - continued
4. Management of insurance and fi nancial risk
(Continued)
(b) Financial risk (continued)
iii) Interest rate risk
Fixed interest rate fi nancial instruments expose the
Company and Group to fair value interest rate risk.
Variable interest rate fi nancial instruments expose
the company to cash fl ow interest rate risk. The
Group’s fi xed interest rate fi nancial instruments
are government securities, deposits with fi nancial
institutions and borrowings. The Company’s variable
interest rate fi nancial instruments are quoted
corporate bonds, which are always the treasury bills
rate plus some basis points. No limits are placed on
the ratio of variable rate fi nancial instruments to fi xed
rate fi nancial instruments.
Investment contracts with fi xed and guaranteed
terms, government securities and deposits with
fi nancial institutions held to maturity are accounted
for at amortised cost and their carrying amounts are
not sensitive to changes in the level of interest rates.
At 31 December 2012 if interest rates on quoted
corporate bonds had been 2% higher/lower with all
other variables held constant, post-tax profi t for the
year would have been Shs 7.7 milion (31 December
2011: Shs 12 million) lower/higher, mainly as a result
of higher/lower interest income on fl oating rate
quoted corporate bonds.
Credit risk
The Group has exposure to credit risk, which is the risk
that a counterparty will be unable to pay amounts in
full when due. Key areas where the Group is exposed
to credit risk are:
• receivables arising out of direct insurance
arrangements;
• receivables arising out of reinsurance
arrangements;
• reinsurers’ share of insurance liabilities.
• Loans and corporate bonds and
• Deposits and government securities
The Group has no signifi cant concentrations of
credit risk. The Group structures the levels of credit
risk it accepts by placing limits on its exposure to a
single counterparty, or groups of counterparty, and to
geographical and industry segments. Such risks are
subject to an annual or more frequent review. Limits
on the level of credit risk by category and territory are
approved quarterly by the Board of Directors.
Reinsurance is used to manage insurance risk. This
does not, however, discharge the Group’s liability as
primary insurer. If a reinsurer fails to pay a claim for
any reason, the Group remains liable for the payment
to the policyholder. The creditworthiness of reinsurers
is considered on an annual basis by reviewing their
fi nancial strength prior to fi nalisation of any contract.
The exposure to individual counterparties is also
managed by other mechanisms, such as the right
of offset where counterparties are both debtors and
creditors of the Group. Management information
reported to the Group includes details of provisions for
impairment on loans and receivables and subsequent
write-offs. Finance and Investment committee of the
Group Board makes regular reviews to assess the
degree of compliance with the Group procedures
on credit. Exposures to individual policyholders
and groups of policyholders are collected within
the ongoing monitoring by the management credit
committee.
The credit quality of fi nancial assets that are neither
past due nor impaired can be assessed by reference
to external credit ratings if available or historical
information about counterparty default rates. None
of the group’s credit risk counter parties are rated
except the Government of Kenya, the issuer of the
Group’s government securities which has B+ rating.
The Company classifi es counterparties without an
external credit rating as below:
Group 1 - new customers/related parties.
Group 2 - existing customers/related parties with no
defaults in the past.
Group 3 - existing customers/related parties with
some defaults in the past. All defaults were fully
recovered
NOTES TO THE FINANACIAL STATEMENTSANNUAL REPORT & FINANCIAL STATEMENTS - 2012
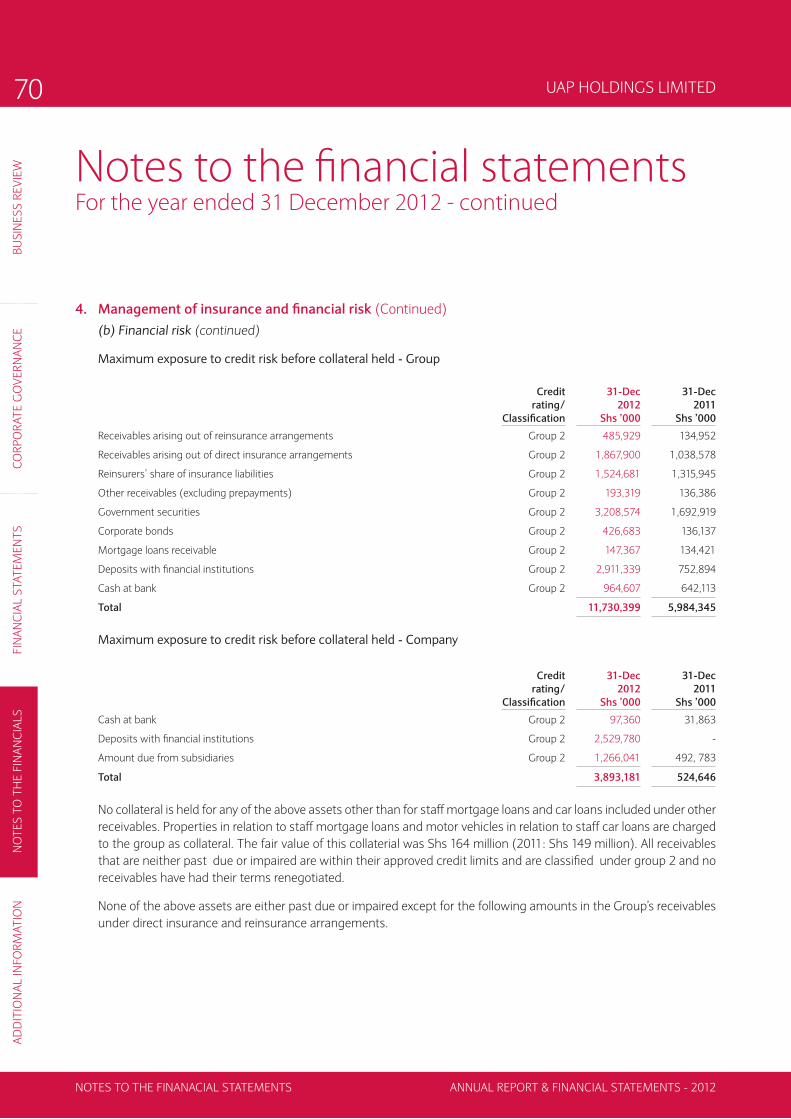
BU
SIN
ES
S R
EV
IEW
CO
RP
OR
AT
E G
OV
ER
NA
NC
EF
INA
NC
IAL
STA
TE
ME
NT
SN
OT
ES
TO
TH
E F
INA
NC
IAL
SA
DD
ITIO
NA
L IN
FO
RM
AT
ION
UAP HOLDINGS LIMITED70
Notes to the fi nancial statementsFor the year ended 31 December 2012 - continued
4. Management of insurance and fi nancial risk (Continued)
(b) Financial risk (continued)
Maximum exposure to credit risk before collateral held - Group
Credit
rating/
Classifi cation
31-Dec
2012
Shs ’000
31-Dec
2011
Shs ’000
Receivables arising out of reinsurance arrangements Group 2 485,929 134,952
Receivables arising out of direct insurance arrangements Group 2 1,867,900 1,038,578
Reinsurers’ share of insurance liabilities Group 2 1,524,681 1,315,945
Other receivables (excluding prepayments) Group 2 193,319 136,386
Government securities Group 2 3,208,574 1,692,919
Corporate bonds Group 2 426,683 136,137
Mortgage loans receivable Group 2 147,367 134,421
Deposits with fi nancial institutions Group 2 2,911,339 752,894
Cash at bank Group 2 964,607 642,113
Total 11,730,399 5,984,345
Maximum exposure to credit risk before collateral held - Company
Credit
rating/
Classifi cation
31-Dec
2012
Shs ’000
31-Dec
2011
Shs ’000
Cash at bank Group 2 97,360 31,863
Deposits with fi nancial institutions Group 2 2,529,780 -
Amount due from subsidiaries Group 2 1,266,041 492, 783
Total 3,893,181 524,646
No collateral is held for any of the above assets other than for staff mortgage loans and car loans included under other
receivables. Properties in relation to staff mortgage loans and motor vehicles in relation to staff car loans are charged
to the group as collateral. The fair value of this collaterial was Shs 164 million (2011: Shs 149 million). All receivables
that are neither past due or impaired are within their approved credit limits and are classifi ed under group 2 and no
receivables have had their terms renegotiated.
None of the above assets are either past due or impaired except for the following amounts in the Group’s receivables
under direct insurance and reinsurance arrangements.
NOTES TO THE FINANACIAL STATEMENTS ANNUAL REPORT & FINANCIAL STATEMENTS - 2012

BU
SIN
ES
S R
EV
IEW
CO
RP
OR
AT
E G
OV
ER
NA
NC
EF
INA
NC
IAL
STA
TE
ME
NT
SN
OT
ES
TO
TH
E F
INA
NC
IAL
SA
DD
ITIO
NA
L IN
FO
RM
AT
ION
UAP HOLDINGS LIMITED 71
Notes to the fi nancial statementsFor the year ended 31 December 2012 - continued
4. Management of insurance and fi nancial risk (Continued)
(b) Financial risk (continued)
Credit risk (continued)
Credit rating /
classifi cation
Receivables arising from direct
insurance arrangements
Receivables arising from re-
insurance arrangements
31-Dec
2012
Shs’000
31-Dec
2011
Shs’000
31-Dec
2012
Shs’000
31-Dec
2011
Shs’000
Past due but not impaired:
- by up to 30 days Group2 601,670 515,801 0 56,112
- by 31 to 60 days Group2 485,394 270,635 8,198 51,252
- by 61 to 150 days Group2 415,316 183,554 466,477 14,678
- by 151 to 360 days Group2 365,520 68,588 11,254 12,910
Total past due but not impaired 1,867,900 1,038,578 485,929 134,952
Receivables individually determined to be
impaired:
Carrying amount before provision for
impairment loss Group3 527,418 441,753 - -
Provision for impairment loss (527,418) (441,753) - -
Net carrying amount 1,867,900 1,038,578 485,929 134,952
No collateral is held in respect of the receivables that are past due but not impaired. Movements on the provision for
impairment of receivables arising on direct insurance arrangements are as follows:
31-Dec
2012
Shs’000
31-Dec
2011
Shs’000
At start of year 441,753 417,343
Provision in the year 85,665 24,410
At end of year 527,418 441,753
All receivables past due by more than 365 days are considered to be impaired, and are carried at their estimated
recoverable value.
NOTES TO THE FINANACIAL STATEMENTSANNUAL REPORT & FINANCIAL STATEMENTS - 2012

BU
SIN
ES
S R
EV
IEW
CO
RP
OR
AT
E G
OV
ER
NA
NC
EF
INA
NC
IAL
STA
TE
ME
NT
SN
OT
ES
TO
TH
E F
INA
NC
IAL
SA
DD
ITIO
NA
L IN
FO
RM
AT
ION
UAP HOLDINGS LIMITED72
Notes to the fi nancial statementsFor the year ended 31 December 2012 - continued
4. Management of insurance and fi nancial risk (Continued)
(b) Financial risk (continued)
Credit risk (continued)
The individually impaired receivables mainly relate to receivables arising out of direct insurance arrangements, the
following amounts have been individually assessed:
Direct Insurance
Arrangements
31-Dec-12
Shs ’000
31-Dec-11
Shs ’000
Individually assessed impaired receivables
Brokers 228,944 212,271
Agents 195,647 107,063
Insurance companies 20,718 44,356
Direct clients 82,109 78,063
At end of year 527,418 441,753
Liquidity risk
Liquidity risk is the risk that the Group is unable to meet its payment obligations associated with its fi nancial liabilities
as they fall due and to replace funds when they are withdrawn.
The Group is exposed to daily calls on available cash resources for claims settlement and other administration
expenses. The Group does not maintain cash resources to meet all of these needs as experience shows that a
minimum level of reinvestment of maturing funds can be predicted with a high level of certainty. The Finance and
Investment Ie sets limits on the minimum level of cash balances.
The table below presents the cash fl ows payable by the Group under fi nancial liabilities by remaining contractual
maturities (other than insurance contract liabilities which are based on expected maturities) at the fi nancial reporting
date.
As at 31 December 2012
Up to 1
month
Shs ’000
1 to 3
month
Shs ’000
3 to 12
month
Shs ’000
1 to 5
years
Shs ’000
Over 5
years
Shs ’000
Total
Shs ’000
Liabilities
Insurance contract liabilities 417,748 413,854 734,757 734,816 1,092,660 3,393,835
Creditors arising from reinsurance arrangements 688,652 88,205 292,766 - - 1,069,623
Payable under deposit administration contracts 2,202,817 - - - - 2,202,817
Unit-linked investment contracts - 4,596 21,974 287,737 533,057 847,364
Other payables 109,510 177,817 587,992 - - 875,319
Borrowings 175,950 28,539 108,618 1,016,929 - 1,330,036
Total fi nancial liabilities
As at 31 December 2012 3,594,677 713,011 1,746,107 2,039,482 1,625,717 9,718,994
NOTES TO THE FINANACIAL STATEMENTS ANNUAL REPORT & FINANCIAL STATEMENTS - 2012
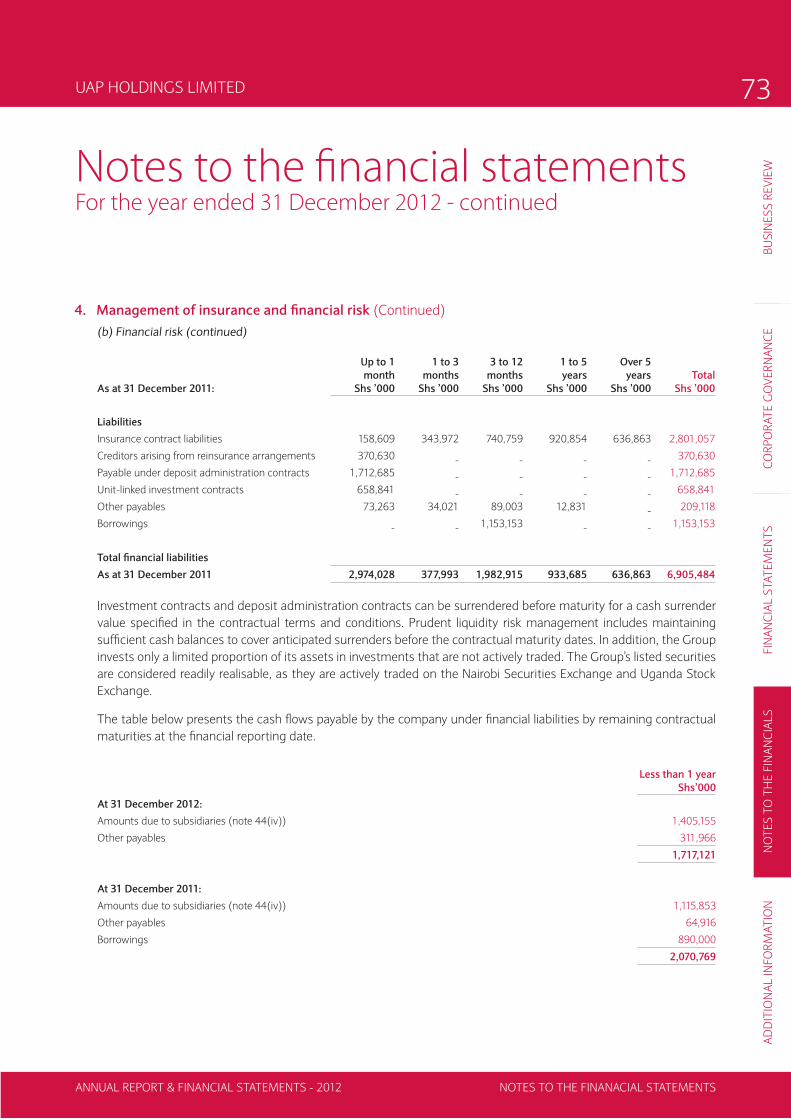
BU
SIN
ES
S R
EV
IEW
CO
RP
OR
AT
E G
OV
ER
NA
NC
EF
INA
NC
IAL
STA
TE
ME
NT
SN
OT
ES
TO
TH
E F
INA
NC
IAL
SA
DD
ITIO
NA
L IN
FO
RM
AT
ION
UAP HOLDINGS LIMITED 73
Notes to the fi nancial statementsFor the year ended 31 December 2012 - continued
4. Management of insurance and fi nancial risk (Continued)
(b) Financial risk (continued)
As at 31 December 2011:
Up to 1
month
Shs ’000
1 to 3
months
Shs ’000
3 to 12
months
Shs ’000
1 to 5
years
Shs ’000
Over 5
years
Shs ’000
Total
Shs ’000
Liabilities
Insurance contract liabilities 158,609 343,972 740,759 920,854 636,863 2,801,057
Creditors arising from reinsurance arrangements 370,630 - - - - 370,630
Payable under deposit administration contracts 1,712,685 - - - - 1,712,685
Unit-linked investment contracts 658,841 - - - - 658,841
Other payables 73,263 34,021 89,003 12,831 - 209,118
Borrowings - - 1,153,153 - - 1,153,153
Total fi nancial liabilities
As at 31 December 2011 2,974,028 377,993 1,982,915 933,685 636,863 6,905,484
Investment contracts and deposit administration contracts can be surrendered before maturity for a cash surrender
value specifi ed in the contractual terms and conditions. Prudent liquidity risk management includes maintaining
suffi cient cash balances to cover anticipated surrenders before the contractual maturity dates. In addition, the Group
invests only a limited proportion of its assets in investments that are not actively traded. The Group’s listed securities
are considered readily realisable, as they are actively traded on the Nairobi Securities Exchange and Uganda Stock
Exchange.
The table below presents the cash fl ows payable by the company under fi nancial liabilities by remaining contractual
maturities at the fi nancial reporting date.
Less than 1 year
Shs’000
At 31 December 2012:
Amounts due to subsidiaries (note 44(iv)) 1,405,155
Other payables 311,966
1,717,121
At 31 December 2011:
Amounts due to subsidiaries (note 44(iv)) 1,115,853
Other payables 64,916
Borrowings 890,000
2,070,769
NOTES TO THE FINANACIAL STATEMENTSANNUAL REPORT & FINANCIAL STATEMENTS - 2012

BU
SIN
ES
S R
EV
IEW
CO
RP
OR
AT
E G
OV
ER
NA
NC
EF
INA
NC
IAL
STA
TE
ME
NT
SN
OT
ES
TO
TH
E F
INA
NC
IAL
SA
DD
ITIO
NA
L IN
FO
RM
AT
ION
UAP HOLDINGS LIMITED74
Notes to the fi nancial statementsFor the year ended 31 December 2012 - continued
4. Management of insurance and fi nancial risk (Continued)
(b) Financial risk (continued)
The Group’s objectives when managing capital, which is a broader concept than the ‘equity’ on the statement of
fi nancial position, are:
• to comply with the capital requirements as set out in the regulations of the jurisdictions in which the Group entities
operate in;
• to comply with regulatory solvency requirements as set out in legislation in the jurisdictions in which the Group entities
operate in;.
• to safeguard the Group’s ability to continue as a going concern, so that it can continue to provide returns to
shareholders and benefi ts for other stake holders; and
• to provide an adequate return to shareholders by pricing insurance and investment contracts commensurately with
the level of risk.
The group’s paid up capital comprises share capital as disclosed on note 12. The Group manages the minimum paid
up capital and regulatory Capital (solvency) held in each subsidiary as capital.
During the year the Group held the minimum paid up share capital required as well as met the required solvency
margins required in the jurisdictions in which the Group entities operate.
Capital adequacy and solvency margin are monitored regularly by the Board of Directors. The required information is
fi led with the respective authorities.
The table below summarises the capital requirements of the Group’s entities in the various jurisdictions in which the
Group operates and the amount of capital held.
31-Dec-12
General
insurance
Shs’000
Kenya
Life Insurance
Shs’000
Sudan
Shs’000
Uganda
Shs’000
Rwanda
Shs’000
Regulatory capital requirements 300,000 150,000 341,190 70,006 -
Amount of paid up capital 600,000 644,093 342,710 241,950 169,486
Required solvency margin 713,287 222,510 - 142,573 -
Solvency margin by Company 1,157,899 351,299 - 794,030 -
Surplus/(defi cit) over required margin 444,612 128,789 - 651,457 -
31-Dec-11
General
insurance
Shs’000
Kenya
Life Insurance
Shs’000
Sudan
Shs’000
Uganda
Shs’000
Rwanda
Shs’000
Regulatory capital requirements 300,000 150,000 341,190 70,006 -
Amount of paid up capital 600,000 200,093 230,691 190,762 -
Required solvency margin 470,474 155,696 - 86,755 -
Solvency margin by Company 731,865 (336,368) - 134,676 -
Surplus/(defi cit) over required margin 261,391 (492,064) - 47,921 -
NOTES TO THE FINANACIAL STATEMENTS ANNUAL REPORT & FINANCIAL STATEMENTS - 2012

BU
SIN
ES
S R
EV
IEW
CO
RP
OR
AT
E G
OV
ER
NA
NC
EF
INA
NC
IAL
STA
TE
ME
NT
SN
OT
ES
TO
TH
E F
INA
NC
IAL
SA
DD
ITIO
NA
L IN
FO
RM
AT
ION
UAP HOLDINGS LIMITED 75
Notes to the fi nancial statementsFor the year ended 31 December 2012 - continued
4. Management of insurance and fi nancial risk (Continued)
(d) Fair values of fi nancial assets and liabilities
The fair value of government securities at amortized cost at 31 December 2012 is estimated at Shs 2,970 million
(2011: 1,791 million) compared to the carrying value Shs 2,662 million (2011: 1,321 million). The fair values of the
Group’s other fi nancial assets and liabilities approximate the respective carrying amounts, due to the generally short
periods to contractual repricing or maturity dates as set out above. Fair values are based on discounted cash fl ows
using a discount rate based upon the borrowing rate that the directors expect would be available to the Group at the
fi nancial reporting date.
(e) Fair values estimation
IFRS 7 requires disclosure of fair value measurements by the following levels of hierarchy for fi nancial instruments
that are measured in the statement of fi nancial position at fair value:
Quoted prices (unadjusted) in active markets for identical assets or liabilities (level 1).
Inputs other than quoted prices included within level 1 that are observable for the asset or liability, either directly (that
is, as prices) or indirectly (that is, derived from prices) (level 2).
Inputs for the asset or liability that are not based on observable market data (that is, unobservable inputs) (level 3).
The following table presents the Group’s assets that are measured at fair value the end of the year.
Level 1
Shs’000
Level 2
Shs’000
Level 3
Shs’000
Total balance
Shs’000
31-Dec-12
Assets
Equity investments 3,452,704 - 53,727 3,506,431
Government securities 546,770 - - 546,770
Total 3,999,474 - 53,727 4,053,201
31-Dec-11
Assets
Equity investments 2,471,665 - 35,175 2,506,840
Government securities 372,264 - - 372,264
Total 2,843,929 - 35,175 2,879,104
The fair value of fi nancial instruments traded in active markets is based on quoted market prices at the end of each
reporting period. A market is regarded as active if quoted prices are readily and regularly available from an exchange,
dealer, broker, industry group, pricing service, or regulatory agency, and those prices represent actual and regularly
occurring market transactions on an arm’s length basis. The quoted market price used for fi nancial assets held by the
company is the current bid price. These instruments are included in level 1. Instruments included in level 1 comprise
of primarily equity investments quoted at Nairobi Securities Exchange and Uganda Stock Exchange.
NOTES TO THE FINANACIAL STATEMENTSANNUAL REPORT & FINANCIAL STATEMENTS - 2012

BU
SIN
ES
S R
EV
IEW
CO
RP
OR
AT
E G
OV
ER
NA
NC
EF
INA
NC
IAL
STA
TE
ME
NT
SN
OT
ES
TO
TH
E F
INA
NC
IAL
SA
DD
ITIO
NA
L IN
FO
RM
AT
ION
UAP HOLDINGS LIMITED76
Notes to the fi nancial statementsFor the year ended 31 December 2012 - continued
4. Management of insurance and fi nancial risk (Continued)
(e) Fair values estimation (continued)
Financial instruments measured at fair value that are not traded in active markets relate to Group’s investment in the
holding company for an investment property. Fair value estimate is based on the Group’s share of the net asset of
the investee company. As the investment property of the investee company is measured at their fair value, the net
asset value of the investee company approximates its fair value. This estimate is classifi ed as level 3. There were no
transfers into or out of level 3 during the year (2010: Nil)
5. Segmental information
Management has determined the operating segments based on the reports reviewed by the Group’s Board of
Directors through its Finance and Investment Committee (FIC) that are used to make strategic decisions.
The Group reviews its operating segments (business units) by type of business and by geography. Based on this, the
group’s operating segments comprise of General Insurance, Life Assurance, Property, Investment management and
related Financial Services. The group currently has operations in fi ve countries namely Kenya, Uganda, South Sudan,
Rwanda and Democratic Republic of Congo (DRC).
The reportable operating segments derive their revenue primarily from the underwriting of classes and non-life risks
as defi ned by the Insurance Act and investment property.
Other services offered by the Group that are included within the Kenya and Uganda segments include stock brokerage,
investment management and related fi nancial advisory services. The results of these operations are included in the
all other segments column as they are not material to the Group.
The Group Board of Directors assesses the performance of the reporting segments based on a measure of revenue
and profi tability.
NOTES TO THE FINANACIAL STATEMENTS ANNUAL REPORT & FINANCIAL STATEMENTS - 2012

UA
P H
OL
DIN
GS
LIM
ITE
D7
7
5 (a
) S
eg
me
nta
l in
form
ati
on
(co
nti
nu
ed)
Th
e s
eg
me
nt
info
rmat
ion
pro
vid
ed
to
th
e G
rou
p B
oa
rd o
f D
ire
cto
rs f
or
the
re
po
rta
ble
se
gm
en
ts f
or
the
ye
ar
en
de
d 3
1 D
ece
mb
er
20
12 is
as
follo
ws:
Ye
ar
en
de
d 3
1 D
ec
em
be
r 2
01
2K
en
ya
Su
da
nU
ga
nd
aA
ll o
the
r
Ge
ne
ral
Insu
ran
ce
Sh
s ’0
00
Lif
e A
ssu
ran
ce
Sh
s ’0
00
Ge
ne
ral
Insu
ran
ce
Sh
s ’0
00
Ge
ne
ral
Insu
ran
ce
Sh
s ’0
00
Lif
e
Ass
ura
nc
e
Sh
s ’0
00
Pro
pe
rty
Sh
s ’0
00
seg
me
nts
Sh
s ’0
00
To
tal
Sh
s ’0
00
Gro
ss w
ritt
en
pre
miu
m (
exte
rna
l cu
sto
me
rs)
5,9
25
,79
6
74
9,8
79
8
24
,68
8
1
,38
2,0
30
16
5,8
79
-
6
,49
8
9,0
54
,77
0
Gro
ss e
arn
ed
pre
miu
m
5
,39
6,3
68
7
81
,413
7
81
,13
9
1
,33
7,5
25
16
5,8
79
-
4
73
8
,46
2,7
97
Net
ea
rne
d p
rem
ium
4
,37
7,4
15
52
9,5
72
6
36
,46
1
84
1,8
78
14
7,4
45
-
4
73
6
,53
3,2
44
Inte
rest
inco
me
84
,28
9
36
4,6
30
7
,32
7
7
0,0
31
1
0,4
51
-
1
57,
23
3
6
93
,96
1
Oth
er
inve
stm
en
t in
com
e
1
,02
8,4
78
3
63
,53
0
4
8,8
52
2
53
,03
4
7
26
4
25
,311
(
28
7,7
67
)
1
,83
2,1
65
Co
mm
issi
on
s a
nd
oth
er
inco
me
2
84
,70
8
5
8,8
58
28
,15
0
4
9,0
19
2
,40
2
-
4,4
61
42
7,5
98
To
tal
inc
om
e
5
,77
4,8
90
1,3
16
,59
0
72
0,7
90
1,2
13
,96
2
1
61
,02
4
42
5,3
11
(
12
5,6
00
)
9
,48
6,9
68
Cla
ims
an
d p
olic
y o
wn
ers
’ be
nefi
ts
pay
ab
le
(2,4
81
,89
7)
(
74
3,9
81
)
(2
37,
00
8)
(
37
7,7
15)
(97,
69
4)
-
-
(3,9
38
,29
5)
Fin
an
ce c
ost
(
27,
43
5)
-
-
-
-
-
(13
4,0
41
)
(
161
,47
6)
De
pre
ciat
ion
(
26
,79
0)
(
5,0
14)
(14
,49
1)
(
9,0
11)
(15
0)
-
(
3,6
56
)
(5
9,1
12)
Am
ort
isat
ion
-
-
-
-
-
-
(
94
,69
2)
(
94
,69
2)
Co
mm
issi
on
s a
nd
oth
er
op
era
tin
g e
xp
en
ses
(1
,94
6,1
91
)
(3
50
,09
2)
(
37
3,9
78
)
(6
29
,75
3)
(1
30
,70
1)
(
4,5
84
)
(5
0,1
43
)
(3,4
85
,44
2)
Sh
are
of
loss
of
ass
oc
iate
Pro
fi t
be
fore
ta
x
1
,29
2,5
77
2
17,
50
3
9
5,3
13
1
97,
48
3
(67,
52
1)
42
0,7
27
(
40
8,1
32
)
1
,74
7,9
51
Inco
me
ta
x e
xp
en
se
(
177,
07
8)
(
5,5
38
)
(6
,99
6)
(4
8,3
33
)
57
4
(
129
,54
9)
-
(3
66
,92
0)
Pro
fi t
or
(lo
ss)
aft
er
tax
fo
r th
e y
ea
r
1
,11
5,4
99
2
11
,96
5
8
8,3
17
1
49
,15
0
(66
,94
7)
29
1,1
78
(
40
8,1
32
)
1
,38
1,0
31
Pro
fi t
attr
ibu
tab
le t
o N
on
-co
ntr
olli
ng
inte
rest
s
-
-
-
70
,10
1
(31
,46
5)
-
6
0,3
89
9
9,0
25
Pro
fi t
attr
ibu
tab
le t
o s
ha
reh
old
ers
of
the
pa
ren
t
1
,115
,49
9
211
,96
5
8
8,3
17
7
9,0
49
(3
5,4
82
)
2
91
,17
8
(4
68
,52
0)
1,2
82
,00
6
Pro
fi t
or
(lo
ss)
aft
er
tax
fo
r th
e y
ea
r
1
,11
5,4
99
2
11
,96
5
8
8,3
17
1
49
,15
0
(66
,94
7)
29
1,1
78
(
40
8,1
32
)
1
,38
1,0
31
Oth
er
com
pre
he
nsi
ve in
com
e
76
1,6
85
-
1
1,4
51
(
25
,78
7)
4
32
(
59
,77
6)
4
,93
4
6
92
,93
9
To
tal
co
mp
reh
en
sive
in
co
me
1,8
77,
18
4
21
1,9
65
99
,76
8
12
3,3
63
(6
6,5
15
)
2
31
,40
2
(4
03
,19
8)
2,0
73
,97
0
Ad
dit
ion
s:
Pro
pe
rty a
nd
eq
uip
me
nt
11
,38
8
1
6,9
05
13
,70
5
3,9
70
-
-
11
,42
1
57,
38
9
Inve
stm
en
t p
rop
ert
y
2,7
00
-
25
0,8
94
-
-
75
7,5
33
93
0,5
72
1
,94
1,6
99
Inta
ng
ible
ass
ets
-
-
-
-
-
-
10
1,8
34
10
1,8
34
To
tal
ass
ets
1
0,6
68
,54
5
4
,66
7,4
61
1,3
93
,51
2
2
,48
4,3
79
27
4,2
91
2,1
76
,87
6
2,9
49
,94
8
2
4,6
15
,01
2
To
tal
eq
uit
y
4
,85
9,5
57
4
69
,43
2
54
5,7
34
8
10
,41
9
30
,82
7
1
,02
2,9
10
3
,83
8,4
71
11
,57
7,3
51
SE
GM
EN
TA
L IN
FO
RM
AT
ION
AN
NU
AL
RE
PO
RT
& F
INA
NC
IAL
STA
TE
ME
NT
S -
20
12

UA
P H
OL
DIN
GS
LIM
ITE
D7
8
5 (
a)
Se
gm
en
tal i
nfo
rma
tio
n (
con
tin
ued
)
Ye
ar
en
de
d 3
1 D
ec
em
be
r 2
01
1K
en
ya
Su
da
nU
ga
nd
aA
ll o
the
r
Ge
ne
ral
Insu
ran
ce
Sh
s ’0
00
Lif
e A
ssu
ran
ce
Sh
s ’0
00
Ge
ne
ral
Insu
ran
ce
Sh
s ’0
00
Ge
ne
ral
Insu
ran
ce
Sh
s ’0
00
Lif
e
Ass
ura
nc
e
Sh
s ’0
00
seg
me
nts
Sh
s ’0
00
To
tal
Sh
s ’0
00
Gro
ss w
ritt
en
pre
miu
m (
ex
tern
al
cu
sto
me
rs)
4,7
15
,51
4
45
5,0
93
6
30
,54
3
1
,27
2,6
04
17
9,3
86
-
7,
25
3,1
40
Gro
ss e
arn
ed
pre
miu
m
4
,29
9,5
09
3
83
,34
4
57
7,8
84
1,1
62
,48
3
1
79
,38
6
-
6,6
02
,60
6
Net
ea
rne
d p
rem
ium
3
,52
0,1
85
2
32
,74
4
44
3,7
24
8
36
,73
0
1
61
,06
8
-
5,1
94
,45
1
Inte
rest
inco
me
67,
92
0
8
6,8
43
4
,98
2
4
1,3
21
8,2
58
4
98
20
9,8
22
Oth
er
inve
stm
en
t in
com
e
60
6,5
64
(12
6,0
76
)
(9
,28
2)
9
3,8
01
1,5
93
2
91
,88
9
8
58
,48
9
Co
mm
issi
on
s a
nd
oth
er
inco
me
3
15,9
84
76
,82
4
4
2,2
59
53
,26
2
1
,97
9
-
4
90
,30
8
To
tal
inc
om
e
4
,51
0,6
53
2
70
,33
5
48
1,6
83
1,0
25
,11
4
1
72
,89
8
29
2,3
87
6
,75
3,0
70
Cla
ims
an
d p
oli
cy
ow
ne
rs’
be
ne
fi ts
pa
ya
ble
(1
,88
1,8
97
)
(3
40
,42
9)
(
16
7,7
60
)
(4
18
,09
6)
(1
18
,59
1)
-
(2
,92
6,7
73
)
Fin
an
ce c
ost
(
33
,58
6)
-
(
9,8
56
)
(8
,810
) -
-
(5
2,2
52
)
De
pre
ciat
ion
(
14,0
80
)
(4
,57
9)
(2
1,3
26
)
(9
,44
0)
(15
6)
(76
)
(4
9,6
57
)
Am
ort
isat
ion
-
-
-
-
-
(3
8,7
49
)
(3
8,7
49
)
Co
mm
issi
on
s a
nd
oth
er
op
era
tin
g e
xp
en
ses
(1
,40
9,4
83
)
(2
61
,86
2)
(
26
9,9
37
)
(4
39
,84
1)
(54
,15
1)
(3
8,6
70
)
(2,4
73
,94
4)
Sh
are
of
loss
of
ass
oci
ate
-
-
-
-
-
(
1,7
83
)
(
1,7
83
)
Pro
fi t
be
fore
ta
x
1
,17
1,6
07
(3
36
,53
5)
1
2,8
04
1
48
,92
7
-
21
3,1
09
1
,20
9,9
12
Inc
om
e t
ax
ex
pe
nse
(1
95
,87
3)
-
(
1,9
20
)
(
79
,49
5)
-
(1
2,9
40
)
(
29
0,2
28
)
Pro
fi t
or
(lo
ss)
afte
r ta
x f
or
the
ye
ar
9
75
,73
4
(
33
6,5
35
)
10
,88
4
6
9,4
32
-
2
00
,16
9
9
19,6
84
Pro
fi t
attr
ibu
tab
le t
o N
on
-co
ntr
olli
ng
inte
rest
s -
-
-
32
,63
3
-
4,8
36
3
7,4
69
Pro
fi t
att
rib
uta
ble
to
sh
are
ho
lde
rs o
f th
e p
are
nt
9
75
,73
4
(
33
6,5
35
)
10
,88
4
3
6,7
99
-
1
95
,33
3
8
82
,21
5
Pro
fi t
or
(lo
ss)
aft
er
tax
fo
r th
e y
ea
r
97
5,7
34
(3
36
,53
5)
1
0,8
84
69
,43
2
-
20
0,1
69
91
9,6
84
Oth
er
com
pre
he
nsi
ve in
com
e
(
62
9,4
14)
-
2,1
22
(
27,
73
7)
4
32
(
36
,87
3)
(6
91
,47
0)
To
tal
co
mp
reh
en
sive
in
co
me
3
46
,32
0
(
33
6,5
35
)
13
,00
6
4
1,6
95
43
2
16
3,2
96
22
8,2
14
Ad
dit
ion
s:
Pro
pe
rty
an
d e
qu
ipm
en
t
5
3,6
55
1
,90
8
3
6,6
35
6
,48
6
1
95
53
,47
4
1
52
,35
3
Inve
stm
en
t p
rop
ert
y
6,8
36
-
51
,11
9
-
-
89
0,5
19
94
8,4
74
Inta
ng
ible
ass
ets
-
-
-
-
-
15
9,7
93
15
9,7
93
To
tal
Ass
ets
7,7
39
,19
42
,92
7,3
78
84
1,1
10
2,0
45
,67
62
09
,89
07
47,
15
01
4,5
10
,39
8
To
tal
Eq
uit
y3
,18
6,3
71
(18
6,5
35
)3
16
,92
25
89
,86
04
6,1
56
69
4,5
25
4,6
47,
30
1
SE
GM
EN
TA
L IN
FO
RM
AT
ION
AN
NU
AL
RE
PO
RT
& F
INA
NC
IAL
STA
TE
ME
NT
S -
20
12

UA
P H
OL
DIN
GS
LIM
ITE
D7
9
5 (a
) S
eg
me
nta
l in
form
ati
on
(co
nti
nu
ed)
Pre
miu
ms
by s
ou
rce
co
un
try
31
-De
c-1
23
1-D
ec
-11
Ke
nya
Sh
s ’0
00
Ug
an
da
Sh
s ’0
00
Su
da
n
Sh
s ’0
00
Rw
an
da
Sh
s ’0
00
To
tal
Sh
s ’0
00
Ke
nya
Sh
s ’0
00
Ug
an
da
Sh
s ’0
00
Su
da
n
Sh
s ’0
00
To
tal
Sh
s ’0
00
Sh
ort
- t
erm
in
sura
nc
e
Gro
ss w
ritt
en
pre
miu
m
5
,92
5,7
96
1
,38
2,0
30
8
24
,68
8
6,4
98
8
,13
9,0
12
4,7
15,5
14
1
,27
2,6
04
63
0,5
43
6
,618
,66
1
Gro
ss e
arn
ed
pre
miu
m
5
,39
6,3
68
1
,33
7,5
25
7
81
,13
9
47
3
7,5
15,5
05
4
,29
9,5
09
1,1
62
,48
3
5
77,
88
4
6,0
39
,87
6
Ne
t e
arn
ed
pre
miu
m
4,3
77,
41
5
8
41
,87
8
63
6,4
61
4
73
5
,85
6,2
27
3
,52
0,1
85
8
36
,73
0
4
43
,72
4
4,8
00
,63
9
Lo
ng
- t
erm
bu
sin
ess
Gro
ss w
ritt
en
pre
miu
m
74
9,8
79
16
5,8
79
-
-
9
15,7
58
45
5,0
93
1
79
,38
6
-
63
4,4
79
Gro
ss e
arn
ed
pre
miu
m
78
1,4
13
1
65
,87
9
-
-
94
7,2
92
38
3,3
44
1
79
,38
6
-
56
2,7
30
Net
ea
rne
d p
rem
ium
5
29
,57
2
1
47,
44
5
-
-
67
7,0
17
2
32
,74
4
16
1,0
68
-
3
93
,812
Gro
ss w
ritt
en
pre
miu
m
6
,67
5,6
75
1
,54
7,9
09
8
24
,68
8
6,4
98
9
,05
4,7
70
5
,17
0,6
07
1,4
51
,99
0
6
30
,54
3
7,2
53
,14
0
Gro
ss e
arn
ed
pre
miu
m
6
,17
7,7
81
1
,50
3,4
04
7
81
,13
9
47
3
8,4
62
,79
7
4,6
82
,85
3
1
,34
1,8
69
57
7,8
84
6
,60
2,6
06
Ne
t e
arn
ed
pre
miu
m
4,9
06
,98
7
9
89
,32
3
63
6,4
61
4
73
6
,53
3,2
44
3
,75
2,9
29
9
97,
79
8
4
43
,72
4
5,1
94
,45
1
Inve
stm
en
t in
com
e
1
,74
0,8
87
62
7,4
20
71
,52
5
(36
)
2
,43
9,7
96
88
2,9
15
18
9,6
96
(4
,30
0)
1
,06
8,3
11
Co
mm
issi
on
ea
rne
d
34
3,5
66
5
5,8
82
28
,15
0
-
4
27,
59
8
2
92
,53
7
5
5,2
41
4
2,2
59
3
90
,03
7
Oth
er
inco
me
(46
,17
7)
1
32
,50
7
-
-
8
6,3
30
(5
8,9
03
)
1
59
,17
4
-
1
00
,27
1
To
tal
inc
om
e
6
,94
5,2
63
1
,80
5,1
32
7
36
,13
6
43
7
9,4
86
,96
8
4,8
69
,47
8
1
,40
1,9
09
48
1,6
83
6
,75
3,0
70
Th
e g
rou
p d
oe
s n
ot
de
rive
a s
ign
ifi ca
nt
am
ou
nt
of
its
reve
nu
e f
rom
a s
ing
le c
ust
om
er.
Th
ere
we
re n
o r
eve
nu
es
de
rive
d f
rom
tra
nsa
ctio
ns
wit
hin
op
era
tin
g s
eg
me
nts
of
the
gro
up
.
Ass
et
allo
ca
tio
n b
y c
ou
ntr
y
Pro
pe
rty a
nd
eq
uip
me
nt
1
29
,60
2
3
,97
0
3
6,6
99
5
06
17
0,7
77
13
2,8
91
7
,55
8
33
,69
3
174
,14
1
Inve
stm
en
t p
rop
ert
y
4
,79
1,7
00
2
,55
9,1
14
76
9,0
94
-
8
,119
,90
8
3,6
60
,00
0
1
,415
,66
4
51
,119
5
,12
6,7
83
Inta
ng
ible
ass
ets
2
16,6
58
-
-
-
2
16,6
58
20
9,5
16
-
-
20
9,5
16
To
tal
ass
ets
1
7,5
33
,84
5
4,9
58
,48
5
1
,95
9,3
93
1
63
,28
9
2
4,6
15
,01
2
1
0,4
62
,45
5
3
,20
6,8
33
84
1,1
10
1
4,5
10
,39
8
To
tal
eq
uit
y
8
,58
6,4
22
1
,88
0,8
57
9
79
,61
4
13
0,4
58
11
,57
7,3
51
2
,90
3,0
39
1,4
27,
34
0
3
16
,92
2
4,6
47,
30
1
SE
GM
EN
TA
L IN
FO
RM
AT
ION
AN
NU
AL
RE
PO
RT
& F
INA
NC
IAL
STA
TE
ME
NT
S -
20
12
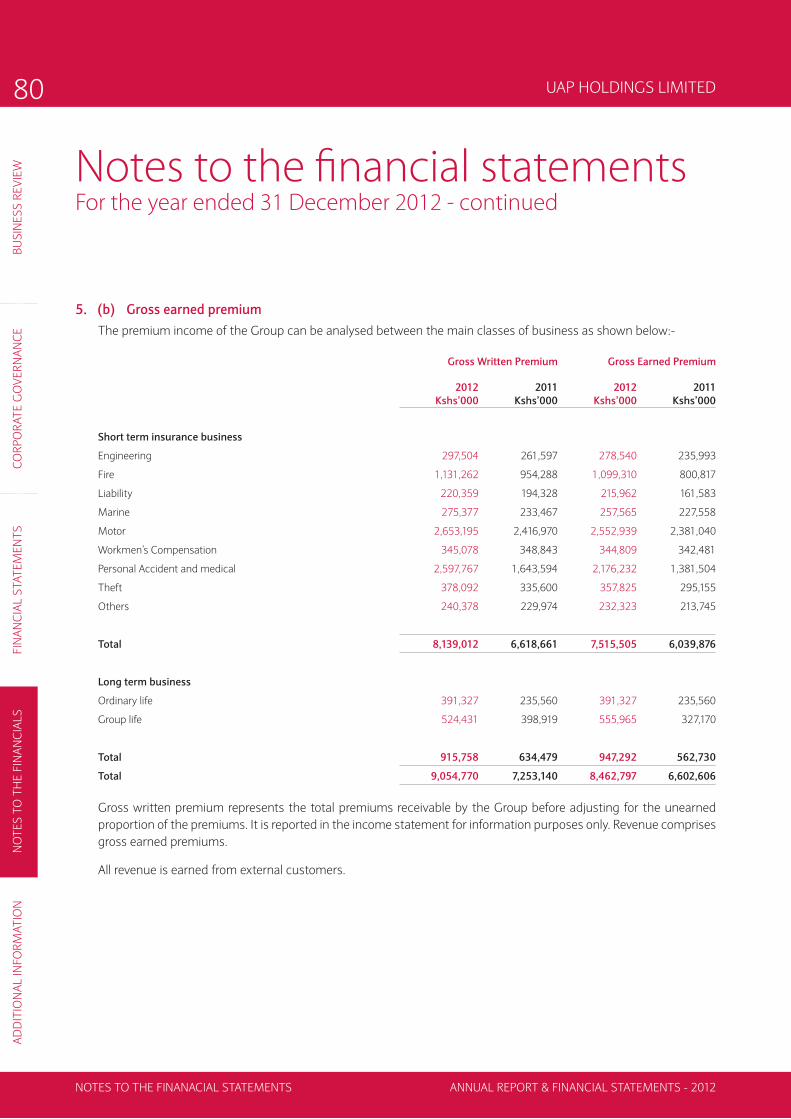
BU
SIN
ES
S R
EV
IEW
CO
RP
OR
AT
E G
OV
ER
NA
NC
EF
INA
NC
IAL
STA
TE
ME
NT
SN
OT
ES
TO
TH
E F
INA
NC
IAL
SA
DD
ITIO
NA
L IN
FO
RM
AT
ION
UAP HOLDINGS LIMITED80
Notes to the fi nancial statementsFor the year ended 31 December 2012 - continued
5. (b) Gross earned premium
The premium income of the Group can be analysed between the main classes of business as shown below:-
Gross Written Premium Gross Earned Premium
2012
Kshs’000
2011
Kshs’000
2012
Kshs’000
2011
Kshs’000
Short term insurance business
Engineering 297,504 261,597 278,540 235,993
Fire 1,131,262 954,288 1,099,310 800,817
Liability 220,359 194,328 215,962 161,583
Marine 275,377 233,467 257,565 227,558
Motor 2,653,195 2,416,970 2,552,939 2,381,040
Workmen’s Compensation 345,078 348,843 344,809 342,481
Personal Accident and medical 2,597,767 1,643,594 2,176,232 1,381,504
Theft 378,092 335,600 357,825 295,155
Others 240,378 229,974 232,323 213,745
Total 8,139,012 6,618,661 7,515,505 6,039,876
Long term business
Ordinary life 391,327 235,560 391,327 235,560
Group life 524,431 398,919 555,965 327,170
Total 915,758 634,479 947,292 562,730
Total 9,054,770 7,253,140 8,462,797 6,602,606
Gross written premium represents the total premiums receivable by the Group before adjusting for the unearned
proportion of the premiums. It is reported in the income statement for information purposes only. Revenue comprises
gross earned premiums.
All revenue is earned from external customers.
NOTES TO THE FINANACIAL STATEMENTS ANNUAL REPORT & FINANCIAL STATEMENTS - 2012

BU
SIN
ES
S R
EV
IEW
CO
RP
OR
AT
E G
OV
ER
NA
NC
EF
INA
NC
IAL
STA
TE
ME
NT
SN
OT
ES
TO
TH
E F
INA
NC
IAL
SA
DD
ITIO
NA
L IN
FO
RM
AT
ION
UAP HOLDINGS LIMITED 81
Notes to the fi nancial statementsFor the year ended 31 December 2012 - continued
6 Investment income
2012 2011
Shs ’000 Shs ’000
Interest from government securities 271,051 128,876
Bank deposit interest 293,765 72,150
Loan interest receivable 23,717 8,796
Rental income from investment properties 219,072 215,176
Miscellaneous income 20,841 10,691
Gain in foreign exchange 993 27,184
Interest on debentures 83,248 1,065
Fair value gains on investment properties (note 21) 1,155,003 702,399
Fair value (losses)/gains on equity assets at fair value through profi t or loss (note 24(b)) 190,316 (241,214)
Dividends receivable from equity investments 159,610 143,188
Fair value (losses)/gains on government securities assets at fair value though profi t or loss 22,180 -
Total 2,439,796 1,068,311
7 Other income
2012 2011Shs ’000 Shs ’000
Fee income 53,548 28,723
Other 32,782 71,548
Total 86,330 100,271
Fee income relates to administration fees arising from services rendered in relation to the issue and management of
deposit administration and other investment contracts. There are no individually signifi cant items included in other
category.
8 Claims and policyholder benefi ts payable
i) Short term insurance business
2012 2011
Shs ’000 Shs ’000
Engineering 400,422 (10,860)
Fire 249,947 188,399
Liability (17,007) 88,781
Marine 167,231 70,829
Motor 1,269,895 1,041,389
Workmen’s compensation 104,743 120,957
Personal accident and medical 1,454,965 919,996
Theft 94,122 132,042
Others 87,885 19,621
Total 3,812,203 2,571,154
NOTES TO THE FINANACIAL STATEMENTSANNUAL REPORT & FINANCIAL STATEMENTS - 2012

BU
SIN
ES
S R
EV
IEW
CO
RP
OR
AT
E G
OV
ER
NA
NC
EF
INA
NC
IAL
STA
TE
ME
NT
SN
OT
ES
TO
TH
E F
INA
NC
IAL
SA
DD
ITIO
NA
L IN
FO
RM
AT
ION
UAP HOLDINGS LIMITED82
Notes to the fi nancial statementsFor the year ended 31 December 2012 - continued
8 Claims and policyholder benefi ts payable (continued)
ii) Long term insurance business
2012
Shs ’000
2011
Shs ’000
Death, maturity and benefi ts payable 415,644 260,952
Increase in policy owners’ liabilities 347,337 217,941
Interest payable on deposit administration and unit linked investments contracts 134,272 49,351
Total 897,253 528,244
Total 4,709,456 3,099,398
9 Operating and other expenses
2012 2011Shs ’000 Shs ’000
Staff costs (Note 10) 1,047,885 579,016
Auditors’ remuneration 19,857 18,532
Depreciation (Note 19) 59,112 49,657
Amortisation on intangible assets (Note 20) 94,692 38,749
Impairment charge on receivables arising out of direct insurance arrangements (Note 4) 85,665 24,410
Operating lease rentals 110,249 95,866
Repairs and maintenance 143,754 46,635
Travelling costs 30,270 16,726
Directors expenses 27,578 15,238
Professional fees 83,137 45,938
Software maintenance & printing costs 254,004 190,352
Marketing & branding 134,554 34,092
Communication costs 27,022 14,931
Insurance related expenses 87,732 68,477
Other expenses 374,974 459,515
Total 2,580,485 1,698,134
There are no individually signfi cant items included in other expenses.
10 Staff costs
2012 2011
Shs ’000 Shs ’000
Salaries and wages 934,151 551,738
Social security benefi ts costs 21,998 21,100
Retirement benefi t costs:
Defi ned benefi ts scheme (Note 23) 16,130 (14,035)
Defi ned contribution scheme 75,606 20,213
Total 1,047,885 579,016
NOTES TO THE FINANACIAL STATEMENTS ANNUAL REPORT & FINANCIAL STATEMENTS - 2012

BU
SIN
ES
S R
EV
IEW
CO
RP
OR
AT
E G
OV
ER
NA
NC
EF
INA
NC
IAL
STA
TE
ME
NT
SN
OT
ES
TO
TH
E F
INA
NC
IAL
SA
DD
ITIO
NA
L IN
FO
RM
AT
ION
UAP HOLDINGS LIMITED 83
Notes to the fi nancial statementsFor the year ended 31 December 2012 - continued
11 Income tax expense
2012
Shs ’000
2011
Shs ’000
Current income tax 253,991 236,958
Deferred tax (Note 22) 112,929 53,270
Total 366,920 290,228
The tax on the Group’s profi t before income tax differs from the theoretical amount that would arise using the
statutory income tax rate as follows:
2012
Shs ’000
2011
Shs ’000
Profi t before tax 1,747,951 1,209,912
Tax calculated at a tax rate of 30% (2011:30%); (15% (2011 15%) UAP South-Sudan) 507,671 362,974
Less: tax effect of income not subject to tax (153,679) (159,176)
Add: tax effect of expenses not deductible for tax purposes 12,928 86,430
Total 366,920 290,228
The tax on other comprehensive income arose from unrealised losses on the Uganda equity investments which are
subject to capital gains tax when realised.
Movement in the tax (payable) / recoverable account is as follows:
2012 2011
Shs ’000 Shs ’000
At the beginning of the year (35,411) 23,443
Taxation charge (253,991) (236,958)
Taxation paid 331,074 178,105
At end of the year 41,672 (35,410)
Disclosed as follows;
31-Dec
2012
Shs ’000
31-Dec
2011
Shs ’000
Current income tax recoverable 50,941 26,672
Current income tax payable (9,269) (62,082)
Total 41,672 (35,410)
NOTES TO THE FINANACIAL STATEMENTSANNUAL REPORT & FINANCIAL STATEMENTS - 2012

BU
SIN
ES
S R
EV
IEW
CO
RP
OR
AT
E G
OV
ER
NA
NC
EF
INA
NC
IAL
STA
TE
ME
NT
SN
OT
ES
TO
TH
E F
INA
NC
IAL
SA
DD
ITIO
NA
L IN
FO
RM
AT
ION
UAP HOLDINGS LIMITED84
Notes to the fi nancial statementsFor the year ended 31 December 2012 - continued
12 Earnings per share
Basic earnings per share are calculated by dividing the profi t attributable to equity holders of the Company by the
weighted average number of ordinary shares outstanding during the year.
2012 2011
Kshs’000 Kshs’000
Profi t attributable to equity holders of the company 1,282,006 882,215
Weighted number of shares in issue 130,402 120,000
Basic earnings per share 9.83 7.35
Diluted earnings per share 9.83 7.35
Weighted number of shares in issue for the year 2012 have been
arrived at in the following way:
Number
of shares.
(Thousands)
Number
of days
Weighted
Average number of
shares
Number of shares at the beginning of the year 120,000 365 120,000
Additional shares on conversion of Private Equity Debt (November 2012) 78,920 47 10,162
Additional shares on closure of Public offer (December 2012) 12,500 7 240
Total 211,420 130,402
There were no potentially dilutive shares outstanding at 31 December 2012 or 31 December 2011. Diluted earnings per
share are therefore the same as basic earnings per share. There was no change in number of shares during the year
ended 31 December 2011.
13 Share capital
The total authorised number of ordinary shares is 220 million (2011: 120 million) with a par value of Shs 5 per share.
At 31 December 2012, 211 million ordinary shares were in issue and were fully paid.
Number of shares Ordinary shares Share premium
‘000 Kshs’000 Kshs’000
Balance at 1 January 2011, 31 December 2011 120,000 600,000 -
Issue of shares (net proceeds) 91,420 457,099 4,612,626
Balance at 31 December 2012 211,420 1,057,099 4,612,626
NOTES TO THE FINANACIAL STATEMENTS ANNUAL REPORT & FINANCIAL STATEMENTS - 2012

BU
SIN
ES
S R
EV
IEW
CO
RP
OR
AT
E G
OV
ER
NA
NC
EF
INA
NC
IAL
STA
TE
ME
NT
SN
OT
ES
TO
TH
E F
INA
NC
IAL
SA
DD
ITIO
NA
L IN
FO
RM
AT
ION
UAP HOLDINGS LIMITED 85
Notes to the fi nancial statementsFor the year ended 31 December 2012 - continued
13 Share capital (continued)
During the year the company raised additional capital through PE investor participation and a public offering. The
breakdown is as follows:
Shares Amount
Shs ’000
Private Equity
Aureos 28,796,810 1,661,000
Swede Fund 14,901,179 859,500
Africinvest 35,221,900 2,031,599
Total private equity 78,919,889 4,552,099
Public Offer 12,500,000 750,000
Total 91,419,889 5,302,099
Expenses of offer 232,374
Net proceeds 5,069,725
14 Fair value reserve for equity investments
The fair value reserves relate to unrealised gains or losses on the group’s equity investments that are carried at fair
value through other comprehensive income. This reserve is not distributable.
15 Retained earnings
The retained earnings balance represents the amount available for dividend distribution to the shareholders of the
Company, except for cumulative fair value gains on the investment properties of Shs 3,069 million (31 December
2011:Shs 1,952 million) whose distribution is subject to restrictions imposed by regulation.
16 Dividends
During the year, an interim dividend of Shs 0.85 per share (2011: nil) amounting to Shs 102 million was paid to
shareholders in the company register as at 30 June 2012. The Directors recommend the payment of a fi nal dividend of
Shs 1.50 per share (2011; Shs 1.70 per share) amounting to Shs 317 million (2011: 204 million). Payment of dividends
is subject to withholding tax at a rate of either 5% or 10% depending on the residence of the respective shareholders.
17 Statutory reserve
The statutory reserve represents amounts set up in the Group’s Ugandan subsidiary in accordance with the Ugandan
Insurance Act, which requires the following amounts to be appropriated from earnings:
• a contingency reserve calculated at the higher of 2% of gross premium and 15% of net profi ts of UAP Uganda.
• a capital reserve, calculated at 5% of net profi ts of UAP Insurance Uganda Limited.
The reserve is available for distribution to the extent that the minimum amounts required by the Uganda Insurance
Act are maintained.
NOTES TO THE FINANACIAL STATEMENTSANNUAL REPORT & FINANCIAL STATEMENTS - 2012

BU
SIN
ES
S R
EV
IEW
CO
RP
OR
AT
E G
OV
ER
NA
NC
EF
INA
NC
IAL
STA
TE
ME
NT
SN
OT
ES
TO
TH
E F
INA
NC
IAL
SA
DD
ITIO
NA
L IN
FO
RM
AT
ION
UAP HOLDINGS LIMITED86
Notes to the fi nancial statementsFor the year ended 31 December 2012 - continued
18 Goodwill
The goodwill arose from acquisition of UAP Insurance Uganda Limited in 2004 and UAP Financial Services Uganda
in 2012 and is therefore all allocated to the Uganda Cash Generating Unit (CGU) for the purposes of impairment
assessment.
31-Dec
2012
Shs ’000
31-Dec
2011
Shs ’000
At start of year: 50,545 50,545
Arising from acquisition of UAP Financial Services Uganda 15,122 -
Total 65,667 50,545
During the period ended 31 December 2012, the company acquired controlling interest in UAP Financial services
Uganda initially classifi ed as an associate. The purchase price exceeded the fair value of net assets acquired and
subsequent goodwill has been recognized as shown below:
Kshs’000
Fair value of consideration 33,022
Net assets acquired
Share capital 47,989
Retained earnings (27,797)
Non-controlling interest 11% (2,292)
Fair value of net assets acquired 17,900
Good will 15,122
The recoverable amount of a CGU is determined based on value-in-use calculations. These calculations use cash fl ow
projections based on fi nancial budgets approved by management covering a 5 year period. The growth rates do not
exceed the long-term average growth rates for the respective businesses in which CGUs operate.
The key assumptions used for the value in use calculations are:
31 December
2012
31 December
2011
Growth rate % 22 22
Discount rate % 13 13
Management determined budgeted profi t from operating activities based on past performance and its expectations
for the market developments. The weighted average growth rates used are consistent with the forecasts included in
industry reports. The discount rates used are pre-tax and refl ect specifi c risks relating to the Uganda segment.
Goodwill is classifi ed as a non-current asset.
NOTES TO THE FINANACIAL STATEMENTS ANNUAL REPORT & FINANCIAL STATEMENTS - 2012
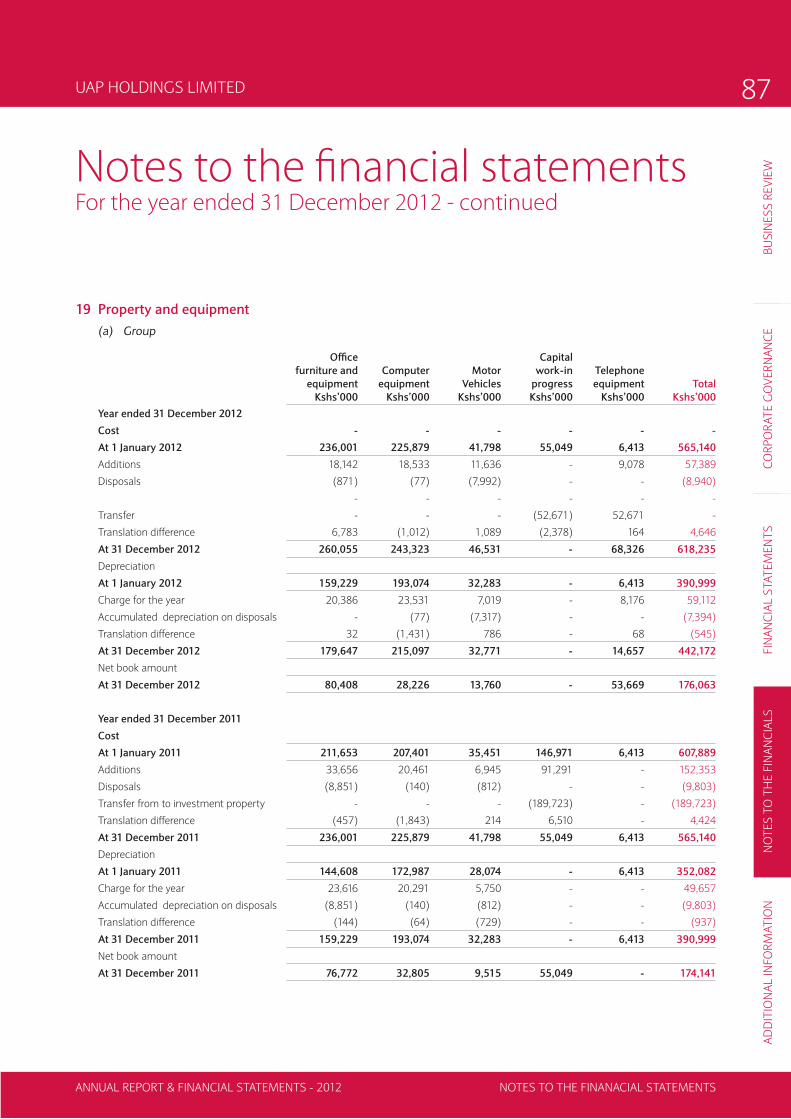
BU
SIN
ES
S R
EV
IEW
CO
RP
OR
AT
E G
OV
ER
NA
NC
EF
INA
NC
IAL
STA
TE
ME
NT
SN
OT
ES
TO
TH
E F
INA
NC
IAL
SA
DD
ITIO
NA
L IN
FO
RM
AT
ION
UAP HOLDINGS LIMITED 87
Notes to the fi nancial statementsFor the year ended 31 December 2012 - continued
19 Property and equipment
(a) Group
Offi ce
furniture and
equipment
Kshs’000
Computer
equipment
Kshs’000
Motor
Vehicles
Kshs’000
Capital
work-in
progress
Kshs’000
Telephone
equipment
Kshs’000
Total
Kshs’000
Year ended 31 December 2012
Cost - - - - - -
At 1 January 2012 236,001 225,879 41,798 55,049 6,413 565,140
Additions 18,142 18,533 11,636 - 9,078 57,389
Disposals (871) (77) (7,992) - - (8,940)
- - - - - -
Transfer - - - (52,671) 52,671 -
Translation difference 6,783 (1,012) 1,089 (2,378) 164 4,646
At 31 December 2012 260,055 243,323 46,531 - 68,326 618,235
Depreciation
At 1 January 2012 159,229 193,074 32,283 - 6,413 390,999
Charge for the year 20,386 23,531 7,019 - 8,176 59,112
Accumulated depreciation on disposals - (77) (7,317) - - (7,394)
Translation difference 32 (1,431) 786 - 68 (545)
At 31 December 2012 179,647 215,097 32,771 - 14,657 442,172
Net book amount
At 31 December 2012 80,408 28,226 13,760 - 53,669 176,063
Year ended 31 December 2011
Cost
At 1 January 2011 211,653 207,401 35,451 146,971 6,413 607,889
Additions 33,656 20,461 6,945 91,291 - 152,353
Disposals (8,851) (140) (812) - - (9,803)
Transfer from to investment property - - - (189,723) - (189,723)
Translation difference (457) (1,843) 214 6,510 - 4,424
At 31 December 2011 236,001 225,879 41,798 55,049 6,413 565,140
Depreciation
At 1 January 2011 144,608 172,987 28,074 - 6,413 352,082
Charge for the year 23,616 20,291 5,750 - - 49,657
Accumulated depreciation on disposals (8,851) (140) (812) - - (9,803)
Translation difference (144) (64) (729) - - (937)
At 31 December 2011 159,229 193,074 32,283 - 6,413 390,999
Net book amount
At 31 December 2011 76,772 32,805 9,515 55,049 - 174,141
NOTES TO THE FINANACIAL STATEMENTSANNUAL REPORT & FINANCIAL STATEMENTS - 2012
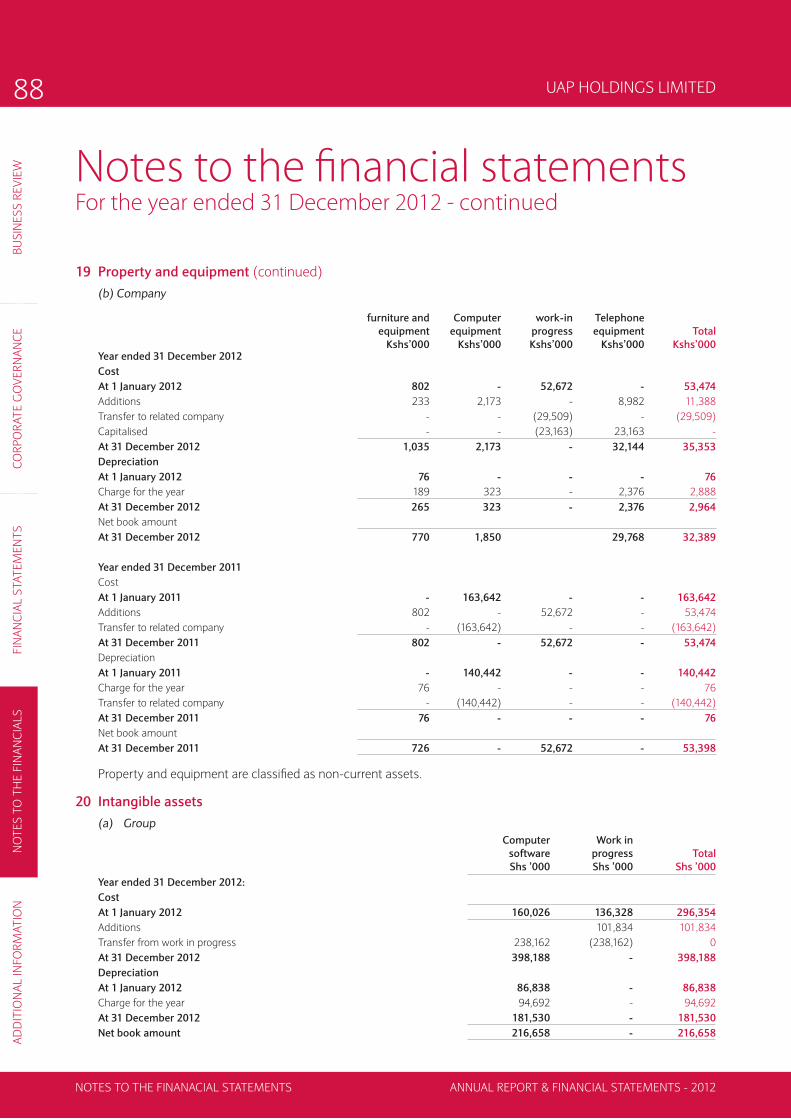
BU
SIN
ES
S R
EV
IEW
CO
RP
OR
AT
E G
OV
ER
NA
NC
EF
INA
NC
IAL
STA
TE
ME
NT
SN
OT
ES
TO
TH
E F
INA
NC
IAL
SA
DD
ITIO
NA
L IN
FO
RM
AT
ION
UAP HOLDINGS LIMITED88
Notes to the fi nancial statementsFor the year ended 31 December 2012 - continued
19 Property and equipment (continued)
(b) Company
furniture and
equipment
Kshs’000
Computer
equipment
Kshs’000
work-in
progress
Kshs’000
Telephone
equipment
Kshs’000
Total
Kshs’000 Year ended 31 December 2012
Cost
At 1 January 2012 802 - 52,672 - 53,474
Additions 233 2,173 - 8,982 11,388
Transfer to related company - - (29,509) - (29,509)
Capitalised - - (23,163) 23,163 -
At 31 December 2012 1,035 2,173 - 32,144 35,353
Depreciation
At 1 January 2012 76 - - - 76
Charge for the year 189 323 - 2,376 2,888
At 31 December 2012 265 323 - 2,376 2,964
Net book amount
At 31 December 2012 770 1,850 29,768 32,389
Year ended 31 December 2011
Cost
At 1 January 2011 - 163,642 - - 163,642
Additions 802 - 52,672 - 53,474
Transfer to related company - (163,642) - - (163,642)
At 31 December 2011 802 - 52,672 - 53,474
Depreciation
At 1 January 2011 - 140,442 - - 140,442
Charge for the year 76 - - - 76
Transfer to related company - (140,442) - - (140,442)
At 31 December 2011 76 - - - 76
Net book amount
At 31 December 2011 726 - 52,672 - 53,398
Property and equipment are classifi ed as non-current assets.
20 Intangible assets
(a) Group
Computer
software
Shs ’000
Work in
progress
Shs ’000
Total
Shs ’000
Year ended 31 December 2012:
Cost
At 1 January 2012 160,026 136,328 296,354
Additions 101,834 101,834
Transfer from work in progress 238,162 (238,162) 0
At 31 December 2012 398,188 - 398,188
Depreciation
At 1 January 2012 86,838 - 86,838
Charge for the year 94,692 - 94,692
At 31 December 2012 181,530 - 181,530
Net book amount 216,658 - 216,658
NOTES TO THE FINANACIAL STATEMENTS ANNUAL REPORT & FINANCIAL STATEMENTS - 2012

BU
SIN
ES
S R
EV
IEW
CO
RP
OR
AT
E G
OV
ER
NA
NC
EF
INA
NC
IAL
STA
TE
ME
NT
SN
OT
ES
TO
TH
E F
INA
NC
IAL
SA
DD
ITIO
NA
L IN
FO
RM
AT
ION
UAP HOLDINGS LIMITED 89
Notes to the fi nancial statementsFor the year ended 31 December 2012 - continued
(a) Group (Continued)
Year ended 31 December 2011:
Cost
At 1 January 2011 136,561 - 136,561
Additions 23,465 136,328 159,793
At 31 December 2011 160,026 136,328 296,354
Depreciation
At 1 January 2011 48,089 - 48,089
Charge for the year 38,749 - 38,749
At 31 December 2011 86,838 - 86,838
Net book amount
At 31 December 2011 73,188 136,328 209,516
Work in progress relates to costs incurred to date in relation to the development of the Group’s enterprise resource
planning (ERP) system.
(b) Company
2012 2011
Shs ’000 Shs ’000
Carrying value
At start of year 209,516 87,300
Additions - 23,465
Work in progress - Additions 100,306 136,328
Amortisation charge for the year (94,692) (37,577)
At end of year 215,130 209,516
The intangible assets for the company relate to computer software. All intangible assets are classifi ed as non-current
assets.
21 Investment properties
(a) Group 2012 2011
Shs ’000 Shs ’ 000
At start of year 5,126,783 3,225,259
Additions 1,941,699 984,482
Transfer from property and equipment (note 19(a)) - 189,723
Fair value gains 1,155,003 702,399
Currency translation differences (103,577) 24,920
At end of year 8,119,908 5,126,783
(b) Company
At start of year 1,000,000 -
Additions 528,953 417,056
Transferred from related parties (UAP Insurance Kenya) 335,777
Fair value (losses)/gains (8,953) 247,167
At end of year 1,520,000 1,000,000
20 Intangible assets (continued)
NOTES TO THE FINANACIAL STATEMENTSANNUAL REPORT & FINANCIAL STATEMENTS - 2012

BU
SIN
ES
S R
EV
IEW
CO
RP
OR
AT
E G
OV
ER
NA
NC
EF
INA
NC
IAL
STA
TE
ME
NT
SN
OT
ES
TO
TH
E F
INA
NC
IAL
SA
DD
ITIO
NA
L IN
FO
RM
AT
ION
UAP HOLDINGS LIMITED90
Notes to the fi nancial statementsFor the year ended 31 December 2012 - continued
21 Investment properties (continued)
(b) Company
The Group’s investment properties were revalued in December 2012 and 2011 by Knight Frank Valuers, professional
independent valuers in Kenya and Uganda respectively on the basis of open market. The open market value of all properties
was determined using recent market prices. The rental income earned by the Group from its investment properties leased
out under operating leases amounted to Shs 262 million (2011: Shs 215 million). Direct operating expenses arising on
investment properties amounted to Shs 3.3 million (2011: Shs 15.1 million). All investment properties are classifi ed as non-
current assets.
22 Deferred income tax
Deferred tax is calculated, in full, on all temporary differences under the liability method using a principal tax rate of
30% (2011: 30%).
The movement on the deferred income tax account is as follows:
31-Dec
2012
Shs ’000
31-Dec
2011
Shs ’000
At start of year: (96,842) (43,572)
Income statement charge / (credit) (Note 11) (112,929) (53,270)
Translation difference 13,871 -
Total (195,900) (96,842)
Disclosed as follows;
31-Dec
2012
Shs ’000
31-Dec
2011
Shs ’000
Deferred tax asset (47,991) (28,884)
Deferred tax liability 243,891 125,726
Total 195,900 96,842
Deferred tax assets and liabilities and deferred tax charge/(credit) in the income statement are attributable to the
following items:
1-Jan
2012
Shs ’000
(Charged)
/ credited
Shs ’000
Translation
Reserves
Shs ’000
31-Dec
2012
Shs ’000
Property and equipment: - on historical cost basis 15,103 1,007 (91) 16,019
Investment property fair value gains (141,367) (128,893) 16,347 (253,913)
Other provisions 29,422 14,957 (2,386) 41,993
Net deferred tax liability (96,842) (112,929) 13,871 (195,900)
NOTES TO THE FINANACIAL STATEMENTS ANNUAL REPORT & FINANCIAL STATEMENTS - 2012

BU
SIN
ES
S R
EV
IEW
CO
RP
OR
AT
E G
OV
ER
NA
NC
EF
INA
NC
IAL
STA
TE
ME
NT
SN
OT
ES
TO
TH
E F
INA
NC
IAL
SA
DD
ITIO
NA
L IN
FO
RM
AT
ION
UAP HOLDINGS LIMITED 91
Notes to the fi nancial statementsFor the year ended 31 December 2012 - continued
22 Deferred income tax (continued)1-Jan
2011
Shs ’000
(Charged) /
credited
Shs ’000
31-Dec
2011
Shs ’000
Property and equipment: - on historical cost basis 35,587 (20,484) 15,103
Investment property fair value gains (109,984) (31,383) (141,367)
Other provisions 30,825 (1,403) 29,422
Net deferred tax liability (43,572) (53,270) (96,842)
Deferred income tax liabilities are classifi ed as non-current liabilities.
23 Retirement benefi t obligation
Description of plan
The Group operates a funded defi ned benefi t plan for all employees. The Scheme is open to new entrants. Scheme
members’ contributions are a fi xed percentage of pensionable pay with the Group responsible for the balance of
the cost of benefi ts accruing. The Scheme is established under trust. The Scheme funds are invested by a fund
manager in a variety of asset classes comprising government securities (Treasury bills and bonds), stocks and shares
and commercial paper.
The amounts recognised in the statement of fi nancial position:
2012
Kshs’000
2011
Kshs’000
Present Value of funded obligations 455,896 360,193
Fair value of plan assets 646,596 488,571
Present value of unfunded obligations/(over-funding) (190,700) (128,378)
Unrecognised acturial gains 42,961 -
Asset in the balance sheet (147,739) (128,378)
The retirement benefi t asset is classifi ed as a non-current asset. The movement in the defi ned benefi t obligation over
the year was as follows:
2012 2011Kshs’000 Kshs’000
At start of year 360,193 318,680
Current service cost 46,630 29,169
Interest cost 51,918 29,705
Actuarial gains 21,763 7,662
Benefi ts paid (24,608) (25,023)
At end of year 455,896 360,193
The movement in the fair value of the plan assets is as follows:
NOTES TO THE FINANACIAL STATEMENTSANNUAL REPORT & FINANCIAL STATEMENTS - 2012

BU
SIN
ES
S R
EV
IEW
CO
RP
OR
AT
E G
OV
ER
NA
NC
EF
INA
NC
IAL
STA
TE
ME
NT
SN
OT
ES
TO
TH
E F
INA
NC
IAL
SA
DD
ITIO
NA
L IN
FO
RM
AT
ION
UAP HOLDINGS LIMITED92
Notes to the fi nancial statementsFor the year ended 31 December 2012 - continued
23 Retirement benefi t obligation (continued)
2012
Kshs’000
2011
Kshs’000
At start of year 488,571 517,779
Expected return on scheme assets 70,657 72,469
Actuarial gains/ (losses) 54,027 (134,731)
Employer contribution 35,492 23,583
Employee contribution 22,458 34,524
Benefi ts paid (24,608) (25,053)
At end of year 646,597 488,571
Plan assets compromise: 2012 2011
Kshs’000 %age Kshs’000 %age
Equity instruments 141,965 21.96% 105,504 21.59%
Debt instruments 376,016 58.15% 287,902 58.93%
Other 128,615 19.89% 95,165 19.48%
At end of year 646,596 100.00% 488,571 100.00%
The expected return on plan assets is determined by considering the expected returns available on the assets
underlying the investment policy.2012 2011 2010 2009 2008
Kshs’000 Kshs’000 Kshs’000 Kshs’000 Kshs’000
Present value of defi ned benefi t obligation 455,896 360,193 318,680 295,127 276,515
Fair value of plan assests 646,597 448,571 517,779 392,179 344,644
Surplus in the plan (190,701) (128,378) (199,099) (97,052) (68,129)
Expected yields on fi xed interest investments are based on gross redemption yields as at the balance sheet date. Expected
returns on equity and property investments refl ect long-term real rates of return experienced in the respective markets.
Expected contributions to the plan for the year ending 31 December 2012 are Shs 58,107,000
The amounts recognised in the income statement for the year are as follows:
2012 2011
Kshs’000 Kshs’000
Current service cost (net of employee contribution) 24,172 (5,355)
Interest cost 51,918 29,705
Expected return on plan assets (70,657) (72,469)
Net actuarial gains recognised in the year 10,697 34,084
Past service costs - -
Net charge for the year included in staff costs (note 10) 16,130 (14,035)
The principal actuarial assumptions used were as follows: 2012 2011
%age %age
Discount rate 14% 14%
Expected rate of return on scheme assets 14% !4%
Future salary increases 12% 12%
Future pension increases 4.9% 4.9%
NOTES TO THE FINANACIAL STATEMENTS ANNUAL REPORT & FINANCIAL STATEMENTS - 2012
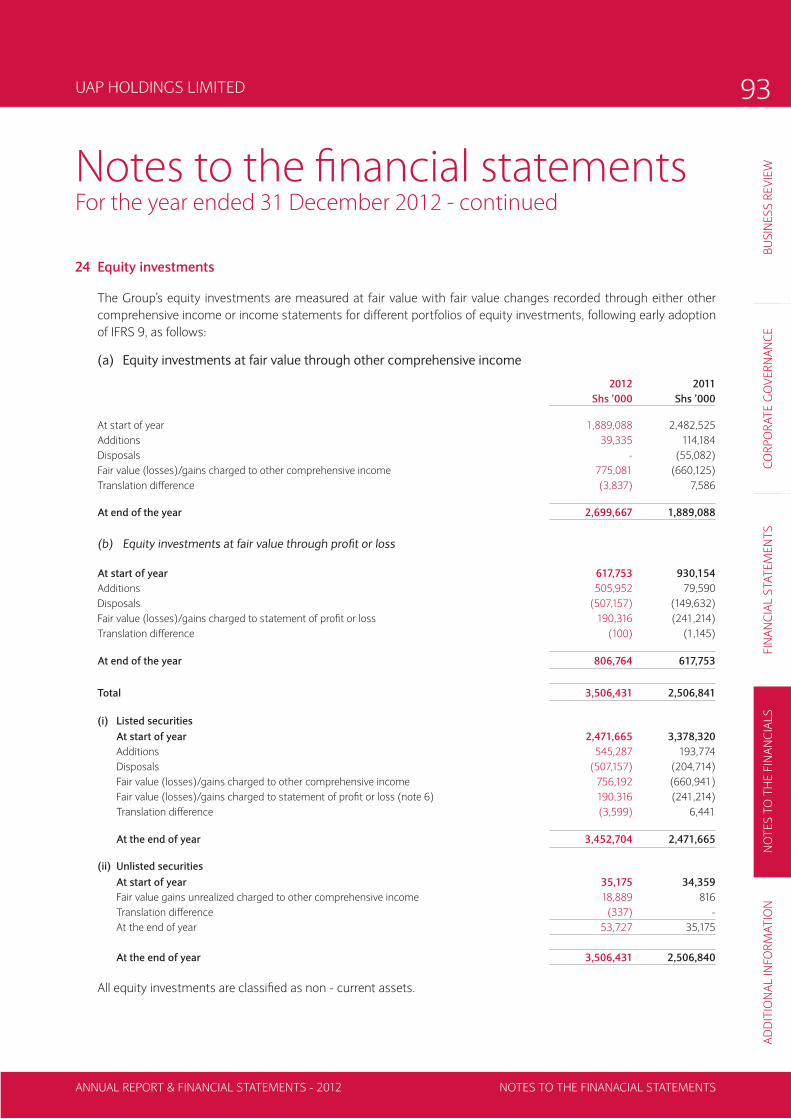
BU
SIN
ES
S R
EV
IEW
CO
RP
OR
AT
E G
OV
ER
NA
NC
EF
INA
NC
IAL
STA
TE
ME
NT
SN
OT
ES
TO
TH
E F
INA
NC
IAL
SA
DD
ITIO
NA
L IN
FO
RM
AT
ION
UAP HOLDINGS LIMITED 93
Notes to the fi nancial statementsFor the year ended 31 December 2012 - continued
24 Equity investments
The Group’s equity investments are measured at fair value with fair value changes recorded through either other
comprehensive income or income statements for different portfolios of equity investments, following early adoption
of IFRS 9, as follows:
(a) Equity investments at fair value through other comprehensive income
2012 2011
Shs ’000 Shs ’000
At start of year 1,889,088 2,482,525
Additions 39,335 114,184
Disposals - (55,082)
Fair value (losses)/gains charged to other comprehensive income 775,081 (660,125)
Translation difference (3,837) 7,586
At end of the year 2,699,667 1,889,088
(b) Equity investments at fair value through profi t or loss
At start of year 617,753 930,154
Additions 505,952 79,590
Disposals (507,157) (149,632)
Fair value (losses)/gains charged to statement of profi t or loss 190,316 (241,214)
Translation difference (100) (1,145)
At end of the year 806,764 617,753
Total 3,506,431 2,506,841
(i) Listed securities
At start of year 2,471,665 3,378,320
Additions 545,287 193,774
Disposals (507,157) (204,714)
Fair value (losses)/gains charged to other comprehensive income 756,192 (660,941)
Fair value (losses)/gains charged to statement of profi t or loss (note 6) 190,316 (241,214)
Translation difference (3,599) 6,441
At the end of year 3,452,704 2,471,665
(ii) Unlisted securities
At start of year 35,175 34,359
Fair value gains unrealized charged to other comprehensive income 18,889 816
Translation difference (337) -
At the end of year 53,727 35,175
At the end of year 3,506,431 2,506,840
All equity investments are classifi ed as non - current assets.
NOTES TO THE FINANACIAL STATEMENTSANNUAL REPORT & FINANCIAL STATEMENTS - 2012
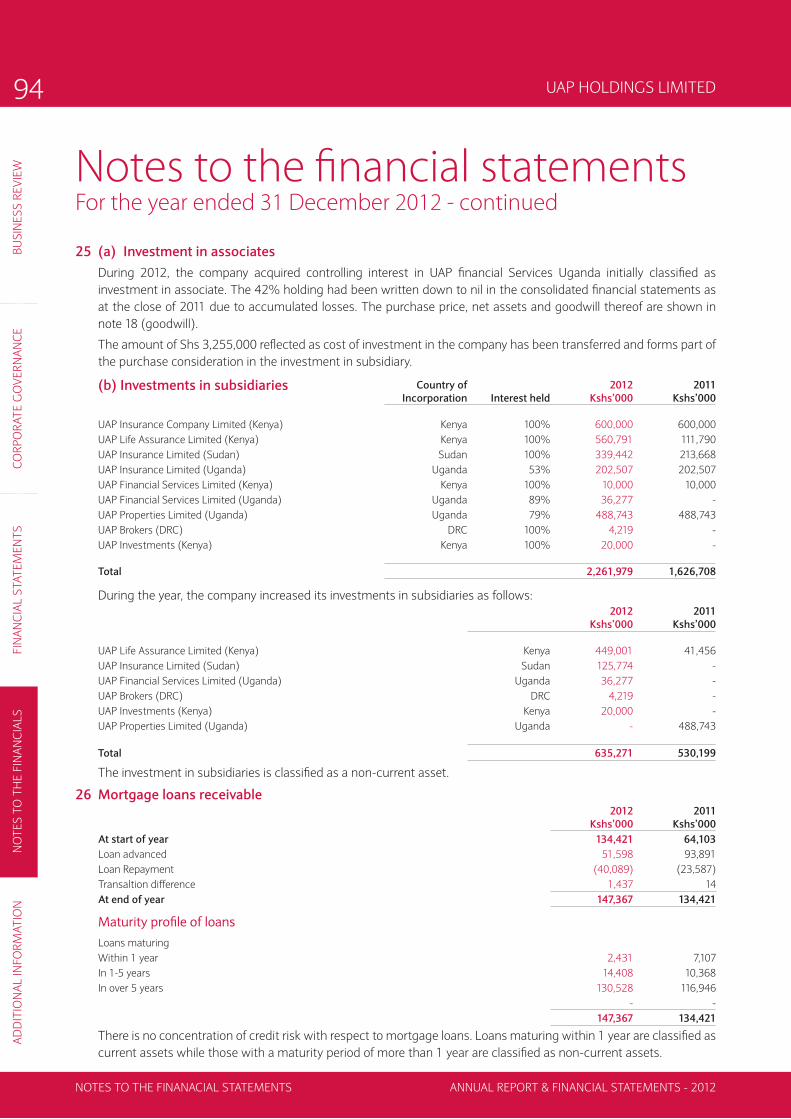
BU
SIN
ES
S R
EV
IEW
CO
RP
OR
AT
E G
OV
ER
NA
NC
EF
INA
NC
IAL
STA
TE
ME
NT
SN
OT
ES
TO
TH
E F
INA
NC
IAL
SA
DD
ITIO
NA
L IN
FO
RM
AT
ION
UAP HOLDINGS LIMITED94
Notes to the fi nancial statementsFor the year ended 31 December 2012 - continued
25 (a) Investment in associates
During 2012, the company acquired controlling interest in UAP fi nancial Services Uganda initially classifi ed as
investment in associate. The 42% holding had been written down to nil in the consolidated fi nancial statements as
at the close of 2011 due to accumulated losses. The purchase price, net assets and goodwill thereof are shown in
note 18 (goodwill).
The amount of Shs 3,255,000 refl ected as cost of investment in the company has been transferred and forms part of
the purchase consideration in the investment in subsidiary.
(b) Investments in subsidiaries Country of 2012 2011
Incorporation Interest held Kshs’000 Kshs’000
UAP Insurance Company Limited (Kenya) Kenya 100% 600,000 600,000
UAP Life Assurance Limited (Kenya) Kenya 100% 560,791 111,790
UAP Insurance Limited (Sudan) Sudan 100% 339,442 213,668
UAP Insurance Limited (Uganda) Uganda 53% 202,507 202,507
UAP Financial Services Limited (Kenya) Kenya 100% 10,000 10,000
UAP Financial Services Limited (Uganda) Uganda 89% 36,277 -
UAP Properties Limited (Uganda) Uganda 79% 488,743 488,743
UAP Brokers (DRC) DRC 100% 4,219 -
UAP Investments (Kenya) Kenya 100% 20,000 -
Total 2,261,979 1,626,708
During the year, the company increased its investments in subsidiaries as follows:
2012 2011
Kshs’000 Kshs’000
UAP Life Assurance Limited (Kenya) Kenya 449,001 41,456
UAP Insurance Limited (Sudan) Sudan 125,774 -
UAP Financial Services Limited (Uganda) Uganda 36,277 -
UAP Brokers (DRC) DRC 4,219 -
UAP Investments (Kenya) Kenya 20,000 -
UAP Properties Limited (Uganda) Uganda - 488,743
Total 635,271 530,199
The investment in subsidiaries is classifi ed as a non-current asset.
26 Mortgage loans receivable2012 2011
Kshs’000 Kshs’000
At start of year 134,421 64,103
Loan advanced 51,598 93,891
Loan Repayment (40,089) (23,587)
Transaltion difference 1,437 14
At end of year 147,367 134,421
Maturity profi le of loans
Loans maturing
Within 1 year 2,431 7,107
In 1-5 years 14,408 10,368
In over 5 years 130,528 116,946
- -
147,367 134,421
There is no concentration of credit risk with respect to mortgage loans. Loans maturing within 1 year are classifi ed as
current assets while those with a maturity period of more than 1 year are classifi ed as non-current assets.
NOTES TO THE FINANACIAL STATEMENTS ANNUAL REPORT & FINANCIAL STATEMENTS - 2012

BU
SIN
ES
S R
EV
IEW
CO
RP
OR
AT
E G
OV
ER
NA
NC
EF
INA
NC
IAL
STA
TE
ME
NT
SN
OT
ES
TO
TH
E F
INA
NC
IAL
SA
DD
ITIO
NA
L IN
FO
RM
AT
ION
UAP HOLDINGS LIMITED 95
Notes to the fi nancial statementsFor the year ended 31 December 2012 - continued
27 Reinsurer’s share of insurance liabilities
2012 2011
Shs’000 Shs’000
Reinsurer’s share of:
Unearned premium (Note 37) 698,853 631,984
Notifi ed claims outstanding:
- short term insurance (Note 35) 580,128 470,012
- long term insurance contract liabilities (Note 35) 171,667 123,603
Claims incurred but not reported short term insurance (Note 35) 74,033 90,346
At end of year 1,524,681 1,315,945
Amounts due from reinsurers in respect of claims already paid by the Group on contracts that are reinsured are
included in receivables arising out of reinsurance arrangements on the statement of fi nancial position. Movements in
the above reinsurance assets are shown in note 35 and 37.
Reinsurer’s share of insurance liabilities is classifi ed as a current asset.
28 Deferred acquisition costs
2012 2011
Kshs’000 Kshs’000
At start of year 216,328 201,577
Additions 80,408 113,142
Amortisation charge (34,024) (98,845)
Translation difference (3,849) 454
At end of year 258,863 216,328
Deferred acquisition costs are classifi ed as current assets.
29 Other receivables and prepayments
(a) Group
2012 2011
Shs ’000 Shs ’000
Prepayments 294,352 57,965
Accrued income 4,172 12,687
Staff debtors 68,920 64,547
Other 120,227 59,152
487,671 194,351
There are no individually signifi cant items under other category.
NOTES TO THE FINANACIAL STATEMENTSANNUAL REPORT & FINANCIAL STATEMENTS - 2012

BU
SIN
ES
S R
EV
IEW
CO
RP
OR
AT
E G
OV
ER
NA
NC
EF
INA
NC
IAL
STA
TE
ME
NT
SN
OT
ES
TO
TH
E F
INA
NC
IAL
SA
DD
ITIO
NA
L IN
FO
RM
AT
ION
UAP HOLDINGS LIMITED96
Notes to the fi nancial statementsFor the year ended 31 December 2012 - continued
29 Other receivables and prepayments (continued)
(b) Company
2012 2011
Shs ’000 Shs ’000
Prepayments 13,181 69,065
Due from related party (note 43 (iv)) 1,266,041 492,783
1,279,222 561,848
30 Government securities
2012 2011
Shs ’000 Shs ’000
(i) At fair value:
After 5 years 546,770 372,264
At end of the year 546,770 372,264
(ii) At amortised cost:
Within 91 days from date of acquisition 40,000 48,798
91 days to 1 year 133,715 116,684
In 1-5 years 1,076,821 516,485
After 5 years 1,411,268 638,688
At end of the year 2,661,804 1,320,655
At end of the year 3,208,574 1,692,919
Government securities with a maturity period of up to 1 year are classifi ed as current assets while those with a
maturity profi le of more than 1 year are classifi ed as non-current assets.
31 Cash and cash equivalents
For the purposes of the statement of cash fl ows, cash and cash equivalents comprise the following:
(a) Group
2012 2011
Shs ’000 Shs ’000
Cash and bank balances 964,607 642,113
Deposits with fi nancial institutions 2,911,339 752,894
Treasury bills maturing within 90 days of the date of acquisition (note 30) 40,000 48,798
At end of the year 3,915,946 1,443,805
NOTES TO THE FINANACIAL STATEMENTS ANNUAL REPORT & FINANCIAL STATEMENTS - 2012

BU
SIN
ES
S R
EV
IEW
CO
RP
OR
AT
E G
OV
ER
NA
NC
EF
INA
NC
IAL
STA
TE
ME
NT
SN
OT
ES
TO
TH
E F
INA
NC
IAL
SA
DD
ITIO
NA
L IN
FO
RM
AT
ION
UAP HOLDINGS LIMITED 97
Notes to the fi nancial statementsFor the year ended 31 December 2012 - continued
31 Cash and cash equivalents (continued)
(b) Company
2012 2011
Shs ’000 Shs ’000
Cash and bank balances 97,360 31,863
Deposits with fi nancial institutions 2,529,780 -
At end of the year 2,627,140 31,863
Cash and cash equivalents are classifi ed as current assets.
32 Insurance contract liabilities
2012 2011
Shs ’000 Shs ’000
Short term insurance contracts
- claims reported and claims handling expenses 2,013,441 1,715,371
- claims incurred but not reported 343,390 311,258
At end of the year 2,356,831 2,026,629
Long term contracts
- claims reported and claims handling expenses 1,037,004 774,428
Total gross insurance liabilities 3,393,835 2,801,057
Insurance contract liabilities are classifi ed as current liabilities. Movements in insurance liabilities and reinsurance
assets are shown in Note 35.
(i) Short term insurance contracts liabilities
Gross claims reported, claims handling expenses liabilities and the liability for claims incurred but not reported are net
of expected recoveries from salvage and subrogation. The expected recoveries at the end of 31 December 2012 and
31 December 2011 are not material.
The Group uses chain-ladder techniques to estimate the ultimate cost of claims and the IBNR provision. Chain
ladder techniques are used as they are an appropriate technique for mature classes of business that have a relatively
stable development pattern. This involves the analysis of historical claims development factors and the selection of
estimated development factors based on this historical pattern. The selected development factors are then applied
to cumulative claims data for each accident year that is not fully developed to produce an estimated ultimate claims
cost for each accident year.
The development of insurance liabilities provides a measure of the Groups’ ability to estimate the ultimate value of
claims. The table below illustrates how the Groups’ estimate of total claims outstanding for each accident year has
changed at successive year ends.
NOTES TO THE FINANACIAL STATEMENTSANNUAL REPORT & FINANCIAL STATEMENTS - 2012
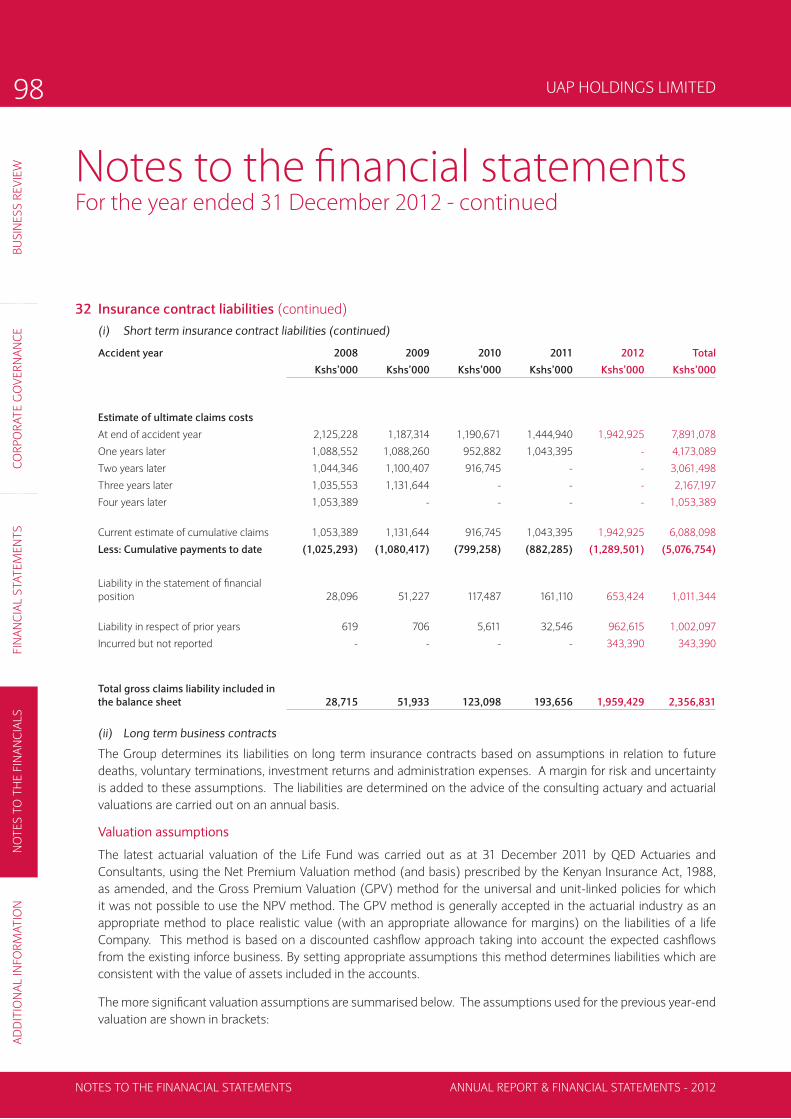
BU
SIN
ES
S R
EV
IEW
CO
RP
OR
AT
E G
OV
ER
NA
NC
EF
INA
NC
IAL
STA
TE
ME
NT
SN
OT
ES
TO
TH
E F
INA
NC
IAL
SA
DD
ITIO
NA
L IN
FO
RM
AT
ION
UAP HOLDINGS LIMITED98
Notes to the fi nancial statementsFor the year ended 31 December 2012 - continued
32 Insurance contract liabilities (continued)
(i) Short term insurance contract liabilities (continued)
Accident year 2008 2009 2010 2011 2012 Total
Kshs’000 Kshs’000 Kshs’000 Kshs’000 Kshs’000 Kshs’000
Estimate of ultimate claims costs
At end of accident year 2,125,228 1,187,314 1,190,671 1,444,940 1,942,925 7,891,078
One years later 1,088,552 1,088,260 952,882 1,043,395 - 4,173,089
Two years later 1,044,346 1,100,407 916,745 - - 3,061,498
Three years later 1,035,553 1,131,644 - - - 2,167,197
Four years later 1,053,389 - - - - 1,053,389
Current estimate of cumulative claims 1,053,389 1,131,644 916,745 1,043,395 1,942,925 6,088,098
Less: Cumulative payments to date (1,025,293) (1,080,417) (799,258) (882,285) (1,289,501) (5,076,754)
Liability in the statement of fi nancial
position 28,096 51,227 117,487 161,110 653,424 1,011,344
Liability in respect of prior years 619 706 5,611 32,546 962,615 1,002,097
Incurred but not reported - - - - 343,390 343,390
Total gross claims liability included in
the balance sheet 28,715 51,933 123,098 193,656 1,959,429 2,356,831
(ii) Long term business contracts
The Group determines its liabilities on long term insurance contracts based on assumptions in relation to future
deaths, voluntary terminations, investment returns and administration expenses. A margin for risk and uncertainty
is added to these assumptions. The liabilities are determined on the advice of the consulting actuary and actuarial
valuations are carried out on an annual basis.
Valuation assumptions
The latest actuarial valuation of the Life Fund was carried out as at 31 December 2011 by QED Actuaries and
Consultants, using the Net Premium Valuation method (and basis) prescribed by the Kenyan Insurance Act, 1988,
as amended, and the Gross Premium Valuation (GPV) method for the universal and unit-linked policies for which
it was not possible to use the NPV method. The GPV method is generally accepted in the actuarial industry as an
appropriate method to place realistic value (with an appropriate allowance for margins) on the liabilities of a life
Company. This method is based on a discounted cashfl ow approach taking into account the expected cashfl ows
from the existing inforce business. By setting appropriate assumptions this method determines liabilities which are
consistent with the value of assets included in the accounts.
The more signifi cant valuation assumptions are summarised below. The assumptions used for the previous year-end
valuation are shown in brackets:
NOTES TO THE FINANACIAL STATEMENTS ANNUAL REPORT & FINANCIAL STATEMENTS - 2012

BU
SIN
ES
S R
EV
IEW
CO
RP
OR
AT
E G
OV
ER
NA
NC
EF
INA
NC
IAL
STA
TE
ME
NT
SN
OT
ES
TO
TH
E F
INA
NC
IAL
SA
DD
ITIO
NA
L IN
FO
RM
AT
ION
UAP HOLDINGS LIMITED 99
Notes to the fi nancial statementsFor the year ended 31 December 2012 - continued
32 Insurance contract liabilities (continued)
(ii) Long term business contracts (continued)
a) Mortality – The Group used SA56-62 (2010: SA56-62) as a base table of standard mortality for the GPV valuation and KE01-03 (2010:
A1949/52) for the NPV basis. Statistical methods are used to adjust the rates refl ected in the table based on the Company’s experience.
An allowance for AIDS is made based on the Actuarial Society of South Africa’s 2003 AIDS tables. For contracts insuring survivorship the
a(55) (2010: a(55)) life table was used as a base; no allowance is made for future mortality improvements.
b) Persistency – The Group does not have suffi cient historical data to allow statistical methods to be used to
determine an appropriate persistency rate. The persistency rates used in the valuation were set according to the
experience observed (by the actuary) in the Group’s data
c) Investment returns are derived with reference to the return on long term fi xed interest investments available in
Kenya and adjusted to refl ect the actual underlying mix of assets. For the current valuation, the rate of return was
13.5% p.a. (2010: 12% p.a.) for the GPV basis and 4% p.a (2010: 6% p.a) for the NPV basis.
d) Expenses, tax and infl ation – The current level of renewal expenses were taken to be an appropriate expense
base. Expenses pertaining to business establishment and expansion were excluded from the valuation assumption.
Expense infl ation is assumed to be 11.5% p.a. (2010:9% p.a.). It has been assumed that the current tax legislation
and rates continue unaltered. Under the NPV method it is not possible to model expenses, tax and infl ation explicitly.
Sensitivity analysis
The following table presents the sensitivity of the value of long term insurance liabilities to movements in key
assumptions used in the estimation of liabilities. For liabilities under insurance contracts with fi xed and guaranteed
terms, key assumptions are unchanged for the duration of the contract. For long term insurance contracts without
fi xed terms and with discretionary participation in profi ts, the liability is set approximately equal to the value of the
underlying asset of the contract. Hence, there is no sensitivity analysis for these types of contracts.
Change in
variable
Increase /
(decrease)
in liability 2012
Shs ’000
Increase /
(decrease)
in liability 2011
Shs ’000Contracts with Fixed and Guaranteed Terms - Variable:
Worsening of mortality 10% 5,052 12,070
Lowering of investment returns p.a. -1% 16,684 32,139
Worsening of expense infl ation rate 1% 5,668 5,304
Worsening of lapse rate 10% (3,489) (28,433)
33 Amounts payable under deposit administration contracts
Deposit administration contracts are recorded at amortised cost. Movements in amounts payable under deposit
administration contracts during the period were as shown below. The liabilities are shown inclusive of interest
accumulated to the end of the reporting period. Interest was declared and credited to the customers accounts at a
weighted average rate of 3.4 % for the year (2010: 10 %).
NOTES TO THE FINANACIAL STATEMENTSANNUAL REPORT & FINANCIAL STATEMENTS - 2012

BU
SIN
ES
S R
EV
IEW
CO
RP
OR
AT
E G
OV
ER
NA
NC
EF
INA
NC
IAL
STA
TE
ME
NT
SN
OT
ES
TO
TH
E F
INA
NC
IAL
SA
DD
ITIO
NA
L IN
FO
RM
AT
ION
UAP HOLDINGS LIMITED100
Notes to the fi nancial statementsFor the year ended 31 December 2012 - continued
33 Amounts payable under deposit administration contracts (continued)
2012 2012
Shs ’000 Shs ’000
At start of year 1,712,685 1,448,028
Pension fund deposits received 443,186 425,524
Surrenders and annuities paid (191,881) (223,353)
Interest payable to policyholders 246,339 73,354
Other movements (6,365) (10,197)
Translation difference (1,147) (671)
At end of the year 2,202,817 1,712,685
Other movements relate to a release of excess liabilities recognised following reconciliation of the deposit administration
policyholders accounts in the year. Amounts payable under deposit administration contracts are classifi ed as current liabilities.
34 Unit-linked investment contracts
The benefi ts offered under these contracts are based on the return of a portfolio of equities and debt securities. The
maturity value of the fi nancial liabilities is determined by the fair value of the linked assets. There will be no difference
between the carrying amount and the maturity amount at maturity date.
2012 2011
Shs ’000 Shs ’000
At start of year 658,841 637,323
Premium received 139,660 114,385
Interest credited 134,272 (3,875)
Liabilities released for payment (68,042) (42,854)
Other movements (16,496) (46,138)
Translation difference (871) -
At end of the year 847,364 658,841
Unit linked investment contracts are classifi ed as current liabilities. Other movements relates to increase in actuarial liabilities.
NOTES TO THE FINANACIAL STATEMENTS ANNUAL REPORT & FINANCIAL STATEMENTS - 2012

BU
SIN
ES
S R
EV
IEW
CO
RP
OR
AT
E G
OV
ER
NA
NC
EF
INA
NC
IAL
STA
TE
ME
NT
SN
OT
ES
TO
TH
E F
INA
NC
IAL
SA
DD
ITIO
NA
L IN
FO
RM
AT
ION
UAP HOLDINGS LIMITED 101
Notes to the fi nancial statementsFor the year ended 31 December 2012 - continued
35 Movements in insurance liabilities and reinsurance assets
31-Dec-12 31-Dec-11
Gross Reinsurance Net Gross Reinsurance Net
Shs’ 000 Shs’ 000 Shs’ 000 Shs’ 000 Shs’ 000 Shs’ 000
a) Short term insurance business
Notifi ed claims 1,715,371 (470,012) 1,245,359 1,523,138 (631,374) 891,764
Incurred but not reported 311,258 (90,346) 220,912 222,950 (75,976) 146,974
Total at beginning of year 2,026,629 (560,358) 1,466,271 1,746,088 (707,350) 1,038,738
Cash paid for claims settled in year (1,848,125) 585,276 (1,262,849) (2,416,282) 343,326 (2,072,956)
Increase in liabilities
- arising from current year claims 1,094,975 (285,224) 809,751 1,424,014 (109,036) 1,314,978
- arising from prior year claims 1,083,352 (393,855) 689,497 1,272,809 (87,298) 1,185,511
Total at end of year 2,356,831 (654,161) 1,702,670 2,026,629 (560,358) 1,466,271
Notifi ed claims 2,013,441 (580,128) 1,433,313 1,715,371 (470,012) 1,245,359
Incurred but not reported 343,390 (74,033) 269,357 311,258 (90,346) 220,912
Total at end of year 2,356,831 (654,161) 1,702,670 2,026,629 (560,358) 1,466,271
b) Long term insurance business
At beginning of year 774,428 (123,604) 650,824 389,852 (74,364) 315,488
Premium received/valuation premium 919,260 (251,841) 667,419 497,864 (87,937) 409,927
Liabilities released for payments (656,684) 203,778 (452,906) (113,288) 38,697 (74,591)
Total at end of year 1,037,004 (171,667) 865,337 774,428 (123,604) 650,824
Total at end of year 3,393,835 (825,828) 2,568,007 2,801,057 (683,962) 2,117,095
36 Borrowings
2012 2011
Shs ’000 Shs ’000
(a) Group
At start of year 1,153,153 498,768
Proceeds from borrowings 1,011,736 938,573
PE investors convertible loans (note 13) 4,552,099 -
Interest cost payable 161,476 52,252
Converted into ordinary shares (4,552,099) -
Loan and Interest paid (1,309,329) (336,440)
At end of the year 1,017,036 1,153,153
NOTES TO THE FINANACIAL STATEMENTSANNUAL REPORT & FINANCIAL STATEMENTS - 2012

BU
SIN
ES
S R
EV
IEW
CO
RP
OR
AT
E G
OV
ER
NA
NC
EF
INA
NC
IAL
STA
TE
ME
NT
SN
OT
ES
TO
TH
E F
INA
NC
IAL
SA
DD
ITIO
NA
L IN
FO
RM
AT
ION
UAP HOLDINGS LIMITED102
Notes to the fi nancial statementsFor the year ended 31 December 2012 - continued
36 Borrowings (continued) 2012 2011
(b) Company Shs ’000 Shs ’000
At start of year 890,000 -
Proceeds from borrowings 150,000 890,000
PE investors convertible loans 4,552,099 -
Interest cost payable 293,897 18,888
Converted into ordinary shares (4,552,099) -
Loan and interest paid (1,333,897) (18,888)
At end of the year - 890,000
Bank borrowings are repayable on demand and bear an average interest rate of equivalent to the 91-day treasury bill
rate plus 1.5% -2% per annum (2010: 91-day treasury bill rate plus 1.5% -2% per annum).
Bank borrowings are classifi ed as current liabilities. The carrying amounts of borrowings approximate to their fair
value.
None of the borrowings was in default at any time during the year.
37 Unearned premium
Unearned premium represents the liability for short term business contracts where the Group’s obligations are not
expired at the year end. Movements in the reserve are shown below:
31-Dec-12 31-Dec-11
Gross Reinsurance Net Gross Reinsurance Net
Shs’ 000 Shs’ 000 Shs’ 000 Shs’ 000 Shs’ 000 Shs’ 000
At beginning of the year 2,769,805 (631,984) 2,137,821 2,210,787 (292,400) 1,918,387
Increase in the year 608,702 (66,869) 541,832 559,018 (339,584) 219,434
At end of year 3,378,507 (698,853) 2,679,653 2,769,805 (631,984) 2,137,821
Unearned premiums are classifi ed as current liabilities.
38 Other payables
(a) Group 2012 2011
Shs ’000 Shs ’000
Deferred income 30,004 977
Accrued expenses 282,512 70,394
Accrued leave 51,897 29,019
Withheld taxes 5,084 1,302
Public offer funds due for refund 111,377 - Other liabilities 394,445 107,426
At end of the year 875,319 209,118
Other payables are classifi ed as current liabilities. There are no individually signifi cant items under other liabilities.
NOTES TO THE FINANACIAL STATEMENTS ANNUAL REPORT & FINANCIAL STATEMENTS - 2012

BU
SIN
ES
S R
EV
IEW
CO
RP
OR
AT
E G
OV
ER
NA
NC
EF
INA
NC
IAL
STA
TE
ME
NT
SN
OT
ES
TO
TH
E F
INA
NC
IAL
SA
DD
ITIO
NA
L IN
FO
RM
AT
ION
UAP HOLDINGS LIMITED 103
Notes to the fi nancial statementsFor the year ended 31 December 2012 - continued
38 Other payables (continued)
(b) Company
2012 2011
Shs ’000 Shs ’000
Accrued expenses 113,333 64,916
Other liablities 87,256 -
Public offer funds due for refund 111,377 -
At end of the year 311,966 64,916
Due to related parties (note 43 (iv)) 1,405,155 1,115,853
There are no individually signifi cant items under “other liabilities.”
39 Cash generated from operations
Reconciliation of profi t before tax to cash generated from operations
2012 2011
Shs ’000 Shs ’000
Profi t before tax 1,747,951 1,209,912
Adjustments for:
Investment income (Note 6) (2,439,796) (1,068,311)
Depreciation (Note 19) 59,112 49,657
Amortisation (Note 20) 94,692 38,749
Finance costs (Note 36) 161,476 52,252
Gain on disposal of property and equipment (464) (676)
Changes in:
Insurance contract liabilities (net) 384,044 762,870
Deposit administration contracts 490,131 264,657
Unit-linked contracts 188,523 21,518
Unearned premium (net) 608,702 219,434
Re-insurance and other payables 1,365,195 (177,971)
Direct insurance, re-insurance and other receivables (1,473,618) (211,931)
Deferred acquisition costs (42,535) (13,094)
Retirement benefi t asset (19,361) (35,456)
Cash generated from operations 1,124,052 1,111,609
40 Contingent liabilities
In common with the insurance industry in general, the Group’s insurance subsidiaries are subject to litigation arising
in the normal course of insurance business. The directors are of the opinion that this litigation will not have a
material effect on the fi nancial position or profi ts of the Group.
NOTES TO THE FINANACIAL STATEMENTSANNUAL REPORT & FINANCIAL STATEMENTS - 2012

BU
SIN
ES
S R
EV
IEW
CO
RP
OR
AT
E G
OV
ER
NA
NC
EF
INA
NC
IAL
STA
TE
ME
NT
SN
OT
ES
TO
TH
E F
INA
NC
IAL
SA
DD
ITIO
NA
L IN
FO
RM
AT
ION
UAP HOLDINGS LIMITED104
Notes to the fi nancial statementsFor the year ended 31 December 2012 - continued
41 Commitments
Capital expenditure committed but not contracted for at fi nancial reporting date is as follows:
2012 2011
Shs ’000 Shs ’000
Capital expenditure 2,612,558 6,500,000
The capital expenditure committed but not contracted relates to three major contracts for the construction of
investment properties in Kenya, Uganda and Sudan. These projects are estimated to cost approximately Shs 7.4
billion. They are estimated to take 24 months to complete.
42 Financial instruments by category
a) Financial assets
The Group’s fi nancial assets are summarised by measurement category in the table below.
2012 2011
Shs ’000 Shs ’000
At amortised cost 11,183,629 5,612,081
At fair value 4,053.201 2,879,105
15,236,831 8,491,186
At amortised cost
Government securities 2,661,804 1,320,655
Corporate bonds 426,683 136,137
Receivables arising out of reinsurance arrangements 485,929 134,952
Receivables arising out of direct insurance arrangements 1,867,900 1,038,578
Reinsurers’ share of insurance liabilities 1,524,681 1,315,945
Other receivables 193,319 136,386
Bank deposits 2,911,339 752,894
Bank balances 964,607 642,113
Mortgage loans receivable 147,367 134,421
11,183,629 5,612,081
Financial assets at fair value
Equity investment
- At fair value through other comprehensive income 2,699,668 1,889,088
- At fair value through profi t or loss 806,764 617,753
Government securities at fair value through profi t or loss 546,770 372,264
4,053,201 2,879,105
NOTES TO THE FINANACIAL STATEMENTS ANNUAL REPORT & FINANCIAL STATEMENTS - 2012

BU
SIN
ES
S R
EV
IEW
CO
RP
OR
AT
E G
OV
ER
NA
NC
EF
INA
NC
IAL
STA
TE
ME
NT
SN
OT
ES
TO
TH
E F
INA
NC
IAL
SA
DD
ITIO
NA
L IN
FO
RM
AT
ION
UAP HOLDINGS LIMITED 105
Notes to the fi nancial statementsFor the year ended 31 December 2012 - continued
42 Financial instruments by category (continued)
b) Financial liabilities
All the Group’s fi nancial liabilities are measured at amortised cost. The carrying value of the Group’s and the Company’s
fi nancial liabilities at the end of 2011 and 2012 is shown on note 4(b).
43 Related party transactions
The group is controlled by UAP Holdings Limited incorpoted in Kenya, being the ultimate parent of the Group. There are
other companies that are related to UAP Holdings Limited through common shareholdings or common directorships.
The following transactions were carried out with related parties:
2012 2011Shs ’000 Shs ’000
i) Administration of staff pension scheme- Group
Contributions paid 35,492 23,583
Benefi ts paid (24,608) (25,053)
ii) Transactions with related parties - Company
Transfer of property& equipment
UAP Insurance Company Limited - Kenya 21,900 (23,200)
UAP Insurance Limited (Uganda) 3,871 -
UAP South Sudan 3,738 -
Interest paid to UAP Insurance Company 159,856 -
iii) Outstanding balances with related parties - Group
Mortgage loans receivable (note 25) 147,367 134,421
Mortgages are advanced to executive management and are fully secured on the mortgage properties and are charged interest at
6% (2011: 6%).
iv) Outstanding balances with related parties - Company
Amount payable to UAP Insurance Company Limited - Kenya 1,374,530 1,044,944
Amount payable to UAP Life Assurance Limited 30,625 51,521
Amount payable to UAP Sudan Limited - 19,388
At end of year 1,405,155 1,115,853
Amount receivable from UAP Insurance Limited 370,500 472,500
Amount receivable from UAP Insurance Limited (Sudan) 13,009 -
Amount receivable from UAP Insurance Limited (Uganda) (8,660) -
Amount receivable from UAP Financial Services Limited (Uganda) 633 11,982
Amount receivable from UAP Properties Limited (Uganda) 133,944 -
Amount receivable from UAP Properties Limited (Sudan) 107,000 -
Amount receivable from Union Insurance (Rwanda) 24,499 8,301
Amount receivable from UAP Brokers (DRC) 21,419 -
Amount receivable from UAP Investments (Kenya) 9,060 -
Amount receivable from UAP Global Services (Mauritius) 424,437 -
Amount receivable from UAP Africa Limited (Mauritius) 170,200 -
At end of year 1,266,041 492,783
NOTES TO THE FINANACIAL STATEMENTSANNUAL REPORT & FINANCIAL STATEMENTS - 2012

BU
SIN
ES
S R
EV
IEW
CO
RP
OR
AT
E G
OV
ER
NA
NC
EF
INA
NC
IAL
STA
TE
ME
NT
SN
OT
ES
TO
TH
E F
INA
NC
IAL
SA
DD
ITIO
NA
L IN
FO
RM
AT
ION
UAP HOLDINGS LIMITED106
Notes to the fi nancial statementsFor the year ended 31 December 2012 - continued
43 Related party transactions (continued) 2012 2011Shs ’000 Shs ’000
The amounts payable to related parties have no specifi c repayment date.
v) Loan to directors
At start of year 39,694 23,971
Loan advanced during the year 3,000 17,000
Loans repayments received (3,445) (1,277)
At end of year 39,249 39,694
Loans to directors are fully secured and are charged interest at 6% (2010: 6%).
vii) Key management compensation
Salaries (Including executive directors salaries) 296,672 186,912
Retirement benefi ts costs 23,347 25,728
Total 320,019 212,640
vi) Directors emoluments
Executive salaries (included in key management compensation above) 121,397 84,251
Fees 38,976 34,016
Other remuneration 4,523 -
Total 164,896 118,267
NOTES TO THE FINANACIAL STATEMENTS ANNUAL REPORT & FINANCIAL STATEMENTS - 2012

BU
SIN
ES
S R
EV
IEW
CO
RP
OR
AT
E G
OV
ER
NA
NC
EF
INA
NC
IAL
STA
TE
ME
NT
SN
OT
ES
TO
TH
E F
INA
NC
IAL
SA
DD
ITIO
NA
L IN
FO
RM
AT
ION
UAP HOLDINGS LIMITED 107YOUR NOTES
YOUR NOTES ANNUAL REPORT & FINANCIAL STATEMENTS - 2012

BU
SIN
ES
S R
EV
IEW
CO
RP
OR
AT
E G
OV
ER
NA
NC
EF
INA
NC
IAL
STA
TE
ME
NT
SN
OT
ES
TO
TH
E F
INA
NC
IAL
SA
DD
ITIO
NA
L IN
FO
RM
AT
ION
UAP HOLDINGS LIMITED108 YOUR NOTES
YOUR NOTESANNUAL REPORT & FINANCIAL STATEMENTS - 2012


![Index [images10.newegg.com]images10.newegg.com/UploadFilesForNewegg/itemintelligence/UNITEC… · Index Index ... pressing function-key in your application program while the barcode](https://static.fdocuments.in/doc/165x107/5af4efbf7f8b9a4d4d8e5a53/index-index-index-pressing-function-key-in-your-application-program-while.jpg)