Two-Port Models, Frequency Response - CppSim
20
M.H. Perrott Analysis and Design of Analog Integrated Circuits Lecture 2 Two-Port Models, Frequency Response Michael H. Perrott January 25, 2011 Copyright © 2012 by Michael H. Perrott All rights reserved.
Transcript of Two-Port Models, Frequency Response - CppSim

M.H. Perrott
Analysis and Design of Analog Integrated CircuitsLecture 2
Two-Port Models, Frequency Response
Michael H. PerrottJanuary 25, 2011
Copyright © 2012 by Michael H. PerrottAll rights reserved.

M.H. Perrott
Review: Basics of One-Port Modeling
Vth computed as open circuit voltage at port nodes Ith computed as short circuit current across port
nodes Zth computed as Vth/Ith- All independent voltage and current sources are set to
zero value
Zth
Vth Ith Zth
Thevenin Equivalent Norton EquivalentLinear Network
2

M.H. Perrott 3
Basics of Two-Port Modeling (Unilateral)
We now include a dependent current or voltage source
Zin- Solve using 1-Port analysis at input
Zout- Solve using 1-Port analysis at output with V1 = 0
GM- Short circuit output current as a function of V1
Av- Open circuit output voltage as a function of V1
No IndependentSources
ZL
Zs
Vin
ZoutGmV1
Linear Network
ZinV1 ZL
Zs
Vin
Zout
AvV1 ZLZinV1
Zs
Vin
OR

M.H. Perrott 4
Analysis of Cascaded Blocks
No IndependentSources
Block 2
No IndependentSources
Block 3
ZLVb
No IndependentSources
Block 1
Vin Va Vc
Linear NetworkLinear NetworkLinear Network
ZLZoutGmVbZinVbZoutGmVaZinVaZoutGmVinZinVin Vc
Zout,effective
Vth,effective Zin,effectiveVb
Analysis carried out without solving simultaneous equations!

M.H. Perrott 5
Problem: Most Circuits are Very Nonlinear!
No IndependentSources
Block 2
No IndependentSources
Block 3
ZLVb
No IndependentSources
Block 1
Vin Va VcNonLinearNetwork
NonLinearNetwork
NonLinearNetwork
Can we still leverage two-port modeling?
Thevenin/Norton modeling only applies to linear networks
Direct analysis of nonlinear networks is challenging

M.H. Perrott 6
Small Signal Modeling Allows Us to Linearize
No IndependentSources
Block 2
No IndependentSources
Block 3
ZLVb
No IndependentSources
Block 1
Vin Va VcNonLinearNetwork
No IndependentSources
Block 2
No IndependentSources
Block 3
ZLVb
No IndependentSources
Block 1
Vin Va Vc
Linear NetworkLinear NetworkLinear Network
NonLinearNetwork
NonLinearNetwork
Linearization
Small signal model is only valid about a specific operating point
M.H. Perrott
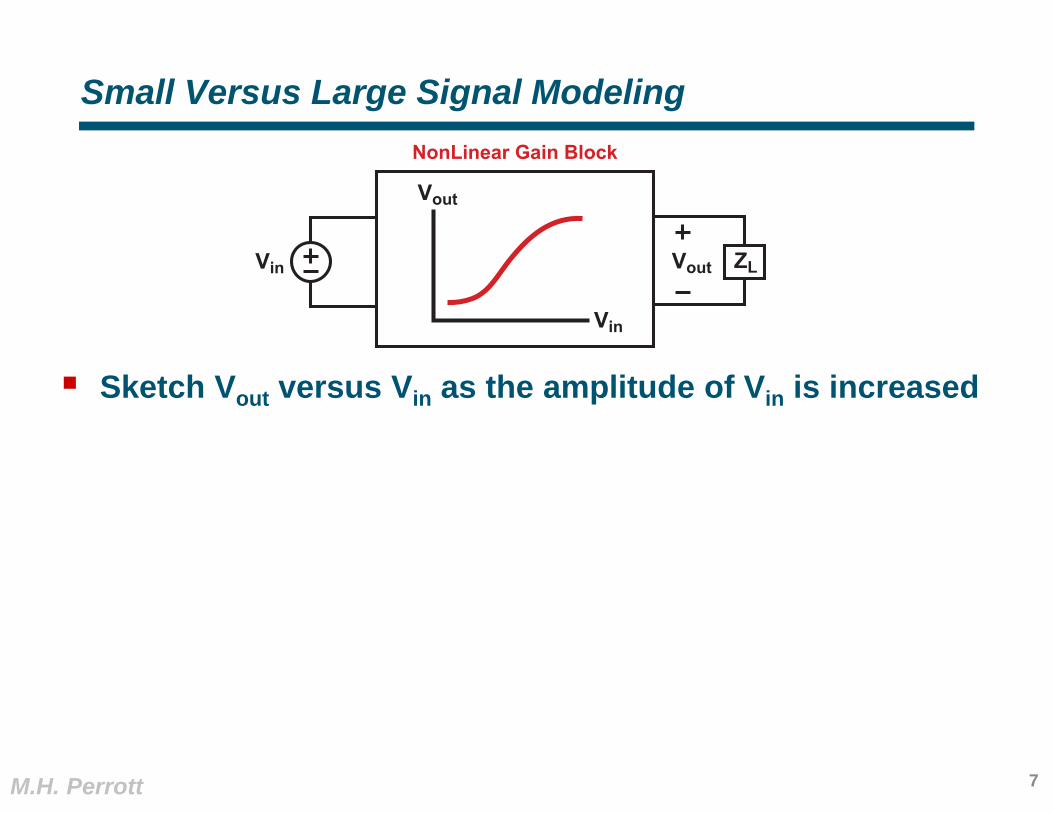
Small Versus Large Signal Modeling
Sketch Vout versus Vin as the amplitude of Vin is increased
7
ZLVin Vout
NonLinear Gain Block
Vin
Vout

M.H. Perrott
Impact of Operating Point on Small Signal Modeling
8
ZLVin Vout
NonLinear Gain Block
Vin
Vout
Vin_dc
Vout_dc
Sketch Vout versus Vin as the DC operating point is changed

M.H. Perrott
Achieving a Small Signal Model
9
ZLVin Vout
NonLinear Gain Block
Vin
Vout
Vin_dc
Vout_dc
Create a two port model of the above block

M.H. Perrott
Including Impedances in Two-Port Models
Compute Vout as a function of Vin
10
Zout
AvV1 ZLZinV1
Zs
Vin Vout

M.H. Perrott
Example of Two-Port Derivation
Compute Zin, Zout, and Gm- Assume rin = infinity, gmb = 011
RD
RS
RG
-gmbvsvgs
vs
rogmvgs voutvin
Device Small Signal Model
rin
g d
s
ZoutGmV1ZinV1 RD
RG
Vin
g d
vout

M.H. Perrott
Frequency Domain Modeling of Impedances
Determine Laplace Transform of Impedances Below:
12
L
C R
CR
ZoutCRZin

M.H. Perrott
Example: Transfer Function of Two-Port Circuit
Derive the transfer function Vout(s)/Vin(s) Label the poles and zeros of the transfer function
13
roGmV1V1Vin
g d
voutCin Cload
Rsrc

M.H. Perrott
Frequency Response
Frequency response is readily derived from a transfer function:- For w (rad/s), you substitute s = jw- For f (Hz), you substitute s = j2f- Note that j = sqrt(-1)
Example, for the transfer function on the previous page, the frequency response (in f (Hz)) is:
14

M.H. Perrott
Bode Plot Basics
The magnitude and phase of the frequency response is often depicted in the form of a Bode plot
Example:
- Log of magnitude (dB):
Taking the log allows the poles and zeros to be plotted separately and then added together
- Phase:
Phase of poles and zeros can also be plotted separately and then added together
15
M.H. Perrott
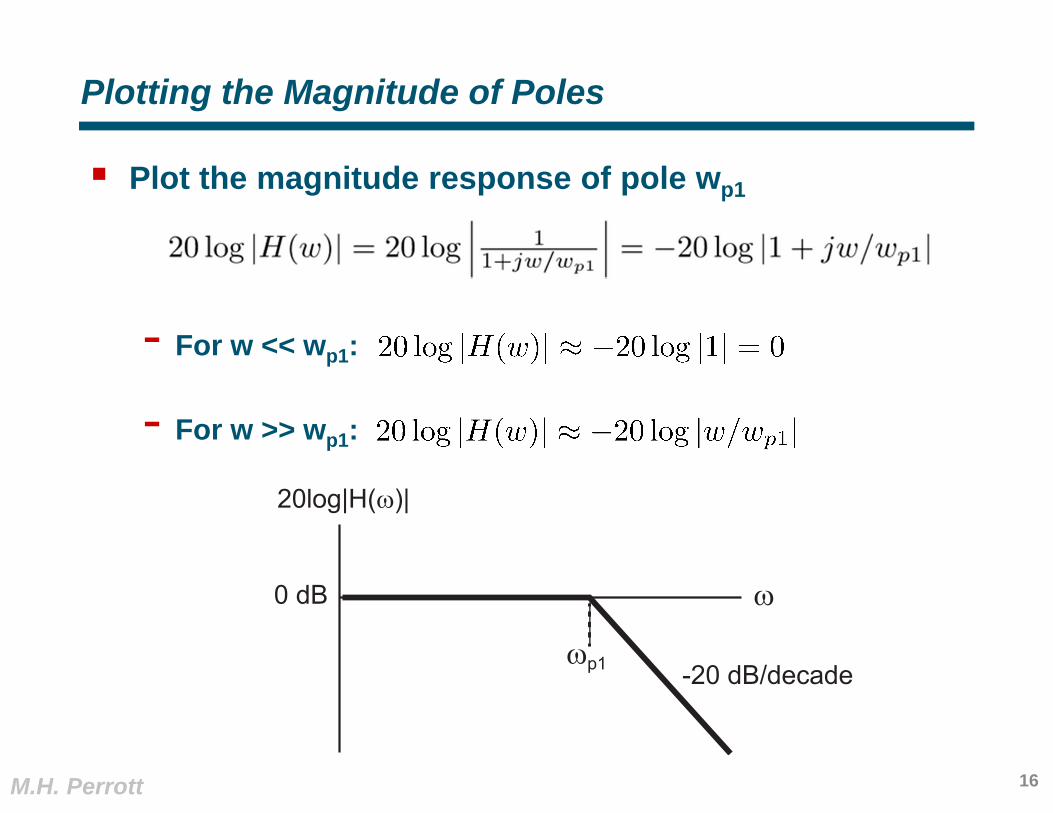
Plotting the Magnitude of Poles
Plot the magnitude response of pole wp1
- For w << wp1:
- For w >> wp1:
16
ω
20log|H(ω)|
0 dB
-20 dB/decadeωp1

M.H. Perrott
Plotting the Magnitude of Zeros
Plot the magnitude response of pole wz
- For w << wz:
- For w >> wz:
17
ω
20log|H(ω)|
0 dB
20 dB/decade
ωz

M.H. Perrott
Putting It All Together
Example Frequency Response:
- Assume wz << wp1 << wp2
18
ω
20log|H(ω)|
0 dB
20 dB/dec
ωz
0 dB/dec
-20 dB/dec
ωp1 ωp2
What happens if wp1 << wz << wp2 ?
H(w) =Vout(w)
Vin(w)=
1 + jw/wz(1 + jw/wp1)(1 + jw/wp2)
M.H. Perrott
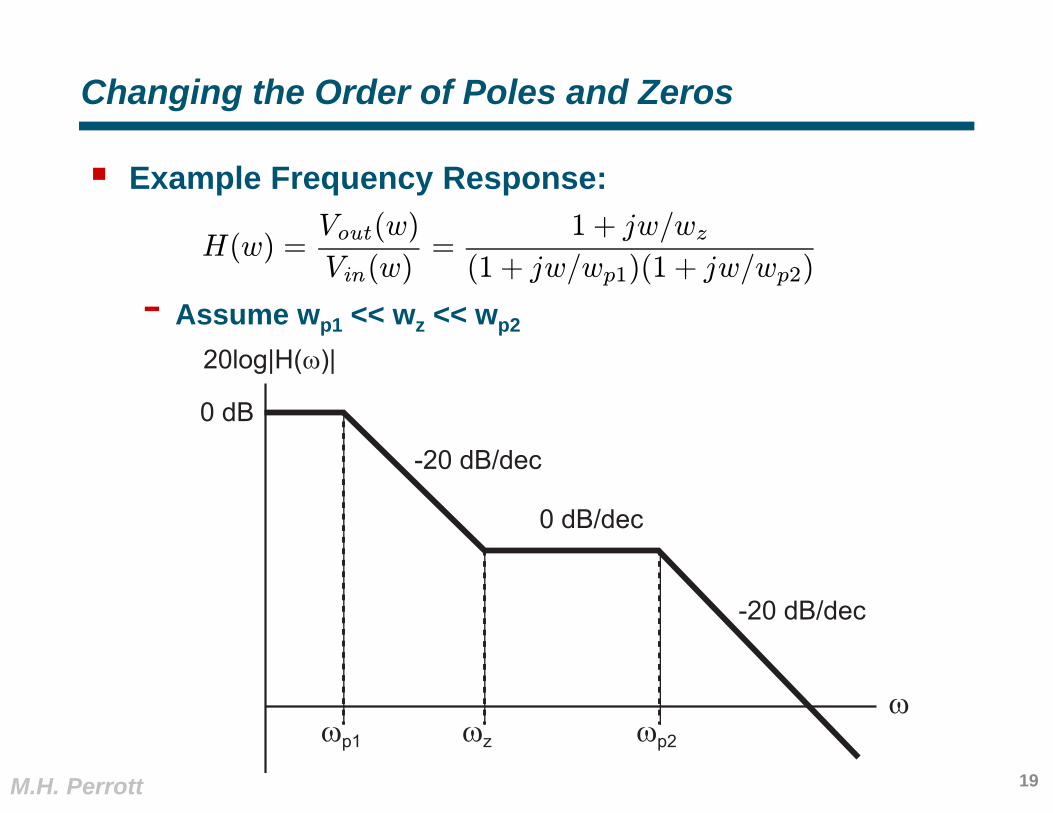
Changing the Order of Poles and Zeros
Example Frequency Response:
- Assume wp1 << wz << wp2
19
H(w) =Vout(w)
Vin(w)=
1 + jw/wz(1 + jw/wp1)(1 + jw/wp2)
ω
20log|H(ω)|
0 dB
-20 dB/dec
ωp1
0 dB/dec
-20 dB/dec
ωz ωp2

M.H. Perrott
Changing the DC Gain from 1 to K
Example Frequency Response:
- Assume wp1 << wz << wp2
20
H(w) =Vout (w)
Vin(w)= K
1 + jw/wz(1 + jw/wp1)(1 + jw/wp2)
ω
20log|H(ω)|
20log(K) dB
-20 dB/dec
ωp1
0 dB/dec
-20 dB/dec
ωz ωp2