Two Failures and a Success: Ireland 1970-2009 John Fitz Gerald The Economic and Social Research...
30
Two Failures and a Success: Two Failures and a Success: Ireland 1970-2009 Ireland 1970-2009 John Fitz Gerald John Fitz Gerald The Economic and Social Research Institute, Ireland The Economic and Social Research Institute, Ireland www.esri.ie www.esri.ie
-
Upload
eugene-mathews -
Category
Documents
-
view
217 -
download
2
Transcript of Two Failures and a Success: Ireland 1970-2009 John Fitz Gerald The Economic and Social Research...
Two Failures and a Success: Two Failures and a Success: Ireland 1970-2009Ireland 1970-2009
John Fitz GeraldJohn Fitz GeraldThe Economic and Social Research Institute, IrelandThe Economic and Social Research Institute, Ireland
www.esri.iewww.esri.ie

Format of PresentationFormat of Presentation
A Remarkable Transformation?A Remarkable Transformation? How Did it All Come About?How Did it All Come About?• Openness & EUOpenness & EU• Foreign Direct Investment (FDI)Foreign Direct Investment (FDI)• Human capitalHuman capital• Demography and the labour marketDemography and the labour market
How Did Things Go Wrong?How Did Things Go Wrong? Out of the Wilderness?Out of the Wilderness?

A Remarkable Transformation?A Remarkable Transformation?
Budgetary Crisis in the 1980sBudgetary Crisis in the 1980s Turnaround in the late 1980sTurnaround in the late 1980s Rapid expansion in the 1990sRapid expansion in the 1990s Overall:Overall:• A Story of Delayed ConvergenceA Story of Delayed Convergence
Icarus: 2001-7Icarus: 2001-7• Housing boom – and bustHousing boom – and bust• Delusions of grandeurDelusions of grandeur

Average Growth in GNPAverage Growth in GNP
Performance spectacular in terms of historical experience
-2
0
2
4
6
8
10
%

Employment GrowthEmployment Growth
-10
-8
-6
-4
-2
0
2
4
6
8
1980 1985 1990 1995 2000 2005
%

Recent performanceRecent performance - -EarningsEarnings
-4
-2
0
2
4
6
8
10
1990 1993 1996 1999 2002 2005 2008
%

Decomposition of GrowthDecomposition of Growth
(inverse) Ratio
Dependency
1564
RateionParticipat
1564
RateEmployment
tyProductivi
capitaper GDP
Pop
Pop
Pop
LForce
LForce
Emp
Emp
GDP
Pop
GDP

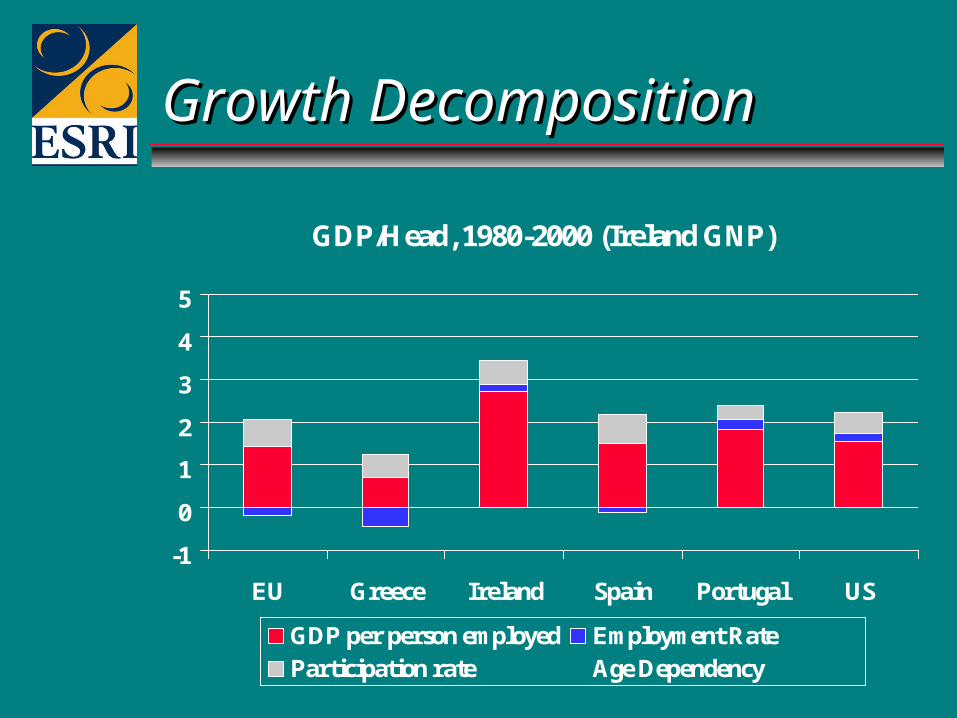
Growth DecompositionGrowth Decomposition
GDP/Head, 1980-2000 (Ireland GNP)
-1
0
1
2
3
4
5
EU Greece Ireland Spain Portugal US
GDP per person employed Employment RateParticipation rate Age Dependency

Growth DecompositionGrowth Decomposition
GDP/Head, 1980-2000 (Ireland GNP)
-1
0
1
2
3
4
5
EU Greece Ireland Spain Portugal US
GDP per person employed Employment RateParticipation rate Age Dependency
Growth DecompositionGrowth Decomposition
GDP/Head, 1980-2000 (Ireland GNP)
-1
0
1
2
3
4
5
EU Greece Ireland Spain Portugal US
GDP per person employed Employment RateParticipation rate Age Dependency

Growth DecompositionGrowth Decomposition
GDP/Head, 1980-2000 (Ireland GNP)
-1
0
1
2
3
4
5
EU Greece Ireland Spain Portugal US
GDP per person employed Employment RateParticipation rate Age Dependency

Driving ForcesDriving Forces
Primary Factors:Primary Factors:• Openness & EUOpenness & EU• Foreign Direct Investment (FDI)Foreign Direct Investment (FDI)• Human capitalHuman capital• Demography and the labour marketDemography and the labour market
Secondary Factors:Secondary Factors:• EU Structural Funds EU Structural Funds • Consensus economic strategyConsensus economic strategy

Industrial PolicyIndustrial Policy
Post 1960Post 1960• Low Corporation TaxLow Corporation Tax• Freeing of TradeFreeing of Trade
EU Membership in 1973EU Membership in 1973 Consistent Policy Consistent Policy • Low corporation taxLow corporation tax• TransparencyTransparency• Attract Foreign Direct Investment (FDI)Attract Foreign Direct Investment (FDI)• Move to High Tech.Move to High Tech.
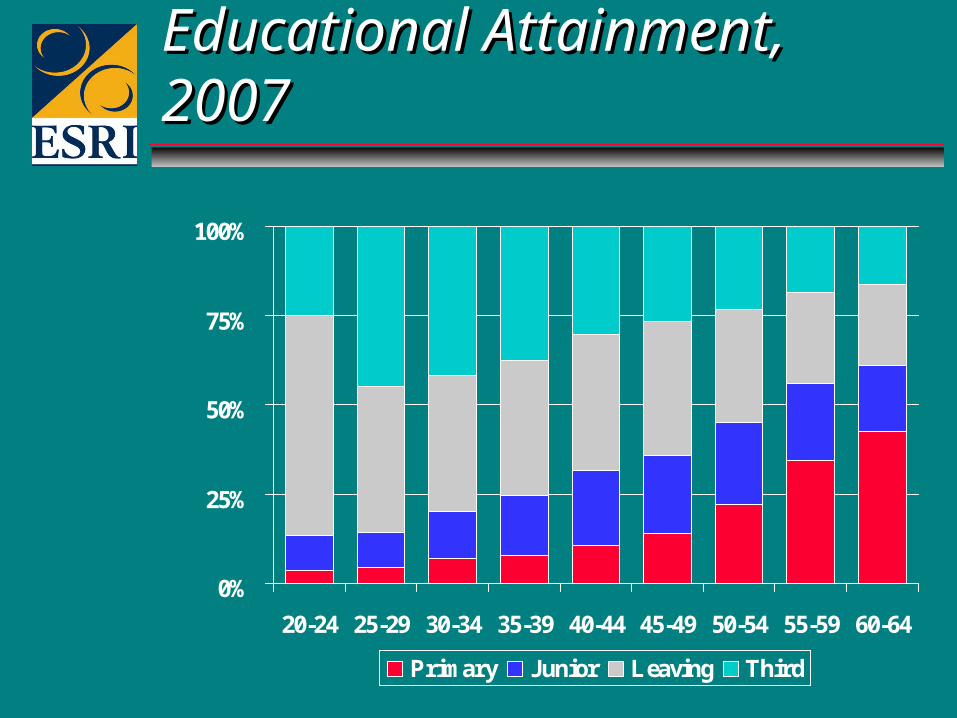
Educational Attainment, 2007Educational Attainment, 2007
0%
25%
50%
75%
100%
20-24 25-29 30-34 35-39 40-44 45-49 50-54 55-59 60-64
Primary Junior Leaving Third

Investment in Human CapitalInvestment in Human Capital
Ratio of Human Capital Index for 25-29s / 55-59s
0.9 1 1.1 1.2 1.3 1.4
GermanyDenmark
FinlandNetherlaHungaryBelgium
PolandGreece
UKIreland
ItalySpain
Portugal

Population, 2005Population, 2005
0 100000 200000 300000 400000
0-4
10-14
20-24
30-34
40-44
50-54
60-64
70-74
80-84
90-94
Age

Population, 2015Population, 2015
0 100000 200000 300000 400000
0-4
10-14
20-24
30-34
40-44
50-54
60-64
70-74
80-84
90-94
Age

DependencyDependency
1
1.2
1.4
1.6
1.8
2
2.2
2.4
Ireland EU
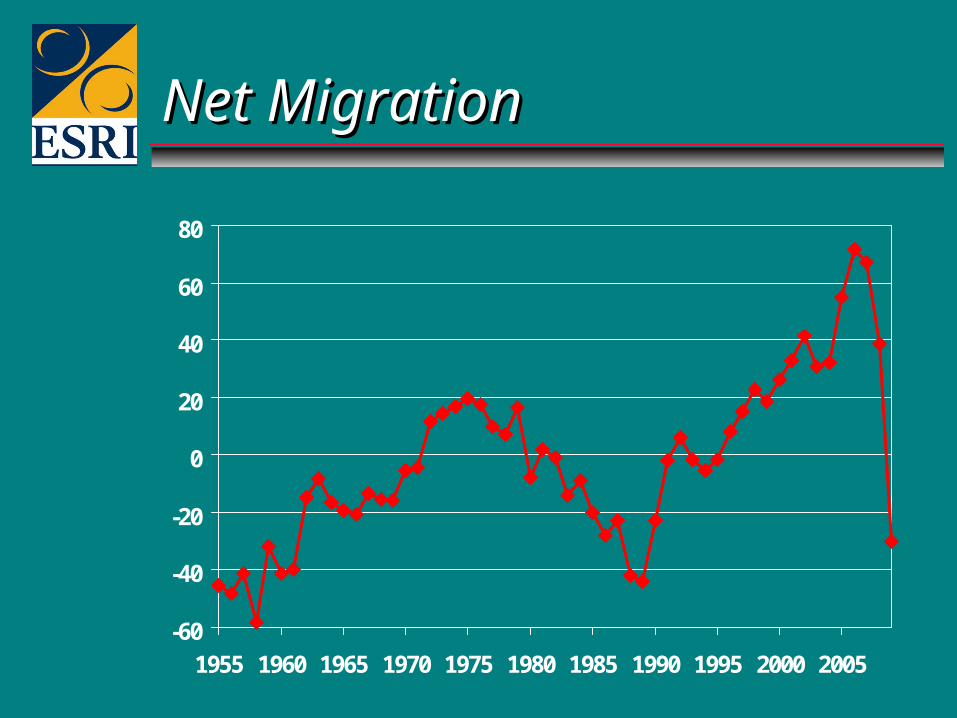
Net MigrationNet Migration
-60
-40
-20
0
20
40
60
80
1955 1960 1965 1970 1975 1980 1985 1990 1995 2000 2005
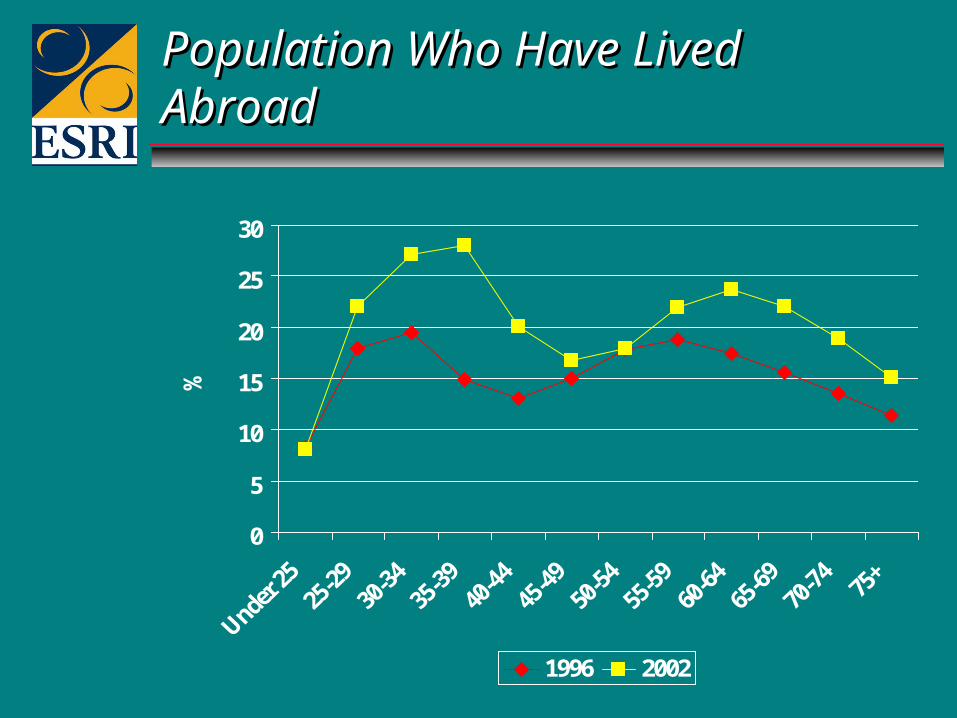
Population Who Have Lived AbroadPopulation Who Have Lived Abroad
0
5
10
15
20
25
30
%
1996 2002


Housing Investment, % of GNPHousing Investment, % of GNP
02468
1012141618
1980 1985 1990 1995 2000 2005 2010
%
Ireland Spain EU 15

Government SurplusGovernment Surplus
-8
-6
-4
-2
0
2
4
6
8
2000 2001 2002 2003 2004 2005 2006 2007 2008
% o
f G
DP
Finland Sweden Ireland

Labour Force SharesLabour Force Shares
0%
10%
20%
30%
40%
50%
60%
70%
80%
90%
100%
2000 2007 2010
UnemployedBuildingPublic SectorOtherMarket ServicesManufacturing

Trend GDP per capita: FinlandTrend GDP per capita: Finland
Source: Wim Suyker, Netherlands Central Planning BureauSource: Wim Suyker, Netherlands Central Planning Bureau

Trend GDP per capita: SwedenTrend GDP per capita: Sweden
Source: Wim Suyker, Netherlands Central Planning BureauSource: Wim Suyker, Netherlands Central Planning Bureau

GNP per Head, 2004 pricesGNP per Head, 2004 prices
0
5
10
15
20
25
30
35
40
1970 1975 1980 1985 1990 1995 2000 2005 2010 2015
€ th
ousa
nd
20002000
20142014

Output Gap, IrelandOutput Gap, Ireland

Correcting the ImbalancesCorrecting the Imbalances
Lasting damageLasting damage• 10% loss of output?10% loss of output?
Improve competitivenessImprove competitiveness• No devaluation, falling wage ratesNo devaluation, falling wage rates
Correct structural deficitCorrect structural deficit• Was 6-8% of GDP – 2010 3% of GDPWas 6-8% of GDP – 2010 3% of GDP• Must implement 2010 budgetMust implement 2010 budget
RecoveryRecovery• Faster growth temporarilyFaster growth temporarily• Returning to full employment?Returning to full employment?

Ireland’s Roller Coaster: LessonsIreland’s Roller Coaster: Lessons
Globalisation is good for you!Globalisation is good for you! Reinventing the Irish economy?Reinventing the Irish economy?• Invest in Education and R&DInvest in Education and R&D
Fiscal Policy MattersFiscal Policy Matters• Should have run surplusShould have run surplus• Use Fiscal policy to manage housingUse Fiscal policy to manage housing
Develop Economic ConsensusDevelop Economic Consensus Be Lucky!Be Lucky!