Introducing Java Stuart Fitz-Gerald (with thanks to Chris Reade) ku00699.
Upload
alexina-taylorCategory
view
216download
2
The Labour Market to 2010:The Labour Market to 2010:New Issues?New Issues?
John Fitz GeraldJohn Fitz GeraldThe Economic and Social Research Institute, The Economic and Social Research Institute,
www.www.esri.ieesri.ie

IntroductionIntroduction
The Driving ForcesThe Driving Forces Economic BackgroundEconomic Background• The clockwork mouse runs downThe clockwork mouse runs down
External environmentExternal environment• US economic imbalancesUS economic imbalances• Globalisation is good for youGlobalisation is good for you• EnlargementEnlargement
Domestic forces for changeDomestic forces for change• Demographic ChangeDemographic Change
The Labour Force of the FutureThe Labour Force of the Future
Average Growth in GNPAverage Growth in GNP
0
1
2
3
4
5
6
7
8
9
%

Relative GNPRelative GNP
Ireland as a % of EU average in PPS
50
60
70
80
90
100
110
1960
1965
1970
1975
1980
1985
1990
1995
2000
2005
2010
per head per person employed
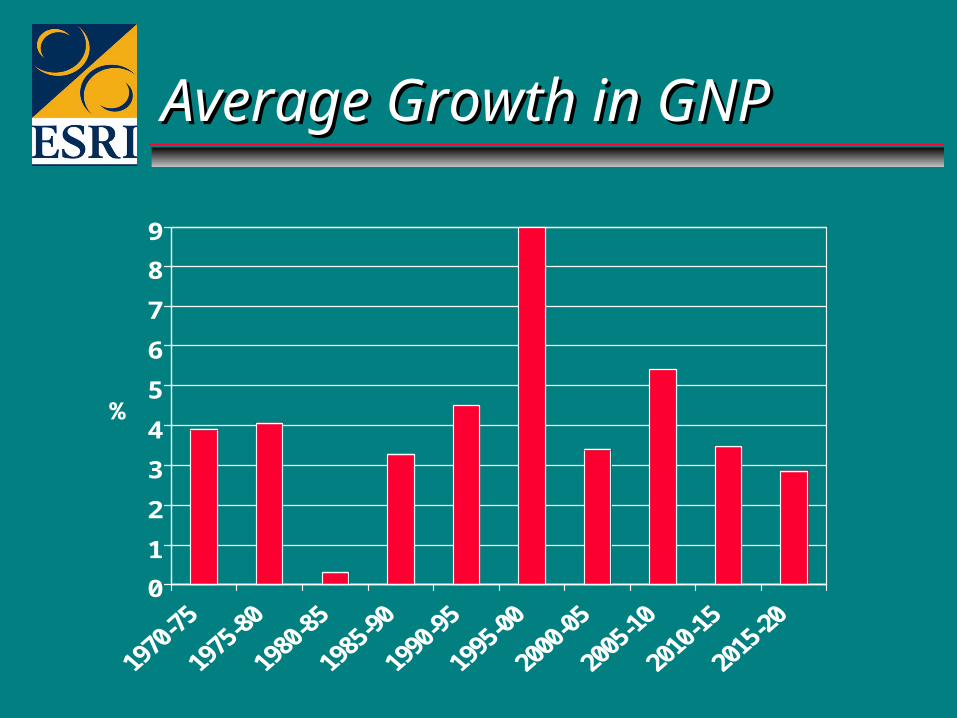
Economic DependencyEconomic Dependency
Numbers not working / Numbers working
1
1.2
1.4
1.6
1.8
2
2.2
2.4
1960
1964
1968
1972
1976
1980
1984
1988
1992
1996
2000
2004
2008
Ireland EU

External EnvironmentExternal Environment
US economic imbalancesUS economic imbalances• Budget and balance of paymentsBudget and balance of payments• How can they be “cured”?How can they be “cured”?• Implications for the dollarImplications for the dollar• Implications for FDIImplications for FDI
If dollar falls – implications for EUIf dollar falls – implications for EU

GlobalisationGlobalisation
EU integration key to successEU integration key to success• Access to marketsAccess to markets• Single MarketSingle Market
Future – Enlargement and world tradeFuture – Enlargement and world trade• Enlargement an opportunityEnlargement an opportunity
Exploiting the global opportunitiesExploiting the global opportunities• Demand for skilled labourDemand for skilled labour• Services sector – key to growthServices sector – key to growth• Shifting supply – flexibility the keyShifting supply – flexibility the key

Domestic FactorsDomestic Factors
Factors affecting labour supplyFactors affecting labour supply• FertilityFertility• ParticipationParticipation• MigrationMigration• EducationEducation

Labour Supply GrowthLabour Supply Growth
Contribution to Growth
-1-0.5
00.5
11.5
22.5
33.5
4
1990-95 1995-00 2000-05 2005-10 2010-15 2015-20
perc
enta
ge p
oint
s
Natural Increase Female Participation
Male Participation Migration

Birth RateBirth Rate
10
12
14
16
18
20
22
24
1960 1970 1980 1990 2000 2010
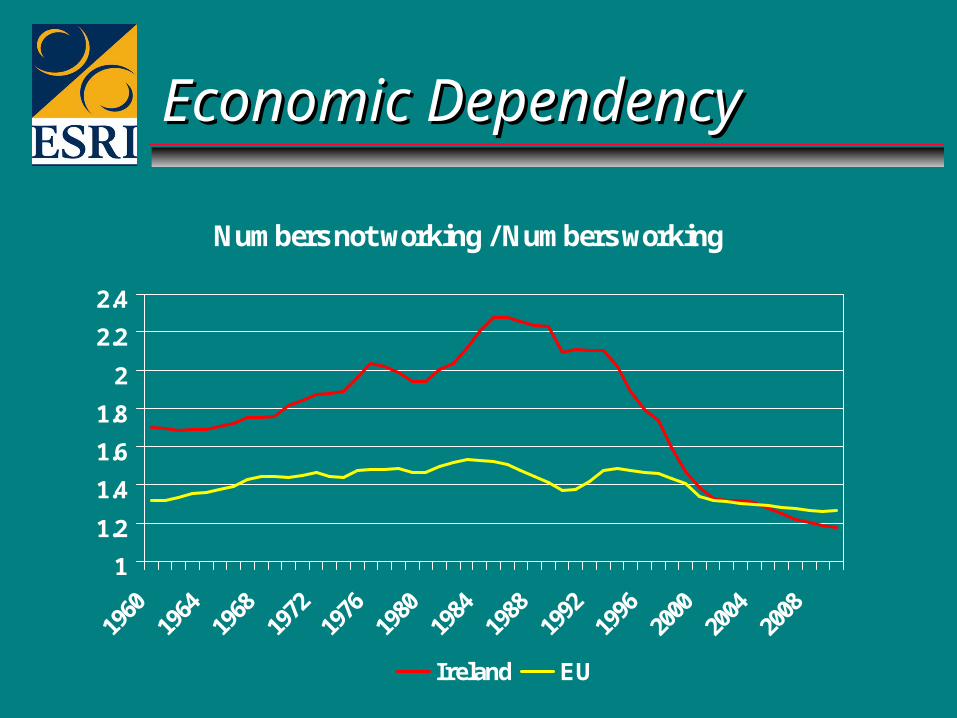
Population Structure, 2003Population Structure, 2003
0 100000 200000 300000 400000
0-4
10-14
20-24
30-34
40-44
50-54
60-64
70-74
80-84
90-94
Age

Population Structure, 2013Population Structure, 2013
0 100000 200000 300000 400000
0-4
10-14
20-24
30-34
40-44
50-54
60-64
70-74
80-84
90-94
Age

Female Labour Force ParticipationFemale Labour Force Participation
0
10
20
30
40
50
60
70
80
90
20-24 25-29 30-34 35-39 40-44 45-49 50-54 55-59 60-64
%
1988 2002

Female Labour Force ParticipationFemale Labour Force Participation
0
10
20
30
40
50
60
70
80
90
15-19 20-24 25-29 30-34 35-39 40-44 45-49 50-54 55-59 60-64
%
Ireland, 2001 EU, 2000

The “Homing Pigeons”The “Homing Pigeons”
Huge Emigration in 1950sHuge Emigration in 1950s• Perception of a failed economyPerception of a failed economy• Leave, Never to ReturnLeave, Never to Return• Brain Drain in 1980sBrain Drain in 1980s
Today: “Homing Pigeons”Today: “Homing Pigeons”• Enhances productivityEnhances productivity• Increase productive potential of economyIncrease productive potential of economy• Good for Foreign Direct InvestmentGood for Foreign Direct Investment

Educational Attainment, 2002Educational Attainment, 2002
0%
25%
50%
75%
100%
20-24 25-29 30-34 35-39 40-44 45-49 50-54 55-59 60-64
Primary Junior Leaving Third

Participation in Education, 15-19Participation in Education, 15-19
60
65
70
75
80
85
90
1988
1989
1990
1991
1992
1993
1994
1995
1996
1997
1998
1999
2000
2001
2002
% o
f P
opul
atio
n
Males Females

Supply of LabourSupply of Labour
400
600
800
1000
1200
1400
1600
1991
1993
1995
1997
1999
2001
2003
2005
2007
2009
Tho
usan
ds
Unskilled Skilled
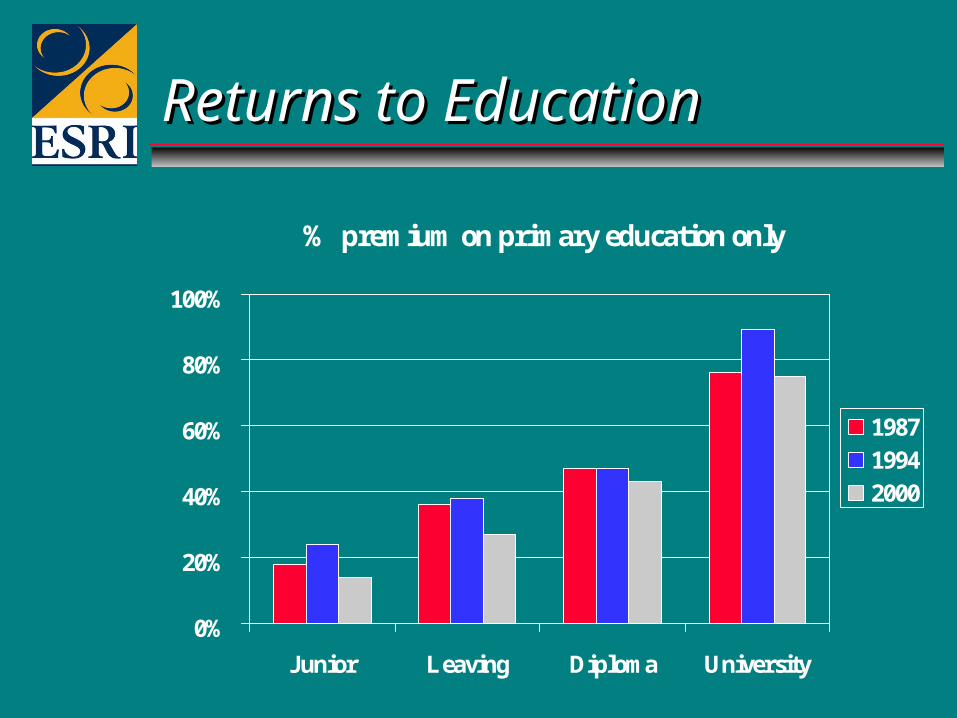
Returns to EducationReturns to Education
% premium on primary education only
0%
20%
40%
60%
80%
100%
Junior Leaving Diploma University
198719942000

Labour DemandLabour Demand
Foreign Direct InvestmentForeign Direct Investment CompetitivenessCompetitiveness

Skilled Labour SupplySkilled Labour Supply
WW
LL
WW11
DD11LL
SS11LL
LL11
SS22LL
LL22
DD22LL

Unskilled LabourUnskilled Labour
SS11LL
SS22LL
UU
LL22
DDLL
LL11
S=WS=W
LL
WW
DD22LL
WW22

Competitive Markets MatterCompetitive Markets Matter
Costs to consumersCosts to consumers Costs to businessCosts to business Competitiveness councilCompetitiveness council• Business as consumersBusiness as consumers
Labour market pass through of costsLabour market pass through of costs• Taxes – well knownTaxes – well known• Consumer prices also pass throughConsumer prices also pass through• Domestic services prices matterDomestic services prices matter

Labour Force 2014Labour Force 2014
A world where couples both workA world where couples both work OlderOlder• 30-34 age group dominates30-34 age group dominates• Affects work patternsAffects work patterns• Affects consumptionAffects consumption
Female labour force participationFemale labour force participation• High - related to educationHigh - related to education
ImmigrationImmigration• Brings skillsBrings skills

Skilled and Unskilled LabourSkilled and Unskilled Labour
Supply increasing rapidlySupply increasing rapidly Unskilled supply falling but demand?Unskilled supply falling but demand? Skilled labour: female proportion risingSkilled labour: female proportion rising Implications for employersImplications for employers• Need to attract and hold female labourNeed to attract and hold female labour• Needs of work force in their 30sNeeds of work force in their 30s
Proportion of skilled labour force who Proportion of skilled labour force who are parents of young children risingare parents of young children rising

Working PatternsWorking Patterns
Accommodating working couplesAccommodating working couples 30-34 Cohort the largest30-34 Cohort the largest• Age at first birth?Age at first birth?
Children bring change in lifestyleChildren bring change in lifestyle• Working pattern, pattern of consumptionWorking pattern, pattern of consumption
Cost of children?Cost of children?• Time out of workforce penalisedTime out of workforce penalised• Delay children?Delay children?
Reaching a modus vivendiReaching a modus vivendi

ImplicationsImplications
Flexible workingFlexible working• May enhance skilled labour supplyMay enhance skilled labour supply• ““Cost-effective” for parents?Cost-effective” for parents?
Potential problemsPotential problems• Penalty for time out of labour forcePenalty for time out of labour force• Does this reflect lower productivity or Does this reflect lower productivity or
prejudice?prejudice? Compulsory paternity leave?Compulsory paternity leave?