Turn in notebook and course expectation signature pages! Set up notebook.
59
• Turn in notebook and course expectation signature pages! • Set up notebook.
Transcript of Turn in notebook and course expectation signature pages! Set up notebook.

• Turn in notebook and course expectation signature pages!
• Set up notebook.

Add To Table of Contents:
• Left side Pg. 2• Right side Pg. 3• Observe Activity Pg. 4• Data gathering Pg. 5• In/Out Pg. 6• Branches of Geo. Pg. 7

Confidence Log: How Organized are You?
In:
0 1 2 3
Not SuperOrganized Organized at all
•Do you think that the INB will help you to be more organized in science class? •Why do you think this?
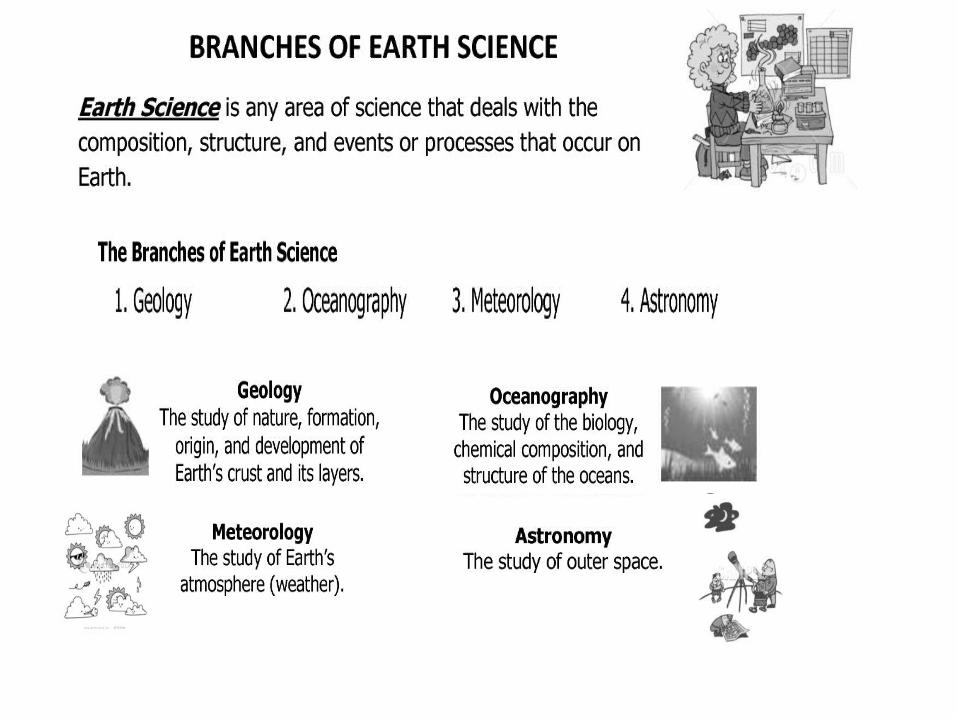
What is Geoscience?

Branches of Earth Science Branches of Earth Science Tree MapCut out the words and pictures on the Cutout sheet.Arrange them into a tree map that shows all 4 branches of earth science. Turn your notebook paper sideways.Don’t forget the pictures and examples.
Main Idea
Branch Branch Branch Branch
Definition
Picture3 Examples

World Map• On your large map, label each item listed on
the following slides.

Label all continents and oceans on your mapColor each continent a different color.
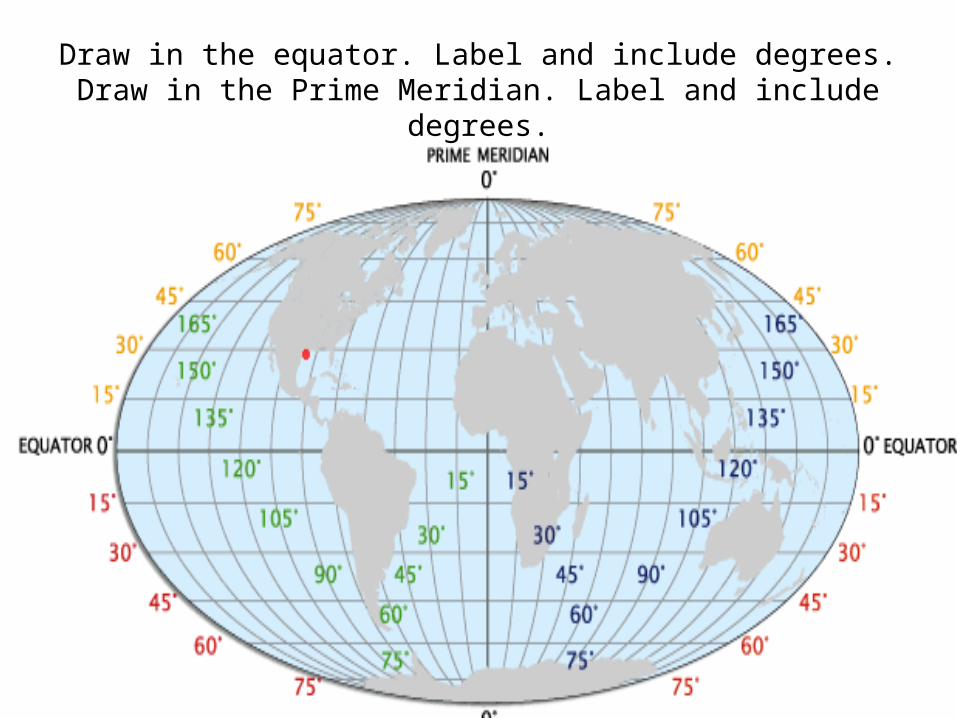
Draw in the equator. Label and include degrees.Draw in the Prime Meridian. Label and include degrees.


Draw in the Tropic of Cancer and the Tropic of Capricorn. Label and include degrees.
Draw in the Arctic Circle and the Antarctic Circle. Label and include degrees.

Out: pg 6
• Have you ever been to any other continent other than North America?
If yes…• What continent was it and how did you like it?If no…• What other continent would you like to visit
and why?

Add to Table of Contents
• Latitude/Longitude Pg. 8• Mapping Pg. 9• World Map Pg. 10

Latitude/Longitude Pg. 8
One of the Greeks’ primary contributions to oceanography and seafaring is the latitude/longitude system.
Latitude lines run east-west and Longitude lines run north-south.
They are numbered in degrees, then minutes and seconds like time. (1degree=1/360 of earth)

Latitude Lines

Longitude Lines


Pg 8 Latitude/Longitude Map• Attach the Latitude/longitude map and use it to
answer these analysis questions.Analysis Questions:1. What is the latitude and longitude of these
points?A EB FC GD H
2. Explain the steps you took to find the answers to question #1.
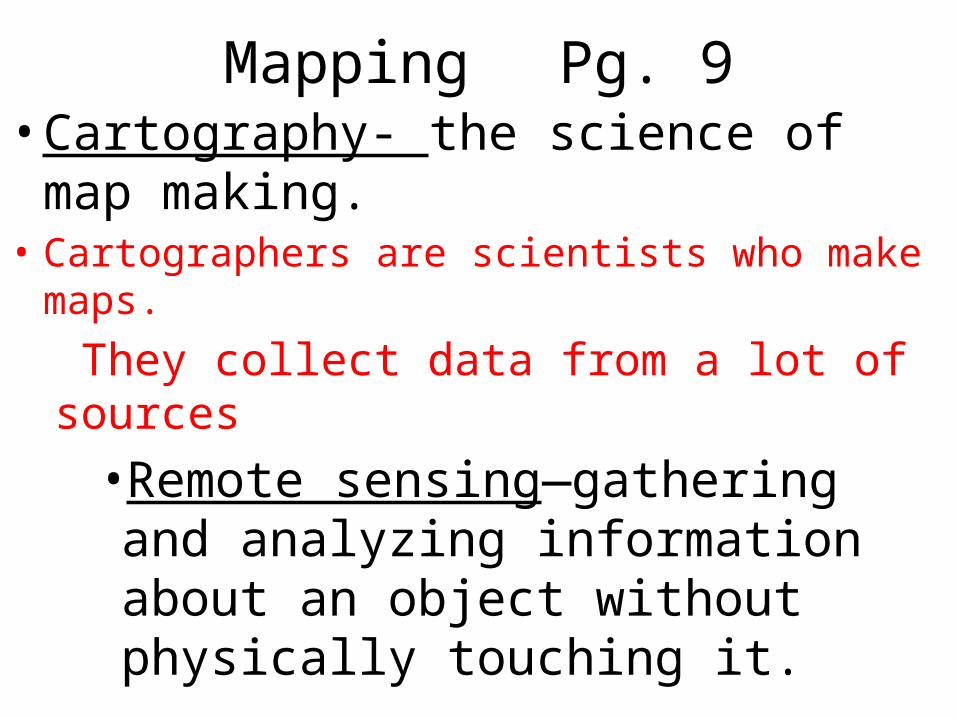
Mapping Pg. 9• Cartography- the science of map making.• Cartographers are scientists who make maps.
They collect data from a lot of sources•Remote sensing—gathering and analyzing information about an object without physically touching it.

Satellite Image of Las Vegas

How do we make maps?
• Map projections –a flat map that represents the curved surface of the earth.
• The problem is that it is hard to transfer a curved surface to a flat format.
• Distortions always happen in map projections.

Map Projections
1. Cylindrical• A cylindrical projection is
the most common type of map. Imagine placing a movie screen around a globe in a cylinder shape. The projection that results is shown in this image. Near the equator there is very little distortion. But, the closer you get to the poles, the more distorted the map is. In this ex. Greenland appears to be many times larger than it really is.


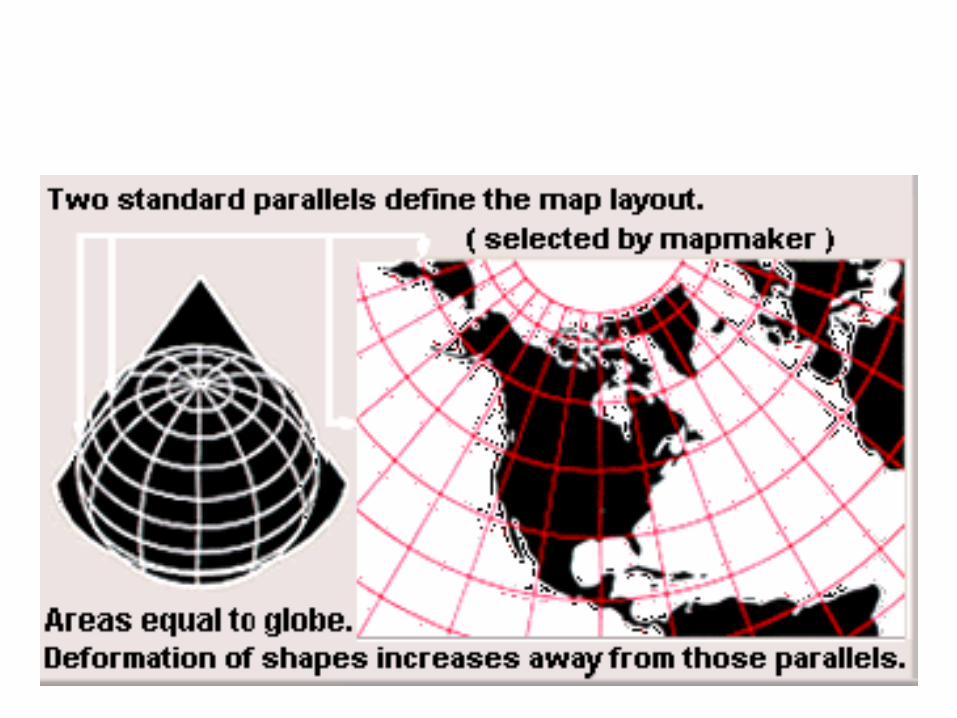
2. Conic• A conic projection map
is created by placing a cone shaped screen on a globe. The resulting projection is more accurate than the cylindrical projection map discussed above. However, the further we travel down the map, the more distorted and less accurate the map becomes.

3. Planar/Azimuthal• A plane projection
is created by placing an imaginary screen directly above or below a globe. The image that would result is called a plane projection. This type of map projection is not commonly used.


Attach map projections in notebook
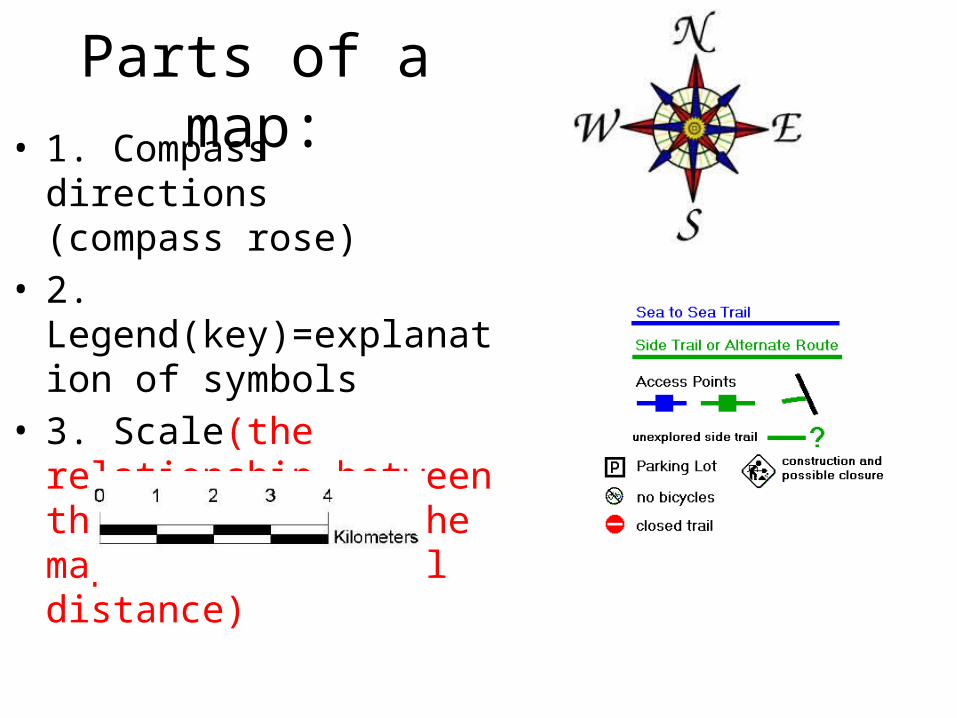
Parts of a map:• 1. Compass directions
(compass rose)• 2. Legend(key)=explanation of
symbols • 3. Scale(the relationship
between the distance on the map and the actual distance)

Types of maps: 1. Road maps

2. Weather maps

3. Satellite maps

4. Geologic maps- rocks, faults and folds

5. Topographic Maps

Assignment
• Worksheet: What is Latitude? What is Longitude?

Out
Tent Paragraph—use the following terms correctly in a short paragraph. Each term must be highlighted!!!• Map• Earth• Cartography• Model• Remote sensing

Add to Table of Contents:
• Map projections Pg. 10• Topography Pg. 11
Then attach map projections to page 10

In:
Look at the topographic map to the right.• What is this map
showing?• What kind of
model is a topographic map? Explain.

Topography Pg. 11Topographic Maps-show the surface shape(topography) of the land.–Uses lines called contour lines to connect
areas of equal elevation(height above sea level).• Isogram-line on a map that represents
constant or equal values.

– Contour interval-the difference in elevation between contour lines.
– Relief-the difference in elevation between the highest and lowest point on the map.
•
• lines pointing inward indicate a depression = decrease in elevation= like a pit or crater!

• What is the contour interval?• What is the relief?

River or Stream bed
Hill

Topographic Model Lab
• Need:– Model box– Washable marker– Piece of paper– Ruler– Water
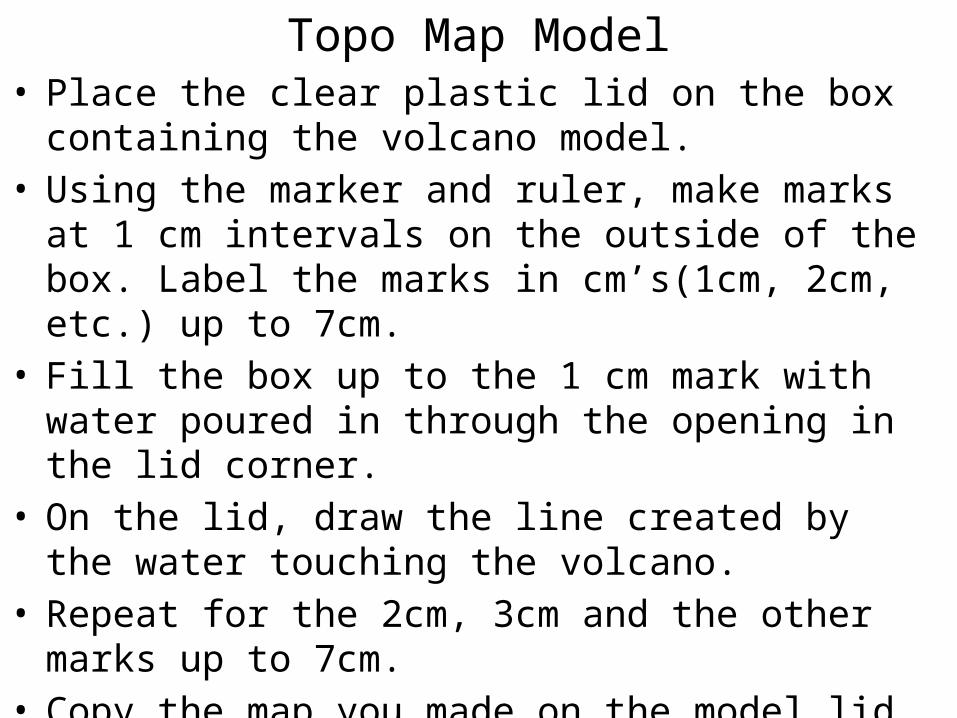
Topo Map Model• Place the clear plastic lid on the box containing the
volcano model.• Using the marker and ruler, make marks at 1 cm intervals
on the outside of the box. Label the marks in cm’s(1cm, 2cm, etc.) up to 7cm.
• Fill the box up to the 1 cm mark with water poured in through the opening in the lid corner.
• On the lid, draw the line created by the water touching the volcano.
• Repeat for the 2cm, 3cm and the other marks up to 7cm.• Copy the map you made on the model lid on your
notebook page. Make sure you add elevation labels on each line and show depressions where appropriate.

Analysis Questions
1. What are the lines you just drew called?2. What is the contour interval of this map?3. What is the relief of this map?4. How did you represent the crater of the
volcano on your map?5. As the slope on the volcano gets steeper,
what happens to the distance between the contour lines?

Assignment:
Topographic Maps Worksheet.

Out
A topo. map shows the shape and elevation of the surface of the Earth.Who do you think uses topo. maps.?What do you think they use them for?

In: pg 24
• Create 2 circle maps—1 for the Prime Meridian and one for the International Date Line. As you read the following slides, fill in 5 facts for each topic.
Prime Meridian
Interna-tional
Date Line

The Prime Meridian is the meridian with a longitude of 0°. It was adopted officially in 1884 as a line from which longitude east and west are measured and as a basis forstandardized time zones. It passes through Greenwich, England, home of the Royal Greenwich Observatory. The Observatory was founded in 1675 and closed except as a museum in 1998. The prime meridian, together with its opposite meridian(the International Date Line at 180°) divide the Earth into the Eastern and Western Hemispheres.

The International Date Line is the imaginary line on the Earth that separates two consecutive calendar days. That is the date in the Eastern hemisphere, to the left of the line, is always one day ahead of the date in the Western hemisphere. Without the International Date Line travelers going westward would discover that when they returned home, one day more than they thought had passed, even though they had kept careful tally of the days. Likewise, a person traveling eastward would find that one fewer days had elapsed than he had recorded.

The International Date Line can be anywhere on the globe. But it is most convenient to be 180° away from the Prime Meridian that goes through Greenwich, England. It also is fortunate that this area is covered, mainly, by empty ocean. However, there have always been zigs and zags in it to allow for local circumstances.

?? How many time zones to go around the globe?• There are 24 time zones – 1 for each hour of
the day
A
B


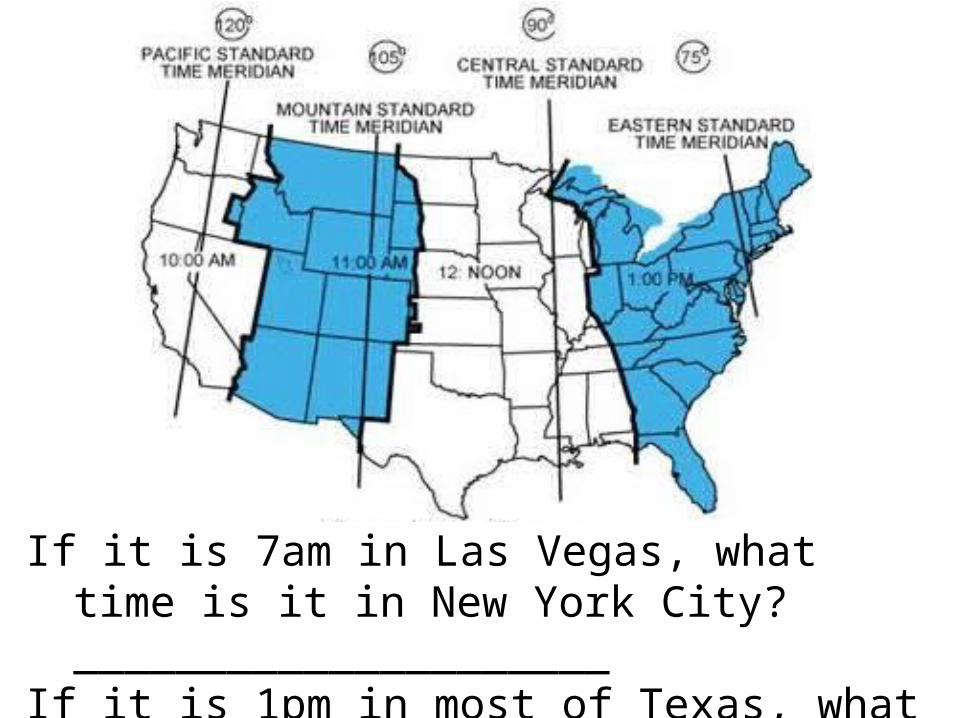
If it is 7am in Las Vegas, what time is it in New York City? _____________________
If it is 1pm in most of Texas, what time is it in Calif?_

1. Complete the Time zone worksheet page and turn in. 2. Work on the review sheet over our first unit-safety/observations/mapping.3. Test next class. Notebook is due! Don’t “forget” it!

The following are the maps for the worksheet
• It is hard to see them on the worksheet.

Line A
Line B
Line C
A
B

Quebec
New York City
Mexico City
Las Vegas

Notebook Check• Left side Pg. 2• Right side Pg. 3• Observe activity Pg. 4• Data gathering Pg. 5• In/Out Pg. 6• Branches of Geo. Pg. 7• Latitude/Longitude Pg. 8• Mapping Pg. 9• Map projections Pg. 10• Topography Pg. 11