Turkish Power Market Monthly Report (July 2012)€¦ · Turkish Power Market Monthly Report (July...
24
Hydropower Investment Promotion Project (HIPP) Turkish Power Market Monthly Report (July 2012) Monday, February 11, 2013 This publication was produced for review by the United States Agency for International Development. It was prepared by Deloitte Consulting.
Transcript of Turkish Power Market Monthly Report (July 2012)€¦ · Turkish Power Market Monthly Report (July...
Hydropower Investment
Promotion Project (HIPP)
Turkish Power Market Monthly
Report (July 2012)
Monday, February 11, 2013
This publication was produced for review by the United States Agency for International Development. It was prepared by Deloitte Consulting.

Turkish Power Market Monthly
Report (July 2012)
USAID HYDROPOWER INVESTMENT PROMOTION PROJECT (HIPP)
CONTRACT NUMBER: EEM-I-00-07-00005-0
DELOITTE CONSULTING LLP
USAID/CAUCASUS OFFICE OF ENERGY AND ENVIRONMENT
MONDAY, FEBRUARY 11, 2013
DISCLAIMER:
The author’s views expressed in this publication do not necessarily reflect the views of the United States Agency for International Development or the United States Government.

This document was prepared by:
Author Organization Contact Details
Nikoloz Sumbadze Deloitte Consulting [email protected]
+995-593-33-42-25
George Bochorishvili Deloitte Consulting [email protected]
+995-32-24-45-70/71
Reviewer Organization Contact Details
Adrian Rouse Deloitte Consulting [email protected]

TABLE OF CONTENTS
EXECUTIVE SUMMARY ...................................................................................... 1
1. INTRODUCTION .......................................................................................... 2
2. SYNOPSIS OF TURKISH ENERGY ECONOMY ......................................... 3
3. SYNOPSIS OF TURKISH DAM ................................................................... 8
4. ANALYSIS OF TURKISH DAM ACTIVITIES IN JULY 2012 ....................... 9 4.1. Price Sub Groups on the Turkish DAM ......................................................... 11 4.2. Price Curve Dynamics by Week-Days .......................................................... 13 4.3. DAM Volume Data Analysis .......................................................................... 14
APPENDIX ......................................................................................................... 17

Acronyms Used in this Report
CPI Consumer Price Index
DAM Day-Ahead Market
EBRD European Bank for Reconstruction and Development
EMRA Energy Market Regulatory Authority
EUAS Turkish Electricity Generation Company
GW Gigawatt
GWh Gigawatt Hours
HIPP Hydropower Investment Promotion Project
HPP Hydro Power Plant
IFI International Financial Institutions
KGÜP Final Day Ahead Production / Consumption Program (Kesinleşmiş Gün Öncesi
Üretim/Tüketim Programı)
kWh Kilowatt Hours
MW Megawatt
MWh Megawatt Hours
PMUM Market Financial Reconciliation Center (Piyasa Mali Uzlastirma Merkezi)
SDV System Demand Volume
TEIAS Turkish Electricity Transmission Company
TL Turkish Lira
TOOR Transfer of Operating Rights
TPP Thermal Power Plant
USD United States Dollar
US c US Dollar Cents
y-o-y Year Over Year
1 | P a g e
Executive Summary
USAID’s Hydropower Investment Promotion Project (HIPP) intends to help facilitate
private sector development of at least 400 MW of new, climate friendly hydropower
in Georgia. This report has been published in support of this goal.
Turkey has been identified as a potential export market for Georgian electricity. This
report provides an analysis of power market prices and developments in Turkey,
thereby enabling potential developers, governments, IFIs and other stakeholders to
better understand the economics of investment into the Georgian hydropower
market.
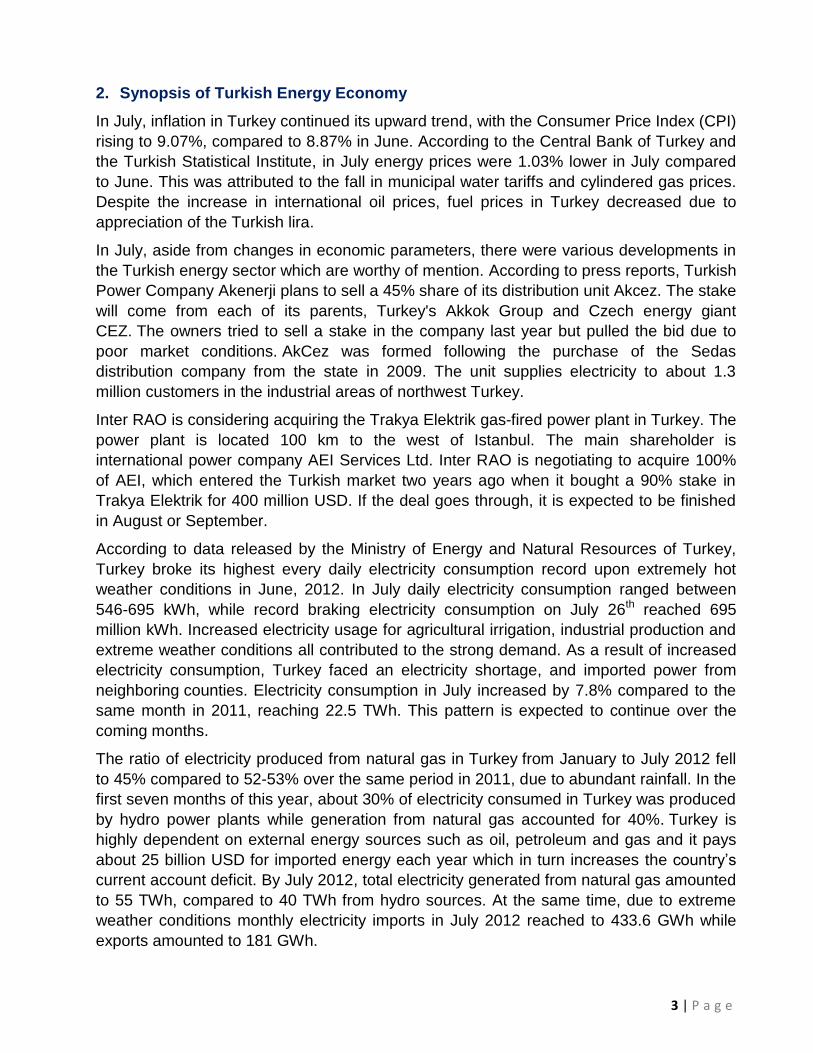
The number of members registered on the DAM in July increased by 5.1% to 556
compared to 545 in June 2012.
Total trading volume in July was recorded at 4,602 GWh, a 25.76% increase on
June, 2012.
At 444.2 million USD, total turnover in the DAM for July was 43.44% higher than
June.
In July, trading volume in the DAM accounted for 22.78% of realized physical
system demand compared to 20.52% in June.
DAM prices in July peaked at 12.17 US c/kWh. The average price during the month
was 9.33 US c/kWh and the minimum price was 0.00 US c/kWh.
July’s peak hours were recorded during 11:00-16:00 when electricity demand in
Turkey reached 33,004 MWh on average and prices ranged between 11.33 - 12.17
US c/kWh for these days in these hours. Off-peak hours were recorded during
04:00-08:00 when electricity demand was 19,711 MWh on average and prices
ranged between 0.00 - 1.94 US c/kWh within these days and in these hours.
During July, maximum SDV was 33,481 MWh, whereas minimum and average SDV
were 19,376 MWh and 27,169 MWh, respectively.
Daily trading volumes on the DAM ranged from a low of 2,603 MWh to a high of
9,043 MWh; the average daily trading volume was 6,185 MWh.
July was the eighth full month of activity on the DAM.

2 | P a g e
1. Introduction
In early 2011, the USAID-funded Hydropower Investment Promotion Project (HIPP)
created the Special Studies Group to provide analysis of the Georgian and regional
electricity markets as well as to support the electricity market research needed for the
Investment Promotion Group within HIPP. The Turkish electricity market is the focal point
of energy sales from new Georgian HPPs and there appears to be strong interest in power
market developments in Turkey from many potential HPP developers, governments, IFIs
and others. By examining the hourly prices and volumes of the Turkish DAM, this report
intends to provide stakeholders such as these with a better understanding of the
economics of investment into the Georgian hydropower market.
The report analyzes the hourly prices and volumes of the Turkish DAM for the examined
month. Historical data on final day-ahead production volume, peak, off-peak and shoulder-
peak prices used in this report are based on data available from the TEIAS/PMUM
website1. TL/USD exchange rates have been calculated using data from the Central Bank
of Turkey’s website, including weekend exchange rates that are calculated using the last
preceding working days’ exchange rate. In addition, The Turkish Power Market Monthly
Report examines total turnover changes together with DAM’s share in total forecasted
demand. The figures on economic parameters are based on Central Bank of Turkey’s
Monthly Price Development Report for July 2012 and its Inflation Report for Quarter III.
The remainder of this report is structured as follows. Section 2 provides a brief overview of
the Turkish energy economy and its main parameters. Section 3 provides an overview of
the Turkish DAM and basic statistical information for July 2012. In addition, a comparison
with June 2012 is conducted. Section 4 provides analysis of the Turkish DAM prices and
volumes within monthly, weekly and hourly intervals, together with DAM volume data
analysis. Finally, data sources and other relevant material are provided in the appendix.
1 Market Financial Reconciliation Center, http://dgpys.teias.gov.tr/dgpys/
3 | P a g e
2. Synopsis of Turkish Energy Economy
In July, inflation in Turkey continued its upward trend, with the Consumer Price Index (CPI)
rising to 9.07%, compared to 8.87% in June. According to the Central Bank of Turkey and
the Turkish Statistical Institute, in July energy prices were 1.03% lower in July compared
to June. This was attributed to the fall in municipal water tariffs and cylindered gas prices.
Despite the increase in international oil prices, fuel prices in Turkey decreased due to
appreciation of the Turkish lira.
In July, aside from changes in economic parameters, there were various developments in
the Turkish energy sector which are worthy of mention. According to press reports, Turkish
Power Company Akenerji plans to sell a 45% share of its distribution unit Akcez. The stake
will come from each of its parents, Turkey's Akkok Group and Czech energy giant
CEZ. The owners tried to sell a stake in the company last year but pulled the bid due to
poor market conditions. AkCez was formed following the purchase of the Sedas
distribution company from the state in 2009. The unit supplies electricity to about 1.3
million customers in the industrial areas of northwest Turkey.
Inter RAO is considering acquiring the Trakya Elektrik gas-fired power plant in Turkey. The
power plant is located 100 km to the west of Istanbul. The main shareholder is
international power company AEI Services Ltd. Inter RAO is negotiating to acquire 100%
of AEI, which entered the Turkish market two years ago when it bought a 90% stake in
Trakya Elektrik for 400 million USD. If the deal goes through, it is expected to be finished
in August or September.
According to data released by the Ministry of Energy and Natural Resources of Turkey,
Turkey broke its highest every daily electricity consumption record upon extremely hot
weather conditions in June, 2012. In July daily electricity consumption ranged between
546-695 kWh, while record braking electricity consumption on July 26th reached 695
million kWh. Increased electricity usage for agricultural irrigation, industrial production and
extreme weather conditions all contributed to the strong demand. As a result of increased
electricity consumption, Turkey faced an electricity shortage, and imported power from
neighboring counties. Electricity consumption in July increased by 7.8% compared to the
same month in 2011, reaching 22.5 TWh. This pattern is expected to continue over the
coming months.
The ratio of electricity produced from natural gas in Turkey from January to July 2012 fell
to 45% compared to 52-53% over the same period in 2011, due to abundant rainfall. In the
first seven months of this year, about 30% of electricity consumed in Turkey was produced
by hydro power plants while generation from natural gas accounted for 40%. Turkey is
highly dependent on external energy sources such as oil, petroleum and gas and it pays
about 25 billion USD for imported energy each year which in turn increases the country’s
current account deficit. By July 2012, total electricity generated from natural gas amounted
to 55 TWh, compared to 40 TWh from hydro sources. At the same time, due to extreme
weather conditions monthly electricity imports in July 2012 reached to 433.6 GWh while
exports amounted to 181 GWh.

4 | P a g e
Table 1. Turkey’s Electricity Generation by Primary Energy Sources, 2012
An overview of July’s and 7 month’s electricity generation by primary energy sources in
Turkey is provided in Table 1.
Energy Sources Generation in
July (GWh) Share (%)
Jan – July
Generation (GWh) Share (%)
Hard Coal and Imported Coal 2,924.87 12.81 17,154.30 12.07
Lignite 3,350.65 14.68 20,647.90 14.52
Liquid Fuels 362.64 1.59 2,124.42 1.49
Natural Gas 10,209.29 44.72 55,961.99 39.36
Renewables and Wastes 185.32 0.81 1,865.07 1.31
Hydro 4,828.44 21.15 39,974.68 28.12
Geothermal and Wind 712.94 3.12 3,652.95 2.57
Imports 596.10 2.61 2,920.19 2.05
Exports 342.39 -1.49 2,128.46 -1.49
Gross Demand 22,827.87 100 142,173.03 100
In general, electricity generated from TPPs accounted for 73% for July above the 63%
mark over the entire 7 month period. The main source of TPP fuel was natural gas, which
amounted to almost half of Turkey’s electricity generation. On the other hand, electricity
generated from hydro sources was 27% in July, compared to 37% for the first seven
months’ of the year. Exports and imports over the period were relatively minor.
When the data for the first 7 months of this year and examined period is examined, it can
be concluded that the electricity production by the generation entities in the Turkish
electricity market differs depending on seasonal changes. According to Table 2, there is a
slight difference between July as a stand-alone month and the full 7 month’s statistics.
Private sector generation companies accounted for 60% of total generation while share of
state owned power generation was only 40%. Share of state owned power generation was
decreasing annually starting from the Turkish electricity market liberalization while share of
private sector generation shows a tendency to increase in these years.

5 | P a g e
Table 2. Turkey’s Electricity Generation by Electric Utility Group
Generators
Generation in
July (GWh) Share (%)
7 Month
Generation
(GWh)
Share
(%)
EUAS 6,842.7 30.31 49,102.76 30.85
Affiliated Partnership of EUAS 1,978.5 8.76 13,089.85 8.23
Mobile Power Plants 0 0 0 0
Generation Companies 12,275.6 54.39 85,380.10 53.65
Autoproducers + TOOR 1,477.4 6.54 11,571.15 7.27
Total 22,574.2 100 159,143.86 100
The extreme temperatures in July and the excessive increase in electricity consumption
negatively affected some of the country’s electricity infrastructure. Several power outages
were reported, caused by high electricity demand. A similar problem occurred during the
past winter when cold weather caused gas shortages and power outages. Such outages
often reflect transmission network issues, including overloading in big cities that caused
transformers explosions. Electricity distribution companies operating in these areas were
facing problems in satisfying excess demand, as reflected in power shortages. This
situation indicates a need for increased investment across the power system.
In spite of the regular increase in electricity consumption, there has not been made
sufficient investment in transmission and distribution systems which disabled distribution
companies to satisfy increased demand. Voltage fluctuations and interruptions also
prevented operation of electrical appliances in homes as well as damaged many hospital
air conditioners, generators and medical devices and led to electricity corruption. During
this period water level and electricity produced from dams’ decreased which increased
cost of electricity from natural gas. Increased electricity demand also doubled production
of lignite for electricity production as well.
TEIAS’s research planning and coordination department recently released 10 year
generation capacity projections for 2012 - 20212. The forecasts also include projections for
transmission and distribution, installed capacity, and electricity demand and supply based
on different scenarios up to 2021. According to the data released in the report, Turkey’s
installed capacity will be increased up to 56,473 MW in 2012, while in 2021 it will reach
95,769 MW. Based on TEIAS’s projections, development of Turkish installed capacity is
shown in Table 3.
2 Data and information used in the report was extracted from the TEAIS’s report, Turkish Electrical Energy 10-year Generation Capacity
Projection (2012-2021), available on the following link: www.teias.gov.tr/KapasiteProjeksiyonuARALIK2012.pdf

6 | P a g e
Table 3. Development of Total Installed Capacity – 2012-2021
Table 4. Peak Load and Demand Forecast
Year Thermal Hydro Wind + Renewables Total
MW % MW % MW % MW
2012 34745 62 19667 35 2060 4 56473
2013 35108 60 20893 36 2434 4 58436
2014 36691 59 23085 37 2741 4 62516
2015 38397 57 25883 38 3028 4 67307
2016 40515 56 29143 40 3028 4 72686
2017 42403 54 31793 41 3775 5 77971
2018 45491 54 33988 40 4523 5 84002
2019 48580 55 34074 39 5271 6 87924
2020 51668 56 34160 37 6018 7 91847
2021 54756 57 34246 36 6766 7 95769
Source: TEIAS
In the report, TEIAS also provided high and low electricity demand growth scenarios over
the forecast period, envisaging an average growth rate of 7.5% and 6.5%, respectively. In
addition, TEIAS expects load curve characteristics to change, while peak load increases
annually, reaching to 71,985 MW by 2021. Detailed annual development of peak load and
electricity demand series in case of high demand scenario is provided in Table 4.
Year Peak Load Electricity Demand
MW Increase (%) GWh Increase (%)
2012 38000 5.2 244026 6.4
2013 41000 7.9 262010 7.4
2014 43800 6.8 281850 7.6
2015 46800 6.8 303140 7.6
2016 50210 7.3 325920 7.5
2017 53965 7.5 350300 7.5
2018 57980 7.4 376350 7.4
2019 62265 7.4 404160 7.4
2020 66845 7.4 433900 7.4
2021 71985 7.7 467260 7.7
Source: TEIAS

7 | P a g e
Figure 1. Peak Load and Demand Forecast
TEIAS’s study also analyzes how to meet peak load and demand series according to:
Existing plants at end 2011
State owned under construction power plants
Private sector owned under construction power plants granted by license and
expected to be in service on proposed date based on “January 2012 Progress
Report” of EMRA and prepared according to Scenario 2 considered with High
Demand Scenario by EMRA.
In this capacity projection study covering the period 2012-2021, it is analyzed how to meet
the demand safely, i.e. with a suitable reserve, by taking into account existing plants,
under construction plants and licensed projects which are expected to be in service on
planned date. Considering macroeconomic targets, supply and demand is calculated as
well as balance and electricity deficit is defined. According to high demand scenario
electricity demand in Turkey in 2012 will be 244 TWh while it will reach 467 TWh by 2021.
When the generation capacity is considered, a domestic supply shortfall exists from 2017.
In this study, the covering of demand according to average and firm generating amounts is
calculated by taking into account maintenance, planned outages, forced outages, hydro
conditions and rehabilitation schedule of power plants in the existing system. While
calculating generating capacity amount, it is also assumed that there will be no deficit in
fuel supply. Figure 1 describes development of electricity demand, production and
shortages during the period of 2012-2021.
Source: TEIAS

8 | P a g e
Table 5. Distribution of DAM Participants
3. Synopsis of Turkish DAM
The number of participants in the DAM increased by 5.1% during July to 556 compared to
the 545 DAM participants observed in July 2012.
License Type June 2012 July 2012
Public Private Public Private
Production 6 294 6 320
Auto Producers 1 113 1 114
Wholesale 1 108 1 109
Retail 9 12 9 12
Auto Producers Group 0 1 0 1
Total 17 528 17 556
In July, total turnover amounted to 444.2 million USD compared to 299.7 million USD in
June 2012. Total trading volume in the DAM was recorded at 4,602,043 MWh compared to
3,659,328 MWh in June, 2012. There was a significant increase in the figures caused by
extreme weather conditions during the examined period, which resulted in high electricity
demand. Overall, electricity consumption in July increased by 7.8% against June, 2012 to
a daily average of 27,169 MWh since the beginning of July, while DAM’s daily average
reached 6,185 MWh in the examined period.

8
Description 06/2012 07/2012 Change
Base Average (US c/kWh) 7.94 9.33 17.51%
Peak Average Price (US c/kWh) 9.07 10.35 14.11%
Off-Peak Average Price (US c/kWh) 5.27 7.03 33.40%
Shoulder-Peak Average Price
(US c/kWh) 8.64 9.9 14.58%
Highest Price (US c/kWh) 11.10 12.17 9.64%
Lowest Price (US c/kWh) 0.00 0.00 0%
Total Turnover (USD) 299,705,113 444,238,034 48.23%
Average Hourly Turnover (USD) 416,257 597,094 43.44%
Maximum Hourly Turnover (USD) 759,502 1,012,432 33.30%
Minimum Hourly Turnover (USD) 0.00 0.00 0%
Average Weekdays Price (US c/kWh) 8.21 9.52 15.96%
Average Weekdays Turnover (USD) 441,682 616,366 39.55%
Average Weekend Price (US c/kWh) 7.33 8.88 21.15%
Average Weekend Turnover (USD) 356,931 549,984 54.09%
Description 06/2012 07/2012 Change
Total Volume (MWh) 3,659,328 4,602,040 25.76%
Highest Trading Volume (MWh) 7,208 9,043 25.46%
Lowest Trading Volume (MWh) 3,558 2,603 -26.84%
Average Trading Volume (MWh) 5,082 6,185 21.70%
Highest System Demand Volume
(MWh) 31,486 33,481 6.34%
Lowest System Demand Volume
(MWh) 17,607 19,376 10.05%
Average System Demand Volume
(MWh) 24,765 27,169 9.71%
Average Weekdays Trading Volume
(MWh) 5,224 6,292 20.44%
Average Weekend Trading Volume
(MWh) 4,750 5,924 24.72%
DAM’s share in total forecasted
demand (%) 20.52 22.77 10.96%
Note:
Base average price contains an average of all the hourly prices in the examined periods. Peak, off-peak, and shoulder-peak average prices and the highest and lowest price contain
prices for already determined peak, off-peak and shoulder-peak hours and maximum and minimum prices during the examined period. Total volume determines the volume of
electricity traded in the DAM. System demand volume represents the total volume of electricity consumed in Turkey.
Table 6. Summary of Prices and Turnover
Table 7. Summary of Volumes

9
4. Analysis of Turkish DAM Activities in July 2012
The Turkish DAM is characterized by hourly and even weekly fluctuations in price
spikes and production volumes. However, in the aggregate, trading volumes and market
clearing prices continue to grow. In July 2012, electricity production increased by 7.8%
compared with the previous year. Based on HIPP’s previous studies, this report uses
three price clusters: peak, shoulder-peak and off-peak hours. During daytime, peak
hours were categorized in 11:00-19:00 hours, whereas off-peak hours were between
02:00-08:00 and shoulder peak hours were 08:00-11:00 and 19:00-02:00.
PMUM’s web site provides day-ahead demand and production forecasts. Data is also
provided on KGUP that is the final schedule of the next day’s production after day-
ahead bidding3. HIPP uses KGUP as a proxy for demand on the Turkish power market.
The data in Table 8 shows there were considerable y-o-y change in key market
variables. Despite the spikes in electricity supply and prices for July 2012, key market
variables continued to show y-o-y increases in July 2012. On average, SDV demand
increased by 6.38% in July 2012 while trading volumes and prices on the DAM tended
to increase as well. In the examined month, DAM’s trading volume on average more
than doubled compared to July 2011, while prices showed a slight y-o-y decrease.
3 We estimated the difference between actual monthly production and KGUP monthly production at around 10.5% in July. (Total
sum of KGUP production for July was 20,214 GWh, while for the same time period actual production was 22,574 GWh).
Year Variables on Hourly
Basis July, 2011 July, 2012 Change
DAM Price (US c/kWh)
Max 11.70 12.17 4.02%
Average 9.40 9.33 -0.74%
Min 0.11 0.00 -110.00%
Trading Volume on the DAM (MWh)
Max 6,408 9,043 41.12%
Average 2,930 6,185 111.09%
Min 373 2,603 597.86%
System Demand Volume (MWh)
Max 31,890 33,481 4.99%
Average 25,540 27,169 6.38%
Min 18,100 19,376 7.05%
Table 8. Comparison of DAM variables

10
0123456789
10111213
US
c/kW
h
Daily Min Prices Daily Average Prices Daily Max Prices
0
2
4
6
8
10
12
0
5
10
15
20
25
30
35
00
:00
-01
:00
01
:00
-02
:00
02
:00
-03
:00
03
:00
-04
:00
04
:00
-05
:00
05
:00
-06
:00
06
:00
-07
:00
07
:00
-08
:00
08
:00
-09
:00
09
:00
-10
:00
10
:00
-11
:00
11
:00
-12
:00
12
:00
-13
:00
13
:00
-14
:00
14
:00
-15
:00
15
:00
-16
:00
16
:00
-17
:00
17
:00
-18
:00
18
:00
-19
:00
19
:00
-20
:00
20
:00
-21
:00
21
:00
-22
:00
22
:00
-23
:00
23
:00
-24
:00
US
c/kW
h
GW
h
Average System Load in 2011 Average System Load in 2012
Average DAM Price in 2011 Average DAM Price in 2012
Figure 1 compares variations in average system loads and prices between July 2011
and July 2012. As can be seen, hourly system volume was higher in July 2012 than in
July 2011. On average, DAM prices are following the same trend for both years,
peaking smoothly during 09:00-18:00 hours, then down turning slightly for 2 hours
during 18:00-20:00 hours and peaking again from 20:00 to 24:00.
Figure 2. Average System Load and Prices by Hours
Figure 3. Daily Minimum, Average and Maximum Prices in the DAM

11
0123456789
10111213
00
:00
-01
:00
01
:00
-02
:00
02
:00
-03
:00
03
:00
-04
:00
04
:00
-05
:00
05
:00
-06
:00
06
:00
-07
:00
07
:00
-08
:00
08
:00
-09
:00
09
:00
-10
:00
10
:00
-11
:00
11
:00
-12
:00
12
:00
-13
:00
13
:00
-14
:00
14
:00
-15
:00
15
:00
-16
:00
16
:00
-17
:00
17
:00
-18
:00
18
:00
-19
:00
19
:00
-20
:00
20
:00
-21
:00
21
:00
-22
:00
22
:00
-23
:00
23
:00
-24
:00
US
c/kW
h
Hourly Min Prices Hourly Average Prices Hourly Max Prices
As can be seen in Figure 3, there were considerable price spikes during July 2012.
July’s peak hours were recorded during 11:00-16:00 when electricity demand in Turkey
reached 33,004 MWh on average and prices ranged between 11.33 - 12.17 US c/kWh
for these days in these hours. Off-peak hours were recorded during 04:00-08:00 when
electricity demand was 19,711 MWh on average and prices ranged between 0.00 - 1.94
US c/kWh within these days in the following hours.
Figure 4 provides the distribution of minimum average and maximum DAM prices within
24 hours. As can be seen, electricity spot prices in the DAM followed typical hourly
trends, however some fluctuations were experienced. Peak hours were during the
daytime when the highest electricity price recorded at 12.17 US c/kWh. Minimum hourly
prices demonstrate considerable downturn during off-peak hours while within shoulder-
peak and peak hours, prices hike significantly, ranging from 9.5 – 10.58 US c/kWh on
average. In general, maximum and average prices were noticeably high in July
compared to the previous month’s trend.
4.1. Price Sub Groups on the Turkish DAM
In Figure 5, we use PMUM data to group July’s hourly prices in four price bands. Based
on our analysis, prices below 3 US c/kWh and prices between 3-6 US c/kWh were only
recorded during off-peak hours and accounted for the smallest share of the four bands.
Prices between 6-9 US c/kWh were recorded in all hours accounted for the second
largest share of market volume but mostly contributed to off-peak hours. Prices above 9
US c/kWh demonstrated the largest share of the four price bands. Sales in this price
band mostly occurred during shoulder-peak and peak hours and had a significantly
higher share of total volume.
Figure 4. Hourly Minimum, Average and Maximum Price in the DAM, July 2012

12
0%
20%
40%
60%
80%
100%
120%
00
:00
-01
:00
01
:00
-02
:00
02
:00
-03
:00
03
:00
-04
:00
04
:00
-05
:00
05
:00
-06
:00
06
:00
-07
:00
07
:00
-08
:00
08
:00
-09
:00
09
:00
-10
:00
10
:00
-11
:00
11
:00
-12
:00
12
:00
-13
:00
13
:00
-14
:00
14
:00
-15
:00
15
:00
-16
:00
16
:00
-17
:00
17
:00
-18
:00
18
:00
-19
:00
19
:00
-20
:00
20
:00
-21
:00
21
:00
-22
:00
22
:00
-23
:00
23
:00
-24
:00
Pe
rce
nt
of
Tim
e
0 to 3 US c/kWh 3 to 6 US c/kWh 6 to 9 US c/kWh More than 9 US c/kWh
Below 3 US c/kWh. The total number of hours when prices were below 3 US c/kWh
was only 13 out of a total 744 hours under study. This price range was recorded during
off-peak hours only and can be considered as an insignificant.
3 to 6 US c/kWh. The number of hours electricity was traded in this range was 34. This
price band was also recorded during off-peak period.
6 to 9 US c/kWh. Prices in this band accounted for 152 hours during July 2012, 112 of
which occurred during off-peak, 35 during shoulder-peak hours and 5 occurred during
peak hours.
Over 9 US c/kWh. There were 545 hours in this price band. During off-peak hours this
price band was recorded for 27 hours. Consequently, the total number of peak and
shoulder-peak hours in this price band were 275 and 243, respectively.
Overall, peak prices were dominant during the examined period. Figure 5 provides
distribution by price band for the period under study.
Figure 5. Distribution of Price Ranges, July 2012

13
0%
10%
20%
30%
40%
50%
60%
70%
80%
0 to 3US c/kWh
3 to 6US c/kWh
6 to 9US c/kWh
More than 9US c/kWh
1.75% 4.57%
20.43%
73.25%
Pe
rce
nt
of
Tim
e
0123456789
10111213
Mon Tue Wed Thu Fri Sat Sun
US
c/kW
h
Minimum Average Maximum
4.2. Price Curve Dynamics by Week-Days
Figure 7 shows that maximum and average electricity prices are high during weekdays,
while electricity prices decrease during weekends, as electricity demand softens.
Figure 8 provides a comparision of price bands within weekdays. Prices below 3 US
c/kWh were recorded only on Sunday and Monday, however with an insignificant share.
Prices between 3-6 USc/kWh occurred on all weekdays and had a minor share. Prices
between 6-9 US c/kWh were the second largest contributor in price breakdowns with a
Figure 6. Distribution by Price Ranges
Figure 7. Price Dynamics by Weekdays, July 2012

14
0.00%20.00%
40.00%60.00%
80.00%100.00%
Mon
Tue
Wed
Thu
Fri
Sat
Sun
4.17%
6.67%
3.33%
5.21%
4.17%
3.33%
5.21%
4.17%
6.67%
20.00%
19.79%
17.71%
17.50%
17.71%
19.79%
29.17%
72.50%
75.00%
78.13%
79.17%
77.08%
76.04%
57.50%
0 to 3 US c/kWh 3 to 6 US c/kWh 6 to 9 US c/kWh More than 9 US c/kWh
20
22
24
26
28
30
32
34
36
38
40
0
100
200
300
400
500
600
700
800P
erc
en
t
GW
h
System Daily Production Share of DAM
20% share of the time. During the examined period, prices over 9 US c/kWh were the
mainstay of the market, occuring around 75% of the time.
4.3. DAM Volume Data Analysis
Figure 9 illustrates daily production in the entire Turkish power market and the share of
the DAM. As can be seen, system loads are significantly lower during weekends in
Turkey. However, trading volumes in the DAM did not follow this trend in July. This
explains why the dashed line on the graph is acyclic to the system load, thereby
indicating an increasing share of trading volume as a portion of total system load during
weekends.
Figure 8. Price Range Breakdown by Weekdays
Figure 9. Daily Electricity Production and Share of the DAM, July 2012

15
0%
5%
10%
15%
20%
25%
30%
35%
40%
0.94%
6.05% 10.75%
19.35%
35.75%
24.33%
2.82% Pe
rce
nt
of
Tim
e
Volume in Single Hour (MWh)
2000
3000
4000
5000
6000
7000
8000
9000
10000
00
:00
-01
:00
01
:00
-02
:00
02
:00
-03
:00
03
:00
-04
:00
04
:00
-05
:00
05
:00
-06
:00
06
:00
-07
:00
07
:00
-08
:00
08
:00
-09
:00
09
:00
-10
:00
10
:00
-11
:00
11
:00
-12
:00
12
:00
-13
:00
13
:00
-14
:00
14
:00
-15
:00
15
:00
-16
:00
16
:00
-17
:00
17
:00
-18
:00
18
:00
-19
:00
19
:00
-20
:00
20
:00
-21
:00
21
:00
-22
:00
22
:00
-23
:00
23
:00
-24
:00
MW
h
Min DAM Volumes (MWh) Average DAM Volume Max DAM Volume
Figure 10 provides distribution of trading volume by groups in the Turkish DAM.
Figure 11 represents minimum, average and maximum volume dynamics within 24
hours.
Figure 10. Trading Volume by Group in the DAM, July 2012
Figure 11. Hourly Minimum, Average and Maximum Volumes in the DAM,
July 2012

16
0
1000
2000
3000
4000
5000
6000
7000
8000
9000
10000
MW
h
Min DAM Volumes (MWh) Average DAM Volume Max DAM Volume
Figure 12 represents daily minimum, average and maximum volume dynamics within
the examined period.
Figure 12. Daily Minimum, Average and Maximum Volumes in the DAM, July
2012

17
Appendix
Source materials used in this report can be found at the following locations.
1. Hydropower Investment Promotion Project, www.hydropower.ge
2. Energy Market Regulatory Authority, www.emra.gov.tr
3. Market Financial Reconciliation Center (PMUM), dgpys.teias.gov.tr/dgpys/
4. Market Financial Reconciliation Center (PMUM), www.pmum.gov.tr
5. Turkish Electricity Transmission Corporation, www.teias.gov.tr

18
USAID Hydropower Investment Promotion Project (USAID-HIPP)
Deloitte Consulting Overseas Projects - HIPP
13th floor, 11, Apakidze str, Tiflis Business Center,
Tbilisi, 0171, Georgia