
TURBIDITY IN CRISIS COMMUNICATIONS: Not Just a Load of Hot Water

Turbidity Analysis for Oregon Public Water Systems Water Quality in Coast Range Drinking Water Source Areas June 2010
Last Updated: 06/29/10
By: Joshua Seeds
DEQ 09-WQ-024
Report

This report prepared by:
Oregon Department of Environmental Quality
811 SW 6th
Avenue
Portland, OR 97204
1-800-452-4011
Contact:
Joshua Seeds
(503) 229-5081
i
Turbidity Analysis for Oregon Public Water Systems
Table of Contents
Table of Contents .......................................................................................... i
List of Figures .............................................................................................. iii
List of Tables ............................................................................................... iiv
List of Maps ................................................................................................. iiv
Executive Summary ..................................................................................... 1
Introduction .................................................................................................. 2
Applicable Turbidity Standards for Water Quality ............................................... 2
Public Water System Evaluations....................................................................... 3
Methods .......................................................................................................................... 5
Definitions of terms......................................................................................................... 6
Summary of Results ....................................................................................................... 6
Case Studies ................................................................................................ 8
Analysis of Public Water System Turbidity Data ................................................. 9
Arch Cape Water District (PWS #4100802) ................................................................... 9
City of Astoria (PWS #4100055) .................................................................................. 10
City of Carlton (PWS# 4100171) .................................................................................. 15
City of Falls City (PWS# 4100297)............................................................................... 20
City of Forest Grove (PWS #4100305) ........................................................................ 23
Hillsboro-Cherry Grove (PWS# 4100985) .................................................................... 27
City of Siletz (PWS# 4100821) ..................................................................................... 30
City of Yamhill (PWS# 4100968) .................................................................................. 33
Ecological and Economic Implications ....................................................... 37
Natural Disturbances and Land Use Have Potential Effects on Sediment/Turbidity ... 37
Land Use May Alter Flow Regimes .............................................................................. 38
Climate Change Risks for Public Water Supplies ........................................................ 38
Potential Costs Related to Higher Turbidity ................................................................. 38
Land Management Effectiveness for Source Water Protection ................................... 39
Potential Followup ...................................................................................... 42
References ................................................................................................. 44
Appendices ................................................................................................ 49

ii
Turbidity Analysis for Oregon Public Water Systems
Appendix A: Public Water Systems with All or Part of DWSA in the Coast
Range ......................................................................................................... 49
Appendix B: Relationship of Stream Turbidity and Suspended Solids in the
Siletz River Basin: Analysis of Data Collected by Confederated Tribes of
Siletz Indians ............................................................................................... 52

iii
Turbidity Analysis for Oregon Public Water Systems
List of Figures Figure 1: Number of Days with High Raw Water Turbidity .................................... 6
Figure 2: Total Duration of Treatment Shutdowns by Month (Arch Cape) ............. 9
Figure 3a: Influent Turbidity for City of Astoria .................................................... 10
Figure 3b: Turbidity in City of Astoria’s Source Water: Streams .......................... 11
Figure 3c: Turbidity in City of Astoria’s Source Water: Lakes ............................. 11
Figure 3d: Precipitation for City of Astoria........................................................... 12
Figure 3e: Raw Water Turbidity Trend for City of Astoria .................................... 12
Figure 3f: Number of Days with High Turbidity in Astoria’s Raw Water ............... 13
Figure 3g: Trend for High Turbidity Days in Astoria’s Raw Water ....................... 14
Figure 4a: Influent Turbidity for City of Carlton .................................................... 15
Figure 4b: Precipitation for City of Carlton .......................................................... 16
Figure 4c: Raw Water Turbidity Trend for City of Carlton
(includes effects of 1999 landslide) ..................................................... 17
Figure 4d: Raw Water Turbidity Trend for City of Carlton
(excludes effects of 1999 landslide) ................................................... 17
Figure 4e: Number of Days with High Turbidity in Carlton’s Raw Water .............. 18
Figure 4f: Trend for High Turbidity Days in Carlton’s Raw Water ........................ 18
Figure 4g: Storage Capacity in City of Carlton’s Reservoir ................................. 19
Figure 5a: Influent Turbidity for City of Falls City................................................. 20
Figure 5b: Precipitation for City of Falls City ....................................................... 21
Figure 5c: Raw Water Turbidity Trend for City of Falls City ................................ 21
Figure 5d: Number of Days with High Turbidity in Falls City’s Raw Water .......... 22
Figure 5e: Trend for High Turbidity Days in Falls City’s Raw Water .................... 22
Figure 5f: Turbidity Range & Mean for November 2006 Sedimentation Incident . 23
Figure 6a: Influent Turbidity for City of Forest Grove .......................................... 24
Figure 6b: Precipitation for City of Forest Grove ................................................. 25
Figure 6c: Raw Water Turbidity Trend for City of Forest Grove .......................... 25
Figure 6d: Number of Days with High Turbidity in Forest Grove’s Raw Water .... 26
Figure 6e: Trend for High Turbidity Days in Forest Grove’s Raw Water .............. 26
Figure 7a: Influent Turbidity for Hillsboro-Cherry Grove ...................................... 27
Figure 7b: Precipitation for Hillsboro-Cherry Grove ............................................ 28
Figure 7c: Raw Water Turbidity Trend for Hillsboro-Cherry Grove ...................... 28
Figure 7d: Number of Days with High Turbidity in Hillsboro-Cherry Grove’s
Raw Water ........................................................................................ 29
Figure 7e: Trend for High Turbidity Days in Hillsboro-Cherry Grove’s
Raw Water ........................................................................................ 29
Figure 8a: Influent Turbidity for City of Siletz ...................................................... 30
Figure 8b: Precipitation for City of Siletz ............................................................. 31
iv
Turbidity Analysis for Oregon Public Water Systems
Figure 8c: Raw Water Turbidity Trend for City of Siletz ...................................... 31
Figure 8d: Number of Days with High Turbidity in City of Siletz’ Raw Water ....... 32
Figure 8e: Trend for High Turbidity Days in City of Siletz’ Raw Water ................. 32
Figure 9a: Influent Turbidity for City of Yamhill ................................................... 33
Figure 9b: Precipitation for City of Yamhill .......................................................... 34
Figure 9c: Raw Water Turbidity Trend for City of Yamhill
(includes effects of 1996 storms) ....................................................... 35
Figure 9d: Raw Water Turbidity Trend for City of Yamhill
(excludes effects of 1996 storms) ...................................................... 35
Figure 9e: Number of Days with High Turbidity in Yamhill’s Raw Water ............. 36
Figure 9f: Trend for High Turbidity Days in Yamhill’s Raw Water ........................ 36
Figure 10: Reductions in fine sediment generated from roads and delivered to streams in Seattle’s Cedar River watershed ................... 40
List of Tables Table 1: Recommendations for future work based on turbidity status and trend .... 7
Table 2: Seasonally-adjusted turbidity & high turbidity day trends
for Astoria’s water sources .................................................................... 13
List of Maps Map 1: Drinking water source areas originating in Oregon’s Coast Range ............ 5
Map 2: Turbidity case studies’ drinking water source areas ................................... 8
1
Turbidity Analysis for Oregon Public Water Systems
Executive Summary After catastrophic storms and landslides hit the Oregon Coast in 2006 and 2007, the Oregon Department of
Environmental Quality and Oregon Department of Human Services had concerns about the resiliency of public
water systems that rely on surface waters in watersheds prone to heavy rains and landslides. Landslides in such
areas can deposit large amounts of sediment that can increase turbidity and significantly lower the quality of
drinking water obtained and treated by these water systems. Increasing levels of turbidity may interfere with
public water system operations, can increase operational costs and can also cause shutdowns. In addition, DEQ
and DHS were interested in the potential effects from climate change in these watersheds.
DEQ sent e-mail inquiries and interviewed staff at numerous public water systems in the Coast Range and
Southwest Oregon. It also obtained and analyzed available daily turbidity data from seven water systems
(Hillsboro-Cherry Grove and the cities of Astoria, Carlton, Falls City, Forest Grove, Siletz and Yamhill) and
collected data on water treatment facility shutdowns from Arch Cape Water District.
DEQ evaluated as case studies a total of eight public water systems in the North and Middle Oregon Coast Range
area and used available turbidity data to analyze long-term trends. DEQ‟s analysis concludes that there are long-
term concerns about system viability or increased treatment costs at five systems (Arch Cape Water District and
the cities of Astoria, Carlton, Siletz, and Yamhill), based on large numbers of high-turbidity days and/or
increasing numbers of high-turbidity days recorded in daily water samples for these systems. Also, DEQ found
that turbidity is increasing in the long term in Drinking Water Source Areas for five systems, remains stable at
one system, and is decreasing at two others.
Drinking Water Source Areas for these Coast Range systems are predominantly forested. Only the City of Siletz
has a significant amount of rural residential and/or agricultural land in the lower part of its source area.
Precipitation has the greatest impact on turbidity patterns for these systems, with the largest spikes in turbidity
occurring during the autumn months. In addition to this seasonal variation, for the five systems with increasing
turbidity trends, there are an increasing number of days reported with turbidity levels above 5 nephelometric
turbidity units (a system of measuring water‟s clarity in terms of visible light), turbidity spikes of increasing
magnitude and/or increasing baseline turbidity. In addition to the problems high turbidity can cause on drinking
water treatment and system operation, changes in turbidity may also adversely affect aquatic life or other
beneficial uses of the water, such as fishing and swimming.
High turbidity levels at some of these eight public water systems may be the result of inherent watershed
characteristics, natural events (such as storms, slides and bank erosion), and land-use activities (forestry,
agriculture, rural residential, road building and maintenance). Regardless of the source of turbidity, watershed
protection and restoration activities can reduce unacceptable levels of sediment deposited into public water system
sources and can reduce the cost of drinking water treatment.
This analysis was not designed or intended to answer cause-and-effect questions related to turbidity. Further
statistical and Geographic Information System analysis is necessary to evaluate the effects of human-caused
changes, natural disturbances and inherent watershed features on public water systems. But collection of new
data, further analysis of existing data, enhanced source water monitoring and evaluation and analysis of sediment
sources and movement will help DEQ and DHS further understand and manage risks to public water systems. In
addition, changes in weather patterns and precipitation due to climate change should be considered as this topic is
studied further.

2
Turbidity Analysis for Oregon Public Water Systems
Introduction
The storms of December 2007 resulted in catastrophic flooding in the northern Coast Range of Oregon,
destroying or harming homes, water supplies, fisheries, roads, farms, and businesses. Many of Oregon‟s Public
Water Systems (PWSs) were directly impacted by the flooding, wind damage, and landslides in their municipal
watersheds. The Department of Human Services (DHS) and the Department of Environmental Quality (DEQ)
had previously mapped all of these watersheds and prepared Source Water Assessment (SWA) reports for the
community officials (http://www.deq.state.or.us/wq/dwp/dwp.htm). The SWAs included maps of the source area
boundaries, natural characteristics of the watersheds, and identified potential risks for the systems.
The damage from the storms raised questions about the sensitivity of these PWSs as the number of severe storms
could increase due to climate change. The landslide near Clatskanie in northwest Oregon completely destroyed
Westport‟s water system. DHS was concerned about the potential for complete loss of, or severe damage to, the
systems due to storms. As part of the existing drinking water protection planning and implementation, DEQ
embarked on this analysis of potential turbidity problems for PWSs. The purpose of this first phase of analysis is
to use existing data to identify the PWSs that have ongoing turbidity problems and to conduct a trend analysis if
data is available.
Work was initiated in January 2008 with an email/phone questionnaire to 148 surface water systems in Oregon.
DEQ asked them if there were any recent landslides in their watershed that impacted the intake(s). We indicated
our purpose was to evaluate whether we need to put more resources into this problem at the state level. Out of
this initial query, we received information from 17 different systems that had turbidity impacts, but not
necessarily from landslides. Several system operators asked for assistance to determine what was causing the
turbidity and to assist them in reducing the loading to the source stream. At that point, both DHS and DEQ
determined that we should proceed with an analysis of the turbidity issues and follow this with recommendations
for reducing the risks for those systems.
Applicable Turbidity Standards for Water Quality
The turbidity water quality standard (OAR 340-41-0036) is:
Turbidity (Nephelometric Turbidity Units, NTU): No more than a ten percent cumulative increase in natural stream
turbidities may be allowed, as measured relative to a control point immediately upstream of the turbidity causing activity.
However, limited duration activities necessary to address an emergency or to accommodate essential dredging, construction
or other legitimate activities and which cause the standard to be exceeded may be authorized provided all practicable
turbidity control techniques have been applied and one of the following has been granted:
(1) Emergency activities: Approval coordinated by the Department with the Oregon Department of Fish and Wildlife under
conditions they may prescribe to accommodate response to emergencies or to protect public health and welfare;
(2) Dredging, Construction or other Legitimate Activities: Permit or certification authorized under terms of section 401 or
404 (Permits and Licenses, Federal Water Pollution Control Act) or OAR 14l-085-0100 et seq. (Removal and Fill Permits,
Division of State Lands), with limitations and conditions governing the activity set forth in the permit or certificate.
In Oregon, there are many waters with low NTU levels and a 10 % increase is very difficult to measure in a clear
stream. In addition, the original 10% Turbidity water quality standard was based on Jackson turbidity units
(JTUs) which are measureable to 25 JTU with an accuracy of ± of 1 JTU. The standard switched to NTUs which
are measureable to 1 NTU with an accuracy of ± 0.1 NTU. This has led to claims that DEQ‟s turbidity standards
cannot by implemented. In reality, the 10% exceedence criteria was designed to take into account the fact that

3
Turbidity Analysis for Oregon Public Water Systems
natural conditions in streams do not produce consistent low turbidity at all times. DEQ recognizes that there is
some natural variation and this creates difficulty in determining whether turbidity levels exceed the criteria of a
10% increase. There are several characteristics of turbidity by which a 10% increase could be documented: the
baseline turbidity of a stream, the number of spikes in a stream‟s turbidity, the median or 75th percentile of
turbidity, and/or the statistical trend that the stream‟s turbidity is following. However, the standard relates to a
control point immediately upstream and is not applicable at the watershed scale but at the reach scale. The
turbidity WQS may be revisited in 2009 or 2010.
Turbidity is one of the primary pollutants regulated in finished drinking water under the Safe Drinking Water Act
(SDWA). To protect human health, the EPA has set the level of allowable turbidity in finished drinking water at:
0.3 Nephelometric Turbidity Units (NTU) in 95% of samples (1 NTU absolute maximum) for conventional
(sedimentation and rapid sand filtration) and direct (rapid sand only) filtration; and 1 NTU in 95% of samples (5
NTU absolute maximum) for membrane, cartridge, slow sand, and diatomaceous earth filtration (US EPA 1998,
US EPA 2001, US EPA 2002b). Turbidity limits prevent drinking water from having excessive levels of
suspended fine sediment (US EPA 1999). Suspended sediment is of concern for drinking water safety as it can
reduce the effectiveness of disinfection treatments (LeChevallier et al 1981), harbor pathogens (e.g. Chang et al
1960, Tracy et al 1966, Sen & Jacobs 1969, Meschke & Sobsey 1998), contribute to formation of disinfection by-
products (Nikolaou et al 1999, US EPA 2002a), and carry nutrients, heavy metals, pesticides, and other toxic
chemicals (Lick 2008). Unpleasant tastes and odors frequently co-occur with excessive turbidity (US EPA 1998).
Prevention or removal of fine sediment pollution from water reduces these risks to acceptable levels (US EPA
2001).
Most drinking water treatment facilities run by Public Water Systems (PWSs) have the capacity to remove
turbidity-causing sediments during treatment of raw water; however, the amount of turbidity that can be
effectively removed depends on the treatment technology in use (US EPA 1999, personal communication with
PWS managers). For example, water can be treated using a flocculent/coagulant agent to collect fine sediments
into larger particles which are then removed by rapid pressurized filtration through a bed of sand. Another
common drinking water treatment system, slow sand filtration, allows water to slowly percolate through a large
bed of sand to be collected through an underdrain. When source water turbidity exceeds 5 NTU, a treatment plant
using these treatment systems will usually need to shut down (National Drinking Water Clearinghouse (NDWC)
1996, pers comm with PWS managers). PWSs with additional pre-filtration or pre-sedimentation basins can treat
source water with turbidity higher than 5 or 10 NTU (US EPA 2004, pers comm with PWS managers). Some
systems in Oregon with frequent high turbidity install advanced filtration systems that can treat water with
turbidity higher than 50 or 100 NTU (e.g. City of Coquille). These advanced filtration systems are expensive to
install and maintain and may not be affordable for all small PWSs. Some studies have shown that prevention of
turbidity and fine sediment pollution is a cost effective way to ensure that current PWS treatment can meet the
SDWA Maximum Contaminant Level (MCL) for turbidity (Brown 2000).
Public Water System Evaluations Some Public Water Systems have historic and/or current problems with turbidity in their source water. There are
161 PWSs with all or part of their Drinking Water Source Areas (DWSAs) in the Coast Range and mountains of
Southwestern Oregon (Appendix A). This report focuses on 8 PWS Case Studies in the North Coast and Mid
Coast regions that included interviews with PWS directors/supervisors and analysis of available raw water
turbidity data. We also conducted field visits in the DWSAs for the Arch Cape, Siletz, and Yamhill PWSs. The
PWS examined in this report are:
Arch Cape Water District,
City of Astoria,
City of Carlton,
City of Falls City,

4
Turbidity Analysis for Oregon Public Water Systems
City of Forest Grove,
Hillsboro-Cherry Grove,
City of Siletz,
City of Yamhill.
In addition, the following PWS were also interviewed and status reports were written based on the interview. The
status reports give some history of each PWS, the operators‟ opinions of the current situation, and their concerns
about potential threats to the PWS. Those status reports are not included in this report because we could not get
turbidity data or conduct a site visit:
City of Clatskanie,
City of Coquille,
Langlois Water District,
City of Myrtle Point,
City of Port Orford,
City of Powers,
Rainier Water Department,
Seaside Water Department,
City of Waldport,
Westport Water Association.
Some water systems did not have daily turbidity data available in an accessible format, and not all PWSs collect
precipitation data. Several were affected by a large landslide in December 2007 above Highway 30 near the
Columbia River. One (Westport Water Association) had their intake and associated infrastructure completely
destroyed by the slide. Out of the 18 water systems that were interviewed, 14 had problems or expressed
concerns about high and/or increasing turbidity in their source water.

5
Turbidity Analysis for Oregon Public Water Systems
Methods We received beginning-of-the-day turbidity data from 7 PWSs, giving a snapshot of turbidity conditions at about
8am each day. One PWS (Arch Cape) gave us data with the dates of treatment shutdowns due to turbidity. Data
were organized and counts of high turbidity days per water year were done using Microsoft Excel 2007. Minitab
v15.1 was used for graphing and data analysis, including time series trend analysis for high turbidity days using
the method of Box and Jenkins (1994) and seasonally-adjusted trend analysis of turbidity data over time
(Makridakis et al 1998). The trend analysis of high turbidity days showed whether the number of days with
turbidity ≥5 NTU (“high turbidity days”) is changing directionally over time. We fitted linear, quadratic, and
exponential models and chose the model with the best accuracy, as shown by lower Mean Absolute Percent Error
Map 1
6
Turbidity Analysis for Oregon Public Water Systems
(MAPE), Mean Absolute Deviation (MAD), and Mean Squared Deviation (MSD) scores. In no cases did the
exponential model have the best fit. The seasonally-adjusted trend analysis of turbidity separated the data into
seasonal and linear trend components. The decomposition of seasonal and linear trends allowed examination of
long-term change while accounting for the tendency of stream systems to have elevated turbidity at the beginning
of the autumn rainy season. Trend equations take the form:
Linear: Yt=α+βt
Quadratic: Yt=α+βt+γt2
where Yt is the turbidity at time t, α is the y-axis intercept, and β and γ are the coefficients of change for t and t2,
respectively.
We used ArcGIS v9.3, operator interviews, and field visits to evaluate patterns in land ownership and conditions
on the ground.
Definitions of terms Low Turbidity Status―Turbidity baseline lower than 5 NTU greater than or equal to 50% of the time
High Turbidity Status―Turbidity baseline lower than 5 NTU less than 50% of the time
Occasional Spikes―Sudden increases in turbidity that exceed 5 NTU occurring less than 30 times/year
Frequent Spikes―Sudden increases in turbidity that exceed 5 NTU occurring more than 30 times/year
Increasing Trend―β > 0.000150 for seasonally-adjusted turbidity trend
Decreasing Trend―β < -0.000150 for seasonally-adjusted turbidity trend
Stable Trend―0.000150 ≥ β ≥ -0.000150 for seasonally-adjusted turbidity trend
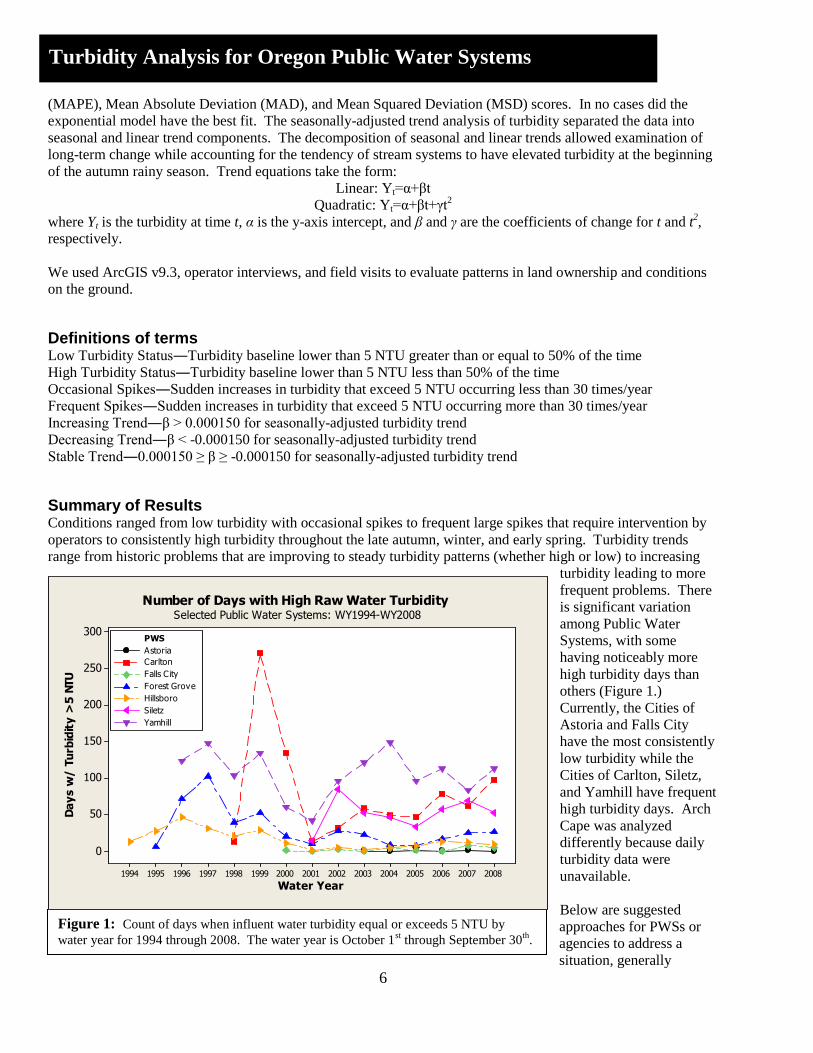
Summary of Results Conditions ranged from low turbidity with occasional spikes to frequent large spikes that require intervention by
operators to consistently high turbidity throughout the late autumn, winter, and early spring. Turbidity trends
range from historic problems that are improving to steady turbidity patterns (whether high or low) to increasing
turbidity leading to more
frequent problems. There
is significant variation
among Public Water
Systems, with some
having noticeably more
high turbidity days than
others (Figure 1.)
Currently, the Cities of
Astoria and Falls City
have the most consistently
low turbidity while the
Cities of Carlton, Siletz,
and Yamhill have frequent
high turbidity days. Arch
Cape was analyzed
differently because daily
turbidity data were
unavailable.
Below are suggested
approaches for PWSs or
agencies to address a
situation, generally
Figure 1: Count of days when influent water turbidity equal or exceeds 5 NTU by
water year for 1994 through 2008. The water year is October 1st through September 30
th.
200820072006200520042003200220012000199919981997199619951994
300
250
200
150
100
50
0
Water Year
Da
ys w
/ T
urb
idit
y >
5 N
TU
Astoria
Carlton
Falls City
Forest Grove
Hillsboro
Siletz
Yamhill
PWS
Number of Days with High Raw Water Turbidity Selected Public Water Systems: WY1994-WY2008

7
Turbidity Analysis for Oregon Public Water Systems
speaking. Specifics will vary from system to system based on their particular watershed(s) and the level of
resource protection within it. It is also important to note that many PWSs do not have resources beyond those
needed for day-to-day operations and maintenance; additional protection measures require additional funding
(Drinking Water Needs Survey 2009). Table 1: Recommendations for Future Work Based on Turbidity Status and Trend
Low Turbidity (Occasional Spikes)
Low Turbidity (Frequent Spikes)
Consistent High Turbidity
Trend of Decreasing Turbidity
N/A Evaluate situation/ Consider DWSA
protection measures
Find causes/Consider additional DWSA
protection measures
Trend of Stable Turbidity
Evaluate situation/ Consider DWSA
protection measures
Find causes/Consider additional DWSA
protection measures
Find causes/Change DWSA mgmt. &
implement restoration
Trend of Increasing Turbidity
Find causes/ Consider additional DWSA protection
measures
Find causes/Change DWSA mgmt. &
implement restoration
Find causes/Change DWSA mgmt. &
implement restoration

8
Turbidity Analysis for Oregon Public Water Systems
Case Studies
Map 2

9
Turbidity Analysis for Oregon Public Water Systems
Analysis of Public Water System Turbidity Data
Arch Cape Water District (PWS# 4100802) Thomas Merrell, Director 503-436-2790 Increasing Trend [Reported by PWS]: Low Turbidity (Occasional Spikes) transitioned to Low Turbidity
(Frequent Spikes)
Arch Cape is small coastal community in southern Clatsop County with a mixture of year-round and part-time
residents. The treatment plant uses chemical coagulation and pressurized (rapid) sand filtration to remove
particulates from the source water. The district has two drinking water intakes in its 1,250 acre Drinking Water
Source Area (DWSA): on Asbury Creek, a medium-sized coastal stream, and on Shark Creek, a medium-sized
tributary of Asbury Creek. The primary intake on Shark Creek is behind a small dam that forms an intake pool,
and the secondary intake is on Asbury Creek below its confluence with Shark Creek. The land of the forested
DWSA has been owned by a succession of private industrial timber companies. Arch Cape Water District does
not have a backup source of water.
Arch Cape Water District
has difficulty with
operations due to high
turbidity and spends a
significant proportion of
each month shutdown due
to turbidity with the
exception of the summer
months (Figure 2). Arch
Cape Water District does
not have a backup source
of water. If the PWS
cannot use the Shark
Creek intake, then they
must use the Asbury
Creek intake (downstream
of the confluence of Shark
and Asbury Creeks). If
neither intake is usable,
then the PWS must shut
down water purification
and use stored water (3 to
7 day supply).
Further increases in suspended sediment in Arch Cape‟s DWSA could be very problematic. As little as 0.5 inches
of rain raises stream turbidity to the point that Arch Cape‟s rapid sand filtration can not remove enough fine
sediment to meet finished water standards (T. Merrell, pers comm). For the last 3 years, the intake pool has
needed to be dredged yearly by necessity where during the previous decade the PWS only dredged it once every 3
or 4 years as routine maintenance. To cope with the increased turbidity, Arch Cape recently applied for and
received over $1 million in American Recovery and Reinvestment Act (“stimulus”) funds to replace their rapid
sand filtration and chlorination treatment with membrane filtration and UV disinfection. Leaking distribution
pipes will also be replaced with these funds.
Figure 2: Number of days per month that Arch Cape Water District‟s treatment plant
spent shutdown due to high turbidity from January 2007 through March 2010. Bar colors
highlight the calendar year.
Mar
201
0
Jan 20
10
Nov 20
09
Sep 20
09
Jul 2
009
May
200
9
Mar
200
9
Jan 20
09
Nov 20
08
Sep 20
08
Jul 2
008
May
200
8
Mar
200
8
Jan 20
08
Nov 20
07
Sep 20
07
Jul 2
007
May
200
7
Mar 200
7
Jan 20
07
30
25
20
15
10
5
0
Sh
utd
ow
n D
ura
tio
n (
Da
ys)
Total Duration of Treatment Shutdowns by MonthArch Cape Water District: 2007-March 2010

10
Turbidity Analysis for Oregon Public Water Systems
City of Astoria (PWS #4100055) Jim Hatcher, Public Works Operations 503-325-3524 Increasing Trend: Low Turbidity (Occasional Spikes)
The City of Astoria is located on the Columbia River estuary. Astoria has water supply intakes on two lakes
(Middle and Main Lakes) and two creeks (Cedar and Bear Creeks). They can switch among intakes as needed,
depending on weather and source conditions. Astoria typically draws more water from the creeks during the
summer and more from the lakes in winter due to turbidity fluctuations. This ability to change sources is an
important asset. Astoria uses a slow-sand filter to remove particulates, and these filters can be easily clogged by
turbidity higher than 5 NTU. Since 1956, the City of Astoria has owned nearly all of the 2,736 acre forested
Drinking Water Source Area (DWSA), in addition to a small part of neighboring Wikiup‟s DWSA. The City
does harvest timber from the DWSA. The Forest Stewardship Council (FSC) certified Astoria‟s management and
harvest operations as “Well Managed” forestland (the highest classification) in 2003. A private industrial timber
(PI) company owns less than 5% of Astoria‟s DWSA, of the southern and northern edges. Private industrial
companies own the land surrounding Astoria‟s DWSA.
Turbidity for water
entering Astoria‟s water
treatment plant is shown
below (Figure 3a). When
the source supplying the
treatment plant begins to
be too turbid, then
operators survey all
sources to determine
which has the lowest
turbidity and is most
suitable for use (Figures
3b&c). Therefore, the
source in use is typically
the one with the lowest
turbidity. Rises in
turbidity are frequently
triggered by precipitation
(Figure 3d). The turbidity
patterns in Astoria‟s water
sources are fairly stable
and easily managed with
the multitude of potential
intakes. However,
influent turbidity is
slightly increasing overall (Figure 3e), albeit at low rate and well below levels that would drive serious concerns.
All of the individual sources except Cedar Creek show at least some recent increase in turbidity (Table 2). Spur
14 Creek has very low turbidity, so its fluctuations in turbidity may appear meaningful when in fact they are very
small.
As the influent turbidity approaches 5 NTU, Astoria‟s drinking water system switches to another source with
lower turbidity. High turbidity days in the influent water are therefore rare, even when several of the sources have
elevated turbidity (Figure 3f). The flexibility among sources created a flat, and extremely low, trend in high
turbidity days (for influent) over the last 6 years (Figure 3g). Bear Creek‟s trend in high turbidity days remained
Figure 3a: Turbidity for City of Astoria‟s drinking water system. Since the City can
switch between sources as needed, this represents a composite of whichever source has
the lowest turbidity at any given time. Other sources within the DWSA probably had
higher turbidity at the time.
09/30/08
01/01/0
8
01/01/07
01/01/
06
01/01/0
5
01/01/04
01/01/0
3
20
15
10
5
0
Tu
rbid
ity
(N
TU
)
5
Influent Turbidity for City of AstoriaDrinking Water Intake: 2002-2008

11
Turbidity Analysis for Oregon Public Water Systems
level after a jump in 2005, and Middle and Main Lakes had noticeable increasing trends in the last two years
(Table 2). The turbidity increases in Bear Creek and the two lakes may be cause for concern and are likely
contributed to by ground
disturbed as trees toppled
in large numbers during
the December 2007
windstorm that struck
Oregon‟s North Coast.
Much of this blowdown
was adjacent to clearcuts
on neighboring private
land.
09/30/0
8
01/01
/08
01/01/0
7
01/01
/06
01/01
/05
01/01
/04
01/01
/03
30
25
20
15
10
5
0
Tu
rbid
ity
(N
TU
)
5
Middle Lake
Main Lake
Turbidity in Astoria's Source Water: LakesNovember 2002-September 2008
Figure 3b: Turbidity for the stream sources of Astoria‟s drinking water (Bear Creek,
Cedar Creek, and Spur 14 Creek).
Figure 3c: Turbidity for the lake sources of Astoria‟s drinking water (Middle Lake and
Main Lake).
09/30/0
8
01/01
/08
01/01
/07
01/01
/06
01/01
/05
01/01
/04
01/01
/03
80
70
60
50
40
30
20
10
5
0
Tu
rbid
ity
(N
TU
)
5
Bear Creek
Cedar Creek
Spur 14 Creek
Turbidity in Astoria's Source Water: StreamsNovember 2002-September 2008

12
Turbidity Analysis for Oregon Public Water Systems
09/30
/08
01/01
/08
01/01
/07
01/01
/06
01/01
/05
01/01
/04
01/01
/03
5
4
3
2
1
0
Pre
cip
ita
tio
n (
inch
es)
Precipitation for City of AstoriaAstoria WSO Airport Co-op Station: 2002-2008
09/30/0
8
01/01
/08
01/01/0
7
01/01
/06
01/01
/05
01/01
/04
01/01
/03
20
15
10
5
0
Tu
rbid
ity
(N
TU
)
5
MA PE 29.0221
MA D 0.3026
MSD 0.3719
A ccuracy MeasuresRaw Data
Model Predictions
Temporal Trend
Raw Water Turbidity Trend & Seasonal Decomposition for AstoriaMultiplicative Model: November 2002-September 2008
Figure 3d: Precipitation at the Astoria WSO Airport co-op weather station, the nearest
weather data to Astoria‟s DWSAs. The seasonal pattern of precipitation drives the
seasonal pattern in turbidity.
Figure 3e: The turbidity trend for the influent (raw) water is gradually increasing
(Yt=0.85+0.000183*t), but the trend is not strong. Generally, the turbidity remains low.

13
Turbidity Analysis for Oregon Public Water Systems
Seasonally-Adjusted Turbidity & High Turbidity Day Trends for Astoria’s Water Sources
Source Water Turbidity Trend
Equation
Direction of Change Days >5 NTU Trend
Equation
Bear Creek Yt= 1.27+0.000455*t Increasing Yt= -4.27+8.44*t-0.82*t2
Cedar Creek Yt= 1.93+0.000065*t Stable Yt= 6.27+1.69*t
Spur 14 Creek Yt= 0.455+0.000169*t Increasing Yt= 1.20-0.057*t
Main Lake Yt= 0.975+0.000728*t Increasing Yt= 31.9-31.2*t+6.05*t2
Middle Lake Yt= 0.890+0.000572*t Increasing Yt= 11.3-11.4*t+2.66*t2
200820072006200520042003
80
70
60
50
40
30
20
10
0
Da
ys w
/ T
urb
idit
y >
5 N
TU
Influent
Bear Cr
Cedar Cr
Spur 14 Cr
Middle Lk
Main Lk
Number of Days with High Turbidity in City of Astoria's Raw WaterWY2003-WY2008
Water Year
Figure 3f: Number of high turbidity days (>5NTU) per water year in Astoria‟s DWSA
as measured at the drinking water treatment plant from the intake(s) in use (Influent) and
as measured at each source. The water year runs from October 1st through September
30th
.
Table 2: Trend for seasonally-adjusted turbidity and trend in the number of days with high turbidity for each of
Astoria‟s water source. Trends are calculated for time period between November 2002 and September 2008.

14
Turbidity Analysis for Oregon Public Water Systems
200820072006200520042003
2.0
1.5
1.0
0.5
0.0
Water Year
Da
ys w
/ T
urb
idit
y >
5 N
TU
MA PE 60.7143
MA D 0.6571
MSD 0.5810
A ccuracy Measures
Count Data
Fitted Trend
Trend for Number of High Turbidity Days for Astoria's Raw WaterLinear Trend Model for WY2003-WY2008
Yt = 0.400 + 0.0286*t
Figure 3g: Trend in number of high turbidity days in Astoria‟s DWSA for 2003 through
2008.
15
Turbidity Analysis for Oregon Public Water Systems
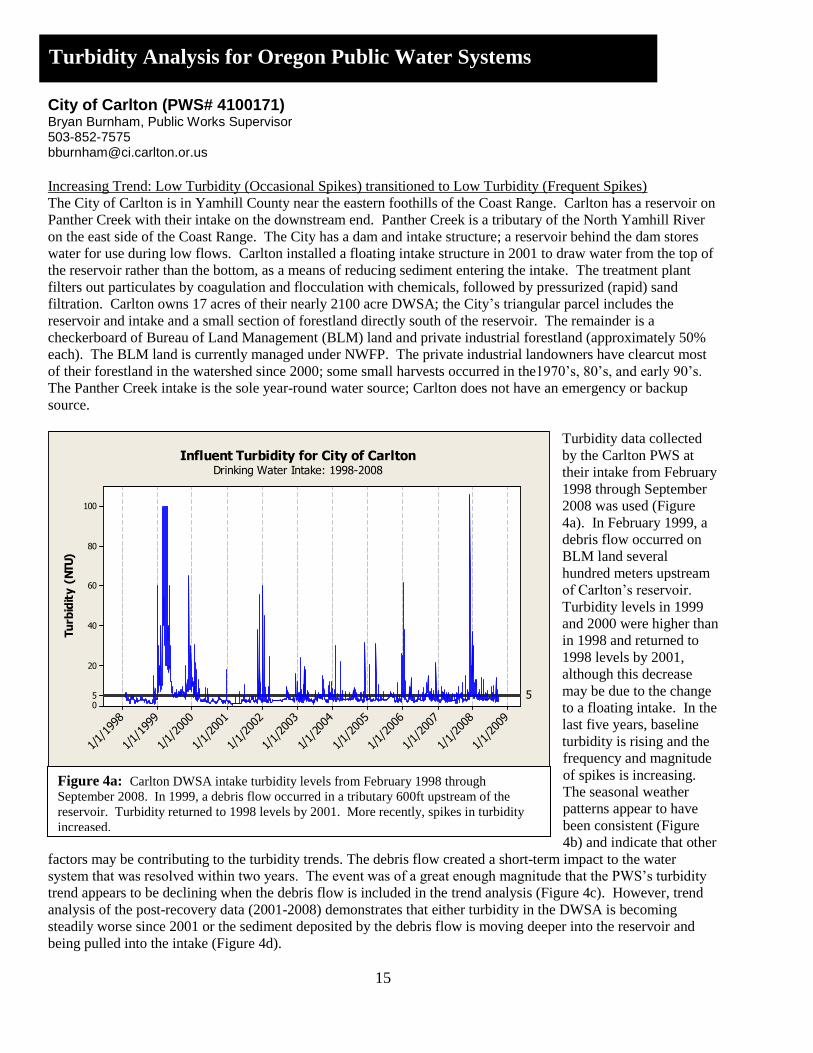
City of Carlton (PWS# 4100171) Bryan Burnham, Public Works Supervisor 503-852-7575 [email protected] Increasing Trend: Low Turbidity (Occasional Spikes) transitioned to Low Turbidity (Frequent Spikes)
The City of Carlton is in Yamhill County near the eastern foothills of the Coast Range. Carlton has a reservoir on
Panther Creek with their intake on the downstream end. Panther Creek is a tributary of the North Yamhill River
on the east side of the Coast Range. The City has a dam and intake structure; a reservoir behind the dam stores
water for use during low flows. Carlton installed a floating intake structure in 2001 to draw water from the top of
the reservoir rather than the bottom, as a means of reducing sediment entering the intake. The treatment plant
filters out particulates by coagulation and flocculation with chemicals, followed by pressurized (rapid) sand
filtration. Carlton owns 17 acres of their nearly 2100 acre DWSA; the City‟s triangular parcel includes the
reservoir and intake and a small section of forestland directly south of the reservoir. The remainder is a
checkerboard of Bureau of Land Management (BLM) land and private industrial forestland (approximately 50%
each). The BLM land is currently managed under NWFP. The private industrial landowners have clearcut most
of their forestland in the watershed since 2000; some small harvests occurred in the1970‟s, 80‟s, and early 90‟s.
The Panther Creek intake is the sole year-round water source; Carlton does not have an emergency or backup
source.
Turbidity data collected
by the Carlton PWS at
their intake from February
1998 through September
2008 was used (Figure
4a). In February 1999, a
debris flow occurred on
BLM land several
hundred meters upstream
of Carlton‟s reservoir.
Turbidity levels in 1999
and 2000 were higher than
in 1998 and returned to
1998 levels by 2001,
although this decrease
may be due to the change
to a floating intake. In the
last five years, baseline
turbidity is rising and the
frequency and magnitude
of spikes is increasing.
The seasonal weather
patterns appear to have
been consistent (Figure
4b) and indicate that other
factors may be contributing to the turbidity trends. The debris flow created a short-term impact to the water
system that was resolved within two years. The event was of a great enough magnitude that the PWS‟s turbidity
trend appears to be declining when the debris flow is included in the trend analysis (Figure 4c). However, trend
analysis of the post-recovery data (2001-2008) demonstrates that either turbidity in the DWSA is becoming
steadily worse since 2001 or the sediment deposited by the debris flow is moving deeper into the reservoir and
being pulled into the intake (Figure 4d).
Figure 4a: Carlton DWSA intake turbidity levels from February 1998 through
September 2008. In 1999, a debris flow occurred in a tributary 600ft upstream of the
reservoir. Turbidity returned to 1998 levels by 2001. More recently, spikes in turbidity
increased.
1/1/20
09
1/1/20
08
1/1/
2007
1/1/
2006
1/1/
2005
1/1/
2004
1/1/20
03
1/1/20
02
1/1/20
01
1/1/
2000
1/1/
1999
1/1/
1998
100
80
60
40
20
50
Tu
rbid
ity
(N
TU
)
5
Influent Turbidity for City of CarltonDrinking Water Intake: 1998-2008

16
Turbidity Analysis for Oregon Public Water Systems
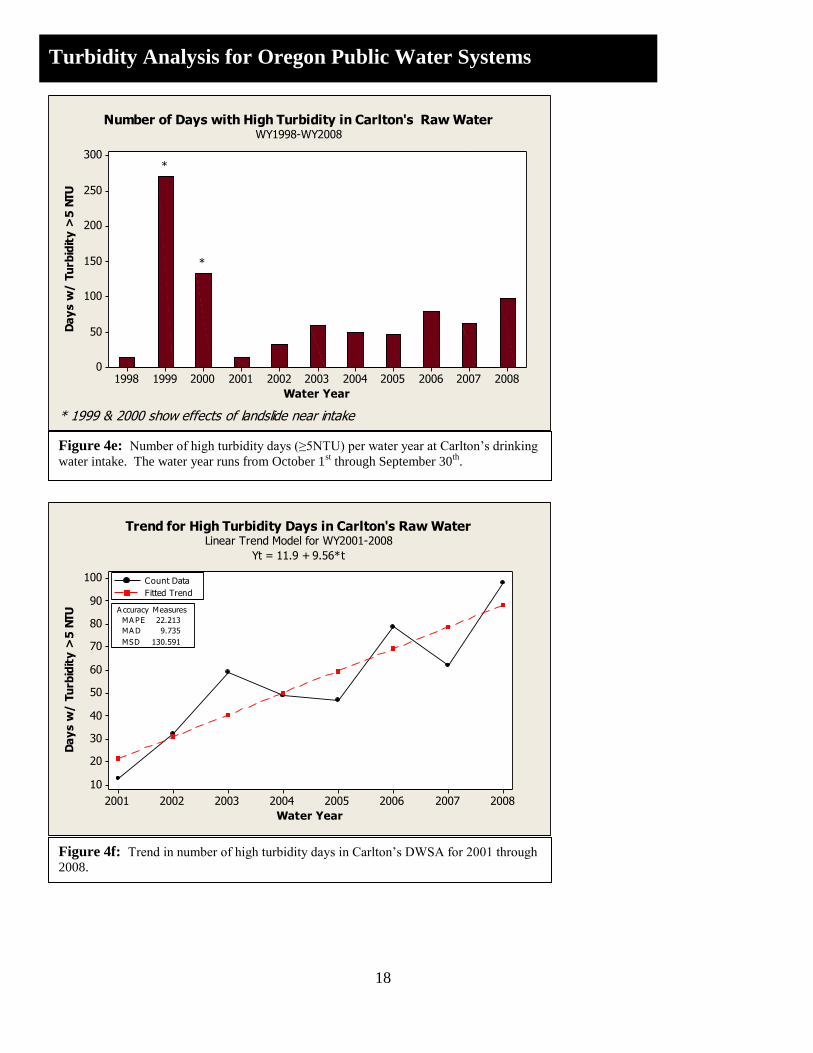
As stated above, days
with turbidity ≥5 NTU
were characterized as
“high turbidity days”
because at this level the
PWS risks clogging its
sand filter unless it has a
means to pre-treat the raw
water. Carlton‟s DWSA
reached its maximum of
271 high turbidity days in
1999 before returning to a
low of 13 days in 2001.
Since then, the maximum
number of high turbidity
days has increased
gradually to 98 days in
Water Year 2008, the
maximum since
stabilization of the
tributary landslide (Figure
4e). Analysis of the
trend in high turbidity
days shows a linear
increase in high turbidity
episodes over the last eight years (Figure 4f). Carlton has advanced filtration systems and is usually able to purify
water adequately. The PWS supervisor reported that during the winter of 2007-08 a silt bar formed where Panther
Creek flows into the reservoir. In addition, reservoir storage is being lost due to sediment settling out in the
reservoir (Figure 4g). Carlton plans to dredge the reservoir to restore lost capacity and prevent future problems.
Figure 4b: Precipitation at Carlton‟s water treatment facility. The seasonal pattern of
precipitation drives the seasonal pattern in turbidity. Many of the changes in turbidity
appear seasonal and weather-driven, but other factors are also suspected.
1/1/
2009
1/1/20
08
1/1/
2007
1/1/
2006
1/1/20
05
1/1/
2004
1/1/
2003
1/1/20
02
1/1/
2001
1/1/20
00
1/1/19
99
1/1/
1998
6
5
4
3
2
1
0
Pre
cip
ita
tio
n (
inch
es)
Precipitation for City of CarltonDrinking Water Intake: 1998-2008

17
Turbidity Analysis for Oregon Public Water Systems
1/1/20
08
1/1/
2007
1/1/20
06
1/1/
2005
1/1/20
04
1/1/
2003
1/1/20
02
1/1/
2001
1/1/20
00
1/1/
1999
2/1/
1998
100
80
60
40
20
50
Tu
rbid
ity
(N
TU
)
5
MA PE 116.612
MA D 3.896
MSD 96.728
A ccuracy MeasuresRaw Data
Model Predictions
Temporal Trend
Raw Water Turbidity Trend & Seasonal Decomposition for City of CarltonMultiplicative Model: February 1998-September 2008
1/1/20
08
1/1/
2007
1/1/20
06
1/1/
2005
1/1/20
04
1/1/
2003
1/1/20
02
1/1/
2001
70
60
50
40
30
20
10
5
0
Tu
rbid
ity
(N
TU
)
5
MA PE 50.5578
MA D 1.7110
MSD 21.6825
A ccuracy MeasuresRaw Data
Model Predictions
Temporal Trend
Raw Water Turbidity Trend & Seasonal Decomposition for City of CarltonMultiplicative Model: January 2001-September 2008 (excludes 1999 slide effects)
Figure 4c: The trend decreases over time (Yt=7.88-0.00139*t). The linear shape of the
trend fails to capture the true trend of the data, which has a curved (quadratic) shape. The
accuracy measures are relatively high (MAD of 3.896 NTU), showing that the fit of the
trend is somewhat poor.
Figure 4d: Turbidity levels in 2001 are similar to those in 1998 and subsequently show
an increasing trend of turbidity levels (Yt=2.62+0.000796*t). The lower values of the
accuracy measures (MAD of 1.711 NTU) reflect a better fitting trend than in Figure 2c.
18
Turbidity Analysis for Oregon Public Water Systems
20082007200620052004200320022001200019991998
300
250
200
150
100
50
0
Water Year
Da
ys w
/ T
urb
idit
y >
5 N
TU
*
*
Number of Days with High Turbidity in Carlton's Raw WaterWY1998-WY2008
* 1999 & 2000 show effects of landslide near intake
20082007200620052004200320022001
100
90
80
70
60
50
40
30
20
10
Water Year
Da
ys w
/ T
urb
idit
y >
5 N
TU
MA PE 22.213
MA D 9.735
MSD 130.591
A ccuracy Measures
Count Data
Fitted Trend
Trend for High Turbidity Days in Carlton's Raw WaterLinear Trend Model for WY2001-2008
Yt = 11.9 + 9.56*t
Figure 4e: Number of high turbidity days (≥5NTU) per water year at Carlton‟s drinking
water intake. The water year runs from October 1st through September 30
th.
Figure 4f: Trend in number of high turbidity days in Carlton‟s DWSA for 2001 through
2008.

19
Turbidity Analysis for Oregon Public Water Systems
200820041998
30
25
20
15
10
5
0
Year of Measurement
Re
se
rvo
ir C
ap
acit
y (
mill
ion
s o
f g
allo
ns)
Storage Capacity in City of Carlton's Reservoir
Figure 4g: Storage capacity of Carlton‟s reservoir from soundings done in 1998, 2004,
and 2008. The decrease in capacity is thought to be due to a landslide that occurred in
1999.

20
Turbidity Analysis for Oregon Public Water Systems
City of Falls City (PWS# 4100297) PWS # 4100297 Don Poe Public Works Supervisor 503-787-1305 Stable Trend: Low Turbidity (Occasional Spikes)
The City of Falls City is in Polk County near the Coast Range; Falls City‟s treatment facility uses slow sand
filtration for removal of particulates. They cease water purification when turbidity goes above 5 NTU, as higher
turbidity clogs the filters. Their 3,219 acre combined Drinking Water Source Areas are located on the eastern
slopes of the Coast Range. Falls City has two drinking water intakes: one on Glaze Creek and the other on Teal
Creek. The intake on Glaze Creek is only ½ mile from the springs, resulting in very low turbidity the majority of
the time. The Glaze Creek intake is usually the sole intake in use during late autumn and winter, water from
Glaze and Teal Creeks are mixed during spring and early summer, and only Teal Creek is used in the late summer
and early autumn when flows are too low on Glaze Creek. The use pattern of the intakes probably keeps influent
turbidity low by relying on Glaze Creek during the early rainy season when high turbidity events are most
common (personal communication w/ PWS staff). Ownership of the Glaze Creek DWSA (648 acres) is split
between a private industrial (PI) company and the Bureau of Land Management with each owning about half of
the drainage. The Teal Creek DWSA (2571 acres) is ~90% owned by the PI company. The BLM owns ~ 10% of
the drainage with an unidentified private non-industrial landowner owning ~50 acres near the intake. Falls City
does not own any of the land in their DWSAs. Private landowners logged half of the Teal Creek DWSA and
about 15% of the Glaze Creek DWSA in the last ten years. Water quality in the watershed is historically very
good.
Turbidity data collected
daily at approximately
8am by the Falls City
PWS from November
1999 through September
2008 was used (Figure
5a). [Falls City must
shutdown their intake for
1 to 3 days during storm-
triggered turbidity spikes
greater than 5 NTU. Data
were censored (>5 NTU
but of indeterminate
value) on days of
treatment plant
shutdowns due to high
turbidity. These data are
counted as 5 NTU in the
analyses, but the values
are likely to be higher.]
The collected data
represent the source water
being used at the time, so
they cannot characterize
Teal Creek during the winter or Glaze Creek during the late summer, for example. Teal Creek could have high or
low turbidity during the winter, but it cannot be evaluated with this data. The composite influent for Falls City
has very low baseline turbidity with few spikes, relative to other PWSs in this report. The seasonal weather
pattern had few large storms earlier in the decade (2001-2004; Figure 5b). This appears to have been a calm
Figure 5a: Falls City‟s influent turbidity levels from November 1999 through
September 2008. Water from Falls City‟s DWSAs generally has low baseline turbidity
with infrequent spikes.
9/30
/200
8
1/1/
2008
1/1/
2007
1/1/20
06
1/1/20
05
1/1/
2004
1/1/20
03
1/1/
2002
1/1/
2001
1/1/20
00
10
8
6
5
4
2
0
Tu
rbid
ity
(N
TU
)
5
Influent Turbidity for City of Falls CityDrinking Water Intake: 1999-2008

21
Turbidity Analysis for Oregon Public Water Systems
period relative to 2000 and 2005 onward. Seasonally-adjusted trend analysis of the data (1999-2008)
demonstrates that influent
turbidity is remaining
steady in the time period
analyzed (Figure 5c).
As stated above, days
with turbidity ≥5 NTU
were characterized as
“high turbidity days”
because at this level the
PWS risks clogging its
sand filter without the
means to pre-treat the raw
water. Falls City‟s
influent water reached its
maximum of 8 high
turbidity days in 2007
(Figure 5d). Three years
did not have any high
turbidity days at all.
Analysis of the trend in
high turbidity days shows
a slight quadratic increase
in high turbidity episodes
over the last eight years
(Figure 5e). Falls City
reports that they currently
get spikes in turbidity
during moderate-to-heavy
rain that requires
shutdowns. Nevertheless,
Falls City experiences
high turbidity days very
rarely compared to other
Coast Range PWSs
examined in this report,
so the physical
significance of this trend
may be minimal. If this
trend continues, it would
be cause for concern.
Figure 5b: Precipitation at the Rockhouse1 RAWS weather station, the nearest weather
data to Falls City‟s DWSAs. The seasonal pattern of precipitation drives the seasonal
pattern in turbidity.
Figure 5c: The trend remains relatively steady over time (Yt=0.62-0.000076*t).
Censored data from treatment plant shutdowns due to high turbidity (in 2003, 2006, and
2007) are entered as 5 NTU when the values were possibly higher. However, the trend
does not change much and remains “stable” even if censored data are assigned higher
values (15 NTU, Yt=0.61-0.000037*t; 50 NTU, Yt=0.62+0.000093*t).
9/30
/200
8
1/1/20
08
1/1/20
07
1/1/20
06
1/1/20
05
1/1/20
04
1/1/20
03
1/1/20
02
1/1/
2001
1/1/20
00
10
8
6
4
2
0
Pre
cip
ita
tio
n (
inch
es)
Precipitation for City of Falls CityRockhouse 1 RAWS Station: 1999-2008
9/30
/200
8
1/1/
2008
1/1/20
07
1/1/
2006
1/1/20
05
1/1/
2004
1/1/20
03
1/1/
2002
1/1/20
01
1/1/
2000
20
15
10
5
0
Tu
rbid
ity
(N
TU
)
5
MA PE 65.6028
MA D 0.2532
MSD 0.2964
A ccuracy MeasuresRaw Data
Model Predictions
Temporal Trend
Raw Water Turbidity Trend & Seasonal Decomposition for Falls CityMultiplicative Model: November 1999-September 2008

22
Turbidity Analysis for Oregon Public Water Systems
In November of 2006,
Falls City had several
days of high turbidity
triggered by logging and
hauling operations near
the springs of Glaze
Creek in the midst of
heavy rains. Oregon
Department of Forestry
later determined that there
were violations of forest
practice rules including
wet weather hauling
limitations. Shortly after
the incident, DEQ
acquired minimum,
maximum, and mean
daily turbidity data for
11/01/2006 through
11/10/2006. We graphed
this data with the 8am
data used in this analysis
of Falls City (Figure 5f).
The 8am data is fairly
close to the mean, but
does not accurately show
the extremes, especially
the maximum. More
systematic data collection
that shows the range of
daily turbidity is probably
needed to characterize
DWSAs accurately.
Figure 5e: Trend in number of high turbidity days in Falls City‟s influent water for
2000 through 2008.
Figure 5d: Number of high turbidity days (≥5NTU) per water year in Falls City‟s
influent drinking water. The water year runs from October 1st through September 30
th.
200820072006200520042003200220012000
8
6
4
2
0
Water Year
Da
ys w
/ T
urb
idit
y >
5 N
TU
Number of Days with High Turbidity in City of Falls City's Raw WaterWY2000-WY2008
200820072006200520042003200220012000
9
8
7
6
5
4
3
2
1
0
Water Year
Da
ys w
/ T
urb
idit
y >
5 N
TU
MA PE 58.2846
MA D 1.8620
MSD 4.8134
A ccuracy Measures
Count Data
Fitted Trend
Trend for Number of High Turbidity Days in Falls City's Raw WaterQuadratic Trend Model for WY2000-WY2008
Yt = 1.29 - 0.31*t + 0.090*t**2

23
Turbidity Analysis for Oregon Public Water Systems
Figure 5f: Comparison of daily means, minima, and maxima with 8am „snapshot‟ data
during sedimentation incident in November, 2006. 8am data are close to the mean, but
inexact. 8am data do not reflect maximum turbidity well.
11/1
0/20
06
11/9/2
006
11/8/2
006
11/7/2
006
11/6/2
006
11/5/2
006
11/4/2
006
11/3/2
006
11/2/2
006
11/1/2
006
50
40
30
20
10
0
Tu
rbid
ity
(N
TU
)
Daily Maximum
Daily Minimum
Daily Mean
8am Measurement
Turbidity Range & Mean for November 2006 Sedimentation Incident
24
Turbidity Analysis for Oregon Public Water Systems
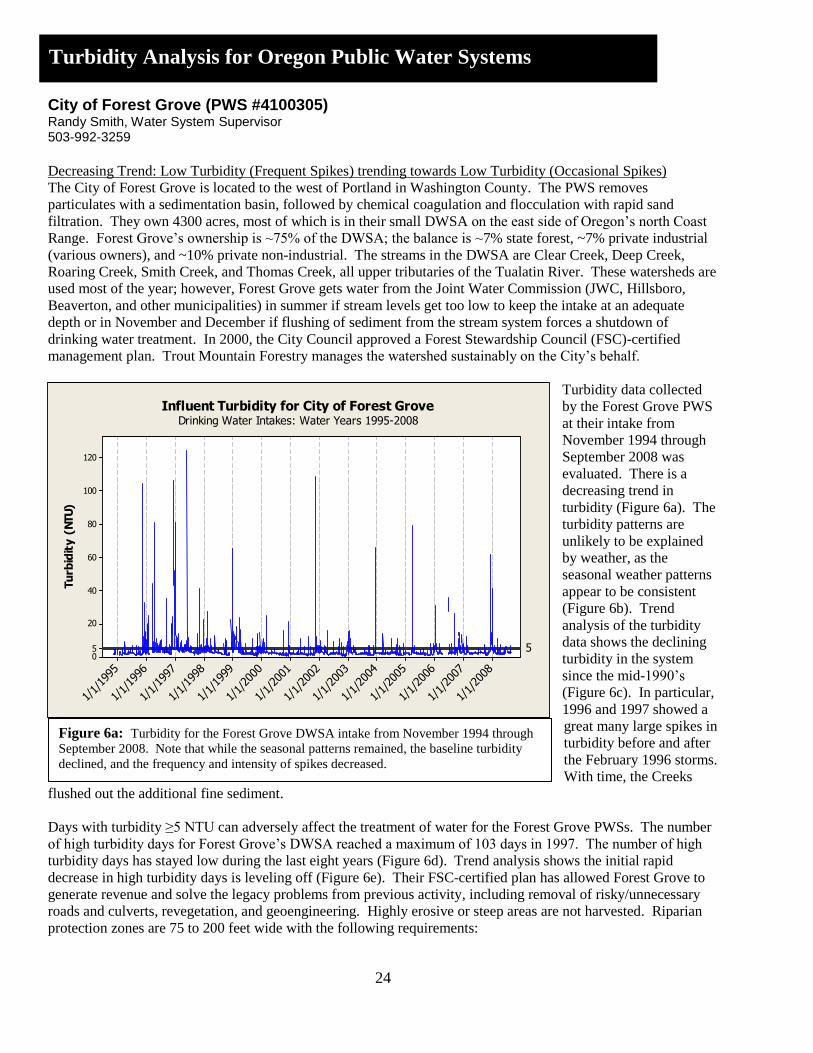
City of Forest Grove (PWS #4100305) Randy Smith, Water System Supervisor 503-992-3259 Decreasing Trend: Low Turbidity (Frequent Spikes) trending towards Low Turbidity (Occasional Spikes)
The City of Forest Grove is located to the west of Portland in Washington County. The PWS removes
particulates with a sedimentation basin, followed by chemical coagulation and flocculation with rapid sand
filtration. They own 4300 acres, most of which is in their small DWSA on the east side of Oregon‟s north Coast
Range. Forest Grove‟s ownership is ~75% of the DWSA; the balance is ~7% state forest, ~7% private industrial
(various owners), and ~10% private non-industrial. The streams in the DWSA are Clear Creek, Deep Creek,
Roaring Creek, Smith Creek, and Thomas Creek, all upper tributaries of the Tualatin River. These watersheds are
used most of the year; however, Forest Grove gets water from the Joint Water Commission (JWC, Hillsboro,
Beaverton, and other municipalities) in summer if stream levels get too low to keep the intake at an adequate
depth or in November and December if flushing of sediment from the stream system forces a shutdown of
drinking water treatment. In 2000, the City Council approved a Forest Stewardship Council (FSC)-certified
management plan. Trout Mountain Forestry manages the watershed sustainably on the City‟s behalf.
Turbidity data collected
by the Forest Grove PWS
at their intake from
November 1994 through
September 2008 was
evaluated. There is a
decreasing trend in
turbidity (Figure 6a). The
turbidity patterns are
unlikely to be explained
by weather, as the
seasonal weather patterns
appear to be consistent
(Figure 6b). Trend
analysis of the turbidity
data shows the declining
turbidity in the system
since the mid-1990‟s
(Figure 6c). In particular,
1996 and 1997 showed a
great many large spikes in
turbidity before and after
the February 1996 storms.
With time, the Creeks
flushed out the additional fine sediment.
Days with turbidity ≥5 NTU can adversely affect the treatment of water for the Forest Grove PWSs. The number
of high turbidity days for Forest Grove‟s DWSA reached a maximum of 103 days in 1997. The number of high
turbidity days has stayed low during the last eight years (Figure 6d). Trend analysis shows the initial rapid
decrease in high turbidity days is leveling off (Figure 6e). Their FSC-certified plan has allowed Forest Grove to
generate revenue and solve the legacy problems from previous activity, including removal of risky/unnecessary
roads and culverts, revegetation, and geoengineering. Highly erosive or steep areas are not harvested. Riparian
protection zones are 75 to 200 feet wide with the following requirements:
Figure 6a: Turbidity for the Forest Grove DWSA intake from November 1994 through
September 2008. Note that while the seasonal patterns remained, the baseline turbidity
declined, and the frequency and intensity of spikes decreased.
1/1/20
08
1/1/20
07
1/1/20
06
1/1/20
05
1/1/20
04
1/1/20
03
1/1/20
02
1/1/20
01
1/1/20
00
1/1/19
99
1/1/19
98
1/1/19
97
1/1/19
96
1/1/19
95
120
100
80
60
40
20
50
Tu
rbid
ity
(N
TU
)
5
Influent Turbidity for City of Forest GroveDrinking Water Intakes: Water Years 1995-2008
25
Turbidity Analysis for Oregon Public Water Systems
Timber removal
is prohibited within
riparian protection zones,
except for restoration
activities (no commercial
harvest is allowed).
Practices promote older
forest structure and
diversity.
Skid trails or
roads in riparian areas are
retired or relocated
wherever possible.
Equipment
operation in riparian areas
is prohibited, except for
restoration activities.
Restoration
activities within riparian
areas use methods with
the lightest possible
impacts.
(Forest Grove Watershed Plan, Chapter 4).
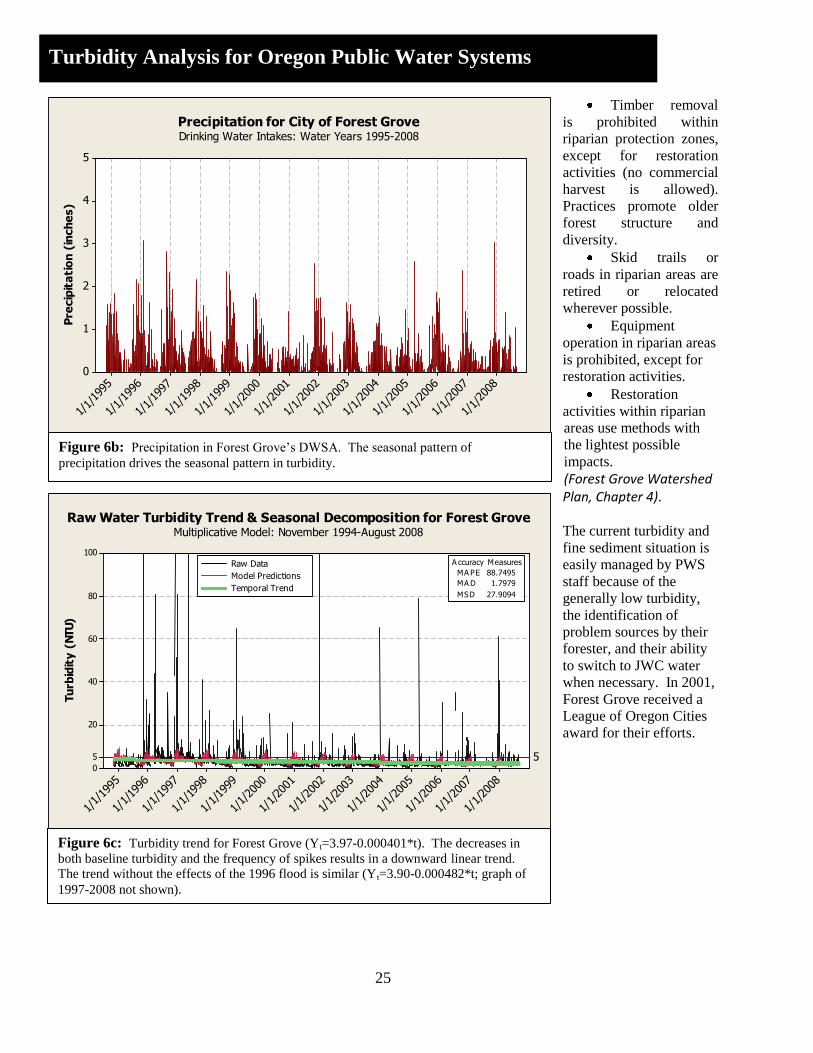
The current turbidity and
fine sediment situation is
easily managed by PWS
staff because of the
generally low turbidity,
the identification of
problem sources by their
forester, and their ability
to switch to JWC water
when necessary. In 2001,
Forest Grove received a
League of Oregon Cities
award for their efforts.
Figure 6b: Precipitation in Forest Grove‟s DWSA. The seasonal pattern of
precipitation drives the seasonal pattern in turbidity.
Figure 6c: Turbidity trend for Forest Grove (Yt=3.97-0.000401*t). The decreases in
both baseline turbidity and the frequency of spikes results in a downward linear trend.
The trend without the effects of the 1996 flood is similar (Yt=3.90-0.000482*t; graph of
1997-2008 not shown).
1/1/20
08
1/1/20
07
1/1/20
06
1/1/20
05
1/1/20
04
1/1/20
03
1/1/20
02
1/1/20
01
1/1/20
00
1/1/19
99
1/1/19
98
1/1/19
97
1/1/19
96
1/1/19
95
5
4
3
2
1
0
Pre
cip
ita
tio
n (
inch
es)
Precipitation for City of Forest GroveDrinking Water Intakes: Water Years 1995-2008
1/1/20
08
1/1/
2007
1/1/20
06
1/1/
2005
1/1/20
04
1/1/20
03
1/1/
2002
1/1/20
01
1/1/
2000
1/1/19
99
1/1/
1998
1/1/
1997
1/1/19
96
1/1/
1995
100
80
60
40
20
5
0
Tu
rbid
ity
(N
TU
)
5
MA PE 88.7495
MA D 1.7979
MSD 27.9094
A ccuracy MeasuresRaw Data
Model Predictions
Temporal Trend
Raw Water Turbidity Trend & Seasonal Decomposition for Forest GroveMultiplicative Model: November 1994-August 2008

26
Turbidity Analysis for Oregon Public Water Systems
20082007200620052004200320022001200019991998199719961995
100
80
60
40
20
0
Water Year
Da
ys w
/ T
urb
idit
y >
5 N
TU
Number of Days with High Turbidity in Forest Grove's Raw WaterWY1995-WY2008
20082007200620052004200320022001200019991998199719961995
100
80
60
40
20
0
Water Year
Da
ys w
/ T
urb
idit
y >
5 N
TU
MA PE 113.648
MA D 15.744
MSD 531.357
A ccuracy Measures
Count Data
Fitted Trend
Trend in High Turbidity Days for Forest Grove's Raw WaterQuadratic Trend Model for WY1995-WY2008
Yt = 63.7 - 6.46*t + 0.221*t^2
Figure 6e: Trend in number of high turbidity days in Forest Grove‟s DWSA.
Figure 6d: Number of high turbidity days (>5NTU) per water year in Forest Grove‟s
DWSA as measured at the drinking water intake. The water year runs from October 1st
through September 30th
.

27
Turbidity Analysis for Oregon Public Water Systems
Hillsboro-Cherry Grove (PWS# 4100985) Niki Iverson Water Resources Manager 503-615-6770 [email protected] Stable Trend: Low Turbidity (Occasional Spikes)
[Formerly a Decreasing Trend: Transitioned from Low Turbidity (Frequent Spikes) to Low Turbidity (Occasional
Spikes)]
The Hillsboro-Cherry Grove Public Water System (PWS) is the sole provider of drinking water to the community
of Cherry Grove and the primary provider for the City of Gaston, the community of Dilley, and the LA Water Co-
op. (The other provider is the Joint Water Commission, PWS# 4100379.) These communities are west of
Portland near the Coast Range. The PWS has two water sources: the upper Tualatin River and Barney Reservoir,
on the upper Trask River. Water from Barney Reservoir is piped into the upper reaches of the Tualatin River
during drier months (June through October) to supplement the Tualatin‟s flow. The PWSs Slow Sand Filtration
Plant (SSFP), which removes particulates by means of a settling pond (sedimentation) and slow sand filtration, is
currently benefitting from low turbidity in the upper Tualatin River, but, as a precaution, the water district shuts
the slow-sand plant when turbidity is 5 NTU or greater. The forested Drinking Water Source Area (DWSA) in
the upper Tualatin River is over 15,500 acres of mixed public and private ownership. The terrain is landslide
prone in the area near the slow-sand water filtration plant. The southeastern corner of the DWSA (near the intake)
is a checkerboard of land
owned by the PWS (~3%
of DWSA) and the Bureau
of Land Management
(~5%). A small parcel
(~1% of DWSA) of
private non-industrial
timberland straddles the
southern edge. A private
industrial (PI) company
owns the Lee Creek
drainage and the
headwaters of Sunday
Creek, amounting to the
eastern edge and the
northeastern third of the
DWSA (~45% of the
DWSA). The remaining
(~45%) area of the
DWSA is in the
Tillamook State Forest,
including most of Sunday
Creek and nearly all of
Maple Creek, in addition
to the headwaters of the
Tualatin River. Some partial cuts (thinning) occurred on state and federal lands. Since 2000, the major private
industrial (PI) landowner has harvested approximately half of their land by clearcutting. The forested DWSA for
the intake on Barney Reservoir is 5275 acres of mixed ownership. The PWS owns land surrounding the Reservoir
(~8% of the DWSA). The lower (northern) part of the DWSA contains most of the Reservoir; it is in the
Tillamook State Forest (~40%). The upper (southern) part is PI forestland (~45%). BLM owns scattered parcels
(~7%) around the edges of the Barney DWSA. The Barney Reservoir (North Fork Trask) DWSA experienced
Figure 7a: Turbidity for the Hillsboro-Cherry Grove DWSA intake from May 1993
through December 2008. The frequency and intensity of turbidity spikes decreased during
the early part of this decade. Recently, the number and intensity of spikes has increased.
Most of the 2003 data is missing.
12/1
5/20
08
1/1/
2008
1/1/
2007
1/1/
2006
1/1/
2005
1/1/
2004
1/1/
2003
1/1/
2002
1/1/
2001
1/1/
2000
1/1/
1999
1/1/
1998
1/1/
1997
1/1/
1996
1/1/
1995
1/1/
1994
5/19
/199
3
140
120
100
80
60
40
20
50
Tu
rbid
ity
(N
TU
)
5
Influent Turbidity at Hillsboro-Cherry Grove Filtration PlantDrinking Water Intake: 1993-2008

28
Turbidity Analysis for Oregon Public Water Systems
some scattered clearcuts
in the last 10 years on PI
land and some partial cuts
on State Forest land.
Conditions in the upper
Tualatin River DWSA
probably have the greatest
impact on source water
turbidity.
Figure 7a shows the
improvement in turbidity
in the upper Tualatin
River watershed. While
spikes in turbidity above
5 NTU were common 12
years ago, the watershed
recovered from
disturbances in the mid-
1990‟s and now has
consistently low turbidity.
Baseline turbidity has
decreased also. Large
spikes do occur from time
to time, as do periods of
high turbidity. These
spikes do appear to be
triggered by extreme
precipitation events at
times (Figure 7b), but
other factors may
contribute to surges in
stream turbidity.
Seasonally-adjusted trend
analysis shows a
downward trend in the
watershed‟s turbidity
(Figure 7c), although
some recent winters had
multiple large turbidity
spikes that reduce the fit
of the trend and may
indicate potential
problems.
The number of high
turbidity days (≥ 5NTU)
decreased from a high of
47 days during the 1996 water year to a low of 2 days in the 2001 water year (Figure 7d). This shows a healthy
recovery from the effects of disturbances before and during the February 1996 floods. Analysis of the trend in
high turbidity days shows that the number of days greater than 5 NTU decreased until 2001 when there were only
Figure 7b: Precipitation at Hillsboro-Cherry Grove‟s slow-sand filtration plant. The
seasonal pattern of precipitation drives the seasonal pattern in turbidity.
Figure 7c: Turbidity trend for the Hillsboro-Cherry Grove Slow Sand Filtration Plant
(Yt=2.79-0.000297*t). After frequent large spikes in the 1990‟s, the frequency and
intensity of high turbidity events declined. The trend without the effects of the 1996 flood
is similar (Yt=2.33-0.000269*t; graph of 1997-2008 not shown).
12/1
5/20
08
1/1/
2008
1/1/
2007
1/1/
2006
1/1/
2005
1/1/
2004
1/1/
2003
1/1/
2002
1/1/
2001
1/1/
2000
1/1/
1999
1/1/
1998
1/1/
1997
1/1/
1996
1/1/
1995
1/1/
1994
5/19
/199
3
7
6
5
4
3
2
1
0
Pre
cip
ita
tio
n (
inch
es)
Precipitation at Hillsboro-Cherry Grove Filtration PlantDrinking Water Intake: 1993-2008
1/1/
2008
1/1/20
07
1/1/
2006
1/1/20
05
1/1/20
04
1/1/
2003
1/1/20
02
1/1/
2001
1/1/20
00
1/1/
1999
1/1/
1998
1/1/19
97
1/1/
1996
1/1/19
95
1/1/
1994
100
80
60
40
20
50
Tu
rbid
ity
(N
TU
)
5
MA PE 123.927
MA D 1.670
MSD 86.395
A ccuracy Measures Raw Data
Model Predictions
Temporal Trend
Raw Water Turbidity Trend & Seasonal Decomposition
Multiplicative Model: May 1993-September 2008
for Hillboro-Cherry Grove SSFP

29
Turbidity Analysis for Oregon Public Water Systems
2 high turbidity days
(Figure 7e). Turbidity
stayed low before
climbing somewhat
recently (14, 12, and 10
days in 2006, 2007, and
2008, respectively). It is
unknown if the 2006-
2008 level represents the
typical equilibrium for
this watershed, or if the
lower turbidity of 2001-
2004 is the norm. The
result is a curved trend
with sharp declines in
high turbidity events
followed by leveling off.
If the trend continues,
then the slight upward
inflection at the end could
become a steady upward
climb in stream turbidity.
Lee Creek drains into the
Tualatin River
approximately 1500
meters upstream of the
SSFP, so any individual
or cumulative timber
harvest effects could be
felt quickly. The next
several years will
demonstrate whether land
use activities are likely to
increase turbidity and
negatively impact water
quality in the upper
Tualatin River watershed.
Figure 7d: Number of high turbidity days (≥5NTU) per water year in Hillsboro-Cherry
Grove‟s DWSA as measured at the drinking water intake. The water year runs from
October 1st through September 30
th.
Figure 7e: Trend in number of high turbidity days in Hillsboro-Cherry Grove‟s DWSA
by water year.
200820072006200520042003200220012000199919981997199619951994
50
40
30
20
10
0
Water Year
Da
ys w
/ T
urb
idit
y >
5 N
TU
MA PE 101.691
MA D 7.177
MSD 89.433
A ccuracy Measures
Count Data
Fitted Trend
Trend for High Turbidity Days in Hillsboro-Cherry Grove's Raw WaterQuadratic Trend Model for WY 1994-2008
Yt = 37.38 - 4.43*t + 0.167*t^2
200820072006200520042003200220012000199919981997199619951994
50
40
30
20
10
0
Water Year
Da
ys w
/ T
urb
idit
y >
5 N
TU
Water Years 1994-2008
Number of Days w/ High Turbidity in Hillsboro-Cherry Grove's Raw Water

30
Turbidity Analysis for Oregon Public Water Systems
City of Siletz (PWS# 4100821) Allen Middaugh, Superintendent of Public Works 541-444-2521 Increasing Trend: Low Turbidity (Occasional Spikes) transitioned to Low Turbidity (Frequent Spikes)
Baseline Turbidity Increasing
In the western foothills of the middle Coast Range, the City of Siletz is located on the banks of the Siletz River in
Lincoln County. The City uses the Siletz River as their year round water source. The PWS accomplishes
particulate removal with chemical coagulation and flocculation and rapid sand filtration. The City has a small
storage tank for raw water. It does not hold more than a roughly two day supply, so Siletz is planning
construction of a water storage pond to provide a backup supply of water when the River‟s turbidity is too high.
Approximately 1/3 of the PWS‟s finished water is purchased by the Confederated Tribes of Siletz Indians. At
131,540 acres, the Drinking Water Source Area is larger than any other PWS cited in this study. Most of the
DWSA is made up of steep terrain with large amounts of rainfall. The majority (~75%) of the DWSA is privately
owned by industrial timber companies. Landowners logged some of the Boulder Creek drainage in the 1980‟s,
and, in 1988, Boise Cascade removed the Valsetz Lake dam. Mr. Middaugh (PWS supervisor) reports that the
River is flashier now-more prone to sudden rises and falls in turbidity and flow. In the 1990‟s and 2000‟s,
landowners logged extensively in the Gravel Creek and South Fork Siletz River drainages and along the mainstem
Siletz River (“the Gorge”). The Siletz tribe owns scattered portions of the watershed (~2.5% of the DWSA). The
low gradient properties along the river (just upstream of the City) are occupied by agricultural and rural
residential lands, making up a very small (~7%) but important portion of the DWSA‟s area. Small landowners
along the river in lower part of the DWSA occasionally conduct land disturbing activities, such as the illegal
clearing of vegetation and fill operations by a riverfront landowner in September 2008, just a couple of miles
upstream of Siletz‟ intake. Public ownership includes some state land in the south-east corner (~5% of the
DWSA) and BLM land in the northern headwaters portion (~10% of the DWSA). BLM did some small scale
clearcut logging on their land around the North Fork Siletz River and Boulder Creek in the 1980‟s. The City of
Siletz does not own or manage any of the DWSA.
The City of Siletz PWS
started monitoring Siletz
River turbidity year round
in April of 2000, after
they built a new water
treatment plant and begin
using the Siletz River as a
water source all year
long. From 1967 to 2000,
they used Tangerman
Creek except in the
summer/early autumn.
(Prior to that, Logan
Creek was the water
source. Source changes
have been driven by
water quality problems.)
The years 2000 and 2001
had low turbidity with
few large spikes, but in
subsequent years, large
spikes in turbidity occur
frequently before
Figure 8a: Influent turbidity for the City of Siletz‟ drinking water intake on the Siletz
from April 2000 through December 2008.
12/3
1/20
08
1/1/20
08
1/1/
2007
1/1/
2006
1/1/20
05
1/1/20
04
1/1/
2003
1/1/
2002
1/1/20
01
4/21
/200
0
90
80
70
60
50
40
30
20
105
0
Tu
rbid
ity
(N
TU
)
5
Influent Turbidity for City of SiletzDrinking Water Intake: 2000-2008

31
Turbidity Analysis for Oregon Public Water Systems
dropping back to the
baseline (Figure 8a). The
baseline turbidity itself is
higher, especially during
the winter rains.
Turbidity follows the
seasonal precipitation
pattern (Figure 8b), but
the biggest storms
frequently do not coincide
with the high turbidity
events. The seasonally-
adjusted trend analysis
demonstrates a gradually
increasing trend (Figure
8c); the relatively less
turbid 2007/2008 rainy
season slightly reduces
the slope of the trend.
The Siletz River
experienced few high
turbidity (≥5NTU) days in
the latter half of the 2000
water year (4 days, April-
September) and in the
whole 2001 water year
(15 days; Figure 8d). In
contrast, the following
water year (WY2002) had
85 high turbidity days, the
highest number since
year-round use of the
Siletz River began. The
number of high turbidity
days has not returned to
the levels seen in 2001,
being 52 days in the 2008
water year. After
excluding the incomplete
data for WY2000,
analysis of the count data
show a generally
increasing trend in
turbidity (Figure 8e). The
turbidity varies around a
central tendency since
2002. It is possible that
WY2000 and WY2001 were anomalously low. Alternately, events since WY2001 may also have created
sediment sources, accounting for the elevated turbidity since 2002. Analysis of turbidity and Total Suspended
Solids (TSS) data collected by the Siletz Tribe indicates that turbidity is spatially and temporally complex and
Figure 8b: Precipitation at Siletz‟ water treatment facility. The seasonal pattern of
precipitation drives the seasonal pattern in turbidity.
Figure 8c: Turbidity trend for the City of Siletz (Yt=2.87+0.000197*t). The frequency
and intensity of high turbidity events increased starting in the autumn of 2001.
12/3
1/20
08
1/1/20
08
1/1/20
07
1/1/20
06
1/1/
2005
1/1/
2004
1/1/
2003
1/1/
2002
1/1/
2001
4/21
/200
0
7
6
5
4
3
2
1
0
Pre
cip
ita
tio
n (
inch
es)
Precipitation for City of SiletzDrinking Water Intake: 2000-2008
9/30
/200
8
1/1/
2008
1/1/
2007
1/1/20
06
1/1/20
05
1/1/20
04
1/1/20
03
1/1/20
02
1/1/20
01
4/21
/200
0
90
80
70
60
50
40
30
20
10
5
0
Tu
rbid
ity
(N
TU
)
5
MA PE 78.7126
MA D 2.0649
MSD 28.0932
A ccuracy Measures Raw Data
Model Predictions
Temporal Trend
Raw Water Turbidity Trend & Seasonal Decomposition for City of SiletzMultiplicative Model: April 2000-September 2008

32
Turbidity Analysis for Oregon Public Water Systems
generally higher farther down in the watershed (Appendix B). Source identification information and turbidity
data prior to April 2000 would be useful to better evaluate the trend in the DWSA.
200820072006200520042003200220012000
90
80
70
60
50
40
30
20
10
0
Water Year
Da
ys w
/ T
urb
idit
y >
5 N
TU
Number of Days with High Turbidity in City of Siletz' Raw WaterWY2000-WY2008
* Data for 2000 begin midway through water year
20082007200620052004200320022001
90
80
70
60
50
40
30
20
10
0
Water Year
Da
ys w
/ T
urb
idit
y >
5 N
TU
MA PE 42.757
MA D 14.375
MSD 365.359
A ccuracy Measures
Count Data
Fitted Trend
Trend for High Turbidity Days in City of Siletz' Raw WaterLinear Trend Model for WY2001-WY2008
Yt = 41.7 + 2.15*t
Figure 8d: Number of high turbidity days (≥5NTU) per water year in the Siletz River as
measured at the drinking water intake. The water year runs from October 1st through
September 30th
.
Figure 8e: Trend in number of high turbidity days at Siletz‟ intake. The linear trend
model shows the increase in high turbidity days since 2001.

33
Turbidity Analysis for Oregon Public Water Systems
City of Yamhill (PWS# 4100968) Richard Howard Public Water System Supervisor 503-662-4344 [email protected] Stable/Increasing Trend: Low Turbidity (Frequent Spikes)
The City of Yamhill is in Yamhill County near the foothills of the Coast Range, north of Carlton. Yamhill‟s PWS
removes particulates by settling in their upper reservoir, chemical coagulation and flocculation, and rapid sand
filtration. Yamhill‟s Drinking Water Source Area is 2900 acres of the Turner Creek watershed, a tributary of the
North Yamhill River on the eastern slopes of the Coast Range. A small dam forming a pool keeps the intake
submerged during lower flow periods. Another structure upstream forms an impoundment to store water to
supplement low flows in the late summer and early autumn. The DWSA is mostly rolling hills with steeper
slopes in the valleys and occasional steep slopes in the uplands. The watershed ownership is a patchwork pattern
of public and private ownership with nearly all the private land harvested within the last ten or fifteen years.
Yamhill owns 60 acres of mature forest just upstream of the intake (given to the City by President Calvin
Coolidge) and another 10 acres on the south side of their water storage impoundment in the upper reaches of the
watershed. BLM owns approximately 27% of the watershed. The remainder is private industrial forestland (70%
of the DWSA total). There is a 75 acre parcel near the intake owned by a small woodland owner; the portion of it
in the DWSA is roughly 20 acres (<1% of the DWSA).
We graphed and analyzed
the turbidity data
collected by the Yamhill
PWS at their intake from
January 1996 through
September 2008 (Figure
9a). Following the
impacts of the 1996
storm, the turbidity
decreased with fewer
large spikes and falling
baseline turbidity.
Turbidity then increases
starting in 2003 with
frequent large spikes and
a baseline that varies
around 5 NTU. The large
storm that hit the northern
Coast Range in December
of 2007 washed sediment
into Turner Creek and
initiated a landslide above
the intake, filling the pool
behind the dam with fine
sediment and gravel. Poor road placement and a blocked culvert contributed to the slide. The intake turbidity
data represents stream turbidity after fine sediment settles out in the impoundment and, to a lesser degree, the
intake pool. The seasonal weather patterns appear to have been consistent, so storms alone cannot explain the
changes in turbidity (Figure 9b). Seasonally-adjusted trend analysis shows a flat, stable trend when 1996 data is
included (Figure 9c). Analysis without 1996 data (to account for the extreme and historically rare nature of the
1996 storm and high-flow events) shows an upward linear trend in turbidity (Figure 9d).
Figure 9a: Turbidity for the Yamhill DWSA intake from January 1996 through
September 2008. Note the effect of the 1996 storm followed by relatively low turbidity
until 2003. More recently, large turbidity spikes occur with greater frequently.
1/1/
2009
1/1/
2008
1/1/
2007
1/1/20
06
1/1/20
05
1/1/20
04
1/1/
2003
1/1/
2002
1/1/
2001
1/1/20
00
1/1/19
99
1/1/19
98
1/1/19
97
1/1/
1996
300
250
200
150
100
50
0
Tu
rbid
ity
(N
TU
)
5
Influent Turbidity for City of YamhillDrinking Water Intake: 1996-2008

34
Turbidity Analysis for Oregon Public Water Systems
High turbidity days (≥5 NTU) are most problematic for PWSs. Yamhill‟s DWSA reached a maximum of 149
high turbidity days in 2004; the low of 42 days was in 2001. The count of high turbidity days has stayed near 100
days since 2004 and was 113 days in the 2008 water year (Figure 9e). This is much greater than the 2008 count
of high turbidity days for Forest Grove and comparable to the current situation in Carlton. Statistical analysis of
the trend shows a decline in high turbidity episodes until six years ago, followed by increased episodes in recent
years (Figure 9f). Data
prior to 1996 would help
to evaluate whether the
high turbidity events in
the late 1990‟s are due to
1996 flood effects or some
other processes in the
DWSA. The intake will
eventually need to be
moved to a more stable
location and designed in a
way that allows adequate
fish passage. Yamhill
needs to dredge the intake
pool and the
impoundment in the upper
watershed to restore lost
storage capacity.
Figure 9b: Precipitation at Yamhill‟s water treatment facility. The seasonal pattern of
precipitation drives the seasonal pattern in turbidity. Analysis shows that many of the
changes in turbidity are seasonal and weather-driven, but other factors are also at work.
1/1/
2009
1/1/
2008
1/1/20
07
1/1/
2006
1/1/
2005
1/1/20
04
1/1/
2003
1/1/
2002
1/1/20
01
1/1/
2000
1/1/
1999
1/1/19
98
1/1/
1997
1/1/
1996
10
8
6
4
2
0
Pre
cip
ita
tio
n (
inch
es)
0
Precipitation for City of YamhillDrinking Water Intake: 1996-2008

35
Turbidity Analysis for Oregon Public Water Systems
1/1/20
08
1/1/20
07
1/1/20
06
1/1/20
05
1/1/20
04
1/1/20
03
1/1/
2002
1/1/
2001
1/1/
2000
1/1/
1999
1/1/
1998
1/1/
1997
1/1/
1996
100
80
60
40
20
50
Tu
rbid
ity
(N
TU
)
5
MA PE 132.179
MA D 5.563
MSD 530.908
A ccuracy Measures
Raw Data
Model Predictions
Temporal Trend
Raw Water Turbidity Trend & Seasonal Decomposition for City of YamhillMultiplicative Model: January 1996-September 2008
1/1/20
08
1/1/20
07
1/1/
2006
1/1/20
05
1/1/
2004
1/1/20
03
1/1/20
02
1/1/
2001
1/1/20
00
1/1/
1999
1/1/19
98
1/1/
1997
100
80
60
40
20
50
Tu
rbid
ity
(N
TU
)
5
MA PE 119.533
MA D 4.866
MSD 432.549
A ccuracy Measures
Raw Data
Model Predictions
Temporal Trend
Raw Water Turbidity Trend & Seasonal Decomposition for City of YamhillMultiplicative Model: January 1997-September 2008 (excludes 1996 flood effects)
Figure 9c: Turbidity trend for the City of Yamhill for 1996-2008 (Yt=6.88-0.000122*t).
The frequency and intensity of high turbidity events decreased through 2001 and
increased thereafter.
Figure 9d: Turbidity trend for the City of Yamhill for 1997-2008
(Yt=4.58+0.000688*t). Removal of 1996 alters the trend noticeably.

36
Turbidity Analysis for Oregon Public Water Systems
2008200720062005200420032002200120001999199819971996
160
140
120
100
80
60
40
20
0
Water Year
Da
ys w
/ T
urb
idit
y >
5 N
TU
Number of Days with High Turbidity in Yamhill's Raw WaterWY1996-WY2008
2008200720062005200420032002200120001999199819971996
160
140
120
100
80
60
40
20
0
Water Year
Da
ys w
/ T
urb
idit
y >
5 N
TU
MA PE 27.062
MA D 21.769
MSD 807.333
A ccuracy Measures
Count Data
Fitted Trend
Trend for High Turbidity Days in Yamhill's Raw WaterQuadratic Trend Model for WY1996-WY2008
Yt = 139.9 - 11.3*t + 0.729*t**2
Figure 9e: Count of high turbidity days (≥5NTU) per water year in Yamhill‟s DWSA as
measured at the drinking water intake. The water year runs from October 1st through
September 30th
.
Figure 9f: Trend in count of high turbidity days in Yamhill‟s DWSA. The quadratic
trend model reflects the dip in high turbidity days in 2000 and 2001. The trend is largely
flat with substantial variation around the mean.

37
Turbidity Analysis for Oregon Public Water Systems
Ecological and Economic Implications In 2002, Oregon Departments of Forestry (ODF) and Environmental Quality (DEQ) released a review of the then-
current rules under the Forest Practices Act (FPA): “Sufficiency Analysis: A Statewide Evaluation of FPA
Effectiveness in Protecting Water Quality” (ODF/ODEQ 2002). The report examined the ability of forest practice
rules to meet some of DEQ‟s water quality standards, including turbidity and sedimentation (accumulation of
bedded sediment). The Sufficiency Analysis (SA) discussion of turbidity and sedimentation focused primarily on
the effects of roads and landslides, the largest sources of sediment. The SA states that roads built to post-1984
road construction standards are less likely to fail, cause landslides, or otherwise contribute sediment. However,
roads can generate substantial amounts of fine sediment the first few years after road construction and during wet-
weather log hauling. The SA also discussed the effects of yarding (moving logs across the ground) on erosion,
the increased incidence of landslides on clearcut forestland, and the effects of landslides on stream channels.
Changes to wet weather hauling, management of ground-based yarding on steep or erosive slopes, and
management of landslide-prone locations were recommended. The SA does not discuss the effects of windthrow
on sediment regimes or the adequacy of riparian buffers to prevent production of fine sediment or intercept
sediment before it reaches water bodies. The SA identifies that the effects of practices along small non-fish-
bearing streams on downstream sediment regimes is an issue that needs research and that data are lacking on
turbidity and fine sediment effects of forest practices. The data and scientific literature in this report may be able
to meet some of these identified data gaps and research needs.
Natural Disturbances and Land Use Have Potential Effects on Sediment/Turbidity Turbidity fluctuations are a normal part of stream systems and an inherent risk in the use of surface water for
drinking water supplies. Disturbances affect even unmanaged watersheds in the form of bank erosion, landslides,
fires, floods, and windthrow. The 1999 debris flow in Carlton‟s Drinking Water Source Area is an example of a
natural disturbance resulting in impacts to a Public Water System. Generally, natural disturbances are infrequent
and stream systems can flush the additional fine sediment from the stream (Reeves et al 1995, Gomi et al 2004,
Gomi et al 2005). Episodic landslides move a much greater volume of fine sediment into stream networks than
small, frequent disturbances; however, landslides are discrete events to which biological systems are adapted
while chronic sedimentation creates chronic stress that has detrimental effects (Kirchner et al 2001). The woody
debris and coarse sediment in landslides can enhance fish habitat, even though there are short term impacts to
aquatic life and drinking water uses (Reeves et al 1995, Reeves et al 2006). The data for the Hillsboro-Cherry
Grove and the Cities of Forest Grove and Yamhill show impacts from the February 1996 storms, but within two
or three years, turbidity is equal to or lower than pre-storm levels. This may confirm the short-term impacts of
natural disturbances discussed by Reeves and Kirchner. The Institute for Natural Resources completed ODF‟s
Dynamic Ecosystem Policy Project in 2009, and the synthesis documents and seminar white papers give more
information about the dynamic nature of forest ecosystems and the importance of planning for natural events
(http://egov.oregon.gov/ODF/STATE_FORESTS/FRP/RP_Home.shtml#Dynamic_Forest_Ecosystems).
Forests are the major land use in the Drinking Water Source Areas described in this report, but DWSAs
throughout the state contain a variety of land uses. There are three major categories of forest ownership in
Oregon: privately owned (industrial and non-industrial), state owned, and federally owned. There are also smaller
amounts of forestlands owned by Native American nations, counties, cities, and public water systems. Impacts
from land management (such as agriculture, silviculture, roads, and (sub)urban development) can create chronic
sediment sources that take time and resources to resolve, such as production of fine sediment by forest roads (see
Sufficiency Analysis and Reid & Dunne 1984). A temporary 2-4 hour increase in turbidity due to legitimate land
use activities is allowable under DEQ‟s water quality standards, but chronic introduction of fine sediment is not
allowed. It is also possible for management to increase the rate of other disturbances, as in the case of clearcut

38
Turbidity Analysis for Oregon Public Water Systems
timber harvests increasing rates of landslides and windthrown trees (Sidle et al 1985, Grizzel & Wolff 1998,
Robison et al 1999). Klein and others (2008) found a significant association of large scale clearcutting and
increased turbidity in Northern California redwood forests. Agriculture and suburban development introduces
sediment and toxics into source water, resulting in increased turbidity, toxic chemicals, and disinfection by-
products in finished drinking water (Ritter et al 2002, Carpenter et al 2008). PWSs may not have resources to
mitigate disasters or to upgrade equipment. Future studies should examine how land management practices affect
operations and costs of PWSs.
Land Use May Alter Flow Regimes Fluctuations in stream flow and modifications due to land use are another potential risk for PWSs with human use
in Drinking Water Source Areas. Urban or suburban development modifies stormwater flows, creating flashier
systems with larger high flows, smaller low flows, and more concentrated pollutants, including fine sediment and
toxics (Schueler 2000). Agricultural uses can consume large amounts of water during summer low flows,
contribute to flashier stream systems, and pollute waterways (Hunter 1992, Perkins et al 2009). Silviculture,
particularly clearcutting and road building, increases soil moisture during the rainy season and the likelihood of
damaging flood events and landslides (Keppeler & Brown 1998). Peak flows can increase during the first fall
storms because of clearcutting (Grant et al 2008); flows can increase due to roads (Jones & Grant 1996),
potentially moving more sediment through channels and carrying sediment from roads. Several years following
harvest and replanting, rapidly growing young trees consume large amounts of water and may result in lower base
flows (Jones & Post 2004). Summer flow deficits are especially great in 35-50 year-old plantations (Perry 2007).
Fast-growing trees in previously harvested riparian areas consume large amounts of water and reduce low flows
(Hicks et al 1991), while older riparian forests consume significantly less water (Moore et al 2004). It should be
noted that any flow alterations due to timber harvest are small in comparison to effects of agriculture or
urbanization. Regardless of the cause, changes in flow regimes can make planning for adequate water supplies
difficult for PWSs and potentially contribute to water shortages during summer when water use is highest.
Climate Change Risks for Public Water Supplies Global climate change compounds the risks of detrimental effects on streamflow and sediment regimes.
Generally, wetter winters and higher storm intensity could create more risk of flooding and erosion, and drier,
hotter summers could contribute to smaller low flows and greater risk of water shortages (Bates et al 2008). In
the Coast Range and Western Cascades geologies, low flows are likely to stay similar but begin earlier in the year
(Tague et al 2008, G. Grant personal communication). Scientists do not know whether the streamflow effects of
changes in vegetation (such as re-growing trees) and climate will compound each other and create greater
problems or whether those effects will negate each other to some extent. More storms of high intensity are likely
to interact with land use effects to amplify sediment generation (Grizzel & Beschta 1993). For example, soil
exposed by agriculture or log skidding is more vulnerable to erosion in intense storms, especially exposed soil
near streams (Gomi et al 2005, Gomi et al 2006). The compounding effects of land use and climate change could
severely impact public water supplies, especially for small PWSs. It is not yet known what the biggest effects of
climate change are likely to be, what the risks are, or how these risks interact with vegetation changes such as
harvest and succession. Scientists are studying this topic intensively.
Potential Costs Related to Higher Turbidity Financial resources are a crucial concern for the operation of small communities‟ Public Water Systems. A
typical small PWS has sufficient income to maintain facilities, pay staff, and fund other operating costs, but water
rates are not usually high enough to absorb substantial cost increases or the need for upgraded equipment. Several
examples of additional costs attributable to higher turbidity are:
Increased use of coagulation/flocculation chemicals to remove sediment from raw water;
Dredging of sediment-filled reservoirs, impoundments, and intake pools;

39
Turbidity Analysis for Oregon Public Water Systems
Increased staff time to monitor turbidity, flush filters, inspect waterways and facilities, and apply for
funding and permits to do additional maintenance work such as dredging;
Equipment upgrades such as new filter systems and pre-filters to remove high levels of fine sediment if
high turbidity conditions are or become chronic;
Installation of new intake structures and/or switching to another water source, such as groundwater or a
neighboring PWS;
In the case of extended shutdowns during high turbidity events, there is a risk of catastrophic loss of
structures if a fire occurs when there is insufficient water in the PWS‟s reservoirs with which to fight the
fire. (Falls City and Arch Cape officials expressed this concern to the Salem Statesman-Journal
newspaper and to DEQ staff, respectively);
Costs to procure water from a vendor or neighboring PWS if extended shutdowns are too prevalent;
Short-term public health risks due to loss of a water supply, the inability to sufficiently purify water,
and/or toxics; and
Long-term health risks and costs as a result of toxic chemicals (such as pesticides, solvents, and heavy
metals) adsorbed onto the surface of fine sediment (Ambachtsheer et al 2007).
Monitoring effectiveness of land use BMPs is necessary to ensure that land management is not increasing public
health risks and PWS operating costs.
Land Management Effectiveness for Source Water Protection It is cheaper and more effective to protect source water quality than it is to clean up degraded water prior to use
(Freeman et al 2008). The recent award of $1 million in ARRA funds to Arch Cape for membrane filtration is
driven in large part by rising turbidity. In addition, modern treatment methods are not able to remove all
contaminants (Stackelburg et al 2004). Of particular concern are wastewater contaminants like pharmaceuticals
and personal care products (Benotti et al 2009) and the synergistic effects of multiple contaminants (Hayes et al
2006). These contaminants can sorb to or move with turbidity-causing particles. Postel and Thompson (2005)
summarize the hydrological services provided by healthy watersheds and the economic costs of losing or reducing
those services. Some municipalities embarked on source water protection and restoration approaches to both
reduce present and future costs and to ensure that their delivered water is free of contaminants that treatment
cannot effectively remove. Seattle, Washington, and New York City, New York, are two notable examples, but
there are others such as Boston, Massachusetts. Their examples showcase potential management directions that
may be of use to Public Water Systems in Oregon.
New York City needed to correct water quality problems. Faced with US Environmental Protection Agency
(EPA) requirements to upgrade treatment facilities, New York applied for a waiver (Limited Alternative to
Filtration) and took the more cost-effective approach of engaging land owners in their municipal watershed,
changing land management practices, and monitoring watershed conditions and water quality. In 1995,
negotiations took place around watershed protection and included representatives of EPA, New York City, New
York State, environmental groups, local governments, and residents of the watershed. New York City protected
their resource and created benefits for the watershed communities through a comprehensive program that includes
land acquisition, conservation easements, regulatory revisions, stream restoration, and incentives for farm- and
forest-owners to keep land safe from development and encourage Best Management Practices that protect water
quality (Watershed Agricultural Program and Watershed Forestry Program, respectively). The watershed
communities benefit from economic development money, infrastructure improvements, and a healthier
environment. New York City benefits by saving money and protecting its source water for the long-term.
Through forward-thinking efforts and working closely with partners, New York City‟s approach saves millions of
dollars, improves the quality of life for watershed residents, and protects and restores the environment in their
municipal watershed ( http://www.nyc.gov/watershed, NRC 2000).
Seattle, in Washington State, gets 2/3 of its water supply from the Cedar River. After buying up the Cedar River
watershed over the last 100+ years, Seattle owns nearly the entire 90,000 acre watershed. (The remaining 1/3 of
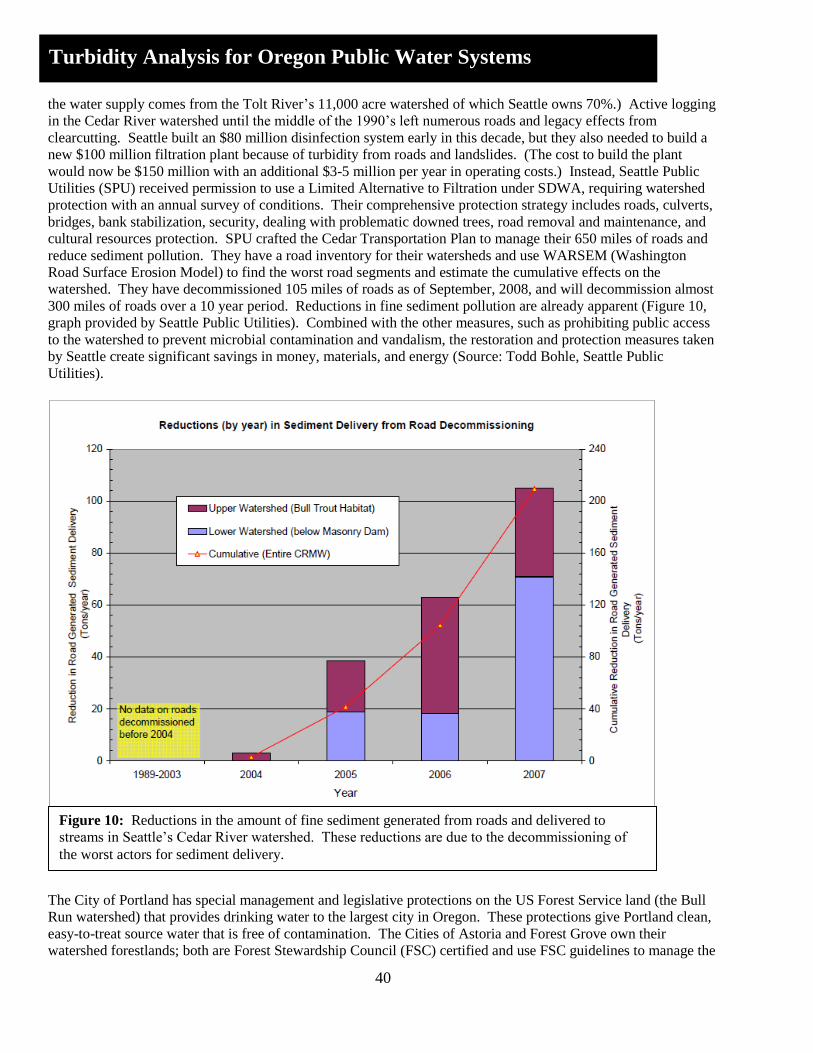
40
Turbidity Analysis for Oregon Public Water Systems
the water supply comes from the Tolt River‟s 11,000 acre watershed of which Seattle owns 70%.) Active logging
in the Cedar River watershed until the middle of the 1990‟s left numerous roads and legacy effects from
clearcutting. Seattle built an $80 million disinfection system early in this decade, but they also needed to build a
new $100 million filtration plant because of turbidity from roads and landslides. (The cost to build the plant
would now be $150 million with an additional $3-5 million per year in operating costs.) Instead, Seattle Public
Utilities (SPU) received permission to use a Limited Alternative to Filtration under SDWA, requiring watershed
protection with an annual survey of conditions. Their comprehensive protection strategy includes roads, culverts,
bridges, bank stabilization, security, dealing with problematic downed trees, road removal and maintenance, and
cultural resources protection. SPU crafted the Cedar Transportation Plan to manage their 650 miles of roads and
reduce sediment pollution. They have a road inventory for their watersheds and use WARSEM (Washington
Road Surface Erosion Model) to find the worst road segments and estimate the cumulative effects on the
watershed. They have decommissioned 105 miles of roads as of September, 2008, and will decommission almost
300 miles of roads over a 10 year period. Reductions in fine sediment pollution are already apparent (Figure 10,
graph provided by Seattle Public Utilities). Combined with the other measures, such as prohibiting public access
to the watershed to prevent microbial contamination and vandalism, the restoration and protection measures taken
by Seattle create significant savings in money, materials, and energy (Source: Todd Bohle, Seattle Public
Utilities).
The City of Portland has special management and legislative protections on the US Forest Service land (the Bull
Run watershed) that provides drinking water to the largest city in Oregon. These protections give Portland clean,
easy-to-treat source water that is free of contamination. The Cities of Astoria and Forest Grove own their
watershed forestlands; both are Forest Stewardship Council (FSC) certified and use FSC guidelines to manage the
Figure 10: Reductions in the amount of fine sediment generated from roads and delivered to
streams in Seattle‟s Cedar River watershed. These reductions are due to the decommissioning of
the worst actors for sediment delivery.

41
Turbidity Analysis for Oregon Public Water Systems
forests in their watersheds (Forest Stewardship Council 2005). According an analysis by EPA (US EPA 2005),
FSC guidelines are at least as effective in protecting source water quality and salmonid fisheries as EPA and
NOAA-Fisheries guidelines. FSC certification also allows the harvested wood to be sold with a price premium
that adds an economic benefit to FSC management (Bensel et al, in press). Other private land management
methods (such as SFI, the Sustainable Forestry Initiative) can potentially protect source water quality, but they
need to be monitored and evaluated to insure that they are in fact adequate. Currently, Oregon State Forest
Management Plans, the federal Northwest Forest Plan, FSC-certified private operations, and other forest
management schemes meeting or exceeding EPA and NOAA-Fisheries guidelines are the demonstrated means
most likely to protect and restore source water quality and limit turbidity impacts while producing timber.
The examples of New York City and Seattle suggest that restoration and protection of source water is an effective
means of reducing treatment costs and ensuring safe, high quality water. Source water protection is a critical part
of the Multi-Barrier Approach to providing safe drinking water (NRC 2000, Barnes et al 2009). Roads are the
greatest source of fine sediment and landslide initiation sites (Montgomery 1994) and can be significant sources
of toxic pollutants (Christensen et al 1997). Therefore, road removal can be an extremely effective means of
protecting source water quality (Switalski et al 2004). When roads are needed, proper road placement and
maintenance contribute to water quality protection (Jones et al 2000). A 30-year turbidity study of managed
forestland in Western Washington by Reiter et al (2009) found that turbidity decreased over the life of the study
with the implication that road improvement and sediment controls were responsible. Thinning and multi-age
management in plantations avoids large changes in peak flows (Grant et al 2008) and increases resiliency (Bisson
et al 2003, Brown et al 2004), leaving forests and streams less vulnerable to climate change and disturbances such
as fires. For example, the management strategies for the Tillamook and Clatsop State Forests incorporate
thinning and multi-age management in addition to a robust riparian protection strategy (ODF 2001). As a result,
water quality in state forests are on a generally improving trend (Rockwell et al 2006). The Northwest Forest
Plan Aquatic Conservation Strategy, coupled with restoration in key watersheds, is also effective in improving
water quality (Gallo et al 2005). Boston, Massachusetts, uses active management of its Quabbin watershed to
increase resiliency and protect water quality and reduce treatment costs (Barten et al 1998). Watershed protection
can be a very important part of providing safe drinking water in a manner that is cost effective overall (Brown
2000), although costs associated with protection can be a significant economic challenge for timber producers (Ice
et al 2006). Incentives or ecosystem services payments could help producers meet economic challenges
associated with source water protection and prevent conversion to non-forest use. The economic benefits of
riparian protection are potentially massive (Palone & Todd 1997). New York City‟s example particularly
suggests that voluntary measures by the owners and managers of working forests and farms can protect source
water quality.

42
Turbidity Analysis for Oregon Public Water Systems
Potential Followup There are several additional tasks that should be done to better understand turbidity dynamics and potential cause-
and-effect relationships between stream conditions and natural conditions, land use activities, and climate change.
The first is to continue acquiring information about the issues that Public Water Systems face, especially in small
communities. This should include turbidity, precipitation, roads, and land use data for DWSAs. Continuous
turbidity monitoring will show patterns more fully than once-per-day measurements, as shown by the comparison
of Falls City‟s daily data with the more detailed data from November 1st-10
th, 2007. Light Ranging and Detection
(LiDAR) data would be an extremely effective tool for evaluating landscape conditions and characteristics. The
results of the Drinking Water State Revolving Fund Needs Survey can be used to help assess the financial
challenges faced by PWSs. Understanding the risks posed by climate change is essential. Further collection,
examination, and analysis of data and expanding the geographic area of analysis will enable an improved
understanding of source water protection.
Improved turbidity monitoring and assessment of source waters is needed when consistent turbidity problems or
identified risks are present. As needed, waterbodies with newly identified problems can be put on the 303(d) list,
and TMDLs or other protection and restoration plans can be developed to meet the requirements of the Clean
Water Act. DEQ plans to revisit the turbidity water quality standard in 2010. A revised turbidity standard would
provide more effective implementation through its existing programs in NPDES permits, CWA 303(d) water
quality assessment and impaired waters listings, 401 certifications, TMDL development, drinking water
protection, and nonpoint source programs. Another critical part of addressing turbidity issues where risks have
been identified is ensuring that nonpoint source programs at other agencies (e.g. Oregon Departments of
Agriculture and Forestry) are adequately funded and staffed to ensure best management practices are being
applied and water quality standards are being met.
In order to accurately assess sources of fine sediment that lead to elevated turbidity in Coast Range DWSAs, an
analysis of land use patterns and disturbances and how they relate to source water turbidity is needed. A thorough
analysis would also include landslides and significant windthrow events (if known), precipitation effects, and
sediment contributions from roads, new and old. Washington‟s WARSEM model is one potential tool for
modeling the effects of roads on DWSA sediment movement. Eugene Water and Electric Board have a source
water monitoring and assessment program that provides methods which could be applied to small PWSs. Ice et al
(2006) explore methods for evaluating the areal extent of riparian protection. Other evaluation methods and
examples exist as well.
DEQ should provide technical assistance to PWSs whenever such assistance is wanted. In the short term, DEQ
can assist PWSs in applying for SDWA grants for testing and data collection to enhance our knowledge of what is
actually happening on the landscape. Since small communities typically do not have the expertise or resources to
thoroughly examine the collected data, the Drinking Water Protection program (DWP) can assist with analysis
and inform them of Best Management Practices that may be of use. In the long term, the DWP program can help
communities to develop land use plans for their DWSAs that are consistent with protecting their drinking water
for generations to come. Such plans may include land acquisition through fee title and/or conservation easements
or incentives/ecosystem services payments to land owners if more protective management practices are found to
be necessary. The DWP program can assist PWSs in identification of funding needs and sources, such as loans
and grants to implement plans for source water protection or collection of fees from water system users for
ecosystem services payments.
DEQ works closely with the Oregon Department of Human Services on drinking water issues. In addition, close
coordination with other state agencies such as Department of Forestry, Department of Land Conservation and
Development, Department of Agriculture, and Department of Geology and Mineral Industries (DOGAMI) could
enable the DWP to better target assistance to PWSs. DOGAMI, for example, has done excellent work recently to

43
Turbidity Analysis for Oregon Public Water Systems
identify active landslides and landslide risk areas. EPA, NRCS, and NOAA-Fisheries are federal agencies with
whom DEQ can increase cooperation to resolve concerns common to source water protection and implementation
of the CWA and ESA.

44
Turbidity Analysis for Oregon Public Water Systems
References Ambachtsheer, J, J Kron, RA Liroff, T Little, and R Massey. 2007. Fiduciary Guide to Toxic Chemical Risk. Investor
Environmental Health Network & Rose Foundation for Communities and the Environment. pp 50.
Barnes, MC, AH Todd, RW Lilja, and PK Barten. 2009. Forests, water and people: drinking water supply and forest lands
in the Northeast and Midwest United States. Report NA-FR-01-08. Newtown, PA: U.S. Dept of Agriculture, Forest
Service, Northeastern Area State and Private Forestry. 71pp.
Barten, PK, T Kyker-Snowman, PJ Lyons, T Mahlstedt, R O‟Connor, and BA Spencer. 1998. Massachusetts: managing a
watershed protection forest. Journal of Forestry 96: 10-15.
Bates, BC, ZW Kundzewicz, S Wu, and JP Palutikof, Eds. 2008. Climate Change and Water. Technical Paper of the
Intergovernmental Panel on Climate Change, IPCC Secretariat, Geneva. pp 210.
Benotti, MJ, RA Trenholm, BJ Vanderford, JC Holady, BD Stanford, and SA Snyder. 2009. Pharmaceuticals and Endocrine
Disrupting Compounds in U.S Drinking Water. Environmental Science and Technology 43: 597-603.
Bensel, T.G., D. Newsom and V. Bahn. (under review in The Journal of Forestry). Are there economic benefits from Forest
Stewardship Council (FSC) certification? An analysis of Pennsylvania State Forest timber sales.
Bisson, PA, BE Reiman, C Luce, PF Hessburg, DC Lee, JL Kershner, GH Reeves, and RE Gresswell. 2003. Fire and
aquatic ecosystems of the western USA: current knowledge and key questions. Forest Ecology and Management
178: 213-229.
Box, GEP and GM Jenkins. 1994. Time Series Analysis: Forecasting and Control, 3rd Edition. Prentice Hall.
Brown, R.T., J.K. Agee, and J.F. Franklin. 2004. Forest restoration and fire: Principles in the context of place.
Conservation Biology 18: 903-912.
Brown, Thomas C. 2000. Economic issues for watersheds supplying drinking water. In: Drinking Water from Forests and
Grasslands: A Synthesis of the Scientific Literature. George E Dissmeyer, ed. General Technical Report SRS-39.
Asheville, NC: U.S. Department of Agriculture, Forest Service, Southern Research Station. pp42-51.
Carpenter, KD, S Sobieszczyk, AJ Arnsberg, and FA Rinella. 2008. Pesticide occurrence and distribution in the lower
Clackamas River basin, Oregon, 2000-2005. U.S. Geological Survey Scientific Investigations Report 2008-5027,
98pp. http://pubs.usgs.gov/sir/2008/5027
Chang, SL, G Berg, NA Clarke, and PW Kabler. 1960. Survival and protection against chlorination of human pathogens in
free-living nematodes isolated from water supplies. Am. J. Trop. Med. Hyg. 9: 136-142.
Christensen, ER, A Li, IAA Razak, [and others]. 1997. Sources of polycyclic aromatic hydrocarbons in sediments of the
Kinnickinnic River, Wisconsin. Journal of Great Lakes Research 23: 61-73.
Drinking Water Needs Survey for 2007. March, 2009. Fourth Report to Congress, EPA 816-R-09-001.
http://www.epa.gov/safewater/needssurvey/index.html
Freeman, J, R Madsen, and K Hart. 2008. Statistical analysis of drinking water treatment plant costs, source water quality,
and land cover characteristics. Trust for Public Lands. 30pp.
Forest Stewardship Council. 2005. Revised Final Pacific Coast (USA) Regional Forest Stewardship Standard, Version 9.0.
Nick Brown, coordinator. http://www.fscus.org/images/documents/2006_standards/pcwg_9.0_NTC.pdf

45
Turbidity Analysis for Oregon Public Water Systems
Gallo, K, SH Lanigan, P Eldred, SN Gordon, and C Moyer. 2005. Northwest Forest Plan – the first 10 years: Preliminary
assessment of the condition of watersheds. General Technical Report PNW-GTR-647. Portland, OR: U.S.
Department of Agriculture, Forest Service, Pacific Northwest Research Station. 133p.
Gomi, T, RC Sidle, S Noguchi, JN Negishi, AR Nik, and S. Sasaki. 2006. Sediment and wood accumulations in humid
tropical headwater streams: Effects of logging and riparian buffers. Forest Ecology and Management 224: 166-175.
Gomi, T, RC Sidle, and DN Swanston. 2004. Hydrogeomorphic linkages of sediment transport in headwater streams,
Maybeso Experimental Forest, southeast Alaska. Hydrological Processes 18: 667-683.
Gomi, T, RD Moore, and MA Hassan. 2005. Suspended sediment dynamics in small forest streams of the Pacific Northwest.
J. Amer. Water Resources Assoc. 41: 877-898.
Grant, GE, SL Lewis, FJ Swanson, JH Cissel, and JJ McDonnell. 2008. Effects of forest practices on peak flows and
consequent channel response: a state-of-science report for western Oregon and Washington. Gen. Tech. Rep. PNW-
GTR-760. Portland, OR: U.S. Department of Agriculture, Forest Service, Pacific Northwest Research Station.
Grizzel, JD and RL Beschta. 1993. Municipal water source turbidities following timber harvest and road construction in
western Oregon: a summary report. Forest Engineering Department, Oregon State University: Corvallis, Oregon.
Grizzel, JD and N Wolff. 1998. Occurrence of windthrow in forest buffer strips and its effect on small streams in Northwest
Washington. Northwest Science 72: 214-223
Hayes, TB, P Case, S Chui, D Chung, C Haefele, K Haston, M Lee, VP Mai, Y Marjuoa, J Parker, and M Tsui. 2006.
Pesticide mixtures, endocrine disruption, and amphibian declines: Are we underestimating the impact?
Environmental Health Perspectives 114suppl: 140-150.
Hicks, BJ, RL Beschta, and RD Harr. 1991. Long-term changes in streamflow following logging in western Oregon and
associated fisheries implications. Water Resources Bulletin 27: 217-226.
Hunter, HM. 1992. Agricultural contaminants in aquatic environments-a review. Department of Primary Industries.
Brisbane, Queensland, Australia.
Ice, GG, A Skaugset, and A Simmons. 2006. Estimating areas and timber values of riparian management on forest lands.
Journal of the American Water Resources Association 42: 115-124.
Jones, JA and GE Grant. 1996. Peak flow responses to clear-cutting and roads in small and large basins, western Cascades,
Oregon. Water Resources Research 32: 959-974.
Jones, JA, FJ Swanson, BC Wemple, and KU Snyder. 2000. Effects of roads on hydrology, geomorphology, and
disturbance patches in stream networks. Conservation Biology 14: 76-85.
Jones, JA and DA Post. 2004. Seasonal and successional streamflow response to forest cutting and growth in the northwest
and eastern United States. Water Resources Research 40: doi:10.1029/2003WR002952.
Keppeler, E, and D Brown. 1998. Subsurface drainage processes and management impacts. Gen. Tech. Rep. PSW-GTR-
168. Portland, OR: U.S. Department of Agriculture, Forest Service, Pacific Southwest Research Station.
Kirchner, JW, RC Finkel, CS Riebe, DE Granger, JL Clayton, JG King, and WF Megahan. 2001. Mountain erosion over 10
yr, 10 k.y., and 10 m.y. time scales. Geology 29: 591-594.
Klein, R, W Trush, and M Buffleben. 2008. Watershed Condition, Turbidity, and Implications for Anadromous Salmonids
in North Coastal California Streams: A Report to the California North Coast Regional Water Quality Control Board,
5550 Skylane Boulevard, Santa Rosa, California 95403.
LeChevallier, MW, TM Evans, and RJ Seidler. 1981. Effect of turbidity on chlorination efficiency and bacterial persistence
in drinking water. Applied and Environmental Microbiology 42: 159-167.
46
Turbidity Analysis for Oregon Public Water Systems
Lick, William. 2008. Sediment and Contaminant Transport in Surface Waters. CRC Press. 404pp.
Makridakis, S, SC Wheelwright, and RJ Hyndman. 1998. Forecasting: Methods and Applications. Wiley.
Meschke, JS, and MD Sobsey. 1998. Comparative adsorption of Norwalk virus, poliovirus 1 and F+ RNA coliphage MS2 to
soils suspended in treated wastewater. Water Sci. Technol. 38: 187-189.
Montgomery, David R. 1994. Road surface drainage, channel initiation, and slope instability. Water Resources Research 30:
1925-1932.
Moore, GW, BJ Bond, JA Jones, N Phillips, and FC Meinzer. 2004. Structural and compositional controls on transpiration
in 40- and 450-year-old riparian forests in western Oregon, USA. Tree Physiology 24: 481-491.
National Drinking Water Clearinghouse. 1996. Tech Brief: Filtration.
http://www.nesc.wvu.edu/pdf/dw/publications/ontap/2009_tb/filtration_DWFSOM51.pdf
National Research Council. 2000. Watershed management for potable water supply: assessing the New York City strategy.
National Academy Press. Washington, D.C.
Nikolaou, AD, MN Kostopoulou, and TD Lekkas. 1999. Organic by-products of drinking water chlorination. Global Nest:
The Int. J. 1: 143-156.
Oregon Department of Environmental Quality. 2007. Comments for the Science Team Review: Western Oregon Plan
Revision (WOPR) – Draft Environmental Impact Statement (DEIS) Alternatives.
Oregon Department of Forestry. 2001. Northwest State Forests Management Plan.
http://egov.oregon.gov/ODF/STATE_FORESTS/nwfmp.shtml
Oregon Department of Forestry and Department of Environmental Quality. 2002. Sufficiency Analysis: A statewide
evaluation of FPA effectiveness in protecting water quality. pp81.
http://www.oregon.gov/ODF/privateforests/docs/AllSAv1031.pdf
Palone, RS, and AH Todd (editors). 1997. Chesapeake Bay riparian handbook: a guide for establishing and maintaining
riparian forest buffers. USDA Forest Service. NA-TP-02-97. Radnor, PA.
Perkins, TR, TC Pagano, and DC Garen. 2009. Innovative operational seasonal water supply forecasting technologies.
Journal of Soil and Water Conservation 64: 15A-.
Perry, Timothy D. 2007. Do vigorous young forests reduce streamflow? Results from up to 54 years of streamflow records
in eight paired-watershed experiments in the H. J. Andrews and South Umpqua Experimental Forests. Master‟s
thesis: Oregon State University, Corvallis, OR. pp135.
Postel, SL, and BH Thompson, Jr. 2005. Watershed protection: Capturing the benefits of nature‟s water supply services.
Natural Resources Forum 29: 98-108.
Reeves, GH, LE Benda, KM Burnett, PA Bisson, and JR Sedell. 1995. A disturbance-based ecosystem approach to
maintaining and restoring freshwater habitats of evolutionarily significant units of anadromous salmonids in the
Pacific Northwest. American Fisheries Society Symposium 17: 334-349.
Reeves, GH, PA Bisson, BE Rieman and LE Benda. 2006. Postfire logging in riparian areas. Conservation Biology 20:
994-1004.
Reid, LM and T Dunne. 1984. Sediment production from forest road surfaces. Water Resources Research 20: 1753-1761.
Reiter, M, JT Heffner, S Beech, T Turner, and RE Bilby. 2009. Temporal and spatial turbidity patterns over 20 years in a
managed forest of Western Washington. Journal of the American Water Resources Association 45: 793-808.

47
Turbidity Analysis for Oregon Public Water Systems
Ritter, L, K Solomon, P Sibley, K Hall, P Keen, G Mattu, and B Linton. 2002. Sources, pathways, and relative risks of
contaminants in surface water and groundwater: a perspective prepared for the Walkerton inquiry. Journal of
Toxicology and Environmental Health 65: 1-142.
Robison, E.G., K. Mills, J. Paul, L. Dent, and A. Skaugset. 1999. Oregon Department of Forestry Storm Impacts and
Landslides of 1996: Final Report. Forest Practices Technical Report No. 4. Oregon Department of Forestry, Salem,
Oregon.
Rockwell, W, F Ebel, and J Rochelle. 2006. Forest Management Assessment Report for the Oregon Department of
Forestry‟s Northwest & Southwest Forest Management Plans. Strategic Resource Systems report of ODF. pp16.
Schueler, TR. 2000. The importance of imperviousness. In: The Practice of Watershed Protection. T Schueler and H
Holland, eds. Center for Watershed Protection, Ellicott City, MD. pp1-12.
Sen, R, and B Jacobs. 1969. Pathogenic intestinal organisms in the unfiltered water supply of Calcutta and the effect of
chlorination. Indian J. Med. Res. 57: 1220-1227.
Sidle, RC, AJ Pearce, and CL O‟Loughin. 1985. Hillslope stability and land use. Water Resources Monograph No. 11.
American Geophysical Union, Washington, DC. 140pp.
Stackelberg, PE, ET Furlong, MT Meyer, SD Zaugg, AK Henderson, and DB Reissman. 2004. Persistence of
pharmaceutical compounds and other organic wastewater contaminants in a conventional drinking-water-treatment
plant. Science of the Total Environment 329: 99-113.
Switalski, TA, JA Bissonette, TH DeLuca, CH Luce, and MA Madej. 2004. Benefits and impacts of road removal.
Frontiers in Ecology and the Environment 2: 21-28.
Tague, C, G Grant, M Farrell, J Choate, and A Jefferson. 2008. Deep groundwater mediates streamflow response to climate
warming in the Oregon Cascades. Climatic Change 86: 189-210.
Tracy, HW, VM Camarena, and F Wing. 1966. Coliform persistence in highly chlorinated waters. Journal of the American
Water Works Association 58: 1151-1159.
US Environmental Protection Agency. 1998. Interim Enhanced Surface Water Treatment Rule (IESWTR) 63 FR 69478 -
69521, December 16, 1998, Vol. 63, No. 241.
US Environmental Protection Agency. 1999. Guidance Manual for Compliance with the Interim Enhanced Surface Water
Treatment Rule: Turbidity Provisions. EPA-815-R-99-010.
US Environmental Protection Agency. 2001. Revisions to the Interim Enhanced Surface Water Treatment Rule (IESWTR),
the Stage 1 Disinfectants and Disinfection Byproducts Rule (Stage 1 DBPR), and Revisions to State Primacy
Requirements to Implement the Safe Drinking Water Act (SDWA) Amendments: 66 FR 3770, January 16, 2001,
Vol 66, No. 29.
US Environmental Protection Agency. 2002a. Edition of the Drinking Water Standards and Health Advisories, EPA 822-R-
02-038.
US Environmental Protection Agency. 2002b. Long Term 1 Enhanced Surface Water Treatment Rule (LT1ESWTR): 67 FR
1812, January 14, 2002, Vol 67, No. 9.
US Environmental Protection Agency. 2004. Long Term 1 Enhanced Surface Water Treatment Rule Turbidity Provisions
Technical Guidance Manual. EPA 816-R-04-007.
US Environmental Protection Agency. 2005. Comparative review of the Pacific Coast (USA), Regional Forest Stewardship
Standard, August 2002; the November 2004 NOAA Fisheries document titled Forest Practices on Non-Federal

48
Turbidity Analysis for Oregon Public Water Systems
Lands and Pacific Salmon Conservation; and the EPA Guidance Specifying Management Measures for Sources of
Nonpoint Source Pollution in Coastal Waters (EPA 840-B-92-002, Chapt. 3 Forestry Measures, January 1993).

49
Turbidity Analysis for Oregon Public Water Systems
Appendices Appendix A: Public Water Systems with All or Part of
DWSA in the Coast Range
ID # PWS Name Water Source County
Area
(acres)
4100003 ADAIR VILLAGE WATER SYSTEM WILLAMETTE R. BENTON 234501.88
4100012 ALBANY, CITY OF S. SANTIAM CANAL LINN 7665.94
4100041 AMITY, CITY OF S. YAMHILL R. YAMHILL 17504.87
4100047 ASHLAND WATER DEPARTMENT ASHLAND CR. JACKSON 12736.58
4100055 ASTORIA, CITY OF BEAR & CEDAR CR., MIDDLE LAKE CLATSOP 2735.95
4100062
YOUNG'S RIVER-LEWIS & CLARK
WD N. & S. FORKS BARNEY CR. CLATSOP 1899.51
4100063 WICKIUP WATER DISTRICT
LITTLE CR. & BIG/LITTLE FAT BUCK
CR. CLATSOP 1359.47
4100074 BANDON, CITY OF GEIGER & FERRY CR. COOS 2555.48
4100124 FISHHAWK LAKE RECREATION CLUB FISHAWK CR. COLUMBIA 10004.88
4100164 CANNON BEACH, CITY OF W. FORK ELK CR. CLATSOP 5277.47
4100169 CANYONVILLE, CITY OF CANYON CR. DOUGLAS 22656.81
4100171 CARLTON, CITY OF PANTHER CR. YAMHILL 2075.02
4100194 CLATSKANIE, CITY OF ROARING & WEST CR. COLUMBIA 1799.90
4100199 BEAVER WATER DISTRICT BEAVER CR. TILLAMOOK 18647.16
4100205
COOS BAY-NORTH BEND WATER
BD. PONY CR. COOS 2557.01
4100213 COQUILLE, CITY OF RINK CR. COOS 429.18
4100214 GARDEN VALLEY WTR ASSOCIATION CHINA CR. COOS 419.24
4100225 CORVALLIS, CITY OF
WILLAMETTE R, S.&N. FORKS ROCK
CR, GRIFFITH CR. BENTON 47005.87
4100239 LONDON WATER CO-OP BEAVER CR. LANE 867.67
4100246 CRESWELL, CITY OF COAST FORK WILLAMETTE R. LANE 123064.39
4100248 DALLAS, CITY OF RICKREAL CR. POLK 17953.92
4100250 MILO ACADEMY S. UMPQUA R, LICKEY CR. DOUGLAS 21934.54
4100254 DEPOE BAY, CITY OF ROCKY &DEPOE BAY CR. LINCOLN 6695.81
4100260 DRAIN, CITY OF BEAR & ALAN CR. DOUGLAS 4017.17
4100276 ELKTON, CITY OF UMPQUA RIVER DOUGLAS 316072.91
4100297 FALLS CITY, CITY OF TEAL &GLAZE CR. POLK 3218.60
4100301 HECETA WATER DISTRICT CLEAR LAKE LANE 614.69
4100302 SILTCOOS HEIGHTS SILTCOOS LAKE LANE 39670.56
4100304
ALDERWOOD WATER
DEVELOPMENT CO WOAHINK LAKE LANE 4334.51
4100305 FOREST GROVE, CITY OF ROARING, CLEAR, THOMAS, DEEP, & SMITH CR. WASHINGTON 4856.58
4100323 GLENDALE, CITY OF COW, SECTION, & MILL CR. DOUGLAS 119381.66
4100324
KERNVILLE-GLENEDEN-LINCOLN
BCH W D DRIFT CREEK LINCOLN 22229.85
4100326 GLIDE WATER ASSOCIATION NORTH UMPQUA RIVER DOUGLAS 428437.01
4100333 GOLD HILL, CITY OF ROGUE RIVER JACKSON 284024.61
4100337 ROCK CREEK HIDEOUT WATER CO UNNAMED CREEK POLK 26.74
4100342 GRANTS PASS, CITY OF ROGUE RIVER JOSEPHINE 170961.64
4100379
HILLSBORO-FOREST GROVE-
BEAVERTON
TUALATIN R. & N. FORK TRASK R.
(BARNEY RES.) WASHINGTON 120691.98
4100463 LAKESIDE WATER DISTRICT EEL LAKE COOS 3872.15
4100466 LANGLOIS WATER DISTRICT FLORAS CREEK CURRY 39049.91
4100483 LINCOLN CITY WATER DISTRICT SCHOONER CREEK LINCOLN 9591.86
4100497 MCMINNVILLE WATER AND LIGHT HASKINS & MCGUIRE RES. YAMHILL 6213.11
4100505 MANZANITA WATER DEPARTMENT N.&W. FORKS ANDERSON CR. TILLAMOOK 569.36

50
Turbidity Analysis for Oregon Public Water Systems
4100507 MAPLETON WATER DISTRICT BERKSHIRE CREEK LANE 501.69
4100513 MEDFORD WATER COMMISSION ROGUE RIVER JACKSON 290653.71
4100548
CLARKS BRANCH WTR.
ASSOCIATION SOUTH UMPQUA RIVER DOUGLAS 84099.45
4100549 TRI-CITY WATER DISTRICT SOUTH UMPQUA RIVER DOUGLAS 106502.61
4100550 MYRTLE CREEK, CITY OF
S. UMPQUA R. & SPRINGBROOK
SPRINGS DOUGLAS 4809.62
4100551 MYRTLE POINT, CITY OF NORTH FORK COQUILLE RIVER COOS 180885.59
4100554 NEHALEM, CITY OF BOB'S CREEK TILLAMOOK 425.21
4100556 NETARTS WATER DISTRICT EAST FALL CREEK TILLAMOOK 367.50
4100564 BAY HILLS WATER ASSOCIATION UNNAMED CREEK LINCOLN 26.21
4100566 NEWPORT, CITY OF BIG CR.&SILETZ R. LINCOLN 2150.12
4100568 BEVERLY BEACH WATER DISTRICT WADE CREEK LINCOLN 1460.17
4100581 OAKLAND, CITY OF CALAPOOYA CREEK DOUGLAS 64894.66
4100585 OCEANSIDE WATER DISTRICT SHORT CREEK TILLAMOOK 1304.36
4100603
PANTHER CREEK WATER
DISTRICT PANTHER CREEK LINCOLN 1106.43
4100610
TIERRA DEL MAR WATER
COMPANY BELTZ CREEK TILLAMOOK 160.06
4100624 PHILOMATH PUBLIC WORKS MARY'S RIVER BENTON 85972.99
4100670 PORT ORFORD, CITY OF HUBBARD CR. & GARRISON LAKE CURRY 2845.60
4100672 POWERS, CITY OF S. FORK COQUILLE R. & BINGHAM CR. COOS 94207.20
4100689 RAINIER WATER DEPARTMENT COLUMBIA R. & FOX CR. COLUMBIA 44917.84
4100699 REEDSPORT, CITY OF CLEAR LAKE DOUGLAS 1382.96
4100706 RIDDLE, CITY OF COW CREEK DOUGLAS 192495.04
4100707
LAWSON ACRES WATER
ASSOCIATION COW CREEK DOUGLAS 7025.14
4100708 ROCKAWAY BEACH WATER DEPT JETTY CREEK TILLAMOOK 1310.52
4100712 ROGUE RIVER, CITY OF ROGUE RIVER JACKSON 69007.97
4100717 ROBERTS CREEK WATER DISTRICT S. UMPQUA RIVER DOUGLAS 3094.75
4100719
UMPQUA BASIN WATER
ASSOCIATION N. UMPQUA RIVER DOUGLAS 33475.75
4100720 ROSEBURG, CITY OF - WINCHESTER N. UMPQUA RIVER DOUGLAS 131134.54
4100731 SALEM PUBLIC WORKS N. SANTIAM RIVER & IG MARION 17149.09
4100792 SCAPPOOSE, CITY OF
GOURLEY, LAZY, & S.FK SCAPPOOSE
CR COLUMBIA 6059.81
4100799 SEASIDE WATER DEPARTMENT NECANICUM R. CLATSOP 30069.02
4100802
ARCH CAPE WATER SERVICE
DISTRICT ASBURY & SHARK CR. CLATSOP 1249.34
4100808 COUNTRY VIEW MH ESTATES ROGUE RIVER JACKSON 734031.45
4100811 SHERIDAN, CITY OF SOUTH YAMHILL RIVER YAMHILL 135375.06
4100821 SILETZ, CITY OF SILETZ R. & TANGERMAN CR. LINCOLN 131836.17
4100843 STAYTON WATER SUPPLY NORTH SANTIAM RIVER MARION 4535.87
4100847 SUTHERLIN, CITY OF CALAPOOYA & COOPER CR. DOUGLAS 57605.19
4100893 TILLAMOOK WATER COMMISSION KILLAM & FAWCETT CR. TILLAMOOK 6176.20
4100898 TIMBER WATER ASSOCIATION NEHALEM RIVER WASHINGTON 7787.26
4100899 TOLEDO WATER UTILITIES MILL CR. & SILETZ R. LINCOLN 2680.81
4100922 VERNONIA, CITY OF ROCK CREEK COLUMBIA 3561.18
4100925 S.W. LINCOLN COUNTY WTR. DIST. BIG, VINGIE, STARR, DICK‟S FORK CR. LINCOLN 3451.89
4100926 WALDPORT, CITY OF ECKMAN & WEIST CR. LINCOLN 3186.26
4100932 WARRENTON WATER SYSTEM LEWIS&CLARK R. CAMP C CR. CLATSOP 18375.81
4100950 WESTPORT WATER ASSOCIATION WEST CREEK CLATSOP 1326.04
4100952 WHEELER WATER DISTRICT VOSBURG & JARVIS CR. TILLAMOOK 365.23
4100953 CITY OF WILLAMINA WATER DEPARTMENT WILLAMINA CREEK YAMHILL 52478.62
4100954 WILSONVILLE, CITY OF WILLAMETTE RIVER CLACKAMAS 1050979.75
4100957
WINSTON-DILLARD WATER
DISTRICT SOUTH UMPQUA RIVER DOUGLAS 111553.38
4100958 YONCALLA, CITY OF ADAMS & WILSON CR. DOUGLAS 1676.22
4100966 YACHATS, CITY OF SALMON & REEDY CR. LINCOLN 773.12
4100968 YAMHILL, CITY OF TURNER CREEK YAMHILL 2916.76
4100970 NESKOWIN REGIONAL WD HAWK CREEK TILLAMOOK 1542.70
4100971 CITY OF CAVE JUNCTION EAST FORK ILLINOIS RIVER JOSEPHINE 148775.61

51
Turbidity Analysis for Oregon Public Water Systems
4100985 HILLSBORO-CHERRY GROVE TUALATIN RIVER WASHINGTON 15565.00
4101012 PP&L-TOKETEE VILLAGE TOKETEE LAKE (N. UMPQUA) DOUGLAS 224207.72
4101062 RAINBOW ROCK VILLAGE MHP TAYLOR CREEK WELLS CURRY 1039.25
4101072
JOHNSON CREEK WATER SERVICE
CO JOHNSON CREEK LINCOLN 660.07
4101092 USFS TILLER RANGER STATION SOUTH UMPQUA RIVER DOUGLAS 288525.43
4101095 USFS WOLF CREEK JOB CORPS LITTLE RIVER DOUGLAS 57801.95
4101139 MIDLAND WATER ASSOCIATION GRAHAM CREEK COLUMBIA 988.93
4101174 BUELL-RED PRAIRIE WATER ASSN GOOSENECK CREEK POLK 1057.58
4101361 RAINBOW ROCK CONDOMINIUMS UNNAMED CREEK CURRY 155.21
4101483 ANGLERS COVE/SCHWC ROGUE RIVER JACKSON 10705.24
4105246
PGE BEAVER GENERATING
STATION COLUMBIA RIVER COLUMBIA 57081.64
4105581 WEISS ESTATES WATER SYSTEM FAHY'S LAKE COOS 1028.96
4105737 BERNDT CREEK WATER CORP ROCK CREEK COLUMBIA 35304.09
4190416 FORT JAMES OPERATING COMPANY COLUMBIA RIVER COLUMBIA 87190.52
4192139 TILLER ELEMENTARY, SD #15 SOUTH UMPQUA RIVER DOUGLAS 54986.13
4192152 POPE & TALBOT, INC., WILLAMETTE RIVER LANE 528459.96
4192674 USFS STAR RANGER STATION APPLEGATE RIVER JACKSON 178577.82
4194300
ROSEBURG FOREST PROD-
DILLARD SOUTH UMPQUA RIVER DOUGLAS 28863.00
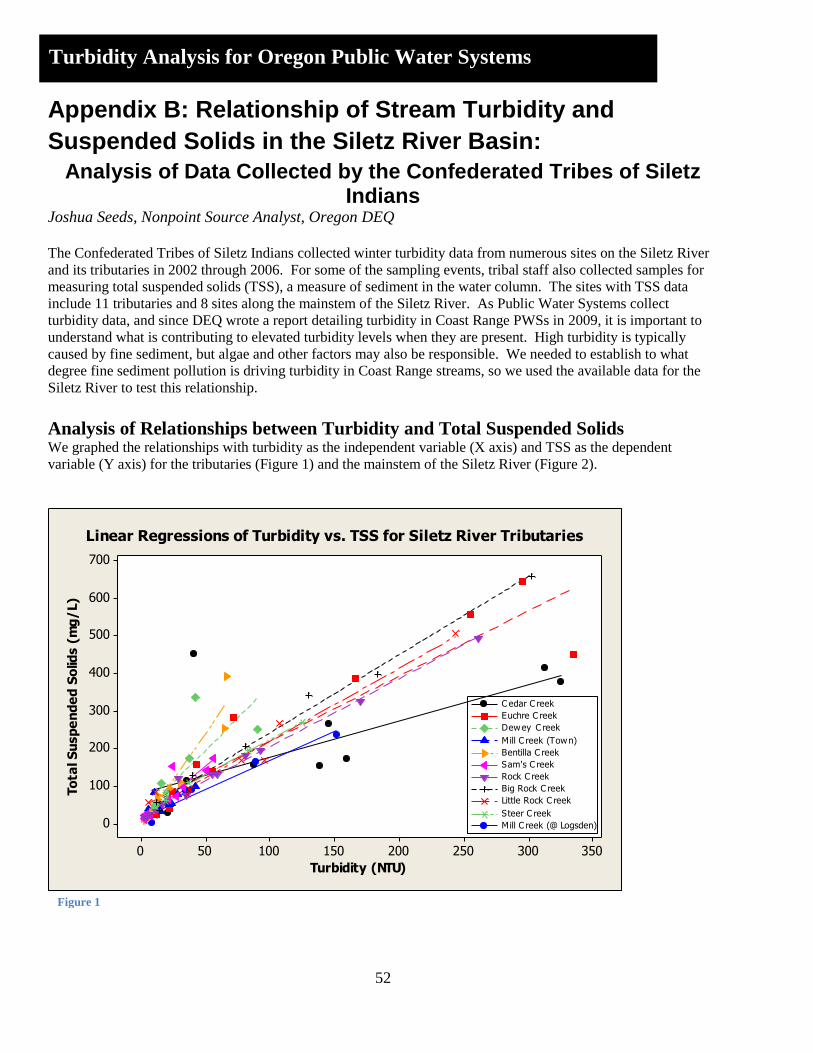
52
Turbidity Analysis for Oregon Public Water Systems
Appendix B: Relationship of Stream Turbidity and
Suspended Solids in the Siletz River Basin:
Analysis of Data Collected by the Confederated Tribes of Siletz Indians
Joshua Seeds, Nonpoint Source Analyst, Oregon DEQ
The Confederated Tribes of Siletz Indians collected winter turbidity data from numerous sites on the Siletz River
and its tributaries in 2002 through 2006. For some of the sampling events, tribal staff also collected samples for
measuring total suspended solids (TSS), a measure of sediment in the water column. The sites with TSS data
include 11 tributaries and 8 sites along the mainstem of the Siletz River. As Public Water Systems collect
turbidity data, and since DEQ wrote a report detailing turbidity in Coast Range PWSs in 2009, it is important to
understand what is contributing to elevated turbidity levels when they are present. High turbidity is typically
caused by fine sediment, but algae and other factors may also be responsible. We needed to establish to what
degree fine sediment pollution is driving turbidity in Coast Range streams, so we used the available data for the
Siletz River to test this relationship.
Analysis of Relationships between Turbidity and Total Suspended Solids
We graphed the relationships with turbidity as the independent variable (X axis) and TSS as the dependent
variable (Y axis) for the tributaries (Figure 1) and the mainstem of the Siletz River (Figure 2).
350300250200150100500
700
600
500
400
300
200
100
0
Turbidity (NTU)
To
tal S
usp
en
de
d S
olid
s (
mg
/L)
Steer C reek
Mill C reek (@ Logsden)
C edar C reek
Euchre C reek
Dewey C reek
Mill C reek (Town)
Bentilla C reek
Sam's C reek
Rock C reek
Big Rock C reek
Little Rock C reek
Linear Regressions of Turbidity vs. TSS for Siletz River Tributaries
Figure 1

53
Turbidity Analysis for Oregon Public Water Systems
300250200150100500
500
400
300
200
100
0
Turbidity (NTU)
To
tal S
usp
en
de
d S
olid
s (
mg
/L)
Below C edar C reek
@O jalla Bridge
@Green Bridge
@Town Bridge
@Tw in Bridge
@Wildcat Bridge
@Logsden Bridge
@ Ly le Yeck's Property
Linear Regressions of Turbidity vs. TSS for Siletz River Sites
DEQ then graphed and analyzed the data using least-squares regressions to evaluate the relationship between
turbidity and TSS in the Siletz River basin. We evaluated the combined data in three different groups: the pooled
tributaries, the pooled mainstem sites, and both tributaries and mainstem sites (the whole system).
To insure the validity of the least-squares regression analysis, we needed to make sure that the assumption that
data are normally distributed was met. Least-squares regressions can be especially sensitive to outliers that skew
the line and give a false impression of its accuracy. Histograms of turbidity and TSS for the three groups all show
lognormal distributions for the data sets (Figures 3-8). Analysis using a Ryan-Joiner test for normality confirms
that transforming the data with a
base10 logarithm results in normal distributions for all the variables except TSS for the tributaries (Figure 4).
Because the data appear lognormally distributed, the likelihood that failure of the normality test is due to a couple
outliers, and other data transformations did not result in a normal distribution, we proceeded with the regression
on the tributary data in addition to the other two groups.
560480400320240160800
60
50
40
30
20
10
0
Turbidity (NTU)
Fre
qu
en
cy
Loc 3.235
Scale 1.341
N 109
Lognormal
Histogram of Turbidity in Siletz River Tributaries
120010008006004002000
50
40
30
20
10
0
Total Suspended Solids (mg/L)
Fre
qu
en
cy
Loc 4.348
Scale 1.171
N 109
Lognormal
Histogram of TSS in Siletz River Tributaries
Figure 2
Figure 3 Figure 4
Figure 6
Figure 8

54
Turbidity Analysis for Oregon Public Water Systems
120010008006004002000
70
60
50
40
30
20
10
0
Total Suspended Solids (mg/L)
Fre
qu
en
cy
Loc 4.373
Scale 1.165
N 157
Lognormal
Histogram of TSS in Siletz River System
The least-squares regressions on the log transformed data for the tributaries, the mainstem, and the whole stream
system show high correlations between turbidity and TSS (R2=81.4%, 89.9%, 82.5%, respectively; Figures 9-11).
The accuracy of the regression is excellent for the lower and middle reaches of the river (Figure 10). Confidence
and prediction intervals are narrow at the lower end of the turbidity and TSS ranges, but widen greatly near the
upper end of the range, showing less certainty about values at the upper end of the ranges. Therefore, turbidity is
a good predictor of the combined organic and mineral suspended solids in the Siletz River system, but caution
must be used in translating turbidity values into TSS at turbidities greater than 100 or 150 NTU.
630540450360270180900
25
20
15
10
5
0
Turbidity (NTU)
Fre
qu
en
cy
Loc 3.694
Scale 1.231
N 48
Lognormal
Histogram of Turbidity in Siletz River Sites
126010809007205403601800
25
20
15
10
5
0
Total Suspended Solids (mg/L)
Fre
qu
en
cy
Loc 4.431
Scale 1.163
N 48
Lognormal
Histogram of TSS in Siletz River Sites
6005004003002001000
80
70
60
50
40
30
20
10
0
Turbidity (NTU)
Fre
qu
en
cy
Loc 3.376
Scale 1.322
N 157
Lognormal
Histogram of Turbidity in Siletz River SystemFigure 7
Figure 5 Figure 6
Figure 8
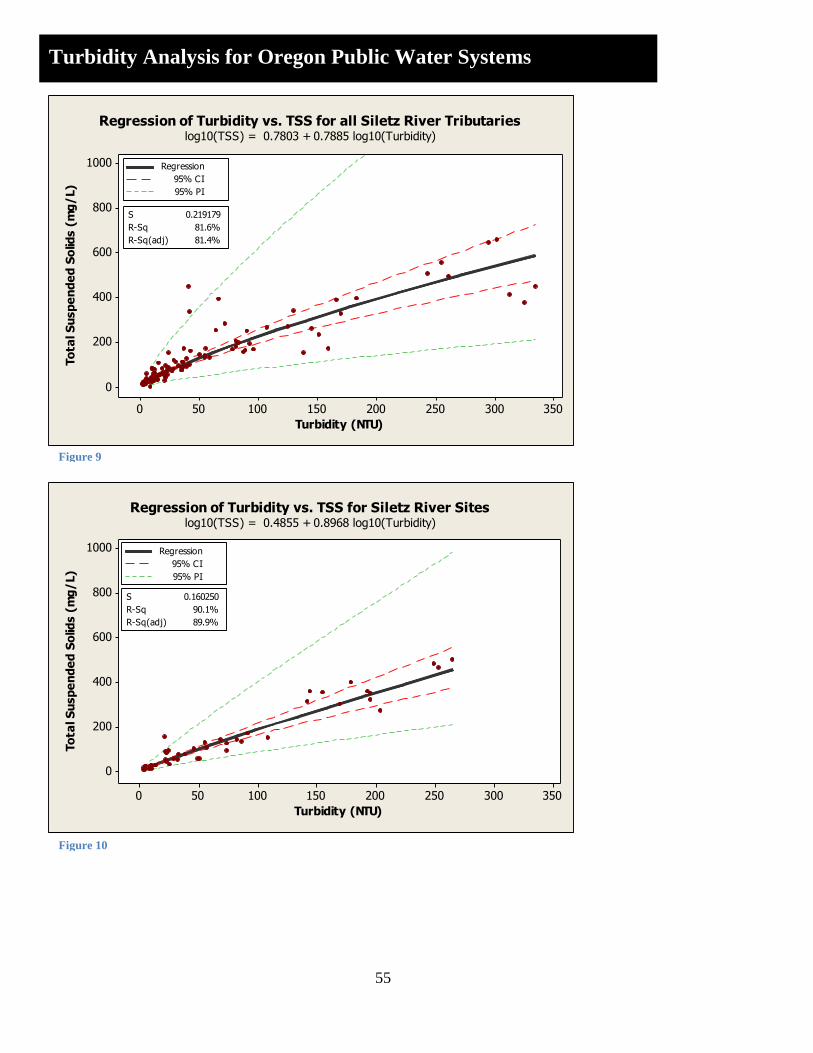
55
Turbidity Analysis for Oregon Public Water Systems
350300250200150100500
1000
800
600
400
200
0
Turbidity (NTU)
To
tal S
usp
en
de
d S
olid
s (
mg
/L)
S 0.219179
R-Sq 81.6%
R-Sq(adj) 81.4%
Regression
95% CI
95% PI
Regression of Turbidity vs. TSS for all Siletz River Tributarieslog10(TSS) = 0.7803 + 0.7885 log10(Turbidity)
350300250200150100500
1000
800
600
400
200
0
Turbidity (NTU)
To
tal S
usp
en
de
d S
olid
s (
mg
/L)
S 0.160250
R-Sq 90.1%
R-Sq(adj) 89.9%
Regression
95% CI
95% PI
Regression of Turbidity vs. TSS for Siletz River Siteslog10(TSS) = 0.4855 + 0.8968 log10(Turbidity)
Figure 9
Figure 10

56
Turbidity Analysis for Oregon Public Water Systems
350300250200150100500
1000
800
600
400
200
0
Turbidity (NTU)
To
tal S
usp
en
de
d S
olid
s (
mg
/L)
S 0.211880
R-Sq 82.6%
R-Sq(adj) 82.5%
Regression
95% CI
95% PI
Regression of Turbidity vs. TSS for Siletz River Systemlog10(TSS) = 0.7247 + 0.8012 log10(Turbidity)
Two tributaries of the Siletz River (Dewey and Bentilla
Creeks) have much steeper slopes to their TSS vs.
Turbidity lines, seen in Figure 1. Cedar Creek also has an
outlier near the Dewey and Bentilla data. An analysis of
variance on the logarithm-transformed ratio of TSS-to-
Turbidity showed a statistically significant difference
among sites (F=3.13, p<0.001). Bentilla and Dewey
Creeks do indeed have the highest mean ratios, but Little
Rock Creek, Mill Creek (near the City of Siletz), and
Sam‟s Creek also have higher than average TSS:Turbidity
ratios.
ANOVA: TSS:Turbidity by Site
Source DF SS MS F P
Sites 18 13.80 0.767 3.13 0.000
Error 138 33.85 0.245
Total 156 47.66
S = 0.4953 R-Sq = 29.0% R-Sq(adj) = 19.7%
Figure 11
Yecks
Stee
r Cr
Sams Cr
Rock C
r
Mill
Cr (To
wn)
Mil l Cr (
Logs
den)
Little
Roc
k Cr
Euch
re C
r
Dewey
Cr
Ceda
r Cr
Big Ro
ck C
r
Bentilla Cr
Below Ced
ar
@Wild
cat B
r
@Tw
in Br
@To
wn Br
@Ojalla
Br
@Lo
gsde
n Br
@Gr
een Br
7
6
5
4
3
2
1
0
TS
S:T
urb
idit
y R
ati
o
95% CI for the Mean
Interval Plot of TSS-to-Turbidity Ratio for Siletz River & Tributaries
Figure 12

57
Turbidity Analysis for Oregon Public Water Systems
Possible explanations for these
differences in sediment characteristics
among sites include soil type,
differences in road surfacing or
density, land use differences, or a
lower proportion of organic sediments
in the total sediment in the stream. A
USGS report (Madej et al 2002)
indicates that organic sediments stay
suspended in the water column and
thereby contribute more to turbidity
than mineral sediments of the same
size. Some of the TSS samples
collected by the tribe were analyzed
for mineral and organic content. We
plotted the percent of organic matter in
TSS samples with that samples
TSS:Turbidity ratio to see if there was
a clear pattern, but no relationship exists (Figure 13). Soil type or other factors are therefore more likely to drive
patterns in relationship between TSS and turbidity in the Siletz River watershed.
Conclusions Turbidity is a useful predictor of sediment mass loads in the Siletz River and tributaries. I recommend using the
regression equation for the whole system when estimating sediment loads(Figure 11), as the results are based on
greater amounts of data and are thereby more robust. The equation from mainstem sites could be used on the
middle and lower reaches of the mainstem where most of the mainstem sample sites were located (Figure 10).
Caution should be used when applying the regression equations in the uppermost portions of the basin (above
Gravel Creek or in the North and South Forks) because there are no TSS data for this part of the basin. Caution
should also be used when turbidities exceed 100 NTU. Some tributaries (such as Bentilla and Dewey Creeks)
have anomalous TSS-to-Turbidity relationships, so it may be necessary to derive individual regression equations
for those streams.
References:
Madej, MA, M Wilzbach, K Cummins, C Ellis, and S Hadden. 2002. The contribution of suspended organic sediments to
turbidity and sediment flux. Turbidity and Other Sediment Surrogates Workshop, Reno, NV.
Figure 13
1009080706050403020
10
8
6
4
2
0
% Organic Matter in TSS
TS
S (
mg
/L):
Tu
rbid
ity
(N
TU
)
Tributaries
Mainstem
Comparison of % Organic Matter in TSS and the TSS:Turbidity Ratio


![Appearance and Water Quality] of Turbidity Plumes Produced by ...](https://static.fdocuments.in/doc/165x107/58a184031a28ab1f238b68e3/appearance-and-water-quality-of-turbidity-plumes-produced-by-.jpg)


