
SMART WATER TURBIDITY ANALYSER. - 122.129.122.220
42
POLITEKNIK SULTAN SALAHUDDIN ABDUL AZIZ SHAH. SMART WATER TURBIDITY ANALYSER. NAME MATRIX NUM PRAKASH KUMAR A/L ARUMUGAM 08DJK17F1152 DEPARTMENT OF ELECTRICAL ENGINEERING JUNE 2019
Transcript of SMART WATER TURBIDITY ANALYSER. - 122.129.122.220

POLITEKNIK SULTAN SALAHUDDIN ABDUL AZIZ
SHAH.
SMART WATER TURBIDITY ANALYSER.
NAME MATRIX NUM
PRAKASH KUMAR A/L ARUMUGAM 08DJK17F1152
DEPARTMENT OF ELECTRICAL ENGINEERING
JUNE 2019

POLITEKNIK SULTAN SALAHUDDIN ABDUL AZIZ
SHAH.
SMART WATER TURBIDITY ANALYSER.
NAME MATRIX NUM
PRAKASH KUMAR A/L ARUMUGAM 08DJK17F1152
This report is submitted to the Department of
Electrical Engineering in fulfillment of the
requirements of the Diploma in Electronic
Engineering (Control).
DEPARTMENT OF ELECTRICAL ENGINEERING
JUN 2019

OATHS OF ORIGINALITY AND RIGHTS RESERVED
TITLE : SMART WATER TURBIDITY ANALYSER
SESSION : JUNE 2019
a) WE, 1. PRAKASH KUMAR A/L ARUMUGAM
2. SRIDHARAN A/L RAMAKRISHNAN
are last semester students pursuit Diploma in Electrical
Engineering (control), Department of Electrical Engineering,
Polytechnic Sultan Salahuddin Abdul Aziz Shah, which located
at Persiaran Ushawan, 40150, Shah Alam, Selangor Darul Ehsan
b) We acknowledge that 'The project above' and the
intellectual property therein is the work of our original
works / creations without taking and imitating any
intellectual property from the other parties.
c) We agree to transfer the intellectual property ownership of
'The Project' to 'the Polytechnic' in order to fulfill the
requirement for us to confer a Diploma in Electronic
Engineering (Control) upon us.
Made and in fact ;)
acknowledged by such ;)

)
a) PRAKASH KUMAR A/L ) ……………….
ARUMUGAM ) PRAKASH
(NRIC:- 970718-10-5045 ) KUMAR
)
)
)
b) SRIDHARAN A/L ) ………………
RAMAKRISHNAN ) SRIDHARAN
(NRIC:- 991119-10-6591 )
at……….. on………..
In front of, MARDIANA BINTI ) .………………
HARUN (NRIC:-790829-01-6362) ) MARDIANA
as a supervisor project on ) BINTI HARON
date ……….

CONFIRMATION.
I declare that this report entitled “Water Quality Monitoring System
Using IOT” is the result of my own research except as cited in the
references. The report has not been accepted for any diploma and is not
concurrently submitted in candidature of any other diploma.
Signature : ……………………………….
Name : PRAKASH KUMAR S/O ARUMUGAM
Date : …………………………

DECLARATION
“I hereby declare that I have read through this report
entitle “Smart Water turbidity Analyser” and found that it
has comply the partial fulfilment for awarding the
Diploma in Electronic Engineering (Control).
Signature : ………………………………
Supervisor’s Name : PN. MARDIANA BT HARON
Date : ………………………………

ACKNOWLEDGEMENT
I hereby would like to take this opportunity to thank all persons who has
involved generously in helping me and assisting me while I was
completing the Final Year Report (FYP) which is a compulsory to all
Polytechnic Sultan Salahuddin Abdul Aziz Shah (PSA) students in order
to complete our diploma.
I would firstly to express my deepest gratitude and thanks to my project
supervisor, Madam Mardiana Binti Haron for her undivided support
morally and physically, assistance, guidance, tolerance, which proved to
be invaluable as to completion my Final Year Project (FYP).
I also would like to thank the panel, Mrs. Noranizah Binti Sarbani, Mr
Ahmad Aftaz Bin Azman and Mr. Khairul Ariffin Bin Jamaluddin, whose
give me a good comment during my presentation. I also would like to
take this opportunity to express my appreciation to my family and friends
for their patients, understanding and also for their undivided support that
they had gave me throughout the completion of my project.
Last but not least, i also would like to thank all those helping and
supporting me during my Final Year Project (FYP).

Abstract.
Turbidity is an important indicator of the amount of suspended sediment
in water, which can have many negative effects on aquatic life. The
suspended sediments that cause turbidity can block light to aquatic plants,
smother aquatic organisms, and carry contaminants and pathogens, such
as lead, mercury, and bacteria. The initiative is to introduce the new smart
water turbidity analyser which is capable to identify turbidity value of the
water. The smart water turbidity analyser is usually designed to send
backwash alert to the customer that it need to be backwash when the
water quality is unhealthy to consume. The World Health Organization,
establishes that the turbidity of drinking water should not be more than 5
NTU, and should ideally be below 1 NTU. The perception behind the
research is to identify the vitality of clean water usage through this
monitoring device among the community and also to prevent the water
filter customers to backwash only when the water is unhealthy to
consume. Hence, this devices plays an important role among the
community.

TABLE OF CONTENTS.
CHAPTERS TOPICS PAGES
OATHS OF ORIGINALITY AND
RIGHTS RESERVED.
ACKNOWLEDGEMENT
ABSTRACT
TABLE OF CONTENT
LIST OF TABLE
LIST OF FIGURE / DIAGRAM
LISTS OF SYMBOLS AND ABREVIATIONS
1. INTRODUCTION
1.1.INTODUCTION
1.2.RESEARCH BACKGROUND
1.3.PROBLEM STATEMENT
1.4.OBJECTIVES OF RESEARCH
1.5.ISSUES OF RESEARCH
1.6.SCOPE OF RESEARCH
1.7.FUNDAMENTALS OF RESEARCH
1.8.OPERATIONS OF RESEARCH
1.9.SUMMARY
2. LITREATURE REVIEW
2.1. INTRODUCTION
2.2. CONCEPT OF THEORY
2.3. PREVIOUS RESEARCH
2.4. SUMMARY

3. METHODOLOGY OF RESEARCH
3.1.INTRODUCTION
3.2.HARDWARE DESIGN OF THE RESEARCH
3.3.METHODS OF GAINING INFORMATION
3.4.INSTRUMENT OF RESEARCH
3.5.SAMPLING TECHNIQUE
3.6.DATA ANALYSIS METHOD
3.7.SUMMARY
4. RESULTS
4.1.INTRODUCTIONS
4.2.RESULTS AND ANALYSIS
4.3.SUMMARY
5. DISCUSSIONS
5.1.INTRODUCTIONS
5.2.DISCUSSIONS
5.3.CONCLUSION
5.4.IMPLICATIONS OF RESEARCH
5.5.SUGGESTIONS OR IDEAS
5.6.SUMMARY
REFERENCES
ATTACHEMENTS

LISTS OF TABLES
1. Table 1.0
2. Table 2.0
3. Table 3.0
4. Table 4.0
5. Table 5.0

LISTS OF FIGURES OF DIAGRAM
1. Diagram 1= Flow Chart of Operation
2. Figure 1 = Water quality analyser system
3. Figure 2: Stationary nephelometers for industry purpose.
4. Figure 3. Water sample before tested.
5. Figure 4: Water quantity and quality monitoring prototype.
6. Figure 5: Nephelometer in water treatment centre.
7. Figure 6: Portable Nephelometer.
8. Diagram 2: Flow Chart Of system.
9. Figure 7 & 8 Hardware prototype with its sketch.
10. Figure 8 & 9: Hardware working mechanism.
11. Figure 10: Connections of Battery
12. Figure 11 & 12: connections of LCD and Arduino.
13. Figure 13: Connection of turbidity sensor.
14. Figure 14: Internal View.
15. Figure 15: External View.
16. Diagram 3: Pooling results on Pie chart.
17. Figure 16 & 17: Results shown during result and analysis portion.
18. Diagram 4: Block Diagram

LISTS OF SYMBOLS AND ABREVIATIONS.
1. Arduino Arduino nano
2. LCD Liquid crystal display
3. NTU Nephelometeric
Turbidity Unit
4. IOT Internet Of Things
5. WM Wifi-Modulator.
1.0 Project Plan.
1.1 Introduction.
Turbidity is measured by evaluating the amount of light scattered in
water. This can be done with simple visual assessments, such as the
original Jackson Candle turbidity meter, or more accurate, technological
methods, such as the nephelometric method. Turbidity is an indicator of
suspended matter or sediment. By itself, the greater the turbidity, the less
the ability of sunlight to percolate to aquatic plants. The suspended
sediments can also smother the different forms of aquatic life.
If the suspended sediment contains pathogens and/or toxic chemicals, that
will affect aquatic life too. Turbidity in fresh water also affects those non-
aquatic life forms who consume that water. Suspended materials in water,
such as clay, silt, and algae, reduce water clarity and cause turbidity.
The benefits of using a water quality monitoring system using IOT, since
this device is placed after the filter it can avoid customers using unclean
water by sending customers alert with its NTU (Nephelometric Turbidity
units). This notification is acts as a reminder to the customer to backwash.
The attached LCD screen shows the NTU values which the customers can
check the water quality manually. Moreover this brings a major advantage
for the individual whom faced difficulty in remembering the backwash
day of their water filter. It is because once the water quality is unhealthy,
the device sends alert to customer for backwash the water filter instantly.
1.2 Problem statement
We had a survey regarding the water filter and the backwash of the filter
in certain residential areas. Throughout the investigation we we able to
find the most of the water filter users facing trouble in remembering the
backwash day of a filter. They Often forget the backwash day due to their
busy schedule. Furthermore they themselves cannot predict the backwash
day approximately. Regarding this issue the customers were had a way to
backwash their water filter regularly for 2 till 4 weeks. However there’s
no visible differences between the filtrate water. In this case they have to
spend money for the backwash of the water filter.
In addition to that the insufficient knowledge of customer on water
quality is one of the major problem. It’s because the individuals

nowadays willing to spend money on their health related issues but
they’re lack of health science knowledge. Similarly the individuals were
financially able to fix water filter at their residences but their knowledge
based on the quality is a quite lacking.
1.3 OBJECTIVE OF RESEARCH
Send customers an alert through message via sms and mail with its
(NTU) Nephelometric Turbidity units.
Attached LCD screen shows the NTU values which enables
customers to check out manually.
Avoid customers using the unclean water.
1.4 ISSUES REVOLVED
I. The mechanical structure must be capable for transfusion of water
molecules. So that easy to detect the water quality spontaneously.
II. The sensor must be efficient as well as its programs were work
according to its input commands and the expected output were
portrays using IOT mechanism.
III. The materials must be free from corrosion. So that the
manufacturing components were free from corrosion and the
particles disallowed into water molecules though chemically.
1.5 SCOPE OF RESEARCH
The scope were defined into the customers who used water treatment and
purifier system at their house. The limitations were referred to its
software programming where it only sense the turbidity of water. The
sensing elements made of eco-friendly substances and materials. The pre-
filter portions consists of sensing elements were it act as signal generator.
1.6 FUNDAMENTALS OF RESEARCH.
I. Alerts the customers and educate them with a basic knowledge of
water treatment and purify methods.
II. Prevents customers from using the polluted water for their
domestic uses.

III. Implementation of internet off things (IOT) in heath science
sectors.
1.7 OPERATION OF RESEARCH
The turbidity sensor is used to detect the haziness of water in form of
NTU value and it send the signal through the electronic connections of
arduino circuit. When the haziness were cross or reach the limit
programmed the system were detect the signal from sensor and send it to
customers phone through message or mail.
Diagram 1. Flow chart of operation
SUMMARY
The backwash alert mechanism was aid to send remember messages to
the customers that the water used was still contains dirt and haziness.
2.0 LITEREATURE REVIEW.
2.1 INTRODUCTION.
A smart system of high-precision water quality analyser that include
turbidity meters, accompanied by effective methods of chemical dosing
and filtration as well as a sophisticated alert system, municipal water
treatment systems are able to correct the water quality and make it safe
for drinking and other uses. In some cases of particularly high turbidity
registered in the water, a decision might be made to halt pumping from
the river or lake source, not to treat water that does not meet minimal
standards or to terminate treatment that is not cost effective.
2.2 CONCEPT OR THEORY
A Closed-loop Control System, also known as a feedback control
system is a control system which uses the concept of an open loop system
as its forward path but has one or more feedback loops (hence its name)
or paths between its output and its input. The reference to “feedback”,
simply means that some portion of the output is returned “back” to the
input to form part of the systems excitation.
Closed-loop systems are designed to automatically achieve and maintain
the desired output condition by comparing it with the actual condition. It
does this by generating an error signal which is the difference between the
output and the reference input. In other words, a “closed-loop system” is a
fully automatic control system in which its control action being dependent
on the output in some way.
2.3 PREVIOUS RESEARCH
The measurement of turbidity is a key test of water quality.
Nephelometers, or nephelometric turbidimeters, measure the light
scattered at an angle of 90° by one detector from the incident light beam
generated by an incandescent light bulb. Readings are reported in
Nephelometric Turbidity Units, or NTUs

2.3.1 Nephelometers applocations and researches.
Figure 1. Water quality analyser system
Figure 2: Stationary nephelometers for industry purpose
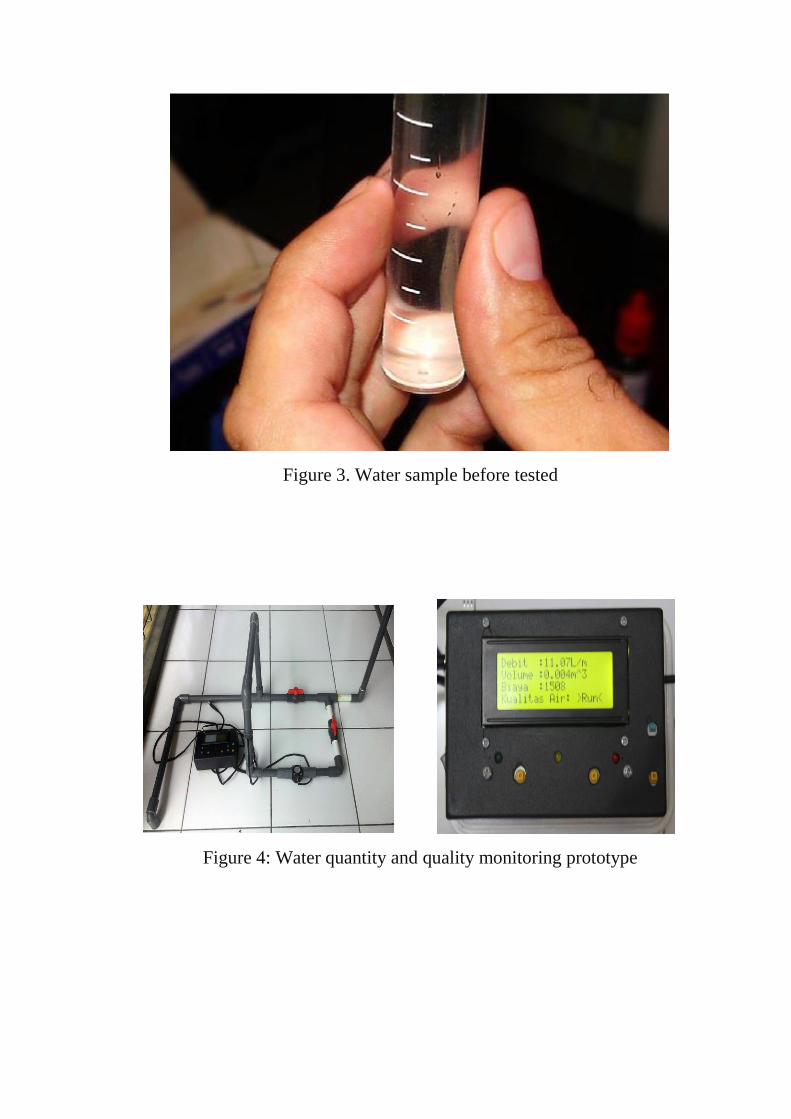
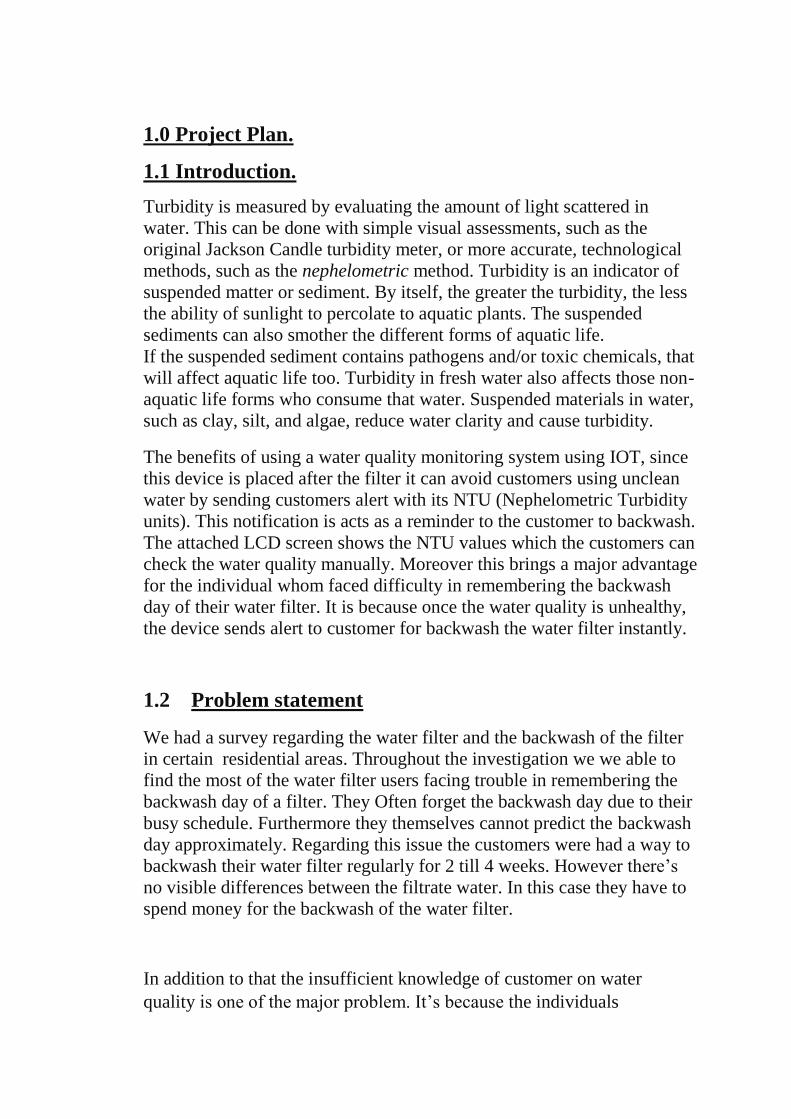
Figure 3. Water sample before tested
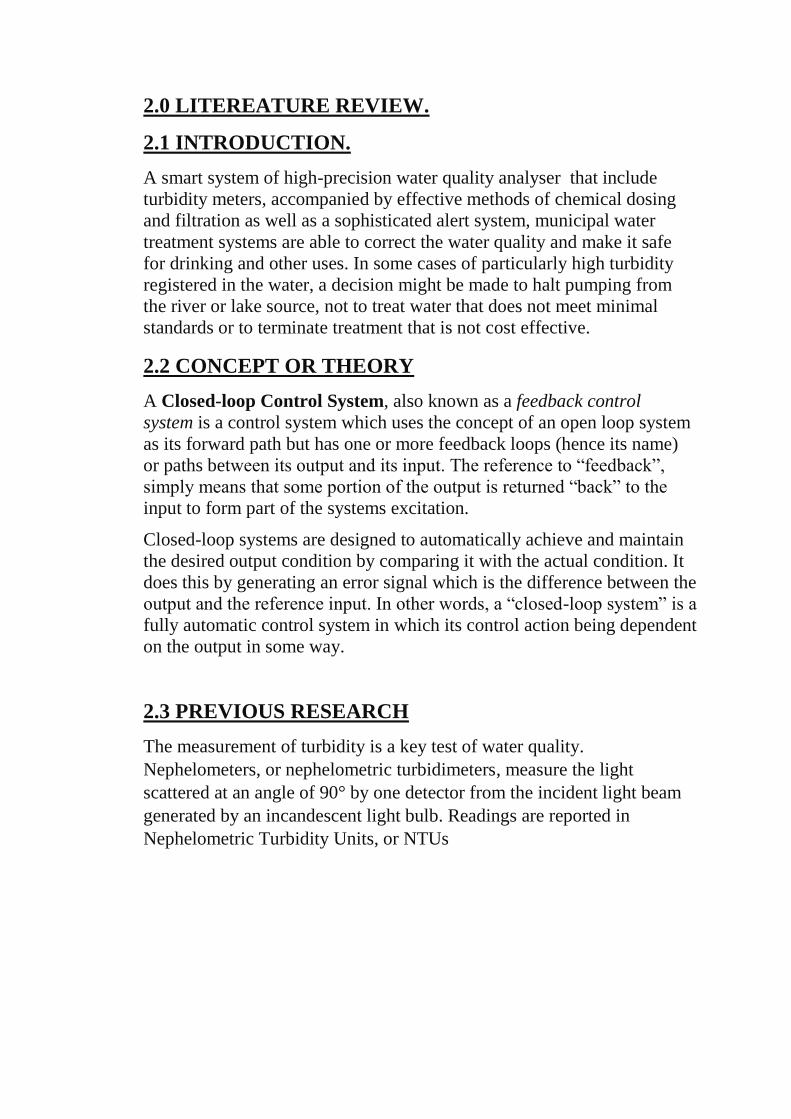
Figure 4: Water quantity and quality monitoring prototype

Figure 5: Nephelometer in water treatment centre.
Figure 6: Portable Nephelometer.

2.4 TOPIC SUMMARY
The working operation of the turbidity sensor alert for backwash was
illustrated in form of basic flow chart and block diagram. Those
mechanisms were described as well as it’s theoretical statements. The
previous research or inventions found on market were shown as an
example for reference purpose.

3.0 Methodology of research
3.1 Introduction.
A system of method used in the project was the basic knowledge of
turbidity which portrays, the water which used for domestic uses must
have 5 NTU value or less. Turbidity of more than it would be noticed by
the turbidity sensor and send alert to customer’s mobile by e-mail and
sms. The NTU/JTU value on a filter cylinder is changed when it never
backwash or delay in backwash.
Diagram 2: Flow Chart Of system
3.1.1 HARDWARE DESIGN OF THE RESEARCH.
There are internal and external parts of the devices were sketched. The
combination of the sensor with filter also attached.

Figure 7 & 8 Hardware prototype with its sketch.
Figure 8 & 9: Hardware working mechanism

Components used for hardware design
1. Title : Turbidity sensor
Description : System includes the capability to detect the NTU values
and give a digital output of suspended particles when it is placed on water
2. Title : Arduino Nano
Description : System includes the microcontroller which usually
comes with Arduino Uno. This microcontroller reads the reading from the
sensor and controls the overall system.
Version : Version 1.0

3. Title : Hitachi LCD 16x2
Description : System includes the LCD interface for the user, which
displays the reading taken by the different sensors in the system.
Version : Version 1.0

Hardware design
use 12volt battery to operate the entire turbidity sensor and the
system
Figure 10: Connections of Battery
Connecting LCD to Arduino
Connect LCD GND to GND.
Connect LCD SCL to Arduino A5.
Connect LCD SDA to Arduino A4.
LCD VCC to Arduino 5V
Figure 11 & 12: connections of LCD and Arduino

• Connecting turbidity sensor to the arduino.
I. Connect the two pins from the Sensor to the two pins on the
Amplifier circuit via hook up wires.
Figure 13: Connection of turbidity sensor
Casing connections.
The casing was all fitted to the arduino and GSM board.
The Sensor is Set up to partially floated in water in order to get
correct NTU values

Figure 14: Internal View
Figure 15: External View
3.2. METHODS OF GAINING INFORMATION.
A close observation and analysis was made by myself and my group
member regarding this issue. We clearly compare it ourself of the water
quality before and after backwash. We also able to gain information from
other reliable sources like newspapers, internet news, in form of bar charts
and graphs. Furthermore we, often do discussion with supervisor and the
project’s specifications were modified.
3.3 . INSTRUMENT OF RESEARCH.
A sample polling was carried out among the customer who having the water
filter and nearly we found 69% of them often forget the deadline of the
backwash day and some said they frequently backwash and it costs
expensive. Some said only when the water odour or colour change.

Diagram 3: Pooling results on Pie chart
3.4 . SAMPLING TECHNIQUE
The main target for the device were the customers who using water filter
and purifier and also for those who having the water storage tank. The
probability of the device marketing is obviously very high and demanding.
Its because some dangerous illness were results of un-treated water.
3.5 . DATA ANALYSIS METHOD.
To make easier and convenient we use the flow chart and graphical items
in order to capture and analyse the improvisation of the device. Its easier to
understand the progress and manage to predict the output easier. The
interviews and polling were taken and assume in form of percentage so that
we able to demonstrate in form of graphics.
3.6 . SUMMARY
Through this methodological research we were able to understand the
demand or the hype for the device and the potential this turbidity alert
system for filter backwash in water resource sector.
69%
18%
13%
POOLING RESULT ON PIE CHART
Forgetting backwash day Often backawash Only change when smelly or colour turns bad

4.0 Results and discussion.
4.1 Introduction.
Analysis and discussion were carried out to ensure the project results are
in the desired state without causing any problems along the final year
project. Determining, identifying, selecting and producing an optimal
design in terms of material specifications, criteria, cost and perfect
designing with manufacturing methods were categorised in terms of
project analysis.
These analysis is more focused on project functionality, errors obtained
and delay in operations with its way to reduce were identified. The cost of
materials such as the price of components, equipment, and software costs
used were involved and stated.
4.2 RESULT AND ANALYSIS
1. GSM Module can connects and sends notifications to mobile
phones.
2. Sensor works and detects the NTU of the water
3. Arduino Nano performs at its good.
4. LCD can display the voltage or potential difference with the NTU
value.
5. If the NTU value is optimal or <5.2 there’s no notification send.
6. If the NTU value is beyond 5.2 the notification of "NTU VALUE IS
HIGHER. YOUR FILTER HAVE TO BACKWASH!" is shown.

Figure 16 & 17: Results shown during result and analysis portion.
Figure 18: Picture during tested session.

4.3 SUMMARY.
Throughout the results obtained we can see the whole system is operating
as it designed. Although there’s a little delay in displaying the readings
but there’s no error obtained along the project analysis and presentations.
Diagram 4: Block Diagram

5.0. DISCUSSION AND COCLUSION.
5.1. INTRODUCTIONS
The discussions were made in order to search and provide further
evidences that support our project results. Not only that we were decided
to enhance the its performance as it designated for the future generations.
5.2 DISCUSSIONS
As a discussions we can say that according to the World Health
Organisation’s Standard Drinking water should have a turbidity of 5
NTU/JTU or less. Turbidity of more than 5 NTU/JTU would be noticed
by users and may cause rejection of the supply. Where water is
chlorinated, turbidity should be less than 5 NTU/JTU and preferably less
than 1 NTU/JTU for chlorination to be effective. Hence this Smart Water
Turbidity Analyser able to triggers when the NTU Value is beyond 5.2
(0.2 considered as an uncertainty) is able to use in existing days.
TABLE 1.0

TABLE 2.0
TABLE 3.0

5.3 CONCLUSION
This paper has presented the overall instruments for water turbidity
measurement. This paper has also shown a design which can be
developed through a very simple circuitry which can be implemented as
effective as possible. However, this is achieved by compromising the
resolution of the measurement. A more comprehensive design of Smart
Water Turbidity Analyser has more scope in domestic uses of water.
5.5 IMPLICATIONS OF RESEARCH
The implications of Smart Water Turbidity analyser is vast and sensible.
This is due to nearly all the sectors and industry required water sources
for their daily routine either in domestic or for productions. Thus, the
quantity of water used in daily routine was huge. As long as there’s
demands for clean water, our project holds a place in determining the
NTU values.
5.6 SUGGESTIONS OR IDEAS
As a suggestion we can say that in future, there will be a quality and
motion controller device itself where it automatically control the
movement of water when the water quality is unclean and unhealthy for
daily routine. Hence, the water quality and motion monitoring controller
is a future

5.7 SUMMARY
As a summary we can say that the device is effective in obtaining the
results. The whole system is operating with respect to its design and
program. Although there’s a little delay in displaying the readings but
there’s no error obtained along the project analysis and presentations.

REFERENCES.
Anderson, C. W. (2005). Turbidity. U.S. Geological Survey techniques of
water- resourcesiInvestigations (A6.6). Retrieved from water.usgs.gov
Ankcorn, P. D. (2003). Clarifying turbidity – the potential and limitations
of turbidity as a surrogate for water-quality monitoring. Georgia Water
Resources Conference. Athens, GA: Georgia Water Science Center
Publications.
Coduto, D. P., Yeung, M. R., & Kitch, W. A. (2010). Geotechnical
engineering: Principles and practices. Saddle River, NJ: Prentice Hall.
Lewis, Jack (2007). Comparisons of turbidity data collected with different
instruments. Report on a cooperative agreement between the California
Department of Forestry and Fire Protection and USDA Forest Service--
Pacific Southwest Research Station (PSW Agreement # 06-CO11272133-
041).
Patil, S. S., Barfield, B. J., & Wilber, G. G. (2011). Turbidity modeling
based on the concentration of total suspended solids for stormwater runoff
from construction and development sites. World Environmental and
Water Resources Congress 2011. Palm Springs, FL: ASCE.
Sadar, M. Turbidity measurement: A simple, effective indicator of water
quality change. Retrieved from www.hacchhydromet.com.
United States Environmental Protection Agency. (1999). EPA guidance
manual: Turbidity provisions. Washington, DC: GPO.
United States Environmental Protection Agency. (2011) Industry effluent
guidelines: Construction and development. Retrieved from water.epa.gov
United States Weather Bureau. (1961). Rainfall atlas of the United States.
Technical paper no. 40. Washington, DC: GPO.

Pricing details.
NAME QUANTITY PRICE (RM)
Screwdriver 1 ( Rm 6.20)
Cutter 1 ( Rm 8.00)
Plier 1 ( Rm 6.00)
Wire stripper 1 ( Rm 9.90)
Soldering iron 1 ( Rm 17.00)
3-way corner
elbow pvc fitting
connector (1/2”)
4 (Rm 16.00)
4 x 245 mm long of
½” pvc pipes
4
(Rm 10.00)
Saw 1 ( Rm 3.00)
DIY plastic tub 1 ( Rm 2.00)
Casing 1 (Rm 19.00)
Scissors 1 (Rm 3.00)
4 x 2-way corner
elbow pvc fitting
connector (1/2”)
4 ( Rm 3.80)
Hot glue 1 (Rm 15.00)
Table 4.0

Components. Quantity. Price.
Wifi module
esp8266
1 RM 11.00
Arduino Nano
1
RM 50
Hitachi 16×2
LCD
1
RM 10.50
Turbidity sensor
1
RM 35.00
Battery 12V
1 RM 22.00
Table 5.0
SAFETY PRECAUTIONS
• During the project, we make sure that all the
wires are connected tightly.
• When testing turbidity sensor we made sure
the sensor was placed properly in order to
get the right reading.
• We ensure that the circuit diagram is keep
away from water to avoid any errors.
• We make sure that the casing was closed
properly so it is user friendly.


COPYRIGHTS