Tuning EASY-Backfilling Queues
20
HAL Id: hal-01522459 https://hal.archives-ouvertes.fr/hal-01522459 Submitted on 15 May 2017 HAL is a multi-disciplinary open access archive for the deposit and dissemination of sci- entific research documents, whether they are pub- lished or not. The documents may come from teaching and research institutions in France or abroad, or from public or private research centers. L’archive ouverte pluridisciplinaire HAL, est destinée au dépôt et à la diffusion de documents scientifiques de niveau recherche, publiés ou non, émanant des établissements d’enseignement et de recherche français ou étrangers, des laboratoires publics ou privés. Tuning EASY-Backfilling Queues Jérôme Lelong, Valentin Reis, Denis Trystram To cite this version: Jérôme Lelong, Valentin Reis, Denis Trystram. Tuning EASY-Backfilling Queues. 21st Workshop on Job Scheduling Strategies for Parallel Processing, May 2017, Orlando, United States. pp.43-61, 10.1007/978-3-319-77398-8_3. hal-01522459
Transcript of Tuning EASY-Backfilling Queues
HAL Id: hal-01522459https://hal.archives-ouvertes.fr/hal-01522459
Submitted on 15 May 2017
HAL is a multi-disciplinary open accessarchive for the deposit and dissemination of sci-entific research documents, whether they are pub-lished or not. The documents may come fromteaching and research institutions in France orabroad, or from public or private research centers.
L’archive ouverte pluridisciplinaire HAL, estdestinée au dépôt et à la diffusion de documentsscientifiques de niveau recherche, publiés ou non,émanant des établissements d’enseignement et derecherche français ou étrangers, des laboratoirespublics ou privés.
Tuning EASY-Backfilling QueuesJérôme Lelong, Valentin Reis, Denis Trystram
To cite this version:Jérôme Lelong, Valentin Reis, Denis Trystram. Tuning EASY-Backfilling Queues. 21st Workshopon Job Scheduling Strategies for Parallel Processing, May 2017, Orlando, United States. pp.43-61,�10.1007/978-3-319-77398-8_3�. �hal-01522459�
Tuning EASY-Backfilling Queues.
Jerome Lelong, Valentin Reis, and Denis Trystram
Univ. Grenoble Alpes, CNRS, Inria, LIG, LJK, [email protected]
Abstract. EASY-Backfilling is a popular scheduling heuristic for allo-cating jobs in large scale High Performance Computing platforms. Whileits aggressive reservation mechanism is fast and prevents job starvation,it does not try to optimize any scheduling objective per se. We consider inthis work the problem of tuning EASY using queue reordering policies.More precisely, we propose to tune the reordering using a simulation-based methodology. For a given system, we choose the policy in orderto minimize the average waiting time. This methodology departs fromthe First-Come, First-Serve rule and introduces a risk on the maximumvalues of the waiting time, which we control using a queue thresholdingmechanism. This new approach is evaluated through a comprehensiveexperimental campaign on five production logs. In particular, we showthat the behavior of the systems under study is stable enough to learna heuristic that generalizes in a train/test fashion. Indeed, the averagewaiting time can be reduced consistently (between 11% to 42% for thelogs used) compared to EASY, with almost no increase in maximum wait-ing times. This work departs from previous learning-based approachesand shows that scheduling heuristics for HPC can be learned directly ina policy space.
1 Introduction
The main challenge of the High Performance Computing community (HPC) isto build extreme scale platforms that can be efficiently exploited. The number ofprocessors on such platforms will drastically increase and more processing capa-bilities will obviously lead to more data produced [10]. Moreover, new computingsystems are expected to run more flexible workloads. Seldom supported by theexisting managing resource systems, the future schedulers should take advantageof this flexibility to optimize the performance of the system. The extreme scalegenerates a huge amount of data at run-time. Collecting relevant information isa prerequisite for determining efficient allocations.
The resources of such platforms are usually subject to competition by manyusers submitting their jobs. Parallel job scheduling is a crucial problem to ad-dress for a better use of the resources. Efficient scheduling of parallel jobs isa challenging task which promises great improvements in various directions, in-cluding improved machine utilization, energy efficiency, throughput and responsetime. The scheduling problems are not only computationally hard, but in prac-tice they are also plagued with uncertainty as many parameters of the problem
are unknown while taking decisions. As a consequence, the actual productionplatforms currently rely on very basic heuristics based on queues of submittedjobs ordered in various ways. The most used heuristic is the well-known EASY-backfilling policy [24, 20]. While EASY is simple, fast to execute and preventsstarvation, it does not fare especially well with respect to cumulative cost met-rics such as the average waiting time of the jobs. Therefore, many HPC codedevelopers and system administrators intend to tune this heuristic by reorder-ing either the primary queue or the backfilling queue. Since such reordering ofjob queues may introduce starvation in the scheduling, this results in a dilemmabetween the average and maximal costs. In order to solve this dilemma, we intro-duce a thresholding mechanism that can effectively manage the risk of reachingtoo large objective values. This issue is further complicated by the dependencyof the relative scheduling performances on system characteristics and workloadprofiles. We propose in this work to use simulations in order to choose queuereordering policies. Finally, we study the empirical generalization and stabilityof this methodology and open the door for further learning-based approaches.
The rest of the paper is organized as follows: Section 2 reviews existing re-source management approaches from the literature. Section 3 describes the con-text and states the problem. Section 4 describes an experimental setup that isessential to the discussion. Section 5 introduce our approach, illustrating thediscussion with results from the KTH-SP2 trace. Section 6 describes the thresh-olding mechanism used. Section 7 validates this approach using a comprehensiveexperimental campaign on 5 logs from the Parallel Workload Archive [14].
2 Related Works
This section presents current solutions to the scheduling problem and the currentdirection taken by the field.
2.1 Scheduling heuristics in HPC platforms
While parallel job scheduling is a well studied theoretical problem [19], the prac-tical ramifications, varying hypotheses, and inherent uncertainty of the problemin HPC have driven practitioners and researchers alike to use and study simpleheuristics. The two most popular heuristics for HPC platforms are EASY [24]and Conservative [21] Backfilling.
While Conservative Backfilling offers many advantages [25], it has a signifi-cant computational overhead, perhaps explaining why most of the machines ofthe top500 ranking [3] still use at the time of this publication a variant of EASYBackfilling.
2.2 EASY
There is a large body of work seeking to improve EASY. Indeed, while the heuris-tic is used by various resource and job management softwares (most notablySLURM [2]), this is rarely done without fine tunings by system administrators.
2

Several works explore how to tune EASY by reordering waiting and/or back-filling queues [29], sometimes even in a randomized manner [23], as well as someimplementations [17]. However, as successful as they may be, these works do notaddress the dependency [5] of scheduling metrics on the workload. Indeed thesestudies most often report post-hoc performance since they compare algorithmsafter the workload is known.
The dynP scheduler [27] proposes a systematic method to tuning these queues,although it requires simulated scheduling runs at decision time and thereforecosts much more than the natural execution of EASY.
2.3 Data-aware resource management
There is a recent focus on leveraging the high amount of data available in largescale computing systems in order to improve their behavior. Some works use col-laborative filtering to colocate tasks in clouds by estimating application interfer-ence [30]. Others are closer to the application level and use binary classificationto distinguish benign memory faults from application errors in order to executerecovery algorithms (see [31] for instance).
Several works use this method in the context of HPC, in particular [29, 16],hoping that better job runtime estimations should improve the scheduling [9].Some algorithms estimate runtime distributions model and choose jobs usingprobabilistic integration procedures [22].
However, these works do not address the duality between the cumulative andmaximal scheduling costs, as mentionned in [16].
While these previous works intend to estimate uncertain parameters, we con-sider in this paper a more pragmatic approach, which is to directly learn a goodscheduling policy from a given policy space.
3 Problem Setting
This section describes the generic platform model used in this paper. It recallsthe EASY heuristic and defines two scheduling cost metrics to be minimized.Finally, it motivates and introduces the problem statement of this paper.
3.1 System Description
The problem addressed in this paper is the one faced by Resource and JobManagement Systems (RJMS) such as SLURM [2], PBS [1] and OAR [7] andmore recently by Flux [4].
The crucial part of these softwares is the scheduling algorithm that deter-mines where and when the submitted jobs are executed. The process is as follows:jobs are submitted by end-users and queued until the scheduler selects one ofthem for running. Each job has a provided bound on the execution time andsome resource requirements (number and type of processing units). Then, the
3

RJMS drives the search for the resources required to execute this job. Finally,the tasks of the job are assigned to the chosen nodes.
In the classical case, these softwares need to execute a set of concurrent par-allel jobs with rigid (known and fixed) resource requirements on a HPC platformrepresented by a pool of m identical resources. This is an on-line problem sincethe jobs are submitted over time and their characteristics are only known whenthey are released. Below is the description and the notations of the characteriscsof job j:
– Submission date rj (also called release date)– Resource requirement qj (number of processors)– Actual running time pj (sometimes called processing time)– Requested running time pj (sometimes called walltime), which is an upper
bound of pj .
The resource requirement qj of job j is known when the job is submitted attime rj , while the requested running time pj is given by the user as an estimate.Its actual value pj is only known a posteriori when the job really completes.Moreover, the users have incentive to over-estimate the actual values, since jobsmay be “killed” if they surpass the provided value.
3.2 EASY Backfilling
The selection of the job to run is performed according to a scheduling policythat establishes the order in which the jobs are executed. EASY-Backfilling isthe most widely used policy due to its simple and robust implementation andknown benefits such as high system utilization [24]. This strategy has no worstcase guarantee beyond the absence of starvation (i.e. every job will be scheduledat some moment).
The EASY heuristic uses a job queue to perform job starting/reservation(the primary queue) and job backfilling (the backfilling queue). These queuescan be dissociated and the heuristic can be parametrized via both a primarypolicy and a backfilling policy. This is typically done by ordering both queues inan identical manner using job attributes. In the following, we denote by EASY-PR-PB the scheduling policy that starts jobs and does the reservation accordingto policy PR and backfills according to policy PB . For the sake of completeness,Algorithm 1 describes the EASY-PR-PB heuristic.
This paper makes use of 7 classical queue reordering policies that are pre-sented below:
– FCFS: First-Come First-Serve, which is the widely used default policy [24].– LCFS: Last-Come First-Serve.– LPF: Longest estimated Processing time pj First.– SPF: Smallest estimated Processing time pj First [25].– LQF: Largest resource requirement qj First.– SQF: Smallest resource requirement qj First.
4

Algorithm 1 EASY-PR-PB policy
Input: Queue Q of waiting jobs.Output: None (calls to Start())
Starting jobs in the PR order1: Sort Q according to PR
2: for job j do3: Pop j from Q4: if j can be started given the current system use. then5: Start(j)6: else7: Reserve j at the earliest time possible according to the estimated running
times of the currently running jobs.Backfill jobs in the PB order
8: L← Q9: Sort L according to PB
10: for job j′ in L do11: if j′ can be started without delaying the reservation on j. then12: Start(j′)13: end if14: end for15: break16: end if17: end for
– EXP: Largest Expansion Factor First [25], where the expansion factor isdefined as follows:
waitj + pjpj
(1)
where waitj is the waiting time until now of job j.
This search set is taken to maximize semantic diversity, without passingjudgement on which policy should be the best for a particular objective.
3.3 Scheduling metric
A system administrator may use one or multiple cost metric(s). Our study ofscheduling performance relies on the waiting times of the jobs, which is one ofthe more commonly used reference.
Waitj = startj − rj (2)
Like other cost metrics, the waiting time is usually considered in its cumula-tive version, which means that one seeks to minimize the average waiting time(AvgWait). In the following, we will also use the maximal version of this costmetric which we denote by MaxWait, a.k.a the maximal value of the waitingtime of all the jobs from a scheduling run.
5

3.4 Problem Description
There are in the authors’ view two main difficulties when effectively tuning theEASY heuristic. Each of these two issues are illustrated below by a dedicatedscheduling experiment.
Table 1. AvgWait performance of EASY-EXP-EXP and EASY-SQF-SQF on the orig-inal CTC-SP2 and SDSC-SP2 traces, in seconds.
CTC-SP2 SDSC-SP2
EASY-EXP-EXP 3074 6765
EASY-SQF-SQF 2090 11234
First, the relative performance of EASY policies is sensitive to the context [5,25]. Table 1 illustrates this effect by comparing the AvgWait of two differentqueue ordering policies on the logs of two different workloads from the ParallelWorkload Archive. The results suggest that there is no ”one size fits all” choiceof primary and backfilling queue policies. In such a situation, tuning EASY mustbe done locally for each HPC system. This can be done via simulation, takingcare that the results generalize to the future.
Table 2. AvgWait and MaxWait performance of EASY-SPF-SPF and EASY-FCFS-FCFS on the original CTC-SP2 trace, in seconds.
EASY-SPF-SPF EASY-FCFS-FCFS
AvgWait 2784 3974
MaxWait 661280 176090
Second, starvation may occur when changing the EASY queue policy awayfrom FCFS. This issue concerns the method used to measure the objective. Mostsystems use a variant of the EASY- FCFS-FCFS policy, where the FCFS policy isused both for primary and backfilling queues. The main advantage of this choiceis that it controls the starvation risk by greedily minimizing the maximum valuesof the job waiting times. Indeed, a job might be indefinitely delayed when notstarting jobs in the FCFS order. This effect was pointed out in some relatedworks [29, 16] that optimize the average cost by removing the FCFS constraint.Table 2 illustrates this effect by reporting the AvgWait and MaxWait of theEASY-SPF-SPF and EASY-FCFS-FCFS strategies on the CTC-SP2 trace.
In this paper, we would like to study the following question: How to lever-age workload data in order to improve cumulative cost metrics whilecontrolling their maximum values?
In order to answer this question, we investigate the use of simulation to tuneEASY-PR-PB by reordering its two queues. The first conclusion is that reorder-ing the primary queue is more beneficial than simply reordering the backfillingqueue. However, this introduces a risk on the maximum values of the objective,which we control by hybridizing FCFS and the reordering policy via a thresh-olding mechanism. Finally, we show that the experimental performance of thethresholded heuristics generalizes well to unseen data.
6

4 Experimental Protocol
This section motivates the statistical approach used to measure performance anddescribes the simulation method.
4.1 Statistical approach
●
●
●
●●
●●
●
●●
●
●
●●
●
●
●
●
●
●●
●
●●
●
●
●
●
●●
●
●
●
●
●●●
●
●
●●
●
●
●
●
●
●
●
●
●
●●
●
●
●
●●
●
●●
●
●
●
●
●
●
●
●
●
●
●
●
●●●
●
●
●
●
●●
●
●
●●●●
●
●
●
●
●
●
●
●
●
●●
●
●
●
●
●
●●
●●
●
●●
●
●
●
●
●
●
●
●
●
●●
●
●●●
●
●
●
●●
●
●
●
●
●●●
●
●
●
●
●
●
●●
●
●●
●
●
●
●
●
●●
●●
●
●●
●
●
●
●
●
●
●
●
●
●●
●
●
●●
●
●
●
●
●
●
●
●
●●●●
●
●
●
●
●
●
●
●
●
●
●
●
●
●
●●
●
●●●
●
●●
●
●
●
●
●
●
●
●
●
●
●
●
●●
●
●
●
●
●
●
●
●
●
●●●●
●●
●
●
●
●
●
●
●●
●
●
●
●
●
●
●●●●
●
●●
●
●
●
●
●
●●
●
●
●●
●
●●●
●
●
●
●●●
●
●
●●●
●
●
●
●
●
●
●
●
●
●
●
●
●
●
●
●
●
●
●●
●
●
●●
●
●
●
●
●
●
●
●
●
●●
●
●
●
●
●
●
●
●
●●
●
●
●●●●
●
●
●
●
●
●
●
●
●
●
●
●
●
0
10000
20000
30000
0 10 20 30 40 50Week number
Avg
Wai
t
Policy●
●
●
●
●
●
●
exp
fcfs
lcfs
lpf
lqf
spf
sqf
●
●
●
●●
●
●
●
●
●
●●●
●
●
●
●
●
●
●
●●
●
●
●
●
●
●
●
●
●
●
●
●
●
●
●
●●●
●
●
●
●
●
●●
●
●
● ●
●
●
●
●
●
●
●●●
●
●
●
●
●
●
●●
●●
●
●●
●
●
●
●
●
●●●
●
●
●
●
●●
●●●
●
●
●
●
●
●
●
●
●
● ●●
●
●
●
●
●
●
●
●●
●●
●
●●●
●
●
●
●
●●
●
●
●
●
●●
●
●
●
●
●
●
●
●
●●
●
●
●
●
●
●
●
●
●
●
●
●
●
●
●●
●
●●
●
●
●
●●
●●
●●
●
●●
●●
●●
●
●
●
●
●
●
●
●●
●
●
●
●
●
●
●●
●
●
●
●●
●
●
●
●
●
●
●
●
●
●●
●
●
●
●
●
●
●
●
●
●●●
●
●
●●
●
●●
●
●
●
●
●
●●●
●●
●●
●
●●
●
●
●
●
●
●
●
●●
●
●●
●
●●
●
●
●●
●●●●
●
●
●
●●
●
●●
●
●
●
●
●
●●
●
●●
●
●●
●
●
●
●
●●
●
●
●
●
●
●
●
●
●●●●●●●●●●●●●●●●●●●●●●●●●●●●●●●●●●●●●●●●●●●●●●●●●●●
0.5
1.0
1.5
2.0
0 10 20 30 40 50Week number
no
rmal
ized
Avg
Wai
t
Policy●
●
●
●
●
●
●
exp
fcfs
lcfs
lpf
lqf
spf
sqf
Fig. 1. AvgWait obtained for the 7 main queue policies with FCFS backfilling for 150generated weeks on the KTH-SP2 trace. First, in absolute value, and then normalizedwith respect to EASY-FCFS-FCFS.
The experimental approach used in this paper is statistical by nature. Fig-ure 1 shows how the AvgWaits of the 7 primary policies used along with FCFSbackfilling evolves during the first 150 weeks of the ”cleaned”1 KTH-SP2 tracefrom the Parallel Workloads Archive. The variability [5, 15] of cost metrics andtheir sensitivity to small changes in the workload logs [28] have been thoroughlystudied in the literature. Our approach to measuring performance without re-porting noise from workload flurries [28] is to aggregate the cost metric on alarge number of generated logs. In this way, we can report the variability alongwith the average values. The trace generation approach of this paper follows inpart the methodology of [12]: We design a trace resampler in order to gener-ate week-long workload logs from an original dataset. The resampling techniqueused is simplistic in nature: for each system user, a random week of job submis-sions from the original trace is used. This approach is combinatorially sufficientto generate infinitely many logs while preserving the natural dependency of the
1 See the Parallel Workloads Archive [14] for details.
7

workload on the weekly period and the variability in load. On the downside, theseasonal effect and the dependency between users are lost. Moreover, there isno user model or other feedback loop in the simulations. In all experiments, theperformance of every policy is evaluated by averaging the cost values over 250generated weeks.
4.2 Simulation method and testbed
While high quality simulators like SimGrid [8] are available in practice, this pa-per focuses on backfilling behavior and does not need to use such advanced tools.This is motivated by the fact that one needs to use a high-performance approachto simulation in order to perform the high number of scheduling runs necessaryfor this study (the total number of week-long simulations in this paper is of theorder of 106). Therefore, experiments are run with a specially written lightweightbackfilling scheduler. Since there is a need for both speed of execution and gener-ality of application, our scheduler simulator discards all topological informationfrom the original machines. Using this simulator, a week of EASY backfillingcan be replayed in under a tenth of a second for the KTH-SP2 machine, theI/O operations (reading and writing a swf file) included. All simulations areperformed on a Dell PowerEdge T630 machine with 2x Intel(R) Xeon(R) CPUE5-2697 v3 @ 2.60GHz/14 cores (28 cores/node), and 260 GB of RAM. We usea minimalistic approach to reproducible research [26] and provide a snapshot ofthe work that includes a build system that runs the experiments using the zy-make [6] minimalistic workflow system. The archive includes our simulator anda nix [11] file that describes the dependencies.
5 Primary and Backfilling queues
This section presents a dedicated experimental campaign that uses the KTH-SP2 trace in order to illustrate the contradictory effect of average and maximumcost.
5.1 Maximum and Average Cost
Figure 2 and 3 show a bi-objective view of the post-hoc optimization problem ofchoosing a primary and backfilling policy among all 49 possible combinations (7policies for the primary queue and 7 for the backfilling queue). The two objectivesare the cumulative and maximal costs. In order to obtain a truthful overview ofthe variability, we use a sample size of 250 weeks and all values are recentered onthe performance of EASY-FCFS-FCFS for that particular week. Figure 2 and 3vary in terms of y axis. In Figure 2, the y axis is the maximum MaxWait oversimulated week, i.e. the highest waiting time of any job on all the simulatedweeks. In Figure 3, the y axis is the average MaxWait over the 250 weeks. Theaverage value reported is the mean average cost over individual weeks, which
8

0e+00
2e+05
4e+05
6e+05
−5000 −2500 0 2500 5000Average AvgWait cost improvement (FCFS−FCFS averages at 6952 s.)
Max
imu
m M
axW
ait
cost
imp
rove
men
t (F
CF
S−
FC
FS
max
es a
t 36
9403
s.)
Backfillingexp
fcfs
lcfs
lpf
lqf
spf
sqf
Primary
●
●
●
●
●
●
●
exp
fcfs
lcfs
lpf
lqf
spf
sqf
Fig. 2. Maximum and average waiting time cost of the 49 heuristics generated byusing the 7 possible policies as primary and backfilling ordering averaged over 250resampled weeks. All values are relative to the value obtained by the EASY primaryqueue policy with EASY backfilling. The maximum MaxWait value reported is themaximum waiting time of all jobs in the 250 weeks. The average AvgWait value is themean of the weekly waiting time averages, and the range indicates the first and lastdecile of the samples.
allows for displaying deciles in both directions. Note that Figure 2 is a moreaggressive way of reporting this value. There are two main observations.
First, it seems possible to improve the AvgWait on this machine as far asto reduce it of 30% in hindsight compared to the EASY-FCFS-FCFS baseline.However, such AvgWait improvements seem to entail an increase in MaxWait.Expectedly, the EASY-FCFS-FCFS heuristic has a good MaxWait behavior.
Second, there seems to be regularities in the performance’s behavior: Themain factor certainly come from the primary queue policy, while the importanceof the backfilling policy varies depending on the primary policy. It appears thatsome policies such as SQF do not lead to many backfilling decisions, while otherslike LQF encourage frequent backfilling. Additionally, there are some backfillingpolicies, such as SPF and ExpFact that systematically outperform the others.
5.2 Comparing Backfilling Policies
It is an interesting question to ask whether some backfilling policies are consis-tently better than others regardless of primary scheduling policies. As Figure 4shows, the AvgWait performance of all backfilling policies relative to EASY-FCFS-FCFS presents roughly the same relative performance for each primary
9

0e+00
1e+05
2e+05
3e+05
4e+05
5e+05
−5000 −2500 0 2500 5000Average AvgWait cost improvement (FCFS−FCFS averages at 6952 s.)
Ave
rag
e M
axW
ait
cost
imp
rove
men
t (F
CF
S−
FC
FS
ave
rag
es a
t 11
6914
s.)
Backfillingexp
fcfs
lcfs
lpf
lqf
spf
sqf
Primary
●
●
●
●
●
●
●
exp
fcfs
lcfs
lpf
lqf
spf
sqf
Fig. 3. Maximum and average waiting time cost of the 49 heuristics generated by usingthe 7 possible policies as primary and backfilling ordering averaged over 250 resampledweeks. All values are relative to the value obtained by the EASY primary queuepolicy with EASY backfilling. The average MaxWait value reported is the averageof the maximum waiting time over 250 weeks. The average AvgWait value is as inFigure 2 the mean of the weekly waiting time averages, and the range indicates thefirst and last decile of the samples, both in x and y scale.
queue policy. Namely, for this machine the SPF backfilling policy was alwaysthe best from our search space in hindsight. We do not elaborate on this aspecthere. In the next section, we focus on the maximal costs incurred by the tunedheuristic.
6 Queue threshold
This section introduces control over the maximal costs using a thresholdingmechanism.
6.1 Thresholding and risk
The future costs Waitj of a waiting job j are lower-bounded at any time t by thevalue of the waiting time so far, t− rj
2. A simple way to introduce robustnessinto the heuristic is therefore to force jobs with unusually high values of t − rj
2 Note that this is also valid for the more refined Average Bounded Slowdown [13]metric.
10

expfcfs
lcfslpf
lqfspf
sqf
−2000 −1000 0 1000Average AvgWait cost improvement (FCFS−FCFS averages at 6952 s.)
Backfillingexp
fcfs
lcfs
lpf
lqf
spf
sqf
Fig. 4. Performance improvement over EASY-FCFS-FCFS of the 7 Backfilling policiesconditioned on Primary policy.
ahead of the primary queue. One way to do this is to introduce a thresholdparameter T and push jobs with t − rj > T immediately ahead of the primaryqueue after the primary queue sorting step (line 1 of Algorithm 1). If more thanone job is in this situation, these jobs are ordered by submission time rj at thehead of the queue.
Figure 5 illustrates the effect on 7 possible heuristics on the KTH-SP2 sys-tem with T = 20 hours. The heuristics search space is dimished by fixing thebackfilling policy to SPF (see Subsection 5.2) for pure visual reasons and exhaus-tive treatment is delayed to Section 7. The threshold is reported as a horizontalline on the figure. The MaxWait is greatly reduced, while all AvgWait valuesare (perhaps expectedly) moved torwards EASY-FCFS-FCFS. This mechanismseems to be a hopeful candidate for tuning the queue policies while controllingthe waiting time of rogue jobs.
The next section gives a glimpse of the behavior of generalization in thisframework.
7 Experimental Validation
This section presents a systematic study of EASY-PR-PB tuning.
7.1 Generalization protocol
The goal of the experimental campaign is to study how the performance ofdifferent heuristics generalize empirically. That is to say, can EASY Backfillingbe tuned on specific workload data? We follow the most simple protocol forassessing learnability:
The initial workload is split at temporal midpoint in two parts, the trainingand testing logs. Each of these are used to resample weeks. For each HPC log
11

● ●● ●●● ● ● ●● ●●● ●
● ●● ●●● ● ● ●● ●●● ●
● ●● ●●● ●● ●● ●●● ●
● ●● ●●● ●
1e+05
2e+05
3e+05
5000 6000 7000 8000Mean AvgWait cost
Max
Max
Wai
t co
st
Primary
●
●
●
●
●
●
●
exp
fcfs
lcfs
lpf
lqf
spf
sqf
Fig. 5. Maximum and average waiting time cost of the 7 heuristics generated by usingthe 7 possible thresholded primary policies with SPF backfilling averaged over 250resampled weeks. The threshold T is chosen at a value of 20 hours. All values are relativeto the value obtained by the EASY primary queue policy with EASY backfilling. Theaverage MaxWait value reported is the maximum waiting time of all jobs in the 250weeks. The average AvgWait value is as in Figure 2 the mean of the weekly waitingtime averages. Semi-transparent points represent the performance of the un-thresholdedpolicies.
from the Parallel Workload archive used in the experiment, this process resultsin two databases of 250 weeks each. The experimental campaign will consist inrunning simulations on the training weeks, selecting the best performing policy(tuning the heuristic), and evaluating the performance of this policy on thetesting weeks. The search space for EASY-PR-PB will be the set of dimension49 composed by the choice of 7 policies as Primary reordering policy and 7policies as Backfilling reordering policy.
This simple approach to measuring performance generalization correspondsto the situation where a system administrator having retained usage logs froma HPC center must choose a scheduling policy for the next period.
7.2 Workload logs
Table 3 outlines the five workload logs from the Parallel Workloads Archive [14]used in the experiments. These logs cover both older and more recent machinesof varying size and length. The logs are subject to pre-filtering. The filteringstep excludes jobs with pj < pj and jobs whose ”requested cores” and ”allo-cated cores” fields exceed the size of the machine.
12

Table 3. Workload logs used in the simulations.
Name Year # CPUs # Jobs Duration
KTH-SP2 1996 100 28k 11 Months
CTC-SP2 1996 338 77k 11 Months
SDSC-SP2 2000 128 59k 24 Months
SDSC-BLUE 2003 1,152 243k 32 Months
CEA-Curie 2012 80,640 312k 3 Months
7.3 Empirical generalization results
0
40000
80000
120000
−3000
−2000
−1000
0
MaxW
aitM
eanWait
0 50000 100000 150000T
No
rmal
ized
co
st
Trace type
test
train
Average and maximal waiting time as function of queue threshold for the l_cea_cu trace.
0e+00
5e+04
1e+05
−3000
−2000
−1000
0
MaxW
aitM
eanWait
0 50000 100000 150000T
No
rmal
ized
co
st
Trace type
test
train
Average and maximal waiting time as function of queue threshold for the l_ctc_sp trace.
Fig. 6. AvgWait and MaxWait generalization of thresholded policies as affected bythe queue threshold. The Value reported as ”train” is that of the least costly heuristicamong the 49 possible policy parametrizations averaged on the training logs. The Valuereported as ”test” is the averaged cost of the same heuristic on the testing logs. Thisfigure is continued as Figure 7.
Figure 7 summarizes the behavior of the empirical generalization and risk ofthe waiting time with respect to the value of the threshold T . There is a fortunateeffect in that the values from the lower parts of the graphs (the AvgWait cost)seem to decrease faster than values from the upper part (the MaxWait cost),which increases linearly with T .
13
0
25000
50000
75000
−5000
−4000
−3000
−2000
−1000
0
1000
MaxW
aitM
eanWait
0 50000 100000 150000T
No
rmal
ized
co
st
Trace type
test
train
Average and maximal waiting time as function of queue threshold for the l_kth_sp trace.
0
20000
40000
60000
−2000
−1500
−1000
−500
0
MaxW
aitM
eanWait
0 50000 100000 150000T
No
rmal
ized
co
st
Trace type
test
train
Average and maximal waiting time as function of queue threshold for the l_sdsc_b trace.
0
25000
50000
−7500
−5000
−2500
0
MaxW
aitM
eanWait
0 50000 100000 150000T
No
rmal
ized
co
st
Trace type
test
train
Average and maximal waiting time as function of queue threshold for the l_sdsc_s trace.
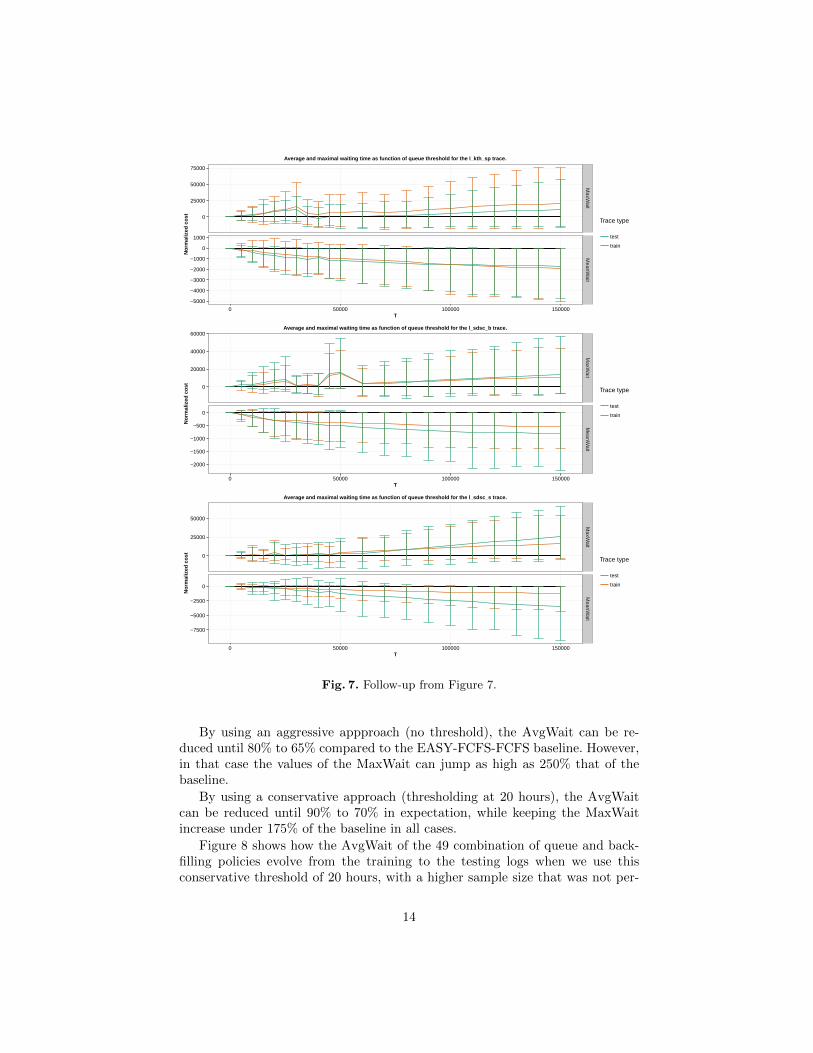
Fig. 7. Follow-up from Figure 7.
By using an aggressive appproach (no threshold), the AvgWait can be re-duced until 80% to 65% compared to the EASY-FCFS-FCFS baseline. However,in that case the values of the MaxWait can jump as high as 250% that of thebaseline.
By using a conservative approach (thresholding at 20 hours), the AvgWaitcan be reduced until 90% to 70% in expectation, while keeping the MaxWaitincrease under 175% of the baseline in all cases.
Figure 8 shows how the AvgWait of the 49 combination of queue and back-filling policies evolve from the training to the testing logs when we use thisconservative threshold of 20 hours, with a higher sample size that was not per-
14
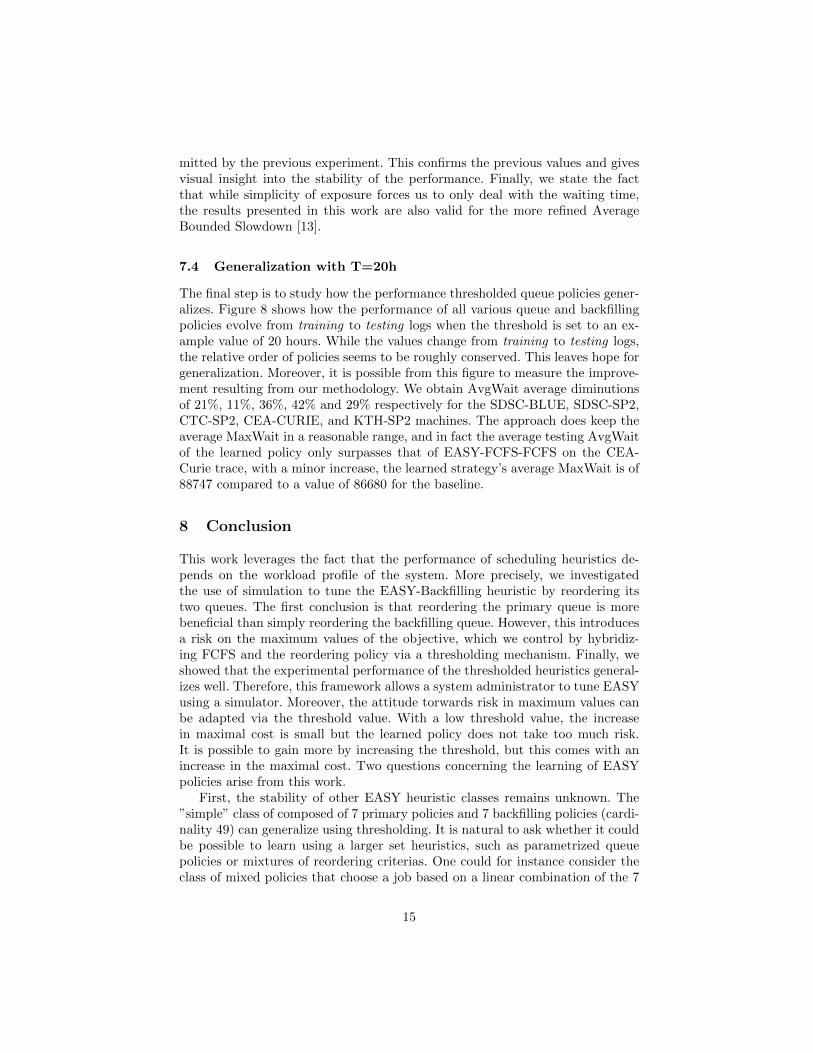
mitted by the previous experiment. This confirms the previous values and givesvisual insight into the stability of the performance. Finally, we state the factthat while simplicity of exposure forces us to only deal with the waiting time,the results presented in this work are also valid for the more refined AverageBounded Slowdown [13].
7.4 Generalization with T=20h
The final step is to study how the performance thresholded queue policies gener-alizes. Figure 8 shows how the performance of all various queue and backfillingpolicies evolve from training to testing logs when the threshold is set to an ex-ample value of 20 hours. While the values change from training to testing logs,the relative order of policies seems to be roughly conserved. This leaves hope forgeneralization. Moreover, it is possible from this figure to measure the improve-ment resulting from our methodology. We obtain AvgWait average diminutionsof 21%, 11%, 36%, 42% and 29% respectively for the SDSC-BLUE, SDSC-SP2,CTC-SP2, CEA-CURIE, and KTH-SP2 machines. The approach does keep theaverage MaxWait in a reasonable range, and in fact the average testing AvgWaitof the learned policy only surpasses that of EASY-FCFS-FCFS on the CEA-Curie trace, with a minor increase, the learned strategy’s average MaxWait is of88747 compared to a value of 86680 for the baseline.
8 Conclusion
This work leverages the fact that the performance of scheduling heuristics de-pends on the workload profile of the system. More precisely, we investigatedthe use of simulation to tune the EASY-Backfilling heuristic by reordering itstwo queues. The first conclusion is that reordering the primary queue is morebeneficial than simply reordering the backfilling queue. However, this introducesa risk on the maximum values of the objective, which we control by hybridiz-ing FCFS and the reordering policy via a thresholding mechanism. Finally, weshowed that the experimental performance of the thresholded heuristics general-izes well. Therefore, this framework allows a system administrator to tune EASYusing a simulator. Moreover, the attitude torwards risk in maximum values canbe adapted via the threshold value. With a low threshold value, the increasein maximal cost is small but the learned policy does not take too much risk.It is possible to gain more by increasing the threshold, but this comes with anincrease in the maximal cost. Two questions concerning the learning of EASYpolicies arise from this work.
First, the stability of other EASY heuristic classes remains unknown. The”simple” class of composed of 7 primary policies and 7 backfilling policies (cardi-nality 49) can generalize using thresholding. It is natural to ask whether it couldbe possible to learn using a larger set heuristics, such as parametrized queuepolicies or mixtures of reordering criterias. One could for instance consider theclass of mixed policies that choose a job based on a linear combination of the 7
15

−600
−300
0
300
Train TestEASY−FCFS−FCFS value:
Train Avg: 1768.1Test Avg: 2399.0
Test Max:129789.000000Learned Max:80612.000000
Avg Decrease : −25.21%
Ave
rag
e A
vgW
ait
imp
rove
men
t
l_sdsc_b
−1000
0
Train TestEASY−FCFS−FCFS value:
Train Avg: 4242.5Test Avg: 13592.3
Test Max:142532.000000Learned Max:61694.000000
Avg Decrease : −12.73%
Ave
rag
e A
vgW
ait
imp
rove
men
t
l_sdsc_s
−800
−400
0
Train TestEASY−FCFS−FCFS value:
Train Avg: 2349.8Test Avg: 2676.2
Test Max:96178.000000Learned Max:92365.000000
Avg Decrease : −37.62%
Ave
rag
e A
vgW
ait
imp
rove
men
t
l_ctc_sp
−500
0
Train TestEASY−FCFS−FCFS value:
Train Avg: 1707.7Test Avg: 1106.1
Test Max:141804.000000Learned Max:102942.000000
Avg Decrease : −46.89%
Ave
rag
e A
vgW
ait
imp
rove
men
t
l_cea_cu
−1000
−500
0
500
Train TestEASY−FCFS−FCFS value:
Train Avg: 6952.5Test Avg: 4409.0
Test Max:204919.000000Learned Max:186764.000000
Avg Decrease : −31.36%
Ave
rag
e A
vgW
ait
imp
rove
men
t
exp
fcfs
lcfs
lpf
lqf
spf
sqf
Primaryexp
fcfs
lcfs
lpf
lqf
spf
sqf
l_kth_sp
Fig. 8. AvgWait generalization of thresholded policies obtained by using a thresholdvalue of 20 hours. Note that each plot has a different vertical y axis. The reportedAvgWait and MaxWait values are averaged over 250 resampled weeks from the trainingor testing original logs, and we report the difference with the cost of EASY-FCFS-FCFS. The average of the baseline EASY-FCFS-FCFS is reported under the figure,along with the average MaxWait obtained by the best training policy on the testinglogs (the ”learned” policy).
criteria. A more ambitious endeavor is to ask whether it is possible to learn acontextual job ranking model [18] that performs well.
16

9 Acknowledgements
Authors are listed in alphabetical order. We warmly thank Eric Gaussier andFrederic Wagner for discussions as well as Pierre Neyron and Bruno Breznikfor their invaluable help with experiments. We gracefully thank the contribu-tors of the Parallel Workloads Archive, Victor Hazlewood (SDSC SP2), TravisEarheart and Nancy Wilkins-Diehr (SDSC Blue), Lars Malinowsky (KTH SP2),Dan Dwyer and Steve Hotovy (CTC SP2), Joseph Emeras (CEA Curie), andof course Dror Feitelson. This work has been partially supported by the LabExPERSYVAL-Lab (ANR-11-LABX-0025-01) funded by the French program In-vestissement d’avenir. Experiments presented in this paper were carried out us-ing the Digitalis platform3 of the Grid’5000 testbed. Grid’5000 is supported bya scientific interest group hosted by Inria and including CNRS, RENATER andseveral Universities as well as other organizations4.
References
1. PBS Pro 13.0 administrator’s guide. http://www.pbsworks.com/pdfs/
PBSAdminGuide13.0.pdf
2. SLURM online documentation. http://slurm.schedmd.com/sched_config.html3. TOP500 online ranking. https://www.top500.org/4. Ahn, D.H., Garlick, J., Grondona, M., Lipari, D., Springmeyer, B., Schulz, M.:
Flux: A next-generation resource management framework for large hpc centers.In: 2014 43rd International Conference on Parallel Processing Workshops. pp. 9–17 (Sept 2014)
5. Aida, K.: Effect of job size characteristics on job scheduling performance. In:Proceedings of the Workshop on Job Scheduling Strategies for Parallel Process-ing. pp. 1–17. IPDPS ’00/JSSPP ’00, Springer-Verlag, London, UK, UK (2000),http://dl.acm.org/citation.cfm?id=646381.689680
6. Breck, E.: zymake: a computational workflow system for machine learning andnatural language processing. In: Software Engineering, Testing, and Quality As-surance for Natural Language Processing. pp. 5–13. Association for ComputationalLinguistics (2008)
7. Capit, N., Da Costa, G., Georgiou, Y., Huard, G., Martin, C., Mounie, G., Neyron,P., Richard, O.: A batch scheduler with high level components. In: CCGrid 2005.IEEE International Symposium on Cluster Computing and the Grid, 2005. vol. 2,pp. 776–783. IEEE (2005)
8. Casanova, H., Giersch, A., Legrand, A., Quinson, M., Suter, F.: Versatile, scal-able, and accurate simulation of distributed applications and platforms. Jour-nal of Parallel and Distributed Computing 74(10), 2899–2917 (Jun 2014), http://hal.inria.fr/hal-01017319
9. Chiang, S.H., Arpaci-Dusseau, A., Vernon, M.K.: The Impact of More AccurateRequested Runtimes on Production Job Scheduling Performance. In: Feitelson,D.G., Rudolph, L., Schwiegelshohn, U. (eds.) Job Scheduling Strategies for Par-allel Processing. No. 2537 in Lecture Notes in Computer Science, Springer BerlinHeidelberg (Jul 2002)
3 http://digitalis.imag.fr4 https://www.grid5000.fr
17

10. DOE, A.r.: Synergistic challenges in data-intensive science and exascale computing(2013)
11. Dolstra, E., Visser, E., de Jonge, M.: Imposing a memory management disciplineon software deployment. In: Software Engineering, 2004. ICSE 2004. Proceedings.26th International Conference on. pp. 583–592. IEEE (2004)
12. Feitelson, D.G.: Resampling with Feedback — A New Paradigm of Using WorkloadData for Performance Evaluation, pp. 3–21. Springer International Publishing,Cham (2016)
13. Feitelson, D.G., Rudolph, L.: Metrics and benchmarking for parallel job scheduling.In: Job Scheduling Strategies for Parallel Processing. pp. 1–24. Springer (1998)
14. Feitelson, D.G., Tsafrir, D., Krakov, D.: Experience with using the paral-lel workloads archive. Journal of Parallel and Distributed Computing 74(10),2967 – 2982 (2014), http://www.sciencedirect.com/science/article/pii/
S074373151400115415. Frachtenberg, E., Feitelson, D.G.: Pitfalls in parallel job scheduling evaluation. In:
Job Scheduling Strategies for Parallel Processing. pp. 257–282. Springer (2005)16. Gaussier, E., Glesser, D., Reis, V., Trystram, D.: Improving backfilling by using
machine learning to predict running times. In: Proceedings of the InternationalConference for High Performance Computing, Networking, Storage and Analysis.pp. 641–6410. SC ’15, ACM, New York, NY, USA (2015)
17. Jackson, D., Snell, Q., Clement, M.: Core algorithms of the Maui scheduler. In:Job Scheduling Strategies for Parallel Processing. Springer (2001)
18. Joachims, T.: Optimizing search engines using clickthrough data. In: Proceedingsof the eighth ACM SIGKDD international conference on Knowledge discovery anddata mining. pp. 133–142. ACM (2002)
19. Leung, J.Y.: Handbook of scheduling: algorithms, models, and performance anal-ysis. CRC Press (2004)
20. Lifka, D.A.: The anl/ibm sp scheduling system. In: Proceedings of the Workshop onJob Scheduling Strategies for Parallel Processing. pp. 295–303. IPPS ’95, Springer-Verlag, London, UK, UK (1995), http://dl.acm.org/citation.cfm?id=646376.689366
21. Mu’alem, A.W., Feitelson, D.G.: Utilization, predictability, workloads, and userruntime estimates in scheduling the ibm sp2 with backfilling. IEEE Trans. ParallelDistrib. Syst. 12(6), 529–543 (Jun 2001), http://dx.doi.org/10.1109/71.932708
22. Nissimov, A., Feitelson, D.G.: Probabilistic Backfilling, pp. 102–115. SpringerBerlin Heidelberg, Berlin, Heidelberg (2008), http://dx.doi.org/10.1007/
978-3-540-78699-3_623. Perkovic, D., Keleher, P.J.: Randomization, speculation, and adaptation in batch
schedulers. In: Supercomputing, ACM/IEEE 2000 Conference. pp. 7–7 (Nov 2000)24. Skovira, J., Chan, W., Zhou, H., Lifka, D.A.: The easy - loadleveler API project. In:
Proceedings of the Workshop on Job Scheduling Strategies for Parallel Processing.pp. 41–47. IPPS ’96, Springer-Verlag, London, UK (1996), http://dl.acm.org/citation.cfm?id=646377.689506
25. Srinivasan, S., Kettimuthu, R., Subramani, V., Sadayappan, P.: Characterization ofbackfilling strategies for parallel job scheduling. In: Parallel Processing Workshops,2002. Proceedings. International Conference on. pp. 514–519. IEEE (2002)
26. Stodden, V., Leisch, F., Peng, R.D.: Implementing reproducible research. CRCPress (2014)
27. Streit, A.: The self-tuning dynP job-scheduler. In: Parallel and Distributed Process-ing Symposium., Proceedings International, IPDPS 2002, Abstracts and CD-ROM(Apr 2002)
18

28. Tsafrir, D., Feitelson, D.G.: Instability in parallel job scheduling simulation: therole of workload flurries. In: Proceedings 20th IEEE International Parallel Dis-tributed Processing Symposium. pp. 10 pp.– (Apr 2006)
29. Tsafrir, D., Etsion, Y., Feitelson, D.G.: Backfilling using runtime predictions ratherthan user estimates. School of Computer Science and Engineering, Hebrew Uni-versity of Jerusalem, Tech. Rep. TR 5 (2005)
30. Ukidave, Y., Li, X., Kaeli, D.: Mystic: Predictive scheduling for gpu based cloudservers using machine learning. In: 2016 IEEE International Parallel and Dis-tributed Processing Symposium (IPDPS). pp. 353–362 (May 2016)
31. Vishnu, A., v. Dam, H., Tallent, N.R., Kerbyson, D.J., Hoisie, A.: Fault modelingof extreme scale applications using machine learning. In: 2016 IEEE InternationalParallel and Distributed Processing Symposium (IPDPS). pp. 222–231 (May 2016)
19