
Master the Art of Performance...
30
-
Upload
trannguyet -
Category
Documents
-
view
225 -
download
1
Transcript of Master the Art of Performance...

Master the Art of
Performance Tuning
Speaker:-
Rachna Mittal, Principal –Enterprise Applications
Infosys Ltd
Agenda
3
Performance Tuning Methodology
Designing and Developing for Performance
Performance monitoring and Tuning Case Study
Performance Monitoring Metrics
Questions and Answers
Performance Matters

Why Performance matters more than ever?
4
Supply Chain
Complexity
•Lean and JIT supply chain
•Multi-tiered networks
•global transportation volume
Business Impact
•Few minutes of downtime stall the whole supply chain
•Revenue Loss
•high operational costs
Adoption of new
functionalities
•Business confidence to uptake new capabilities of OTM
•Support to organization’s growth

Agenda
5
Performance Tuning Methodology
Designing and Developing for Performance
Performance monitoring and Tuning Case Study
Performance Monitoring Metrics
Questions and Answers
Performance Matters

Performance Tuning Methodology
6
Deploy using
Holistic Approach
Hardware sizing,
Architecture
Robust functional/technical
design
Performance Testing
Monitor
Ongoing monitoring and
measuring of performance
levels
Identify Pain points
Identify opportunities for
performance improvement
Tuning of Application
server/JVM
Configuration Tuning
Database Tuning
Application Assurance
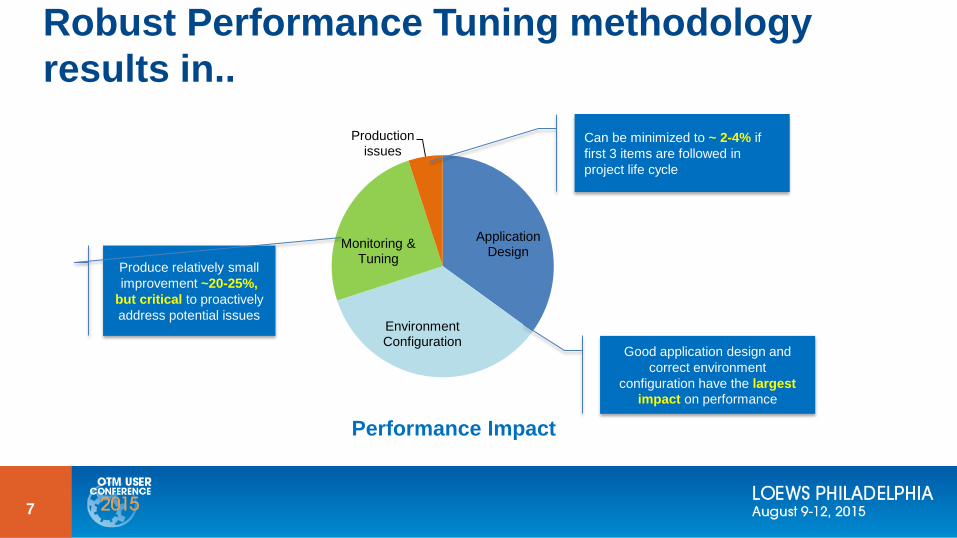
Robust Performance Tuning methodology
results in..
7
Application Design
Environment Configuration
Monitoring & Tuning
Production issues
Good application design and
correct environment
configuration have the largest
impact on performance
Can be minimized to ~ 2-4% if
first 3 items are followed in
project life cycle
Produce relatively small
improvement ~20-25%,
but critical to proactively
address potential issues
Performance Impact

Agenda
8
Performance Tuning Methodology
Designing and Developing for Performance
Performance monitoring and Tuning Case Study
Performance Monitoring Metrics
Questions and Answers
Performance Matters

Hardware Sizing
9
The first step is sizing and procuring an environment to meet your needs:-
• Overlay: Current volume and growth, Performance processing goals
• Platform: OS, Application Server, 3rd Party Products, Middleware
• Usage: Daily patterns including averages and Peek demand of batch processes, User
roles and activity, Operating hours
• OTM Functionality: Order Management, Planning, Execution, Visibility, Freight Audit
and Payment, Reporting, Procurement, Cooperative Routing, Inventory Visibility,
Forwarding and Brokerage

Application Design Considerations
Order
Management
• Order types, large volume(process in small payloads), order validations & constraints
• order changes- types/frequency, response times, order ready to plan
• Transmission size, XML, integration technology
• SQL, DSU, Finder Saved Queries in Agents
• Do not auto-initialize variables in agents that are always set from processing logic inside agent
Shipment
Planning
• Order selection criteria, Direct plan vs. bulk plan
• Planning constraints/parameters
• Bulk plan size, frequency, schedule, Configurations like Rates, Itineraries
• Order Selection Bulk plan queries should be efficient, non-overlapping
• CPU availability for concurrent Bulk plans
• Planning Threads
Tendering and
Execution
• Communication protocols, Frequency, interfaces,
• Bundle Tenders, Auto Accept, Optimize Workflow
• Reduce XML thru Stylesheets
• Out XML profiles
• Threads
Supply Chain
Visibility
• User Roles, VPD, Screen Sets
• Monitoring events frequency, volume
• Event tracking & data flow exchange
• Business monitors
• External predicates
• Saved Queries
Functional Business Process Technical

Application Design Considerations
Freight
Settlement
• Optimize Match & Pay workflow
• User Roles for approval processes
• Voucher transmissions sizes
• SQL, external predicates, trim xml,
• Offload batch processing to non-peak times
• Threads
Analytics &
Reporting
• OTM reports or FTI reports
• Which reports can be scheduled during non-peak hours?
• Data loading to FTI process
• PL/SQL code, queries in BI reports
• Index queries, Add hints
Functional Business Process Technical

Iterative Performance Testing & Tuning Approach
12
Create representative workload
Test & Measure
Analyze Tune(small,
incremental changes in each iteration)
Increase the load

Performance Test Strategy
OTM Database Monitoring of JVM’s 1.5x Stress testing, Latency Test
Addressing Top SQL Performance issues
Collect Environment specification for monitoring. Below is the example:-
Performance Testing JVM Monitoring Database
Type Environment Host Name Location Memory # of CPU Speed
Web Server LT
(Weblogic Host)
d3-a1-oa2-iplt-16, d3-a1-oa2-iplt-17, d3-a1-oa2-iplt-30
SJC 16GB 2 3324 MHz
App Server LT
(Weblogic Host) d3-a1-oa2-iplt-18, d3-a1-oa2-iplt-22, d3-a1-oa2-iplt-29, d3-a1-oa2-iplt-19 SJC 32 GB 2 3324 MHz
OSB LT
(Weblogic Host) cdsbapp-nprd3-21, cdsbapp-nprd4-21 SJC 16GB 4 2925MHz
Queue Details LT DV_SCM_EVENT_SQ, DV_FRGHT_EVENT_SQ
Monitoring of JMS Queues Throughput Time Comparison
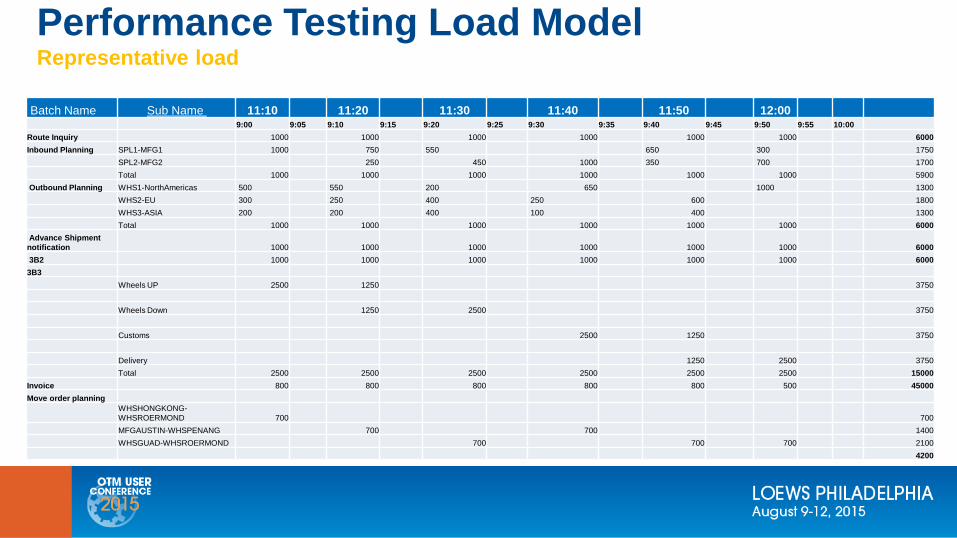
Performance Testing Load Model Representative load
Batch Name Sub Name 11:10 11:20 11:30 11:40 11:50 12:00 9:00 9:05 9:10 9:15 9:20 9:25 9:30 9:35 9:40 9:45 9:50 9:55 10:00
Route Inquiry 1000 1000 1000 1000 1000 1000 6000
Inbound Planning SPL1-MFG1 1000 750 550 650 300 1750
SPL2-MFG2 250 450 1000 350 700 1700
Total 1000 1000 1000 1000 1000 1000 5900
Outbound Planning WHS1-NorthAmericas 500 550 200 650 1000 1300
WHS2-EU 300 250 400 250 600 1800
WHS3-ASIA 200 200 400 100 400 1300
Total 1000 1000 1000 1000 1000 1000 6000
Advance Shipment
notification 1000 1000 1000 1000 1000 1000 6000
3B2 1000 1000 1000 1000 1000 1000 6000
3B3
Wheels UP 2500 1250 3750
Wheels Down 1250 2500 3750
Customs 2500 1250 3750
Delivery 1250 2500 3750
Total 2500 2500 2500 2500 2500 2500 15000
Invoice 800 800 800 800 800 500 45000
Move order planning
WHSHONGKONG-
WHSROERMOND 700 700
MFGAUSTIN-WHSPENANG 700 700 1400
WHSGUAD-WHSROERMOND 700 700 700 2100
4200

Performance Testing Report
15
Process Testing Monitoring Results
OSB : CPU , Heap & GC Details OTM App Hosts: GC Behavior
OTM App Hosts: Connection Details OTM Web Hosts: CPU, Heap and GC Behavior
OTM App Hosts: Heap Utilization

Agenda
16
Performance Tuning Methodology
Designing and Developing for Performance
Performance monitoring and Tuning Case Study
Performance Monitoring Metrics
Questions and Answers
Performance Matters
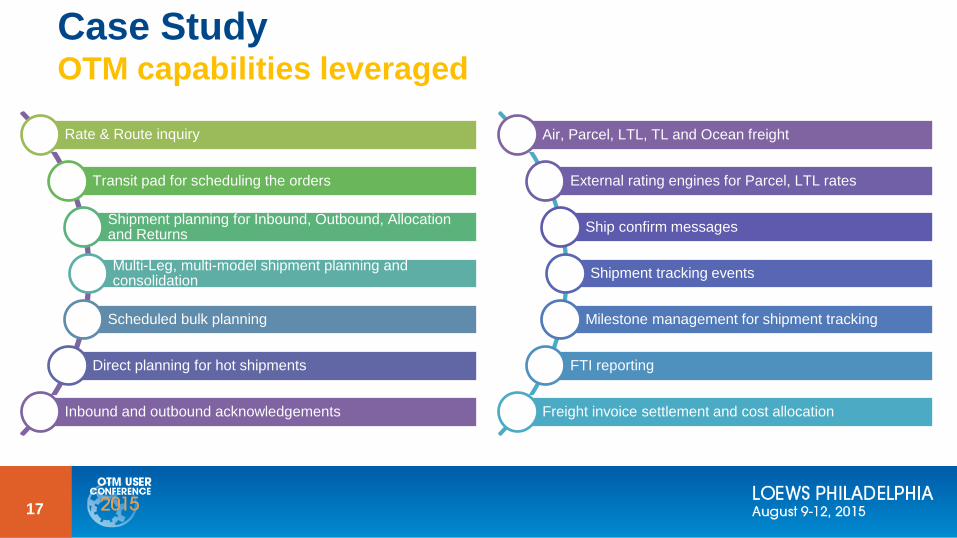
Case Study OTM capabilities leveraged
17
Rate & Route inquiry
Transit pad for scheduling the orders
Shipment planning for Inbound, Outbound, Allocation and Returns
Multi-Leg, multi-model shipment planning and consolidation
Scheduled bulk planning
Direct planning for hot shipments
Inbound and outbound acknowledgements
Air, Parcel, LTL, TL and Ocean freight
External rating engines for Parcel, LTL rates
Ship confirm messages
Shipment tracking events
Milestone management for shipment tracking
FTI reporting
Freight invoice settlement and cost allocation

Case Study Business Problem
18
Exponential increase in volume due to business growth and new buy sell enablement
New trading partners onboarding
Drastic database growth due to increased volume
Performance issues with integration, Bulk plan and saved queries
Stability & agility of the OTM platform
Transformation leading to new capabilities enablement
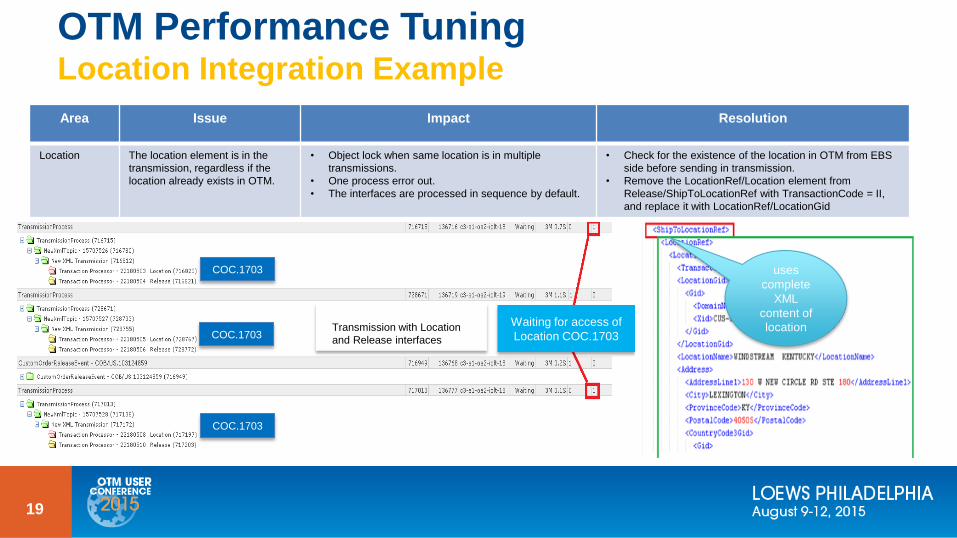
OTM Performance Tuning Location Integration Example
19
COC.1703
COC.1703
COC.1703
Waiting for access of
Location COC.1703
uses
complete
XML
content of
location Transmission with Location
and Release interfaces
Area Issue Impact Resolution
Location The location element is in the
transmission, regardless if the
location already exists in OTM.
• Object lock when same location is in multiple
transmissions.
• One process error out.
• The interfaces are processed in sequence by default.
• Check for the existence of the location in OTM from EBS
side before sending in transmission.
• Remove the LocationRef/Location element from
Release/ShipToLocationRef with TransactionCode = II,
and replace it with LocationRef/LocationGid

OTM Performance Tuning OutXMLProfile & OAQ example
20
Removal of
internal
shipment
statuses which are mot requires
Shipment XML
Order release weight
and volume, Source
and destination
location Ref, involved
party etc
Time event
6/22 6:12:16 AM Integration of insert new Release
7/24 3:02:48 AM Order Unassigned, integration set to EBS by agent ORDER_INDICATOR
7/24 3:02:49 AM EBS acknowledgement of receiving message of Unassign.
7/24 3:05:?? AM
There must be a planning process that hold the Order_release. But I could not find the trace of this process
as the shipments were already removed by Unassign process, and the bulk_plan_gid on the order was over
written by later planning activities.
7/24 3:10:17 AM
Order Unassigned, integration set to EBS by agent ORDER_INDICATOR, however, the status in the xml is
PLANNING_PLANNED - FINAL, this indicate the order was unassigned, and planned while it was integrated
to EBS.
The PLANNING_UNASSIGNED can an intermit status of bulk plan process.
7/24 3:10:17 AM EBS acknowledgement of receiving message of Unassign.
7/24 3:10:?? AM
Agent ORDER_MOVEMENT_PLAN error of time out due to waiting on access of order_release
COB/EU.111555252. The error was about 5 min timeout when the agent failed to get hold of the
order_release object.
7/24 3:12:25 AM Order Unassigned, integration set to EBS by agent ORDER_INDICATOR
7/24 3:12:25 AM EBS acknowledgement of receiving message of Unassign.
Inbound ACK
locking order
planning
process to
continue
Area Issue Impact Resolution
OutXMLProfile Unnecessarily large outbound
integration Shipment XML
• Increased load on application and database server Remove redundant tags and reduce the size of the
XML
OAQ EBS to OTM integration on Release
Status Update
• EBS send acknowledgement to OTM for un-assign signal received
from OTM.
• The order_release may still undergoing planning or waiting to be
planned, thus the integration inbound would lock the order and
cause agent execution error
Move the inbound integration for acknowledgements
to advanced queue, with data queue pulling of 10 min
or longer.

OTM Performance Tuning Planning examples
21
Object Lock
with overlapping
bulk plan queries
Area Issue Impact Resolution
Bulk Plan • Bulk plan running on same set
of orders
• Queries taking long time
• Inefficient planning process
• Object lock, waiting for resources
• Removal of overlapping queries
• Queries Tuning
• Adding planning partition
• Scheduling big batches in no-peak hours
Agents • Long time consumed by order
validation and Shipment agents
• Object locks
• Inefficient Error handler process in 88
agents
• Lengthy processing logic with lot of
DSU in Agents
• Multiple DSU
• Same event triggering multiple agents
• Replace complex business logic with PL/SQL package. This could reduce the
number of DB connections, data locking by agent. The PL/SQL will also provide
proper cache at DB level.
• Increasing Threads
• Refresh cache on the last update in agent than doing it for every DSU
• Enabling ‘Parse SQL’ for improved performance, the agent will refresh only the
specific Business Object being updated
• Performance enhancement by consolidating actions of sequential agent work
flow in different agents because triggering a new agent require overhead of
agent in execution, and issues in code maintenance in long term OTM service.

Application Server- Auditing and Logging
• Diagnostic logs, create a very large amount of data very quickly
• Ensure that there is adequate space in the temporary file system
• User logs have significant impact on performance event when user is not logged in
• LogIds with a suffix of “Debug” or “Details” should be avoided
• A good rule of thumb starting point would be 2 GB of free space, however file system usage
should be monitored to determine what amount of space is adequate for a particular environment.
22

Scalability Enabled Architecture
Web
Server2
Fail Over Routing
Web Load Balancer
Domain
Routing
Weighted Routing
Web
Server3
App
Server2
App
Server3
App
Server4
Domain / Work Routing
Failover Routing
Fail Over Routing
Domain
Routing
Web
Server1
Domain
Routing
DEFAULT
CLUSTER
Domain D1
Domain D2
App
Server1
How it helps:-
• Adding a node will
expand the total available
memory.
• If the processing power
(CPU) is being maxed
out on a single
application server, adding
another SCA node on
another physical server
increase the total
processing power.
DOMAIN
CLUSTER
Domain D3

Agenda
24
Performance Tuning Methodology
Designing and Developing for Performance
Performance monitoring and Tuning Case Study
Performance Monitoring Metrics
Questions and Answers
Performance Matters
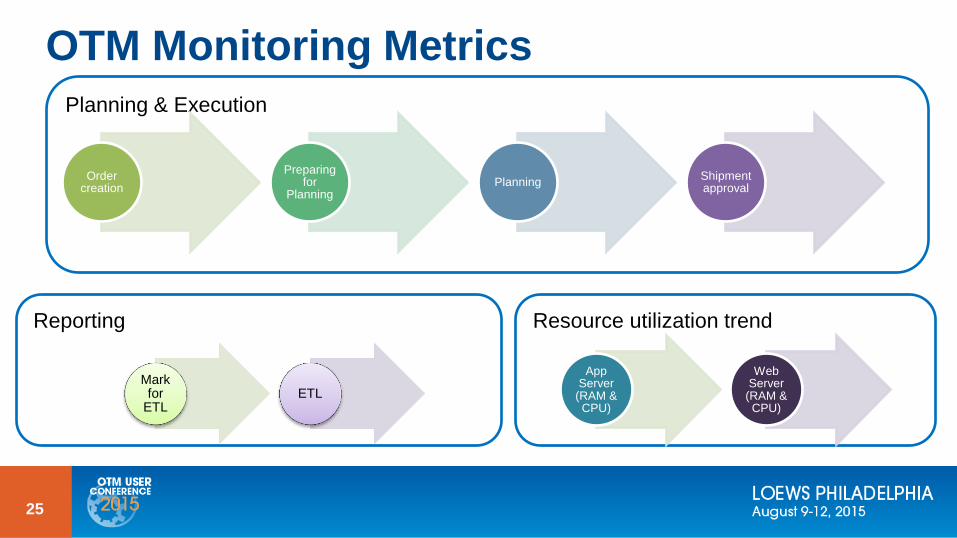
Resource utilization trend
OTM Monitoring Metrics
25
Reporting
Planning & Execution
Order creation
Preparing for
Planning Planning
Shipment approval
Mark for
ETL ETL
App Server
(RAM & CPU)
Web Server
(RAM & CPU)

OTM Monitoring Metrics
26
Average order Creation Time
Improvement in order release creation with integration tuning
Identified longer running transactions more than 10 sec
Average Agent Execution Time
25% improvement in order release and shipment agents by moving validation logic in DB package, SQL tuning, reducing
actions, error handler
0
10
20
30
40
50
60
Order agent execution time (s) Shipment agent execution time (s)
Oct release
Nov release
Dec release
(Sec
on
d
5.2% gain
84% gain
72% gain
80% gain
0
2
4
6
8
10
12
14
16
Nov 11-15
Dec 10-11
(Seco
n
62% gain 77% gain
56% gain
Domain1 Domain2 Domain3
0
20
40
60
80
100
120
140
Average Query Time ofbulk plan (seconds)
Average Planning Timeof bulk plan (seconds)
Average Planning Timeper Order (seconds)
Average Planning Timeper Shipment (seconds)
(Sec
12% gain 55% gain
69% gain 39% gain
Planning Metrics
0
5
10
15
20
25
30
Average time/order Average time/shipment
Before optimization
After optimization
(Sec
on
ds)
1.29 times faster
1.38 times faster
ETL of OTM data for FTI use
Bulk Plan performance improvement by creation planning partition and updating in on order release, Query Tuning,
changes in schedule

OTM Monitoring Metrics
27
Resource Utilization- App Server Resource Utilization- Web Server

Agenda
28
Performance Tuning Methodology
Designing and Developing for Performance
Performance monitoring and Tuning Case Study
Performance Monitoring Metrics
Questions and Answers
Performance Matters

29

© 2013 Infosys Limited, Bangalore, India. All Rights Reserved. Infosys believes the information in this document is accurate as of its publication date; such information is subject to change without notice. Infosys acknowledges the proprietary rights of other companies to the trademarks, product names and such other intellectual property rights mentioned in this document. Except as expressly permitted, neither this documentation nor any part of it may be reproduced, stored in a retrieval system, or transmitted in any form or by any means, electronic, mechanical, printing, photocopying, recording or otherwise, without the prior permission of Infosys Limited and/ or any named intellectual property rights holders under this document.
Thank You