Tunable and esponsive R Structural Color from Polymeric ...
15
1 Tunable and Responsive Structural Color from Polymeric Microstructured Surfaces 1 Enabled by Interference of Totally Internally Reflected Light 2 3 Amy E. Goodling 1 , Sara Nagelberg 2 , Mathias Kolle 2 , and Lauren D. Zarzar* 1, 3, 4 4 1. Department of Materials Science and Engineering, The Pennsylvania State University, 5 University Park, Pennsylvania 16082, USA 6 2. Department of Mechanical Engineering, Massachusetts Institute of Technology, 7 Cambridge, Massachusetts 02139, USA 8 3. Department of Chemistry, The Pennsylvania State University, University Park, 9 Pennsylvania 16082, USA 10 4. Materials Research Institute, The Pennsylvania State University, University Park, 11 Pennsylvania 16082, USA 12 *correspondence to [email protected] 13 14 Abstract 15 This report describes a straightforward and versatile approach to the fabrication of polymer 16 films comprised of microscale dome or well features that create structural color by interference 17 from total internal reflection. The fabrication approach utilizes assembly of glass particles at 18 monomer oil-water interfaces, providing control over the radius of curvature and contact angle 19 of the resultant microstructures. The influence of the microscale concave interface geometry 20 and refractive index contrast on the structural colors produced is systematically investigated 21 and the results are compared with those predicted by optical modeling. By dynamically 22 changing such parameters, for example by deforming the surfaces with mechanical force or 23 using temperature to change refractive index, stimuli-responsive color-changing surfaces and 24 structurally colored patterned images are demonstrated. This simple design and fabrication 25 method to produce structurally-colored surfaces may be of interest for both fundamental and 26 applied research areas such as dynamic displays, anti-counterfeiting technology, and 27 colorimetric sensors. 28 29 Table of contents image 30 31 32
Transcript of Tunable and esponsive R Structural Color from Polymeric ...

1
Tunable and Responsive Structural Color from Polymeric Microstructured Surfaces 1 Enabled by Interference of Totally Internally Reflected Light 2 3 Amy E. Goodling1, Sara Nagelberg2, Mathias Kolle2, and Lauren D. Zarzar*1, 3, 4 4
1. Department of Materials Science and Engineering, The Pennsylvania State University, 5 University Park, Pennsylvania 16082, USA 6
2. Department of Mechanical Engineering, Massachusetts Institute of Technology, 7 Cambridge, Massachusetts 02139, USA 8
3. Department of Chemistry, The Pennsylvania State University, University Park, 9 Pennsylvania 16082, USA 10
4. Materials Research Institute, The Pennsylvania State University, University Park, 11 Pennsylvania 16082, USA 12 *correspondence to [email protected] 13 14
Abstract 15 This report describes a straightforward and versatile approach to the fabrication of polymer 16 films comprised of microscale dome or well features that create structural color by interference 17 from total internal reflection. The fabrication approach utilizes assembly of glass particles at 18 monomer oil-water interfaces, providing control over the radius of curvature and contact angle 19 of the resultant microstructures. The influence of the microscale concave interface geometry 20 and refractive index contrast on the structural colors produced is systematically investigated 21 and the results are compared with those predicted by optical modeling. By dynamically 22 changing such parameters, for example by deforming the surfaces with mechanical force or 23 using temperature to change refractive index, stimuli-responsive color-changing surfaces and 24 structurally colored patterned images are demonstrated. This simple design and fabrication 25 method to produce structurally-colored surfaces may be of interest for both fundamental and 26 applied research areas such as dynamic displays, anti-counterfeiting technology, and 27 colorimetric sensors. 28 29 Table of contents image 30
31 32
2
Main Text 33 Unlike the color generated from dyes and pigments due to optical absorption,1 structural 34
colors can be created by optical interference occurring when light interacts with physical 35 structures within or on the surface of a material.2–4 Recently, we reported that structural 36 coloration is produced when light undergoes multiple total internal reflections (TIR) at concave 37 microscale interfaces;5 light rays propagating by different trajectories of TIR along an interface 38 experience varying optical path lengths and a subsequent phase shift that leads to interference 39 and structural colors. Unlike well-known nanoscale periodic materials that generate structural 40 color, such as photonic crystals, thin film multilayers, or diffraction gratings,2,6,7 interference 41 from TIR is due to light interacting with microstructures that have dimensions orders of 42 magnitude larger than the wavelength of visible light.5 The fundamentally different geometric 43 requirements provide opportunities for controlling structural colors in materials and via 44 processing methods where it previously would not have been possible, such as in liquid droplets 45 as previously reported.5 Here, we describe a simple route to fabrication of polymeric microwell 46 and microdome-array surfaces that display structural color via TIR interference and 47 characterize how the structural colors are affected by parameters such as refractive index 48 contrast and microstructure geometry. By assembling commercially available monodisperse 49 glass microparticles at monomer oil-water interfaces and polymerizing the monomer, we create 50 microdome arrays of controllable contact angle and radius of curvature over centimeter scale 51 areas. The microstructured surfaces can be replicated via soft lithography8 into a range of 52 polymeric materials of varying refractive indices and mechanical properties as a means to tune 53 the structural color and responsivity. We examine in detail the iridescent spectral characteristics 54 of the microdome and microwell arrays as a function of diameter, contact angle, and refractive 55 indices. We also demonstrate tunable color in response to stimuli such as temperature and 56 mechanical deformation. The ability to readily harness the TIR interference optical mechanism 57 in polymeric solid films and elastomers may provide accessible routes for utilizing dynamic 58 structural coloration in stimuli responsive materials, displays, coatings, or sensors.9–12 59 In order to create surfaces with microscale hemispherical structures that support 60 multiple trajectories of TIR to generate interference (Figure 1a), we anticipated that a simple 61 approach for large-area patterning could be partially embedding monodisperse spherical 62 particles at a uniform depth within a polymer film. Our fabrication method is outlined in Figure 63 1b. In brief, a thin layer of uncured Norland Optical Adhesive 71 (NOA 71) was poured into a 64 Petri dish followed by an aqueous suspension of soda lime glass particles (40-43 µm diameter 65 with 95% of particles in range, 0.01 g/mL) in 1 mM hexadecyltrimethylammonium bromide 66 (CTAB) aqueous surfactant. The CTAB was necessary to render the particles sufficiently 67 hydrophobic to be wetted by the NOA 71 and partially sink into the oil-water interface. UV 68 light exposure was used to cure the NOA 71 and fix the particles in place. We then washed 69 away the aqueous phase, leaving behind an array of glass spheres partially embedded in 70 polymer. An inverse replica of this domed surface was fabricated in crosslinked 71 polydimethylsiloxane elastomer (PDMS) to form a uniform array of wells (Figure 1c-d). The 72 PDMS wells could be subsequently used as a mold to fabricate polymer domes of various 73 materials, such as UV-curable polymers, numerous times via soft lithography.8 Domes 74 replicated in epoxy OG142-87 (𝑛𝑛 = 1.51) when viewed in air (𝑛𝑛 = 1) appeared white in 75 reflection (Figure S1). The air backing creates a large refractive index contrast resulting in 76 many trajectories of TIR which do not all interfere constructively resulting in muter colors; 77 increased refractive index contrast also results in a larger amount of background reflection 78 which further washes out the colors, thereby causing a white appearance. However, when the 79 epoxy surface was submerged in heptane (𝑛𝑛 = 1.39) to reduce the refractive index contrast, 80 bright structural coloration was observed (Figure 1e-f, Video S1). 81

3
82 83
Figure 1. Fabrication of microwells and domes with structural coloration due to 84 interference from TIR. a. Schematic of a concave geometry generating interference from TIR 85 of incident light. Collimated light impinges upon the concave interface between a high and a 86 low index medium and undergoes TIR. Different paths of TIR have different optical path 87 lengths leading to a shift in phase that causes interference and structural color. b. Method of 88 fabrication for monodisperse microwells and domes. (i) A thin layer of uncured NOA 71 89 monomer is pipetted into a Petri dish. An aqueous surfactant solution containing monodisperse 90 glass particles is added. The glass particles assemble at the water-NOA 71 interface. (ii) The 91 sample is cured with UV light, leaving the particles embedded partially in the NOA 71. (iii-iv) 92 The surface is molded in crosslinked PDMS to form wells. (v) Polymer domes are replicated 93 from the PDMS wells. See Methods for experimental details. c, d. Scanning electron 94 microscopy (SEM) and optical profilometry images, respectively, of PDMS wells formed from 95 soda lime glass particles (95% of particles having diameters in the range of 40-43 µm) 96 embedded in NOA 71 deposited from an aqueous solution of 1 mM CTAB and 20 v/v% 97 isopropyl alcohol. The resultant wells have 𝑟𝑟 = 20.7 ± 1.1 𝜇𝜇𝜇𝜇, 𝜃𝜃𝐶𝐶𝐶𝐶 = 76.0 ± 5.7° (average 98 and standard deviation as measured by the optical profilometry, sample size is 45 for radius and 99 15 for contact angle calculations, respectively). Scale, 25 µm. e. Reflection optical micrograph 100 of epoxy domes (𝑛𝑛 = 1.51) replicated from PDMS wells with the same geometry as in (c-d) 101 submerged in heptane (𝑛𝑛 = 1.39). Scale, 25 µm. f. Photographs of the same sample as in (e) of 102 epoxy domes (𝑛𝑛 = 1.51) submerged in heptane (𝑛𝑛 = 1.39 , viewed macroscopically under 103 collimated white light illumination. As the viewing angle 𝜑𝜑 rotates, the color changes (as also 104 seen in Video S1). Scale, 1 cm. 105
106

4
Because these iridescent surfaces display different colors as a function of viewing and 107 illumination angle, we required a method to “map” the iridescence in three dimensions in order 108 to characterize and compare the optical properties of the surfaces. We used our previously 109 reported method5 in which the sample’s reflected light is “projected” onto the inside of a 110 translucent hemispherical screen (which is a half of a ping-pong ball), providing correlation of 111 the colors with specific reflection directions in spherical coordinates (Figure 2a) Qualitative 112 comparison of an experimentally collected color distribution from the sample shown in Figure 113 1e,f with a simulated color distribution5 for the same geometry, refractive indices, and 114 illumination angle yielded a close match (Figure 2b). We used a spectrometer to collect a 115 reflection spectrum for several specific reflection angles and found that the spectra also matched 116 well with those predicted by the interference optical model (Figure 2b).5 Please refer to the 117 Methods section for information on the optical model. Thus, this fabrication method appeared 118 suitable for the formation of microwell or microdome arrays that, upon interfacing with an 119 appropriately high or low refractive index material respectively, can generate bright iridescent 120 color from TIR interference. 121
122 123
124 Figure 2. Spectral characterization of surfaces generating structural color from TIR. a. 125 Schematic of the method used to characterize the iridescent color distribution in spherical 126 coordinates. Collimated white LED light illuminates the sample through a 3 mm hole in a 127 translucent hemisphere (a half ping-pong ball). The reflected colors are projected onto the inside 128 surface of the translucent hemisphere, which acts as a screen. The angles of 𝜃𝜃 and 𝜑𝜑 are defined 129 such that 𝜃𝜃 = 0° corresponds to the sample normal and the light source is at 𝜑𝜑 = 0°. b. Top 130 row: photograph of the reflected color distribution collected as shown in (a) from domes of 131 epoxy (𝑟𝑟 = 19.4 ± 1.97 𝜇𝜇𝜇𝜇, 𝜃𝜃𝐶𝐶𝐶𝐶 = 72.5 ± 5.1°,𝑛𝑛 = 1.51) backed in water (𝑛𝑛 = 1.33) with 132 corresponding spectra collected at 𝜃𝜃 = 45° for varying values of 𝜑𝜑, as color coded in the key. 133 White “x’s” in the photograph show where the spectra where collected. Illumination angle was 134 (𝜃𝜃 = 45°,𝜑𝜑 = 0°). Scale, 1 cm. Bottom row: modelled color distribution and calculated spectra 135 for domes of (𝑟𝑟 = 18 𝜇𝜇𝜇𝜇, 𝜃𝜃𝐶𝐶𝐶𝐶 = 75°,𝑛𝑛 = 1.505) backed with index 𝑛𝑛 = 1.33 for 136 comparison to the experimental data. The values of the reflectance shown here are estimates 137 relative to a Lambertian scatterer, and a description of the estimation method is included in the 138 Methods sections, “Measuring the samples’ reflection spectra” and “Quantifying reflectance in 139 the theoretical model of the microstructures’ optical properties”. 140 141
142 143 Having developed a straightforward method to fabricate polymer surfaces displaying 144
TIR interference, we next investigated whether we could control the structural color through 145 variations in geometrical parameters and refractive index contrast. Based on the mechanism of 146 TIR interference,5 we expect the structural colors to be dependent on the contact angle and 147

5
radius of curvature of the concave optical interface. For a given glass microparticle used during 148 surface fabrication, the contact angle, 𝜃𝜃𝐶𝐶𝐶𝐶, of the resultant dome should be dependent on the 149 contact angle of the microparticle at the monomer oil ̶ water interface (e.g. how far the particle 150 sinks into the monomer oil). Particles that are more deeply embedded into the monomer would 151 thus result in domes with a lower effective contact angle (and hence, shallower wells upon 152 replication in PDMS, following the procedure in Figure 1b). We found that by varying the 153 concentration of isopropyl alcohol in the aqueous CTAB solution, we were able to tune the 154 interfacial tension and manipulate how far the glass particles penetrated into the oil layer for 155 𝜃𝜃𝐶𝐶𝐶𝐶 values ranging from 76.0 ± 5.7° to 93.2 ± 5.1° (average and standard deviation determined 156 by optical profilometry, sample sizes of at least 14 structures). In order to expand the range of 157 accessible contact angles, we replaced the aqueous CTAB surfactant solution during surface 158 fabrication with PDMS oil of varying viscosity, which we anticipated would alter the wetting 159 dynamics of the particles at the liquid-liquid interface.13,14 Use of PDMS oil with viscosity of 160 10 cSt resulted in a contact angle of 75.4 ± 1.8°, close to that produced using an aqueous phase 161 with CTAB and 20 wt% isopropanol solution; when 1 cSt viscosity PDMS oil was instead used, 162 much lower contact angles of 52.3 ± 2.6° were generated (Figure S2). Particles that were 163 embedded at a contact angle much higher than 𝜃𝜃𝐶𝐶𝐶𝐶 = 90° could not be easily replicated by 164 PDMS molding and thus were not considered here. 165
Domes with contact angles ranging from ≈76° to 93° made of a UV-curable epoxy OG 166 142-87 (𝑛𝑛 = 1.51) were submerged in water (𝑛𝑛 = 1.33) and their color distributions were 167 collected at an illumination angle of (𝜃𝜃 = 45°,𝜑𝜑 = 0°) (Figure 3a). The contact angle of the 168 domes determined which light trajectories were allowed for a given input and output angle 169 combination; as the contact angle decreased from 93° to 76°, the total number of light rays that 170 were able to undergo TIR upon impinging at the concave interface increased for the given 171 illumination angle, and hence the number of possible trajectories of TIR was also increased. As 172 a result, more vibrant and distinct colors were seen in Figure 3a(iii) (lower contact angle) as 173 compared to Figure 3a(i) (higher contact angle). The experimental color distributions matched 174 well with the calculated color distributions (Figure 3a, Figure S3). 175
The radius of curvature, 𝑟𝑟, is also expected to influence the structural color because it 176 impacts the optical path length for light undergoing TIR. Radius of curvature is most easily 177 manipulated by starting with glass particles of a different diameter upon initial surface 178 fabrication. We examined surfaces generated from three diameters of particles (29-32 µm, 40-179 43 µm and 98-102 µm, 95% of particles falling in range). Resultant PDMS wells (and 180 subsequent replicated domes) had average 𝑟𝑟 with standard deviation of 14.6±0.8 µm, 20.7±1.1 181 µm and 47.0±6.4 µm, respectively, as determined by optical profilometry for sample sizes of 182 76, 45, and 10, respectively (Figure 3b). Structural color distributions from domes fabricated 183 in epoxy OG 142-87 (𝑛𝑛 = 1.51) and submerged in water (𝑛𝑛 = 1.33) of the three differently 184 sized domes are shown in Figure 3b and compared well with the colors predicted by the optical 185 model. For a constant refractive index contrast, the dome array with the smallest r had the 186 largest angular separation of the colors, while larger values of 𝑟𝑟 generated bands of color that 187 were narrower and more closely spaced. In essence, for domes with smaller radii, each ray 188 trajectory is shorter and the optical path length difference between interfering paths is smaller, 189 resulting in less pronounced spectral shifts as a function of viewing angle. 190
191

6
192 Figure 3. Contact angle and radius of curvature of the microwells and domes affects the 193 structural color. a. The contact angle of the microdomes was tuned by using varying 194 concentrations of isopropyl alcohol during initial assembly of particles (following the procedure 195 in Figure 1). Top row: Resultant geometries of structures replicated from PDMS molds of 40-196 43 µm diameter particles embedded in NOA 71 from (i) 0 v/v%, (ii) 10 v/v%, and (iii) 20 v/v% 197 isopropyl alcohol with 1 mM CTAB. These conditions yielded 𝑟𝑟 = 20.7 ± 1.1 𝜇𝜇𝜇𝜇 and 𝜃𝜃𝐶𝐶𝐶𝐶 =198 93 ± 5.1°, 82 ± 5.4° and 76.0 ± 5.7° for geometries (i-iii), respectively. The radius of 199 curvature and contact angles were measured using optical profilometry (second row, scale is 20 200 µm). Third row: Photographs of the color distribution generated from replica epoxy domes (𝑛𝑛 =201 1.51) submerged in water (𝑛𝑛 = 1.33) for geometries (i-iii). Light angle (𝜃𝜃 = 45°,𝜑𝜑 = 0°), 202 camera angle (𝜃𝜃 = 0°,𝜑𝜑 = 0°). Scale, 1 cm. Bottom row: Calculated color distributions. Input 203 parameters for model values: 𝑟𝑟 = 20.0 𝜇𝜇𝜇𝜇 and 𝜃𝜃𝐶𝐶𝐶𝐶 = 95.0°, 80.0° and 76.0°. b. Varying the 204 diameter of monodisperse glass particles used during fabrication (following method from 205 Figure 1) was used to tune the radius of curvature of the resultant microwells and domes. 206 Specifically, the samples shown are epoxy dome replicas fabricated from PDMS molds of 207 particles of (i) 29-32 µm, (ii) 40-43 µm and (iii) 98-102 µm diameter deposited from aqueous 208 surfactant solution of 1 mM CTAB and 20 v/v% isopropyl alcohol. These conditions yielded 209 geometries of (𝑟𝑟 = 14.6 ± 0.8 𝜇𝜇𝜇𝜇, 𝜃𝜃𝐶𝐶𝐶𝐶 = 79.2 ± 3.9°) for (i), (𝑟𝑟 = 20.7 ± 1.1 𝜇𝜇𝜇𝜇, 𝜃𝜃𝐶𝐶𝐶𝐶 =210 76.1 ± 5.7°) for (ii), and (𝑟𝑟 = 47.0 ± 6.4 𝜇𝜇𝜇𝜇, 𝜃𝜃𝐶𝐶𝐶𝐶 = 86.4 ± 4.6°) for (iii). Stated dimensions 211 are the averages and standard deviations as measured by optical profilometry (second row, scale 212 20 µm). Third and fourth rows are photographs of the color distributions and calculated color 213 distributions, respectively, correlating to the dimensions of (b, i-iii) (scale, 1 cm). Input 214 parameters for the calculated color distributions: (𝑟𝑟 = 14.0 𝜇𝜇𝜇𝜇, 𝜃𝜃𝐶𝐶𝐶𝐶 = 79.0°) for (i), (𝑟𝑟 =215 20.0 𝜇𝜇𝜇𝜇, 𝜃𝜃𝐶𝐶𝐶𝐶 = 76.0°) for (ii), and (𝑟𝑟 = 50.0 𝜇𝜇𝜇𝜇, 𝜃𝜃𝐶𝐶𝐶𝐶 = 85.0°) for (iii). 216
217 218 Having developed a method to fabricate the structurally colored surfaces in elastomeric 219
PDMS, we were interested as to whether mechanical deformation could be used to actuate the 220 colors and examine the effect of an anisotropic structure on the resultant iridescence. We 221 created PDMS wells (𝑛𝑛 = 1.42, 𝑟𝑟 = 20.7 ± 1.1 𝜇𝜇𝜇𝜇,𝜃𝜃𝐶𝐶𝐶𝐶 = 76 ± 5.0°) filled with a higher 222 refractive index silicone, Dowsil VE-6001 (𝑛𝑛 = 1.53) to produce a fully solidified elastomeric 223 sample. Stretching of the elastomer wells by even 10 or 15% resulted in significant 224

7
mechanically-induced shifts in structural color (Figure 4a,b, Video S2). To create surfaces 225 with an array of permanent ellipsoidal structures, PDMS wells were filled with UV curable 226 epoxy OG 142-87 (𝑛𝑛 = 1.51) , which was polymerized while strain in the PDMS was 227 maintained at 15%. The anisotropic ellipsoidal domes, along with precursor spherical domes of 228 the same material, were then submerged in water (𝑛𝑛 = 1.33) and color distribution maps were 229 collected at illumination angles of (𝜃𝜃 = 0°,𝜑𝜑 = 0°) and (𝜃𝜃 = 50°,𝜑𝜑 = 0°) for ellipsoidal 230 major axis orientations along 𝜑𝜑 = 0° and 90° (Figure 4c,d). Under illumination at (𝜃𝜃 =231 0°,𝜑𝜑 = 0°) the spherical domes generated a circularly symmetric color distribution with a 232 singular ring of color, largely red, centered around the light source (Figure 4c, middle column). 233 In comparison, ellipsoidal structures under the same illumination had a distinctly different color 234 distribution, where the red nearly entirely disappeared and was replaced by a light blue and 235 green oval pattern with the long axis of the oval perpendicular to the long axis of the ellipsoidal 236 domes (Figure 4c). The elliptical domes imaged with an oblique light angle (𝜃𝜃 = 50°,𝜑𝜑 = 0°) 237 similarly yielded a “stretched” version of the color distribution pattern as compared to the 238 spherical domes (Figure 4d). Hence, the surfaces’ colors can be varied by mechanical 239 deformation of an elastomeric surface or rotation of ellipsoidal structures, changing not only 240 the positions of colors, but in some cases actually generating new colors previously not visible 241 under the given illumination conditions. 242
243
244 Figure 4. Mechanical deformation was used to create ellipsoidal wells and domes and alter 245 structural color. a. Transmission optical micrographs of wells that have been stretched in two 246 different directions, which correspond to the macroscale images aligned beneath in (b). Scale, 247 50 µm. b. Photographs of elastomeric PDMS wells (𝑛𝑛 = 1.42) with the same geometry as (a), 248 (𝑟𝑟 = 20.7 ± 1.1 𝜇𝜇𝜇𝜇, 𝜃𝜃𝐶𝐶𝐶𝐶 = 76.0 ± 5.7) filled with a high index UV-curable elastomer (𝑛𝑛 =249 1.53) being stretched and viewed under two different illumination and viewing conditions. Top 250 row illumination (𝜃𝜃 = 0°,𝜑𝜑 = 0°) and camera (𝜃𝜃 = 15°,𝜑𝜑 = 90°); bottom row illumination 251 (𝜃𝜃 = 50°,𝜑𝜑 = 0°) and camera (𝜃𝜃 = 50°,𝜑𝜑 = 110°). The three images in each row correspond 252 to the unstretched sample (middle) and stretching in two orthogonal directions (left and right). 253 Yellow arrows show the stretching direction relative to the unstretched sample (center). Scale, 254 1 cm. c-d. Photographs of the projected color distributions from ellipsoidal domes with 255 geometry similar to (a-b) but replicated in epoxy (𝑛𝑛 = 1.51) and submerged in water (𝑛𝑛 =256 1.33). Schematics in the top row illustrate the surface orientation of the ellipsoidal domes. 257 Images in (c) were taken under illumination at (𝜃𝜃 = 0°,𝜑𝜑 = 0°) and images in (d) were taken 258 under illumination at (𝜃𝜃 = 50°,𝜑𝜑 = 0°). In (d), the major axis of the ellipsoids is at 𝜑𝜑 = 90° 259 (leftmost image) and 𝜑𝜑 = 0° (rightmost image) defined relative to the light, as shown in the 260 top-row schematics. Scale, 1 cm. 261
262 263 In addition to geometric effects influencing structural color from TIR, we also expect 264
refractive index contrast to impact the reflected color distribution, because the critical angle for 265 TIR, 𝜃𝜃𝑐𝑐 , is directly related to the refractive indices at the optical interface, where 𝜃𝜃𝑐𝑐 =266

8
arcsin (𝑛𝑛2 𝑛𝑛1� ).15 As the refractive index contrast increases, the critical angle decreases, and 267 more paths of TIR become available. To examine the effect of the refractive index contrast on 268 the structural color, we filled PDMS wells (𝑛𝑛2 = 1.42) with liquids of varying refractive index, 269 where the refractive index was tuned through mixing of tetrabromoethane (𝑛𝑛1 = 1.64), benzyl 270 benzoate (𝑛𝑛1 = 1.57) and n-decane (𝑛𝑛1 = 1.41). The color distributions were collected at an 271 illumination angle of (𝜃𝜃 = 50°,𝜑𝜑 = 0°) for several refractive index contrasts (Figure 5a). At 272 too low of an index contrast, (e.g. 𝑛𝑛1 = 1.49) in Figure 5a), an insignificant fraction of light 273 undergoes TIR and no reflected colors were observed. As the refractive index contrast increased, 274 more paths of TIR became available, leading to interference and causing bands of color to 275 appear. Use of increasingly higher refractive index oils affected the perceived color in multiple 276 ways. Besides increasing the refractive index contrast, and thus increasing the total amount of 277 light undergoing TIR, increasing 𝑛𝑛1 also refracts the illuminating light rays to a greater degree 278 such that the illuminating rays have slightly different incident angles upon striking the concave 279 microscale interface; this refraction may not only contribute to increased availability of TIR 280 paths but may also produce a slight shift in the position of the color bands, as seen in Figure 281 5a. Increasing 𝑛𝑛1 also increases the optical path length of each of the light trajectories; this has 282 an effect similar to increasing the size of the dome and is due to the fact that the optical path 283 length is the product of physical path length and the refractive index. If 𝑛𝑛1 is increased while 284 holding the refractive index contrast constant (i.e. 𝑛𝑛2 increased proportionally) then the same 285 change in color would be expected as occurs when changing only the radius of curvature (again, 286 proportionally). The magnitude of refractive index contrast �𝑛𝑛1 𝑛𝑛2� � also determines the 287 amount of phase change occurring upon each reflection and so also affects the colors that are 288 observed. Higher index contrast additionally leads to an overall increase in the intensity of the 289 reflected light (Figure 5a); however, if too high of a refractive index contrast is used, the 290 surface appears whiter as a result of the many possible trajectories of TIR which do not all 291 interfere constructively and hence generate muter colors (Figure S1). While the experiments 292 shown in Figure 5a only examine the effect of refractive index 𝑛𝑛1 for one specific radius of 293 curvature and contact angle, additional combinations of geometries and index contrasts 294 achieved by varying 𝑛𝑛2 are shown in Figure S4. In summary, changing the refractive index 295 contrast allows tuning of the intensity and direction of the reflected colors due to variations in 296 refraction and changes to TIR trajectories and path length differences that cause the interference. 297
We used the variation in color as a function of refractive index contrast to construct an 298 iridescent multi-colored image by “painting” onto the PDMS wells with different refractive 299 index oils, benzyl benzoate (𝑛𝑛 = 1.57) and tetrabromoethane (𝑛𝑛 = 1.64) (Figure 5b, Video 300 S3). Glass capillary tubes loaded with each oil were touched to the PDMS wells to selectively 301 fill specific wells with the oil. Wells filled with high index oils generated TIR interference, 302 whereas the empty wells appeared black, because they do not have the appropriate index 303 contrast for TIR (Figure 5b). When illuminated at an angle of (𝜃𝜃 = 50°,𝜑𝜑 = 0°) and viewed 304 at (𝜃𝜃 = 30°,𝜑𝜑 = 40°), the wells filled with the higher index tetrabromoethane appeared a pastel 305 pink while the wells filled with benzyl benzoate gave a vibrant green color, yielding a picture 306 of a rose. These colors correlated, as expected, to the angular positions in the color distribution 307 maps for those index contrasts (Figure 5a,b). We also explored whether dynamic changes in 308 refractive index contrast could be used to responsively change the reflected color. Liquid 309 crystals experience abrupt changes in birefringence, and hence refractive index, when 310 undergoing transitions between ordered and disordered phases.16 Curious as to how birefringent 311 liquid crystals would influence interference from TIR, we filled PDMS microwells (𝑛𝑛 =312 1.42, 𝑟𝑟 = 20.7 ± 1.1 𝜇𝜇𝜇𝜇, 𝜃𝜃𝐶𝐶𝐶𝐶 = 76.0 ± 5.7) with 4-cyano-4'-pentylbiphenyl (5CB) liquid 313 crystal. At room temperature, 5CB has a nematic structure with vertical molecular alignment 314 on PDMS17 (Figure S5) and refractive indices for the extraordinary and ordinary ray18 315 (𝑛𝑛𝑒𝑒 ≈ 1.72,𝑛𝑛𝑜𝑜 ≈ 1.53) that are high enough, in principle, to produce color through TIR when 316
9
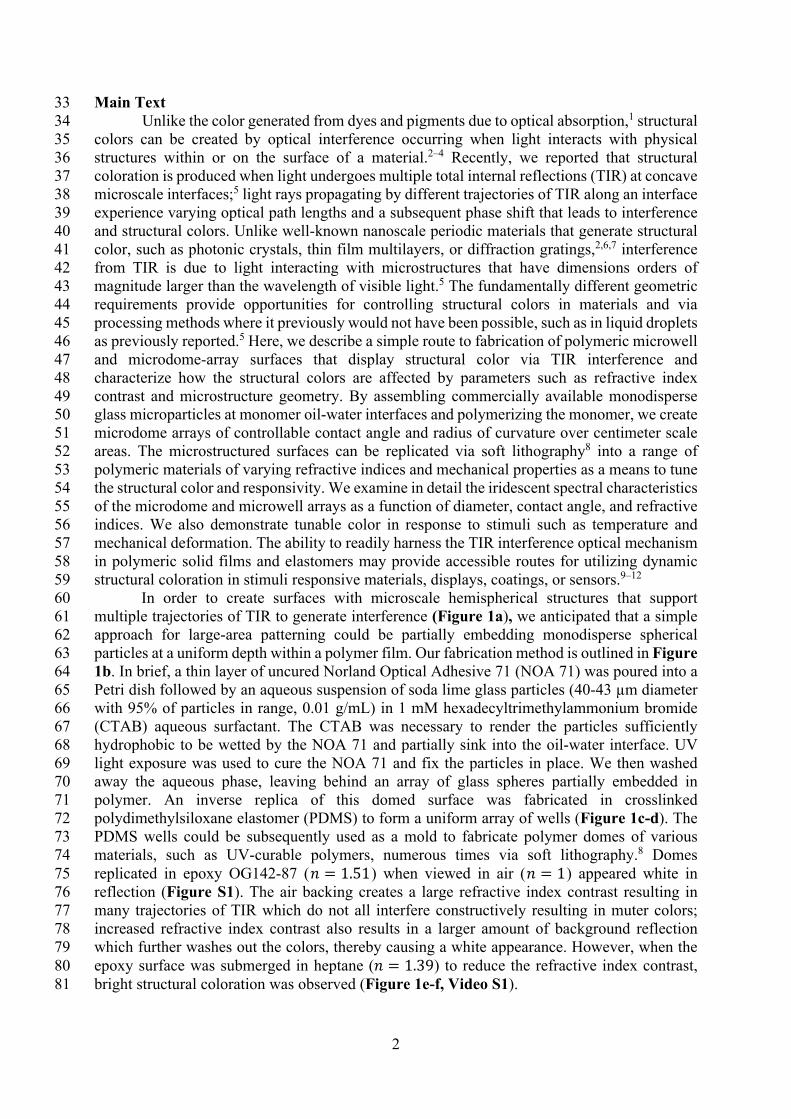
paired with PDMS wells ( 𝑛𝑛 = 1.42 ). However, the birefringence influenced the TIR 317 interference mechanism and resulted in a dull, polarization dependent pinkish reflection. When 318 the sample was heated above the nematic-to-isotropic phase transition temperature (TN-I = 319 35°C),18 the liquid crystal transitioned into an isotropic state with 𝑛𝑛 = 1.59 , and vibrant 320 iridescent colors due to TIR interference became visible (Figure 5c, Video S4). This 321 temperature-induced color change transition was fully reversible. The reflected color could also 322 be thermally switched on and off by backing domes with two immiscible oils that, upon heating 323 above a critical temperature, mix to form a solution that has too low of an index contrast for 324 TIR. This approach is shown in Figure 5d with domes of epoxy (𝑛𝑛 = 1.51) submerged in a 325 low index fluorinated oil, 2-(trifluoromethyl)-3-ethoxydodecafluorohexane (pure oil, 𝑛𝑛 =326 1.28), with a higher index hydrocarbon oil mixture (benzyl benzoate and toluene in a 1:5 327 volume ratio, 𝑛𝑛 = 1.50) floating on top. The index contrast between the domes and fluorinated 328 oil supports TIR to give an iridescent color, but as the solution was heated above the oils’ critical 329 solution temperature (TC < T=50 °C) all oils became miscible, raising the refractive index of 330 the mixture to 𝑛𝑛 = 1.44. As shown in Figure 5d, this index contrast was too low to generate 331 TIR interference, and the color disappeared. This mechanism was also fully reversible, and 332 upon cooling below TC, the color reappeared. 333
334
335 Figure 5. Patterned and responsive structural color patterns achieved by varying 336 refractive index contrast. a. To probe the effect of refractive index contrast on the structural 337 color, we filled PDMS wells (𝑟𝑟 = 14.6 ± 0.8 𝜇𝜇𝜇𝜇,𝜃𝜃𝐶𝐶𝐶𝐶 = 79.2 ± 3.9°) with oils of increasingly 338 lower refractive index. Different oil refractive indices were achieved through mixing of 339 tetrabromoethane (𝑛𝑛 = 1.64), benzyl benzoate (𝑛𝑛 = 1.57) and/or n-decane (𝑛𝑛 = 1.42). As the 340 refractive index contrast was reduced, the color began to fade as less light undergoes TIR. Scale, 341 1 cm. b. PDMS wells from (a) were filled with different refractive index oils (benzyl benzoate, 342 𝑛𝑛 = 1.57, and tetrabromoethane, 𝑛𝑛 = 1.64), to create a structurally-colored image of a rose. 343 Camera: (𝜃𝜃 = 50°,𝜑𝜑 = 40°), illumination: (𝜃𝜃 = 50°,𝜑𝜑 = 0°). Scale, 1 cm. c. Temperature 344 responsive color change achieved by filling PDMS wells (same geometry as used in (a)) with 345 5CB liquid crystal. At room temperature, the nematic 5CB anchored on the surface of the 346
10
PDMS (Figure S5) and the birefringence affected interference from TIR resulting in less 347 colorful, pinkish hues. As the sample was heated, the 5CB underwent a nematic to isotropic 348 transition, losing molecular alignment, and coloration from TIR interference became more 349 intense. Scale, 5 mm. d. Iridescent color switched on and off in response to temperature by 350 varying the index contrast at the optical interface through oil mixing. Domes of epoxy (𝑛𝑛 =351 1.51) with the same geometry as in (a) were immersed in low index 2-(trifluoromethyl)-3-352 ethoxydodecafluorohexane (oil 2, 𝑛𝑛 = 1.33, refractive index measured after saturating with the 353 hydrocarbon mixture) onto which an immiscible layer of higher index hydrocarbon (5:1 volume 354 ratio of toluene to benzyl benzoate, oil 1, 𝑛𝑛 = 1.50 ) was added. A 3:1 volume ratio of 355 hydrocarbon to fluorocarbon oil was used. The sample and solution were heated above the oils’ 356 critical solution temperature (TC < T=50 °C), which led to oil mixing (new refractive index 𝑛𝑛 =357 1.44). The index contrast with the polymer domes was thus reduced and the color faded. The 358 color change was reversible upon cooling. Scale, 5 mm. 359
360 361
In summary, we have presented a straightforward method to produce and manipulate 362 structural coloration in polymeric surfaces by harnessing interference from total internal 363 reflection in microwells and microdome structures. The approach of embedding glass particles 364 at the interface of water or PDMS oil and UV curable monomer provided a route to tuning both 365 the radius of curvature and contact angle of the resultant hemispherical microstructures, key 366 geometric parameters that affect the structural color. Surfaces fabricated with this method could 367 be easily replicated into other polymers of choice via PDMS molding. We examined the 368 relationship between contact angle, radius of curvature, refractive index contrast, and structure 369 symmetry on the distribution of reflected colors, and compared the results to those predicted by 370 optical modeling. By dynamically changing such parameters, for example by deforming the 371 surfaces with mechanical force or using temperature to change refractive index, we could create 372 stimuli-responsive color-changing surfaces and structurally colored patterned images. Many 373 other stimuli-responsive polymeric platforms with similar geometries could be envisioned, such 374 as those that respond to pH, ionic strength, or biomolecules to create colorimetric sensors,19–22 375 for example. Given that long range nanoscale periodicity is not needed, we expect that this 376 fabrication approach and optical mechanism may provide an accessible route to creating and 377 tuning structural colors over larger areas in a greater diversity of materials than is currently 378 accessible, enabling applications ranging from dynamic camouflage to anti-counterfeiting 379 technology. 380 381 Experimental Methods 382 Chemicals and materials: Hexadecyltrimethylammonium bromide (CTAB) (Fluka, >99.0%), 383 isopropyl alcohol (VWR, >99.8%), Norland Optical Adhesive 71 (Norland), benzyl benzoate 384 (Alfa Aesar, 99+%), n-decane (Alfa Aesar, 99+%), 1,1,2,2-tetrabromoethane (TCI, >98.0%), 385 toluene (VWR, >99.5%), 2-(trifluoromethyl)-3-ethoxydodecafluorohexane (Synquest 386 Laboratories, 99%), perfluorooctane (TMC Industries, >98%), 4-cyano-4’-pentylbiphenyl 387 (Frontier Scientific, 99%), Sylgard 184 polydimethylsiloxane (PDMS) (Dow Corning), Dowsil 388 VE-6001 UV Optical Bonding (Dow Corning), PMS Black Silc Pig pigment (SmoothOn), soda 389 lime glass particles (40-43 𝜇𝜇m, 29-32 𝜇𝜇m, 98-102 𝜇𝜇m diameter, 2.5 g/cc) (Cospheric), OG 142-390 87 epoxy (Epotek), PDMS oil of 10 cSt and 1 cSt (Gelest). 391 392 Microdome and microwell fabrication method 393 Uncured NOA 71 was placed into a thin layer in a petri dish. An aqueous solution of 1 mM 394 CTAB with 0.01g/mL of dispersed glass particles (40-43 𝜇𝜇m, 29-32 𝜇𝜇m, or 98-102 𝜇𝜇m 395 diameter) was pipetted onto the surface of the uncured NOA 71. The dense particles sank to the 396 water-monomer interface, forming a monolayer. Isopropyl alcohol could be added to the 397

11
particle solution in varying concentrations (0% v/v, 10% v/v and 20% v/v) to tune the depth the 398 particles settled at the aqueous-monomer interface. The samples were then cured using an 399 OmniCure UV lamp (mercury bulb, 17 W/cm2) for 1 minute, fixing the particles into the cured 400 optical adhesive. The aqueous phase was then removed, and the sample was washed with water 401 and baked at 50°C for 12 hours to complete the curing of the NOA 71. A variant of this method 402 was achieved with using PDMS oil (either 1 cSt or 10 cSt) instead of the aqueous phase; the 403 procedure was otherwise the same. Dow Corning Sylgard 184 PDMS was then used to create 404 an inverse replica from the soda lime silica particles fixed in the cured NOA 71. The PDMS 405 base and hardener were mixed in a 10:1 mass ratio, mixed, degassed, poured over the polymer 406 sample, and cured in an oven at 50°C for at least two hours. The cured PDMS was peeled off 407 the fixed particles to yield an array of wells. The PDMS wells could be used directly to create 408 the structural color by filling the wells with a high refractive index oil or polymer, or the wells 409 could be used as a mold to fabricate domes of various polymers, such as epoxy OG 142-87. 410 411 Sample imaging and characterization 412 For large area sample illumination, an Amscope LED-50W light with a collimating lens was 413 used to illuminate the sample. For selected area illumination, a Thorlabs LED light (MWWHF2, 414 4000 K, 16.3 mW) equipped with a Ø200 µm fiber optic cable and collimating lens (CFC-2X-415 A) was used. The translucent dome used for capturing the iridescent color distribution pattern 416 was created by cutting a 40 mm diameter ping-pong ball in half with a razor blade and drilling 417 a 3 mm diameter hole in the side with a Dremel Model 220. The ping-pong ball dome screen 418 was then placed on top of the well or dome sample and collimated light from the LED was 419 passed through the hole into the center of the sample. All macroscale photographs were taken 420 using a Canon EOS Rebel T6 DSLR camera mounted to an optical table and positioned at 421 specific angles, as indicated in the primary text. Scanning electron micrograph (SEM) images 422 were taken using an FEI Nova NanoSEM 630. Profilometry images were taken using a Zygo 423 NexView 3D Profilometer. Optical microscope brightfield images were taken using a Nikon 424 Eclispe Ti-U inverted microscope and an Image Source DFK 23UX249 color camera. 425 426 Effect of varying refractive index contrast on color 427 To test how the refractive index affects the perceived color (Figure 5), PDMS wells replicated 428 from 40-43 µm glass particles embedded in NOA 71 originally in an aqueous phase of 1 mM 429 CTAB and 20 v/v% in isopropyl alcohol were filled with varying concentrations of 430 tetrabromoethane, benzyl benzoate and n-decane to observe the effect of refractive index 431 difference at the concave interface. The refractive indices of the oil mixtures were measured 432 using a J457FC refractometer (Rudolph Research Analytical). 433 434 Mechanical force experiments 435 Stretchable films of well arrays were fabricated by removing cured NOA 71 with fixed soda 436 lime silica particles (40-43 𝜇𝜇m diameter) at the surface from its 5.5 cm Petri dish and placing it 437 in a larger 8.5 cm Petri dish. PDMS dyed black with Silc pig pigment was then poured over the 438 polymer sample and cured to form an array of microwells that were indented into a 5.5 cm well 439 a couple mm deep. Dowsil VE-6001 was used to fill the 5.5 cm well with the PDMS and cured 440 with an OmniCure UV lamp (mercury bulb, 17 W/cm2) for 2 minutes. Because the Dowsil 441 remains tacky when cured, an additional thin (1 mm) layer of transparent PDMS poured on the 442 surface and cured to form the sample. 443 444 Fabricating ellipsoidal domes 445 A sample of glass particles (40-43 𝜇𝜇m diameter) embedded in NOA 71 was prepared from an 446 aqueous solution of 1 mM CTAB and 20 v/v% in isopropyl alcohol. PDMS wells were molded 447 from the embedded particles. These wells were stretched using two metal clamps, filled with 448
12
uncured OG 142-87, and then UV cured for 1 minute at 100% power of an OmniCure UV lamp 449 (mercury bulb, 17 W/cm2). The polymerized domes were then removed from the PDMS mold. 450 The cured polymer was then removed and backed with water to give an index contrast that 451 promotes TIR and iridescent color. 452 453 Liquid crystal heating 454 PDMS wells replicated from particles embedded in NOA 71 originally in an aqueous phase of 455 1mM CTAB and 20 v/v% in isopropyl alcohol were filled with 5CB liquid crystal in its nematic 456 state at room temperature. The wells were heated to 40°C on a hot plate, above the nematic to 457 isotropic transition temperature, where the liquid crystal loses its birefringence and the resulting 458 color became much more vibrant. 459 460 Drawing structural color images in microwells 461 PDMS wells replicated from particles (29-32 𝜇𝜇m diameter) embedded in NOA 71 fabricated 462 using an aqueous phase of 1 mM CTAB and 20 v/v% in isopropyl alcohol were selectively 463 filled to create an image. 1.05 mm ID, 1.5 mm OD borosilicate square capillary tubes were 464 filled with benzyl benzoate or tetrabromoethane. The capillary was dragged across the surface 465 of the PDMS, filling the wells with the oils to create an image of a rose. 466 467 Temperature-responsive structural color using phase separation of oils 468 PDMS wells were generated from particles (40-43 𝜇𝜇m) embedded in NOA 71 originally 469 deposited from an aqueous phase of 1 mM CTAB and 20 v/v% in isopropyl alcohol. Domes of 470 OG 142-87 (n=1.51) were replicated from the PDMS wells and the surface was placed in 35 471 mm Petri dish containing fluorinated oil, 2-(trifluoromethyl)-3-ethoxydodecafluorohexane 472 (n=1.33), which gave a refractive index difference that generates coloration from multiple TIR. 473 A 5:1 volume mixture of toluene to benzyl benzoate (final refractive index of n=1.50) was 474 placed on top of the fluorinated oil with the dome array. The hydrocarbon oil mixture and the 475 fluorinated oil were used in a 3:1 volume ratio. At room temperature, the toluene and benzyl 476 benzoate solution are immiscible with the fluorinated phase, but once heated to 35 °C, all the 477 oils became miscible, raising the refractive index of the mixture to n=1.44. This high refractive 478 index backing of the domes no longer supported TIR to produce structural color. Upon cooling 479 back to room temperature, the fluids phase separated, and color was again visible. 480 481 Measuring the samples’ reflection spectra 482 Experimental spectra were collected with an Ocean Optics Maya2000Pro spectrometer. The 483 sample was placed in a water-filled petri dish on a Thorlabs rotation stage. A collimated optical 484 fiber was mounted at a polar angle of 45º, illuminating the sample with an Ocean Optics halogen 485 light source HL-2000. The spectrometer was coupled into another collimated optical fiber also 486 mounted at 45º on the rotation stage, such that both the sample and spectrometer rotated 487 together. This allowed us to vary the azimuthal angle between the light and collection fibers as 488 the spectra were collected (integration time 𝑡𝑡sample = 5 seconds). A mirror was used as a 489 reference (integration time 𝑡𝑡mirror = 7.2 ms), and the illumination was turned off in order to 490 collect the background signals 𝐵𝐵sample and 𝐵𝐵mirror for the respective integration times, which 491 were subtracted from the sample and the reference spectra. 492 493 In order to estimate the samples’ reflectance in relation to a Lambertian scatterer, we estimate 494 the collection solid angle of the collimated fibers to be Ω𝑐𝑐 = 0.0012 sr (4 square degrees). We 495 also assume that the collected intensity scales linearly with integration time of the spectrometer, 496 such that we can compare the reflection from the mirror for short integration times to the data 497 collected from the samples for long integration times. Even at the spectroscope’s lowest 498

13
integration time, the mirror reference would saturate the detector, so the light was partially 499 blocked (4% transmission), and this factor (0.04) was also included in the estimation. The 500 reflectance with respect to a Lambertian scatterer is then given by 501 502
𝑅𝑅 =𝐼𝐼sample − 𝐵𝐵sample𝐼𝐼mirror − 𝐵𝐵mirror
⋅𝑡𝑡mirror ⋅ 0.04𝑡𝑡sample
⋅2𝜋𝜋Ω𝑐𝑐
503
504 505 Quantifying reflectance in the theoretical model of the microstructures’ optical properties 506 Spectra for different light incidence and observation conditions were calculated as presented in 507 our previous work.5 However, absolute values of these spectra were not included in these initial 508 calculations. Here, we have included the reflectance relative to a Lambertian scatterer. In order 509 to do this, we identified the fraction of light hitting the structure’s internal interface that 510 undergoes TIR (much of the light strikes the interface at angle less than the critical angle, as 511 shown in Figure S6, and thus does not contribute to the color generation by TIR and 512 interference). We calculate the area of the interface that accepts incident light into TIR 513 trajectories by determining where light that is striking the internal interface at the critical angle 514 passes through the top plane, as shown in Figure S6. The incoming trajectory of a ray of light 515 can be parameterized by: 516 517
�𝑥𝑥𝑦𝑦𝑧𝑧� = �
𝑥𝑥i𝑦𝑦i𝑧𝑧i� + 𝑐𝑐 �
−𝑠𝑠𝑠𝑠𝑛𝑛(𝜃𝜃in)0
𝑐𝑐𝑐𝑐𝑠𝑠(𝜃𝜃in)� (1) 518
519 Here, (𝑥𝑥i, 𝑦𝑦i, 𝑧𝑧i) is the location on the concave interface, where the incident ray first hits the 520 surface, 𝜃𝜃in is the illumination angle measured from the vertical, and 𝑐𝑐 is a parameter that will 521 be specified below. The origin of the coordinate system lies at the center of curvature of the 522 interface. The normal of the interface at the location of intersection with the incident light ray 523
is 1𝑅𝑅�𝑥𝑥i𝑦𝑦i𝑧𝑧i�, such that the local angle of incidence is: 524
cos(𝛼𝛼) = − 1𝑅𝑅�𝑥𝑥i𝑦𝑦i𝑧𝑧i� ⋅ �
−𝑠𝑠𝑠𝑠𝑛𝑛(𝜃𝜃in)0
𝑐𝑐𝑐𝑐𝑠𝑠(𝜃𝜃in)� = 𝑥𝑥i sin(𝜃𝜃in)−𝑧𝑧i cos(𝜃𝜃in)
𝑅𝑅 (2) 525
526 We wish to identify the locations (𝑥𝑥,𝑦𝑦, 𝑧𝑧) on the top plane of the structure that correspond to 527 the crictical angle 𝛼𝛼𝑐𝑐 = sin−1 𝑛𝑛2
𝑛𝑛1. We note that the z location is set by how deeply embedded 528
the sphere is: 𝑧𝑧 = −𝑅𝑅 cos 𝜃𝜃CA = 𝑧𝑧i + 𝑐𝑐 cos(𝜃𝜃in) 529 530
⇒ 𝑐𝑐 = (𝑅𝑅 cos(𝜃𝜃CA)−𝑧𝑧i)cos𝜃𝜃in
(3) 531 532 Combining Equations 1, 2, and 3, we obtain curve (x, y) parameterized by 𝑥𝑥in: 533 534
𝑥𝑥 = 𝑥𝑥i −(𝑅𝑅 cos(𝜃𝜃CA) − 𝑧𝑧i)
cos 𝜃𝜃insin (𝜃𝜃in) 535
536
𝑦𝑦 = 𝑦𝑦i = ±�𝑅𝑅2 − 𝑥𝑥i2 − 𝑧𝑧i2 537
538
14
where 𝑧𝑧i = (𝑅𝑅𝑐𝑐𝑜𝑜𝑅𝑅(𝛼𝛼𝑐𝑐)+𝑥𝑥i sin(𝜃𝜃in))cos(𝜃𝜃in) . 539
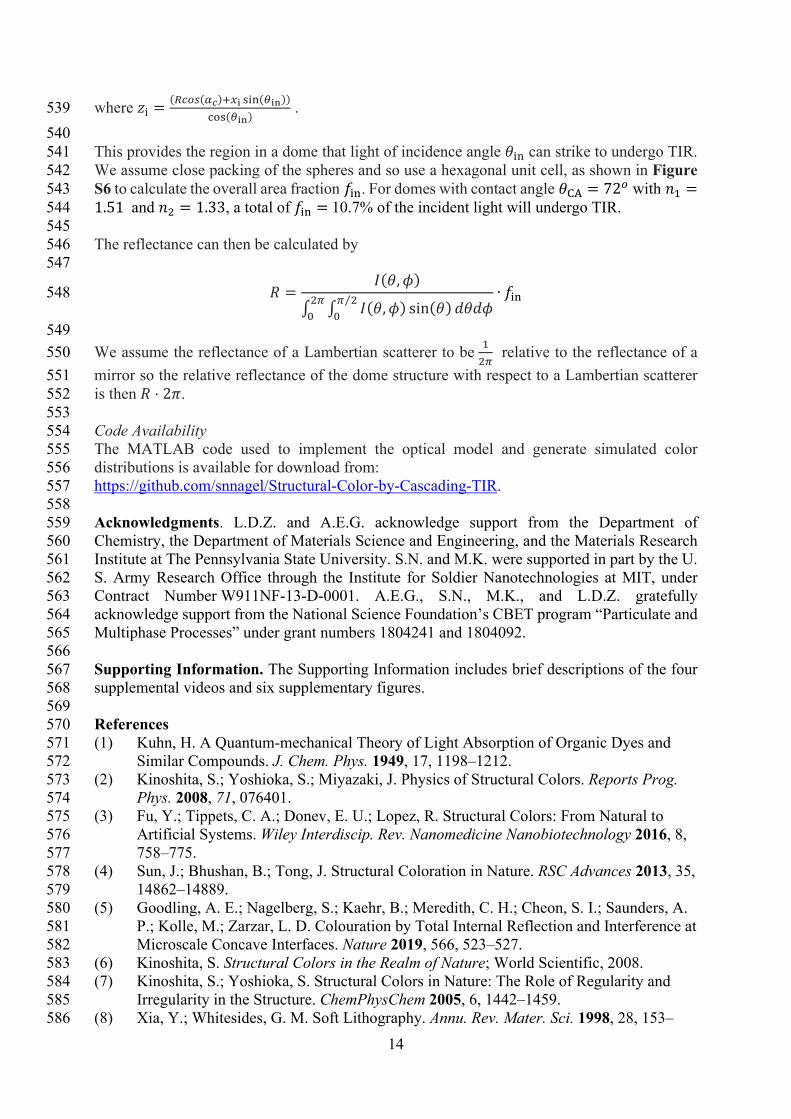
540 This provides the region in a dome that light of incidence angle 𝜃𝜃in can strike to undergo TIR. 541 We assume close packing of the spheres and so use a hexagonal unit cell, as shown in Figure 542 S6 to calculate the overall area fraction 𝑓𝑓in. For domes with contact angle 𝜃𝜃CA = 72𝑜𝑜 with 𝑛𝑛1 =543 1.51 and 𝑛𝑛2 = 1.33, a total of 𝑓𝑓in = 10.7% of the incident light will undergo TIR. 544 545 The reflectance can then be calculated by 546 547
𝑅𝑅 =𝐼𝐼(𝜃𝜃,𝜙𝜙)
∫ ∫ 𝐼𝐼(𝜃𝜃,𝜙𝜙) sin(𝜃𝜃)𝑑𝑑𝜃𝜃𝑑𝑑𝜙𝜙𝜋𝜋 2⁄0
2𝜋𝜋0
∙ 𝑓𝑓in 548
549 We assume the reflectance of a Lambertian scatterer to be 1
2𝜋𝜋 relative to the reflectance of a 550
mirror so the relative reflectance of the dome structure with respect to a Lambertian scatterer 551 is then 𝑅𝑅 ⋅ 2𝜋𝜋. 552 553 Code Availability 554 The MATLAB code used to implement the optical model and generate simulated color 555 distributions is available for download from: 556 https://github.com/snnagel/Structural-Color-by-Cascading-TIR. 557 558 Acknowledgments. L.D.Z. and A.E.G. acknowledge support from the Department of 559 Chemistry, the Department of Materials Science and Engineering, and the Materials Research 560 Institute at The Pennsylvania State University. S.N. and M.K. were supported in part by the U. 561 S. Army Research Office through the Institute for Soldier Nanotechnologies at MIT, under 562 Contract Number W911NF-13-D-0001. A.E.G., S.N., M.K., and L.D.Z. gratefully 563 acknowledge support from the National Science Foundation’s CBET program “Particulate and 564 Multiphase Processes” under grant numbers 1804241 and 1804092. 565 566 Supporting Information. The Supporting Information includes brief descriptions of the four 567 supplemental videos and six supplementary figures. 568 569 References 570 (1) Kuhn, H. A Quantum‐mechanical Theory of Light Absorption of Organic Dyes and 571
Similar Compounds. J. Chem. Phys. 1949, 17, 1198–1212. 572 (2) Kinoshita, S.; Yoshioka, S.; Miyazaki, J. Physics of Structural Colors. Reports Prog. 573
Phys. 2008, 71, 076401. 574 (3) Fu, Y.; Tippets, C. A.; Donev, E. U.; Lopez, R. Structural Colors: From Natural to 575
Artificial Systems. Wiley Interdiscip. Rev. Nanomedicine Nanobiotechnology 2016, 8, 576 758–775. 577
(4) Sun, J.; Bhushan, B.; Tong, J. Structural Coloration in Nature. RSC Advances 2013, 35, 578 14862–14889. 579
(5) Goodling, A. E.; Nagelberg, S.; Kaehr, B.; Meredith, C. H.; Cheon, S. I.; Saunders, A. 580 P.; Kolle, M.; Zarzar, L. D. Colouration by Total Internal Reflection and Interference at 581 Microscale Concave Interfaces. Nature 2019, 566, 523–527. 582
(6) Kinoshita, S. Structural Colors in the Realm of Nature; World Scientific, 2008. 583 (7) Kinoshita, S.; Yoshioka, S. Structural Colors in Nature: The Role of Regularity and 584
Irregularity in the Structure. ChemPhysChem 2005, 6, 1442–1459. 585 (8) Xia, Y.; Whitesides, G. M. Soft Lithography. Annu. Rev. Mater. Sci. 1998, 28, 153–586

15
184. 587 (9) Zhao, Y.; Xie, Z.; Gu, H.; Zhu, C.; Gu, Z. Bio-Inspired Variable Structural Color 588
Materials. Chem. Soc. Rev. 2012, 41, 3297- 3317. 589 (10) Aguirre, C. I.; Reguera, E.; Stein, A. Tunable Colors in Opals and Inverse Opal 590
Photonic Crystals. Adv. Funct. Mater. 2010, 20, 2565–2578. 591 (11) Isapour, G.; Lattuada, M. Bioinspired Stimuli-Responsive Color-Changing Systems. 592
Adv. Mater. 2018, 30, 1707069. 593 (12) Leber, A.; Cholst, B.; Sandt, J.; Vogel, N.; Kolle, M. Stretchable Thermoplastic 594
Elastomer Optical Fibers for Sensing of Extreme Deformations. Adv. Funct. Mater. 595 2019, 29, 1802629. 596
(13) De Coninck, J.; De Ruijter, M. J.; Voué, M. Dynamics of Wetting. Current Opinion in 597 Colloid and Interface Science 2001, 6, 49–53. 598
(14) Chen, L.; Bonaccurso, E. Effects of Surface Wettability and Liquid Viscosity on the 599 Dynamic Wetting of Individual Drops. Phys. Rev. E - Stat. Nonlinear, Soft Matter 600 Phys. 2014, 90, 022401. 601
(15) Jenkins, F. A.; White, H. E. Fundamentals of Optics; McGraw-Hill, 2001. 602 (16) Singh, S.; Dunmur, P. D. A. Liquid Crystals Fundamentals; World Scientific: Farrer 603
Road, Singapore, 2002. 604 (17) Zheng, W. J.; Huang, M. H. Use of Polydimethylsiloxane Thin Film as Vertical Liquid 605
Crystal Alignment Layer. Thin Solid Films 2012, 520, 2841–2845. 606 (18) Li, J.; Gauza, S.; Wu, S. T. Temperature Effect on Liquid Crystal Refractive Indices. J. 607
Appl. Phys. 2004, 96, 19–24. 608 (19) Ahn, S. K.; Kasi, R. M.; Kim, S. C.; Sharma, N.; Zhou, Y. Stimuli-Responsive 609
Polymer Gels. Soft Matter 2008, 4, 1151–1157. 610 (20) Hu, J.; Zhang, G.; Liu, S. Enzyme-Responsive Polymeric Assemblies, Nanoparticles 611
and Hydrogels. Chemical Society Reviews 2012, 18, 5933–5949. 612 (21) Ulijn, R. V. Enzyme-Responsive Materials: A New Class of Smart Biomaterials. J. 613
Mater. Chem. 2006, 16, 2217–2225. 614 (22) Hu, J.; Liu, S. Responsive Polymers for Detection and Sensing Applications: Current 615
Status and Future Developments. Macromolecules 2010, 43, 8315–8330. 616 617