Tucson Electric Power 2017 Integrated Resource Plan · Tucson Electric Power 2017 Integrated...
27
Tucson Electric Power 2017 Integrated Resource Plan Jeff Yockey, PE Southern Arizona Regional Solar Partnership May 2017
Transcript of Tucson Electric Power 2017 Integrated Resource Plan · Tucson Electric Power 2017 Integrated...

Tucson Electric Power 2017 Integrated Resource Plan
Jeff Yockey, PESouthern Arizona Regional Solar Partnership
May 2017

Integrated Resource Plan (IRP) Overview
Reliability
Affordability
Environmental Performance
Risk
Just a Plan► Additional steps for specific actions ► Already outdated
2
Evolving Portfolio ObjectiveLeast Cost
Preferred Portfolio
Stakeholder Involvement► Preliminary IRP (PIRP)
– March 2016► ACC IRP Workshop
– July 2016► Supplemental PIRP
– October 2016► TEP IRP Workshop
– November 2016► [email protected]
Timing► 2-year planning cycle
– Just completed cycle was 3 years► 15-year outlook
– 2017 through 2032

IRP Key Planning Drivers
3
2012 – Meet the Peak 2017 – Balance the Grid

TEP’s 2017 Portfolio Diversification StrategyTransitioning to a Balanced Portfolio
Target a Balanced Mix of Coal, Natural Gas and Renewables
► Reduce coal capacity over the next five yearsSan Juan Unit 2 170 MW – December 2017Navajo Generating Station168 MW – December 2019San Juan Unit 1170 MW – June 2022
► Explore natural gas generation expansion– Combined Cycle Natural Gas– Fast ramping resources
► Integrate cost effective renewable energy
► Operational challenges / opportunities– Natural gas storage– Energy storage technologies
69%
11%
9%7%
4%
2017 Portfolio Energy Mix
38%
26%5%
26%
5%
2032 Portfolio Energy Mix
Coal
Natural Gas
Market Purchases
Utility Scale Renewables
Distributed Generation

Coal Plant Retirements
5
Jointly-Owned Plant “Off-ramps”• Coal Contracts• Land Leases• Participation Agreements

► TEP Ownership of Springerville
► Units 1 & 2 (793 MW)
Newest coal units in TEP fleet
Access to competitive coal via rail
Full operational control of Units 1 & 2
• Unit 1 - 387 MW
• Unit 2 - 406 MW
Implement future cycling strategy to facilitate the integration of renewables
Springerville Generating StationLong-Term Base Load Arizona Resource

Renewable Energy Expansion
Utility-ScaleFixed Solar PV
Utility-ScaleTracking Solar PV
Utility-ScaleWind
RooftopSolar PV
Capacity Factor 23% 31% 27% 23%
PeakCoincidence 34% 63% 23% 34%
2017 Capacity MWAC
36 158 80 168
2032 Capacity MWAC 202 493 414 283
7
30% of Retail Load by 2030

Renewable Energy Diversification
8
0%
10%
20%
30%
40%
50%
60%
70%
80%
90%
100%
1 2 3 4 5 6 7 8 9 10 11 12 13 14 15 16 17 18 19 20 21 22 23 24
Hour Ending
Average Capacity Factor at Four Renewable Energy Resource Locations
Red Horse Solar / Single-Axis Tracker DG / Fixed-Tilt Red Horse Wind NextEra Wind

Renewable Integration Challenges“TEP Duck Curve”
9
2030 Winter Day – High Solar Penetration

Renewable Integration ChallengesIntermittency
10

Renewable Integration Challenges10-Minute Ramping Capacity Analysis
11
Existing Ramping Capacity versus Projected Requirements
Ramping Capacity Under Reference Case Plan versus Projected Requirements

Renewable Integration Opportunities
12

Renewable Integration Opportunities
13

Resource Solutions and Response Times
14

$15$503
$257
$157$130
$77$65
$53$105
$51$44
Customer Energy EfficiencyCustomer Demand Response
Battery Storage
Combustion TurbineRICE
Natural Gas Combined Cycle - Load FollowingNatural Gas Combined Cycle - Baseload
Utility-Scale WindResidential Solar PV
Utility-Scale Solar PV - Fixed-Tilt PanelUtility-Scale Solar PV - Single-Axis Tracking
Levelized Cost of Energy ($/MWh)
15
Renewable Energy ResourcesIntermittent Service
Fossil Fuel ResourcesBaseload, Balancing, Peaking Service
Non-Energy ResourcesConditional Service

Energy Efficiency After 2020
16
► Reduction in future load growth based on 2014 Technical Report by Electric Power Research Institute (EPRI)

2017 IRP Energy Efficiency Forecast
17
-
200
400
600
800
1,000
1,200
1,400
1,600
1,800
2,000
2016 2018 2020 2022 2024 2026 2028 2030 2032
GWh
Cumulative Sales Reductions
Base Case without Credits
Base Case Including Credits
22%
15%
17%
0%
5%
10%
15%
20%
25%
2016 2018 2020 2022 2024 2026 2028 2030 2032
Percent of Retail Sales
EE Standard Including Credits
EE Base Case (No Credits)
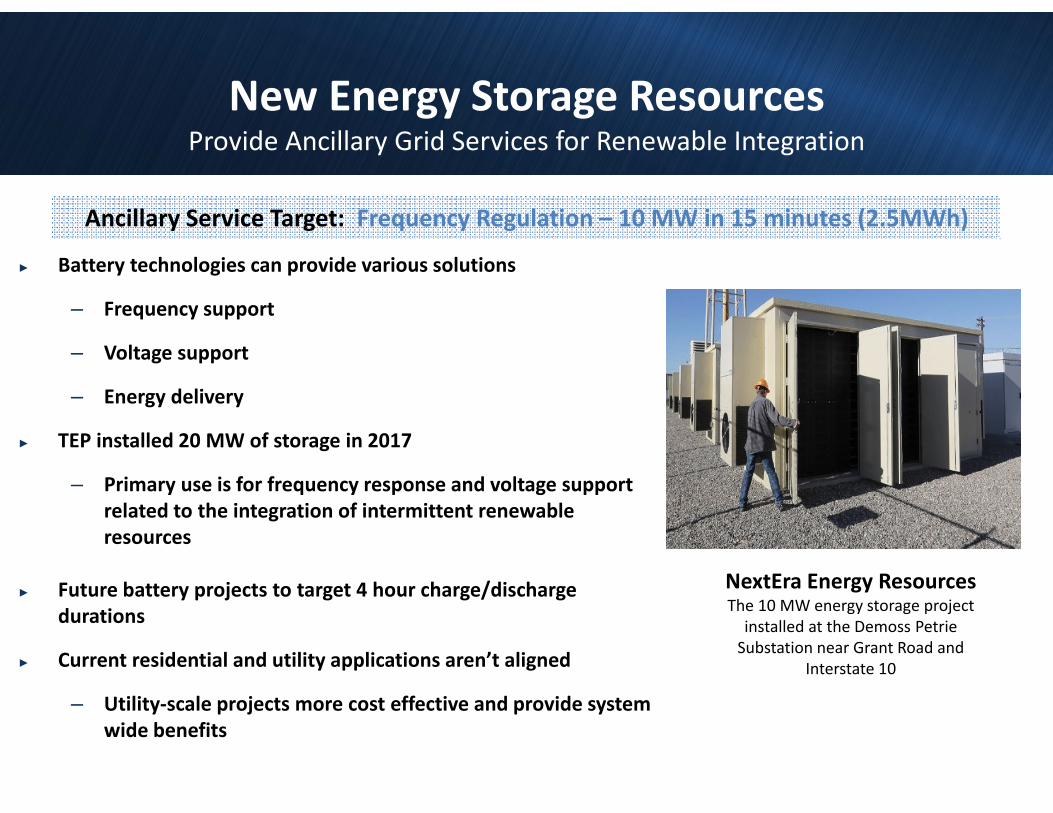
New Energy Storage ResourcesProvide Ancillary Grid Services for Renewable Integration
► Battery technologies can provide various solutions
– Frequency support
– Voltage support
– Energy delivery
► TEP installed 20 MW of storage in 2017
– Primary use is for frequency response and voltage support related to the integration of intermittent renewable resources
► Future battery projects to target 4 hour charge/discharge durations
► Current residential and utility applications aren’t aligned
– Utility-scale projects more cost effective and provide system wide benefits
NextEra Energy ResourcesThe 10 MW energy storage project
installed at the Demoss Petrie Substation near Grant Road and
Interstate 10
Ancillary Service Target: Frequency Regulation – 10 MW in 15 minutes (2.5MWh)

Natural Gas Reciprocating Engines (RICE)► Historically found in marine and industrial applications. Today, under new power generation
applications, there is real potential to help solve renewable integration issues► Fast start and fast ramp times (Starts in 2 minutes and at full load in 5 minutes) ► Small modular footprint (smart grid paradigm) and reliability spread across multiple units ► Low gas pressure requirement and low water consumption► RICE would provide additional value in EIM or RTO markets
New Flexible Generation ResourcesFast Ramping Resources for Renewable Integration

Merchant NGCC Opportunities at Palo Verde
Merchant Resource OpportunitiesNatural Gas Combined Cycle (NGCC) Resources
► Natural gas combined cycle capacity available at Harquahala, Gila River and Mesquite
► One unit could be purchased jointly by TEP and UNS Electric to meet future load serving requirements
► Backstop for NGS and SJGS retirements
► Low cost, fast ramping resources
► Option to lock in Natural Gas long-term
Harquahala Generating Station
Gila River Power Station
Mesquite Generating Station

Arizona Gas Storage (AGS)Kinder Morgan Natural Gas Storage Project

Regional Transmission Projects
► Nogales DC Intertie
– Interconnection between Arizona and Mexico
– Reliability – 3rd import path
– Access to Palo Verde market
► Sunzia / Southline / Western Spirit Clean Line
– Move New Mexico Wind to the Palo Verde Hub
– Various stages in the permitting/approval process
– All projects come through our system
• Reliability – particularly Southline
• Access to high capacity factor wind
• Transmission revenue
22

Regional Transmission Organizations
CAISO Energy Imbalance Market► Sub-hourly balancing► Share resource reserves
– Lower production costs
► E3 evaluation of economic benefits for TEP– Majority of benefit during
extreme pricing events– $2.5M annual benefits
► TEP currently evaluating costs
SW Utility “Working Group”► Evaluate forming/joining a regional
market► Significant potential value exists
► Mountain West Transmission Group– Regional Rate Market– RFP with CAISO / MISO / SPP– Contracting SPP to run market
► Benefits of partnership– Governance– Diversity
• Geographic / Load (Peak) / Resources
23

IRP Production Cost Modeling
24
Plant Parameters
FuelPrice
PowerPrice
Energy Efficiency
Load Profile
Distributed Generation
Generation
Fuel Expense
Purchase Power
Unit Stats
Emissions
Water
Non-Fuel Expense• Capital• Fixed O&M• Taxes
Revenue Requirement
Reserve Margin
Carbon Compliance
Hourly Dispatch

Alternative Scenarios
25
High Economy
Capacity ExpansionLoad Growth
Technology AdvancementImproved Efficiency
High Technology
Capital CostsFuel Prices
Power Prices
Capital CostsFuel Prices
Power Prices
Base Case
PACE GlobalAlternative Market Price Sensitivity

Reference Case Plan Modeling Results
26
NPV Revenue Requirement Portfolio Risk Dashboard

TEP Future Resources2017 Portfolio Reference Case
27