TTY CAMBODIA BIOGAS PROJECT - LLV
60
TTY CAMBODIA BIOGAS PROJECT Prepared by Carbon Bridge Pte Ltd June 2007
Transcript of TTY CAMBODIA BIOGAS PROJECT - LLV

TTY CAMBODIA BIOGAS PROJECT
Prepared by Carbon Bridge Pte Ltd June 2007

PROJECT DESIGN DOCUMENT FORM (CDM PDD) - Version 03.1. CDM – Executive Board page 1
CLEAN DEVELOPMENT MECHANISM
PROJECT DESIGN DOCUMENT FORM (CDM-PDD) Version 03 - in effect as of: 28 July 2006
CONTENTS A. General description of project activity B. Application of a baseline and monitoring methodology C. Duration of the project activity / crediting period D. Environmental impacts E. Stakeholders’ comments
Annexes Annex 1: Contact information on participants in the project activity Annex 2: Information regarding public funding Annex 3: Baseline information
Annex 4: Monitoring plan
PROJECT DESIGN DOCUMENT FORM (CDM PDD) - Version 03.1. CDM – Executive Board page 2 SECTION A. General description of project activity A.1 Title of the project activity: Title: TTY Cambodia Biogas Project Version: 003 Date: 05/06/07 A.2. Description of the project activity: The purpose of the TTY Biogas project is to:
• Build a Biogas Project at the T.T.Y Tapioca Starch Factory in Memot, Cambodia. • Capture biogas emitted from the anaerobic digestion of organic matter in wastewater that is
currently discharged from the tapioca starch factory into large deep lagoons • Create and use renewable biogas energy to replace the heavy fuel oil (HFO) currently used
in the heaters to dry the starch in the factory • Create renewable electricity from the biogas to displace electricity from the local electricity
grid which is solely supplied from the Vietnamese electricity grid • Create Certified Emission Reductions from the project
How the project reduces greenhouse gas emissions The project activity involves the installation of a CIGAR (Covered In-Ground Anaerobic Reactor) designed by Waste Solutions Ltd (WSL) of New Zealand and construction co-ordinated by Waste to Energy Pte Ltd (W2E) of Singapore. The CIGAR creates an enclosed and anaerobic environment which enables bacteria to convert organic matter into biogas. The captured biogas will be sent to a new heater (InPlan 4.05 MW) which will run on the biogas and displace around 2,700m3 of Heavy Fuel Oil per year. Dedicated 3MW of biogas generators will be installed (the exact configuration of the size of the generator sets will depend on the brand that is procured). Any excess biogas will be flared in an enclosed flare. The baseline scenario of the project will be the continued use of the existing deep lagoon wastewater treatment process, which currently emits methane to the atmosphere. In addition, the factory will continue to use HFO in the heaters to dry the starch, and electricity will be purchased from the local electricity grid. In the project scenario, the project will capture and burn the methane, thus reducing the potent greenhouse gas. The renewable biogas burned in the heaters will displace the need to burn fossil fuel HFO and the associated emissions, while the renewable electricity produced from burning the biogas will displace the need for electricity to be produced from fossil fuels like coal and gas in Vietnam. The additionality of the project is clearly demonstrated by a quotation from the Owner of the Starch Factory at the second meeting with the Consultant, Carbon Bridge, the company that introduced the biogas concept to the owner and helped identify technology providers “I had heard about this technology but some people said it had problems and did not work. I had no idea how to bring it to my factory and make sure I got good quality until you came along”. No other starch factory in Cambodia has a biogas plant.
PROJECT DESIGN DOCUMENT FORM (CDM PDD) - Version 03.1. CDM – Executive Board page 3 Contribution to Sustainable Development
The Project will contribute to sustainable development of Cambodia by: • Improving the local and global environment, particularly by treating wastewater, reducing air
pollution, odour and greenhouse gas emissions. The project will not result in any increases in air, soil or water pollution.
• Supporting the development of Cambodia’s agro-industry, which is a key part of the Royal Government’s development strategy, particularly as over 80% of the population is agrarian. The tapioca starch industry in Cambodia is slowly developing and is considered extremely small compared to its neighbours in Thailand and Vietnam.
• Directly creating 3 new jobs and ensuring the continuation of the employment of 180 staff and indirectly hundreds of farmers who sell cassava root to the Factory.
• Contributing to the national economy by reducing Cambodia’s 100% dependence on imported fossil fuels.
• Transferring technology from developed countries, particularly important as no other starch factory in Cambodia uses anaerobic digestion to produce biogas.
• Improving human capacity and diversity of employment opportunity, by training project managers, lab technicians and operators
• Mobilising private investment. The project will not use ODA, which is significant in a country where a significant proportion of the national budget is from foreign aid.
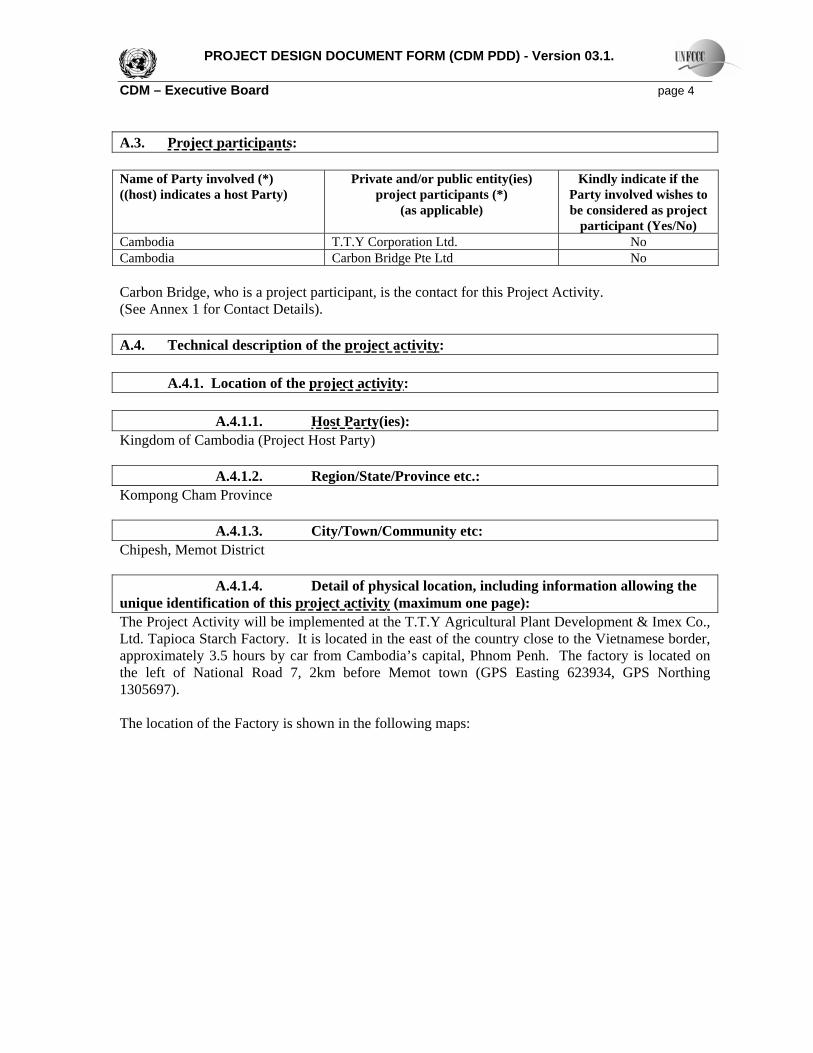
Table 1 – Sustainable Development Indicators for The Gold Standard Score (-2 to 2)
Local/regional/global environment • Water quality and quantity +1 • Air quality (emissions other than GHGs) Reduction in odour +1 • Other pollutants (where relevant, toxicity, radioactivity, POPs, ozone depleting gases) 0
• Soil condition (quality and quantity) – use of organic fertilizer of sludge for land application
+1
• Biodiversity (species and habitat conservation) 0 Sub total +3
Social sustainability and development • Employment (including job quality, fulfillment of labour standards) 0 • Livelihood of the poor 0 (including poverty alleviation, distributional equity, and access to essential services)
• Access to energy services 0 • Human and institutional capacity +1 (including empowerment, education, involvement, gender)
Sub total Economic and technological development
+1
• Employment (numbers) +1 • Balance of payments (sustainability) 0 • Technological self reliance (including project replicability, hard currency
liability, skills development, institutional capacity, technology transfer) +1
Sub total TOTAL
+2 +6
PROJECT DESIGN DOCUMENT FORM (CDM PDD) - Version 03.1. CDM – Executive Board page 4 A.3. Project participants: Name of Party involved (*) ((host) indicates a host Party)
Private and/or public entity(ies) project participants (*)
(as applicable)
Kindly indicate if the Party involved wishes to be considered as project
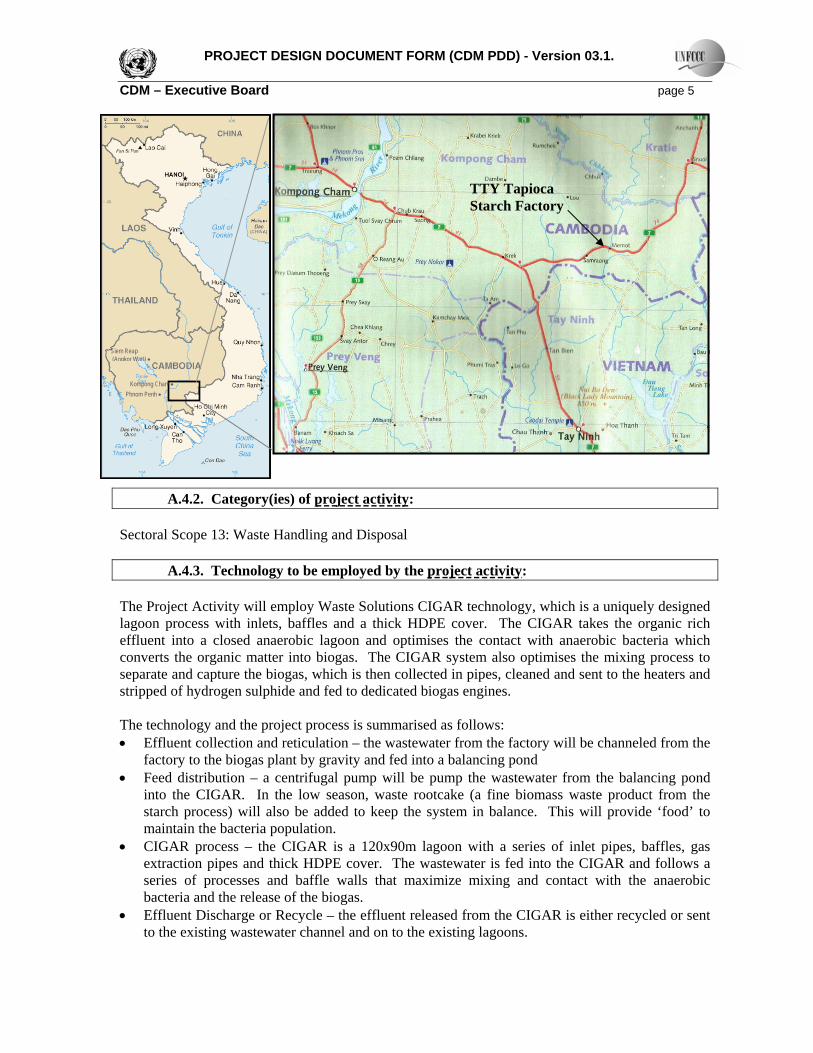
participant (Yes/No) Cambodia T.T.Y Corporation Ltd. No Cambodia Carbon Bridge Pte Ltd No Carbon Bridge, who is a project participant, is the contact for this Project Activity. (See Annex 1 for Contact Details). A.4. Technical description of the project activity: A.4.1. Location of the project activity: A.4.1.1. Host Party(ies): Kingdom of Cambodia (Project Host Party) A.4.1.2. Region/State/Province etc.: Kompong Cham Province A.4.1.3. City/Town/Community etc: Chipesh, Memot District A.4.1.4. Detail of physical location, including information allowing the unique identification of this project activity (maximum one page): The Project Activity will be implemented at the T.T.Y Agricultural Plant Development & Imex Co., Ltd. Tapioca Starch Factory. It is located in the east of the country close to the Vietnamese border, approximately 3.5 hours by car from Cambodia’s capital, Phnom Penh. The factory is located on the left of National Road 7, 2km before Memot town (GPS Easting 623934, GPS Northing 1305697). The location of the Factory is shown in the following maps:
PROJECT DESIGN DOCUMENT FORM (CDM PDD) - Version 03.1. CDM – Executive Board page 5
A.4.2. Category(ies) of project activity: Sectoral Scope 13: Waste Handling and Disposal A.4.3. Technology to be employed by the project activity: The Project Activity will employ Waste Solutions CIGAR technology, which is a uniquely designed lagoon process with inlets, baffles and a thick HDPE cover. The CIGAR takes the organic rich effluent into a closed anaerobic lagoon and optimises the contact with anaerobic bacteria which converts the organic matter into biogas. The CIGAR system also optimises the mixing process to separate and capture the biogas, which is then collected in pipes, cleaned and sent to the heaters and stripped of hydrogen sulphide and fed to dedicated biogas engines. The technology and the project process is summarised as follows: • Effluent collection and reticulation – the wastewater from the factory will be channeled from the
factory to the biogas plant by gravity and fed into a balancing pond • Feed distribution – a centrifugal pump will be pump the wastewater from the balancing pond
into the CIGAR. In the low season, waste rootcake (a fine biomass waste product from the starch process) will also be added to keep the system in balance. This will provide ‘food’ to maintain the bacteria population.
• CIGAR process – the CIGAR is a 120x90m lagoon with a series of inlet pipes, baffles, gas extraction pipes and thick HDPE cover. The wastewater is fed into the CIGAR and follows a series of processes and baffle walls that maximize mixing and contact with the anaerobic bacteria and the release of the biogas.
• Effluent Discharge or Recycle – the effluent released from the CIGAR is either recycled or sent to the existing wastewater channel and on to the existing lagoons.
TTY Tapioca Starch Factory
Phnom Penh • Kompong Cham •
Siem Reap (Angkor Wat)) •
PROJECT DESIGN DOCUMENT FORM (CDM PDD) - Version 03.1. CDM – Executive Board page 6 • Sludge Recycle or processing - a small amount of sludge (which mainly consists of perished
bacteria) will be collected in the bottom of the CIGAR, and will be either recirculated back to the CIGAR as slurry or removed by pump and used for aerobic land application on the TTY cassava plantations. It is expected to have a good nitrogen content due to the selective nutrient up take of the bacteria.
• Gas extraction and pumping – the gas will be extracted in a large diameter pipe where it will be stripped of condensation, dust, H2S and compressed to be sent to the Factory heaters, engines or in case of excess build-up of biogas or emergency, to an enclosed flare.
• Biogas engines – dedicated engines designed to run on biogas will be used to produce electricity. .
• Biogas Drying – the biogas will be sent to the existing heaters at the factory, which will be retrofitted to run on dual fuel biogas.
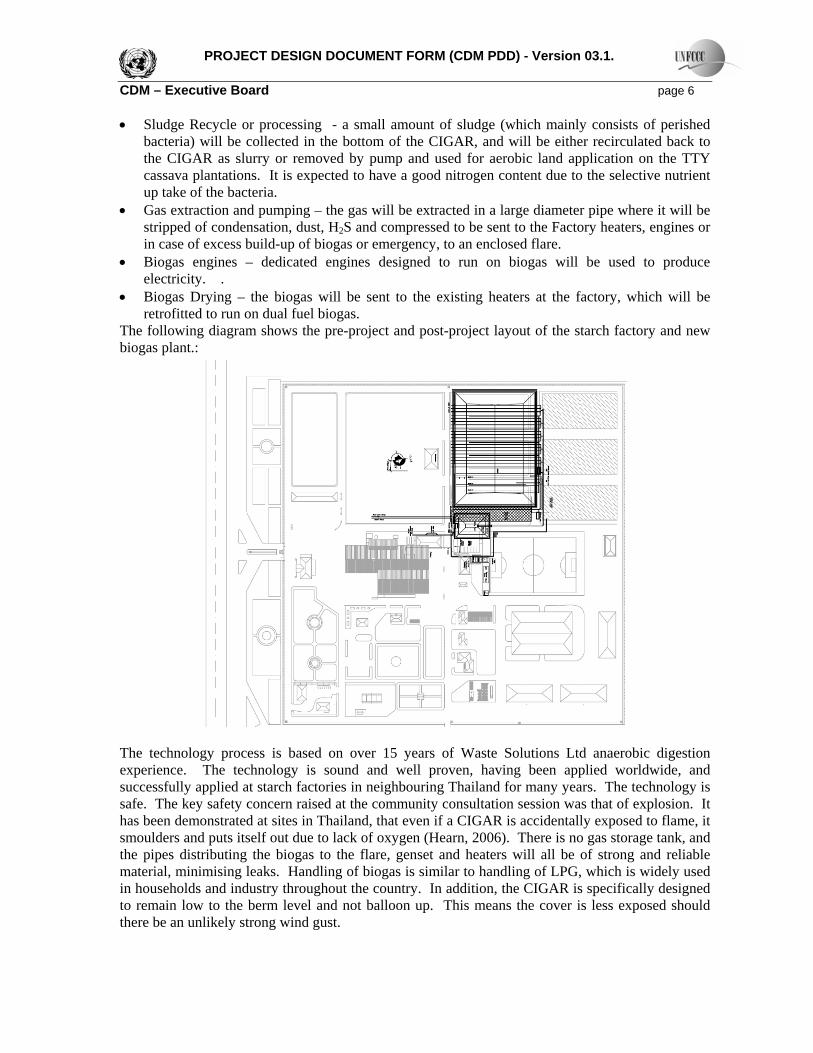
The following diagram shows the pre-project and post-project layout of the starch factory and new biogas plant.:
The technology process is based on over 15 years of Waste Solutions Ltd anaerobic digestion experience. The technology is sound and well proven, having been applied worldwide, and successfully applied at starch factories in neighbouring Thailand for many years. The technology is safe. The key safety concern raised at the community consultation session was that of explosion. It has been demonstrated at sites in Thailand, that even if a CIGAR is accidentally exposed to flame, it smoulders and puts itself out due to lack of oxygen (Hearn, 2006). There is no gas storage tank, and the pipes distributing the biogas to the flare, genset and heaters will all be of strong and reliable material, minimising leaks. Handling of biogas is similar to handling of LPG, which is widely used in households and industry throughout the country. In addition, the CIGAR is specifically designed to remain low to the berm level and not balloon up. This means the cover is less exposed should there be an unlikely strong wind gust.
PROJECT DESIGN DOCUMENT FORM (CDM PDD) - Version 03.1. CDM – Executive Board page 7 The project is designed by WSL, and co-ordination of construction is undertaken by W2E. Local suppliers have been used for civil, mechanical and electrical and HDPE works. After construction, WSL will provide intensive training for TTY Factory staff. Ad hoc review and advice to TTY operators will be provided by WSL. This will be improved by live telecommunications link to the PLC output reporting system.
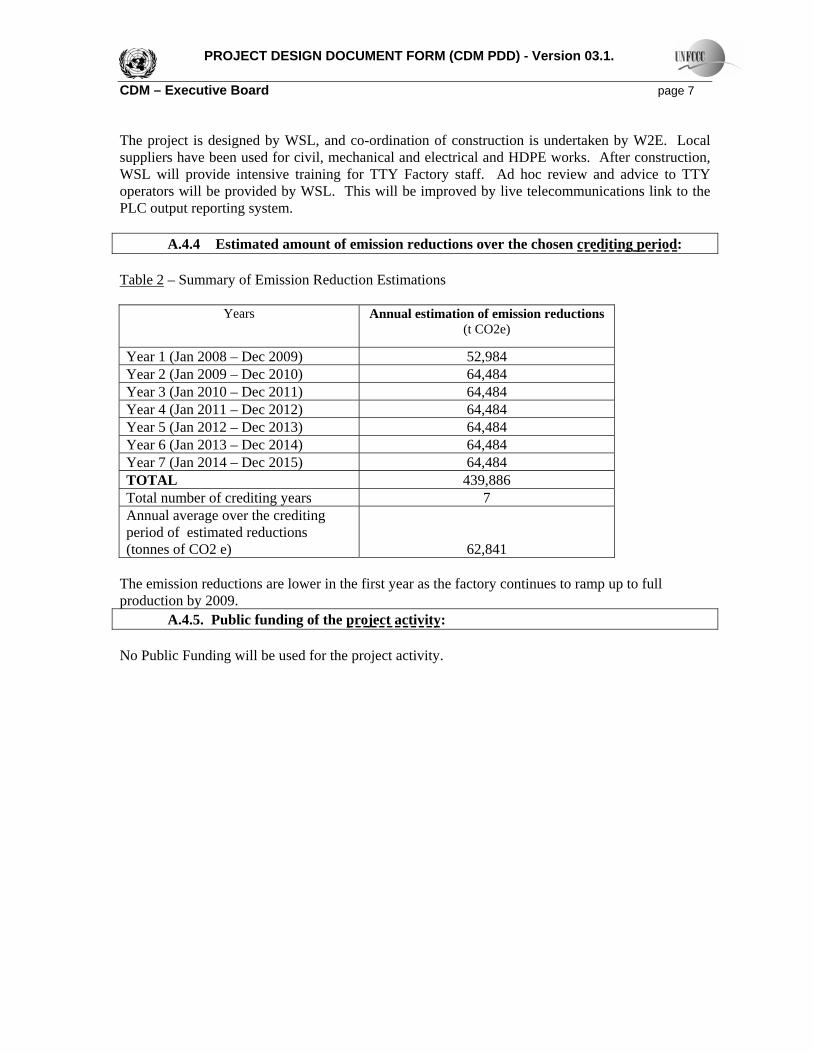
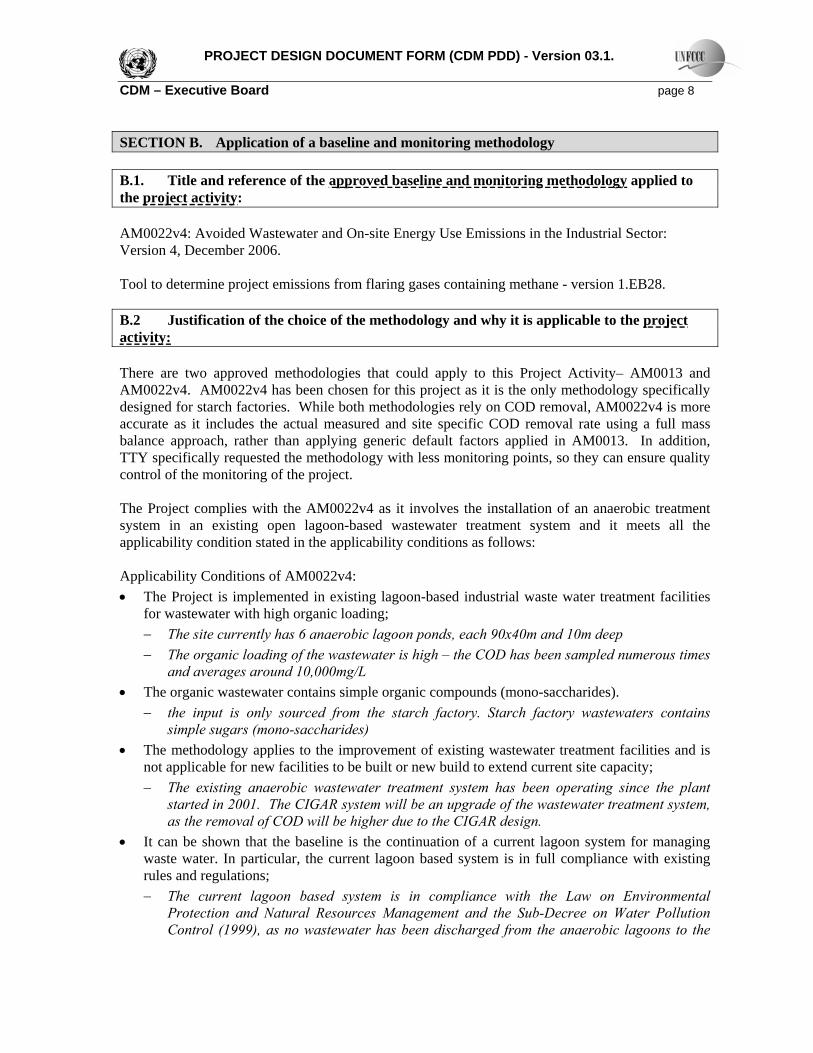
A.4.4 Estimated amount of emission reductions over the chosen crediting period: Table 2 – Summary of Emission Reduction Estimations
Years
Annual estimation of emission reductions (t CO2e)
Year 1 (Jan 2008 – Dec 2009) 52,984 Year 2 (Jan 2009 – Dec 2010) 64,484 Year 3 (Jan 2010 – Dec 2011) 64,484 Year 4 (Jan 2011 – Dec 2012) 64,484 Year 5 (Jan 2012 – Dec 2013) 64,484 Year 6 (Jan 2013 – Dec 2014) 64,484 Year 7 (Jan 2014 – Dec 2015) 64,484 TOTAL 439,886 Total number of crediting years 7 Annual average over the crediting period of estimated reductions (tonnes of CO2 e) 62,841
The emission reductions are lower in the first year as the factory continues to ramp up to full production by 2009. A.4.5. Public funding of the project activity: No Public Funding will be used for the project activity.
PROJECT DESIGN DOCUMENT FORM (CDM PDD) - Version 03.1. CDM – Executive Board page 8 SECTION B. Application of a baseline and monitoring methodology B.1. Title and reference of the approved baseline and monitoring methodology applied to the project activity: AM0022v4: Avoided Wastewater and On-site Energy Use Emissions in the Industrial Sector: Version 4, December 2006. Tool to determine project emissions from flaring gases containing methane - version 1.EB28. B.2 Justification of the choice of the methodology and why it is applicable to the project activity: There are two approved methodologies that could apply to this Project Activity– AM0013 and AM0022v4. AM0022v4 has been chosen for this project as it is the only methodology specifically designed for starch factories. While both methodologies rely on COD removal, AM0022v4 is more accurate as it includes the actual measured and site specific COD removal rate using a full mass balance approach, rather than applying generic default factors applied in AM0013. In addition, TTY specifically requested the methodology with less monitoring points, so they can ensure quality control of the monitoring of the project. The Project complies with the AM0022v4 as it involves the installation of an anaerobic treatment system in an existing open lagoon-based wastewater treatment system and it meets all the applicability condition stated in the applicability conditions as follows: Applicability Conditions of AM0022v4: • The Project is implemented in existing lagoon-based industrial waste water treatment facilities
for wastewater with high organic loading; − The site currently has 6 anaerobic lagoon ponds, each 90x40m and 10m deep − The organic loading of the wastewater is high – the COD has been sampled numerous times
and averages around 10,000mg/L • The organic wastewater contains simple organic compounds (mono-saccharides).
− the input is only sourced from the starch factory. Starch factory wastewaters contains simple sugars (mono-saccharides)
• The methodology applies to the improvement of existing wastewater treatment facilities and is not applicable for new facilities to be built or new build to extend current site capacity; − The existing anaerobic wastewater treatment system has been operating since the plant
started in 2001. The CIGAR system will be an upgrade of the wastewater treatment system, as the removal of COD will be higher due to the CIGAR design.
• It can be shown that the baseline is the continuation of a current lagoon system for managing waste water. In particular, the current lagoon based system is in full compliance with existing rules and regulations; − The current lagoon based system is in compliance with the Law on Environmental
Protection and Natural Resources Management and the Sub-Decree on Water Pollution Control (1999), as no wastewater has been discharged from the anaerobic lagoons to the
PROJECT DESIGN DOCUMENT FORM (CDM PDD) - Version 03.1. CDM – Executive Board page 9
surrounding environment. Enforcement of environmental standards in Cambodia is very low.
• The depth of the anaerobic lagoons should be at least 1m − The depth of the anaerobic lagoons is 10m.
• The temperature of the wastewater in the anaerobic lagoons is always at least 15 °C; − Cambodia has a tropical monsoon climate. The annual average temperature of Cambodia
is 28°C. The annual average temperature is 28°C, with a maximum average of 38°C in April, and a minimum average of 17°C in January.
• In the project, the biogas recovered from the anaerobic treatment system is flared and/or used on-site for heat and/or power generation, surplus biogas is flared; − In the Project, the biogas will be used for heat in the heaters for drying the starch, for
electricity generation and any surplus biogas will be flared in a closed flare. • Heat and electricity needs per unit input of the water treatment facility remain largely
unchanged before and after the project; − The balance of energy needs per unit input of the water treatment facility remain
unchanged. In fact, the biogas renewable electricity will produce more than sufficient electricity to satisfy the needs of the biogas plant.
• Data requirements as laid out in the related Monitoring Methodology are fulfilled. In particular, organic materials flow into and out of the considered lagoon based treatment system and the contribution of different removal processes can be quantified (measured or estimated). − The monitoring plan established in AM0022v4 has been implemented onsite, including
organic materials flow into and out of the considered lagoon based treatment system and the contribution of different removal processes are be quantified.
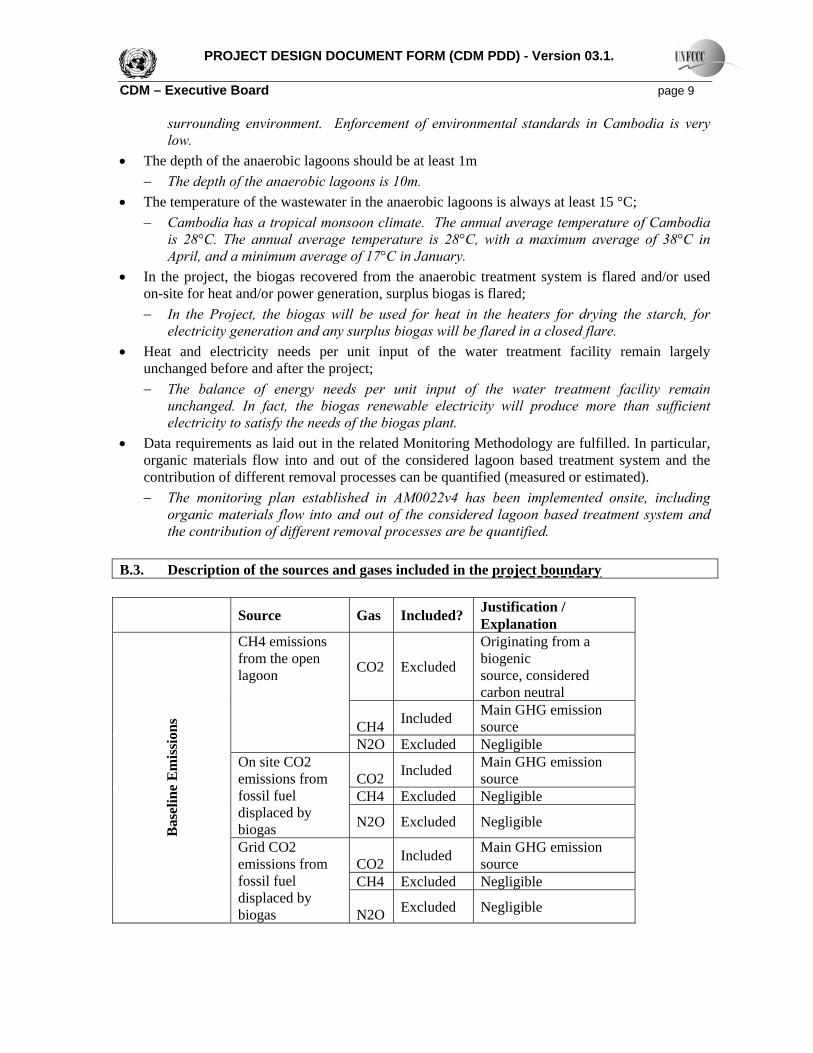
B.3. Description of the sources and gases included in the project boundary
Source Gas Included? Justification / Explanation
CO2 Excluded
Originating from a biogenic source, considered carbon neutral
CH4 Included Main GHG emission source
CH4 emissions from the open lagoon
N2O Excluded Negligible
CO2 Included Main GHG emission source
CH4 Excluded Negligible
On site CO2 emissions from fossil fuel displaced by biogas N2O Excluded Negligible
CO2 Included Main GHG emission source
CH4 Excluded Negligible
Bas
elin
e E
mis
sion
s
Grid CO2 emissions from fossil fuel displaced by biogas N2O Excluded Negligible
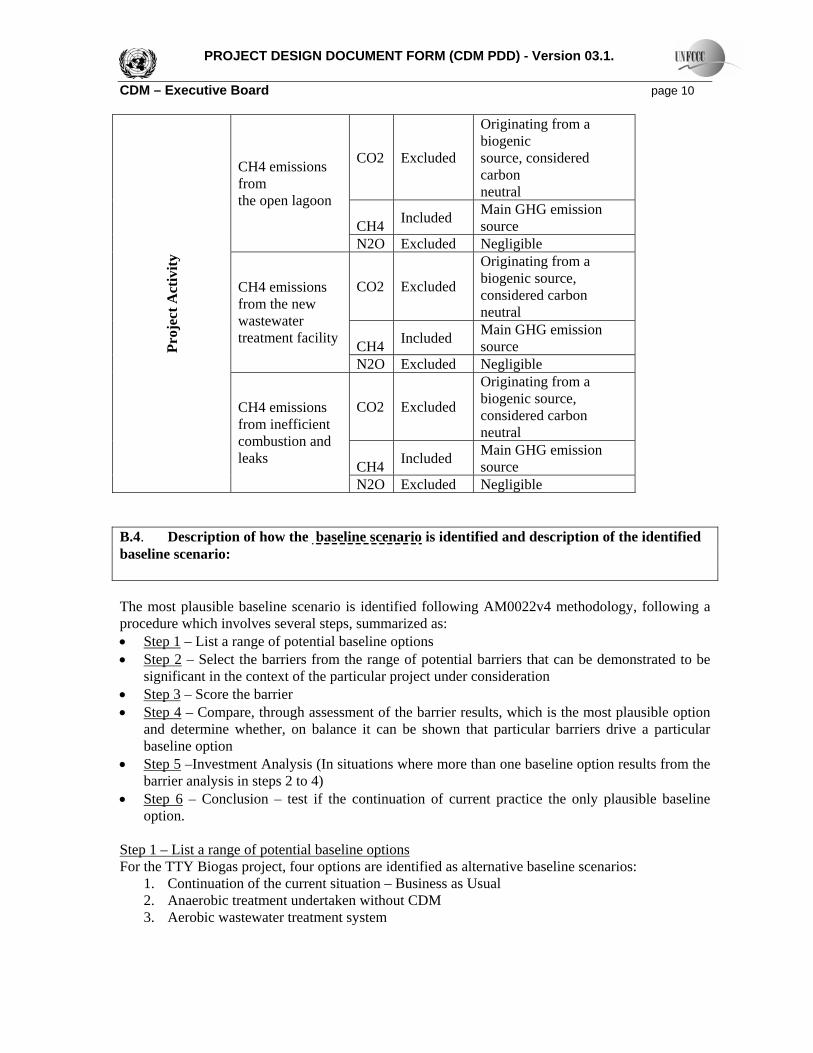
PROJECT DESIGN DOCUMENT FORM (CDM PDD) - Version 03.1. CDM – Executive Board page 10
CO2 Excluded
Originating from a biogenic source, considered carbon neutral
CH4 Included Main GHG emission source
CH4 emissions from the open lagoon
N2O Excluded Negligible
CO2 Excluded
Originating from a biogenic source, considered carbon neutral
CH4 Included Main GHG emission source
CH4 emissions from the new wastewater treatment facility
N2O Excluded Negligible
CO2 Excluded
Originating from a biogenic source, considered carbon neutral
CH4 Included Main GHG emission source
Proj
ect A
ctiv
ity
CH4 emissions from inefficient combustion and leaks
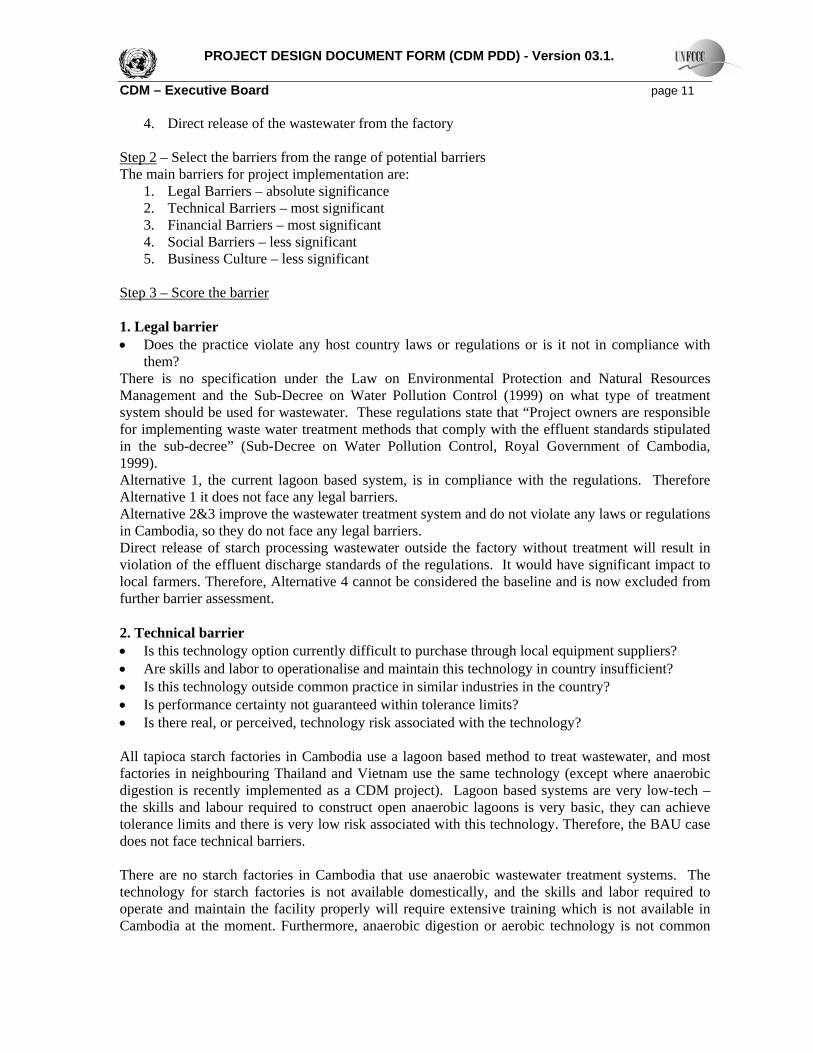
N2O Excluded Negligible B.4. Description of how the baseline scenario is identified and description of the identified baseline scenario: The most plausible baseline scenario is identified following AM0022v4 methodology, following a procedure which involves several steps, summarized as: • Step 1 – List a range of potential baseline options • Step 2 – Select the barriers from the range of potential barriers that can be demonstrated to be
significant in the context of the particular project under consideration • Step 3 – Score the barrier • Step 4 – Compare, through assessment of the barrier results, which is the most plausible option
and determine whether, on balance it can be shown that particular barriers drive a particular baseline option
• Step 5 –Investment Analysis (In situations where more than one baseline option results from the barrier analysis in steps 2 to 4)
• Step 6 – Conclusion – test if the continuation of current practice the only plausible baseline option.
Step 1 – List a range of potential baseline options For the TTY Biogas project, four options are identified as alternative baseline scenarios:
1. Continuation of the current situation – Business as Usual 2. Anaerobic treatment undertaken without CDM 3. Aerobic wastewater treatment system
PROJECT DESIGN DOCUMENT FORM (CDM PDD) - Version 03.1. CDM – Executive Board page 11
4. Direct release of the wastewater from the factory Step 2 – Select the barriers from the range of potential barriers The main barriers for project implementation are:
1. Legal Barriers – absolute significance 2. Technical Barriers – most significant 3. Financial Barriers – most significant 4. Social Barriers – less significant 5. Business Culture – less significant
Step 3 – Score the barrier 1. Legal barrier • Does the practice violate any host country laws or regulations or is it not in compliance with
them? There is no specification under the Law on Environmental Protection and Natural Resources Management and the Sub-Decree on Water Pollution Control (1999) on what type of treatment system should be used for wastewater. These regulations state that “Project owners are responsible for implementing waste water treatment methods that comply with the effluent standards stipulated in the sub-decree” (Sub-Decree on Water Pollution Control, Royal Government of Cambodia, 1999). Alternative 1, the current lagoon based system, is in compliance with the regulations. Therefore Alternative 1 it does not face any legal barriers. Alternative 2&3 improve the wastewater treatment system and do not violate any laws or regulations in Cambodia, so they do not face any legal barriers. Direct release of starch processing wastewater outside the factory without treatment will result in violation of the effluent discharge standards of the regulations. It would have significant impact to local farmers. Therefore, Alternative 4 cannot be considered the baseline and is now excluded from further barrier assessment. 2. Technical barrier • Is this technology option currently difficult to purchase through local equipment suppliers? • Are skills and labor to operationalise and maintain this technology in country insufficient? • Is this technology outside common practice in similar industries in the country? • Is performance certainty not guaranteed within tolerance limits? • Is there real, or perceived, technology risk associated with the technology? All tapioca starch factories in Cambodia use a lagoon based method to treat wastewater, and most factories in neighbouring Thailand and Vietnam use the same technology (except where anaerobic digestion is recently implemented as a CDM project). Lagoon based systems are very low-tech – the skills and labour required to construct open anaerobic lagoons is very basic, they can achieve tolerance limits and there is very low risk associated with this technology. Therefore, the BAU case does not face technical barriers. There are no starch factories in Cambodia that use anaerobic wastewater treatment systems. The technology for starch factories is not available domestically, and the skills and labor required to operate and maintain the facility properly will require extensive training which is not available in Cambodia at the moment. Furthermore, anaerobic digestion or aerobic technology is not common
PROJECT DESIGN DOCUMENT FORM (CDM PDD) - Version 03.1. CDM – Executive Board page 12 practice in starch factories in neighbouring Thailand or Vietnam, which means there are significant performance and technology risks in effluent treatment. Therefore, Alternative 2 faces very strong technical barriers. There are no starch factories in Cambodia that use aerobic wastewater treatment systems. While the technology has been used in sewage treatment plants in major cities, the construction of such plants are usually donor funded and internationally built, as in the case of the new Sihanoukville Wastewater Treatment plant financed by ADB and built by a Japanese consortium (RGC, 2006) . There are very limited skills and labor available to operate and maintain the facility properly and this would require extensive training. Aerobic technology also exists in neighbouring Thailand or Vietnam, but it is not common practice for use in starch factories. Therefore, while Alternative 3 faces less technical barriers than Alternative 2, it still faces significant technology risk for application in starch factories. 3. Financial barrier Is the technology intervention financially less attractive in comparison to other technologies (taking into account potential subsidies, soft loans or tax windows available)? • Is equity participation difficult to find locally? • Is equity participation difficult to find internationally? • Are site owners/ project beneficiaries carrying any risk? • Is technology currency (country) denomination a risk? • Is the proposed project exposed to commercial risk? TTY is currently using an open lagoon based system and it does not require further financing. Therefore Alternative 1 does not face any financial barriers. Anaerobic digesters and aerobic treatment systems have very high upfront capital, operation and maintenance costs. Compared to the open lagoon based system, which is a very cheap, low-tech solution and requires virtually no operation and maintenance, these Alternatives face significant financial barriers. TTY had no plans to install aerobic or anaerobic digestion systems at the Factory because the existing wastewater treatment system fulfills all regulatory requirements. TTY had vaguely heard of the concept of biogas – however they were unsure how to access the technology and ensure good quality in Cambodia. They considered the commercial risk to be very high. Without the CDM, TTY would not have been approached by consultants who were prepared to go through the full educational process about the technology, the suppliers available internationally, the costs, the benefits and options for finance in return for partnership on CDM. In TTY’s case, the CDM Consultant, Carbon Bridge, invested significant time and resources to explain the process, research technology suppliers and developers, undertake sampling and data analysis, directly liaise and arrange for Waste Solutions to undertake a feasibility study, assess the costs and benefits of the project, including of course the CERs and finally co-ordinate a developer to construct the project. Without the worldwide demand for carbon credits, CDM companies would not be present in such small and risky economies and visiting small factories. Without the CDM, the factory owner would not have accessed the technology transfer, despite over 10 years of ‘renewable energy’ aid and development projects.
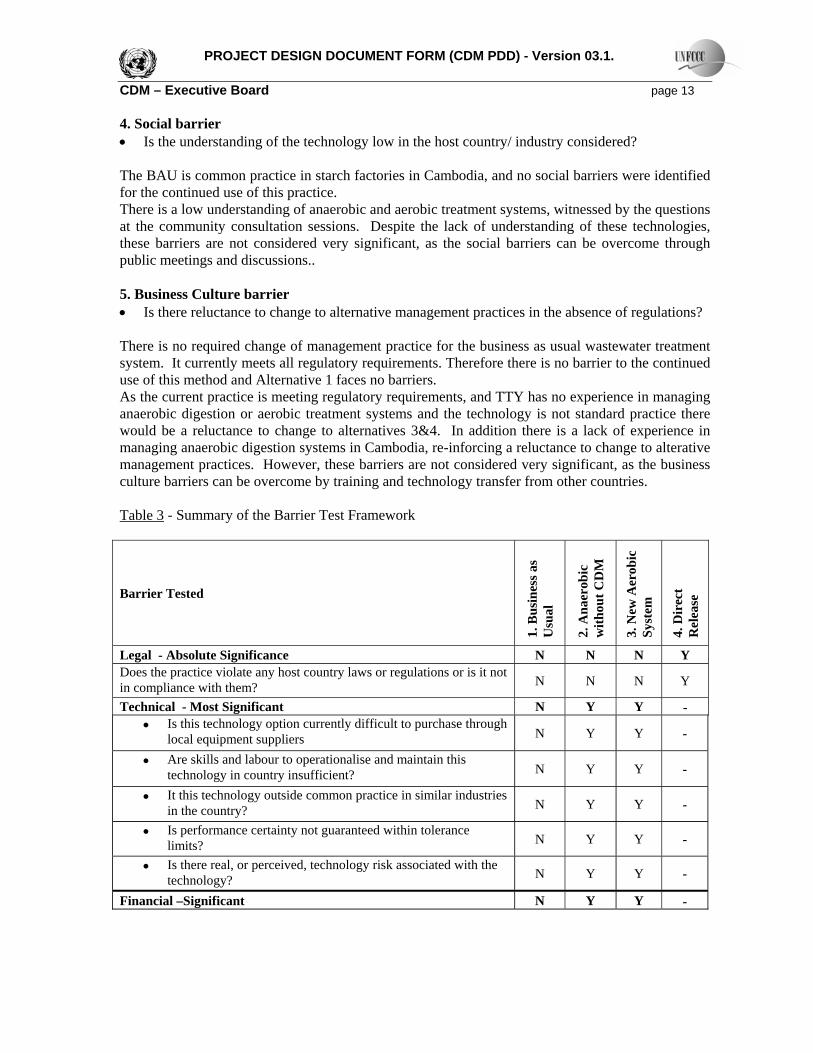
PROJECT DESIGN DOCUMENT FORM (CDM PDD) - Version 03.1. CDM – Executive Board page 13 4. Social barrier • Is the understanding of the technology low in the host country/ industry considered? The BAU is common practice in starch factories in Cambodia, and no social barriers were identified for the continued use of this practice. There is a low understanding of anaerobic and aerobic treatment systems, witnessed by the questions at the community consultation sessions. Despite the lack of understanding of these technologies, these barriers are not considered very significant, as the social barriers can be overcome through public meetings and discussions.. 5. Business Culture barrier • Is there reluctance to change to alternative management practices in the absence of regulations? There is no required change of management practice for the business as usual wastewater treatment system. It currently meets all regulatory requirements. Therefore there is no barrier to the continued use of this method and Alternative 1 faces no barriers. As the current practice is meeting regulatory requirements, and TTY has no experience in managing anaerobic digestion or aerobic treatment systems and the technology is not standard practice there would be a reluctance to change to alternatives 3&4. In addition there is a lack of experience in managing anaerobic digestion systems in Cambodia, re-inforcing a reluctance to change to alterative management practices. However, these barriers are not considered very significant, as the business culture barriers can be overcome by training and technology transfer from other countries. Table 3 - Summary of the Barrier Test Framework
Barrier Tested
1. B
usin
ess a
s U
sual
2. A
naer
obic
w
ithou
t CD
M
3. N
ew A
erob
ic
Syst
em
4. D
irec
t R
elea
se
Legal - Absolute Significance N N N Y Does the practice violate any host country laws or regulations or is it not in compliance with them? N N N Y
Technical - Most Significant N Y Y - • Is this technology option currently difficult to purchase through
local equipment suppliers N Y Y -
• Are skills and labour to operationalise and maintain this technology in country insufficient? N Y Y -
• It this technology outside common practice in similar industries in the country? N Y Y -
• Is performance certainty not guaranteed within tolerance limits? N Y Y -
• Is there real, or perceived, technology risk associated with the technology? N Y Y -
Financial –Significant N Y Y -
PROJECT DESIGN DOCUMENT FORM (CDM PDD) - Version 03.1. CDM – Executive Board page 14
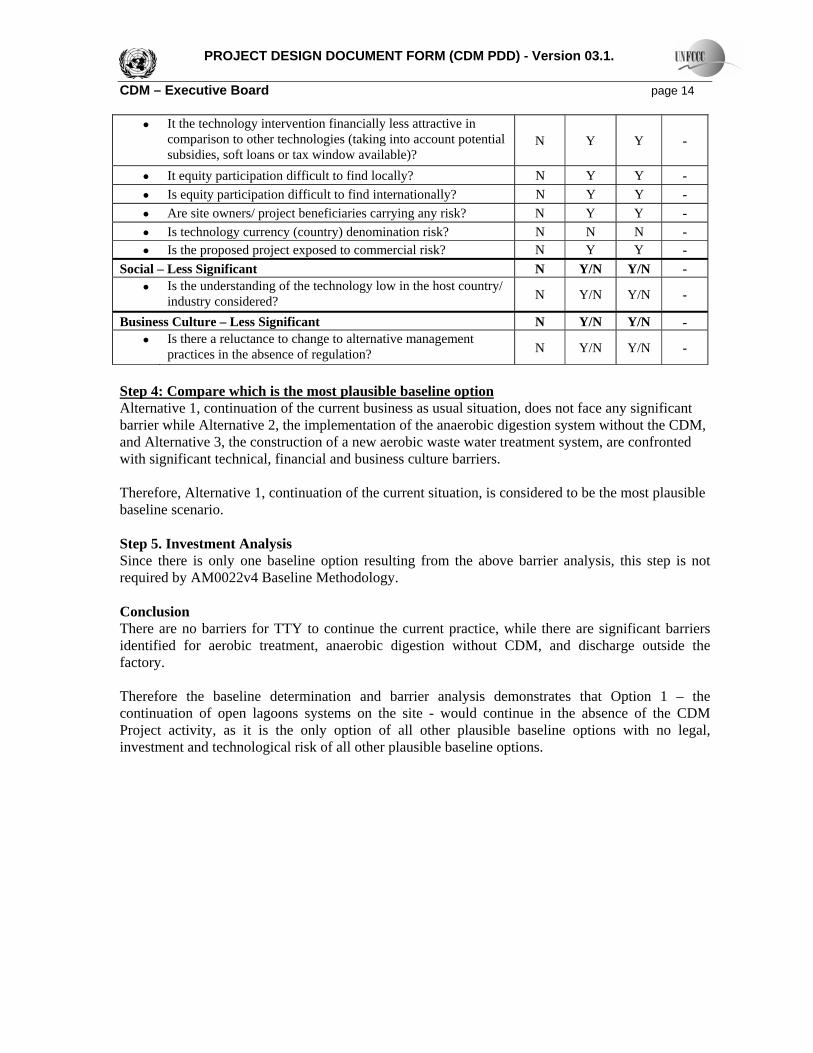
• It the technology intervention financially less attractive in comparison to other technologies (taking into account potential subsidies, soft loans or tax window available)?
N Y Y -
• It equity participation difficult to find locally? N Y Y - • Is equity participation difficult to find internationally? N Y Y - • Are site owners/ project beneficiaries carrying any risk? N Y Y - • Is technology currency (country) denomination risk? N N N - • Is the proposed project exposed to commercial risk? N Y Y -
Social – Less Significant N Y/N Y/N - • Is the understanding of the technology low in the host country/
industry considered? N Y/N Y/N -
Business Culture – Less Significant N Y/N Y/N - • Is there a reluctance to change to alternative management
practices in the absence of regulation? N Y/N Y/N -
Step 4: Compare which is the most plausible baseline option Alternative 1, continuation of the current business as usual situation, does not face any significant barrier while Alternative 2, the implementation of the anaerobic digestion system without the CDM, and Alternative 3, the construction of a new aerobic waste water treatment system, are confronted with significant technical, financial and business culture barriers. Therefore, Alternative 1, continuation of the current situation, is considered to be the most plausible baseline scenario. Step 5. Investment Analysis Since there is only one baseline option resulting from the above barrier analysis, this step is not required by AM0022v4 Baseline Methodology. Conclusion There are no barriers for TTY to continue the current practice, while there are significant barriers identified for aerobic treatment, anaerobic digestion without CDM, and discharge outside the factory. Therefore the baseline determination and barrier analysis demonstrates that Option 1 – the continuation of open lagoons systems on the site - would continue in the absence of the CDM Project activity, as it is the only option of all other plausible baseline options with no legal, investment and technological risk of all other plausible baseline options.
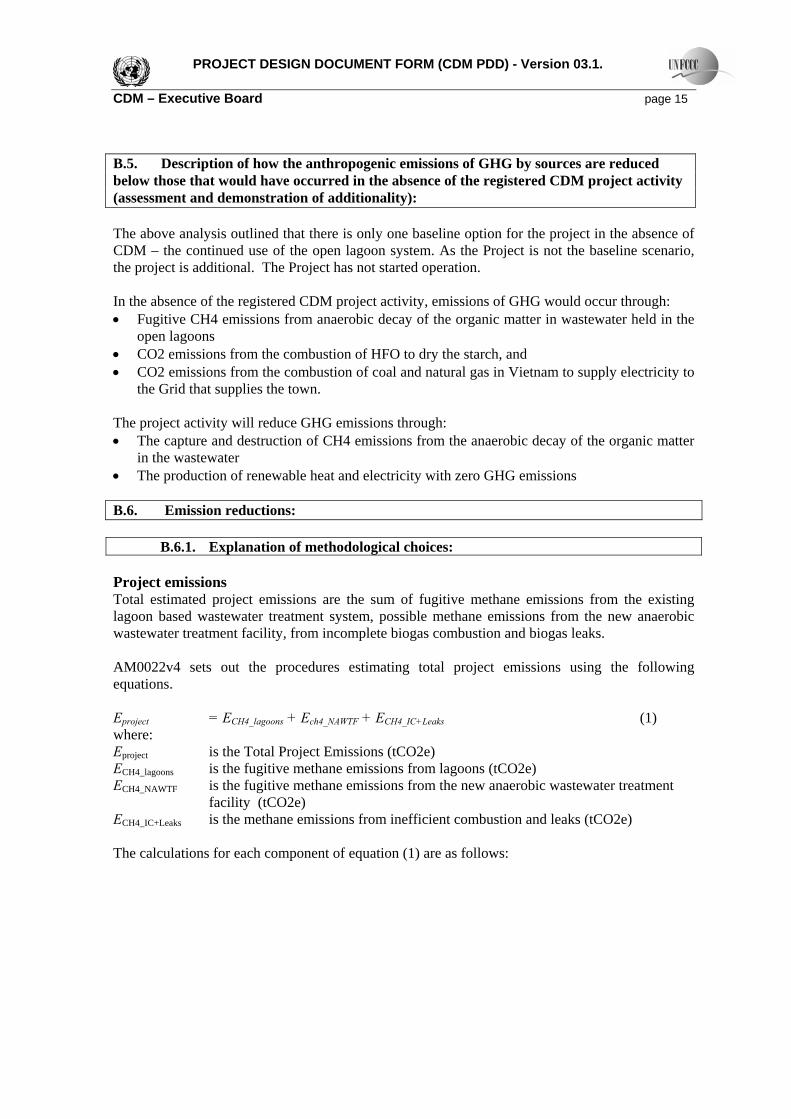
PROJECT DESIGN DOCUMENT FORM (CDM PDD) - Version 03.1. CDM – Executive Board page 15 B.5. Description of how the anthropogenic emissions of GHG by sources are reduced below those that would have occurred in the absence of the registered CDM project activity (assessment and demonstration of additionality): The above analysis outlined that there is only one baseline option for the project in the absence of CDM – the continued use of the open lagoon system. As the Project is not the baseline scenario, the project is additional. The Project has not started operation. In the absence of the registered CDM project activity, emissions of GHG would occur through: • Fugitive CH4 emissions from anaerobic decay of the organic matter in wastewater held in the
open lagoons • CO2 emissions from the combustion of HFO to dry the starch, and • CO2 emissions from the combustion of coal and natural gas in Vietnam to supply electricity to
the Grid that supplies the town. The project activity will reduce GHG emissions through: • The capture and destruction of CH4 emissions from the anaerobic decay of the organic matter
in the wastewater • The production of renewable heat and electricity with zero GHG emissions B.6. Emission reductions:
B.6.1. Explanation of methodological choices: Project emissions Total estimated project emissions are the sum of fugitive methane emissions from the existing lagoon based wastewater treatment system, possible methane emissions from the new anaerobic wastewater treatment facility, from incomplete biogas combustion and biogas leaks. AM0022v4 sets out the procedures estimating total project emissions using the following equations. Eproject = ECH4_lagoons + Ech4_NAWTF + ECH4_IC+Leaks (1) where: Eproject is the Total Project Emissions (tCO2e) ECH4_lagoons is the fugitive methane emissions from lagoons (tCO2e) ECH4_NAWTF is the fugitive methane emissions from the new anaerobic wastewater treatment
facility (tCO2e) ECH4_IC+Leaks is the methane emissions from inefficient combustion and leaks (tCO2e) The calculations for each component of equation (1) are as follows:

PROJECT DESIGN DOCUMENT FORM (CDM PDD) - Version 03.1. CDM – Executive Board page 16 1) Fugitive Methane Emissions from Lagoons (ECH4_lagoons) The digester effluent is discharged into lagoons where it is further treated prior to its release from the factory. Fugitive Methane Emissions from Lagoons are calculated as follows: ECH4_lagoons = Mlagoon_anaerobic . EFCH4 . GWPCH4/1000 (2) where: Mlagoon_anaerobic is the amount of organic material removed by anaerobic processes in the lagoon
system (kgCOD) EFCH4 is the methane emission factor (kgCH4/kgCOD). A default COD to Methane
conversion factor of 0.21kg CH4/kgCOD is used as per AM0022v4 GWPCH4 is the Global Warming Potential of methane (21) The amount of organic material removed by anaerobic processes in the lagoon system (Mlagoon_anaerobic) is calculated using a mass balance approach to COD removals:
Mlagoon_anaerobic = Mlagoon_total – Mlagoon_aerobic – Mlagoon_chemical_ox – Mlagoon_deposition (3) where: Mlagoon_total is the total amount of organic material removed in the lagoon system from
equation (5) (kg COD). This is site specific and determined prior to Project implementation.
Mlagoon_aerobic is the amount of organic material degraded aerobically in the lagoon system (kg COD). Surface aerobic losses of organic material in pond-based systems equal to 254kg COD per hectare of pond surface area and per day is assumed to be lost through aerobic processes.
Mlagoon_chemical_ox is the amount of organic material lost through chemical oxidation in the lagoon system (kg COD).
Mlagoon_deposition is the amount of organic material lost through deposition in the lagoon system from equation (6) (kg COD)
Amount of organic material removed in the lagoon system (Mlagoon_total) Mlagoon_total = Mlagoon_input . Rlagoon (5) with Mlagoon_input = Minput_total . (1-RNAWTF) (4) where: Mlagoon_input is the input of organic material from the new project anaerobic wastewater
treatment facility into the lagoon system (kg COD) Rlagoon is the total organic material removal ratio of the lagoon. It is a project specific
factor, and is equal to the proportion of organic material removed (through all routes) within the boundaries of the existing lagoon system and determined through testing prior to project implementation.
Minput_total is the total amount of organic material fed into the new project wastewater treatment facility (kg COD)
RNAWTF is the total organic material removal efficiency of the new project wastewater treatment facility.

PROJECT DESIGN DOCUMENT FORM (CDM PDD) - Version 03.1. CDM – Executive Board page 17 Amount of organic material degraded aerobically in the lagoon system (Mlagoon_aerobic) The amount of organic material degraded aerobically in the lagoon system is calculated as the product of default value of surface aerobic losses of organic material in pond (254 kg COD/ha/day), total surface area of the lagoons (1.08 ha) and number of days in a year (365 days). As per the methodology, sensitivity analysis was conducted in order to determine the effect of change in the surface aerobic loss of COD to the emission reductions. Table 4 – Sensitivity analysis for the surface aerobic losses of organic material
Oxidative Removal Rate
Error Factor Applied
Baseline Lagoon Emissions Sensitivity
Project Pond Emissions Sensitivity
Emissions Reductions Estimated Sensitivity
254 - 54498 - 7759 - 46739 -318 25% 54387 0% 7648 1% 46739 0%381 50% 54278 0% 7538 3% 46739 0%508 100% 54057 1% 7317 6% 46739 0%
1524 500% 52291 4% 5551 40% 46739 0%2794 1000% 54498 0% 7759 0% 46739 0%
This analysis clearly shows that the emissions reduction calculated are independent of the surface oxidative removal of COD in this project, and thus the 254 kg COD/ha/day is appropriate for this project. Amount of organic material lost through chemical oxidation in lagoon system (Mlagoon_chemical_ox ) No oxidative chemicals are expected in the wastewater, although regular samples will test for concentration of oxidizing agents where they are identified as being likely to be present in wastewater when they are added as part of the process. Amount of organic material lost through deposition in the lagoon system (Mlagoon_deposition) Mlagoon_depositional = Mlagoon_input . Rdeposition (6) where: Rdeposition is the organic material deposition ratio of the lagoon. The wastewater at the TTY factory shows little signs of sedimentation as the wastewater is well mixed and COD readily available for bacterial digestion. However to check this assumption, the deposition of organic material was measured based on Annex 3 of AM0022v4 and adapted from advice from Waste Solutions Engineers. It showed that over the 6 years of operation of the TTY Starch Factory, 1.3% of COD input into the lagoons has sedimented. To be conservative per the Gold Standard requirements, a conservative error factor of 1.5 was applied, and an Rdeposition of 2.1% has been applied. 2) Methane emissions from new anaerobic wastewater treatment facility (ECH4_NAWTF) Methane emissions from the CIGAR are expected to be zero for this project, as the CIGAR will be operating under sub atmospheric pressure. Therefore it is likely that air would be drawn in as opposed to biogas escaping out. Leaks in the biogas pipeline system are also expected to be zero
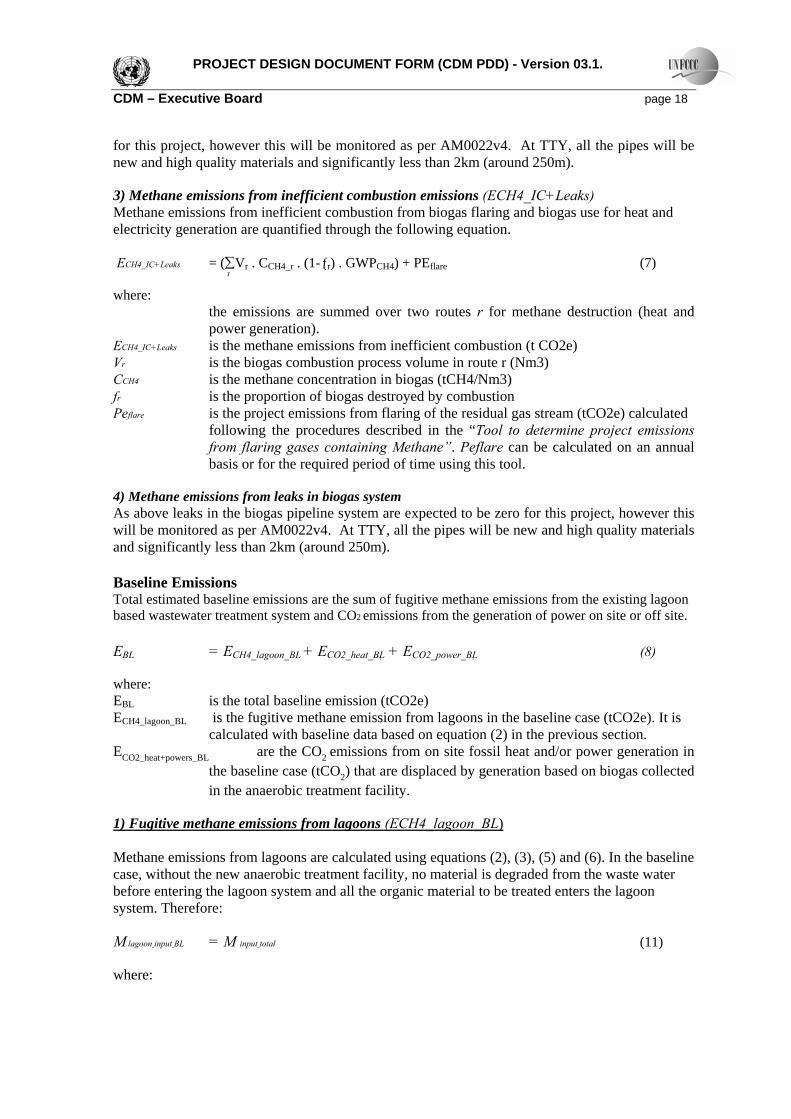
PROJECT DESIGN DOCUMENT FORM (CDM PDD) - Version 03.1. CDM – Executive Board page 18 for this project, however this will be monitored as per AM0022v4. At TTY, all the pipes will be new and high quality materials and significantly less than 2km (around 250m). 3) Methane emissions from inefficient combustion emissions (ECH4_IC+Leaks) Methane emissions from inefficient combustion from biogas flaring and biogas use for heat and electricity generation are quantified through the following equation. ECH4_IC+Leaks = (∑Vr . CCH4_r . (1-ƒr) . GWPCH4) + PEflare (7) where:
the emissions are summed over two routes r for methane destruction (heat and power generation).
ECH4_IC+Leaks is the methane emissions from inefficient combustion (t CO2e) Vr is the biogas combustion process volume in route r (Nm3) CCH4 is the methane concentration in biogas (tCH4/Nm3) fr is the proportion of biogas destroyed by combustion Peflare is the project emissions from flaring of the residual gas stream (tCO2e) calculated
following the procedures described in the “Tool to determine project emissions from flaring gases containing Methane”. Peflare can be calculated on an annual basis or for the required period of time using this tool.
4) Methane emissions from leaks in biogas system As above leaks in the biogas pipeline system are expected to be zero for this project, however this will be monitored as per AM0022v4. At TTY, all the pipes will be new and high quality materials and significantly less than 2km (around 250m). Baseline Emissions Total estimated baseline emissions are the sum of fugitive methane emissions from the existing lagoon based wastewater treatment system and CO2 emissions from the generation of power on site or off site. EBL = ECH4_lagoon_BL + ECO2_heat_BL + ECO2_power_BL (8) where: EBL is the total baseline emission (tCO2e) ECH4_lagoon_BL is the fugitive methane emission from lagoons in the baseline case (tCO2e). It is
calculated with baseline data based on equation (2) in the previous section. ECO2_heat+powers_BL are the CO2 emissions from on site fossil heat and/or power generation in
the baseline case (tCO2) that are displaced by generation based on biogas collected in the anaerobic treatment facility.
1) Fugitive methane emissions from lagoons (ECH4_lagoon_BL) Methane emissions from lagoons are calculated using equations (2), (3), (5) and (6). In the baseline case, without the new anaerobic treatment facility, no material is degraded from the waste water before entering the lagoon system and all the organic material to be treated enters the lagoon system. Therefore: M lagoon input BL = M input total (11) where:
r
PROJECT DESIGN DOCUMENT FORM (CDM PDD) - Version 03.1. CDM – Executive Board page 19 Mlagoon_input_BL is the input of organic material from the new project anaerobic wastewater
treatment facility into the lagoon system (kg COD) Minput_total is the total amount of organic material fed into the baseline wastewater treatment
facility (kg COD) It is the same amount as fed into the project wastewater treatment facility.
All emission factors for surface aerobic losses of organic material, aerobic degradation, deposition or removal as well as chemical oxidation are determined in the same way as described for project emissions calculations. 2) On site fossil fuel emissions displaced by generation of heat based on biogas collected in the anaerobic treatment facility (ECO2_heat_BL ) ECO2_heat_BL = F . NCV . EF (9) Where: F is the corresponding amount of fossil fuel displaced by the use of biogas for the
generation of on site heat (unit). This is estimated as product of 1) Average specific fuel consumption for the output of the facility, estimated using historical data; and (2) the annual production NCV is the net calorific value of the fossil fuel considered (TJ/unit). IPCC default data for Cambodia was used as site specific data is not available.
EF is the carbon emission factor of the fossil fuel considered (tCO2/TJ). 3) On site and off site grid power generation emissions displaced by generation based on biogas collected in the anaerobic treatment facility (ECO2_power_BL ) Displaced electricity CO2 emissions are: ECO2_power = EL . CEF (10) where: EL is the amount of electricity displaced by the electricity generation from the biogas collected from the anaerobic treatment facility. This is estimated as product of: (1) the predicted electricity output of the generator, based on conservative estimates: and (2) the annual production. CEF is the carbon emission factor for the electricity displaced by the electricity generated from the biogas. (tCO2e/MWh). For the purpose of ex-ante calculation, EL was determined from the expected electricity generation from the biogas installed as the part of the Project activity, less the required electricity required to operate the CIGAR. These estimates are conservative and the actual production and CIGAR consumption will be monitored ex-post. The CEF of the Vietnamese electricity grid was calculated based on ACM0002 (0.5806tCO2e/MWh) Details of the CEF calculations are included in Annex 3. Leakage As per the methodology, leakage is considered to be negligible.
PROJECT DESIGN DOCUMENT FORM (CDM PDD) - Version 03.1. CDM – Executive Board page 20 Emission Reductions Emission reductions, ER (tCO2e) are calculated as the difference between the total baseline emissions (equation (8)) and the total project emissions (equation (1)). Leakage is considered to be negligible. ER = EBL – E project (12) It has to be verified that the emissions of methane from the lagoons in the baseline scenario are not higher than the total emissions of methane from the CIGAR and lagoons in the project scenario. Therefore we check whether the following equation is positive: ECH4_lagoon_BL – (ECH4_lagoon + ECH4_NAWTF + ECH4_col) (13) where: ECH4_coll is the amount of methane expressed in (tCO2e) contained in the biogas collected from the anaerobic treatment facility (i.e. the sum of the biogas sent to generation sets and biogas sent to the flare) If the result of the equation (13) is positive, it will be deducted from the result obtained through the equation (12) in order to obtain the final estimation of the emission reductions. For the purpose of ex-ante calculation, it is assumed that the emissions of methane from the lagoons in the baseline scenario are equal to the total emissions of biogas from the digester and the lagoons in the Project. Therefore, equation (13) sums up to zero and is disregarded in the emission calculations.
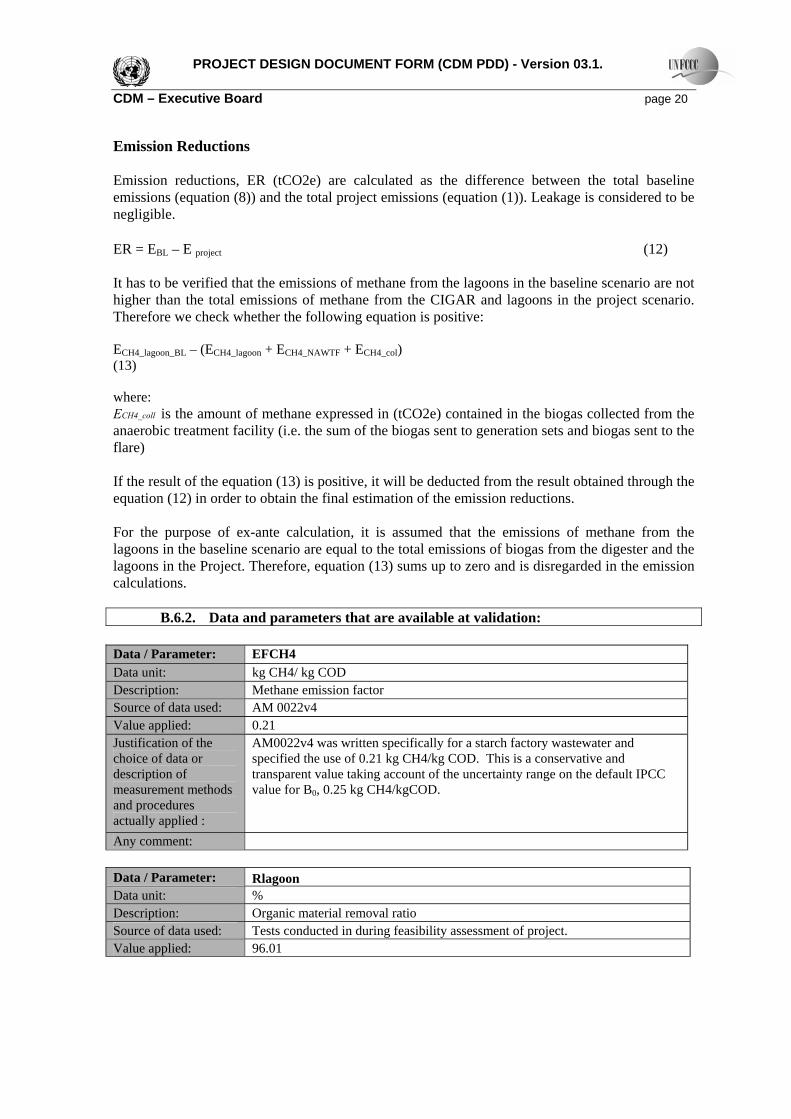
B.6.2. Data and parameters that are available at validation: Data / Parameter: EFCH4 Data unit: kg CH4/ kg COD Description: Methane emission factor Source of data used: AM 0022v4 Value applied: 0.21 Justification of the choice of data or description of measurement methods and procedures actually applied :
AM0022v4 was written specifically for a starch factory wastewater and specified the use of 0.21 kg CH4/kg COD. This is a conservative and transparent value taking account of the uncertainty range on the default IPCC value for B0, 0.25 kg CH4/kgCOD.
Any comment: Data / Parameter: Rlagoon Data unit: % Description: Organic material removal ratio Source of data used: Tests conducted in during feasibility assessment of project. Value applied: 96.01
PROJECT DESIGN DOCUMENT FORM (CDM PDD) - Version 03.1. CDM – Executive Board page 21 Justification of the choice of data or description of measurement methods and procedures actually applied:
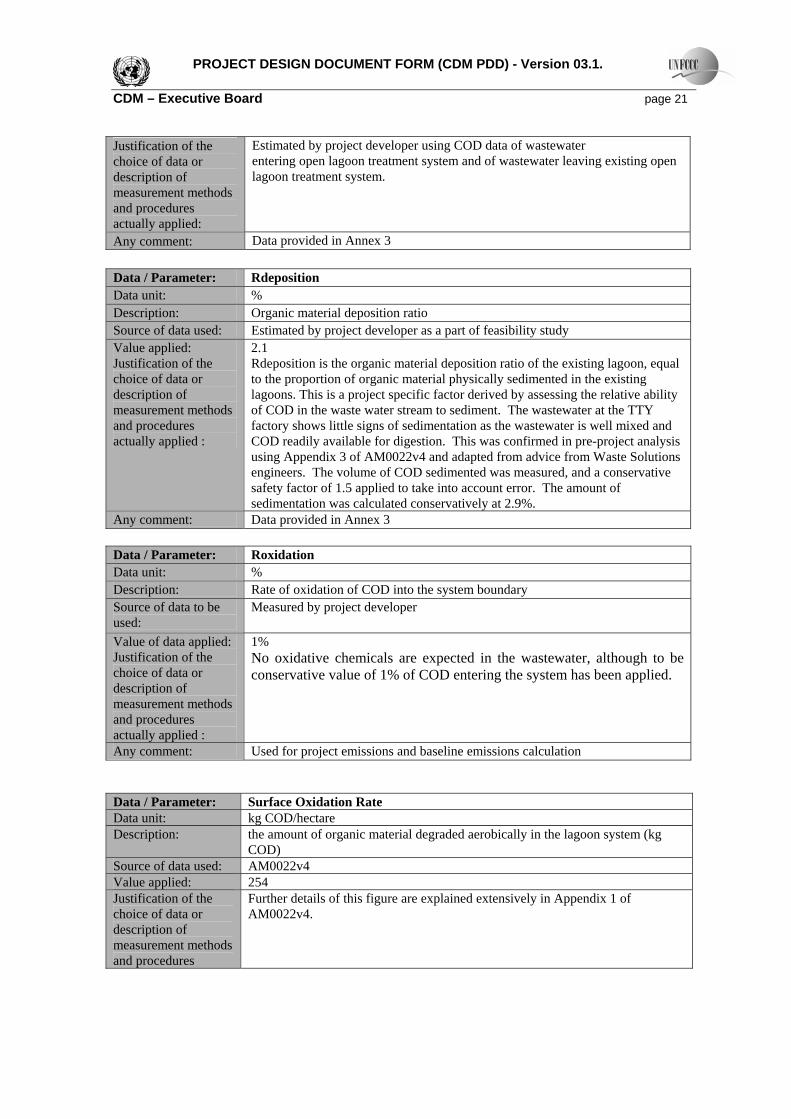
Estimated by project developer using COD data of wastewater entering open lagoon treatment system and of wastewater leaving existing open lagoon treatment system.
Any comment: Data provided in Annex 3 Data / Parameter: Rdeposition Data unit: % Description: Organic material deposition ratio Source of data used: Estimated by project developer as a part of feasibility study Value applied: Justification of the choice of data or description of measurement methods and procedures actually applied :
2.1 Rdeposition is the organic material deposition ratio of the existing lagoon, equal to the proportion of organic material physically sedimented in the existing lagoons. This is a project specific factor derived by assessing the relative ability of COD in the waste water stream to sediment. The wastewater at the TTY factory shows little signs of sedimentation as the wastewater is well mixed and COD readily available for digestion. This was confirmed in pre-project analysis using Appendix 3 of AM0022v4 and adapted from advice from Waste Solutions engineers. The volume of COD sedimented was measured, and a conservative safety factor of 1.5 applied to take into account error. The amount of sedimentation was calculated conservatively at 2.9%.
Any comment: Data provided in Annex 3 Data / Parameter: Roxidation Data unit: % Description: Rate of oxidation of COD into the system boundary Source of data to be used:
Measured by project developer
Value of data applied: Justification of the choice of data or description of measurement methods and procedures actually applied :
1% No oxidative chemicals are expected in the wastewater, although to be conservative value of 1% of COD entering the system has been applied.
Any comment: Used for project emissions and baseline emissions calculation Data / Parameter: Surface Oxidation Rate Data unit: kg COD/hectare Description: the amount of organic material degraded aerobically in the lagoon system (kg
COD) Source of data used: AM0022v4 Value applied: 254 Justification of the choice of data or description of measurement methods and procedures
Further details of this figure are explained extensively in Appendix 1 of AM0022v4.
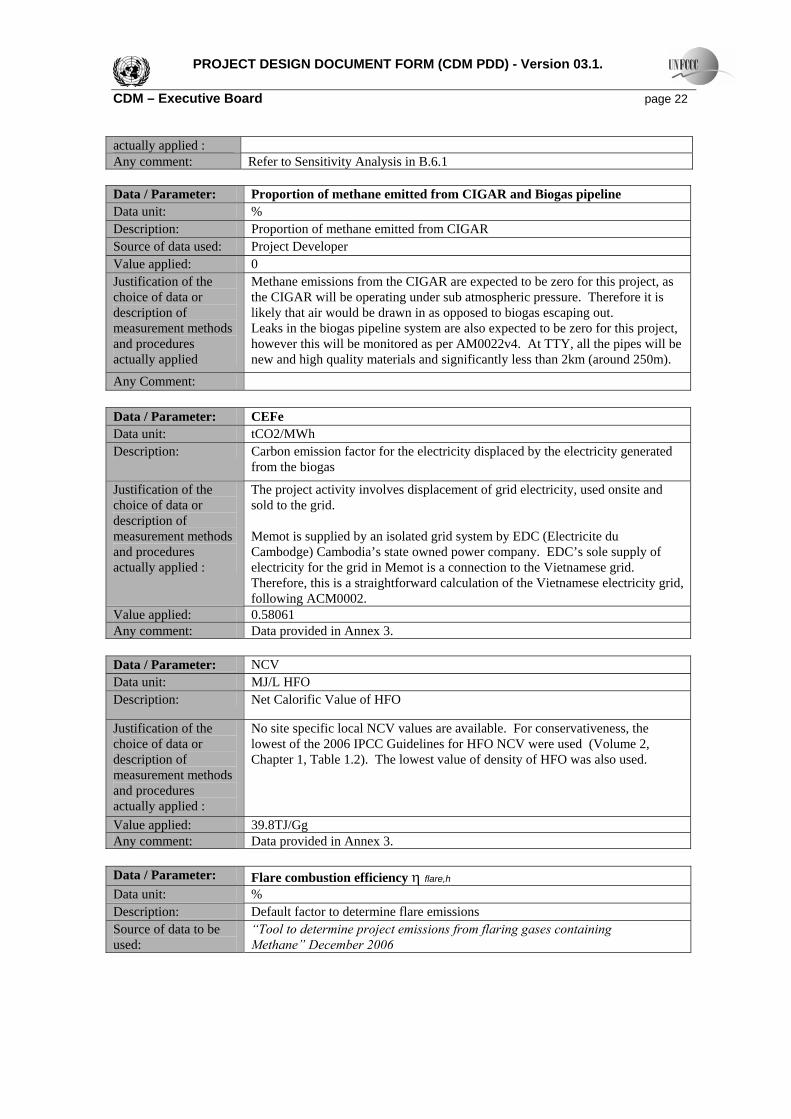
PROJECT DESIGN DOCUMENT FORM (CDM PDD) - Version 03.1. CDM – Executive Board page 22 actually applied : Any comment: Refer to Sensitivity Analysis in B.6.1 Data / Parameter: Proportion of methane emitted from CIGAR and Biogas pipeline Data unit: % Description: Proportion of methane emitted from CIGAR Source of data used: Project Developer Value applied: 0 Justification of the choice of data or description of measurement methods and procedures actually applied
Methane emissions from the CIGAR are expected to be zero for this project, as the CIGAR will be operating under sub atmospheric pressure. Therefore it is likely that air would be drawn in as opposed to biogas escaping out. Leaks in the biogas pipeline system are also expected to be zero for this project, however this will be monitored as per AM0022v4. At TTY, all the pipes will be new and high quality materials and significantly less than 2km (around 250m).
Any Comment: Data / Parameter: CEFe Data unit: tCO2/MWh Description: Carbon emission factor for the electricity displaced by the electricity generated
from the biogas
Justification of the choice of data or description of measurement methods and procedures actually applied :
The project activity involves displacement of grid electricity, used onsite and sold to the grid. Memot is supplied by an isolated grid system by EDC (Electricite du Cambodge) Cambodia’s state owned power company. EDC’s sole supply of electricity for the grid in Memot is a connection to the Vietnamese grid. Therefore, this is a straightforward calculation of the Vietnamese electricity grid, following ACM0002.
Value applied: 0.58061 Any comment: Data provided in Annex 3. Data / Parameter: NCV Data unit: MJ/L HFO Description: Net Calorific Value of HFO
Justification of the choice of data or description of measurement methods and procedures actually applied :
No site specific local NCV values are available. For conservativeness, the lowest of the 2006 IPCC Guidelines for HFO NCV were used (Volume 2, Chapter 1, Table 1.2). The lowest value of density of HFO was also used.
Value applied: 39.8TJ/Gg Any comment: Data provided in Annex 3. Data / Parameter: Flare combustion efficiency η flare,h Data unit: % Description: Default factor to determine flare emissions Source of data to be used:
“Tool to determine project emissions from flaring gases containing Methane” December 2006
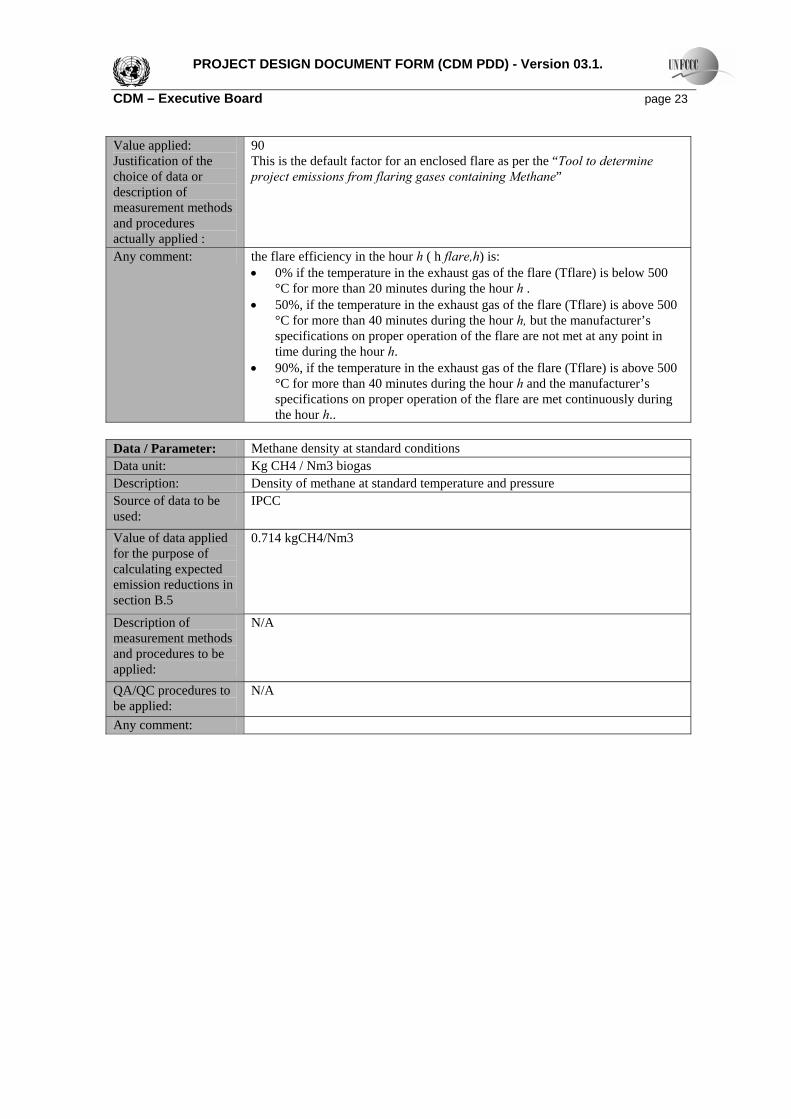
PROJECT DESIGN DOCUMENT FORM (CDM PDD) - Version 03.1. CDM – Executive Board page 23 Value applied: Justification of the choice of data or description of measurement methods and procedures actually applied :
90 This is the default factor for an enclosed flare as per the “Tool to determine project emissions from flaring gases containing Methane”
Any comment: the flare efficiency in the hour h ( h flare,h) is: • 0% if the temperature in the exhaust gas of the flare (Tflare) is below 500
°C for more than 20 minutes during the hour h . • 50%, if the temperature in the exhaust gas of the flare (Tflare) is above 500
°C for more than 40 minutes during the hour h, but the manufacturer’s specifications on proper operation of the flare are not met at any point in time during the hour h.
• 90%, if the temperature in the exhaust gas of the flare (Tflare) is above 500 °C for more than 40 minutes during the hour h and the manufacturer’s specifications on proper operation of the flare are met continuously during the hour h..
Data / Parameter: Methane density at standard conditions Data unit: Kg CH4 / Nm3 biogas Description: Density of methane at standard temperature and pressure Source of data to be used:
IPCC
Value of data applied for the purpose of calculating expected emission reductions in section B.5
0.714 kgCH4/Nm3
Description of measurement methods and procedures to be applied:
N/A
QA/QC procedures to be applied:
N/A
Any comment:

PROJECT DESIGN DOCUMENT FORM (CDM PDD) - Version 03.1. CDM – Executive Board page 24
B.6.3 Ex-ante calculation of emission reductions:
For the purposes of Ex-ante calculations, the emission reductions for the full production scenario will be used. The emission reductions for the first year will be lower, as shown in Table 2, as the factory continues to ramp up to full it’s full capacity. Project Emissions Project emissions are fugitive emissions from the lagoons, the CIGAR biogas system and inefficient combustion.
Eproject = ECH4_lagoons + Ech4_NAWTF + ECH4_IC+Leaks (1) Eproject = 7,595 + 3,053 + 0 tCO2e/y = 10,647 tCO2e/y 1 ECH4_lagoons – fugitive methane emissions from lagoons ECH4_lagoons = Mlagoon_anaerobic . EFCH4 . GWPCH4/1000 (2)
= 1,722,156 COD/y x 0.21 kg CH4/kgCOD x 21 tCO2e/tCH4)/ 1000 = 7,595 (tCO2e/y)
Mlagoon_anaerobic_BL is established following AM0022v4 mass balance approach for removals of organic matter in the system:
Total COD input into system = 1,319,500 m3/y x 1.5kgCOD/m3 = 1,979,250 kg COD/y Total COD removed from the system = 1,979,250 kg COD/y x 96.01% = 1,900,314 kg COD/y Surface aerobic losses = 254 kg COD x 1.08 ha x 365days =100,127 kg COD/y Sedimentation = 1,979,250 kg COD x 2.9%/y = 58,239 kg COD/y Oxidisation = 1,979,250 kg COD x 1.0%/y = 19,793 kg COD/y Total Anaerobic losses (ie COD converted to methane (Mlagoon_anaerobic) =1,900,314 – 44,219 – 100,127 – 19,793 kg COD/y = 1,722,156 kg COD/y
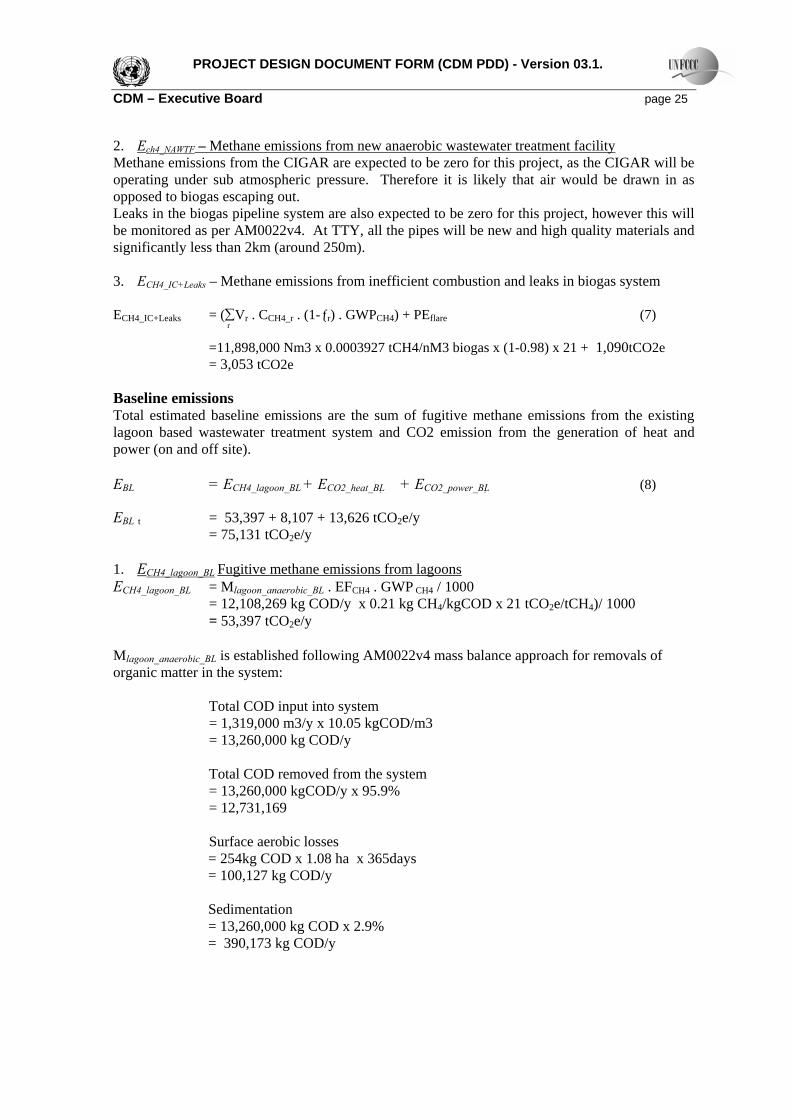
PROJECT DESIGN DOCUMENT FORM (CDM PDD) - Version 03.1. CDM – Executive Board page 25 2. Ech4_NAWTF – Methane emissions from new anaerobic wastewater treatment facility Methane emissions from the CIGAR are expected to be zero for this project, as the CIGAR will be operating under sub atmospheric pressure. Therefore it is likely that air would be drawn in as opposed to biogas escaping out. Leaks in the biogas pipeline system are also expected to be zero for this project, however this will be monitored as per AM0022v4. At TTY, all the pipes will be new and high quality materials and significantly less than 2km (around 250m). 3. ECH4_IC+Leaks – Methane emissions from inefficient combustion and leaks in biogas system ECH4_IC+Leaks = (∑Vr . CCH4_r . (1-ƒr) . GWPCH4) + PEflare (7)
=11,898,000 Nm3 x 0.0003927 tCH4/nM3 biogas x (1-0.98) x 21 + 1,090tCO2e = 3,053 tCO2e
Baseline emissions Total estimated baseline emissions are the sum of fugitive methane emissions from the existing lagoon based wastewater treatment system and CO2 emission from the generation of heat and power (on and off site). EBL = ECH4_lagoon_BL + ECO2_heat_BL + ECO2_power_BL (8) EBL t = 53,397 + 8,107 + 13,626 tCO2e/y = 75,131 tCO2e/y 1. ECH4_lagoon_BL Fugitive methane emissions from lagoons ECH4_lagoon_BL = Mlagoon_anaerobic_BL . EFCH4 . GWP CH4 / 1000
= 12,108,269 kg COD/y x 0.21 kg CH4/kgCOD x 21 tCO2e/tCH4)/ 1000 = 53,397 tCO2e/y
Mlagoon_anaerobic_BL is established following AM0022v4 mass balance approach for removals of organic matter in the system:
Total COD input into system = 1,319,000 m3/y x 10.05 kgCOD/m3 = 13,260,000 kg COD/y Total COD removed from the system = 13,260,000 kgCOD/y x 95.9% = 12,731,169 Surface aerobic losses = 254kg COD x 1.08 ha x 365days = 100,127 kg COD/y Sedimentation = 13,260,000 kg COD x 2.9% = 390,173 kg COD/y
r
PROJECT DESIGN DOCUMENT FORM (CDM PDD) - Version 03.1. CDM – Executive Board page 26
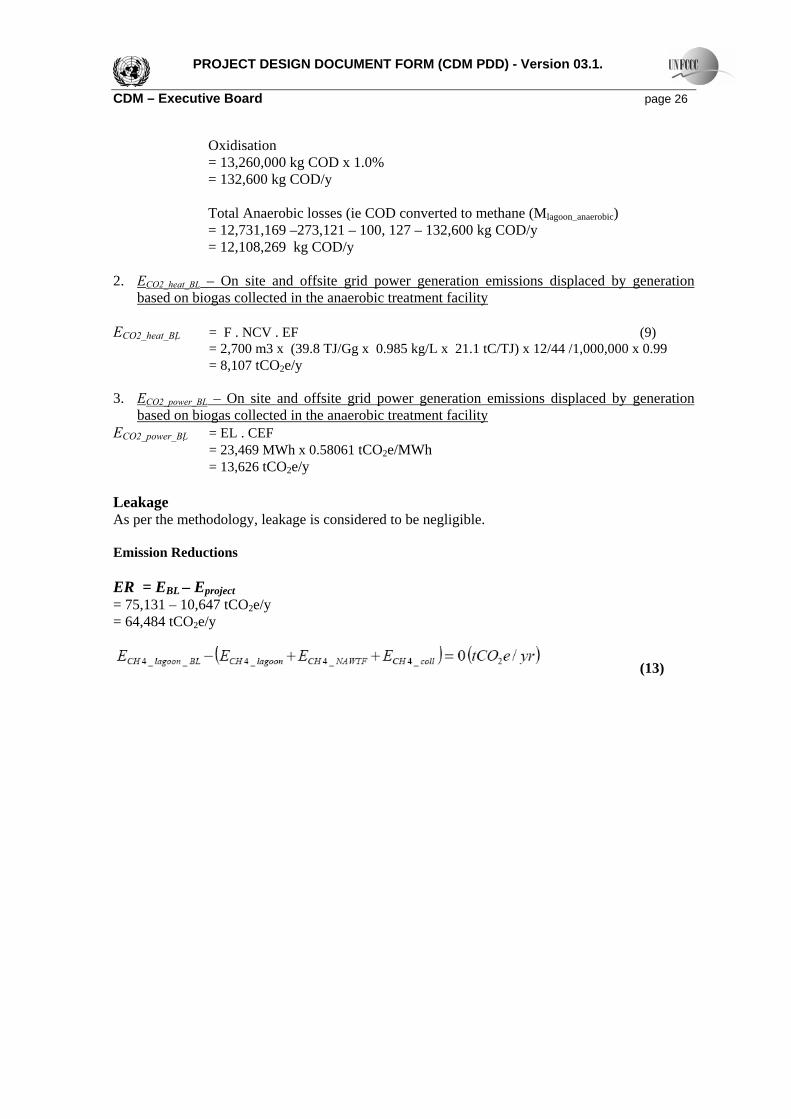
Oxidisation = 13,260,000 kg COD x 1.0% = 132,600 kg COD/y Total Anaerobic losses (ie COD converted to methane (Mlagoon_anaerobic) = 12,731,169 –273,121 – 100, 127 – 132,600 kg COD/y = 12,108,269 kg COD/y
2. ECO2_heat_BL – On site and offsite grid power generation emissions displaced by generation
based on biogas collected in the anaerobic treatment facility ECO2_heat_BL = F . NCV . EF (9)
= 2,700 m3 x (39.8 TJ/Gg x 0.985 kg/L x 21.1 tC/TJ) x 12/44 /1,000,000 x 0.99 = 8,107 tCO2e/y 3. ECO2_power_BL – On site and offsite grid power generation emissions displaced by generation
based on biogas collected in the anaerobic treatment facility ECO2_power_BL = EL . CEF
= 23,469 MWh x 0.58061 tCO2e/MWh = 13,626 tCO2e/y
Leakage As per the methodology, leakage is considered to be negligible. Emission Reductions ER = EBL – Eproject = 75,131 – 10,647 tCO2e/y = 64,484 tCO2e/y
(13)
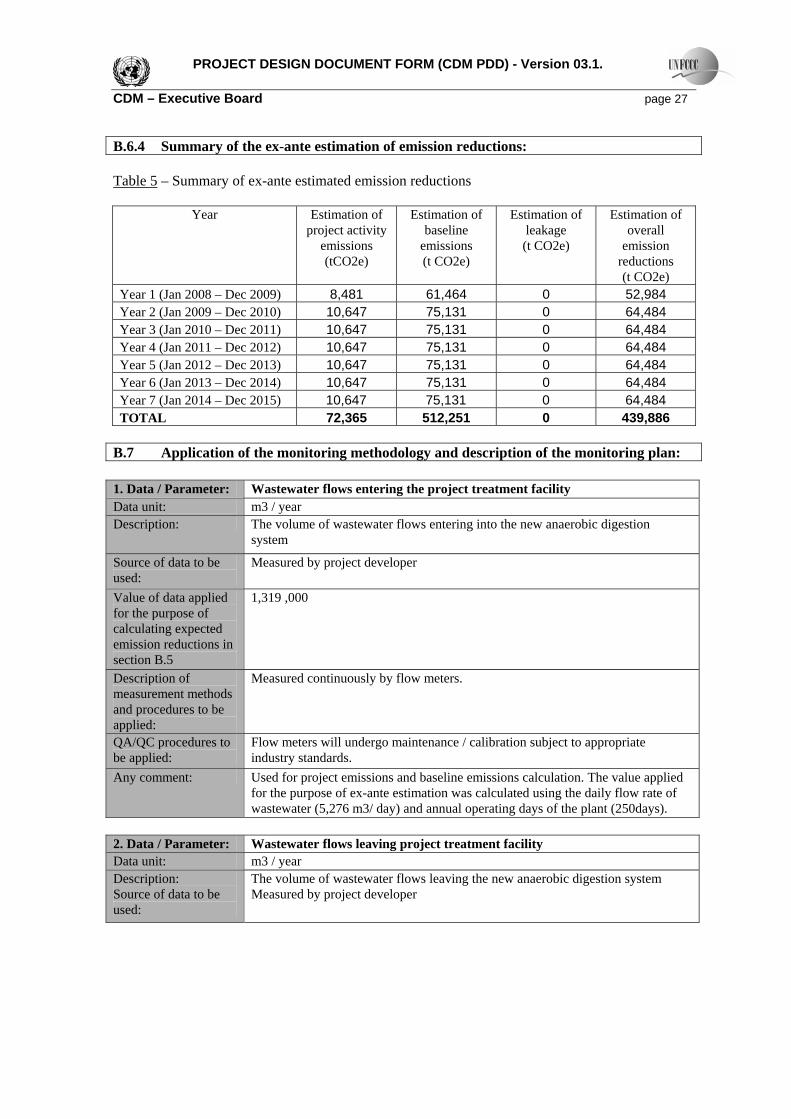
PROJECT DESIGN DOCUMENT FORM (CDM PDD) - Version 03.1. CDM – Executive Board page 27 B.6.4 Summary of the ex-ante estimation of emission reductions: Table 5 – Summary of ex-ante estimated emission reductions
Year
Estimation of project activity
emissions (tCO2e)
Estimation of baseline
emissions (t CO2e)
Estimation of leakage (t CO2e)
Estimation of overall
emission reductions (t CO2e)
Year 1 (Jan 2008 – Dec 2009) 8,481 61,464 0 52,984 Year 2 (Jan 2009 – Dec 2010) 10,647 75,131 0 64,484 Year 3 (Jan 2010 – Dec 2011) 10,647 75,131 0 64,484 Year 4 (Jan 2011 – Dec 2012) 10,647 75,131 0 64,484 Year 5 (Jan 2012 – Dec 2013) 10,647 75,131 0 64,484 Year 6 (Jan 2013 – Dec 2014) 10,647 75,131 0 64,484 Year 7 (Jan 2014 – Dec 2015) 10,647 75,131 0 64,484 TOTAL 72,365 512,251 0 439,886
B.7 Application of the monitoring methodology and description of the monitoring plan:
1. Data / Parameter: Wastewater flows entering the project treatment facility Data unit: m3 / year Description: The volume of wastewater flows entering into the new anaerobic digestion
system
Source of data to be used:
Measured by project developer
Value of data applied for the purpose of calculating expected emission reductions in section B.5
1,319 ,000
Description of measurement methods and procedures to be applied:
Measured continuously by flow meters.
QA/QC procedures to be applied:
Flow meters will undergo maintenance / calibration subject to appropriate industry standards.
Any comment: Used for project emissions and baseline emissions calculation. The value applied for the purpose of ex-ante estimation was calculated using the daily flow rate of wastewater (5,276 m3/ day) and annual operating days of the plant (250days).
2. Data / Parameter: Wastewater flows leaving project treatment facility Data unit: m3 / year Description: Source of data to be used:
The volume of wastewater flows leaving the new anaerobic digestion system Measured by project developer
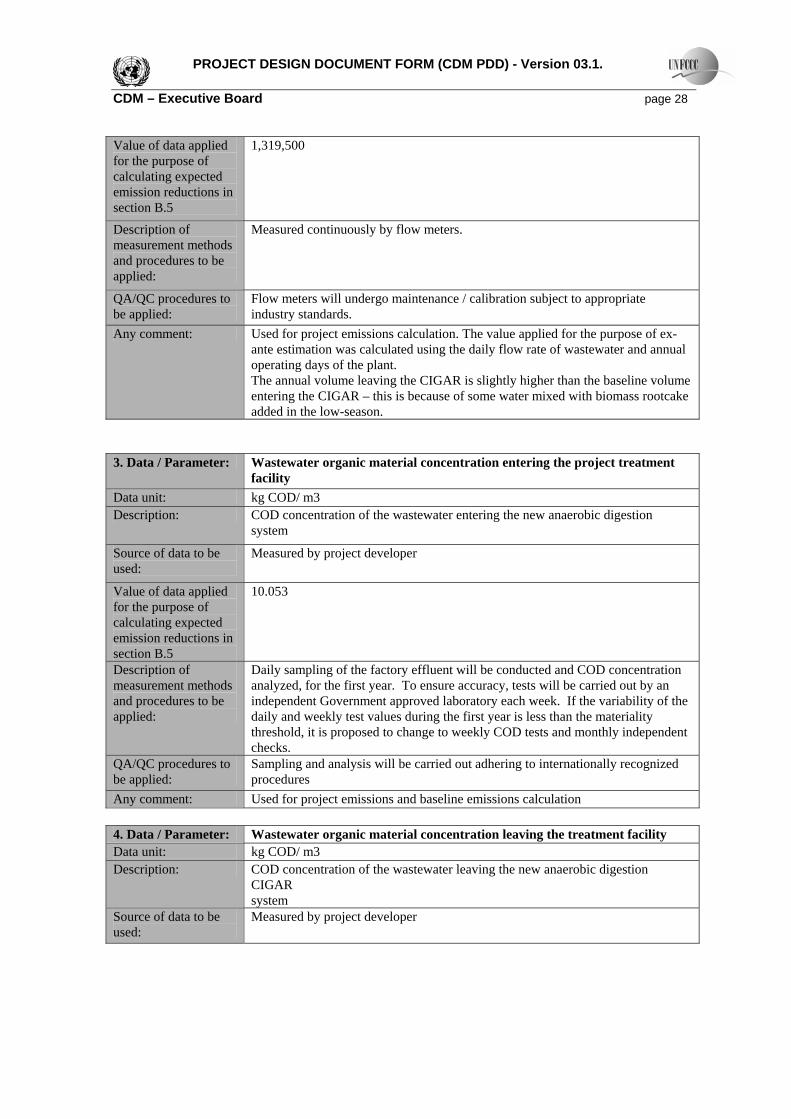
PROJECT DESIGN DOCUMENT FORM (CDM PDD) - Version 03.1. CDM – Executive Board page 28 Value of data applied for the purpose of calculating expected emission reductions in section B.5
1,319,500
Description of measurement methods and procedures to be applied:
Measured continuously by flow meters.
QA/QC procedures to be applied:
Flow meters will undergo maintenance / calibration subject to appropriate industry standards.
Any comment: Used for project emissions calculation. The value applied for the purpose of ex- ante estimation was calculated using the daily flow rate of wastewater and annual operating days of the plant. The annual volume leaving the CIGAR is slightly higher than the baseline volume entering the CIGAR – this is because of some water mixed with biomass rootcake added in the low-season.
3. Data / Parameter: Wastewater organic material concentration entering the project treatment
facility Data unit: kg COD/ m3 Description: COD concentration of the wastewater entering the new anaerobic digestion
system
Source of data to be used:
Measured by project developer
Value of data applied for the purpose of calculating expected emission reductions in section B.5
10.053
Description of measurement methods and procedures to be applied:
Daily sampling of the factory effluent will be conducted and COD concentration analyzed, for the first year. To ensure accuracy, tests will be carried out by an independent Government approved laboratory each week. If the variability of the daily and weekly test values during the first year is less than the materiality threshold, it is proposed to change to weekly COD tests and monthly independent checks.
QA/QC procedures to be applied:
Sampling and analysis will be carried out adhering to internationally recognized procedures
Any comment: Used for project emissions and baseline emissions calculation 4. Data / Parameter: Wastewater organic material concentration leaving the treatment facility Data unit: kg COD/ m3 Description: COD concentration of the wastewater leaving the new anaerobic digestion
CIGAR system
Source of data to be used:
Measured by project developer
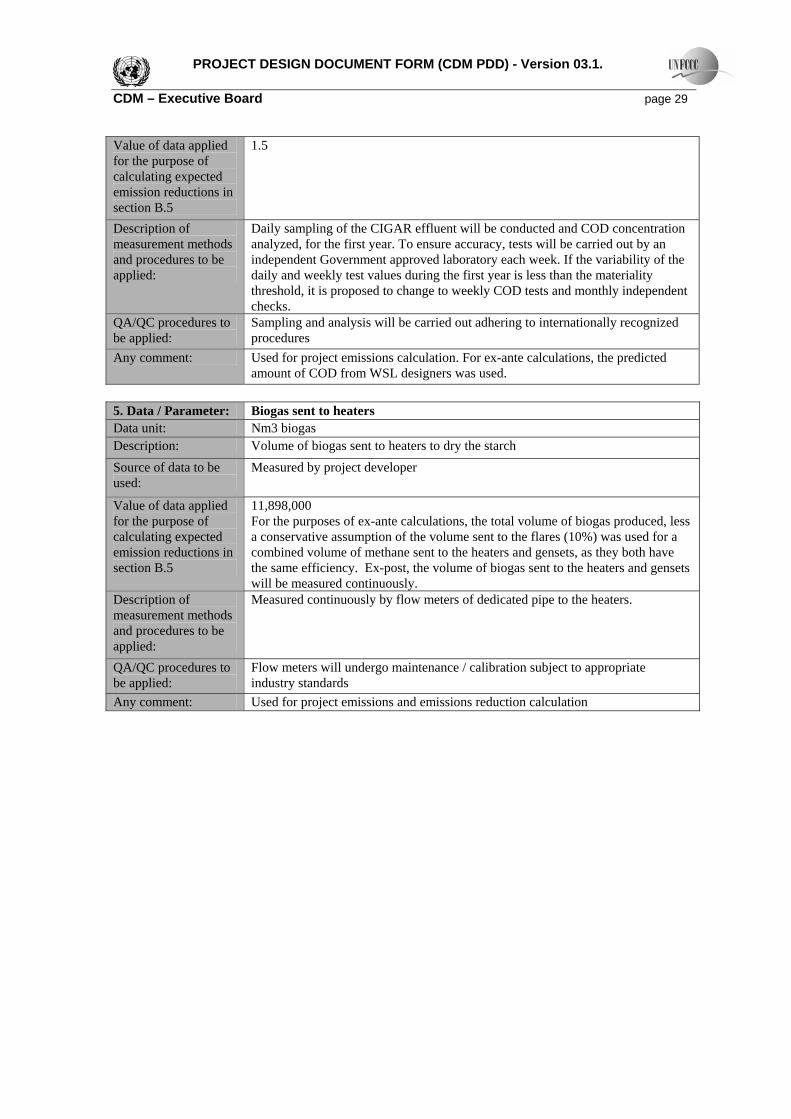
PROJECT DESIGN DOCUMENT FORM (CDM PDD) - Version 03.1. CDM – Executive Board page 29 Value of data applied for the purpose of calculating expected emission reductions in section B.5
1.5
Description of measurement methods and procedures to be applied:
Daily sampling of the CIGAR effluent will be conducted and COD concentration analyzed, for the first year. To ensure accuracy, tests will be carried out by an independent Government approved laboratory each week. If the variability of the daily and weekly test values during the first year is less than the materiality threshold, it is proposed to change to weekly COD tests and monthly independent checks.
QA/QC procedures to be applied:
Sampling and analysis will be carried out adhering to internationally recognized procedures
Any comment: Used for project emissions calculation. For ex-ante calculations, the predicted amount of COD from WSL designers was used.
5. Data / Parameter: Biogas sent to heaters Data unit: Nm3 biogas Description: Volume of biogas sent to heaters to dry the starch Source of data to be used:
Measured by project developer
Value of data applied for the purpose of calculating expected emission reductions in section B.5
11,898,000 For the purposes of ex-ante calculations, the total volume of biogas produced, less a conservative assumption of the volume sent to the flares (10%) was used for a combined volume of methane sent to the heaters and gensets, as they both have the same efficiency. Ex-post, the volume of biogas sent to the heaters and gensets will be measured continuously.
Description of measurement methods and procedures to be applied:
Measured continuously by flow meters of dedicated pipe to the heaters.
QA/QC procedures to be applied:
Flow meters will undergo maintenance / calibration subject to appropriate industry standards
Any comment: Used for project emissions and emissions reduction calculation
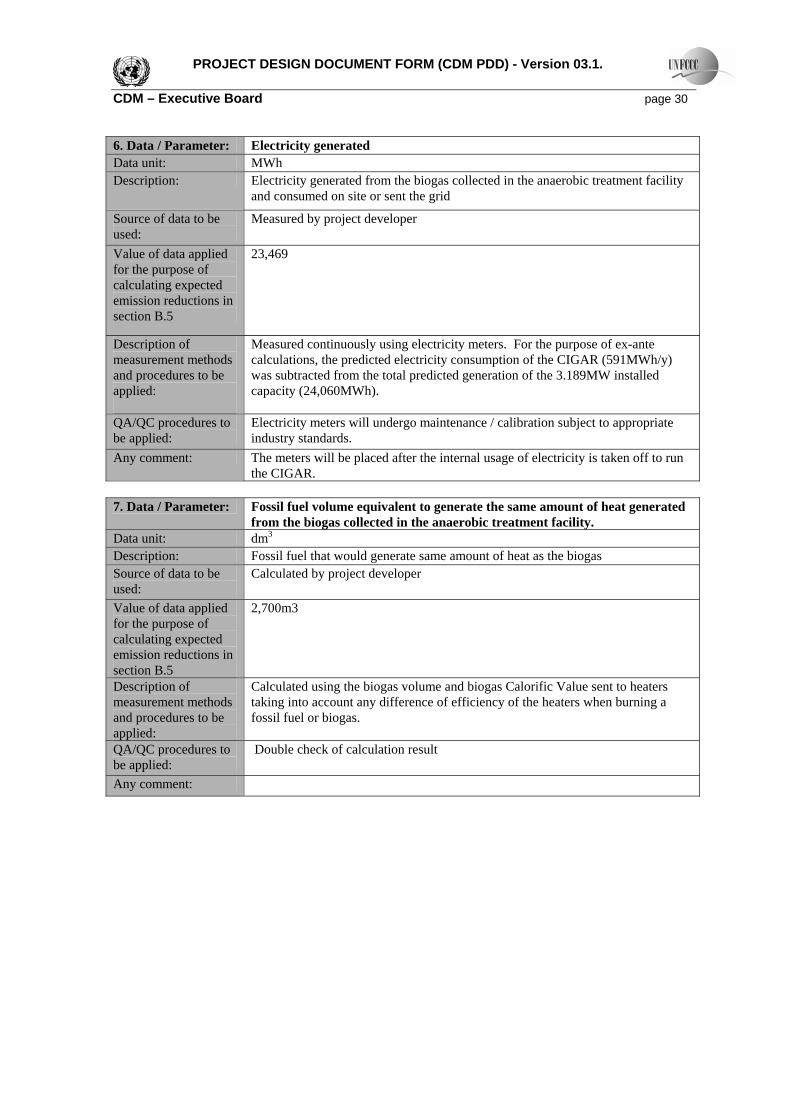
PROJECT DESIGN DOCUMENT FORM (CDM PDD) - Version 03.1. CDM – Executive Board page 30 6. Data / Parameter: Electricity generated Data unit: MWh Description: Electricity generated from the biogas collected in the anaerobic treatment facility
and consumed on site or sent the grid
Source of data to be used:
Measured by project developer
Value of data applied for the purpose of calculating expected emission reductions in section B.5
23,469
Description of measurement methods and procedures to be applied:
Measured continuously using electricity meters. For the purpose of ex-ante calculations, the predicted electricity consumption of the CIGAR (591MWh/y) was subtracted from the total predicted generation of the 3.189MW installed capacity (24,060MWh).
QA/QC procedures to be applied:
Electricity meters will undergo maintenance / calibration subject to appropriate industry standards.
Any comment: The meters will be placed after the internal usage of electricity is taken off to run the CIGAR.
7. Data / Parameter: Fossil fuel volume equivalent to generate the same amount of heat generated
from the biogas collected in the anaerobic treatment facility. Data unit: dm3 Description: Fossil fuel that would generate same amount of heat as the biogas Source of data to be used:
Calculated by project developer
Value of data applied for the purpose of calculating expected emission reductions in section B.5
2,700m3
Description of measurement methods and procedures to be applied:
Calculated using the biogas volume and biogas Calorific Value sent to heaters taking into account any difference of efficiency of the heaters when burning a fossil fuel or biogas.
QA/QC procedures to be applied:
Double check of calculation result
Any comment:
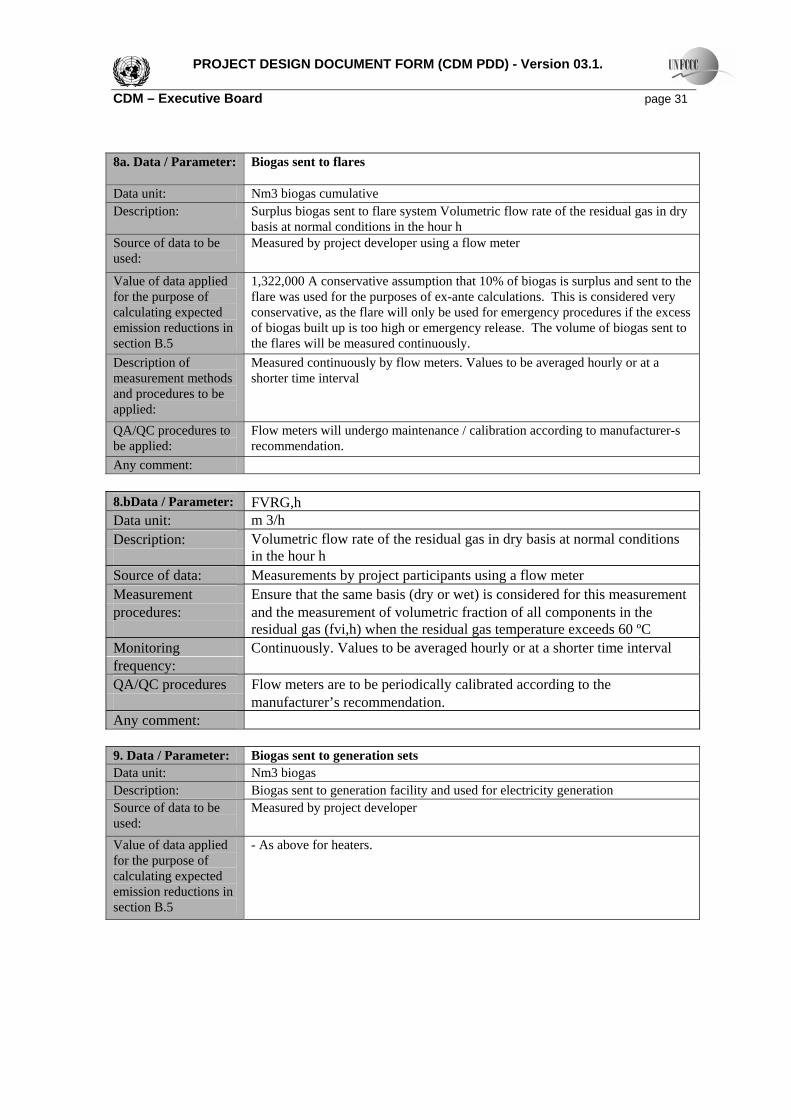
PROJECT DESIGN DOCUMENT FORM (CDM PDD) - Version 03.1. CDM – Executive Board page 31 8a. Data / Parameter: Biogas sent to flares
Data unit: Nm3 biogas cumulative Description: Surplus biogas sent to flare system Volumetric flow rate of the residual gas in dry
basis at normal conditions in the hour h Source of data to be used:
Measured by project developer using a flow meter
Value of data applied for the purpose of calculating expected emission reductions in section B.5
1,322,000 A conservative assumption that 10% of biogas is surplus and sent to the flare was used for the purposes of ex-ante calculations. This is considered very conservative, as the flare will only be used for emergency procedures if the excess of biogas built up is too high or emergency release. The volume of biogas sent to the flares will be measured continuously.
Description of measurement methods and procedures to be applied:
Measured continuously by flow meters. Values to be averaged hourly or at a shorter time interval
QA/QC procedures to be applied:
Flow meters will undergo maintenance / calibration according to manufacturer-s recommendation.
Any comment: 8.bData / Parameter: FVRG,h Data unit: m 3/h Description:
Volumetric flow rate of the residual gas in dry basis at normal conditions in the hour h
Source of data: Measurements by project participants using a flow meter Measurement Ensure that the same basis (dry or wet) is considered for this measurement procedures: and the measurement of volumetric fraction of all components in the residual gas (fvi,h) when the residual gas temperature exceeds 60 ºC Monitoring Continuously. Values to be averaged hourly or at a shorter time interval frequency: QA/QC procedures Flow meters are to be periodically calibrated according to the manufacturer’s recommendation. Any comment: 9. Data / Parameter: Biogas sent to generation sets Data unit: Nm3 biogas Description: Biogas sent to generation facility and used for electricity generation Source of data to be used:
Measured by project developer
Value of data applied for the purpose of calculating expected emission reductions in section B.5
- As above for heaters.
PROJECT DESIGN DOCUMENT FORM (CDM PDD) - Version 03.1. CDM – Executive Board page 32 Description of measurement methods and procedures to be applied:
Measured continuously by flow meters at the dedicated pipe for biogas sent to the gensets.
QA/QC procedures to be applied:
Flow meters will undergo maintenance / calibration subject to appropriate Industry standards
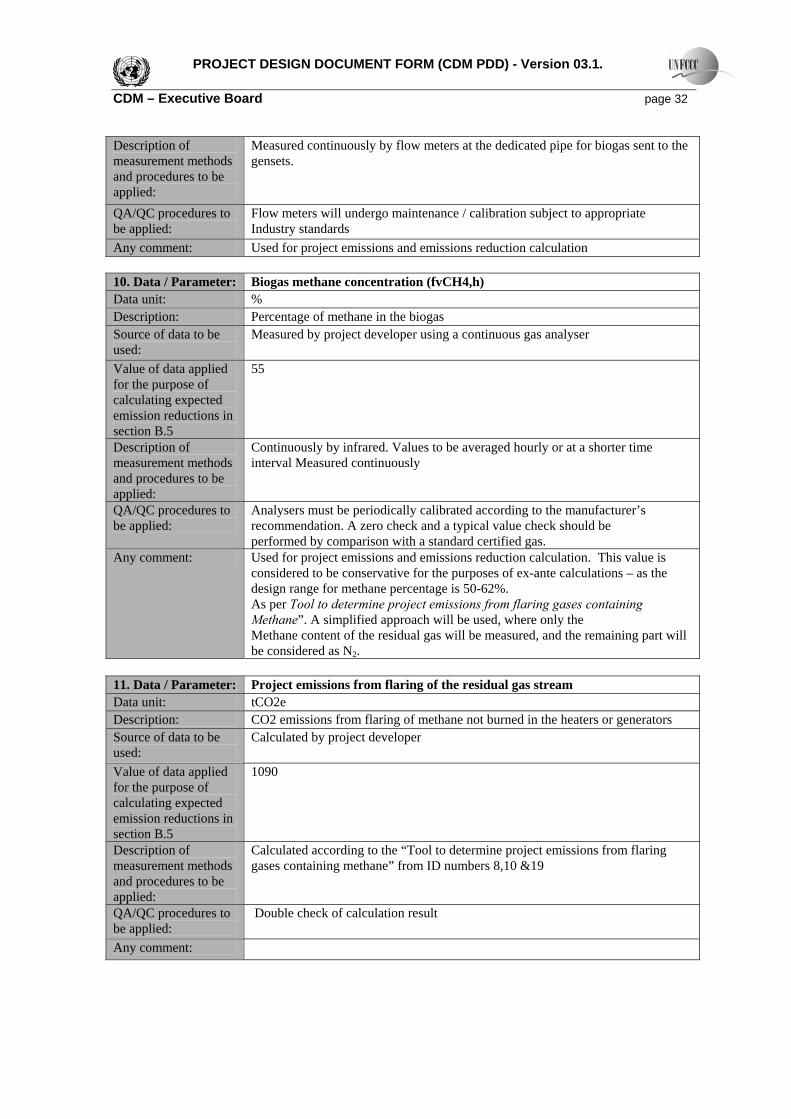
Any comment: Used for project emissions and emissions reduction calculation 10. Data / Parameter: Biogas methane concentration (fvCH4,h) Data unit: % Description: Percentage of methane in the biogas Source of data to be used:
Measured by project developer using a continuous gas analyser
Value of data applied for the purpose of calculating expected emission reductions in section B.5
55
Description of measurement methods and procedures to be applied:
Continuously by infrared. Values to be averaged hourly or at a shorter time interval Measured continuously
QA/QC procedures to be applied:
Analysers must be periodically calibrated according to the manufacturer’s recommendation. A zero check and a typical value check should be performed by comparison with a standard certified gas.
Any comment: Used for project emissions and emissions reduction calculation. This value is considered to be conservative for the purposes of ex-ante calculations – as the design range for methane percentage is 50-62%. As per Tool to determine project emissions from flaring gases containing Methane”. A simplified approach will be used, where only the Methane content of the residual gas will be measured, and the remaining part will be considered as N2.
11. Data / Parameter: Project emissions from flaring of the residual gas stream Data unit: tCO2e Description: CO2 emissions from flaring of methane not burned in the heaters or generators Source of data to be used:
Calculated by project developer
Value of data applied for the purpose of calculating expected emission reductions in section B.5
1090
Description of measurement methods and procedures to be applied:
Calculated according to the “Tool to determine project emissions from flaring gases containing methane” from ID numbers 8,10 &19
QA/QC procedures to be applied:
Double check of calculation result
Any comment:
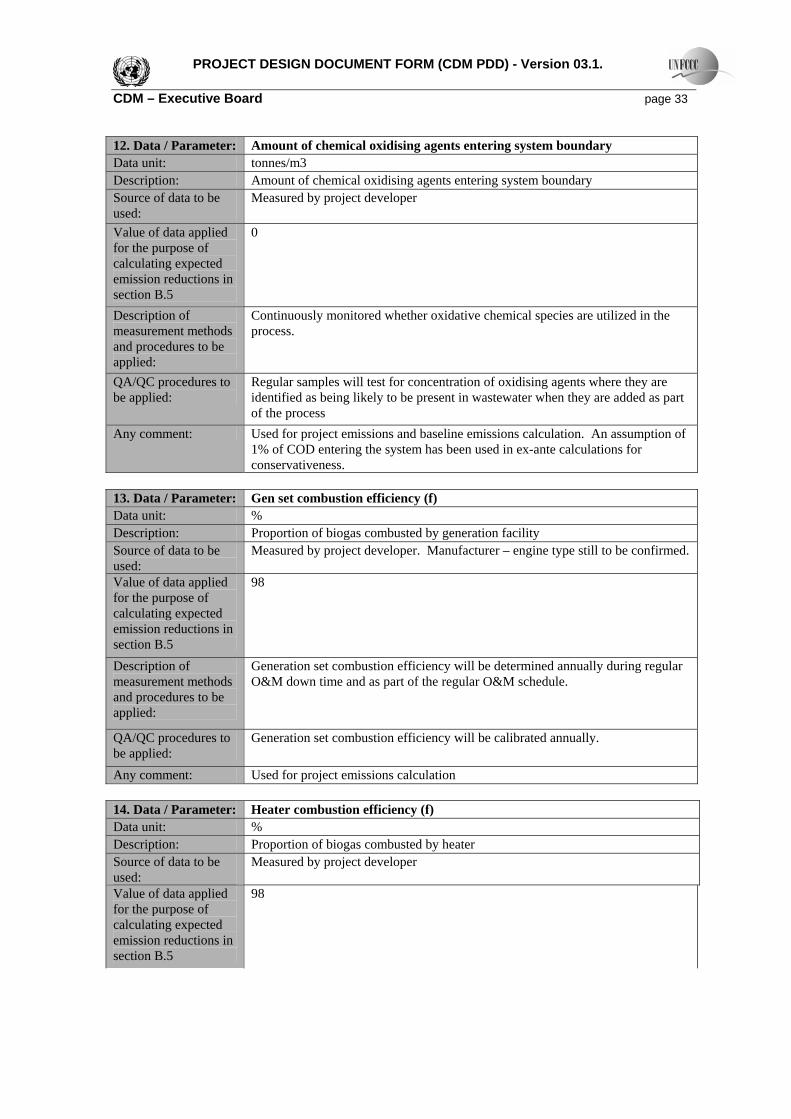
PROJECT DESIGN DOCUMENT FORM (CDM PDD) - Version 03.1. CDM – Executive Board page 33 12. Data / Parameter: Amount of chemical oxidising agents entering system boundary Data unit: tonnes/m3 Description: Amount of chemical oxidising agents entering system boundary Source of data to be used:
Measured by project developer
Value of data applied for the purpose of calculating expected emission reductions in section B.5
0
Description of measurement methods and procedures to be applied:
Continuously monitored whether oxidative chemical species are utilized in the process.
QA/QC procedures to be applied:
Regular samples will test for concentration of oxidising agents where they are identified as being likely to be present in wastewater when they are added as part of the process
Any comment: Used for project emissions and baseline emissions calculation. An assumption of 1% of COD entering the system has been used in ex-ante calculations for conservativeness.
13. Data / Parameter: Gen set combustion efficiency (f) Data unit: % Description: Proportion of biogas combusted by generation facility Source of data to be used:
Measured by project developer. Manufacturer – engine type still to be confirmed.
Value of data applied for the purpose of calculating expected emission reductions in section B.5
98
Description of measurement methods and procedures to be applied:
Generation set combustion efficiency will be determined annually during regular O&M down time and as part of the regular O&M schedule.
QA/QC procedures to be applied:
Generation set combustion efficiency will be calibrated annually.
Any comment: Used for project emissions calculation 14. Data / Parameter: Heater combustion efficiency (f) Data unit: % Description: Proportion of biogas combusted by heater Source of data to be used:
Measured by project developer
Value of data applied for the purpose of calculating expected emission reductions in section B.5
98
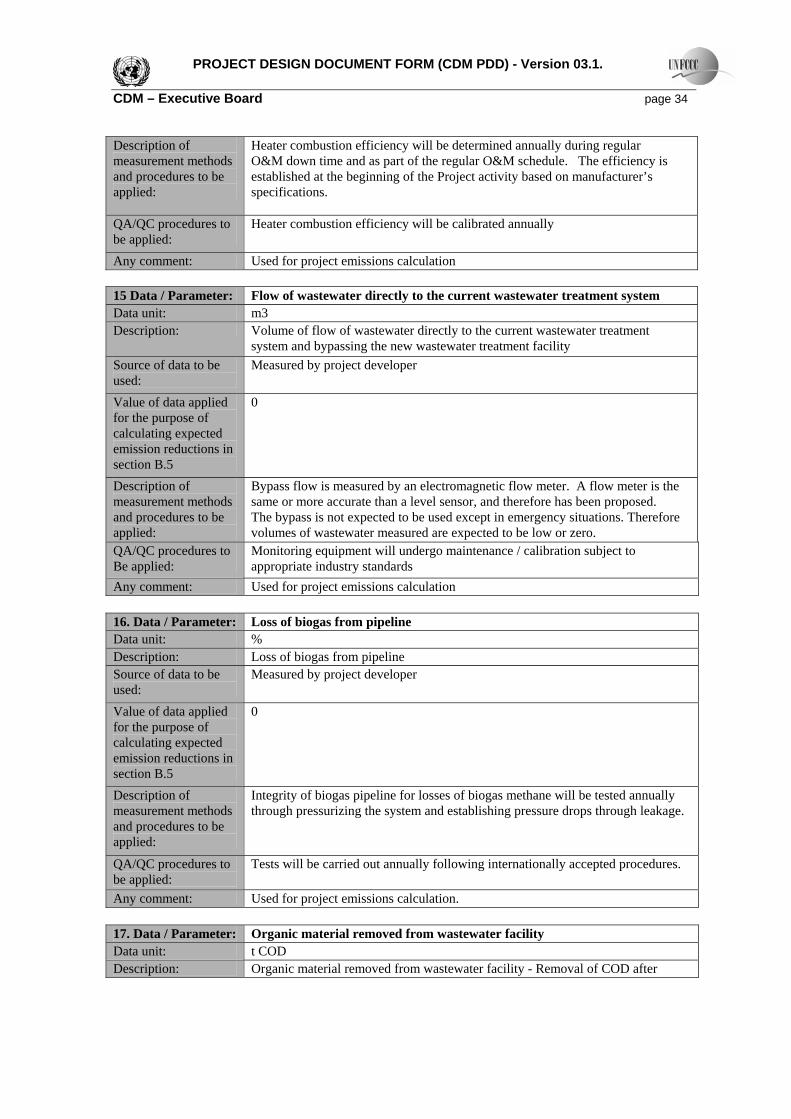
PROJECT DESIGN DOCUMENT FORM (CDM PDD) - Version 03.1. CDM – Executive Board page 34 Description of measurement methods and procedures to be applied:
Heater combustion efficiency will be determined annually during regular O&M down time and as part of the regular O&M schedule. The efficiency is established at the beginning of the Project activity based on manufacturer’s specifications.
QA/QC procedures to be applied:
Heater combustion efficiency will be calibrated annually
Any comment: Used for project emissions calculation 15 Data / Parameter: Flow of wastewater directly to the current wastewater treatment system Data unit: m3 Description: Volume of flow of wastewater directly to the current wastewater treatment
system and bypassing the new wastewater treatment facility Source of data to be used:
Measured by project developer
Value of data applied for the purpose of calculating expected emission reductions in section B.5
0
Description of measurement methods and procedures to be applied:
Bypass flow is measured by an electromagnetic flow meter. A flow meter is the same or more accurate than a level sensor, and therefore has been proposed. The bypass is not expected to be used except in emergency situations. Therefore volumes of wastewater measured are expected to be low or zero.
QA/QC procedures to Be applied:
Monitoring equipment will undergo maintenance / calibration subject to appropriate industry standards
Any comment: Used for project emissions calculation 16. Data / Parameter: Loss of biogas from pipeline Data unit: % Description: Loss of biogas from pipeline Source of data to be used:
Measured by project developer
Value of data applied for the purpose of calculating expected emission reductions in section B.5
0
Description of measurement methods and procedures to be applied:
Integrity of biogas pipeline for losses of biogas methane will be tested annually through pressurizing the system and establishing pressure drops through leakage.
QA/QC procedures to be applied:
Tests will be carried out annually following internationally accepted procedures.
Any comment: Used for project emissions calculation. 17. Data / Parameter: Organic material removed from wastewater facility Data unit: t COD Description: Organic material removed from wastewater facility - Removal of COD after
PROJECT DESIGN DOCUMENT FORM (CDM PDD) - Version 03.1. CDM – Executive Board page 35
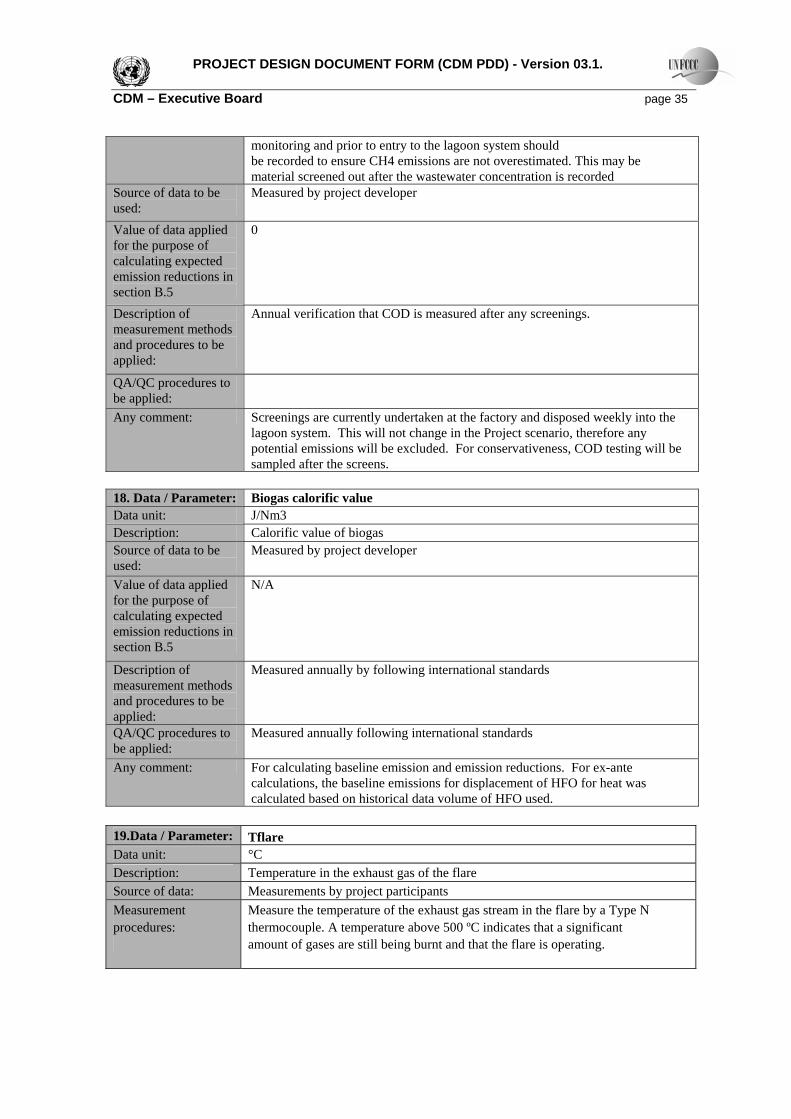
monitoring and prior to entry to the lagoon system should be recorded to ensure CH4 emissions are not overestimated. This may be material screened out after the wastewater concentration is recorded
Source of data to be used:
Measured by project developer
Value of data applied for the purpose of calculating expected emission reductions in section B.5
0
Description of measurement methods and procedures to be applied:
Annual verification that COD is measured after any screenings.
QA/QC procedures to be applied:
Any comment: Screenings are currently undertaken at the factory and disposed weekly into the lagoon system. This will not change in the Project scenario, therefore any potential emissions will be excluded. For conservativeness, COD testing will be sampled after the screens.
18. Data / Parameter: Biogas calorific value Data unit: J/Nm3 Description: Calorific value of biogas Source of data to be used:
Measured by project developer
Value of data applied for the purpose of calculating expected emission reductions in section B.5
N/A
Description of measurement methods and procedures to be applied:
Measured annually by following international standards
QA/QC procedures to be applied:
Measured annually following international standards
Any comment: For calculating baseline emission and emission reductions. For ex-ante calculations, the baseline emissions for displacement of HFO for heat was calculated based on historical data volume of HFO used.
19.Data / Parameter: Tflare Data unit: °C Description: Temperature in the exhaust gas of the flare Source of data: Measurements by project participants Measurement Measure the temperature of the exhaust gas stream in the flare by a Type N procedures: thermocouple. A temperature above 500 ºC indicates that a significant amount of gases are still being burnt and that the flare is operating.
PROJECT DESIGN DOCUMENT FORM (CDM PDD) - Version 03.1. CDM – Executive Board page 36 Monitoring Continuously. frequency: QA/QC procedures Thermocouples should be replaced or calibrated every year.
Any comment:
As per “Tool to determine project emissions from flaring gases containing Methane” An excessively high temperature at the sampling point (above 700 ºC) may be an indication that the flare is not being adequately operated or that its capacity is not adequate to the actual flow.
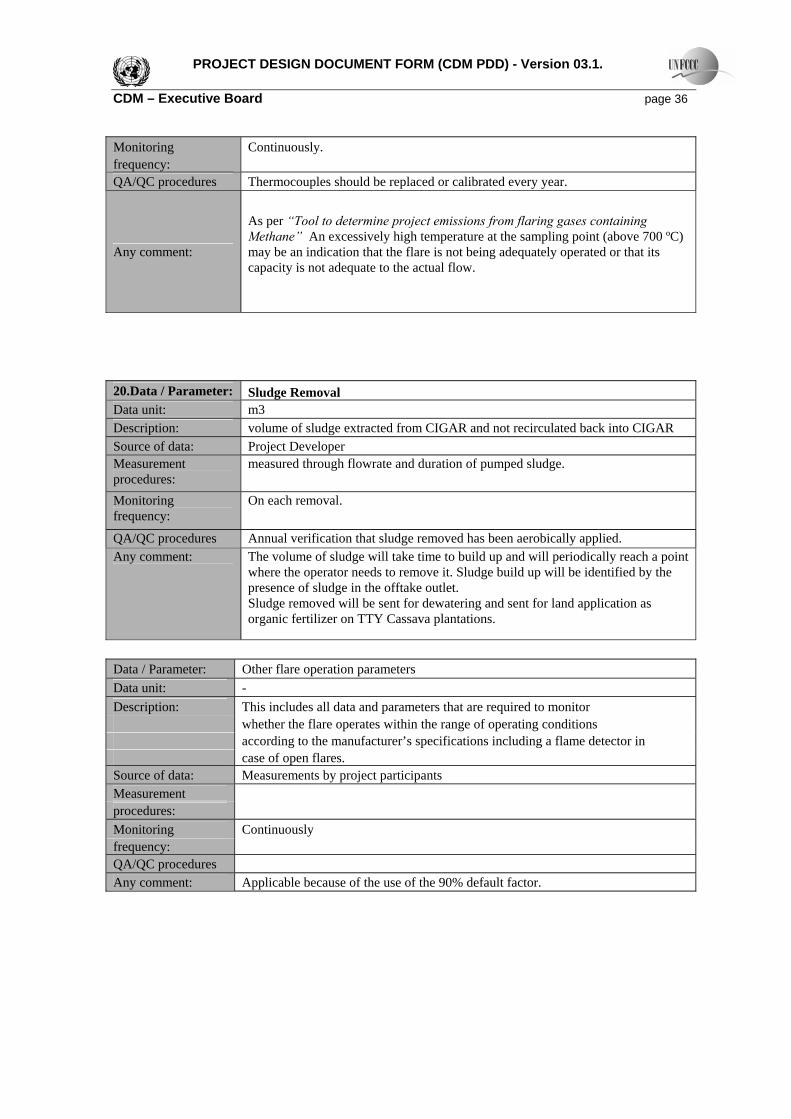
20.Data / Parameter: Sludge Removal Data unit: m3 Description: volume of sludge extracted from CIGAR and not recirculated back into CIGAR Source of data: Project Developer Measurement procedures:
measured through flowrate and duration of pumped sludge.
Monitoring frequency:
On each removal.
QA/QC procedures Annual verification that sludge removed has been aerobically applied. Any comment: The volume of sludge will take time to build up and will periodically reach a point
where the operator needs to remove it. Sludge build up will be identified by the presence of sludge in the offtake outlet. Sludge removed will be sent for dewatering and sent for land application as organic fertilizer on TTY Cassava plantations.
Data / Parameter: Other flare operation parameters Data unit: - Description: This includes all data and parameters that are required to monitor whether the flare operates within the range of operating conditions according to the manufacturer’s specifications including a flame detector in case of open flares. Source of data: Measurements by project participants Measurement procedures: Monitoring Continuously frequency: QA/QC procedures Any comment: Applicable because of the use of the 90% default factor.
PROJECT DESIGN DOCUMENT FORM (CDM PDD) - Version 03.1. CDM – Executive Board page 37
B.7.2 Description of the monitoring plan: The Monitoring Plan ensures that parameters for both project and baseline scenario emissions are monitored. The main elements, to be monitored as per AM0022v41 , include:
• Fugitive methane, through the assessment of organic material flows through the project and the baseline system;
• Electricity generated from the biogas collected in the anaerobic treatment facility and consumed on site or sent to the grid;
• On-site heat generated from the biogas collected in the anaerobic treatment facility; • Inefficient biogas combustion emissions in project: emissions arising though inefficient
destruction of biogas in the heating systems and electricity generation sets will be quantified through assessing the efficiency of biogas destruction during equipment O&M cycles; the parameters used for determining the project emissions from flaring of the residual gas stream (PEflare) will be monitored as per the “Tool to determine project emissions from flaring gases containing Methane”.
• Biogas leakage in project: through leaks in the pipeline during transportation of biogas, or its production in anaerobic digesters.
• Aerobic disposal of sludge for land application In addition, for the Gold Standard, sustainable development indicators scoring 0.5 or over and significant issues raised during consultation will be monitored. These are:
• Jobs created – were 3 jobs created from the Project? • Use of organic sludge as fertilizer for land application – is TTY using the sludge as
organic fertilizer for cassava plantations? • Safety of Biogas Project – no fire or explosions resulted from the Biogas Project
Section B.7.1 outlines the suitable indicators and their sources, QA/AC procedures and the method to measure the parameters. Table 13 included in Annex 4 outlines the parameters, recording frequency, type of equipment and how the data will be archived and who will be responsible Annex 4 Contains a diagram (Figure 1) outlining the location of each of the monitoring points outlined in Section B.7.1 & Table 13.
1 Note, AM 0022 specifically stresses the importance to quantify (measured or estimated) the organic material flowing into and out of anaerobic systems; and contribution of different removal processes – in this case, this can include the sludge removed from the CIGAR and dried aerobically and sent for land application as an organic fertilizer high in nitrogen.
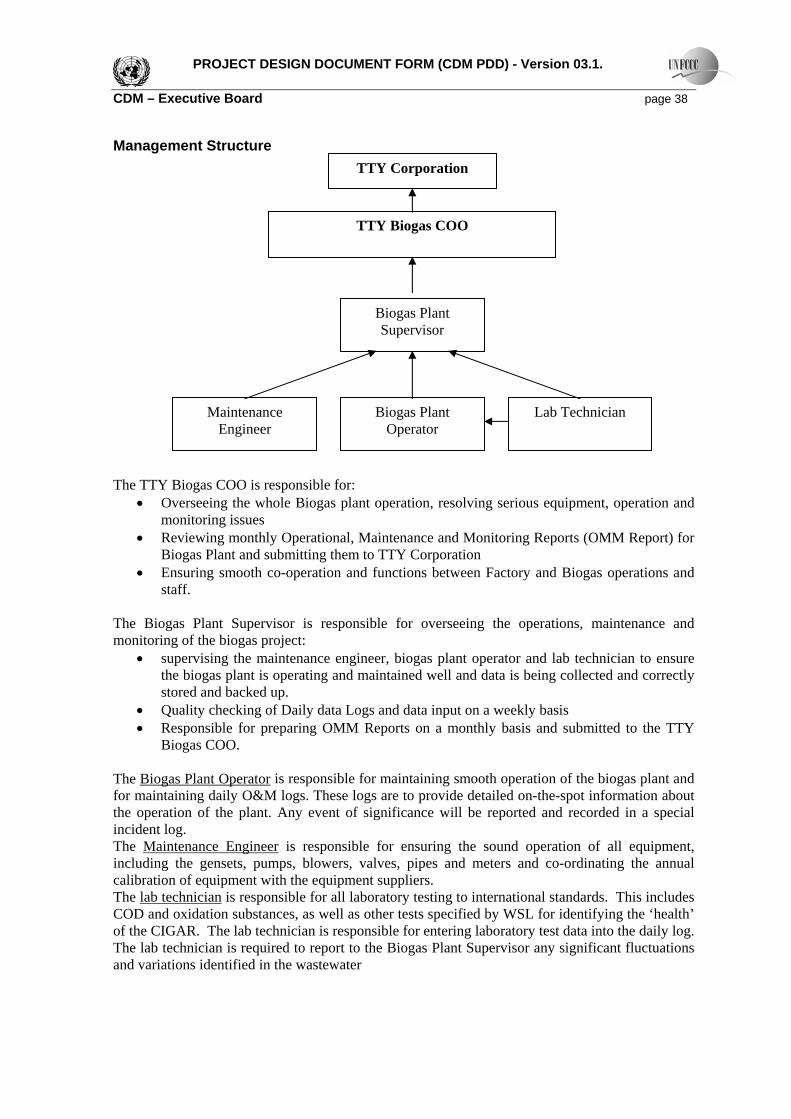
PROJECT DESIGN DOCUMENT FORM (CDM PDD) - Version 03.1. CDM – Executive Board page 38 Management Structure
The TTY Biogas COO is responsible for:
• Overseeing the whole Biogas plant operation, resolving serious equipment, operation and monitoring issues
• Reviewing monthly Operational, Maintenance and Monitoring Reports (OMM Report) for Biogas Plant and submitting them to TTY Corporation
• Ensuring smooth co-operation and functions between Factory and Biogas operations and staff.
The Biogas Plant Supervisor is responsible for overseeing the operations, maintenance and monitoring of the biogas project:
• supervising the maintenance engineer, biogas plant operator and lab technician to ensure the biogas plant is operating and maintained well and data is being collected and correctly stored and backed up.
• Quality checking of Daily data Logs and data input on a weekly basis • Responsible for preparing OMM Reports on a monthly basis and submitted to the TTY
Biogas COO. The Biogas Plant Operator is responsible for maintaining smooth operation of the biogas plant and for maintaining daily O&M logs. These logs are to provide detailed on-the-spot information about the operation of the plant. Any event of significance will be reported and recorded in a special incident log. The Maintenance Engineer is responsible for ensuring the sound operation of all equipment, including the gensets, pumps, blowers, valves, pipes and meters and co-ordinating the annual calibration of equipment with the equipment suppliers. The lab technician is responsible for all laboratory testing to international standards. This includes COD and oxidation substances, as well as other tests specified by WSL for identifying the ‘health’ of the CIGAR. The lab technician is responsible for entering laboratory test data into the daily log. The lab technician is required to report to the Biogas Plant Supervisor any significant fluctuations and variations identified in the wastewater
TTY Biogas COO
Biogas Plant Supervisor
Maintenance Engineer
Biogas Plant Operator
Lab Technician
TTY Corporation
PROJECT DESIGN DOCUMENT FORM (CDM PDD) - Version 03.1. CDM – Executive Board page 39 TTY Corporation will be responsible for any external and international communication – including submitting monthly reports to Carbon Partners and any liaison with Verifying Auditors. TTY Corporation Quality Manager is responsible for reviewing Quality Assurance And Quality control procedures on site. The OMM personnel will be skilled technicians, and any additional training required to ensure accurate and effective monitoring will be provided by WSL and W2E and Carbon Bridge prior to project commissioning. This training will include equipment operation, data monitoring and recording (including how to reconcile any adjustments and/or data uncertainties), reporting, operation, calibration, maintenance, and emergency procedures, project performance review, and corrective actions. TTY maintenance engineer will co-ordinate the annual calibration of equipment with the equipment suppliers, who will calibrate according to international standards. Calibration of required equipment will be performed by the technology provider or their approved representative. Annual calibration of equipment will be part of their procurement contract. B.8 Date of completion of the application of the baseline study and monitoring methodology and the name of the responsible person(s)/entity(ies) 10/02/07 Carbon Bridge Pte Ltd. Carbon Bridge is a Project Participant for the project. SECTION C. Duration of the project activity / crediting period C.1 Duration of the project activity: C.1.1. Starting date of the project activity: 01/05/07 C.1.2. Expected operational lifetime of the project activity: 25 years C.2 Choice of the crediting period and related information: C.2.1. Renewable crediting period C.2.1.1. Starting date of the first crediting period: 01/01/08 or date of Registration, whichever occurs later. C.2.1.2. Length of the first crediting period: 7 years
PROJECT DESIGN DOCUMENT FORM (CDM PDD) - Version 03.1. CDM – Executive Board page 40 C.2.2. Fixed crediting period: C.2.2.1. Starting date: Not Applicable C.2.2.2. Length: Not Applicable SECTION D. Environmental impacts D.1. Documentation on the analysis of the environmental impacts, including transboundary impacts: The project will result in a positive environmental benefit. Firstly, the project will result in reduce greenhouse gas emissions and therefore help reduce the global environmental issue of climate change and global warming. Cambodia, as a least developed agrarian economy, is highly vulnerable to climate change impacts, not the least because poorer communities are less able to afford financially and have the capacity to adapt to changes. The project will reduce greenhouse gas emissions by capturing the methane currently emitted from the anaerobic conditions in the lagoons where the wastewater is held. Methane is a potent greenhouse gas 21 times that of carbon dioxide. The project will also reduce emissions by displacing the use of heavy fuel oil in the heaters for drying the starch, and in displacing diesel used in the onsite diesel engines that were used as backup if the EDC grid went down. Secondly, the closed anaerobic biogas to produce energy will result in reduced wastewater pollution, as the process retains the wastewater in anaerobic conditions, which kills pathogens, and reduces the COD and BOD loading. Thirdly, the project will reduce local odour pollution, which was highlighted as a benefit during the community consultation. The use of rootcake in the low season will significantly reduce local nuisance, as drying the rootcake in monsoonal conditions is problematic and TTY has difficulty in finding appropriate space to dry it year round. The use of the sludge, which is primarily bacterial biomass, will be used as an organic fertiliser for the TTY cassava plantations. The sludge will have good concentrated nitrogen (as it is taken up by the bacteria) and will reduce the amount of fertiliser used for the plantations. The main environmental and social risk identified during the consultation was that of fire at the factory. The safety risk is considered low - fires have occurred at these lagoons before, however they do not explode, but rather put themselves out as there is not sufficient oxygen in the covered system. There is a risk of gas leak and explosion in the gas pipes transported to the boiler, however good quality and new piping will be used, the lengths minimised and tested regularly. The use of biogas is s similar risk to that of any other LPG cylinders used throughout households in Cambodia. D.2. If environmental impacts are considered significant by the project participants or the host Party, please provide conclusions and all references to support documentation of an environmental impact assessment undertaken in accordance with the procedures as required by the host Party:
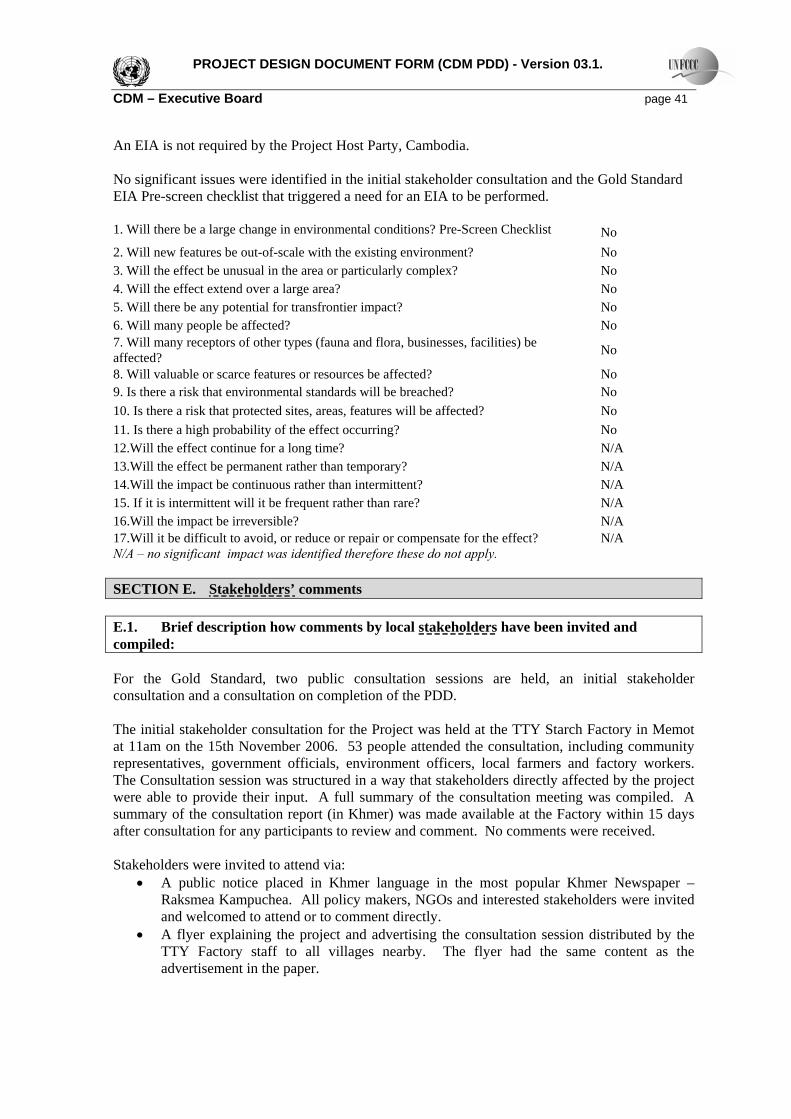
PROJECT DESIGN DOCUMENT FORM (CDM PDD) - Version 03.1. CDM – Executive Board page 41 An EIA is not required by the Project Host Party, Cambodia. No significant issues were identified in the initial stakeholder consultation and the Gold Standard EIA Pre-screen checklist that triggered a need for an EIA to be performed. 1. Will there be a large change in environmental conditions? Pre-Screen Checklist No 2. Will new features be out-of-scale with the existing environment? No 3. Will the effect be unusual in the area or particularly complex? No 4. Will the effect extend over a large area? No 5. Will there be any potential for transfrontier impact? No 6. Will many people be affected? No 7. Will many receptors of other types (fauna and flora, businesses, facilities) be affected? No
8. Will valuable or scarce features or resources be affected? No 9. Is there a risk that environmental standards will be breached? No 10. Is there a risk that protected sites, areas, features will be affected? No 11. Is there a high probability of the effect occurring? No 12.Will the effect continue for a long time? N/A 13.Will the effect be permanent rather than temporary? N/A 14.Will the impact be continuous rather than intermittent? N/A 15. If it is intermittent will it be frequent rather than rare? N/A 16.Will the impact be irreversible? N/A 17.Will it be difficult to avoid, or reduce or repair or compensate for the effect? N/A N/A – no significant impact was identified therefore these do not apply. SECTION E. Stakeholders’ comments E.1. Brief description how comments by local stakeholders have been invited and compiled: For the Gold Standard, two public consultation sessions are held, an initial stakeholder consultation and a consultation on completion of the PDD. The initial stakeholder consultation for the Project was held at the TTY Starch Factory in Memot at 11am on the 15th November 2006. 53 people attended the consultation, including community representatives, government officials, environment officers, local farmers and factory workers. The Consultation session was structured in a way that stakeholders directly affected by the project were able to provide their input. A full summary of the consultation meeting was compiled. A summary of the consultation report (in Khmer) was made available at the Factory within 15 days after consultation for any participants to review and comment. No comments were received. Stakeholders were invited to attend via:
• A public notice placed in Khmer language in the most popular Khmer Newspaper – Raksmea Kampuchea. All policy makers, NGOs and interested stakeholders were invited and welcomed to attend or to comment directly.
• A flyer explaining the project and advertising the consultation session distributed by the TTY Factory staff to all villages nearby. The flyer had the same content as the advertisement in the paper.
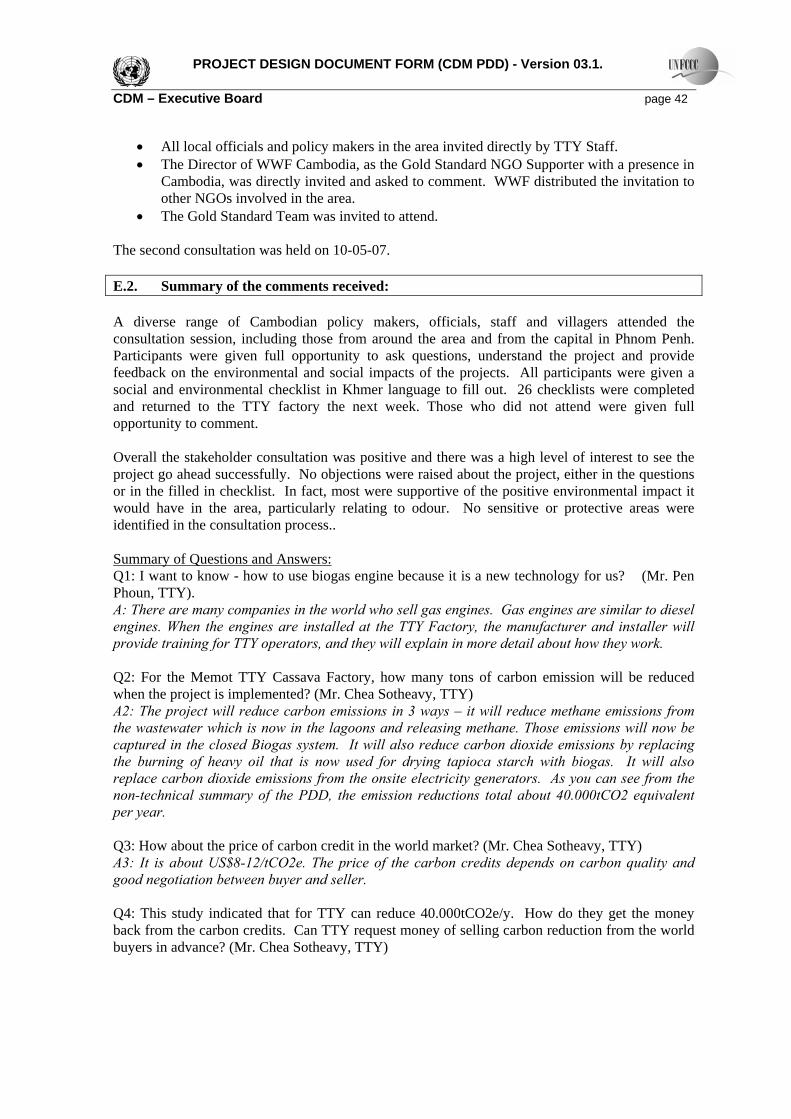
PROJECT DESIGN DOCUMENT FORM (CDM PDD) - Version 03.1. CDM – Executive Board page 42
• All local officials and policy makers in the area invited directly by TTY Staff. • The Director of WWF Cambodia, as the Gold Standard NGO Supporter with a presence in
Cambodia, was directly invited and asked to comment. WWF distributed the invitation to other NGOs involved in the area.
• The Gold Standard Team was invited to attend. The second consultation was held on 10-05-07. E.2. Summary of the comments received: A diverse range of Cambodian policy makers, officials, staff and villagers attended the consultation session, including those from around the area and from the capital in Phnom Penh. Participants were given full opportunity to ask questions, understand the project and provide feedback on the environmental and social impacts of the projects. All participants were given a social and environmental checklist in Khmer language to fill out. 26 checklists were completed and returned to the TTY factory the next week. Those who did not attend were given full opportunity to comment. Overall the stakeholder consultation was positive and there was a high level of interest to see the project go ahead successfully. No objections were raised about the project, either in the questions or in the filled in checklist. In fact, most were supportive of the positive environmental impact it would have in the area, particularly relating to odour. No sensitive or protective areas were identified in the consultation process.. Summary of Questions and Answers: Q1: I want to know - how to use biogas engine because it is a new technology for us? (Mr. Pen Phoun, TTY). A: There are many companies in the world who sell gas engines. Gas engines are similar to diesel engines. When the engines are installed at the TTY Factory, the manufacturer and installer will provide training for TTY operators, and they will explain in more detail about how they work. Q2: For the Memot TTY Cassava Factory, how many tons of carbon emission will be reduced when the project is implemented? (Mr. Chea Sotheavy, TTY) A2: The project will reduce carbon emissions in 3 ways – it will reduce methane emissions from the wastewater which is now in the lagoons and releasing methane. Those emissions will now be captured in the closed Biogas system. It will also reduce carbon dioxide emissions by replacing the burning of heavy oil that is now used for drying tapioca starch with biogas. It will also replace carbon dioxide emissions from the onsite electricity generators. As you can see from the non-technical summary of the PDD, the emission reductions total about 40.000tCO2 equivalent per year. Q3: How about the price of carbon credit in the world market? (Mr. Chea Sotheavy, TTY) A3: It is about US$8-12/tCO2e. The price of the carbon credits depends on carbon quality and good negotiation between buyer and seller. Q4: This study indicated that for TTY can reduce 40.000tCO2e/y. How do they get the money back from the carbon credits. Can TTY request money of selling carbon reduction from the world buyers in advance? (Mr. Chea Sotheavy, TTY)
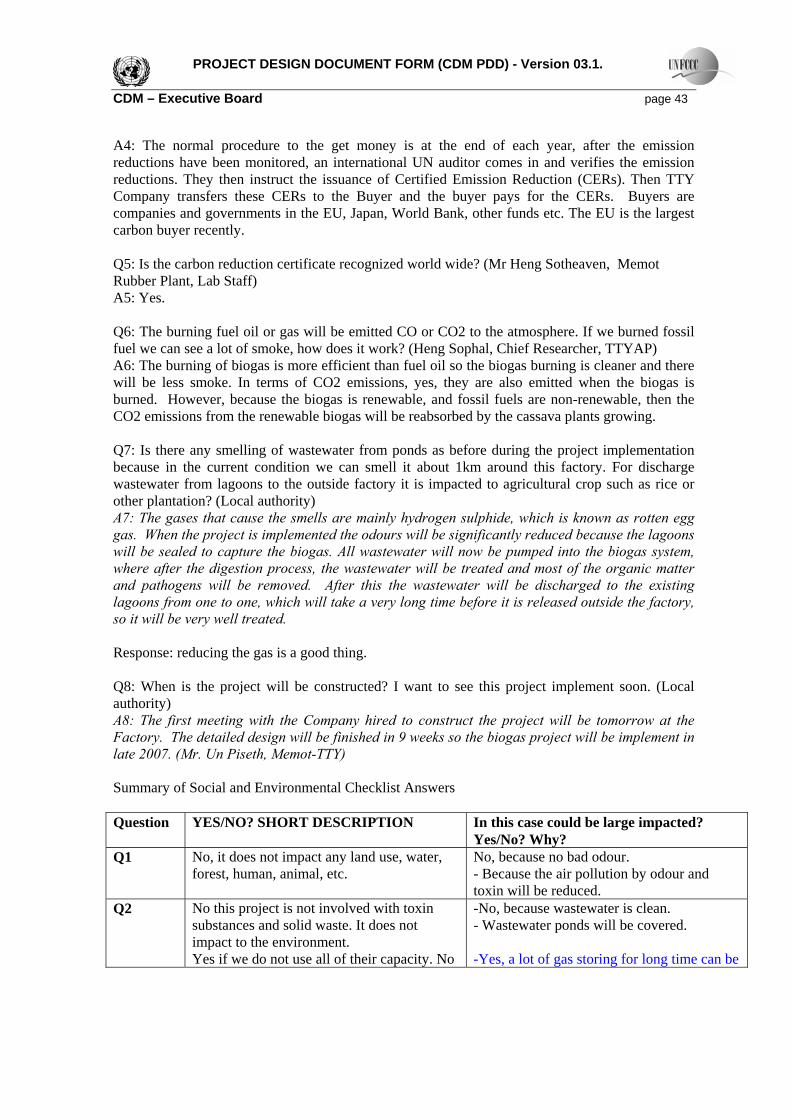
PROJECT DESIGN DOCUMENT FORM (CDM PDD) - Version 03.1. CDM – Executive Board page 43 A4: The normal procedure to the get money is at the end of each year, after the emission reductions have been monitored, an international UN auditor comes in and verifies the emission reductions. They then instruct the issuance of Certified Emission Reduction (CERs). Then TTY Company transfers these CERs to the Buyer and the buyer pays for the CERs. Buyers are companies and governments in the EU, Japan, World Bank, other funds etc. The EU is the largest carbon buyer recently. Q5: Is the carbon reduction certificate recognized world wide? (Mr Heng Sotheaven, Memot Rubber Plant, Lab Staff) A5: Yes. Q6: The burning fuel oil or gas will be emitted CO or CO2 to the atmosphere. If we burned fossil fuel we can see a lot of smoke, how does it work? (Heng Sophal, Chief Researcher, TTYAP) A6: The burning of biogas is more efficient than fuel oil so the biogas burning is cleaner and there will be less smoke. In terms of CO2 emissions, yes, they are also emitted when the biogas is burned. However, because the biogas is renewable, and fossil fuels are non-renewable, then the CO2 emissions from the renewable biogas will be reabsorbed by the cassava plants growing. Q7: Is there any smelling of wastewater from ponds as before during the project implementation because in the current condition we can smell it about 1km around this factory. For discharge wastewater from lagoons to the outside factory it is impacted to agricultural crop such as rice or other plantation? (Local authority) A7: The gases that cause the smells are mainly hydrogen sulphide, which is known as rotten egg gas. When the project is implemented the odours will be significantly reduced because the lagoons will be sealed to capture the biogas. All wastewater will now be pumped into the biogas system, where after the digestion process, the wastewater will be treated and most of the organic matter and pathogens will be removed. After this the wastewater will be discharged to the existing lagoons from one to one, which will take a very long time before it is released outside the factory, so it will be very well treated. Response: reducing the gas is a good thing. Q8: When is the project will be constructed? I want to see this project implement soon. (Local authority) A8: The first meeting with the Company hired to construct the project will be tomorrow at the Factory. The detailed design will be finished in 9 weeks so the biogas project will be implement in late 2007. (Mr. Un Piseth, Memot-TTY) Summary of Social and Environmental Checklist Answers Question YES/NO? SHORT DESCRIPTION In this case could be large impacted?
Yes/No? Why? Q1 No, it does not impact any land use, water,
forest, human, animal, etc. No, because no bad odour. - Because the air pollution by odour and toxin will be reduced.
Q2 No this project is not involved with toxin substances and solid waste. It does not impact to the environment. Yes if we do not use all of their capacity. No
-No, because wastewater is clean. - Wastewater ponds will be covered. -Yes, a lot of gas storing for long time can be
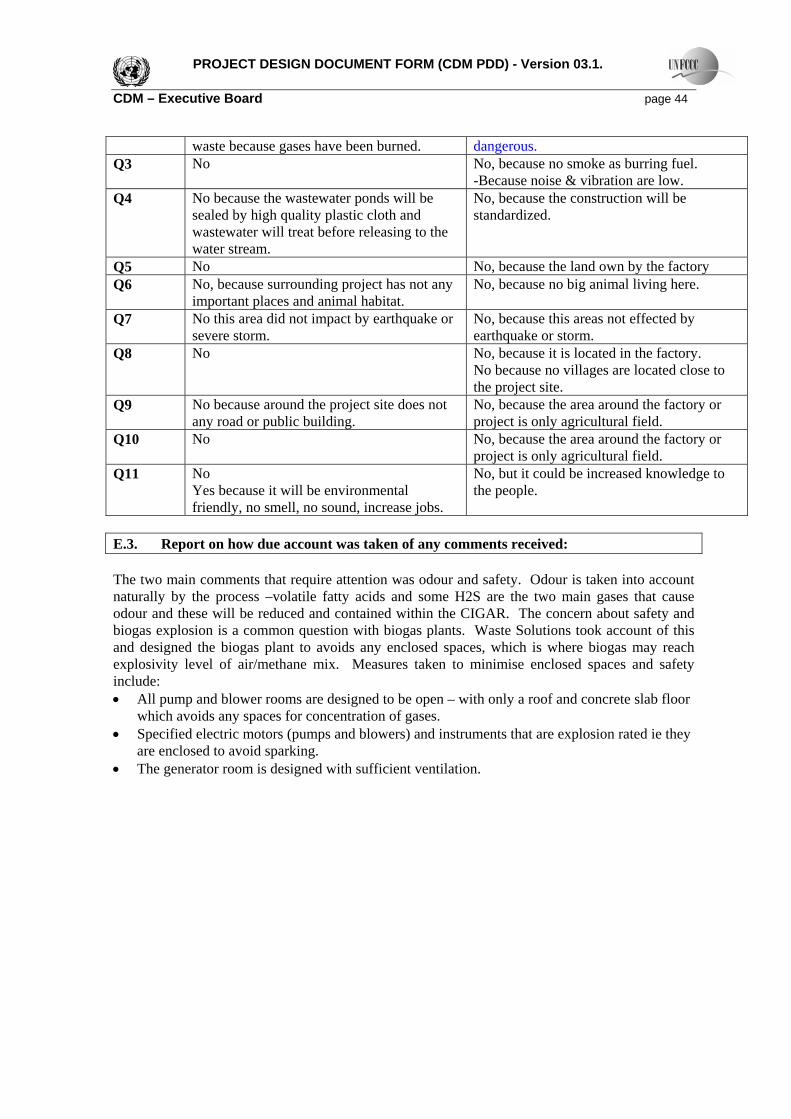
PROJECT DESIGN DOCUMENT FORM (CDM PDD) - Version 03.1. CDM – Executive Board page 44
waste because gases have been burned. dangerous. Q3 No No, because no smoke as burring fuel.
-Because noise & vibration are low. Q4 No because the wastewater ponds will be
sealed by high quality plastic cloth and wastewater will treat before releasing to the water stream.
No, because the construction will be standardized.
Q5 No No, because the land own by the factory Q6 No, because surrounding project has not any
important places and animal habitat. No, because no big animal living here.
Q7 No this area did not impact by earthquake or severe storm.
No, because this areas not effected by earthquake or storm.
Q8 No No, because it is located in the factory. No because no villages are located close to the project site.
Q9 No because around the project site does not any road or public building.
No, because the area around the factory or project is only agricultural field.
Q10 No No, because the area around the factory or project is only agricultural field.
Q11 No Yes because it will be environmental friendly, no smell, no sound, increase jobs.
No, but it could be increased knowledge to the people.
E.3. Report on how due account was taken of any comments received: The two main comments that require attention was odour and safety. Odour is taken into account naturally by the process –volatile fatty acids and some H2S are the two main gases that cause odour and these will be reduced and contained within the CIGAR. The concern about safety and biogas explosion is a common question with biogas plants. Waste Solutions took account of this and designed the biogas plant to avoids any enclosed spaces, which is where biogas may reach explosivity level of air/methane mix. Measures taken to minimise enclosed spaces and safety include: • All pump and blower rooms are designed to be open – with only a roof and concrete slab floor
which avoids any spaces for concentration of gases. • Specified electric motors (pumps and blowers) and instruments that are explosion rated ie they
are enclosed to avoid sparking. • The generator room is designed with sufficient ventilation.
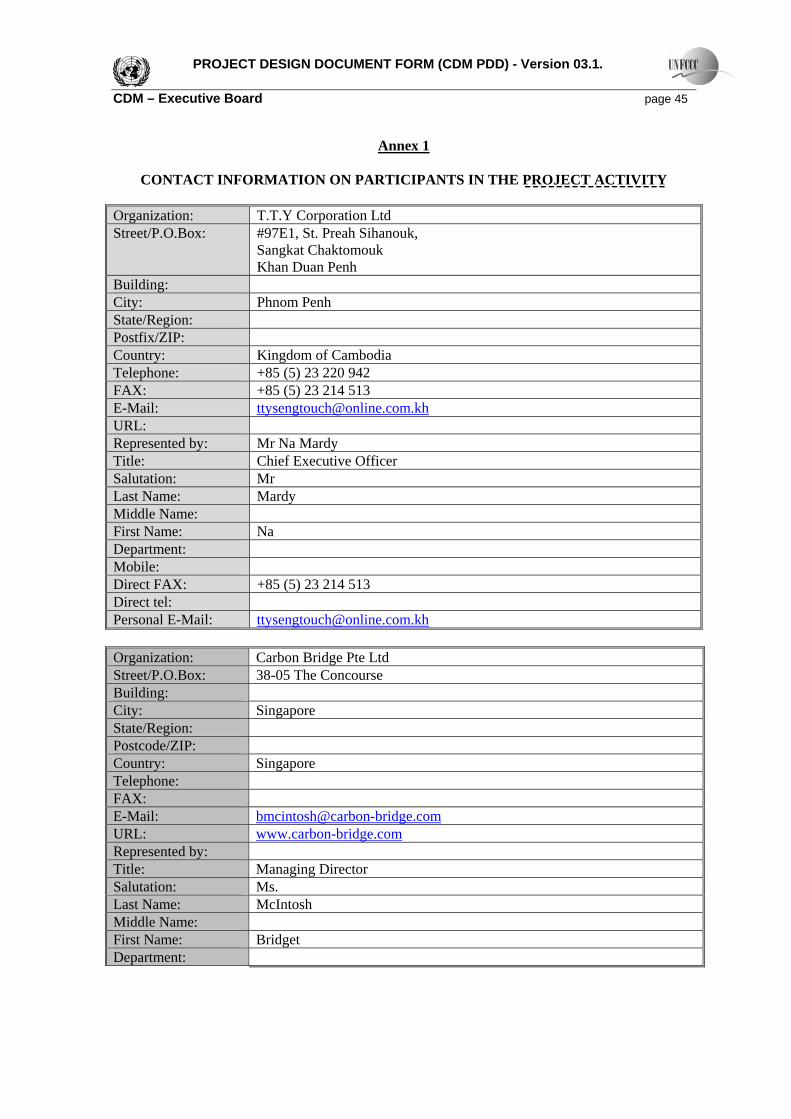
PROJECT DESIGN DOCUMENT FORM (CDM PDD) - Version 03.1. CDM – Executive Board page 45
Annex 1
CONTACT INFORMATION ON PARTICIPANTS IN THE PROJECT ACTIVITY Organization: T.T.Y Corporation Ltd Street/P.O.Box: #97E1, St. Preah Sihanouk,
Sangkat Chaktomouk Khan Duan Penh
Building: City: Phnom Penh State/Region: Postfix/ZIP: Country: Kingdom of Cambodia Telephone: +85 (5) 23 220 942 FAX: +85 (5) 23 214 513 E-Mail: [email protected] URL: Represented by: Mr Na Mardy Title: Chief Executive Officer Salutation: Mr Last Name: Mardy Middle Name: First Name: Na Department: Mobile: Direct FAX: +85 (5) 23 214 513 Direct tel: Personal E-Mail: [email protected] Organization: Carbon Bridge Pte Ltd Street/P.O.Box: 38-05 The Concourse Building: City: Singapore State/Region: Postcode/ZIP: Country: Singapore Telephone: FAX: E-Mail: [email protected] URL: www.carbon-bridge.com Represented by: Title: Managing Director Salutation: Ms. Last Name: McIntosh Middle Name: First Name: Bridget Department:

PROJECT DESIGN DOCUMENT FORM (CDM PDD) - Version 03.1. CDM – Executive Board page 46 Mobile: +85512452795 Direct FAX: Direct tel: Personal E-Mail: [email protected]

PROJECT DESIGN DOCUMENT FORM (CDM PDD) - Version 03.1. CDM – Executive Board page 47
Annex 2
INFORMATION REGARDING PUBLIC FUNDING No Public Funding will be used for the project activity.
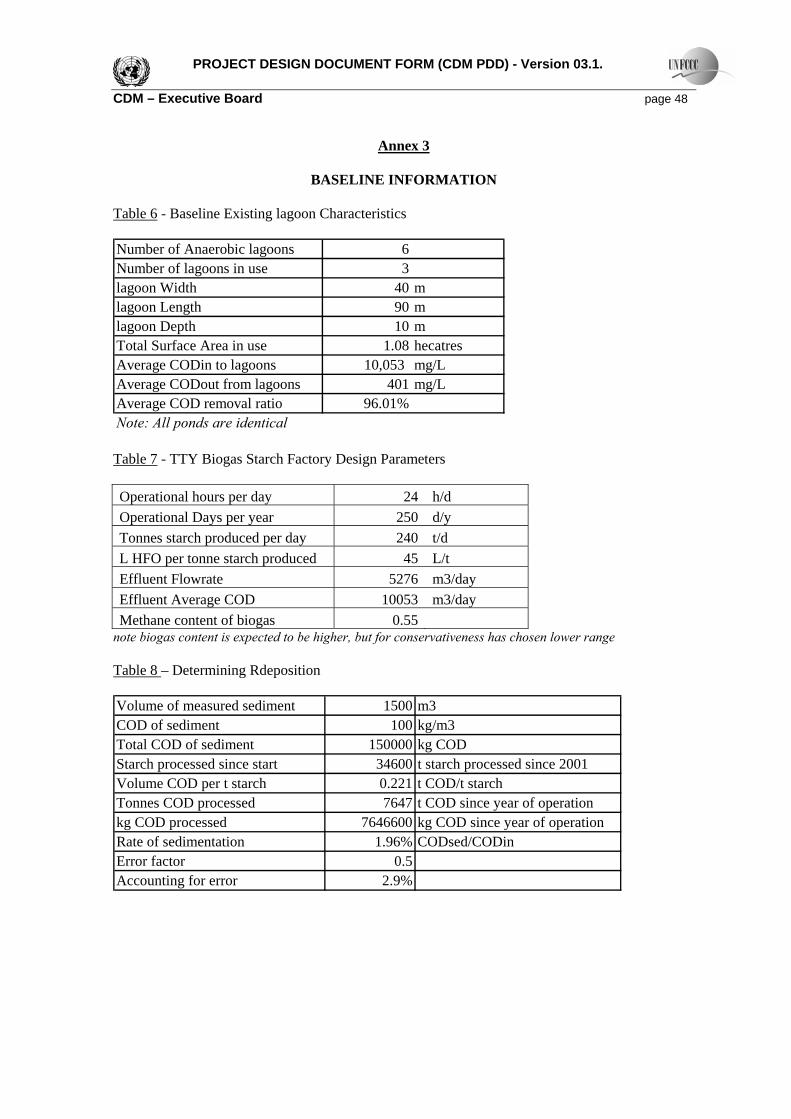
PROJECT DESIGN DOCUMENT FORM (CDM PDD) - Version 03.1. CDM – Executive Board page 48
Annex 3
BASELINE INFORMATION Table 6 - Baseline Existing lagoon Characteristics
Number of Anaerobic lagoons 6Number of lagoons in use 3lagoon Width 40 mlagoon Length 90 mlagoon Depth 10 mTotal Surface Area in use 1.08 hecatresAverage CODin to lagoons 10,053 mg/LAverage CODout from lagoons 401 mg/LAverage COD removal ratio 96.01%Note: All ponds are identical Table 7 - TTY Biogas Starch Factory Design Parameters Operational hours per day 24 h/d Operational Days per year 250 d/y Tonnes starch produced per day 240 t/d L HFO per tonne starch produced 45 L/t Effluent Flowrate 5276 m3/day Effluent Average COD 10053 m3/day Methane content of biogas 0.55
note biogas content is expected to be higher, but for conservativeness has chosen lower range Table 8 – Determining Rdeposition Volume of measured sediment 1500 m3COD of sediment 100 kg/m3Total COD of sediment 150000 kg CODStarch processed since start 34600 t starch processed since 2001Volume COD per t starch 0.221 t COD/t starchTonnes COD processed 7647 t COD since year of operationkg COD processed 7646600 kg COD since year of operationRate of sedimentation 1.96% CODsed/CODinError factor 0.5Accounting for error 2.9%

PROJECT DESIGN DOCUMENT FORM (CDM PDD) - Version 03.1. CDM – Executive Board page 49 Calculation of baseline emission factor of the Vietnamese National Electricity Grid
The emissions factor is calculated using ACM0002 version 06.
Carbon Bridge would like to thank Tran Minh Tuyen, of Energy and Environment Consultancy Joint Stock Company, who kindly provided the data and following calculations:
The baseline emission factor (EF) is calculated as a combined margin (CM), consisting of the combination of operating margin (OM) and build margin (BM) factors according to the following three steps:
• Step1: Operating Margin emission factor (EFOM)
• Step2: Build Margin emission factor (EFBM)
• Step3: Calculate the baseline emission factor EF
Step1: Operating Margin emission factor (EFOM)
The Simple OM method can be used in the project because of the two following reasons:
• Dispatch data is available only in Vietnam Dispatching Centre, currently these data are confidential and can not be accessed. So Dispatch Data Analysis based OM method cannot be selected.
• Low-cost/must-run resources in Vietnam constitute less than 50% of total grid generation in average of the five most recent years
Table 9: Rate of low cost/must-run sources based on generation2
Year 2001 2002 2003 2004 2005 Average
Rate of low cost/must-run sources generation, % 59.43 48.25 47.24 38.53 34.53 45.6
The Simple OM emission factor (EFOM,simple,y) is calculated as the generation-weighted average emissions per electricity unit (tCO2/MWh) of all generating sources serving the system, not including low-operating cost and must-run power plants:
EF_OMy = ∑
∑j yj,
, ji,yj,i,
GEN
EF*Fji CO
Where: Fi ,j, y is the amount of fuel i (in a mass or volume unit) consumed by relevant power sources j in year(s) y,
j refers to the power sources delivering electricity to the grid, not including low-operating cost and must-run power plants, and including imports to the grid,
COEFi,j y is the CO2 emission coefficient of fuel i (tCO2 / mass or volume unit of the fuel), taking into account the carbon content of the fuels used by relevant power sources j and the percent oxidation of the fuel in year(s) y, and
2 Master Plan of Electricity Expansion for period of 2001-2010 with perspective to 2015 – Electricity Corporation of Viet Nam
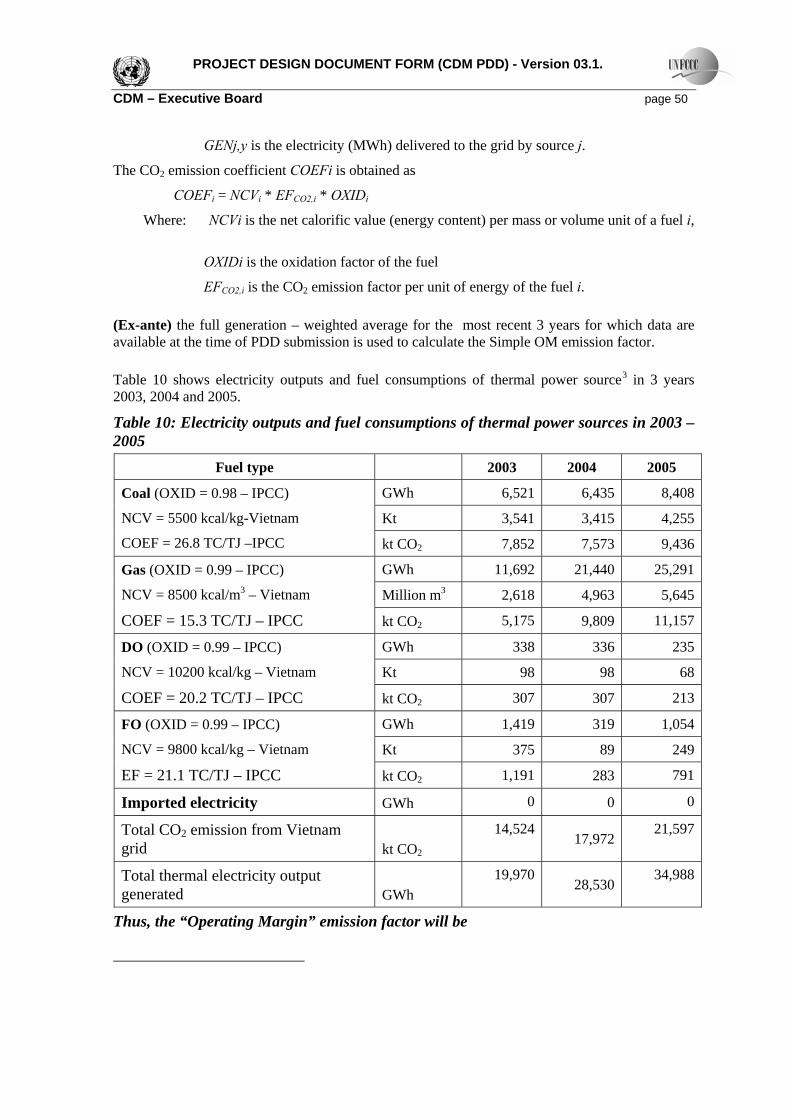
PROJECT DESIGN DOCUMENT FORM (CDM PDD) - Version 03.1. CDM – Executive Board page 50
GENj,y is the electricity (MWh) delivered to the grid by source j.
The CO2 emission coefficient COEFi is obtained as
COEFi = NCVi * EFCO2,i * OXIDi
Where: NCVi is the net calorific value (energy content) per mass or volume unit of a fuel i,
OXIDi is the oxidation factor of the fuel
EFCO2,i is the CO2 emission factor per unit of energy of the fuel i. (Ex-ante) the full generation – weighted average for the most recent 3 years for which data are available at the time of PDD submission is used to calculate the Simple OM emission factor. Table 10 shows electricity outputs and fuel consumptions of thermal power source3 in 3 years 2003, 2004 and 2005.
Table 10: Electricity outputs and fuel consumptions of thermal power sources in 2003 – 2005
Fuel type 2003 2004 2005
GWh 6,521 6,435 8,408
Kt 3,541 3,415 4,255
Coal (OXID = 0.98 – IPCC)
NCV = 5500 kcal/kg-Vietnam
COEF = 26.8 TC/TJ –IPCC kt CO2 7,852 7,573 9,436
GWh 11,692 21,440 25,291
Million m3 2,618 4,963 5,645
Gas (OXID = 0.99 – IPCC)
NCV = 8500 kcal/m3 – Vietnam
COEF = 15.3 TC/TJ – IPCC kt CO2 5,175 9,809 11,157
GWh 338 336 235
Kt 98 98 68
DO (OXID = 0.99 – IPCC)
NCV = 10200 kcal/kg – Vietnam
COEF = 20.2 TC/TJ – IPCC kt CO2 307 307 213
GWh 1,419 319 1,054
Kt 375 89 249
FO (OXID = 0.99 – IPCC)
NCV = 9800 kcal/kg – Vietnam
EF = 21.1 TC/TJ – IPCC kt CO2 1,191 283 791
Imported electricity GWh 0 0 0
Total CO2 emission from Vietnam grid kt CO2
14,52417,972
21,597
Total thermal electricity output generated GWh
19,97028,530
34,988
Thus, the “Operating Margin” emission factor will be
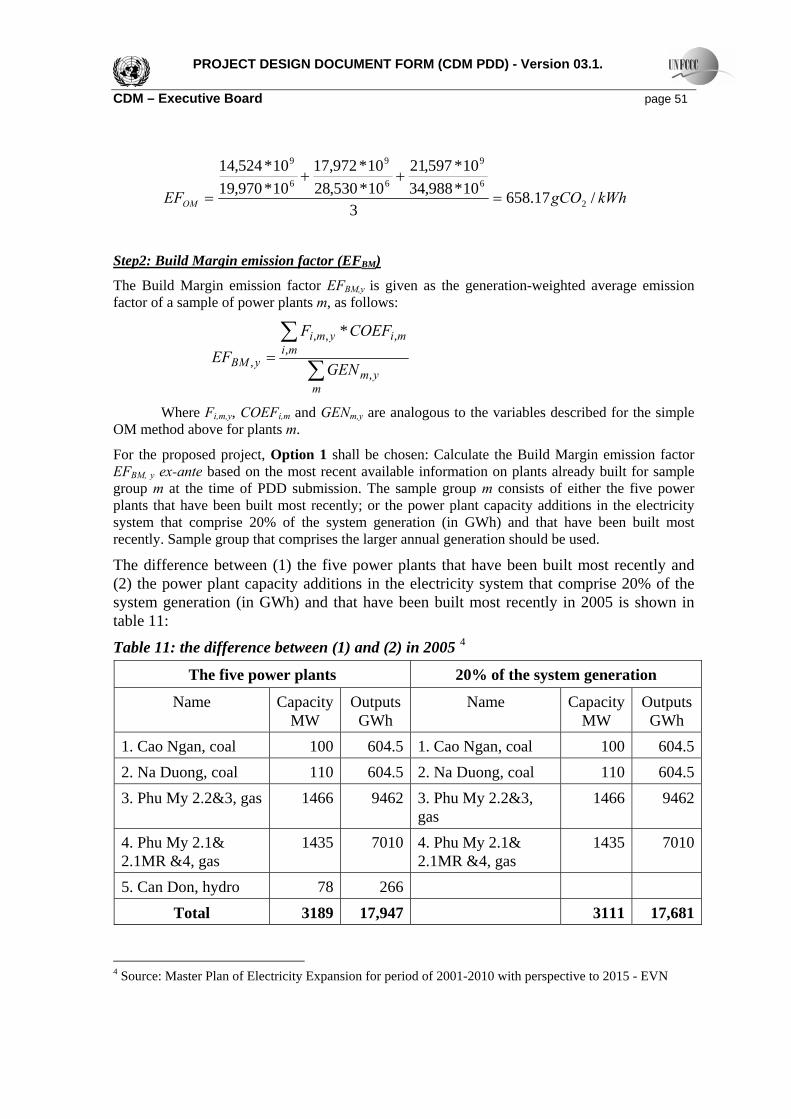
PROJECT DESIGN DOCUMENT FORM (CDM PDD) - Version 03.1. CDM – Executive Board page 51
kWhgCOEFOM /17.6583
10*988,3410*597,21
10*530,2810*972,17
10*970,1910*524,14
2
6
9
6
9
6
9
=++
=
Step2: Build Margin emission factor (EFBM)
The Build Margin emission factor EFBM,y is given as the generation-weighted average emission factor of a sample of power plants m, as follows:
∑
∑=
mym
mimiymi
yBM GEN
COEFF
EF,
,,,,
,
*
Where Fi,m,y, COEFi,m and GENm,y are analogous to the variables described for the simple OM method above for plants m.
For the proposed project, Option 1 shall be chosen: Calculate the Build Margin emission factor EFBM, y ex-ante based on the most recent available information on plants already built for sample group m at the time of PDD submission. The sample group m consists of either the five power plants that have been built most recently; or the power plant capacity additions in the electricity system that comprise 20% of the system generation (in GWh) and that have been built most recently. Sample group that comprises the larger annual generation should be used.
The difference between (1) the five power plants that have been built most recently and (2) the power plant capacity additions in the electricity system that comprise 20% of the system generation (in GWh) and that have been built most recently in 2005 is shown in table 11:
Table 11: the difference between (1) and (2) in 2005 4
The five power plants 20% of the system generation
Name Capacity MW
Outputs GWh
Name Capacity MW
Outputs GWh
1. Cao Ngan, coal 100 604.5 1. Cao Ngan, coal 100 604.52. Na Duong, coal 110 604.5 2. Na Duong, coal 110 604.53. Phu My 2.2&3, gas 1466 9462 3. Phu My 2.2&3,
gas 1466 9462
4. Phu My 2.1& 2.1MR &4, gas
1435 7010 4. Phu My 2.1& 2.1MR &4, gas
1435 7010
5. Can Don, hydro 78 266 Total 3189 17,947 3111 17,681
4 Source: Master Plan of Electricity Expansion for period of 2001-2010 with perspective to 2015 - EVN
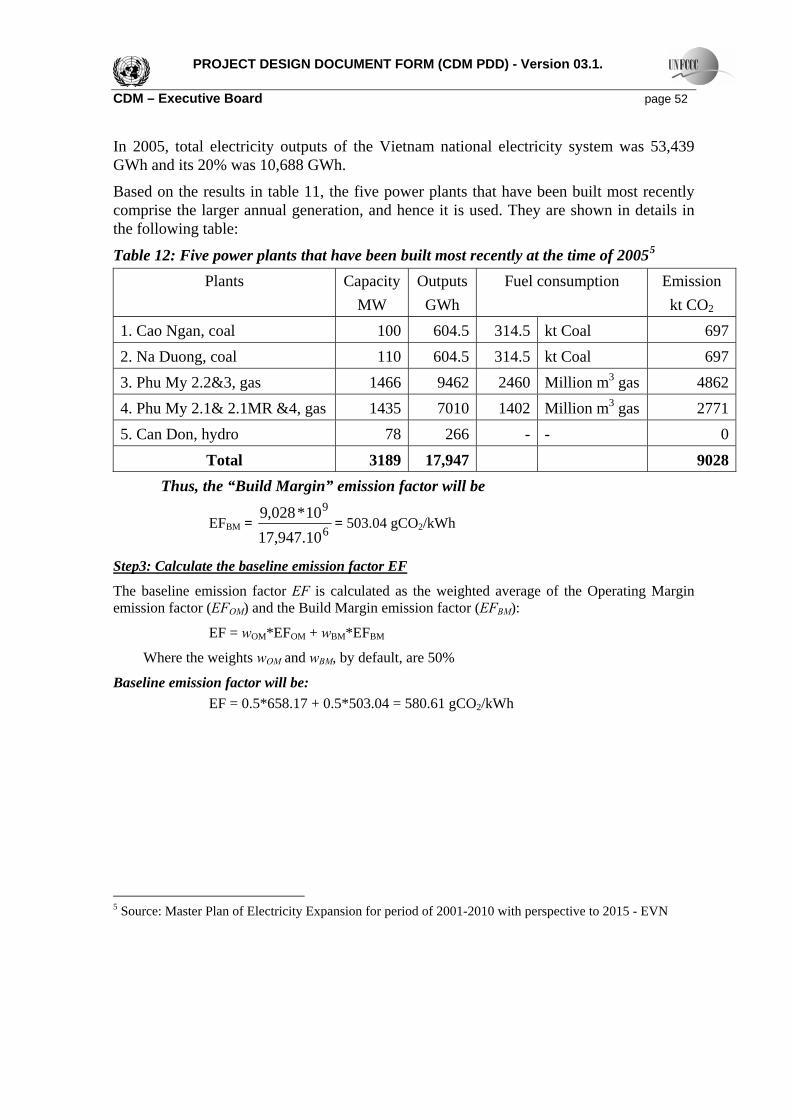
PROJECT DESIGN DOCUMENT FORM (CDM PDD) - Version 03.1. CDM – Executive Board page 52 In 2005, total electricity outputs of the Vietnam national electricity system was 53,439 GWh and its 20% was 10,688 GWh.
Based on the results in table 11, the five power plants that have been built most recently comprise the larger annual generation, and hence it is used. They are shown in details in the following table:
Table 12: Five power plants that have been built most recently at the time of 20055 Plants Capacity
MW Outputs
GWh Fuel consumption Emission
kt CO2 1. Cao Ngan, coal 100 604.5 314.5 kt Coal 6972. Na Duong, coal 110 604.5 314.5 kt Coal 6973. Phu My 2.2&3, gas 1466 9462 2460 Million m3 gas 48624. Phu My 2.1& 2.1MR &4, gas 1435 7010 1402 Million m3 gas 27715. Can Don, hydro 78 266 - - 0
Total 3189 17,947 9028 Thus, the “Build Margin” emission factor will be
EFBM = 6
9
10.947,1710*028,9
= 503.04 gCO2/kWh
Step3: Calculate the baseline emission factor EF
The baseline emission factor EF is calculated as the weighted average of the Operating Margin emission factor (EFOM) and the Build Margin emission factor (EFBM):
EF = wOM*EFOM + wBM*EFBM
Where the weights wOM and wBM, by default, are 50%
Baseline emission factor will be: EF = 0.5*658.17 + 0.5*503.04 = 580.61 gCO2/kWh
5 Source: Master Plan of Electricity Expansion for period of 2001-2010 with perspective to 2015 - EVN
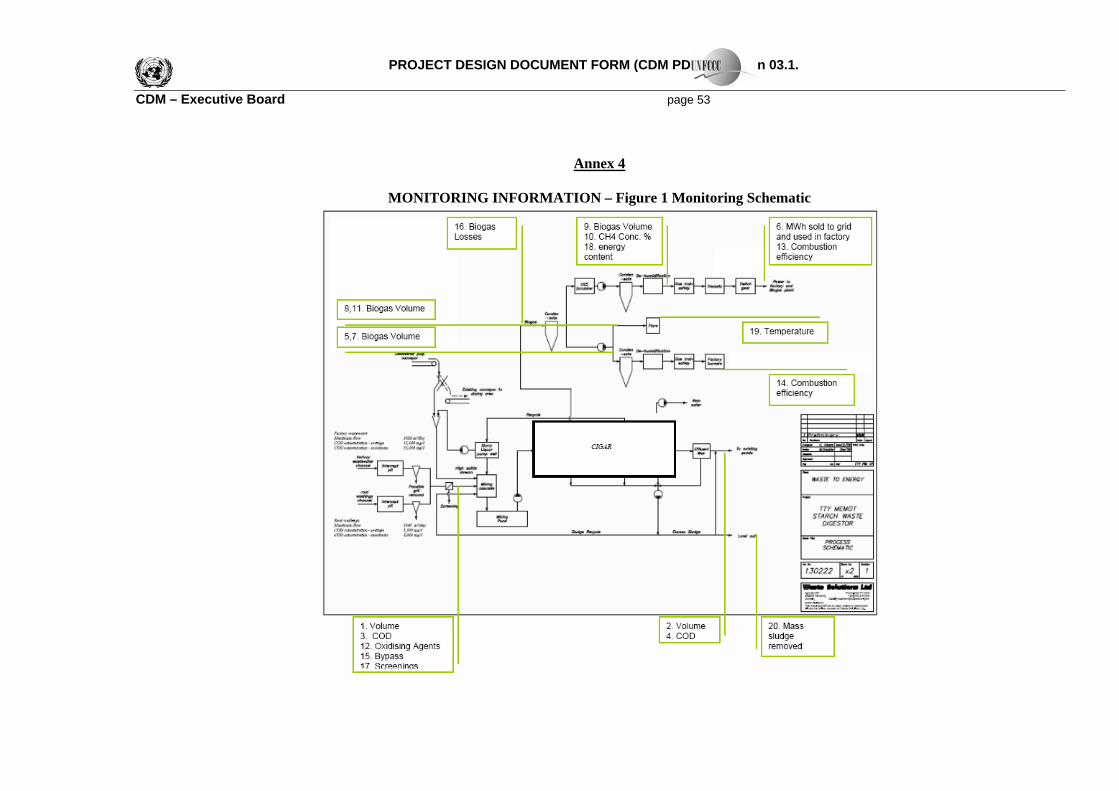
PROJECT DESIGN DOCUMENT FORM (CDM PDD) - Version 03.1. CDM – Executive Board page 53
Annex 4
MONITORING INFORMATION – Figure 1 Monitoring Schematic
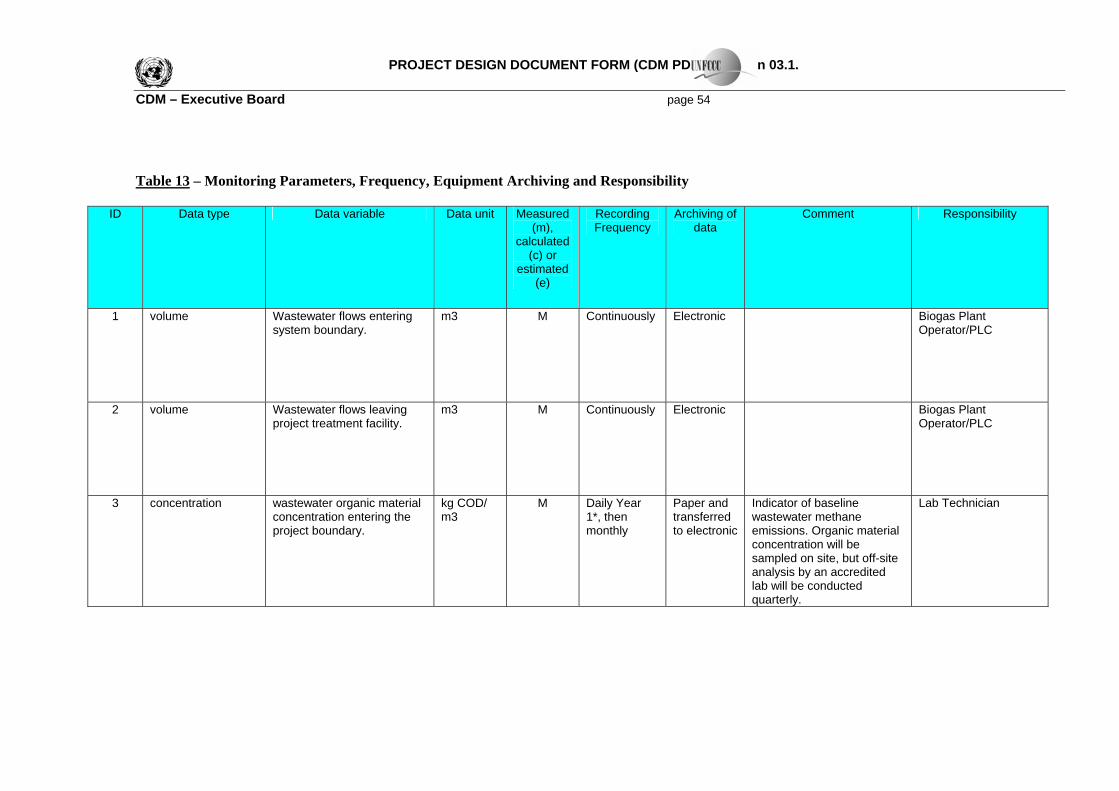
PROJECT DESIGN DOCUMENT FORM (CDM PDD) - Version 03.1. CDM – Executive Board page 54
Table 13 – Monitoring Parameters, Frequency, Equipment Archiving and Responsibility
ID Data type Data variable Data unit Measured
(m), calculated
(c) or estimated
(e)
Recording Frequency
Archiving of data
Comment Responsibility
1 volume Wastewater flows entering system boundary.
m3 M Continuously Electronic Biogas Plant Operator/PLC
2 volume Wastewater flows leaving project treatment facility.
m3 M Continuously Electronic Biogas Plant Operator/PLC
3 concentration wastewater organic material concentration entering the project boundary.
kg COD/ m3
M Daily Year 1*, then monthly
Paper and transferred to electronic
Indicator of baseline wastewater methane emissions. Organic material concentration will be sampled on site, but off-site analysis by an accredited lab will be conducted quarterly.
Lab Technician
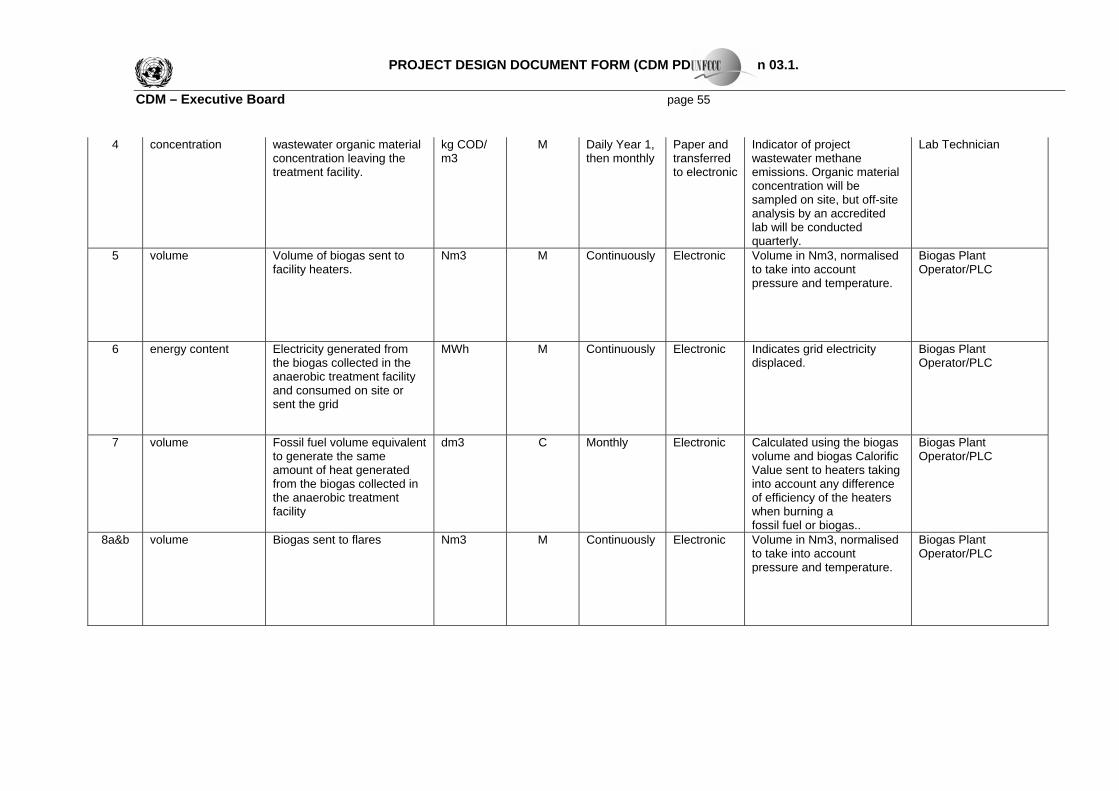
PROJECT DESIGN DOCUMENT FORM (CDM PDD) - Version 03.1. CDM – Executive Board page 55
4 concentration wastewater organic material concentration leaving the treatment facility.
kg COD/ m3
M Daily Year 1, then monthly
Paper and transferred to electronic
Indicator of project wastewater methane emissions. Organic material concentration will be sampled on site, but off-site analysis by an accredited lab will be conducted quarterly.
Lab Technician
5 volume Volume of biogas sent to facility heaters.
Nm3 M Continuously Electronic Volume in Nm3, normalised to take into account pressure and temperature.
Biogas Plant Operator/PLC
6 energy content Electricity generated from the biogas collected in the anaerobic treatment facility and consumed on site or sent the grid
MWh M Continuously Electronic Indicates grid electricity displaced.
Biogas Plant Operator/PLC
7 volume Fossil fuel volume equivalent to generate the same amount of heat generated from the biogas collected in the anaerobic treatment facility
dm3 C Monthly Electronic Calculated using the biogas volume and biogas Calorific Value sent to heaters taking into account any difference of efficiency of the heaters when burning a fossil fuel or biogas..
Biogas Plant Operator/PLC
8a&b volume Biogas sent to flares Nm3 M Continuously Electronic Volume in Nm3, normalised to take into account pressure and temperature.
Biogas Plant Operator/PLC
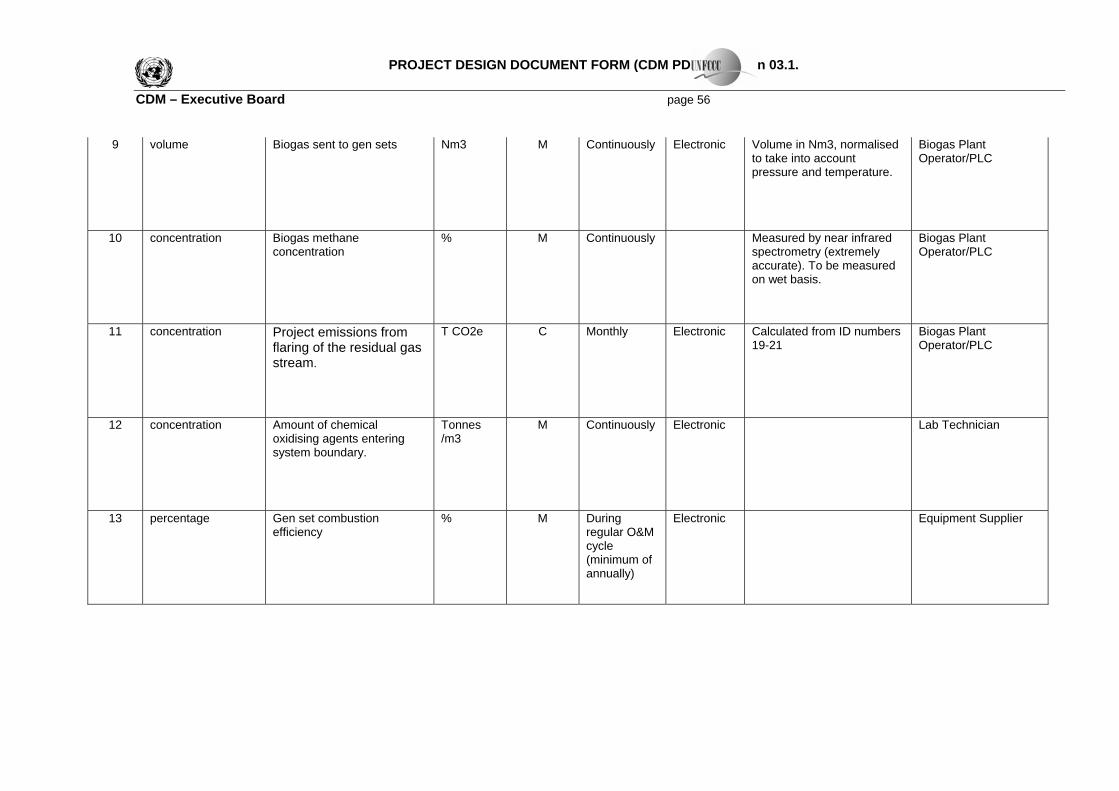
PROJECT DESIGN DOCUMENT FORM (CDM PDD) - Version 03.1. CDM – Executive Board page 56
9 volume Biogas sent to gen sets Nm3 M Continuously Electronic Volume in Nm3, normalised to take into account pressure and temperature.
Biogas Plant Operator/PLC
10 concentration Biogas methane concentration
% M Continuously Measured by near infrared spectrometry (extremely accurate). To be measured on wet basis.
Biogas Plant Operator/PLC
11 concentration Project emissions from flaring of the residual gas stream.
T CO2e C Monthly Electronic Calculated from ID numbers 19-21
Biogas Plant Operator/PLC
12 concentration Amount of chemical oxidising agents entering system boundary.
Tonnes /m3
M Continuously Electronic Lab Technician
13 percentage Gen set combustion efficiency
% M During regular O&M cycle (minimum of annually)
Electronic Equipment Supplier
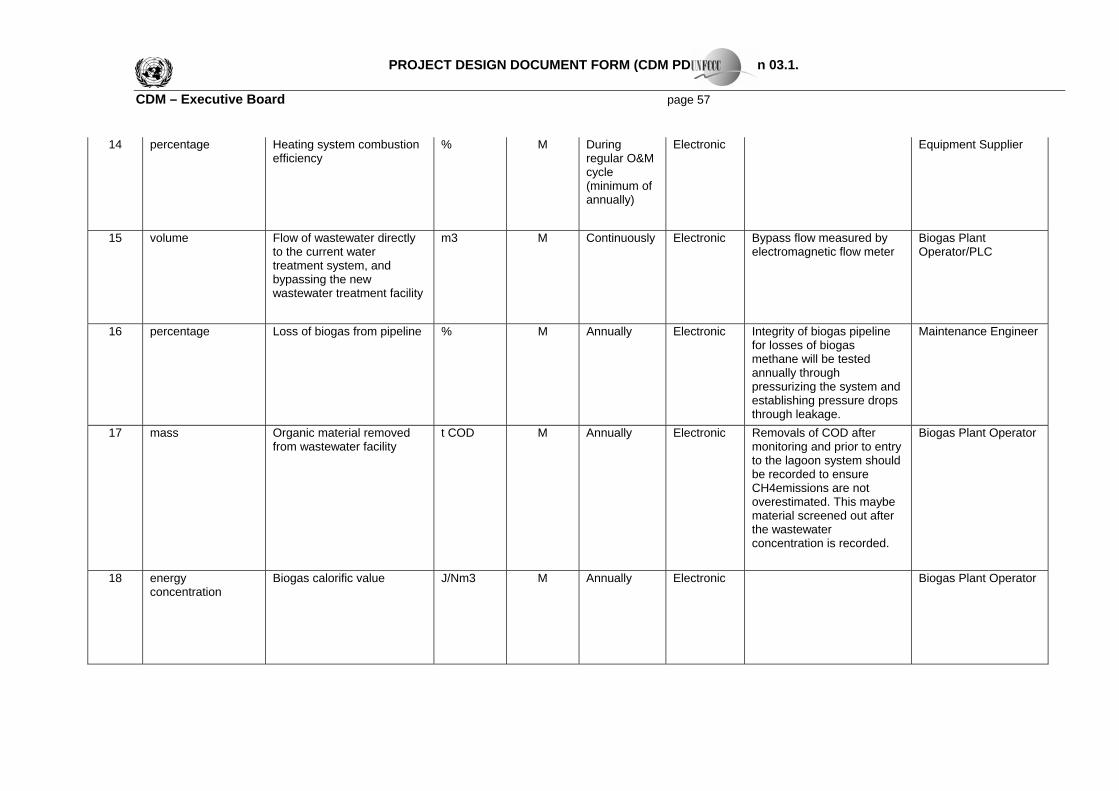
PROJECT DESIGN DOCUMENT FORM (CDM PDD) - Version 03.1. CDM – Executive Board page 57
14 percentage Heating system combustion efficiency
% M During regular O&M cycle (minimum of annually)
Electronic Equipment Supplier
15 volume Flow of wastewater directly to the current water treatment system, and bypassing the new wastewater treatment facility
m3 M Continuously Electronic Bypass flow measured by electromagnetic flow meter
Biogas Plant Operator/PLC
16 percentage Loss of biogas from pipeline % M Annually Electronic Integrity of biogas pipeline for losses of biogas methane will be tested annually through pressurizing the system and establishing pressure drops through leakage.
Maintenance Engineer
17 mass Organic material removed from wastewater facility
t COD M Annually Electronic Removals of COD after monitoring and prior to entry to the lagoon system should be recorded to ensure CH4emissions are not overestimated. This maybe material screened out after the wastewater concentration is recorded.
Biogas Plant Operator
18 energy concentration
Biogas calorific value J/Nm3 M Annually Electronic Biogas Plant Operator
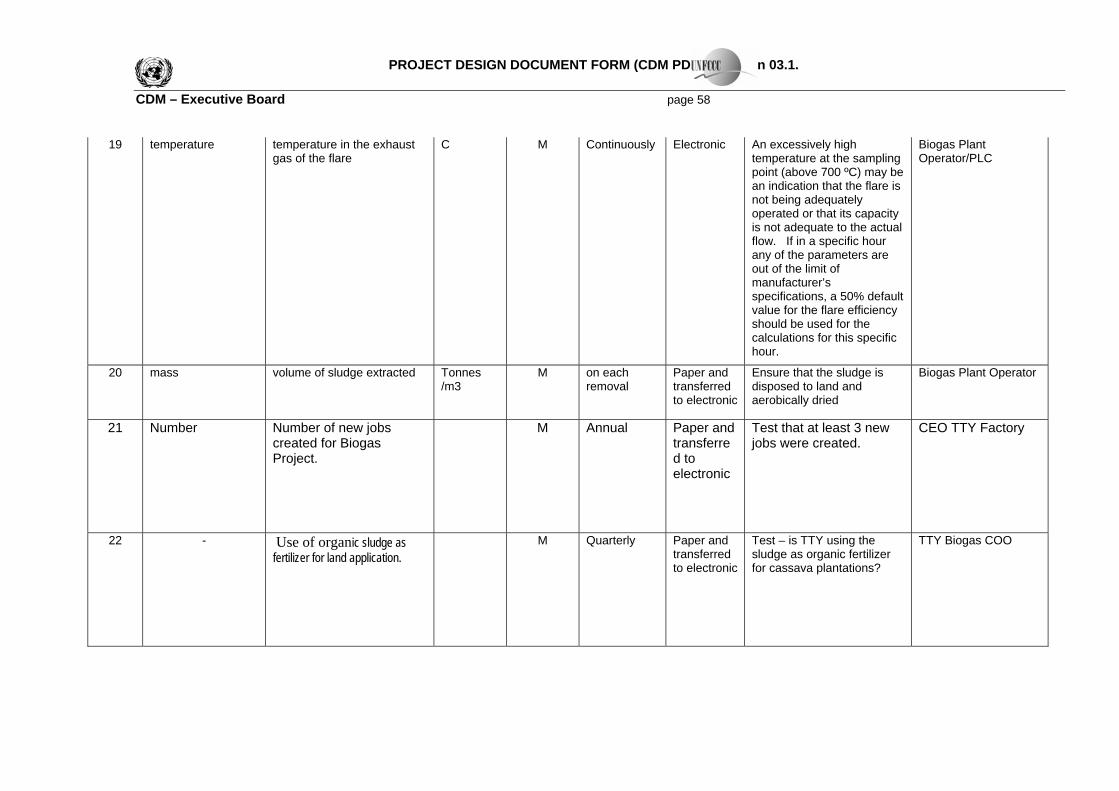
PROJECT DESIGN DOCUMENT FORM (CDM PDD) - Version 03.1. CDM – Executive Board page 58
19 temperature temperature in the exhaust gas of the flare
C M Continuously Electronic An excessively high temperature at the sampling point (above 700 ºC) may be an indication that the flare is not being adequately operated or that its capacity is not adequate to the actual flow. If in a specific hour any of the parameters are out of the limit of manufacturer’s specifications, a 50% default value for the flare efficiency should be used for the calculations for this specific hour.
Biogas Plant Operator/PLC
20 mass volume of sludge extracted Tonnes /m3
M on each removal
Paper and transferred to electronic
Ensure that the sludge is disposed to land and aerobically dried
Biogas Plant Operator
21 Number Number of new jobs created for Biogas Project.
M Annual Paper and transferred to electronic
Test that at least 3 new jobs were created.
CEO TTY Factory
22 - Use of organic sludge as fertilizer for land application.
M Quarterly Paper and transferred to electronic
Test – is TTY using the sludge as organic fertilizer for cassava plantations?
TTY Biogas COO
PROJECT DESIGN DOCUMENT FORM (CDM PDD) - Version 03.1. CDM – Executive Board page 59
23 - Safety of Biogas Project M On incident log
Paper and transferred to electronic
Any safety incidents - no fire or explosions resulted from the Biogas Project?
Biogas Plant Operator
.