
Tribological characterisation of turbocharger turbine ...1174880/FULLTEXT02.pdfSurface fatigue: this...
81
Tribological characterisation of turbocharger turbine sealing rings in heavy duty diesel engines Alex Gousskov Alin Dumitru Durac Mechanical Engineering, master's level 2018 Luleå University of Technology Department of Engineering Sciences and Mathematics
Transcript of Tribological characterisation of turbocharger turbine ...1174880/FULLTEXT02.pdfSurface fatigue: this...

Tribological characterisation of
turbocharger
turbine sealing rings
in heavy duty diesel engines
Alex Gousskov
Alin Dumitru Durac
Mechanical Engineering, master's level
2018
Luleå University of Technology
Department of Engineering Sciences and Mathematics

i
ii
Abstract This work investigated the wear mechanisms of turbocharger components in heavy duty diesel
engines. By understanding the wear mechanisms that are occurring in turbochargers the life time
of the turbocharger components can be improved. For better understanding, as to why the
components are worn out, an analysis of several turbocharger components and tribological tests
were carried out.
The contact surfaces between turbocharger and sealing rings were analysed. Surfaces are analysed
by several methods, including chemical composition of the surface. Influence of different
parameters such as contact pressure, sliding velocity, temperature, and distance on friction and
wear behaviour are established by performing tribological tests. Pin on disc sliding wear tests were
carried out at both room temperature and at high temperature of 300˚C. The pin and the disc, that
were used during the tribological tests, were made of the same materials that are used in
turbocharger components.
Analysis of pins and discs from tribo-tests and turbocharger components (turbine sealing rings and
shafts) show abrasive and adhesive wear on the worn surfaces of the components, from both the
tribological tests and the turbochargers respectively. An increase of the temperature resulted in a
reduced friction due to the formation of oxide layers on the sliding surfaces of pins and discs. In
the turbocharger, traces of lubricant between the sliding surfaces was found, in addition to plastic
deformations on the worn surfaces of the shafts and adhesive and abrasive wear on both worn
surfaces that were in contact with each other. On the other hand, on the worn surfaces of the turbine
sealing rings some cracks were observed that were perpendicular to the sliding direction, which
indicates presence of a fatigue process. The presence of fatigue cracks is probably due to the way
the trucks were operated, the increase and decrease of temperature and pressure in the turbocharger
is probably the cause of these cracks.
To minimize the wear mechanisms that occurs in turbocharger components such as sealing rings
and shafts, there are some parameters such as contact pressure between the sliding surfaces of the
components that can be minimized. By minimizing the contact pressure between the sliding
surfaces, the lifetime of turbocharger can be improved. A better surface finishing and geometry of
the contacting surfaces can also improve the sealing rings and shafts lifetime. To minimize the
relaxation of turbine sealing rings, materials that can better keep the mechanical properties of the
sealing rings at high temperatures must be used.
iii
Table of contents
1. Introduction ................................................................................................................................ 1 1.1 Tribology ................................................................................................................................ 1 1.2 Tribological testing ................................................................................................................ 1
Pin on disc (rotational) ............................................................................................................. 2
Pin on flat (reciprocating) ........................................................................................................ 2 Taber abrasion test ................................................................................................................... 2 Mar-Resistance Abrasion test ................................................................................................... 2
1.3 Wear mechanisms .................................................................................................................. 2 1.4 Wear characteristics of tool steels .......................................................................................... 4
1.5 Wear mechanisms at high temperatures ................................................................................. 4
1.6 Fundamentals of internal combustions engines and turbochargers ........................................ 5
Internal Combustion Engine ..................................................................................................... 5 Turbocharger ............................................................................................................................ 7
1.7 Wear of turbochargers ............................................................................................................ 8 1.8 Wear models for turbochargers .............................................................................................. 9
1.9 Knowledge gaps ..................................................................................................................... 9
2. Aim, objectives and limitations ............................................................................................... 10
Aim of the project ...................................................................................................................... 10 Objectives ................................................................................................................................... 10 Limitations ................................................................................................................................. 10
Limitations in tribological tests .............................................................................................. 10
3. Experimental work ................................................................................................................... 11
3.1 Material and specimens ........................................................................................................ 11 Turbocharger .......................................................................................................................... 11
Tribological test specimens .................................................................................................... 11 Data from customer trucks ..................................................................................................... 11
3.2 Experimental technique ........................................................................................................ 12
The turbocharger components ................................................................................................ 12 Tribotests ................................................................................................................................ 14
3.3 Test parameters .................................................................................................................... 15 Contact pressure ..................................................................................................................... 15 Sliding speed .......................................................................................................................... 18 Sliding distance ...................................................................................................................... 18
3.4 Test procedures .................................................................................................................... 18 Preparation before tribological test. ....................................................................................... 18
3.5 Microstructural analysis ....................................................................................................... 19
3D surface profilometry ......................................................................................................... 19 Light optical microscope (LOM) ........................................................................................... 20 Vickers hardness testing ......................................................................................................... 21 Scanning Electron Microscope. .............................................................................................. 22 Analysis of tribological specimens. ....................................................................................... 22 Data analysis .......................................................................................................................... 23
4. Results and discussion .............................................................................................................. 24

iv
4.1 Wear and failure analysis of turbocharger components ....................................................... 24
4.1.1 LOM analysis of turbocharger components .................................................................. 24 4.1.2 3D surface profile analysis ............................................................................................ 28 4.1.3 Wear depth of inner sealing rings and shafts. ............................................................... 35 4.1.4 Hardness of new samples .............................................................................................. 36 4.1.5 Hardness of used shafts ................................................................................................. 37
4.1.6 Hardness of inner sealing rings ..................................................................................... 38 4.1.7 Hardness of outer sealing rings (in contact with shaft surfaces) ................................... 39 4.1.8 Hardness of outer sealing rings (from exhaust gases side) ........................................... 40 4.1.9 SEM analysis of worn inner sealing rings ..................................................................... 41 4.1.10 SEM analysis of shafts ................................................................................................ 47
4.1.11 Cross-section analysis of the inner sealing rings and shafts ....................................... 49 4.1.12 Cross-section analysis of the used shafts .................................................................... 50
4.2 Friction and wear behaviour from tribological tests ............................................................ 52
4.2.1 Friction behaviour ......................................................................................................... 52 Wear behaviour ...................................................................................................................... 54 Analyse of field data .............................................................................................................. 59
4.3 Suggestions for improved durability of sealing rings .......................................................... 61
5. Conclusions ............................................................................................................................... 62
6. Future work .............................................................................................................................. 63
7. Acknowledgements ................................................................................................................... 64
8. References ................................................................................................................................. 65
9. Appendix ..................................................................................................................................... 1
A. Tribological conditions for each test ................................................................................. 1
B. Wear data from tribological experiments .......................................................................... 2 C. Disc hardness measurement ............................................................................................... 4 D. EDS analysis of disc surface ............................................................................................. 5
E. Hardness measurements across cross-section of turbocharger components...................... 7 F. Parameters influence on wear behavior of AISI 4140 .......................................................... 9
1
1. Introduction
1.1 Tribology
Tribology is the science and technology of interacting surfaces in relative motion and of related
subjects and practise. The word tribology comes from the Greek word τρίβω (tribo) meaning
rubbing. The study focuses on friction, wear mechanisms and lubricants.
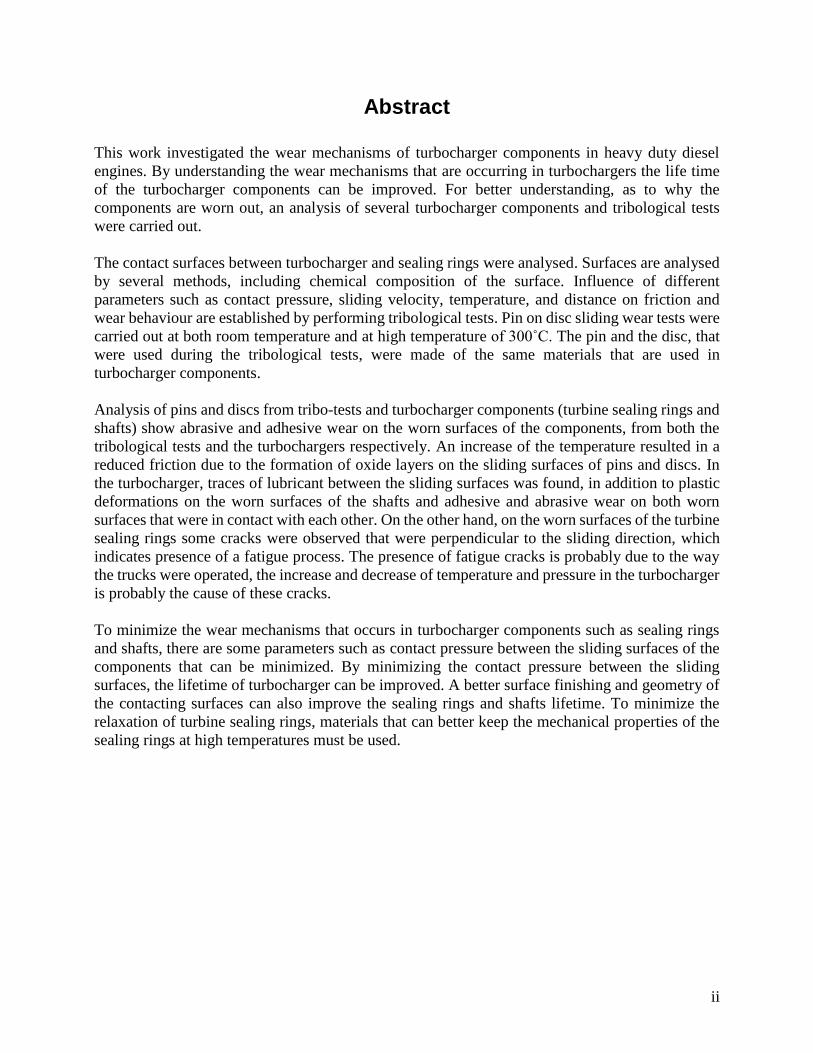
One of the earliest tribological thinking is found in old Egypt circa 1880 BC. Egyptians poured
lubricant in front of a sled to be able to move the colossus El-Bersheh. Approximately 170 slaves
were used to pull the 60 ton statue. It was possible due to the lubricant which lower the coefficient
of friction down to 0.27 [1]. The coefficient of friction itself was introduced by Renaissance
engineer-artist Leonardo da Vinci, who defined it as ratio of friction force that resisted sliding to
normal load applied on the surface.
Figure 1. Egyptian using lubricant to aid movement of colossus, EL-Bersheh, ca 1880 B.C.
1.2 Tribological testing
Measurement of friction and wear is termed tribotesting and consist of four basic elements:
simulation, acceleration, specimen preparation and friction and wear measurements. Good
simulation is a correct prepared test that replicate the wear mechanisms in actual system. The
simulation includes type of motion, speed, load, lubrication condition, and operating environment
(humidity, temperature etc..). Acceleration of the test is used to minimize the cost by reducing
lubricant or increasing load, speed or temperature. It is crucial to keep the same wear mechanism
that occurs in real application. Specimen preparation is important for getting repeatable results
from the test.
In laboratory testing, there are three types of contact geometries that are typically employed:
conforming (area) contact, line contact and point contact. Conformal contact provides uniform and
stable contact area after the parts has worn in. This result in accurate measurements data for
validation. The point contact changes the contact area during the test but do not need alignment.
There are various numbers of tribological tests that exist today. Some examples are:
2
Pin on disc (rotational)
Pin on disc tribological test is commonly used to measure the friction force and wear of materials.
The test gives possibilities to vary load, temperature, lubricant even during the test. Usually the
disc is made of a harder material than the pin to avoid the problem with the pin cutting through the
disc instead of continuous wear. One of the most common problems with this type of test is the
small oscillation or vibration during lubricated or boundary-lubricated conditions [2].
Pin on flat (reciprocating)
Pin on flat test uses an oscillation motion to evaluate friction and wear behaviour of the test
material. This test is widely used to evaluate the friction behaviour of cylinder liner and piston
rings, but other applications are also possible such as the replacement of shoulder joint. The test
has an advantage of study of friction during start stop conditions and evaluate wear in human
shoulder joints.
Taber abrasion test
Taber abrasion test evaluate a wear resistance in sliding rotational movement. This movement
causes a specific rub-wear action which evaluate a resistance of surface to outside conditions. It is
used to evaluate the effective strength of fabrics or the forces required to brake a specific width of
fabric. Other application like determination of coating behaviour is also common.
Mar-Resistance Abrasion test
Mar-resistance abrasion test uses different techniques to evaluate the resistance to scratching of a
material. The samples are usually high gloss rigid surfaces. It measures the difference in colour
before and after which can be taken as measurement of resistance to scratch. The technique uses to
evaluate the home electronics like flat screens.
1.3 Wear mechanisms
Wear constitutes the main limitation of the technical and economical service life of a machine. The
wear is defined as the progressive loss of material from one or both the contacting surfaces, this is
occurring because of the normal load and the relative motion between two surfaces [3].
There are four basic wear processes, Adhesive wear, Abrasive wear, Surface fatigue and Corrosive
wear [3-4].
Adhesive wear: occurs when the two surfaces are sliding relatively to each other, the contact
between interacting asperities lead to micro-welding, material from the lower wear resistant surface
removes to the other surface. This type of wear is dependent on both chemical and physical aspects,
such as material properties and corrosive atmosphere of chemicals. Specific forms of adhesive
wear are scuffing, scoring and galling [3-4].
Several steps that are leading to Adhesive wear:
• Deformation of the contacting asperities
• Adhesive junction forms
• Transfer of material during the failure of the junctions.
3
The way of preventing/avoiding Adhesive wear, is to choose two different materials that are not
metallurgically compatible to each other, in turn this decrease the friction and the wear will be
reduced [3-4].
Abrasive wear: the abrasive wear is divided into two types of abrasive wear which means that this
type of wear occurs in two modes, two and three body abrasive wear:
Two body abrasive wear: occurs when hard particles or grid remove material of the opposite
surface, there the harder surfaces asperities are penetrating the softer surface and removing
material throw a plugging or cutting operation [4].
Three body abrasive wear: occurs when the third body is present, usually small hard particles
that are in between two surfaces that are sliding relatively to each other. These small particles
are able to slide down and roll on the surfaces and by that damage the surface that has a lower
hardness [4].
The abrasive wear can be minimized/prevented by:
• The difference of the hardness less 10% of the two surfaces
• Both surfaces should have a high hardness.
• Implementing a harder layer in the softer surface
• Keeping clean or removing the hard particles from the surfaces
Surface fatigue: this type of wear occurs in rolling contact possibly with some slip, the surface
fatigue manifest generally after a very large number of contacting cycles. Because of these cycles
particles of material breaks away from the sliding surface with rolling bearing, cams and gears.
The surfaces fatigue is also known as pitting, small pits are formed on the contacting surfaces, these
pits are of different sizes, if it`s delamination or spalling, the pit seizes are in order of 1000 µm
other ways the pit sizes are in order of 30 µm [3-4].
The surface fatigue can be minimized by:
• Reducing the contact pressure
• High hardness of both surfaces
• Finishing/polishing the surfaces in contact, low roughness
• By hardening the surface, carburizing flame or induction hardening (not nitriding)
Corrosive wear: occurs under reaction of the products in corrosive environment, which means that
under presence of a corrosive liquids or gases, the reaction products are formed on the surfaces
which in turn strongly affects the wear process. The most common form of corrosive wear is the
oxidation. Most metals react with oxygen in air or water to form an oxide layer [3-4]. The reaction
of steel with oxygen builds up a thin oxide layer that is often more brittle than the base material.
During the sliding this thin oxide layer brakes and if the oxide debris are softer than the base
material then the debris are like a solid lubricant and minimize the friction. If the oxide debris are
more brittle than the base material then these oxide debris increase the abrasive wear.
The corrosive wear can be decreased by taking care of the environment and the dynamic
interactions between the mating surfaces. Protection against chemical attack from environment.
can prevent corrosive wear.
4
1.4 Wear characteristics of tool steels
Tool steels are complex iron-base alloys of carbon, chromium, vanadium, molybdenum or
tungsten, in different combinations thereof. In some cases, tool steels can have a substantial amount
of cobalt, cobalt dissolves in iron and strengthens it whilst and at the same time is imparting the
temperature strength, the temperature of the cutting surface can sometimes even be 850°C. These
different alloys are balanced to give a high resistance to wear, high resistance to thermal softening
and a good toughness for effecting cutting operations in different industries. The main influence
factors that are preventing the wear in tool steels are: the carbide forming elements, the
microstructure and the hardness of the material [5] [6]. The friction and wear of tool steels are
temperature dependent. The friction decreases with increasing temperature while the wear
increases with increasing temperature.
The governing wear mechanisms that occurs in machine elements there the tool steels are used are
adhesive and abrasive wear. Adhesive wear is often described as a severe wear, is generally the
starting point for a wear process developing between two metal surfaces that are sliding against
each other. It is a process where the softer surfaces mechanically adhere or bond, which in turn is
identified by tearing or material displacement, this in turn can produce debris in a loose form.
The abrasive wear arises from the penetration of asperities of harder surface into the softer surface
during the sliding against each other, this is called two-body abrasive wear. Even the debris that
are coming from material displacement between the sliding surfaces from adhesive wear lead to
three-body abrasive wear [7].
Often the tool steel is used at elevated temperatures, tool steels have better hardness properties than
other steels at elevated temperatures. Even for tool steels there are several problems that are
encountered at elevated temperatures such as thermal fatigue and oxidation [8]. If tool steel
machine elements are frequently exposed to high cyclic temperatures and mechanical loads. These
severe conditions will eventually lead to surface damage. One of the most common failure
mechanisms is crack initiation caused by heat checking, which is a network of surface cracks that
are created by friction heating of contacting surfaces and it is followed by rapidly cooling of the
surfaces and is usually influenced by oxidation and creep [9].
1.5 Wear mechanisms at high temperatures
In many applications, the machine components are exposed to severe conditions such as high
working loads, sliding speeds and temperature. These type of machine elements are mostly found
in aerospace, mining, metal working industries and automotive. The high temperature tribology is
therefore focused on how the temperature affects the friction and wear behavior and how to control
these [10].
The wear mechanisms at relatively high temperature are mainly abrasive and adhesive wear.
Mechanical systems exposed to high temperatures can increase the severity of these wear
mechanisms and thereby increase the wear rate [11].
The adhesive wear is initiated by the formation of bond between the asperities of sliding surfaces.
At higher temperatures, the strength of the materials decreases (materials get softer), the materials

5
get more ductile and the number of bonds starts to increase and the severity of the adhesive wear
increases under a given load [12].
During sliding, the detached asperities (from the sliding surfaces or abrasive particles from outside
environment, debris) may get accumulated and builds up particles [12]. These particles can embed
into one of the surfaces causing grooves by ploughing in the counter surface and two body abrasive
wear occurs. Due to the build-up particles, three body abrasive wear at high temperature can also
occur, due to the presence of hard particle/oxides wear debris [12], [13].
At high temperature the materials get softer, by that the abrasive particles that are between the
sliding surfaces can get embedded into the softer surface and that in turn can form a tribo-layer on
the surface which increases the resistance to wear. Such layers are sometimes called glaze oxide
layers [14].
The oxide layers are present on almost all metals in presence of oxygen. The interaction of this
chemical reaction occurs when the oxygen and metal ions react. The rate of the chemical reactions
and the formation of oxides increase with increasing of temperature. These oxides have a higher
forming rate not only during the heat that is generated the contacting asperities but also due to the
heat that is generated from the surrounding environment (high ambient temperature) [15]. This rate
of oxidation increases at higher temperature due to the higher diffusion rate of ions.
While increasing the ambient temperature the rate of oxidation increases and in turn a total
oxidation of the sliding surfaces can occur. At high ambient temperature, the stability of the oxide
layers on the substrates will be affected by changes in the coefficient of thermal expansion of the
metal substrate and the oxide layer [16-19]. While increasing the ambient temperature the oxide
layers are less adherent to the metal substrate, which in turn increases the formation of oxide
debris/particles between the sliding surfaces [19].
Another important factor that also influence the appearance of the oxide particles in the
tribosystem, is the thermal diffusivity value. If the thermal diffusivity of the oxide layer is higher
than that of the counter surface and in turn will rapidly cool down by transferring the generated
heat into the counter surface, then the oxide layer will become hard and brittle, and these hard and
brittle oxide layers will easily produce abrasive particles in the contact [19].
1.6 Fundamentals of internal combustions engines and turbochargers
Internal Combustion Engine
The Internal Combustion Engine (ICE) is a thermal engine where the combustion of a fuel occurs
with an oxidizer, the oxidizer is usually air which in turn mixes with the fuel in a combustion
chamber. The expansion of high-pressure gases and high-temperature in the combustion chamber
applies a direct force on engine components (pistons), the components starting to move in order to
convert thermal energy into mechanical energy [20].
The most common internal combustion engines are four-stroke engines (four-cycle engine). The
four-stroke engine is an engine in which the piston completes four separate strokes while turning a
crankshaft, the length of a stroke is the full travel of the piston along the cylinder.

6
1. The intake stroke begins at top dead center and ends at bottom dead center. In this stroke,
the intake valve is open, the piston pulls an air-fuel mixture into the cylinder.
2. Compression stroke starts at bottom dead center, in this stroke the valves are close and the
piston compresses the air-fuel mixture in preparation for ignition.
3. Ignition stroke or power stroke, starts at top dead center and the air-fuel mixture is ignited,
then forcefully the piston moves to bottom dead center. This stroke produces mechanical
work from the engine to turn the crankshaft.
4. Exhaust stroke starts from bottom dead center of the cylinder and ends at top dead center
while the exhaust valve is open and the exhaust gases are evacuated from the cylinder.
There are two different four-stroke internal combustion engines, diesel engines and gasoline
engines. Both diesel engines and gasoline engines are converting the chemical energy of the fuel
into mechanical energy through a series of combustions. In a gasoline engine, the fuel is mixed
with air, compressed by the piston and then is ignited by spark from a spark plug. In a diesel engine,
the air is compressed first then the fuel is injected, while the air heats up during the compression,
the fuel ignites.
Figure 2. How a four-stroke internal combustion engine works.
The materials that are used to manufacture the internal combustion engines must be reinforced, the
reinforcement of these metals can have many different objectives.
Increase the yield strength and tensile strength at room temperature and high temperature while
maintaining minimum ductility or toughness and other objectives such as increase the fatigue
strength at elevated temperatures, improvement of thermal chock resistance, improvement of
corrosion resistance, increase of Young`s modulus and reduction of the thermal elongation [19].

7
Turbocharger
The engine power can be boosted if the air entering the cylinder has a density that is higher than
the pressure at ambient conditions. If the air density is higher, then the air mass flow rate is higher
and a higher fuel mass flow rate can be burnt in the same displacement volume [21]. The purpose
is to increase the engine power. To be able to compress the air entering the cylinder and to increase
the engine power a turbocharger is required. The turbocharger uses the exhausted gases energy to
rotate a turbine wheel which in turn rotates the compressor [21]. The compressor wheel pressurizes
the air into the combustion chamber of an internal combustion engine. The turbine wheel is
connected to the compressor wheel through a shaft. The shaft has axial and radial bearings to hold
it in place in the central housing of the turbocharger. Between the central house of the turbocharger
and the turbine house there are sealing rings to prevent the exhaust gases from entering into the
central house and contaminate the oil, and on the other hand prevent the oil leaking from the central
housing of the turbocharger [21].
Figure 3. Cross-section view of turbocharger with components description, how the exhaust gases rotate the turbo wheel and how
the air is then compressed through a compressor wheel.

8
1.7 Wear of turbochargers
Modern trucks are regulated by many requirements for emissions and demands for lower fuel
consumption. This leads to a higher demand for more efficient engines as well as turbochargers. It
is well known that the turbocharger increases the thermodynamic efficiency of the combustion
engine [22]. To minimize losses further the turbocharger itself should become more efficient,
without sacrificing its durability.
The turbocharger has several components whose combination can provide a durable system to
increase the engine efficiency including heavy-duty diesel engines. The failure of one of the
component can lead to seizure of turbocharger and damage the engine. FABIŚ-DOMAGAŁA [23]
have conducted FMEA research to determine a probability of failure of each component.
To secure turbocharger durability it is important to focus on sealing rings and bearings. A common
practice today is using a floating bearing to support a turbine shaft [24]. The bearing is silent and
have advantage in rotor dynamics because of its damping ability due to the oil film between the
shaft and the bearing. The rotodynamic have been extensively studied [24,25-28] and validation of
models have been done [27]. Papers describe influence of oil feed, oil pressure, whirl, bearing
clearance on the stability of the rotor and friction behaviour. The one study on floating bearing in
turbochargers investigates air as the separating media [28] and nano-magnetorheological fluids
instead for oil [29].
The second alternative to decrease frictional losses in turbochargers is to replace the trust bearing
with a ball bearing [30,31]. Several designs of ball bearings have been evaluated, from different
sizes to material selection. There are many questions about the dynamics and durability of the new
designs that are main subject of research.
This work focuses on wear of sealing rings. One of the main problem it is discussed that the main
problem of poor sealing performance is increased blow by. The exhaust gases, which passes
through the sealing rings, flows in to the bearing house. The oil drain pipe of the turbocharger leads
the gases further to the oil chamber. Extensive leakage through the sealing rings builds up a
pressure, first in the bearing house, then in the oil drain. This lead to problems of the engine system.
High pressure in the oil chamber creates several problems. The high-pressure forces oil through
the sealing for example in engine head which leads to a risk of fire. Another problem is that high
pressure in the oil chamber prevents oil draining from the turbocharger. Oil then stays in the
turbocharger causing problems with lubrication of the shaft bearings which leads to severe damage
and potential seizure of the bearing.
9
1.8 Wear models for turbochargers
Based on Scania internal research one of the latest wear models to describe wear of sealing rings
is based on Archard’s wear equation. Archard have in the 1950’s described wear as function 𝑄 =𝐾 𝑊 𝐿
𝐻. The equation describes wear 𝑄 proportional to normal load 𝑊, sliding distance 𝐿 and a wear
constant 𝐾. The model also takes in account the hardness of softer material 𝐻.
The parameters to apply to the wear equation were determent by using data accumulated by Scania.
The normal load 𝑊 and sliding distance 𝐿 are described by knowing pressure and rotational speed
in the turbocharger. The hardness of material 𝐻 varies with temperature but in the wear model for
turbocharger have taken as a constant value. The value of the constant 𝐾 is estimated by available
data from existing measurements. The model shows some promising results, but its limitations are
discussed.
One of the challenges is to determine the conditions in the turbocharger. Measurements of required
pressure to move the sealing ring are not taken. The friction generated between sealing rings and a
bearing house is measured at disassembled turbocharger. This gives some uncertainties in the
model.
1.9 Knowledge gaps
The uncertainties of today’s wear model of sealing rings based on Archard’s equation gives an
area for a deeper research. There have not been found information about wear mechanisms that
occur in the sealing of turbocharger. It is mentioned before that the working conditions are not
determined either. It has not been found an available data on measured temperature, pressure or
content of fluid around sealing rings.
This thesis work will cover the analyze of gliding surfaces of sealing rings and shaft. Performing
a visual, hardness, EDS and profile analyses will give better understanding of conditions that may
occur in the sealing area. Performed analyses will help to determine wear mechanisms, which are
crucial for the models based on Archard’s equations. Furthermore, there will be performed
several tribological tests to evaluate conditions influence on wear mechanisms and wear rate.
10
2. Aim, objectives and limitations
Aim of the project
The aim of this project is to identify the dominant wear mechanisms of the inner sealing rings and
shafts of turbochargers in heavy duty diesel engines. Tribological experiments will be carried out
to identify which parameters that influence the wear. Analysis of data from trucks used in the field
will be analysed to assess which driving conditions that are most damaging for the components of
the turbochargers. The long-term aim is to use this information to prevent the damage of the
components of turbochargers.
Objectives
The objectives of the project are:
1) Literature studies about different types of wear, at different conditions such as wear at high
temperature and literature studies about the wear that occurs in turbochargers.
2) Investigations about the contact conditions that are occurring between the turbocharger
shafts and the sealing rings. These investigations are focussed on temperature, contacting
pressure, sliding velocity and the wear and friction between the sliding surfaces.
3) Identify the dominant wear mechanisms that are occurring in the turbocharger components
(sealing rings and shafts) and how these mechanisms are influencing the turbocharger
components lifetime.
4) Carry out tribological experiments to understand the influence of operating conditions such
as contact pressure, sliding velocity and temperature on friction and wear.
Limitations
The analysis of worn turbocharger components from field use were limited to four selected
vehicles. These were selected based on randomly chosen turbochargers. Two of the turbochargers
came from Netherlands, one from Australia and one from Great Britain. The trucks were used for
hauling a general cargo, mostly highway. Trucks have different mileage and work conditions for
better comparison.
Limitations in tribological tests
The extreme conditions (high sliding speeds and temperatures) in the turbocharger are difficult to
simulate in the laboratory. The pin on disc TE67 machine can run up to 2000 RPM and with the
maximum disc radius the sliding speed is limited to 11 m/s. This is lower than the actual application
but can still provide an indication about the effect of sliding speed.

11
3. Experimental work
3.1 Material and specimens
Turbocharger
The sealing rings of turbochargers are commonly made of tool steel HS 6-5-2. The hardness of the
sealing ring material is around 620 HV and the chemical composition of the material can be seen
in Table 1 below.
Table 1.The chemical composition of the sealing rings material.
Element C Cr Mo W V Fe
wt% 0.9 4.2 5.0 6.4 1.8 Balance
The shaft is made of carbon steel, with the designation ASIS 4140 (UNS G87400) and the hardness
is around 412 HV. In Table 2 below, the chemical composition of the shaft is given.
Table 2.Chemical composition of shaft material.
Element C Mg Cr Mo Si P S Fe
wt% 0.40 0.80 0.55 0.22 0.27 0.02 0.02 Balance
Tribological test specimens
The discs for tribological experiments are made of the tool steel HS 6-5-2, same as the ring material.
The diameter of the discs is Ø120 mm and 8 mm thick with a Ø10 mm hole in the middle for
attachment to the tribological machine.
The shaft of the turbocharger is made from carbon steel UNS G87400. The same material is used
in pins supplied for tribological experiments. The pins are Ø4 mm in diameter and 4 mm in length.
They have chamfered edges on both sides to prevent cutting effects that may occur during the
tribological test when using flat-on-flat contacts.
Data from customer trucks
During the project, data from approximately 60 customer trucks was made available. Logged data
was downloaded from trucks and presented as a matrix. This matrix included the truck serial
number, mileage, number of gearshifts, country, percentage of use at each load interval within
RPM interval. Trucks used the same engine with different truck application. The information was
used to evaluate parameters influence on wear resistance.
The turbochargers were removed from trucks. All the turbochargers were in working conditions
before they were removed. The turbochargers were taken apart to remove the sealing rings. Wear
of both outer and inner sealing rings was measured at three different points and an average value
was calculated for each sealing ring. The data was then added to the matrix from trucks and
supplied by Scania.
12
3.2 Experimental technique
The turbocharger components
Turbocharger components that had been chosen for analyses came from trucks which had been
used by costumers. Differentiation of turbochargers in analyses had been done by writing the
chassis number of each truck, where the turbochargers had been used. The components of
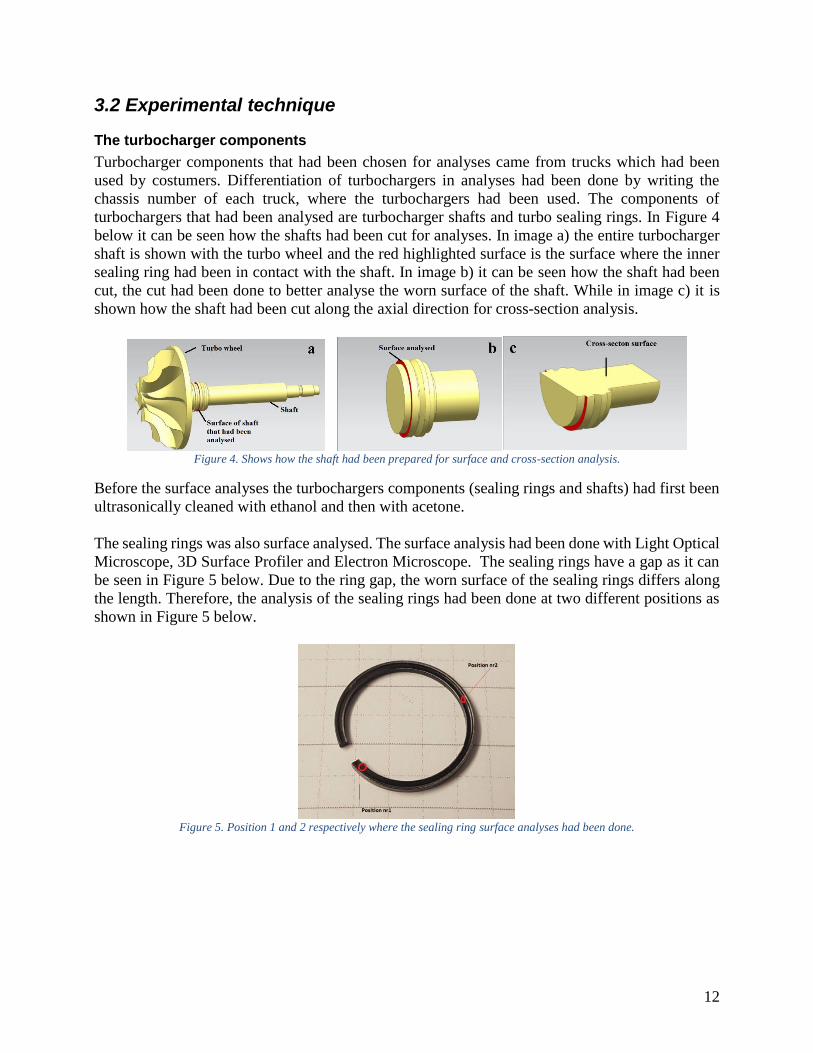
turbochargers that had been analysed are turbocharger shafts and turbo sealing rings. In Figure 4
below it can be seen how the shafts had been cut for analyses. In image a) the entire turbocharger
shaft is shown with the turbo wheel and the red highlighted surface is the surface where the inner
sealing ring had been in contact with the shaft. In image b) it can be seen how the shaft had been
cut, the cut had been done to better analyse the worn surface of the shaft. While in image c) it is
shown how the shaft had been cut along the axial direction for cross-section analysis.
Figure 4. Shows how the shaft had been prepared for surface and cross-section analysis.
Before the surface analyses the turbochargers components (sealing rings and shafts) had first been
ultrasonically cleaned with ethanol and then with acetone.
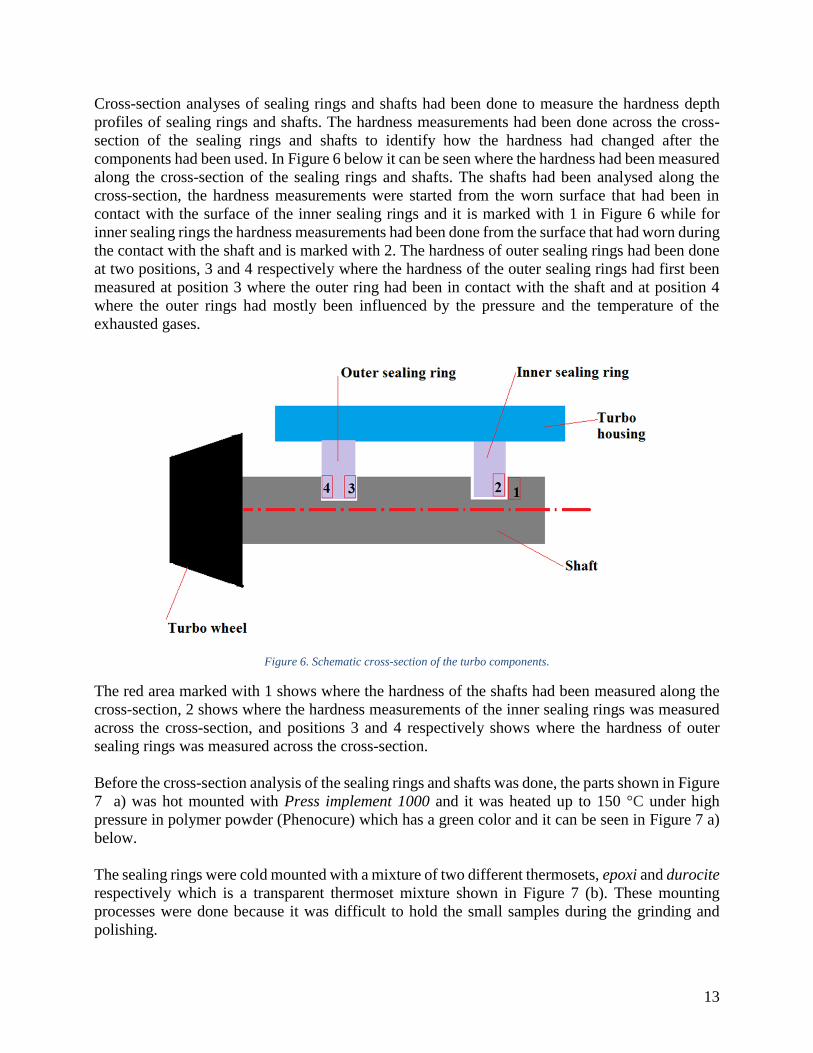
The sealing rings was also surface analysed. The surface analysis had been done with Light Optical
Microscope, 3D Surface Profiler and Electron Microscope. The sealing rings have a gap as it can
be seen in Figure 5 below. Due to the ring gap, the worn surface of the sealing rings differs along
the length. Therefore, the analysis of the sealing rings had been done at two different positions as
shown in Figure 5 below.
Figure 5. Position 1 and 2 respectively where the sealing ring surface analyses had been done.
13
Cross-section analyses of sealing rings and shafts had been done to measure the hardness depth
profiles of sealing rings and shafts. The hardness measurements had been done across the cross-
section of the sealing rings and shafts to identify how the hardness had changed after the
components had been used. In Figure 6 below it can be seen where the hardness had been measured
along the cross-section of the sealing rings and shafts. The shafts had been analysed along the
cross-section, the hardness measurements were started from the worn surface that had been in
contact with the surface of the inner sealing rings and it is marked with 1 in Figure 6 while for
inner sealing rings the hardness measurements had been done from the surface that had worn during
the contact with the shaft and is marked with 2. The hardness of outer sealing rings had been done
at two positions, 3 and 4 respectively where the hardness of the outer sealing rings had first been
measured at position 3 where the outer ring had been in contact with the shaft and at position 4
where the outer rings had mostly been influenced by the pressure and the temperature of the
exhausted gases.
Figure 6. Schematic cross-section of the turbo components.
The red area marked with 1 shows where the hardness of the shafts had been measured along the
cross-section, 2 shows where the hardness measurements of the inner sealing rings was measured
across the cross-section, and positions 3 and 4 respectively shows where the hardness of outer
sealing rings was measured across the cross-section.
Before the cross-section analysis of the sealing rings and shafts was done, the parts shown in Figure
7 a) was hot mounted with Press implement 1000 and it was heated up to 150 °C under high
pressure in polymer powder (Phenocure) which has a green color and it can be seen in Figure 7 a)
below.
The sealing rings were cold mounted with a mixture of two different thermosets, epoxi and durocite
respectively which is a transparent thermoset mixture shown in Figure 7 (b). These mounting
processes were done because it was difficult to hold the small samples during the grinding and
polishing.

14
Figure 7. In a) molded cross-section of the shaft and in b) the cross-section of the sealing ring.
Tribotests
The pin on disc machine Phoenix Tribology TE67 was used to perform tribological tests. The tests
evaluate the tribological behaviour during the rotational motion between two surfaces. In this
project, the test is used to specify the influence of different parameters, such as load, speed and
temperature, on wear behaviour of the materials in turbocharger.
The pin on disc machine TE67 have several possibilities to apply load in different ways. There is
a pneumatic bellow that can be mounted for high load or variable loads during the test. For
measurement during these tests a dead weight system will be used instead. It is placed on top of
the pin as shown in Figure 8 . Thermo couples were placed in the middle of inlet air channel to
measure the inlet air temperature. The temperature of the disc is measured by a pyrometer which
is adjusted before tests. A lid is placed on top of the chamber during the heating and testing at high
temperature, see Figure 8. The friction sensor measures the friction force in Newton up to 10
measurements per second.
Figure 8. Pin on disc test machine TE67.
Lid
15
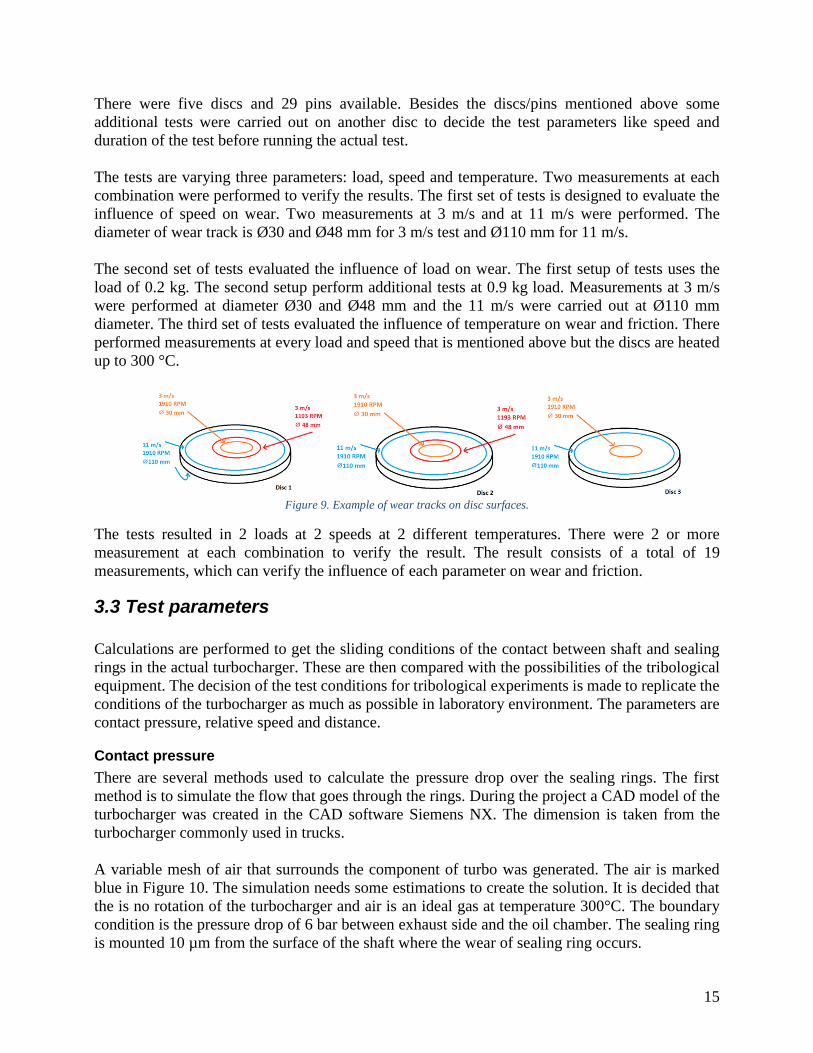
There were five discs and 29 pins available. Besides the discs/pins mentioned above some
additional tests were carried out on another disc to decide the test parameters like speed and
duration of the test before running the actual test.
The tests are varying three parameters: load, speed and temperature. Two measurements at each
combination were performed to verify the results. The first set of tests is designed to evaluate the
influence of speed on wear. Two measurements at 3 m/s and at 11 m/s were performed. The
diameter of wear track is Ø30 and Ø48 mm for 3 m/s test and Ø110 mm for 11 m/s.
The second set of tests evaluated the influence of load on wear. The first setup of tests uses the
load of 0.2 kg. The second setup perform additional tests at 0.9 kg load. Measurements at 3 m/s
were performed at diameter Ø30 and Ø48 mm and the 11 m/s were carried out at Ø110 mm
diameter. The third set of tests evaluated the influence of temperature on wear and friction. There
performed measurements at every load and speed that is mentioned above but the discs are heated
up to 300 °C.
Figure 9. Example of wear tracks on disc surfaces.
The tests resulted in 2 loads at 2 speeds at 2 different temperatures. There were 2 or more
measurement at each combination to verify the result. The result consists of a total of 19
measurements, which can verify the influence of each parameter on wear and friction.
3.3 Test parameters
Calculations are performed to get the sliding conditions of the contact between shaft and sealing
rings in the actual turbocharger. These are then compared with the possibilities of the tribological
equipment. The decision of the test conditions for tribological experiments is made to replicate the
conditions of the turbocharger as much as possible in laboratory environment. The parameters are
contact pressure, relative speed and distance.
Contact pressure
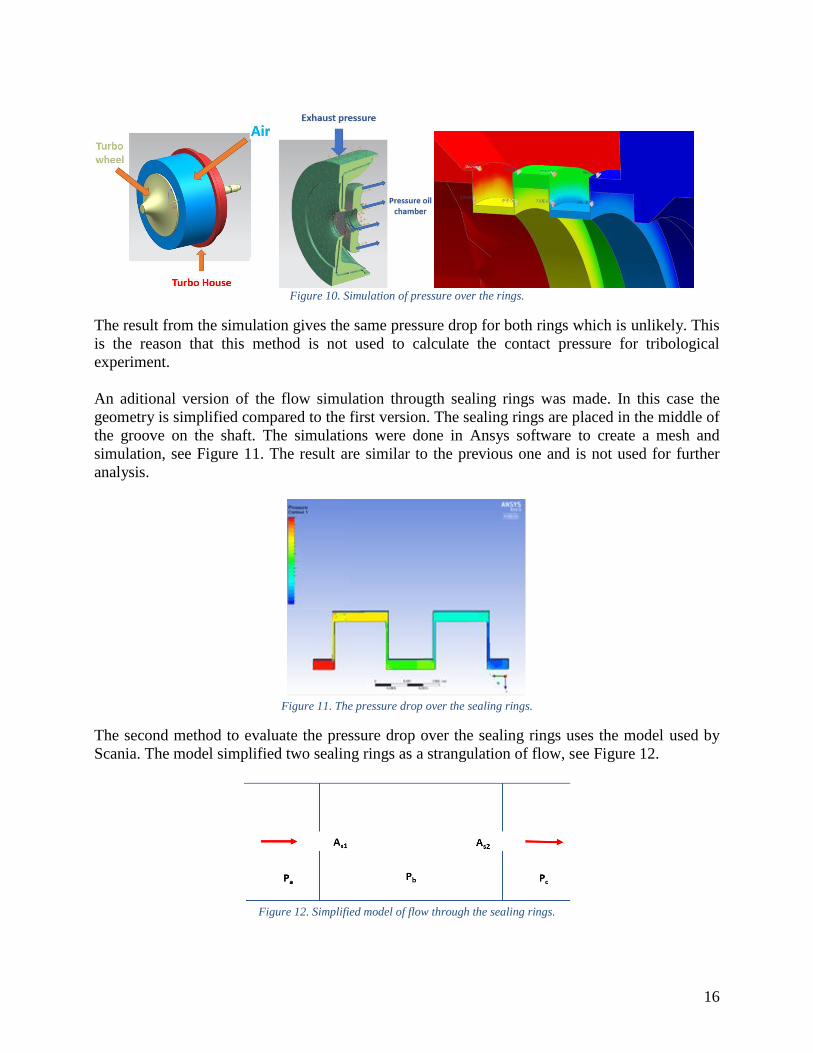
There are several methods used to calculate the pressure drop over the sealing rings. The first
method is to simulate the flow that goes through the rings. During the project a CAD model of the
turbocharger was created in the CAD software Siemens NX. The dimension is taken from the
turbocharger commonly used in trucks.
A variable mesh of air that surrounds the component of turbo was generated. The air is marked
blue in Figure 10. The simulation needs some estimations to create the solution. It is decided that
the is no rotation of the turbocharger and air is an ideal gas at temperature 300°C. The boundary
condition is the pressure drop of 6 bar between exhaust side and the oil chamber. The sealing ring
is mounted 10 µm from the surface of the shaft where the wear of sealing ring occurs.
16
Figure 10. Simulation of pressure over the rings.
The result from the simulation gives the same pressure drop for both rings which is unlikely. This
is the reason that this method is not used to calculate the contact pressure for tribological
experiment.
An aditional version of the flow simulation througth sealing rings was made. In this case the
geometry is simplified compared to the first version. The sealing rings are placed in the middle of
the groove on the shaft. The simulations were done in Ansys software to create a mesh and
simulation, see Figure 11. The result are similar to the previous one and is not used for further
analysis.
Figure 11. The pressure drop over the sealing rings.
The second method to evaluate the pressure drop over the sealing rings uses the model used by
Scania. The model simplified two sealing rings as a strangulation of flow, see Figure 12.
Figure 12. Simplified model of flow through the sealing rings.

17
The calculation gives the pressure difference over sealing ring of 2.7 and 3.8 bar over the outer and
inner sealing ring respectively where the pressure drop is 6 bar over both sealing rings.
The second step is calculation of contact pressure. The pressure drop over ring is not the same as
the contact pressure because of geometry. This pressure drop 𝑃1 applies over area 𝐴1 of the sealing
ring and generates the force 𝐹1. The shaft is preventing the sealing movement and generate the
pressure 𝑃2 over the area 𝐴2 which generates the force 𝐹2, which resist force 𝐹1, see Figure 13. The
pressure 𝑃2 is the contact pressure of two surfaces in the tribological experiment.
Figure 13. Cutting section of sealing ring mounted in place.
The equilibrium between forces 𝐹1 = 𝐹2 gives the equation of contact pressure 𝑃2 dependency on
pressure drop 𝑃1 over the sealing ring:
𝑃2 =𝐴1 ∗ 𝑃1
𝐴2=
𝐴1
𝐴2∗ 𝑃1
Measurements of the inner- and outer diameters of the new ring mounted in a turbo house were
taken. This gives an expression for the area A1:
𝐴1 = (𝐷𝑜𝑢𝑡2 − 𝐷𝑖𝑛
2 ) ∗ 𝜋/4
where 𝐷𝑜𝑢𝑡 is outside diameter and 𝐷𝑖𝑛 is the inside diameter of the mounted ring. The area A2 is
calculated from the wear diameter 𝐷𝑤𝑒𝑎𝑟
𝐴2 = (𝐷𝑤𝑒𝑎𝑟2 − 𝐷𝑖𝑛
2 ) ∗ 𝜋/4
The wear diameter 𝐷𝑤𝑒𝑎𝑟 is taken from measurement of surface topography where the width of the
wear track on the sealing ring can be measured. This results in:
𝑃2 =(𝐷𝑜𝑢𝑡
2 − 𝐷𝑖𝑛2 ) ∗ 𝜋/4
(𝐷𝑤𝑒𝑎𝑟2 − 𝐷𝑖𝑛
2 ) ∗ 𝜋/4∗ 𝑃1 =
𝐷𝑜𝑢𝑡2 − 𝐷𝑖𝑛
2
𝐷𝑤𝑒𝑎𝑟2 − 𝐷𝑖𝑛
2 ∗ 𝑃1
The equations above give the influence of geometry to the difference between pressure drop over
the sealing ring and the actual contact pressure between sealing ring and shaft.
In the tribological tests, the minimum contact pressure is given by the lowest dead weight that is
available which is 0.2 kg. The second weight is 0.9 kg which corresponds to a pressure drop over
the sealing ring of 15 bar.

18
Sliding speed
There are two relative speeds used in tribotests. The tribological test machine TE67 can run up to
2000 rpm. The disc, which is used in these tests, have a diameter of Ø120 mm. The maximum
diameter for placing a pin on disc is settled to Ø110 mm. The minimum diameter of the wear track
is 30 mm. The highest achievable relative speed between two surfaces at minimum diameter is:
𝑆𝑝𝑒𝑒𝑑 = 2𝜋𝑟 ∗ 𝑅𝑃𝑀 = 2𝜋 ∗ 15 𝑚𝑚 ∗ 2000 𝑅𝑃𝑀 ≈ 314𝑚
𝑚𝑖𝑛≈ 3 𝑚/𝑠
The highest relative speed achieved if pin placed on the highest radius of Ø110 mm:
𝑆𝑝𝑒𝑒𝑑 = 2𝜋 ∗ 110 𝑚𝑚 ∗ 2000 𝑅𝑃𝑀 ≈ 11 𝑚/𝑠
The relative speed at which the sealing ring slide against the turbo shaft in the turbocharger is
calculated for 80000 RPM:
𝑆𝑝𝑒𝑒𝑑 = 2𝜋𝑟 ∗ 𝑅𝑃𝑀 = 2𝜋 ∗ 10𝑒−3 ∗ 80000 ≈ 5000𝑚
𝑚𝑖𝑛≈ 84 𝑚/𝑠
Sliding distance
Different sliding distances were evaluated to decide the sliding distance for tribological test. The
trial tests showed that the pin can withstand 6000 m at high wear rate and be long enough distance
to produce a measurable wear. That lead to a conclusion of the total sliding distance of 6000 meters.
The sliding distance of 6000 meters for an engine correspond to a 20 minutes’ drive if the engine
is operating at 1200 RPM and 30% engine load.
3.4 Test procedures
Preparation before tribological test.
The pins are cleaned in industrial petrol in an ultrasonic cleaner, rinsed with acetone and dried. The
discs are wiped with paper rinsed with acetone before mounting them in place. A dial gauge is used
to level the disc by placing shims under the disc. The calibration allowed the fluctuation up to 1
µm of outer radius of the disc, see Figure 14. The discs are additionally wiped with acetone before
a test.
Figure 14. Levelling of disc before test.
There are two friction sensors available. The first sensor is designed to take loads up to 100 N and
the second one takes 5 kg (49 N). The second sensor is used during the tests because the friction
forces do not exceed the load limit. The sensor is more sensitive at the chosen loads, which results
19
in more accurate data. The friction force is calibrated with a dead weight of 2020 gram which is
supposed to represent the double of friction force generated during the test.
A thermocouple of type K was used to calibrate the pyrometer, which is used to heat the test
specimens during the tribological tests. The calibration is performed at 300 °C. The thermocouple
was placed on top of the disc surface to get reading of the temperature which the pyrometer is
calibrated to.
The disc is rotated at 120 RPM during the heating. The heater delivers a 600 °C inlet air until the
pyrometer reaches the reading of 300 °C. After this, the pin is lowered and loaded against the disc
to perform the high temperature tests.
3.5 Microstructural analysis
The equipment that have been used to analyse the worn turbocharger components (sealing rings
and shafts) and the test specimens from the tribological tests are presented in this chapter.
Descriptions about the function of these apparatus and how the turbocharger components were
prepared for these analyses are presented below.
3D surface profilometry
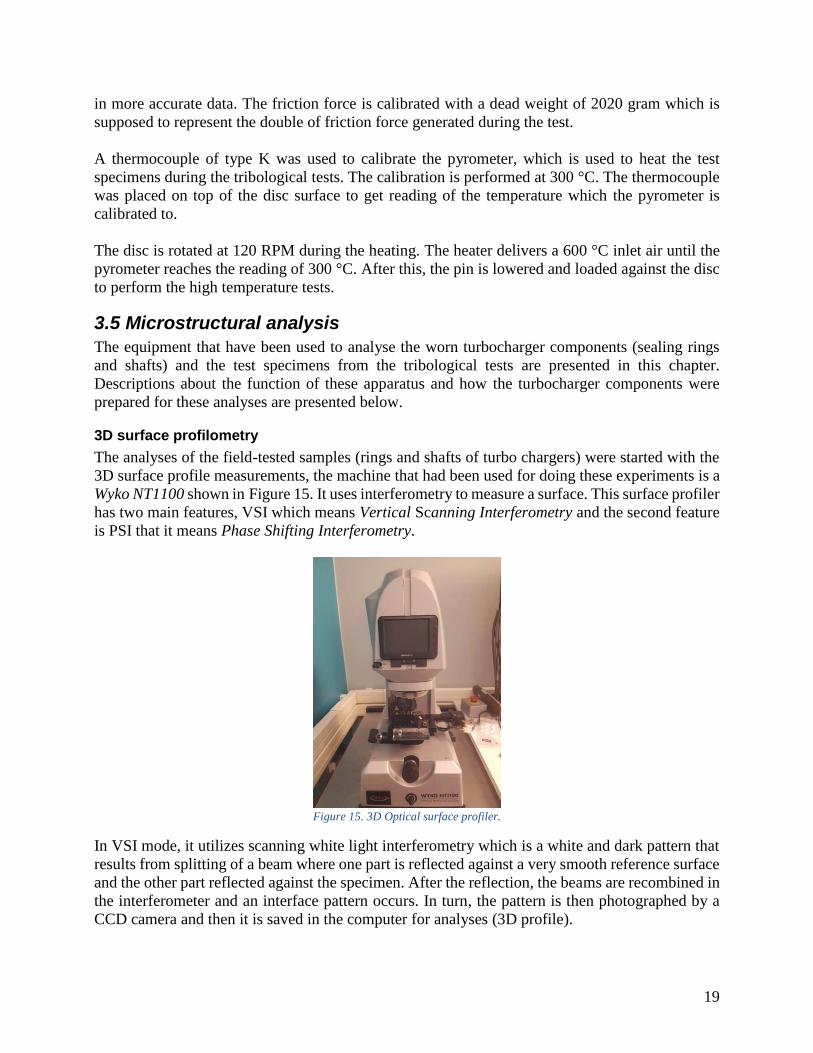
The analyses of the field-tested samples (rings and shafts of turbo chargers) were started with the
3D surface profile measurements, the machine that had been used for doing these experiments is a
Wyko NT1100 shown in Figure 15. It uses interferometry to measure a surface. This surface profiler
has two main features, VSI which means Vertical Scanning Interferometry and the second feature
is PSI that it means Phase Shifting Interferometry.
Figure 15. 3D Optical surface profiler.
In VSI mode, it utilizes scanning white light interferometry which is a white and dark pattern that
results from splitting of a beam where one part is reflected against a very smooth reference surface
and the other part reflected against the specimen. After the reflection, the beams are recombined in
the interferometer and an interface pattern occurs. In turn, the pattern is then photographed by a
CCD camera and then it is saved in the computer for analyses (3D profile).
20
PSI mode, is like the VSI mode but it uses filtered light and the reference surface is translated
instead of the objective. It also uses the difference in intensity instead of fringes for height data
acquisition. The data that is acquired is then used to generate a 3D image for the surface. The
computer software Vision 32 enable advanced calculations of various surface parameters and
image processing.
Light optical microscope (LOM)
The analysis of the samples were continued with the Light Optical Microscope LOM, the analyses
of the worn surfaces of rings and shafts that had been sliding against each other were analysed to
get an overview of the surface damage and potentially see if there were any lubricant residues
between these sliding surfaces of the samples.
The light optical microscope, is a microscope which uses visible light and a system of lenses to
magnify the images of the samples. The image of the samples from an optical microscope can be
captured by normal light sensitive cameras to generate a micrograph. A micrograph is a digital
image taken trough microscope to show a magnified image.
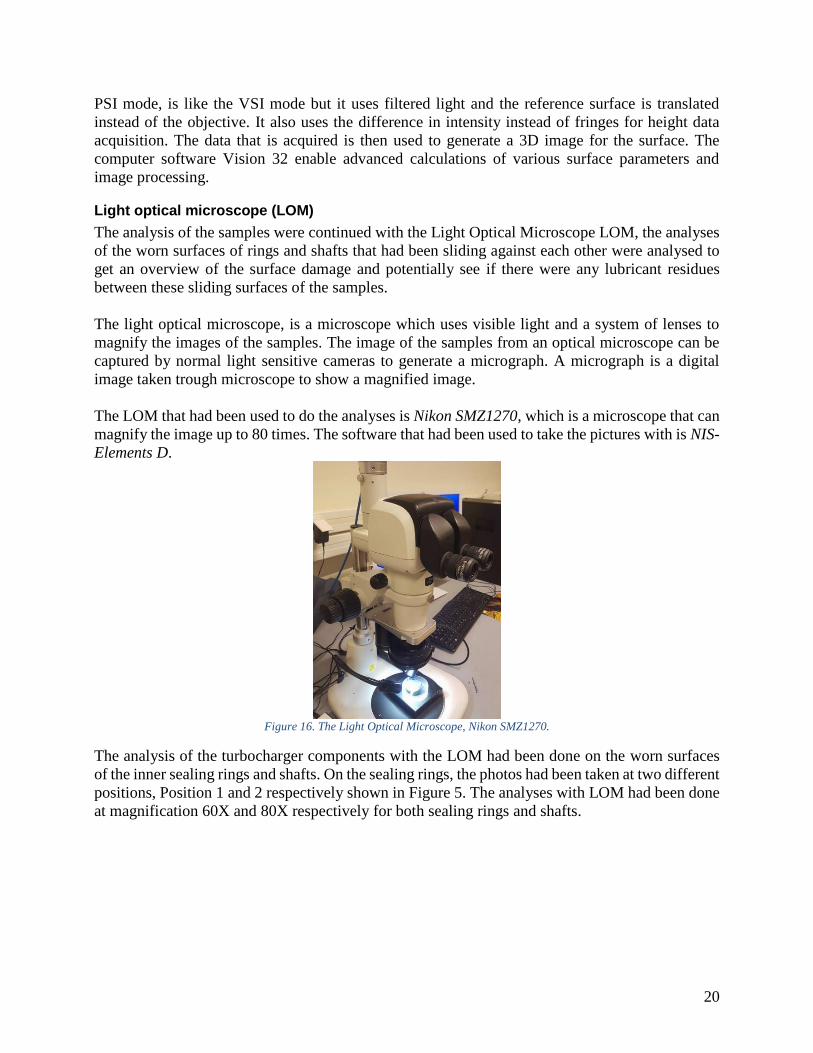
The LOM that had been used to do the analyses is Nikon SMZ1270, which is a microscope that can
magnify the image up to 80 times. The software that had been used to take the pictures with is NIS-
Elements D.
Figure 16. The Light Optical Microscope, Nikon SMZ1270.
The analysis of the turbocharger components with the LOM had been done on the worn surfaces
of the inner sealing rings and shafts. On the sealing rings, the photos had been taken at two different
positions, Position 1 and 2 respectively shown in Figure 5. The analyses with LOM had been done
at magnification 60X and 80X respectively for both sealing rings and shafts.

21
Vickers hardness testing The hardness is a characteristic of a material, hardness is defined as the resistance of the material
to indentation and is determined by measuring the depth of indentation.
The hardness tests of the specimens was done with a microhardness tester, the hardness tester is
shown in Figure 17. A fixed force (load) and a given indenter is used and the smaller the indentation
the harder the material.
Figure 17. Microhardness tester.
The Vickers hardness tester is based on an optical measurement system. The test procedure,
specifies a range of light loads using a diamond indenter, a square base pyramid shaped diamond
is used for testing in the Vickers scale.
The indentations were measured using an optical microscope with a digital camera and then the
area that was measured with help of the computer software had automatically been converted by
the software to the hardness value (HV). The test indentation is very small for Vickers tests.
The microhardness tester has a range of load from 10g up to 1000g. The software that was used to
measure the hardness is OmniMet (Manual Microindetation Hardness testing). The load that was
used during the hardness measurements for turbocharger components was 10 grams and the
distance between the hardness measurements across the cross-section of the samples was 10 µm.
The hardness measurements had been repeated three times at each depth under the surface of the
samples and the mean value was calculated as the hardness of the material at respectively depth.

22
Scanning Electron Microscope.
SEM is an abbreviation for Scanning Electron Microscope. The optical microscope uses the light
to create an image. The SEM use electrons to create an image.
The electron gun generates the electron beam inside the SEM. The beam first passes through the
anode to attract the electrons towards the specimen. Some electrons will be absorbed by the anode,
but remaining electrons will have a velocity and direction towards specimen. The beam has a
direction, but it is not focused. The light microscope uses lenses to focus the light. The electrons
cannot pass a lens and they are instead moved by a magnetic field. There are two magnetic fields
that adjust the electron beam in different directions this is called stigma. By changing the stigma,
the magnetic field is changed which adjusts the beam. Then the electron beam passes through the
objective lens to focus the beam at specific point at specimen surface, see Figure 18 a).
Figure 18. Scanning Electron Microscope.
When the beam reaches the surface, it excites the specimen’s electrons to generate secondary
electrons, backscatter electrons and X-rays. Secondary electrons have lower energy and they are
closer to the surface than backscatter electrons. Electrons that penetrate the surface deep enough,
so they cannot be reflected, release the energy by creating x-ray, see Figure 18 b).
The secondary and backscatter electrons are used to create an image. X-ray electrons are used to
perform EDS analyse, which show the atomic content of the sample material. The result of SEM
and EDS analyse is used to analyse the rings, shafts and tribological specimens in this project.
Analysis of tribological specimens.
The pins were weighed five times each to get the average weight before and after the test. The
difference between measurements show the weight loss of the pins during the test. The discs cannot
be weighed because they exceed the total mass of 200 grams, which is the limit of the semi-
microelectronic weighing balance.
The wear of the discs were evaluated by 3D optical profile measurements instead. The 3D optical
profile is taken at four different points at the wear track. It is taken five to six measurements across
the wear track.
a b

23
Figure 19. Example of wear measurement across discs wear track.
The values that comes from measurement is recalculated to get the wear depth at each point. The
evaluation subtracts the geometrical triangle above the wear track to get the depth value. The
triangle is marked orange in Figure 20 a). When the depth at each point is calculated the average
depth at each radius is taken. In other words, one blue point on Figure 20 b) is average of four
measurements along the wear track.
Figure 20. Calculation of disc wear.
The curve is fitted through measured values. The function of the curve is integrated to get the worn
area. The area is multiplied with wear tracks circumference and density of material to get the mass
loss of the disc. The result gives the possibility to compare the wear between soft and hard material
involved in the tribological experiment.
Data analysis
The data provided by Scania was analysed to find correlation between the working conditions of
the trucks and wear of sealing rings. Due to the big scatter in the working conditions a filter is
added to find the trucks with similar load conditions. There is data available on load and RPM
conditions of the engine. The parameters which are analysed are mileage, number of km in high
load, number of km during exhaust brake and number of gearshifts. After filtering, only mileage
was used to find correlation with wear.
b a

24
4. Results and discussion
4.1 Wear and failure analysis of turbocharger components
4.1.1 LOM analysis of turbocharger components
The analysis of turbocharger components was started with the new ring and shaft. The surfaces that
were analysed are the surfaces of the inner sealing ring that is in contact with the surface of the
shaft. The surfaces of the new shaft and sealing ring are shown in Figure 21. Grooves on the shaft
surface are from the machining of the component. The surface of the new sealing ring does not
have any grooves and presented a smooth surface which appeared to be polished to a surface texture
without orientation.
Figure 21. Illustrates the surface of the new sealing ring and shaft at magnification 80X.
25
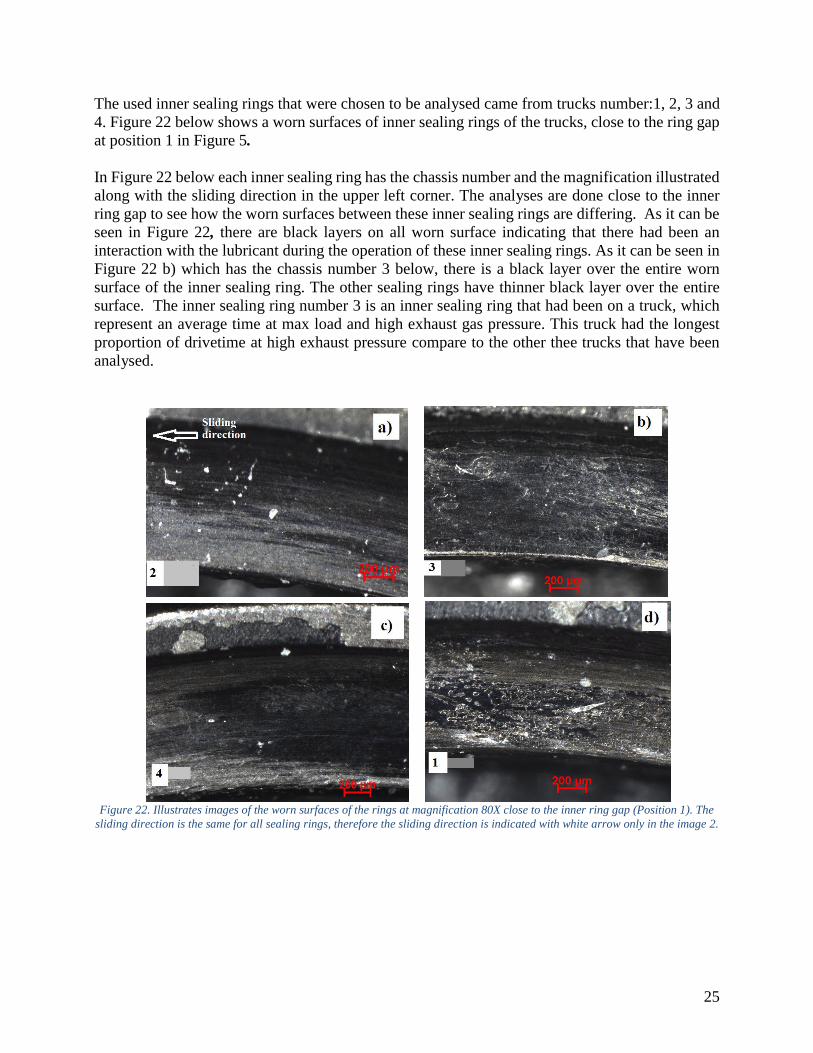
The used inner sealing rings that were chosen to be analysed came from trucks number:1, 2, 3 and
4. Figure 22 below shows a worn surfaces of inner sealing rings of the trucks, close to the ring gap
at position 1 in Figure 5.
In Figure 22 below each inner sealing ring has the chassis number and the magnification illustrated
along with the sliding direction in the upper left corner. The analyses are done close to the inner
ring gap to see how the worn surfaces between these inner sealing rings are differing. As it can be
seen in Figure 22, there are black layers on all worn surface indicating that there had been an
interaction with the lubricant during the operation of these inner sealing rings. As it can be seen in
Figure 22 b) which has the chassis number 3 below, there is a black layer over the entire worn
surface of the inner sealing ring. The other sealing rings have thinner black layer over the entire
surface. The inner sealing ring number 3 is an inner sealing ring that had been on a truck, which
represent an average time at max load and high exhaust gas pressure. This truck had the longest
proportion of drivetime at high exhaust pressure compare to the other thee trucks that have been
analysed.
b
Figure 22. Illustrates images of the worn surfaces of the rings at magnification 80X close to the inner ring gap (Position 1). The
sliding direction is the same for all sealing rings, therefore the sliding direction is indicated with white arrow only in the image 2.
26
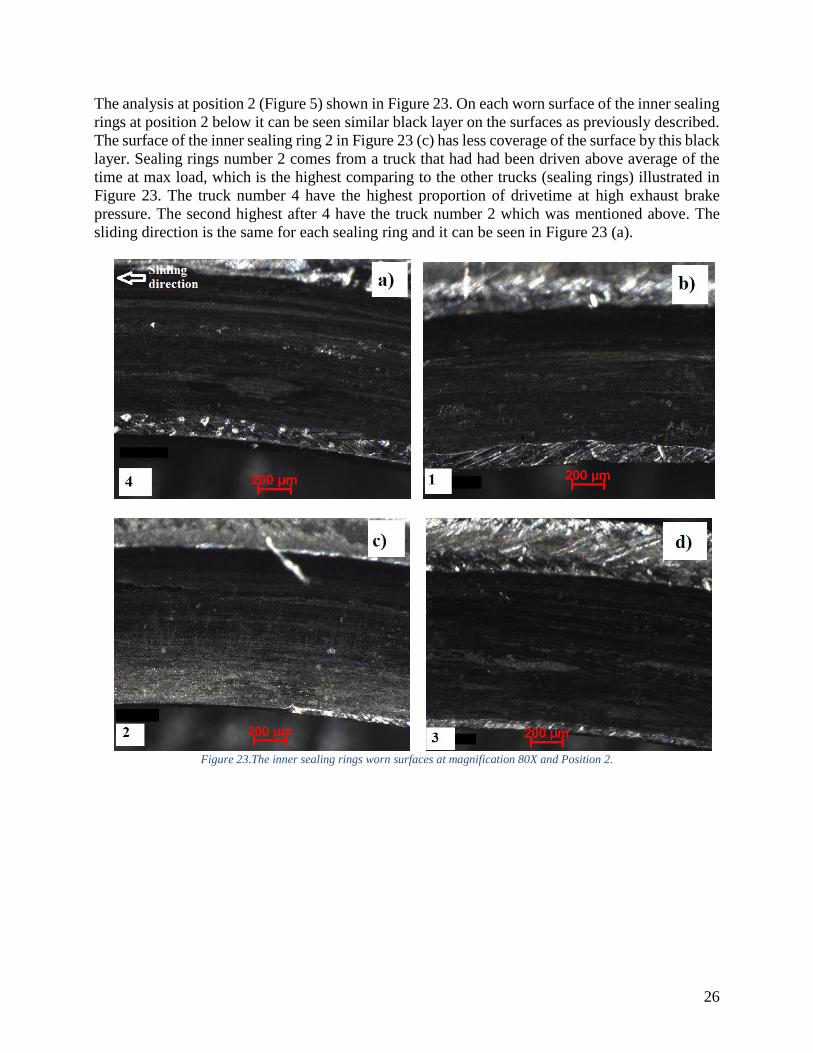
The analysis at position 2 (Figure 5) shown in Figure 23. On each worn surface of the inner sealing
rings at position 2 below it can be seen similar black layer on the surfaces as previously described.
The surface of the inner sealing ring 2 in Figure 23 (c) has less coverage of the surface by this black
layer. Sealing rings number 2 comes from a truck that had had been driven above average of the
time at max load, which is the highest comparing to the other trucks (sealing rings) illustrated in
Figure 23. The truck number 4 have the highest proportion of drivetime at high exhaust brake
pressure. The second highest after 4 have the truck number 2 which was mentioned above. The
sliding direction is the same for each sealing ring and it can be seen in Figure 23 (a).
Figure 23.The inner sealing rings worn surfaces at magnification 80X and Position 2.
27
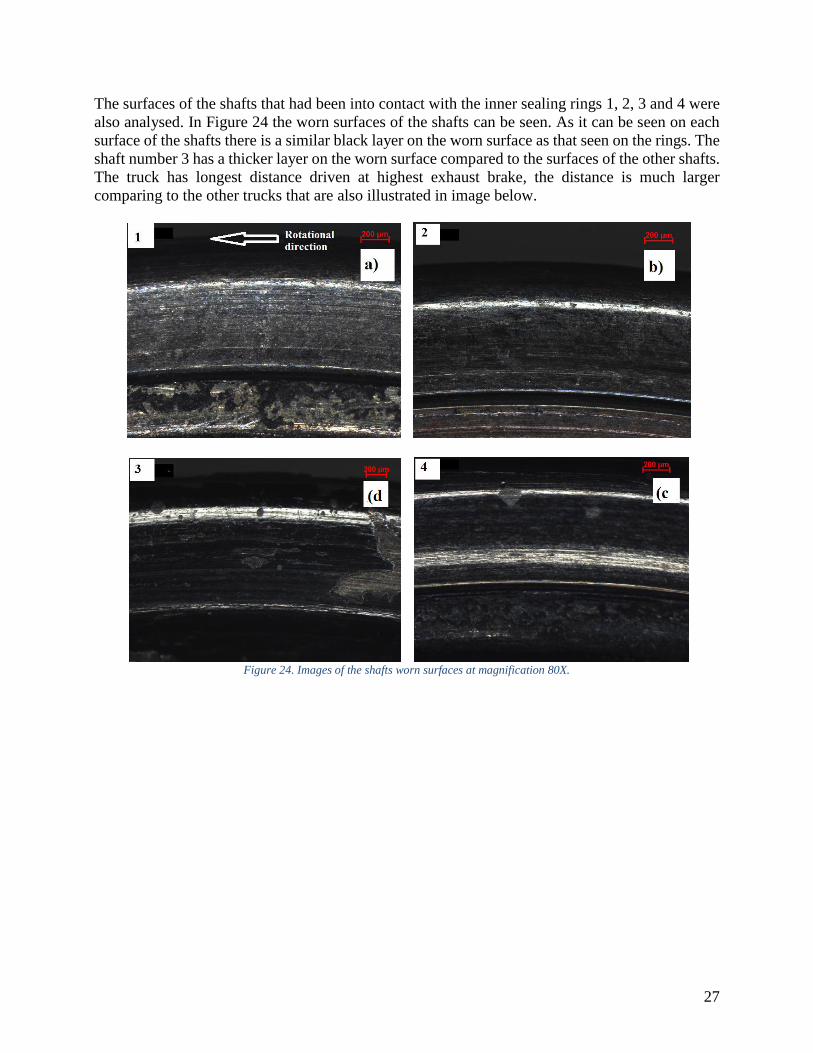
The surfaces of the shafts that had been into contact with the inner sealing rings 1, 2, 3 and 4 were
also analysed. In Figure 24 the worn surfaces of the shafts can be seen. As it can be seen on each
surface of the shafts there is a similar black layer on the worn surface as that seen on the rings. The
shaft number 3 has a thicker layer on the worn surface compared to the surfaces of the other shafts.
The truck has longest distance driven at highest exhaust brake, the distance is much larger
comparing to the other trucks that are also illustrated in image below.
Figure 24. Images of the shafts worn surfaces at magnification 80X.

28
4.1.2 3D surface profile analysis
The 3D profile images had first been taken on the surfaces of the new shaft and ring and the surface
roughness Sa was first calculated for the surface of the new ring. The measurements had been done
at four different points on the surface and then the mean value of these measurements had been
chosen as the Sa of the new sealing ring surface and the shafts. The 3D surface profile images were
taken at magnification 10X and 20X respectively for both sealing rings and shafts. In Figure 25,
the 3D profile images of the new sealing ring at magnification 10X and 20X are shown respectively.
The smooth surface with random surface orientation can clearly be seen. The mean value of the
surface roughness of the new sealing ring at magnification 10X and 20X respectively were:
- Roughness of the new sealing ring surface at magnification 10X: 𝑅𝑎 = 390 𝑛𝑚. The
standard deviation STDEV is 1.2754.
- Roughness of the new sealing ring surface at magnification 20X: 𝑅𝑎 = 510 𝑛𝑚. The
standard deviation STDEV 1.5259.
Figure 25. 3D surface profile images of the new sealing ring.
The machining marks on the new shaft surface is shown in Figure 26 and the mean value of the
surface roughness Ra of the new shaft were:
- Roughness of the new shaft surface at magnification 10X: 𝑅𝑎 = 630 𝑛𝑚. The standard
deviation STDEV is 1.354.
- Roughness of the new shaft surface at magnification 20 X:𝑅𝑎 = 600 𝑛𝑚. The standard
deviation STDEV is 1.285.
Figure 26. Illustrates the 3D surface profile of the new shaft surface at magnification 10X and 20X.

29
The 3D surface profile analyses of the worn surfaces was started with the surfaces of inner sealing
rings at position 1 close to the ring gap. The red arrow in each image illustrates the sliding direction.
As shown in Figure 27, the surfaces of the inner sealing rings had been worn more in the middle
of the surface and had a shape that is more concave. The concave shape is probably due to the
geometry of the inner sealing ring and shaft grooves and also due to the high pressure and friction
generation between the sliding surfaces.
There was only one ring that had been worn different, the inner sealing ring from truck number 1,
has a worn surface that was more flat comparing to the other inner sealing surfaces which had been
analysed. The truck number 1 had been less exposed to max load and even exhaust brake pressure
comparing to the other three inner sealing rings that are illustrated in Figure 27. The inner sealing
ring from truck number 2 got the most concave shape perpendicular to the sliding direction. The
truck has the longest time at max load comparing to the other sealing rings that are illustrated
below.
Figure 27. The 3D surface profile images of the rings at Position 1 and magnification 10X.

30
The 3D surface profile analysis was also done at magnification 20X. At this magnification, some
grooves that are parallel to the sliding direction can be seen, these grooves can be seen in image
that has the chassis number 1 up to left. The presence of these grooves on the worn surfaces of the
sealing rings can indicate that there had been debris or hard abrasive particles between the sliding
surfaces of the sealing rings and shafts during the operation. In Figure 28, the surfaces of the inner
sealing rings at position 1 and magnification 20X are shown.
Figure 28. Rings 3D surface profile at Position 1 and magnification 20X.

31
The 3D surface profiles of the inner sealing rings at Position 2 and magnification 10X is shown in
Figure 29. The surfaces at this position had mainly been worn in the same way as at Position 1. At
this position, there were also some grooves on the worn surfaces of the sealing rings that are parallel
to the sliding direction (red arrow), at magnification 20X the grooves can better be seen.
Figure 29. Surface profile images at magnification 10X and Position 2 on the worn surfaces of the inner sealing ring.

32
The 3D surface profile analyses of the inner sealing rings in Figure 30 below had as well been done
at magnification 20X at position 2. At this magnification, the grooves on the worn surfaces can be
more clearly seen. The biggest and deepest grooves on the worn surface can be seen in image that
has the truck number 1.
Figure 30. 3D surface profiles at magnification 20X and Position 2 on the worn surfaces of inner sealing rings, the chassis
number is up to the left in each image and the red arrow shows the sliding direction.

33
3D surface profile analysis of worn surfaces of shafts that had been into contact with the worn
surfaces of the inner sealing rings is shown below. The shafts which were analyzed have the same
number as the inner sealing rings that were described above. The shafts are illustrated in Figure 31
below. The red arrows in each figure illustrates the rotational direction of the shaft. In Figure 31,
it can be seen, the worn surfaces of the shafts have a convex shape perpendicular to the rotational
direction which corresponds to the inverse shape of the sealing ring counter surface, which means
that the contact between the worn surfaces of the inner sealing rings and shafts was conformal
during the operation. The shaft number 1 has a flatter worn surface than the other shafts, as well
the inner sealing ring from truck number 1 has a flatter surface perpendicular to the sliding
direction. As it was mentioned before the truck number 1 comes from Netherlands and had been
less driven at max load and high exhaust brake pressure than the other trucks that are illustrated in
Figure 31 below.
Figure 31. Illustrates the 3D surface topography of the shafts at magnification 10X.
34
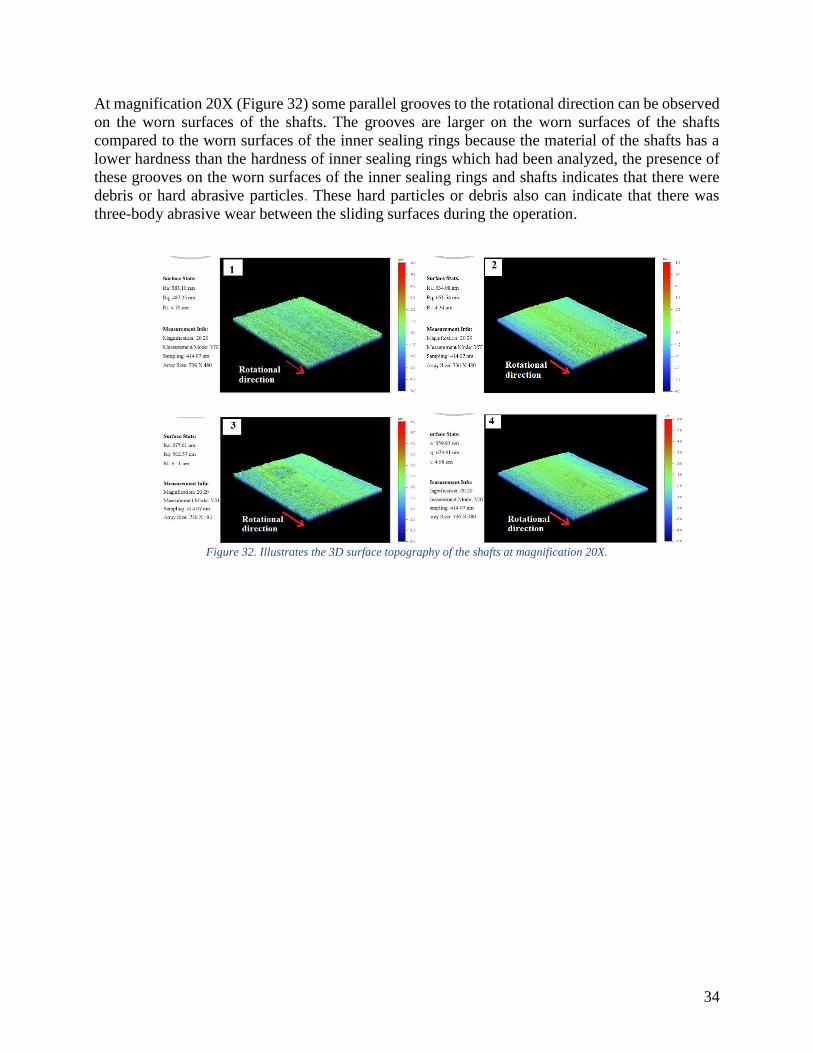
At magnification 20X (Figure 32) some parallel grooves to the rotational direction can be observed
on the worn surfaces of the shafts. The grooves are larger on the worn surfaces of the shafts
compared to the worn surfaces of the inner sealing rings because the material of the shafts has a
lower hardness than the hardness of inner sealing rings which had been analyzed, the presence of
these grooves on the worn surfaces of the inner sealing rings and shafts indicates that there were
debris or hard abrasive particles. These hard particles or debris also can indicate that there was
three-body abrasive wear between the sliding surfaces during the operation.
Figure 32. Illustrates the 3D surface topography of the shafts at magnification 20X.
35
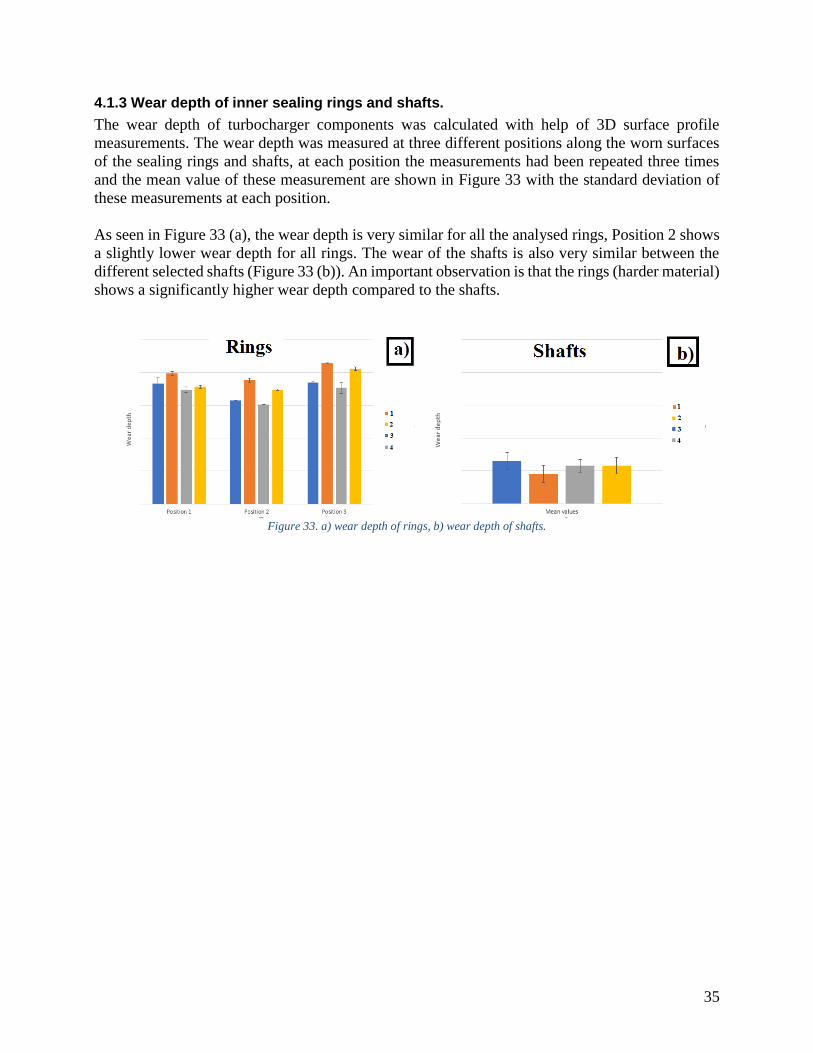
4.1.3 Wear depth of inner sealing rings and shafts.
The wear depth of turbocharger components was calculated with help of 3D surface profile
measurements. The wear depth was measured at three different positions along the worn surfaces
of the sealing rings and shafts, at each position the measurements had been repeated three times
and the mean value of these measurement are shown in Figure 33 with the standard deviation of
these measurements at each position.
As seen in Figure 33 (a), the wear depth is very similar for all the analysed rings, Position 2 shows
a slightly lower wear depth for all rings. The wear of the shafts is also very similar between the
different selected shafts (Figure 33 (b)). An important observation is that the rings (harder material)
shows a significantly higher wear depth compared to the shafts.
Figure 33. a) wear depth of rings, b) wear depth of shafts.

36
4.1.4 Hardness of new samples
The hardness of new sealing ring and shaft is shown in Figure 34. The measurements were taken
along the cross-section of the sealing rings and shafts, the measurements had been repeated three
times at each depth and the mean value and standard deviation of each measurement are shown in
Figure 34.
As it can be seen the hardness of the new sealing ring has a hardness value around 660 𝐻𝑉0.01 just
below the surface and decreases to a constant hardness value around 630 𝐻𝑉0.01 at a depth of
approximately 60 µm. The new shaft has the hardness value around 416 𝐻𝑉0.01 along the cross-
section. As it can be seen in Figure 34, the hardness measurements were started at 10 µm under the
surfaces of the new samples and been continued until the hardness values became constant. The
positions where the hardness measurements had been done can be seen in Figure 6 where the
positions are marked with 1, 2, 3 and 4 respectively. More details and measurement values can be
found in Appendix E.
Figure 34. Hardness values of the new samples.
350
400
450
500
550
600
650
700
750
800
0 20 40 60 80 100
Har
ne
ss H
V0.
01
Depth [µm]
New shaft and New sealing ringNew Saft New sealing ring

37
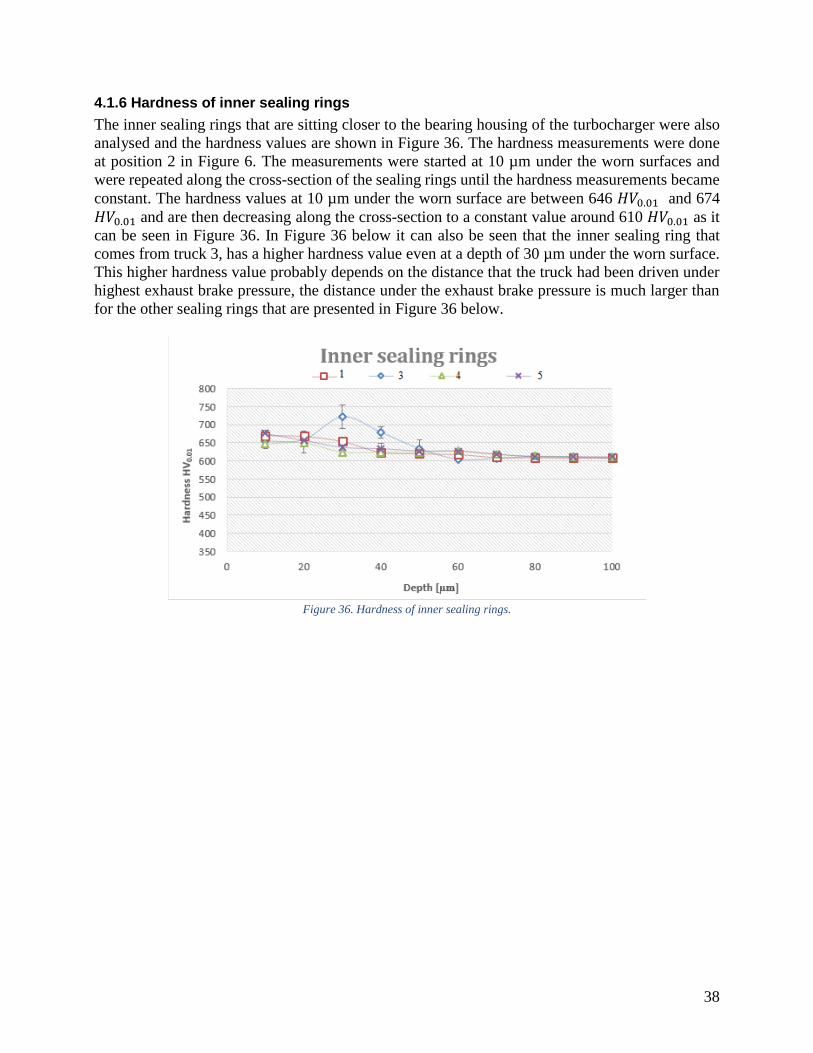
4.1.5 Hardness of used shafts
The hardness measurements were taken on the turbocharger shafts that come from trucks: 1, 3, 4
and 5. The hardness measurements on the shafts had been done at the positions that are marked
with 1 in Figure 6. The hardness values of the shafts at 10 μm under the worn surfaces varies
between 435 and 460 𝐻𝑉0.01 and these values are decreasing along the cross-section to a constant
value around 416 𝐻𝑉0.01 as it can be seen in Figure 35. The hardness measurements show that there
are not big differences in the hardness between the shafts that were compared in Figure 35. Mainly
it can be seen that the hardness had a little increased close to the surface that had been worn, the
hardness of the shafts had probably increased directly under the worn surfaces due to deformation
hardening during the wear process.
Figure 35. Hardness of used shafts.
38
4.1.6 Hardness of inner sealing rings
The inner sealing rings that are sitting closer to the bearing housing of the turbocharger were also
analysed and the hardness values are shown in Figure 36. The hardness measurements were done
at position 2 in Figure 6. The measurements were started at 10 µm under the worn surfaces and
were repeated along the cross-section of the sealing rings until the hardness measurements became
constant. The hardness values at 10 µm under the worn surface are between 646 𝐻𝑉0.01 and 674
𝐻𝑉0.01 and are then decreasing along the cross-section to a constant value around 610 𝐻𝑉0.01 as it
can be seen in Figure 36. In Figure 36 below it can also be seen that the inner sealing ring that
comes from truck 3, has a higher hardness value even at a depth of 30 µm under the worn surface.
This higher hardness value probably depends on the distance that the truck had been driven under
highest exhaust brake pressure, the distance under the exhaust brake pressure is much larger than
for the other sealing rings that are presented in Figure 36 below.
Figure 36. Hardness of inner sealing rings.

39
4.1.7 Hardness of outer sealing rings (in contact with shaft surfaces)
Figure 37 shows the hardness measurements of the outer sealing rings that were analysed. The
hardness measurements started from the surfaces that had been in contact with shafts, the position
is marked with 3 in Figure 6. In Figure 37, the hardness at 10 µm under the surfaces of the sealing
rings is between 691 𝐻𝑉0.01 and 770 𝐻𝑉0.01 and decrease until a constant value 680 𝐻𝑉0.01 along
the cross section of the rings, a part of one of the rings, ring number 3 there the hardness values
across the cross-section is around 625 𝐻𝑉0.01, the hardness measurements values can be seen in
Figure 37. As it can be seen in Figure 37 below, the hardness of outer sealing ring from truck
number 4 is higher comparing to the hardness of the other outer sealing rings in the graph. The
truck that has the number 4 comes from a truck that was used in Germany, from truck analyses it
can be seen that the inner sealing ring of the turbocharger that had been used on truck number 4
had the largest wear depth of inner sealing ring, probably the outer sealing ring had relaxed, and
the exhaust pressure had directly pressed on the inner sealing ring and influenced the wear. This is
most likely due to the high exhaust gas temperature that the outer sealing rings relaxes and then the
outer sealing rings cools down quick by the air, metals that are cooling down quick gets harder and
more brittle, thereof a higher hardness.
Figure 37. Illustrates the hardness of the outer sealing rings from the surface that had been in contact to the shafts, which it can
be seen in Figure 6 at position that’s marked with 3.

40
4.1.8 Hardness of outer sealing rings (from exhaust gases side)
The hardness of the outer sealing rings was measured on the exhaust gases side as it can be seen in
Figure 6, position marked with 4. The hardness of the samples is illustrated in Figure 38 where the
hardness values are between 740 𝐻𝑉0.01 and 772 𝐻𝑉0.01 at 10 µm under the surface and continues
to decrease along the cross-section of the sealing rings to a constant value around 660 and 670
𝐻𝑉0.01. Only one outer sealing ring from truck number 3 has a hardness value of 614 𝐻𝑉0.01 at 10
µm under the surface and then the hardness values of it are increasing across the cross-section to a
value around 660 𝐻𝑉0.01. The lower hardness of the outer sealing ring 3 it is probably that the truck
that has this chassis number had been longest driven at this highest exhaust pressure, comparing to
the other sealing rings that had been analysed.
Figure 38. Hardness of outer sealing rings (from exhaust gases side).

41
4.1.9 SEM analysis of worn inner sealing rings
SEM analysis was performed on the worn surfaces of sealing rings and shafts at positions 1 and 2
as shown in Figure 5. The first inner sealing ring that had been analysed come from truck number
6. In Figure 39 (a), close to the ring gap, there are signs of a patchy layer on the worn surface.
Figure 39 (b) is a high magnification of (a) and cracks can be seen along the middle of the worn
surface of the sealing ring. The cracks are perpendicular to the sliding direction. The presence of
the cracks shows that there were high shear stresses, probably due to the high friction generation
between the sliding surfaces of the sealing ring and shaft.
The cracks can also indicate the presence of a thermal fatigue wear mechanism. Thermal fatigue
cracking of surfaces results from the rapid alternations in temperature, which may induce stresses
high enough to impose an increase of plastic strain in the sealing ring surface [32]. Figure 39 (c)
and (d) shows that the cracks are 20 to 30 µm long. Some small particles that had been flattered
down on the worn surface of the sealing ring are also seen. Figure 39 shows the SEM image of the
inner sealing ring 6 close to the ring gap.
Figure 39. a) is the image of the inner sealing ring 6 close to the ring gap,b) is in zoom of middle of a) as well c) is an in zoom of
b) and d) is an high magnification of c), the white arrow in d) shows for example a particle that had been flattered down.

42
In Figure 40 the SEM micrographs were taken at position 2 on the worn surface of inner sealing
ring number 6. In Figure 40 (a) also shows where (b), (c) and (d) are taken. The worn surface shows
sign of adhesive wear in (c), some mild abrading grooves parallel to the sliding direction in (d). In
Figure 40 (b), a tribo-layer is seen on the surface of the sealing ring.
Figure 40. SEM analyses at position 2, in b) and c) it can be seen adhesive wear on the worn surface of the sealing ring.
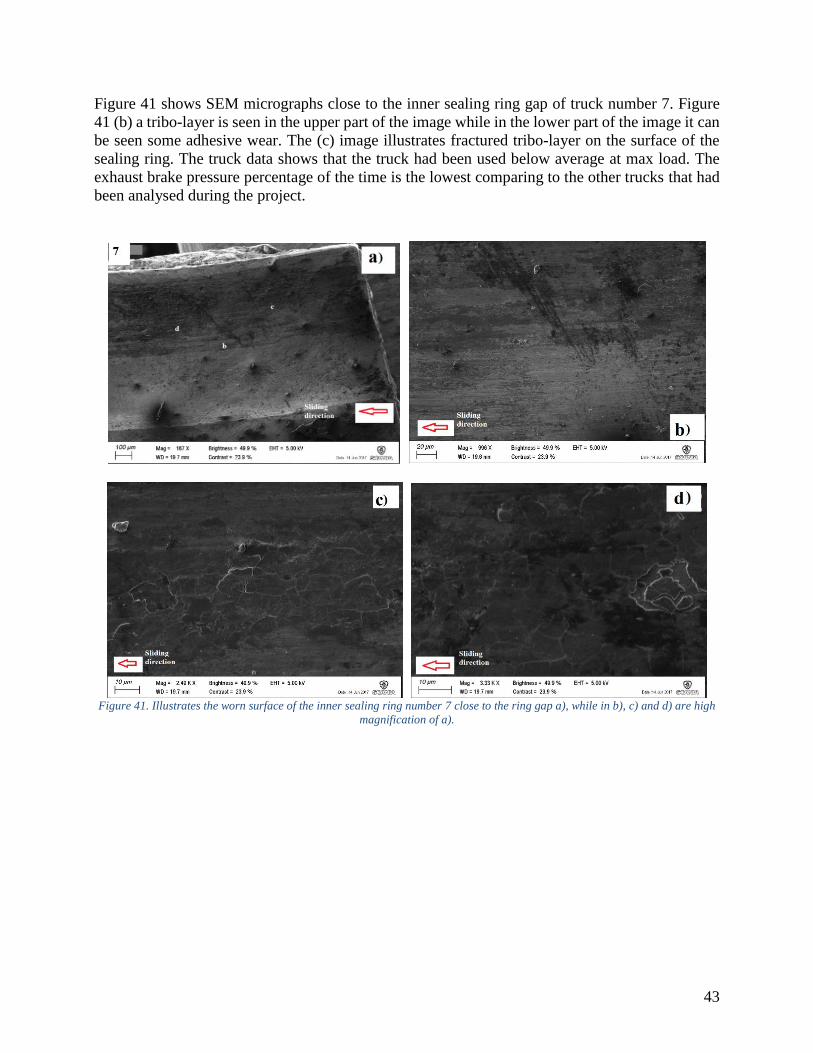
43
Figure 41 shows SEM micrographs close to the inner sealing ring gap of truck number 7. Figure
41 (b) a tribo-layer is seen in the upper part of the image while in the lower part of the image it can
be seen some adhesive wear. The (c) image illustrates fractured tribo-layer on the surface of the
sealing ring. The truck data shows that the truck had been used below average at max load. The
exhaust brake pressure percentage of the time is the lowest comparing to the other trucks that had
been analysed during the project.
Figure 41. Illustrates the worn surface of the inner sealing ring number 7 close to the ring gap a), while in b), c) and d) are high
magnification of a).

44
At position 2 on the inner sealing ring 7, SEM analyses was done on the worn surface. On the
inner edge of the sealing ring some debris is accumulated, Figure 42 (b). In (c) it can be seen a
crack that is perpendicular to the sliding direction, the cracks goes trough the tribolayer into the
surface of the sealing ring. The cracks look similar to the cracks that were identified in the surface
of the inner sealing ring in Figure 39. In (d) can be seen adhesive wear, the blue arrow indicates
adhesive particles that had been flattered down.
Figure 42. a) shows the position there the analyses had been done on the worn surface of the ring that comes from truck number
7. In b) it can be seen an in zoom of a) and c) is a high magnification of b).

45
The inner sealing ring that is presented in Figure 43, comes from truck number 1. As it can be seen
in (c) there are cracks that are perpendicular to the sliding direction, while in (d) a fractured tribo-
layer over the worn surface of the sealing ring is seen. The cracks look like the cracks that are
present on the worn surface of the sealing ring that is illustrated in Figure 39. The inner sealing
ring 1, which comes form truck number 1, that was driven below average at max load and lowest
percentage at medium exhaust brake pressure.
Figure 43. Position 1, analyses of worn surface close to the ring gap.

46
SEM analysis at position 2 on the inner sealing ring number 1 are shown in in Figure 44. In (b), a
crack on the worn surface is seen and the crack looks like the cracks that were found on the worn
surface of the sealing rings in Figure 39 and Figure 42. In (c), it can be seen adhesive particles that
had been flattered down on the worn surface of the sealing ring. The presence of cracks on the
worn surfaces of the inner sealing rings can be due to high friction forces and /or due to the thermal
fatigue.
Figure 44. Position 2, analyses of the worn surface at the middle along the worn surface.

47
4.1.10 SEM analysis of shafts
The worn surfaces of the shafts that had been in contact with the inner sealing rings was also
analysed. The first shaft that was analysed comes from truck number 6. In Figure 45 (a), can be
seen where the analysis was done. The red arrow indicates the rotational direction of the shaft. In
(c) and (d), it can be seen how the surface asperities had been flattered down and how these
asperities had plastically deformed. The white arrow shows plastic deformation of such asperities
on the middle of the worn surface of the shaft. In c) and d) there are some small cracks that are
perpendicular to the rotational direction. The cracks are along the worn surface of the shaft. The
presence of these cracks and plastic deformation of the surface of the shaft shows that there was
high friction generation and high shear stresses between the sliding surfaces of the sealing rings
and shafts. As it was shown in 3D surface profile analyses, the worn surfaces of the shafts, generally
have a convex shape while the worn surfaces of the sealing rings got concave shape during the
operation, probably due to the high heat and friction generation between the sliding surfaces and
probably even due to the high pressure.
Figure 45. Surface of the shaft, b, c and d are high magnification areas of the surface of an image.

48
Figure 46 shows the analysis of the worn surface of shaft that comes from truck number 7. In (a),
it can be seen where the worn surface of the shaft was closer analysed and where (b), (c) and (d)
were magnified on the surface. The red arrow shows the rotational direction of the shaft while the
white arrow in (d) shows asperities that was flattered down, probably due to the high pressure
during the operation. In (d) and (c) it can also be seen some small parallel grooves to the rotational
direction which means that there is abrasive wear on the worn surface of the shaft. In (b) it can be
seen how the surface was plastically deformed and even that there was adhesive wear during the
using of turbocharger.
Figure 46. Illustrates the worn surface of the shaft, there the shaft had been in contact with the worn inner sealing ring.
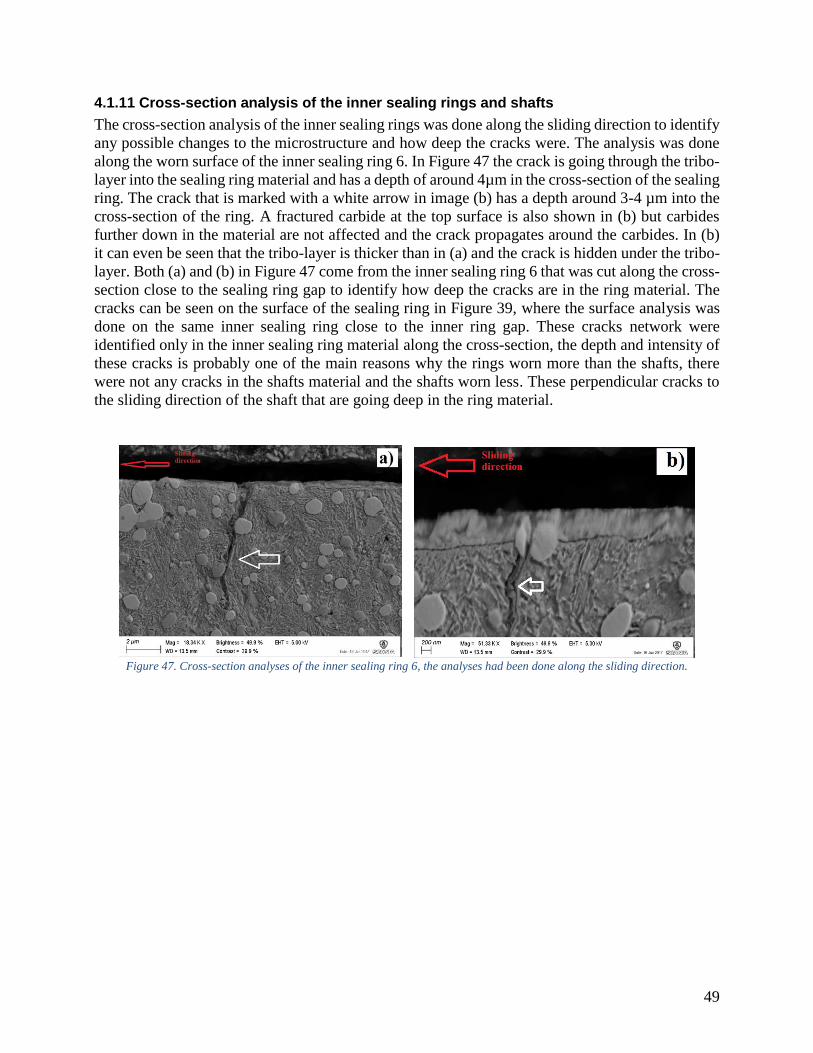
49
4.1.11 Cross-section analysis of the inner sealing rings and shafts
The cross-section analysis of the inner sealing rings was done along the sliding direction to identify
any possible changes to the microstructure and how deep the cracks were. The analysis was done
along the worn surface of the inner sealing ring 6. In Figure 47 the crack is going through the tribo-
layer into the sealing ring material and has a depth of around 4µm in the cross-section of the sealing
ring. The crack that is marked with a white arrow in image (b) has a depth around 3-4 µm into the
cross-section of the ring. A fractured carbide at the top surface is also shown in (b) but carbides
further down in the material are not affected and the crack propagates around the carbides. In (b)
it can even be seen that the tribo-layer is thicker than in (a) and the crack is hidden under the tribo-
layer. Both (a) and (b) in Figure 47 come from the inner sealing ring 6 that was cut along the cross-
section close to the sealing ring gap to identify how deep the cracks are in the ring material. The
cracks can be seen on the surface of the sealing ring in Figure 39, where the surface analysis was
done on the same inner sealing ring close to the inner ring gap. These cracks network were
identified only in the inner sealing ring material along the cross-section, the depth and intensity of
these cracks is probably one of the main reasons why the rings worn more than the shafts, there
were not any cracks in the shafts material and the shafts worn less. These perpendicular cracks to
the sliding direction of the shaft that are going deep in the ring material.
Figure 47. Cross-section analyses of the inner sealing ring 6, the analyses had been done along the sliding direction.
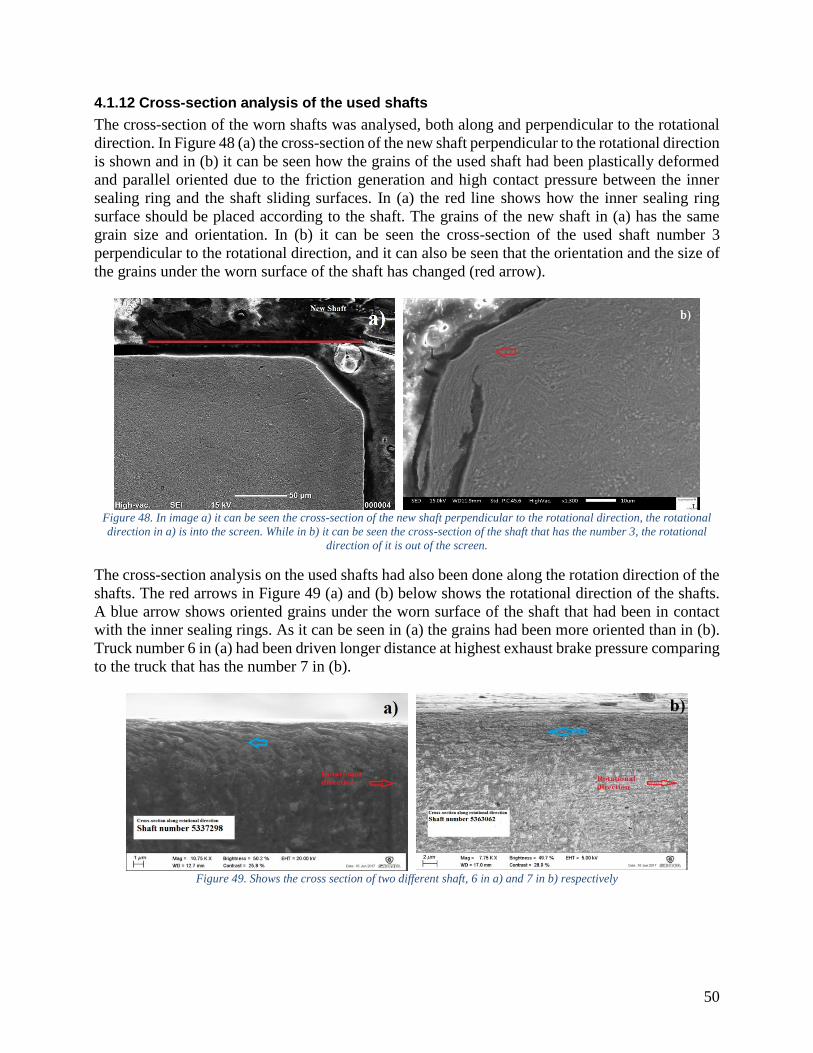
50
4.1.12 Cross-section analysis of the used shafts
The cross-section of the worn shafts was analysed, both along and perpendicular to the rotational
direction. In Figure 48 (a) the cross-section of the new shaft perpendicular to the rotational direction
is shown and in (b) it can be seen how the grains of the used shaft had been plastically deformed
and parallel oriented due to the friction generation and high contact pressure between the inner
sealing ring and the shaft sliding surfaces. In (a) the red line shows how the inner sealing ring
surface should be placed according to the shaft. The grains of the new shaft in (a) has the same
grain size and orientation. In (b) it can be seen the cross-section of the used shaft number 3
perpendicular to the rotational direction, and it can also be seen that the orientation and the size of
the grains under the worn surface of the shaft has changed (red arrow).
Figure 48. In image a) it can be seen the cross-section of the new shaft perpendicular to the rotational direction, the rotational
direction in a) is into the screen. While in b) it can be seen the cross-section of the shaft that has the number 3, the rotational
direction of it is out of the screen.
The cross-section analysis on the used shafts had also been done along the rotation direction of the
shafts. The red arrows in Figure 49 (a) and (b) below shows the rotational direction of the shafts.
A blue arrow shows oriented grains under the worn surface of the shaft that had been in contact
with the inner sealing rings. As it can be seen in (a) the grains had been more oriented than in (b).
Truck number 6 in (a) had been driven longer distance at highest exhaust brake pressure comparing
to the truck that has the number 7 in (b).
Figure 49. Shows the cross section of two different shaft, 6 in a) and 7 in b) respectively
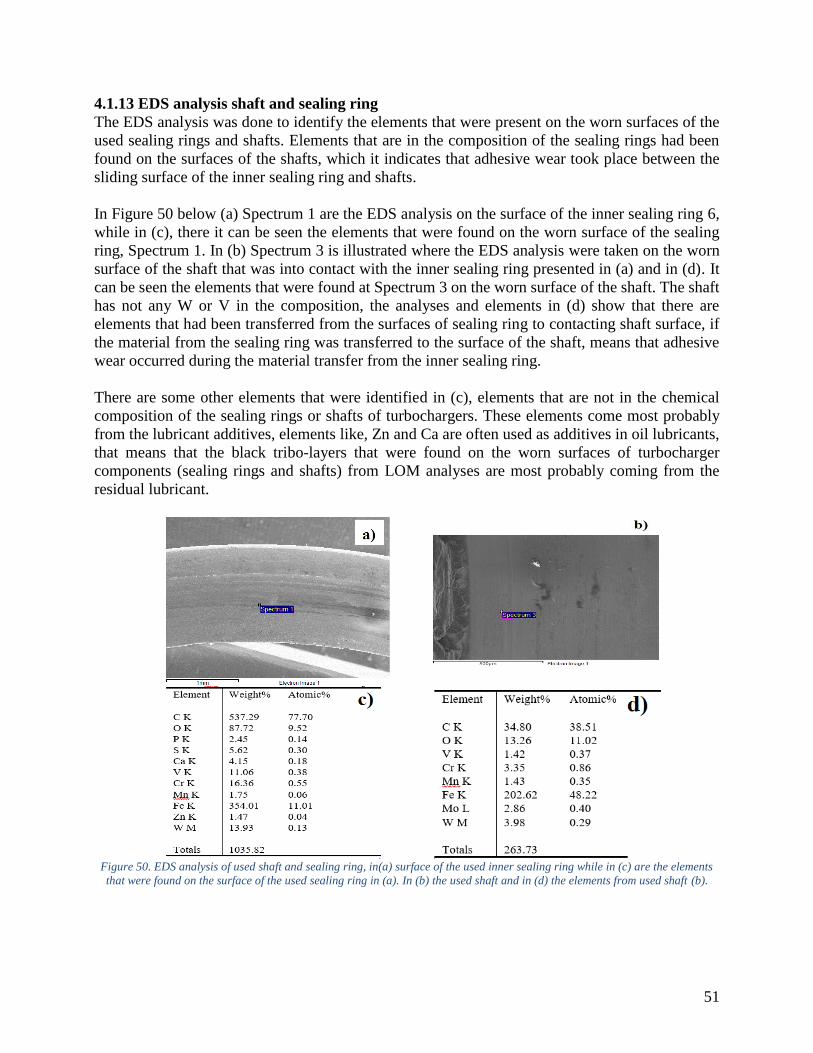
51
4.1.13 EDS analysis shaft and sealing ring
The EDS analysis was done to identify the elements that were present on the worn surfaces of the
used sealing rings and shafts. Elements that are in the composition of the sealing rings had been
found on the surfaces of the shafts, which it indicates that adhesive wear took place between the
sliding surface of the inner sealing ring and shafts.
In Figure 50 below (a) Spectrum 1 are the EDS analysis on the surface of the inner sealing ring 6,
while in (c), there it can be seen the elements that were found on the worn surface of the sealing
ring, Spectrum 1. In (b) Spectrum 3 is illustrated where the EDS analysis were taken on the worn
surface of the shaft that was into contact with the inner sealing ring presented in (a) and in (d). It
can be seen the elements that were found at Spectrum 3 on the worn surface of the shaft. The shaft
has not any W or V in the composition, the analyses and elements in (d) show that there are
elements that had been transferred from the surfaces of sealing ring to contacting shaft surface, if
the material from the sealing ring was transferred to the surface of the shaft, means that adhesive
wear occurred during the material transfer from the inner sealing ring.
There are some other elements that were identified in (c), elements that are not in the chemical
composition of the sealing rings or shafts of turbochargers. These elements come most probably
from the lubricant additives, elements like, Zn and Ca are often used as additives in oil lubricants,
that means that the black tribo-layers that were found on the worn surfaces of turbocharger
components (sealing rings and shafts) from LOM analyses are most probably coming from the
residual lubricant.
Figure 50. EDS analysis of used shaft and sealing ring, in(a) surface of the used inner sealing ring while in (c) are the elements
that were found on the surface of the used sealing ring in (a). In (b) the used shaft and in (d) the elements from used shaft (b).

52
4.2 Friction and wear behaviour from tribological tests
The friction and wear behaviour are analysed by replication of the operating conditions in the
turbocharger. The tests were performed in Pin on Disc TE67 tribological test machine. The tests
are performed at different conditions to evaluate the influence of each parameter on friction and
wear behaviour.
4.2.1 Friction behaviour
Test under two loads at two different speeds were performed. The tests performed at two
temperatures which results in 8 different setups. The friction results can be seen in Figure 51.
Figure 51. Average coefficient of friction for all test conditions.
The observations show that increased load lead to insignificant changes in frictional behaviour.
The only condition where load dependency have considerable influence on coefficient of friction
is high temperature (HT) with high sliding speed.
The reason of decreased resistance to sliding may be explained by the equation for coefficient of
friction
𝐹𝜇 = 𝜇 ∗ 𝑁
where the increased normal load 𝑁 should increase the resisting force of gliding 𝐹𝜇 with the factor
𝜇, which is coefficient of friction. If the force 𝐹𝜇 is not increased enough compare to the normal
load 𝑁 the coefficient of friction should decrease. This is being observed during this experiment at
high speed HT.
The second explanation for the decreased coefficient of friction may be the wear mechanism. The
condition of high load and high speed at room temperature (RT) . have extreme difference to other
conditions. During the test run sparks were observed. The sparks usually are a heated material that
leaves the contact area. The difference can be seen in Figure 52 and Figure 53.
0.00
0.20
0.40
0.60
0.80
0.5 1.5
Co
effi
cien
t o
f fr
icti
on
Pressure [MPa]
Coefficient of friction at 3 m/s
R.T., 3 m/s300 C°, 3 m/s
0.00
0.20
0.40
0.60
0.80
0.5 1.5
Co
effi
cien
t o
f fr
icti
on
Pressure [MPa]
Coefficient of friction at 11 m/sR.T., 11 m/s300 C°, 11 m/s
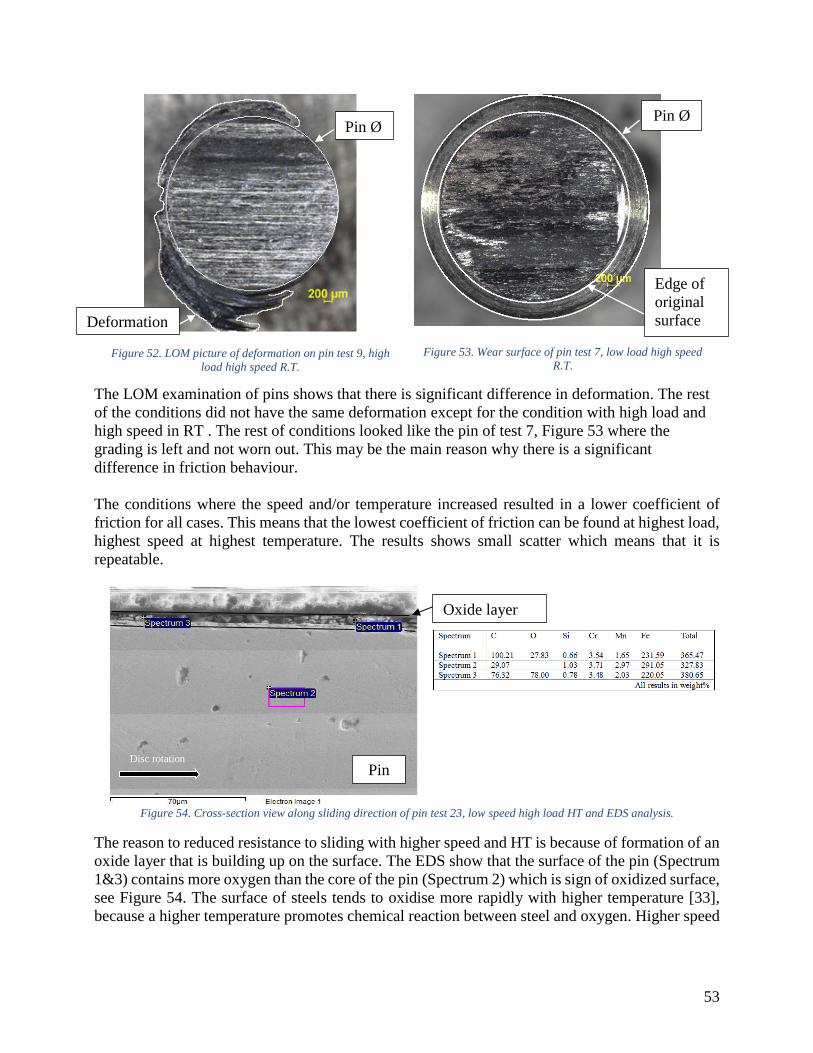
53
Figure 52. LOM picture of deformation on pin test 9, high
load high speed R.T.
Figure 53. Wear surface of pin test 7, low load high speed
R.T.
The LOM examination of pins shows that there is significant difference in deformation. The rest
of the conditions did not have the same deformation except for the condition with high load and
high speed in RT . The rest of conditions looked like the pin of test 7, Figure 53 where the
grading is left and not worn out. This may be the main reason why there is a significant
difference in friction behaviour.
The conditions where the speed and/or temperature increased resulted in a lower coefficient of
friction for all cases. This means that the lowest coefficient of friction can be found at highest load,
highest speed at highest temperature. The results shows small scatter which means that it is
repeatable.
Figure 54. Cross-section view along sliding direction of pin test 23, low speed high load HT and EDS analysis.
The reason to reduced resistance to sliding with higher speed and HT is because of formation of an
oxide layer that is building up on the surface. The EDS show that the surface of the pin (Spectrum
1&3) contains more oxygen than the core of the pin (Spectrum 2) which is sign of oxidized surface,
see Figure 54. The surface of steels tends to oxidise more rapidly with higher temperature [33],
because a higher temperature promotes chemical reaction between steel and oxygen. Higher speed
Oxide layer
Pin Disc rotation
Edge of
original
surface
Pin Ø Pin Ø
Deformation
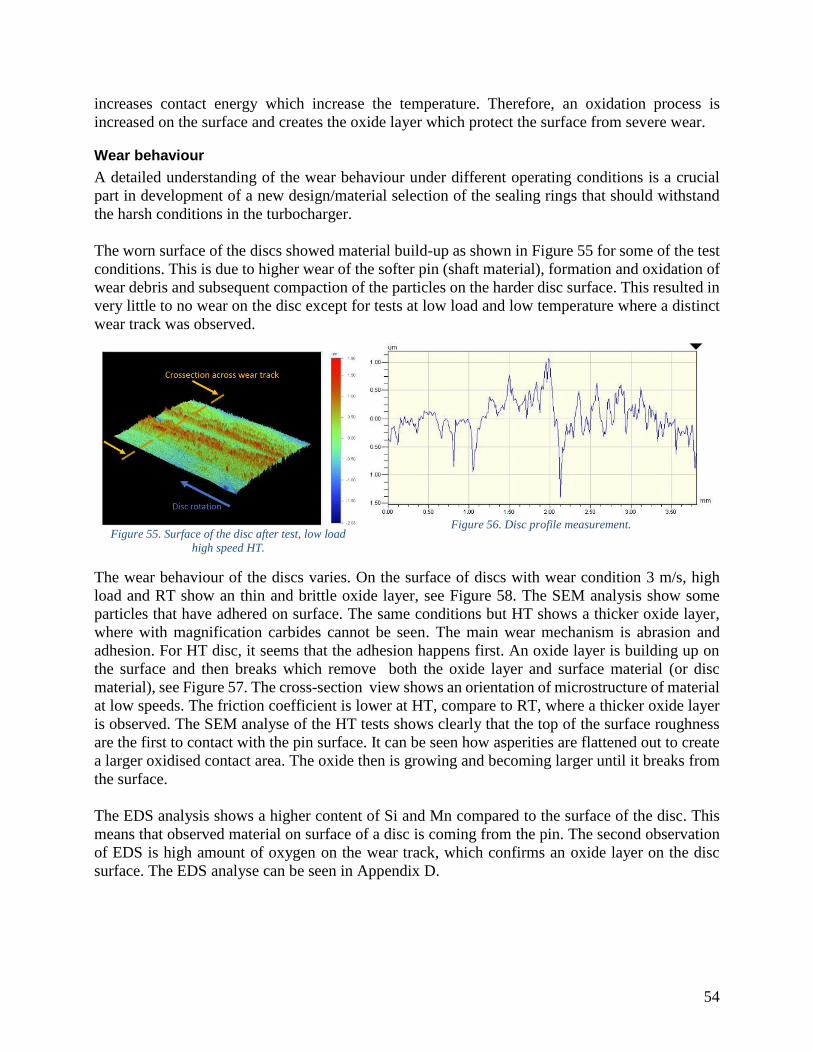
54
increases contact energy which increase the temperature. Therefore, an oxidation process is
increased on the surface and creates the oxide layer which protect the surface from severe wear.
Wear behaviour
A detailed understanding of the wear behaviour under different operating conditions is a crucial
part in development of a new design/material selection of the sealing rings that should withstand
the harsh conditions in the turbocharger.
The worn surface of the discs showed material build-up as shown in Figure 55 for some of the test
conditions. This is due to higher wear of the softer pin (shaft material), formation and oxidation of
wear debris and subsequent compaction of the particles on the harder disc surface. This resulted in
very little to no wear on the disc except for tests at low load and low temperature where a distinct
wear track was observed.
Figure 55. Surface of the disc after test, low load
high speed HT.
Figure 56. Disc profile measurement.
The wear behaviour of the discs varies. On the surface of discs with wear condition 3 m/s, high
load and RT show an thin and brittle oxide layer, see Figure 58. The SEM analysis show some
particles that have adhered on surface. The same conditions but HT shows a thicker oxide layer,
where with magnification carbides cannot be seen. The main wear mechanism is abrasion and
adhesion. For HT disc, it seems that the adhesion happens first. An oxide layer is building up on
the surface and then breaks which remove both the oxide layer and surface material (or disc
material), see Figure 57. The cross-section view shows an orientation of microstructure of material
at low speeds. The friction coefficient is lower at HT, compare to RT, where a thicker oxide layer
is observed. The SEM analyse of the HT tests shows clearly that the top of the surface roughness
are the first to contact with the pin surface. It can be seen how asperities are flattened out to create
a larger oxidised contact area. The oxide then is growing and becoming larger until it breaks from
the surface.
The EDS analysis shows a higher content of Si and Mn compared to the surface of the disc. This
means that observed material on surface of a disc is coming from the pin. The second observation
of EDS is high amount of oxygen on the wear track, which confirms an oxide layer on the disc
surface. The EDS analyse can be seen in Appendix D.

55
Figure 57. Disc of test 22, 3m/s High load HT. White arrow
show brittle oxide layer. Red arrow pointing on original
surface.
Figure 58. Disc of test 19. 3 m/s High load RT. Oxide layer
appears as darker surface (red rings). White arrow shows a
broken oxide layer. Blue arrow shows an embedded particle.
Hardness of discs have been measured before and after the tests. The hardness of discs has not
changed even after HT tests, but the hardness of oxide-layer is a bit harder compare to original
material hardness. The original measurements of tool steel give hardness 640-680 HV0.025. It is
hard to measure but after HT tests the oxide layers have hardness of 800 HV0.025. Measurements of
disc hardness can be seen in Appendix C.
Measurement of existing wear track show an insignificant wear compare to the pin (soft material).
It is known that in the turbochargers harder ring have higher wear compare to the soft shaft. The
effect of higher wear rate of the harder material is not observed in the tribological tests. The results
of mass loss of material on pin and disc, where it could be measured, is shown in Figure 59 and
standard deviation value in shown in Appendix B.
Figure 59. The wear loss of pins and discs in mg for all conditions.
1.53 3.281.95
12.04
6.4E-04 4.1E-030.00
10.00
20.00
30.00
40.00
50.00
60.00
70.00
80.00
0.5 1.5
Wea
r lo
ss [
mg]
Pressure [MPa]
Wear loss at 3 m/s
R.T., 3 m/s Pin
300 °C, 3 m/s Pin
R.T., 3 m/s Disc
2.07
82.74
2.336.59
0.00
10.00
20.00
30.00
40.00
50.00
60.00
70.00
80.00
0.5 1.5
Wea
r lo
ss [
mg]
Pressure [MPa]
Wear loss at 11 m/s
R.T., 11m/s Pin
300 °C, 11m/s Pin
Disc rotation
Disc rotation Disc rotation
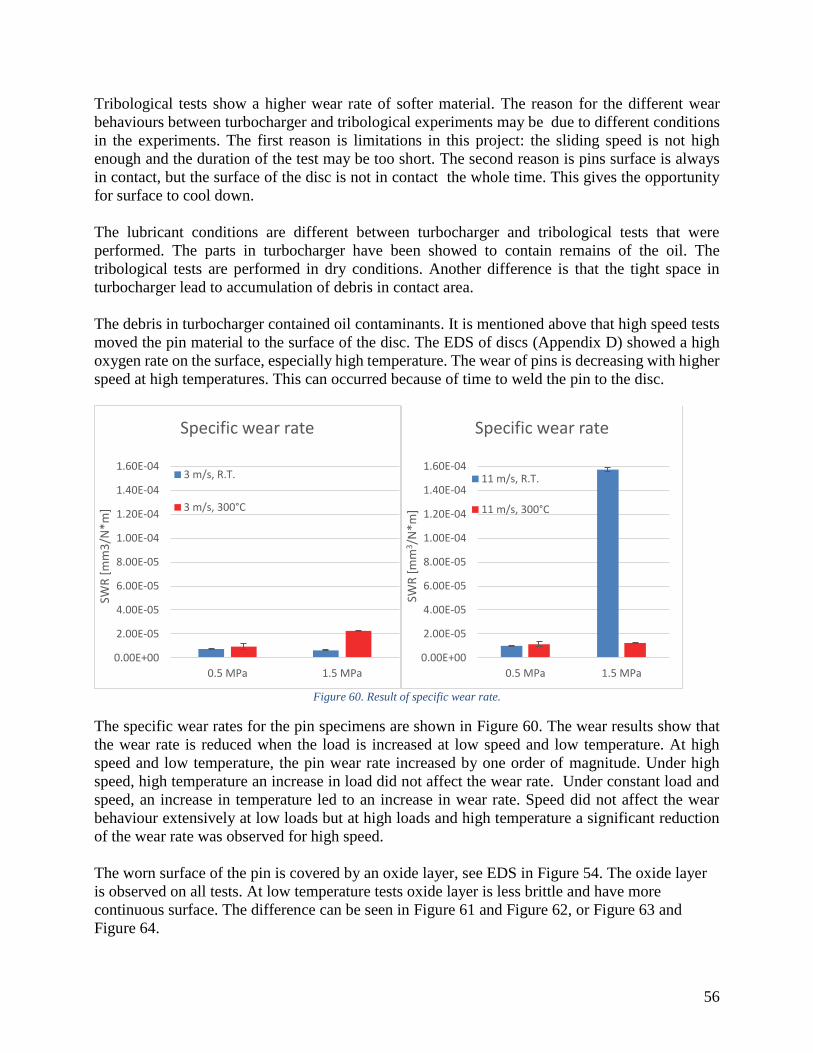
56
Tribological tests show a higher wear rate of softer material. The reason for the different wear
behaviours between turbocharger and tribological experiments may be due to different conditions
in the experiments. The first reason is limitations in this project: the sliding speed is not high
enough and the duration of the test may be too short. The second reason is pins surface is always
in contact, but the surface of the disc is not in contact the whole time. This gives the opportunity
for surface to cool down.
The lubricant conditions are different between turbocharger and tribological tests that were
performed. The parts in turbocharger have been showed to contain remains of the oil. The
tribological tests are performed in dry conditions. Another difference is that the tight space in
turbocharger lead to accumulation of debris in contact area.
The debris in turbocharger contained oil contaminants. It is mentioned above that high speed tests
moved the pin material to the surface of the disc. The EDS of discs (Appendix D) showed a high
oxygen rate on the surface, especially high temperature. The wear of pins is decreasing with higher
speed at high temperatures. This can occurred because of time to weld the pin to the disc.
Figure 60. Result of specific wear rate.
The specific wear rates for the pin specimens are shown in Figure 60. The wear results show that
the wear rate is reduced when the load is increased at low speed and low temperature. At high
speed and low temperature, the pin wear rate increased by one order of magnitude. Under high
speed, high temperature an increase in load did not affect the wear rate. Under constant load and
speed, an increase in temperature led to an increase in wear rate. Speed did not affect the wear
behaviour extensively at low loads but at high loads and high temperature a significant reduction
of the wear rate was observed for high speed.
The worn surface of the pin is covered by an oxide layer, see EDS in Figure 54. The oxide layer
is observed on all tests. At low temperature tests oxide layer is less brittle and have more
continuous surface. The difference can be seen in Figure 61 and Figure 62, or Figure 63 and
Figure 64.
0.00E+00
2.00E-05
4.00E-05
6.00E-05
8.00E-05
1.00E-04
1.20E-04
1.40E-04
1.60E-04
0.5 MPa 1.5 MPa
SWR
[m
m3
/N*m
]
Specific wear rate
3 m/s, R.T.
3 m/s, 300°C
0.00E+00
2.00E-05
4.00E-05
6.00E-05
8.00E-05
1.00E-04
1.20E-04
1.40E-04
1.60E-04
0.5 MPa 1.5 MPa
SWR
[m
m3/N
*m]
Specific wear rate
11 m/s, R.T.
11 m/s, 300°C

57
Figure 61. SEM picture of pin test 7, high speed low load RT.
Figure 62. SEM picture of pin worn surface after test 20 at low speed low load HT.
Figure 63. SEM picture of pin worn surface after test 7, high
speed low load RT.
Figure 64. SEM picture of pin worn surface after test 20, low
speed low load HT.
Flake
Flake

58
At low speeds and low loads adhesive wear is dominant. The surface is more continuous and have
no flakes, like the one marked with white in Figure 64. With increased temperature flakes are more
common. The oxide layers created after high temperature tests in average tend to be harder than
the RT tests, 740HV10 HT against 570HV10 for RT tests. The hardness measurement itself varies a
lot because of the inhomogeneous tribolayer. This gives a conclusion that the oxide layer is more
brittle with higher temperature. Increased speed has a big influence on size of the flakes. Flakes
are much larger, see Figure 65.
Figure 65. SEM image of surface of the pin after test 27, high speed high load HT.
A cross-section view of the pins have showed an orientation of grains within the material. The
orientation is observed both along and across of sliding direction, see Figure 66 and Figure 67. An
angle of orientation showed in Figure 66 varies with the load. Figure 67 demonstrates an image of
a pin at high speeds, where no wear of the disc is observed. The material moves from the surface
of the pin to the surface of the disc. The current view shows a grain orientation to the point where
original pin surface contacts the disc. This means that the oxide layer prevent extensive adhesive
wear.
Figure 66. SEM image of cutting view along sliding direction
of the pin test 5, low speed low load RT.
Figure 67. SEM image of cutting view across sliding
direction of the pin test 26, high speed high load HT.
Disc rotation
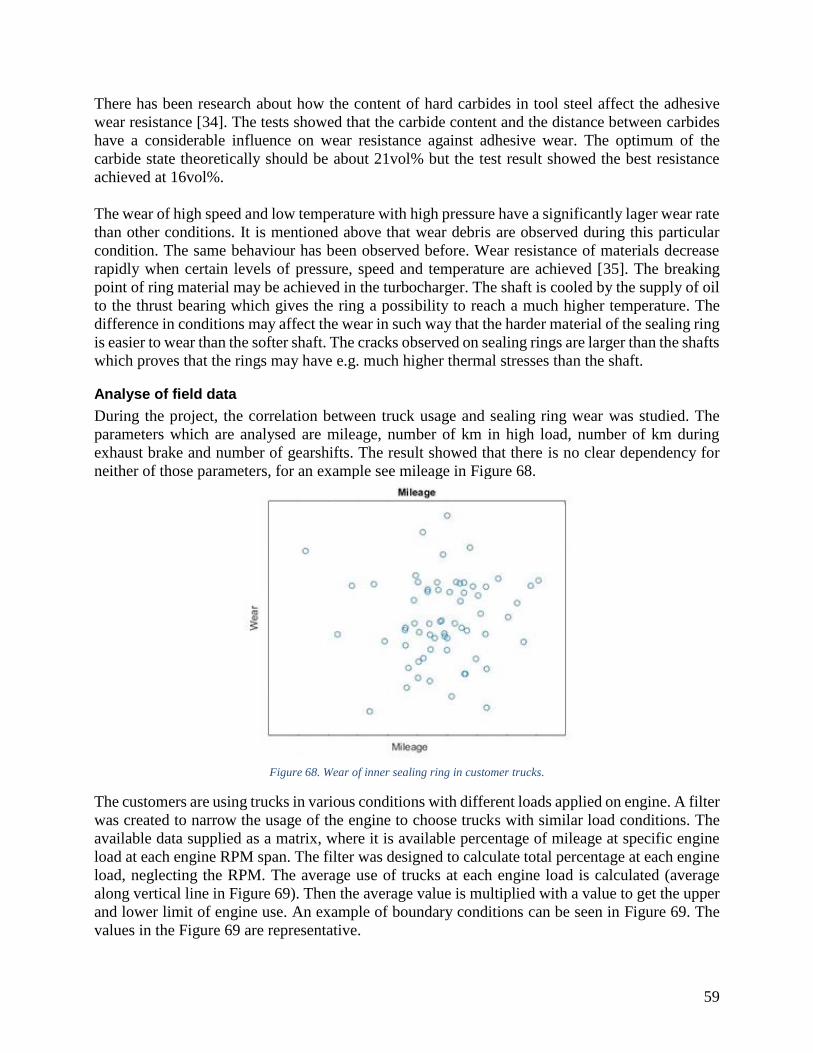
59
There has been research about how the content of hard carbides in tool steel affect the adhesive
wear resistance [34]. The tests showed that the carbide content and the distance between carbides
have a considerable influence on wear resistance against adhesive wear. The optimum of the
carbide state theoretically should be about 21vol% but the test result showed the best resistance
achieved at 16vol%.
The wear of high speed and low temperature with high pressure have a significantly lager wear rate
than other conditions. It is mentioned above that wear debris are observed during this particular
condition. The same behaviour has been observed before. Wear resistance of materials decrease
rapidly when certain levels of pressure, speed and temperature are achieved [35]. The breaking
point of ring material may be achieved in the turbocharger. The shaft is cooled by the supply of oil
to the thrust bearing which gives the ring a possibility to reach a much higher temperature. The
difference in conditions may affect the wear in such way that the harder material of the sealing ring
is easier to wear than the softer shaft. The cracks observed on sealing rings are larger than the shafts
which proves that the rings may have e.g. much higher thermal stresses than the shaft.
Analyse of field data
During the project, the correlation between truck usage and sealing ring wear was studied. The
parameters which are analysed are mileage, number of km in high load, number of km during
exhaust brake and number of gearshifts. The result showed that there is no clear dependency for
neither of those parameters, for an example see mileage in Figure 68.
Figure 68. Wear of inner sealing ring in customer trucks.
The customers are using trucks in various conditions with different loads applied on engine. A filter
was created to narrow the usage of the engine to choose trucks with similar load conditions. The
available data supplied as a matrix, where it is available percentage of mileage at specific engine
load at each engine RPM span. The filter was designed to calculate total percentage at each engine
load, neglecting the RPM. The average use of trucks at each engine load is calculated (average
along vertical line in Figure 69). Then the average value is multiplied with a value to get the upper
and lower limit of engine use. An example of boundary conditions can be seen in Figure 69. The
values in the Figure 69 are representative.

60
Figure 69. The dots represent engine use at each engine load and the green line show the conditions of average use with 23%
margin.
The same method is applied for engine revolution by neglecting the engine load. The data of wear
of inner sealing ring and mileage is taken from the selected trucks. The result from filtering by
revolution didn’t showed any pattern, but the 10 trucks selected with similar engine load conditions
may follow a linear pattern, see Figure 70.
Figure 70. The trucks filtered by engine load conditions.
The result represents the average load conditions. A further investigation of different load
conditions showed that there is a possible dependency between mileage and wear. Same load
conditions are critical to confirm the wear prediction. The revolution of the engine has not the same
influence on the sealing rings wear.
The study is performed on a few trucks. A mechanical condition in the turbocharger, provides an
inaccuracy in the linear models. Different load conditions show a linear dependency as well.

61
4.3 Suggestions for improved durability of sealing rings
The durability of the sealing rings can be improved by several methods. Here it is discussed to
change the material or operating condition. The change of material is possible. An alternative
material should be resistant to higher temperatures than the sealing rings material. The tool steel
that is used today uses Fe matrix with hard tungsten carbides. The carbides can potentially be
removed from matrix before they were worn out. The cracks through tungsten carbides show that
the carbides may be to brittle for this kind of conditions.
The second possible improvement is changing the working conditions. During the tribological
experiments it was found that materials have breaking points due to conditions [35]. There is a
specific combination of contact pressure, sliding velocity, temperature and lubricant that gives the
highest wear rate. The wear resistance may decrease with higher value of for example pressure. A
smaller diameter could be an option to reduce the sliding speed between the surfaces in the future
turbocharger.
There can be several methods to reduce the contact pressure. For example, a larger contact area is
the most straight forward way to bring down the contact pressure. The problem is that the blow by
may increase because of the unsealed contact. A geometry of least efficient flow can be applied to
decrease the blow by.
There is a possibility to reduce the pressure over sealing rings is by creating cuttings on the shaft,
turbo wheel or cuttings on the bearing house to push the gases away from sealing rings. The gases
are moving at the same rotational speed of the shaft which means that a specially formed stationary
heat shield may decrease the pressure near the sealing rings. This decrease the contact pressure and
may decrease the temperature as well. The thermal problem of relaxation of the ring and wear of
the ring is main mechanisms of increased blow by.
The improvement of turbocharger and sealing rings performance can be improved by implementing
a ball bearing design. It is decreasing frictional losses up to 50% [36] and increase durability of the
sealing rings. With improvement of this technology a turbocharger can decrease pollution and
increase durability of heavy duty diesel engines.

62
5. Conclusions
From the results that are presented in chapter 4.1, the plastic deformation of shafts worn surfaces
are showing that there was high friction between the sliding surfaces. The friction, is in turn
influenced by high contact pressure between the sliding surfaces in turbocharger components. Both
the turboshafts and the turbo sealing rings in turbochargers are made of steel.
Steel has good material properties at high pressure and high temperatures and it is probably one of
the main reasons why sealing rings and shafts were made of this material. When two surfaces that
are made of same materials and sliding against each other, generally high friction generates which
in turn leads to high adhesive wear.
Both the sealing rings and shafts from the turbochargers that were analysed in chapter 4.1 are
showing that there was both adhesive and abrasive wear on the worn surfaces. The worn surfaces
of shafts were plastically deformed, while on the worn surfaces of the sealing rings was a network
of small cracks perpendicular to the sliding direction, these small cracks are from the high friction
generation and contacting pressure between the sliding surfaces, by rapidly changing the driving
conditions then the friction and pressure between sliding surfaces in turbochargers, suddenly
change. The sudden changing of friction and pressure between the sliding surfaces due to different
driving conditions then the sliding surfaces temperature also suddenly is changing which in turn
leads to thermal fatigue cracks of the sealing rings worn surfaces.
The tribo-tests in chapter 4.2 are also showing the presence of plastic deformation on the worn
surfaces of the pins, which are made of the same material as turbocharger shafts. The plastic
deformation of the material shows also a presence of high adhesive friction due to the high
contacting pressure.
The pins and the disc from the tribo-tests both show adhesive and abrasive wear. An oxide layer
was observed which varies with the operating conditions. The tool steel in some conditions did not
show any wear. There were not any thermal fatigue cracks on the worn surfaces from the tribo-
tests components, probably because there was not any sudden increase or decrease in the surface
temperature.
One of the main parameters that is influencing the damage of the turbocharger sealing rings and
shafts is the high contact pressure that arises during exhaust braking and high engine load. During
tribological tests it was confirmed that the breaking point of material can be achieved by increasing
pressure only.
To minimize the contact pressure between the inner sealing rings and shafts the geometry of the
sealing rings and shafts can be changed by having a larger contact area between the components.
In this way, the pressure would probably have a lower influence on the lifetime of the turbocharger
components. To minimize the high friction and high adhesive wear, the turbocharger sealing rings
can be made of other material, for example, materials that can better resist to relaxation and the
high temperatures from the exhaust gases and temperature from the high exhaust gas pressure in
turbine house. For example, the rings can be made of such called nickel superalloys.
63
6. Future work
More measurements of working conditions of sealing rings can be performed. It is crucial for
further research that the conditions are known. Measurements of pressure between sealing ring or
movement of sealing rings are needed for better evaluation of wear and friction. A measurement
of friction force between sealing ring and bearing house at high temperatures can be made. This
measurement will help to understand the contact pressure, which is estimated by calculation today.
The temperature of the sealing is to be estimated or measured. Several tests can be performed with
both higher and lower carbide content to estimate wear rate of the material in a turbocharger.
The future tribological tests can be performed on ring-on-ring contact. This will eliminate a cooling
cycle for the disc material. A temperature measurement of sealing rings combined with ring-on-
ring contact may better recreate the wear cycle in the actual turbocharger. This will give a
possibility to estimate breaking point for tool steel. This may give a possibility to explain why a
harder material is worn more than a soft material.
A continuous work on wear model to estimate a wear dependency on different parameters. A filter
for available wear data that is taking into account a turbocharger performance instead of engine
performance, which was performed in this project. It may show the influence of driving on wear
behaviour of the rings.

64
7. Acknowledgements
This master thesis was done in collaboration between Lulea University of Technology and Scania.
The work was done for Scania, but the largest period of the time the work was done at Lulea
University of Technology. The work comprises a 20 weeks’ fulltime work and was done during
the spring semester 2017 at Lulea University of Technology.
We want to thank Jens Hardell from the Division of Machine Elements at Lulea University of
Technology. Jens was our supervisor and examiner and he assisted with a lot of help and knowledge
during this thesis time. Jens helped a lot to choose the right analysis methods and even with the
examination of the components. As well we want to thank Madeleine Ekström our supervisor from
Scania. Madeleine helped a lot with material data from trucks and even knowledge about the
driving conditions of diesel engines turbochargers.
We would also thank Pouria Valizadeh Moghaddam for his help in tribology lab. Thanks to
Leonardo Pelcastre, Lars Hammerström and the NMGG department for their help during the
project.

65
8. References
1. BHUSHAN, Bharat. Introduction to tribology. John Wiley & Sons, 2013.
2. GODFREY, Douglas. Friction oscillations with a pin-on-disc tribometer. Tribology
International, 1995, 28.2: 119-126.
3. Burwell, John T. "Survey of possible wear mechanisms." Wear 1.2 (1957): 119-141.
4. Van Beek, Anton. "Advanced engineering design." TU Delft, Delft, The
Netherlands (2006).
5. Hurricks, P. L. "Some metallurgical factors controlling the adhesive and abrasive wear
resistance of steels. A review." Wear 26.3 (1973): 285-304.
6. Hardell, Jens, and Braham Prakash. "High-temperature friction and wear behaviour of
different tool steels during sliding against Al–Si-coated high-strength steel." Tribology
International 41.7 (2008): 663-671.
7. Runkle, Joseph C. "Method for making tool steel with high thermal fatigue
resistance." U.S. Patent No. 5,290,507. 1 Mar. 1994.
8. Roberts, George Adam, Richard Kennedy, and George Krauss. Tool steels. ASM
international, 1998.
9. Eyre, T. S. "Wear characteristics of metals." Tribology International 9.5 (1976): 203-
212.
10. Neale, Michael, and Mark Gee. A Guide to Wear Problems and Testing for Industry.
William Andrew, 2001.
11. Williams, John. Engineering tribology. Cambridge University Press, 2005.
12. Stott, F. H. "High-temperature sliding wear of metals." Tribology International 35.8
(2002): 489-495.
13. Soemantri, Satryo, A. C. McGee, and Iain Finnie. "Some aspects of abrasive wear at
elevated temperatures." Wear 104.1 (1985): 77-91.
14. Quinn, T. F. J. "Oxidational wear modelling: Part II. The general theory of oxidational
wear." Wear 175.1-2 (1994): 199-208.
15. Quinn, T. F. J. "Oxidational wear." Wear 18.5 (1971): 413-419.
16. Waterhouse, R. B., and D. E. Taylor. "Fretting debris and the delamination theory of
wear." Wear 29.3 (1974): 337-344.
17. Quinn, T. F. J. "Oxidational wear modelling: I." Wear 153.1 (1992): 179-200.
18. Blau, Peter J. "Elevated-temperature tribology of metallic materials." Tribology
international 43.7 (2010): 1203-1208.
19. Dohda, Kuniaki, et al. "Tribology in metal forming at elevated
temperatures." Friction 3.1 (2015): 1-27.
20. Ganesan, V. Internal combustion engines. McGraw Hill Education (India) Pvt Ltd,
2012.
21. Gjika, Kostandin, L. San Andrés, and G. D. Larue. "Nonlinear dynamic behavior of
turbocharger rotor-bearing systems with hydrodynamic oil film and squeeze film
damper in series: prediction and experiment." Journal of Computational and
Nonlinear Dynamics 5.4 (2010): 041006.
22. FERGUSON, Colin R.; KIRKPATRICK, Allan T. Internal combustion engines:
applied thermosciences. John Wiley & Sons, 2015.

66
23. FABIŚ-DOMAGAŁA, Joanna. FMEA analysis of potential failures of turbochargers
for combustion engines by the use of the simularity method. Czasopismo Techniczne,
2015.
24. SAN ANDRES, Luis; KERTH, Jason. Thermal effects on the performance of floating
ring bearings for turbochargers. Proceedings of the Institution of Mechanical
Engineers, Part J: Journal of Engineering Tribology, 2004, 218.5: 437-450.
25. HOWARD, Samuel A. Rotordynamics and Design Methods of an Oil-Free
Turbocharger©. Tribology transactions, 1999, 42.1: 174-179.
26. BORICEAN, C. C.; RADU, Gh A. Diesel engine turbochargers: analysis and testing.
Bulletin of the Transilvania University of Brasov, Series I: Engineering Sciences,
2012, 5.1.
27. KOUTSOVASILIS, P.; DRIOT, N. Turbocharger rotors with oil-film bearings:
Sensitivity and optimization analysis in virtual prototyping. In: Proceedings of the
11th International Conference on Vibrations in Rotating Machines, Wiesbaden,
Germany. 2015. p. 23-25.
28. KNOTEK, J., et al. Influence of Turbine and Compressor Wheel Mass and Inertia on
the Rotor Dynamics of Turbocharger. Tribology in Industry, 2016, 38.1.
29. ΜΠΌΜΠΟΣ, Δημήτριος. Tribological design of nano/magnetorheological fluid
journal bearings. 2016. PhD Thesis.
30. Tanimoto, K., Kajihara, K. and Yanai, K., 2000. Performance of hybrid ceramic ball
bearing for turbochargers. Koyo Engineering Journal, 157, pp.21-31.
31. ZEPPEI, Dieter; KOCH, Silvio; ROHI, Amir. Ball Bearing Technology for Passenger
Car Turbochargers. MTZ worldwide, 2016, 77.11: 26-31.
32. Persson, Anders, Sture Hogmark, and Jens Bergström. "Thermal fatigue cracking of
surface engineered hot work tool steels." Surface and Coatings Technology 191.2
(2005): 216-227.
33. Garza-Montes-de-Oca, N.F. and Rainforth, W.M., 2009. Wear mechanisms
experienced by a work roll grade high speed steel under different environmental
conditions. Wear, 267(1), pp.441-448.
34. Fontalvo, G.A., Humer, R., Mitterer, C., Sammt, K. and Schemmel, I., 2006.
Microstructural aspects determining the adhesive wear of tool steels. Wear, 260(9),
pp.1028-1034.
35. So, H., 1996. Characteristics of wear results tested by pin-on-disc at moderate to high
speeds. Tribology international, 29(5), pp.415-423.
36. MILLER, Jay K. Turbo: Real world high-performance turbocharger systems.
CarTech Inc, 2008.

1
9. Appendix
A. Tribological conditions for each test
Cold tests Warm tests
test_1 test_2 test_3 test_4 test_14
Distance [m] 3000 6000 6000 6000 Distance [m] 6000
Rotational speed [RPM] 1900.0 1500.0 1239.1 1583.3 Rotational speed [RPM] 1910
Diameter [mm] 30 38 46 54 Diameter [mm] 110
1 rev [m] 0.094248 0.11938 0.144513 0.169646 1 rev [m] 545.4
Distance per minut [m/min] 179.07 179.07 179.07 268.61 Distance per minut [m/min] 11.0
Duration of the test [sec] 1005.19 2010.379 2010.379 1340.252 Duration of the test [sec] 0.9
Relativ speed 2.98 2.98 2.98 4.48 Relativ speed 17362.36
Total number of revolution 31831 50259 41519 35368 Total number of revolution
Load [kg] 0.7 0.7 1.2 0.7 Load [kg] 0.9
Disc nr_side prov prov prov prov Disc nr_side prov
test_5 test_6 test_7 test_8 test_20 test_21 test_22 test_23
Distance [m] 6000 6000 6000 6000 Distance [m] 6000 6000 6000 6000
RPM 1910 1193.662 1910 1910 RPM 1194 1194 1194 1194
Diameter wear track [m] 30 48 110 110 Diameter wear track [m] 48 48 48 48
Duration of the test [sec] 1999.9 2000.0 545.4 545.4 Duration of the test [sec] 1999.4 1999.4 1999.4 1999.4
Relative speed [m/s] 3.0 3.0 11.0 11.0 Relative speed [m/s] 3.0 3.0 3.0 3.0
Load [kg] 0.2 0.2 0.2 0.2 Load [kg] 0.2 0.2 0.9 0.9
Total number of laps 63662 39789 17362 17362 Total number of laps 39789 39789 39789 39789
Disc nr_side 1_1 1_1 1_1 1_2 Disc nr_side 1a_1 2a_1 3a_1 4a_1
test_9 test_10 test_11 test_12 test_24 test_25 test_26 test_27
Distance [m] 6000 6000 6000 6000 Distance [m] 6000 6000 6000 6000
RPM 1910 1910 1194 1910 RPM 1910 1910 1910 1910
Diameter wear track [m] 110 30 48 30 Diameter wear track [m] 110 110 110 110
Duration of the test [sec] 545.4 1999.9 1999.4 1999.9 Duration of the test [sec] 545.4 545.4 545.4 545.4
Relative speed [m/s] 11.0 3.0 3.0 3.0 Relative speed [m/s] 11.0 11.0 11.0 11.0
Load [kg] 0.9 0.9 0.9 0.2 Load [kg] 0.2 0.2 0.9 0.9
Total number of laps 17362 63662 39789 63662 Total number of laps 17362 17362 17362 17362
Disc nr_side 2_1 2_1 2_1 3_1 Disc nr_side 2a_2 1a_2 3a_2 4a_2
test_13 test_15 test_16 test_28 test_29
Distance [m] 6000 6000 6000 Distance [m] 6000 6000
RPM 1910 1910 1910 RPM 1910 1910
Diameter wear track [m] 110 30 30 Diameter wear track [m] 110 110
Duration of the test [sec] 545.4 1999.9 1999.9 Duration of the test [sec] 545.4 545.4
Relative speed [m/s] 11.0 3.0 3.0 Relative speed [m/s] 11.0 11.0
Load [kg] 0.9 1.1 1.1 Load [kg] 0.2 0.2
Total number of laps 17362 63662 63662 Total number of laps 17362 17362
Disc nr_side 3_1 1a_2 3a_2 Disc nr_side 1a_1 2a_1
test_17 test_18 test_19
Distance [m] 6000 6000 6000
RPM 1910 1910 1194
Diameter wear track [m] 30 110 48
Duration of the test [sec] 1999.9 545.4 1999.4
Relative speed [m/s] 3.0 11.0 3.0
Load [kg] 1.1 0.2 0.9
Total number of laps 63662 17362 39789
Disc nr_side 5_1 5_1 5_1
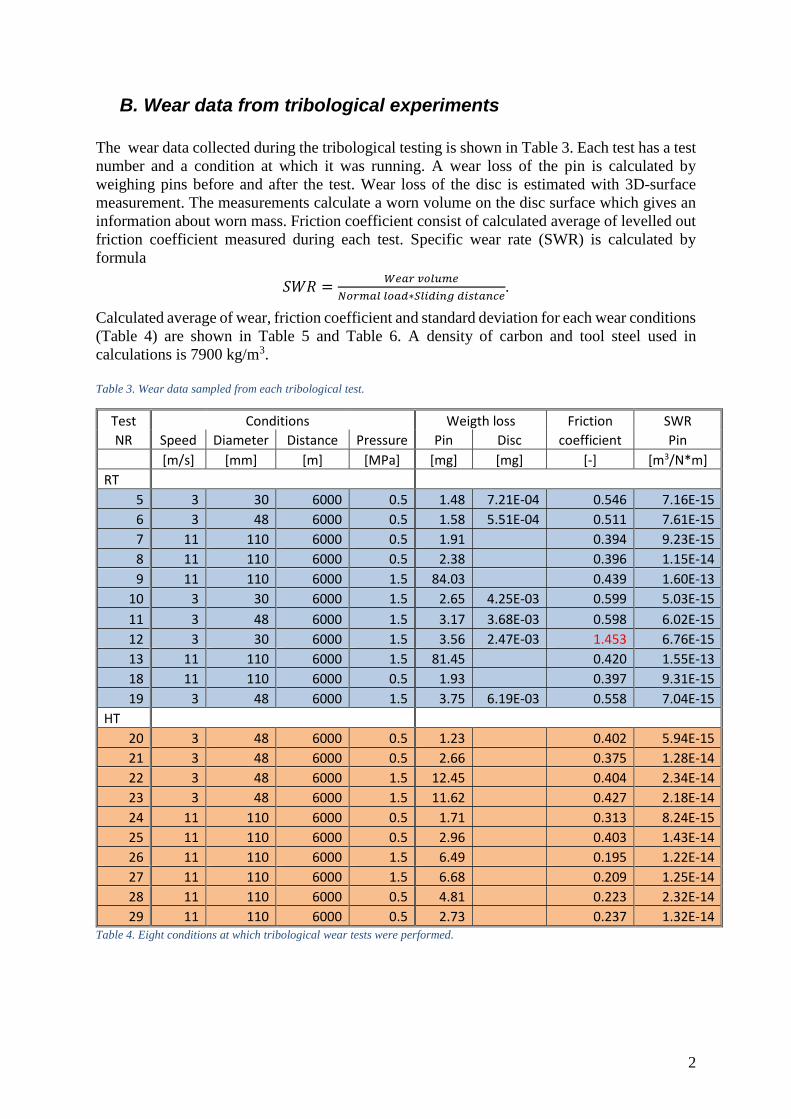
2
B. Wear data from tribological experiments
The wear data collected during the tribological testing is shown in Table 3. Each test has a test
number and a condition at which it was running. A wear loss of the pin is calculated by
weighing pins before and after the test. Wear loss of the disc is estimated with 3D-surface
measurement. The measurements calculate a worn volume on the disc surface which gives an
information about worn mass. Friction coefficient consist of calculated average of levelled out
friction coefficient measured during each test. Specific wear rate (SWR) is calculated by
formula
𝑆𝑊𝑅 =𝑊𝑒𝑎𝑟 𝑣𝑜𝑙𝑢𝑚𝑒
𝑁𝑜𝑟𝑚𝑎𝑙 𝑙𝑜𝑎𝑑∗𝑆𝑙𝑖𝑑𝑖𝑛𝑔 𝑑𝑖𝑠𝑡𝑎𝑛𝑐𝑒.
Calculated average of wear, friction coefficient and standard deviation for each wear conditions
(Table 4) are shown in Table 5 and Table 6. A density of carbon and tool steel used in
calculations is 7900 kg/m3.
Table 3. Wear data sampled from each tribological test.
Test Conditions Weigth loss Friction SWR
NR Speed Diameter Distance Pressure Pin Disc coefficient Pin
[m/s] [mm] [m] [MPa] [mg] [mg] [-] [m3/N*m]
RT
5 3 30 6000 0.5 1.48 7.21E-04 0.546 7.16E-15
6 3 48 6000 0.5 1.58 5.51E-04 0.511 7.61E-15
7 11 110 6000 0.5 1.91 0.394 9.23E-15
8 11 110 6000 0.5 2.38 0.396 1.15E-14
9 11 110 6000 1.5 84.03 0.439 1.60E-13
10 3 30 6000 1.5 2.65 4.25E-03 0.599 5.03E-15
11 3 48 6000 1.5 3.17 3.68E-03 0.598 6.02E-15
12 3 30 6000 1.5 3.56 2.47E-03 1.453 6.76E-15
13 11 110 6000 1.5 81.45 0.420 1.55E-13
18 11 110 6000 0.5 1.93 0.397 9.31E-15
19 3 48 6000 1.5 3.75 6.19E-03 0.558 7.04E-15
HT
20 3 48 6000 0.5 1.23 0.402 5.94E-15
21 3 48 6000 0.5 2.66 0.375 1.28E-14
22 3 48 6000 1.5 12.45 0.404 2.34E-14
23 3 48 6000 1.5 11.62 0.427 2.18E-14
24 11 110 6000 0.5 1.71 0.313 8.24E-15
25 11 110 6000 0.5 2.96 0.403 1.43E-14
26 11 110 6000 1.5 6.49 0.195 1.22E-14
27 11 110 6000 1.5 6.68 0.209 1.25E-14
28 11 110 6000 0.5 4.81 0.223 2.32E-14
29 11 110 6000 0.5 2.73 0.237 1.32E-14 Table 4. Eight conditions at which tribological wear tests were performed.

3
Wear condition Temperature Speed Diameter Distance Pressure Load
NR [°C] [m/s] [mm] [m] [MPa] [kg]
1 25 3 30-48 6000 0.5 0.2
2 25 3 30-48 6000 1.5 0.9
3 25 11 110 6000 0.5 0.2
4 25 11 110 6000 1.5 0.9
5 300 3 48 6000 0.5 0.2
6 300 3 48 6000 1.5 0.9
7 300 11 110 6000 0.5 0.2
8 300 11 110 6000 1.5 0.9
Table 5. The calculated average value at each tribological wear condition.
Wear condition
Mean value
Pin Disc Friction Pin SWR
NR [mg] [mg] coefficient [mm^3/N*m]
1 1.53 6.36E-04 0.53 7.39E-06
2 3.28 4.15E-03 0.59 6.21E-06
3 2.07 0.40 1.00E-05
4 82.74 0.43 1.57E-04
5 1.95 0.39 9.40E-06
6 12.04 0.42 2.26E-05
7 2.33 0.36 1.13E-05
8 6.59 0.20 1.24E-05
Table 6. Calculated standard deviation of average value at each tribological wear condition.
Wear condition
Standard deviation
Mass pin Mass Disc Friction Pin SWR
NR [mg] [mg] coefficient [mm^3/N*m]
1 0.03 6.01E-05 0.01 1.61E-07
2 0.24 7.75E-04 0.01 4.50E-07
3 0.13 0.00 6.40E-07
4 0.91 0.01 1.73E-06
5 0.51 0.01 2.44E-06
6 0.29 0.01 5.48E-07
7 0.44 0.03 2.15E-06
8 0.07 0.00 1.23E-07

4
C. Disc hardness measurement
The hardness of discs is taken before and after tribological tests. Four hardness measurements
are performed at randomly selected discs at random places before tests. After the HT tests the
hardness of discs surface taken on three discs at three randomly selected places, see Table 7.
Hardness measurements of wear track after the tests can be seen in Table 8. The measurement
is taken on brittle oxide layer which in some cases broke during the measurement.
Table 7. Hardness of disc tool steel material.
All measurements in HV0.025
Original discs 688 647 672 672
Disc 1a 672 672 549
Disc 2a 642 633 672
Disc 3a 633 683 672
Table 8. Hardness measurement of disc wear tracks after performed tribological test.
Test NR
All measurements in HV0.025
Mean value
STD
5 633 619 642 647 635 12
6 652 667 652 652 656 8
7 496 483 503 493 494 8
8 580 576 638 593 597 28
9 683 683 638 693 674 25
10 642 615 624 610 623 14
17 783 775 801 763 781 16
18 704 683 693 672 688 14
20 815 843 788 937 846 65
21 829 775 858 715 794 63
22 683 1008 858 904 863 136
23 858 801 788 801 812 31
24 888 815 815 693 803 81
25 1047 872 815 971 926 103
26 1027 788 662 715 798 161
27 1252 801 954 843 963 204
28 704 888 872 937 850 101
29 920 801 750 715 797 90

5
D. EDS analysis of disc surface
The EDS analysis have been performed on the discs. To perform the analyse discs were cut
along wear track. The cut surface was polished and cleaned with acetone. Further it was taken
pictures of the cut surface in SEM with 30 kV, see in Table 9. The EDS analyse is performed
at two points to compare a content of material.
Table 9. Cutting view of Disc 3a test 22, 3m/s high load HT.
Spectrum 1
Element Weight% Atomic%
C K 46.03 28.90
O K 84.16 39.67
V K 6.70 0.99
Cr K 11.77 1.71
Fe K 195.17 26.35
Mo L 17.65 1.39
W M 24.46 1.00
Totals 385.93
Spectrum 3
Element Weight% Atomic%
C K 71.95 37.84
O K 9.89 3.91
V K 10.22 1.27
Cr K 25.42 3.09
Mn K 2.44 0.28
Fe K 450.19 50.92
Mo L 24.37 1.60
W M 32.05 1.10
Totals 626.54
Additional EDS analyse is performed on the surface of the disc where a wear track is created.
The test focus on analysing the content of material that have been applied to the surface of
the disc. The EDS performed at three different point to be able to confirm the difference in
content, see Table 10. The analyse is performed at 30kV.
Disc rotation Disc rotation
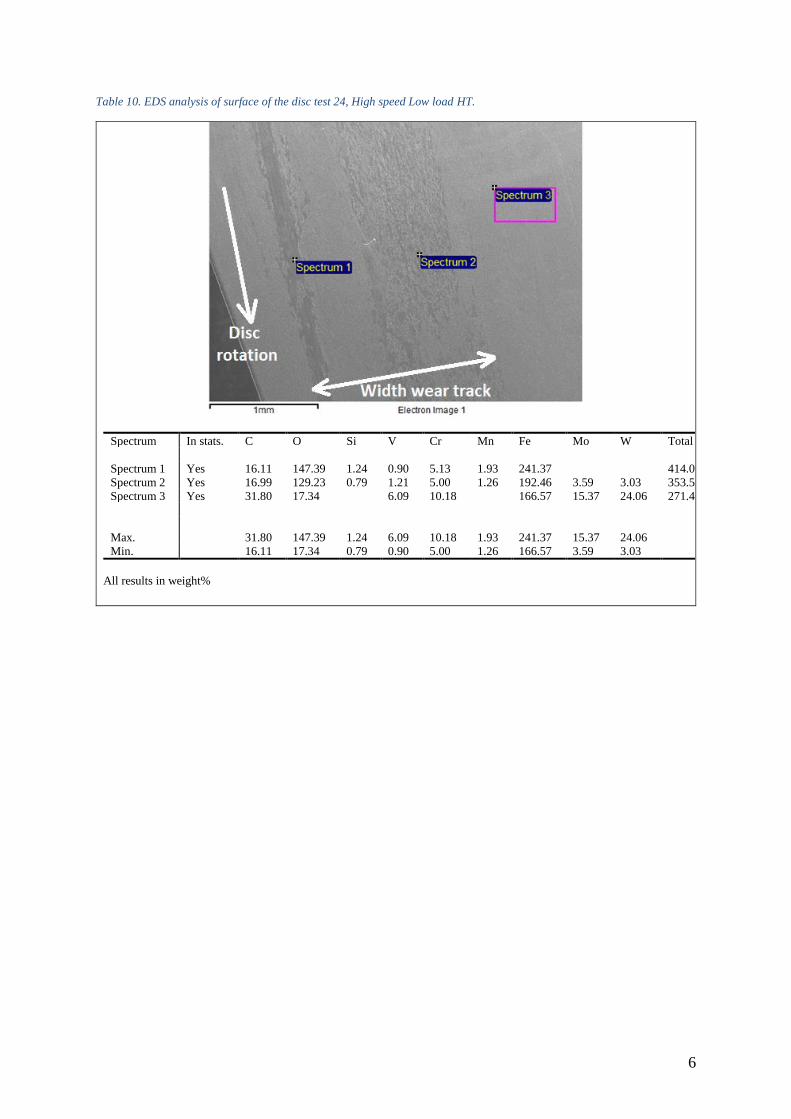
6
Table 10. EDS analysis of surface of the disc test 24, High speed Low load HT.
Spectrum In stats. C O Si V Cr Mn Fe Mo W Total
Spectrum 1 Yes 16.11 147.39 1.24 0.90 5.13 1.93 241.37 414.07
Spectrum 2 Yes 16.99 129.23 0.79 1.21 5.00 1.26 192.46 3.59 3.03 353.57
Spectrum 3 Yes 31.80 17.34 6.09 10.18 166.57 15.37 24.06 271.43
Max. 31.80 147.39 1.24 6.09 10.18 1.93 241.37 15.37 24.06
Min. 16.11 17.34 0.79 0.90 5.00 1.26 166.57 3.59 3.03
All results in weight%
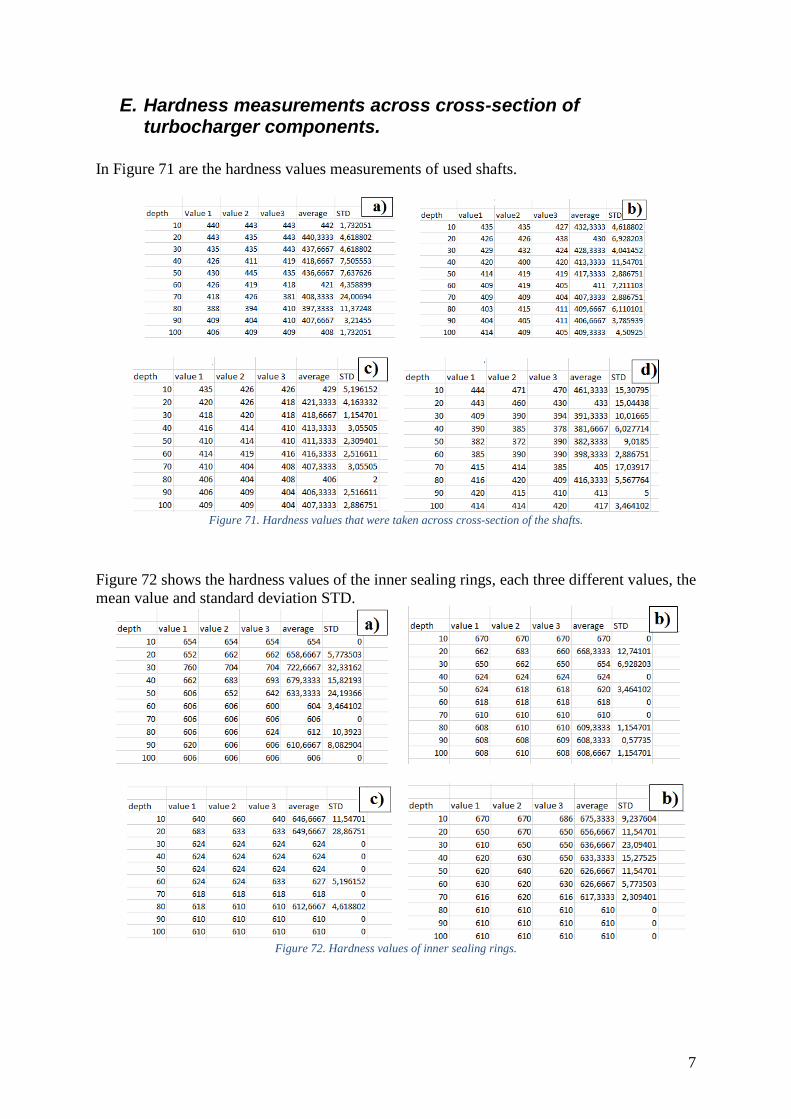
7
E. Hardness measurements across cross-section of turbocharger components.
In Figure 71 are the hardness values measurements of used shafts.
Figure 71. Hardness values that were taken across cross-section of the shafts.
Figure 72 shows the hardness values of the inner sealing rings, each three different values, the
mean value and standard deviation STD.
Figure 72. Hardness values of inner sealing rings.

8
Hardness values of outer sealing rings, the values that are shown in Figure 73 below are taken
from the part that is closer to the inner sealing ring, can be seen in Figure 6 marked with 4.
Figure 73. Hardness values of outer sealing rings, from the side of the outer rings that’s closer to the inner sealing rings.
Hardness of the outer sealing rings was measured even from the turbine wheel. The
measurements values are shown in Figure 74. The hardness from the turbine wheel side are
shown in Figure 6 the position is marked with 4.
Figure 74. Hardness values of outer sealing rings, the measurements are taken from the turbine/exhaust gas side, as it can
be seen the hardness values are generally higher than the hardness values of inner sealing rings.
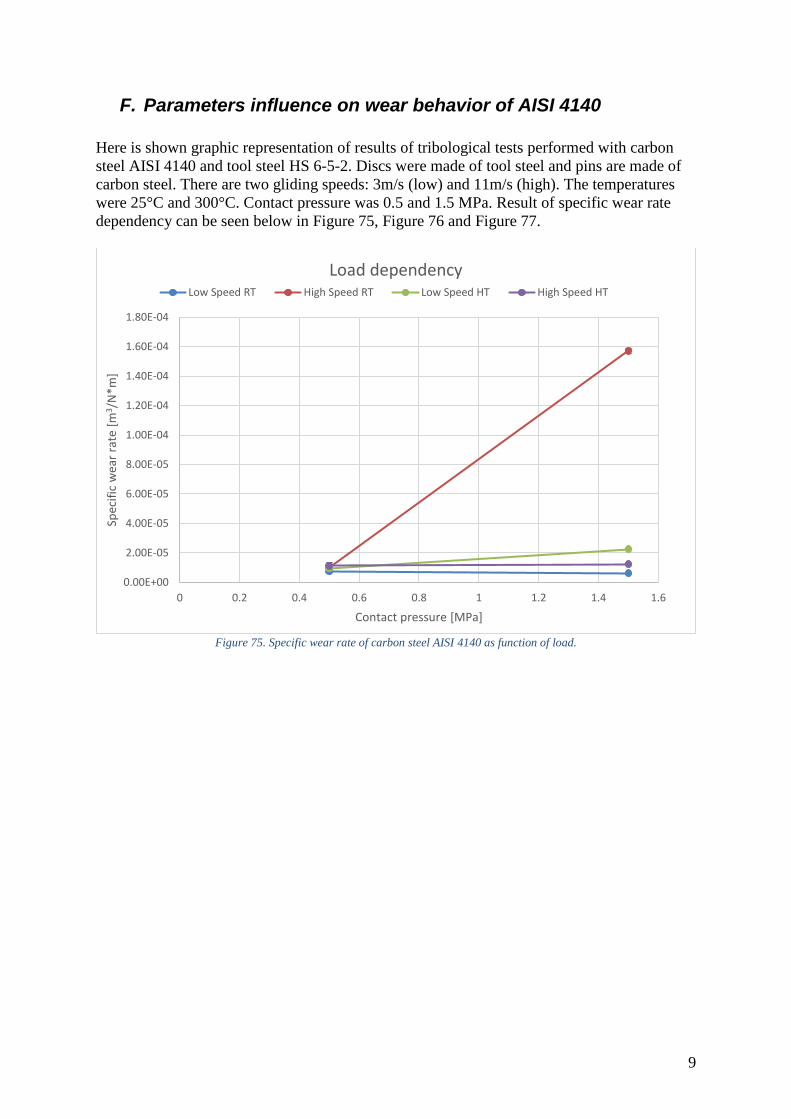
9
F. Parameters influence on wear behavior of AISI 4140
Here is shown graphic representation of results of tribological tests performed with carbon
steel AISI 4140 and tool steel HS 6-5-2. Discs were made of tool steel and pins are made of
carbon steel. There are two gliding speeds: 3m/s (low) and 11m/s (high). The temperatures
were 25°C and 300°C. Contact pressure was 0.5 and 1.5 MPa. Result of specific wear rate
dependency can be seen below in Figure 75, Figure 76 and Figure 77.
Figure 75. Specific wear rate of carbon steel AISI 4140 as function of load.
0.00E+00
2.00E-05
4.00E-05
6.00E-05
8.00E-05
1.00E-04
1.20E-04
1.40E-04
1.60E-04
1.80E-04
0 0.2 0.4 0.6 0.8 1 1.2 1.4 1.6
Spec
ific
wea
r ra
te [
m3 /
N*m
]
Contact pressure [MPa]
Load dependencyLow Speed RT High Speed RT Low Speed HT High Speed HT

10
Figure 76. Specific wear rate of carbon steel AISI 4140 as function of gliding speed.
Figure 77. Specific wear rate of carbon steel AISI 4140 as function of temperature.
0.00E+00
2.00E-05
4.00E-05
6.00E-05
8.00E-05
1.00E-04
1.20E-04
1.40E-04
1.60E-04
1.80E-04
0 2 4 6 8 10 12
Spec
ific
wea
r ra
te [
m3/N
*m]
Speed [m/s]
Speed dependency
Low Load RT High Load RT Low Load HT High Load HT
0.00E+00
2.00E-05
4.00E-05
6.00E-05
8.00E-05
1.00E-04
1.20E-04
1.40E-04
1.60E-04
1.80E-04
0 50 100 150 200 250 300 350
Spec
ific
wea
r ra
te [
m3 /
N*m
]
Temperature [°C]
Temperature dependency
Low Speed Low Load High Speed Low Load Low Speed High Load High Load High Speed