Trent Lukaczyk AA 241B Final Report - Stanford...
10
Transcript of Trent Lukaczyk AA 241B Final Report - Stanford...
Trent Lukaczyk [email protected]
1. Supersonic Business Jet Summary The major role of this supersonic business jet will be that of a time-saving form of transportation by reducing the large opportunity costs associated with the time lost while traveling for high-pay business executives. The proposed aircraft, with a design cruise speed of Ma 1.7 and range of 4200 nmi, would reduce the trans-American travel time from of current business jets by more than half - from six down to three hours. To reduce weight and complexity, and target the business jet market, it is specified to have a capacity of 8-12 passengers and a max gross weight of 41,000 kg. To allow use at medium sized or regional airports, it will have a maximum field length of 1850m (6500 ft), which will be determined by the airplane's max lift coefficient. Given an implicit requirement for 45% total travel time reduction, a supersonic passenger jet must be able to fly at least Ma 1.6 over land, which will constrain boom loudness and drag. Finally, high altitude flight greater than 15 km is desirable to bring down max dynamic pressure, increase equivalent land speed, and avoid existing air traffic. This altitude will be constrained by the airplane's maximum cruise lift coefficient and engine performance.
2. Optimization The matlab distribution of PASS was wrapped in an SLSQP Gradient-Based Optimizer to improve upon the direct analysis performed by hand over the last 6 months. For the most part, the analysis in PASS matches that of the hand analysis, but can perform several hundred evaluations a second. The main approach used to take advantage of this design tool was that of an inner-loop optimizer. Only specific variables were given to the optimizer to modify, while the designer was left to adjust other higher level design variables. The main goal of this study was to identify a feasible design which minimizes ticket price, which ties together the multiple objectives of minimizing weight and fuel consumption, while maintaining a minimum range and maximum balanced field length. Additional constraints were included to maintain stability and control of the aircraft.
The relevant design inputs objectives and constraints are printed below.
Design Variable Min Max Primarily Effects Max Take Off Weight 50,000 lbs 12,000 lbs Range Wing Reference Area 100 ft2 2000 ft2 Lift, Range SLS Thrust 10,000 lbf 40,000 lbf Climb rate, Range Wing Aspect Ratio 2.0 4.0 Induced drag, Range Initial Cruise Altitude 40,000 ft 56,000 ft Range Final Cruise Altitude 40,000 ft 56,000 ft Range Wing Location (x/fuse len.) 0.2 0.6 Static Stability Margin Horizontal Tail Area Ratio 0.15 0.5 Static Stability Margin Wing Sweep 20° 58° Drag, Range Wing t/c 0.02 0.15 Drag, Range Takeoff Mach Number 0.1 0.25 Take off field length Landing Mach Number 0.1 0.25 Landing field length Zero Fuel Weight ratio 0.6 0.9 Range, Landing field length

Trent Lukaczyk [email protected]
Constraints Min Max Relevance Cruise Range 4200 nmi 60000 nmi Design specification Take off field length 3000 ft 5900 ft Design specification Landing field length 3000 ft 5900 ft Design specification Static Stability Margin 0.2 0.5 Flight Stability, Safety Vertical Tail CL, engine out -1.0 1.0 Safety, Emergency Second Segment Climb Grad 0.024 0.10 Federal Regulation Landing Gear Location 0.5 1.0 Taxi Stability Drag/Thrust 0.0 0.88 Ability to climb at cruise Tail CL margins 0.0 2.0 Stability and trim during climb Payload margins 1500 lbs 10,000 lbs Growth of the aircraft
Higher Level Variables Relevance Engine SFC
Low order engine model, requires tuning
Engine weight/thrust ratio
Low order engine model, requires tuning
Tail Sweep Angles Should be greater than main wing sweep
Note that the take-off and landing field length requirements are tighter than the design specification to explore a more conservative design.
The initial design provided from the hand analysis had a range of 2850 nmi. Initially this was brought into feasibility by reducing the engine's specific fuel consumption. Additionally, the aircraft had a large stability margin, which was overestimated because the effect trimming by fuel weight management was not considered. The optimizer was able to bring the range into a feasible region, while reducing the static margin down to the constraint limit.
The resulting aircraft from this study had a large main wing sweep, and was larger than the tail sweeps. For additional safety and stability, it is better for the tail sweeps to be larger, to delay shocks in subsonic flight. The angles of the tail sweeps were increased to two-degrees above the current main wing sweep angle, and the main wing sweep was constrained to be no larger than its current angle. The optimizer was able to adjust the design given this update.
The landing gear then had to be moved to accommodate better on-ground stability, for example while taxing. This was accomplished by adjusting the landing gear location constraint. Finally, the specific fuel consumption was increased, as there was still a large amount of room left in the maximum take-off weight budget, and a tsfc of 0.93 is perhaps more reasonable for a supersonic turbine bypass engine. This optimization was responsible for generating the final design. A summary of the design path is shown in the table below.
Trent Lukaczyk [email protected]
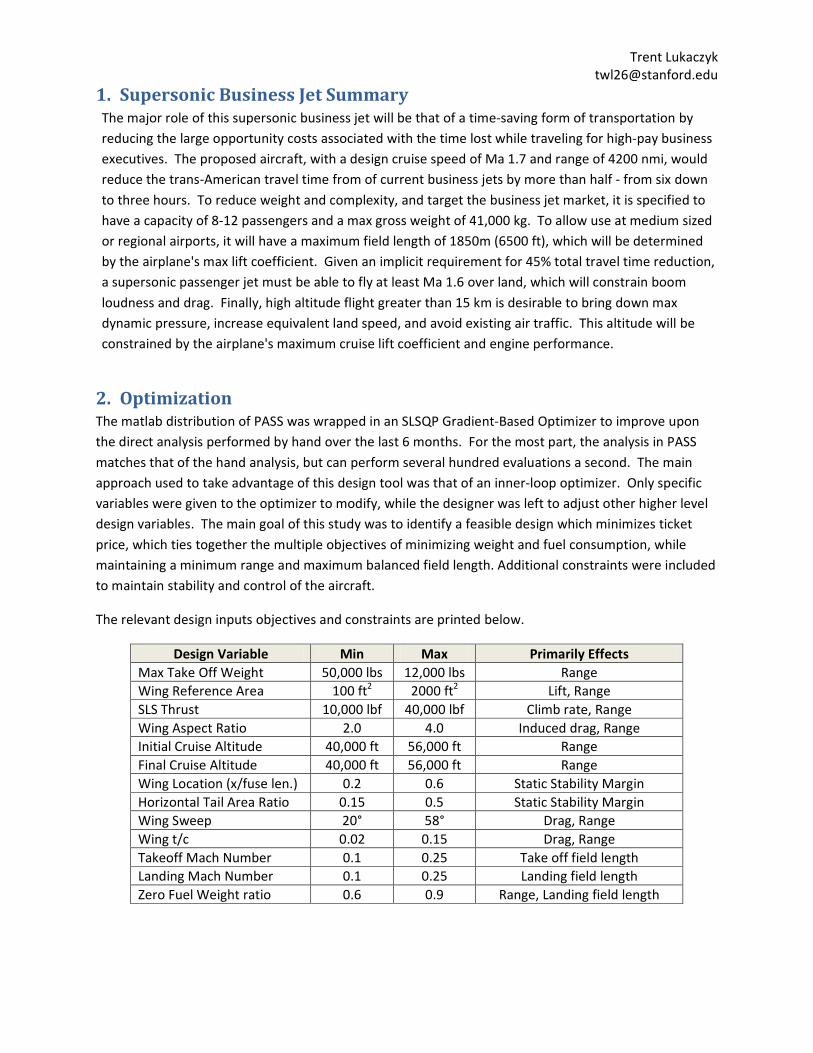
Decision Wing Area ft2
Range nmi
Static Margin
MTOW lbs
Ticket Price $
Initial Design
1510 2850 0.38 90,300 2632
Optimize Initial Design lower tsfc to meet range
616 4200 0.20 59,100 1879
Set Tail Sweeps = 58° Constrain Wing sweep < 56°
620 4200 0.20 59,400 1882
Constrain Landing Gear x/c > 0.5
651 4200 0.20 62,050 1909
Final Design, Raise tsfc = 0.93
1130 4200 0.20 90,800 2349
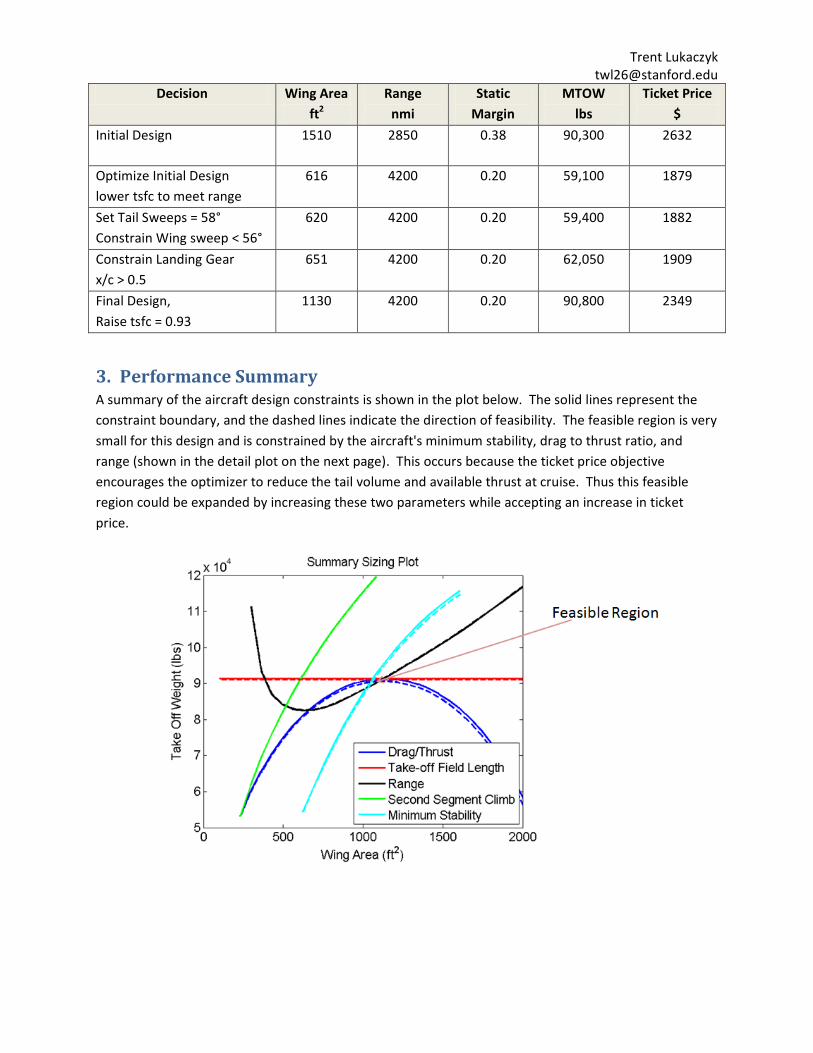
3. Performance Summary A summary of the aircraft design constraints is shown in the plot below. The solid lines represent the constraint boundary, and the dashed lines indicate the direction of feasibility. The feasible region is very small for this design and is constrained by the aircraft's minimum stability, drag to thrust ratio, and range (shown in the detail plot on the next page). This occurs because the ticket price objective encourages the optimizer to reduce the tail volume and available thrust at cruise. Thus this feasible region could be expanded by increasing these two parameters while accepting an increase in ticket price.
Trent Lukaczyk [email protected]
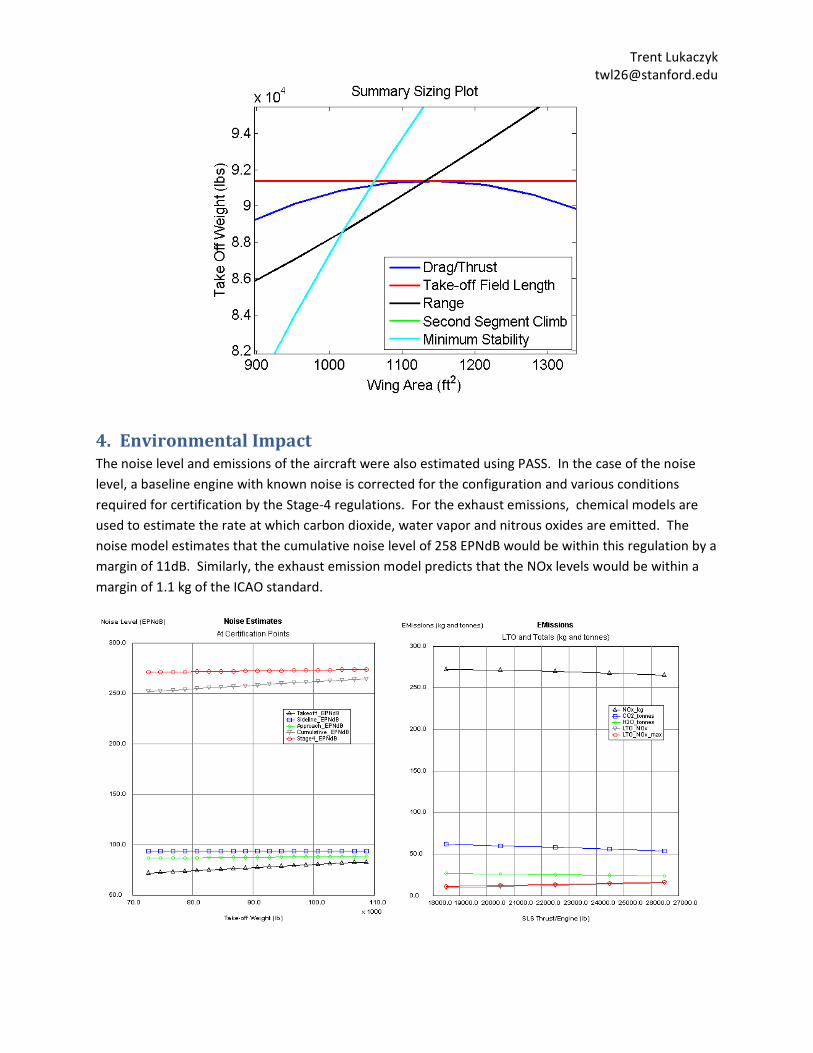
4. Environmental Impact The noise level and emissions of the aircraft were also estimated using PASS. In the case of the noise level, a baseline engine with known noise is corrected for the configuration and various conditions required for certification by the Stage-4 regulations. For the exhaust emissions, chemical models are used to estimate the rate at which carbon dioxide, water vapor and nitrous oxides are emitted. The noise model estimates that the cumulative noise level of 258 EPNdB would be within this regulation by a margin of 11dB. Similarly, the exhaust emission model predicts that the NOx levels would be within a margin of 1.1 kg of the ICAO standard.
Trent Lukaczyk [email protected]
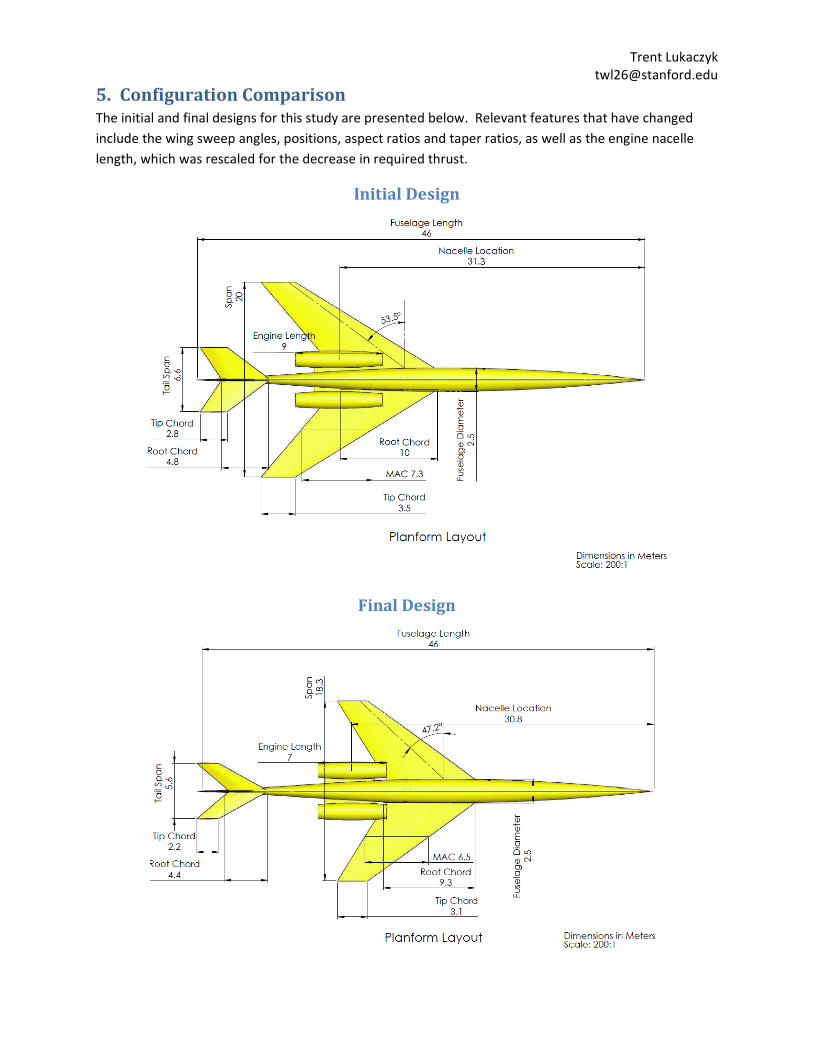
5. Configuration Comparison The initial and final designs for this study are presented below. Relevant features that have changed include the wing sweep angles, positions, aspect ratios and taper ratios, as well as the engine nacelle length, which was rescaled for the decrease in required thrust.
Initial Design
Final Design
Trent Lukaczyk [email protected]
6. Aerodynamic Comparison
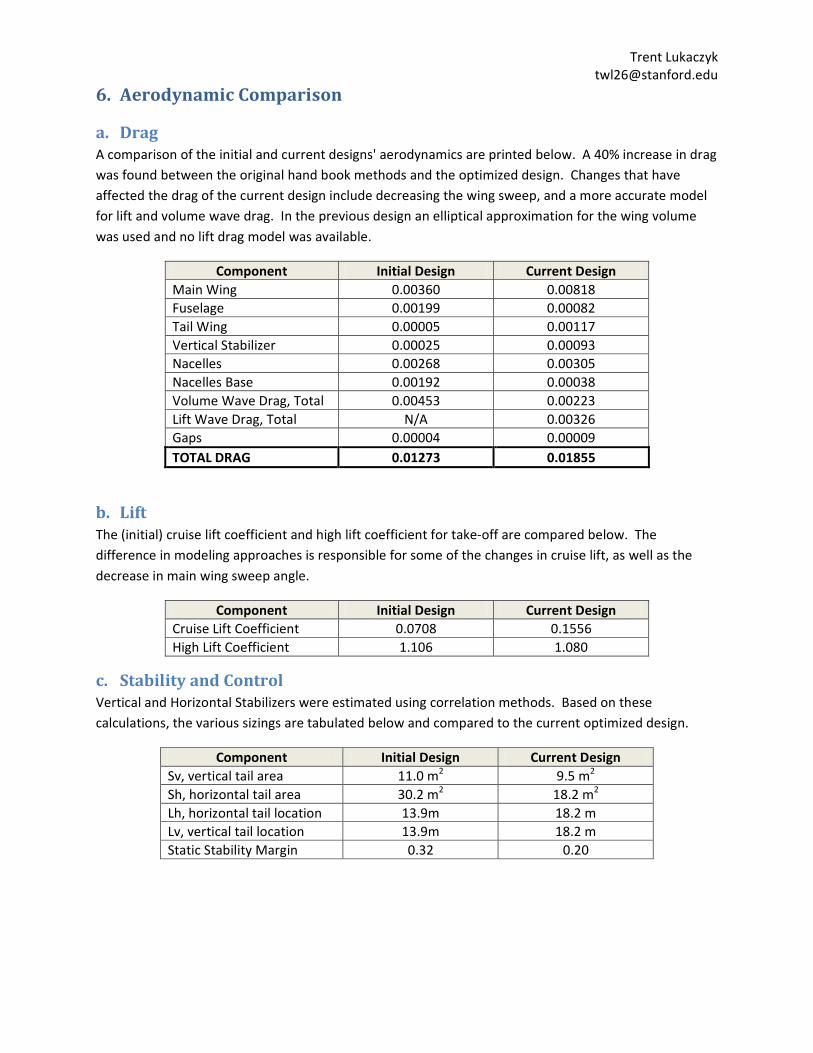
a. Drag A comparison of the initial and current designs' aerodynamics are printed below. A 40% increase in drag was found between the original hand book methods and the optimized design. Changes that have affected the drag of the current design include decreasing the wing sweep, and a more accurate model for lift and volume wave drag. In the previous design an elliptical approximation for the wing volume was used and no lift drag model was available.
Component Initial Design Current Design Main Wing 0.00360 0.00818 Fuselage 0.00199 0.00082 Tail Wing 0.00005 0.00117 Vertical Stabilizer 0.00025 0.00093 Nacelles 0.00268 0.00305 Nacelles Base 0.00192 0.00038 Volume Wave Drag, Total 0.00453 0.00223 Lift Wave Drag, Total N/A 0.00326 Gaps 0.00004 0.00009 TOTAL DRAG 0.01273 0.01855
b. Lift The (initial) cruise lift coefficient and high lift coefficient for take-off are compared below. The difference in modeling approaches is responsible for some of the changes in cruise lift, as well as the decrease in main wing sweep angle.
Component Initial Design Current Design Cruise Lift Coefficient 0.0708 0.1556 High Lift Coefficient 1.106 1.080
c. Stability and Control Vertical and Horizontal Stabilizers were estimated using correlation methods. Based on these calculations, the various sizings are tabulated below and compared to the current optimized design.
Component Initial Design Current Design Sv, vertical tail area 11.0 m2 9.5 m2 Sh, horizontal tail area 30.2 m2 18.2 m2 Lh, horizontal tail location 13.9m 18.2 m Lv, vertical tail location 13.9m 18.2 m Static Stability Margin 0.32 0.20

Trent Lukaczyk [email protected]
7. Propulsion Take off and cruise thrusts are compared below. A loose correlation method is used on old engine data in this approach. Significant improvement in fidelity could be available for these estimates.
Item Initial Design Current Design Take off Thrust 58,000 lbf 22,960 lbf Cruise Thrust (55,000 ft) 18,500 lbf 12,000 lbf
8. Weights Initial weights were estimated using the weight index methods based on previous aircraft. The results are tabulated below and compared to PASS results where possible.
Component Initial Design (lbs) Current Design (lbs) Wing 13711 - Horizontal Tail 3016 - Vertical Tail 1867 - Fuselage 10081 - Landing Gear 3612 - Surface Controls 1463 - Propulsion 8748 - Instruments 100 - Hydraulics 897 - Electrical + Electronics 404 - Furnishing 694 - HVAC 120 - MANF. EMPTY WEIGHT 43,423 46,589 Operational Items 224 - Flight Crew 230 - Flight Attendants 210 - Payload 1800 - ZERO FUEL WEIGHT 46,877 49,109 Reserve and Safety Fuel 3970 4247 LANDING WEIGHT 49,647 53,356 Fuel Weight Allowance 40653 37,444 TAKEOFF GROSS WEIGHT 90300 90800
9. Conclusions This report has presented the current results of a preliminary design study on an eight-passenger supersonic business jet. Using handbook methods embedded in the PASS analysis tool, a feasible design was identified with a range of 4200nmi and a balanced field length of 5900ft.
Additional studies are possible especially in identifying the sensitivity of the results to changes in the engine model. It was noted during the study (but not presented in this report) that the maximum takeoff weight and ticket price were very sensitive to the engine weight scaling parameter, and the

Trent Lukaczyk [email protected]
engine specific fuel consumption. As mentioned earlier, the engine model is perhaps the weakest model of the analysis, as a very loose correlation method is used on old engine data. Significant improvement in fidelity could be available for these estimates and show be investigated further.
Additional future studies could investigate the wave drag of this aircraft in more detail. Specifically, a simple Euler CFD simulation could be used to estimate the additional wave drag that comes from the interaction of the aircraft components. This could be used to update the area ruling factor.