Trends in the livestock sector - Food and Agriculture … 3 Trends in the livestock sector The world...
16
PART 3 Trends in the livestock sector The world food economy is increasingly driven by the shift in diet and food consumption patterns towards live- stock products. In the last few decades, in the develop- ing countries of Asia - where the bulk of the world pop- ulation increase has taken place - consumption of meat has been growing at over 4 percent per annum, and that of milk and dairy products between 2 to 3 percent per an- num. Aggregate agricultural output is being affected by these trends, not only through the increase in livestock production per se, but also through the linkage of live- stock production to the crop sector that supplies feed- stuffs, mainly cereals and oilseeds, as well as the fish- eries sector. Globally, livestock production is the largest user of agri- cultural land. On the negative side, there are environ- mental implications associated with the expansion of livestock production. For example, through the expan- sion of land for livestock development, sector growth has been a prime force in deforestation in Latin America and the Caribbean, and in overgrazing in other regions. In- tensive, large-scale livestock operations, mostly in the industrial countries but increasingly also in the develop- ing ones, are a major source of environmental problems through effluent production. In parallel, growth in the ruminant sector contributes to greenhouse gas concen- trations in the atmosphere through methane emissions and nitrous oxide from the waste of grazing animals. The rapid growth in the meat sector has been under- pinned by rising demand for poultry meat, which has consistently increased at around three times the rate of population growth over each of the past five decades. As for other meat sectors, per capita consumption growth has been stagnant or non-existent, especially in rumi- nant meat (cattle, sheep and goats) and pork (when China is excluded). Moreover, in many developing countries, where the need to increase protein consumption is greatest, the produc- tive sector has not participated in the “livestock revolu- tion”. There are, for instance, still about 20 developing countries whose per capita meat consumption is below 10 kg, compared to an average of 80 kg among devel- oped countries. Cultural or religions reasons may ex- plain this feature in some countries, but low productive capacities are, by and large, to blame in many others. Growth of world milk production and consumption has been far less buoyant. Until recently, per capita growth was largely stagnant, unchanged for several decades. Developing countries continue to have per capita con- sumption well below that of the industrial countries (partly reflecting consumption habits as well as low in- comes and poverty), but the gap is gradually closing, es- pecially in East and in South Asia. In East Asia, for ex- ample, per capita dairy intake has more than doubled in the past decade. Map 46: No Data 0 - 1 Source: FAO, Statistics Division (FAOSTAT) Metalink: P3.FEED.FAO.ESS.MT.QP, p. 273 → The world produced 293 million tonnes of meat in 2010 → The Americas lead the way as the high- est producing region → But growing industry intensification is boosting output to meet demand in other areas, particularly in Asia 198
Transcript of Trends in the livestock sector - Food and Agriculture … 3 Trends in the livestock sector The world...

PART 3
Trends in the livestock sector
The world food economy is increasingly driven by theshift in diet and food consumption patterns towards live-stock products. In the last few decades, in the develop-ing countries of Asia - where the bulk of the world pop-ulation increase has taken place - consumption of meathas been growing at over 4 percent per annum, and thatof milk and dairy products between 2 to 3 percent per an-num. Aggregate agricultural output is being affected bythese trends, not only through the increase in livestockproduction per se, but also through the linkage of live-stock production to the crop sector that supplies feed-stuffs, mainly cereals and oilseeds, as well as the fish-eries sector.
Globally, livestock production is the largest user of agri-cultural land. On the negative side, there are environ-mental implications associated with the expansion oflivestock production. For example, through the expan-sion of land for livestock development, sector growth hasbeen a prime force in deforestation in Latin America andthe Caribbean, and in overgrazing in other regions. In-tensive, large-scale livestock operations, mostly in theindustrial countries but increasingly also in the develop-ing ones, are a major source of environmental problemsthrough effluent production. In parallel, growth in theruminant sector contributes to greenhouse gas concen-trations in the atmosphere through methane emissionsand nitrous oxide from the waste of grazing animals.
The rapid growth in the meat sector has been under-pinned by rising demand for poultry meat, which hasconsistently increased at around three times the rate ofpopulation growth over each of the past five decades. Asfor other meat sectors, per capita consumption growthhas been stagnant or non-existent, especially in rumi-nant meat (cattle, sheep and goats) and pork (whenChina is excluded).
Moreover, in many developing countries, where the needto increase protein consumption is greatest, the produc-tive sector has not participated in the “livestock revolu-tion”. There are, for instance, still about 20 developingcountries whose per capita meat consumption is below10 kg, compared to an average of 80 kg among devel-oped countries. Cultural or religions reasons may ex-plain this feature in some countries, but low productivecapacities are, by and large, to blame in many others.
Growth of world milk production and consumption hasbeen far less buoyant. Until recently, per capita growthwas largely stagnant, unchanged for several decades.Developing countries continue to have per capita con-sumption well below that of the industrial countries(partly reflecting consumption habits as well as low in-comes and poverty), but the gap is gradually closing, es-pecially in East and in South Asia. In East Asia, for ex-ample, per capita dairy intake has more than doubled inthe past decade.
Map 46:
No Data 0 − 1 1 − 500 500 − 2000 2000 − 8000 8000 − 10000
Meat producing countries (thousand tonnes, 2010)
Source: FAO, Statistics Division (FAOSTAT)
Metalink: P3.FEED.FAO.ESS.MT.QP, p. 273
→ The world produced 293 million tonnesof meat in 2010
→ The Americas lead the way as the high-est producing region
→ But growing industry intensification isboosting output to meet demand inother areas, particularly in Asia
198

TRENDS IN THE LIVESTOCK SECTOR
No Data 0 − 1 1 − 500 500 − 2000 2000 − 8000 8000 − 10000
Meat producing countries (thousand tonnes, 2010)
Chart 79: Meat production on the rise in developing countries, while developed countriesapproach saturation
Per capita meat production (1992-2010)
kg
84868890
23262932
1995 2000 2005 2010
Developed
Developing
Developed Developing
Source: FAO, Statistics Division (FAOSTAT)
Metalink: P3.FEED.FAO.ESS.MT.QPPC, p. 273
199
PART 3
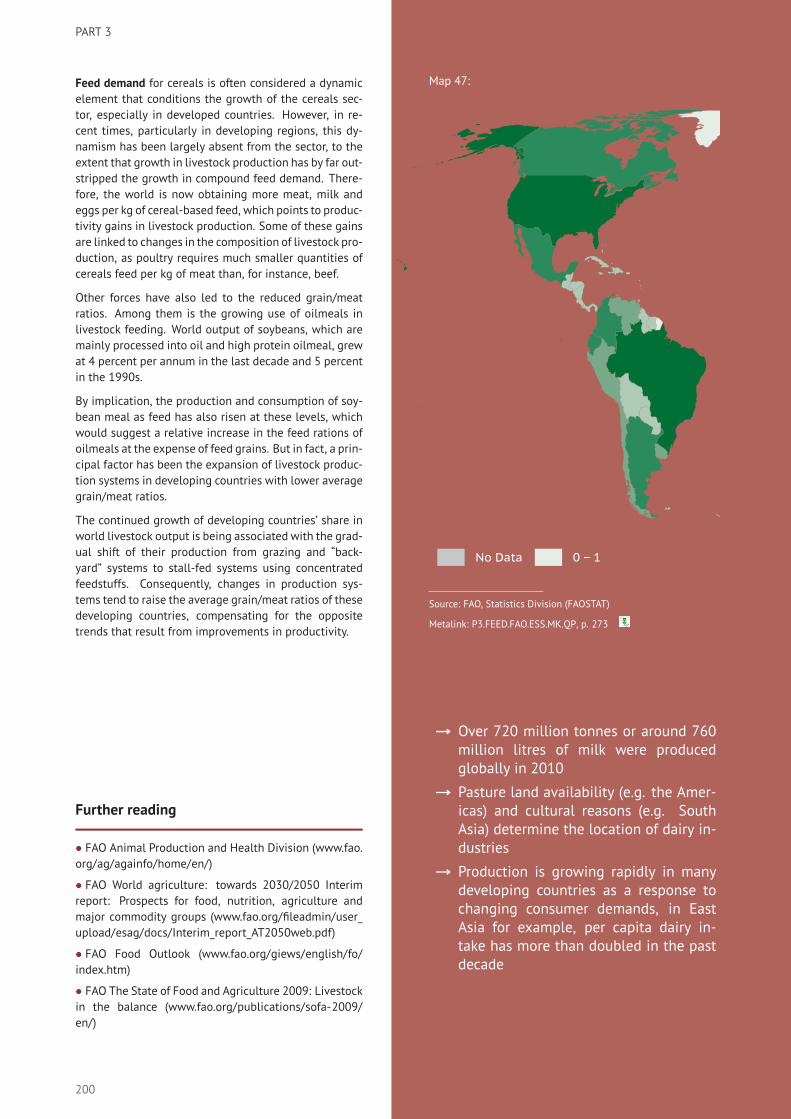
Feed demand for cereals is often considered a dynamicelement that conditions the growth of the cereals sec-tor, especially in developed countries. However, in re-cent times, particularly in developing regions, this dy-namism has been largely absent from the sector, to theextent that growth in livestock production has by far out-stripped the growth in compound feed demand. There-fore, the world is now obtaining more meat, milk andeggs per kg of cereal-based feed, which points to produc-tivity gains in livestock production. Some of these gainsare linked to changes in the composition of livestock pro-duction, as poultry requires much smaller quantities ofcereals feed per kg of meat than, for instance, beef.
Other forces have also led to the reduced grain/meatratios. Among them is the growing use of oilmeals inlivestock feeding. World output of soybeans, which aremainly processed into oil and high protein oilmeal, grewat 4 percent per annum in the last decade and 5 percentin the 1990s.
By implication, the production and consumption of soy-bean meal as feed has also risen at these levels, whichwould suggest a relative increase in the feed rations ofoilmeals at the expense of feed grains. But in fact, a prin-cipal factor has been the expansion of livestock produc-tion systems in developing countries with lower averagegrain/meat ratios.
The continued growth of developing countries’ share inworld livestock output is being associated with the grad-ual shift of their production from grazing and “back-yard” systems to stall-fed systems using concentratedfeedstuffs. Consequently, changes in production sys-tems tend to raise the average grain/meat ratios of thesedeveloping countries, compensating for the oppositetrends that result from improvements in productivity.
Further reading
• FAO Animal Production and Health Division (www.fao.org/ag/againfo/home/en/)
• FAO World agriculture: towards 2030/2050 Interimreport: Prospects for food, nutrition, agriculture andmajor commodity groups (www.fao.org/fileadmin/user_upload/esag/docs/Interim_report_AT2050web.pdf)
• FAO Food Outlook (www.fao.org/giews/english/fo/index.htm)
• FAO The State of Food and Agriculture 2009: Livestockin the balance (www.fao.org/publications/sofa-2009/en/)
Map 47:
No Data 0 − 1 1 − 1000 1000 − 4000 4000 − 15000 15000 − 20000
Dairy producing countries (thousand tonnes, 2010)
Source: FAO, Statistics Division (FAOSTAT)
Metalink: P3.FEED.FAO.ESS.MK.QP, p. 273
→ Over 720 million tonnes or around 760million litres of milk were producedglobally in 2010
→ Pasture land availability (e.g. the Amer-icas) and cultural reasons (e.g. SouthAsia) determine the location of dairy in-dustries
→ Production is growing rapidly in manydeveloping countries as a response tochanging consumer demands, in EastAsia for example, per capita dairy in-take has more than doubled in the pastdecade
200

TRENDS IN THE LIVESTOCK SECTOR
No Data 0 − 1 1 − 1000 1000 − 4000 4000 − 15000 15000 − 20000
Dairy producing countries (thousand tonnes, 2010)
Chart 80: Dairy production growth slowing in developed countries, but rising in devel-oping countries, albeit from a low base
Per capita dairy production (1992-2010)
kg
278282286290
4248546066
1995 2000 2005 2010
Developed
Developing
Developed Developing
Source: FAO, Statistics Division (FAOSTAT)
Metalink: P3.FEED.FAO.ESS.MK.QPPC, p. 273
201

PART 3
Trends in the fisheries sector
In 2009, capture fisheries and aquaculture supplied theworld with almost 145 million tonnes of fish. Of this,122 million tonnes were used as human food, providingan estimated per capita food supply of about 18 kg (liveweight equivalent). Globally, fish provides about 2.9 bil-lion people with almost 20 percent of their average percapita intake of animal protein. Fish is also very impor-tant in diets in developing countries, where current percapita intake is more than 16 kg per person per annum.
Although capture fisheries dominate world output, aqua-culture accounts for a growing percentage of total fishsupply, rising from a share of 4 percent in 1970 to 38percent in 2009. Aquaculture provides close to half ofall fish supplies destined directly for human food con-sumption.
Fish landed not used for direct human consumption ismainly processed in the form of fishmeal and oil, used asanimal feed (around 18 million tonnes), mainly for rais-ing carnivorous aquatic species (such as shrimp, salmon,trout, eels, sea bass and sea bream), but also for pigs,chickens, pet food and cattle, etc.
Worldwide, capture fisheries and aquaculture provide asource of income and livelihood for 45 million peoplethrough direct employment and provides more than 180million jobs as a whole in the global fish industry. Thereare millions of rural dwellers, many of whom are women,particularly in Asia and Africa, involved in seasonal or oc-casional fishing activities with few alternative sources ofincome and employment. Employment in aquaculture isincreasing at a faster rate than world population growthand now accounts for one-quarter of the total numberof workers directly involved in the fisheries sector. Em-ployment in fishing is decreasing in capital-intensiveeconomies, in particular in most European countries, andin North America and Japan. The global fishing fleet isestimated to be around 4.3 million vessels with about 60percent of all fishing vessels engine-powered.
According to the Big Numbers Project of FAO, the World-Fish Center and the World Bank, estimates indicate thatsmall-scale fisheries produce close to half of the worldmarine and inland fish catch, while providing employ-ment for more than 90 percent of the world’s fishers.About half of the total workforce in the fishing and fishprocessing sector comprise women.
Map 48:
No Data 0 − 1 1 − 100 100 − 300 300 − 1000 1000 − 10000
Capture fish producing countries (thousand tonnes, 2009)
Source: FAO, Fisheries and Aquaculture Department (Fishery andAquaculture statistics)
Metalink: P3.FTW.FAO.FI.CAP.QP, p. 279
→ The global fish catch has remained ataround 90 million tonnes per annumover the past 20 years
→ Greater controls, scarcity and high costshave combined to lower production inthe capture sector of developed coun-tries
→ The Pacific Ocean provides more thanhalf of the global catch
202

TRENDS IN THE FISHERIES SECTOR
No Data 0 − 1 1 − 100 100 − 300 300 − 1000 1000 − 10000
Capture fish producing countries (thousand tonnes, 2009)
Chart 81: Rising controls, scarcity and costs have combined to lower production in thecapture sector of developed countries
Capture fish production, per capita (1990-2009)
kg
15
20
25
30
1990 1995 2000 2005
Developed Developing
Source: FAO, Fisheries and Aquaculture Department (Fishery and Aquaculture statistics)
Metalink: P3.FTW.FAO.FI.CAP.QP, p. 279
203

PART 3
During the last two decades, the production of capturefisheries fluctuated in a range between 85 and 95milliontonnes per annum. More than half of the global catchcame from the Pacific Ocean. Global production is typi-cally influenced by variations in catches of anchoveta –a species extremely susceptible to oceanographic con-ditions determined by the El Niño Southern Oscillation– in the Southeast Pacific. Fluctuations in other speciesand regions tend to compensate for each other to a largeextent.
Regarding the state of major marine stocks, the propor-tion of stocks estimated to be underexploited or mod-erately exploited declined from 40 percent in the mid-1970s to 15 percent in 2008. In contrast, the propor-tion of overexploited, depleted or recovering stocks in-creased from 10 percent in 1974 to 32 percent in 2008.The proportion of fully exploited stocks has remainedrelatively stable at about 50 percent since the 1970s. Asa whole, this indicates that global marine capture pro-duction is less likely to increase, unless effective man-agement plans are put in place to rebuild overfishedstocks. While the degree of uncertainty about these es-timates may be somewhat high the apparent increasingtrend in the percentage of overexploited, depleted andrecovering stocks and the decreasing trend in underex-ploited and moderately exploited stocks do give causefor concern. At the same time, there are encouragingsigns of steady progress in some areas in restoring over-fished stocks and marine ecosystems through effectivemanagement.
Inland fisheries are vital for livelihoods in many partsof the world and also in diets by providing high qual-ity protein, essential nutrients and minerals that are of-ten difficult to obtain from other food sources. In re-cent years, inland water fishery production expanded toover 10 million tonnes, accounting for over 10 percentof global capture production. However, the state of in-land fishery resources and the ecosystems that supportthem is generally not precisely known and the reliabil-ity of data on inland water catches reported by severalcountries remains questionable. There is, nonetheless, agrowing appreciation of the need to improve inland fish-ery statistics.
Map 49:
No Data 0 − 1 1 − 50 50 − 100 100 − 300 300 − 10000
Aquaculture producing countries (thousand tonnes, 2009)
Source: FAO, Fisheries and Aquaculture Department (Fishery andAquaculture statistics)
Metalink: P3.FTW.FAO.FI.ACQ.QP, p. 279
→ 56 million tonnes of fish and fisheryproducts were produced by aquaculturein 2009. Aquaculture represents thefastest-growing animal-based food pro-ducing sector
→ Aquaculture production now accountsfor around half of world supplies of fishand fishery products destined for humanconsumption
→ China has a share of over 60 percentin world aquaculture production, whileAsia as a whole accounts for almost 90percent
204

TRENDS IN THE FISHERIES SECTOR
No Data 0 − 1 1 − 50 50 − 100 100 − 300 300 − 10000
Aquaculture producing countries (thousand tonnes, 2009)
Chart 82: Exceptional growth in aquaculture production in developing countries is sus-taining world fish supply
Aquaculture per capita production (1990-2009)
kg
3
4
5
6
7
8
9
1990 1995 2000 2005
Developed Developing
Source: FAO, Fisheries and Aquaculture Department (Fishery and Aquaculture statistics)
Metalink: P3.FTW.FAO.FI.ACQ.QP, p. 279
205

PART 3
Aquaculture represents the fastest-growing animal-based food producing sector with 56 million tonnes ofproduction in 2009 and continues to outpace populationgrowth. Great strides in breeding technology, system de-sign and feed technology in the latter half of the twenti-eth century have enabled the expansion of commerciallyviable aquaculture across species and in volume. Chinaalone produced over 60 percent of global aquacultureproduction, while Asia as a whole accounted for around90 percent of worldwide aquaculture output.
Aquaculture production has been dominated in quantityterms by species that feed low on the food chain in theirnatural habitats, such as carp, characins and tilapias.Carp alone accounted for around 60 percent of worldproduction of cultured finfishes in 2009. Aquaculturealso provides a dominant share in the total productionof several high-priced species such as salmon, shrimp,prawns, eels, oysters and scallops. The share of aqua-culture products in international trade is increasing notonly for high-priced products but for a broad range ofspecies.
Further reading
• FAO The State of World Fisheries and Aquaculture(www.fao.org/publications/en/)
• FAO Fisheries and Aquaculture Department (www.fao.org/fishery/en)
• FAO Food Outlook (www.fao.org/giews/english/fo/index.htm)
Chart 83: The scope for further increases in capture pro-duction is non-existent
State of the world’s fishery stocks (1974 versus 2008)
%
0%
20%
40%
60%
80%
100%
1974 2008
Under ormoderatelyExploited
FullyExploited
Recovering,depleted oroverexploited
Source: FAO, Fisheries and Aquaculture Department
Metalink: P3.FTW.FAO.FI.STK, p. 279
Chart 84: Capture production is dominated by marinefish, while aquaculture mainly produces freshwater anddiadromous fish, shrimp and shellfish
Composition of fish products (2009)
%
0%
20%
40%
60%
80%
100%
Aquaculture Capture
Marine fishFreshwater &diadromousfishCrustaceansMolluscsexcludingcephalopodsCephalopods
Others
Source: FAO, Fisheries and Aquaculture Department (Fishery andAquaculture statistics)
Metalink: P3.FTW.FAO.FI.CFP, p. 280
206

TRENDS IN THE FISHERIES SECTOR
Map 50: Geo-location of harvests by capture and aquaculture
Source: FAO, Fisheries and Aquaculture Department (Fishery and Aquaculture statistics)
Metalink: P3.FTW.FAO.FI.HARV, p. 280
Chart 85: Aquaculture supplies close to half of all fish consumed
Fish food supply, per capita (1990-2009)
kg
0
5
10
15
1990 1995 2000 2005
Capture fisheries Aquaculture
Source: FAO, Fisheries and Aquaculture Department (Fishery and Aquaculture statistics)
Metalink: P3.FTW.FAO.FI.TOT.QP, p. 280
207
PART 3
Trends in agricultural trade
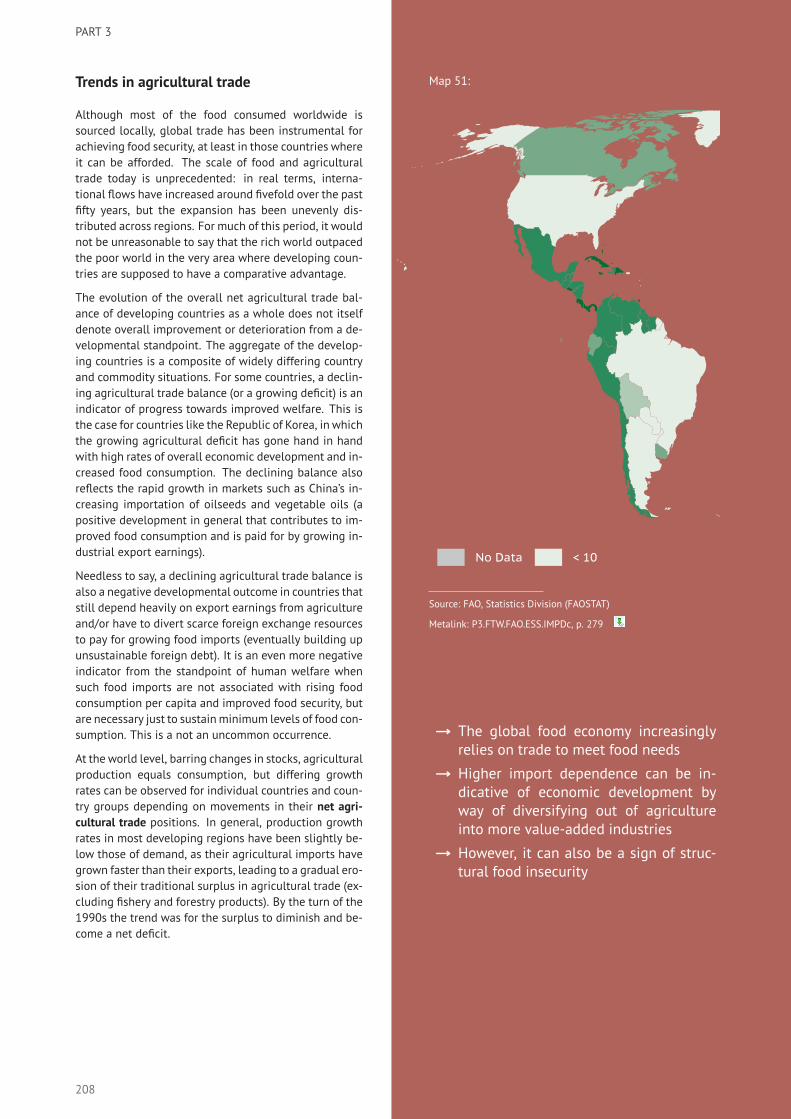
Although most of the food consumed worldwide issourced locally, global trade has been instrumental forachieving food security, at least in those countries whereit can be afforded. The scale of food and agriculturaltrade today is unprecedented: in real terms, interna-tional flows have increased around fivefold over the pastfifty years, but the expansion has been unevenly dis-tributed across regions. For much of this period, it wouldnot be unreasonable to say that the rich world outpacedthe poor world in the very area where developing coun-tries are supposed to have a comparative advantage.
The evolution of the overall net agricultural trade bal-ance of developing countries as a whole does not itselfdenote overall improvement or deterioration from a de-velopmental standpoint. The aggregate of the develop-ing countries is a composite of widely differing countryand commodity situations. For some countries, a declin-ing agricultural trade balance (or a growing deficit) is anindicator of progress towards improved welfare. This isthe case for countries like the Republic of Korea, in whichthe growing agricultural deficit has gone hand in handwith high rates of overall economic development and in-creased food consumption. The declining balance alsoreflects the rapid growth in markets such as China’s in-creasing importation of oilseeds and vegetable oils (apositive development in general that contributes to im-proved food consumption and is paid for by growing in-dustrial export earnings).
Needless to say, a declining agricultural trade balance isalso a negative developmental outcome in countries thatstill depend heavily on export earnings from agricultureand/or have to divert scarce foreign exchange resourcesto pay for growing food imports (eventually building upunsustainable foreign debt). It is an even more negativeindicator from the standpoint of human welfare whensuch food imports are not associated with rising foodconsumption per capita and improved food security, butare necessary just to sustainminimum levels of food con-sumption. This is a not an uncommon occurrence.
At the world level, barring changes in stocks, agriculturalproduction equals consumption, but differing growthrates can be observed for individual countries and coun-try groups depending on movements in their net agri-cultural trade positions. In general, production growthrates in most developing regions have been slightly be-low those of demand, as their agricultural imports havegrown faster than their exports, leading to a gradual ero-sion of their traditional surplus in agricultural trade (ex-cluding fishery and forestry products). By the turn of the1990s the trend was for the surplus to diminish and be-come a net deficit.
Map 51:
No Data < 10 10 − 20 20 − 30 30 − 50 > 50
Import dependence (%, 2009)
Source: FAO, Statistics Division (FAOSTAT)
Metalink: P3.FTW.FAO.ESS.IMPDc, p. 279
→ The global food economy increasinglyrelies on trade to meet food needs
→ Higher import dependence can be in-dicative of economic development byway of diversifying out of agricultureinto more value-added industries
→ However, it can also be a sign of struc-tural food insecurity
208

TRENDS IN AGRICULTURAL TRADE
No Data < 10 10 − 20 20 − 30 30 − 50 > 50
Import dependence (%, 2009)
Chart 86: Growing reliance on trade to meet food needs
Global food trade index - calories and value (1990-2009)
2004-2006=100
50
100
150
1970 1980 1990 2000
Value Calories
Source: FAO, Statistics Division (FAOSTAT)
Metalink: P3.FEED.FAO.ESS.FD.IXc, p. 271
209

PART 3
The overall net deficit in food trade of developing coun-tries would have deepened much more were it notfor the exceptional performance of several emergingagro-exporters, notably Brazil and its exports mainly ofoilseeds and livestock products. But by the same to-ken, China’s large-scale imports of agricultural productsin the last decade (especially raw materials and primarycommodities) also places bias on this trend.
Even excluding Brazil and China, the deterioration of thenet balance of the other developing countries as a wholeis alarming – a US$1 billion surplus towards the end ofthe 1980s became a deficit of US$34 billion two decadeslater. In fact, sub-Saharan Africa has seen its share ofworld food exports drop from 11 percent to under 3 per-cent in the space of just 20 years. The region’s half-a-billion US dollar trade surplus in food in the late 1980shas mushroomed into a 9 billion dollar deficit at present.
Growing net imports of cereal and livestock productshave been dominant in shaping the growing deficit ofagriculture in developing countries. Imports of prod-ucts in the oilseed complex by several major develop-ing countries other than China have also assumed im-portance, notwithstanding rapidly rising net exports ofthese products from other developing countries (e.g.Malaysia, Argentina, Indonesia).
Cereals as a group, notably wheat, is by far the largestdeficit item in the developing country food basket. Overthe period 1970 to 2008, over 70 percent of the incre-ment in wheat consumption was met by increments inwheat imports. Moreover, several countries have de-pended entirely on imports for increasing consumptionof wheat.
On the other hand, net exports of fruit and vegetables,and tropical beverages (coffee, tea and cocoa) are virtu-ally the only significant items that have shown consis-tent improvements in the net trade positions of manydeveloping countries, despite the fact that tropical bev-erage consumption is slowing in the traditional majormarkets of developed countries.
Chart 87: Rising dependence on international markets tomeet food, feed and industrial needs for traditional "bulkcommodities"
Global trade - cereals, sugar and oilseeds (1990-2009)
US$billion
20
40
60
80
100
120
140
1990 1995 2000 2005
Cereals Oilseeds Sugar
Source: FAO, Statistics Division (FAOSTAT)
Metalink: P3.FEED.FAO.ESS.CE.EXv, p. 270
Chart 88: The world market for vegetable oils on the rise,while improved freight technology and higher demandare boosting global fruit and vegetable flows
Global trade - vegetable oils and fruit + vegetables (1990-2009)
US$billion
20
40
60
80
100
120
140
160
1990 1995 2000 2005
Fruit & VegetablesVegetable Oils& Animal Fats
Source: FAO, Statistics Division (FAOSTAT)
Metalink: P3.FEED.FAO.ESS.VL.EXv, p. 278
210

TRENDS IN AGRICULTURAL TRADE
Chart 89: Better transportation technology and rising in-tensification have met demand in an expanded globalmarket for livestock and fish products
Global trade - livestock and fish (1990-2009)
US$billion
20
40
60
80
100
1990 1995 2000 2005
Fish Meat Milk
Source: FAO, Statistics Division (FAOSTAT)
Metalink: P3.FTW.FAO.FI.TOT.EXv, p. 280
Chart 90: Trade in tropical beverages and spices, themainstay of many developing country exports, on therise
Global trade - coffee, tea, cocoa and spices (1990-2009)
US$billion
20
30
40
50
60
1990 1995 2000 2005
Source: FAO, Statistics Division (FAOSTAT)
Metalink: P3.FEED.FAO.ESS.CF.EXv, p. 270
Chart 91: Despite growing export markets for them insome crops, developing countries, excluding Brazil andChina, have become net buyers of food
Net food trade balance, excl. Brazil & China (1990-2009)
US$billion
-15
-10
-5
0
5
1990 1995 2000 2005
Source: FAO, Statistics Division (FAOSTAT)
Metalink: P3.FEED.FAO.ESS.FD.NTx, p. 272
Chart 92: The overall situation for sub-Saharan Africa iseven more alarming, with food import costs increasinglyoutpacing export earnings
Net food trade balance of Sub-Saharan Africa (1990-2009)
US$billion
-10
-8
-6
-4
-2
0
1990 1995 2000 2005
Source: FAO, Statistics Division (FAOSTAT)
Metalink: P3.FEED.FAO.ESS.FD.NTv, p. 271
211
PART 3
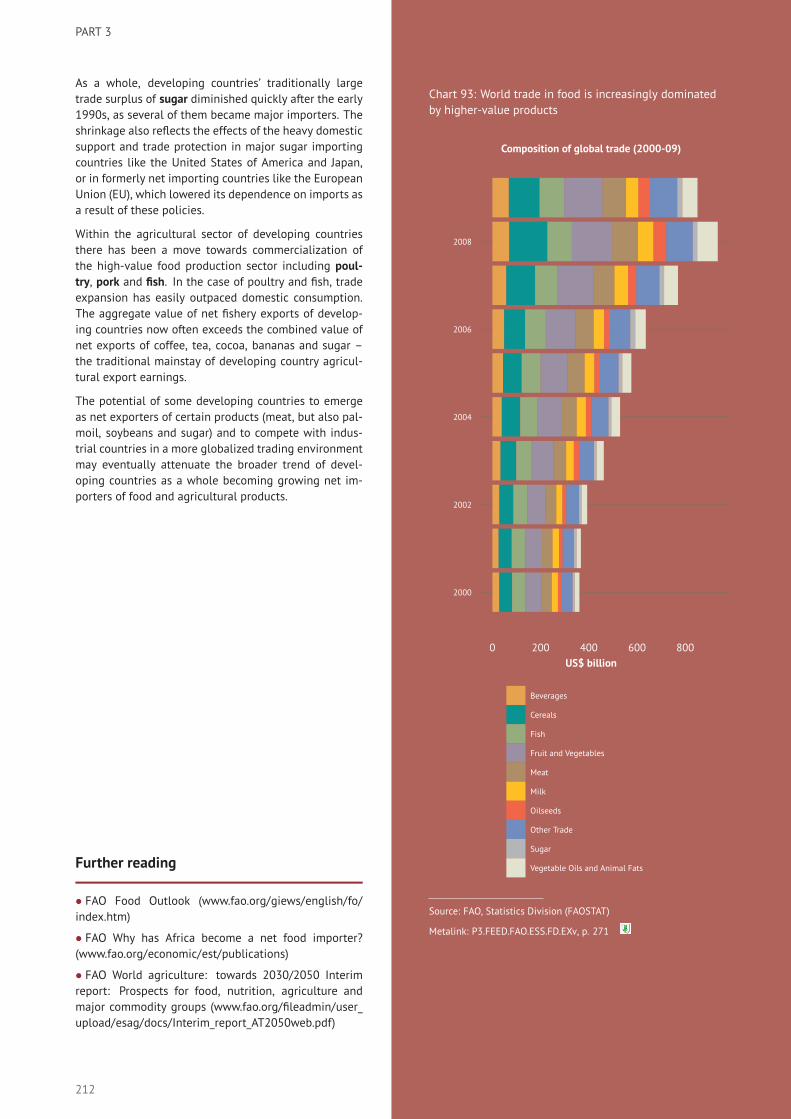
As a whole, developing countries’ traditionally largetrade surplus of sugar diminished quickly after the early1990s, as several of them became major importers. Theshrinkage also reflects the effects of the heavy domesticsupport and trade protection in major sugar importingcountries like the United States of America and Japan,or in formerly net importing countries like the EuropeanUnion (EU), which lowered its dependence on imports asa result of these policies.
Within the agricultural sector of developing countriesthere has been a move towards commercialization ofthe high-value food production sector including poul-try, pork and fish. In the case of poultry and fish, tradeexpansion has easily outpaced domestic consumption.The aggregate value of net fishery exports of develop-ing countries now often exceeds the combined value ofnet exports of coffee, tea, cocoa, bananas and sugar –the traditional mainstay of developing country agricul-tural export earnings.
The potential of some developing countries to emergeas net exporters of certain products (meat, but also pal-moil, soybeans and sugar) and to compete with indus-trial countries in a more globalized trading environmentmay eventually attenuate the broader trend of devel-oping countries as a whole becoming growing net im-porters of food and agricultural products.
Further reading
• FAO Food Outlook (www.fao.org/giews/english/fo/index.htm)
• FAO Why has Africa become a net food importer?(www.fao.org/economic/est/publications)
• FAO World agriculture: towards 2030/2050 Interimreport: Prospects for food, nutrition, agriculture andmajor commodity groups (www.fao.org/fileadmin/user_upload/esag/docs/Interim_report_AT2050web.pdf)
Chart 93: World trade in food is increasingly dominatedby higher-value products
Composition of global trade (2000-09)
US$ billion
2000
2002
2004
2006
2008
0 200 400 600 800
Beverages
Cereals
Fish
Fruit and Vegetables
Meat
Milk
Oilseeds
Other Trade
Sugar
Vegetable Oils and Animal Fats
Source: FAO, Statistics Division (FAOSTAT)
Metalink: P3.FEED.FAO.ESS.FD.EXv, p. 271
212
TRENDS IN AGRICULTURAL TRADE
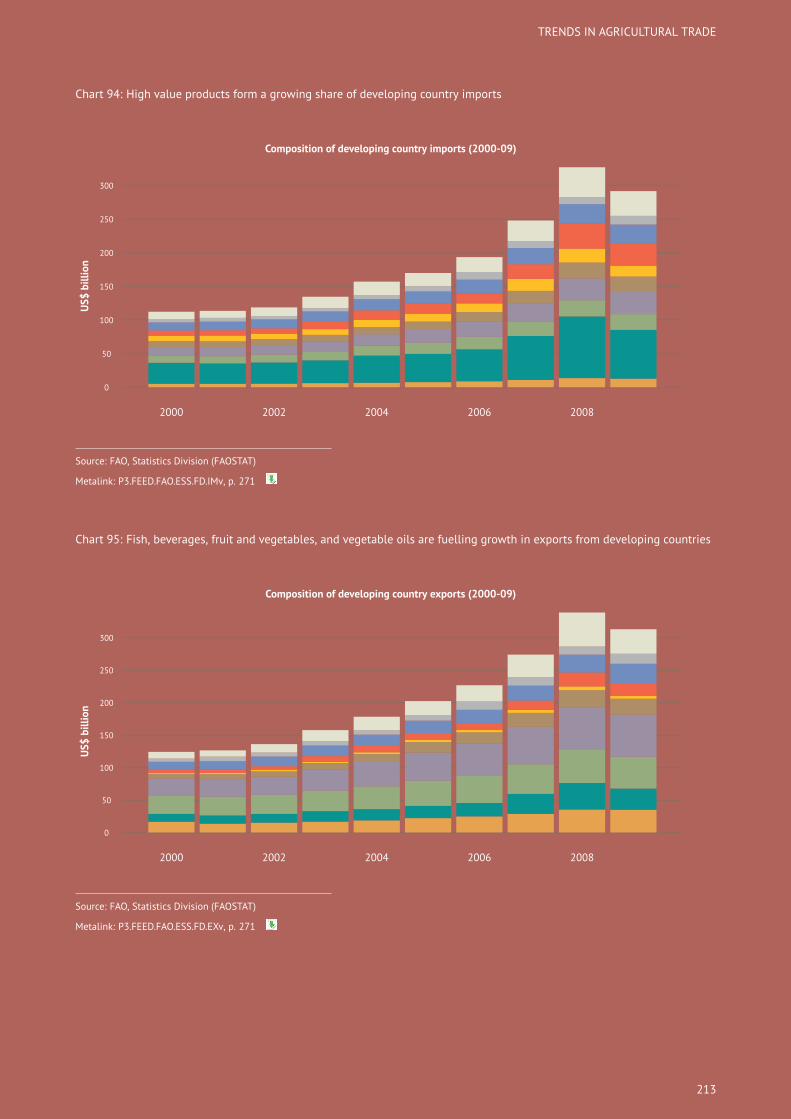
Chart 94: High value products form a growing share of developing country imports
Composition of developing country imports (2000-09)
US$billion
0
50
100
150
200
250
300
2000 2002 2004 2006 2008
Source: FAO, Statistics Division (FAOSTAT)
Metalink: P3.FEED.FAO.ESS.FD.IMv, p. 271
Chart 95: Fish, beverages, fruit and vegetables, and vegetable oils are fuelling growth in exports from developing countries
Composition of developing country exports (2000-09)
US$billion
0
50
100
150
200
250
300
2000 2002 2004 2006 2008
Source: FAO, Statistics Division (FAOSTAT)
Metalink: P3.FEED.FAO.ESS.FD.EXv, p. 271
213