The global livestock sector: Trends, drivers and implications for society, health and the...
46
The global livestock sector: Trends, drivers and implications for society, health and the environment Science with Impact – Annual Conference 2015 – BSAS/AVTRW/WPSA Binks Building, University of Chester, 14-15 April 2015 Timothy Robinson, William Wint, Giulia Conchedda, Giuseppina Cinardi, Thomas Van Boeckel, Michael Macleod, Bernard Bett, Delia Grace & Marius Gilbert
Transcript of The global livestock sector: Trends, drivers and implications for society, health and the...

The global livestock sector: Trends, drivers and
implications for society, health and the environment
Science with Impact – Annual Conference 2015 – BSAS/AVTRW/WPSA
Binks Building, University of Chester, 14-15 April 2015
Timothy Robinson,
William Wint, Giulia Conchedda, Giuseppina Cinardi, Thomas Van Boeckel, Michael Macleod, Bernard Bett, Delia Grace & Marius Gilbert
Overview
• The global livestock sector
• Trends and drivers
• Mapping livestock distributions and production systems
• Livestock and livelihoods
• Livestock, health and nutrition
• Livestock and the environment
• Bringing it all together: Animal health and greenhouse gas emissions

The global livestock sector
• Livestock numbers (FAOSTAT 2012) • 1.8 billion cattle and buffalo
• 2.5 billion sheep and goats
• 1.5 billion pigs
• 30.6 billion poultry
• Sector accounts for 30% of the land surface
• 70% of all agricultural land
• 8% of human water use

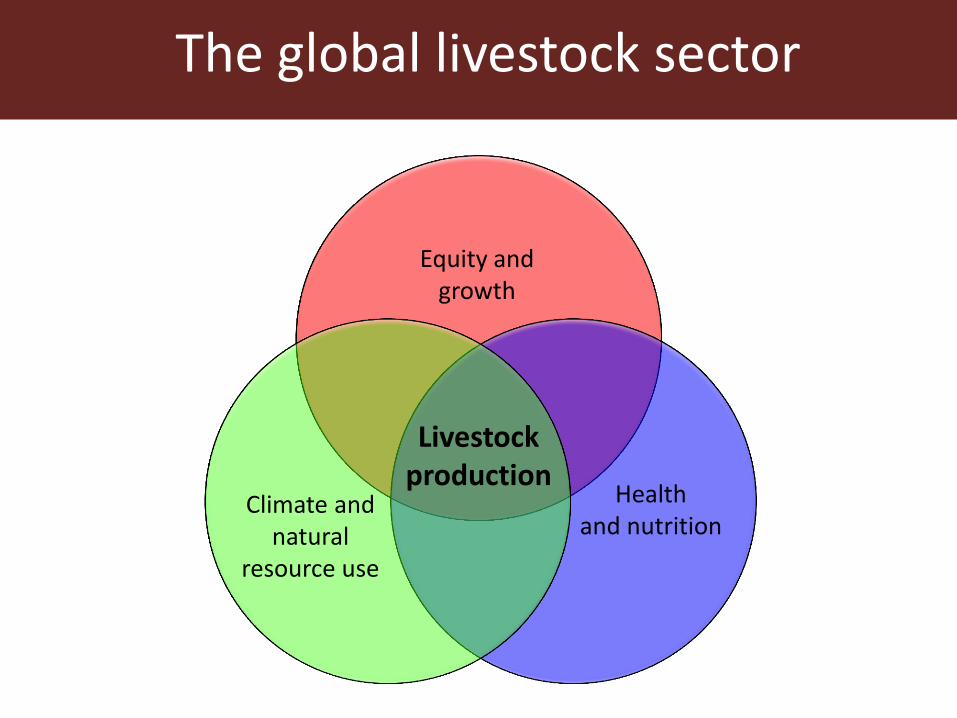
The global livestock sector
Health and nutrition
Equity and growth
Climate and natural
resource use
Livestock production

The global livestock sector Po
licie
s a
nd
in
stitu
tio
na
l
ch
an
ge
Economic
growth Tra
de
&
m
arke
tin
g
Changing
diets
Energy prices
Health and nutrition
Equity and growth
Livestock production
Climate and natural
resource use

• Demographic and social drivers
• Population: + 32% or 9.6 billion people by 2050
• Income growth: + 2% per year by 2050
• Urbanization: 70% will live in cities by 2050
➜ Growth in demand for animal source foods
• + 70% by 2050
• + 200 million tonnes of meat
➜ Structural changes in the livestock sector
• Shift from ruminant to monogastric
• Intensification of production
➜ Impinges on global public goods • Poverty and growth • Health and nutrition • Climate and natural resources
• Integrated approach to socially desirable livestock sector development
• Need reliable data and information to guide policy
The changing livestock sector

Livestock to 2030 – demand growth
Consumption of Animal Source Foods is increasing faster in developing countries than in developed countries
Mill
ion
s o
f to
nn
es
Year
Developed
Developing

Disaggregating demand growth
Growth in poultry consumption in China to 2030
Demand growth attributable to population growth
Demand growth attributable to
changing consumption patterns
Demand growth as a function of both
Demand in 2000

Implications for production
• Rural population growth
→ EXPANSION
• Urban population growth
• Increasing wealth
• Changing consumption patterns
→ INTENSIFICATION

Livestock distribution and production
Livestock distribution modelling
Livestock maps by production system
Livestock production estimates
Global livestock maps
Production systems modelling
Sub-national Livestock data
Herd / production modelling
Data collection, cleaning and geo-registration

Global distribution of pigs
Source: Robinson et al. (2014)
Pigs per square kilometre (2006)

Mapped based on rural population
Difference (total – extensive)
% backyard
% intensive
Monogastric production systems
Livestock distribution
Extensive production
Intensive production

Chicken systems O
utp
ut
/ in
pu
t ra
tio
(lo
g kg
-1 s
tock
-1 y
ear-1
)
Log per-capita GDP (US$/person/year) From World Bank data
Source: Gilbert et al. (under review)
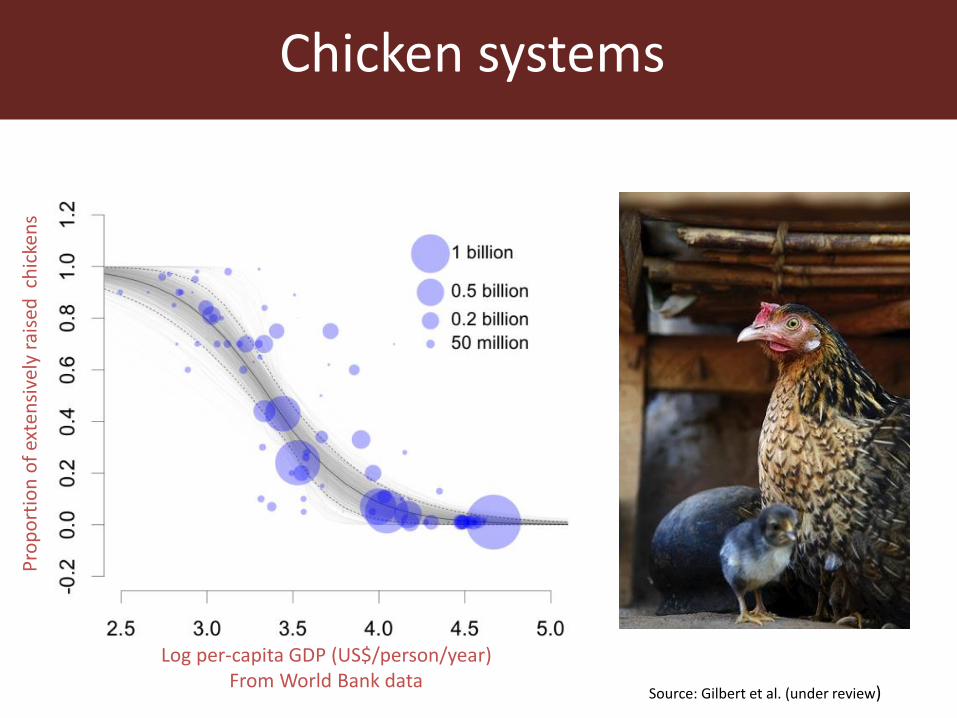
Chicken systems
Log per-capita GDP (US$/person/year) From World Bank data
Pro
po
rtio
n o
f ex
ten
sive
ly r
aise
d c
hic
ken
s
Source: Gilbert et al. (under review)
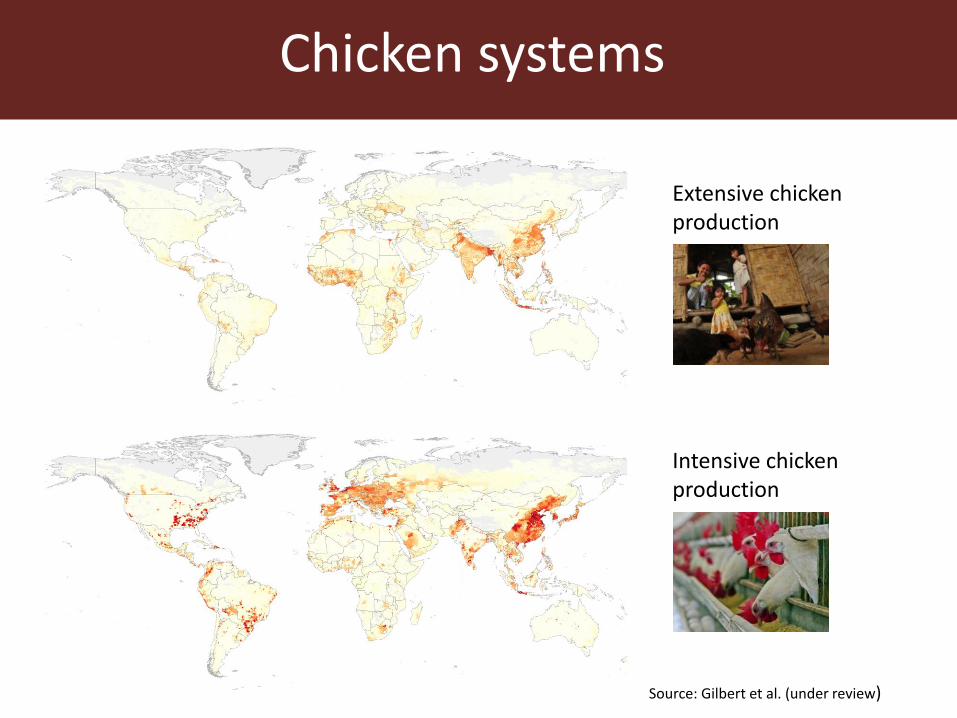
Chicken systems
Extensive chicken production
Intensive chicken production
Source: Gilbert et al. (under review)

http://www.livestock.geo-wiki.org
The global livestock sector
Health and nutrition
Equity and growth
Climate and natural
resource use
Livestock production
Livestock and livelihoods
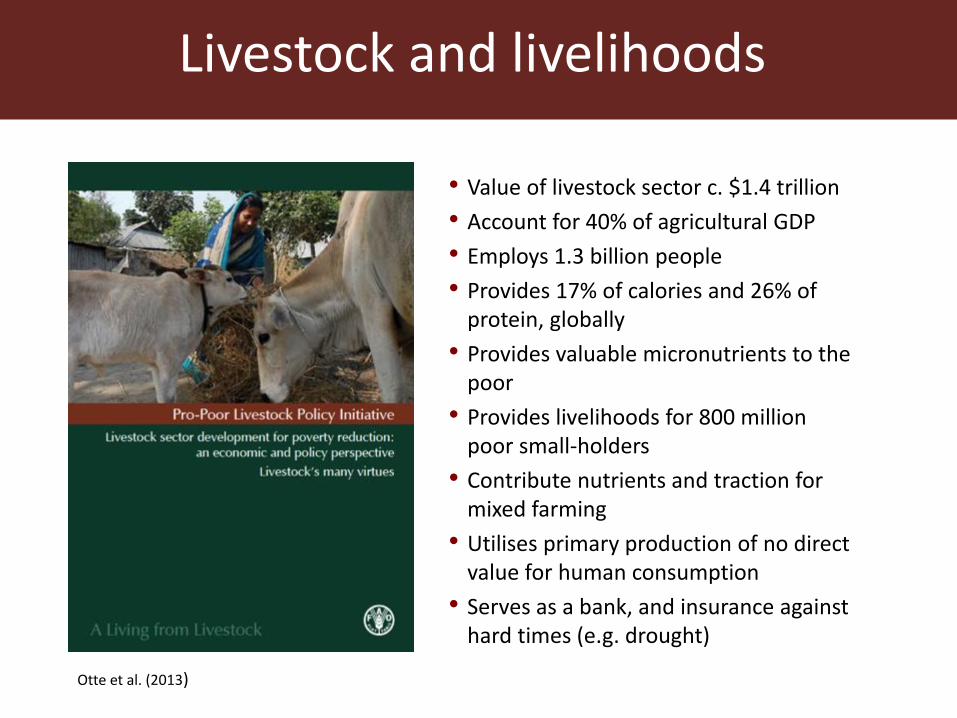
• Value of livestock sector c. $1.4 trillion
• Account for 40% of agricultural GDP
• Employs 1.3 billion people
• Provides 17% of calories and 26% of protein, globally
• Provides valuable micronutrients to the poor
• Provides livelihoods for 800 million poor small-holders
• Contribute nutrients and traction for mixed farming
• Utilises primary production of no direct value for human consumption
• Serves as a bank, and insurance against hard times (e.g. drought)
Otte et al. (2013)

AfriPop
Population
Rural population
Agricultural population Poor farmers
Livestock keepers Poor livestock keepers
Livestock and livelihoods

Source: Robinson et al. (2011)
Poor Livestock Keepers National, rural poverty lines
Livestock and livelihoods

Livestock, health and nutrition
• Nutrition • Positive: Hunger, malnutrition, stunting, cognitive
impairment
• Negative: Obesity and associated health risks
• Diseases • Food-borne diseases
• 39% OIE diseases are zoonotic
• Aflatoxin poisoning
• Antimicrobial resistance
• Poverty • Poor people are less healthy
• Livestock contribute to livelihoods and resilience
• Economic losses from endemic diseases of production
• Climate change • Reduced food security
• Heat waves, floods and droughts
• Changing VBD risks

Nutrition: the double-edged sword
Livestock are key to both sides
• Over one third of all adults across the world – 1.46 billion people – are obese or overweight
• Between 1980 and 2008, the numbers of people affected in the developing world more than tripled, from 250 million to 904 million
• Diets are changing with income rises in developing countries, shifting from starch to meat, milk, fats and sugar, fruit and vegetables
• We live in a world more than with 800 million hungry and 165 million stunted children
• Animal-Source Foods provide 17% of calories and 26% of protein
• Animal-Source Foods provide valuable micronutrients to the poor

Nutrition: the double-edged sword
Source: Dobbs et al. 2014
Obesity is one of the top three social burdens generated by human beings
But to what extent is livestock
consumption contributing?
• Overeating
• Physical inactivity
• High-fat diets (ASF)
• Diets high in refined carbohydrates
• Sugared soft drinks
• Excessive alcohol consumption
Obesity causes some 5% of global deaths
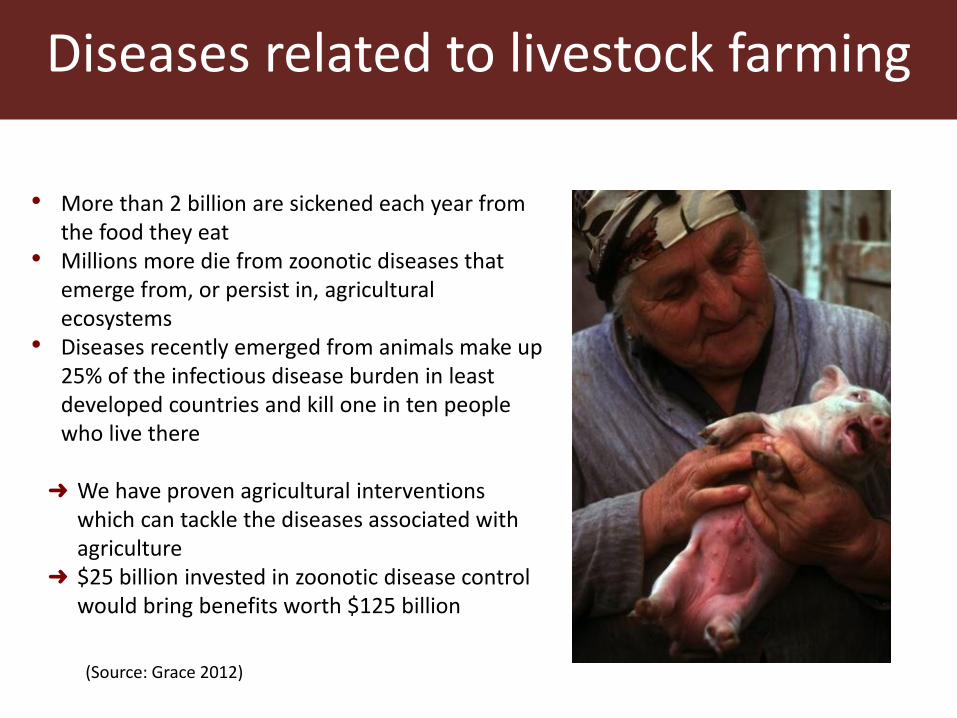
• More than 2 billion are sickened each year from the food they eat
• Millions more die from zoonotic diseases that emerge from, or persist in, agricultural ecosystems
• Diseases recently emerged from animals make up 25% of the infectious disease burden in least developed countries and kill one in ten people who live there
➜ We have proven agricultural interventions
which can tackle the diseases associated with agriculture
➜ $25 billion invested in zoonotic disease control would bring benefits worth $125 billion
Diseases related to livestock farming
(Source: Grace 2012)

H7N9 risk prediction
Emerging diseases – Avian Influenza
Source: Gilbert et al. (2014)

Source: Gilbert et al. (under review)
Data mining extensive and intensive chicken production
Intensification trajectories

Source: Gilbert et al. (under review)
Intensification trajectories
Creating bootstrapped models
Source: Gilbert et al. (under review)
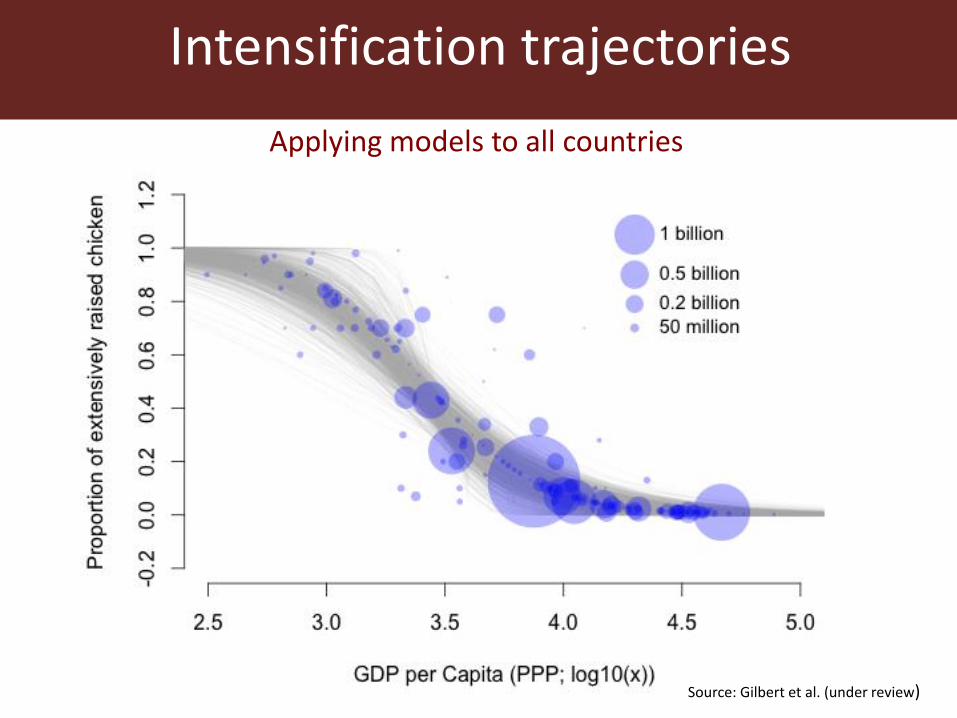
Intensification trajectories
Applying models to all countries

Source: Gilbert et al. (under review)
Intensification trajectories
Here is China…

Intensification trajectories
… and several other important countries for AI in humans

Intensification trajectories
Focus on these countries, standardized to 2010 data

Focus on these countries, standardized to 2030 FAO projections
Intensification trajectories

South Asia
Source: Gilbert et al. (under review)
Intensification trajectories
Focus on these countries, standardized to 2030 FAO projections
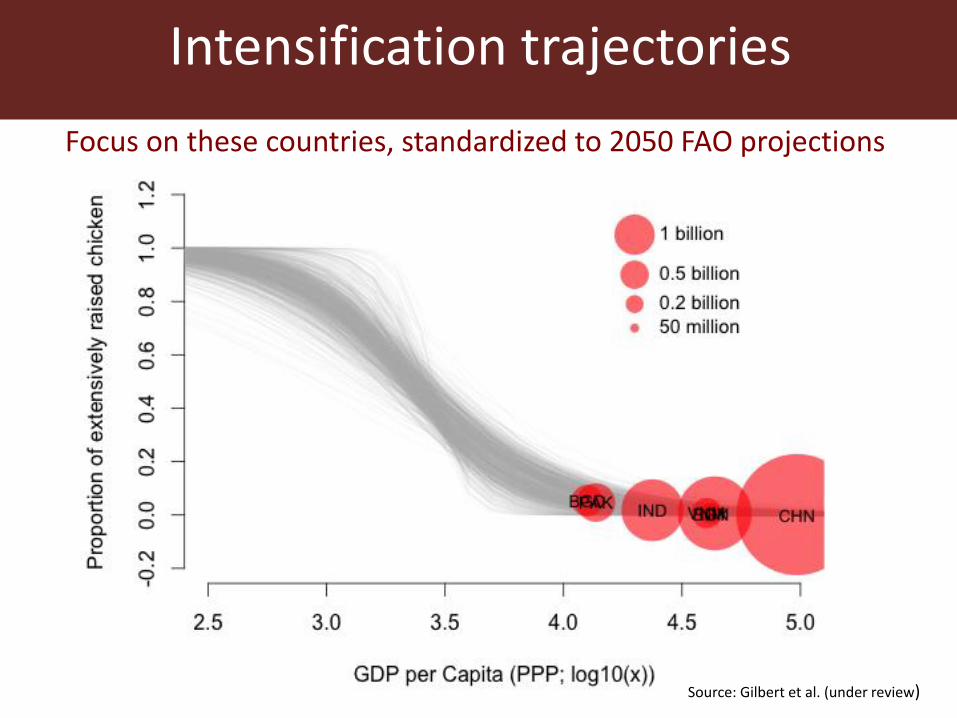
Source: Gilbert et al. (under review)
Intensification trajectories
Focus on these countries, standardized to 2050 FAO projections

Antimicrobial resistance
• USA: at least 2 million people get drug-resistant infections each year, and at least 23,000 die from them
• USA: 80% of antimicrobial sales are in the agricultural sector
• Total consumption in the livestock sector in 2010 estimated at 63,151 tons
• Global antimicrobial consumption will rise by 67% by 2030
• It will nearly double in BRICS (Brazil, Russia, India, China, and South Africa) countries
• China’s livestock industry by itself could soon be consuming almost one third of world’s available antibiotics

Antimicrobial resistance
Source: Van Boeckel et al. 2015
Global antimicrobial use in food animals (mg per 10km pixel)

Antimicrobial resistance
• The European Union banned the use of antibiotics to boost animals' growth in 2006
• There is a ‘voluntary’ ban in the USA
• Chick-fil-A, McDonalds and Costco stopping antimicrobial use in the production chain
➜ Concerted action – multi-stakeholder platforms
➜ Strengthen the evidence base linking agricultural use to AMR in the medical sector
➜ Appropriate approaches in different settings – poor countries may not have the ‘resilience’ or ‘capacity’ of Europe in withstanding a blanket ban, for example

Livestock and the environment
➜ ADAPTATION
➜ Capacity to respond to changes
Livestock
Environment
GHG emissions
Climate change
Carbon sequestration
Land use change
Pollution
Water resource availability
Feed availability
Nutrient cycling
Land degradation
Biodiversity
➜ MITIGATION
➜ Climate-smart agriculture
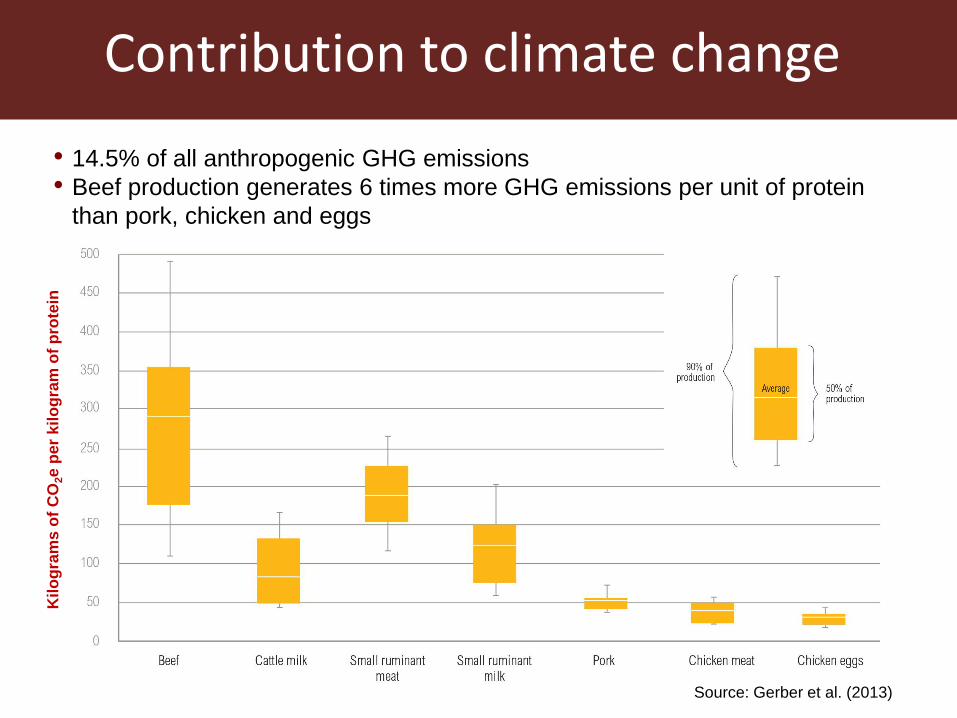
Source: Gerber et al. (2013)
• 14.5% of all anthropogenic GHG emissions
• Beef production generates 6 times more GHG emissions per unit of protein
than pork, chicken and eggs
Kilo
gra
ms
of
CO
2e
pe
r k
ilo
gra
m o
f p
rote
in
Contribution to climate change

Source: Gerber et al. 2013
per unit of
edible
protein
Livestock emissions

Source: Gerber et al. 2013
Livestock emissions
per unit of
land

Source : Shaw et al. (2014)
Economic benefits over 20 years of trypanosomosis removal
Cattle production
system Pastoral
Agro- pastoral
Mixed farming
(general)
Mixed farming
(Ethiopia)
Low oxen 63 82 90 102
Medium oxen
– 98 122 135
High oxen – 118 152 161
High dairy – 142 148 –
Cattle density
Tsetse distribution
Production systems
Herd model
Burden of disease Herd growth and spread Value of production
Production systems
Economic benefits per animal (US$)
Bringing it all together

Decrease in emissions intensity arising from trypanosomosis removal
Red
uct
ion
in E
I
Production system
Results
Source: MacLeod et al. (submitted)

Results
• Removal of trypanosomosis leads to significant increases in production and emissions across all the systems
• Production increases by more than emissions so EI decreases
• The biggest decrease in EI is in the high yield dairy systems
• Demonstrates a clear link between improving productivity and decreasing EI
% change in emissions intensity
Source: MacLeod et al. (submitted)

In conclusion
‘The fundamental interconnectedness of all things’
• Rapid demand growth for Animal Source Foods – particularly in developing and emerging economies
• The response of the livestock sector to this growth has major implications for global, interconnected, public goods
• This calls for integrated solutions to guide sector development along a sustainable pathway
• These are global issues and require global responses
Thank You !