Trends and Economics of Washington State Organic...
8
1 Trends and Economics of Washington State Organic Blueberry Production WASHINGTON STATE UNIVERSITY EXTENSION FACT SHEET • FS154E Summary Washington State is the leading producer of organic blueberries in the United States, and recent data on acreage, production, and value are presented here to help growers assess entry into, or expansion of, organic blueberry production. From 2009 to 2012, organic blueberry acreage in Washington increased 130%, while production tripled. Nearly 75% of the acreage in the state is east of the Cascade Range. Washington organic blueberry producers reported a farmgate value of $23 million for the 2012 crop, up from $7 million for the 2009 crop. Recent average organic yields were lower than those reported by USDA-NASS for all blueberries in the state, which is partially due to the high proportion of young plantings. However, average organic blueberry market prices exceeded those reported by NASS for all blueberries. A large increase in supply of both conventional and organic blueberries is expected within the next few years because a significant portion of planted acres are not yet fully bearing and still more acreage is being planted. This could lead to a supply- demand imbalance that might depress prices. Introduction Worldwide production of blueberries has increased in recent years (Brazelton 2013) as consumers seek them out as part of a healthy diet. Northern highbush blueberry (Vaccinium corymbosum) has emerged as a major player within Washington State’s specialty crop sector. Organic production is an important component of the berry indus- try and Washington leads in national organic blueberry production (NASS 2012). Organic food sales, including blueberries, continue to increase, creating opportunities for producers. The Organic Trade Association reported 11.5% annual growth in U.S. retail sales of organic foods during 2013, with fruits and vegetables accounting for 33% of all organic food sales (OTA 2014). This fact sheet summarizes recent Washington organic blueberry acreage, production, and value. Also provid- ed are baseline analyses of organic yield, price, and gross revenue per acre. The organic blueberry industry is young and still rapidly expanding, thus precise and reliable price and yield data are difficult to find. The information provided in this study represents a significant addition to what is currently avail- able publically. References to blueberry in this publication refer solely to V. corymbosum. This publication is part of a series on select Washington organic specialty crops including berries, tree fruit, grapes, and vegetables. It is intended to assist industry supply fore- casts, support producer decisions regarding entry into or expansion of organic production, and help manage finan- cial risk, especially important for crops where Washington production represents a significant portion of the national organic supply. Methods and Data Description Organic blueberry trends reported here were derived from data provided by the Washington State Department of Agriculture (WSDA) Organic Food Program, which includes approximately 95% of National Organic Program (NOP)– certified Washington producers. Four years (2009-2012) of acreage, production, and gross crop sales (farmgate, not including value added) were provided, compiled, and summarized, and then compared to similar USDA-National Agricultural Statistics Service (NASS) data for all blueber- ries in the state (NASS 2013a, 2013b). In some cases, data have been segregated by geography within the state, with “West” meaning west of the Cascade Range and “East” meaning east of the mountains. For blueberries, production in the East generally requires full-season irrigation, whereas in the West, there may be supplemental irrigation during the summer. Any production data reported by volume were converted to weight using standard market guidelines (USDA-AMS 2012). Note: Production reported as packed fruit was not converted to a gross field production value. There was no distinction made between berries sold to the fresh market versus the processing market (generally at different prices) in the data reported to WSDA. This fact sheet is part of the Trends in Washington Organic Crop Production Series.
-
Upload
nguyenhanh -
Category
Documents
-
view
215 -
download
0
Transcript of Trends and Economics of Washington State Organic...
1
Trends and Economics of Washington State Organic
Blueberry Production
W A S H I N G T O N S T A T E U N I V E R S I T Y E X T E N S I O N F A C T S H E E T • F S 1 5 4 E
Summary
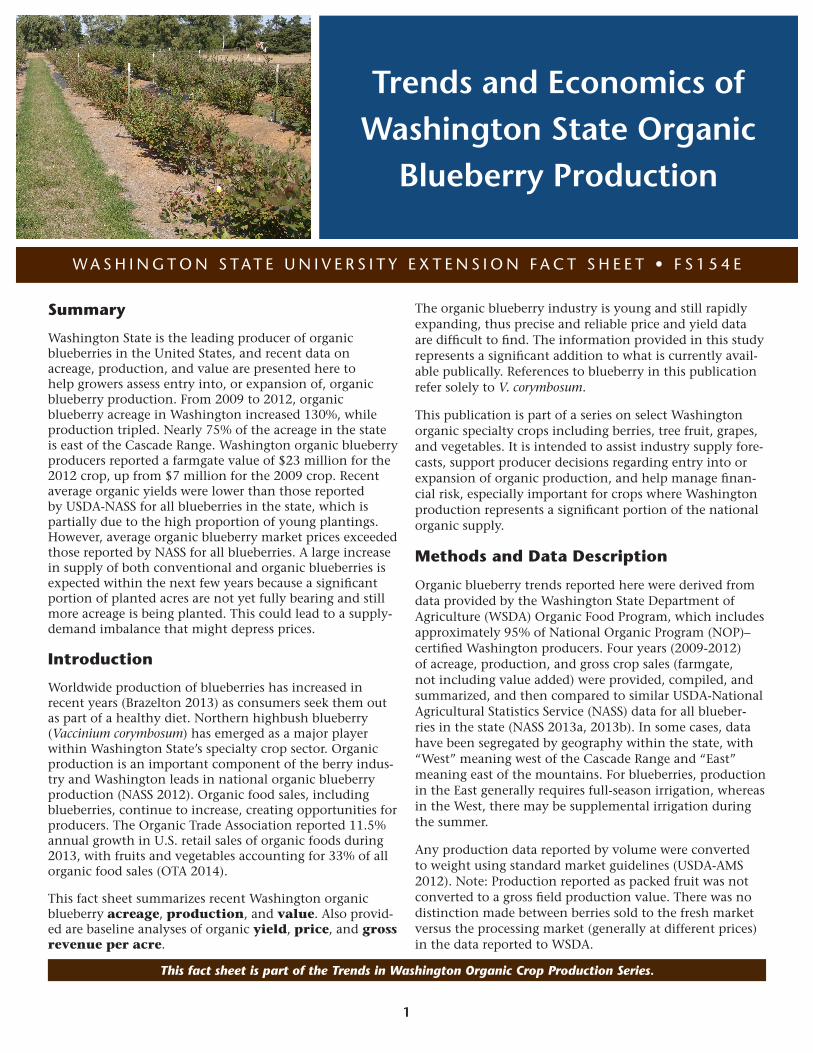
Washington State is the leading producer of organic blueberries in the United States, and recent data on acreage, production, and value are presented here to help growers assess entry into, or expansion of, organic blueberry production. From 2009 to 2012, organic blueberry acreage in Washington increased 130%, while production tripled. Nearly 75% of the acreage in the state is east of the Cascade Range. Washington organic blueberry producers reported a farmgate value of $23 million for the 2012 crop, up from $7 million for the 2009 crop. Recent average organic yields were lower than those reported by USDA-NASS for all blueberries in the state, which is partially due to the high proportion of young plantings. However, average organic blueberry market prices exceeded those reported by NASS for all blueberries. A large increase in supply of both conventional and organic blueberries is expected within the next few years because a significant portion of planted acres are not yet fully bearing and still more acreage is being planted. This could lead to a supply-demand imbalance that might depress prices.
Introduction
Worldwide production of blueberries has increased in recent years (Brazelton 2013) as consumers seek them out as part of a healthy diet. Northern highbush blueberry (Vaccinium corymbosum) has emerged as a major player within Washington State’s specialty crop sector. Organic production is an important component of the berry indus-try and Washington leads in national organic blueberry production (NASS 2012). Organic food sales, including blueberries, continue to increase, creating opportunities for producers. The Organic Trade Association reported 11.5% annual growth in U.S. retail sales of organic foods during 2013, with fruits and vegetables accounting for 33% of all organic food sales (OTA 2014).
This fact sheet summarizes recent Washington organic blueberry acreage, production, and value. Also provid-ed are baseline analyses of organic yield, price, and gross revenue per acre.
The organic blueberry industry is young and still rapidly expanding, thus precise and reliable price and yield data are difficult to find. The information provided in this study represents a significant addition to what is currently avail-able publically. References to blueberry in this publication refer solely to V. corymbosum.
This publication is part of a series on select Washington organic specialty crops including berries, tree fruit, grapes, and vegetables. It is intended to assist industry supply fore-casts, support producer decisions regarding entry into or expansion of organic production, and help manage finan-cial risk, especially important for crops where Washington production represents a significant portion of the national organic supply.
Methods and Data Description
Organic blueberry trends reported here were derived from data provided by the Washington State Department of Agriculture (WSDA) Organic Food Program, which includes approximately 95% of National Organic Program (NOP)–certified Washington producers. Four years (2009-2012) of acreage, production, and gross crop sales (farmgate, not including value added) were provided, compiled, and summarized, and then compared to similar USDA-National Agricultural Statistics Service (NASS) data for all blueber-ries in the state (NASS 2013a, 2013b). In some cases, data have been segregated by geography within the state, with “West” meaning west of the Cascade Range and “East” meaning east of the mountains. For blueberries, production in the East generally requires full-season irrigation, whereas in the West, there may be supplemental irrigation during the summer.
Any production data reported by volume were converted to weight using standard market guidelines (USDA-AMS 2012). Note: Production reported as packed fruit was not converted to a gross field production value. There was no distinction made between berries sold to the fresh market versus the processing market (generally at different prices) in the data reported to WSDA.
This fact sheet is part of the Trends in Washington Organic Crop Production Series.
2
More detailed definitions and explanation of data calcula-tions can be found online at: http://csanr.wsu.edu/data-and-calculations/.
Blueberry Trends
To provide perspective on organic blueberries, it is helpful to first review trends in the blueberry industry as a whole. Worldwide, as in Washington State, the blueberry industry has experienced a period of extensive growth of planted area, production, and value. According to the North Ameri-can Blueberry Council (NABC),world highbush blueberry acreage grew by 42% from 2008 to 2012, while produc-tion (lb) grew by almost 70% (Brazelton 2013). This rapid growth has made it difficult for the industry to accurately forecast supply and demand. However, in the United States, demand unexpectedly kept up with increased national supply through the 2012 season. As young acres planted over the last decade come into full production, industry challenges such as limited packing capacity and control of Spotted Wing Drosophila (Drosophila suzukii) have become apparent (Brazelton 2013).
The Pacific Northwest region (British Columbia, Canada; Washington and Oregon, United States) has become the world’s largest blueberry production region with 261 mil-lion pounds of blueberries in 2012, representing 25% of the world’s total highbush volume. British Columbia was the largest producer, with 115 million pounds. Other large producers include the states of Michigan, Georgia, and New Jersey, and the countries of Chile, Argentina, and China. Washington blueberry production increased 79%, from 36 million pounds in 2009, to 70 million pounds in 2012 (Brazelton 2013; NASS 2013).
By 2012, Washington State ranked third in blueberry acre-age in the United States, behind Michigan and Georgia, and overtook Oregon and New Jersey. The NABC reported 11,360 acres of Washington blueberries for 2012, includ-ing non-bearing and bearing acreage. (Commercial bear-ing generally begins in the second year after planting and reaches full production in the seventh year after planting). NASS data show that harvested Washington blueberry acreage reached 8,000 acres in 2012, an increase of 67% from 2009. The Washington Blueberry Commission (WBC) estimated that a third of all planted acreage in the state was non-bearing in 2013, signaling a large increase in produc-tion in the next few years.
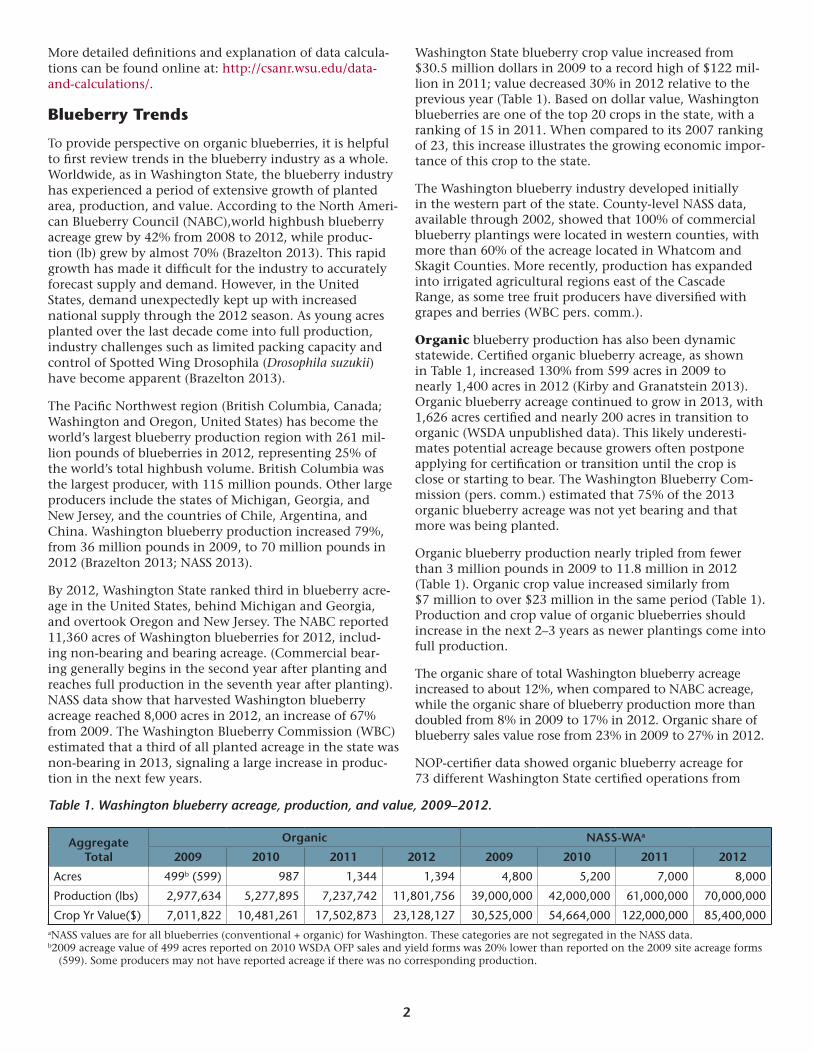
Washington State blueberry crop value increased from $30.5 million dollars in 2009 to a record high of $122 mil-lion in 2011; value decreased 30% in 2012 relative to the previous year (Table 1). Based on dollar value, Washington blueberries are one of the top 20 crops in the state, with a ranking of 15 in 2011. When compared to its 2007 ranking of 23, this increase illustrates the growing economic impor-tance of this crop to the state.
The Washington blueberry industry developed initially in the western part of the state. County-level NASS data, available through 2002, showed that 100% of commercial blueberry plantings were located in western counties, with more than 60% of the acreage located in Whatcom and Skagit Counties. More recently, production has expanded into irrigated agricultural regions east of the Cascade Range, as some tree fruit producers have diversified with grapes and berries (WBC pers. comm.).
Organic blueberry production has also been dynamic statewide. Certified organic blueberry acreage, as shown in Table 1, increased 130% from 599 acres in 2009 to nearly 1,400 acres in 2012 (Kirby and Granatstein 2013). Organic blueberry acreage continued to grow in 2013, with 1,626 acres certified and nearly 200 acres in transition to organic (WSDA unpublished data). This likely underesti-mates potential acreage because growers often postpone applying for certification or transition until the crop is close or starting to bear. The Washington Blueberry Com-mission (pers. comm.) estimated that 75% of the 2013 organic blueberry acreage was not yet bearing and that more was being planted.
Organic blueberry production nearly tripled from fewer than 3 million pounds in 2009 to 11.8 million in 2012 (Table 1). Organic crop value increased similarly from $7 million to over $23 million in the same period (Table 1). Production and crop value of organic blueberries should increase in the next 2–3 years as newer plantings come into full production.
The organic share of total Washington blueberry acreage increased to about 12%, when compared to NABC acreage, while the organic share of blueberry production more than doubled from 8% in 2009 to 17% in 2012. Organic share of blueberry sales value rose from 23% in 2009 to 27% in 2012.
NOP-certifier data showed organic blueberry acreage for 73 different Washington State certified operations from
Table 1. Washington blueberry acreage, production, and value, 2009–2012.
Aggregate Total
Organic NASS-WAa
2009 2010 2011 2012 2009 2010 2011 2012
Acres 499b (599) 987 1,344 1,394 4,800 5,200 7,000 8,000
Production (lbs) 2,977,634 5,277,895 7,237,742 11,801,756 39,000,000 42,000,000 61,000,000 70,000,000
Crop Yr Value($) 7,011,822 10,481,261 17,502,873 23,128,127 30,525,000 54,664,000 122,000,000 85,400,000aNASS values are for all blueberries (conventional + organic) for Washington. These categories are not segregated in the NASS data.b2009 acreage value of 499 acres reported on 2010 WSDA OFP sales and yield forms was 20% lower than reported on the 2009 site acreage forms
(599). Some producers may not have reported acreage if there was no corresponding production.
3
2009 to 2013. The number of operations varied annually as growers entered or exited organic production. In 2009, 51 Washington operations reported organic blueberry acre-age compared to 53 operations in 2013, which included 22 operations that did not show certified blueberry acreage in 2009. Twenty operations with organic blueberries in 2009 were not certified in 2013; 30 had organic blueberry acre-age all five years. Just 9 operations increased their organic blueberry acreage during the 2009 to 2013 period. The number of operations listing blueberry sales and produc-tion data ranged from 25 for the 2009 crop to 42 for 2012.
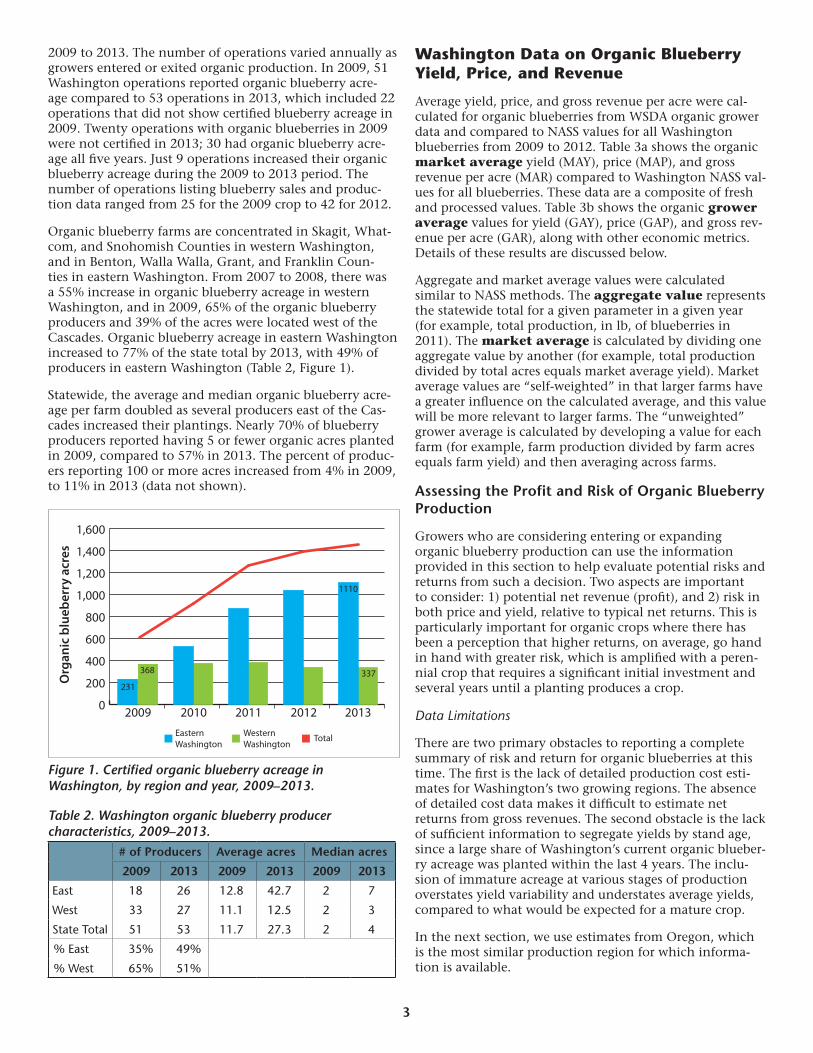
Organic blueberry farms are concentrated in Skagit, What-com, and Snohomish Counties in western Washington, and in Benton, Walla Walla, Grant, and Franklin Coun-ties in eastern Washington. From 2007 to 2008, there was a 55% increase in organic blueberry acreage in western Washington, and in 2009, 65% of the organic blueberry producers and 39% of the acres were located west of the Cascades. Organic blueberry acreage in eastern Washington increased to 77% of the state total by 2013, with 49% of producers in eastern Washington (Table 2, Figure 1).
Statewide, the average and median organic blueberry acre-age per farm doubled as several producers east of the Cas-cades increased their plantings. Nearly 70% of blueberry producers reported having 5 or fewer organic acres planted in 2009, compared to 57% in 2013. The percent of produc-ers reporting 100 or more acres increased from 4% in 2009, to 11% in 2013 (data not shown).
Washington Data on Organic Blueberry Yield, Price, and Revenue
Average yield, price, and gross revenue per acre were cal-culated for organic blueberries from WSDA organic grower data and compared to NASS values for all Washington blueberries from 2009 to 2012. Table 3a shows the organic market average yield (MAY), price (MAP), and gross revenue per acre (MAR) compared to Washington NASS val-ues for all blueberries. These data are a composite of fresh and processed values. Table 3b shows the organic grower average values for yield (GAY), price (GAP), and gross rev-enue per acre (GAR), along with other economic metrics. Details of these results are discussed below.
Aggregate and market average values were calculated similar to NASS methods. The aggregate value represents the statewide total for a given parameter in a given year (for example, total production, in lb, of blueberries in 2011). The market average is calculated by dividing one aggregate value by another (for example, total production divided by total acres equals market average yield). Market average values are “self-weighted” in that larger farms have a greater influence on the calculated average, and this value will be more relevant to larger farms. The “unweighted” grower average is calculated by developing a value for each farm (for example, farm production divided by farm acres equals farm yield) and then averaging across farms.
Assessing the Profit and Risk of Organic Blueberry Production
Growers who are considering entering or expanding organic blueberry production can use the information provided in this section to help evaluate potential risks and returns from such a decision. Two aspects are important to consider: 1) potential net revenue (profit), and 2) risk in both price and yield, relative to typical net returns. This is particularly important for organic crops where there has been a perception that higher returns, on average, go hand in hand with greater risk, which is amplified with a peren-nial crop that requires a significant initial investment and several years until a planting produces a crop.
Data Limitations
There are two primary obstacles to reporting a complete summary of risk and return for organic blueberries at this time. The first is the lack of detailed production cost esti-mates for Washington’s two growing regions. The absence of detailed cost data makes it difficult to estimate net returns from gross revenues. The second obstacle is the lack of sufficient information to segregate yields by stand age, since a large share of Washington’s current organic blueber-ry acreage was planted within the last 4 years. The inclu-sion of immature acreage at various stages of production overstates yield variability and understates average yields, compared to what would be expected for a mature crop.
In the next section, we use estimates from Oregon, which is the most similar production region for which informa-tion is available.
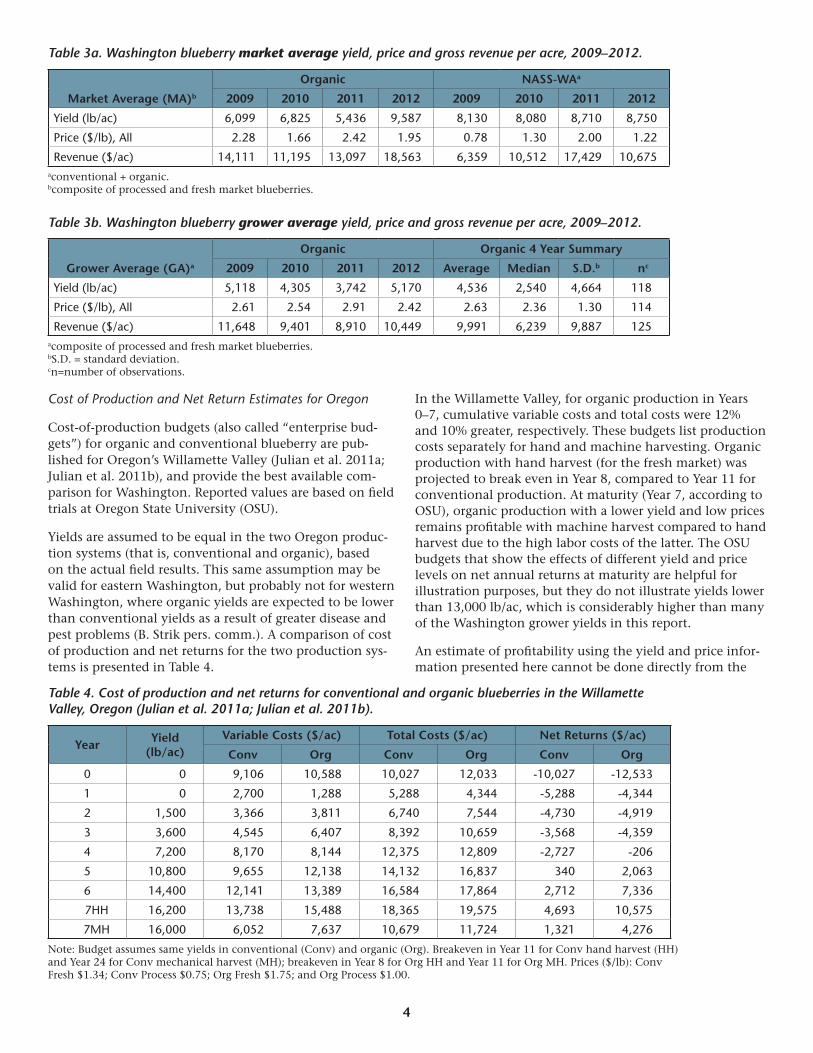
Table 2. Washington organic blueberry producer characteristics, 2009–2013.
# of Producers Average acres Median acres
2009 2013 2009 2013 2009 2013
East 18 26 12.8 42.7 2 7
West 33 27 11.1 12.5 2 3
State Total 51 53 11.7 27.3 2 4
% East 35% 49%
% West 65% 51%
0
200
400
600
800
1,000
1,200
1,400
1,600
2009 2010 2011 2012 2013
EasternWashington
Total
Org
anic
blu
eber
ry a
cres
WesternWashington
231
368
1110
337
Figure 1. Certified organic blueberry acreage in Washington, by region and year, 2009–2013.
4
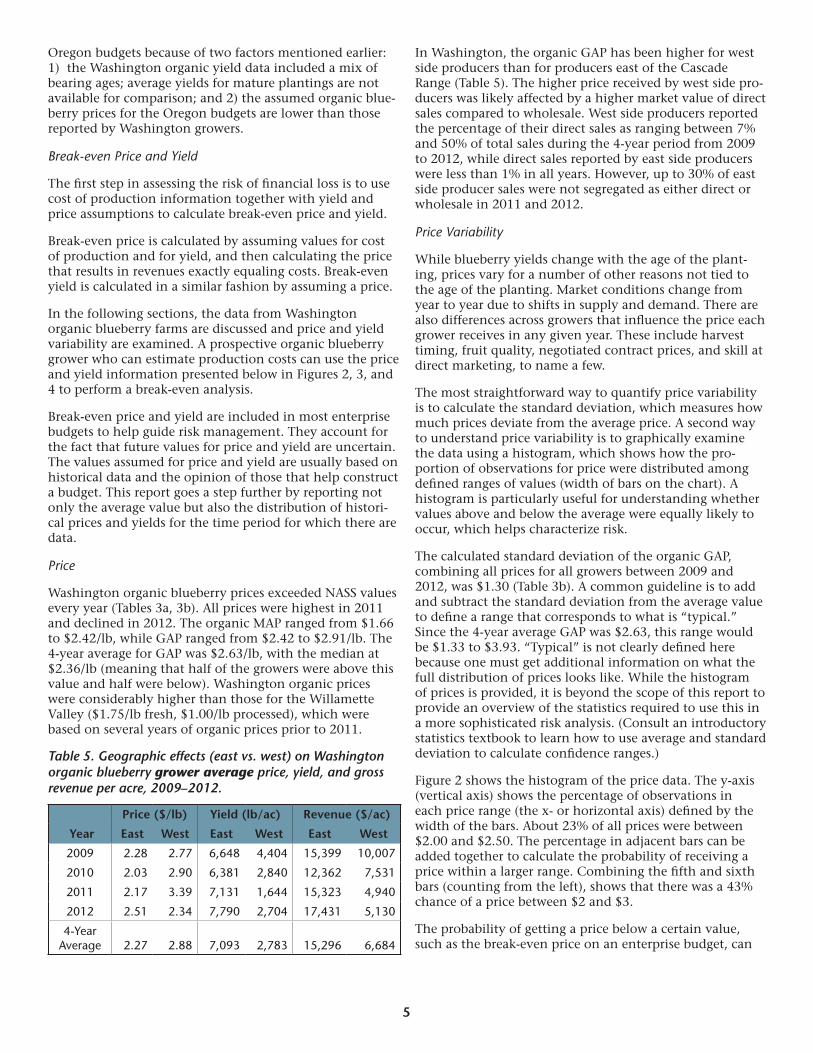
Table 3a. Washington blueberry market average yield, price and gross revenue per acre, 2009–2012.
Market Average (MA)b
Organic NASS-WAa
2009 2010 2011 2012 2009 2010 2011 2012
Yield (lb/ac) 6,099 6,825 5,436 9,587 8,130 8,080 8,710 8,750
Price ($/lb), All 2.28 1.66 2.42 1.95 0.78 1.30 2.00 1.22
Revenue ($/ac) 14,111 11,195 13,097 18,563 6,359 10,512 17,429 10,675aconventional + organic.bcomposite of processed and fresh market blueberries.
Table 3b. Washington blueberry grower average yield, price and gross revenue per acre, 2009–2012.
Grower Average (GA)a
Organic Organic 4 Year Summary
2009 2010 2011 2012 Average Median S.D.b nc
Yield (lb/ac) 5,118 4,305 3,742 5,170 4,536 2,540 4,664 118
Price ($/lb), All 2.61 2.54 2.91 2.42 2.63 2.36 1.30 114
Revenue ($/ac) 11,648 9,401 8,910 10,449 9,991 6,239 9,887 125acomposite of processed and fresh market blueberries.bS.D. = standard deviation.cn=number of observations.
Cost of Production and Net Return Estimates for Oregon
Cost-of-production budgets (also called “enterprise bud-gets”) for organic and conventional blueberry are pub-lished for Oregon’s Willamette Valley (Julian et al. 2011a; Julian et al. 2011b), and provide the best available com-parison for Washington. Reported values are based on field trials at Oregon State University (OSU).
Yields are assumed to be equal in the two Oregon produc-tion systems (that is, conventional and organic), based on the actual field results. This same assumption may be valid for eastern Washington, but probably not for western Washington, where organic yields are expected to be lower than conventional yields as a result of greater disease and pest problems (B. Strik pers. comm.). A comparison of cost of production and net returns for the two production sys-tems is presented in Table 4.
In the Willamette Valley, for organic production in Years 0–7, cumulative variable costs and total costs were 12% and 10% greater, respectively. These budgets list production costs separately for hand and machine harvesting. Organic production with hand harvest (for the fresh market) was projected to break even in Year 8, compared to Year 11 for conventional production. At maturity (Year 7, according to OSU), organic production with a lower yield and low prices remains profitable with machine harvest compared to hand harvest due to the high labor costs of the latter. The OSU budgets that show the effects of different yield and price levels on net annual returns at maturity are helpful for illustration purposes, but they do not illustrate yields lower than 13,000 lb/ac, which is considerably higher than many of the Washington grower yields in this report.
An estimate of profitability using the yield and price infor-mation presented here cannot be done directly from the
Table 4. Cost of production and net returns for conventional and organic blueberries in the Willamette Valley, Oregon (Julian et al. 2011a; Julian et al. 2011b).
Year Yield (lb/ac)
Variable Costs ($/ac) Total Costs ($/ac) Net Returns ($/ac)
Conv Org Conv Org Conv Org
0 0 9,106 10,588 10,027 12,033 -10,027 -12,533
1 0 2,700 1,288 5,288 4,344 -5,288 -4,344
2 1,500 3,366 3,811 6,740 7,544 -4,730 -4,919
3 3,600 4,545 6,407 8,392 10,659 -3,568 -4,359
4 7,200 8,170 8,144 12,375 12,809 -2,727 -206
5 10,800 9,655 12,138 14,132 16,837 340 2,063
6 14,400 12,141 13,389 16,584 17,864 2,712 7,336
7HH 16,200 13,738 15,488 18,365 19,575 4,693 10,575
7MH 16,000 6,052 7,637 10,679 11,724 1,321 4,276
Note: Budget assumes same yields in conventional (Conv) and organic (Org). Breakeven in Year 11 for Conv hand harvest (HH) and Year 24 for Conv mechanical harvest (MH); breakeven in Year 8 for Org HH and Year 11 for Org MH. Prices ($/lb): Conv Fresh $1.34; Conv Process $0.75; Org Fresh $1.75; and Org Process $1.00.
5
Oregon budgets because of two factors mentioned earlier: 1) the Washington organic yield data included a mix of bearing ages; average yields for mature plantings are not available for comparison; and 2) the assumed organic blue-berry prices for the Oregon budgets are lower than those reported by Washington growers.
Break-even Price and Yield
The first step in assessing the risk of financial loss is to use cost of production information together with yield and price assumptions to calculate break-even price and yield.
Break-even price is calculated by assuming values for cost of production and for yield, and then calculating the price that results in revenues exactly equaling costs. Break-even yield is calculated in a similar fashion by assuming a price.
In the following sections, the data from Washington organic blueberry farms are discussed and price and yield variability are examined. A prospective organic blueberry grower who can estimate production costs can use the price and yield information presented below in Figures 2, 3, and 4 to perform a break-even analysis.
Break-even price and yield are included in most enterprise budgets to help guide risk management. They account for the fact that future values for price and yield are uncertain. The values assumed for price and yield are usually based on historical data and the opinion of those that help construct a budget. This report goes a step further by reporting not only the average value but also the distribution of histori-cal prices and yields for the time period for which there are data.
Price
Washington organic blueberry prices exceeded NASS values every year (Tables 3a, 3b). All prices were highest in 2011 and declined in 2012. The organic MAP ranged from $1.66 to $2.42/lb, while GAP ranged from $2.42 to $2.91/lb. The 4-year average for GAP was $2.63/lb, with the median at $2.36/lb (meaning that half of the growers were above this value and half were below). Washington organic prices were considerably higher than those for the Willamette Valley ($1.75/lb fresh, $1.00/lb processed), which were based on several years of organic prices prior to 2011.
In Washington, the organic GAP has been higher for west side producers than for producers east of the Cascade Range (Table 5). The higher price received by west side pro-ducers was likely affected by a higher market value of direct sales compared to wholesale. West side producers reported the percentage of their direct sales as ranging between 7% and 50% of total sales during the 4-year period from 2009 to 2012, while direct sales reported by east side producers were less than 1% in all years. However, up to 30% of east side producer sales were not segregated as either direct or wholesale in 2011 and 2012.
Price Variability
While blueberry yields change with the age of the plant-ing, prices vary for a number of other reasons not tied to the age of the planting. Market conditions change from year to year due to shifts in supply and demand. There are also differences across growers that influence the price each grower receives in any given year. These include harvest timing, fruit quality, negotiated contract prices, and skill at direct marketing, to name a few.
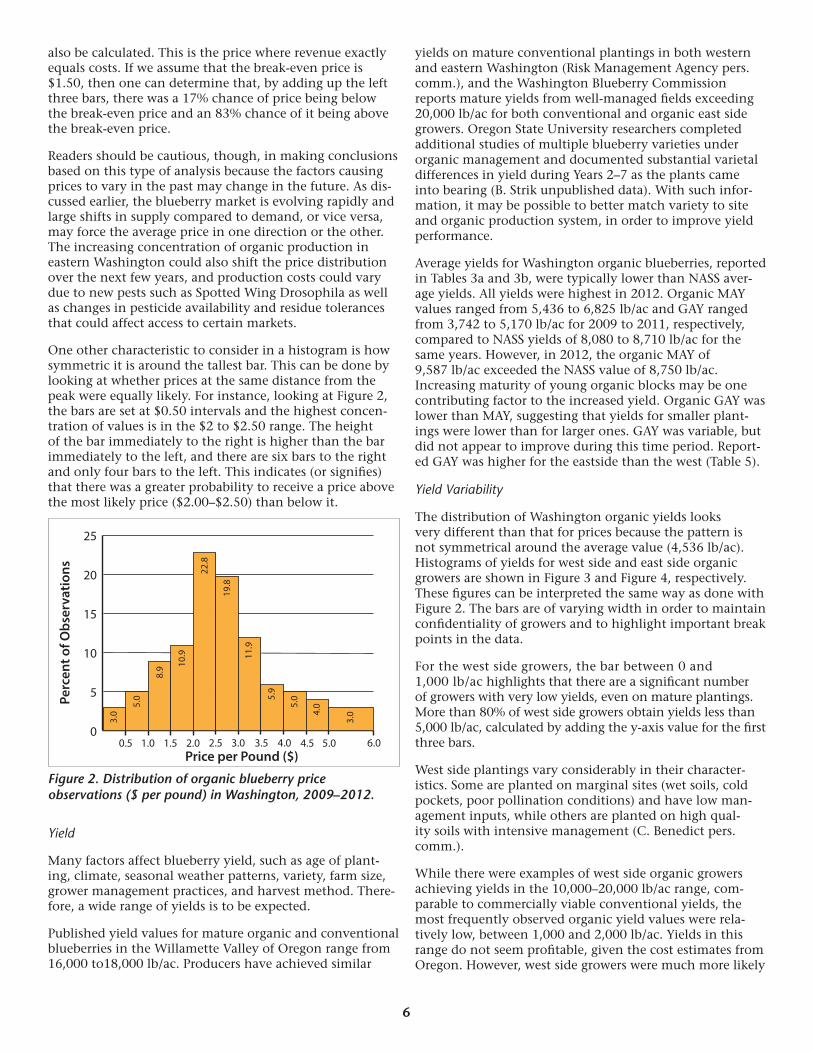
The most straightforward way to quantify price variability is to calculate the standard deviation, which measures how much prices deviate from the average price. A second way to understand price variability is to graphically examine the data using a histogram, which shows how the pro-portion of observations for price were distributed among defined ranges of values (width of bars on the chart). A histogram is particularly useful for understanding whether values above and below the average were equally likely to occur, which helps characterize risk.
The calculated standard deviation of the organic GAP, combining all prices for all growers between 2009 and 2012, was $1.30 (Table 3b). A common guideline is to add and subtract the standard deviation from the average value to define a range that corresponds to what is “typical.” Since the 4-year average GAP was $2.63, this range would be $1.33 to $3.93. “Typical” is not clearly defined here because one must get additional information on what the full distribution of prices looks like. While the histogram of prices is provided, it is beyond the scope of this report to provide an overview of the statistics required to use this in a more sophisticated risk analysis. (Consult an introductory statistics textbook to learn how to use average and standard deviation to calculate confidence ranges.)
Figure 2 shows the histogram of the price data. The y-axis (vertical axis) shows the percentage of observations in each price range (the x- or horizontal axis) defined by the width of the bars. About 23% of all prices were between $2.00 and $2.50. The percentage in adjacent bars can be added together to calculate the probability of receiving a price within a larger range. Combining the fifth and sixth bars (counting from the left), shows that there was a 43% chance of a price between $2 and $3.
The probability of getting a price below a certain value, such as the break-even price on an enterprise budget, can
Table 5. Geographic effects (east vs. west) on Washington organic blueberry grower average price, yield, and gross revenue per acre, 2009–2012.
Year
Price ($/lb) Yield (lb/ac) Revenue ($/ac)
East West East West East West
2009 2.28 2.77 6,648 4,404 15,399 10,007
2010 2.03 2.90 6,381 2,840 12,362 7,531
2011 2.17 3.39 7,131 1,644 15,323 4,940
2012 2.51 2.34 7,790 2,704 17,431 5,130
4-Year Average 2.27 2.88 7,093 2,783 15,296 6,684
6
also be calculated. This is the price where revenue exactly equals costs. If we assume that the break-even price is $1.50, then one can determine that, by adding up the left three bars, there was a 17% chance of price being below the break-even price and an 83% chance of it being above the break-even price.
Readers should be cautious, though, in making conclusions based on this type of analysis because the factors causing prices to vary in the past may change in the future. As dis-cussed earlier, the blueberry market is evolving rapidly and large shifts in supply compared to demand, or vice versa, may force the average price in one direction or the other. The increasing concentration of organic production in eastern Washington could also shift the price distribution over the next few years, and production costs could vary due to new pests such as Spotted Wing Drosophila as well as changes in pesticide availability and residue tolerances that could affect access to certain markets.
One other characteristic to consider in a histogram is how symmetric it is around the tallest bar. This can be done by looking at whether prices at the same distance from the peak were equally likely. For instance, looking at Figure 2, the bars are set at $0.50 intervals and the highest concen-tration of values is in the $2 to $2.50 range. The height of the bar immediately to the right is higher than the bar immediately to the left, and there are six bars to the right and only four bars to the left. This indicates (or signifies) that there was a greater probability to receive a price above the most likely price ($2.00–$2.50) than below it.
Yield
Many factors affect blueberry yield, such as age of plant-ing, climate, seasonal weather patterns, variety, farm size, grower management practices, and harvest method. There-fore, a wide range of yields is to be expected.
Published yield values for mature organic and conventional blueberries in the Willamette Valley of Oregon range from 16,000 to18,000 lb/ac. Producers have achieved similar
yields on mature conventional plantings in both western and eastern Washington (Risk Management Agency pers. comm.), and the Washington Blueberry Commission reports mature yields from well-managed fields exceeding 20,000 lb/ac for both conventional and organic east side growers. Oregon State University researchers completed additional studies of multiple blueberry varieties under organic management and documented substantial varietal differences in yield during Years 2–7 as the plants came into bearing (B. Strik unpublished data). With such infor-mation, it may be possible to better match variety to site and organic production system, in order to improve yield performance.
Average yields for Washington organic blueberries, reported in Tables 3a and 3b, were typically lower than NASS aver-age yields. All yields were highest in 2012. Organic MAY values ranged from 5,436 to 6,825 lb/ac and GAY ranged from 3,742 to 5,170 lb/ac for 2009 to 2011, respectively, compared to NASS yields of 8,080 to 8,710 lb/ac for the same years. However, in 2012, the organic MAY of 9,587 lb/ac exceeded the NASS value of 8,750 lb/ac. Increasing maturity of young organic blocks may be one contributing factor to the increased yield. Organic GAY was lower than MAY, suggesting that yields for smaller plant-ings were lower than for larger ones. GAY was variable, but did not appear to improve during this time period. Report-ed GAY was higher for the eastside than the west (Table 5).
Yield Variability
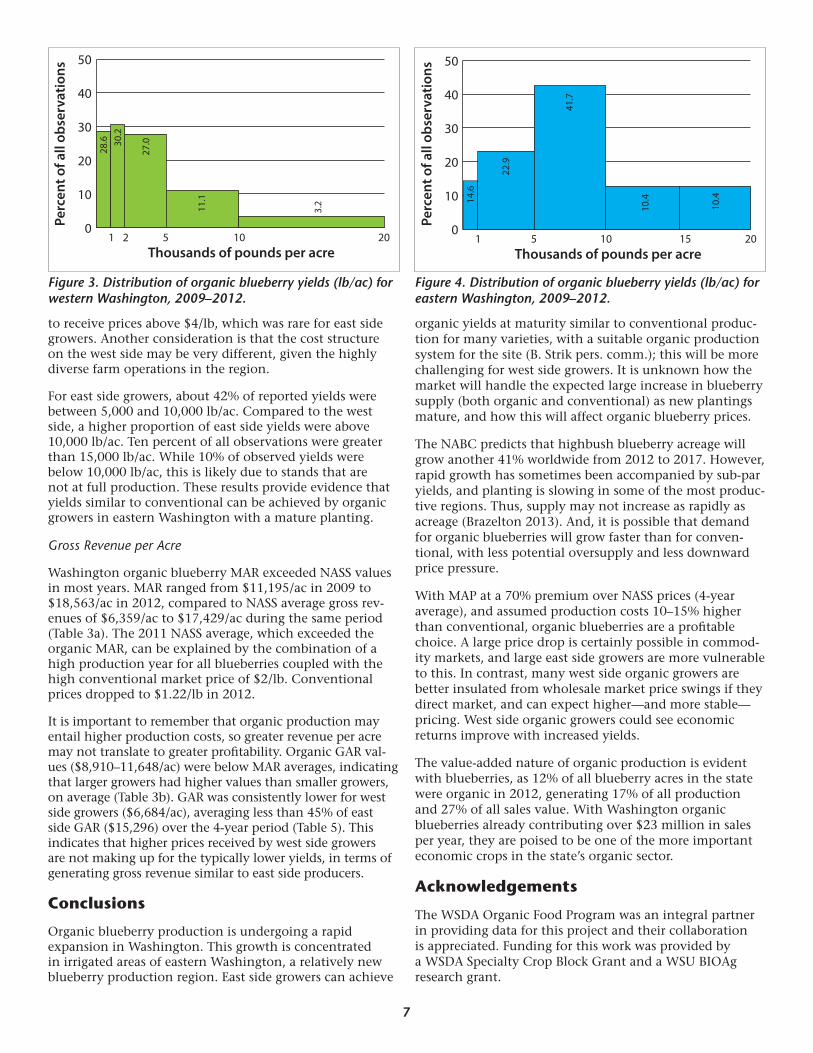
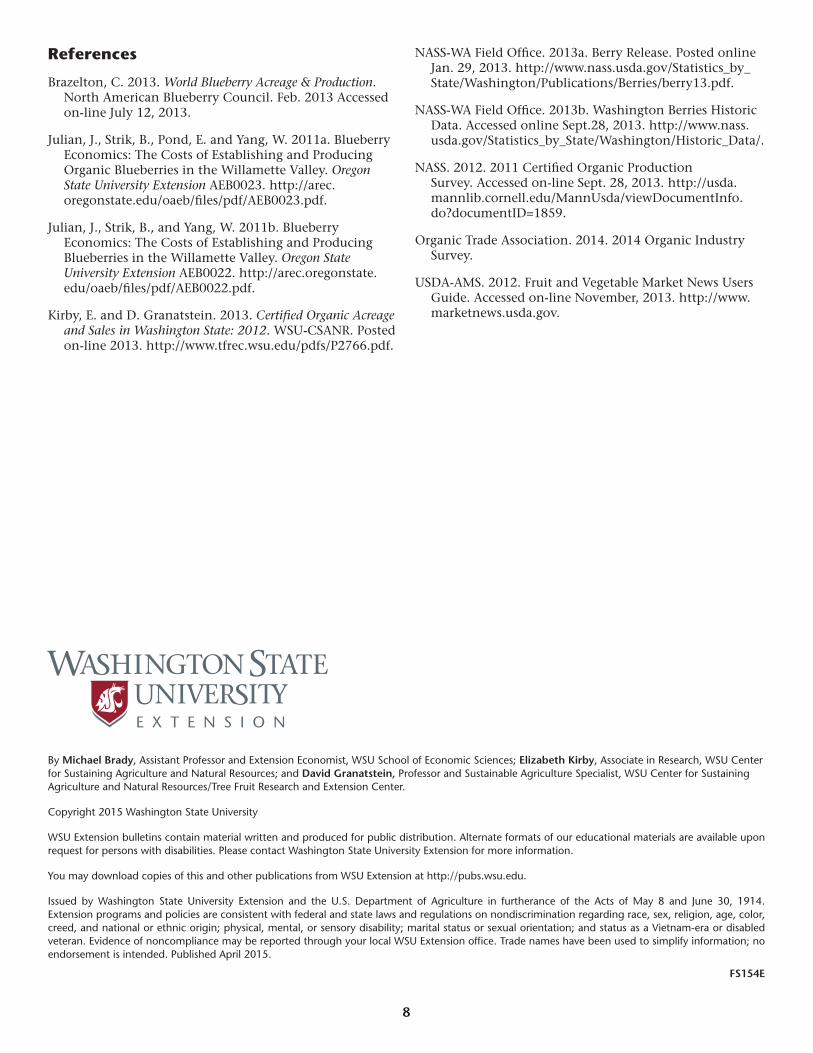
The distribution of Washington organic yields looks very different than that for prices because the pattern is not symmetrical around the average value (4,536 lb/ac). Histograms of yields for west side and east side organic growers are shown in Figure 3 and Figure 4, respectively. These figures can be interpreted the same way as done with Figure 2. The bars are of varying width in order to maintain confidentiality of growers and to highlight important break points in the data.
For the west side growers, the bar between 0 and 1,000 lb/ac highlights that there are a significant number of growers with very low yields, even on mature plantings. More than 80% of west side growers obtain yields less than 5,000 lb/ac, calculated by adding the y-axis value for the first three bars.
West side plantings vary considerably in their character-istics. Some are planted on marginal sites (wet soils, cold pockets, poor pollination conditions) and have low man-agement inputs, while others are planted on high qual-ity soils with intensive management (C. Benedict pers. comm.).
While there were examples of west side organic growers achieving yields in the 10,000–20,000 lb/ac range, com-parable to commercially viable conventional yields, the most frequently observed organic yield values were rela-tively low, between 1,000 and 2,000 lb/ac. Yields in this range do not seem profitable, given the cost estimates from Oregon. However, west side growers were much more likely
Perc
ent o
f Obs
erva
tions
0
5
10
15
20
25
Price per Pound ($)0.5 1.0 1.5 2.0 2.5 3.0 3.5 4.0 4.5 5.0 6.0
3.0
5.0
8.9 10
.9
22.8
19.8
11.9
5.9
5.0
4.0
3.0
Figure 2. Distribution of organic blueberry price observations ($ per pound) in Washington, 2009–2012.
7
to receive prices above $4/lb, which was rare for east side growers. Another consideration is that the cost structure on the west side may be very different, given the highly diverse farm operations in the region.
For east side growers, about 42% of reported yields were between 5,000 and 10,000 lb/ac. Compared to the west side, a higher proportion of east side yields were above 10,000 lb/ac. Ten percent of all observations were greater than 15,000 lb/ac. While 10% of observed yields were below 10,000 lb/ac, this is likely due to stands that are not at full production. These results provide evidence that yields similar to conventional can be achieved by organic growers in eastern Washington with a mature planting.
Gross Revenue per Acre
Washington organic blueberry MAR exceeded NASS values in most years. MAR ranged from $11,195/ac in 2009 to $18,563/ac in 2012, compared to NASS average gross rev-enues of $6,359/ac to $17,429/ac during the same period (Table 3a). The 2011 NASS average, which exceeded the organic MAR, can be explained by the combination of a high production year for all blueberries coupled with the high conventional market price of $2/lb. Conventional prices dropped to $1.22/lb in 2012.
It is important to remember that organic production may entail higher production costs, so greater revenue per acre may not translate to greater profitability. Organic GAR val-ues ($8,910–11,648/ac) were below MAR averages, indicating that larger growers had higher values than smaller growers, on average (Table 3b). GAR was consistently lower for west side growers ($6,684/ac), averaging less than 45% of east side GAR ($15,296) over the 4-year period (Table 5). This indicates that higher prices received by west side growers are not making up for the typically lower yields, in terms of generating gross revenue similar to east side producers.
Conclusions
Organic blueberry production is undergoing a rapid expansion in Washington. This growth is concentrated in irrigated areas of eastern Washington, a relatively new blueberry production region. East side growers can achieve
organic yields at maturity similar to conventional produc-tion for many varieties, with a suitable organic production system for the site (B. Strik pers. comm.); this will be more challenging for west side growers. It is unknown how the market will handle the expected large increase in blueberry supply (both organic and conventional) as new plantings mature, and how this will affect organic blueberry prices.
The NABC predicts that highbush blueberry acreage will grow another 41% worldwide from 2012 to 2017. However, rapid growth has sometimes been accompanied by sub-par yields, and planting is slowing in some of the most produc-tive regions. Thus, supply may not increase as rapidly as acreage (Brazelton 2013). And, it is possible that demand for organic blueberries will grow faster than for conven-tional, with less potential oversupply and less downward price pressure.
With MAP at a 70% premium over NASS prices (4-year average), and assumed production costs 10–15% higher than conventional, organic blueberries are a profitable choice. A large price drop is certainly possible in commod-ity markets, and large east side growers are more vulnerable to this. In contrast, many west side organic growers are better insulated from wholesale market price swings if they direct market, and can expect higher—and more stable—pricing. West side organic growers could see economic returns improve with increased yields.
The value-added nature of organic production is evident with blueberries, as 12% of all blueberry acres in the state were organic in 2012, generating 17% of all production and 27% of all sales value. With Washington organic blueberries already contributing over $23 million in sales per year, they are poised to be one of the more important economic crops in the state’s organic sector.
Acknowledgements
The WSDA Organic Food Program was an integral partner in providing data for this project and their collaboration is appreciated. Funding for this work was provided by a WSDA Specialty Crop Block Grant and a WSU BIOAg research grant.
Perc
ent o
f all
obse
rvat
ions
0
10
20
30
40
50
Thousands of pounds per acre1 5 10 20
28.6
27.0
11.1
3.2
30.2
2
Figure 3. Distribution of organic blueberry yields (lb/ac) for western Washington, 2009–2012.
Perc
ent o
f all
obse
rvat
ions
0
10
20
30
40
50
Thousands of pounds per acre1 5 10 2015
14.6
22.9
41.7
10.4
10.4
Figure 4. Distribution of organic blueberry yields (lb/ac) for eastern Washington, 2009–2012.
8
By Michael Brady, Assistant Professor and Extension Economist, WSU School of Economic Sciences; Elizabeth Kirby, Associate in Research, WSU Center for Sustaining Agriculture and Natural Resources; and David Granatstein, Professor and Sustainable Agriculture Specialist, WSU Center for Sustaining Agriculture and Natural Resources/Tree Fruit Research and Extension Center.
Copyright 2015 Washington State University
WSU Extension bulletins contain material written and produced for public distribution. Alternate formats of our educational materials are available upon request for persons with disabilities. Please contact Washington State University Extension for more information.
You may download copies of this and other publications from WSU Extension at http://pubs.wsu.edu.
Issued by Washington State University Extension and the U.S. Department of Agriculture in furtherance of the Acts of May 8 and June 30, 1914. Extension programs and policies are consistent with federal and state laws and regulations on nondiscrimination regarding race, sex, religion, age, color, creed, and national or ethnic origin; physical, mental, or sensory disability; marital status or sexual orientation; and status as a Vietnam-era or disabled veteran. Evidence of noncompliance may be reported through your local WSU Extension office. Trade names have been used to simplify information; no endorsement is intended. Published April 2015.
FS154E
References
Brazelton, C. 2013. World Blueberry Acreage & Production. North American Blueberry Council. Feb. 2013 Accessed on-line July 12, 2013.
Julian, J., Strik, B., Pond, E. and Yang, W. 2011a. Blueberry Economics: The Costs of Establishing and Producing Organic Blueberries in the Willamette Valley. Oregon State University Extension AEB0023. http://arec.oregonstate.edu/oaeb/files/pdf/AEB0023.pdf.
Julian, J., Strik, B., and Yang, W. 2011b. Blueberry Economics: The Costs of Establishing and Producing Blueberries in the Willamette Valley. Oregon State University Extension AEB0022. http://arec.oregonstate.edu/oaeb/files/pdf/AEB0022.pdf.
Kirby, E. and D. Granatstein. 2013. Certified Organic Acreage and Sales in Washington State: 2012. WSU-CSANR. Posted on-line 2013. http://www.tfrec.wsu.edu/pdfs/P2766.pdf.
NASS-WA Field Office. 2013a. Berry Release. Posted online Jan. 29, 2013. http://www.nass.usda.gov/Statistics_by_State/Washington/Publications/Berries/berry13.pdf.
NASS-WA Field Office. 2013b. Washington Berries Historic Data. Accessed online Sept.28, 2013. http://www.nass.usda.gov/Statistics_by_State/Washington/Historic_Data/.
NASS. 2012. 2011 Certified Organic Production Survey. Accessed on-line Sept. 28, 2013. http://usda.mannlib.cornell.edu/MannUsda/viewDocumentInfo.do?documentID=1859.
Organic Trade Association. 2014. 2014 Organic Industry Survey.
USDA-AMS. 2012. Fruit and Vegetable Market News Users Guide. Accessed on-line November, 2013. http://www.marketnews.usda.gov.