Trends in Washington State Organic Diversified Vegetable...
18
1 DRAFT. 1/17/18. This manuscript is currently under review by WSU Extension. The version below has not yet undergone peer review. The publication will be part of the Organic Trends Series. Trends in Washington State Organic Diversified Vegetable Production Authors: David Granatstein, Mike Brady, Elizabeth Kirby, Marcy Ostrom; WSU SUMMARY Around 25% of certified organic farms in Washington produce diversified organic vegetables. Growing organic vegetables is commonly viewed as an important entry strategy into agriculture for beginning farmers who may also have limited resources. Data from the WSDA Organic Food Program, the primary organic certifier in Washington State, were collected and analyzed to characterize diversified organic vegetable farms in the state in terms of their number, size, distribution, marketing channel, and gross revenue. About two-thirds of these farms are located in western Washington and account for 80% of the sales value from mixed organic vegetables. Three-quarters of mixed vegetable farms exclusively grow mixed vegetables and other horticultural crops. Half the farms are five acres or less in size. The average gross revenue per acre from mixed vegetable production for 2009-2012 was $12,500, with a number of observations exceeding $40,000. An estimate of total production cost was derived from Vancouver, BC crop budgets, and was $16,500. About 30% of the gross revenue per acre observations were above this level. In aggregate, farms in the mixed vegetable category generated over $20 million in sales in 2012. INTRODUCTION Organic farming has become a well-established component of U.S. agriculture. In 2015, there were an estimated 14,861 certified farming operations in the U.S. covering some 5.3 million acres (NASS 2016b). When organic farming was first emerging as a defined production and marketing system in the 1970s, it offered an avenue for new farmers, particularly from the “back to the land” movement, to enter agriculture (Guthman 2014). Diversified vegetable production was a common production model, and direct marketing was often pursued. Fueled by rising consumer demand for fresh local products, this trend has continued to the present, with many beginning farmers looking to enter agriculture through direct marketing of diversified organic products (Ostrom 2011). While some entrants in the 1970s were successful financially, it is not clear how viable this path is for new farmers today. Farms in America continue to grow in size putting upward pressure on the minimum viable size. It is common for the smallest farms (<$5,000 in gross sales per year) to have costs that exceed revenues (Sumner 2014). However, there is evidence that small farms are increasing as well (Key and Roberts 2007). The category that is disappearing most quickly is the medium sized farm. This is consistent with pursuing two different strategies for economic viability. The largest farms keep margins thin but use scale to enhance profitability. The smallest farms pursue direct and local market channelings to achieve higher margins. In this publication, we examine a subset of certified organic farms in Washington State categorized as “mixed vegetables” or “mixed horticulture.” Vegetables are a subset of the broader horticulture discipline, which can include production of fruits, flowers, and other crops not considered cereals, oilseeds, or forages. Diversified vegetable production fits the common public perception of an organic farm. These farms typically grow many crops on areas too small or difficult to report as individual crops within their organic certification process. Crops may be mixed within a single bed, within a small field, or
Transcript of Trends in Washington State Organic Diversified Vegetable...

1
DRAFT. 1/17/18. This manuscript is currently under review by WSU Extension. The version below has not yet undergone peer review. The publication will be part of the Organic Trends Series.
Trends in Washington State Organic Diversified Vegetable Production
Authors: David Granatstein, Mike Brady, Elizabeth Kirby, Marcy Ostrom; WSU
SUMMARY
Around 25% of certified organic farms in Washington produce diversified organic vegetables. Growing organic vegetables is commonly viewed as an important entry strategy into agriculture for beginning farmers who may also have limited resources. Data from the WSDA Organic Food Program, the primary organic certifier in Washington State, were collected and analyzed to characterize diversified organic vegetable farms in the state in terms of their number, size, distribution, marketing channel, and gross revenue. About two-thirds of these farms are located in western Washington and account for 80% of the sales value from mixed organic vegetables. Three-quarters of mixed vegetable farms exclusively grow mixed vegetables and other horticultural crops. Half the farms are five acres or less in size. The average gross revenue per acre from mixed vegetable production for 2009-2012 was $12,500, with a number of observations exceeding $40,000. An estimate of total production cost was derived from Vancouver, BC crop budgets, and was $16,500. About 30% of the gross revenue per acre observations were above this level. In aggregate, farms in the mixed vegetable category generated over $20 million in sales in 2012.
INTRODUCTION
Organic farming has become a well-established component of U.S. agriculture. In 2015, there were an estimated 14,861 certified farming operations in the U.S. covering some 5.3 million acres (NASS 2016b). When organic farming was first emerging as a defined production and marketing system in the 1970s, it offered an avenue for new farmers, particularly from the “back to the land” movement, to enter agriculture (Guthman 2014). Diversified vegetable production was a common production model, and direct marketing was often pursued. Fueled by rising consumer demand for fresh local products, this trend has continued to the present, with many beginning farmers looking to enter agriculture through direct marketing of diversified organic products (Ostrom 2011). While some entrants in the 1970s were successful financially, it is not clear how viable this path is for new farmers today. Farms in America continue to grow in size putting upward pressure on the minimum viable size. It is common for the smallest farms (<$5,000 in gross sales per year) to have costs that exceed revenues (Sumner 2014). However, there is evidence that small farms are increasing as well (Key and Roberts 2007). The category that is disappearing most quickly is the medium sized farm. This is consistent with pursuing two different strategies for economic viability. The largest farms keep margins thin but use scale to enhance profitability. The smallest farms pursue direct and local market channelings to achieve higher margins.
In this publication, we examine a subset of certified organic farms in Washington State categorized as “mixed vegetables” or “mixed horticulture.” Vegetables are a subset of the broader horticulture discipline, which can include production of fruits, flowers, and other crops not considered cereals, oilseeds, or forages. Diversified vegetable production fits the common public perception of an organic farm. These farms typically grow many crops on areas too small or difficult to report as individual crops within their organic certification process. Crops may be mixed within a single bed, within a small field, or
2
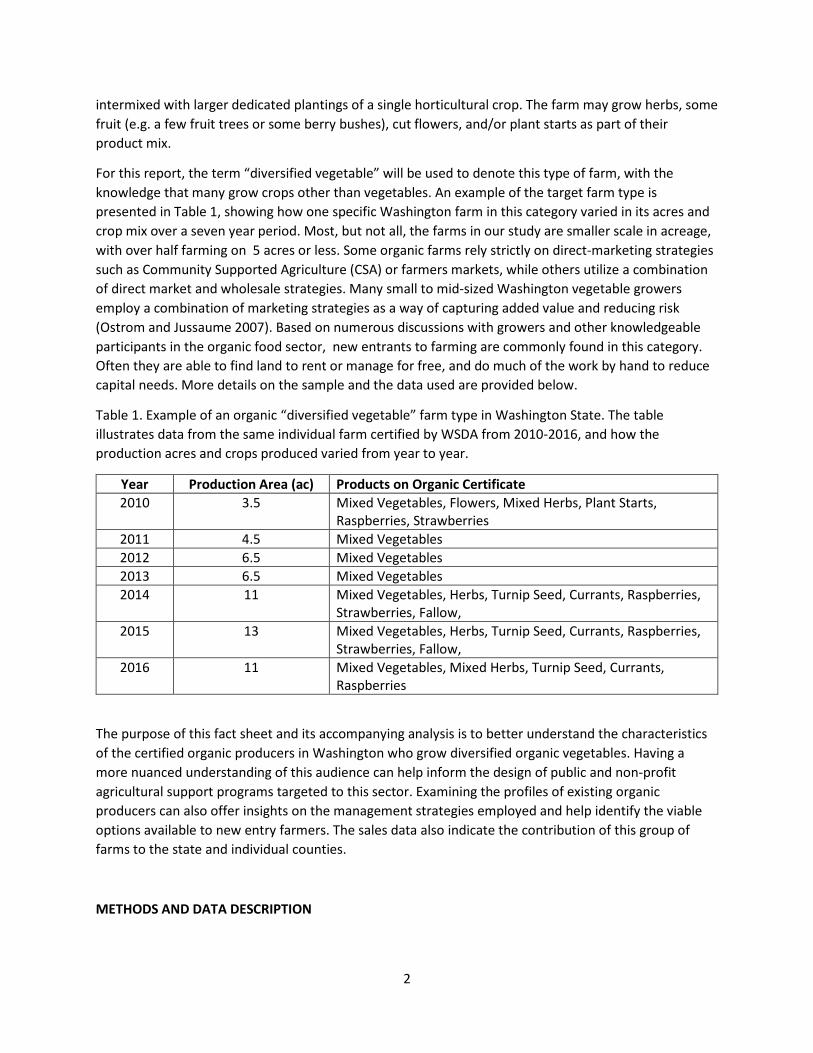
intermixed with larger dedicated plantings of a single horticultural crop. The farm may grow herbs, some fruit (e.g. a few fruit trees or some berry bushes), cut flowers, and/or plant starts as part of their product mix.
For this report, the term “diversified vegetable” will be used to denote this type of farm, with the knowledge that many grow crops other than vegetables. An example of the target farm type is presented in Table 1, showing how one specific Washington farm in this category varied in its acres and crop mix over a seven year period. Most, but not all, the farms in our study are smaller scale in acreage, with over half farming on 5 acres or less. Some organic farms rely strictly on direct-marketing strategies such as Community Supported Agriculture (CSA) or farmers markets, while others utilize a combination of direct market and wholesale strategies. Many small to mid-sized Washington vegetable growers employ a combination of marketing strategies as a way of capturing added value and reducing risk (Ostrom and Jussaume 2007). Based on numerous discussions with growers and other knowledgeable participants in the organic food sector, new entrants to farming are commonly found in this category. Often they are able to find land to rent or manage for free, and do much of the work by hand to reduce capital needs. More details on the sample and the data used are provided below.
Table 1. Example of an organic “diversified vegetable” farm type in Washington State. The table illustrates data from the same individual farm certified by WSDA from 2010-2016, and how the production acres and crops produced varied from year to year.
Year Production Area (ac) Products on Organic Certificate 2010 3.5 Mixed Vegetables, Flowers, Mixed Herbs, Plant Starts,
Raspberries, Strawberries 2011 4.5 Mixed Vegetables 2012 6.5 Mixed Vegetables 2013 6.5 Mixed Vegetables 2014 11 Mixed Vegetables, Herbs, Turnip Seed, Currants, Raspberries,
Strawberries, Fallow, 2015 13 Mixed Vegetables, Herbs, Turnip Seed, Currants, Raspberries,
Strawberries, Fallow, 2016 11 Mixed Vegetables, Mixed Herbs, Turnip Seed, Currants,
Raspberries
The purpose of this fact sheet and its accompanying analysis is to better understand the characteristics of the certified organic producers in Washington who grow diversified organic vegetables. Having a more nuanced understanding of this audience can help inform the design of public and non-profit agricultural support programs targeted to this sector. Examining the profiles of existing organic producers can also offer insights on the management strategies employed and help identify the viable options available to new entry farmers. The sales data also indicate the contribution of this group of farms to the state and individual counties.
METHODS AND DATA DESCRIPTION

3
Data were derived from a number of sources, including organic certifiers, the USDA NASS Census of Agriculture (NASS 2014), the NASS Organic Production surveys (NASS 2009, 2012, 2015, 2016a), and the NASS Organic Certifier data (NASS 2016b). Data on area and crop production for certified organic farms in Washington State were obtained from the primary certifier, the Washington State Department of Agriculture Organic Food Program (WSDA). The WSDA organic program began in 1988, and in recent years has certified between 90-95% of the organic farms in the state. Farm, crop, and year specific detail on crop yields and sales were obtained from WSDA for the 2009-2012 crop years, and provided the basis for the farm revenue analysis. These data included a breakout of sales by direct marketing versus wholesale for each year for most farms, which were used to evaluate marketing channel. WSDA also provided gross revenue by farm for the years 1993-2015, used in the regression analysis of Gross Revenue per Acre. Since most farms in this study reported a mixed crop, no yield data could be analyzed or presented. Similarly price per unit could not be derived by dividing revenue by production volume. Thus, this study focuses on trends in farm number, farm size, and gross revenues. The access to the detailed certifier data, particularly the sales and yield data, is unique; they are not always collected by certifiers and are not normally available for research. The partnership between WSDA and WSU on organic statistics made this analysis possible.
The trend line for number of organic farms with diversified vegetable production was derived from WSDA certifier data starting in 1988 when the state organic certification program began. For this analysis, any farm that had “vegetables” or “mixed vegetables” as one of the crop designations was initially included. Then each farm was screened for: crop diversity (4 or more vegetable crops grown); acreage of a single vegetable crop (generally excluded if >130 acres, the size of a center-pivot irrigated field); large discrepancies between site acres and crop acres (a site can contain multiple fields and crops). The data were more detailed after 2005, thus the estimates are likely more accurate after this date than before. Data were not available for 2000-2003.
The “mixed vegetable” sample was derived from the database of all WSDA certified organic farms and the renewal forms covering the 2009-2012 production years. The initial set of farms was determined by those that had the designation ‘Mixed Vegetable’ or ‘Mixed Horticulture’ in the WSDA database. These farms may have had sites with other designations as well, such as a defined area of a specific vegetable or fruit. If mixed vegetable or mixed horticulture production was the dominant use (>50% of the combined area of these crops or the combined revenue from these crops), the farm was included. Farms with Mixed Horticulture in the crop category were included if they had Mixed Horticulture, Fruit Mixed, Flowers, or Plant Starts as a variety field and met the dominant use rule above. In addition, farms with ‘Vegetables’ for crop category, but not ‘Mixed Vegetables’ listed as variety, were examined to see if they listed a range of vegetable crops with specific acreages and were diversified beyond the 1 to 3 vegetable crops grown in large fields for processing by many of the larger organic farms that do not fit the profile being examined. Farms with incomplete or missing data that precluded analysis were dropped. In total, 136 unique farms were included in the sample. Some were certified for all four years examined, others only for one to three years. Several farms listed under Mixed Horticulture that appeared to be nursery or greenhouse operations were also excluded.
Averages for farm acres and gross farm revenue were generated by dividing the total by the number of farms (443). Gross revenue per acre (GRA) was determined by dividing the revenue on each farm by the acres on each farm, and then averages were calculated from those values. This is the ‘grower average’ method that does not weight by farm size. The ‘market average’ method (total revenues from all farms
4
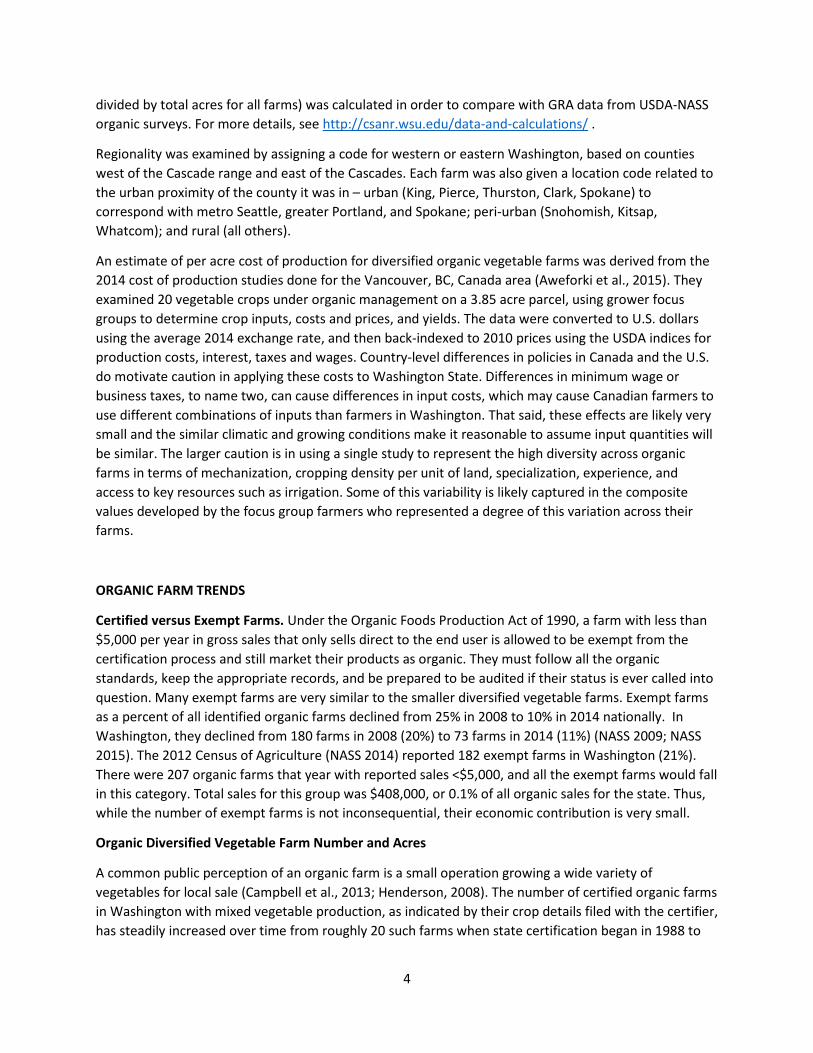
divided by total acres for all farms) was calculated in order to compare with GRA data from USDA-NASS organic surveys. For more details, see http://csanr.wsu.edu/data-and-calculations/ .
Regionality was examined by assigning a code for western or eastern Washington, based on counties west of the Cascade range and east of the Cascades. Each farm was also given a location code related to the urban proximity of the county it was in – urban (King, Pierce, Thurston, Clark, Spokane) to correspond with metro Seattle, greater Portland, and Spokane; peri-urban (Snohomish, Kitsap, Whatcom); and rural (all others).
An estimate of per acre cost of production for diversified organic vegetable farms was derived from the 2014 cost of production studies done for the Vancouver, BC, Canada area (Aweforki et al., 2015). They examined 20 vegetable crops under organic management on a 3.85 acre parcel, using grower focus groups to determine crop inputs, costs and prices, and yields. The data were converted to U.S. dollars using the average 2014 exchange rate, and then back-indexed to 2010 prices using the USDA indices for production costs, interest, taxes and wages. Country-level differences in policies in Canada and the U.S. do motivate caution in applying these costs to Washington State. Differences in minimum wage or business taxes, to name two, can cause differences in input costs, which may cause Canadian farmers to use different combinations of inputs than farmers in Washington. That said, these effects are likely very small and the similar climatic and growing conditions make it reasonable to assume input quantities will be similar. The larger caution is in using a single study to represent the high diversity across organic farms in terms of mechanization, cropping density per unit of land, specialization, experience, and access to key resources such as irrigation. Some of this variability is likely captured in the composite values developed by the focus group farmers who represented a degree of this variation across their farms.
ORGANIC FARM TRENDS
Certified versus Exempt Farms. Under the Organic Foods Production Act of 1990, a farm with less than $5,000 per year in gross sales that only sells direct to the end user is allowed to be exempt from the certification process and still market their products as organic. They must follow all the organic standards, keep the appropriate records, and be prepared to be audited if their status is ever called into question. Many exempt farms are very similar to the smaller diversified vegetable farms. Exempt farms as a percent of all identified organic farms declined from 25% in 2008 to 10% in 2014 nationally. In Washington, they declined from 180 farms in 2008 (20%) to 73 farms in 2014 (11%) (NASS 2009; NASS 2015). The 2012 Census of Agriculture (NASS 2014) reported 182 exempt farms in Washington (21%). There were 207 organic farms that year with reported sales <$5,000, and all the exempt farms would fall in this category. Total sales for this group was $408,000, or 0.1% of all organic sales for the state. Thus, while the number of exempt farms is not inconsequential, their economic contribution is very small.
Organic Diversified Vegetable Farm Number and Acres
A common public perception of an organic farm is a small operation growing a wide variety of vegetables for local sale (Campbell et al., 2013; Henderson, 2008). The number of certified organic farms in Washington with mixed vegetable production, as indicated by their crop details filed with the certifier, has steadily increased over time from roughly 20 such farms when state certification began in 1988 to
5
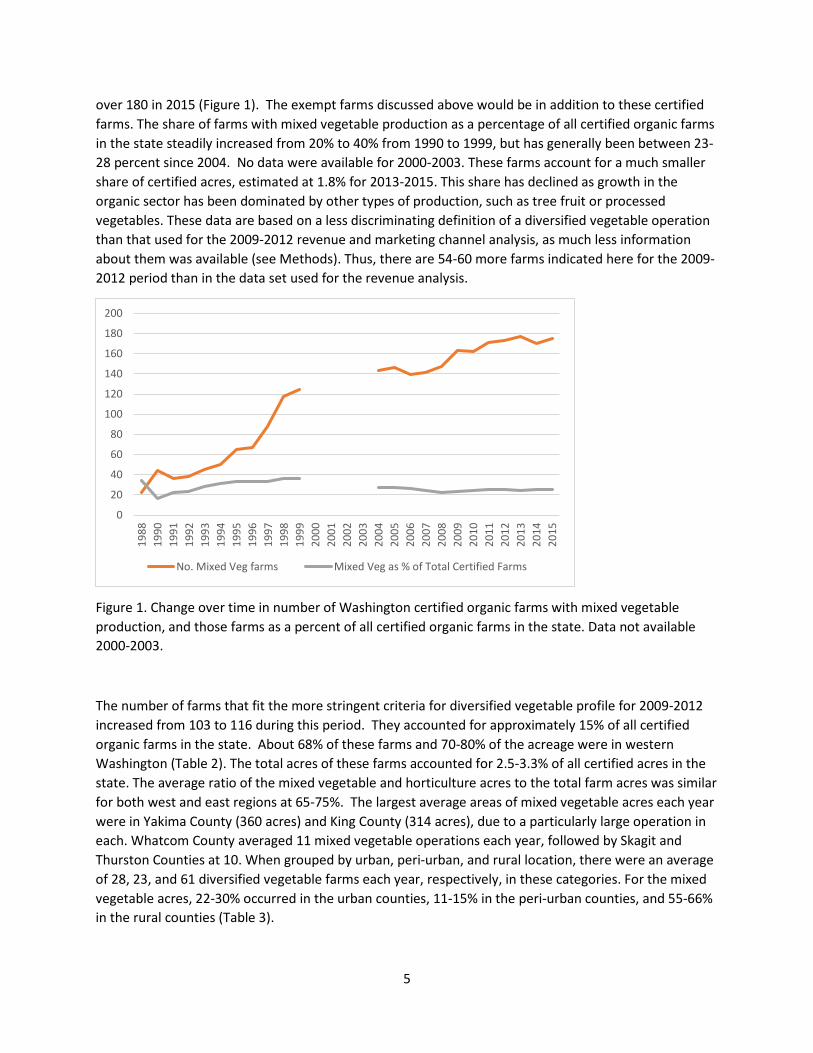
over 180 in 2015 (Figure 1). The exempt farms discussed above would be in addition to these certified farms. The share of farms with mixed vegetable production as a percentage of all certified organic farms in the state steadily increased from 20% to 40% from 1990 to 1999, but has generally been between 23-28 percent since 2004. No data were available for 2000-2003. These farms account for a much smaller share of certified acres, estimated at 1.8% for 2013-2015. This share has declined as growth in the organic sector has been dominated by other types of production, such as tree fruit or processed vegetables. These data are based on a less discriminating definition of a diversified vegetable operation than that used for the 2009-2012 revenue and marketing channel analysis, as much less information about them was available (see Methods). Thus, there are 54-60 more farms indicated here for the 2009-2012 period than in the data set used for the revenue analysis.
Figure 1. Change over time in number of Washington certified organic farms with mixed vegetable production, and those farms as a percent of all certified organic farms in the state. Data not available 2000-2003.
The number of farms that fit the more stringent criteria for diversified vegetable profile for 2009-2012 increased from 103 to 116 during this period. They accounted for approximately 15% of all certified organic farms in the state. About 68% of these farms and 70-80% of the acreage were in western Washington (Table 2). The total acres of these farms accounted for 2.5-3.3% of all certified acres in the state. The average ratio of the mixed vegetable and horticulture acres to the total farm acres was similar for both west and east regions at 65-75%. The largest average areas of mixed vegetable acres each year were in Yakima County (360 acres) and King County (314 acres), due to a particularly large operation in each. Whatcom County averaged 11 mixed vegetable operations each year, followed by Skagit and Thurston Counties at 10. When grouped by urban, peri-urban, and rural location, there were an average of 28, 23, and 61 diversified vegetable farms each year, respectively, in these categories. For the mixed vegetable acres, 22-30% occurred in the urban counties, 11-15% in the peri-urban counties, and 55-66% in the rural counties (Table 3).
0
20
40
60
80
100
120
140
160
180
200
1988
1990
1991
1992
1993
1994
1995
1996
1997
1998
1999
2000
2001
2002
2003
2004
2005
2006
2007
2008
2009
2010
2011
2012
2013
2014
2015
No. Mixed Veg farms Mixed Veg as % of Total Certified Farms
6
Table 2. Number and acres of diversified organic vegetable farms and acres in Washington, by region, 2009-2012. West=counties west of the Cascades Range; east=counties east of the Cascades
No. Farms Total Acres Mixed Vegetable Acres West East West East West East 2009 72 31 1,832 745 1,206 537 2010 73 35 2,321 577 1,280 388 2011 77 37 2,214 758 1,379 459 2012 77 39 1,836 791 1,374 607
Table 3. Distribution of mixed vegetable acres on diversified vegetable farms by urban, peri-urban, or rural proximity.
2009 2010 2011 2012 Urban 397 508 523 523 Peri-urban 198 244 275 261 Rural 1,163 931 1,055 1,215
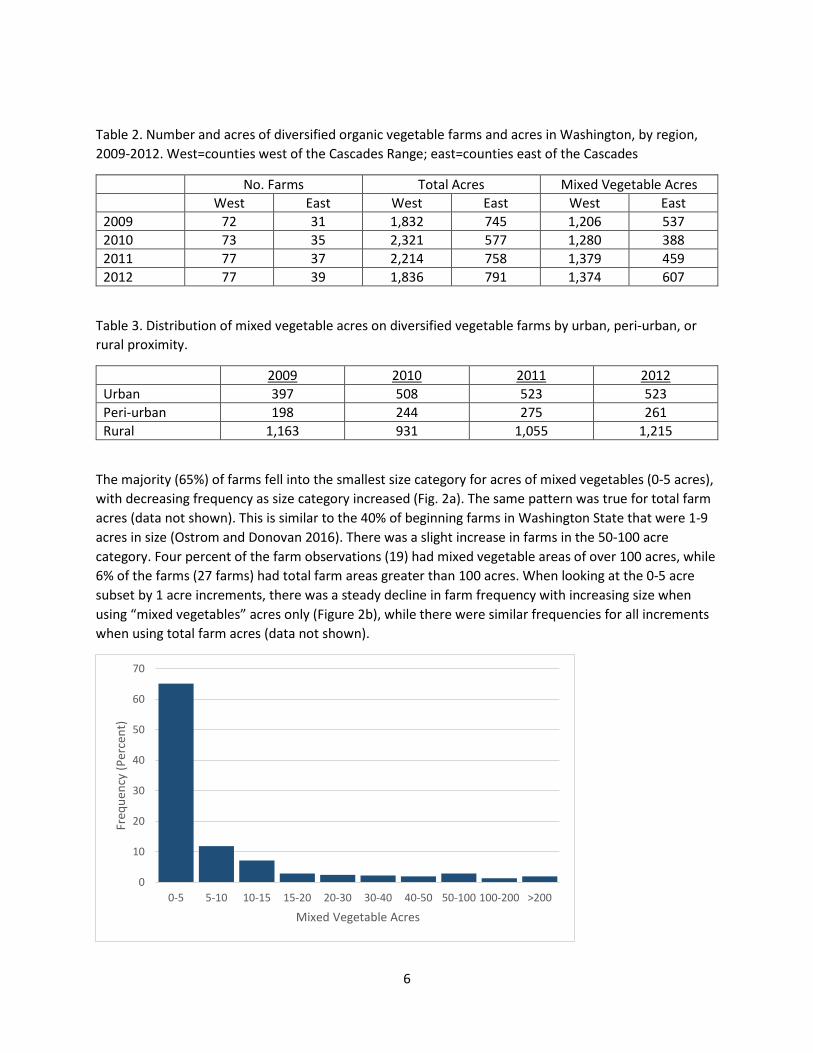
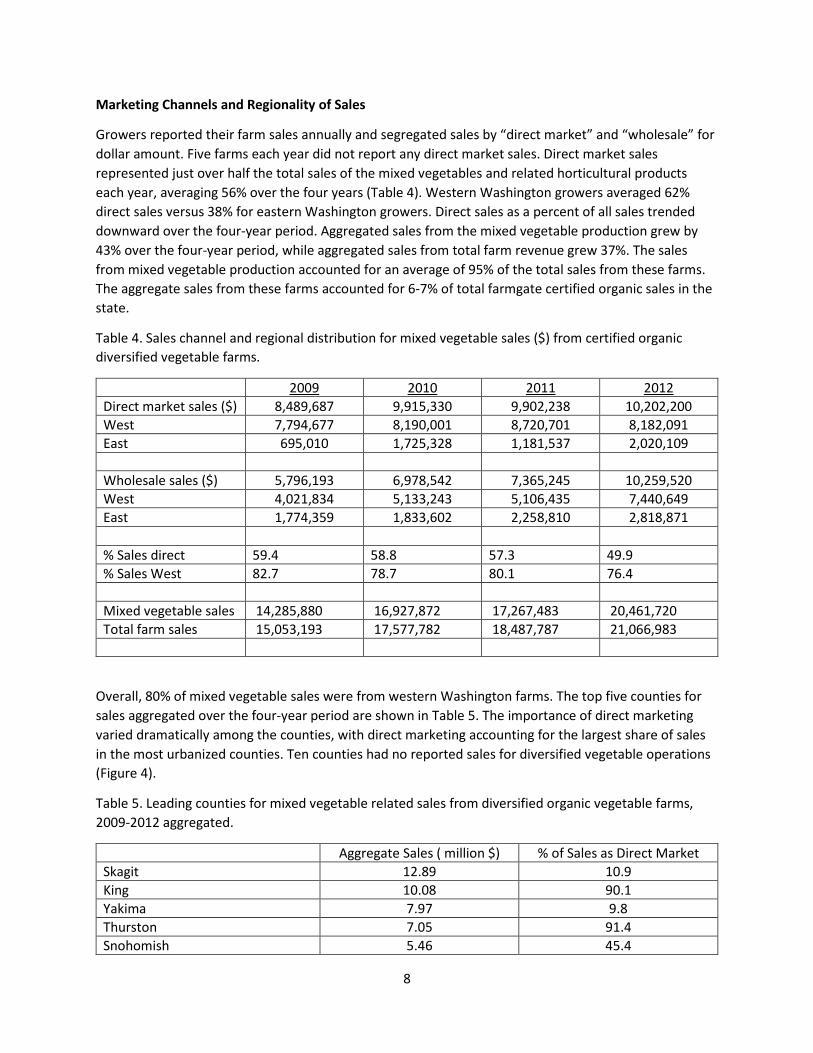
The majority (65%) of farms fell into the smallest size category for acres of mixed vegetables (0-5 acres), with decreasing frequency as size category increased (Fig. 2a). The same pattern was true for total farm acres (data not shown). This is similar to the 40% of beginning farms in Washington State that were 1-9 acres in size (Ostrom and Donovan 2016). There was a slight increase in farms in the 50-100 acre category. Four percent of the farm observations (19) had mixed vegetable areas of over 100 acres, while 6% of the farms (27 farms) had total farm areas greater than 100 acres. When looking at the 0-5 acre subset by 1 acre increments, there was a steady decline in farm frequency with increasing size when using “mixed vegetables” acres only (Figure 2b), while there were similar frequencies for all increments when using total farm acres (data not shown).
0
10
20
30
40
50
60
70
0-5 5-10 10-15 15-20 20-30 30-40 40-50 50-100 100-200 >200
Freq
uenc
y (P
erce
nt)
Mixed Vegetable Acres
7
Figure 2. Distribution of diversified vegetable farm acres across size categories for mixed vegetable acres (2a) and 1-acre increment detail for the 0-5 acre category (2b).
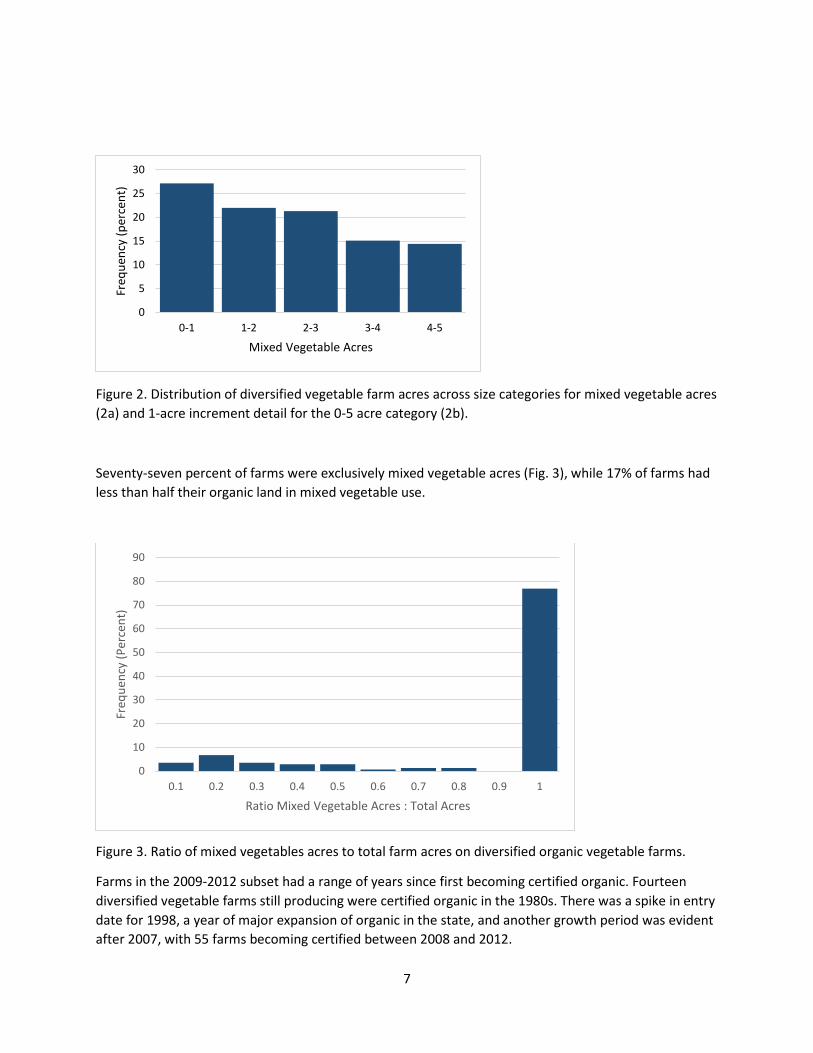
Seventy-seven percent of farms were exclusively mixed vegetable acres (Fig. 3), while 17% of farms had less than half their organic land in mixed vegetable use.
Figure 3. Ratio of mixed vegetables acres to total farm acres on diversified organic vegetable farms.
Farms in the 2009-2012 subset had a range of years since first becoming certified organic. Fourteen diversified vegetable farms still producing were certified organic in the 1980s. There was a spike in entry date for 1998, a year of major expansion of organic in the state, and another growth period was evident after 2007, with 55 farms becoming certified between 2008 and 2012.
0
5
10
15
20
25
30
0-1 1-2 2-3 3-4 4-5
Freq
uenc
y (p
erce
nt)
Mixed Vegetable Acres
0
10
20
30
40
50
60
70
80
90
0.1 0.2 0.3 0.4 0.5 0.6 0.7 0.8 0.9 1
Freq
uenc
y (P
erce
nt)
Ratio Mixed Vegetable Acres : Total Acres
8
Marketing Channels and Regionality of Sales
Growers reported their farm sales annually and segregated sales by “direct market” and “wholesale” for dollar amount. Five farms each year did not report any direct market sales. Direct market sales represented just over half the total sales of the mixed vegetables and related horticultural products each year, averaging 56% over the four years (Table 4). Western Washington growers averaged 62% direct sales versus 38% for eastern Washington growers. Direct sales as a percent of all sales trended downward over the four-year period. Aggregated sales from the mixed vegetable production grew by 43% over the four-year period, while aggregated sales from total farm revenue grew 37%. The sales from mixed vegetable production accounted for an average of 95% of the total sales from these farms. The aggregate sales from these farms accounted for 6-7% of total farmgate certified organic sales in the state.
Table 4. Sales channel and regional distribution for mixed vegetable sales ($) from certified organic diversified vegetable farms.
2009 2010 2011 2012 Direct market sales ($) 8,489,687 9,915,330 9,902,238 10,202,200 West 7,794,677 8,190,001 8,720,701 8,182,091 East 695,010 1,725,328 1,181,537 2,020,109 Wholesale sales ($) 5,796,193 6,978,542 7,365,245 10,259,520 West 4,021,834 5,133,243 5,106,435 7,440,649 East 1,774,359 1,833,602 2,258,810 2,818,871 % Sales direct 59.4 58.8 57.3 49.9 % Sales West 82.7 78.7 80.1 76.4 Mixed vegetable sales 14,285,880 16,927,872 17,267,483 20,461,720 Total farm sales 15,053,193 17,577,782 18,487,787 21,066,983
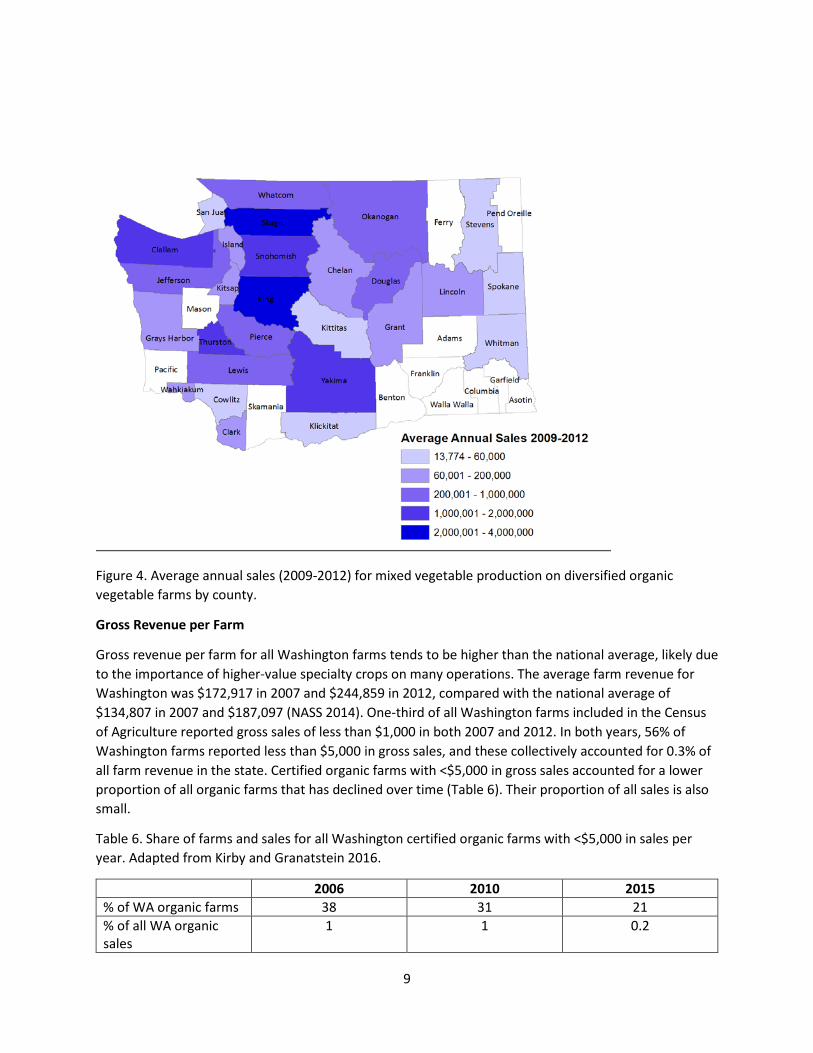
Overall, 80% of mixed vegetable sales were from western Washington farms. The top five counties for sales aggregated over the four-year period are shown in Table 5. The importance of direct marketing varied dramatically among the counties, with direct marketing accounting for the largest share of sales in the most urbanized counties. Ten counties had no reported sales for diversified vegetable operations (Figure 4).
Table 5. Leading counties for mixed vegetable related sales from diversified organic vegetable farms, 2009-2012 aggregated.
Aggregate Sales ( million $) % of Sales as Direct Market Skagit 12.89 10.9 King 10.08 90.1 Yakima 7.97 9.8 Thurston 7.05 91.4 Snohomish 5.46 45.4
9
Figure 4. Average annual sales (2009-2012) for mixed vegetable production on diversified organic vegetable farms by county.
Gross Revenue per Farm
Gross revenue per farm for all Washington farms tends to be higher than the national average, likely due to the importance of higher-value specialty crops on many operations. The average farm revenue for Washington was $172,917 in 2007 and $244,859 in 2012, compared with the national average of $134,807 in 2007 and $187,097 (NASS 2014). One-third of all Washington farms included in the Census of Agriculture reported gross sales of less than $1,000 in both 2007 and 2012. In both years, 56% of Washington farms reported less than $5,000 in gross sales, and these collectively accounted for 0.3% of all farm revenue in the state. Certified organic farms with <$5,000 in gross sales accounted for a lower proportion of all organic farms that has declined over time (Table 6). Their proportion of all sales is also small.
Table 6. Share of farms and sales for all Washington certified organic farms with <$5,000 in sales per year. Adapted from Kirby and Granatstein 2016.
2006 2010 2015 % of WA organic farms 38 31 21 % of all WA organic sales
1 1 0.2
10
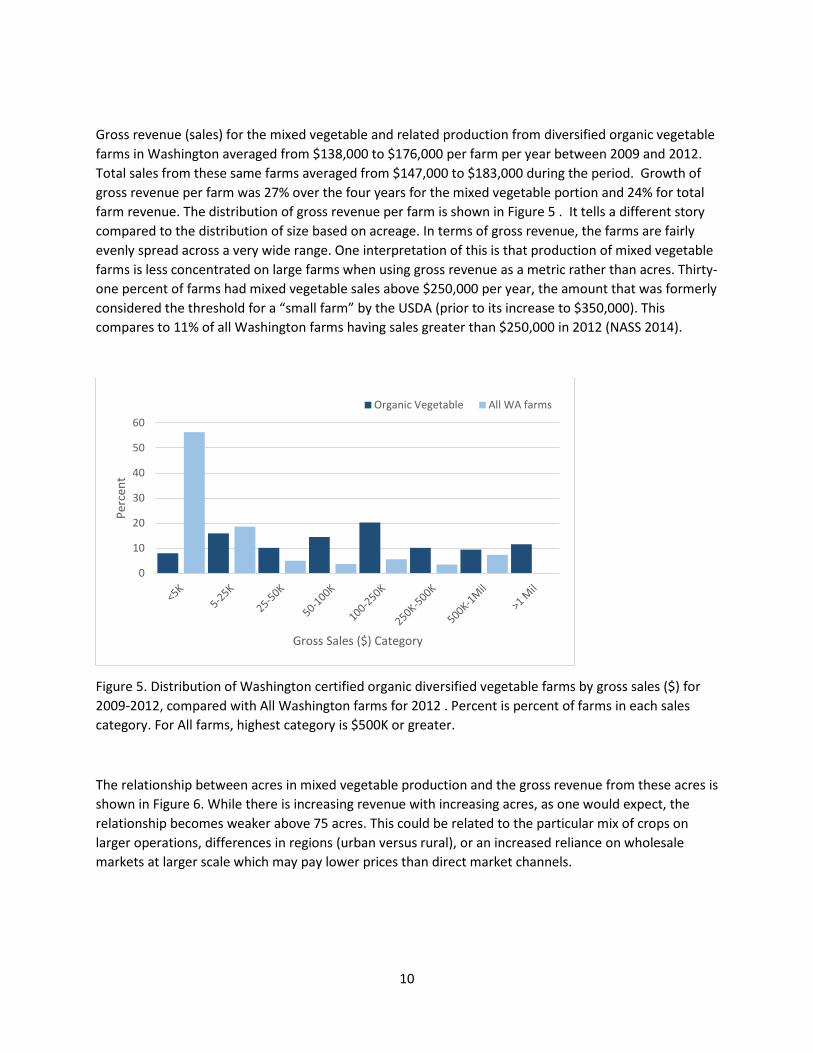
Gross revenue (sales) for the mixed vegetable and related production from diversified organic vegetable farms in Washington averaged from $138,000 to $176,000 per farm per year between 2009 and 2012. Total sales from these same farms averaged from $147,000 to $183,000 during the period. Growth of gross revenue per farm was 27% over the four years for the mixed vegetable portion and 24% for total farm revenue. The distribution of gross revenue per farm is shown in Figure 5 . It tells a different story compared to the distribution of size based on acreage. In terms of gross revenue, the farms are fairly evenly spread across a very wide range. One interpretation of this is that production of mixed vegetable farms is less concentrated on large farms when using gross revenue as a metric rather than acres. Thirty-one percent of farms had mixed vegetable sales above $250,000 per year, the amount that was formerly considered the threshold for a “small farm” by the USDA (prior to its increase to $350,000). This compares to 11% of all Washington farms having sales greater than $250,000 in 2012 (NASS 2014).
Figure 5. Distribution of Washington certified organic diversified vegetable farms by gross sales ($) for 2009-2012, compared with All Washington farms for 2012 . Percent is percent of farms in each sales category. For All farms, highest category is $500K or greater.
The relationship between acres in mixed vegetable production and the gross revenue from these acres is shown in Figure 6. While there is increasing revenue with increasing acres, as one would expect, the relationship becomes weaker above 75 acres. This could be related to the particular mix of crops on larger operations, differences in regions (urban versus rural), or an increased reliance on wholesale markets at larger scale which may pay lower prices than direct market channels.
0
10
20
30
40
50
60
Perc
ent
Gross Sales ($) Category
Organic Vegetable All WA farms

11
Figure 6. Relationship between mixed vegetable acres and revenue from mixed vegetable acres on diversified organic vegetable farms in Washington.
Gross Revenue Per Acre (GRA)
Gross Revenue per Acre on Washington organic farms appears to be the highest in the U.S., based on the NASS Organic Producer Survey data (NASS 2015, 2016a) and using the Market Average calculation (see Methods). Average GRA for organic farms in the U.S. was $1,413 and $1,497 per acre for 2014 and 2015, respectively, while GRA for Washington State was $7,015 and $8,694. For reference, California was $3,082 and $3,253 per acre. The GRA for all Washington farms in 2012 was $1,212 for cropland, which compared with the U.S. GRA of $1,012 for cropland (NASS 2014). Thus, Washington organic farms are generating far more revenue per acre than the state’s farms in general. In part, much of the state cropland is in dryland wheat, which generates lower revenue per acre both because of the crop and because much of the acreage is in crop-fallow (one crop every two years). Also, the organic sector is underrepresented for dryland grain production, and heavily represented by tree fruit and other high value crops.
The average GRA from the mixed vegetable acres for all certified organic farms in the 2009-2012 subset was relatively stable over the four-year period, with a state average of $9,456 using the Market Average (for comparison with USDA data above) and $12,552 using the Grower Average (used for the rest of the calculations) (Table 7). The average was $13,275 for farms in western Washington, and $11,019 in eastern Washington. These compare with a GRA of $12,189, $8,917, and $11,143 for all acres (mixed vegetable plus other) of farms for western, eastern, and statewide, respectively. The median GRA across
0
500,000
1,000,000
1,500,000
2,000,000
2,500,000
3,000,000
3,500,000
4,000,000
0 50 100 150 200 250 300 350 400 450
Mix
ed V
eg S
ales
$
Mixed Veg Acres
12
all years was $10,480. Mixed vegetable acres GRA was numerically lowest in 2011 for western Washington but not eastern, likely a reflection of weather conditions that spring. Whatcom and Lincoln Counties had the highest county average GRA for mixed vegetable acres at $18,600. The four-year average GRA (for counties with more than one observation per year) ranged from $6,886 (Clallam) to $18,661 (Whatcom) for western Washington counties, and from $3,603 (Spokane) to $17,897 (Klickitat) for eastern Washington counties. When grouped by urban proximity, the four-year average GRA for mixed vegetable acres was $12,920, $12,541, and $9,920 for farms in urban, peri-urban, and rural counties, respectively.
Table 7. Average Gross Revenue per Acre from the mixed vegetable/horticulture production on certified organic diversified vegetable farms in Washington State, by region and year, and statewide median by year.
2009 2010 2011 2012 West 13,520 13,065 12,107 14,410 East 11,194 10,658 10,115 12,108 State 12,820 12,292 11,466 13,636 Median 11,111 9,499 9,163 11,928
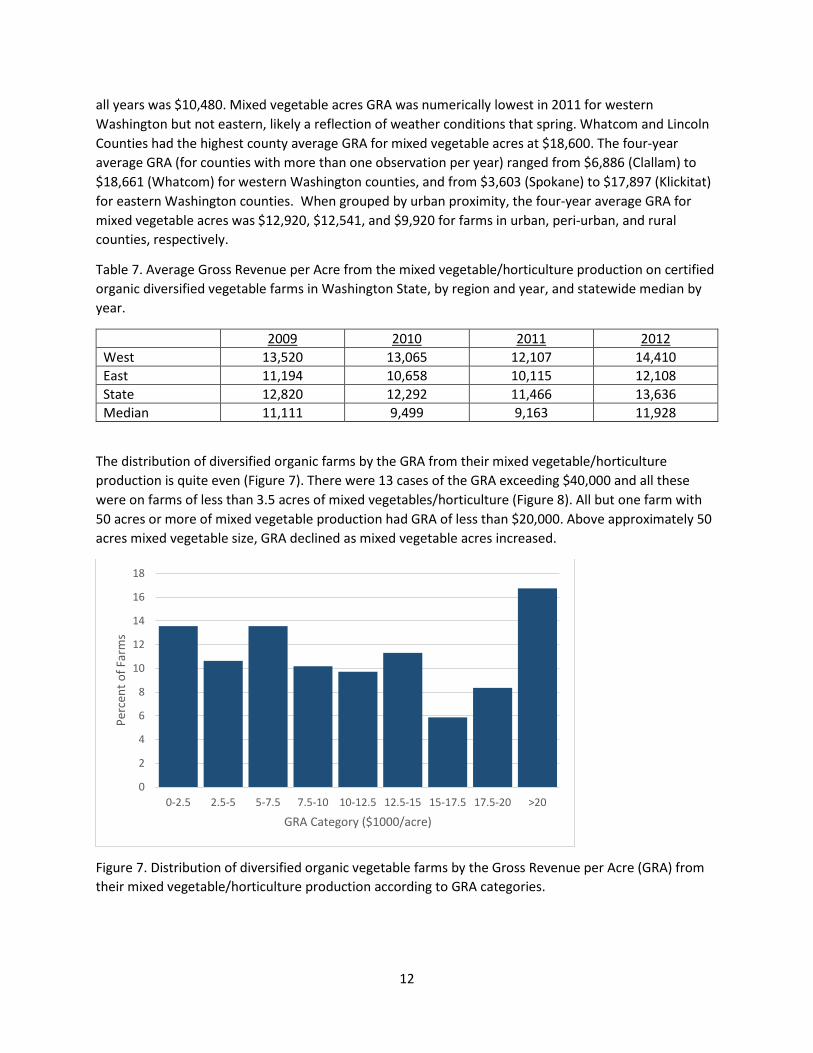
The distribution of diversified organic farms by the GRA from their mixed vegetable/horticulture production is quite even (Figure 7). There were 13 cases of the GRA exceeding $40,000 and all these were on farms of less than 3.5 acres of mixed vegetables/horticulture (Figure 8). All but one farm with 50 acres or more of mixed vegetable production had GRA of less than $20,000. Above approximately 50 acres mixed vegetable size, GRA declined as mixed vegetable acres increased.
Figure 7. Distribution of diversified organic vegetable farms by the Gross Revenue per Acre (GRA) from their mixed vegetable/horticulture production according to GRA categories.
0
2
4
6
8
10
12
14
16
18
0-2.5 2.5-5 5-7.5 7.5-10 10-12.5 12.5-15 15-17.5 17.5-20 >20
Perc
ent o
f Far
ms
GRA Category ($1000/acre)
13
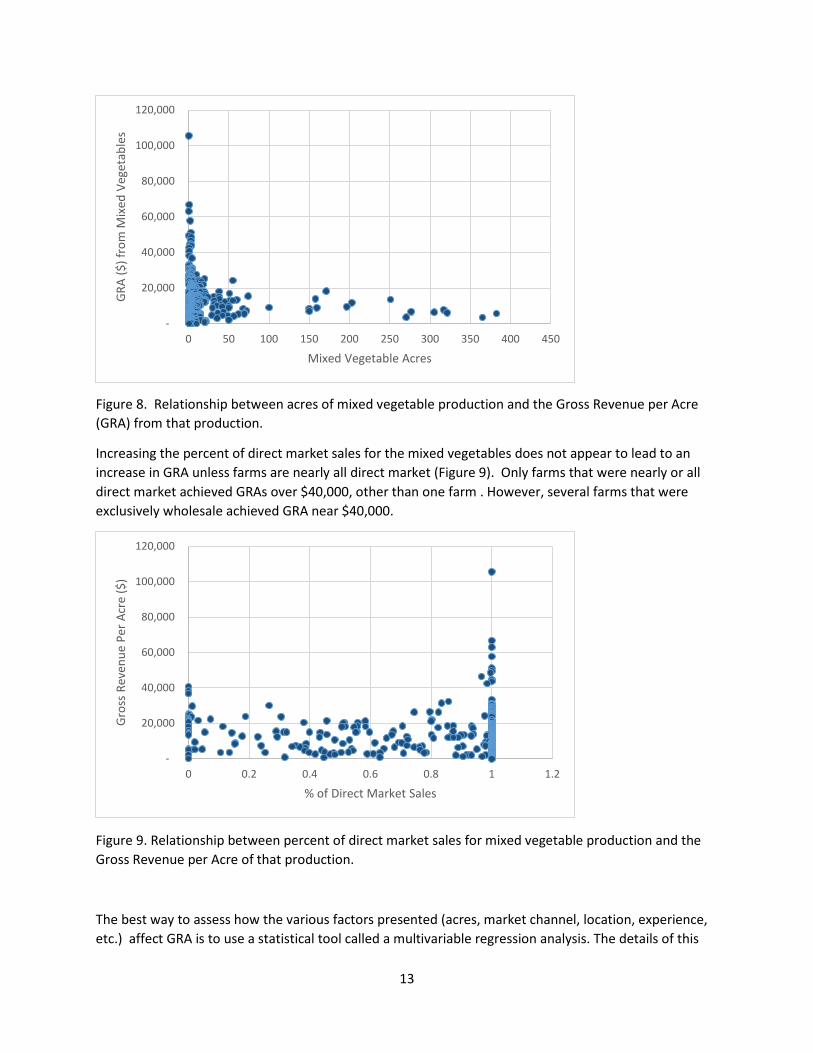
Figure 8. Relationship between acres of mixed vegetable production and the Gross Revenue per Acre (GRA) from that production.
Increasing the percent of direct market sales for the mixed vegetables does not appear to lead to an increase in GRA unless farms are nearly all direct market (Figure 9). Only farms that were nearly or all direct market achieved GRAs over $40,000, other than one farm . However, several farms that were exclusively wholesale achieved GRA near $40,000.
Figure 9. Relationship between percent of direct market sales for mixed vegetable production and the Gross Revenue per Acre of that production.
The best way to assess how the various factors presented (acres, market channel, location, experience, etc.) affect GRA is to use a statistical tool called a multivariable regression analysis. The details of this
-
20,000
40,000
60,000
80,000
100,000
120,000
0 50 100 150 200 250 300 350 400 450
GRA
($) f
rom
Mix
ed V
eget
able
s
Mixed Vegetable Acres
-
20,000
40,000
60,000
80,000
100,000
120,000
0 0.2 0.4 0.6 0.8 1 1.2
Gros
s Re
venu
e Pe
r Acr
e ($
)
% of Direct Market Sales
14
approach are beyond the scope of this fact sheet, but the basic idea is that it reveals which factor is most strongly related to GRA in either a negative or a positive way. Results showed that the calendar year, the ratio of mixed to total organic acres, and the percent of sales that were direct sales all had no clear relationship with GRA. The variables that did have a clear relationship with GRA were the region the farm was in (East vs. West), the size of the farm as measured by organic mixed vegetable acres, and how long the farm had been certified organic. Farms in western Washington had close to $2,800 higher GRA than those in eastern Washington. It was also the case that smaller farms had a higher value for GRA. The magnitude of the relationship was the following: a 10 acre increase in organic mixed vegetable acres was associated with a decrease in GRA of $31. It is important to point out that this analysis measures the effect of farm size on GRA separate from the region. Farms in eastern Washington tend to be bigger than western Washington, but the regression analysis identifies the effect of farm size separately from the region the farm is in. The third factor that was associated with GRA was how long the farm had been certified organic. Our records go back to 1988 so this variable can take on a value as high as 24 years. We found that more experienced organic farms had higher GRA. Specifically, every additional year of experience was associated with almost $300 more in GRA.
Estimated Cost of Production and Economic Viability
While no data are available on the costs of production for the actual farms in the 2009-2012 subset, enterprise budgets have been developed for the greater Vancouver, BC area for small-scale, diversified, direct market growers who primarily use organic practices (Afeworki et al. 2015). Their production systems are very similar to those of much of the diversified vegetable subset in Washington State being described in this study. Their prototype farm generated sales (in Canadian dollars) of $160,025 with production expenses of $88,439, resulting in an estimated net return of $71,585. Production and marketing labor are paid for in the budget, so if the grower is performing some of these tasks, s/he has additional income from wages. Thus, this sort of diversified organic direct market vegetable system appears to be quite viable in providing a family income. To create an estimate for comparison with the gross revenue data from Washington discussed here, the values were converted to U.S. dollars with the 2014 exchange rate, and then indexed back to 2010 using the USDA values for production, interest, taxes and wages (PITW). The 2014 hourly wage assumptions in the BC budgets were similar to wage values used in various WSU extension enterprise budgets from the 2009 to 2012 period. From this calculation, a rough estimate of total cost of production per acre was $16,539. Costs for selling at farmers’ markets (travel, labor time, market fees) were included, as well as interest on operating costs. Income to the operator was assumed to be paid through any hourly wages they earn plus any net profit above expenses; no management charge was included. This coarse estimate of cost compares with the average GRA for the Washington diversified organic vegetable farms of $12, 552. Twenty-seven percent of farms had GRA above $16,500, while 52% had GRA above $10,000 (Figure 7). With the uncertainty of the estimated production cost per acre, it may be that a lower GRA still is economically viable for a number of the farms in this study.
As another point of comparison, Wiswall (2009) presents enterprise budgets for diversified organic vegetable farms in New England with 5 acres in cultivation and two plastic-covered greenhouses. His cash flow projections for 2008-2012 show $42,700-76,000 in income, $32,490-39,335 in total expenses, and $10,210-36,665 in net profit. This translates to $8,500-15,200 gross revenue per acre (similar to the

15
GRA reported above) and $6,500-7,900 per acre of expenses (substantially lower than the total production cost estimates from BC).
Given the coarse nature of the comparison of GRA with estimated cost of production, it is important to consider the difference between an accounting profit and an economic profit. A diversified vegetable grower would have to pay for cash costs (compost, seed, fuel, hired labor, etc.) and would not be able to continue in business for long if GRA did not cover these costs. The producer could let the value of their labor be a residual of any revenue minus cash costs, for an apparent accounting profit. However, their hourly wage might be quite low, and this is a frequent complaint of small-scale diversified vegetable producers in the state. If they have little equipment or other assets that might depreciate, then the non-cash cost of depreciation is not an important consideration in profitability analysis. The primary factor becomes the opportunity cost for their labor – could they earn more per hour working in another job versus in their mixed vegetable production? However, there may be important non-cash benefits that are not captured in the above analysis that could help explain a potential economic loss. Producers may be providing a substantial amount of food for their family from the production that has an economic value of thousands of dollars. They also may enjoy a housing or lifestyle benefit from living on the farm itself. With over 25% of farms exceeding the rough cost of production estimate for formal economic viability, it appears that diversified vegetable production can be financially viable but that there is great variability in how well these growers are executing this management system.
When revenues from diversified organic vegetable farming are not covering the total cost of production, it may be helpful to look at the particular mix of crops being grown to identify poor performers that might be reduced and top performers that might be increased. These changes will be constrained first by the demand side. What diversity of crops do the markets or CSAs being served require? If the focus changed to a few crops grown in larger quantity, would this shift the market channel to wholesale where prices are typically much lower? Examples of the potential difference in net returns (in Canadian dollars) from 20 organic vegetable crops grown in the Vancouver, BC area are presented in Table 8 (Afeworki et al. 2015). Cucumber has by far the highest net return, but this is based on a high tunnel system that requires substantial capital outlay for the infrastructure, and only covers 0.02 acres in the prototype farm. Lettuce, tomato, bell pepper, bok choy, and zucchini are the next best performing crops with net returns of $5,800-6,800 per 0.1 acre. In this group, tomato has the highest labor cost as well as the highest cash cost. The next group (garlic, kale, cabbage, winter squash, radish, green bean, Brussel sprout) has net returns of $3,000-3,650. Cabbage has the lowest labor cost and a low cash cost. Spinach, beet, turnip, and carrot have net returns of $1,200-2,800. All but spinach have relatively low labor costs. Finally, the lowest net return crops were yellow onion, broccoli, and potato ($400-800) with a range of expenses. If a grower is labor constrained, then looking for crops with a lower labor cost could be useful. Similarly, if one is liquidity (or cash) constrained, then crops with lower cash costs might be attractive.

16
Table 8. Cash costs, labor costs, and net return for selected crops in diversified direct-market vegetable production. Values normalized to 0.1 acre area. Adapted from Afeworki et al., 2015, based on 2014 prices in Canadian dollars in Vancouver, BC.
Net return
Total labor cost
Total cash cost
Labor $ per $ output
Cash $ per $ output
CAN$/0.1 ac Cucumber (High Tunnel) 43979 1142 9255 0.10 0.85 Lettuce 6866 921 3013 0.17 0.56 Tomato 6724 2434 6771 0.22 0.60 Bell Pepper 6630 1240 3380 0.18 0.50 Bok Choy 6458 945 3397 0.18 0.63 Zucchini 5870 1561 2569 0.52 0.86 Garlic 3645 1620 7735 0.21 0.99 Kale 3579 1835 1786 0.25 0.25 Cabbage 3548 756 1696 0.05 0.11 Winter Squash 3527 951 2272 0.14 0.34 Radish 3470 3177 2953 0.66 0.62 Fresh Market (Bush) Bean 3383 13194 4423 3.14 1.05 Brussel Sprouts 3098 618 1685 0.23 0.62 Spinach 2776 3068 2251 1.52 1.11 Beet 1777 475 1248 0.03 0.07 Turnip 1552 571 1378 0.13 0.31 Carrots 1191 621 1387 0.04 0.09 Yellow Onion 816 1780 2404 0.59 0.80 Broccoli 557 468 1376 0.08 0.23 Potato 420 98 1482 0.01 0.07
Another way to analyze these production costs is to calculate the labor cost or cash expense cost to get a dollar of output (or gross revenue). Potato required one cent of labor cost to get an additional dollar of output, compared to $3.14 for green bean. Beet and potato required seven cents of cash expense to get an additional dollar of output. Both crops also had a low labor cost. Thus, for a grower with limited cash and labor, these crops could be emphasized more. In contrast, green bean had a high labor and cash cost per dollar of additional output. So if a farm was struggling to be profitable, and their markets could be maintained without supplying green beans, this could be a crop to eliminate.
Conclusion
Diversified organic vegetable production is an important component of the organic farming sector in Washington State and is an attractive option for beginning farmers to enter agriculture. These farms account for about 25% of the certified organic farms in the state but less than 2% of the acres. About two-thirds of these farms and mixed vegetable acres are in western Washington, along with 80% of the sales. About half the farms have five acres or less, and 77% only grow mixed vegetables. The average gross revenue per acre (2009-2012) for organic mixed vegetable production was $12,500, and was

17
slightly higher in western Washington and lower in eastern Washington. A coarse estimate of the total production costs for a diversified organic vegetable farm using direct marketing was developed from crop budgets for Vancouver, BC, and was $16,500 per acre. About 27% of the reported GRAs in Washington were above this estimate. The BC budgets show significant differences in net returns, labor cost, and cash costs for the different crops. Diversified vegetable growers could examine their operations for those crops that underperform economically and possibly increase emphasis on top performers as a way to boost their farm financial viability. There were 13 observations of GRA in excess of $40,000 per acre, all on farms less than 3.5 acres. Thus, generating high revenue that will more than cover the cost of production is being accomplished by a number of operations.
REFERENCES
Afeworki, E., P. Wallapak, C. Chiu and K. Mullinix. 2015. Southwest British Columbia Small-scale Farm Enterprise Budgets. Technical Bulletins 2015-001 to 020. Kwantlen Polytechic University, Richmond, BC, Canada. http://www.kpu.ca/isfs/enterprise-budgets
Campbell, B., S. Mhlanga, and I. Lesschaeve. 2013. Perception versus reality: Canadian consumer views of local and organic. Canadian J. Agricultural Economics 61:531-558.
Guthman, J. (2014). Agrarian dreams: The paradox of organic farming in California. Univ of California Press.
Henderson, E. 2008. Should there be a limit on the size of organic farms? Natural Foods Merchandiser http://www.newhope.com/news/should-there-be-limit-size-organic-farms
Key, N. and M.J. Roberts. 2007. Measures of trends in farm size tell differing stories. Amber Waves, 5(5).
Kirby, E. and Granatstein, D. 2017. Certified organic acreage and sales in Washington State: 2007-2015. Washington State University Extension Organic Trends series Publication TB43, Pullman, WA. http://extension.wsu.edu/publications/pubs/tb43e/
NASS. 2009. 2008 Organic Production Survey. USDA-NASS, Washington, DC.
NASS. 2012. 2011 Certified Organic Production Survey. USDA-NASS, Washington, DC.
NASS. 2014. 2012 Census of Agriculture. USDA-NASS, Washington, DC. https://www.agcensus.usda.gov/Publications/2012/
NASS. 2015. 2014 Organic Survey. USDA-NASS, Washington, DC.
NASS. 2016a. 2015 Certified Organic Survey. USDA-NASS, Washington, DC. https://www.nass.usda.gov/Surveys/Guide_to_NASS_Surveys/Organic_Production/
NASS. 2016b. 2014 and 2015 Organic Certifier Data. USDA-NASS, Washington, DC. https://www.nass.usda.gov/Surveys/Guide_to_NASS_Surveys/Organic_Production/Organic_Certifiers/2016/USDA_Accredited_Certifying_Agent_Certified_Organic_Data_2014_2015.pdf

18
Ostrom, M. 2011. Cultivating Success Past Student Evaluation: Sustainable Small Farms Education Program., Social and Economic Sciences Resesarch Center (SESRC) Report # 11-088, Washington State University.
Ostrom, M. and C. Donovan. 2016. Profile of small farms in Washington State. 2015 update., Washington State University Extension Publication TB39, Pullman, WA. http://extension.wsu.edu/publications/pubs/tb39/
Ostrom, M. and R. Jussaume. 2007, Assessing the Significance of Direct Farmer-Consumer Linkages as a Change Strategy, in Remaking the North American Food System, Clare Hinrichs and Tom Lyson (eds). University of Nebraska Press: 235-259.
Sumner, D.A. 2014. American farms keep growing: size, productivity, and policy. Journal of Economic Perspectives 28(1):147-166.
Wiswall, R. 2009. The Organic Farmer’s Business Handbook. Chelsea Green Publ., Vermont.