Trees? J. Peter Gogarten University of Connecticut Dept. of Molecular and Cell Biology Sculpture at...
26
Trees? J. Peter Gogarten University of Connecticut Dept. of Molecular and Cell Biology S c u l p t u r e a t R o y a l B o t a n i c a l G a r d e n s , K e w
-
date post
22-Dec-2015 -
Category
Documents
-
view
216 -
download
1
Transcript of Trees? J. Peter Gogarten University of Connecticut Dept. of Molecular and Cell Biology Sculpture at...
Trees?
J. Peter Gogarten
University of ConnecticutDept. of Molecular and Cell Biology
Scu lptur e at R
oyal Bot anical G
ardens, Kew
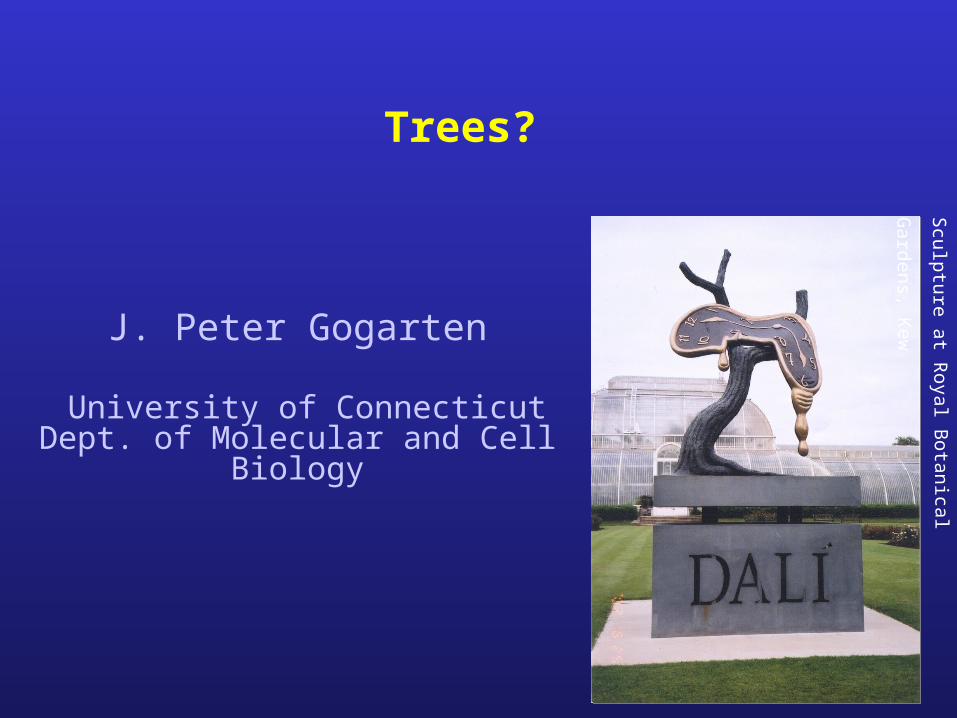
muscle alignment
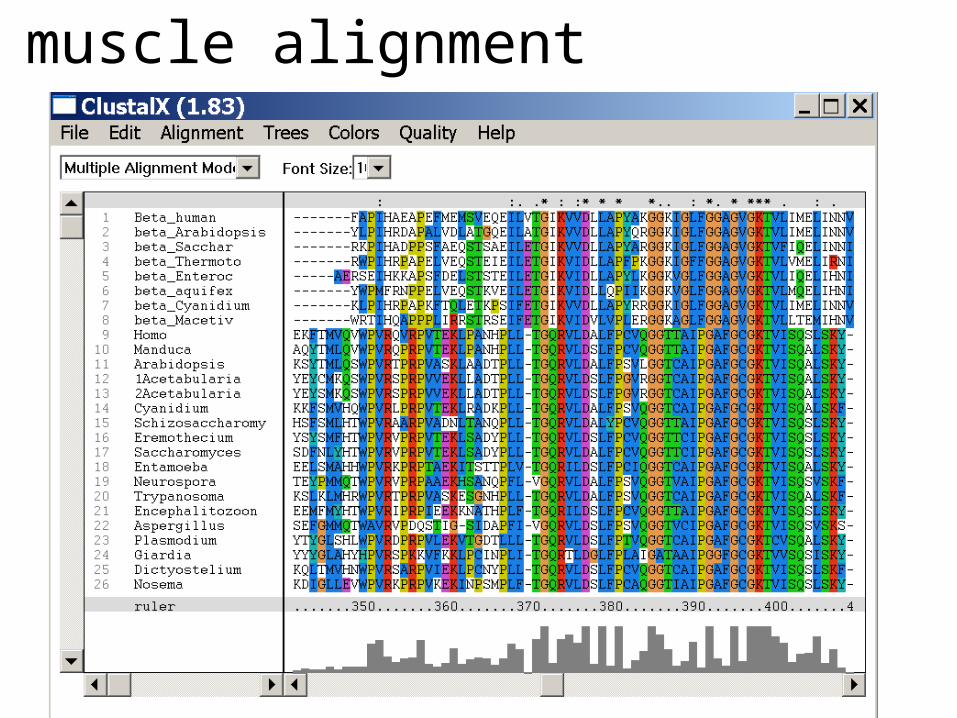
muscle vs clustal
more on alignment programs (statalign, pileup, SAM) here
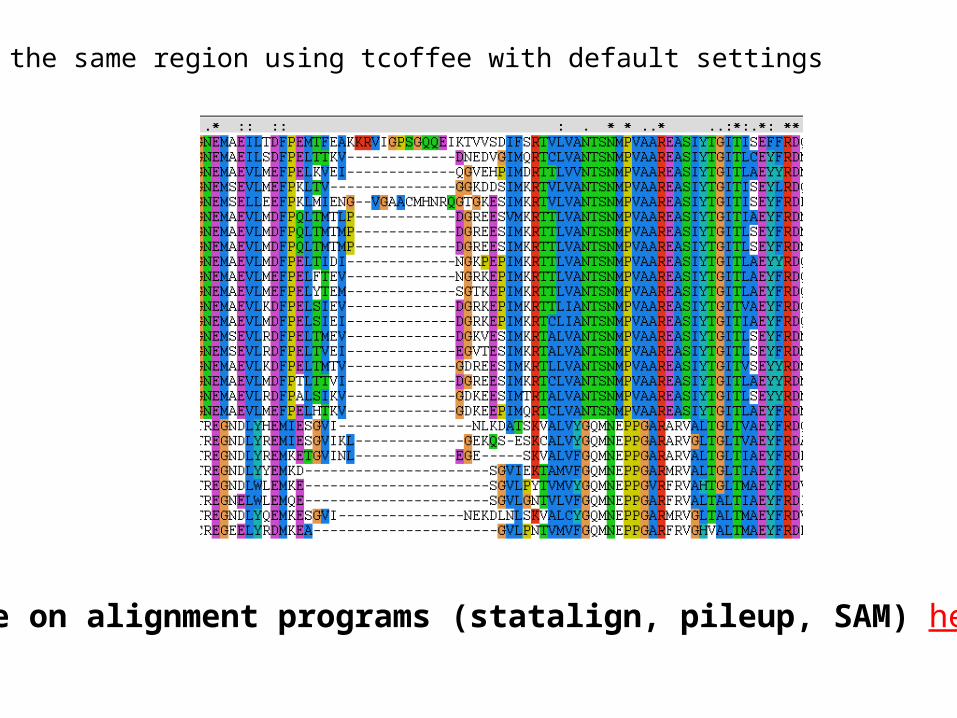
the same region using tcoffee with default settings
more on alignment programs (statalign, pileup, SAM) here

Sequence editors and viewers
Jalview Homepage, Description Jalview as Java Web Start Application (other JAVA applications are here)
Jalview is easy to install and run. Test file is here (ATPase subunits)(Intro to ATPases: 1bmf in spdbv)(gif of rotation here, movies of the rotation are here and here) (Load all.txt into Jalview,
colour options, mouse use, PID tree,Principle component analysis -> sequence space)More on sequence space here
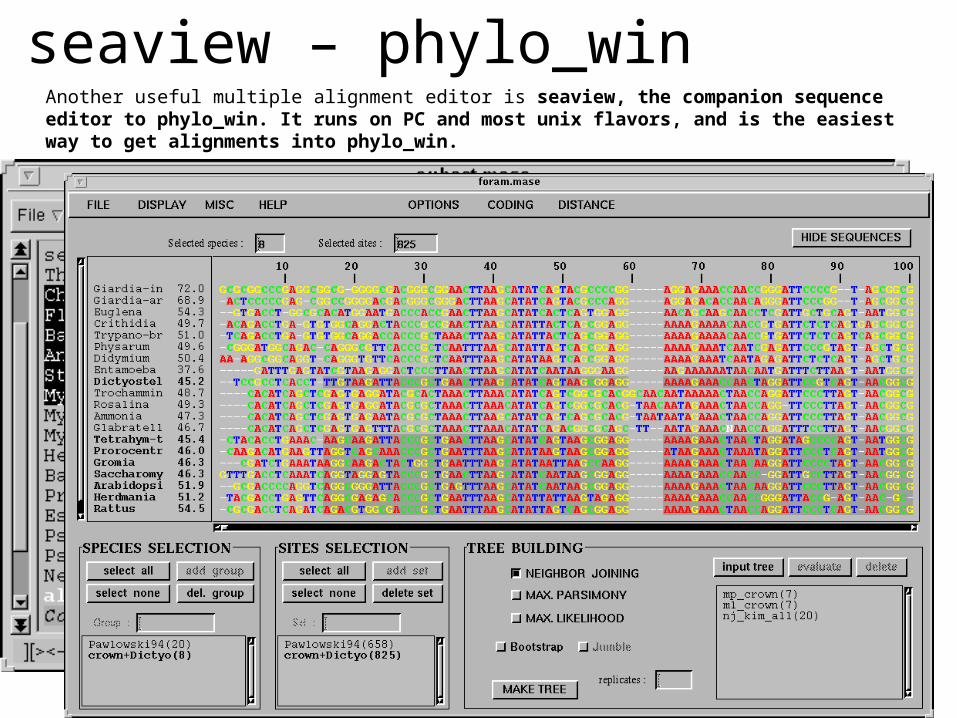
seaview – phylo_winAnother useful multiple alignment editor is seaview, the companion sequence editor to phylo_win. It runs on PC and most unix flavors, and is the easiest way to get alignments into phylo_win.
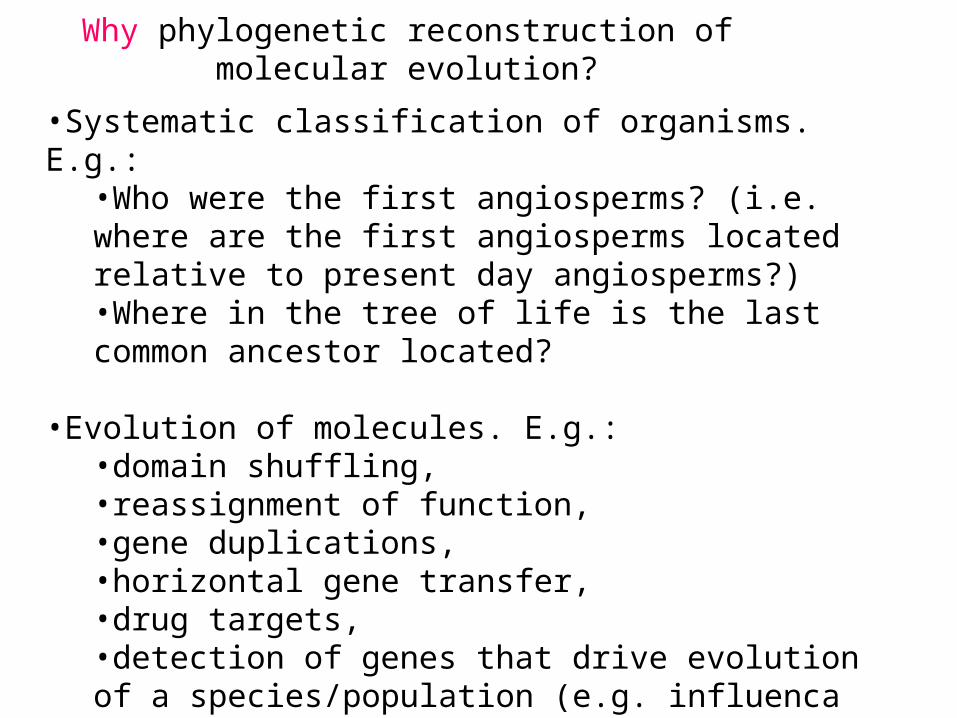
Why phylogenetic reconstruction of molecular evolution?
•Systematic classification of organisms. E.g.: •Who were the first angiosperms? (i.e. where are the first angiosperms located relative to present day angiosperms?)•Where in the tree of life is the last common ancestor located?
•Evolution of molecules. E.g.: •domain shuffling, •reassignment of function, •gene duplications, •horizontal gene transfer, •drug targets, •detection of genes that drive evolution of a species/population (e.g. influenca virus, see here for more examples)
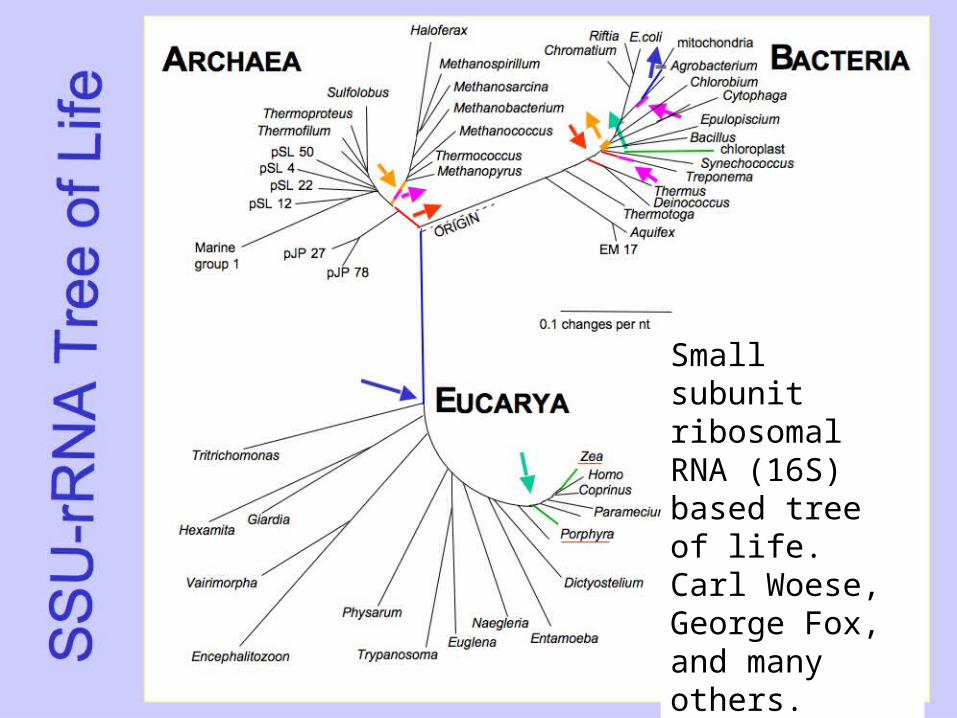
Small subunit ribosomal RNA (16S) based tree of life. Carl Woese, George Fox, and many others.
QuickTime™ and a decompressor
are needed to see this picture.
Phylogenetic analysis is an inference of evolutionary relationships between organisms. Phylogenetics tries to answer the question “How did groups of organisms come into existence?”
Those relationships are usually represented by tree-like diagrams.
Note: the assumption of a tree-like process of evolution is controversial!
Steps of the phylogenetic analysis
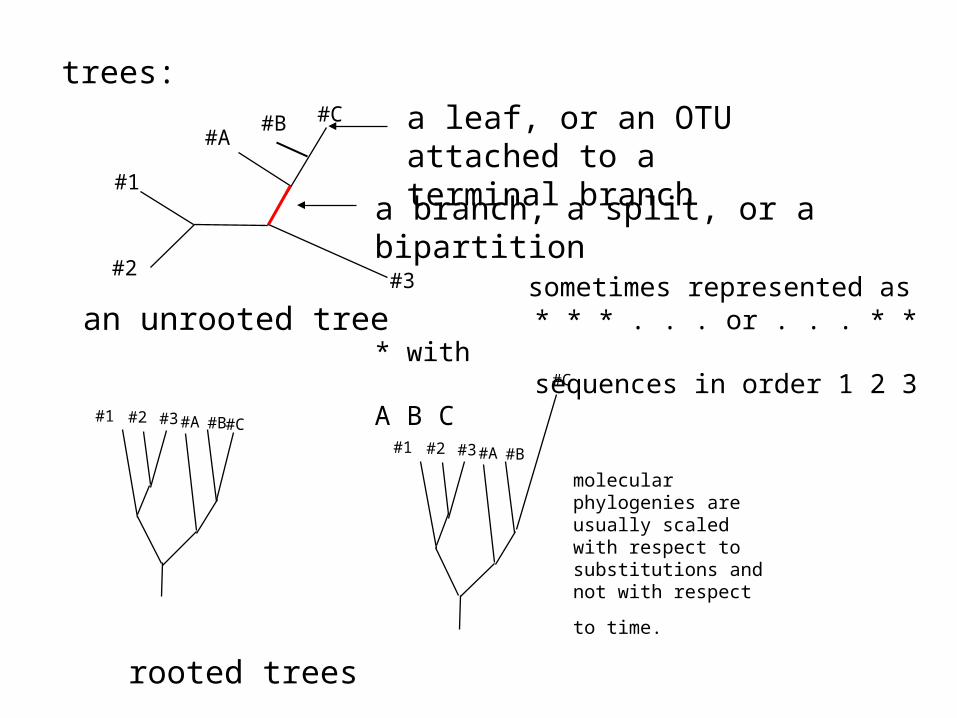
trees:
an unrooted tree
a branch, a split, or a bipartition sometimes represented as * * * . . . or . . . * * * with sequences in order 1 2 3 A B C
a leaf, or an OTU attached to a terminal branch
#1
#2#3
#B#A
#C
#1 #2 #3 #A #B#C
rooted trees
#1 #2 #3 #A #B
#C
molecular phylogenies are usually scaled with respect to substitutions and not with respect to
time.
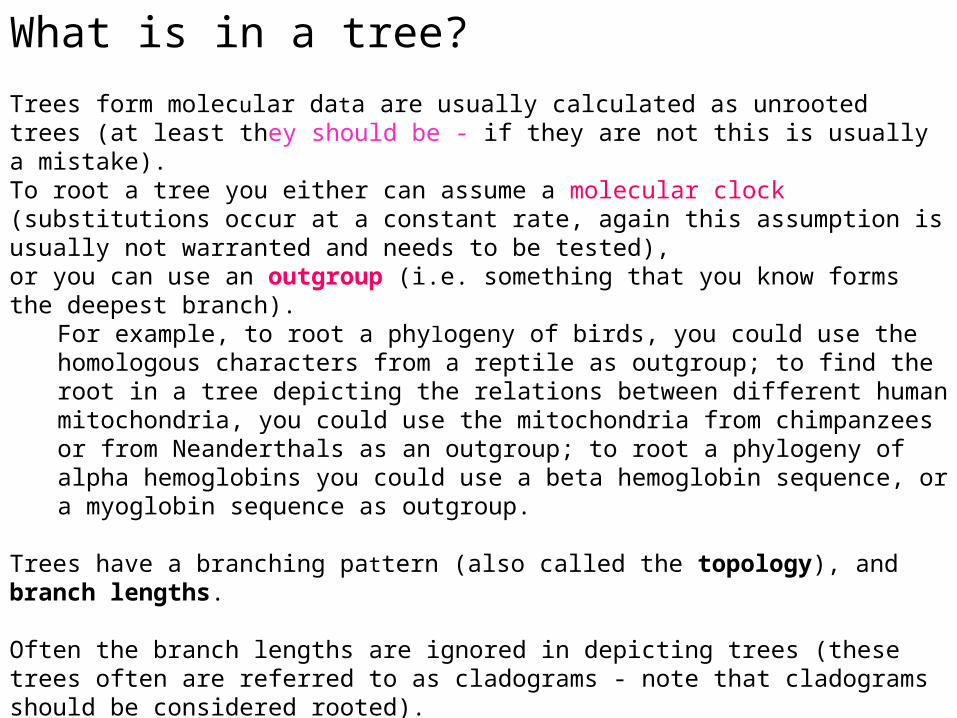
What is in a tree?Trees form molecular data are usually calculated as unrooted trees (at least they should be - if they are not this is usually a mistake). To root a tree you either can assume a molecular clock (substitutions occur at a constant rate, again this assumption is usually not warranted and needs to be tested), or you can use an outgroup (i.e. something that you know forms the deepest branch).
For example, to root a phylogeny of birds, you could use the homologous characters from a reptile as outgroup; to find the root in a tree depicting the relations between different human mitochondria, you could use the mitochondria from chimpanzees or from Neanderthals as an outgroup; to root a phylogeny of alpha hemoglobins you could use a beta hemoglobin sequence, or a myoglobin sequence as outgroup.
Trees have a branching pattern (also called the topology), and branch lengths.
Often the branch lengths are ignored in depicting trees (these trees often are referred to as cladograms - note that cladograms should be considered rooted). You can swap branches attached to a node, and in an unrooted you can depict the tree as rooted in any branch you like without changing the tree.
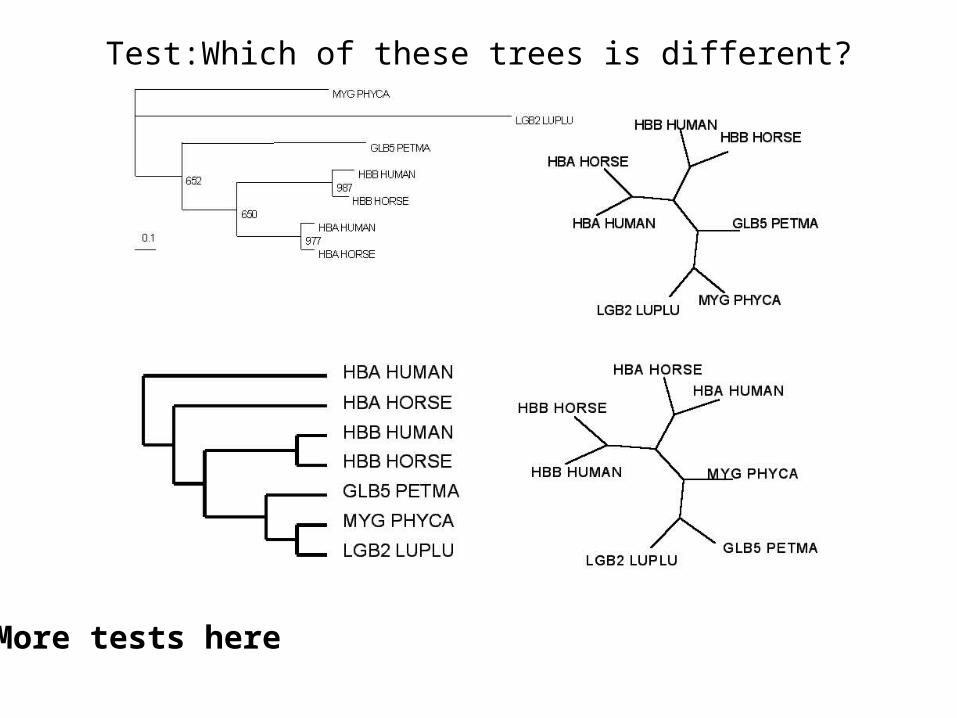
Test:Which of these trees is different?
More tests here
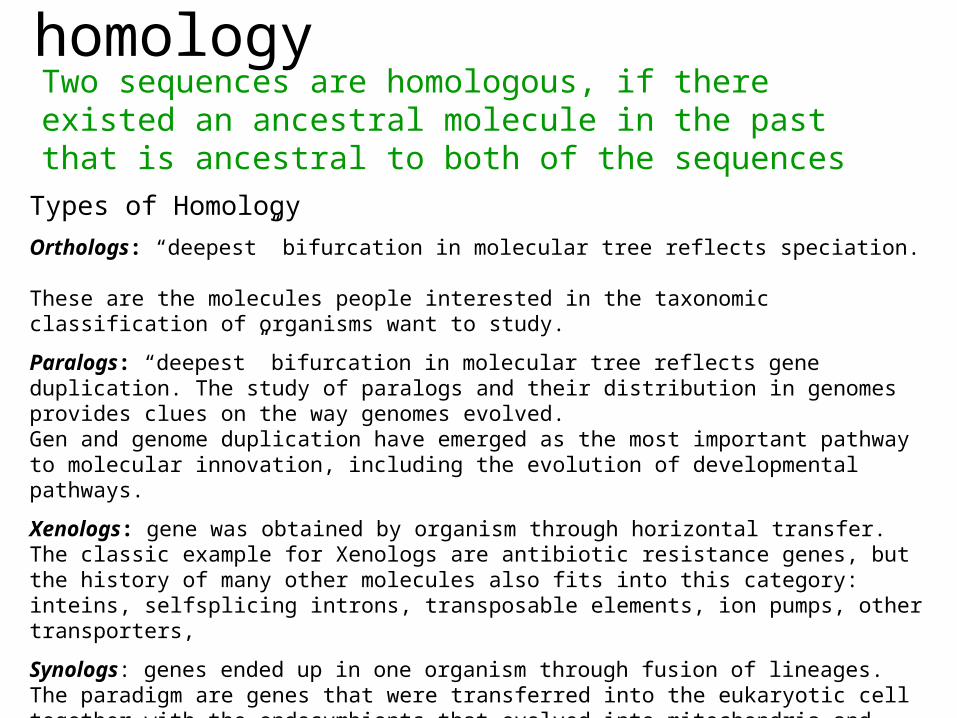
homologyTwo sequences are homologous, if there existed an ancestral molecule in the past that is ancestral to both of the sequences
Types of Homology
Orthologs: “deepest” bifurcation in molecular tree reflects speciation. These are the molecules people interested in the taxonomic classification of organisms want to study.
Paralogs: “deepest” bifurcation in molecular tree reflects gene duplication. The study of paralogs and their distribution in genomes provides clues on the way genomes evolved. Gen and genome duplication have emerged as the most important pathway to molecular innovation, including the evolution of developmental pathways.
Xenologs: gene was obtained by organism through horizontal transfer. The classic example for Xenologs are antibiotic resistance genes, but the history of many other molecules also fits into this category: inteins, selfsplicing introns, transposable elements, ion pumps, other transporters,
Synologs: genes ended up in one organism through fusion of lineages. The paradigm are genes that were transferred into the eukaryotic cell together with the endosymbionts that evolved into mitochondria and plastids (the -logs are often spelled with "ue" like in orthologues)
see Fitch's article in TIG 2000 for more discussion.
•Branches, splits, bipartitions•In a rooted tree: clades•Mono-, Para-, polyphyletic groups, cladists and a natural taxonomy
Terminology
The term cladogram refers to a strictly bifurcating diagram, where each clade is defined by a common ancestor that only gives rise to members of this clade. I.e., a clade is monophyletic (derived from one ancestor) as opposed to polyphyletic (derived from many ancestors). (note you need to know where the root is!)
A clade is recognized and defined by shared derived characters (= synapomorphies). Shared primitive characters (= sympleisiomorphies , aternativie spelling is symplesiomorphies) do not define a clade. (see in class example drawing ala Hennig).
To use these terms you need to have polarized characters; for most molecular characters you don't know which state is primitive and which is derived (exceptions:....).
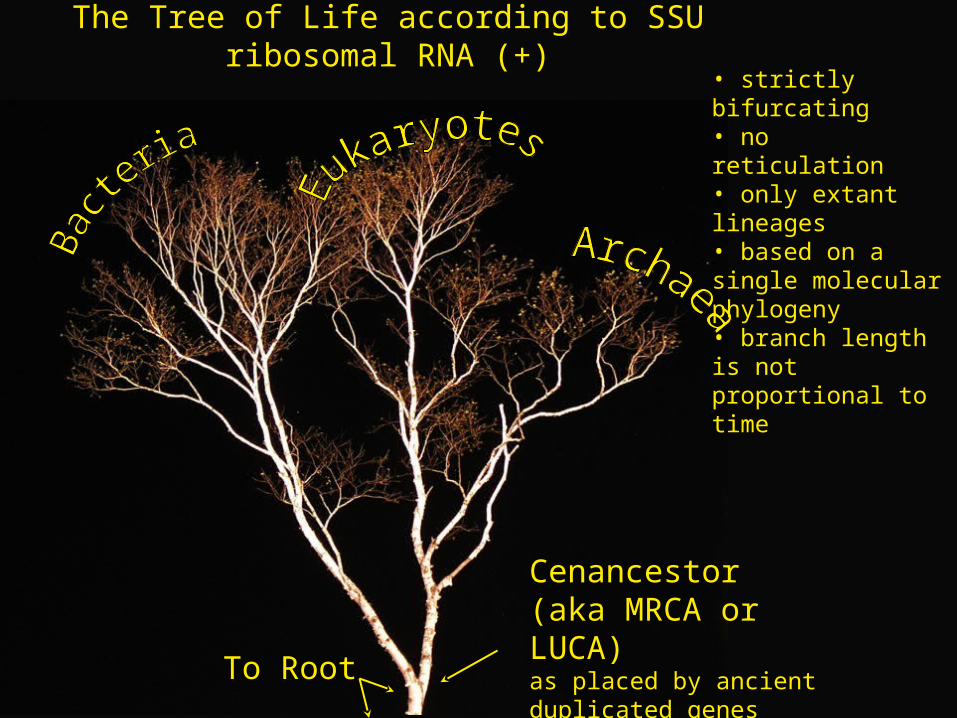
Cenancestor (aka MRCA or LUCA)as placed by ancient duplicated genes (ATPases, Signal recognition particles, EF)
To Root
• strictly bifurcating• no reticulation• only extant lineages• based on a single molecular phylogeny• branch length is not proportional to time
The Tree of Life according to SSU ribosomal RNA (+)
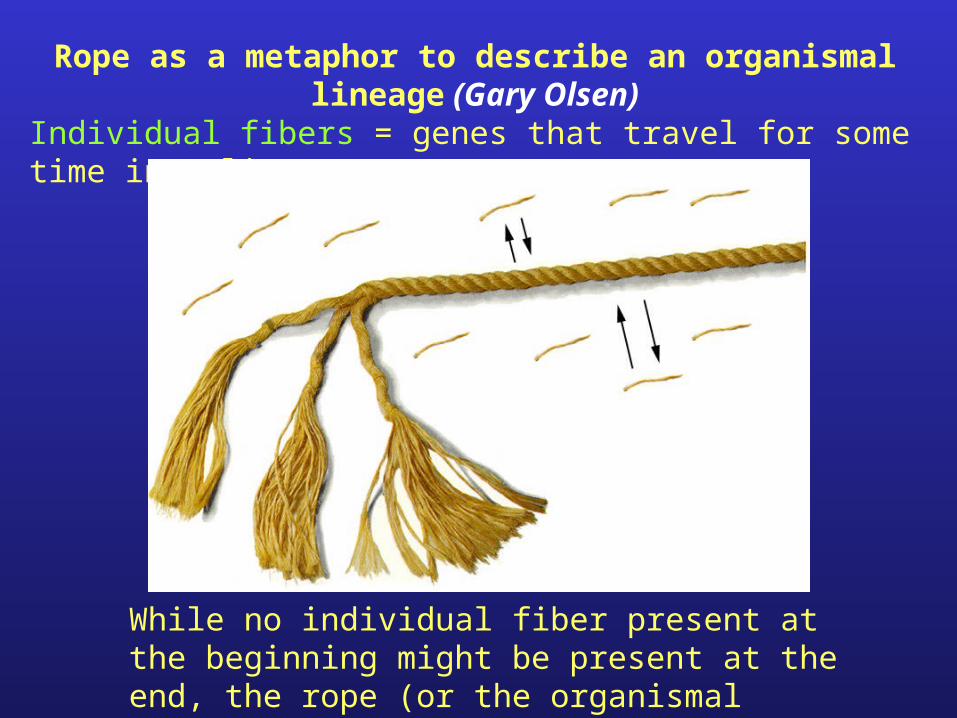
Rope as a metaphor to describe an organismal lineage (Gary Olsen)
Individual fibers = genes that travel for some time in a lineage.
While no individual fiber present at the beginning might be present at the end, the rope (or the organismal lineage) nevertheless has continuity.
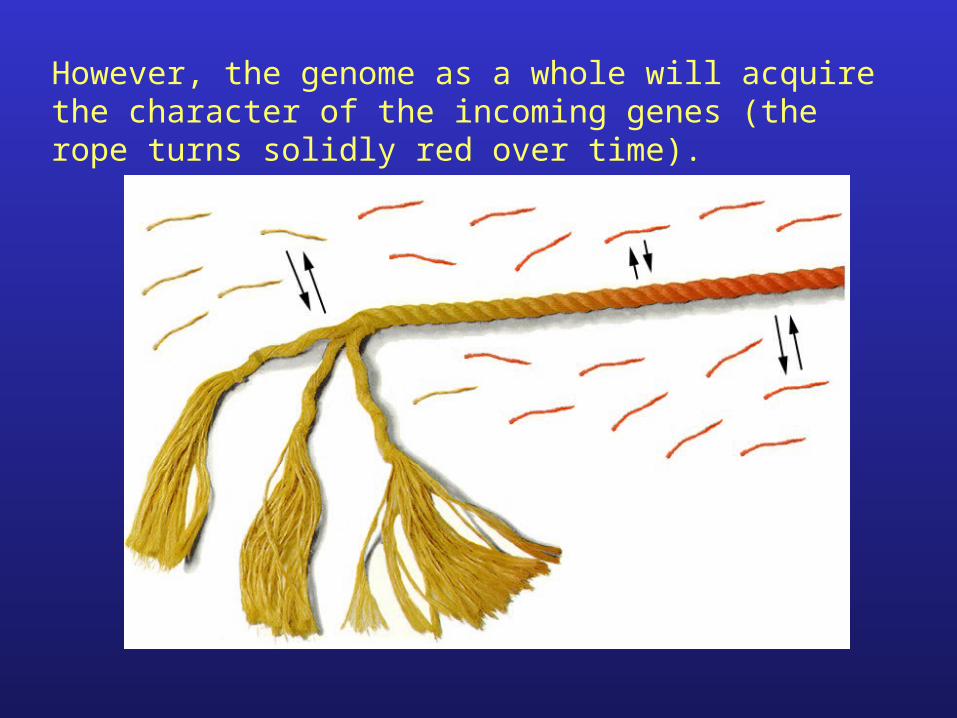
However, the genome as a whole will acquire the character of the incoming genes (the rope turns solidly red over time).
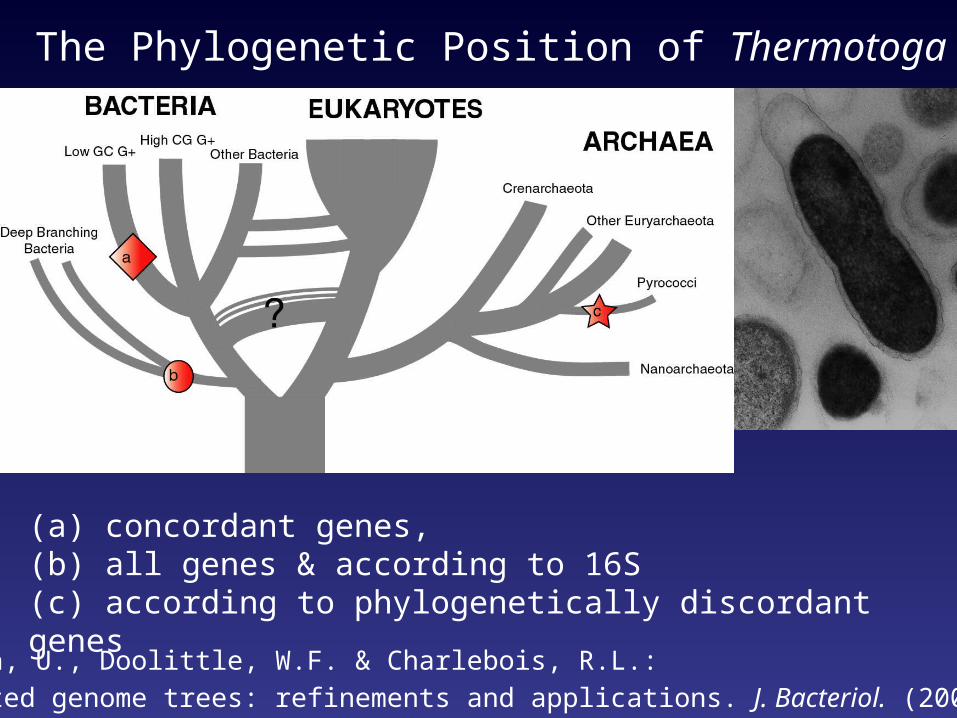
The Phylogenetic Position of Thermotoga
(a) concordant genes, (b) all genes & according to 16S (c) according to phylogenetically discordant genes
Gophna, U., Doolittle, W.F. & Charlebois, R.L.:
Weighted genome trees: refinements and applications. J. Bacteriol. (2005)
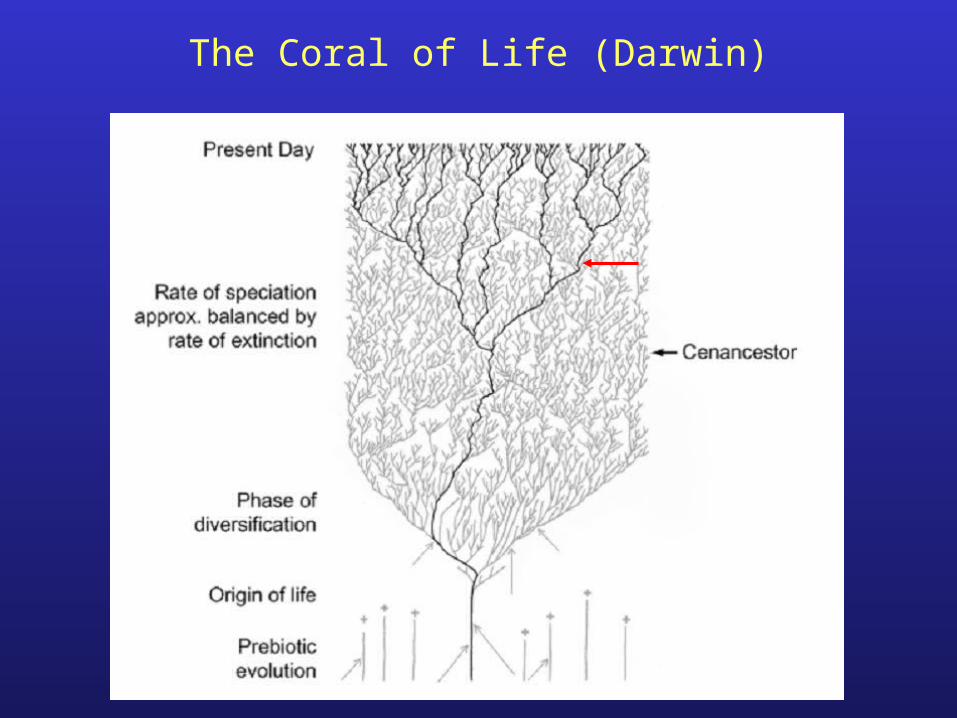
The Coral of Life (Darwin)
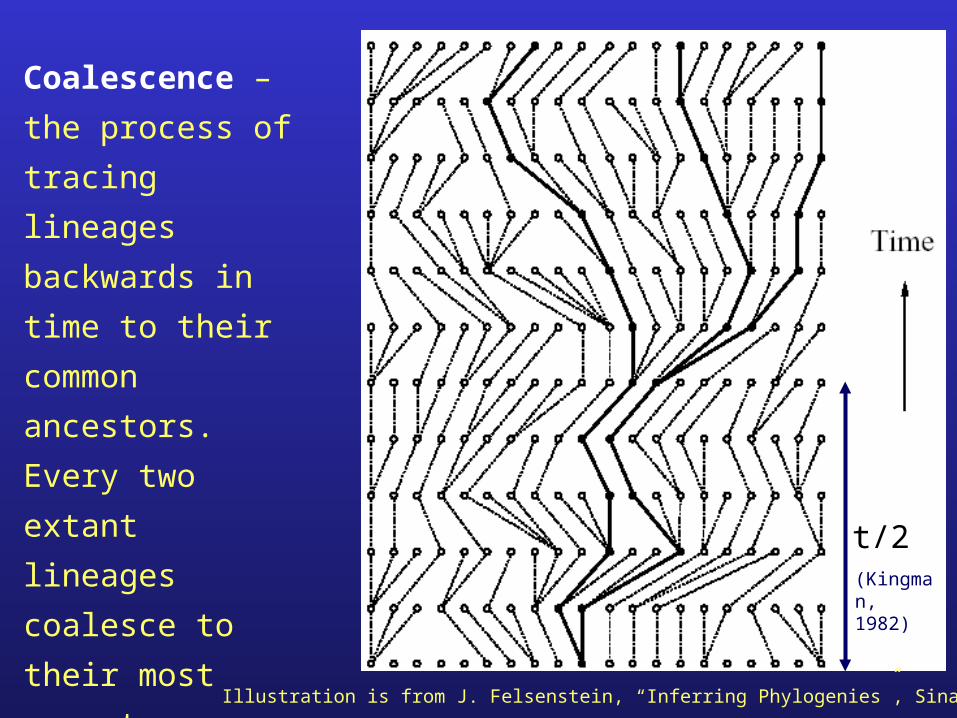
Coalescence – the
process of tracing
lineages backwards
in time to their
common ancestors.
Every two extant
lineages coalesce
to their most recent
common ancestor.
Eventually, all
lineages coalesce
to the cenancestor.
t/2(Kingman, 1982)
Illustration is from J. Felsenstein, “Inferring Phylogenies”, Sinauer, 2003
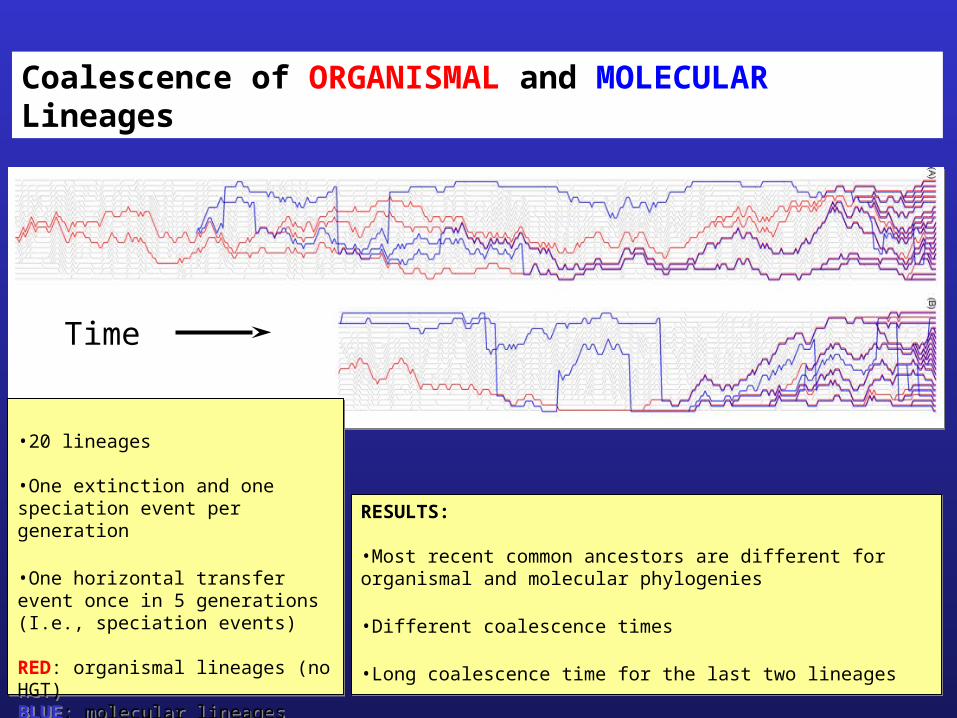
Coalescence of ORGANISMAL and MOLECULAR Lineages
•20 lineages
•One extinction and one speciation event per generation
•One horizontal transfer event once in 5 generations (I.e., speciation events)
RED: organismal lineages (no HGT)BLUE: molecular lineages (with HGT)GRAY: extinct lineages
•20 lineages
•One extinction and one speciation event per generation
•One horizontal transfer event once in 5 generations (I.e., speciation events)
RED: organismal lineages (no HGT)BLUE: molecular lineages (with HGT)GRAY: extinct lineages
RESULTS:
•Most recent common ancestors are different for organismal and molecular phylogenies
•Different coalescence times
•Long coalescence time for the last two lineages
RESULTS:
•Most recent common ancestors are different for organismal and molecular phylogenies
•Different coalescence times
•Long coalescence time for the last two lineages
Time
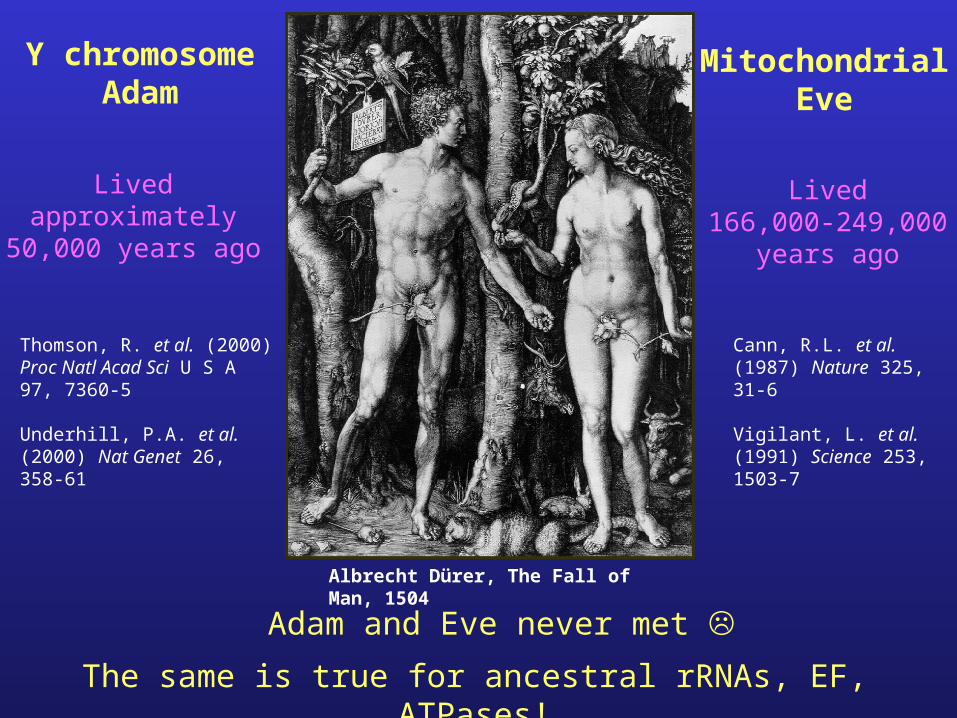
Adam and Eve never met
Albrecht Dürer, The Fall of Man, 1504
MitochondrialEve
Y chromosomeAdam
Lived approximately
50,000 years ago
Lived 166,000-249,000
years ago
Thomson, R. et al. (2000) Proc Natl Acad Sci U S A 97, 7360-5
Underhill, P.A. et al. (2000) Nat Genet 26, 358-61
Cann, R.L. et al. (1987) Nature 325, 31-6
Vigilant, L. et al. (1991) Science 253, 1503-7
The same is true for ancestral rRNAs, EF, ATPases!
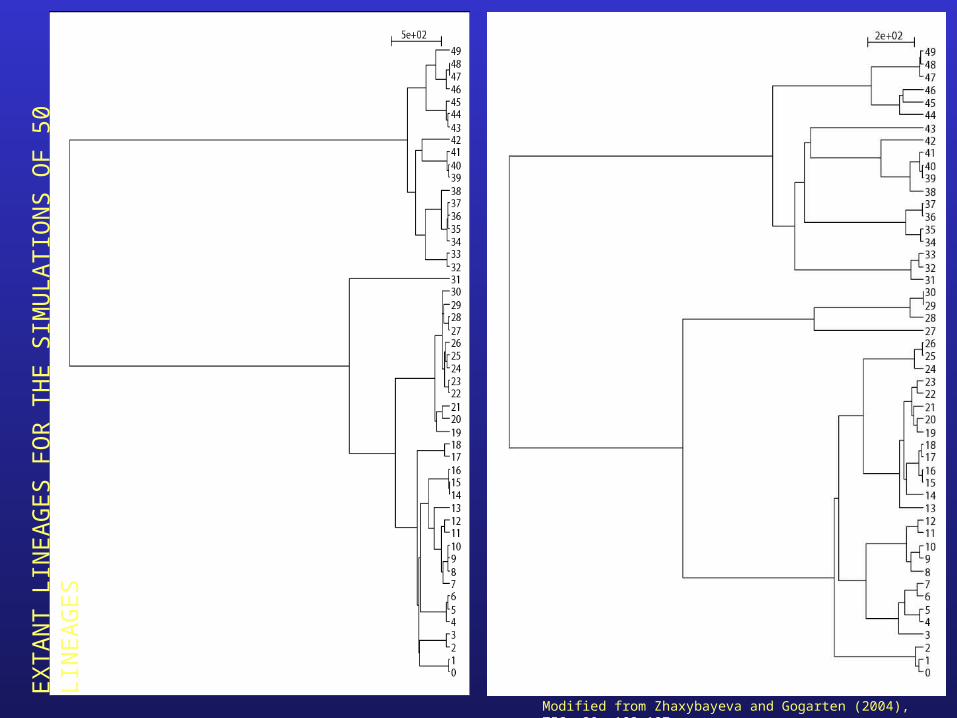
EX
TA
NT
LIN
EA
GE
S F
OR
TH
E S
IMU
LAT
ION
S O
F 5
0 LI
NE
AG
ES
Modified from Zhaxybayeva and Gogarten (2004), TIGs 20, 182-187
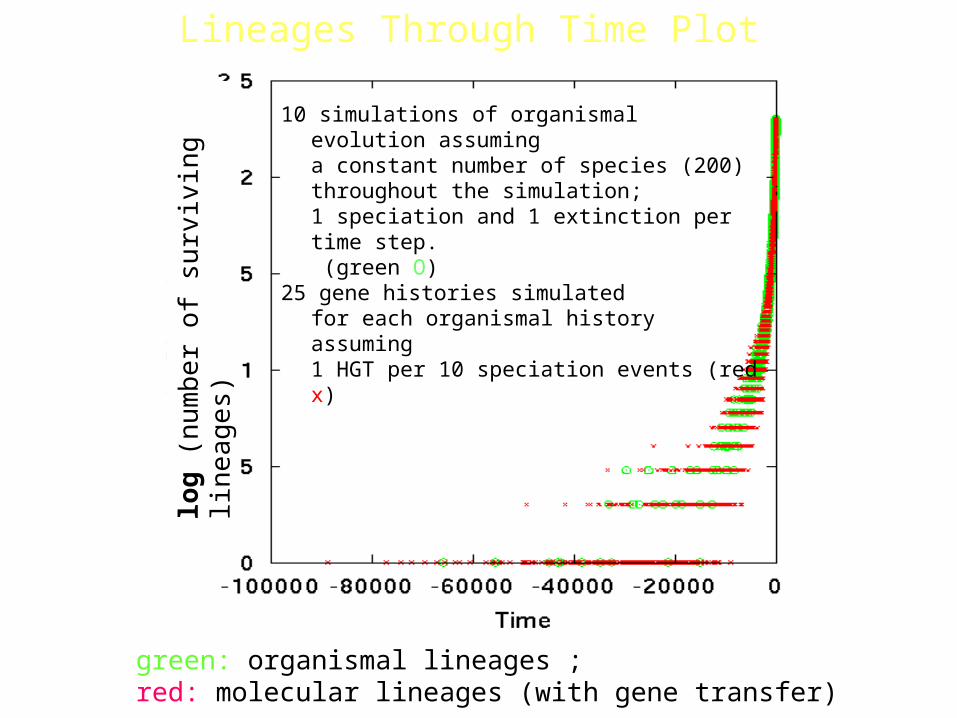
green: organismal lineages ; red: molecular lineages (with gene transfer)
Lineages Through Time Plot
10 simulations of organismal evolution assuming a constant number of species (200) throughout the simulation; 1 speciation and 1 extinction per time step. (green O)
25 gene histories simulated for each organismal history assuming 1 HGT per 10 speciation events (red x)
log
(n
umb
er o
f su
rviv
ing
line
age
s)
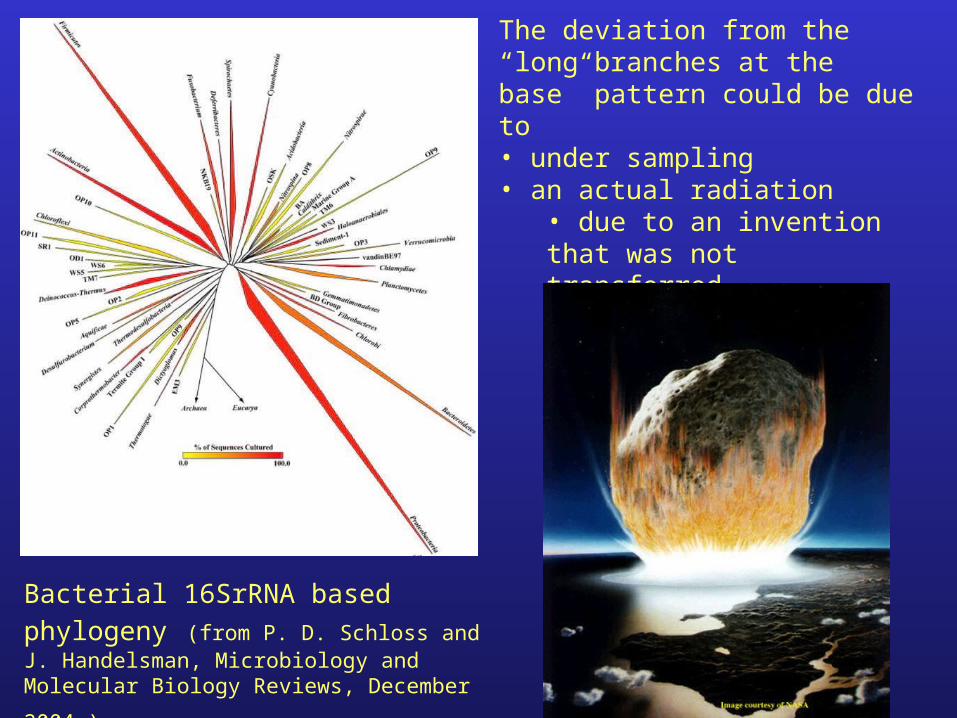
Bacterial 16SrRNA based phylogeny (from P. D. Schloss and J. Handelsman, Microbiology and Molecular Biology Reviews,
December 2004.)
The deviation from the “long branches at the base” pattern could be due to • under sampling• an actual radiation
• due to an invention that was not transferred• following a mass extinction
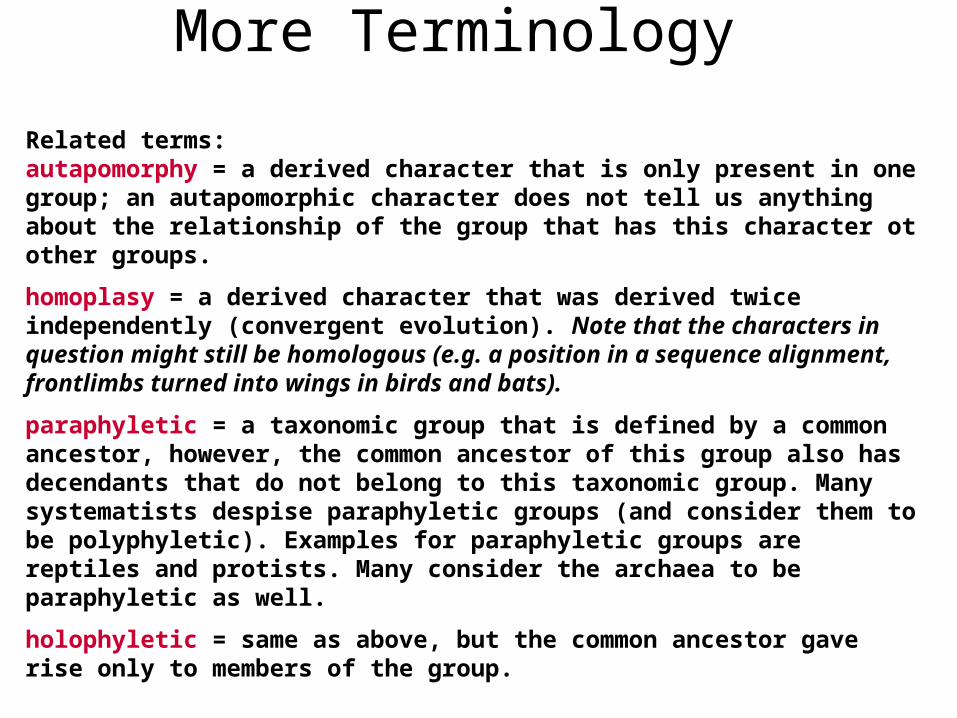
More Terminology
Related terms: autapomorphy = a derived character that is only present in one group; an autapomorphic character does not tell us anything about the relationship of the group that has this character ot other groups.
homoplasy = a derived character that was derived twice independently (convergent evolution). Note that the characters in question might still be homologous (e.g. a position in a sequence alignment, frontlimbs turned into wings in birds and bats).
paraphyletic = a taxonomic group that is defined by a common ancestor, however, the common ancestor of this group also has decendants that do not belong to this taxonomic group. Many systematists despise paraphyletic groups (and consider them to be polyphyletic). Examples for paraphyletic groups are reptiles and protists. Many consider the archaea to be paraphyletic as well.
holophyletic = same as above, but the common ancestor gave rise only to members of the group.