Treatment of Chronic Coronary Atherosclerosis - his …his-files.com/pdf/M45.pdf · Treatment of...
91
Treatment of Chronic Coronary Atherosclerosis Professor Yoseph Rozenman The E. Wolfson Medical Center CME course, Cesaria 2010
-
Upload
phungthien -
Category
Documents
-
view
233 -
download
2
Transcript of Treatment of Chronic Coronary Atherosclerosis - his …his-files.com/pdf/M45.pdf · Treatment of...

Treatment of Chronic Coronary
AtherosclerosisProfessor Yoseph Rozenman
The E. Wolfson Medical Center
CME course, Cesaria
2010

OUTLINEPathophysiology
–
Atherosclerosis–
Ischemia
Primary prevention –
who should be treatedTherapy
–
Lifestyle–
Pharmacology
–
Revascularization
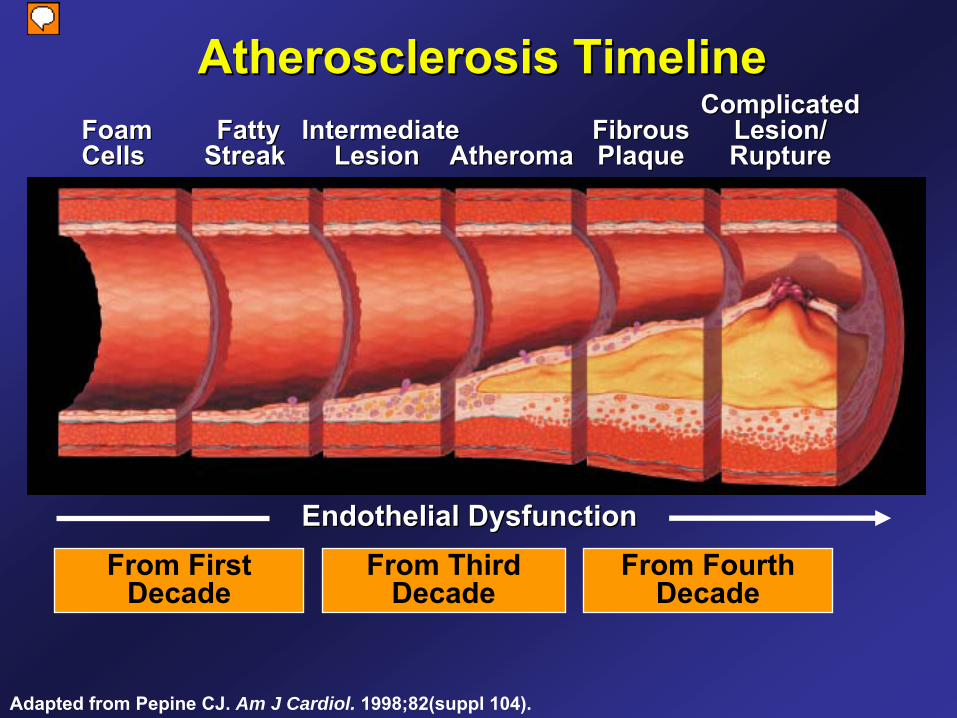
Atherosclerosis TimelineAtherosclerosis TimelineFoamFoamCells Cells
FattyFattyStreak Streak
IntermediateIntermediateLesion Lesion AtheromaAtheroma
FibrousFibrousPlaquePlaque
ComplicatedComplicatedLesion/Lesion/RuptureRupture
Adapted from Pepine
CJ. Am J Cardiol. 1998;82(suppl 104).
From FirstDecade
From ThirdDecade
From FourthDecade
Endothelial DysfunctionEndothelial Dysfunction
מציג
הערות מצגת
Atherosclerosis is a progressive disease involving the development of arterial wall lesions. As they grow, these lesions may narrow or occlude the arterial lumen. Complex lesions may also become unstable and rupture, leading to acute coronary events, such as unstable angina, myocardial infarction, and stroke. Pepine CJ. The effects of angiotensin-converting enzyme inhibition on endothelial dysfunction: potential role in myocardial ischemia. Am J Cardiol. 1998; 82(suppl 10A):244-275.

The Glagov
Concept Atherosclerosis progression and luminal narrowing
Similar luminal area despite marked variation in the volume of atheroma
due to compensatory enlargement of the artery
Glagov S
et al NEJM 316:1371, 1987,
מציג
הערות מצגת
CD Figure 326. Arteries appear to enlarge initially as plaques form, tending to preserve a lumen of adequate cross-section even in the presence of relatively large intimal plaques. A, Postmortem sections of the left anterior descending coronary artery taken at the same level in two individuals. The lumen cross-sectional area (L) is approximately the same for each individual, although the lesion area is vastly different. If the artery on the left had not enlarged to compensate for the large plaque that formed, the lumen would have been totally occluded. That artery enlargement is a consequence of plaque formation is indicated by the fact that in any given artery segment lumen cross-sectional area is often similar for involved and uninvolved segments. Enlargement usually occurs only where plaques are forming. B, Diagram of artery enlargement with plaque formation based on a study of the human left main coronary artery. Although plaque formation may be arrested at any stage, lumen stenosis appears to be evident on the average when 40 percent or more of the potential lumen area (as defined by the area encompassed by internal elastic lamina) is occupied by plaque. Plaque enlargement is mainly associated with outward bulging of the artery wall beneath the lesion. (Adapted from Glagov S, Weisenberg E, Zarins CK, et al: Compensatory enlargement of human atherosclerotic coronary arteries. N Engl J Med 316:1371-1375, 1987.)

Oxygen Supply myocardium vs
other tissues
O2
DeliveryCoronary Blood FlowHemoglobinArterial O2
saturationMyocardial (A-V) O2
Difference
In resting condition coronary sinus blood is desaturated
thus oxygen supply to the
myocardium during conditions of increased demand is dependent on coronary blood flow.

Impact of diameter stenosis
on resting and maximal coronary flow (flow reserve)
Normalized resting flow
Normalized flow reserve
מציג
הערות מצגת
FIGURE 34–22. Relationship between resting (dashed line) and maximal coronary blood flow (solid line) and percentage of diameter stenosis in a dog. Progressive coronary stenosis was achieved by progressively narrowing a short segment of a proximal coronary artery. Resting coronary blood flow did not change until coronary diameter stenosis exceeded 80 percent. (From Marcus ML: The Coronary Circulation in Health and Disease. New York, McGraw-Hill, 1983, and modified from Gould KL, Lipscomb L: Effects of coronary stenoses on coronary flow reserve and resistance. Am J Cardiol 34:50, 1974.) W.B. Saunders Company items and derived items copyright © 2001 by W.B Saunders Company.

Mechanism of stress induced perfusion mismatch
Limited coronary flow reserve (CFR) in the territory supplied by the stenotic
artery
causing perfusion mismatch
מציג
הערות מצגת
FIGURE 9–17. Schematic representation of the principle underlying rest/stress myocardial perfusion imaging. Top, Two branches of a coronary artery are schematically shown; the left branch is normal whereas the right branch has a significant stenosis. Middle, Myocardial perfusion images of the territories supplied by the two branches. Bottom, Schematic representation of coronary blood flow in the branches at rest and during stress. At rest, myocardial blood flow is similar in both coronary artery branches. When a myocardial perfusion imaging agent is injected at rest, myocardial uptake is homogeneous (normal image). During stress, coronary blood flow increases 2.0 to 2.5 times in the normal branch, but not to the same extent in the stenosed branch, thereby resulting in heterogeneous distribution of blood flow. This heterogeneity in blood flow can be visualized with 201 Tl or 99m Tc-sestamibi as an area with relatively decreased radiotracer uptake (myocardial perfusion defect). (From Wackers FJTh: Exercise myocardial perfusion imaging. J Nucl Med 35:726, 1994. Reprinted with permission from the Society of Nuclear Medicine.) W.B. Saunders Company items and derived items copyright © 2001 by W.B Saunders Company.


Consequences of Acute Coronary Ischemia
Typically causes ECG changes, myocardial dysfunction (diastolic and systolic) and symptoms of chest pain.
Causes prolonged? dysfunction (stunning, occasional repetitive)
Magnitude of effect modified by adaptive mechanisms (smart heart)Hibernation (adaptation of mechanical function
to flow limitation)Preconditioning (protection from future
ischemia by past ischemic episodes)

Unusual Presentations of Chronic Angina –
Current Understanding
Diurnal variation of anginaCoronary tone, preconditioning
Angina disappears during walking Coronary tone, preconditioning
Prolonged fatigue after exertionMyocardial stunning
CHF symptoms without previous MIHibernation (repetitive stunning)

OUTLINEPathophysiology
–
Atherosclerosis–
Ischemia
Primary prevention –
who should be treatedTherapy
–
Lifestyle–
Pharmacology
–
Revascularization

עם סיפור משפחתי ש ל מחלת לב אסימפטומטי 55בן LDL= 125mg/dl)(כלילית
?האם מומלץ להתחיל טיפול ב סטטין
כן1.
לא2.
) שנקבעת על פי גורמי הסיכון(תלוי ברמת הסיכון 3.LDLובערך המטרה המת אים של
תחת ) אקו(מיפוי / תלוי בתוצ את מבחן מאמץ 4.דחק
בדיקת הדמיה –תלוי בנוכחות טרשת בכלי דם 5.של טרשת
CRPתלוי ברמת 6.

Note: Risk estimates were derived from the experience of the Framingham Heart Study, a predominantly Caucasian population in Massachusetts, USA.
Expert Panel on Detection, Evaluation, and Treatment of High Blood Cholesterol in Adults. JAMA. 2001;285:2486-2497.
Assessing CHD Risk in Men -
FraminghamStep 1: Age
Years Points20-34 -935-39 -440-44 045-49 350-54 655-59 860-64 1065-69 1170-74 1275-79 13
Step 2: Total CholesterolTC Points at Points at Points at Points
at Points at (mg/dL) Age 20-39 Age 40-49 Age 50-59 Age 60-69Age
70-79 <160 0 0 0 0 0
160-199 4 3 2 1 0200-239 7 5 3 1 0240-279 9 6 4 2 1280 11 8 5 3 1
HDL-C (mg/dL) Points
60 -150-59 040-49 1<40 2
Step 3: HDL-Cholesterol
Systolic BP Points Points (mm Hg) if Untreated if Treated
<120 0 0120-129 0 1130-139 1 2140-159 1 2160 2 3
Step 4: Systolic Blood Pressure
Step 5: Smoking Status
Points at Points at Points at Points at Points at
Age 20-39 Age 40-49 Age 50-59 Age 60-69Age 70-79 Nonsmoker 0 0 0 0 0Smoker 8 5 3 1 1
AgeTotal cholesterolHDL-cholesterolSystolic blood pressureSmoking statusPoint total
Step 6: Adding Up the Points
Point Total 10-Year Risk Point Total10-Year Risk
<0 <1% 11 8%0 1% 12 10%1 1% 13 12%2 1% 14 16%3 1% 15 20%4 1% 16 25%5 2% 17 30%6 2%7 3%8 4%9 5%
10 6%
Step 7: CHD Risk
©
2001, Professional Postgraduate Services®
www.lipidhealth.org

Risk subgroups LOW RISK
designated as <0.6% CHD risk per
year (<6% in 10 years) INTERMEDIATE RISK
designated as a CHD risk
of 0.6%-2.0% per year (6-20% over 10 years)HIGH RISK
designated as a CHD risk of >2%
per year (20% in 10 years) (CHD risk equivalent), including those with CVD, diabetes, and PAD
Target LDL and need for statin
is determined by level of risk

How Good Is NCEP III At Predicting MI in young?
222 patients with 1222 patients with 1stst
acute MI, no prior CADacute MI, no prior CADmen <55 y/o (75%), women <65 (25%), no DMmen <55 y/o (75%), women <65 (25%), no DM
12%
18%
70%
High Risk Intermediate Risk Low Risk
High RiskWould qualify for statin
Akosah
Et al, JACC 2003:41 1475-9
מציג
הערות מצגת
A study published almost 4 years ago, summarized these deficiencies in a nice manner. In this study the authors assessed nearly 200 young patient with no history of CAD who presented with an acute MI and asked a simple question< How would FRS classify them. Interestingly they found that nearly ¾ of them were classified as low risk by FRS, so if they walked into your clinic one day before an event you would have given them a clean bill of health and reassured them of their CHD risk for at least next 5 years. Also more women were classified as low risk as compared to men as well they were less likely to be eligible for pharmacotherapy.

First Presentation is Frequently Sudden Death might be preventable with early therapy

What should be done? Who should be started on statin
RX
Everyone > 50 years oldOnly those at high risk for eventRisk predictors:Calcium Score (CAC)Carotid Intima–Media Thickness (CIMT)C Reactive Protein (CRP)

How Is the Coronary Artery Calcium (CAC) Score Calculated?
Peak density and area in each location, in each coronary artery, are measured.
CAC score
= total of area and density of each calcified lesionImages courtesy of Alan B. Images courtesy of Alan B. ZelingerZelinger, MD., MD.
Hn x-factor(Agatston Scoring)
130-199 1
200-299 2
300-399 3
>400 4
מציג
הערות מצגת
References Arad Y, Spadaro LA, Goodman K, et al. Predictive value of electron beam computed tomography of the coronary arteries. 19-month follow-up of 1173 asymptomatic subjects. Circulation. 1996;93:1951-1953. Berman DS, Wong ND, Gransar H, et al. Relationship between stress-induced myocardial ischemia and atherosclerosis measured by coronary calcium tomography. J Am Coll Cardiol. 2004;44:923-930. Agatston AS, Janowitz WR, Hildner FJ, et al. Quantification of coronary artery calcium using ultrafast computed tomography. J Am Coll Cardiol. 1990;15:827-832. Rumberger JA, Brundage BH, Rader DJ, et al. Electron beam computed tomographic coronary calcium scanning: a review and guidelines for use in asymptomatic persons. Mayo Clin Proc. 1999;74:243-252.

FollowFollow--up (Years)up (Years)554433221100
Shaw LJ, et al. Radiology. 2003;228:826-833.
Coronary Artery Calcium (CAC) Score Can Predict Risk-Unadjusted All-Cause Mortality
Cum
ulat
ive
Surv
ival
(%)
Cum
ulat
ive
Surv
ival
(%)
1.001.00
.98.98
.96.96
.94.94
.92.92
.90.90
.88.88
.86.86
.84.84
.82.82
.80.80
401401--10001000
>1000>1000
101101--4004001111--100100≤≤
1010
CAC

What is Carotid Intima–Media Thickness (CIMT)?
Common Carotid
Internal CarotidExternal Carotid
Flow Divider
10 mm
Internal
10 mm
10 mm
Bifurcation
Common
Normal and Diseased Arterial Histology
Normal and DiseasedNormal and Diseased Arterial HistologyArterial Histology
Skin Surface
מציג
הערות מצגת
Slide 16. What is carotid intima–media thickness (CIMT)? [I] Measuring carotid intima–media thickness (CIMT) is an ultrasound technique in which the combined intima and media layer of the far wall of the carotid artery is imaged and then its mean thickness is measured using a computer program to trace the near (intima–lumen) and far (media–adventitia) wall border.

What is Carotid Intima–Media Thickness (CIMT)?
Mean CIMT 1.174 mm
מציג
הערות מצגת
Slide 17. What is carotid intima–media thickness (CIMT)? [II] Measuring carotid intima–media thickness (CIMT) is an ultrasound technique in which the combined intima and media layer of the far wall of the carotid artery is imaged and then its mean thickness is measured using a computer program to trace the near (intima–lumen) and far (media–adventitia) wall border.

Carotid Disease as a Marker of Cardiovascular Risk: MI or Stroke
OO’’Leary, et al. Leary, et al. N Engl J MedN Engl J Med. 1999;340:14. 1999;340:14--22.22.
YearsYears
Cum
ulat
ive
Even
tC
umul
ativ
e Ev
ent -- F
ree
Rat
e (%
)Fr
ee R
ate
(%)
00 11 22 33 44 55 66 77
N=4476N=4476
7070
7755
8080
8585
9595
9090
100100
11stst
Quintile IMTQuintile IMT
22ndnd
Quintile IMTQuintile IMT33rdrd
Quintile IMTQuintile IMT
44thth
Quintile IMTQuintile IMT
55thth
Quintile IMTQuintile IMT
CIMT

1.00
0.99
0.98
0.97
0.96
00 2 6 84
1st Quintile
2nd3rd
4th
5th
CVD Risk in the Women’s Health Study According to Quintiles of CRP
Ridker PM et al. N Engl J Med 2002;347:1557-1565. Copyright 2002 Massachusetts Medical Society. All rights reserved.
Probab
ility
of Eve
nt-
Free
Surv
ival
CRP
מציג
הערות מצגת
CRP, LDL-C, and CVD risk in the Women’s Health Study The effects of levels of CRP and LDL cholesterol on risk for CVD were compared in the Women’s Health Study, and the authors found that the effects of the inflammatory marker CRP were very similar to what was observed for LDL cholesterol. Reference: Ridker PM, Rifai N, Rose L, Buring JE, Cook NR. Comparison of C-reactive protein and low-density lipoprotein cholesterol levels in the prediction of first cardiovascular events. N Engl J Med 2002;347:1557-1565.
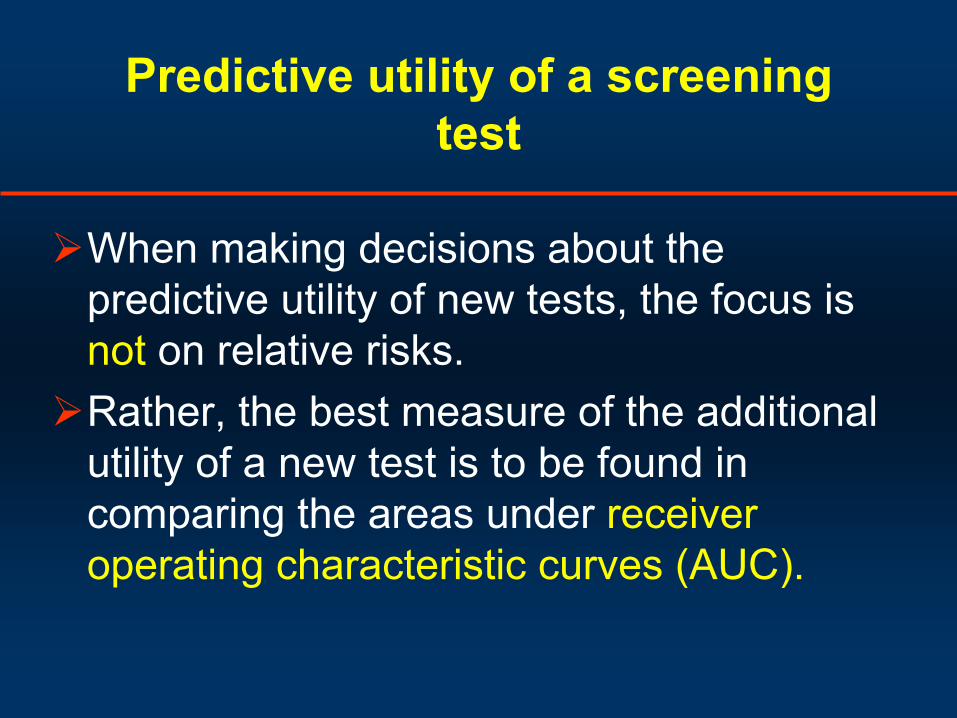
Predictive utility of a screening test
When making decisions about the predictive utility of new tests, the focus is not
on relative risks.
Rather, the best measure of the additional utility of a new test is to be found in comparing the areas under receiver operating characteristic curves (AUC).

Based on: Pepe
e. al. Am J Epidemiol
2004; 159:882-890.
ROC Curve, its AUC and Corresponding Odds RatioROC Curve, its AUC and Corresponding Odds Ratio
hs-CRPLDLHDLSmokingHypertensionDiabetesetc.
CAC
IMT, FRS

MESA Study – 6,814 Patients: 3.5 year follow-up
1
3.61
7.73
9.67
0
5
10
15
None 1-100 100-300 >300
Fully adjusted – Detrano et al– NEJM 2008
Haz
ard
Rat
ioRisk of Coronary Events Associated with Increasing CAC
after
Adjustment for Standard Risk Factors
מציג
הערות מצגת
At Tim’s suggestion and my preference I will be modifying the subsequent slides to look like this. That way I won’t be a total copycat.

Association for the Eradication of Heart Attacks

Most Myocardial Infarctions Are Caused by Low-Grade Stenoses:
Pooled data from 4 studies: Ambrose et al, 1988; Little et al, 1988; Nobuyoshi et al, 1991; and Giroud et al, 1992. Falk E et al, Circulation, 1995.
Failure rate
of primary and secondary prevention is high
even with statin
therapy

Prediction and Prevention: The Vulnerable Plaque
Project Goal: Prevent heart attacks
Currently in development. Not available for sale.
Preventing MI
Predicting VulnerabilityCurrent standard of
primary & Secondary prevention
700,000 new and 500,000 recurrent Myocardial Infarctions (MI) annually
Vulnerable plaque causes most heart attacks
700,000 New
500,000 Recurrent

Detection of Vulnerable Plaque Catheter Base and Non-invasive techniques
Prediction should be reliable enough to justify invasive therapy (stent)Otherwise, patients with any plaques, should be on statins

Soft Plaque (CTA): A marker of vulnerability?
LAD: with narrowing RCA: with minimal narrowing

OUTLINEPathophysiology
–
Atherosclerosis–
Ischemia
Primary prevention –
who should be treatedTherapy
–
Lifestyle–
Pharmacology
–
Revascularization

Aims of Treatment
Improve prognosis– Prevention of death and myocardial
infarction
Improve quality of life– Prevent / minimize symptomatic
ischemic events

Aims and Modes of Treatment From the Guidelines
Improve prognosis–
“Lifestyle changes and drug treatment
play vital
roles in modifying the atherosclerotic disease process and ‘stabilising’
coronary plaques ***”
–
“In certain circumstances, such as in patients with severe lesions in coronary arteries supplying a large area of jeopardised
myocardium,
revascularization
offers additional opportunities to improve prognosis by improving existing perfusion or providing alternative routes of perfusion”
ESC guidelines on the management of stable AP -
2006

Aims and Modes of Treatment From the Guidelines
Improve quality of life–
“Lifestyle changes, drugs, and revascularization all have a role to play in minimising
or eradicating symptoms of
angina, although not necessarily all in the same patient”
ESC guidelines on the management of stable AP -
2006

N Engl
J Med 2007;356:2388-98.
From 1980 to 2000, the age-adjusted mortality rate from CAD fell (per 100,000 population):
Men: from 542.9 to 266.8 (51%)
Women: from 263.3 to 134.4 (49%)
A previously validated model was used to estimate the roles of specific cardiac treatments and changes in risk factors in this decline

Sequence Variations in PCSK9*, Low LDL, and Protection against Coronary Heart
Disease
Jonathan C. Cohen, Ph.D., Eric Boerwinkle, Ph.D., Thomas H. Mosley Jr., Ph.D. and Helen H. Hobbs, M.D.
N Engl J Med Volume 354;12:1264-1272, March 23, 2006
*proprotein
convertase
subtilisin/kexin
type 9 serine protease gene

Background: PCSK9 mutation and its effect on LDL-C level
PCSK9 is responsible for degradation of LDL receptors in liver cellsVarious genetic variations are present in
blacks (2%) and whites (3.2%)Subjects have increased LDL receptor density
(statin
like effect)associated with a 20-40 percent reduction in mean
LDL cholesterol
Clinical significance was determined in 15792 participants of ARIC: a prospective study of atherosclerosis in the communityData represents 15 years of follow-up
Cohen, J. et al. N Engl J Med 2006;354:1264-1272

Cohen, J. et al. N Engl J Med 2006;354:1264-1272
Distribution of Plasma LDL-C and Incidence of CHD among 3363 Black Participants in the Study
Carriers and noncarriers
of PCSK9 nonsense mutation
Plasma LDL-C 28% lower in carriers
15 years follow-up
CHD in only 1 of 85 carriers!
88% risk reduction

28 31
15
50
28
88
0
25
50
75
100
Statins PCSK9 (whites) PCSK9 (blacks)
LDL-C ReductionRisk Reduction
Relation Between Reduction of LDL-C and Cardiovascular Risk Reduction
Statins
as compared to PCSK9 mutation
Meta-analysis Variant Nonsense

Atherosclerosis Progression Implication for therapy
Atherosclerosis is a slowly progressive diseaseDisease starts at childhood but becomes
clinically evident decades later It takes years until the maximal benefit of
therapy is evident5 years (F/U time in many statin
trials) are not
enough to obtain the full benefit from therapy

ASTEROID rosuvastatin
50 60 80 90 100 110
0.6
1.2
1.8
Med
ian
chan
ge in
PA
V (%
)
Mean (on treatment) LDL-C (mg/dL)
0
-1.2
-0.6
70 120
A-Plus placebo
CAMELOT placebo
REVERSAL pravastatin
REVERSAL atorvastatin
R2 = 0.97 P<0.001
Progression
Regression
Ref: Nissen
S et al. JAMA 2006; 295: e-publication ahead of print
ASTEROID: Aggressive statin
therapy can induce regression
of atherosclerosis
מציג
הערות מצגת
Core slide This slide shows a linear regression analysis of LDL-C levels achieved and the IVUS progression rates from previous IVUS studies and from ASTEROID. It shows that there is a remarkably high correlation between mean LDL-C achieved in the various studies and the mean progression rate for the most robust IVUS endpoint Percent Atheroma Volume. The results from ASTEROID demonstrate that no apparent LDL-C ‘threshold’ exists beyond which benefits of LDL- reduction apply. To achieve regression, lower is better. REVERSAL indicates Reversal of Atherosclerosis With Aggressive Lipid-Lowering12; CAMELOT, Comparison of Amlodipine vs Enalapril to Limit Occurrences of Thrombosis14; A-Plus, Avasimibe and Progression of Lesions on Ultrasound13; and ASTEROID, A Study to Evaluate the Effect of Rosuvastatin on Intravascular Ultrasound-Derived Coronary Atheroma Burden.

4S-P
CARE-P
LIPID-P4S-S
LIPID-S
CARE-S
HPS-S
HPS-P
Treating to New Targets (TNT) trial: Rationale
Treating to New Targets (TNT) trial: Rationale
25
20
15
10
5
0 S = statin treated P = placebo treated
Perc
ent w
ith C
HD
eve
nt
80 mg
10 mg
Simvastatin
Pravastatin
Atorvastatin
Screening
TNT
LDL-C, mg/dl
90 110 130 150 170 190 21070
Modified from Kastelein JJP. Atherosclerosis. 1999;143(suppl 1):S17-S21
מציג
הערות מצגת
It is unclear whether additional benefit can be attained by further lowering LDL-C in patients whose LDL-C levels have already been lowered to 100 mg/dL (2.6 mmol/L) from higher levels. The primary hypothesis of the Treating to New Targets (TNT) Study is that incremental reduction in cardiovascular risk can be achieved by lowering LDL-C levels beyond currently recommended minimum targets.

TNT: Treatment effects on primary outcome
LaRosa
JC et al. N Engl J Med. 2005;352.
22% risk reduction
Years
65421 3
Atorvastatin
10 mg
Atorvastatin
80 mg
00.00
Major CVevents (%)
0.05
0.10
0.15
HR = 0.78 (0.69–0.89)P < 0.001

0
2
4
6
8
10
12
14
Major CV events CHD death Nonfatal MI
<64 65-7778-90 91-106>106 mg/dl
P < 0.0001*
P < 0.01*
P < 0.0001*
*P-value for trend across LDL-C
Major CV Events Across Quintiles of Achieved LDL
LaRosa
JC. AHA. 2005
% p
atie
nts

JUPITER Trial: LDL and event* reduction
0
50
100
LDL
(mg/
dL)
LDL decrease 50 percent at 12 months
HR 0.56, 95% CI 0.46-0.69P < 0.00001
0 1 2 3 4
0.00
0.02
0.04
0.06
0.08
Cum
ulat
ive
Inci
denc
e
Follow-up (years)Months0 12 24 36 48
Ridker
et al NEJM 2008
*Primary Trial Endpoint :
MI, Stroke, UA/Revascularization, CV Death

Role of RAAS Modulation in CAD Implications from recent
clinical trials

Benefit of ACE inhibition in CADBenefit of ACE inhibition in CAD
EUROPA
HOPE
All CAD patientsAll CAD patients
SOLVD SAVE
AIRE TRACE SOLVD
(prev)
High risk
Bertrand ME. Curr Med Res Opin. 2004;20:1559-69.
PEACE
Post-MI, HF, LVEF <40%
מציג
הערות מצגת
A number of large multicenter, randomized trials have established the important role of ACE inhibitors at different stages of the pathophysiologic continuum of CV diseases.1 Earlier long-term trials such as SOLVD and SAVE showed that ACE inhibitors could prevent major adverse CV events in acute MI patients with heart failure or LV dysfunction. The SOLVD-prevention trial extended these findings to CAD patients with �LV dysfunction. The HOPE study extended the role of ACE inhibition to patients age >55 years who were at high risk of CV events without heart failure or LV dysfunction, but with a prior history of vascular disease or diabetes plus another risk factor. EUROPA has recently shown that ACE inhibition is beneficial in a broad population of patients at low risk and with stable CAD and no apparent heart failure. Results support the use of ACE inhibitors for secondary prevention in all CAD patients.

ACEI trials in CAD without HF: Primary outcomes
HOPE Study Investigators. N Engl J Med. 2000;342:145-53.Pitt B et al. Am J Cardiol. 2001;87:1058-63.
PEACE
CV death/MI/CABG/PCI
HOPE
CV death/MI/stroke
15
5
10
0
20
0
Placebo
Ramipril 10 mg
Time (years)
%
2 41
22% Risk reductionHR 0.78 (0.70–0.86)
P < 0.001
3Time (years)
12
4
10
01 3 4
14
0
Placebo
Perindopril
8 mg
86
2
52
EUROPACV death/MI/cardiac arrest
20% Risk reductionHR 0.80 (0.71–0.91)
P = 0.0003
40
20
30
0
50
0
Placebo
Quinapril
20 mg
Time (years)1
4% Risk increaseHR 1.04 (0.89–1.22)
P = 0.6
10
2 3
QUIET
All CV events
Time (years)
Trandolapril4 mg
Placebo30
20
10
15
5
1 2 3 4 5
25
06
4% Risk reductionHR 0.96 (0.88–1.06)
P = 0.43
EUROPA Investigators. Lancet. 2003;362:782-8.PEACE Trial Investigators. N Engl J Med. 2004;351:2058-68.
%
%
%
מציג
הערות מצגת
Four major trials have studied the effect of long-term ACE inhibition in CAD patients with normal LV function. EUROPA: Perindopril 8 mg demonstrated a 20% reduction in the primary outcome �(CV death, MI, and cardiac arrest) in relatively low-risk patients.1 HOPE: Ramipril 10 mg demonstrated a 22% reduction in the primary outcome �(CV death, MI, and stroke) in high-risk patients.2 EUROPA and HOPE achieved comparable benefits, even though EUROPA patients were at lower risk and more intensively treated. PEACE: In contrast, trandolapril 4 mg demonstrated a neutral effect on the primary outcome (CV death, MI, and revascularization) in lower-risk patients.3 QUIET: This trial also demonstrated a neutral effect of ACE inhibition on a composite of all major CV outcomes. Quinapril 20 mg was administered to 1750 patients who had undergone coronary angioplasty or atherectomy. Subjects were randomized to treatment or placebo and followed for a mean of 27 months.4 The proposed reasons for the differences among the trial findings include: a low-risk population; the drug or dosage; too brief a study period (QUIET); or underpowered (PEACE) to demonstrate a reduction in MI and CV death.4,5

EUROPA, HOPE, PEACE, QUIET: Totality of trial evidence
MI
Stroke
All-cause death
Event rate (%)Favors ACEIACEI
Revascularization
Favors placeboPlacebo
7.5
6.4
2.1
15.5
8.9
7.7
2.7
16.3
0.86
0.86
0.77
0.93
0.0004
0.0004
0.0004
0.025
0.5 0.75 1.251Odds ratio
P
Pepine
CJ, Probstfield
JL. Vasc Bio Clin Pract. CME Monograph; UF College of Medicine. 2004;6(3).
מציג
הערות מצגת
Combined analyses of the data from EUROPA, HOPE, PEACE, and QUIET show that treatment with ACE inhibition reduced the risk of total mortality in CAD patients without heart failure.1-5 There was an overall relative risk reduction in total mortality of 14% (P < 0.0004). MI, stroke, and revascularizations were also significantly reduced. This analysis confirms the clear benefits of ACE inhibitors in patients with vascular disease and no LV dysfunction.

ACE inhibitors: ESC guidelines on the management of stable AP -
2006
Class I
ACE-inhibitor therapy in patients with coincident indications for ACE-inhibition, such as hypertension, heart failure, LV dysfunction, prior MI with LV dysfunction, or diabetes–
level of evidence A
Class IIa
ACE-inhibitor therapy in all patients with angina and proven coronary disease–
level of evidence B
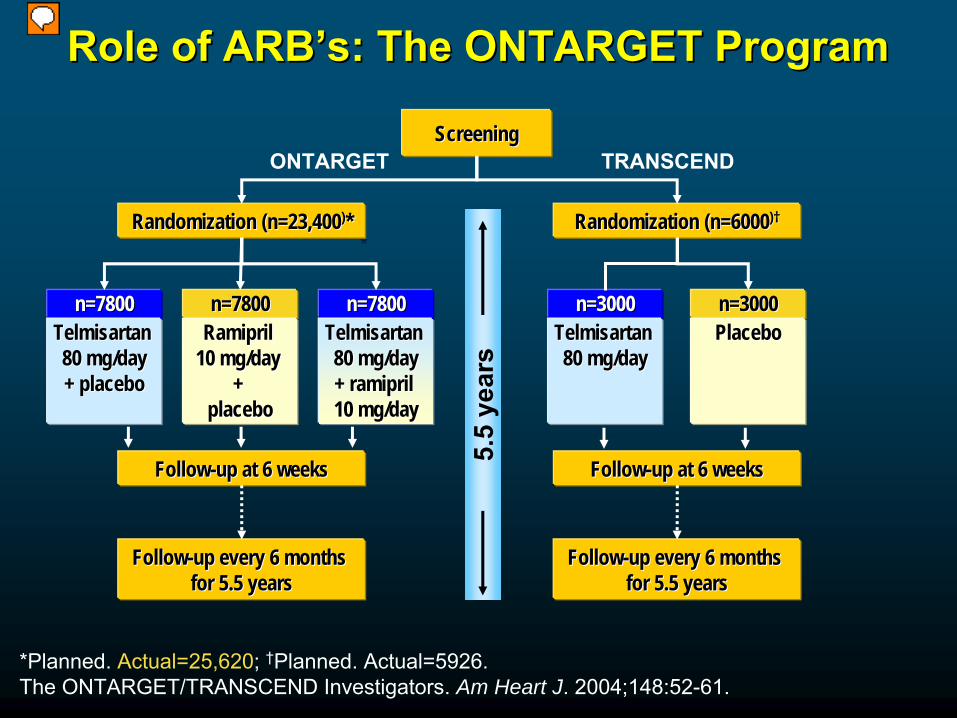
Role of Role of ARBARB’’ss: The ONTARGET Program: The ONTARGET Program
*Planned. Actual=25,620; †Planned. Actual=5926.The ONTARGET/TRANSCEND Investigators. Am Heart J. 2004;148:52-61.
*
ScreeningScreening
Randomization (n=6000Randomization (n=6000))††
TRANSCEND
n=3000n=3000PlaceboPlacebo
n=3000n=3000Telmisartan Telmisartan 80 mg/day80 mg/day
FollowFollow--up at 6 weeksup at 6 weeks
FollowFollow--up every 6 months up every 6 months for 5.5 yearsfor 5.5 years
FollowFollow--up every 6 months up every 6 months for 5.5 yearsfor 5.5 years
Randomization (n=23,400Randomization (n=23,400))**
ONTARGET
n=7800n=7800Telmisartan Telmisartan 80 mg/day80 mg/day + placebo+ placebo
n=7800n=7800Telmisartan Telmisartan 80 mg/day80 mg/day + ramipril + ramipril 10 mg/day10 mg/day
n=7800n=7800Ramipril Ramipril
10 mg/day 10 mg/day + +
placeboplacebo
FollowFollow--up at 6 weeksup at 6 weeks5.
5 ye
ars
מציג
הערות מצגת
After screening, patients are included either in the ONTARGET or the TRANSCEND trial. ONTARGET patients are titrated to telmisartan 80 mg/day, or ramipril 10 mg/day, or a combination of telmisartan 80 mg/day and ramipril 10 mg/day (receiving matching placebos in the monotherapy groups). In the TRANSCEND trial, telmisartan 80 mg/day is tested against placebo. Both trials have a follow-up period of 5.5 years.

The ONTARGET TrialThe ONTARGET Trial
Age Age 55 years55 years
At high risk of developing a CVD event, At high risk of developing a CVD event, with a history ofwith a history of––
Coronary artery diseaseCoronary artery disease
––
Peripheral arterial occlusive disease (PAOD)Peripheral arterial occlusive disease (PAOD)––
Cerebrovascular eventCerebrovascular event
––
Diabetes mellitus with end organ diseaseDiabetes mellitus with end organ disease
Intolerant to ACE inhibitors (Intolerant to ACE inhibitors (TRANSCENDTRANSCEND))
Inclusion Criteria
The ONTARGET/TRANSCEND Investigators. Am Heart J. 2004;148:52-61.
Criteria similar to HOPE trial
מציג
הערות מצגת
The inclusion criteria for the ONTARGET trial are very similar to those of the HOPE trial. It is comprised of consenting male or female subjects, 55 years of age or older, who are at high risk of developing a major CV event and who have a history of:�- Coronary artery disease - Peripheral arterial occlusive disease (PAOD) - Cerebrovascular event - Diabetes mellitus with end-organ disease In addition to the above criteria TRANSCEND patients must also be intolerant to treatment with ACE inhibitors.

ONTARGET Change in BP (mmHg)
Ramipril Telmisartan Combination
Systolic -6.0 -6.9 -8.4
Diastolic -4.6 -5.2 -6.0
ONTARGET
NEJM 2008: 358; 1547-1559
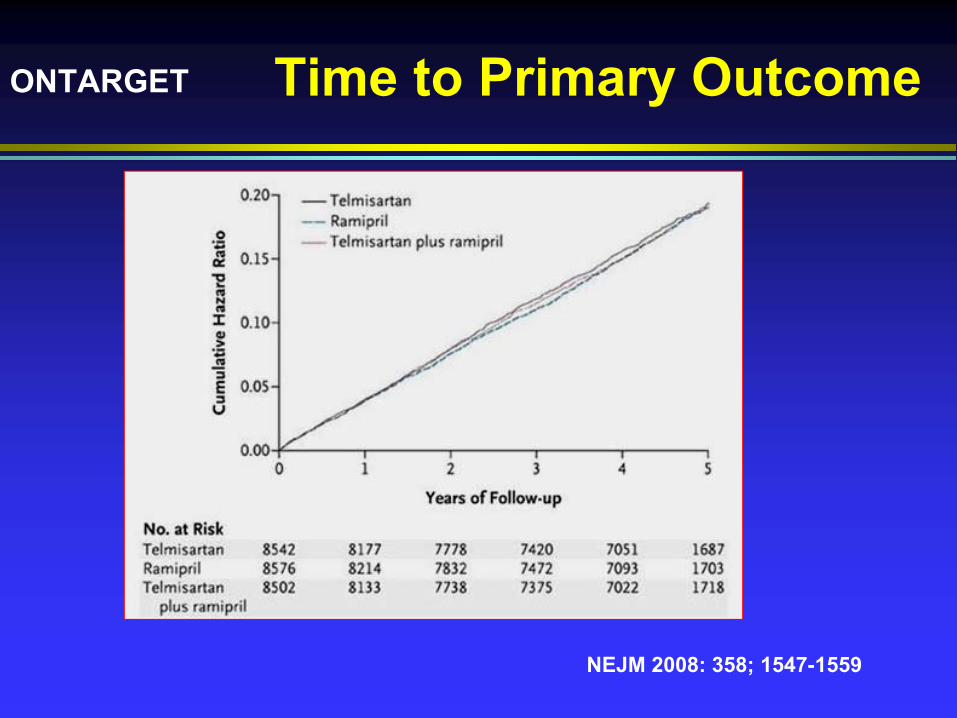
Time to Primary Outcome

Telmisartan
vs. Placebo in ACE intolerant patients
ESC: SEP 2008

ONTARGET Implications
•
Telmisartan is as effective as ramipril, with a slightly better tolerability.
•
Combination therapy is not superior to ramipril, and has increased side effects.
•
Telmisartan
is not better than placebo in ACE intolerant patients
How can Telmisartan
be as effective as Ramipril
(HOPE population) and at the
same time not be better than placebo????

Antiplatelet Therapy

•
Aspirin is a weak antiplatelet
agent•
Role of aspirin in treatment in patients with ACS and in stable CAD is proven beyond doubt
•
Addition of clopidogrel to aspirin is helpful to improve outcome in ACS
•
Is there benefit to combination therapy (aspirin and clopidogrel) in stable CAD?
Antiplatelet
therapy –
beyond aspirin

Clopidogrel for High Atherothrombotic Risk and Ischemic Stabilization, Management and Avoidance
(CHARISMA)

Study Design
* MI (fatal or non-fatal), stroke (fatal or non-fatal), or cardiovascular death;event-driven
trial
Clopidogrel 75 mg/day(n=7802)
Placebo 1 tablet/day (n=7801)
1-month visit
Final visit (Fixed study
end date)
Patients age ≥
45 years at high risk of atherothrombotic events
R Double-blind treatment up to 1040 primary efficacy events*
Low dose ASA 75162 mg/day
Low dose ASA 75162 mg/day
(n=15603)
Visits every 6 months3-month visit
Bhatt DL, Topol EJ, et al. Am Heart J 2004; 148: 263–268.
מציג
הערות מצגת
CHARISMA was a multicenter, multinational, randomized, two-parallel group, double-blind trial of clopidogrel versus placebo A total of 15603 patients with documented atherothrombotic disease (symptomatic) or multiple risk factors (asymptomatic patients) were randomized to clopidogrel (75 mg per day) or placebo in a double-blind manner, both in addition to background therapy including low-does ASA (75-162 mg/day, the exact dose left to the discretion of the individual treating physician), and followed for a median of 28 months. 2 The randomization was centralized using an IVRS1 CHARISMA was an event-driven trial, meaning that it was planned to end after at least 1,040 blinded, primary events had accrued 1 Since 1040 primary efficacy events had been reached, the fixed study end date was 29 August 2005 Final visits occurred within the month following the fixed study end date1 During the trial each patient had follow-up visits scheduled at 1 month, 3 months, 6 months, 12 months and every 6 months thereafter until a common study end date 1 All patients were followed from randomization until study end date, with the last patient followed for at least 3 months1 Reference Bhatt DL, Topol, EJ, et al. Am Heart J 2004; 148: 263–268.

Must include
SignedWritten
InformedConsent
Patients aged>45 years
At
least
one
offour
criteria
Major Risk
Factors•
Type I or Type II diabetes•
Diabetic
nephropathy•
Ankle
Brachial Index <0.9 •
Asymptomatic
carotid stenosis
> 70%•
Presence
of
at
least one
carotid
plaque
Minor
Risk
Factors•
SBP 150 mm Hg(despite therapy)
• Hypercholesterolemia• Current
smoking >15 cigarettes/day
•
Male 65 years or female
70 years
1.
Documented cerebrovascular
disease
2.
Documented coronary
disease
3.
Documented symptomatic PAD
4.
2 major or 1 major and
2 minor
or 3
minor
risk
factors
Inclusion criteria

Overall Population: Primary Efficacy Outcome (MI, Stroke, or CV Death)†
†
First Occurrence of MI (fatal or non-fatal), stroke (fatal or non-fatal), or cardiovascular death*All patients received ASA 75-162mg/dayMedian follow-up was 28 months
Cum
ulat
ive
even
t rat
e (%
)
0
2
4
6
8
Months since randomization0 6 12 18 24 30
Placebo + ASA*7.3%
Clopidogrel + ASA*6.8%
RRR: 7.1% [95% CI: -4.5%, 17.5%]p=0.22
Bhatt DL, Fox KA, Hacke W, et al. NEJM 2006 –
In press
REACH – 3.5%
מציג
הערות מצגת
The primary efficacy endpoint in CHARISMA was a cluster of the first occurrence of fatal or nonfatal MI, or fatal or nonfatal stroke (of any cause), or cardiovascular death (including haemorrhagic death) With a median of 28 months of follow-up, the primary event rate was 6.8% in the clopidogrel plus aspirin arm and 7.3% in the placebo plus aspirin arm. This represented a non-significant 7.1% relative risk reduction (relative risk [RR] 0.93, 95% confidence interval [CI] 0.83, 1.05, p=0.22)1 The number of patients followed beyond 30 months decreases rapidly to zero and there are only 21 primary efficacy events that occurred beyond this time (13 clopidogrel and 8 placebo) Reference 1. Bhatt DL, Fox KA, Hacke W, et al. N Engl J Med 2006, In press.

Primary Efficacy Results (MI/Stroke/CV Death)* by Category of Inclusion Criteria
Bhatt DL. Oral presentation at ACC 2006.
Population N RR (95% CI)
p value
Documented AT 12,153
0.88 (0.77, 0.998) 0.046
Coronary 5,835
0.86 (0.71, 1.05) 0.13
Cerebrovascular
4,320
0.84 (0.69, 1.03) 0.09
PAD 2,838
0.87 (0.67, 1.13) 0.29
Multiple RF 3,284
1.20 (0.91, 1.59) 0.20
Overall Population 15,603
0.93 (0.83, 1.05) 0.22
0.6 0.8 1.41.2Clopidogrel + ASA
BetterPlacebo + ASA
Better
1.60.4
* First Occurrence of MI (fatal or not), Stroke (fatal or not), or CV DeathRF= Risk Factors, AT= Atherothrombosis
מציג
הערות מצגת
Overall, there was a non-statistically significant relative risk reduction in the primary endpoint (MI/Stroke/CV Death) of 7.1% for clopidogrel plus ASA versus placebo plus ASA (p=0.22). When looking at the primary efficacy results in subgroups of patients by category of inclusion: There was a statistically significant relative risk reduction of 12.5% in the primary endpoint (MI/Stroke/CV Death) for clopidogrel plus ASA versus placebo plus ASA in patients with a history of documented atherothrombosis (p=0.046) The results in these patients with documented atherothrombosis were consistent regardless of whether patients had coronary artery disease (CAD), cerebrovascular disease (CVD), or peripheral arterial disease (PAD) For patients with risk factors only (without documented atherothrombotic disease) there was a non-statistically significant relative risk increase of 20% in the primary endpoint (MI/Stroke/CV Death) for patients treated with clopidogrel plus ASA versus placebo plus ASA (p=0.20) There were 166 patients originally randomized which were found later to have not met any of the inclusion criteria. These patients are included in the overall analysis (intention to treat), but are not included in the documented atherothrombosis or risk factor only subgroups. Therefore, the numbers of patients in these subgroups do not add up to 15603. Patients with documented atherothrombotic disease may have met more than one entry criteria (CAD, CVD, or PAD). For purposes of this analysis, patients are included in each category where they met entry criteria, so the numbers of patients in the subgroups add up to more than 12153. Reference Bhatt DL. Oral presentation at ACC 2006.

Multiple Risk Factor Population: Secondary Efficacy Results
Clopidogrel
Placebo + ASA
+ ASA
Endpoint* –
N (%)
(n=1659) (n=1625)
RR (95% CI)
p
value
Principal Secondary Endpoint†
224 (13.5)
216 (13.3)
1.01 (0.84, 1.22)
0.88
All Cause Death
89 (5.4)
62 (3.8)
1.41 (1.02, 1.95)
0.04
Cardiovascular Death
64 (3.9)
36 (2.2)
1.74 (1.16, 2.62)
0.01
Myocardial Infarction
40 (2.4) 33 (2.0) 1.19 (0.75, 1.89)
0.45
Ischemic Stroke
27 (1.6)
29 (1.8)
0.91 (0.54, 1.54)
0.73
Stroke
35 (2.1)
36 (2.2)
0.95 (0.60, 1.52)
0.84
Hospitalization‡
140 (8.4)
147 (9.0)
0.93 (0.74, 1.18)
0.55
Bhatt DL. Oral presentation at ACC 2006.
*Intention to treat analysis†First occurrence of MI (fatal or not), stroke (fatal or not), cardiovascular death (including hemorrhagic death), or hospitalization‡‡For UA, TIA, or revascularization
מציג
הערות מצגת
In patients with risk factors only, there was an unexpected significant increase in cardiovascular death (RR: 1.74, [95% CI: 1.16, 2.62], p=0.01) and all cause death (RR: 1.41, [95% CI:1.02, 1.95], p=0.04) for patients treated with clopidogrel plus ASA versus placebo plus ASA. The cause of this increase is currently unknown. A few potential hypotheses have been offered by the investigators. One possibility is that it was the play of chance. The excess fatalities in this subgroup and the heightened risk of bleeding complications suggest that we should be cautious about too quickly dismissing this unexpected finding as the play of chance. It is possible that established vascular disease represents a crude proxy for hyperactive platelets. If this concept is accepted, dual antiplatelet therapy would be anticipated to be associated with greater efficacy and less bleeding in the subgroup of symptomatic patients. However, reduced basal platelet activity in asymptomatic patients would be expected to serve as a liability, increasing the risk of bleeding complications, including possible hemorrhage into an arterial plaque. Reference Bhatt DL. Oral presentation at ACC 2006.

CHARISMA –
post hoc subgroup analysis cardiovascular death, MI, or stroke
Patients with prior MI
Patients with CADWithout prior MI
Validity of subgroup analysis in a negative trial?
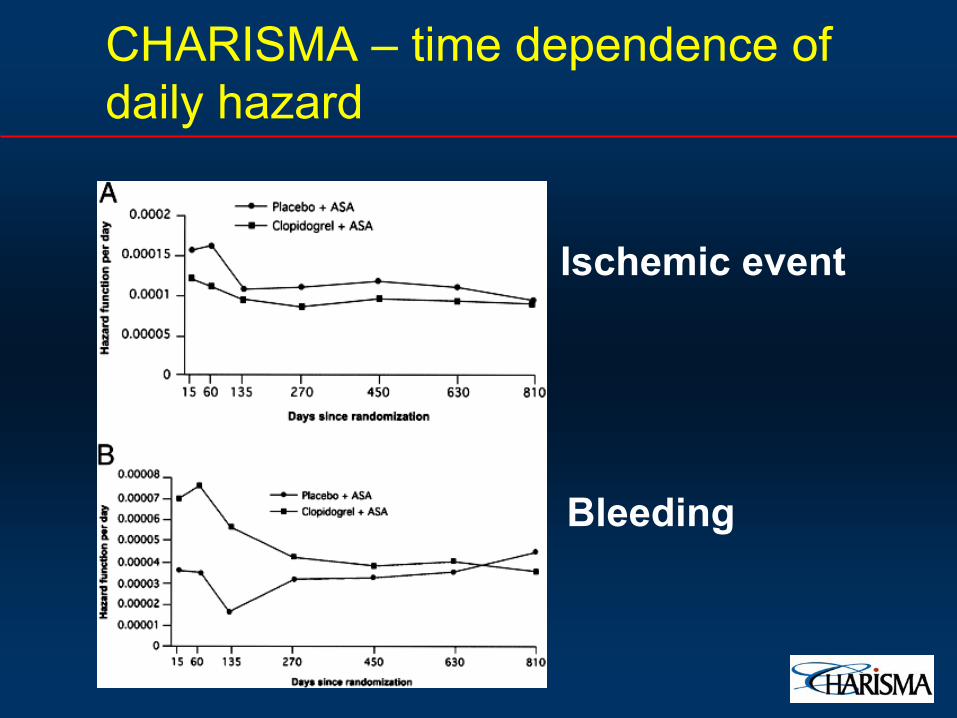
CHARISMA –
time dependence of daily hazard
Ischemic event
Bleeding

Recommendations for pharmacological therapy to improve prognosis
Class I
Aspirin
75
mg daily in all
patients without specific
contraindications (ie
active GI bleeding, aspirin allergy or previous aspirin intolerance) (level of evidence A)
Statin
therapy for all
patients with coronary disease (level of evidence A)
ACE-inhibitor
therapy in patients with coincident indications for ACE-inhibition, such as hypertension, heart failure, LV dysfunction, prior MI with LV dysfunction, or diabetes
(level of evidence A)
Oral beta blocker
therapy in patients post-MI or with heart failure
(level of evidence A)
ESC guidelines on the management of stable AP -
2006

Class IIa
ACE-inhibitor therapy in all
patients with angina and proven
coronary disease (level of evidence B)
Clopidogrel
as an alternative
antiplatelet
agent in patients with stable angina who cannot take aspirin eg
Aspirin
allergic
(level of evidence B)
High-dose statin
therapy in high risk
(>2% annual CV mortality) patients with proven coronary disease (level of evidence B)
Class IIb
Fibrate
therapy in patients with low HDL and high
triglycerides who have diabetes or the metabolic syndrome (level of evidence B)
Recommendations for pharmacological therapy to improve prognosis
ESC guidelines on the management of stable AP -
2006

pharmacological therapy to improve symptoms and/or reduce ischaemia
Beta Blockers
Nitrates–
Short, long acting
Ca Channel Blockers–
Dihydropyridines, Non-dihydropyridines
Others–
K channel opener -
Nicorandil
–
Sinus node inhibitor –
Ivabradine–
Metabolic modifiers –
Trimetazidine, Ranolazine

OUTLINEPathophysiology
–
Atherosclerosis–
Ischemia
Primary prevention –
who should be treatedTherapy
–
Lifestyle–
Pharmacology
–
Revascularization

COURAGE
Clinical Outcomes Utilizing
Revascularization and
Aggressive Guideline-Driven
Drug
Evaluation

PCI + Optimal Medical Therapy
will be Superior to
Optimal Medical Therapy Alone
Hypothesis

Optimal Medical Therapy
Pharmacologic•
Anti-platelet: aspirin; clopidogrel in accordance with established practice standards
•
Statin: simvastatin ±
ezetimibe or ER niacin•
ACE Inhibitor or ARB: lisinopril or losartan
•
Beta-blocker: long-acting metoprolol•
Calcium channel blocker: amlodipine
•
Nitrate: isosorbide 5-mononitrate Lifestyle
•
Smoking cessation•
Exercise program
•
Nutrition counseling•
Weight control
Applied to Both Arms by Protocol and Case-Managed
מציג
הערות מצגת
The medical therapy in the COURAGE Trial is aggressive and multifaceted and conforms to the most recent ACC/AHA Treatment Guidelines. It consists of an individualized lifestyle interventions: diet, weight loss, smoking cessation/relapse prevention, and regular exercise routine, as well as of the aggressive use of the following pharmacologic agents. A ll patients in both arms received : anti-thrombotic therapy with aspirin (or clopidogrel 75 mg/day, if aspirin allergy was present). Additionally, clopidogrel plus aspirin use evolved as an accepted standard for PCI management during the course of the study, including clopidogrel loading prior to (or during) PCI. Medical anti-ischemic therapy in both arms included long-acting metoprolol, amlodipine, and isosorbide 5-mononitrate, alone or in combination. Post-MI patients received standard secondary prevention with beta-blockers (unless contraindicated) and an lisinopril or, for those unable to take lisinopril, losartan for left ventricular ejection fraction <40% or anterior MI location. The centerpiece of medical therapy was aggressive LDL lowering with a target of 60-85 mg/dL (1.55-2.20 mmol/L) using up to 80 mg of simvastatin daily, alone or in combination with ezetimibe, in conformity with established. Patients with high-density lipoprotein-cholesterol <40 mg/dL (1.04 mmol/L) were treated with extended release niacin (Niaspan). Discussion: Drug-eluting stents were not approved for clinical use until very late during patient accrual and, subsequently, few patients received these intracoronary devices.

Risk Factor GoalsVariable GoalSmoking CessationTotal Dietary Fat / Saturated Fat <30% calories / <7% calories
Dietary Cholesterol <200 mg/dayLDL cholesterol (primary goal) 60-85 mg/dL
HDL cholesterol (secondary goal) >40 mg/dL
Triglyceride (secondary goal) <150 mg/dLPhysical Activity 30-45 min. moderate intensity 5X/week
Body Weight by Body Mass index Initial BMI
Weight Loss Goal25-27.5 BMI <25>27.5 10% relative weight
loss Blood Pressure <130/85 mmHg Diabetes HbAlc
<7.0%

Long-Term Improvement in Treatment Targets (Group Median ±
SE Data)
Treatment Targets Baseline 60 Months
PCI +OMT OMT PCI +OMT OMT
SBP 131 ±
0.77 130 ±
0.66 124 ±
0.81 122 ±
0.92
DBP 74 ±
0.33 74 ±
0.33 70 ±
0.81 70 ±
0.65Total Cholesterol mg/dL 172 ±
1.37 177 ±
1.41 143 ±
1.74 140 ±
1.64
LDL mg/dL 100 ±
1.17 102 ±
1.22 71 ±
1.33 72 ±
1.21
HDL mg/dL 39 ±
0.39 39 ±
0.37 41 ±
0.67 41 ±
0.75TG mg/dL 143 ±
2.96 149 ±
3.03 123 ±
4.13 131 ±
4.70
BMI Kg/M² 28.7 ±
0.18 28.9 ±
0.17 29.2 ±
0.34 29.5 ±
0.31
Moderate Activity (5x/week) 25% 25% 42% 36%

Survival Free of Death from Any Cause and Myocardial Infarction
Number at RiskMedical Therapy 1138 1017 959
834
638
408
192
3PCI
1149 1013 952
833
637
417
200
3
Years0 1 2 3 4 5 6
0.0
0.5
0.6
0.7
0.8
0.9
1.0
PCI +
OMT
Optimal Medical Therapy (OMT)
Hazard ratio: 1.0595% CI (0.87-1.27)P = 0.62
7

Nuclear Substudy
(n=314/2,287)Hypothesis:Hypothesis:
Reduction in Ischemia will be greater for patients Reduction in Ischemia will be greater for patients
randomized to PCI+OMT than for those randomized to OMTrandomized to PCI+OMT than for those randomized to OMT
Serial Rest/Stress Myocardial Perfusion SPECT (MPS) Serial Rest/Stress Myocardial Perfusion SPECT (MPS) To compare patient management strategy for ischemia reductionTo compare patient management strategy for ischemia reduction
PCI+OMTPCI+OMT (n=159)(n=159)OMTOMT
(n=155)(n=155)
Repeat MPS*Repeat MPS* at 6at 6--18 m18 m
Repeat MPS*Repeat MPS* at 6at 6--18 m18 m
Mean = 374Mean = 374±±50 days50 days
DocumentedDocumented PrePre--Rx IschemiaRx Ischemia•• PrePre--Rx = Off MedsRx = Off Meds
•• 66--18m = On Meds18m = On Meds
*Timing chosen *Timing chosen to occur to occur beyond window beyond window of inof in--stent stent restenosis & restenosis & delayed to delayed to allow effects of allow effects of medical Rx to medical Rx to be observedbe observed
Shaw et al: J Shaw et al: J NuclNucl
CardiolCardiol
2006; 2006; 13:68513:685--9898

% ischemic myocardium:% ischemic myocardium:(stress TPD(stress TPD--rest TPD)rest TPD)
< 5%: minimal (< 5%: minimal (““no ischemiano ischemia””))
5.0%5.0%--9.9%: mild9.9%: mild
10%: moderate10%: moderate--toto--severesevere
Significant reduction in ischemia:Significant reduction in ischemia:
5% reduction in ischemic myocardium*5% reduction in ischemic myocardium*
Quantification of extent and severity of ischemia by nuclear perfusion study:
total perfusion deficit (TPD)
Slomka et al. J Nucl Cardiol 2005;12:66-77
Defect extent
TPD Lower Nllimit
Defectseverity
*threshold exceeds test repeatability
מציג
הערות מצגת
WE QUANTITATIVELY MEASURED PERFUSION ISCHEMIA USING THE TOTAL PERFUSION DEFECT SCORE OR TPD. TPD, DEVELOPED AT CEDARS SINAI MEDICAL CENTER, IS A VALIDATED OBJECTIVE QUANTITATIVE MEASURE THAT COMBINES BOTH DEFECT EXTENT AND SEVERITY; AS IS ILLUSTRATED IN THE UPPER RIGHT OF THIS SLIDE. TPD SCORES ARE ASSIGNED FOR PIXELS THAT FALL BELOW NORMAL LIMITS. A SCORE OF 4 IS ASSIGNED BY COMPUTER TO A SEGMENT FOR PIXELS THAT ARE MORE THAN 70% BELOW THE NORMAL LIMITS. WHILE A SCORE OF 0 IS ASSIGNED FOR PIXELS THAT ARE ABOVE THE NORMAL LIMIT. THE % ISCHEMIC MYOCARDIUM IS CALCULATED BY SUBTRACTING THE STRESS TPD SCORE MINUS THE REST TPD SCORE. LESS THAN 5% OF THE MYOCARDIUM IS ISCHEMIC IS CONSIDERED MINIMAL TO NO ISCHEMIA. 5-9.9% MYOCARDIUM ISCHEMIC IS CONSIDERED IS CONSIDERED MILD ISCHEMIA. 10% OR MORE % MYOCARDIUM ISCHEMIC IS CONSIDERED MODERATE-TO-SEVERE ISCHEMIA. FOR THIS NUCLEAR SUBSTUDY, A SIGNIFICANT REDUCTION IN ISCHEMIA WAS DEFINED AS A REDUCTION IN THE % ISCHEMIC MYOCARDIUM ISCHEMIC OF 5% OR GREATER. THIS THRESHOLD WAS CHOSEN AS IT EXCEEDED TEST REPEATABILITY AS BASED ON PRIOR WORK FROM OUR GROUP.

PrePre--Rx TPD: 28%Rx TPD: 28%
12 m12 mPrePre--RxRx
12m TPD: 2%12m TPD: 2%
מציג
הערות מצגת
HERE IS AN ILLLUSTRATIVE CASE OF A COURAGE PATIENT ENROLLED IN THIS SUBSTUDY. TO ORIENT YOU, THE PRE-TREATMENT STRESS IMAGES ARE IN THE FIRST COLUMN WHILE THE 12 MONTH FOLLOW-UP IMAGES ARE IN THE 2ND COLUMN. A SEVERE AND EXTENSIVE PERFUSION DEFECT IS SEEN IN THE PRE-TREATMENT WITH NEAR COMPLETE RESOLUTION ON THE POST-TRETMENT STUDY. THE POLAR PLOTS FOR THE FIRST AND 2ND STUDIES ARE ALSO NOTED IN THE CENTER OF THIS SLIDE. THE STRESS TPD FOR THE BASELINE STUDY WAS 28% OF THE MYOCARDIUM WHILE THE 2ND STUDY FOLLOWING 12 MONTHS OF AGGRESSIVE MEDICAL INTERVENTION RESULTED IN A DRAMATIC DECLINE TO A TPD OF ONLY 2%..
0%
20%
40%
60%
80%
100%
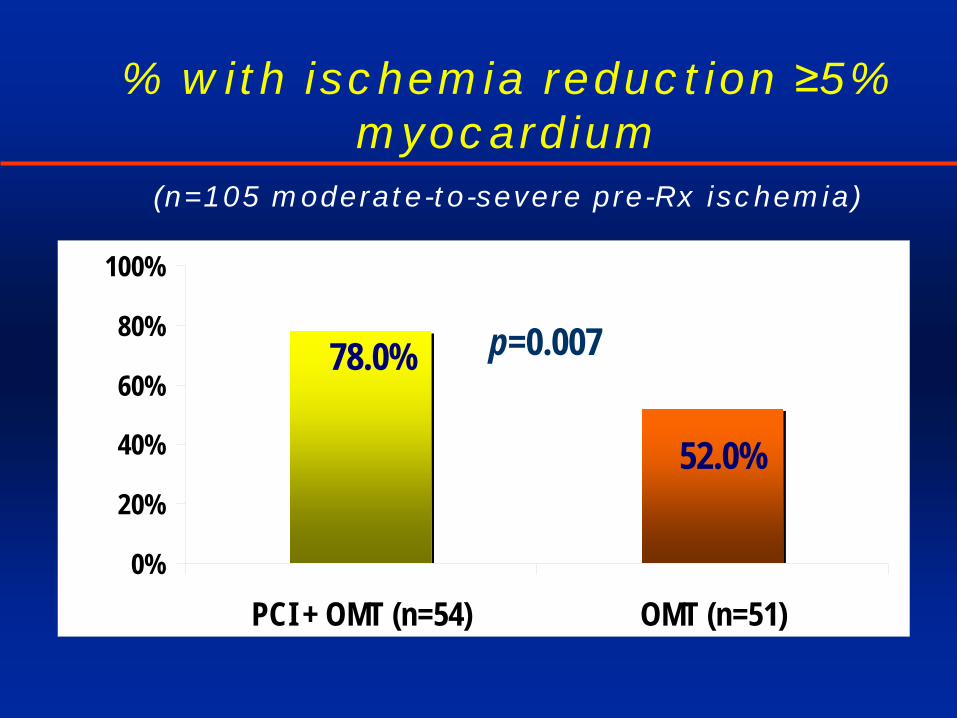
PCI + OMT (n=54) OMT (n=51)
52.0%
p=0.00778.0%
Ische
mia
redu
ctio
n ≥
5%
% with ischemia reduction ≥5% myocardium
(n=105 moderate-to-severe pre-Rx ischemia)

Rates of Death or MI by Residual IschemiaRates of Death or MI by Residual Ischemia
0
5
10
15
20
25
30
35
40
≥≥10% 10% (n=61)(n=61)
%%
COURAGE TrialCOURAGE Trial
0% 0% (n=22)(n=22) 1%1%--4.9% 4.9% (n=160)(n=160) 5%5%--9.9% 9.9% (n=94)(n=94)
P=0.063P=0.063
P=0.023P=0.023
P=0.002P=0.002
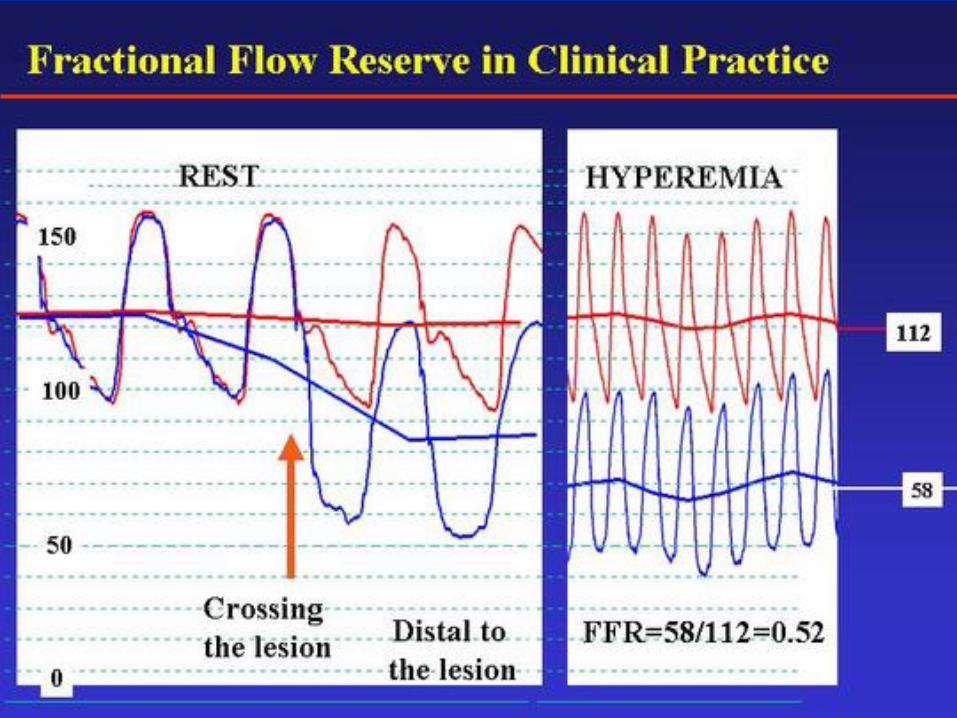

Diameter
Stenosis
versus FFR
20
30
40
50
60
70
80
90
FFR < 0.75FFR 0.75
DS
%
Diameter stenosis
is the main determinant of coronary stenosisHoweverResistance is also influenced by lesion length and the 3D morphology of the stenosis
Anatomical assessment is not accurate enough to determine physiological significanceCoronary angiography provides only the anatomical data

FAME study: FAME study: HYPOTHESISHYPOTHESIS
FFR FFR guided Percutaneous guided Percutaneous Coronary Intervention (PCI) Coronary Intervention (PCI)
in in multivessel diseasemultivessel disease, , is superior to current is superior to current
angiographyangiography guided PCIguided PCI
מציג
הערות מצגת
Consequently is was essential to test the The main hypothesis FFR guided PCI in MVD is superior to angiography guided PCI.

FAME FAME studystudy: : Baseline Baseline CharacteristicsCharacteristics (2)(2)
ANGIO-groupN=496
FFR-groupN=509 PP--valuevalue
# # indicatedindicated lesionslesions per per patientpatient 2.7±0.9 2.8±1.0 0.340.34
ReferenceReference
diameter diameter (mm)(mm) 2.5±0.6 2.5±0.7 0.810.81% stenosis % stenosis severityseverity 61±17 60±18 0.240.24
MLD (mm)MLD (mm) 1.0±0.4 1.0±0.5 0.350.35
5050--70% 70% narrowingnarrowing, , No (%)No (%) 550 (41) 624 (44) --7070--90% 90% narrowingnarrowing,,
No (%)No (%) 553 (41) 530 (37) --
9090--99% 99% narrowingnarrowing,,
No (%)No (%) 207 (15) 202(14) --Total Total occlusionocclusion, , No (%)No (%) 40 (3) 58 (4) --
Patients with Patients with ≥≥1 total occlusion 1 total occlusion (%)(%) 7.5 10.6 0.080.08

ANGIO-groupN=496
FFR-groupN=509 PP--valuevalue
# # indicatedindicated lesionslesions per per patientpatient 2.7 ±
0.9 2.8 ±
1.0 0.340.34
FFR FFR resultsresultsLesionsLesions
succesfullysuccesfully
measuredmeasured, , No (%)No (%) - 1329 (98%) --
LesionsLesions
withwith
FFR FFR ≤≤
0.80 ,0.80 ,No (%)No (%) - 874 (63%) --LesionsLesions
withwith
FFR > 0.80 ,FFR > 0.80 ,No (%)No (%) - 513 (37%) --
FAME FAME studystudy: : ProceduralProcedural ResultsResults (1)(1)

ANGIO-groupN=496
FFR-groupN=509 PP--valuevalue
# # indicatedindicated lesionslesions per per patientpatient 2.7 ±
0.9 2.8 ±
1.0 0.340.34
FFR FFR resultsresultsLesionsLesions
succesfullysuccesfully
measuredmeasured, , No (%)No (%) - 1329 (98%) --
LesionsLesions
withwith
FFR FFR ≤≤
0.80 ,0.80 ,No (%)No (%) - 874 (63%) --LesionsLesions
withwith
FFR > 0.80 ,FFR > 0.80 ,No (%)No (%) - 513 (37%) --
stentsstents per per patientpatient 2.7 ±
1.2 1.9 ±
1.3 <0.001<0.001
LesionsLesions
succesfullysuccesfully
stentedstented
(%)(%) 92% 94% --
DES, DES, totaltotal, , NoNo 1359 980 --
FAME FAME studystudy: : ProceduralProcedural ResultsResults (1)(1)

FFR-guided
30 days2.9% 90 days
3.8% 180 days4.9% 360 days
5.3%
Angio-guided
absolute difference
in MACE-free
survival
FAME FAME studystudy: : EventEvent--freefree Survival Survival

Impact of revascularization on outcome -
controversial
Anatomic obstruction with documented ischemic physiologyLong term outcome is better
with PCI
compared to OMTCOURAGE nuclear substudy, FAME
Anatomic obstruction without documented ischemic physiologyLong term outcome is worse
with PCI
compared to OMTDEFER, FAME

תודה רבה