TRAVIS COUNTY, · TRAVIS COUNTY, TEXAS 4. Statistical Section – Although this section contains...
260
0 N TRAVIS CouNTY, TEXAS
Transcript of TRAVIS COUNTY, · TRAVIS COUNTY, TEXAS 4. Statistical Section – Although this section contains...

0 N
TRAVIS CouNTY, TEXAS

Printed courtesy of the Travis County Print Shop
Cover layout by Randy York

TRAVIS COUNTY,
TEXAS
COMPREHENSIVE ANNUAL
FINANCIAL REPORT
FOR THE FISCAL YEAR ENDED
SEPTEMBER 30, 2013
Prepared by the Travis County Auditor’s Office
Nicki Riley, CPA County Auditor
700 Lavaca, Suite 1200 Austin, Texas 78701


TRAVIS COUNTY, TEXAS COMPREHENSIVE ANNUAL FINANCIAL REPORT Fiscal Year Ended September 30, 2013 TABLE OF CONTENTS PAGE
INTRODUCTORY SECTION (Unaudited)
County Auditor’s Letter of Transmittal .................................................................................... Intro-1 Organization Chart ................................................................................................................. Intro-15 Principal Officials .................................................................................................................... Intro-16
FINANCIAL SECTION
Independent Auditors’ Report ................................................................................................. FS-1 Management’s Discussion and Analysis (MD&A) (Unaudited) ............................................... FS-5 BASIC FINANCIAL STATEMENTS
Government-wide Financial Statements: Statement of Net Position ............................................................................................. BFS-5 Statement of Activities .................................................................................................. BFS-6
Fund Financial Statements:
Balance Sheet - Governmental Funds .......................................................................... BFS-10 Reconciliation of the Balance Sheet of Governmental Funds to the Statement of Net Position ............................................................................................................... BFS-13 Statement of Revenues, Expenditures, and Changes in Fund Balances - Governmental Funds ................................................................................................ BFS-14 Reconciliation of the Statement of Revenues, Expenditures, and Changes in Fund
Balances of Governmental Funds to the Statement of Activities ............................. BFS-17 Statement of Net Position - Proprietary Fund ............................................................... BFS-18 Statement of Revenues, Expenses, and Change in Net Position - Proprietary Fund .. BFS-19 Statement of Cash Flows - Proprietary Fund ................................................................ BFS-20 Statement of Fiduciary Assets and Liabilities - Agency Funds ..................................... BFS-21
Notes to the Financial Statements ...................................................................................... NT-3
REQUIRED SUPPLEMENTARY INFORMATION (Unaudited)
Schedule of Revenues, Expenditures, and Changes in Fund Balance - Budget and Actual - General Fund .............................................................................. RSI-3
Schedule of Funding Progress for Retirement Plan and Other Post-employment
Benefits Plan ................................................................................................................ RSI-4
iii

TRAVIS COUNTY, TEXAS COMPREHENSIVE ANNUAL FINANCIAL REPORT Fiscal Year Ended September 30, 2013 TABLE OF CONTENTS PAGE
OTHER SUPPLEMENTARY INFORMATION
Combining Statements - Governmental Funds:
Combining Balance Sheet - Non-major Governmental Funds .......................................... OSI- 6
Combining Statement of Revenues, Expenditures, and Changes in Fund Balances - Non-major Governmental Funds ................................................................................ OSI-16 Budgetary Comparison Schedules:
Schedule of Revenues, Expenditures, and Changes in Fund Balance - Budget and Actual - General Purpose Debt Service Fund ......................................................... OSI-29 Schedule of Revenues, Expenditures, and Changes in Fund Balances - Budget and Actual - Non-major Special Revenue Funds ............................................................. OSI-30 Schedule of Revenues, Expenditures, and Changes in Fund Balances - Budget and Actual - Non-major Capital Projects Funds ............................................................... OSI-49
Combining Statements – Proprietary Fund:
Combining Statement of Net Position - Internal Service Funds ......................................... OSI-53
Combining Statement of Revenues, Expenses, and Changes in Net Position - Internal Service Funds ................................................................................................ OSI-54
Combining Statement of Cash Flows - Internal Service Funds ........................................ OSI-55 Combining Statements - Fiduciary Funds:
Combining Statement of Assets and Liabilities - Agency Funds ....................................... OSI-60
Combining Statement of Changes in Assets and Liabilities - Agency Funds .................... OSI-64 Expenditures Budget and Actual Detail: Schedule of Expenditures by Function, Subfunction and Office/Department – Budget and Actual - General Fund ............................................................................ OSI-71
STATISTICAL SECTION (Unaudited)
FINANCIAL TRENDS Government-wide Information:
Schedule 1: Net Position by Component - Governmental Activities .............................. ST- 6
Schedule 2: Changes in Net Position - Governmental Activities ................................... ST- 8
Fund Information: Schedule 3: Fund Balances - Governmental Funds ..................................................... ST- 10
Schedule 4: Changes in Fund Balances - Governmental Funds ................................... ST-12
Schedule 5: Expenditures by Function - Governmental Funds ..................................... ST-14
iv

TRAVIS COUNTY, TEXAS COMPREHENSIVE ANNUAL FINANCIAL REPORT Fiscal Year Ended September 30, 2013 TABLE OF CONTENTS PAGE
STATISTICAL SECTION, continued (Unaudited)
REVENUE CAPACITY
Schedule 6: Assessed Value and Actual Value of Taxable Property ......................... ST-19
Schedule 7: Direct and Overlapping Property Tax Rates ........................................... ST-22
Schedule 8: Principal Property Tax Payers ............................................................... ST-28
Schedule 9: Property Tax Levies and Collections ...................................................... ST-30
Schedule 10: Property Tax Rates and Tax Levies ....................................................... ST-32
DEBT CAPACITY
Schedule 11: Ratio of Outstanding Debt by Type ........................................................ ST-36
Schedule 12: Ratio of Net General Bonded Debt Outstanding .................................... ST-38
Schedule 13: Schedule of Direct and Estimated Overlapping Debt ............................ ST-40
Schedule 14: Legal Debt Margin Information - Bonds Issued under Article 3, Section 52 of the Texas Constitution ....................................... ST-42
Schedule 15: Legal Debt Margin Information - Bonds and Certificates of Obligation Issued under Texas General Laws ....................................... ST-44
Schedule 16: Ratio of Annual Debt Service for General Bonded Debt to Total General Expenditures .................................................................... ST- 46
DEMOGRAPHIC AND ECONOMIC INFORMATION
Schedule 17: Demographic and Economic Statistics ................................................... ST-50
Schedule 18: Principal Employers ............................................................................... ST-52
OPERATING INFORMATION
Schedule 19: Full-time Equivalent County Government Employees by Function ......... ST-58
Schedule 20: Operating Indicators by Function/Program ............................................ ST-60
Schedule 21: Capital Asset Statistics by Function/Program ........................................ ST-62
v

vi

TRAVIS COUNTY, TEXAS INTRODUCTORY SECTION


TRAVIS COUNTY
AUDITOR’S OFFICE
NICKI RILEY, CPA COUNTY AUDITOR
TRAVIS COUNTY
ADMINISTRATION BUILDING 700 LAVACA SUITE 1200
P.O. BOX 1748 AUSTIN, TX 78767 (512) 854-9125
FAX: (512) 854-9164
February 21, 2014
Honorable District Judges of Travis County, Honorable Members of the Travis County Commissioners’ Court, and the Citizens of Travis County (County):
The County Auditor’s Office proudly submits the Comprehensive Annual Financial Report (CAFR) of Travis County, Texas for the fiscal year ended September 30, 2013. This report is submitted in compliance with Texas Local Government Code §114.025.
Responsibility for Financial Statements This report was prepared by the County Auditor's Office. Responsibility for both the accuracy of the presented data and the completeness and fairness of the presentation, including all disclosures, rests with the County. We believe the data, as presented, is accurate in all material aspects; that it is presented in a manner designed to fairly set forth the financial position and results of operations of the County as measured by the financial activity of its various funds; and that all disclosures necessary to enable the reader to gain a reasonable understanding of the County's financial affairs have been included.
The County Auditor serves as the Chief Financial Officer for Travis County. By statute, the Auditor reports to the State District Judges. This provides for an independent review of County financial operations separate from the Commissioners’ Court, the legislative and executive branch of county government. The County Auditor is responsible for accounting systems design, audit functions required by law, general control of finances, revenue estimation and certification, and ensuring that the County meets its fiduciary responsibilities to taxpayers with regard to County finances by strictly enforcing the statutes governing County finances as provided by the local government code. As an appointed official and a Certified Public Accountant, the County Auditor takes an oath to uphold the Constitution and the laws of the State of Texas.
Accounting System and Internal Controls In developing and evaluating the accounting system, consideration is given to the adequacy of internal accounting controls. Internal accounting controls are designed to provide reasonable, but not absolute, assurance regarding: (1) the reliability of financial reporting; (2) the effectiveness and efficiency of operations; and (3) compliance with applicable laws and regulations. The concept of reasonable assurance recognizes that: (1) the cost of a control should not exceed the benefits likely to be derived; and (2) the evaluation of costs and benefits requires estimates and judgments by management.
All internal control evaluations occur within the above framework. We believe that the County’s internal accounting controls adequately safeguard assets and provide reasonable assurance of proper recording of financial transactions.
Intro - 1

TRAVIS COUNTY, TEXAS
Independent Audit In compliance with Texas Local Government Code §115.045, the financial statements and notes contained in this report have been audited by the independent auditors of Atchley & Associates, LLP. The Independent Auditors’ Report is included in the Financial Section of this report. This firm was also engaged to perform an audit of the County's federal and state awards that was designed to meet the requirements of the Federal Single Audit Act and related Office of Management and Budget Circular A-133. The audit reports on federal and state awards are issued separately.
Reporting Standards The accompanying financial statements have been prepared in conformity with generally accepted accounting principles (GAAP) in the United States of America as applied to governmental units. The Governmental Accounting Standards Board (GASB) is the accepted primary standard-setting body for establishing governmental accounting and financial reporting principles.
GAAP requires that management provide a narrative introduction, overview, and analysis to accompany the basic financial statements in the form of a Management’s Discussion and Analysis (MD&A). The letter of transmittal is designed to complement the MD&A and should be read in conjunction with it. The MD&A can be found in the Financial Section of this report.
Financial Statement Format This Comprehensive Annual Financial Report is presented according to the reporting model established by GASB Statement No. 34, Basic Financial Statements – and Management’s Discussion and Analysis – for State and Local Governments and related statements. The report, including all funds of Travis County and its component units, is divided into four sections:
1. Introductory Section – This section includes the letter of transmittal, organizational chart, and list of principal officials.
2. Financial Section – The financial section includes the Independent Auditors’ Report, Management’s Discussion and Analysis, the Basic Financial Statements, and Required Supplementary Information.
a. Basic Financial Statements – This section includes government-wide and fund financial statements as well as the notes to the financial statements. The notes are considered essential to the fair presentation and adequate disclosure for this financial report. They include the Summary of Significant Accounting Policies for the County and other necessary disclosures of important matters relating to the financial position of the County. The notes are treated as an integral part of the financial statements and should be read in conjunction with them.
b. Required Supplementary Information (RSI) – This section is comprised of budgetary comparison schedules for the General Fund and any major special revenue fund with a legally adopted budget. This section also includes schedules related to pension and other post-employment benefits. Both of these schedules are included in the notes to the financial statements.
3. Other Supplementary Information – This section includes a variety of schedules to assist users in analyzing the basic financial statements. This section may include, but is not limited to, combining statements, individual fund statements, and schedules focusing on major funds. The County includes combining statements for non-major funds, proprietary funds, and fiduciary funds, as well as other budgetary comparison schedules.
Intro - 2

TRAVIS COUNTY, TEXAS
4. Statistical Section – Although this section contains substantial financial information, these schedules differ from financial statements in that they present some non-financial data, cover more than the current fiscal year, and are designed to reflect demographic and economic data, operating information, financial trends, and the fiscal capacity of the County.
PROFILE OF TRAVIS COUNTY
Geographic Information Travis County, a corporate body and a political subdivision of the State of Texas, was created from Bastrop County in 1840 and organized in 1843. Located in central Texas on the edge of the "Hill Country", the County is approximately 200 miles south of the Fort Worth/Dallas area, 160 miles west of Houston, and 80 miles northeast of San Antonio. The County encompasses 1,022.1 square miles of which 989.3 square miles (96.8%) is land and 32.8 square miles (3.2%) is water area. The water area comes from the Colorado River, which runs northwest to southeast through the County, and Lake Austin and Lake Travis, parts of the Highland Lakes chain.
The mild climate reflects the County's fortunate location. The mean temperature is 68.6 degrees, with the days almost evenly divided among clear, partly cloudy, and cloudy. The growing season averages 270 days long, with the last freeze of the winter coming in early March and the first of the next autumn coming normally around Thanksgiving. Average rainfall is 31.9 inches.
The 2013 population of Travis County is estimated to be 1,108,403, an increase of 32,284 people (3.0%) over the 2012 estimated population. The principal city in the County is Austin, the County Seat and State Capital. The estimated 2013 population for Austin, including Full and Limited Purpose Areas, is 842,750 or 76.0% of the total for the County.
Governmental Structure The governing body of the County is the Commissioners’ Court, comprised of the County Judge (who is elected at-large and serves as the presiding officer) and four Commissioners, each of whom is elected for a four-year term (unless filling a predecessor’s unexpired term) from one of the County's four precincts. The Commissioners’ Court has powers expressly granted by the State Legislature. These powers are reflected in the following County functions:
General Government – This category includes budgets for the County Judge and County Commissioners, administrative, financial, and physical support for the County's "line" offices/departments, the Tax Office, Risk Management, the Employee Health Benefit Fund, Civil Service Commission, Election Administration, and certain recording duties of the County Clerk.
Justice System – Activities in this category are associated with the judicial responsibilities of the County. It includes the costs for the County's court systems (Civil Courts and Criminal Courts, which include indigent attorney fees, Probate Court, Juvenile Court, and the Justice of the Peace Courts) and associated offices/departments or parts thereof: District Clerk, County Clerk, District Attorney, County Attorney, the Dispute Resolution Center, Criminal Justice Planning, and the Law Library.
Intro - 3

TRAVIS COUNTY, TEXAS
Public Safety – Public Safety includes activities associated with the protection of persons and property within the County including direct enforcement of State statutes. Offices/departments included in this category are the Constables (serve warrants and other court papers), the Medical Examiner, and divisions of the Sheriff's Office dedicated to law enforcement and public safety. Also included are Emergency Services, Fire Marshall, and Criminal Justice Planning, which provide services for the Combined Transportation, Emergency and Communications Center (911 Call Center).
Corrections and Rehabilitation – This category includes activities associated with confinement, probation, counseling, and other related programs available for adult offenders. The Sheriff is in charge of the County jail and County corrections center. Also under this classification are the Community Supervision and Corrections Department (adult probation), Pretrial Services, and the Counseling and Educational Services Department, which was created to counsel and correct the behavior of offenders.
Health and Human Services – Activities designed to provide healthcare related services to those in need and promote the conservation and improvement of public health are included in this category. The County provides public assistance (assistance with food, rent, and utility expenses) through its Health and Human Services Department to eligible indigents, including military veterans. This category also includes the Agriculture Extension Service and the Emergency Medical Services Department, which is comprised of StarFlight and ground ambulance services.
Infrastructure and Environmental Services – Activities in this category are associated with the development and maintenance of the County's transportation systems, subdivision platting and review, conservation and development of natural resources, and activities associated with providing sanitation services within the County through the Transportation and Natural Resources Department.
Community and Economic Development – Included in this category are activities for providing economic development in the County and cultural, recreational, and educational activities for the benefit of County residents and visitors. Specifically, the County owns and operates the Travis County Exposition Center and, in conjunction with the State of Texas, operates the Travis County Historical Commission. In addition, the County operates 56 parks that are either owned or maintained by the County. These parks, which vary from lakes and hills to rivers and prairies, provide facilities for picnics, hiking, camping, swimming, boating, soccer, baseball, and equestrian activities.
Blended Component Units The Travis County Commissioners’ Court serves as the governing body for the below-mentioned separate entities. Therefore, in accordance with GASB Standards, these are presented as blended component units. For more information, refer to Note 1 of the Notes to the Financial Statements.
The Road Districts – Northwest Travis County Road District No. 3 (NWTCRD No. 3) contains approximately 242 acres. NWTCRD No. 3 is ad valorem tax supported for repayment of debt. Southwest Travis County Road District No. 1 (SWTCRD No. 1) contains approximately 7,015 acres. Except for $10,000 of unredeemed coupon bonds from the original 1985 issuance, all debt of SWTCRD No. 1 has been defeased, redeemed or matured. Travis County Bee Cave Road District No. 1 (TCBCRD No. 1) encompasses 141 acres in western Travis County, wholly within the corporate limits of the Village of Bee Cave, Texas. TCBCRD No. 1 is ad valorem tax supported for the repayment of debt. The road districts act as agents for property owners in collecting assessments, forwarding collections to the bondholders, and initiating foreclosure
Intro - 4

TRAVIS COUNTY, TEXAS
proceedings, if appropriate. The debt of the road districts is not a debt or obligation of the County, nor will the County be liable for payment thereof. The Travis County Commissioners’ Court is the statutory governing body of the road districts.
The Corporations – The Capital Health Facilities Development Corporation, Travis County Housing Finance Corporation, Travis County Health Facilities Development Corporation, Capital Industrial Development Corporation, Travis County Development Authority, and Travis County Cultural Education Facilities Finance Corporation have been established by the County under provisions of the Development Corporation Act of 1979 of the State of Texas, the Health Facilities Development Act, the Texas Housing Finance Corporation Act, the Texas Transportation Code, and the Cultural Education Facilities Finance Corporation Act. Through these Corporations, eligible applicants are furnished financial assistance through the sale of tax-free bonds. Such debt is issued by the Corporations as “conduit or no-commitment debt” for the benefit of private third parties for purposes of public interest without the obligation of the Corporations or the County for repayment. The Travis County Commissioners’ Court is the Board of Directors for each corporation.
Budget Process The annual budget serves as the foundation for Travis County’s financial planning and control. Activities of the General Fund, certain special revenue and capital projects funds, internal service funds, and the General Purpose Debt Service Fund are included in the appropriated budget. The budget is prepared by fund, office/department, and account. The level of budgetary control (that is the level at which expenditures cannot legally exceed the appropriated amount) is set by state statute and is at the office/department level. The County’s elected/appointed officials, executive managers, and department heads may make transfers of appropriations within an office/department as specified in the Commissioners’ Court-approved annual budget rules. Transfers between departments, as specified in the budget rules, require prior approval of the Commissioners’ Court.
The County maintains an encumbrance accounting system as a method to accomplish budgetary control. The County Auditor monitors expenditures of the various offices/ departments to prevent expenditures from exceeding budgeted appropriations and sends a monthly budget report to the Commissioners’ Court. The County Auditor also monitors the revenues received for budget compliance. Purchase orders and contracts are not valid until the County Auditor certifies that money is available to make payment. During fiscal year 2013 there were no offices/departments or any individual funds for which the expenditures exceeded budgeted appropriations.
Year-end encumbrances are added to the following year’s adopted budget. For all budgeted funds, appropriations that are not encumbered lapse at the end of the fiscal year. Budget to actual comparison schedules are provided in this report for all governmental funds for which the appropriated annual budget has been adopted. The General Fund schedule is in the Required Supplementary Information section, while all other budgetary comparison schedules are included in the Other Supplementary Information section. A separate report is generated that demonstrates budgetary compliance at the office/department level for all funds and is available to the public upon request.
Intro - 5

TRAVIS COUNTY, TEXAS
ECONOMIC CONDITION AND OUTLOOK
Local Economy The Travis County business sector continued to grow steadily in fiscal year 2013. According to the US Bureau of Economic Analysis, the City of Austin’s economy grew at one of the fastest rates in the country. Employment for County residents rose during the year to a September total of 575,116, while the County’s unemployment rate held steady at 5.3% for the end of fiscal year 2013, which is still under the national average.
Below are just a few publications that mentioned Travis County and the City of Austin during fiscal year 2013:
• Forbes Magazine ranked Austin as one of the best cities for good jobs.
• Bloomberg ranked the Austin-Round Rock metropolitan area as the number one “boomtown.”
• MSN.com ranked Austin in the top ten “great cities that support excellent public schools.”
• Trulia.com ranked Austin as the fifth healthiest housing market.
• Ziprealty.com ranked Austin as the seventh most affordable housing market.
• The Business Journals’ On Numbers ranked Austin number one in the national economic rankings and among the best places for young adults to live and work.
For many years, Travis County was known largely for two things, state government and the University of Texas, but over the past five years, the private sector has grown 11.18%. Now, the high-tech industry has become a large part of the Travis County economic scene, and this diversification has made this area an attractive place to do business. Dell, IBM, Freescale Semiconductor, Advanced Micro Devices, Apple, Applied Materials, National Instruments and Samsung are all major employers in the Travis County area. In 2012, Apple announced plans to expand their Austin operations over the next ten years. This expansion would add approximately 3,600 new positions, making Apple one of the top ten employers in Travis County.
The Austin area has a lively and diverse leisure industry, which includes the Texas Stars, the top affiliate of the National Hockey League’s Dallas Stars. Also here are University of Texas sports teams, the Austin Toros of the NBA Developmental League, and Triple-A baseball. Austin has long been called the “Live Music Capital of the World” in part due to the South by Southwest Music Festival held annually in the spring and the Austin City Limits Festival held annually in the fall. In addition, Austin also boasts many live music venues, a number of which are located in the famous downtown East Sixth Street Entertainment District. In 2012, Circuit of the Americas, the first Grand Prix race facility in the United States, was completed in southeastern Travis County. The first Formula 1 United States Grand Prix race was held there in November of 2012.
Intro - 6

TRAVIS COUNTY, TEXAS
The Assessed Property Valuation rose in fiscal year 2013 with a 4.7% increase compared to fiscal year 2012.
The chart below shows the changes in assessed property valuation over the last ten years.
Sales tax receipts for the City of Austin for fiscal year 2013 totaled $165.8 million, a 6.9% increase compared to the previous year. Austin’s gross retail sales for the first three quarters of fiscal year 2013 reached $12.0 billion, a 10.2% increase over the same period in fiscal year 2012.
0
20
40
60
80
100
120
2004 2005 2006 2007 2008 2009 2010 2011 2012 2013
Billi
ons
of D
olla
rs
Fiscal Years
Travis County Assessed Property Valuation
0.00
2.00
4.00
6.00
8.00
10.00
12.00
14.00
2004 2005 2006 2007 2008 2009 2010 2011 2012 2013
Billi
ons o
f Dol
lars
Fiscal Years
Austin Gross Retail Sales First Three Quarters
Intro - 7

TRAVIS COUNTY, TEXAS
The housing market in the Austin area strengthened at an increased pace after rebounding more modestly over the past several years. For the County’s fiscal year ended September 30, 2013, units sold totaled 29,788; that figure constitutes a 22.6% increase compared to fiscal year 2012. Along those same lines, the average selling price increased 8.8% from September 2012 to September 2013. County-issued site development permits in fiscal year 2013 for construction in the rural parts of Travis County increased 20.5% from the previous year.
The graph below shows the changes in County-issued site development permits over the past ten years.
In fiscal year 2013, Travis County maintained its Reserve Ratio of 11%, and this level of reserve has been maintained without fail since fiscal year 1996.
The Commissioners’ Court set the property tax rate at $0.5001, an increase of $0.0128 above the effective tax rate, to provide funds for general operations and debt service for fiscal year 2013.
Significant budget initiatives in fiscal year 2013 included:
• Addition of approximately 20 new full-time positions with associated costs in the Sheriff’s Office for law enforcement, communications, training, and corrections staffing purposes.
• Additional funding for civil and criminal indigent attorney fees.
• Funding for pilot programs related to pretrial services, Sheriff’s Office psychologist services, and the counterfeit motor vehicle inspection program.
0
1000
2000
3000
4000
5000
6000
2004 2005 2006 2007 2008 2009 2010 2011 2012 2013
No.
of P
erm
its
Fiscal Years
County-Issued Development Permits
Intro - 8

TRAVIS COUNTY, TEXAS
The Commissioners’ Court authorized three issuances of new debt in fiscal year 2013:
General Obligation Bonds:
Unlimited Tax Road Bonds, Series 2013 33,220,000$ (for local roads, drainage, bridges, and right-of-way)
Limited Tax Permanent Improvement Bonds, Series 2013 10,755,000$ (for parks)
Certificates of Obligation (Limited Tax, Series 2013):
In addition to the general obligation bonds, the County also issued $21,025,000 in Limited Tax Certificates of Obligation. The proceeds of the tax-exempt certificates of obligation, including a premium of $1,532,762, are to be used for a firefighting aircraft, building construction and improvements (mainly for the Ned Granger and Executive Office Buildings), road and bridge projects, upgraded software and computer equipment, and other authorized capital project needs for the County. The tax-exempt certificates of obligation bear an interest rate ranging from 3.00 percent to 3.375 percent and mature in varying amounts in each year from 2014 to 2018.
Long-Term Financial Planning It has been the long-standing intention of the Commissioners’ Court to maintain a sound financial footing, preserve the 11% reserve ratio, and maintain the County’s AAA bond rating. It was these accumulated resources that allowed the County to avoid disruptions in services during the years when the local economy took a downturn. In order to ensure that the fiscal year 2014 budget kept these goals in focus, the Commissioners’ Court issued the Fiscal Year 2014 Planning and Budget Manual in early 2013. In this document the Commissioners’ Court called for offices and departments in Travis County to stress long-term initiatives in the areas of: (1) providing law enforcement and justice support to Travis County residents, (2) addressing various socials ills (such as child abuse, truancy, domestic violence, and poverty), (3) ensuring appropriate funds for emergency functions (medical, fire and public safety), and (4) maintaining the County’s infrastructure.
Budgeted revenues (including other financing sources), available balances, and budgeted expenditures (including other financing uses) for fiscal year 2014 are summarized as follows:
General Debt Service OtherBudgeted Fund Fund Funds
Revenues and Available Balances 625,958,053$ 96,948,783$ 149,484,584$ Less Expenditures and Other Financing Uses 514,766,688 80,822,786 97,768,118
Ending Fund Balance 111,191,365$ 16,125,997$ 51,716,466$ Capital Project Funds are budgeted based on Certificates of Obligation and General Obligation Bond indenture provisions. At the end of fiscal year 2013, actual fund balances were carried over into the new year, and the Planning and Budget Office included a not-to-exceed number of $250 million in its Recapitulation of the Fiscal Year 2014 Adopted Budget.
Included in these figures is $15,287,057 in transfers among the funds, of which $207,713 is a transfer to the General Fund from non-budgetary funds and $11,958,661 is a transfer from the
Intro - 9

TRAVIS COUNTY, TEXAS
General Fund to the Balcones Canyonlands Preservation Fund. Other funds’ budgeted expenditures (including transfers out) consisted of $16,579,580 in the Road and Bridge Fund and $81,188,538 in various other funds.
In addition, a portion of the ending fund balances is budgeted as Allocated Reserves, meaning that expenditure of these reserves is possible with the approval of the Commissioners’ Court: $43,105,767 in the General Fund, and $51,716,466 in other funds, of which $27,415,823 is in the Internal Service Funds.
For fiscal year 2014, the certified taxable property value available at the time of budget approval was $107.1 billion or 5.7% more than the certified value available for the fiscal year 2013 budget process.
RELEVANT FINANCIAL POLICIES
Long-Term Debt Neither Travis County nor any road district has ever defaulted on the payment of principal or interest on its bonds or certificates of obligation. The County has a bond rating of “AAA” from Standard and Poor’s and “Aaa” from Moody's Investor Service, Inc.
In compliance with requirements of each bond order, the General Purpose Debt Service Fund is maintained to provide available funds to meet all obligations during the year. A separate tax levy is set each year for this purpose.
Debt Policy The purpose of this policy is to provide guidelines for the Commissioners’ Court in deciding whether to issue additional debt and to attempt to keep the debt issuance of the County within established limits.
General Approach to Debt:
Travis County will maintain a prudent approach to the issuance of debt that includes the following:
• Travis County will ensure that necessary services are provided in this community in a timely and sufficient manner using current revenues.
• Travis County will ensure that necessary equipment and facilities are provided to County departments in a timely manner using the most frugal method of payment available for such expenditures.
• Routine purchase and replacement of capital equipment, such as computer equipment, furniture, and "down payments" on larger capital projects will be financed through the Capital Acquisition Resources account from current operating revenues. This account will be gradually adjusted as existing funds become available and as economic circumstances allow, to reduce or eliminate the need for issuing debt or entering into any other financing arrangement for recurring operating equipment purchases.
• Sale of bonds or certificates of obligation will follow general market conventions assuring the best interest rate deemed possible at the time, as determined by the Commissioners’ Court, based upon advice from the County's financial advisor.
Intro - 10

TRAVIS COUNTY, TEXAS
The Travis County Commissioners’ Court will not issue long-term debt (with a repayment period in excess of five years) without the approval of such bond issue by the voters at an election, except under the following circumstances:
• The expenditure is legally required of the County, where penalties or fines could be imposed on the County if the expenditure is not made; or
• When a financial analysis demonstrates that during a stipulated term Travis County would spend significantly less; or
• The voters have previously approved the issuance of general obligation bonds but, for valid reasons, certificates of obligation must be substituted for such bonds in order to carry out the voters' authorization; or
• When the expense is for necessary planning services or acquiring options for a future capital project that will be submitted to the voters.
Capital expenditures, particularly those involving the issuance of debt, will be approved only in the context of multi-year planning by the County.
Process to Determine Needs:
• Expenditures for capital improvements and equipment will be requested, justified and approved, specifying the recommended method of finance for such expenditures as part of the annual County budget process, prior to budget adoption.
• Each year as part of the budget process, the Planning and Budget Office will prepare a debt report analyzing all recommended expenditures which are proposed to be financed with debt. The report will explain the impact the proposed new debt will have on the County's debt service tax rate and an analysis of such impact on the average county taxpayer, and the impact of the issuance of the proposed County debt in light of the general obligation debt of other taxing entities in Travis County (schools, cities, special districts).
• Building renovation or construction projects will be reviewed and assessed by the Facilities Management Department prior to consideration by the Commissioners’ Court.
• The Transportation and Natural Resources Department will review and assess any project which includes roads, drainage or parks prior to consideration by the Commissioners’ Court.
• The Commissioners’ Court will decide which projects will be undertaken, the timing of those projects, and the source of funding to be provided for accomplishment of those projects.
Debt Policies:
• A debt service reserve of at least 10% of total debt service requirements for the current fiscal year will be maintained to ensure availability of funds to meet the debt service payments in the event of tax revenue shortfalls.
• The term of any debt should not exceed 20 years, and should never exceed the useful life of the asset or the weighted average useful life of a group of assets when multiple assets are funded in a single issuance.
Intro - 11

TRAVIS COUNTY, TEXAS
• Except in the case of revenue producing facilities, debt will not be issued for the purpose of making debt service interest payments. If interest capitalization becomes necessary, it will only be used for three years or the period of the construction phase, whichever is the shorter period.
• Delays in repayment of principal will be part of the debt structure only if in a particular circumstance such delay is seen to be in the County's best financial interest.
• Interest earnings on bonds and certificates of obligation that have been sold will be retained in the project until that project is completed unless the Commissioners’ Court has instructed otherwise in a debt covenant or Official Statement. Funds unneeded for the project after its completion will be either transferred to the Interest and Sinking Fund in order to mitigate the need to increase the debt service tax rate or may be used for projects of a similar nature as allowed by law. Excess funds will not be allowed to increase the scope of the original project without additional justification and analysis.
• Optional debt redemption shall be provided for, based upon the advice of the County's financial advisor.
• Travis County will maintain a ratio of annual short-term (five years or less at time of issuance) debt service payments to total debt service of 25% or less, and short-term debt service payments to total General Fund expenditures of 5% or less.
• Guidelines in the form of industry-standard ratios will be reviewed in conjunction with each debt issuance in order to provide a framework within which to view overall Travis County debt.
Those guideline ratios include:
1. Net debt to taxable value should not exceed the range of 1.0%-1.5%.
2. Net debt to population should not exceed $800 per capita.
3. Debt service to total expenditures (operating expenditures and debt service combined) shall be approximately 20% or less.
4. A total debt target of 5% of taxable value for all overlapping debt in Travis County (county, city, school district and other) will be established, in concert with cooperative efforts toward sharing this goal with the other debt-issuing entities.
Intro - 12

TRAVIS COUNTY, TEXAS
The debt analysis below will also show the anticipated net debt per taxable value and the net debt per capita.
Debt Policy September 30, September 30,Guidelines 2013 2012
Debt service reserve percentage of totalgeneral purpose debt service requirements 10% or > 23.16% 18.67%
Net debt to assessed valuation 1.0% - 1.5% 0.48% 0.51%
Net debt per capita $800 or < $554.85 $582.89
General purpose debt service expenditures tototal general fund plus general purpose debt service expenditures 20% or < 14.00% 14.76%
Short-term debt service expenditures(1) to totalgeneral purpose debt service expenditures 25% or < 20.27% 16.59%
Short-term debt service expenditures(1) to totalgeneral fund expenditures 5% or < 3.30% 2.87%
Note: Excludes blended component units(1) Five years or less at time of issuance.
HEALTHCARE BENEFITS FOR RETIRED EMPLOYEES
In June 2004, the Governmental Accounting Standards Board (GASB) issued Statement No. 45, Accounting and Financial Reporting by Employers for Postemployment Benefits Other Than Pensions (GASB 45), creating accounting standards for OPEB provided by governmental entities separate from a pension plan. GASB 45 defines an OPEB liability to include amounts the governing body has not yet authorized for employees, and for which there is no legally enforceable liability. Measurement of the OPEB liability involves the use of assumptions and estimates that are difficult to predict and are subject to extreme volatility. As a result, the County did not implement GASB 45 during fiscal years 2008 through 2012 and the Statutory Basis of accounting was followed during those years, which is an other comprehensive basis of accounting provided, but not mandated, by Chapter 2266 of the Texas Government Code.
In an effort to increase transparency and once again report in accordance with GAAP, the County chose to implement GASB 45 during fiscal year 2013. Accordingly, information and amounts presented in the County’s CAFR relative to OPEB expenses, related liabilities, note disclosures, and supplementary information are only intended to achieve compliance with the requirements of GAAP and do not constitute nor imply that the County has made a commitment or is legally obligated to provide OPEB benefits. While GASB 45 requires governments to record an estimate of a rather volatile and unsubstantiated liability on the government-wide financial statements, there is no requirement to fund this liability. The County continues to manage retiree health benefit obligations on a “pay-as-you-go” basis, identical to the method used by most local governments.
For additional information regarding the County’s healthcare plan for retired employees, please see Note 12 of the Notes to the Financial Statements and the Required Supplementary Information Section.
Intro - 13

TRAVIS COUNTY, TEXAS
ACKNOWLEDGMENTS
The preparation of this report could not have been accomplished without the dedicated services of the staff of the County Auditor's Office. I wish to express my deep appreciation to all the members of this office who contributed to its preparation. We want to express our appreciation and thanks to the members of the Commissioners’ Court, their staff and all other County officials and employees who have given their support in planning and conducting the financial operations of Travis County in a responsible manner. Respectfully submitted, Nicki Riley, CPA County Auditor
Intro - 14

TRA
VIS
CO
UN
TY V
OTE
RS
DIS
TRIC
T A
TTO
RN
EY
DIS
TRIC
T C
LER
K
CO
UN
TY A
TTO
RN
EY
CO
NST
AB
LES
CO
UR
T-A
T-LA
WJU
DG
ES
PRO
BA
TE J
UD
GE
JUST
ICES
OF
THE
PEA
CE
SHER
IFF
CR
IMIN
AL
DIS
TRIC
T JU
DG
ESC
IVIL
D
ISTR
ICT
JUD
GES
CO
MM
UN
ITY
SU
PER
VIS
ION
&
CO
RR
ECTI
ON
S
Pre
-Tria
l S
ervi
ces
CO
MM
ISSI
ON
ERS
CO
UR
T
TAX
ASS
ESSO
R-
CO
LLEC
TOR
TREA
SUR
ER
CO
UN
TY C
LER
K
PUR
CH
ASI
NG
BO
AR
D
PUR
CH
ASI
NG
AG
ENT
Nic
ki R
iley
JUS
TIC
E &
PU
BLIC
SA
FETY
–Su
ppor
t Se
rvic
es
JUVE
NIL
E P
RO
BAT
ION
Dom
estic
R
elat
ions
TRA
VIS
CO
UN
TY
CO
MM
ISSI
ON
ERS
1. R
on D
avis
2. B
ruce
Tod
d3.
Ger
ald
Dau
gher
ty4.
Mar
gare
t Gom
ez
CO
UN
TY J
UD
GE
Sam
Bis
coe
(2) C
ount
y C
omm
issi
oner
s(3
) Dis
trict
Ju
dges
JUVE
NIL
E B
OA
RD
Dis
trict
Ju
dges
Cou
nty
Judg
e
HE
ALTH
, HU
MAN
SER
VIC
ES &
VET
ERAN
S SV
CS
TRAN
SP.,
NAT
UR
AL R
ESO
UR
CES
& F
AC
ILIT
IES
PLA
NN
ING
& B
UD
GET
ADM
INIS
TRAT
IVE
OPE
RAT
ION
S
Ros
emar
y Le
hmbe
rg
Amal
ia
Rod
rigue
z-M
endo
za
Dav
id E
scam
illa
Gre
g H
amilt
on
1. D
anny
Tho
mas
2. A
dan
Balle
ster
os3.
Sal
ly H
erna
ndez
4. M
aria
Can
chol
a5.
Car
los
Lope
z
1. D
avid
Phi
llips
2. E
ric S
hepp
erd
3. J
ohn
Lips
com
be4.
Mik
e D
ento
n 5.
Nan
cy H
ohen
garte
n6.
Bra
ndy
Mue
ller
7. E
lisab
eth
Earle
8. C
arlo
s Ba
rrera
Guy
Her
man
1. Y
vonn
e M
. Will
iam
s2.
Gle
nn B
ass
3. S
usan
Ste
eg4.
Rau
l Gon
zale
z5.
Her
b Ev
ans
147t
h C
liff B
row
n16
7th
Dav
id W
ahlb
erg
299t
h K
aren
Sag
e33
1st
Dav
id C
rain
390t
h J
ulie
Koc
urek
403r
d B
rend
a Ke
nned
y42
7th
Jim
Cor
onad
o
53rd
Sco
tt H
. Jen
kins
98th
Rho
nda
Hur
ley
126t
h D
arle
ne B
yrne
200t
h G
isel
a D
. Tria
na20
1st
Amy
Cla
rk M
each
um25
0th
Joh
n K.
Die
tz26
1st
Lora
J. L
ivin
gsto
n34
5th
Ste
phen
Yel
enos
ky35
3rd
Tim
Sul
ak41
9th
Orli
nda
Nar
anjo
Bruc
e El
fant
Dol
ores
Orte
ga-C
arte
r
Dan
a D
eBea
uvoi
r
Inde
pend
ently
Ele
cted
/App
oint
ed
Offi
cial
s w
ith s
tatu
tory
dut
ies
CO
UN
TY A
UD
ITO
R
Cyd
Grim
es
Dep
artm
ents
Rep
ortin
g to
Com
mis
sion
ers'
Cou
rt
Hea
lth &
Hum
an S
ervi
ces
Vet
eran
s S
ervi
ces
Texa
s C
oope
rativ
e E
xten
sion
Crim
inal
Jus
tice
Pla
nnin
gC
ouns
elin
g &
Edu
catio
n S
ervi
ces
Juve
nile
Pub
lic D
efen
der
Dis
pute
Res
olut
ion
Cen
ter
Rec
ords
Man
agem
ent &
Com
mun
icat
ions
Res
ourc
es
Sep
tem
ber 3
0, 2
013
EMER
GEN
CY
SER
VIC
ES
Em
erge
ncy
Ser
vice
s M
edic
al E
xam
iner
Em
erge
ncy
Med
ical
Ser
vice
s
GE
NER
AL A
DM
INIS
TRAT
ION
Tran
spor
tatio
n &
Nat
ural
Res
ourc
esFa
cilit
ies
Man
agem
ent
Pla
nnin
g &
Bud
get
Hum
an R
esou
rce
Man
agem
ent
INFO
RM
ATIO
N T
ECH
NO
LOG
Y
Intro - 15

TRAVIS COUNTY, TEXAS PRINCIPAL OFFICIALS
September 30, 2013
GOVERNING BODY
Samuel T. Biscoe, County Judge Ron Davis, Commissioner, Precinct 1 Bruce Todd, Commissioner, Precinct 2 Gerald Daugherty, Commissioner, Precinct 3 Margaret Gomez, Commissioner, Precinct 4
OTHER PRINCIPAL OFFICIALS
Bruce Elfant, Tax Assessor/Collector Nicki Riley, CPA, County Auditor David Escamilla, County Attorney Rosemary Lehmberg, District Attorney Greg Hamilton, Sheriff Dolores Ortega-Carter, Treasurer Amalia Rodriguez-Mendoza, District Clerk Dana DeBeauvoir, County Clerk
Intro - 16

TRAVIS COUNTY, TEXAS FINANCIAL SECTION


INDEPENDENT AUDITORS' REPORT
To the Honorable County Judge and Commissioners of Travis County, Texas
Report on the Financial Statements
We have audited the accompanying financial statements of the governmental activities, each major fund, and the aggregate remaining fund information of Travis County, Texas (the County), as of and for the year ended September 30, 2013, and the related notes to the financial statements, which collectively comprise the County’s basic financial statements as listed in the table of contents.
Management’s Responsibility for the Financial Statements
Management is responsible for the preparation and fair presentation of these financial statements in accordance with accounting principles generally accepted in the United States of America; this includes the design, implementation, and maintenance of internal control relevant to the preparation and fair presentation of financial statements that are free from material misstatement, whether due to fraud or error.
Auditors’ Responsibility
Our responsibility is to express opinions on these financial statements based on our audit. We conducted our audit in accordance with auditing standards generally accepted in the United States of America and the standards applicable to financial audits contained in Government Auditing Standards issued by the Comptroller General of the United States. Those standards require that we plan and perform the audit to obtain reasonable assurance about whether the financial statements are free from material misstatement.
An audit involves performing procedures to obtain audit evidence about the amounts and disclosures in the financial statements. The procedures selected depend on the auditors’ judgment, including the assessment of the risks of material misstatement of the financial statements, whether due to fraud or error. In making those risk assessments, the auditors consider internal control relevant to the entity’s preparation and fair presentation of the financial statements in order to design audit procedures that are appropriate in the circumstances, but not for the purpose of expressing an opinion on the effectiveness of the entity’s internal control. Accordingly, we express no such opinion. An audit also includes evaluating the appropriateness of accounting policies used and the reasonableness of significant accounting estimates made by management, as well as evaluating the overall presentation of the financial statements.
We believe that the audit evidence we have obtained is sufficient and appropriate to provide a basis for our audit opinions.
FS - 1

Opinions
In our opinion, the financial statements referred to above present fairly, in all material respects, the respective financial position of the governmental activities, each major fund, and the aggregate remaining fund information of the County, as of September 30, 2013, and the respective changes in financial position and, where applicable, cash flows thereof for the year then ended in accordance with accounting principles generally accepted in the United States of America.
Other Matters
Required Supplementary Information
Accounting principles generally accepted in the United States of America require that the required supplemental information, such as Management’s Discussion and Analysis on pages FS-5 to FS-21, Budgetary Comparison Information on page RSI-3, and the Schedule of Funding Progress on page RSI-4 be presented to supplement the basic financial statements. Such information, although not a part of the basic financial statements, is required by the Governmental Accounting Standards Board (GASB) who considers it to be an essential part of financial reporting for placing the basic financial statements in an appropriate operational, economic, or historical context. We have applied certain limited procedures to the required supplementary information in accordance with auditing standards generally accepted in the United States of America, which consisted of inquiries of management about the methods of preparing the information and comparing the information for consistency with management’s responses to our inquiries, the basic financial statements, and other knowledge we obtained during our audit of the basic financial statements. We do not express an opinion or provide any assurance on the information because the limited procedures do not provide us with sufficient evidence to express an opinion or provide any assurance.
Other Information
Our audit was conducted for the purpose of forming opinions on the financial statements that collectively comprise the County’s basic financial statements. The combining and individual fund financial statements and budgetary comparison schedules listed in the foregoing table of contents are presented for purposes of additional analysis and are not a required part of the basic financial statements.
The combining and individual fund financial statements and budgetary comparison schedules are the responsibility of management and were derived from and relate directly to the underlying accounting and other records used to prepare the basic financial statements. Such information has been subjected to the auditing procedures applied in the audit of the basic financial statements and certain additional procedures, including comparing and reconciling such information directly to the underlying accounting and other records used to prepare the basic financial statements or to the basic financial statements themselves, and other additional procedures in accordance with auditing standards generally accepted in the United States of America. In our opinion, the combining and individual fund financial statements and budgetary comparison schedules are fairly stated, in all material respects, in relation to the basic financial statements as a whole.
The introductory section and the statistical information listed in the table of contents have not been subjected to the auditing procedures applied in the audit of the basic financial statements, and accordingly, we do not express an opinion or provide any assurance on them.
FS - 2

Other Reporting Required by Government Auditing Standards
In accordance with Government Auditing Standards, we have also issued our report dated February 21, 2014, on our consideration of the County's internal control over financial reporting and on our tests of its compliance with certain provisions of laws, regulations, contracts, and grant agreements and other matters. The purpose of that report is to describe the scope of our testing of internal control over financial reporting and compliance and the results of that testing, and not to provide an opinion on internal control over financial reporting or on compliance. That report is an integral part of an audit performed in accordance with Government Auditing Standards in considering the County’s internal control over financial reporting and compliance.
Emphasis of Matter
For fiscal years ended September 30, 2008 through September 30, 2012, the County followed the statutory basis of accounting. In fiscal year ended September 30, 2013, the County again began reporting in accordance with generally accepted accounting principles. The only difference between the statutory basis of accounting followed by the County and generally accepted accounting principles was the effects of not applying GASB No. 45, Accounting and Financial Reporting by Employers for Postemployment Benefits Other Than Pensions. As discussed in Note 12 to the financial statements, the County implemented GASB No. 45 during the fiscal year ended September 30, 2013, which changed the way it is accounting for other postemployment benefits. Our opinion is not modified with respect to this matter.
Austin, Texas February 21, 2014
FS - 3

FS - 4

TRAVIS COUNTY, TEXAS MANAGEMENT’S DISCUSSION AND ANALYSIS (MD&A) (Unaudited)
For The Year Ended September 30, 2013
The following is a narrative overview and analysis of the financial activities of Travis County (County) for the fiscal year ended September 30, 2013. Please consider the information presented here in conjunction with the transmittal letter, financial statements, and related footnotes.
FINANCIAL HIGHLIGHTS
Government-wide:
• The assets of the County exceeded its liabilities at the close of the fiscal year by $951.3 million (reported as net position), a decrease of $34.4 million or 3.5 percent from the prior year, as restated. Of the total net position amount, $811.9 million is the net investment in capital assets, $84.6 million is unrestricted, and $54.8 million is restricted for specific future uses. Fiscal year 2012 net position for government-wide has been restated due to the change from the Statutory Basis of reporting to generally accepted accounting principles (GAAP) in the United States of America as applied to governmental units. Please see Note 15 of the Notes to the Financial Statements for additional information.
Fund Financial Statements:
• As of the close of the fiscal year, the County’s governmental funds reported combined ending fund balances of $416.1 million, an increase of $21.0 million or 5.3 percent from the previous year. Approximately 34.0 percent of ending fund balances is unassigned and may be used to meet ongoing obligations to citizens and creditors.
• The fund balance of the General Fund, one of the major governmental funds, was $161.9 million at September 30, 2013, a $4.6 million increase over last year. The unassigned portion of fund balance was $141.5 million or 87.4 percent of total fund balance and 29.0 percent of total General Fund expenditures and other financing uses for fiscal year 2013.
• At September 30, 2013, the net position of the County’s Internal Service Funds was $34.5 million, a decrease of $3.7 million or 9.6 percent from the prior year, as restated. Fiscal year 2012 net position for the Internal Service Funds has been restated due to the change from the Statutory Basis to the GAAP basis. Please see Note 15 of the Notes to the Financial Statements for additional information.
Long-term Debt:
• The County’s total bond and certificate of obligation debt decreased $7.7 million or 1.2 percent during the fiscal year reducing total debt outstanding to $663.7 million, net of deferred amounts.
OVERVIEW OF THE FINANCIAL STATEMENTS This discussion and analysis is intended to serve as an introduction to the County’s basic financial statements, which are comprised of three components (1) government-wide financial statements, (2) fund financial statements, and (3) notes to the financial statements. This report also contains required and other supplementary information in addition to the financial statements themselves.
The financial statements presented herein include all of the activities of Travis County using the integrated approach as prescribed by GASB Statement No. 34 and all amendments thereafter.
FS - 5

The following illustration summarizes the sections and reporting requirements of this financial report.
REQUIRED SUPPLEMENTARY INFORMATION Management’s Discussion and Analysis (MD&A)
Government-wide Financial Statements
Governmental Fund Financial Statements
Fiduciary Fund Financial Statements
Notes to the Financial Statements
FINANCIAL SECTION - BASIC FINANCIAL STATEMENTS
Mandatory Reporting
REQUIRED SUPPLEMENTARY INFORMATION
(Other than MD&A)
OTHER SUPPLEMENTARYINFORMATION (Not Required) Combining Fund Financial Statements/Schedules Non-Mandatory
Reporting
Proprietary Fund Financial Statements
Budgetary Basis Reporting with Notes
Miscellaneous Schedules
Government-wide Financial Statements (Reporting the County as a Whole)
The government-wide financial statements are designed to provide readers with a broad overview of the financial position of the County. They include a Statement of Net Position and a Statement of Activities. Both of these statements are presented using the economic resources measurement focus and the accrual basis of accounting. Revenues are recorded when earned and expenses are recorded when a liability is incurred regardless of the timing of the related cash flows. This accounting method produces a view of financial position similar to that presented by most private-sector companies.
The Statement of Net Position (on page BFS-5) presents information on all County assets and liabilities, with the difference between the two reported as net position. The analysis of net position over time may serve as a useful indicator of whether the County’s overall financial position is improving or deteriorating. To assess the overall health of the County, however, other factors should be considered, such as changes in the County’s property tax base and the condition of its roads and bridges (infrastructure).
The Statement of Activities (on page BFS-6) presents the County’s revenues and expenses for the period, with the difference between the two resulting in the current year change in net position. A change in net position is reported when the underlying event giving rise to the change occurs, regardless of the timing of the related cash flows. Thus, revenues and expenses reported in this statement may result in cash flows in future fiscal periods (e.g., uncollected taxes and earned but unused vacation leave).
FS - 6

In the Statement of Net Position and the Statement of Activities, the County reports its basic services as governmental activities. These activities include general government, justice system, public safety, corrections and rehabilitation, health and human services, infrastructure and environmental services, and community and economic development. These services are predominantly financed through property taxes, fees, and intergovernmental grants. Included within the general government function are services provided by the internal service funds, as these services primarily benefit the County.
The government-wide financial statements include not only the County itself (known as the primary government), but also the following legally separate entities known as component units, which are blended into the County's financial statements: Northwest Travis County Road District No. 3; Southwest Travis County Road District No. 1; Travis County Bee Cave Road District No. 1; Capital Health Facilities Development Corporation; Travis County Housing Finance Corporation; Travis County Health Facilities Development Corporation; Capital Industrial Development Corporation; Travis County Development Authority; and Travis County Cultural Education Facilities Finance Corporation. Additional information regarding component units can be found in Note 1 of the Notes to the Financial Statements.
Fund Financial Statements (Reporting the County’s Major Funds) The fund financial statements focus on the County’s most significant funds individually rather than on the County as a whole. A fund is a group of related accounts used to keep track of specific sources of funding and spending for a particular purpose. Funds are established for various purposes, and the fund financial statements allow the demonstration of resource inflows and outflows and/or related budgetary compliance for individual parts of the County government. All funds of the County are classified into one of three categories: governmental funds, proprietary funds, or fiduciary funds.
Governmental funds – The County’s governmental funds are used to account for essentially the same basic services reported in the governmental activities category of the government-wide financial statements. However, unlike the government-wide financial statements, governmental fund financial statements focus on near-term inflows and outflows of spendable resources, as well as on balances of spendable resources available at the end of the fiscal year. Such information may be useful in evaluating the County’s near-term financing requirements.
Also unlike the government-wide financial statements, governmental funds are reported using the modified accrual method of accounting, which measures cash and only those assets that can be readily converted to cash. Because governmental fund financial statements do not encompass the additional long-term focus of the government-wide financial statements, additional information is provided that explains the relationship (or differences) between them.
Travis County maintains 62 individual governmental funds (including blended component units), of which seven are considered major funds and are included in the governmental fund Balance Sheet and governmental fund Statement of Revenues, Expenditures, and Changes in Fund Balances beginning on page BFS-10. The major funds are General, Operating Grants, General Purpose Debt Service, Capital Permanent Improvement Bonds, Capital Certificates of Obligation, Capital Road and State Highway Bonds and Certificates of Obligation, and Capital Grants. The remaining less significant funds are combined into a single, aggregated presentation. Individual fund data for each of these non-major governmental funds is provided in the form of combining statements located in the Other Supplementary Information section of this report beginning on page OSI-6.
FS - 7

Proprietary fund – An internal service fund, a type of proprietary fund, reports activities that provide services to the County internally. The County uses an internal service fund to account for the activities of the County’s self-insurance program for general liability, automobile liability, error and omissions claims and judgments, workers’ compensation, and employee healthcare services provided to County employees, retirees, and their dependents. Because these services predominantly benefit governmental functions, they have been included within governmental activities in the government-wide financial statements. Proprietary fund financial statements begin on page BFS-18.
Fiduciary funds – Fiduciary funds are used to account for resources held for the benefit of parties other than the County itself. Because the resources from these funds are held for the benefit of others and not available to support the County’s own programs, fiduciary funds are not reflected in the government-wide financial statements. The County’s fiduciary financial information is reported in a separate Statement of Fiduciary Assets and Liabilities on page BFS-21.
Notes to the Financial Statements The notes to the financial statements provide additional information that is essential to the understanding and fair presentation of the data provided in both the government-wide and fund financial statements. Notes to the financial statements begin on page NT-3 of this report.
Required Supplementary Information (Other than MD&A) Required supplementary information (other than MD&A) includes information concerning the County’s General Fund budget. The County adopts an annual appropriation budget for its General Fund and various special revenue funds. A budgetary comparison schedule has been provided for the General Fund to demonstrate compliance with its budget. This section also includes the Schedule of Funding Progress for Retirement Plan and the Schedule of Funding Progress for Other Post-employment Benefits Plan as required by GASB Statement No. 50, Pension Disclosures – an amendment of GASB Statements No. 25 and No. 27 and GASB Statement No. 45, Accounting and Financial Reporting by Employers for Postemployment Benefits Other Than Pensions (GASB 45), respectively. Required Supplementary Information begins on page RSI-3 of this report.
Other Supplementary Information Other supplementary information includes combining and individual fund schedules and financial statements that provide actual and/or budgetary information for certain major funds, non-major governmental funds, internal service funds, and fiduciary funds. Other Supplementary Information begins on page OSI-1 of this report.
FS - 8

GOVERNMENT-WIDE FINANCIAL ANALYSIS (Reporting the County as a Whole) The County is providing condensed financial information for fiscal year 2013 with comparative information for fiscal year 2012. The following schedule was derived from the Statement of Net Position on page BFS-5 of this report and focuses on the net position of the County.
2013 2012(1)
Current and other assets 567,144,827$ 553,681,756$ Capital assets, net of depreciation 1,223,055,514 1,227,433,447
Total assets 1,790,200,341 1,781,115,203
Current liabilities 69,483,808 71,850,840 Non-current liabilities 769,404,862 723,548,369
Total liabilities 838,888,670 795,399,209
Net Position:Net investment in capital assets 811,869,512 819,274,444 Restricted 54,852,048 37,110,491 Unrestricted 84,590,111 129,331,059
Total net position 951,311,671$ 985,715,994$ (1) Fiscal year 2012 net position has been restated, please see Note 15.
Travis County, TexasCondensed Statement of Net Position
September 30, 2013With Comparative Totals For September 30, 2012
Governmental Activities
Travis County’s assets exceeded liabilities by $951.3 million at September 30, 2013. The largest portion of the County’s net position in the amount of $811.9 million reflects its net investment in capital assets such as land, buildings, equipment, and infrastructure (roads, bridges and other immovable assets) less any related outstanding debt used to acquire those assets. The County uses these capital assets to provide services to citizens; consequently, these assets are not available for future spending. Although the County’s investment in its capital assets is reported net of related debt, it should be noted that the resources needed to repay this debt must be provided from other sources, since the capital assets themselves cannot be used to liquidate these liabilities.
Restricted net position in the amount of $54.8 million represents County resources that are subject to external restrictions, constitutional provisions, or enabling legislation regarding how they may be used.
FS - 9

The individual components of net position are analyzed below:
2013 2012(1)
Net Investment in Capital AssetsSome County-owned assets have depreciable lives for financial reporting that are different from the period over which the related debt principal is being repaid. In addition, many assets may not have been funded with debt, or may be fully paid and have a netundepreciated balance. 811,869,512$ 819,274,444$
Restricted Net Position Funds legally restricted for capital projects 17,186,561 5,512,044 Funds legally restricted for debt service 12,155,368 7,938,539 Funds legally restricted in the Permanent School Fund 3,246,561 3,363,703 Funds legally restricted for justice, corrections, and rehabilitative 17,532,049 15,263,654
programsFunds legally restricted for roads, parks, and preserves 3,248,898 3,282,416 Funds restricted to finance other specific activities 1,482,611 1,750,135
Total Restricted Net Position 54,852,048 37,110,491
Unrestricted Net PositionThe County issued debt for the purpose of purchasing right-of-wayland for joint road projects with the State of Texas. The State maintains the property; therefore, the capital asset is not recordedon the County's books. This is the debt outstanding for these non-County owned assets at year end. (56,901,253) (65,617,407)
Travis County Bee Cave Road District No. 1 issued debt to reimburse the developer for the cost of constructing various improvements toroads related to the Hill Country Galleria project. These roads are maintained by the Village of Bee Cave; therefore, the capital asset is not recorded on the County's books. This is the debt outstanding for these non-County owned assets at year end. (12,850,000) (13,250,000)
The County's other post-employment benefit liability has no impacton cash and the County is not required to fund it. This is theactuarial estimated liability at year end. (52,840,782) -
All other unrestricted non-capital assets exceed the total of the County's other liabilities by this amount. 207,182,146 208,198,466
Total Unrestricted Net Position 84,590,111 129,331,059 Total Net Position 951,311,671$ 985,715,994$
(1) Fiscal year 2012 net position has been restated, please see Note 15.
Travis County, TexasComponents of Net Position
September 30, 2013With Comparative Totals For September 30, 2012
As shown in the schedule above, the County’s total net position decreased $34.4 million from $985.7 million to $951.3 million or 3.5 percent over the course of this fiscal year’s operations. This difference is primarily due to the following:
• A decrease of $52.8 million due to the initial recording of the other post-employment benefit expense;
• An increase of $12.0 million due to various donated assets; and • An increase of $11.9 million due to monies received from the City of Austin for joint road
projects.
FS - 10

The difference between total fund balance in the governmental fund Balance Sheet (fund financial statements) and total net position in the Statement of Net Position (government-wide) is $535.2 million. This variance exists because of several items that are presented in the government-wide financial statements that are not presented in the governmental fund financial statements, including:
Capital assets in the amount of $1,222.7 million;
Certain long-term assets in the amount of $30.2 million;
Adjustments to current liabilities of $0.4 million;
Long-term liabilities of ($752.6) million; and
Net position of $34.5 million in the Internal Service Funds.
A detailed reconciliation can be found in Note 3 of the Notes to the Financial Statements.
The following condensed financial information was derived from the government-wide Statement of Activities on page BFS-6 of this report and reflects how the County’s net position changed during the fiscal year.
2013 2012 (1)
Revenues:Program revenues:
Fees, fines, and charges for services 118,795,686$ 105,623,286$ Operating grants, contributions,
shared revenues, and entitlements 34,071,678 35,798,211 Capital grants, contributions, and donated assets 14,123,290 17,716,749
General revenues:Property taxes, ad valorem 494,900,530 462,761,804 Excise taxes from the State of Texas 7,370,217 6,436,318 Grants and contributions not
restricted to specific programs 1,730,628 1,402,323 Investment earnings 5,569,651 5,913,723 Miscellaneous 9,534,583 7,588,756
Total revenues 686,096,263 643,241,170
Expenses:General government* 206,204,957 132,305,119 Justice system 126,651,421 122,517,414 Public safety 73,492,351 65,304,918 Corrections and rehabilitation 124,653,947 117,721,251 Health and human services 55,594,585 52,934,006 Infrastructure and environmental services 89,562,401 86,650,269 Community and economic development 12,022,962 10,835,162 Interest on long-term debt 32,317,962 28,443,421
Total expenses 720,500,586 616,711,560 Change in net position (34,404,323) 26,529,610 Net position - beginning of year 985,715,994 959,186,384 Net position - end of year 951,311,671$ 985,715,994$
* Includes Internal Service Funds expenses of $64,222,267 and $49,557,815 for FY13 and FY12, respectively.
(1) Fiscal year 2012 has been restated, please see Note 15.
Travis County, TexasCondensed Statement of Activities
For The Year Ended September 30, 2013With Comparative Totals For September 30, 2012
Governmental Activities
FS - 11

In fiscal year 2013, revenues increased by $42.9 million or 6.7 percent. This increase is primarily attributed to the following:
• Property tax revenue increased $32.1 million partially due to new construction of $3.5 billion that was added to the tax roll. Additionally, Commissioners' Court approved a Maintenance and Operations (M&O) tax rate that exceeded the effective M&O tax rate of $0.4089 by 3.13 percent. The Effective Tax Rate is the tax rate that will produce the same total revenue for the current tax year that was generated for the previous tax year from the same properties on the tax roll. Therefore, for any given fiscal year, if a tax rate is set at the Effective Tax Rate, then any additional revenue for that fiscal year must come from new properties added to the tax roll. Funding public priorities and requirements while meeting the needs of the taxpayer is difficult and challenging at all levels of government. Counties find the demands of providing services particularly challenging because of the standards set by the State and Federal Government. Services provided by counties are very basic services predominately focused on:
a) Courts b) Jails c) Roads d) Public Safety
Three characteristics of these services are: 1) Mandated by State Law 2) Cannot control the demand 3) Demand for services increases in an economic decline
In fiscal year 2013, a tax rate increase was needed to fund several major initiatives/issues, which include the following: The addition of law enforcement officers due to an increase in population and
increased need for law enforcement, communications, training, and corrections staffing programs;
Funding for Information Technology Services including critical systems and mobile data program support;
Additional funding for legally mandated attorney fees in Civil and Criminal Courts to cover an increase in indigent costs related to increased workload needs;
The increase in the peace officer pay scale of $10.1 million, or 11.4 percent; and Compensation increases related to the market salary survey performed during fiscal
year 2012. • Fees, fines, and charges for services increased $13.2 million mostly due to monies
received from the City of Austin for joint road projects.
Expenses increased $103.8 million or 16.8 percent. The majority of this increase is due to the following:
• An increase of $52.8 million due to the implementation of GASB 45 and the initial recording of other post-employment benefit expense;
• Salaries and benefits increased $18.7 million. This is due to $10.1 million for a Commissioners’ Court approved peace officer pay scale increase of 11.4 percent. The remaining is due to a market salary survey adjustment and an increase in full-time employees county-wide;
• IT expense increased $6.7 million due to the following: (1) the implementation and development of new court case management systems; (2) costs associated with the current
FS - 12

court case management software; (3) county-wide user authentication software; and (4) computer equipment purchased for the data center project;
• Medical claims expense increased $5.6 million due to an 8.2% increase in the weighted average claims per participant and an increase of 283 participants; and
• Interest and other charges increased $3.9 million due to the costs associated with the County using unspent debt proceeds from the 2001 voter-approved Proposition 3 bonds to partially defease debt remaining that related to those bonds. No bonds were defeased in fiscal year 2012.
The difference between the governmental funds net change in fund balance in the Statement of Revenues, Expenditures, and Changes in Fund Balances (fund financial statements) and the change in net position in the Statement of Activities (government-wide) is ($55.4) million. This variance exists partly because certain items are presented in the government-wide financial statements that are not presented in the County’s fund financial statements. Conversely, there are certain items that are reported in the fund financial statements that are not presented in the government-wide financial statements. These variances include:
• Depreciation expense in excess of capital outlay expenditures and other capital related transactions of ($16.0) million;
• Revenues and other financing sources totaling $14.3 million; • Items associated with long-term debt in the amount of 9.1 million; • Various expenses, including other post-employment benefits, in the amount of
($59.1) million; and • The change in net position of the Internal Service Funds of ($3.7) million.
A detailed reconciliation can be found in Note 3 of the Notes to the Financial Statements section of this report.
The following chart depicts expenses and program revenues for fiscal year 2013 for governmental activities (government-wide):
*Program Revenues do not include property tax revenue, which is reported as general revenue. County government is largely dependent upon property taxes, as state law limits sources of revenue available to counties. General government expense includes other post-employment benefit expense of $52.8 million; see Note 12 for additional information.
$0$20,000$40,000$60,000$80,000
$100,000$120,000$140,000$160,000$180,000$200,000$220,000
GeneralGovernment
JusticeSystem
PublicSafety
Corrections &Rehabilitation
Health &Human
Services
Infrastructure &Environmental
Services
Community &Economic
Development
Interest onLong-
Term Debt
FY 2013 Expenses and Program Revenues* Governmental Activities
(in thousands)
ExpensesRevenues
FS - 13

The following chart depicts total revenues of governmental activities (government-wide) for fiscal year 2013:
THE COUNTY’S FUNDS (Reporting the County’s Major Funds) Travis County uses fund accounting to ensure and demonstrate compliance with finance-related legal requirements.
Governmental Funds The focus of the County’s governmental funds is to provide information on near-term inflows, outflows, and balances of spendable resources. Unlike the government-wide financial statements, governmental fund financial statements focus on current sources and uses of spendable resources, as well as on balances of spendable resources available at the end of the fiscal year. This information is useful in assessing the County’s financing requirements. Non-financial assets such as governmental buildings, roads, drainage ways, park land, and long-term liabilities, such as payables or long-term liabilities that will not be paid with current assets, are excluded. The County’s governmental functions are contained in the General, Special Revenue, Debt Service, Capital Projects, and Permanent funds.
At the end of the current fiscal year, the County’s governmental funds reported combined ending fund balances of $416.1 million, an increase of $21.0 million compared to fiscal year 2012. Approximately $141.5 million of the total ending fund balance is available for future use. The remaining fund balance consists of $0.2 million nonspendable items, $238.6 million restricted by specific legal requirements, such as debt covenants, and $35.8 million committed to specific types of expenditures.
For a detailed explanation of the components of fund balance, please see Note 1 of the Notes to the Financial Statements.
17% 5%
2%
72%
1%
0% 1% 2%
FY 2013 Revenues by Source Governmental Activities
Fees, fines, and charges for services
Operating grants, contributions,shared revenues, and entitlements
Capital grants, contributions, anddonated assets
Property taxes, ad valorem
Excise taxes from the State of Texas
Grants and contributions notrestricted to specific programs
Investment earnings
Miscellaneous
FS - 14

The following schedule summarizes and compares revenues by source of the County’s governmental funds for fiscal years ended September 30, 2013 and September 30, 2012.
Revenues by source: FY 2013 FY 2012Taxes 495,311,689$ 462,914,737$ Intergovernmental 45,399,431 44,556,137 Charges for services 100,676,125 88,184,352 Fines and forfeits 7,383,197 6,844,291 Investment income 556,382 2,314,632 Miscellaneous 7,628,387 5,769,358
656,955,211$ 610,583,507$
Travis County, TexasRevenues Classified by Source
Governmental Funds
76%
7%
15% 1% 0% 1%
FY 2013 Revenues by Source Governmental Funds
Taxes
Intergovernmental
Charges for services
Fines and forfeits
Investment income
Miscellaneous
FS - 15

The schedule below summarizes and compares expenditures of the County’s governmental funds by function for fiscal years ended September 30, 2013 and September 30, 2012.
Current: FY 2013 FY 2012General government 93,989,180$ 86,087,010$ Justice system 134,223,728 130,461,470 Public safety 76,105,420 67,378,510 Corrections and rehabilitation 126,293,126 120,520,737 Health and human services 54,706,194 52,134,317 Infrastructure and environmental services 27,291,234 24,444,275 Community and economic development 9,263,948 8,663,992
Capital outlay 77,841,388 93,505,123 Debt service 80,422,339 77,480,605
680,136,557$ 660,676,039$
Travis County, TexasExpenditures by Function
Governmental Funds
14%
20%
11%
19%
8%
4% 1%
11%
12%
FY 2013 Expenditures by Function Governmental Funds
General government Justice systemPublic safety Corrections and rehabilitationHealth and human services Infrastructure and environmental servicesCommunity and economic development Capital outlayDebt service
FS - 16

General Fund. The General Fund is the County’s chief operating fund. At the end of the current fiscal year, fund balance of the General Fund was $161.9 million, of which $141.5 million was unassigned. As a measure of the General Fund’s liquidity, it may be useful to compare both unassigned fund balance and total fund balance to total fund expenditures (including other financing uses). Unassigned fund balance and total fund balance constitute 29.0 percent and 33.1 percent, respectively, of total General Fund expenditures and other financing uses combined.
There was an increase in the fund balance of the County’s General Fund of $4.6 million or 2.9 percent during the current fiscal year. There were several planned, one-time expenditures budgeted into fund balance for improvements on Kellam Road, the land purchase for the new District Attorney’s office, and computer equipment. However, a higher than anticipated tax collection rate helped offset the budgeted reduction in fund balance. In addition, expenditures came in under budget primarily due to timing of projects and salary and benefits savings of $12.6 million, mainly due to vacant slots and a change in the method of estimating compensated absences. The majority of the project monies have either been encumbered or re-budgeted in fiscal year 2014.
Operating Grants Fund. The Operating Grants fund, a type of special revenue fund, is used to account for grant contributions from other entities. These contributions are intended to be used or expended for specific purposes designated by the grantor. At the end of the current fiscal year, the Operating Grants fund balance was $3.0 million, an increase of $0.9 million or 43.6 percent from the previous fiscal year. Normally grant funds do not maintain a fund balance. However, the Basic Supervision program in the Community Supervision and Corrections Department (CSCD) allows for a fund balance to carry over into the following year. Refunds to the grantor for unused contributions for other CSCD programs are distributed every biennium. Accordingly, CSCD will refund a total of $0.7 million to the grantor for fiscal year 2013.
Debt Service Fund. The General Purpose Debt Service fund is used to account for financial resources set aside for the payment of principal and interest on the County’s long-term debt obligations. At the end of the current fiscal year, the General Purpose Debt Service fund balance was $17.9 million, an increase of $4.0 million or 28.8 percent from the prior fiscal year. A $1.4 million reduction to fund balance was budgeted for fiscal year 2013. However, offsetting this budgeted decrease were higher than anticipated tax collections during fiscal year 2013.
Capital Permanent Improvement Bonds, Capital Certificates of Obligation, and Capital Road and State Highway Bonds and Certificates of Obligation Funds. The County’s Capital Projects funds are used to account for financial resources set aside for the acquisition or construction of major capital endeavors. At the end of the current fiscal year, the total fund balance for the County’s major Capital Projects funds was $183.6 million, a decrease of $2.2 million or 1.2 percent from the prior year. In fiscal year 2013, the County used unspent proceeds to partially defease debt of $19.9 million. See Note 8 in the Notes to the Financial Statements for further information.
Capital Grants Fund. The Capital Grants fund, a type of capital project fund, is used to account for capital grant contributions from other entities. These contributions are intended to be used or expended for specific capital project purposes designated by the grantor. These grant funds do not maintain a fund balance; therefore, a zero fund balance is reported at year end.
Proprietary Fund. The County is self-insured and uses an internal service fund, a type of proprietary fund, to account for general and automobile liabilities, error and omissions claims and judgments, and workers’ compensation claims. The County also uses an internal service fund to self-insure its employee and retiree health and medical claims. Total net position for the County’s Proprietary Fund at the end of the fiscal year was $34.5 million, a decrease of $3.7 million or 9.6 percent from the prior year, as restated. The previous year’s net position has been restated due to
FS - 17

the change from the Statutory Basis to the GAAP basis. Please see Note 15 of the Notes to the Financial Statements for additional information.
BUDGETARY HIGHLIGHTS
The County’s budget is prepared according to the budget rules adopted by the Commissioners’ Court. The most significant budgeted fund is the General Fund.
General Fund. During the fiscal year 2013 budget process, the local economy began showing signs of steady improvement. Several factors reflected this improvement including increases in population, employment, and home sales along with a decrease in unemployment. Once again the Commissioners' Court required that the budget maintain the 11.0 percent reserve goal for property tax-supported funds, which has been maintained since fiscal year 1996. It is these accumulated resources that have allowed the County to avoid disruptions in services during slow economic times.
The following table summarizes General Fund budgeted and actual amounts for fiscal year 2013.
Original Budget Final Budget ActualRevenues and Transfers In
Taxes 408,135$ 408,135$ 414,723$ Intergovernmental 8,537 9,476 10,446 Charges for services 52,731 53,708 58,752 Other 5,262 5,143 7,775 Transfers in and sale of
capital assets 1,059 1,229 1,327 Total 475,724 477,691 493,023
Expenditures and Transfers OutExpenditures 512,383 520,985 474,561 Transfers out 14,023 13,907 13,879
Total 526,406 534,892 488,440
Net change in fund balance (50,682)$ (57,201)$ 4,583$
Travis County, TexasFY13 General Fund Budget vs. Actual Amounts
(in thousands)
The General Fund final budget as a whole did not change significantly from the original adopted budget for fiscal year 2013, with revenues and transfers in increasing only 0.4 percent and expenditures and transfers out increasing 1.6 percent.
Actual revenues and transfers in were 3.2 percent over the final budget mainly due to the following:
• Property tax collections were greater than anticipated, due to a slightly higher collection rate.
• An unexpected donation in miscellaneous revenues was received from Seton Healthcare for STARFlight.
• An environmental fine was received for violations of the Texas Water Code.
FS - 18

Actual expenditures and transfers out were 8.7 percent under the final budget. This is primarily due to the following items:
• Encumbered spending commitments set for disbursement in fiscal year 2014 were $20.1 million in the General Fund at the end of this fiscal year. Operating expenditures make up $13.3 million of these encumbrances, with capital outlay expenditures making up the remaining $6.8 million. These encumbrances are primarily due to delay of services provided, projects not completed during the fiscal year, and projects pending contract negotiations at year-end. This amount encompasses a wide array of expenditures in all of the functions, but the majority is in the General Government, Corrections and Rehabilitation, Health and Human Services, and Infrastructure and Environmental Services functions.
• Operating costs were $24.6 million under budget, which included $12.6 million in salaries and benefits, largely due to a change in the method of estimating compensated absences expected to be liquidated with current expendable resources (of $7.4 million) and temporary personnel cost savings as the result of unanticipated vacant positions. The remaining $12.0 million is mostly due to lower than anticipated operating costs primarily in the General Government and Justice System functions.
CAPITAL ASSETS AND DEBT ADMINISTRATION Capital Assets. The capital assets of the County are those assets that are used in the performance of the County’s functions including infrastructure assets such as roads, bridges and other immovable assets. As of September 30, 2013, capital assets of the County’s governmental activities totaled $1,223.1 million, net of accumulated depreciation. The overall decrease in the County’s net capital assets for the current period is 0.4 percent as shown in the table below.
Increase/(Decrease)
Percent2013 2012 of Change
Land and land improvements 255,197,217$ 239,080,278$ 6.7%Land infrastructure 71,857,909 65,339,140 10.0%Property, plant and equipment:
Buildings 352,029,901 356,656,238 -1.3%Improvements other than buildings 74,250,634 55,962,527 32.7%Machinery and equipment 56,523,965 45,299,987 24.8%Assets under capital lease 649,170 1,830,741 -64.5%Leasehold improvements 426,339 584,674 -27.1%
Infrastructure (other than land) 377,121,334 385,727,225 -2.2%Construction in progress 34,999,045 76,952,637 -54.5%
Total capital assets, net 1,223,055,514$ 1,227,433,447$ -0.4%
Activities
Travis County, TexasCapital Assets
(net of accumulated depreciation)September 30, 2013
With Comparative Totals For September 30, 2012
Governmental
FS - 19

Major capital events during the current fiscal year included the following:
The County invested $8.7 million for the purchase of additional acreage for the Balcones Canyonlands Conservation Plan. This land is set aside by the County to protect eight endangered species, including the Black-capped Vireo, Golden-cheeked Warbler, Tooth Cave Pseudoscorpion, and the Bone Cave Harvestman, as well as 27 other species believed to be at risk.
In fiscal year 2013, $19.4 million was transferred from construction in progress to improvements other than buildings, as the work at Milton Reimers Ranch Park was completed.
Machinery and equipment purchased in fiscal year 2013 included $7.3 million for computer hardware and software, $7.0 million for a County-wide financial system, and $5.7 million for new vehicles/ambulances.
In Infrastructure (other than land), $36.2 million was transferred from construction in progress due to road projects being completed during the year, the majority related to improvements for FM 969 and FM 1626. Additionally, $13.1 million was added to construction in progress for new or ongoing road projects.
The County purchased land adjacent to the County Courthouse for $7.2 million with plans for a new building to house the District Attorney’s office.
A total of $12.0 million in capital assets was donated to the County in fiscal year 2013. These donations consist of roads, sidewalks, and rights-of-way that were built by developers when constructing new subdivisions and donated to the County for ongoing maintenance.
Increases in assets were offset by depreciation expense of $92.0 million, the majority in Infrastructure (other than land).
Additional information on the County’s capital assets can be found in Note 7 of the Notes to the Financial Statements.
Long-Term Debt. At the end of the current fiscal year, the County had total long-term debt outstanding, net of deferred amounts, of $663.7 million, a decrease of $7.7 million or 1.2 percent from the previous year. The County’s outstanding debt obligations are summarized below:
Increase/2013 2012 (Decrease)
Voter approved:General obligation bonds 239,630,000$ 237,460,000$ 2,170,000$
Commissioners' Court approved:State Highway System bonds 3,465,000 3,500,000 (35,000) Refunding bonds 178,604,735 178,516,335 88,400 Certificates of obligation 224,635,000 236,090,000 (11,455,000)
Deferred amounts(1) 17,386,794 15,897,692 1,489,102 Total 663,721,529$ 671,464,027$ (7,742,498)$
Includes blended component units(1) Deferred amounts include loss on refundings, unamortized discounts, and unamortized premiums.
Travis County, TexasOutstanding Debt
September 30, 2013With Comparative Totals For September 30, 2012
Governmental Activities
FS - 20

During fiscal year 2013, the County issued general obligation bonds totaling $99.3 million. Included in this amount was $55.3 million of Limited Tax Refunding Bonds, of which $21.7 million is taxable, that were used to pay off amounts outstanding on previously issued bonds that carried higher interest costs. The remaining $44.0 million will largely be utilized for road and bridge construction and park improvements. In addition, Certificates of Obligation were issued for $21.0 million. The majority of these proceeds will be used for building construction and improvements, software upgrades and computer equipment, road construction projects, a firefighting aircraft, and other authorized capital project needs for the County. During the year, retirement of debt amounted to $132.4 million, which included $56.6 million in refunded debt and $19.9 million in defeased debt. See Note 8 of the Notes to the Financial Statements for additional information.
During fiscal year 2013, the County maintained a triple-A rating from both Standard & Poor’s (S&P) and Moody’s Investors Service, Inc. credit rating agencies. The County received its first triple-A rating from S&P in fiscal year 2000 and from Moody’s in fiscal year 2001.
State statute limits the amount of debt the County can issue to 5.0 percent of the total property value assessed within the County. Additionally, Travis County is limited on the amount that may be levied to service general law bonds and provide funds for the general operations of the County to $0.80 annually on the $100 assessed valuation plus a levy of $0.15 annually for the maintenance of public roads. The County’s outstanding debt is significantly below its current limit of $6.4 billion.
Other long-term debt of the County includes capital leases, claims and judgments, compensated absences, and other long-term liabilities, which consist of arbitrage and the long-term cost of postclosure care for landfill remediation, and other post-employment benefits.
Additional information on the County’s long-term debt can be found in Note 8 of the Notes to the Financial Statements.
ECONOMIC FACTORS AND OUTLOOK
The Travis County economy grew steadily in fiscal year 2013. Along those lines, population and employment both showed increases year over year. The number of home sales and the average selling price of homes increased 22.6 percent and 8.8 percent, respectively.
Other economic improvements that occurred in fiscal year 2013, as compared to fiscal year 2012, were as follows:
Gross retail sales for the City of Austin increased 10.2 percent for the first three quarters year over year;
Total assessed property valuation increased by 4.7 percent; and
Site development permits issued increased 20.5 percent.
The fiscal year 2014 annual budget for the County was prepared with consideration of the above statistics. The Commissioners' Court approved an M&O tax rate for fiscal year 2014 of $0.4190, which is $0.0141 or 3.5 percent above the effective M&O tax rate. The reserve ratio for tax-supported funds remained at 11.0 percent.
REQUESTS FOR INFORMATION
The County’s financial statements are designed to give a general overview of the County’s finances. Questions concerning any of the information provided in this report or requests for additional financial information may be addressed to the Travis County Auditor’s Office, P.O. Box 1748, Austin, Texas 78767.
FS - 21

FS - 22

TRAVIS COUNTY, TEXAS BASIC FINANCIAL STATEMENTS
Government-Wide Financial Statements Government-wide financial statements are used to provide readers with a broad overview of the County’s overall financial position and include all funds except for the Fiduciary Funds.
Fund Financial Statements
Fund financial statements consist of governmental funds, which are used to account for revenues and expenditures of the main government of Travis County. Other funds are required to maintain certain information and are presented separately. The governmental funds included in the County’s fund financial statements consist of the following:
General Fund – The General Fund is the principal fund of the County and is used to account for all financial resources except those required to be accounted for by another fund.
Operating Grants Fund – This is a special revenue fund that consists of major federal, state, and local grants used for specific programs and services for the community.
General Purpose Debt Service Fund – This fund accounts for the accumulation of resources and the subsequent disbursement of such resources to pay principal and interest on long-term general obligation bonds and certificates of obligation.
Capital Permanent Improvement Bonds Fund – This capital project fund accounts for bond proceeds used for land purchases and construction and improvement projects of County facilities and parks.
Capital Certificates of Obligation Fund – This capital project fund accounts for proceeds from certificates of obligation designated for capital expenditures.
Capital Road and State Highway Bonds and Certificates of Obligation Fund – This capital project fund accounts for bond and certificate of obligation proceeds issued for the construction of roads and state highways.
Capital Grants Fund – This capital project fund accounts for federal, state, and local grants received for specific capital projects designated by the grantor.
Other Governmental Funds – These funds include non-major special revenue, debt service, capital projects, and permanent funds. The details of these funds are located in the Other Supplementary Information section of this report.
Fund financial statements also consist of the following funds:
Proprietary Fund – Travis County’s proprietary fund consists of two internal service funds. Internal service funds are used to account for the financing of goods or services provided by one department to other departments of the government on a cost reimbursement basis. The details of the County’s internal service funds are located in the Other Supplementary Information section of this report.
Fiduciary Funds – Agency Funds, a type of fiduciary fund, are used to account for assets held by the County in a fiduciary capacity as custodian or agent for individuals and other governmental units. The details of the County’s agency funds are located in the Other Supplementary Information section of this report.
BFS - 1

BFS - 2

TRAVIS COUNTY, TEXAS
GOVERNMENT-WIDE
FINANCIAL STATEMENTS
BFS - 3

BFS - 4

TRAVIS COUNTY, TEXASSTATEMENT OF NET POSITIONGOVERNMENTAL ACTIVITIES
September 30, 2013
ASSETSCash and pooled cash $ 485,768,972 Investments 20,327,156 Interest receivable 545,012 Taxes receivable, net 5,170,699 Accounts receivable, net 27,804,016 Other receivables 18,401,868 Prepaid items 610,925 Cash - restricted 84,780 Other assets 8,431,399 Capital assets:
Land and land improvements 255,197,217 Land infrastructure 71,857,909 Property, plant, and equipment 754,408,370 Infrastructure (other than land) 1,211,278,496 Construction in progress 34,999,045 Less accumulated depreciation (1,104,685,523)
Total assets 1,790,200,341
LIABILITIESAccounts payable 18,478,847 Interest payable 2,841,259 Accrued liabilities 19,114,933 Other liabilities 17,636,332 Due to other governmental entities 669,486 Deferred revenue 10,742,951 Noncurrent liabilities:
Due within one year:Long-term debt obligations 57,295,000 Other long-term liabilities 116,063 Capital lease obligations 429,006 Claims and judgments 11,511,235 Compensated absences 16,047,230
Due in more than one year:Long-term debt obligations 606,426,529 Other long-term liabilities 55,062,997 Capital lease obligations 901,604 Claims and judgments 5,121,397 Compensated absences 16,493,801
Total liabilities 838,888,670
NET POSITIONNet investment in capital assets 811,869,512 Restricted for:
Capital projects 17,186,561 Debt service 12,155,368 Permanent funds 3,246,561 Justice, corrections, and rehabilitation programs 17,532,049Roads, parks, and preserves 3,248,898Other purposes 1,482,611
Unrestricted 84,590,111 Total net position $ 951,311,671
See accompanying notes to financial statements.
GovernmentalActivities
BFS - 5

TRAVIS COUNTY, TEXASSTATEMENT OF ACTIVITIES
For The Year Ended September 30, 2013
Program Revenues
Fees, Fines, andCharges for
Functions/Programs Expenses Services
Primary government:
Governmental activities:
General government 206,204,957$ 33,255,984$
Justice system 126,651,421 18,262,009
Public safety 73,492,351 10,580,108
Corrections and rehabilitation 124,653,947 17,022,695
Health and human services 55,594,585 10,267,912
Infrastructure and environmental services 89,562,401 26,754,514
Community and economic development 12,022,962 2,652,464
Interest on long-term debt 32,317,962 - Total governmental activities 720,500,586$ 118,795,686$
See accompanying notes to financial statements.
BFS - 6

Net (Expense) Revenue andChanges in Net Position
Operating Grants,Contributions, Capital Grants,
Shared Revenues, Contributions, and Governmentaland Entitlements Donated Assets Activities
330,556$ -$ (172,618,417)$
12,284,939 - (96,104,473)
1,864,454 - (61,047,789)
12,801,005 - (94,830,247)
6,509,509 - (38,817,164)
273,060 13,169,674 (49,365,153)
8,155 953,616 (8,408,727)
- - (32,317,962) 34,071,678$ 14,123,290$ (553,509,932)
General revenues:
Property taxes, ad valorem 494,900,530
Excise taxes from the State of Texas 7,370,217
1,730,628
Investment earnings 5,569,651
Miscellaneous 9,534,583
Total general revenues 519,105,609
Change in net position (34,404,323)
Net position - beginning of year before restatement 979,505,450
Cumulative effect of change from Statutory Basis to GAAP Basis (See Note 15) 6,210,544
Net position - beginning of year after restatement 985,715,994 Net position - end of year 951,311,671$
Program Revenues
Grants and contributions not restricted to specific programs
BFS - 7

BFS - 8

TRAVIS COUNTY, TEXAS
FUND FINANCIAL STATEMENTS
BFS - 9

Operating General PurposeGeneral Grants Debt Service
Assets
Cash and pooled cash 202,023,716$ 8,863,174$ 23,032$ Investments - - 18,813,492 Interest receivable 232,917 7,428 7,904 Due from other funds 4,395,998 - 1,919 Accounts receivable 3,792,014 - - Intergovernmental and other receivables - 3,143,418 - Taxes receivable (net of allowances
for estimated uncollectibles) 2,065,318 - 1,028,765 Prepaid items 205,000 - - Cash - restricted - - -
Total assets 212,714,963$ 12,014,020$ 19,875,112$
Liabilities and Fund Balances
Liabilities:Accounts payable 14,658,939$ 659,733$ -$ Interest payable - - 188,533 Accrued liabilities 17,495,320 772,134 - Due to other funds 79,404 2,690,876 - Other liabilities 16,525,247 - 773,596 Due to other governmental entities - 666,432 - Deferred revenue 2,065,618 4,271,419 1,028,765
Total liabilities 50,824,528 9,060,594 1,990,894
Fund balances:Nonspendable
Prepaid items 205,000 - -
RestrictedDebt service - - 17,884,218 Capital projects - - - Special revenue funds - 2,953,426 - County schools - - -
CommittedSpecial revenue funds - - - Justice, corrections, and rehabilitation programs 4,742,928 - - Roads, parks, and preserves 5,118,901 - - Information technology services 2,598,796 - - Facilities management 2,658,899 - - Health and human services 3,941,410 - - Other purposes 1,088,011 - -
UnassignedGeneral fund 141,536,490 - -
Total fund balances 161,890,435 2,953,426 17,884,218 Total liabilities and fund balances 212,714,963$ 12,014,020$ 19,875,112$
See accompanying notes to financial statements.
BALANCE SHEETTRAVIS COUNTY, TEXAS
GOVERNMENTAL FUNDSSeptember 30, 2013
BFS - 10

CapitalCapital Capital Road & State
Permanent Certificates Highway Bonds Other Total Improvement of and Certificates Capital Governmental Governmental
Bonds Obligation of Obligation Grants Funds Funds
34,071,631$ 40,860,728$ 110,756,723$ 6,442,414$ 36,295,806$ 439,337,224$ - - - - 1,513,664 20,327,156
37,944 45,793 120,657 7,359 33,839 493,841 - - - - 3,101 4,401,018 - 40,967 - - 234,292 4,067,273 - - - 1,528,617 13,596,215 18,268,250
- - - - 20,366 3,114,449 - - - - - 205,000 - 16,861 474 67,445 - 84,780
34,109,575$ 40,964,349$ 110,877,854$ 8,045,835$ 51,697,283$ 490,298,991$
694,406$ 882,864$ 776,486$ 28,729$ 666,970$ 18,368,127$ - - - - - 188,533 - - - - 702,231 18,969,685
21 - 1,898 1,586,841 126,733 4,485,773 - - - - 337,489 17,636,332 - - - - 3,054 669,486 - 40,967 - 6,430,265 20,366 13,857,400
694,427 923,831 778,384 8,045,835 1,856,843 74,175,336
- - - - - 205,000
- - - - 380,250 18,264,468 33,415,148 40,040,518 110,099,470 - 17,186,561 200,741,697
- - - - 13,335,232 16,288,658 - - - - 3,246,561 3,246,561
- - - - 15,691,836 15,691,836 - - - - - 4,742,928 - - - - - 5,118,901 - - - - - 2,598,796 - - - - - 2,658,899 - - - - - 3,941,410 - - - - - 1,088,011
- - - - - 141,536,490
33,415,148 40,040,518 110,099,470 - 49,840,440 416,123,655 34,109,575$ 40,964,349$ 110,877,854$ 8,045,835$ 51,697,283$ 490,298,991$
BFS - 11

BFS - 12

TRAVIS COUNTY, TEXASRECONCILIATION OF THE BALANCE SHEET OF GOVERNMENTAL FUNDS
TO THE STATEMENT OF NET POSITIONSeptember 30, 2013
Fund balance - total governmental funds $ 416,123,655
Amounts reported for governmental activities in the Statement of Net Positionare different due to the following:
Capital assets used in governmental activities are not financial resources and, therefore, are not reported in the funds (excluding Internal Service Funds). 1,222,682,605
Other long-term assets are not available to pay for current-period expenditures and, therefore, are not reported in the fund financial statements (excluding Internal Service Funds). 30,172,931
Difference due to liabilities for deferred revenue and interest payable. 461,723
Non-current liabilities, including the portion due within one year, that have not matured would not be reported in the funds (excluding Internal Service Funds). (752,644,916)
Internal Service Funds are used by management to charge the costs of certain activities to individual funds. The assets and liabilities of the Internal Service Funds are included in governmental activities in the Statement of Net Position. 34,515,673
Net position - governmental activities $ 951,311,671
See accompanying notes to financial statements.
BFS - 13

Operating General PurposeGeneral Grants Debt Service
Revenues:Taxes 414,723,210$ -$ 78,951,431$ Intergovernmental 10,446,141 32,221,071 - Charges for services 58,752,113 6,532,285 - Fines and forfeits 2,126,330 - - Investment income (364,978) 243,618 49,315 Miscellaneous 6,013,670 69,680 -
Total revenues 491,696,486 39,066,654 79,000,746
Expenditures:Current:
General government 90,344,622 - - Justice system 119,141,353 11,805,731 - Public safety 70,839,795 1,492,824 - Corrections and rehabilitation 106,089,039 17,658,337 - Health and human services 47,951,030 6,568,954 - Infrastructure and environmental services 8,758,821 28,977 - Community and economic development 9,225,328 8,155 -
Capital outlay 21,737,289 609,081 - Debt service:
Debt issuance costs - - 557,607 Advance refunding escrow - - 326,295 Capital lease principal 415,140 - - Principal on general obligation debt - - 52,110,000 Interest and other charges 58,304 - 24,228,550
Total expenditures 474,560,721 38,172,059 77,222,452
Excess (deficiency) of revenues over expenditures 17,135,765 894,595 1,778,294
Other financing sources (uses):General obligation debt issued - - - Refunding debt issued - - 55,340,000 Debt premium - - 7,112,340 Payment to refunding bond agent - - (61,848,695) Sale of capital assets 257,050 - - Bond defeasance - - - Transfers in 1,069,861 5,575 1,619,204 Transfers out (13,879,563) (3,420) -
Total other financing sources (uses) (12,552,652) 2,155 2,222,849
Net change in fund balances 4,583,113 896,750 4,001,143
Fund balances - beginning of year 157,307,322 2,056,676 13,883,075
Fund balances - end of year 161,890,435$ 2,953,426$ 17,884,218$
See accompanying notes to financial statements.
TRAVIS COUNTY, TEXASSTATEMENT OF REVENUES, EXPENDITURES, AND CHANGES IN FUND BALANCES
GOVERNMENTAL FUNDSFor The Year Ended September 30, 2013
BFS - 14

CapitalCapital Capital Road & State
Permanent Certificates Highway Bonds Other Total Improvement of and Certificates Capital Governmental Governmental
Bonds Obligation of Obligation Grants Funds Funds
-$ -$ -$ -$ 1,637,048$ 495,311,689$ - - - 2,132,334 599,885 45,399,431 - 3,993 - - 35,387,734 100,676,125 - - - - 5,256,867 7,383,197
79,474 81,104 252,195 33,362 182,292 556,382 - - - - 1,545,037 7,628,387
79,474 85,097 252,195 2,165,696 44,608,863 656,955,211
12,318 (9,246) 13,043 - 3,628,443 93,989,180 - - - - 3,276,644 134,223,728 - - - - 3,772,801 76,105,420 - 1,264 - - 2,544,486 126,293,126 - - - - 186,210 54,706,194 - - - 121 18,503,315 27,291,234 - - - - 30,465 9,263,948
6,239,862 28,994,984 7,996,430 2,165,575 10,098,167 77,841,388
160,957 92,751 731,072 - - 1,542,387 - - - - - 326,295 - - - - - 415,140 - - - - 975,000 53,085,000 - - - - 766,663 25,053,517
6,413,137 29,079,753 8,740,545 2,165,696 43,782,194 680,136,557
(6,333,663) (28,994,656) (8,488,350) - 826,669 (23,181,346)
10,755,000 21,025,000 33,220,000 - - 65,000,000 - - - - - 55,340,000
151,467 1,532,762 690,431 - - 9,487,000 - - - - - (61,848,695) - - - - - 257,050 - - (24,100,670) - - (24,100,670) - - - - 13,873,988 16,568,628
(312,900) (773,258) (533,046) - (1,066,441) (16,568,628)
10,593,567 21,784,504 9,276,715 - 12,807,547 44,134,685
4,259,904 (7,210,152) 788,365 13,634,216 20,953,339
29,155,244 47,250,670 109,311,105 - 36,206,224 395,170,316
33,415,148$ 40,040,518$ 110,099,470$ -$ 49,840,440$ 416,123,655$
BFS - 15

BFS - 16

TRAVIS COUNTY, TEXASRECONCILIATION OF THE STATEMENT OF REVENUES, EXPENDITURES,
AND CHANGES IN FUND BALANCES OF GOVERNMENTAL FUNDSTO THE STATEMENT OF ACTIVITIESFor The Year Ended September 30, 2013
Net change in fund balances - total governmental funds $ 20,953,339
Amounts reported for governmental activities in the Statement of Activitiesare different due to the following:
Governmental funds report capital outlays as expenditures. However, in the Statement of Activities, the cost of those assets is allocated over their estimated useful lives and reported as depreciation expense. This is the amount by which depreciation exceeded capital outlay and other capital related transactions in the current period (excluding Internal Service Funds). (16,057,241)
Revenues in the Statement of Activities that do not provide current financial resources are not reported as revenues in the funds. In addition, there are certain revenues in the governmental funds that are eliminated in consolidation. 14,310,369
The issuance of long-term debt provides current financial resources to governmental funds, while the repayment of the principal of long-term debt consumes the current financial resources of governmental funds. Neither transaction, however, has any effect on net position. Also, governmental funds report the effect of issuance costs, premiums, discounts, losses on refunding, and similar items when debt is first issued, whereas these amounts are deferred and amortized in the Statement of Activities. Included is the accrual and accretion of interest on debt which does not require current resources. This amount is the net effect of these differences in the treatment of long-term debt and related items. 9,134,894
Some expenses reported in the Statement of Activities do not require the use of current financial resources or have not matured and therefore are not reported as expenditures in governmental funds (excluding Internal Service Funds). (59,068,255)
Internal Service Funds are used by management to charge the costs of certain activities, such as insurance, to individual funds. The net revenue (expense) of the Internal Service Funds is reported in governmental activities. (3,677,429)
Change in net position of governmental activities $ (34,404,323)
See accompanying notes to financial statements.
BFS - 17

TRAVIS COUNTY, TEXASSTATEMENT OF NET POSITION
PROPRIETARY FUNDSeptember 30, 2013
GovernmentalActivities
Assets
Current assets:Pooled cash $ 46,431,748 Interest receivable 51,171
84,844 Accounts receivable 1,083,420 Other receivables 133,618 Prepaid items 405,925 Other assets 2,968,041
Total current assets 51,158,767
Noncurrent assets:Capital assets:
Property, plant, and equipment 528,495 Less accumulated depreciation (155,586)
Total noncurrent assets 372,909
Total assets 51,531,676
Liabilities
Current liabilities:Accounts payable 110,720 Due to other funds 89 Accrued and other liabilities 145,248 Claims and judgments 11,511,235 Compensated absences 56,098
Total current liabilities 11,823,390
Noncurrent liabilities:Claims and judgments 5,121,397 Compensated absences 71,216
Total noncurrent liabilities 5,192,613
Total liabilities 17,016,003
Net PositionNet investment in capital assets 372,909 Unrestricted 34,142,764
Total net position $ 34,515,673
See accompanying notes to financial statements.
Internal Service Funds
Due from other funds
BFS - 18

TRAVIS COUNTY, TEXASSTATEMENT OF REVENUES, EXPENSES,
AND CHANGE IN NET POSITIONPROPRIETARY FUND
For The Year Ended September 30, 2013
GovernmentalActivities
Operating revenues:Insurance premiums-county $ 50,498,992 Insurance premiums-employee 7,772,949 Miscellaneous 2,237,534
Total operating revenues 60,509,475
Operating expenses:Incurred losses 58,147,901 Unemployment claims 277,771 Insurance expense 3,376,182 Professional services 41,799 Depreciation expense 3,483 Administration 2,375,131
Total operating expenses 64,222,267
Operating income (loss) (3,712,792)
Nonoperating revenues:Investment income 35,363
Total nonoperating revenues 35,363
Change in net position (3,677,429)
Net position - beginning of year before restatement 31,982,558
Cumulative effect of change from Statutory Basis to GAAP Basis (see Note 15) 6,210,544
Net position - beginning of year after restatement 38,193,102
Net position - end of year $ 34,515,673
See accompanying notes to financial statements.
Internal Service Funds
BFS - 19

TRAVIS COUNTY, TEXASSTATEMENT OF CASH FLOWS
PROPRIETARY FUNDFor The Year Ended September 30, 2013
GovernmentalActivities
Cash flows from operating activitiesCash received from premium revenues $ 57,729,106 Cash received from subrogation 2,896 Cash received from insurance proceeds, rebates, and other receipts 1,740,648 Cash paid for self-insured claims and loss adjustment expenses (55,872,502) Cash paid for other operating expenses (4,343,780) Cash paid for payroll (2,263,890)
Net cash provided by (used for) operating activities (3,007,522)
Cash flows from investing activitiesInterest received 261,998 Increase (decrease) in fair value of investments in pooled cash (227,985)
Net cash provided by (used for) investing activities 34,013
Net increase (decrease) in pooled cash balance (2,973,509)
Pooled cash balance - beginning of year 49,405,257
Pooled cash balance - end of year $ 46,431,748
Reconciliation of operating income (loss) to net cash provided by (used for) operating activities
Operating income (loss) $ (3,712,792)
Adjustments to reconcile operating income to net cash provided by (used for) operating activities:Depreciation expense 3,483 (Increase) decrease in due from other funds 865 (Increase) decrease in other receivables (1,078,292) (Increase) decrease in prepaid items (298,426) Increase (decrease) in claims and judgments 3,211,089 Increase (decrease) in other liabilities (1,133,449)
Net cash provided by (used for) operating activities $ (3,007,522)
See accompanying notes to financial statements.
Internal Service Funds
BFS - 20

TRAVIS COUNTY, TEXASSTATEMENT OF FIDUCIARY ASSETS AND LIABILITIES
AGENCY FUNDSSeptember 30, 2013
AgencyFunds
AssetsCash and pooled cash $ 23,247,361 Certificates of deposit 21,601,345 Investments 18,464,192 Interest receivable 22,441 Accounts receivable, net 2,932,621
Total assets $ 66,267,960
LiabilitiesDue to third parties $ 45,773,665 Civil and probate deposits 233,301 Cash and surety bonds and deposits 8,568,220 Due to other governmental entities 11,692,774
Total liabilities $ 66,267,960
See accompanying notes to financial statements.
BFS - 21

BFS - 22

TRAVIS COUNTY, TEXAS
NOTES TO THE
FINANCIAL STATEMENTS
NT - 1

NT - 2

TRAVIS COUNTY, TEXAS
TRAVIS COUNTY, TEXAS NOTES TO THE FINANCIAL STATEMENTS
September 30, 2013 INDEX
PAGE Note 1: Summary of Significant Accounting Policies ...................................................................................... NT- 4
Note 2: Disaggregation of Receivable Balances ............................................................................................ NT-16
Note 3: Reconciliation of Government-wide and Fund Financial Statements ............................................... NT-17
Note 4: Ad Valorem (Property) Taxes ............................................................................................................. NT-19
Note 5: Interfund Transactions ........................................................................................................................ NT-20
Note 6: Deposits and Investments .................................................................................................................. NT-21
Note 7: Capital Assets ..................................................................................................................................... NT-25
Note 8: Long-Term Debt .................................................................................................................................. NT-27
Note 9: Conduit Debt Obligations .................................................................................................................... NT-32
Note 10: Operating Leases ................................................................................................................................ NT-32
Note 11: Retirement Plan .................................................................................................................................. NT-33
Note 12: Post-employment Benefits Other Than Pension Benefits ................................................................. NT-35
Note 13: Self-Insurance ..................................................................................................................................... NT-37
Note 14: Contingent Liabilities ........................................................................................................................... NT-38
Note 15: Restatement of Prior Year Net Position Due to Change in Reporting Basis .................................... NT-39
NT - 3

TRAVIS COUNTY, TEXAS
TRAVIS COUNTY, TEXAS NOTES TO THE FINANCIAL STATEMENTS
September 30, 2013
1. SUMMARY OF SIGNIFICANT ACCOUNTING POLICIES Travis County (County) is a corporate body and a political subdivision of the State of Texas (State) governed by a Commissioners’ Court, which is made up of an elected county judge and four elected county precinct commissioners. The financial statements of the County have been prepared in conformity with generally accepted accounting principles (GAAP) in the United States of America as applied to governmental units. The Governmental Accounting Standards Board (GASB) is the accepted primary standard-setting body for establishing governmental accounting and financial reporting principles. GASB periodically updates its codification of the existing Governmental Accounting and Financial Reporting Standards, which, along with subsequent GASB pronouncements (Statements and Interpretations), constitutes GAAP for governmental units.
In fiscal year 2013, the County implemented GASB Statement No. 62 (GASB 62) Codification of Accounting and Financial Reporting Guidance Contained in Pre-November 30, 1989 FASB and AICPA Pronouncements, which incorporated certain Financial Accounting Standards Board (FASB) and American Institute of Certified Public Accountants (AICPA) pronouncements issued prior to December 1, 1989, into the GASB Codification as long as they don’t conflict or contradict GASB literature. The implementation of this statement had no effect on the financial reporting of the County.
Other significant accounting policies followed by the County are described herein.
A. Reporting Entity In accordance with GASB Statements, a financial reporting entity consists of the primary government and its component units. Component units are defined as “...legally separate organizations for which the elected officials of the primary government are financially accountable. In addition, component units can be other organizations for which the nature and significance of their relationship with a primary government are such that exclusion would cause the reporting entity’s financial statements to be misleading.” Because of the closeness of the relationship to the primary government, some component units should be blended, as though they are part of the primary government; however, most component units should be discretely presented.
Blended Component Units
In accordance with GAAP, the following separate entities have been included as blended component units.
Road Districts:
Northwest Travis County Road District No. 3 (NWTCRD No. 3) – Created and established in August 1986, NWTCRD No. 3 contains approximately 242 acres consisting of ten separate tracts located in the County. In July 1989, NWTCRD No. 3 issued $8,600,000 in bonds, which were refunded in 2005. The road district is ad valorem tax-supported for repayment of debt.
Southwest Travis County Road District No. 1 (SWTCRD No. 1) – Created and established in November 1984, the district contains approximately 7,015 acres. In September 1994, SWTCRD No. 1 issued, delivered, and exchanged Special
NT - 4

TRAVIS COUNTY, TEXAS
Assessment Refunding bonds for its previously issued Unlimited Tax Refunding bonds, Series 1990. Except for $10,000 of unredeemed coupon bonds from the original 1985 issuance, all debt of SWTCRD No. 1 has been defeased, redeemed or matured.
Travis County Bee Cave Road District No. 1 (TCBCRD No. 1) – Approved by the Commissioners’ Court in July 2006, this road district encompasses 141 acres in western Travis County, wholly within the corporate limits of the Village of Bee Cave, Texas. In August 2008, TCBCRD No. 1 issued $14,725,000 in Unlimited Tax Road Bonds. The road district is ad valorem tax-supported for repayment of debt.
The County acts as paying agent for the debt of these road districts; however, the bonded debt of these road districts is not a debt or obligation of the County, nor will the County be liable for payment thereof. The road districts do not issue separate financial statements.
Corporations:
Capital Health Facilities Development Corporation – The Capital Health Facilities Development Corporation was incorporated on May 25, 1985, as a public nonprofit corporation in accordance with the Health Facilities Development Act, Texas Health and Safety Code Annotated, Chapter 221, as amended. Under that Act, the Capital Health Facilities Development Corporation was created to provide, expand and improve health facilities for residents of Travis County, Texas that the Corporation determines are needed to improve the adequacy, cost, and accessibility of health care, research, and education in the State. The Corporation is authorized to participate in the issuance of bonds for those purposes. The Corporation currently holds no assets or liabilities.
Travis County Housing Finance Corporation – The Travis County Housing Finance Corporation was incorporated on November 19, 1980, as a public nonprofit corporation in accordance with the Texas Housing Finance Corporations Act, Texas Local Government Code Annotated, Chapter 394, as amended. Under that Act, the Travis County Housing Finance Corporation was created to provide decent, safe, and sanitary housing at affordable prices for residents of Travis County, Texas and is authorized to participate in the issuance of bonds for the purpose, among others, of defraying the development cost of multifamily rental housing to be occupied substantially by persons of low and moderate income as determined by the Board of Directors, to provide funds to purchase mortgage loans made to persons of low and moderate income, and to refund bonds previously issued by the Corporation. The Corporation also administers grants to provide down-payment assistance to first-time homebuyers and rental assistance and family self-sufficiency services to low-income residents.
Travis County Health Facilities Development Corporation – The Travis County Health Facilities Development Corporation was incorporated on December 18, 1991, as a public nonprofit corporation in accordance with the Health Facilities Development Act, Texas Health and Safety Code Annotated, Chapter 221, as amended. Under that Act, the Travis County Health Facilities Development Corporation was created to provide, expand, and improve health facilities for residents of Travis County, Texas that the Corporation determines are needed to improve the adequacy, cost, and accessibility of health care, research, and education in the State. The Corporation is authorized to participate in the issuance of bonds for those purposes.
Capital Industrial Development Corporation – The Capital Industrial Development Corporation was incorporated on April 29, 1980, as a public nonprofit corporation in accordance with the Development Corporation Act of 1979, Article 5190.6, Vernon’s
NT - 5

TRAVIS COUNTY, TEXAS
Annotated Civil Statutes. Under that Act, the Capital Industrial Development Corporation was created to provide for the promotion and development of industrial and manufacturing enterprises, to promote and encourage employment and the public welfare, and is authorized to participate in the issuance of bonds for those purposes.
Travis County Development Authority – The Travis County Development Authority was incorporated on December 17, 1999, as a public nonprofit corporation under the provisions of Subchapter D of Chapter 431, Texas Transportation Code and Chapter 394, Vernon’s Texas Codes Annotated for the purpose of promoting economic development of Travis County through the creation of new employment opportunities by entering into contracts, grant agreements, leases, and other business arrangements with other corporations, both public and private, for the research and development of technology. The Corporation currently holds no assets or liabilities.
Travis County Cultural Education Facilities Finance Corporation – The Travis County Cultural Education Facilities Finance Corporation was created on August 7, 2001 pursuant to the Cultural Education Facilities Finance Corporation Act, Article 1528m, Vernon’s Annotated Texas Civil Statutes for the purpose of promoting the health, education, and general welfare of citizens by providing and financing cultural, health and educational facilities as defined in the Act.
Through the Corporations, eligible applicants are furnished financial assistance through proceeds from the sale of tax-free bonds. Such debt is issued by the Corporations as “conduit or noncommitment debt” (see Note 9). Neither the Corporations nor the County are liable for the payment of the bonds. The Corporations do not publish separate financial statements.
B. Related and Jointly Governed Organizations Related organizations and jointly governed organizations provide services within the County that are administered by separate boards or commissions, for which the County is not financially accountable. Such organizations are therefore not component units of the County, even though the Commissioners’ Court may appoint the voting majority of an organization’s board. Consequently, financial information for these organizations is not included within the scope of these financial statements.
Related Organizations – The Commissioners’ Court appoints the members to the various Travis County Fire and EMS Districts which were created to implement emergency services to designated areas throughout Travis County. The County’s accountability does not extend beyond the board appointment function.
Central Health is a Hospital District that was formed to furnish medical aid and provide hospital care to indigent and needy persons residing in Travis County. Central Health is a legally separate organization and imposes a separate ad valorem tax on the residents of the County. Of Central Health’s nine member Board of Managers, four are appointed by Travis County, four by the City of Austin, and one is a joint appointee. Additionally, the Travis County Commissioners’ Court approves Central Health’s annual budget and tax rate each year. The debt of Central Health is not a debt or obligation of the County, nor will the County be liable for payment thereof. The County has an interlocal agreement with Central Health in which the County provides legal and accounting services. The County recognized revenue in the amount of $456,112 and recorded an interlocal receivable in the amount of $86,259 related to the interlocal agreement.
NT - 6

TRAVIS COUNTY, TEXAS
The County is also a participant in the Waller Creek Tax Increment Financing Zone (TIF) with the City of Austin. This TIF was created to help fund a major drainage project and related facilities around Waller Creek, which runs through downtown Austin. It is anticipated that other complementary development will follow. The Commissioners’ Court appoints one board member as provided in the state statutes. The County disbursed $506,640 this year to the Waller Creek TIF.
C. Measurement Focus, Basis of Accounting and Financial Statement Presentation In fiscal year 2013, the County implemented GASB Statement No. 63, Financial Reporting of Deferred Outflows of Resources, Deferred Inflows of Resources, and Net Position (GASB 63). This statement amends the net asset reporting requirements of GASB Statement No. 34, Basic Financial Statements – and Management’s Discussion and Analysis – for State and Local Governments, and other pronouncements by incorporating deferred outflows of resources and deferred inflows of resources into the definitions of the required components of the net assets and by renaming that measure as net position.
Government-wide Financial Statements The government-wide financial statements report on a consolidated level all the activities of the County and its component units except fiduciary activities. The effect of interfund activity within the primary government has been eliminated from these statements.
The government-wide financial statements are presented using the economic resources measurement focus and the accrual basis of accounting. Revenues are recorded when earned and expenses are recorded when a liability is incurred, regardless of the timing of related cash flows. Property taxes are recognized in the year for which they are levied. Grants and similar items are recognized as revenue as soon as all eligibility requirements are met.
The Statement of Net Position reports all current and non-current assets, including capital assets. It also reports all current and long-term liabilities of the County. The Statement of Activities reports program revenues and expenses by function. Program revenues include fees, fines, and charges for services; operating grants, contributions, shared revenues, and entitlements; and capital grants, contributions, and donated assets. Internally dedicated resources are reported as general revenues and include items such as taxes, grants and contributions not restricted to specific programs, and investment earnings. Expenses include costs related to non-current assets, such as depreciation expense, and costs related to long-term debt activities.
In the government-wide financial statements, the Proprietary Fund is included in governmental activities, as its main purpose is to internally serve the County.
Fund Financial Statements The accounts of Travis County are organized on the basis of funds, each of which is considered a separate accounting entity. The operations of each fund are accounted for with a separate set of self-balancing accounts that comprise its assets, liabilities, fund balance/net position, revenues, and expenditures/expenses.
Fund accounting is designed to demonstrate legal compliance and to aid financial management by segregating transactions related to certain government functions or activities.
NT - 7

TRAVIS COUNTY, TEXAS
Government resources are allocated to and accounted for in individual funds based upon the purposes for which they are to be spent and the means by which spending activities are controlled, as described below. Accordingly, the fund financial statements are presented for governmental funds, proprietary funds, and fiduciary funds.
The governmental fund financial statements are reported using the current financial resources measurement focus and the modified accrual basis of accounting. Under this basis of accounting, revenues are recognized when they become both measurable and available. Revenues are considered measurable when the amount of the transaction can be determined, while revenues are considered available when they are collectible within the current period or soon enough thereafter to pay liabilities of the current period. Taxes, charges for services, fines and forfeits, and most governmental miscellaneous revenues, including investment earnings, are recorded as earned since they are measurable and available. The County defines the time period of availability to be generally 60 days after the fiscal year end. Expenditures are normally recognized in a governmental fund at the same time that a liability is incurred, except for certain long-term accrued liabilities that normally are not expected to be liquidated with expendable available financial resources. Expenditures for long-term indebtedness such as formal debt issuances, compensated absences, claims and judgments, special termination benefits, landfill closure and post-closure care costs, pollution remediation costs, and other commitments that are not current liabilities, if any of the above costs occur, are recognized in governmental funds to the extent they have matured. Therefore, only current assets and current liabilities are included on the balance sheet of the governmental funds. Capital asset acquisitions are reported as expenditures of the current period. Operating statements of the governmental funds present increases (i.e., revenues and other financing sources) and decreases (i.e., expenditures and other financing uses) in fund balance.
Like the government-wide financial statements, proprietary fund financial statements are reported using the economic resources measurement focus and the accrual basis of accounting. Proprietary funds distinguish operating revenues and expenses from non-operating items. Operating revenues and expenses generally result from charging for and providing goods and services in connection with a proprietary fund’s principal ongoing operations. The principal ongoing operating revenues of the Internal Service Funds are generated by charging premiums to County offices/departments. Operating expenses in the Internal Service Funds include the costs of reimbursements of specific claims for healthcare, general and automobile liability, error and omissions claims and judgments, workers’ compensation, and other related insurance activities. Expenses also include insurance expense where the County is not self-insured for that type or amount of loss. All revenues and expenses not meeting this definition are reported as non-operating revenues and expenses.
The fiduciary fund financial statements are also reported using the accrual basis of accounting.
The County reports the following major governmental funds:
General Fund – primary general operating fund of the County. It accounts for all financial resources of the general government, except those required to be accounted for in another fund.
Operating Grants Fund – consists of federal, state, and local grants used to account for monies received for specific programs and services for the community. Federal grants include those from the U.S. Department of Energy, U.S. Department of Health and
NT - 8

TRAVIS COUNTY, TEXAS
Human Services, U.S. Department of Justice, U.S. Department of Transportation, and others. State grants include those provided by the Texas Juvenile Justice Department, Office of the Governor-Criminal Justice Division, Texas Department of Criminal Justice, and others. Local grants include various funds received from local entities and private sources to provide various services to the community.
General Purpose Debt Service Fund – used to accumulate resources for the payment of principal and interest on long-term general obligation bonds and certificates of obligation.
Capital Permanent Improvement Bonds Fund – used to account for voter approved financial resources specifically designated for the purpose of paying contractual obligations incurred in the construction of public works. Examples of public works include building a courthouse or jail, establishing facilities for serving needy or indigent persons, constructing bridges, and improving and maintaining roads and parks.
Capital Certificates of Obligation Fund – used to account for Commissioners’ Court-approved financial resources specifically designated for the purpose of paying contractual obligations incurred in the construction of public works; the purchase of materials, supplies, equipment, machinery, buildings, rights-of-way and real property; and for the payment of professional services. Examples of public works include construction and equipping of jails and connecting a bridge to a county road.
Capital Road and State Highway Bonds and Certificates of Obligation Fund – used to account for voter approved road bonds, state highway bonds, and Commissioners’ Court-approved certificates of obligation as financial resources specifically designated for the purpose of paying contractual obligations incurred in the construction, purchase and maintenance of roads; the purchase of road-related materials, supplies, equipment, and real property; and for the payment of road-related professional services.
Capital Grants Fund – consists of federal, state, and local grants used to account for monies received for capital projects throughout the County. Federal grants are provided by the U.S. Department of Transportation. State grants include those provided by the Texas Department of Transportation and the Texas Parks and Wildlife. Local grants are provided by Capital Metro.
The County reports the following non-major governmental funds:
Special Revenue Funds – used to account for revenues derived from specific revenue sources that are legally restricted to finance specific activities.
Capital Projects Funds – used to account for financial resources specifically designated for capital expenditures.
Debt Service Funds – used to account for the accumulation of resources and the subsequent disbursement of such resources to pay principal and interest on general long-term debt for road districts.
Permanent School Fund – used to account for the principal of a trust fund, in which oil royalties are deposited and can be expended only by order of the Commissioners’ Court.
NT - 9

TRAVIS COUNTY, TEXAS
The County reports the following Proprietary and Fiduciary Funds:
Internal Service Funds – used to account for the activities of the County’s self-insurance program for general and automobile liability; error and omissions claims and judgments; workers’ compensation; employee healthcare services provided to County employees, retirees, and their dependents; and other insurance related expenses. In the government-wide financial statements, the Internal Service Funds are included in governmental activities.
Agency Funds – used to account for assets held by the County as custodian or agent for individuals and other governmental units such as cash bonds, state revenue fees, Lower Colorado River Authority fees, officials’ fee accounts, inmate trust funds, and other similar arrangements.
D. Budgets and Budgetary Accounting The Commissioners’ Court appoints a budget officer who is responsible for preparing a proposed budget and budgeted expenditures may not exceed total budgeted revenues and available resources as estimated by the County Auditor.
The proposed budget for each fiscal year includes estimated revenues and proposed expenditures (by fund, office/department, and cost center) for the General Fund, General Purpose Debt Service Fund, and selected special revenue funds. The Corporations’ and Road Districts’ budgets are approved by their individual Board of Directors, which are solely comprised by members of the Commissioners’ Court. Grants are budgeted based on the grant award and grant fiscal period. The remaining funds not included in the fiscal year 2013 original budget are: CAPSO/DAPSO Fund, Law Enforcement Fund, Jail Commissary Fund, Abandoned Vehicles/Livestock Fund, LEOSE Elected Officials Fund, CSCD Fees Fund, After School Youth Enrichment Services Fund, Motor Vehicle Interest Fund, and the Permanent School Fund.
Public hearings are conducted to obtain taxpayer comments during the budgetary process. The annual appropriations budget is legally adopted by the Commissioners’ Court in the September/October timeframe. There is no difference between the appropriations budget and the Commissioners’ Court-approved expenditure budget.
State law provides that the Commissioners’ Court “may amend the budget to transfer an amount budgeted for one item to another budgeted item.”
The legal level of budgetary control is at the office/department level. The County’s elected/appointed officials, executive managers, and department heads may make transfers of appropriations within an office/department as specified in the Commissioners’ Court-approved annual budget rules. Transfers of appropriations between offices/departments, as specified in the budget rules, require the specific pre-approval of the Commissioners’ Court. A report for all funds is generated that demonstrates budgetary compliance at the office/department level and is available to the public, upon request.
The Commissioners’ Court may adopt a supplemental budget for the limited purpose of spending money from grants or intergovernmental contracts for their intended purpose. During fiscal year 2013, there was $1,967,803 in supplemental budgets adopted by the Commissioners’ Court in the General Fund. No fund or office/department exceeded appropriations for fiscal year 2013. All annual appropriations lapse at fiscal year end.
NT - 10

TRAVIS COUNTY, TEXAS
E. Assets, Liabilities and Fund Balance or Net Position
Deposits and Investments (Cash, Pooled Cash, Certificates of Deposit, and Investments) In the County financial statements cash refers to amounts in demand deposit accounts. Pooled cash refers to the pooling of cash for investment purposes; therefore, pooled cash includes pooled investments.
State statutes regulate the types of investments the County may purchase. Examples of authorized investments that the County may purchase include the following: (1) U.S. Agencies, (2) U.S. Treasury securities, (3) obligations of the State of Texas or its agencies, (4) obligations that the State of Texas or the U.S. Treasury guarantee, (5) municipal bonds, and (6) commercial paper. Investments are stated at fair value, except for “2a7 like” external investment pools which are reported at amortized cost. Fair value is the amount at which an investment could be exchanged in a current transaction between willing parties, other than in a forced or liquidation sale.
For the purpose of cash flows, the Internal Service Funds consider pooled cash, certificates of deposit, and all other highly liquid investments with a maturity of three months or less when purchased to be cash equivalents.
The County’s investment policy requires collateralization with a fair market value equal to at least 105 percent of the County’s funds in excess of $250,000 on deposit in the bank for interest and non-interest bearing accounts.
More information on the County’s deposits and investments can be found in Note 6.
Receivables and Payables
Outstanding balances of lending and borrowing type activities between funds are classified as “due from other funds” and “due to other funds,” respectively, on the fund financial statements. Interfund activity has been eliminated for the government-wide financial statements.
All accounts and taxes receivable are shown net of allowances for uncollectible amounts. Accounts receivable allowances are based on historical collection trends. Allowances for taxes receivable and tax-related receivables, such as enforcement fees and penalties and interest, are also based on historical trends by assessment year. The allowance amount is composed of two different calculations: 1) amounts not anticipated to be collected in a timely manner; and 2) amounts that are anticipated never to be collected.
Restricted Assets Restricted assets are used to differentiate assets, the use of which is restricted by the donor or contractual agreement. The County’s restricted assets represent funds that are in escrow related to a pending land purchase.
Capital Assets Travis County defines capital assets as assets with an initial, individual cost of at least $5,000, with the exception of $100,000 for software, and an estimated useful life of one year or more. The County capitalizes all land and land improvements, regardless of cost.
Capital assets are included only in the government-wide financial statements unless they are associated with proprietary or fiduciary funds. Purchased or constructed capital
NT - 11

TRAVIS COUNTY, TEXAS
assets are recorded at historical or estimated historical value, while donated capital assets are recorded at estimated fair market value at date of donation. The cost of all purchased, constructed, or donated assets is depreciated over the estimated useful life of the specific asset group.
The County’s capital assets are depreciated by using the composite method of depreciation over the estimated useful lives of the following groups:
Asset Groups Years Buildings* 30 Improvements other than buildings 30 Buildings under capital lease 30 Infrastructure** 10 – 45 Machinery, equipment and other assets** 3 – 10 Leasehold improvements 5 Equipment under capital lease 5
* Certain major buildings are not included in group depreciation,
but are depreciated individually over a thirty year original life. ** Denotes multiple groups.
Maintenance or repair costs that do not add to the value or materially extend the useful life of an asset are expensed rather than capitalized. Major outlays for improvements and capital assets are capitalized during the construction phase.
In the fund financial statements, capital asset acquisitions are reported as expenditures of the current period.
Inventory and Prepaid Items In most cases, inventories and prepaid items are recorded as expenditures at the time of purchase in the governmental fund financial statements. There are, however, cases where payments are recorded as prepaid items. The Internal Service Funds and General Fund have prepayments for insurance premiums and flexible spending claims. Such amounts are not significant at year end.
Long-term Debt In the government-wide financial statements, long-term debt and other long-term obligations are reported as liabilities. Bond and certificate of obligation premiums and discounts, as well as issuance costs and gain/loss on refunding, are deferred and amortized over the life of the bonds/certificates using the effective interest method, which is a technique for calculating amortization based on the outstanding value of the debt. Long-term debt obligations are reported net of applicable bond/certificate premium or discount and deferred loss on refunding, while issuance costs are reported as other assets. In the fund financial statements, governmental funds recognize bond and certificate of obligation premiums, discounts, and issuance costs in the current period. The face value of the debt issued and any premiums received on the debt issuance are reported as “other financing sources” while discounts on the debt issuance are reported as “other financing uses.” All issuance costs, whether or not withheld from the actual debt proceeds, are reported as debt service expenditures.
NT - 12

TRAVIS COUNTY, TEXAS
Note 8 gives detailed information regarding the County’s long-term debt service and outstanding debt at September 30, 2013.
Deferred Revenues In the fund financial statements, the County defers all uncollected property taxes (net of estimated uncollectible amounts), unearned grant revenue, and other advance payments. In the Internal Service Funds, premiums collected in advance from employees are deferred until earned.
Arbitrage The Tax Recovery Act of 1986 established regulations for the rebate to the federal government of arbitrage earnings on certain local government bonds and certificates of obligation. Issuing governments must calculate any arbitrage rebate due and remit the amount due at least every five years on each individual series from its respective issuance date.
As of September 30, 2013, the County has an estimated arbitrage rebate liability reported on the government-wide financial statements in other long-term debt in the amount of $63,278. Travis County has elected to account for arbitrage liability as a reduction of revenue rather than a claim or judgment. There will be no recognition in the governmental fund financial statements until rebatable amounts are actually due and payable to the federal government.
Compensated Absences All full-time employees of the County accumulate vacation benefits in varying annual amounts up to a maximum allowable accumulation of 240 hours, with the exception of law enforcement employees who may accumulate unlimited vacation hours. Sick leave benefits are earned by all full-time employees at a rate of twelve days per year and may be accumulated without limit. In the event of termination, an employee is reimbursed for all accumulated vacation days up to a maximum of 20 days or 160 hours, and for one-half of all accrued sick leave up to a maximum of 30 days or 240 hours.
In fiscal year 2013 the County changed its method of estimating the amount of compensated absences that are expected to be liquidated with current expendable resources. Consequently, all compensated absence benefits are accrued when incurred in the government-wide and proprietary fund financial statements. There will be no recognition in the governmental fund financial statements until due and payable.
Transactions Between Funds Transactions between funds that would be accounted for as revenues, expenditures or expenses if they involved organizations external to the County are accounted for as revenues and expenditures in the funds involved. In the fund financial statements, transactions that constitute reimbursements of a fund for expenditures initially made from it, which are properly applicable to another fund, are recorded as expenditures in the reimbursing fund and a reduction of the expenditure in the fund that is reimbursed. All legally authorized transfers are treated as transfers in the financial statements. Interfund activity within the primary government’s governmental activities has been eliminated in the government-wide financial statements. Note 5 gives an analysis of the County’s interfund transactions for fiscal year 2013.
NT - 13

TRAVIS COUNTY, TEXAS
Premium revenues generated by the Internal Service Funds and the corresponding expenses in those funds in the amount of $50,498,992 have been eliminated in the government-wide financial statements.
Net Position/Fund Balance (nonspendable, restricted, committed, etc.) For the government-wide financial statements, restricted net position represents assets that have externally imposed restrictions by creditors, grantors, contributors, or laws or regulations of other governments. Assets may also be restricted as imposed by law through constitutional provisions or enabling legislation. Net investment in capital assets represents capital assets, net of accumulated depreciation and is reduced by outstanding balances for bonds, certificates of obligation, and other debt that is attributed to the acquisition, construction, or improvement of those assets.
When both restricted and unrestricted resources are available, it is the County’s policy to use restricted resources first, then unrestricted resources as they are needed.
Governmental funds are reported in the following classifications:
Nonspendable – Amounts that cannot be spent because they are either not in spendable form or they are required, legally or contractually, to be maintained intact. This classification includes items such as inventories, prepaid amounts, assets held for resale, and long-term receivables.
Restricted – As in the government-wide financial statements, these amounts represent assets that have externally imposed restrictions by creditors, grantors, contributors, or laws or regulations of other governments. Assets may also be restricted as imposed by law through constitutional provisions or enabling legislation.
Committed – Amounts that can only be used for specific purposes pursuant to constraints imposed by formal action of the government’s highest level of decision-making authority. The County’s highest level of decision-making authority resides with the Commissioners’ Court. The constraints imposed by the formal action of the Commissioners’ Court remain binding unless removed or changed in the same manner employed to previously commit those resources.
Assigned – Amounts that are constrained by the County’s intent to be used for specific purposes, but that do not meet the criteria to be restricted or committed. Such intent should be expressed by the Commissioners’ Court or its designated officials to assign amounts to be used. Constraints imposed on the use of assigned amounts can be removed with no formal action.
Included within this category is any appropriation of existing fund balance equal to the amount of the subsequent year’s budgeted expenditures that exceed the budgeted revenues.
Unassigned – Amounts that have not been restricted, committed, or assigned. The General Fund is the only fund that reports unassigned fund balance.
Encumbrances outstanding at the end of fiscal year 2013 were as follows: $20,148,945 in the General Fund, $24,039 in grants, $67,856,669 in debt proceeds, and $8,415,040 in other sources.
For the classification of fund balances in the governmental funds, the County considers an expenditure to be funded from the most restrictive category first when more than one classification is available.
NT - 14

TRAVIS COUNTY, TEXAS
Minimum Fund Balance Policy It is the desire of the County to maintain an adequate fund balance in the General Fund to help maintain liquidity and stability in anticipation of economic downturns or natural disasters. The Financial and Budgeting Guidelines adopted by the Commissioners’ Court state that the County’s goal is to maintain a minimum fund balance between 10% and 12% of total expenditures excluding transfers out in the following three funds: General Fund, Debt Service Fund, and Road and Bridge Fund. This reserve is not dedicated for any specific expenditure, and therefore, in compliance with GASB Statement No. 54, Fund Balance Reporting and Governmental Fund Type Definitions, is reported as unassigned fund balance in the General Fund.
Pension Plans It is the policy of the County to fund pension costs, which consist of normal cost and amortization of unfunded prior service cost, if any, from funds provided from current operations. For more information on the County’s pension plan, see Note 11 of the Notes to the Financial Statements.
F. New Reporting Standards The County is currently reviewing the following GASB Statements and has not determined the impact these statements will have on its financial statements:
GASB Statement No. 65, Items Previously Reported as Assets and Liabilities, is effective for the County beginning fiscal year 2014. This Statement establishes standards for reclassifying certain assets and liabilities as deferred outflows of resources and deferred inflows of resources.
GASB Statement No. 66, Technical Corrections–2012–an amendment of GASB Statements No. 10 and No. 62, is effective for the County beginning fiscal year 2014. As per the title, this Statement contains technical corrections for conflicting guidance that occurred due to the issuances of GASB Statements No. 54 and No. 62. This Statement also amends GASB Statement No. 10 by removing the provision that requires an entity to account for its risk financing activity in the General Fund or Internal Service Fund.
GASB Statement No. 68, Accounting and Financial Reporting for Pensions–an amendment of GASB Statement No. 27 (GASB 68) is effective for the County beginning fiscal year 2015. This statement replaces GASB Statement No. 27 for most government employers. This statement will affect the financial reporting of pension liabilities for governments by requiring them to record the net pension liability on the government-wide financial statements.
GASB Statement No. 69, Government Combinations and Disposals of Government Operations, is effective for the County beginning fiscal year 2015. This statement establishes standards for: (1) disposals of operations; (2) determining whether a combination is a merger, acquisition, or transfer of operations; and (3) measuring the value of assets, liabilities, deferred inflows of resources, and deferred outflows of resources for governments. Prior to this, governments have been using guidance intended for the business sector.
GASB Statement No. 70, Accounting and Financial Reporting for Nonexchange Financial Guarantees, is effective for the County beginning in fiscal year 2014. This statement requires a government involved in a non-exchange financial guarantee to record this amount on their financial statements if certain conditions are met.
NT - 15
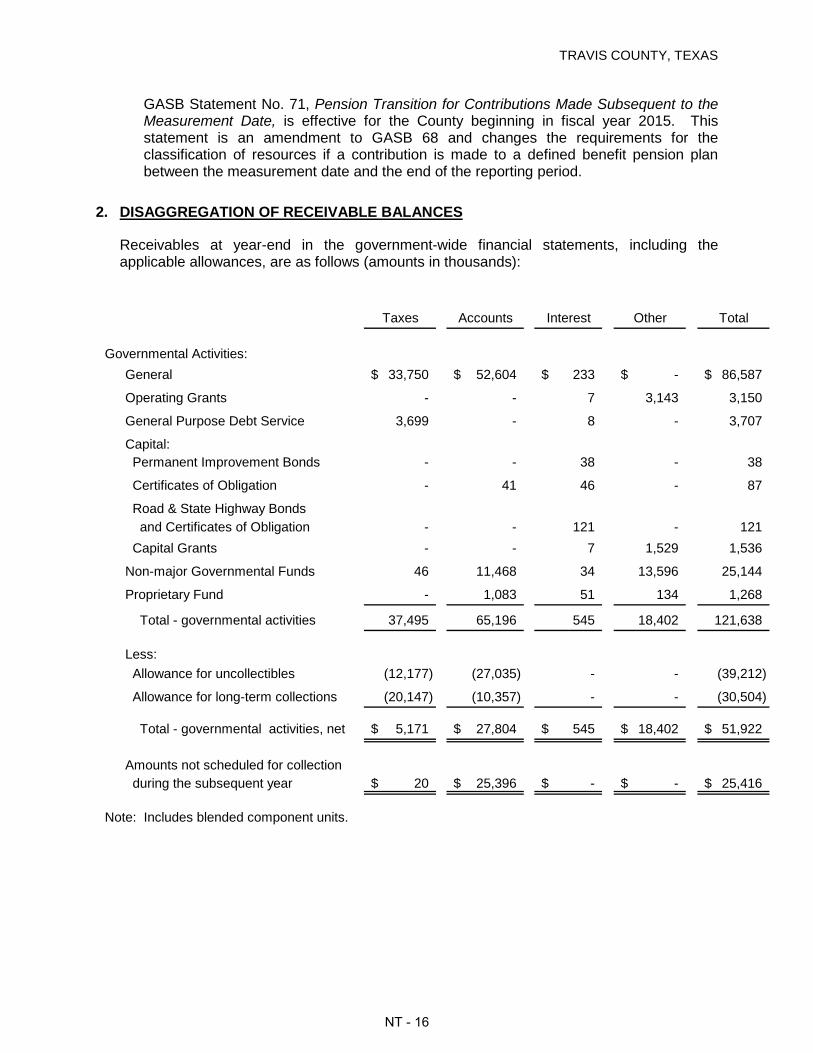
TRAVIS COUNTY, TEXAS
GASB Statement No. 71, Pension Transition for Contributions Made Subsequent to the Measurement Date, is effective for the County beginning in fiscal year 2015. This statement is an amendment to GASB 68 and changes the requirements for the classification of resources if a contribution is made to a defined benefit pension plan between the measurement date and the end of the reporting period.
2. DISAGGREGATION OF RECEIVABLE BALANCES
Receivables at year-end in the government-wide financial statements, including the applicable allowances, are as follows (amounts in thousands):
Taxes Accounts Interest Other Total
Governmental Activities:General 33,750$ 52,604$ 233$ -$ 86,587$
Operating Grants - - 7 3,143 3,150
General Purpose Debt Service 3,699 - 8 - 3,707
Capital: Permanent Improvement Bonds - - 38 - 38
Certificates of Obligation - 41 46 - 87
Road & State Highway Bonds and Certificates of Obligation - - 121 - 121 Capital Grants - - 7 1,529 1,536
Non-major Governmental Funds 46 11,468 34 13,596 25,144
Proprietary Fund - 1,083 51 134 1,268
Total - governmental activities 37,495 65,196 545 18,402 121,638
Less: Allowance for uncollectibles (12,177) (27,035) - - (39,212)
Allowance for long-term collections (20,147) (10,357) - - (30,504)
Total - governmental activities, net 5,171$ 27,804$ 545$ 18,402$ 51,922$
Amounts not scheduled for collection during the subsequent year 20$ 25,396$ -$ -$ 25,416$
Note: Includes blended component units.
NT - 16

TRAVIS COUNTY, TEXAS
3. RECONCILIATION OF GOVERNMENT-WIDE AND FUND FINANCIAL STATEMENTS
A. Explanation of differences between the Governmental Fund Balance Sheet and the Government-wide Statement of Net Position
The governmental fund balance sheet includes a reconciliation between the governmental fund balance on the fund financial statements and total net position of governmental activities on the government-wide financial statements.
The following schedule gives the details of each of the reconciling items:
Governmental fund balance 416,123,655$
Difference due to capital assetsCapital assets (excluding Internal Service Funds) 2,327,212,542 Accumulated Depreciation (excluding (1,104,529,937) 1,222,682,605 Internal Service Funds)
Difference due to receivables and other assetsTaxes receivable (including penalties and interest) 2,056,250 Accounts receivable, net of allowances (excluding Internal Service Funds) 22,653,323 Debt issuance costs 5,463,358 30,172,931
Difference due to current liabilitiesDeferred revenue 3,114,449 Interest payable (2,652,726) 461,723
Difference due to non-current liabilitiesCapital lease obligations (1,330,610) Arbitrage (63,278) Landfill remediation (2,275,000) Other post-employment benefits (52,840,782) Compensated absences (excluding (32,413,717) Internal Service Funds)Debt payable* (663,721,529) (752,644,916)
Difference due to Internal Service FundsNet position of Self-Insurance Fund 11,676,469 Net position of Employee Health Benefit Fund 22,839,204 34,515,673
*Net of unamortized premiums, discounts, and loss of refundings
Government-wide net position 951,311,671$
B. Explanation of differences between the Governmental Fund Statement of Revenues, Expenditures, and Changes in Fund Balances and the Government-wide Statement of Activities
The governmental fund statement of revenues, expenditures, and changes in fund balances includes a reconciliation between the change in governmental fund balance on the fund financial statements and change in total net position of governmental activities on the government-wide financial statements.
NT - 17

TRAVIS COUNTY, TEXAS
The following schedule gives the details of each of the reconciling items:
Change in governmental fund balance 20,953,339$ Amount by which depreciation exceeds capital outlayexpense and other capital related transactionsCapital outlay(1) 76,070,200 Depreciation expense (excludes Internal Service Funds) (92,015,362) Capitalized current expenditures 792,467 Land annexed by other governmental entity (904,546) (16,057,241)
Revenues that do not provide current financial resources(2)
Excess of capital asset donated revenue over disposal revenue 11,682,791 Property tax and penalty and interest revenues (411,159) Accounts receivable, net of allowances 2,968,983 Arbitrage 69,754 14,310,369
Long-term debt and related itemsDebt payments 135,610,130 Debt issuances (includes any premiums/discounts) (129,827,000) Deferral of debt issuance costs (amortized over life of debt) 1,483,762 Accrued interest expense 38,719 Accretion of capital appreciation bond interest (93,400) Amortization of debt premiums 4,908,152 Amortization of debt discounts (31,208) Amortization of debt issuance costs (784,101) Amortization of loss on refunding bonds (2,170,160) 9,134,894
Expenses that do not require the use of current financialresources(2) or have not maturedReduction of landfill liability - non-current 1,320,525 Other post-employment benefits (52,840,782) Compensated absence adjustment - non-current (excludes
Internal Service Funds) (7,547,998) (59,068,255)
Internal Service Funds change in net positionSelf-Insurance Fund (1,158,651) Employee Health Benefit Fund (2,518,778) (3,677,429)
Change in government-wide net position (34,404,323)$
(1) The difference between capital outlay at government-wide compared to in the governmental funds is:capital outlay in the governmental funds 77,841,388$ non-Travis County assets related to road projects (1,500,000) assets owned or maintained by other governmental agencies (506,640) elimination for fund financial statement presentation 235,452
76,070,200$
(2) Eliminations for government-wide statements for current expenditures and revenues are:elimination between General Fund and Grants (96,149)$ elimination for operating lease between General Fund and a grant (284,216)
(380,365)$
NT - 18

TRAVIS COUNTY, TEXAS
4. AD VALOREM (PROPERTY) TAXES
The County’s property tax is levied each October 1 on the assessed value listed as of the prior January 1, the date a lien attaches, for all real and personal property located in the County. The assessment ratio is 100 percent of fair market value for the roll levied October 1. Taxes are due by January 31 following the October 1 statement date and become delinquent on February 1, at which time penalty and interest begin to accrue. Total value for County property on the 2012 tax roll was approximately $100,657,777,296 (net of exemptions) and produced a total levy of $503,473,218, excluding blended component units. Collections on this levy were recognized as revenue in fiscal year 2013 in the governmental fund financial statements.
The County is permitted by Article VIII, Section 9 of the State of Texas Constitution to levy taxes up to $0.80 per $100 of assessed valuation for general governmental services including payment of principal and interest on general obligation long-term debt and maintenance of roads and bridges. Title 6, Chapters 256.052 and 256.054 of Vernon’s Texas Transportation Statutes permits the County to collect an additional $0.15 per $100 assessed valuation for road and bridge purposes and $0.30 per $100 assessed valuation for road and bridge and flood control purposes, respectively. However, for the October 2012 tax roll, all required taxes to be used for general government purposes were levied under Article VIII, Section 9.
At October 1, 2012 (tax levy for fiscal year 2013 revenues) the County tax rate was $0.5001 per $100 valuation, of which $0.0784 was used for payment of long-term debt requirements. The County, therefore, has legal margins of $0.2999, $0.1500 and $0.3000 and could raise up to $301,872,674, $150,986,666 and $301,973,332, respectively, of additional taxes per year from the 2012 tax roll assessed valuation of $100,657,777,296 before the limit is reached.
The appraisal of property within the County is the responsibility of the Travis Central Appraisal District, which is required under the Property Tax Code to assess all property within the appraisal district on the basis of 100 percent of its appraised value, and is prohibited from applying any assessment ratios. The value of property within the County must be reviewed every three years by the appraisal district unless the County, at its own expense, requires more frequent reviews. The County may challenge the appraised values through various appeals and, if necessary, legal action. Under this legislation, the County continues to set tax rates on county property.
Road Districts
Property tax for the road districts is to be levied each October 1 on the assessed value listed as of the prior January 1 for all property within each road district. The Commissioners’ Court will levy and collect taxes within each road district, as required. Debt issued by the road districts is payable from the proceeds of this ad valorem tax to be levied without legal limitation as to rate or amount on all of the taxable property within the road districts. Article III, Section 52 of the State of Texas Constitution, as amended, permits each road district to issue bonds in any amount not to exceed 25 percent of the assessed valuation of the real property of the road district.
As of September 30, 2013, Northwest Travis County Road District No. 3 (NWTCRD No. 3) is one of two active road districts that is ad valorem tax-supported for repayment of debt. The total value for NWTCRD No. 3 property on the 2012 tax roll was approximately $434,914,360 and produced a total levy of $565,389. At October 1, 2012 (tax levy for fiscal year 2013), the NWTCRD No. 3 tax rate was $0.1300 per $100 valuation.
NT - 19

TRAVIS COUNTY, TEXAS
Travis County Bee Cave Road District No. 1 (TCBCRD No. 1) is the other active road district that is ad valorem tax-supported. The total value for TCBCRD No. 1 property on the 2012 tax roll was approximately $158,093,998 and produced a total levy of $1,106,869. At October 1, 2012 (tax levy for fiscal year 2013), the TCBCRD No. 1 tax rate was $0.7000 per $100 valuation.
5. INTERFUND TRANSACTIONS
Although all interfund activity within the County is eliminated in the government-wide financial statements, it remains intact in the fund financial statements.
Interfund transfers for the year ended September 30, 2013 were:
GeneralOperating Purpose Other
General Grants Debt Service Governmental TotalsTransfers out:
General -$ 5,575$ -$ 13,873,988$ 13,879,563$
Operating Grants 3,420 - - - 3,420
Capital: Permanent Improvement Bonds - - 312,900 - 312,900 Certificates of Obligation - - 773,258 - 773,258 Road & State Highway Bonds and Certificates of Obligation - - 533,046 - 533,046
Other Governmental 1,066,441 - - - 1,066,441
Totals 1,069,861$ 5,575$ 1,619,204$ 13,873,988$ 16,568,628$
Transfers in:
Transfers are used to (1) move revenues from the fund that the statute or budget requires to collect them to the fund that the statute or budget requires to expend them, and (2) use unrestricted revenues collected in the general fund to finance various programs accounted for in other funds in accordance with budgetary authorizations.
NT - 20

TRAVIS COUNTY, TEXAS
Interfund receivables and payables at September 30, 2013 were:
GeneralPurpose Other Internal
General Debt Service Governmental Service TotalsDue To: General -$ -$ 3,101$ 76,303$ 79,404$
Operating Grants 2,690,249 - - 627 2,690,876
Capital: Permanent Improvement Bonds - 21 - - 21
Road & State Highway Bonds and Certificates of Obligation - 1,898 - - 1,898
Capital Grants 1,586,841 - - - 1,586,841
Other Governmental 118,908 - - 7,825 126,733
Internal Service - - - 89 89
Totals 4,395,998$ 1,919$ 3,101$ 84,844$ 4,485,862$
Due From:
These balances resulted from the time lag between the dates that interfund services are provided or reimbursable expenditures occur and payments between funds are made. Interfund balances are expected to be repaid within one year from the date of the financial statements and are routine in nature.
6. DEPOSITS AND INVESTMENTS
Deposits
The Commissioners’ Court has developed a formal investment policy for the County that is consistent with state statutes. The County’s policy states they will use the “prudent investor rule” in investment decisions. The objectives of the County’s policy are to ensure the safety of the principal, maintain adequate liquidity, and yield the highest possible return subject to the first two principles.
The County’s investment policy requires collateralization with a fair market value equal to at least 105 percent of their funds in excess of $250,000, the amount insured by the Federal Deposit Insurance Company. The County’s depository agreement with JPMorgan Chase Bank also requires collateralization with a fair market value equal to at least 105 percent of County funds in excess of $250,000 on deposit in the bank for interest bearing accounts and $250,000 on deposit in the bank for non-interest bearing accounts. All of the pledged collateral for the County’s demand deposits and time deposits are U.S. Treasury securities or U.S. Government agency securities. The depository agreements state that collateral shall consist of one or more of the following: United States Treasury securities, Federal National Mortgage Association (Fannie Mae) securities, Federal Farm Credit Bank (FFCB) securities, Federal Home Loan Bank (FHLB) agencies, and Federal Home Loan Mortgage Corporation (Freddie Mac) securities.
NT - 21

TRAVIS COUNTY, TEXAS
This collateral is held by the Federal Reserve Bank of New York, which in the case of default by JPMorgan Chase will act as agent for Travis County, in a fiduciary account held in the name of JPMorgan Chase and Travis County and pledged to Travis County. During fiscal year 2013, collateral coverage was more than the 105 percent of the County’s bank balances required by policy on all days during the year, including September 30, 2013.
Deposits, including non-participating interest earning investment contracts, are stated at cost plus accrued interest, if any, and the carrying amounts are displayed on the balance sheet as “Cash”, “Certificates of Deposit”, or a component of “Pooled Cash”. For cash management, the County has pooled cash and certain investments. At year-end, an individual fund may have a negative balance in pooled cash, in which case the fund reports the negative amount as “due to” the General Fund. Interest revenue from pooled cash is allocated to participating funds monthly on an average daily balance basis. Deposits of blended component units are stated at cost plus accrued interest, if any, and the carrying amounts are displayed on the balance sheet as “Cash and Pooled Cash”.
Investments
The County is authorized to purchase, sell, and invest its funds as well as funds under its control in accordance with the Texas Public Funds Investment Act, Government Code Chapter 2256 and its subsequent amendments, and Travis County Code, Chapter 23, Investment Policy and Procedures. During the fiscal period, the County’s investments consisted of U.S. government securities, U.S. government agency securities, certificates of deposit, commercial paper, participation in three local government investment pools (TexPool, TexasTERM, and TexSTAR), municipal bonds, and a mutual fund. The carrying amount of investments as of September 30, 2013 is displayed on the balance sheet as “Investments” or as a component of “Pooled Cash”.
The County’s adoption of GASB Statement No. 31, Accounting and Financial Reporting for Certain Investments and for External Investment Pools, requires some investments be reported at fair value. TexPool operates in a manner consistent with the SEC’s Rule 2a7 of the Investment Company Act of 1940. TexPool uses amortized cost rather than market value to report net assets to compute share prices. Accordingly, the fair value of the position in TexPool is the same as the value of TexPool shares. The State Comptroller of Public Accounts exercises oversight responsibility over TexPool. Oversight includes the ability to significantly influence operations, designation of management, and accountability for fiscal matters. Additionally, the State Comptroller has established an advisory board composed of both participants in TexPool and other persons who do not have a business relationship with TexPool. The Advisory Board members review the investment policy and management fee structure.
TexasTERM is organized in conformity with the Texas Public Funds Investment Act of the Texas Government Code. It provides for a fixed-rate, fixed-term investment for a period of 60 days to one year and includes TexasDAILY, a portfolio of the Local Government Pool, providing daily access to funds. An Advisory Board, composed of participants in TexasTERM and other parties who do not participate in the Pool, has responsibility for the overall management of the Pool, including formulation and implementation of its Investment and Operating Policies. PFM Asset Management LLC, a leading national financial and investment advisory firm, is the investment advisor to the Pool. TexasTERM’s TexasDAILY portfolio maintains a Net Asset Value of approximately $1 per share and is a Rule 2a7-like pool.
TexSTAR is a local government investment pool organized under the authority of the Interlocal Cooperation Act, Chapter 791, of the Texas Government Code. TexSTAR is governed by a
NT - 22

TRAVIS COUNTY, TEXAS
five-member board of directors composed of three participant members, one representative from J.P. Morgan Investment Management Inc. (JPMIM), and one representative from First Southwest Asset Management to provide for the joint investment of participants’ public funds. JPMIM serves as investment manager to TexSTAR while First Southwest Asset Management provides administrative services, participant support, and marketing services. TexSTAR, a Rule 2a7-like pool, reports its investments using amortized cost rather than market value. TexSTAR maintains a Net Asset Value of approximately $1 per share.
TexPool, TexasTERM, and TexSTAR are rated AAAm by Standard & Poor’s. As a requirement to maintain the rating, weekly portfolio information must be submitted to Standard & Poor’s for review. TexPool is also required to send portfolio information to the office of the State Comptroller of Public Accounts.
As of September 30, 2013, the County had the following investments:
Investment at September 30, 2013
Fair Value Weighted Average
Maturity (Years) Certificates of Deposit $ 21,602,148 N/A Government Agencies 349,645,864 2.53 Government Treasuries 10,264,840 1.86 Mutual Funds 54,766 0.00 Municipal Bonds 8,682,277 0.62 Commercial Paper Local Government Investment Pools
31,690,715 110,985,250
0.20 0.00
Total fair value $ 532,925,860 Portfolio weighted average maturity 1.72
Note: Cash and pooled cash, restricted cash, investments, and certificates of deposit for County funds at September 30, 2013 total $569,493,806. The total fair value amount of $532,925,860 excludes cash of $36,567,946.
Interest Rate Risk. In accordance with its investment policy, the County manages its exposure to declines in fair values by limiting the weighted average maturity of its investment portfolio to 912 days or less. Individual security types are limited as well, with the longest permitted maturity of seven years for government treasuries.
Credit Risk. State law limits investment in municipal bonds to at least an A rating or its equivalent by a nationally recognized investment rating firm, and likewise the County also requires a minimum rating of A or its equivalent. For commercial paper, state law limits investments to a rating not less than A-1 or P-1 by at least two nationally recognized credit rating agencies. The County’s Investment Policy limits commercial paper to a rating not less than A-1 by Standard and Poor’s and P-1 by Moody’s Investors Service. The County does not have credit limits on government agency securities. The County’s investments in government agencies carry the implicit guarantee of the U.S. government. The County’s Investment Policy requires that certificates of deposit be either federally insured or collateralized. For local government investment pools, the County’s Investment Policy requires a continuous rating no lower than AAA or AAAm.
NT - 23

TRAVIS COUNTY, TEXAS
As of September 30, 2013, the ratings of the County’s investments were as follows:
Investment at September 30, 2013 Standard &
Poor's Rating Certificates of Deposit N/A Fannie Mae AA+ Freddie Mac AA+ Federal Home Loan Bank AA+ Federal Farm Credit Bureau AA+ Mutual Funds N/A Municipal Bonds AA-/MIG1 Commercial Paper Local Government Investment Pools
A-1 AAAm
U.S. Treasuries AA+
Concentration of Credit Risk. The concentration of credit risk is the risk of loss attributable to the magnitude of a government’s investment in a single issuer. The County’s Investment Policy limits the percentage of the combined portfolios for each type of eligible investment to reduce the risk of principal loss as follows:
Investment at September 30, 2013
% of Portfolio
Portfolio Limit Certificates of Deposit 4% 50% Government Agencies 65% 75% Government Treasuries 2% 100% Mutual Funds 0% 20% Municipal Bonds 2% 20% Commercial Paper TexPool
6% 8%
20% 50%
TexStar TexasDaily
5% 8%
30% 30%
Information regarding investments in any one issuer that represents five percent or more of the County’s total investments must be disclosed under GASB Statement No. 40, Deposit and Investment Risk Disclosures – an amendment of GASB Statement No. 3, excluding investments issued or explicitly guaranteed by the U.S. government, investments in mutual funds, and investments in external investment pools. At September 30, 2013, the County’s investments which require disclosure are as follows:
Issuer Fair Value % of Portfolio Fannie Mae $ 100,569,485 19% Freddie Mac 99,738,215 18% Federal Farm Credit Bureau 78,648,707 15% Federal Home Loan Bank 70,689,457 13%
NT - 24

TRAVIS COUNTY, TEXAS
7. CAPITAL ASSETS
Capital asset activity for the year ended September 30, 2013 is as follows:
Beginning Reclassifications EndingBalance Increases and Adjustments (Decreases) Balance
Governmental Activities
Capital assets not being depreciated:Land and land improvements 239,080,278$ 16,116,939$ -$ -$ 255,197,217$
Land infrastructure 65,339,140 3,303,528 4,119,787 (904,546) 71,857,909
Construction in progress 76,952,637 13,130,942 (55,084,534) - 34,999,045
Total capital assets not being depreciated 381,372,055 32,551,409 (50,964,747) (904,546) 362,054,171
Capital assets being depreciated:
Property, plant, and equipment:Buildings 494,466,985 9,265,788 8,689 - 503,741,462
Improvements other than buildings 72,691,436 1,293,415 19,470,467 - 93,455,318
Machinery and equipment 142,104,125 24,437,591 618,812 (13,184,661) 153,975,867
Assets under capital lease 2,219,194 - - - 2,219,194
Leasehold improvements 961,528 55,001 - - 1,016,529
Infrastructure (other than land) 1,160,322,041 21,296,340 30,866,779 (1,206,664) 1,211,278,496
Total capital assets being depreciated 1,872,765,309 56,348,135 50,964,747 (14,391,325) 1,965,686,866
Less accumulated depreciation:Property, plant, and equipment:
Buildings (137,810,747) (13,900,774) (40) - (151,711,561)
Improvements other than buildings (16,728,909) (2,475,775) - - (19,204,684)
Machinery and equipment (96,804,138) (14,282,669) 366,029 12,830,575 (97,890,203)
Assets under capital lease (388,453) (377,241) (366,029) - (1,131,723)
Leasehold improvements (376,854) (213,336) - - (590,190)
Infrastructure (other than land) (774,594,816) (60,769,050) 40 1,206,664 (834,157,162)
Total accumulated depreciation (1,026,703,917) (92,018,845) - 14,037,239 (1,104,685,523) Total capital assets being depreciated, net 846,061,392 (35,670,710) 50,964,747 (354,086) 861,001,343
Total capital assets, net 1,227,433,447$ (3,119,301)$ -$ (1,258,632)$ 1,223,055,514$
Note: Decreases include retirements and other dispositions.
NT - 25

TRAVIS COUNTY, TEXAS
Depreciation expense in fiscal year 2013 was charged to functions/programs of the primary government as follows:
DepreciationGovernmental Activities Expense
General government 10,334,829$ Justice system 2,657,506 Public safety 2,702,199 Corrections and rehabilitation 6,697,415 Health and human services 2,431,069 Infrastructure and environmental services 64,142,230 Community and economic development 3,053,597
Total depreciation expense 92,018,845$
Construction in progress consists of the following at September 30, 2013:
AmountRoads (overlay and road expansion projects) 24,342,266$ Onion Creek and other park projects 4,990,458 Drainage Systems 2,095,470 Bridges 2,091,898 Land infrastructure (parks & open space) 1,104,746 County-wide ERP System 195,332 Sidewalks 178,875
Total construction in progress 34,999,045$
Description
NT - 26

TRAVIS COUNTY, TEXAS
8. LONG-TERM DEBT
The following is a summary of long-term debt transactions of the County, including blended component units, for the year ended September 30, 2013.
Beginning Balance Additions Reductions Ending Balance
Due Within One Year
Governmental ActivitiesDebt payable:
General obligation bonds 240,960,000$ 43,975,000$ (41,840,000)$ 243,095,000$ 12,360,000$ Refunding bonds1 178,516,335 55,433,400 (55,345,000) 178,604,735 20,200,000 Certificates of obligation 236,090,000 21,025,000 (32,480,000) 224,635,000 24,735,000
655,566,335 120,433,400 (129,665,000) 646,334,735 57,295,000 Less deferred amounts:
Loss on refundings (5,326,456) (5,126,681) 2,522,219 (7,930,918) -
Add:Unamortized discounts (319,510) - 31,208 (288,302) - Unamortized premiums 21,543,658 9,487,000 (5,424,644) 25,606,014 -
Total debt payable 671,464,027 124,793,719 (132,536,217) 663,721,529 57,295,000
Capital leases 1,745,750 - (415,140) 1,330,610 429,006 Claims and judgments2 13,421,543 59,083,591 (55,872,502) 16,632,632 11,511,235 Compensated absences 33,188,492 30,823,966 (31,471,427) 32,541,031 16,047,230
Other long-term liabilities:Arbitrage 133,032 - (69,754) 63,278 56,063 Landfill post-closure care 3,595,525 - (1,320,525) 2,275,000 60,000 Other post-employment
benefits - 52,840,782 - 52,840,782 -
Total long-term liabilities 723,548,369$ 267,542,058$ (221,685,565)$ 769,404,862$ 85,398,534$
1 Addition to the refunding bonds includes $93,400 for accretion of interest on the capital appreciation bonds.2 Beginning balance for claims and judgments is restated for change from statutory basis to GAAP (see Note 15).
At September 30, 2013, $18,264,468 was available in the debt service funds (including blended component units in the amount of $380,250) to service the long-term debt requirements. The general obligation debt payable in the government-wide financial statements includes cumulative accretion of interest on capital appreciation bonds in the amount of $559,748. The unaccreted interest on the capital appreciation bonds is $403,966.
The Internal Service Funds predominantly serve the governmental funds. Accordingly, long-term liabilities, including claims and judgments and compensated absences, reported in those funds are included as part of the above totals for governmental activities. At year end, $127,314 of the Internal Service Funds compensated absences was included in the above amounts. As they relate to the governmental funds, the liabilities for arbitrage are typically liquidated by capital projects funds; liabilities for landfill post-closure care are typically liquidated by the General Fund; and liabilities for compensated absences are typically liquidated by the General Fund and special revenue funds.
Long-Term Debt Long-term debt of the County consists of various issues of general obligation and refunding bonds and certificates of obligation. General obligation bonds include permanent improvement bonds, road bonds, and state highway system bonds. Permanent improvement and road bonds require voter approval at a public election before issuance, while certificates of
NT - 27

TRAVIS COUNTY, TEXAS
obligation, refunding, and state highway system bonds are issued upon the vote of the Commissioner’s Court. General obligation, including state highway system bonds, refunding bonds and certificates of obligation are backed by the full faith and credit of the County. Debt service is primarily paid from ad valorem taxes.
Original OutstandingBalance Balance
General Obligation BondsUnlimited Tax Road Bonds
Series 2004 7,830,000$ 3.38 - 4.38 2005 - 2024 380,000$ Series 2005 1,150,000 3.75 - 4.38 2006 - 2025 110,000 Series 2006 16,110,000 4.00 - 5.00 2007 - 2026 8,180,000 Series 2007 35,725,000 4.00 - 4.50 2008 - 2027 28,500,000 Series 2008 23,230,000 3.50 - 4.50 2009 - 2028 19,640,000 Series 2008 (TCBCRD No. 1) 14,725,000 4.00 - 5.88 2009 - 2032 12,850,000 Series 2009 6,980,000 3.00 - 4.00 2010 - 2029 6,095,000 Series 2010 3,610,000 2.00 - 4.13 2011 - 2030 3,225,000 Series 2011 3,765,000 2.00 - 4.50 2012 - 2031 3,530,000 Series 2012 21,920,000 2.00 - 3.25 2013 - 2032 21,400,000 Series 2013 33,220,000 2.00 - 4.00 2014 - 2033 33,220,000
Limited Tax Permanent Improvement BondsSeries 2004 4,090,000 3.30 - 4.30 2005 - 2024 200,000 Series 2005 3,940,000 3.25 - 4.25 2006 - 2025 370,000 Series 2006 44,010,000 4.00 - 5.00 2007 - 2026 22,030,000 Series 2007 21,005,000 4.00 - 5.00 2008 - 2027 16,760,000 Series 2008 3,795,000 4.00 - 4.38 2009 - 2028 3,230,000 Series 2009 6,705,000 3.00 - 4.00 2010 - 2029 5,855,000 Series 2010 11,315,000 2.00 - 4.13 2011 - 2030 10,095,000 Series 2011 1,855,000 2.00 - 4.50 2012 - 2031 1,735,000 Series 2012 32,240,000 1.50 - 3.38 2013 - 2032 31,470,000 Series 2013 10,755,000 1.50 - 3.25 2014 - 2033 10,755,000
Limited Tax State Highway System BondsSeries 2012 3,500,000 1.50 - 3.38 2013 - 2032 3,465,000
311,475,000 243,095,000
Refunding BondsLimited Tax Refunding Bonds
Series 2004 33,455,000 2.50 - 5.00 2005 - 2020 3,585,000 Series 2005 30,745,000 3.50 - 5.50 2008 - 2016 9,270,000 Series 2009 31,905,000 2.00 - 5.00 2010 - 2019 13,205,000 Series 2010 27,090,000 2.00 - 5.00 2011 - 2022 18,850,000 Series 2010A 22,460,000 2.00 - 5.00 2012 - 2023 8,935,000 Series 2012 33,660,000 2.00 - 5.00 2014 - 2026 33,660,000 Series 2012 Taxable 21,680,000 0.30 - 2.15 2013 - 2020 20,895,000
Unlimited Tax Refunding BondsSeries 2005 53,670,000 3.50 - 5.50 2008 - 2022 47,260,000Series 2005 (NWTCRD No. 3) 4,765,000 3.00 - 4.00 2005 - 2014 600,000 Series 2006 23,470,000 3.65 - 4.38 2007 - 2022 21,470,000
Capital Appreciation Bonds Principal * 4.25 2016 - 2020 314,987$ Accretion of Interest 559,748 CAB Series Maturities 874,735
282,900,000 178,604,735
Certificates of ObligationLimited Tax
Series 2006 23,925,000 4.00 - 4.40 2007 - 2026 2,425,000 Series 2007 26,705,000 4.00 - 4.40 2008 - 2027 11,435,000 Series 2007-A 24,500,000 4.00 - 5.00 2009 - 2028 20,295,000 Series 2008 23,175,000 3.25 - 4.25 2009 - 2028 7,830,000 Series 2009 17,730,000 2.00 - 2.38 2010 - 2014 3,735,000 Series 2010 Taxable 14,305,000 0.74 - 4.15 2011 - 2018 9,640,000 Series 2010 100,305,000 2.00 - 5.00 2011 - 2030 91,705,000 Series 2011 Taxable 22,715,000 0.47 - 4.21 2012 - 2021 18,790,000 Series 2011 20,355,000 2.00 - 5.00 2012 - 2031 15,405,000 Series 2012 27,150,000 2.13 - 4.00 2013 - 2017 22,350,000 Series 2013 21,025,000 3.00 - 3.38 2014 - 2018 21,025,000
321,890,000 224,635,000 Total Bonds and Certificates of Obligation Payable 916,265,000$ 646,334,735$
* effective interest rate
Note: This chart includes blended component units.
Interest Rate MaturityIssue Range (%) Dates
NT - 28

TRAVIS COUNTY, TEXAS
Debt Service Requirements:
The annual debt service requirements for all general obligation bonds and certificates of obligation outstanding at September 30, 2013, including blended component units, are as follows:
Maturity Principal Interest Principal Interest Principal Interest Total2014 12,360,000$ 9,007,025$ 20,200,000$ 7,147,934$ 24,735,000$ 9,123,388$ 82,573,347$ 2015 12,625,000 8,139,407 22,060,000 6,227,402 21,690,000 8,126,183 78,867,992 2016 12,815,000 7,707,867 21,819,507 6,017,181 22,260,000 7,318,208 77,937,763 2017 13,330,000 7,262,438 21,434,780 5,267,661 20,405,000 6,571,557 74,271,436 2018 13,855,000 6,803,513 21,285,000 3,734,277 14,145,000 5,980,813 65,803,603
2019-2023 69,260,000 26,755,585 60,490,448 9,230,903 50,370,000 22,807,546 238,914,482 2024-2028 72,865,000 13,320,338 11,315,000 527,625 52,855,000 10,922,018 161,804,981
2029-2033 35,985,000 2,781,160 - - 18,175,000 949,719 57,890,879 243,095,000$ 81,777,333$ 178,604,735$ 38,152,983$ 224,635,000$ 71,799,432$ 838,064,483$
General Obliation Bonds Refunding Bonds Certificates of Obligation
Defeased Debt:
In fiscal year 2013, the County used unspent proceeds from 2001 voter-approved Proposition 3 bonds to partially defease debt remaining that related to those bonds in the amount of $19,935,000. The unspent proceeds were deposited in an irrevocable trust with an escrow agent. On September 30, 2013 defeased debt remaining unredeemed or unmatured amounted to $15,035,000.
On September 30, 2013 defeased debt remaining unredeemed or unmatured from the 2010A, 2012, and 2012 (taxable) refunding issuances amounted to $745,000, $34,570,000 and $20,085,000, respectively.
In September 1994, Southwest Travis County Road District No. 1 (SWTCRD No. 1) issued, delivered, and exchanged Special Assessment Refunding bonds for its previously issued Unlimited Tax Refunding bonds, Series 1990. Except for $10,000 of unredeemed coupon bonds from the original 1985 issuance, all debt of SWTCRD No. 1 has been defeased, redeemed, or matured.
Refunded Debt:
In prior years, the County has issued refunding bonds to advance refund certain general obligation bonds, refunding bonds and certificates of obligation. The proceeds of the refunding bonds were deposited in an irrevocable trust with an escrow agent. The funds were used to purchase government securities, which will provide for all future debt service requirements.
In November 2012, the County issued Tax-Exempt Limited Tax Refunding Bonds in the amount of $33,660,000. Proceeds from the sale were used to provide monies to advance refund previously issued Limited and Unlimited Tax Bonds and Limited Tax Certificates of Obligation totaling $36,560,000. The County realized an economic gain of $2,381,470 on a savings of $2,782,518.
Also in November 2012, the County issued Taxable Limited Tax Refunding Bonds in the amount of $21,680,000. Proceeds from the sale were used to provide monies to advance refund previously issued Limited Tax Refunding Bonds totaling $20,085,000. The County realized an economic gain of $1,362,639 on a savings of $1,453,894.
NT - 29

TRAVIS COUNTY, TEXAS
New Debt:
In May 2013, the County issued $33,220,000 in Unlimited Tax Road Bonds, Series 2013. This issuance is part of the $132,840,000 authorization approved on November 8, 2011. These bonds carry interest rates ranging from 2.0 percent to 4.0 percent. The road bonds mature in varying amounts in each of the years 2014 to 2033.
The County also issued $10,755,000 of Limited Tax Permanent Improvement Bonds, Series 2013. This issuance is part of the $82,105,000 authorization approved on November 8, 2011. These bonds carry interest rates ranging from 1.5 percent to 3.25 percent and mature in varying amounts in each of the years 2014 to 2033.
In addition to the bonds, the County also issued $21,025,000 in Limited Tax Certificates of Obligation, Series 2013. The proceeds, including a premium in the amount of $1,532,762, are to be used for the following:
1. $13,146,016 for building construction and improvements;
2. $3,551,500 to upgrade software and computer equipment;
3. $2,866,342 for road and bridge projects;
4. $2,302,015 for a firefighting aircraft;
5. $588,989 for various other capital projects;
6. $102,900 for cost of issuance.
The certificates, bearing an interest rate ranging from 3.0 percent to 3.375 percent, will mature in varying amounts in each of the years 2014 to 2018.
All new tax-exempt debt issued is subject to the federal arbitrage regulations discussed in Note 1.
Future Borrowing:
In a county-wide bond election held on November 7, 2000 (2000 Election), the electorate authorized the County to issue an additional $28,000,000 of unlimited tax road bonds. Of the total of the County’s $27,300,000 Certificates of Obligation, Series 2001 (Series 2001 Certificates), $4,000,000 was issued for road building purposes in-lieu-of a like amount of road bonds authorized by the 2000 Election. The County agreed and covenanted that it would not issue a like amount of the voter authorized road bonds, thereby leaving $24,000,000 of the road bonds authorized by the 2000 Election remaining to be issued in the future and unencumbered by such “in-lieu-of” covenants. In 2002, $22,000,000 of unlimited tax road bonds was issued as part of Series 2002-A pursuant to the 2000 Election and an additional $1,515,000 was issued in 2012, thereby leaving $485,000 of the road bonds authorized by the 2000 Election to be issued in the future.
In a county-wide bond election held on November 6, 2001 (2001 Election), the electorate authorized the County to issue an additional $156,355,000 of unlimited tax road bonds of which $89,330,000 was issued in 2002, $31,660,000 in 2003, $7,830,000 in 2004, $1,150,000 in 2005, $3,345,000 in 2006, $19,900,000 in 2007, and $950,000 in 2008, thereby leaving $2,190,000 to be issued in the future. Also authorized by the electorate in the 2001 Election were $28,600,000 limited tax permanent improvement bonds for County parks, of which $13,000,000 was issued in 2002, $4,335,000 in 2003, $4,090,000 in 2004, $3,940,000 in 2005, and $3,035,000 in 2006, thereby leaving $200,000 to be issued in the future.
NT - 30

TRAVIS COUNTY, TEXAS
In a county-wide bond election held on November 8, 2011 (2011 Election), the electorate authorized the County to issue an additional $132,840,000 of unlimited tax road bonds of which $20,405,000 was issued in 2012 and $33,220,000 was issued in 2013, thereby leaving $79,215,000 to be issued in the future. Also authorized by the electorate in the 2011 Election were $82,105,000 limited tax permanent improvement bonds for County parks, of which $32,240,000 was issued in 2012 and $10,755,000 was issued in 2013, thereby leaving $39,110,000 to be issued in the future.
Other Debt Capital Leases:
In October 2010, Travis County entered into a five-year capital lease with Motorola Inc. for the purchase of hand-held radios to be funded by the General Fund. The County agreed to make installment payments over five years beginning with November 1, 2011, and will retain ownership of the radios at the end of the lease period. Assets acquired under this capital lease are as follows:
GovernmentalDescription Activities
Radios 2,219,194$ Less: accumulated depreciation (1,131,723)
Total 1,087,471$
Future minimum lease payments under this capital lease are as follows:
LeaseFiscal Year Payments
2014 473,444$ 2015 473,444 2016 473,444
Total minimum lease payments 1,420,332
Less amount representing interest (89,722) Present value of net minimum lease payments 1,330,610$
Landfill Remediation:
State and federal laws and regulations require the County to place final covers on its landfill sites when waste acceptance has stopped and to perform certain maintenance and monitoring functions after closure. All County landfills have reached 100 percent capacity and are no longer accepting waste. The County has estimated the current cost of post-closure care to be $2,275,000. The nature of the cost estimates includes ground water monitoring, annual maintenance, and development of a permanent leachate treatment/disposal system. Actual costs may be higher due to inflation, deflation, changes in technology, or changes in laws or regulations. There are currently no assets restricted for payment of landfill costs. Future costs may be covered by the County’s various general revenue sources, statutorily allowed debt issuances, or both.
NT - 31

TRAVIS COUNTY, TEXAS
9. CONDUIT DEBT OBLIGATIONS
From time to time the Corporations established by Travis County have issued conduit debt in the name of the Corporations to provide financial assistance to private sector entities for various purposes of public interest. The obligation for repayment of the debt rests with the private party benefiting from the proceeds of such debt. Neither the County nor the Corporations are obligated in any manner for repayment of the debt. Accordingly, the borrowings are not reported as liabilities in the accompanying financial statements. These obligations typically include private entities providing credit enhancements collateralized by underlying assets.
The estimated amount of conduit debt outstanding at September 30, 2013 is as follows:
Travis County Housing Finance Corporation 147,528,874$
Travis County Health Facilities Development Corporation 225,965,000
Capital Industrial Development Corporation 9,430,000
Travis County Cultural Education Facilities Finance Corporation 20,735,000
Total 403,658,874$
10. OPERATING LEASES
Travis County is committed under various leases for buildings and office space. These leases are considered for accounting purposes to be operating leases. Lease expenditures for the year ended September 30, 2013 amounted to $1,420,053. Future minimum lease payments for these leases are as follows:
Fiscal YearFuture MinimumLease Payments
2014 1,211,815$ 2015 1,061,619 2016 415,519 2017 95,219 2018 95,219
2019-2023 169,881 2024-2028 169,881 2029-2033 169,881 2034-2038 101,928
Total 3,490,962$
NT - 32

TRAVIS COUNTY, TEXAS
11. RETIREMENT PLAN
Plan Description
Travis County provides retirement, disability, and death benefits for all of its non-temporary employees through a nontraditional defined benefit pension plan in the Texas County and District Retirement System (TCDRS). The Board of Trustees of TCDRS is responsible for the administration of the statewide agent multiple-employer public employee retirement system consisting of 641 nontraditional defined benefit pension plans. TCDRS issues an aggregated comprehensive annual financial report (CAFR) on a calendar year basis. The CAFR is available upon written request from the TCDRS Board of Trustees at P.O. Box 2034, Austin, Texas 78768-2034, and online at www.tcdrs.org.
The plan provisions are adopted by the governing body of each employer within the options available in the state statutes (TCDRS Act) governing TCDRS. Members can retire at age sixty and above with at least eight years of service; with thirty years of service regardless of age; or when the sum of their age and years of service equals seventy-five or more. Generally, members are vested after eight years of service, but must leave their accumulated contributions in the plan to receive any employer-financed benefit. Additionally, members with prior service at certain qualifying organizations may also be able to use that service time to qualify for benefits. Members who withdraw their personal contributions upon termination forfeit pension benefits provided by their employer. Cost-of-living adjustments (COLA) are provided at the discretion of the Commissioners’ Court.
Benefit amounts are determined by the sum of the employee’s accumulated contributions with interest (personal account balance) and employer-financed monetary credits. The level of these monetary credits is adopted by the governing body of the employer within the actuarial constraints imposed by the TCDRS Act so that the expected benefits can be adequately financed by the employer’s commitment to contribute. At retirement, death or disability, the benefit is calculated by converting the sum of the employee’s personal account balance and the employer-financed monetary credits to a monthly annuity using the actuarial equivalent as prescribed by the TCDRS Act.
Funding Policy
The County has elected the annually determined contribution rate plan provisions of the TCDRS Act. Under the TCDRS Act, the County has the option of selecting the plan benefits to provide in the future, while at the same time considering the level of the employer contribution rate required to adequately finance the plan. The plan is funded by monthly contributions from both employee members and the employer based on the covered payroll of those employees. The contribution rate of the employer is actuarially determined annually on a calendar year basis using the entry age actuarial cost method. The rate consists of a normal cost contribution rate plus the rate required to amortize the unfunded actuarial accrued liability (UAAL) over the plan’s amortization period. The UAAL is amortized over a 20-year closed amortization period; however, the period for amortizing increases or decreases in the UAAL due to elected plan changes effective after January 1, 2009 are amortized over a closed 15-year period. The actuarially determined contribution rates for calendar years 2013, 2012, and 2011 were 12.89%, 12.27% and 11.69%, respectively. The required contribution rate payable by the employee members for calendar year 2013 was 7.00% as adopted by the Commissioners’ Court. Both the employee contribution rate and the employer contribution rate may be changed by Commissioners’ Court within the options available in the TCDRS Act. The TCDRS Act states that the
NT - 33

TRAVIS COUNTY, TEXAS
County’s contribution rate may not exceed 11% of payroll unless the Commissioners’ Court elects to waive this limitation.
Annual Pension Cost
For fiscal year 2013, the County’s annual pension cost for the TCDRS plan was equal to the actual contributions of $35,294,219. Each annual required contribution was actuarially determined as a percentage of the covered payroll of the participating employees, and was in compliance with GASB Statement No. 27, Accounting for Pensions by State and Local Governmental Employers, parameters based on the actuarial valuations as of December 31, 2010 and December 31, 2011, the basis for determining the contribution rates for calendar years 2012 and 2013. The December 31, 2012 actuarial valuation is the most recent valuation.
Actuarial valuation date 12/31/2010 12/31/2011 12/31/2012Actuarial cost method Entry Age Entry Age Entry AgeAmortization method Level percentage Level percentage Level percentage
of payroll, closed of payroll, closed of payroll, closedAmortization period 20 20 20Asset valuation method *SAF: 10-yr *SAF: 10-yr *SAF: 10-yr
smoothed value smoothed value smoothed value**ESF Fund Value **ESF Fund Value **ESF Fund Value
Actuarial Assumptions:Investment return 8.00% 8.00% 8.00%Projected salary increases 5.40% 5.40% 5.40%Inflation 3.50% 3.50% 3.50%Cost-of-living adjustments 0.00% 0.00% 0.00%
* The Subdivision Accumulation Fund (SAF) contains an account for each participating employee to fund retirement benefits.
** The Employee Savings Fund (ESF) contains an account for each member employee.
Actuarial Valuation Information
Annual Percentage NetFiscal Pension of APC Pension
Year Ending Cost (APC) Contributed Obligation
9/30/2011 29,696,627$ 100% $0
9/30/2012 31,791,705$ 100% $0
9/30/2013 35,294,219$ 100% $0
Trend InformationFor the Retirement Plan for the Employees of Travis County
NT - 34

TRAVIS COUNTY, TEXAS
Actuarial UAAL as aActuarial Accrued Unfunded Annual Percentage
Actuarial Value of Liability (AAL) AAL Funded Covered of CoveredValuation Assets Entry Age (UAAL) Ratio Payroll Payroll
Date (a) (b) (b - a) (a / b) (c) ((b - a) / c)12/31/2010 734,076,781$ 858,901,388$ 124,824,607$ 85.47% 251,116,217$ 49.71%12/31/2011 777,920,704$ 923,057,907$ 145,137,203$ 84.28% 255,175,972$ 56.88%12/31/2012 826,309,913$ 990,813,568$ 164,503,655$ 83.40% 265,667,051$ 61.92%
Note: The funded ratio in the above schedule is the most current information available from TCDRS as of the date of this report.
Schedule of Funding Progress for the Retirement Plan
12. POST-EMPLOYMENT BENEFITS OTHER THAN PENSION BENEFITS
Plan Description
Retired County employees and their dependents are eligible under certain conditions to elect continued coverage for Other Post-employment Benefits (OPEB), including medical and prescription drug benefits, under the County’s healthcare plan upon retirement. The County currently contributes to the premium charged for such benefits for eligible retirees. To be eligible for the County subsidy in years where the benefit is provided, one must be a County retiree or dependent of a County retiree and covered at time of retirement. As of September 30, 2013, there are 1,530 retirees and their beneficiaries; however, based on the County’s plan, only 1,047 retirees and beneficiaries qualified for and elected the fiscal year 2013 plan. The plan is a single employer plan and is administered by UnitedHealthcare. In addition, the County purchases stop-loss insurance for claims that exceed a determined threshold. The plan does not issue a stand-alone financial report, as there are no assets legally segregated for the sole purpose of paying benefits under the plan. As such, a separate, audited GAAP-basis post-employment benefit plan report is not available.
Funding Policy
The Commissioners’ Court, as the governing body of the County, is under no legal obligation to pay or otherwise subsidize retiree premiums and approves OPEB on a year-to-year basis during the annual budget process. The plan is funded on a pay-as-you-go basis and provides for separate rate schedules for both active employees and retirees. For fiscal year ended September 30, 2013, the County contributed $6,768,004, while the retiree’s contributed $1,128,342 for a total contribution of $7,896,346. Monthly contribution rates are dependent upon level of coverage selected and number of dependents covered. The County’s monthly contribution rates per retiree for retirees under the age of 65 range from $1,268 to $1,495 and $370 to $416 for retirees over 65. Retirees under age 65 contributed from $119 to $1,293 per month while retirees over age 65 contributed $37 per month to $509 per month.
NT - 35

TRAVIS COUNTY, TEXAS
Annual OPEB Cost and Net OPEB Obligation
In June 2004, the Governmental Accounting Standards Board (GASB) issued Statement No. 45 (GASB 45), creating accounting standards for OPEB provided by governmental entities separate from a pension plan. This statement establishes standards for the measurement, recognition, and display of OPEB expenses/expenditures and related liabilities, note disclosures, and if applicable required supplemental information (RSI) in the financial reports of state and local governments. The County implemented the requirements of GASB 45 during the fiscal year ended September 30, 2013.
The County’s annual OPEB cost (expense) was calculated based on the annual required contribution of the employer (ARC), an amount actuarially determined in accordance with GASB 45. The ARC represents a level of funding that, if paid on an on-going basis, is projected to cover the “normal cost”, as defined by GASB 45, each year and amortize any unfunded actuarial liabilities over a period not to exceed thirty years.
The County’s ARC for the year was $59,608,786, which was comprised of normal cost of $36,830,855 and the amortization of the unfunded actuarial accrued liability of $22,777,931. The County’s annual OPEB cost, employer contribution, percentage of annual OPEB cost contributed to the plan, and the net OPEB obligation for 2013 is as follows:
Fiscal Percentage ofYear Annual Employer Annual OPEB Net OPEB
Ended OPEB Cost Contributions Cost Contributed Obligation9/30/13 59,608,786$ 6,768,004$ 11.4% 52,840,782$
Travis County Trend Information
Funded Status and Funding Progress
As of October 1, 2012, the initial and most recent actuarial valuation date, the County’s plan was 0% funded, resulting in an unfunded actuarial accrued liability (UAAL) of $502,849,126. The covered payroll (annual payroll of active employees covered by the plan) was $274,668,850. The ratio of the UAAL as a percentage of covered payroll was 183%.
The Schedule of Funding Progress presented as required supplementary information following the notes to the financial statements, presents the results of OPEB valuations as of October 1, 2012. The schedule will be updated each year to eventually provide multi-year trend information about whether the actuarial values of plan assets are increasing or decreasing over time relative to the actuarial accrued liabilities for benefits.
Methods and Assumptions
Projections of benefits for financial reporting purposes are based on the County’s current plan and include the types of benefits that the Commissioners’ Court has approved for the fiscal year. The actuarial calculations reflect a long-term perspective and employ methods and assumptions that are designed to reduce short-term volatility in actuarial accrued liabilities and the actuarial value of assets. In order to perform the valuation, it was necessary for the County and the actuary to make certain assumptions regarding items such as rates of employee turnover, retirement, and mortality, as well as economic assumptions regarding healthcare trends and interest rates.
NT - 36

TRAVIS COUNTY, TEXAS
In the October 1, 2012 actuarial valuation, a 4% discount rate was used and the initial health care cost trend rate was assumed to be 7.25%, reduced to an ultimate rate of 4.5% in 2082. Inflation was assumed to be 2.5%, compounded annually. The actuarial cost method used in valuing the County’s liabilities was the projected unit credit cost method. Under this method the benefits of each individual included in the valuation were allocated by a consistent formula over the years. The UAAL is being amortized over 30 years as a level percentage of pay, on an open basis. Payroll was assumed to increase 2% annually.
Additional Disclosures Since 1991, the County has included communications both in information provided to employees and in the previously issued annual financial statements which specifically state that the decision to provide funding, if any, for OPEB is made on an annual basis by the Commissioners’ Court. County financial statements have consistently acknowledged an annual OPEB plan in each year that the Commissioners’ Court adopted a plan, which may vary from year to year. Additionally, the County does not participate in any collective bargaining agreements which would impose obligations for post-employment healthcare benefits. Under Texas law, the County has no legally enforceable liability beyond the 2014 fiscal year.
GASB 45 requires governmental organizations to recognize an actuarially calculated accrued liability for OPEB, even though it may not have a legally enforceable obligation to pay benefits. The County implemented GASB 45 during fiscal year 2013. Accordingly, information and amounts presented in the County’s Comprehensive Annual Financial Report relative to OPEB expense/expenditures, related liabilities, note disclosures, and supplementary information are only intended to achieve compliance with the requirements of generally accepted accounting principles and do not constitute nor imply that the County has made a commitment or is legally obligated to provide OPEB benefits.
13. SELF-INSURANCE
From October 1, 1994 to September 30, 2001, the County purchased insurance for employee accident and health claims. On October 1, 2001, the County began financing employee health through risk retention (self-insurance) for employee and retiree health care coverage, which is reported in an internal service fund, the Travis County Hospital and Insurance Fund-County Employees. On August 16, 2005 the Commissioners’ Court dissolved the Travis County Hospital and Insurance Fund-County Employees and transferred all assets, liabilities, and claims to the newly formed Employee Health Benefit Fund effective October 1, 2005. The new fund operates under Texas Local Government Code Annotated, Chapter 157.101. The fund charges premiums to other funds for servicing and payment of claims. The fund also charges a premium to employees for their dependents and to retirees and their dependents who participate in the plan.
Risk management activities, other than employee health, are also reported in an internal service fund, the Travis County Self-Insurance Fund. The County has financed its risk of loss through risk retention (self-insurance) for general liability, automobile liability, error and omissions claims and judgments, and workers’ compensation since January 1, 1989. The fund charges premiums to other funds for servicing and payment of claims.
The County purchases insurance coverage for aviation damage and liability, public dishonesty, professional liability, and property damage. Insurance coverage is purchased for excess workers’ compensation, and the retention (deductible) is $600,000 per occurrence. Additionally, stop-loss insurance is carried on employee health, and the annual stop-loss retention is $250,000. If an individual claim exceeds $250,000, the carrier pays
NT - 37
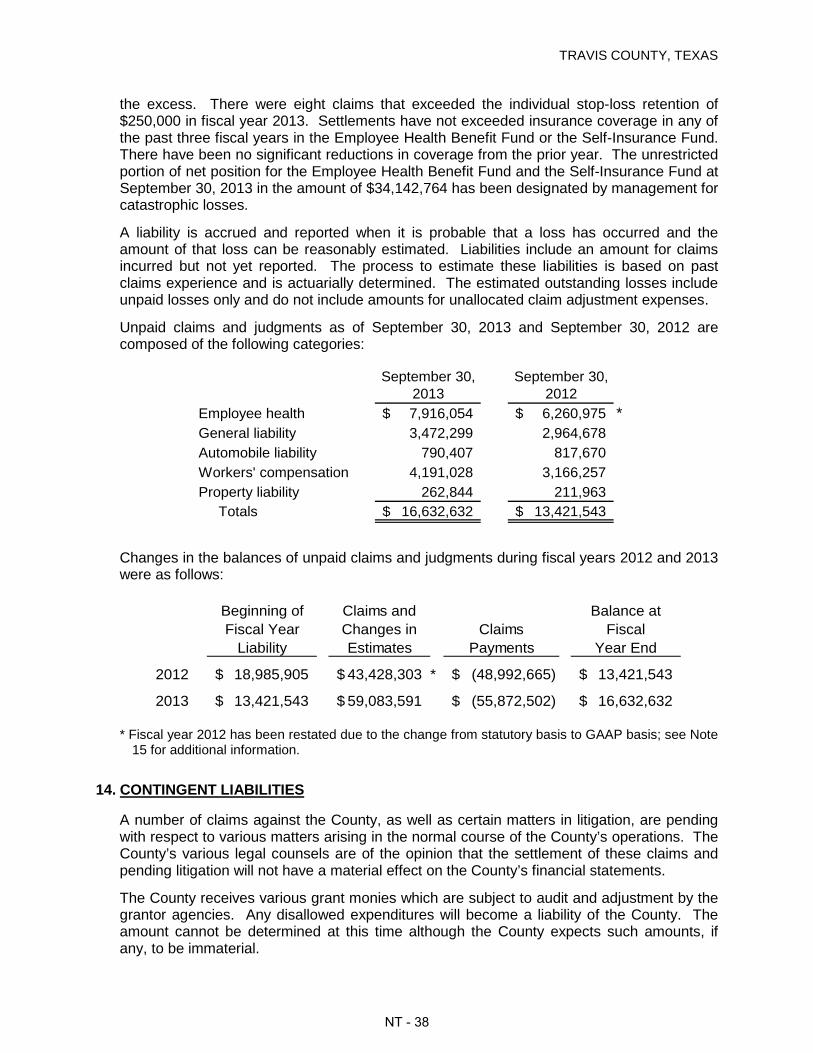
TRAVIS COUNTY, TEXAS
the excess. There were eight claims that exceeded the individual stop-loss retention of $250,000 in fiscal year 2013. Settlements have not exceeded insurance coverage in any of the past three fiscal years in the Employee Health Benefit Fund or the Self-Insurance Fund. There have been no significant reductions in coverage from the prior year. The unrestricted portion of net position for the Employee Health Benefit Fund and the Self-Insurance Fund at September 30, 2013 in the amount of $34,142,764 has been designated by management for catastrophic losses.
A liability is accrued and reported when it is probable that a loss has occurred and the amount of that loss can be reasonably estimated. Liabilities include an amount for claims incurred but not yet reported. The process to estimate these liabilities is based on past claims experience and is actuarially determined. The estimated outstanding losses include unpaid losses only and do not include amounts for unallocated claim adjustment expenses.
Unpaid claims and judgments as of September 30, 2013 and September 30, 2012 are composed of the following categories:
September 30, September 30,2013 2012
Employee health 7,916,054$ 6,260,975$ *General liability 3,472,299 2,964,678 Automobile liability 790,407 817,670 Workers' compensation 4,191,028 3,166,257 Property liability 262,844 211,963
Totals 16,632,632$ 13,421,543$
Changes in the balances of unpaid claims and judgments during fiscal years 2012 and 2013 were as follows:
Beginning of Claims and Balance atFiscal Year Changes in Claims Fiscal
Liability Estimates Payments Year End
2012 18,985,905$ 43,428,303$ * (48,992,665)$ 13,421,543$
2013 13,421,543$ 59,083,591$ (55,872,502)$ 16,632,632$
* Fiscal year 2012 has been restated due to the change from statutory basis to GAAP basis; see Note 15 for additional information.
14. CONTINGENT LIABILITIES
A number of claims against the County, as well as certain matters in litigation, are pending with respect to various matters arising in the normal course of the County’s operations. The County’s various legal counsels are of the opinion that the settlement of these claims and pending litigation will not have a material effect on the County’s financial statements.
The County receives various grant monies which are subject to audit and adjustment by the grantor agencies. Any disallowed expenditures will become a liability of the County. The amount cannot be determined at this time although the County expects such amounts, if any, to be immaterial.
NT - 38

TRAVIS COUNTY, TEXAS
15. RESTATEMENT OF NET POSITION
In fiscal year 2013, the County changed from reporting its financial statements on the statutory basis of accounting, as provided by the State in Chapter 2266 of the Texas Government Code, to preparing them in conformity with generally accepted accounting principles (GAAP) in the United States of America as applied to governmental units. By reporting the financial statements in accordance with GAAP, this provides the users with an improved ability to compare the County’s financial position to similar counties, most of which report in accordance with GAAP.
As a result of this change, the County implemented GASB Statement No. 45 (GASB 45) in fiscal year 2013. Per GASB 45, the County should begin its OPEB liability at a zero balance in the first year of implementation. In fiscal year 2012, the County reported an OPEB liability of $6,210,544 in the Internal Service Funds. Due to the implementation of GASB 45 and the requirement that the OPEB liability begin at zero, the OPEB liability in fiscal year 2012 should be reversed. This resulted in an increase to the fiscal year 2013 beginning net position on the County’s government-wide Statement of Activities and the Proprietary Fund Statement of Revenues, Expenses, and Changes in Net Position.
Governmental ProprietaryActivities Fund
Net position - beginning of year before restatement 979,505,450$ 31,982,558$ Cumulative effect of change from Statutory Basis
to GAAP Basis 6,210,544 6,210,544 Net position - beginning of year after restatement 985,715,994$ 38,193,102$
For more information on the implementation of GASB 45, please see Note 12.
NT - 39

NT - 40

TRAVIS COUNTY, TEXAS
REQUIRED SUPPLEMENTARY
INFORMATION (Unaudited)
RSI - 1

RSI - 2

TRAVIS COUNTY, TEXASSCHEDULE OF REVENUES, EXPENDITURES, AND CHANGES IN FUND BALANCE
BUDGET AND ACTUALGENERAL FUND
For The Year Ended September 30, 2013(Unaudited)
Variance withFinal Budget
Budgeted Amounts Actual Positive Original Final Amounts (Negative)
Revenues:Taxes $ 408,134,737 $ 408,134,737 $ 414,723,210 $ 6,588,473 Intergovernmental 8,537,034 9,476,037 10,446,141 970,104 Charges for services 52,730,817 53,708,117 58,752,113 5,043,996 Fines and forfeits 918,977 918,977 2,126,330 1,207,353 Investment income 488,073 488,073 (364,978) (853,051) Miscellaneous 3,854,429 3,735,929 6,013,670 2,277,741
Total revenues 474,664,067 476,461,870 491,696,486 15,234,616
Expenditures:Current:
General government 102,354,785 102,797,911 90,344,622 12,453,289 Justice system 124,480,394 125,534,302 119,141,353 6,392,949 Public safety 70,449,981 75,050,865 70,839,795 4,211,070 Corrections and rehabilitation 110,399,304 109,670,051 106,089,039 3,581,012 Health and human services 53,671,914 54,374,135 47,951,030 6,423,105 Infrastructure and environmental services 12,505,196 12,760,694 8,758,821 4,001,873 Community and economic development 10,142,786 10,042,647 9,225,328 817,319
Capital outlay 27,905,006 30,281,450 21,737,289 8,544,161 Debt service:
Capital lease principal 473,445 415,141 415,140 1 Interest and other charges - 58,304 58,304 -
Total expenditures 512,382,811 520,985,500 474,560,721 46,424,779
Excess (deficiency) of revenues over expenditures (37,718,744) (44,523,630) 17,135,765 61,659,395
Other financing sources (uses):Sale of capital assets - 170,000 257,050 87,050 Transfers in 1,059,498 1,059,498 1,069,861 10,363 Transfers out (14,022,883) (13,907,055) (13,879,563) 27,492
Total other financing sources (uses) (12,963,385) (12,677,557) (12,552,652) 124,905
Net change in fund balance (50,682,129) (57,201,187) 4,583,113 61,784,300
Fund balance - beginning of year 157,307,322 157,307,322 157,307,322 -
Fund balance - end of year $ 106,625,193 $ 100,106,135 $ 161,890,435 $ 61,784,300
RSI - 3

Actuarial UAAL as aActuarial Accrued Unfunded Annual PercentageValue of Liability (AAL) AAL Funded Covered of CoveredAssets Entry Age (UAAL) Ratio Payroll Payroll
(a) (b) (b - a) (a / b) (c) ((b - a) / c)734,076,781$ 858,901,388$ 124,824,607$ 85.47% 251,116,217$ 49.71%777,920,704$ 923,057,907$ 145,137,203$ 84.28% 255,175,972$ 56.88%826,309,913$ 990,813,568$ 164,503,655$ 83.40% 265,667,051$ 61.92%
Note: The funded ratio in the above schedule is the most current information available from TCDRS as of the date of this report.Travis County funded 100% of the annual required pension cost as defined by GAAP.
UAAL as aActuarial Actuarial Unfunded Annual PercentageValue of Accrued AAL Funded Covered of CoveredAssets Liability (AAL) (UAAL) Ratio Payroll Payroll
(a) (b) (b - a) (a / b) (c) ((b - a) / c)-$ 502,849,126$ 502,849,126$ 0% 274,668,850$ 183.07%
(Unaudited)
ActuarialValuation
Date10/1/2012
OTHER POST-EMPLOYMENT BENEFITS PLAN
SCHEDULE OF FUNDING PROGRESS
TRAVIS COUNTY, TEXAS
ActuarialValuation
Date12/31/201012/31/201112/31/2012
REQUIRED SUPPLEMENTARY INFORMATION
RETIREMENT PLAN(Unaudited)
RSI - 4

TRAVIS COUNTY, TEXAS OTHER SUPPLEMENTARY
INFORMATION


TRAVIS COUNTY, TEXAS NON-MAJOR GOVERNMENTAL FUNDS
Special Revenue Funds: These funds are used to account for revenues derived from
fees, specific taxes, grant revenues and other revenue sources that are legally restricted to finance specific activities.
Road and Bridge Fund - To account for monies received from auto registration fees and traffic fines, which are used for operating and maintaining County owned roads and bridges.
Law Library Fund - To account for the cost of operating and maintaining a law library for public use. Financing is provided through fees charged as part of court costs for civil cases processed through the District, County and Probate Courts.
County Attorney and District Attorney Processing Sight Orders (CAPSO-DAPSO) Fund - To account for fees assessed for the processing and collection of insufficient checks. These funds may be used for expenditures of the prosecutors’ offices.
Law Enforcement Fund - To account for monies resulting from the sale of forfeited property confiscated in arrests and the allowable expenditures of these monies.
Dispute Resolution Center Fund - To account for monies resulting from a fee charged on each District, County, and Probate Court civil case filed and expenditures of the Alternative Dispute Resolution Center. The purpose of the Center is to resolve disputes that do not require formal court action.
Voter Registration Fund - To account for monies received from the State of Texas as reimbursement for expenditures related to voter registration.
Juvenile Fee Fund - To account for monies resulting from a court-ordered probation fee to be used to provide services for juvenile probationers.
County and District Clerk Records Management and Preservation Fund - To account for monies resulting from fees assessed for the recording of documents by the County and District Clerks’ offices (real estate transactions, assumed names, etc.). Monies are to be used for the records management and preservation services performed by these offices.
Records Management and Preservation Fund - To account for monies resulting from fees assessed for County and District Court records, including civil, probate and criminal court actions. Monies are to be used for the records management and preservation services performed by the County.
Courthouse Security Fund - To account for monies resulting from fees charged as part of court costs for the purpose of providing security services for buildings housing a District, County or Justice Court.
LCRA Parks CIP Fund - To account for the 15% of LCRA park revenues that are designated for capital improvement projects (CIP).
Justice Court Building Security Fund - To account for monies resulting from fees charged as part of court costs for the purpose of providing security services for a justice court located in a building that is not the County courthouse.
N O N M A J O R
G O V E R N M E N T A L
F U N D S
OSI - 1

TRAVIS COUNTY, TEXAS Non-Major Governmental Funds, continued
Juvenile Justice Alternative Education Program Fund - To account for monies collected for the state mandated program to provide alternative education for juveniles in Travis County or in other counties, under contractual agreement, who have been expelled from school under Texas Education Code Sec 37.007. The monies are being collected from the participating school districts and state agencies.
Jail Commissary Fund - To account for revenues generated by the sale of personal items to jail inmates and the expenditure of those funds for the benefit of the inmates in accordance with rules adopted by the commission on jail standards.
Court Reporter Service Fund - To account for monies resulting from the court reporter service fee assessed in each civil case filed with the County or District Clerk to maintain a court reporter who is available for assignment in the court. The monies are to be used to assist in the payment of court-reporter-related services.
CSCD Equipment Acquisition Fund - To account for funds received by the Department of Information and Telecommunications for computer services provided to the Community Supervision and Corrections Department (CSCD). These funds are used to offset computer hardware and software costs incurred by the County in operating the CSCD.
Juvenile Deferred Prosecution Fund - To account for monies from a court-ordered deferred prosecution fee to be used for juvenile probation or community-based juvenile corrections services.
Balcones Canyonlands Preservation Fund - To account for monies received from participation certificate sales to be used for land acquisition and preserve system needs. Travis County and the City of Austin are joint permit holders of the preserve system land. Permits may be sold to the private sector and the funds will provide a funding mechanism for the management and additional purchase of preserve system land.
Abandoned Vehicles/Livestock Fund - To account for monies collected from the sale of abandoned motor vehicles and livestock. The proceeds shall be used for the reimbursement of expenditures incurred in the placement of vehicles/livestock into custody and any notice and publication costs incurred.
LEOSE Elected Officials Fund - To account for monies received from the State Comptroller’s pro-rata distribution of funds designated for law enforcement officers’ education. The monies in this fund are to be used for the continuing education of law enforcement personnel under the discretion of the County Attorney, District Attorney, Constables 1 through 5, and the Sheriff.
LEOSE Commissioners’ Court Fund - To account for monies received from the State Comptroller’s pro-rata distribution of funds designated for law enforcement officers’ education.
Juvenile Delinquency Prevention Fund - To account for funds resulting from a fee charged per person convicted of a graffiti offense. These monies are used to repair damages, provide educational and intervention programs, and for public awards leading to the conviction of such offenders.
OSI - 2

TRAVIS COUNTY, TEXAS Non-Major Governmental Funds, continued
Unclaimed Property Fund - To account for funds resulting from unclaimed property held by the County that is presumed to be abandoned.
Professional Prosecutors Fund - To account for monies received from the State of Texas as salary supplement for the County prosecutor. Monies are to be used for expenses of the County prosecutor’s office as per waiver under HB 804, 76th Legislature.
Mary Quinlan Park Fund - To account for monies collected for the purpose of maintaining and improving Mary Quinlan Park.
Probate Judiciary Fee Fund - To account for monies collected under HB 1220, 82nd Legislature relating to payments made to the County from the judicial fund for the support of the statutory probate court in the County.
Courts Technology Fund - To account for monies collected as fees from anyone convicted of a criminal offense to be used for technology improvements for all Court offices of the County; as well as the costs of training and education regarding technological improvements for the County, and District Court.
Travis County Housing Finance Corporation - The Travis County Housing Finance Corporation was created to provide decent, safe, and sanitary housing at affordable prices for residents of Travis County, Texas. It is authorized to issue bonds for the purpose, among others, of defraying the development cost of multi-family rental housing to be occupied substantially by persons of low and moderate income as determined by the Board of Directors; to provide funds to purchase mortgage loans made to persons of low and moderate income; and to refund bonds previously issued by the Corporation.
Travis County Health Facilities Development Corporation - The Travis County Health Facilities Development Corporation was created to provide, expand and improve health facilities for residents of Travis County, Texas that the Corporation determines are needed to improve the adequacy, cost, and accessibility of health care, research, and education in the state. The Corporation provides conduit financing for non-profit health facilities.
Capital Industrial Development Corporation - The Capital Industrial Development Corporation was created for the promotion and development of industrial and manufacturing enterprises to promote and encourage employment and the public welfare, and is authorized to issue bonds for those purposes.
Travis County Cultural Education Facilities Finance Corporation - The Travis County Cultural Education Facilities Finance Corporation was created for the purpose of promoting the health, education, and general welfare of citizens by providing and financing cultural, health and educational facilities.
Truancy Court Fund - To account for monies collected by the Juvenile Probation Department from the City of Austin and Austin Independent School District. Monies are used to provide supervision, referrals to community services, and regular reviews of student progress in an effort to reduce truancy.
County Clerk Archival Fund - To account for monies received when a public document is presented by a person, excluding a state agency, to the County Clerk for recording or filing. These monies are used for preservation and restoration services performed by the County Clerk in connection with maintaining their records archive.
OSI - 3

TRAVIS COUNTY, TEXAS Non-Major Governmental Funds, continued
Family Protection Fund - To account for monies collected as a fee at the time a suit for dissolution of a marriage is filed. These monies are to be used to fund a non-profit organization located in the County or an adjacent County that provides family violence prevention, intervention, mental health, counseling, legal, and marriage preservation services to families that have experienced, or are at risk of experiencing, family violence, child abuse or neglect.
Elections Contract Fund - To account for the reimbursement of election services provided by the County to other jurisdictions and the related expenditures.
Vital Statistic Preservation Fund - To account for monies collected as fees by the local registrar for the preservation of vital statistics records maintained by the registrar.
Fire Code Fund - To account for monies collected as fees for fire safety inspections on new or substantially renovated commercial property and multi-family housing. Expenditures are related to the enforcement of the fire code.
Child Abuse Prevention Fund - To account for monies collected as fees from child abuse related offenses to finance the study and development of child abuse prevention.
Juvenile Case Manager Fund - To account for monies collected as fees in fine-only misdemeanor offenses to finance the salary and benefits of a juvenile case manager.
Health Food Permits Fund - To account for monies collected as fees for issuing or renewing a permit related to the regulation of food service establishments. These monies are used for conducting inspections and issuing permits for food service establishments.
Drug Court Program Fund - To account for monies collected for offenders to attend an alternative rehabilitative drug program which includes drug testing and counseling.
Probate Guardianship Fund - To account for fees assessed on probate court actions to reimburse court-initiated guardianship fees for both attorneys and guardians.
Gardner House Handicraft Fund - To account for donated monies to be used for juveniles in the custody of Travis County at the Gardner Betts Juvenile Justice Center.
CAPCOG 911 Fees Fund - To account for 911 fees and surcharges per the interlocal agreement with Capital Area Council of Governments (CAPCOG), Commission on State Emergency Communications Rule 251.3. These monies are used to establish and operate 911 call centers and related operations within Travis County.
CSCD Fees Fund - To account for fees collected by the Community Service and Corrections Department (CSCD) paid by probationers in lieu of community service hours. These monies are used to provide assistance throughout the local operations of CSCD.
Unclaimed Juvenile Restitution Fund - To account for funds resulting from unclaimed juvenile restitution payments held by the County. Monies are used for the same purposes for which the County uses juvenile state aid money.
OSI - 4

TRAVIS COUNTY, TEXAS Non-Major Governmental Funds, continued
Lake Travis Economic Development Fund - To account for monies received from various local government entities to fund a study of the economic impact of the Lake Travis area within the State of Texas.
After School Youth Enrichment Services Fund - To account for monies received from various local entities for support of the AmeriCorps Project which provides after-school programs to local schools.
Motor Vehicle Interest Fund - To account for the interest generated from the Tax Assessor-Collector’s motor vehicle inventory escrow account. These funds are to be used by the Tax Office to defray related costs of administration of the prepayment procedure established by Tax Code Section 23.122.
Debt Service Funds: These funds account for the accumulation of resources and the subsequent disbursement of such resources to pay principal and interest on long-term general obligation bonds and certificates of obligation.
Northwest Travis County Road District No. 3 - To account for the accumulation of resources and the subsequent disbursement of such resources to pay principal and interest on general long-term debt for Northwest Travis County Road District No. 3.
Travis County Bee Cave Road District No. 1 - To account for the accumulation of resources and the subsequent disbursement of such resources to pay principal and interest on general long-term debt for Travis County Bee Cave Road District No. 1.
Capital Projects Funds: These funds are used to account for financial resources set aside for the acquisition or construction of major capital endeavors.
Joint Road Improvements Fund - To account for contractual agreements with other governmental entities for the construction, expansion, or improvement of roads.
Subdivision Parkland Fund - To account for monies received from developers for the acquisition or improvement of parks near new subdivision developments and the related expenditures.
Northeast Metro Park Fund - To account for proceeds received from the sale of land financed by voter-approved bond funds. These monies are used only for projects allowable within the original bond covenant.
Permanent Funds: These funds are used to report resources that are legally restricted to the extent that only earnings, and not principal, may be used for the benefit of the County or its citizens.
Permanent School Fund - To account for the principal of a trust fund, which cannot be expended. Oil royalties are deposited into this fund and may be distributed to the County’s independent school districts as directed by the Commissioners’ Court.
OSI - 5

DisputeRoad and Law CAPSO Law Resolution
Bridge Library DAPSO Enforcement CenterAssets
Cash and pooled cash 6,062,380$ 298,365$ 470,810$ 1,240,289$ 35,802$ Investments - - - - - Interest receivable 6,569 344 - - 34 Due from other funds - - - 3,101 - Accounts receivable 81,449 3,681 - 5,272 1,627 Intergovernmental and other receivables - - - - -
- - - - - Total assets 6,150,398$ 302,390$ 470,810$ 1,248,662$ 37,463$
Liabilities and Fund Balances
Liabilities:Accounts payable 386,265$ 12,489$ -$ -$ 611$ Accrued liabilities 414,361 21,568 - - - Due to other funds 6,048 38 15,025 5,200 - Other liabilities - - - 2,002 - Due to other governmental entities - - - 3,054 - Deferred revenue - - - - -
Total liabilities 806,674 34,095 15,025 10,256 611
Fund balances:Restricted
Debt service - - - - - Capital projects - - - - - Special revenue funds - 268,295 455,785 1,238,406 - County schools - - - - -
CommittedSpecial revenue funds 5,343,724 - - - 36,852
Total fund balances 5,343,724 268,295 455,785 1,238,406 36,852 Total liabilities and fund balances 6,150,398$ 302,390$ 470,810$ 1,248,662$ 37,463$
Taxes receivable (net of allowances for estimated uncollectibles)
TRAVIS COUNTY, TEXASCOMBINING BALANCE SHEET
NON-MAJOR GOVERNMENTAL FUNDSSeptember 30, 2013
Special Revenue
OSI - 6

County andDistrict Clerk Justice
Records Records CourtVoter Juvenile Management & Management & Courthouse LCRA Building
Registration Fee Preservation Preservation Security Parks CIP Security
97,228$ 404,665$ 1,907,859$ 321,962$ 434,860$ 2,967,353$ 351,500$ - - - - - - - - 481 2,132 378 653 3,301 413 - - - - - - - - - 808 2,425 959 - 86 - - - - - - -
- - - - - - - 97,228$ 405,146$ 1,910,799$ 324,765$ 436,472$ 2,970,654$ 351,999$
-$ -$ 23,373$ 439$ -$ -$ -$ - - 24,369 13,763 113,869 - - - - 44 24 1,187 - - - - - - - - - - - - - - - - - - - - - - - - - 47,786 14,226 115,056 - -
- - - - - - - - - - - - - - - 405,146 1,860,613 310,539 - 2,970,654 351,999 - - - - - - -
97,228 - 2,400 - 321,416 - -
97,228 405,146 1,863,013 310,539 321,416 2,970,654 351,999 97,228$ 405,146$ 1,910,799$ 324,765$ 436,472$ 2,970,654$ 351,999$
(continued)
Special Revenue
OSI - 7

TRAVIS COUNTY, TEXASCOMBINING BALANCE SHEET, continuedNON-MAJOR GOVERNMENTAL FUNDSSeptember 30, 2013
JuvenileJustice
Alternative Court CSCD JuvenileEducation Jail Reporter Equipment DeferredProgram Commissary Service Acquisition Prosecution
AssetsCash and pooled cash 1,006,077$ 476,181$ 83,660$ 1,121$ 87,081$ Investments - - - - - Interest receivable 1,135 - 103 - 104 Due from other funds - - - - - Accounts receivable - - 1,577 - - Intergovernmental and other receivables - - - - -
- - - - - Total assets 1,007,212$ 476,181$ 85,340$ 1,121$ 87,185$
Liabilities and Fund Balances
Liabilities:Accounts payable 35,451$ 12,955$ -$ -$ -$ Accrued liabilities 7,569 - 13,508 - - Due to other funds 65 98,683 22 - - Other liabilities - 3,924 - - - Due to other governmental entities - - - - - Deferred revenue - - - - -
Total liabilities 43,085 115,562 13,530 - -
Fund balances:Restricted
Debt service - - - - - Capital projects - - - - - Special revenue funds - 360,619 71,810 1,121 87,185 County schools - - - - -
CommittedSpecial revenue funds 964,127 - - - -
Total fund balances 964,127 360,619 71,810 1,121 87,185 Total liabilities and fund balances 1,007,212$ 476,181$ 85,340$ 1,121$ 87,185$
Taxes receivable (net of allowances for estimated uncollectibles)
Special Revenue
OSI - 8

Balcones Abandoned LEOSE LEOSE JuvenileCanyonlands Vehicles/ Elected Commissioners' Delinquency Unclaimed ProfessionalPreservation Livestock Officials Court Prevention Property Prosecutors
6,912,603$ 70,833$ 21,721$ 3,801$ 707$ 23,106$ 6$ - - - - - - -
7,978 - - - - 34 - - - - - - - - - - - - - - - - - - - - - -
- - - - - - - 6,920,581$ 70,833$ 21,721$ 3,801$ 707$ 23,140$ 6$
15,466$ -$ -$ -$ -$ -$ -$ 26,614 - - - - - -
251 - - - - - - - 1,793 1,682 - - 5,719 - - - - - - - - - - - - - - -
42,331 1,793 1,682 - - 5,719 -
- - - - - - - - - - - - - - - 69,040 20,039 3,801 707 17,421 - - - - - - - -
6,878,250 - - - - - 6
6,878,250 69,040 20,039 3,801 707 17,421 6 6,920,581$ 70,833$ 21,721$ 3,801$ 707$ 23,140$ 6$
(continued)
Special Revenue
OSI - 9

TRAVIS COUNTY, TEXASCOMBINING BALANCE SHEET, continuedNON-MAJOR GOVERNMENTAL FUNDSSeptember 30, 2013
Travis Travis CountyCounty Health
Mary Probate Housing FacilitiesQuinlan Judiciary Courts Finance Development
Park Fee Technology Corporation CorporationAssets
Cash and pooled cash 277,889$ 92,680$ 470,566$ 872,385$ 60,390$ Investments - - - 588,539 544,800 Interest receivable 310 103 516 - - Due from other funds - - - - - Accounts receivable - 134,510 536 - - Intergovernmental and other receivables - - - 16,668 -
- - - - - Total assets 278,199$ 227,293$ 471,618$ 1,477,592$ 605,190$
Liabilities and Fund Balances
Liabilities:Accounts payable -$ -$ 25,095$ -$ -$ Accrued liabilities - 7,752 3,478 - - Due to other funds - 13 6 - - Other liabilities - - - - - Due to other governmental entities - - - - - Deferred revenue - - - - -
Total liabilities - 7,765 28,579 - -
Fund balances:Restricted
Debt service - - - - - Capital projects - - - - - Special revenue funds 278,199 219,528 443,039 160,302 43,362 County schools - - - - -
CommittedSpecial revenue funds - - - 1,317,290 561,828
Total fund balances 278,199 219,528 443,039 1,477,592 605,190 Total liabilities and fund balances 278,199$ 227,293$ 471,618$ 1,477,592$ 605,190$
Taxes receivable (net of allowances for estimated uncollectibles)
Special Revenue
OSI - 10

Travis CountyCapital Cultural
Industrial Education County VitalDevelopment Facilities Truancy Clerk Family Elections StatisticCorporation Finance Corp Court Archival Protection Contract Preservation
3,308$ 34,591$ 106,340$ 1,078,111$ 37,400$ 374,026$ 36,603$ - - - - - - - - - 138 1,169 34 483 34 - - - - - - - - - - - 654 - 1 - - - - - - -
- - - - - - - 3,308$ 34,591$ 106,478$ 1,079,280$ 38,088$ 374,509$ 36,638$
-$ -$ 495$ 12,909$ -$ 8,536$ 820$ - - 7,557 15,056 - 5,304 - - - 12 24 - 9 - - - - - - - - - - - - - - - - - - - - - - - - 8,064 27,989 - 13,849 820
- - - - - - - - - - - - - -
531 1,078 - 1,051,291 38,088 360,660 35,818 - - - - - - -
2,777 33,513 98,414 - - - -
3,308 34,591 98,414 1,051,291 38,088 360,660 35,818 3,308$ 34,591$ 106,478$ 1,079,280$ 38,088$ 374,509$ 36,638$
(continued)
Special Revenue
OSI - 11

TRAVIS COUNTY, TEXASCOMBINING BALANCE SHEET, continuedNON-MAJOR GOVERNMENTAL FUNDSSeptember 30, 2013
Child Juvenile Health DrugFire Abuse Case Food Court
Code Prevention Manager Permits ProgramAssets
Cash and pooled cash 397,866$ 10,647$ 1,063,055$ 229,699$ 181,994$ Investments - - - - - Interest receivable 516 - 1,238 275 206 Due from other funds - - - - - Accounts receivable - - 664 - 43 Intergovernmental and other receivables - - - - -
- - - - - Total assets 398,382$ 10,647$ 1,064,957$ 229,974$ 182,243$
Liabilities and Fund Balances
Liabilities:Accounts payable -$ -$ 962$ 26,443$ 4,842$ Accrued liabilities - - 6,329 - 2,765 Due to other funds - - 71 - 4 Other liabilities - - - - - Due to other governmental entities - - - - - Deferred revenue - - - - -
Total liabilities - - 7,362 26,443 7,611
Fund balances:Restricted
Debt service - - - - - Capital projects - - - - - Special revenue funds 398,382 10,647 1,057,595 203,531 174,632 County schools - - - - -
CommittedSpecial revenue funds - - - - -
Total fund balances 398,382 10,647 1,057,595 203,531 174,632 Total liabilities and fund balances 398,382$ 10,647$ 1,064,957$ 229,974$ 182,243$
Taxes receivable (net of allowances for estimated uncollectibles)
Special Revenue
OSI - 12

After SchoolGardner Unclaimed Lake Travis Youth
Probate House CAPCOG CSCD Juvenile Economic EnrichmentGuardianship Handicraft 911 Fees Fees Restitution Development Services
225,195$ 3,358$ 20,913$ 117,211$ 32,068$ 45$ 47,583$ - - - - - - -
275 - 34 138 34 - - - - - - - - - - - - - - - - - - - - - - -
- - - - - - - 225,470$ 3,358$ 20,947$ 117,349$ 32,102$ 45$ 47,583$
-$ -$ -$ 31,726$ -$ -$ 305$ - - - 13,927 - - 4,442 - - - - - - 7 - - - - - - - - - - - - - - - - - - - - - - - - 45,653 - - 4,754
- - - - - - - - - - - - - -
225,470 3,358 20,947 71,696 32,102 45 8,818 - - - - - - -
- - - - - - 34,011
225,470 3,358 20,947 71,696 32,102 45 42,829 225,470$ 3,358$ 20,947$ 117,349$ 32,102$ 45$ 47,583$
(continued)
Special Revenue
OSI - 13

TRAVIS COUNTY, TEXASCOMBINING BALANCE SHEET, continuedNON-MAJOR GOVERNMENTAL FUNDSSeptember 30, 2013
Northwest Travis CountyMotor Travis Bee Cave
Vehicle County Road Road DistrictInterest Total District No. 3 No. 1 Total
AssetsCash and pooled cash 2,933$ 29,056,826$ 236$ 383$ 619$ Investments - 1,133,339 89,563 290,762 380,325 Interest receivable - 29,162 - - - Due from other funds - 3,101 - - - Accounts receivable - 234,292 - - - Intergovernmental and other receivables - 16,668 - - -
- - 1,409 18,957 20,366 Total assets 2,933$ 30,473,388$ 91,208$ 310,102$ 401,310$
Liabilities and Fund Balances
Liabilities:Accounts payable -$ 599,182$ 694$ -$ 694$ Accrued liabilities - 702,231 - - - Due to other funds - 126,733 - - - Other liabilities - 15,120 - - - Due to other governmental entities - 3,054 - - - Deferred revenue - - 1,409 18,957 20,366
Total liabilities - 1,446,320 2,103 18,957 21,060
Fund balances:Restricted
Debt service - - 89,105 291,145 380,250 Capital projects - - - - - Special revenue funds 2,933 13,335,232 - - - County schools - - - - -
CommittedSpecial revenue funds - 15,691,836 - - -
Total fund balances 2,933 29,027,068 89,105 291,145 380,250 Total liabilities and fund balances 2,933$ 30,473,388$ 91,208$ 310,102$ 401,310$
Taxes receivable (net of allowances for estimated uncollectibles)
Debt ServiceSpecial Revenue
OSI - 14

PermanentFund
TotalJoint Northeast Non-MajorRoad Subdivision Metro Permanent Governmental
Improvements Parkland Park Total School Fund Funds
3,243,469$ 726,322$ 22,009$ 3,991,800$ 3,246,561$ 36,295,806$ - - - - - 1,513,664
3,818 825 34 4,677 - 33,839 - - - - - 3,101 - - - - - 234,292
13,579,547 - - 13,579,547 - 13,596,215
- - - - - 20,366 16,826,834$ 727,147$ 22,043$ 17,576,024$ 3,246,561$ 51,697,283$
64,628$ -$ 2,466$ 67,094$ -$ 666,970$ - - - - - 702,231 - - - - - 126,733
322,369 - - 322,369 - 337,489 - - - - - 3,054 - - - - - 20,366
386,997 - 2,466 389,463 - 1,856,843
- - - - - 380,250 16,439,837 727,147 19,577 17,186,561 - 17,186,561
- - - - - 13,335,232 - - - - 3,246,561 3,246,561
- - - - - 15,691,836
16,439,837 727,147 19,577 17,186,561 3,246,561 49,840,440 16,826,834$ 727,147$ 22,043$ 17,576,024$ 3,246,561$ 51,697,283$
(concluded)
Capital Projects
OSI - 15

DisputeRoad and Law CAPSO Law Resolution
Bridge Library DAPSO Enforcement CenterRevenues:
Taxes -$ -$ -$ -$ -$ Intergovernmental 156,947 - 22,500 8,664 - Charges for services 11,382,248 862,554 137,865 - 350,958 Fines and forfeits 4,376,275 - - 266,945 - Investment income 32,037 1,607 - 1,692 309 Miscellaneous 111,400 - - - 3,981
Total revenues 16,058,907 864,161 160,365 277,301 355,248
Expenditures:Current:
General government - - - - - Justice system - 763,388 112,085 91,433 396,773 Public safety - - - 167,316 - Corrections and rehabilitation - - - - - Health and human services - - - - - Infrastructure and environmental services 15,527,797 - - - - Community and economic development - - - - -
Capital outlay 275 - - 12,773 - Debt service:
Principal on general obligation debt - - - - - Interest and other charges - - - - - Total expenditures 15,528,072 763,388 112,085 271,522 396,773
Excess (deficiency) of revenues over expenditures 530,835 100,773 48,280 5,779 (41,525)
Other financing sources (uses):Transfers in - - - - 52,632 Transfers out (750,091) - (112,584) - -
Total other financing sources (uses) (750,091) - (112,584) - 52,632
Net change in fund balances (219,256) 100,773 (64,304) 5,779 11,107
Fund balances - beginning of year 5,562,980 167,522 520,089 1,232,627 25,745 Fund balances - end of year 5,343,724$ 268,295$ 455,785$ 1,238,406$ 36,852$
Special Revenue
TRAVIS COUNTY, TEXASCOMBINING STATEMENT OF REVENUES, EXPENDITURES,
AND CHANGES IN FUND BALANCESNON-MAJOR GOVERNMENTAL FUNDSFor The Year Ended September 30, 2013
OSI - 16

County andDistrict Clerk Justice
Records Records CourtVoter Juvenile Management & Management & Courthouse LCRA Building
Registration Fee Preservation Preservation Security Parks CIP Security
-$ -$ -$ -$ -$ -$ -$ 95,093 - - - - - -
- 10,084 1,396,625 536,683 497,394 131,042 39,402 - - - - - - - - 2,301 10,123 1,764 8,853 16,441 1,931 - - - - - - -
95,093 12,385 1,406,748 538,447 506,247 147,483 41,333
109,901 - 905,178 405,547 - - - - - 41,008 32,915 - - - - - - - 2,971,056 - - - - - - - - - - - - - - - - - - - - - - - - - - - - 26,026 - - - 191,861 - - 161,476 -
- - - - - - - - - - - - - -
109,901 - 1,138,047 438,462 2,971,056 187,502 -
(14,808) 12,385 268,701 99,985 (2,464,809) (40,019) 41,333
- - - - 2,526,548 - - - - - - - - - - - - - 2,526,548 - -
(14,808) 12,385 268,701 99,985 61,739 (40,019) 41,333
112,036 392,761 1,594,312 210,554 259,677 3,010,673 310,666 97,228$ 405,146$ 1,863,013$ 310,539$ 321,416$ 2,970,654$ 351,999$
(continued)
Special Revenue
OSI - 17

TRAVIS COUNTY, TEXASCOMBINING STATEMENT OF REVENUES, EXPENDITURES, AND CHANGES IN FUND BALANCES, continuedNON-MAJOR GOVERNMENTAL FUNDSFor The Year Ended September 30, 2013
JuvenileJustice
Alternative Court CSCD JuvenileEducation Jail Reporter Equipment DeferredProgram Commissary Service Acquisition Prosecution
Revenues:Taxes -$ -$ -$ -$ -$ Intergovernmental 92,224 - - - - Charges for services - 1,823,591 360,929 - 3,695 Fines and forfeits - - - - - Investment income 6,096 508 487 - 487 Miscellaneous - - - - -
Total revenues 98,320 1,824,099 361,416 - 4,182
Expenditures:Current:
General government - - - - - Justice system 476,044 - 347,803 - - Public safety - - - - - Corrections and rehabilitation - 1,790,436 - - - Health and human services - - - - - Infrastructure and environmental services - - - - - Community and economic development - - - - -
Capital outlay - 25,275 - - - Debt service:
Principal on general obligation debt - - - - - Interest and other charges - - - - - Total expenditures 476,044 1,815,711 347,803 - -
Excess (deficiency) of revenues over expenditures (377,724) 8,388 13,613 - 4,182
Other financing sources (uses):Transfers in 189,313 - - - - Transfers out - - - - -
Total other financing sources (uses) 189,313 - - - -
Net change in fund balances (188,411) 8,388 13,613 - 4,182
Fund balances - beginning of year 1,152,538 352,231 58,197 1,121 83,003 Fund balances - end of year 964,127$ 360,619$ 71,810$ 1,121$ 87,185$
Special Revenue
OSI - 18

Balcones Abandoned LEOSE LEOSE JuvenileCanyonlands Vehicles/ Elected Commissioners' Delinquency Unclaimed ProfessionalPreservation Livestock Officials Court Prevention Property Prosecutors
-$ -$ -$ -$ -$ -$ -$ - - - - - - 62,500
189,088 - - - 105 - - - - - - - 48,430 -
53,150 64 23 - - 277 - 121,810 30,987 - - - - - 364,048 31,051 23 - 105 48,707 62,500
- - - - - - - - - 876 - - - 62,506 - 14,917 1,338 - - - - - - - - - - - - - - - - - -
784,922 - - - - - - - - - - - - -
8,887,168 - - - - - -
- - - - - - - - - - - - - -
9,672,090 14,917 2,214 - - - 62,506
(9,308,042) 16,134 (2,191) - 105 48,707 (6)
10,927,333 - - - - - - - - - - - (31,455) -
10,927,333 - - - - (31,455) -
1,619,291 16,134 (2,191) - 105 17,252 (6)
5,258,959 52,906 22,230 3,801 602 169 12 6,878,250$ 69,040$ 20,039$ 3,801$ 707$ 17,421$ 6$
(continued)
Special Revenue
OSI - 19

TRAVIS COUNTY, TEXASCOMBINING STATEMENT OF REVENUES, EXPENDITURES, AND CHANGES IN FUND BALANCES, continuedNON-MAJOR GOVERNMENTAL FUNDSFor The Year Ended September 30, 2013
Travis Travis CountyCounty Health
Mary Probate Housing FacilitiesQuinlan Judiciary Courts Finance Development
Park Fee Technology Corporation CorporationRevenues:
Taxes -$ -$ -$ -$ -$ Intergovernmental - - - 161,957 - Charges for services - 179,510 186,883 512,566 - Fines and forfeits - - - - - Investment income 1,501 905 2,559 395 598 Miscellaneous 5,000 - - - -
Total revenues 6,501 180,415 189,442 674,918 598
Expenditures:Current:
General government - - 16,520 177,920 14,655 Justice system - 204,991 181,086 - - Public safety - - - - - Corrections and rehabilitation - - - - - Health and human services - - - - - Infrastructure and environmental services - - - - - Community and economic development - - - - -
Capital outlay - - - - - Debt service:
Principal on general obligation debt - - - - - Interest and other charges - - - - - Total expenditures - 204,991 197,606 177,920 14,655
Excess (deficiency) of revenues over expenditures 6,501 (24,576) (8,164) 496,998 (14,057)
Other financing sources (uses):Transfers in - - - - - Transfers out - - - (123,109) (40,000)
Total other financing sources (uses) - - - (123,109) (40,000)
Net change in fund balances 6,501 (24,576) (8,164) 373,889 (54,057)
Fund balances - beginning of year 271,698 244,104 451,203 1,103,703 659,247 Fund balances - end of year 278,199$ 219,528$ 443,039$ 1,477,592$ 605,190$
Special Revenue
OSI - 20

Travis CountyCapital Cultural
Industrial Education County VitalDevelopment Facilities Truancy Clerk Family Elections StatisticCorporation Finance Corp Court Archival Protection Contract Preservation
-$ -$ -$ -$ -$ -$ -$ - - - - - - - - 22,570 97,411 1,293,424 53,884 803,064 1,439 - - - - - - - 5 28 897 5,027 226 3,030 193 - - - - - - - 5 22,598 98,308 1,298,451 54,110 806,094 1,632
1,900 962 - 888,716 - 876,076 - - - 195,799 - 55,323 - 820 - - - - - - - - - - - - - - - - - - - - - - - - - - - - - - - - - - - - - - - - 38,100 -
- - - - - - - - - - - - - -
1,900 962 195,799 888,716 55,323 914,176 820
(1,895) 21,636 (97,491) 409,735 (1,213) (108,082) 812
- - 144,151 - - - - (500) (1,000) - (7,702) - - - (500) (1,000) 144,151 (7,702) - - -
(2,395) 20,636 46,660 402,033 (1,213) (108,082) 812
5,703 13,955 51,754 649,258 39,301 468,742 35,006 3,308$ 34,591$ 98,414$ 1,051,291$ 38,088$ 360,660$ 35,818$
(continued)
Special Revenue
OSI - 21

TRAVIS COUNTY, TEXASCOMBINING STATEMENT OF REVENUES, EXPENDITURES, AND CHANGES IN FUND BALANCES, continuedNON-MAJOR GOVERNMENTAL FUNDSFor The Year Ended September 30, 2013
Child Juvenile Health DrugFire Abuse Case Food Court
Code Prevention Manager Permits ProgramRevenues:
Taxes -$ -$ -$ -$ -$ Intergovernmental - - - - - Charges for services 341,296 3,553 202,111 88,350 147,889 Fines and forfeits - - - - - Investment income 2,490 - 6,080 1,212 1,097 Miscellaneous - - - - -
Total revenues 343,786 3,553 208,191 89,562 148,986
Expenditures:Current:
General government - - - - - Justice system - - 237,627 - - Public safety 163,496 - - - - Corrections and rehabilitation - - - - 150,153 Health and human services - - - 26,444 - Infrastructure and environmental services - - - - - Community and economic development - - - - -
Capital outlay - - - - - Debt service:
Principal on general obligation debt - - - - - Interest and other charges - - - - - Total expenditures 163,496 - 237,627 26,444 150,153
Excess (deficiency) of revenues over expenditures 180,290 3,553 (29,436) 63,118 (1,167)
Other financing sources (uses):Transfers in - - - - - Transfers out - - - - -
Total other financing sources (uses) - - - - -
Net change in fund balances 180,290 3,553 (29,436) 63,118 (1,167)
Fund balances - beginning of year 218,092 7,094 1,087,031 140,413 175,799 Fund balances - end of year 398,382$ 10,647$ 1,057,595$ 203,531$ 174,632$
Special Revenue
OSI - 22

After SchoolGardner Unclaimed Lake Travis Youth
Probate House CAPCOG CSCD Juvenile Economic EnrichmentGuardianship Handicraft 911 Fees Fees Restitution Development Services
-$ -$ -$ -$ -$ -$ -$ - - - - - - -
92,742 - - - - - 168,584 - - - 560,875 4,342 - -
1,301 - 32 678 205 - - - - - - - - -
94,043 - 32 561,553 4,547 - 168,584
- - - - - - - 76,167 - - - - - -
- - 454,678 - - - - - - - 603,897 - - - - - - - - - 159,766 - - - - - - - - - - - - - - - - - - - - -
- - - - - - - - - - - - - -
76,167 - 454,678 603,897 - - 159,766
17,876 - (454,646) (42,344) 4,547 - 8,818
- - - - - - 34,011 - - - - - - - - - - - - - 34,011
17,876 - (454,646) (42,344) 4,547 - 42,829
207,594 3,358 475,593 114,040 27,555 45 - 225,470$ 3,358$ 20,947$ 71,696$ 32,102$ 45$ 42,829$
(continued)
Special Revenue
OSI - 23

TRAVIS COUNTY, TEXASCOMBINING STATEMENT OF REVENUES, EXPENDITURES, AND CHANGES IN FUND BALANCES, continuedNON-MAJOR GOVERNMENTAL FUNDSFor The Year Ended September 30, 2013
Northwest Travis CountyMotor Travis Bee Cave
Vehicle County Road Road DistrictInterest Total District No. 3 No. 1 Total
Revenues:Taxes -$ -$ 548,067$ 1,088,981$ 1,637,048$ Intergovernmental - 599,885 - - - Charges for services - 21,917,539 - - - Fines and forfeits - 5,256,867 - - - Investment income 2,933 169,542 398 698 1,096 Miscellaneous - 273,178 - - -
Total revenues 2,933 28,217,011 548,465 1,089,679 1,638,144
Expenditures:Current:
General government - 3,397,375 3,700 7,309 11,009 Justice system - 3,276,644 - - - Public safety - 3,772,801 - - - Corrections and rehabilitation - 2,544,486 - - - Health and human services - 186,210 - - - Infrastructure and environmental services - 16,312,719 - - - Community and economic development - 26,026 - - -
Capital outlay - 9,316,928 - - - Debt service:
Principal on general obligation debt - - 575,000 400,000 975,000 Interest and other charges - - 47,600 719,063 766,663 Total expenditures - 38,833,189 626,300 1,126,372 1,752,672
Excess (deficiency) of revenues over expenditures 2,933 (10,616,178) (77,835) (36,693) (114,528)
Other financing sources (uses):Transfers in - 13,873,988 - - - Transfers out - (1,066,441) - - -
Total other financing sources (uses) - 12,807,547 - - -
Net change in fund balances 2,933 2,191,369 (77,835) (36,693) (114,528)
Fund balances - beginning of year - 26,835,699 166,940 327,838 494,778 Fund balances - end of year 2,933$ 29,027,068$ 89,105$ 291,145$ 380,250$
Special Revenue Debt Service
OSI - 24

PermanentFund
TotalJoint Northeast Non-MajorRoad Subdivision Metro Permanent Governmental
Improvements Parkland Park Total School Fund Funds
-$ -$ -$ -$ -$ 1,637,048$ - - - - - 599,885
13,075,126 395,069 - 13,470,195 - 35,387,734 - - - - - 5,256,867
6,399 6,566 (1,311) 11,654 - 182,292 1,168,942 - - 1,168,942 102,917 1,545,037
14,250,467 401,635 (1,311) 14,650,791 102,917 44,608,863
- - - - 220,059 3,628,443 - - - - - 3,276,644 - - - - - 3,772,801 - - - - - 2,544,486 - - - - - 186,210
2,190,596 - - 2,190,596 - 18,503,315 4,439 - - 4,439 - 30,465
128,801 176,382 476,056 781,239 - 10,098,167
- - - - - 975,000 - - - - - 766,663
2,323,836 176,382 476,056 2,976,274 220,059 43,782,194
11,926,631 225,253 (477,367) 11,674,517 (117,142) 826,669
- - - - - 13,873,988 - - - - - (1,066,441) - - - - - 12,807,547
11,926,631 225,253 (477,367) 11,674,517 (117,142) 13,634,216
4,513,206 501,894 496,944 5,512,044 3,363,703 36,206,224 16,439,837$ 727,147$ 19,577$ 17,186,561$ 3,246,561$ 49,840,440$
(concluded)
Capital Projects
OSI - 25

OSI - 26

TRAVIS COUNTY, TEXAS
BUDGETARY COMPARISON
SCHEDULES
OSI - 27

OSI - 28

TRAVIS COUNTY, TEXASSCHEDULE OF REVENUES, EXPENDITURES, AND CHANGES IN FUND BALANCE
BUDGET AND ACTUALGENERAL PURPOSE DEBT SERVICE FUND
For The Year Ended September 30, 2013
Budgeted Final BudgetAmounts Actual Positive
Amounts (Negative)
Revenues:Taxes $ 77,898,650 $ 78,951,431 $ 1,052,781 Investment income 46,781 49,315 2,534
Total revenues 77,945,431 79,000,746 1,055,315
Expenditures:Debt service:
Debt isuance costs 579,255 557,607 21,648 Advance refunding escrow 326,295 326,295 - Principal on general obligation debt 52,725,000 52,110,000 615,000 Interest and other charges 26,286,499 24,228,550 2,057,949
Total expenditures 79,917,049 77,222,452 2,694,597
Excess (deficiency) of revenuesover expenditures (1,971,618) 1,778,294 3,749,912
Other financing sources (uses):Refunding debt issued 55,340,000 55,340,000 - Debt premium 7,112,340 7,112,340 - Payment to refunding bond agent (61,848,695) (61,848,695) - Transfers in - 1,619,204 1,619,204
Total other financing sources (uses) 603,645 2,222,849 1,619,204
Net change in fund balance (1,367,973) 4,001,143 5,369,116
Fund balance - beginning of year 13,883,075 13,883,075 -
Fund balance - end of year $ 12,515,102 $ 17,884,218 $ 5,369,116
Variance with
Final
OSI - 29

Road and Bridge
Revenues:Intergovernmental $ 106,049 $ 156,947 $ 50,898 Charges for services 10,280,000 11,382,248 1,102,248 Fines and forfeits 4,626,741 4,376,275 (250,466) Investment income 47,279 32,037 (15,242) Miscellaneous 42,347 111,400 69,053
Total revenues 15,102,416 16,058,907 956,491
Expenditures:Current:
Infrastructure and environmental services 18,235,924 15,527,797 2,708,127 Capital outlay 283,980 275 283,705
Total expenditures 18,519,904 15,528,072 2,991,832
Excess (deficiency) of revenues over expenditures (3,417,488) 530,835 3,948,323
Other financing sources (uses):Transfers out (750,091) (750,091) -
Total other financing sources (uses) (750,091) (750,091) -
Net change in fund balance (4,167,579) (219,256) 3,948,323
Fund balance - beginning of year 5,562,980 5,562,980 -
Fund balance - end of year $ 1,395,401 $ 5,343,724 $ 3,948,323
Law Library
Revenues:Charges for services $ 858,173 $ 862,554 $ 4,381 Investment income 963 1,607 644
Total revenues 859,136 864,161 5,025
Expenditures:Current:
Justice system 851,250 763,388 87,862 Total expenditures 851,250 763,388 87,862
Excess (deficiency) of revenues over expenditures 7,886 100,773 92,887
Net change in fund balance 7,886 100,773 92,887
Fund balance - beginning of year 167,522 167,522 -
Fund balance - end of year $ 175,408 $ 268,295 $ 92,887
TRAVIS COUNTY, TEXASSCHEDULE OF REVENUES, EXPENDITURES, AND CHANGES IN
FUND BALANCESBUDGET AND ACTUAL
NON-MAJOR SPECIAL REVENUE FUNDSFor The Year Ended September 30, 2013
Variance withFinal Budget
Positive(Negative)
ActualAmounts
BudgetedAmounts
Final
OSI - 30

Dispute Resolution Center
Revenues:Charges for services $ 359,508 $ 350,958 $ (8,550) Investment income 436 309 (127) Miscellaneous 4,000 3,981 (19)
Total revenues 363,944 355,248 (8,696)
Expenditures:Current:
Justice system 426,843 396,773 30,070 Total expenditures 426,843 396,773 30,070
Excess (deficiency) of revenues over expenditures (62,899) (41,525) 21,374
Other financing sources (uses):Transfers in 41,665 52,632 10,967
Total other financing sources (uses) 41,665 52,632 10,967
Net change in fund balance (21,234) 11,107 32,341
Fund balance - beginning of year 25,745 25,745 -
Fund balance - end of year $ 4,511 $ 36,852 $ 32,341
Voter Registration
Revenues:Intergovernmental $ 116,681 $ 95,093 $ (21,588) Investment income 137 - (137)
Total revenues 116,818 95,093 (21,725)
Expenditures:Current:
General government 129,910 109,901 20,009 Total expenditures 129,910 109,901 20,009
Excess (deficiency) of revenues over expenditures (13,092) (14,808) (1,716)
Net change in fund balance (13,092) (14,808) (1,716)
Fund balance - beginning of year 112,036 112,036 -
Fund balance - end of year $ 98,944 $ 97,228 $ (1,716) (continued)
AmountsFinal
BudgetedVariance withFinal Budget
Actual PositiveAmounts (Negative)
OSI - 31

TRAVIS COUNTY, TEXASSCHEDULE OF REVENUES, EXPENDITURES, AND CHANGES INFUND BALANCESBUDGET AND ACTUAL, continuedNON-MAJOR SPECIAL REVENUE FUNDSFor The Year Ended September 30, 2013
Juvenile Fee
Revenues:Charges for services $ 3,480 $ 10,084 $ 6,604 Investment income 2,163 2,301 138
Total revenues 5,643 12,385 6,742
Expenditures:Current:
Justice system 397,355 - 397,355 Total expenditures 397,355 - 397,355
Excess (deficiency) of revenues over expenditures (391,712) 12,385 404,097
Net change in fund balance (391,712) 12,385 404,097
Fund balance - beginning of year 392,761 392,761 -
Fund balance - end of year $ 1,049 $ 405,146 $ 404,097
County and District ClerkRecords Management & Preservation
Revenues:Charges for services $ 1,048,122 $ 1,396,625 $ 348,503 Investment income 7,586 10,123 2,537
Total revenues 1,055,708 1,406,748 351,040
Expenditures:Current:
General government 1,041,180 905,178 136,002 Justice system 73,869 41,008 32,861
Capital outlay 611,367 191,861 419,506 Total expenditures 1,726,416 1,138,047 588,369
Excess (deficiency) of revenues over expenditures (670,708) 268,701 939,409
Net change in fund balance (670,708) 268,701 939,409
Fund balance - beginning of year 1,594,312 1,594,312 -
Fund balance - end of year $ 923,604 $ 1,863,013 $ 939,409
Final Amounts (Negative)
Variance withBudgeted Final BudgetAmounts Actual Positive
OSI - 32

Records Management & Preservation
Revenues:Charges for services $ 524,529 $ 536,683 $ 12,154 Investment income 1,406 1,764 358
Total revenues 525,935 538,447 12,512
Expenditures:Current:
General government 518,805 405,547 113,258 Justice system 40,658 32,915 7,743
Total expenditures 559,463 438,462 121,001
Excess (deficiency) of revenues over expenditures (33,528) 99,985 133,513
Net change in fund balance (33,528) 99,985 133,513
Fund balance - beginning of year 210,554 210,554 -
Fund balance - end of year $ 177,026 $ 310,539 $ 133,513
Courthouse Security
Revenues:Charges for services $ 464,080 $ 497,394 $ 33,314 Investment income (9,595) 8,853 18,448
Total revenues 454,485 506,247 51,762
Expenditures:Current:
Public safety 3,136,691 2,971,056 165,635 Total expenditures 3,136,691 2,971,056 165,635
Excess (deficiency) of revenues over expenditures (2,682,206) (2,464,809) 217,397
Other financing sources (uses):Transfers in 2,526,548 2,526,548 -
Total other financing sources (uses) 2,526,548 2,526,548 -
Net change in fund balance (155,658) 61,739 217,397
Fund balance - beginning of year 259,677 259,677 -
Fund balance - end of year $ 104,019 $ 321,416 $ 217,397 (continued)
Final Amounts (Negative)
Variance withBudgeted Final BudgetAmounts Actual Positive
OSI - 33

TRAVIS COUNTY, TEXASSCHEDULE OF REVENUES, EXPENDITURES, AND CHANGES INFUND BALANCESBUDGET AND ACTUAL, continuedNON-MAJOR SPECIAL REVENUE FUNDSFor The Year Ended September 30, 2013
LCRA Parks CIP
Revenues:Charges for services $ 175,000 $ 131,042 $ (43,958) Investment income 16,104 16,441 337
Total revenues 191,104 147,483 (43,621)
Expenditures:Current:
Community and economic development 26,026 26,026 - Capital outlay 418,770 161,476 257,294
Total expenditures 444,796 187,502 257,294
Excess (deficiency) of revenues over expenditures (253,692) (40,019) 213,673
Net change in fund balance (253,692) (40,019) 213,673
Fund balance - beginning of year 3,010,673 3,010,673 -
Fund balance - end of year $ 2,756,981 $ 2,970,654 $ 213,673
Justice Court Building Security
Revenues:Charges for services $ 42,464 $ 39,402 $ (3,062) Investment income 1,617 1,931 314
Total revenues 44,081 41,333 (2,748)
Expenditures:Total expenditures - - -
Excess (deficiency) of revenues over expenditures 44,081 41,333 (2,748)
Net change in fund balance 44,081 41,333 (2,748)
Fund balance - beginning of year 310,666 310,666 -
Fund balance - end of year $ 354,747 $ 351,999 $ (2,748)
Final Amounts (Negative)
Variance withBudgeted Final BudgetAmounts Actual Positive
OSI - 34

Juvenile Justice Alternative Education Program
Revenues:Intergovernmental $ 36,708 $ 92,224 $ 55,516 Investment income 6,755 6,096 (659)
Total revenues 43,463 98,320 54,857
Expenditures:Current:
Justice system 1,060,083 476,044 584,039 Total expenditures 1,060,083 476,044 584,039
Excess (deficiency) of revenues over expenditures (1,016,620) (377,724) 638,896
Other financing sources (uses):Transfers in 189,313 189,313 -
Total other financing sources (uses) 189,313 189,313 -
Net change in fund balance (827,307) (188,411) 638,896
Fund balance - beginning of year 1,152,538 1,152,538 -
Fund balance - end of year $ 325,231 $ 964,127 $ 638,896
Court Reporter Service
Revenues:Charges for services $ 359,462 $ 360,929 $ 1,467 Investment income 340 487 147
Total revenues 359,802 361,416 1,614
Expenditures:Current:
Justice system 359,913 347,803 12,110 Total expenditures 359,913 347,803 12,110
Excess (deficiency) of revenues over expenditures (111) 13,613 13,724
Net change in fund balance (111) 13,613 13,724
Fund balance - beginning of year 58,197 58,197 -
Fund balance - end of year $ 58,086 $ 71,810 $ 13,724 (continued)
Final Amounts (Negative)
Variance withBudgeted Final BudgetAmounts Actual Positive
OSI - 35

TRAVIS COUNTY, TEXASSCHEDULE OF REVENUES, EXPENDITURES, AND CHANGES INFUND BALANCESBUDGET AND ACTUAL, continuedNON-MAJOR SPECIAL REVENUE FUNDSFor The Year Ended September 30, 2013
CSCD Equipment Acquisition
Revenues:Total revenues $ - $ - $ -
Expenditures:Total expenditures - - -
Excess (deficiency) of revenues over expenditures - - -
Net change in fund balance - - -
Fund balance - beginning of year 1,121 1,121 -
Fund balance - end of year $ 1,121 $ 1,121 $ -
Juvenile Deferred Prosecution
Revenues:Charges for services $ 6,657 $ 3,695 $ (2,962) Investment income 410 487 77
Total revenues 7,067 4,182 (2,885)
Expenditures:Current:
Justice system 83,723 - 83,723 Total expenditures 83,723 - 83,723
Excess (deficiency) of revenues over expenditures (76,656) 4,182 80,838
Net change in fund balance (76,656) 4,182 80,838
Fund balance - beginning of year 83,003 83,003 -
Fund balance - end of year $ 6,347 $ 87,185 $ 80,838
Final Amounts (Negative)
Variance withBudgeted Final BudgetAmounts Actual Positive
OSI - 36

Balcones Canyonlands Preservation
Revenues:Charges for services $ 150,000 $ 189,088 $ 39,088 Investment income 84,552 53,150 (31,402) Miscellaneous 14,584 121,810 107,226
Total revenues 249,136 364,048 114,912
Expenditures:Current:
Infrastructure and environmental services 1,241,778 784,922 456,856 Capital outlay 13,779,876 8,887,168 4,892,708
Total expenditures 15,021,654 9,672,090 5,349,564
Excess (deficiency) of revenues over expenditures (14,772,518) (9,308,042) 5,464,476
Other financing sources (uses):Transfers in 10,927,333 10,927,333 -
Total other financing sources (uses) 10,927,333 10,927,333 -
Net change in fund balance (3,845,185) 1,619,291 5,464,476
Fund balance - beginning of year 5,258,959 5,258,959 -
Fund balance - end of year $ 1,413,774 $ 6,878,250 $ 5,464,476
LEOSE Commissioners' Court
Revenues:Investment income $ 3 $ - $ (3)
Total revenues 3 - (3)
Expenditures:Current:
Public safety 3,792 - 3,792 Total expenditures 3,792 - 3,792
Excess (deficiency) of revenues over expenditures (3,789) - 3,789
Net change in fund balance (3,789) - 3,789
Fund balance - beginning of year 3,801 3,801 -
Fund balance - end of year $ 12 $ 3,801 $ 3,789 (continued)
Final Amounts (Negative)
Variance withBudgeted Final BudgetAmounts Actual Positive
OSI - 37

TRAVIS COUNTY, TEXASSCHEDULE OF REVENUES, EXPENDITURES, AND CHANGES INFUND BALANCESBUDGET AND ACTUAL, continuedNON-MAJOR SPECIAL REVENUE FUNDSFor The Year Ended September 30, 2013
Juvenile Delinquency Prevention
Revenues:Charges for services $ 75 $ 105 $ 30 Investment income 2 - (2)
Total revenues 77 105 28
Expenditures:Total expenditures - - -
Excess (deficiency) of revenues over expenditures 77 105 28
Net change in fund balance 77 105 28
Fund balance - beginning of year 602 602 -
Fund balance - end of year $ 679 $ 707 $ 28
Unclaimed Property
Revenues:Fines and forfeits $ 31,250 $ 48,430 $ 17,180 Investment income 95 277 182
Total revenues 31,345 48,707 17,362
Expenditures:Total expenditures - - -
Excess (deficiency) of revenues over expenditures 31,345 48,707 17,362
Other financing sources (uses):Transfers out (31,455) (31,455) -
Total other financing sources (uses) (31,455) (31,455) -
Net change in fund balance (110) 17,252 17,362
Fund balance - beginning of year 169 169 -
Fund balance - end of year $ 59 $ 17,421 $ 17,362
Final Amounts (Negative)
Variance withBudgeted Final BudgetAmounts Actual Positive
OSI - 38

Professional Prosecutors
Revenues:Intergovernmental $ 62,500 $ 62,500 $ -
Total revenues 62,500 62,500 -
Expenditures:Current:
Justice system 62,506 62,506 - Total expenditures 62,506 62,506 -
Excess (deficiency) of revenues over expenditures (6) (6) -
Net change in fund balance (6) (6) -
Fund balance - beginning of year 12 12 -
Fund balance - end of year $ 6 $ 6 $ -
Mary Quinlan Park
Revenues:Investment income $ 687 $ 1,501 $ 814 Miscellaneous 5,000 5,000 -
Total revenues 5,687 6,501 814
Expenditures:Total expenditures - - -
Excess (deficiency) of revenues over expenditures 5,687 6,501 814
Net change in fund balance 5,687 6,501 814
Fund balance - beginning of year 271,698 271,698 -
Fund balance - end of year $ 277,385 $ 278,199 $ 814 (continued)
Final Amounts (Negative)
Variance withBudgeted Final BudgetAmounts Actual Positive
OSI - 39

TRAVIS COUNTY, TEXASSCHEDULE OF REVENUES, EXPENDITURES, AND CHANGES INFUND BALANCESBUDGET AND ACTUAL, continuedNON-MAJOR SPECIAL REVENUE FUNDSFor The Year Ended September 30, 2013
Probate Judiciary Fee
Revenues:Charges for services $ 148,337 $ 179,510 $ 31,173 Investment income 1,207 905 (302)
Total revenues 149,544 180,415 30,871
Expenditures:Current:
Justice system 213,483 204,991 8,492 Total expenditures 213,483 204,991 8,492
Excess (deficiency) of revenues over expenditures (63,939) (24,576) 39,363
Net change in fund balance (63,939) (24,576) 39,363
Fund balance - beginning of year 244,104 244,104 -
Fund balance - end of year $ 180,165 $ 219,528 $ 39,363
Courts Technology
Revenues:Charges for services $ 195,389 $ 186,883 $ (8,506) Investment income 2,285 2,559 274
Total revenues 197,674 189,442 (8,232)
Expenditures:Current:
General government 25,597 16,520 9,077 Justice system 223,968 181,086 42,882
Total expenditures 249,565 197,606 51,959
Excess (deficiency) of revenues over expenditures (51,891) (8,164) 43,727
Net change in fund balance (51,891) (8,164) 43,727
Fund balance - beginning of year 451,203 451,203 -
Fund balance - end of year $ 399,312 $ 443,039 $ 43,727
Final Amounts (Negative)
Variance withBudgeted Final BudgetAmounts Actual Positive
OSI - 40

Truancy Court
Revenues:Charges for services $ 97,411 $ 97,411 $ - Investment income 440 897 457
Total revenues 97,851 98,308 457
Expenditures:Current:
Justice system 226,770 195,799 30,971 Total expenditures 226,770 195,799 30,971
Excess (deficiency) of revenues over expenditures (128,919) (97,491) 31,428
Other financing sources (uses):Transfers in 144,151 144,151 -
Total other financing sources (uses) 144,151 144,151 -
Net change in fund balance 15,232 46,660 31,428
Fund balance - beginning of year 51,754 51,754 -
Fund balance - end of year $ 66,986 $ 98,414 $ 31,428
County Clerk Archival
Revenues:Charges for services $ 928,000 $ 1,293,424 $ 365,424 Investment income 1,475 5,027 3,552
Total revenues 929,475 1,298,451 368,976
Expenditures:Current:
General government 1,181,615 888,716 292,899 Total expenditures 1,181,615 888,716 292,899
Excess (deficiency) of revenues over expenditures (252,140) 409,735 661,875
Other financing sources (uses):Transfers out (7,702) (7,702) -
Total other financing sources (uses) (7,702) (7,702) -
Net change in fund balance (259,842) 402,033 661,875
Fund balance - beginning of year 649,258 649,258 -
Fund balance - end of year $ 389,416 $ 1,051,291 $ 661,875 (continued)
Final Amounts (Negative)
Variance withBudgeted Final BudgetAmounts Actual Positive
OSI - 41

TRAVIS COUNTY, TEXASSCHEDULE OF REVENUES, EXPENDITURES, AND CHANGES INFUND BALANCESBUDGET AND ACTUAL, continuedNON-MAJOR SPECIAL REVENUE FUNDSFor The Year Ended September 30, 2013
Family Protection
Revenues:Charges for services $ 53,862 $ 53,884 $ 22 Investment income 121 226 105
Total revenues 53,983 54,110 127
Expenditures:Current:
Justice system 55,324 55,323 1 Total expenditures 55,324 55,323 1
Excess (deficiency) of revenues over expenditures (1,341) (1,213) 128
Net change in fund balance (1,341) (1,213) 128
Fund balance - beginning of year 39,301 39,301 -
Fund balance - end of year $ 37,960 $ 38,088 $ 128
Elections Contract
Revenues:Charges for services $ 853,500 $ 803,064 $ (50,436) Investment income 3,671 3,030 (641)
Total revenues 857,171 806,094 (51,077)
Expenditures:Current:
General government 1,162,854 876,076 286,778 Capital outlay 38,500 38,100 400
Total expenditures 1,201,354 914,176 287,178
Excess (deficiency) of revenues over expenditures (344,183) (108,082) 236,101
Net change in fund balance (344,183) (108,082) 236,101
Fund balance - beginning of year 468,742 468,742 -
Fund balance - end of year $ 124,559 $ 360,660 $ 236,101
Final Amounts (Negative)
Variance withBudgeted Final BudgetAmounts Actual Positive
OSI - 42

Vital Statistic Preservation
Revenues:Charges for services $ 658 $ 1,439 $ 781 Investment income 227 193 (34)
Total revenues 885 1,632 747
Expenditures:Current:
Justice system 3,000 820 2,180 Total expenditures 3,000 820 2,180
Excess (deficiency) of revenues over expenditures (2,115) 812 2,927
Net change in fund balance (2,115) 812 2,927
Fund balance - beginning of year 35,006 35,006 -
Fund balance - end of year $ 32,891 $ 35,818 $ 2,927
Fire Code
Revenues:Charges for services $ 120,000 $ 341,296 $ 221,296 Investment income 1,205 2,490 1,285
Total revenues 121,205 343,786 222,581
Expenditures:Current:
Public safety 167,234 163,496 3,738 Total expenditures 167,234 163,496 3,738
Excess (deficiency) of revenues over expenditures (46,029) 180,290 226,319
Net change in fund balance (46,029) 180,290 226,319
Fund balance - beginning of year 218,092 218,092 -
Fund balance - end of year $ 172,063 $ 398,382 $ 226,319 (continued)
Final Amounts (Negative)
Variance withBudgeted Final BudgetAmounts Actual Positive
OSI - 43

TRAVIS COUNTY, TEXASSCHEDULE OF REVENUES, EXPENDITURES, AND CHANGES INFUND BALANCESBUDGET AND ACTUAL, continuedNON-MAJOR SPECIAL REVENUE FUNDSFor The Year Ended September 30, 2013
Child Abuse Prevention
Revenues:Charges for services $ 2,500 $ 3,553 $ 1,053 Investment income 18 - (18)
Total revenues 2,518 3,553 1,035
Expenditures:Current:
Health and human services 5,050 - 5,050 Total expenditures 5,050 - 5,050
Excess (deficiency) of revenues over expenditures (2,532) 3,553 6,085
Net change in fund balance (2,532) 3,553 6,085
Fund balance - beginning of year 7,094 7,094 -
Fund balance - end of year $ 4,562 $ 10,647 $ 6,085
Juvenile Case Manager
Revenues:Charges for services $ 213,062 $ 202,111 $ (10,951) Investment income 6,070 6,080 10
Total revenues 219,132 208,191 (10,941)
Expenditures:Current:
Justice system 252,001 237,627 14,374 Total expenditures 252,001 237,627 14,374
Excess (deficiency) of revenues over expenditures (32,869) (29,436) 3,433
Net change in fund balance (32,869) (29,436) 3,433
Fund balance - beginning of year 1,087,031 1,087,031 -
Fund balance - end of year $ 1,054,162 $ 1,057,595 $ 3,433
Final Amounts (Negative)
Variance withBudgeted Final BudgetAmounts Actual Positive
OSI - 44

Health Food Permits
Revenues:Charges for services $ 67,000 $ 88,350 $ 21,350 Investment income 478 1,212 734
Total revenues 67,478 89,562 22,084
Expenditures:Current:
Health and human services 135,000 26,444 108,556 Total expenditures 135,000 26,444 108,556
Excess (deficiency) of revenues over expenditures (67,522) 63,118 130,640
Net change in fund balance (67,522) 63,118 130,640
Fund balance - beginning of year 140,413 140,413 -
Fund balance - end of year $ 72,891 $ 203,531 $ 130,640
Drug Court Program
Revenues:Charges for services $ 201,606 $ 147,889 $ (53,717) Investment income 920 1,097 177
Total revenues 202,526 148,986 (53,540)
Expenditures:Current:
Corrections and rehabilitation 189,322 150,153 39,169 Total expenditures 189,322 150,153 39,169
Excess (deficiency) of revenues over expenditures 13,204 (1,167) (14,371)
Net change in fund balance 13,204 (1,167) (14,371)
Fund balance - beginning of year 175,799 175,799 -
Fund balance - end of year $ 189,003 $ 174,632 $ (14,371) (continued)
Final Amounts (Negative)
Variance withBudgeted Final BudgetAmounts Actual Positive
OSI - 45

TRAVIS COUNTY, TEXASSCHEDULE OF REVENUES, EXPENDITURES, AND CHANGES INFUND BALANCESBUDGET AND ACTUAL, continuedNON-MAJOR SPECIAL REVENUE FUNDSFor The Year Ended September 30, 2013
Probate Guardianship
Revenues:Charges for services $ 79,000 $ 92,742 $ 13,742 Investment income 1,139 1,301 162
Total revenues 80,139 94,043 13,904
Expenditures:Current:
Justice system 82,750 76,167 6,583 Total expenditures 82,750 76,167 6,583
Excess (deficiency) of revenues over expenditures (2,611) 17,876 20,487
Net change in fund balance (2,611) 17,876 20,487
Fund balance - beginning of year 207,594 207,594 -
Fund balance - end of year $ 204,983 $ 225,470 $ 20,487
Gardner House Handicraft
Revenues:Investment income $ 13 $ - $ (13)
Total revenues 13 - (13)
Expenditures:Current:
Justice system 3,353 - 3,353 Total expenditures 3,353 - 3,353
Excess (deficiency) of revenues over expenditures (3,340) - 3,340
Net change in fund balance (3,340) - 3,340
Fund balance - beginning of year 3,358 3,358 -
Fund balance - end of year $ 18 $ 3,358 $ 3,340
Final Amounts (Negative)
Variance withBudgeted Final BudgetAmounts Actual Positive
OSI - 46

CAPCOG 911 Fees
Revenues:Investment income $ (4,692) $ 32 $ 4,724
Total revenues (4,692) 32 4,724
Expenditures:Current:
Public safety 470,796 454,678 16,118 Total expenditures 470,796 454,678 16,118
Excess (deficiency) of revenues over expenditures (475,488) (454,646) 20,842
Net change in fund balance (475,488) (454,646) 20,842
Fund balance - beginning of year 475,593 475,593 -
Fund balance - end of year $ 105 $ 20,947 $ 20,842
Unclaimed Juvenile Restitution
Revenues:Fines and forfeits $ 2,825 $ 4,342 $ 1,517 Investment income 161 205 44
Total revenues 2,986 4,547 1,561
Expenditures:Total expenditures - - -
Excess (deficiency) of revenues over expenditures 2,986 4,547 1,561
Net change in fund balance 2,986 4,547 1,561
Fund balance - beginning of year 27,555 27,555 -
Fund balance - end of year $ 30,541 $ 32,102 $ 1,561 (continued)
Final Amounts (Negative)
Variance withBudgeted Final BudgetAmounts Actual Positive
OSI - 47

TRAVIS COUNTY, TEXASSCHEDULE OF REVENUES, EXPENDITURES, AND CHANGES INFUND BALANCESBUDGET AND ACTUAL, continuedNON-MAJOR SPECIAL REVENUE FUNDSFor The Year Ended September 30, 2013
Lake Travis Economic DevelopmentRevenues:
Investment income $ 23 $ - $ (23) Total revenues 23 - (23)
Expenditures:Current:
Total expenditures - - -
Excess (deficiency) of revenues over expenditures 23 - (23)
Net change in fund balance 23 - (23)
Fund balance - beginning of year 45 45 -
Fund balance - end of year $ 68 $ 45 $ (23)
After School Youth ServicesRevenues:
Charges for services $ 168,584 $ 168,584 $ - Total revenues 168,584 168,584 -
Expenditures:Current:
Health and human services 202,595 159,766 42,829 Total expenditures 202,595 159,766 42,829
Excess (deficiency) of revenues over expenditures (34,011) 8,818 42,829
Other financing sources (uses):Transfers in 34,011 34,011 -
Total other financing sources (uses) 34,011 34,011 -
Net change in fund balance - 42,829 42,829
Fund balance - beginning of year - - -
Fund balance - end of year $ - $ 42,829 $ 42,829 (concluded)
Variance withFinal Budget
Positive(Negative)
BudgetedAmounts
FinalActual
Amounts
OSI - 48

Joint Road Improvements
Revenues:Charges for services $ 961,507 $ 13,075,126 $ 12,113,619 Investment income 2,839 6,399 3,560 Miscellaneous 139,491 1,168,942 1,029,451
Total revenues 1,103,837 14,250,467 13,146,630
Expenditures:Current:
Infrastructure and environmental services 4,931,253 2,190,596 2,740,657 Community and economic development 4,439 4,439 -
Capital outlay 208,112 128,801 79,311 Total expenditures 5,143,804 2,323,836 2,819,968
Excess (deficiency) of revenuesover expenditures (4,039,967) 11,926,631 15,966,598
Net change in fund balance (4,039,967) 11,926,631 15,966,598
Fund balance - beginning of year 4,513,206 4,513,206 -
Fund balance - end of year $ 473,239 $ 16,439,837 $ 15,966,598
Subdivision Parkland
Revenues:Charges for services $ 381,128 $ 395,069 $ 13,941 Investment income - 6,566 6,566
Total revenues 381,128 401,635 20,507
Expenditures:Current:
Community and economic development 237,097 - 237,097 Capital outlay 645,925 176,382 469,543
Total expenditures 883,022 176,382 706,640
Excess (deficiency) of revenuesover expenditures (501,894) 225,253 727,147
Net change in fund balance (501,894) 225,253 727,147
Fund balance - beginning of year 501,894 501,894 -
Fund balance - end of year $ - $ 727,147 $ 727,147 (continued)
AmountsFinal
Budgeted
TRAVIS COUNTY, TEXASSCHEDULE OF REVENUES, EXPENDITURES, AND CHANGES IN FUND BALANCES
BUDGET AND ACTUALNON-MAJOR CAPITAL PROJECTS FUNDSFor The Year Ended September 30, 2013
ActualAmounts
Variance withFinal Budget
Positive(Negative)
OSI - 49

Northeast Metro Park
Revenues:Investment Income $ - $ (1,311) $ (1,311)
Total revenues - (1,311) (1,311)
Expenditures:Capital outlay 477,882 476,056 1,826
Total expenditures 477,882 476,056 1,826
Excess (deficiency) of revenuesover expenditures (477,882) (477,367) 515
Net change in fund balance (477,882) (477,367) 515
Fund balance - beginning of year 496,944 496,944 -
Fund balance - end of year $ 19,062 $ 19,577 $ 515 (concluded)
BudgetedAmounts
Final
TRAVIS COUNTY, TEXASSCHEDULE OF REVENUES, EXPENDITURES, AND CHANGES IN FUND BALANCESBUDGET AND ACTUAL, continuedNON-MAJOR CAPITAL PROJECTS FUNDSFor The Year Ended September 30, 2013
ActualAmounts
Variance withFinal Budget
Positive(Negative)
OSI - 50

TRAVIS COUNTY, TEXAS PROPRIETARY FUND
Internal service funds, a type of proprietary fund, are used to account for the financing of goods or services provided by one department to other departments of the government on a cost reimbursement basis. The County’s proprietary fund consists of the following:
Self-Insurance Fund - This fund is used to account for the activities of the County's self-insurance program for general, property and automobile liabilities, error and omissions claims and judgments, workers’ compensation claims, and loss from theft and crime.
Employee Health Benefit Fund - This fund is used to account for the activities of the County's self-insurance program for paying health claims for county employees, retirees, and their dependents who are eligible members of the plan.
I N T E R N A L
S E R V I C E
F U N D S OSI - 51

OSI - 52

TRAVIS COUNTY, TEXASCOMBINING STATEMENT OF NET POSITION
INTERNAL SERVICE FUNDSSeptember 30, 2013
EmployeeSelf-Insurance Health Benefit Total
Assets
Current assets:Pooled cash $ 19,657,767 $ 26,773,981 $ 46,431,748 Interest receivable 22,559 28,612 51,171 Due from other funds 84,844 - 84,844 Accounts receivable - 1,083,420 1,083,420 Other receivables 133,618 - 133,618 Prepaid items 405,925 - 405,925 Other assets 300,000 2,668,041 2,968,041
Total current assets 20,604,713 30,554,054 51,158,767
Noncurrent assets:Capital assets:
Property, plant, and equipment 50,000 478,495 528,495 Less accumulated depreciation (50,000) (105,586) (155,586)
Total noncurrent assets - 372,909 372,909
Total assets 20,604,713 30,926,963 51,531,676
Liabilities
Current liabilities:Accounts payable 79,171 31,549 110,720 Due to other funds - 89 89 Accrued and other liabilities 92,665 52,583 145,248 Claims and judgments 3,595,181 7,916,054 11,511,235 Compensated absences 17,739 38,359 56,098
Total current liabilities 3,784,756 8,038,634 11,823,390
Noncurrent liabilities:Claims and judgments 5,121,397 - 5,121,397 Compensated absences 22,091 49,125 71,216
Total noncurrent liabilities 5,143,488 49,125 5,192,613
Total liabilities 8,928,244 8,087,759 17,016,003
Net Position
Net investment in capital assets - 372,909 372,909 Unrestricted 11,676,469 22,466,295 34,142,764
Total net position $ 11,676,469 $ 22,839,204 $ 34,515,673
OSI - 53

EmployeeSelf-Insurance Health Benefit Total
Operating revenues:Insurance premiums-county $ 5,039,177 $ 45,459,815 $ 50,498,992 Insurance premiums-employee - 7,772,949 7,772,949 Miscellaneous 25,887 2,211,647 2,237,534
Total operating revenues 5,065,064 55,444,411 60,509,475
Operating expenses:Incurred losses 4,270,669 53,877,232 58,147,901 Unemployment claims 277,771 - 277,771 Insurance expense 913,404 2,462,778 3,376,182 Professional services 3,854 37,945 41,799 Depreciation expense - 3,483 3,483 Administration 776,225 1,598,906 2,375,131
Total operating expenses 6,241,923 57,980,344 64,222,267
Operating income (loss) (1,176,859) (2,535,933) (3,712,792)
Nonoperating revenues:Investment income 18,208 17,155 35,363
Total nonoperating revenues 18,208 17,155 35,363
Change in net position (1,158,651) (2,518,778) (3,677,429)
Net position - beginning of year before restatement 12,835,120 19,147,438 31,982,558
Cumulative effect of change from Statutory Basisto GAAP Basis (see Note 15) - 6,210,544 6,210,544
Net position - beginning of year after restatement 12,835,120 25,357,982 38,193,102
Net position - end of year $ 11,676,469 $ 22,839,204 $ 34,515,673
TRAVIS COUNTY, TEXASCOMBINING STATEMENT OF REVENUES, EXPENSES,
AND CHANGES IN NET POSITIONINTERNAL SERVICE FUNDS
For The Year Ended September 30, 2013
OSI - 54

TRAVIS COUNTY, TEXASCOMBINING STATEMENT OF CASH FLOWS
INTERNAL SERVICE FUNDSFor The Year Ended September 30, 2013
EmployeeSelf-Insurance Health Benefit Total
Cash flows from operating activitiesCash received from premium revenues $ 5,042,274 $ 52,686,832 $ 57,729,106 Cash received from subrogation 2,896 - 2,896 Cash received from insurance proceeds, rebates, and other receipts 25,887 1,714,761 1,740,648 Cash paid for self-insured claims and loss adjustment expenses (3,063,815) (52,808,687) (55,872,502) Cash paid for other operating expenses (1,356,128) (2,987,652) (4,343,780) Cash paid for payroll (685,629) (1,578,261) (2,263,890)
Net cash provided by (used for) operating activities (34,515) (2,973,007) (3,007,522)
Cash flows from investing activitiesInterest received 109,498 152,500 261,998 Increase (decrease) in fair value of investments in pooled cash (92,276) (135,709) (227,985)
Net cash provided by (used for) investing activities 17,222 16,791 34,013
Net increase (decrease) in pooled cash balance (17,293) (2,956,216) (2,973,509)
Pooled cash balance - beginning of year 19,675,060 29,730,197 49,405,257
Pooled cash balance - end of year $ 19,657,767 $ 26,773,981 $ 46,431,748
Reconciliation of operating income (loss) to net cash provided by (used for) operating activities
Operating income (loss) $ (1,176,859) $ (2,535,933) $ (3,712,792)
Adjustments to reconcile operating income to net cash provided by (used for) operating activities:Depreciation expense - 3,483 3,483 (Increase) decrease in due from other funds 865 - 865 (Increase) decrease in other receivables 5,128 (1,083,420) (1,078,292) (Increase) decrease in prepaid items (298,426) - (298,426) Increase (decrease) in claims and judgments 1,556,010 1,655,079 3,211,089 Increase (decrease) in other liabilities (121,233) (1,012,216) (1,133,449)
Net cash provided by (used for) operating activities $ (34,515) $ (2,973,007) $ (3,007,522)
OSI - 55

OSI - 56

TRAVIS COUNTY, TEXAS FIDUCIARY FUNDS
Agency funds, a type of fiduciary fund, are used to account for assets held by the County in a fiduciary capacity as custodian or agent for individuals and other governmental units.
Agency Funds
County Officials' Escrow Fund - To account for cash bail bonds deposited prior to January 1, 1984 for which there have been no requests for refunds.
Cash Bonds Fund - To account for cash bail bonds deposited after January 1, 1984.
Surety Bail Bond Deposits Fund - To account for collateral deposits required of surety bail bond individuals.
State Revenue Fund - To account for fees collected on various court cases and jury contributions, which are remitted to the State of Texas. For some of the fees collected, the County receives a 10% commission, which is deposited into the General Fund.
LCRA Escrow Fund - To account for fees collected at LCRA parks operated by the County that are transferred to the General Fund as park fee revenue upon the approval of the Commissioners’ Court. Fees are also transferred to LCRA – Parks CIP Fund.
Officials' Fee Account Fund - To account for monies held in elected and appointed officials’ bank accounts as well as accounts for DRO and CSCD. County officials each have a bank account into which they deposit their collections. From these accounts they disburse monies to the County, State, other governmental entities, and individuals.
District and County Clerk Invested Trust Fund - To provide a compilation of all invested trust funds for reporting purposes.
Road District Indemnification Fees Fund - To account for deposits required of road districts to ensure contract compliance.
TNR Escrow Fund - To account for deposits required of road contractors to ensure contract compliance.
Forfeited Property Fund - To account for funds seized by the County or District Attorney’s Office or the Sheriff’s Office related to criminal cases awaiting adjudication. Based on the decision in the case, the funds are either returned to the defendant or distributed to the applicable justice system organizations.
Travis County Refunded Bonds Fund - To account for monies received from escrow agent and disbursed for payment of principal and interest on refunded bonds.
Road Districts Refunded Bonds Fund - Southwest Travis County Road District No. 1 has advance refunded bonds. The monies were placed in an escrow account to be disbursed for payment of the principal and interest for the bonds refunded. The County acts as the paying agent for these bonds.
A G E N C Y
F U N D S
OSI - 57

TRAVIS COUNTY, TEXAS Agency Funds, continued
Inmate Trust Fund - Funds belonging to jail inmates are accounted for in this fund until such time as they are expended on behalf of or returned to the inmates upon discharge.
DNA Testing Fund - To account for court costs for convictions of offenses requiring DNA testing.
Available School Fund - To account for funds, other than oil royalties, from land owned by Travis County, and to account for the annual distribution of these monies to school districts.
CAPEC Participation Fund - To account for funds received from participating entities and to account for the disbursement of these monies to procure services and products on behalf of the Capital Area Pavement Engineering Council’s efforts to significantly improve transportation infrastructure and advance public safety.
OSI - 58

OSI - 59

Assets
Cash and pooled cash $ - $ - $ 50,000 $ 1,824,793 Certificates of deposit - - 1,268,919 - Investments - - - - Interest receivable - - - - Accounts receivable, net - - - 1,943,210
Total assets $ - $ - $ 1,318,919 $ 3,768,003
Liabilities
Due to third parties $ - $ - $ - $ - Civil and probate deposits - - - - Cash and surety bonds and deposits - - 1,318,919 - Due to other governmental entities - - - 3,768,003
Total liabilities $ - $ - $ 1,318,919 $ 3,768,003
Escrow
SuretyBail BondDeposits
Officials' CashBonds
TRAVIS COUNTY, TEXASCOMBINING STATEMENT OF ASSETS AND LIABILITIES
AGENCY FUNDSSeptember 30, 2013
CountyState
Revenue
OSI - 60

$ 28,888 $ 13,639,133 $ 218,260 $ 40,823 $ 6,223,011 - - 19,644,720 - - - 18,409,426 54,766 - -
757 - 11,264 34 6,362 - 986,233 - - -
$ 29,645 $ 33,034,792 $ 19,929,010 $ 40,857 $ 6,229,373
$ 29,645 $ 17,756,616 $ 19,929,010 $ 40,857 $ 6,229,373 - 233,301 - - - - 7,249,301 - - - - 7,795,574 - - -
$ 29,645 $ 33,034,792 $ 19,929,010 $ 40,857 $ 6,229,373 (continued)
FeesTNR
Escrow
District andCounty Clerk
InvestedTrust Fund
RoadDistrict
IndemnificationLCRAEscrow
Officials'Fee
Account
OSI - 61

TRAVIS COUNTY, TEXASCOMBINING STATEMENT OF ASSETS AND LIABILITIES, continuedAGENCY FUNDSSeptember 30, 2013
Assets
Cash and pooled cash $ 191,883 $ 5,316 $ 682,068 Certificates of deposit 687,706 - - Investments - - - Interest receivable - - - Accounts receivable, net - - -
Total assets $ 879,589 $ 5,316 $ 682,068
Liabilities
Due to third parties $ 879,589 $ 5,316 $ 682,068 Civil and probate deposits - - - Cash and surety bonds and deposits - - - Due to other governmental entities - - -
Total liabilities $ 879,589 $ 5,316 $ 682,068
RefundedBonds
RoadDistricts
RefundedBonds
TravisCounty
ForfeitedProperty
OSI - 62

$ 138,658 $ 9,589 $ 115,668 $ 79,271 $ 23,247,361 - - - - 21,601,345 - - - - 18,464,192 - - 3,920 104 22,441
3,178 - - - 2,932,621 $ 141,836 $ 9,589 $ 119,588 $ 79,375 $ 66,267,960
$ 141,816 $ - $ - $ 79,375 $ 45,773,665 - - - - 233,301 - - - - 8,568,220
20 9,589 119,588 - 11,692,774 $ 141,836 $ 9,589 $ 119,588 $ 79,375 $ 66,267,960
(concluded)
CAPECParticipation
Fund
TotalAgencyFunds
DNAAvailableSchoolFund
InmateTrustFund Testing
OSI - 63

Balance BalanceOctober 1, 2012 Additions Deletions September 30, 2013
County Officials' EscrowAssets:
Cash and pooled cash $ 20,006 $ - $ 20,006 $ - Total assets $ 20,006 $ - $ 20,006 $ -
Liabilities:Due to third parties $ 5,798 $ - $ 5,798 $ - Cash and surety bonds and deposits 14,208 - 14,208 -
Total liabilities $ 20,006 $ - $ 20,006 $ -
Cash BondsAssets:
Cash and pooled cash $ 647,996 $ 30,630 $ 678,626 $ - Total assets $ 647,996 $ 30,630 $ 678,626 $ -
Liabilities:Cash and surety bonds and deposits $ 647,996 $ 30,630 $ 678,626 $ -
Total liabilities $ 647,996 $ 30,630 $ 678,626 $ -
Surety Bail Bond DepositsAssets:
Cash and pooled cash $ 50,000 $ 61,157 $ 61,157 $ 50,000 Certificates of deposit 1,352,926 115,150 199,157 1,268,919
Total assets $ 1,402,926 $ 176,307 $ 260,314 $ 1,318,919
Liabilities:Cash and surety bonds and deposits $ 1,402,926 $ 122,150 $ 206,157 $ 1,318,919
Total liabilities $ 1,402,926 $ 122,150 $ 206,157 $ 1,318,919
State RevenueAssets:
Cash and pooled cash $ 1,551,780 $ 7,085,380 $ 6,812,367 $ 1,824,793 Accounts receivable, net 1,795,153 3,135,699 2,987,642 1,943,210
Total assets $ 3,346,933 $ 10,221,079 $ 9,800,009 $ 3,768,003
Liabilities:Due to other governmental entities $ 3,346,933 $ 22,048,073 $ 21,627,003 $ 3,768,003
Total liabilities $ 3,346,933 $ 22,048,073 $ 21,627,003 $ 3,768,003
TRAVIS COUNTY, TEXASCOMBINING STATEMENT OF CHANGES IN ASSETS AND LIABILITIES
AGENCY FUNDS For the Year Ended September 30, 2013
OSI - 64

Balance BalanceOctober 1, 2012 Additions Deletions September 30, 2013
LCRA EscrowAssets:
Cash and pooled cash $ 29,392 $ 2,294,207 $ 2,294,711 $ 28,888 Interest receivable 766 6,998 7,007 757
Total assets $ 30,158 $ 2,301,205 $ 2,301,718 $ 29,645
Liabilities:Due to third parties $ 30,158 $ 1,925,191 $ 1,925,704 $ 29,645
Total liabilities $ 30,158 $ 1,925,191 $ 1,925,704 $ 29,645
Officials' Fee AccountAssets:
Cash and pooled cash $ 17,701,852 $ 3,929,041,599 $ 3,933,104,318 $ 13,639,133 Investments 16,277,090 1,259,652,680 1,257,520,344 18,409,426 Accounts receivable, net 981,496 58,836,403 58,831,666 986,233
Total assets $ 34,960,438 $ 5,247,530,682 $ 5,249,456,328 $ 33,034,792
Liabilities:Due to third parties $ 14,952,547 $ 2,268,417,910 $ 2,265,613,841 $ 17,756,616 Civil and probate deposits 171,160 6,752,722 6,690,581 233,301 Cash and surety bonds and deposits 12,733,680 6,262,988 11,747,367 7,249,301 Due to other governmental entities 7,103,051 384,240,659 383,548,136 7,795,574
Total liabilities $ 34,960,438 $ 2,665,674,279 $ 2,667,599,925 $ 33,034,792
District and County Clerk Invested Trust FundAssets:
Cash and pooled cash $ 147,905 $ 12,153,174 $ 12,082,819 $ 218,260 Certificates of deposit 21,601,705 697,017 2,654,002 19,644,720 Investments 9,632,196 8,936 9,586,366 54,766 Interest receivable 39,353 - 28,089 11,264
Total assets $ 31,421,159 $ 12,859,127 $ 24,351,276 $ 19,929,010
Liabilities:Due to third parties $ 31,421,159 $ 12,096,548 $ 23,588,697 $ 19,929,010
Total liabilities $ 31,421,159 $ 12,096,548 $ 23,588,697 $ 19,929,010
Road District Indemnification FeesAssets:
Cash and pooled cash $ 40,813 $ 1,618 $ 1,608 $ 40,823 Interest receivable 45 591 602 34
Total assets $ 40,858 $ 2,209 $ 2,210 $ 40,857
Liabilities:Due to third parties $ 40,858 $ 1,016 $ 1,017 $ 40,857
Total liabilities $ 40,858 $ 1,016 $ 1,017 $ 40,857 (continued)
OSI - 65

TRAVIS COUNTY, TEXASCOMBINING STATEMENT OF CHANGES IN ASSETS AND LIABILITIES, continuedAGENCY FUNDSFor the Year Ended September 30, 2013
Balance BalanceOctober 1, 2012 Additions Deletions September 30, 2013
TNR EscrowAssets:
Cash and pooled cash $ 4,704,798 $ 3,838,769 $ 2,320,556 $ 6,223,011 Interest receivable 5,122 63,156 61,916 6,362
Total assets $ 4,709,920 $ 3,901,925 $ 2,382,472 $ 6,229,373
Liabilities:Due to third parties $ 4,709,920 $ 6,968,256 $ 5,448,803 $ 6,229,373
Total liabilities $ 4,709,920 $ 6,968,256 $ 5,448,803 $ 6,229,373
Forfeited PropertyAssets:
Cash and pooled cash $ 140,502 $ 930,558 $ 879,177 $ 191,883 Certificates of deposit 651,514 348,479 312,287 687,706
Total assets $ 792,016 $ 1,279,037 $ 1,191,464 $ 879,589
Liabilities:Due to third parties $ 792,016 $ 622,102 $ 534,529 $ 879,589 Due to other governmental entities - 24,519 24,519 -
Total liabilities $ 792,016 $ 646,621 $ 559,048 $ 879,589
Travis County Refunded BondsAssets:
Cash and pooled cash $ 5,316 $ 33,586,170 $ 33,586,170 $ 5,316 Total assets $ 5,316 $ 33,586,170 $ 33,586,170 $ 5,316
Liabilities:Due to third parties $ 5,316 $ 67,152,038 $ 67,152,038 $ 5,316
Total liabilities $ 5,316 $ 67,152,038 $ 67,152,038 $ 5,316
Road Districts Refunded BondsAssets:
Cash and pooled cash $ 681,559 $ 509 $ - $ 682,068 Total assets $ 681,559 $ 509 $ - $ 682,068
Liabilities:Due to third parties $ 681,559 $ 509 $ - $ 682,068
Total liabilities $ 681,559 $ 509 $ - $ 682,068
OSI - 66

Balance BalanceOctober 1, 2012 Additions Deletions September 30, 2013
Inmate Trust FundAssets:
Cash and pooled cash $ 134,329 $ 5,948,957 $ 5,944,628 $ 138,658 Accounts receivable, net - 3,187 9 3,178
Total assets $ 134,329 $ 5,952,144 $ 5,944,637 $ 141,836
Liabilities:Due to third parties $ 134,329 $ 2,981,841 $ 2,974,354 $ 141,816 Due to other governmental entities - 20 - 20
Total liabilities $ 134,329 $ 2,981,861 $ 2,974,354 $ 141,836
DNA TestingAssets:
Cash and pooled cash $ 6,377 $ 37,285 $ 34,073 $ 9,589 Total assets $ 6,377 $ 37,285 $ 34,073 $ 9,589
Liabilities:Due to other governmental entities $ 6,377 $ 37,285 $ 34,073 $ 9,589
Total liabilities $ 6,377 $ 37,285 $ 34,073 $ 9,589
Available School FundAssets:
Cash and pooled cash $ 128,060 $ 273,670 $ 286,062 $ 115,668 Interest receivable 3,824 51,396 51,300 3,920
Total assets $ 131,884 $ 325,066 $ 337,362 $ 119,588
Liabilities:Due to other governmental entities $ 131,884 $ 226,063 $ 238,359 $ 119,588
Total liabilities $ 131,884 $ 226,063 $ 238,359 $ 119,588
CAPEC Participation FundAssets:
Cash and pooled cash $ 167,772 $ 101,120 $ 189,621 $ 79,271 Interest receivable 184 1,876 1,956 104
Total assets $ 167,956 $ 102,996 $ 191,577 $ 79,375
Liabilities:Due to third parties $ 167,956 $ 100,095 $ 188,676 $ 79,375
Total liabilities $ 167,956 $ 100,095 $ 188,676 $ 79,375 (continued)
OSI - 67

TRAVIS COUNTY, TEXASCOMBINING STATEMENT OF CHANGES IN ASSETS AND LIABILITIES, continuedAGENCY FUNDSFor the Year Ended September 30, 2013
Balance BalanceOctober 1, 2012 Additions Deletions September 30, 2013
Total - All Agency FundsAssets:
Cash and pooled cash $ 26,158,457 $ 3,995,384,803 $ 3,998,295,899 $ 23,247,361 Certificates of deposit 23,606,145 1,160,646 3,165,446 21,601,345 Investments 25,909,286 1,259,661,616 1,267,106,710 18,464,192 Interest receivable 49,294 124,017 150,870 22,441 Accounts receivable, net 2,776,649 61,975,289 61,819,317 2,932,621
Total assets $ 78,499,831 $ 5,318,306,371 $ 5,330,538,242 $ 66,267,960
Liabilities:Due to third parties $ 52,941,616 $ 2,360,265,506 $ 2,367,433,457 $ 45,773,665 Civil and probate deposits 171,160 6,752,722 6,690,581 233,301 Cash and surety bonds and deposits 14,798,810 6,415,768 12,646,358 8,568,220 Due to other governmental entities 10,588,245 406,576,619 405,472,090 11,692,774
Total liabilities $ 78,499,831 $ 2,780,010,615 $ 2,792,242,486 $ 66,267,960 (concluded)
OSI - 68

GENERAL FUND
EXPENDITURES BUDGET
AND ACTUAL DETAIL
OSI - 69

OSI - 70

TRAVIS COUNTY, TEXASSCHEDULE OF EXPENDITURES BY FUNCTION, SUB-FUNCTION AND OFFICE/DEPARTMENT
BUDGET AND ACTUALGENERAL FUND
For The Year Ended September 30, 2013 Variance withFinal Budget
Budgeted Amounts1, 2 Actual Positive Original Final Amounts2 (Negative)
General Government:General Administration
County Judge $ 449,009 $ 448,976 $ 422,906 $ 26,070 County Commissioner Precinct No. 1 365,969 365,969 349,947 16,022 County Commissioner Precinct No. 2 365,155 365,081 314,464 50,617 County Commissioner Precinct No. 3 359,675 359,651 341,887 17,764 County Commissioner Precinct No. 4 353,888 354,713 302,984 51,729 Commissioners' Court General Administration 4,363,594 4,191,551 3,336,382 855,169 Human Resource Management 13,039,349 13,364,862 11,628,708 1,736,154 Information Technology Services 33,955,228 36,968,818 32,650,892 4,317,926 County Clerk - Recording 3,264,129 3,004,255 2,769,068 235,187 Civil Service Commission 95,376 95,376 89,897 5,479 Records Management and Communication 5,115,930 5,255,201 4,848,958 406,243 Hospitalization Contra (124,819) (124,819) - (124,819) Centralized Computer Systems and Services (ITS) 596,555 596,555 397,420 199,135 Centralized Rent and Utilities (Facilities) 2,398,542 660,262 251,277 408,985 Centralized Fleet Services (TNR) 21,947 34,423 13,081 21,342
Total General Administration 64,619,527 65,940,874 57,717,871 8,223,003
Financial AdministrationCounty Auditor 11,173,113 11,104,220 9,076,426 2,027,794 County Treasurer 812,359 809,162 749,910 59,252 Planning and Budget 2,104,781 2,154,637 1,975,344 179,293 Purchasing and Inventory Management 3,701,138 3,710,458 3,484,052 226,406 Hospitalization Contra (126,693) (126,693) - (126,693) Centralized Computer Systems and Services (ITS) 53,924 53,924 32,936 20,988 Centralized Rent and Utilities (Facilities) 16,170 64,170 61,394 2,776 Centralized Fleet Services (TNR) 1,058 1,323 1,319 4
Total Financial Administration 17,735,850 17,771,201 15,381,381 2,389,820
Tax AdministrationTax Collector 7,632,639 7,626,696 7,270,620 356,076 Hospitalization Contra (92,632) (92,632) - (92,632) Centralized Computer Systems and Services (ITS) 16,277 16,277 6,535 9,742 Centralized Rent and Utilities (Facilities) 7,934 79,434 79,320 114 Centralized Fleet Services (TNR) 3,203 4,071 4,063 8
Total Tax Administration 7,567,421 7,633,846 7,360,538 273,308
Facilities ManagementFacilities Management 16,319,641 15,997,823 12,402,875 3,594,948 Property Development (TNR) 85,194 85,194 - 85,194 Hospitalization Contra (90,627) (90,627) - (90,627) Centralized Computer Systems and Services (ITS) 28,203 28,203 24,901 3,302 Centralized Rent and Utilities (Facilities) 1,218 116,768 109,284 7,484 Centralized Fleet Services (TNR) 195,341 176,064 175,881 183
Total Facilities Management 16,538,970 16,313,425 12,712,941 3,600,484
Election AdministrationCounty Clerk - Election Administration 3,377,409 3,611,377 3,095,111 516,266 Hospitalization Contra (8,577) (8,577) - (8,577) Centralized Rent and Utilities (Facilities) 121 56,596 54,501 2,095
Total Election Administration 3,368,953 3,659,396 3,149,612 509,784
Total General Government 109,830,721 111,318,742 96,322,343 14,996,399 (continued)
1
2
Healthcare premium costs are budgeted in each County office/department. Hospitalization Contra is the estimated savings for declined healthcare coverage and vacant employee positions and is budgeted by subfunction. Departmental expenditures include capital outlay and capital lease principal payment.
OSI - 71

TRAVIS COUNTY, TEXASSCHEDULE OF EXPENDITURES BY FUNCTION, SUB-FUNCTION AND OFFICE/DEPARTMENTBUDGET AND ACTUAL, continuedGENERAL FUNDFor The Year Ended September 30, 2013
Variance withFinal Budget
Budgeted Amounts1, 2 Actual Positive Original Final Amounts2 (Negative)
Justice System:Criminal Justice
Central Collections (Tax Collector) 883,245 878,305 832,471 45,834 County Attorney 8,741,942 8,391,697 7,936,462 455,235 County Clerk 2,154,725 2,139,238 1,860,891 278,347 District Clerk 2,512,936 2,490,771 2,370,246 120,525 District Attorney 14,417,352 14,437,330 13,921,092 516,238 Criminal Courts 7,269,139 7,574,330 6,756,444 817,886 Justice of the Peace No. 1 543,614 553,805 544,008 9,797 Justice of the Peace No. 2 1,316,492 1,341,550 1,310,772 30,778 Justice of the Peace No. 3 1,008,848 1,008,848 961,406 47,442 Justice of the Peace No. 4 628,345 627,805 599,610 28,195 Justice of the Peace No. 5 596,897 596,897 558,647 38,250 Criminal Justice Planning 4,205,174 4,298,863 3,883,636 415,227 Hospitalization Contra (437,728) (437,728) - (437,728) Program Specific Facilities Projects 7,571,233 7,671,767 7,565,980 105,787 Records Management and Communication 20,191 84,845 79,926 4,919 Centralized Computer Systems and Services (ITS) 192,139 220,902 143,214 77,688 Centralized Rent and Utilities (Facilities) 1,851,170 933,970 911,611 22,359 Centralized Fleet Services (TNR) 13,271 16,574 16,540 34 Legally Mandated Fees (Criminal Courts) 8,442,719 8,495,047 6,791,832 1,703,215
Total Criminal Justice 61,931,704 61,324,816 57,044,788 4,280,028
Civil JusticeCounty Attorney 8,188,099 8,771,612 8,382,573 389,039 County Clerk 1,381,060 1,421,287 1,376,055 45,232 District Clerk 5,053,236 5,060,038 4,754,128 305,910 Civil Courts 6,869,532 6,725,783 6,513,462 212,321 District Attorney 3,186,451 2,236,393 1,902,484 333,909 Probate Court 1,856,092 1,855,358 1,731,794 123,564 Justice of the Peace No. 1 462,163 494,665 484,431 10,234 Justice of the Peace No. 2 671,497 632,707 559,755 72,952 Justice of the Peace No. 3 382,600 382,600 371,686 10,914 Justice of the Peace No. 4 328,974 329,440 315,041 14,399 Justice of the Peace No. 5 404,756 411,823 381,131 30,692 Hospitalization Contra (385,078) (385,078) - (385,078) Records Management and Communication 203,898 199,972 159,493 40,479 Centralized Computer Systems and Services (ITS) 184,166 184,166 115,161 69,005 Centralized Rent and Utilities (Facilities) 5,628 292,578 266,135 26,443 Centralized Fleet Services (TNR) 19,175 25,137 24,397 740 Legally Mandated Fees (Civil Courts) 2,940,573 3,329,364 3,324,236 5,128
Total Civil Justice 31,752,822 31,967,845 30,661,962 1,305,883
Juvenile ServicesCounty Judge 5,805 5,805 5,716 89 Juvenile Public Defender 1,427,873 1,422,386 1,317,778 104,608 Juvenile Court 35,844,846 35,788,243 34,808,104 980,139 Child Protective Services (HHS) 766,194 732,804 683,324 49,480 District Attorney 636 862,226 862,226 - Hospitalization Contra (329,524) (329,524) - (329,524) Centralized Computer Systems and Services (ITS) 217,635 224,048 190,291 33,757 Centralized Rent and Utilities (Facilities) 188,444 964,449 962,706 1,743 Centralized Fleet Services (TNR) 34,653 43,830 43,693 137
Total Juvenile Services 38,156,562 39,714,267 38,873,838 840,429
Total Justice System 131,841,088 133,006,928 126,580,588 6,426,340
OSI - 72

Variance withFinal Budget
Budgeted Amounts1, 2 Actual Positive Original Final Amounts2 (Negative)
Public Safety:Law Enforcement
Constable No. 1 2,026,295 2,302,025 2,252,205 49,820 Constable No. 2 2,749,414 2,749,054 2,667,309 81,745 Constable No. 3 2,308,787 2,308,737 2,204,023 104,714 Constable No. 4 1,653,985 1,652,467 1,441,219 211,248 Constable No. 5 4,397,425 4,395,447 4,151,744 243,703 Sheriff 44,680,196 46,618,458 43,850,690 2,767,768 Medical Examiner 4,506,640 4,494,141 4,189,380 304,761 Hospitalization Contra (328,333) (328,333) - (328,333) Program Specific Facilities Projects 162,820 164,237 32,124 132,113 Centralized Computer Systems and Services (ITS) 1,165,205 1,131,541 821,719 309,822 Centralized Rent and Utilities (Facilities) 21,398 274,098 258,058 16,040 Centralized Fleet Services (TNR) 3,171,196 3,993,953 3,571,604 422,349
Total Law Enforcement 66,515,028 69,755,825 65,440,075 4,315,750
Emergency Management ServicesEmergency Management Services 5,456,029 6,930,388 6,565,291 365,097 Hospitalization Contra (15,568) (15,568) - (15,568) Centralized Computer Systems and Services (ITS) 4,076 9,246 5,396 3,850 Centralized Rent and Utilities (Facilities) 4 16,054 13,574 2,480 Centralized Fleet Services (TNR) 38,401 47,872 47,784 88
Total Emergency Management Services 5,482,942 6,987,992 6,632,045 355,947
Total Public Safety 71,997,970 76,743,817 72,072,120 4,671,697
Corrections and Rehabilitation:Housing and Booking
Sheriff 103,986,170 102,502,781 96,593,794 5,908,987 Pretrial Services 1,635,345 1,464,896 1,380,950 83,946 Hospitalization Contra (930,720) (930,720) - (930,720) Centralized Computer Systems and Services (ITS) 1,672 1,672 1,672 - Centralized Rent and Utilities (Facilities) 153,308 559,655 477,485 82,170 Centralized Fleet Services (TNR) 76,303 91,411 90,510 901
Total Housing and Booking 104,922,078 103,689,695 98,544,411 5,145,284
SupervisionCommunity Supervision and Corrections 564,015 556,116 551,730 4,386 Travis County Counseling Center/SACA 3,566,766 3,504,691 3,373,295 131,396 Pretrial Services 3,471,076 3,637,160 3,445,428 191,732 Hospitalization Contra (78,836) (78,836) - (78,836) Centralized Computer Systems and Services (ITS) 263,856 263,586 193,076 70,510 Centralized Rent and Utilities (Facilities) 94,596 497,096 478,385 18,711 Centralized Fleet Services (TNR) 7,227 7,438 7,422 16
Total Supervision 7,888,700 8,387,251 8,049,336 337,915
Total Corrections and Rehabilitation 112,810,778 112,076,946 106,593,747 5,483,199
Health and Human Services:Healthcare
Health Services (HHS) 888,802 845,835 814,313 31,522 Emergency Medical Services 20,996,246 20,856,089 18,246,235 2,609,854 Hospitalization Contra (50,105) (50,105) - (50,105) Centralized Computer Systems and Services (ITS) 2,193 2,193 2,099 94 Centralized Rent and Utilities (Facilities) 41,340 138,340 126,098 12,242 Centralized Fleet Services (TNR) 12,094 15,105 14,977 128
Total Healthcare 21,890,570 21,807,457 19,203,722 2,603,735 (continued)
OSI - 73

TRAVIS COUNTY, TEXASSCHEDULE OF EXPENDITURES BY FUNCTION, SUB-FUNCTION AND OFFICE/DEPARTMENTBUDGET AND ACTUAL, continuedGENERAL FUNDFor The Year Ended September 30, 2013
Variance withFinal Budget
Budgeted Amounts1, 2 Actual Positive Original Final Amounts2 (Negative)
Public HealthPublic Health (HHS) 479,093 3,580,198 3,126,190 454,008 Centralized Rent and Utilities (Facilities) 19,157 26,157 23,979 2,178 Centralized Fleet Services (TNR) - 1,000 76 924
Total Public Health 498,250 3,607,355 3,150,245 457,110
Human ServicesVeteran Services 447,045 446,662 253,890 192,772 County Cooperative (Agricultural) Extension Service 1,170,054 431,576 329,331 102,245 Human Services (HHS) 30,071,656 28,995,456 25,202,073 3,793,383 Hospitalization Contra (149,371) (149,371) - (149,371) Centralized Computer Systems and Services (ITS) 82,560 82,560 48,192 34,368 Centralized Rent and Utilities (Facilities) 179,537 205,037 203,972 1,065 Centralized Fleet Services (TNR) 24,397 29,976 29,926 50
Total Human Services 31,825,878 30,041,896 26,067,384 3,974,512
Total Health and Human Services 54,214,698 55,456,708 48,421,351 7,035,357
Infrastructure and Environmental Services:Roads and Bridges
Transportation and Roads 14,892,992 15,797,031 9,651,150 6,145,881 Hospitalization Contra (36,053) (36,053) - (36,053) Centralized Computer Systems and Services (ITS) 156,968 156,968 115,483 41,485 Centralized Rent and Utilities (Facilities) 671 54,171 50,180 3,991 Centralized Fleet Services (TNR) 31,836 42,695 37,741 4,954
Total Roads and Bridges 15,046,414 16,014,812 9,854,554 6,160,258
DrainageTransportation and Roads - Stormwater Management 712,889 685,851 607,480 78,371 Hospitalization Contra (17,649) (17,649) - (17,649) Centralized Computer Systems and Services (ITS) 136 136 136 - Centralized Rent and Utilities (Facilities) 41 8,041 7,265 776 Centralized Fleet Services (TNR) 3,406 4,309 4,302 7
Total Drainage 698,823 680,688 619,183 61,505
Development and RegulationCentralized Computer Systems and Services (ITS) 10,810 10,810 1,491 9,319 Centralized Rent and Utilities (Facilities) 41 8,891 7,597 1,294
Total Development and Regulation 10,851 19,701 9,088 10,613
Conservation and Natural ResourcesTransportation and Roads 4,144,409 3,967,903 3,430,161 537,742 Hospitalization Contra (26,769) (26,769) - (26,769) Centralized Computer Systems and Services (ITS) 226 226 226 - Centralized Rent and Utilities (Facilities) 151 19,651 17,381 2,270 Centralized Fleet Services (TNR) 16,158 19,938 19,902 36
Total Conservation and Natural Resources 4,134,175 3,980,949 3,467,670 513,279
SanitationTransportation and Roads - Onsite Sewage Facility 640,510 575,108 555,225 19,883 Hospitalization Contra (1,285) (1,285) - (1,285) Centralized Computer Systems and Services (ITS) 136 136 136 - Centralized Rent and Utilities (Facilities) 41 8,641 7,264 1,377 Centralized Fleet Services (TNR) 12,347 15,658 15,631 27
Total Sanitation 651,749 598,258 578,256 20,002
Total Infrastructure and Environmental Services 20,542,012 21,294,408 14,528,751 6,765,657
OSI - 74

Variance withFinal Budget
Budgeted Amounts1, 2 Actual Positive Original Final Amounts2 (Negative)
Community and Economic Development:Economic Development
Waller Creek TIF (Gen Admin) 528,019 528,019 506,640 21,379 Travis County Exposition Center 1,196,917 1,194,914 1,038,294 156,620 Centralized Computer Systems and Services (ITS) 45 45 45 - Centralized Rent and Utilities (Facilities) 3,767 22,567 14,116 8,451 Centralized Fleet Services (TNR) 9,423 11,386 11,363 23
Total Economic Development 1,738,171 1,756,931 1,570,458 186,473
Parks and RecreationParks (TNR) 9,004,233 8,792,304 7,901,930 890,374 Hospitalization Contra (75,571) (75,571) - (75,571) Facilities Management 20,393 20,393 19,610 783 Centralized Computer Systems and Services (ITS) 139,770 139,770 98,324 41,446 Centralized Rent and Utilities (Facilities) 3,058 3,058 3,058 - Centralized Fleet Services (TNR) 313,548 440,624 439,410 1,214
Total Parks and Recreation 9,405,431 9,320,578 8,462,332 858,246
Culture and EducationHistorical Commission 1,942 10,442 9,031 1,411
Total Culture and Education 1,942 10,442 9,031 1,411
Total Community and Economic Development 11,145,544 11,087,951 10,041,821 1,046,130
Total $ 512,382,811 $ 520,985,500 $ 474,560,721 $ 46,424,779 (concluded)
OSI - 75

OSI - 76

TRAVIS COUNTY, TEXAS STATISTICAL SECTION


TRAVIS COUNTY, TEXAS STATISTICAL SECTION
September 30, 2013
This part of Travis County's comprehensive annual financial report presents detailed information as a context for understanding what the information in the financial statements, note disclosures, and required supplementary information says about the County's overall financial health. Contents Page Financial Trends ST-3 These schedules contain trend information to help the reader understand how
the County's financial performance and well-being have changed over time. The first two schedules relate to government-wide; the remaining schedules relate to fund information.
Revenue Capacity ST-17 These schedules contain information to help the reader assess the factors
affecting the County's ability to generate its property taxes. Debt Capacity ST-33 These schedules present information to help the reader assess the
affordability of the County's current levels of outstanding debt and the County's ability to issue additional debt in the future.
Demographic and Economic Information ST-47 These schedules offer demographic and economic indicators to help the
reader understand the environment within which the County's financial activities take place and to help make comparisons over time and with other governments.
Operating Information ST-55 These schedules contain information about the County's operations and
resources to help the reader understand how the County's financial information relates to the services the County provides and the activities it performs.
Sources: Unless otherwise noted, the information in these schedules is derived from the
comprehensive annual financial report for the relevant year.
ST - 1

ST - 2

TRAVIS COUNTY, TEXAS
FINANCIAL TRENDS
ST - 3

ST - 4

ST - 5

Schedule 1
2004 2005 2006 2007
Net Position
Net investment in capital assets $ 698,238,526 $ 725,154,875 $ 731,245,017 $ 746,649,334
Restricted 28,644,316 28,381,876 27,804,954 34,216,858
Unrestricted(1) (22,634,867) (15,021,161) 22,701,561 59,589,364
Total net position $ 704,247,975 $ 738,515,590 $ 781,751,532 $ 840,455,556
Notes:
(1)
Fiscal years 2007 and prior are reported in accordance with GAAP. Beginning with fiscal year 2008, the County followed theStatutory Basis of Accounting. In fiscal year 2013, the County again began reporting in accordance with GAAP and fiscal year2012 has been restated due to this change. Please see Note 15 of the Notes to the Financial Statements for additionalinformation.
The classification of net position in fiscal year 2005 reflects the effects of the implementation of GASB Statement No. 46, Net Assets Restricted by Enabling Legislation . In fiscal year 2013, the County implemented GASB Statement No. 63, Financial Reporting of Deferred Outflows of Resources, Deferred Inflows of Resources, and Net Position .
Fiscal Year Ended September 30
This schedule includes blended component units.
The deficit in unrestricted net position is a result of payments made to the State of Texas for right-of-way land purchased forjoint road projects for which the County reports the debt, but does not report the asset.
Travis County, TexasNet Position by Component
Governmental ActivitiesLast Ten Fiscal Years
(Unaudited)
ST - 6

2008 2009 2010 2011 2012 2013
$ 778,735,287 $ 826,242,229 $ 828,574,985 $ 830,072,559 $ 819,274,444 $ 811,869,512
40,318,478 34,033,639 32,618,002 32,571,911 37,110,491 54,852,048
50,784,405 49,520,735 72,797,386 96,541,914 129,331,059 84,590,111
$ 869,838,170 $ 909,796,603 $ 933,990,373 $ 959,186,384 $ 985,715,994 $ 951,311,671
Fiscal Year Ended September 30
ST - 7

Schedule 2
2004 2005 2006 2007
ExpensesGeneral government $ 77,881,031 $ 80,842,627 $ 83,695,932 $ 94,632,906 Justice system 78,445,879 83,914,875 89,223,427 96,855,914 Public safety 38,719,649 41,136,886 45,638,186 48,569,296 Corrections and rehabilitation 80,464,846 87,272,090 95,254,826 97,913,001 Health and human services 39,343,976 34,812,146 35,419,641 39,246,181 Infrastructure and environmental services(1) 77,209,480 68,946,441 65,733,063 68,917,914 Community and economic development 5,992,029 6,735,409 7,299,040 7,821,417 Interest on long-term debt 22,721,482 21,632,040 21,828,103 24,044,409
Total expenses $ 420,778,372 $ 425,292,514 $ 444,092,218 $ 478,001,038
Program RevenuesFees, fines, and charges for services:
General government 19,740,593 20,806,930 23,820,299 24,240,885 Justice system 15,327,949 16,285,653 17,868,607 19,393,065 Public safety 8,623,813 9,985,491 10,762,529 10,614,565 Corrections and rehabilitation 14,422,038 14,161,117 15,926,055 16,387,894 Health and human services 1,817,582 3,880,421 5,382,199 6,513,604 Infrastructure and environmental services 16,367,385 15,600,245 15,961,633 20,337,407 Community and economic development 2,129,646 2,548,111 2,498,757 2,206,645
Operating grants, contributions, shared revenues, and entitlements:
General government 154,557 237,140 147,520 330,363 Justice system 9,540,413 9,658,941 9,698,991 10,970,200 Public safety 1,390,995 1,151,008 1,994,959 1,345,879 Corrections and rehabilitation 10,326,513 8,981,133 9,796,562 9,888,297 Health and human services 2,748,569 2,129,141 2,593,112 2,929,081 Infrastructure and environmental services - 67,432 19,393 50,812 Community and economic development - - - -
Capital grants, contributions, and donated assets:General government(2) - 4,084,379 - - Public safety - - - - Infrastructure and environmental services 29,664,319 30,468,263 17,271,386 30,000,117 Community and economic development 109,606 422,231 44,487 9,793
Total program revenues $ 132,363,978 $ 140,467,636 $ 133,786,489 $ 155,218,607
Net (Expense)/Revenue $ (288,414,394) $ (284,824,878) $ (310,305,729) $ (322,782,431)
General RevenuesProperty taxes, ad valorem 296,050,880 297,540,102 322,901,024 337,534,219 Excise taxes from the State of Texas 4,376,878 4,686,760 5,093,749 5,663,239 Grants and contributions not restricted to specific programs 2,130,837 1,537,938 2,111,177 2,323,500 Investment earnings 4,669,265 9,647,663 18,026,783 26,663,045 Miscellaneous 4,161,627 5,680,030 5,408,938 7,659,944
Special item - gain from sale of land - - - 1,642,508 Total general revenues and special items $ 311,389,487 $ 319,092,493 $ 353,541,671 $ 381,486,455
Change in Net Position $ 22,975,093 $ 34,267,615 $ 43,235,942 $ 58,704,024
Notes:
This schedule includes blended component units.
(1) Travis County contributed $10.5 million in 2004 to the State of Texas for joint road projects from debt proceeds.
(2)
Fiscal years 2007 and prior are reported in accordance with GAAP. Beginning with fiscal year 2008, the County followed the Statutory Basis ofAccounting. In fiscal year 2013, the County again began reporting in accordance with GAAP and fiscal year 2012 has been restated due to this change.Please see Note 15 of the Notes to the Financial Statements for additional information.
Travis County received $4.1 million in federal aid in fiscal year 2005 related to the Help America Vote Act (HAVA) grant.
Travis County, Texas
(Unaudited)
Fiscal Year
Last Ten Fiscal YearsGovernmental ActivitiesChanges in Net Position
ST - 8

2008 2009 2010 2011 2013
$ 106,253,737 $ 113,861,069 $ 121,478,680 $ 127,613,204 $ 132,305,119 $ 206,204,957 108,115,964 115,824,734 118,066,369 120,180,410 122,517,414 126,651,421 54,936,023 57,010,176 57,162,121 64,203,918 65,304,918 73,492,351
107,202,072 108,941,093 112,646,370 114,254,582 117,721,251 124,653,947 44,465,983 50,044,973 51,655,422 55,937,551 52,934,006 55,594,585 90,031,020 83,761,739 76,269,788 86,751,850 86,650,269 89,562,401 8,576,884 10,095,501 9,981,277 10,346,132 10,835,162 12,022,962
25,471,681 24,707,401 26,894,758 28,054,923 28,443,421 32,317,962 $ 545,053,364 $ 564,246,686 $ 574,154,785 $ 607,342,570 $ 616,711,560 $ 720,500,586
24,899,983 24,642,565 24,956,625 27,164,648 29,419,038 33,255,984 16,979,972 19,616,347 20,566,715 19,345,185 18,722,896 18,262,009 11,130,775 10,367,723 10,454,740 10,924,473 10,127,072 10,580,108 16,729,409 16,798,043 17,031,272 16,863,520 16,557,517 17,022,695 6,297,117 7,537,315 7,591,326 7,887,003 9,972,980 10,267,912
19,094,706 17,013,426 16,333,867 12,691,508 18,200,747 26,754,514 2,931,424 2,423,400 2,926,932 2,656,648 2,623,036 2,652,464
342,528 464,350 656,213 333,209 670,549 330,556 12,497,150 14,179,763 14,831,487 14,823,613 13,476,324 12,284,939 1,034,596 1,223,271 2,250,584 1,823,685 1,685,524 1,864,454
11,796,920 11,943,090 11,911,352 12,815,464 12,375,195 12,801,005 4,600,998 7,408,313 8,770,391 11,693,332 7,207,231 6,509,509
4,951 30,931 760,209 593,214 378,431 273,060 - - 8,498 97,995 4,957 8,155
- - - 2,033,437 - - - - - 546,228 100,426 -
44,167,832 47,957,484 21,818,685 20,492,285 17,401,768 13,169,674 227,004 505,461 283,195 649,254 214,555 953,616
$ 172,735,365 $ 182,111,482 $ 161,152,091 $ 163,434,701 $ 159,138,246 $ 166,990,654
$ (372,317,999) $ (382,135,204) $ (413,002,694) $ (443,907,869) $ (457,573,314) $ (553,509,932)
360,850,200 390,915,512 415,866,340 443,866,668 462,761,804 494,900,530 6,155,316 6,244,691 6,663,574 7,061,767 6,436,318 7,370,217 4,096,582 1,882,050 2,934,300 2,339,893 1,402,323 1,730,628
23,238,045 17,912,888 4,809,383 5,233,051 5,913,723 5,569,651 7,360,470 5,138,496 6,922,867 10,602,501 7,588,756 9,534,583
- - - - - - $ 401,700,613 $ 422,093,637 $ 437,196,464 $ 469,103,880 $ 484,102,924 $ 519,105,609
$ 29,382,614 $ 39,958,433 $ 24,193,770 $ 25,196,011 $ 26,529,610 $ (34,404,323)
Fiscal Year
2012
ST - 9

Schedule 3
2004 2005 2006 2007
General FundReserved $ 7,989,636 $ 9,122,387 $ 10,390,156 $ 14,242,234 Unreserved, designated for:
Compensated absences 4,427,676 4,639,999 4,890,239 5,224,477 Unreserved, undesignated 55,050,141 55,219,702 67,926,235 75,699,112
Total general fund $ 67,467,453 $ 68,982,088 $ 83,206,630 $ 95,165,823
All Other Governmental Funds(1)
Reserved $ 31,589,784 $ 30,014,676 $ 27,306,616 $ 65,171,416 Unreserved, designated for:
Special revenue funds - compensated absences 536,163 506,199 529,716 573,555 Debt service 7,157,714 7,197,456 8,795,401 11,300,206 Capital projects 50,872,574 57,229,849 86,038,870 125,696,103
Unreserved, undesignated reported in:Special revenue funds 25,702,246 25,817,301 32,006,001 38,738,844
Total all other governmental funds $ 115,858,481 $ 120,765,481 $ 154,676,604 $ 241,480,124
2010 2011 2012 2013
General FundNonspendable $ 205,000 $ 205,000 $ 205,000 $ 205,000 Committed:
Compensated absences (2) 6,414,336 6,795,793 7,406,759 - Encumbrances 13,034,688 14,538,170 20,141,071 20,148,945
Assigned 6,566,778 5,797,998 17,540,008 - Unassigned 87,573,763 109,728,289 112,014,484 141,536,490
Total general fund $ 113,794,565 $ 137,065,250 $ 157,307,322 $ 161,890,435
All Other Governmental Funds(1)
Nonspendable $ 3,143,936 $ 3,256,010 $ 3,363,703 $ - Restricted 221,546,972 199,399,092 220,491,750 238,541,384 Committed:
Special revenue funds 22,989,273 17,175,639 14,007,541 15,691,836 Total all other governmental funds $ 247,680,181 $ 219,830,741 $ 237,862,994 $ 254,233,220
This schedule includes blended component units.
(1)
(2) In fiscal year 2013, the County changed its method of estimating the amount of compensated absences that are expected to beliquidated with current expendable resources and these are now reported on the government-wide financial statements.
All Other Governmental Funds includes all governmental funds, including permanent funds, except General Fund.
Travis County, TexasFund Balances
Governmental FundsLast Ten Fiscal Years
(Unaudited)
Fiscal Year Ended September 30Post GASB 54
Pre GASB 54
Notes: Fiscal years 2007 and prior are reported in accordance with GAAP. Beginning with fiscal year 2008, the County followed theStatutory Basis of Accounting. In fiscal year 2013, the County again began reporting in accordance with GAAP and fiscalyear 2012 has been restated due to this change. Please see Note 15 of the Notes to the Financial Statements for additionalinformation.
The County implemented GASB Statement No. 54 in fiscal year 2011. Fiscal year 2010 has been restated for GASB 54comparable presentation; previous fiscal years have not been restated.
Fiscal Year Ended September 30
ST - 10

2008 2009
$ 18,694,360 $ 13,577,327
5,887,093 6,280,220 62,146,514 71,375,127
$ 86,727,967 $ 91,232,674
$ 104,378,747 $ 45,891,103
638,005 659,484 13,872,599 13,608,314 98,165,632 112,447,494
22,762,168 24,914,276 $ 239,817,151 $ 197,520,671
Fiscal Year Ended September 30Pre GASB 54
ST - 11

Schedule 4
Fiscal Year2004 2005 2006 2007
RevenuesTaxes $ 299,227,758 $ 302,205,859 $ 328,098,773 $ 342,807,949 Intergovernmental 45,194,797 34,510,489 28,162,319 28,210,834 Charges for services 66,224,790 69,742,078 77,651,363 81,905,656 Fines and forfeits 6,321,816 6,829,689 8,029,767 8,444,507 Investment income 3,663,515 7,461,294 14,983,807 23,230,344 Miscellaneous 4,171,895 5,702,595 5,138,032 6,904,960
Total revenues 424,804,571 426,452,004 462,064,061 491,504,250
Expenditures(1)
Current 326,362,031 337,687,465 361,113,294 381,829,343 Capital outlay(2) 57,008,391 36,706,409 72,630,959 56,082,201 Debt service 64,553,185 64,402,803 64,571,657 65,423,524
Total expenditures 447,923,607 438,796,677 498,315,910 503,335,068
Excess (deficiency) of revenues overexpenditures (23,119,036) (12,344,673) (36,251,849) (11,830,818)
Other Financing Sources (Uses)General obligation debt issued(2) 13,720,000 17,490,000 84,045,000 107,935,000 General obligation debt premium 6,300 64,793 214,216 252,319 Original issue discount - - - - Refunding bonds issued - 122,635,000 9,155,000 23,784,987 Refunding bonds premium - 10,854,350 130,991 1,431,592 Payment to refunding bond agent - (132,277,835) (9,157,693) (24,920,762) Refunding bonds original issue discount - - - - Sale of capital assets - - - - Bond defeasance - - - - Transfers in 7,980,136 8,062,028 10,295,664 10,691,891 Transfers out (6,984,136) (8,062,028) (10,295,664) (10,691,891)
Total other financing sources (uses) 14,722,300 18,766,308 84,387,514 108,483,136
Special ItemsProceeds from sale of real estate - - - 2,110,395
Net change in fund balances $ (8,396,736) $ 6,421,635 $ 48,135,665 $ 98,762,713
Debt service as a percentageof noncapital expenditures 16.1% (3) 16.0% 15.2% 14.6%
Notes:
This schedule includes blended component units.
(1) Expenditures are shown in detail in Schedule 5.
(2)
(3)
(4)
(Unaudited)
Changes in Fund Balances
Travis County contributed $10.5 million in 2004 to the State of Texas for joint road projects from debt proceeds. In addition, in 2008Travis County contributed $12.7 million to developers in the Village of Bee Cave for the cost of various road improvements.The debt service as a percentage of noncapital expenditures calculation was adjusted in 2004 to reflect Travis County's contribution tothe State of Texas for joint road projects from debt proceeds. For the purposes of this calculation these amounts are included ascurrent expenditures versus capital outlay.
The debt service as a percentage of noncapital expenditures calculation was adjusted in 2008 for contributions paid to developers forthe cost of constructing various improvements to roads which serve the Hill Country Galleria project and are owned by the Village ofBee Cave. For the purposes of this calculation these amounts are included as current expenditures versus capital outlay.
Travis County, Texas
Governmental FundsLast Ten Fiscal Years
Fiscal years 2007 and prior are reported in accordance with GAAP. Beginning with fiscal year 2008, the County followed the StatutoryBasis of Accounting. In fiscal year 2013, the County again began reporting in accordance with GAAP and fiscal year 2012 has beenrestated due to this change. Please see Note 15 of the Notes to the Financial Statements for additional information.
ST - 12
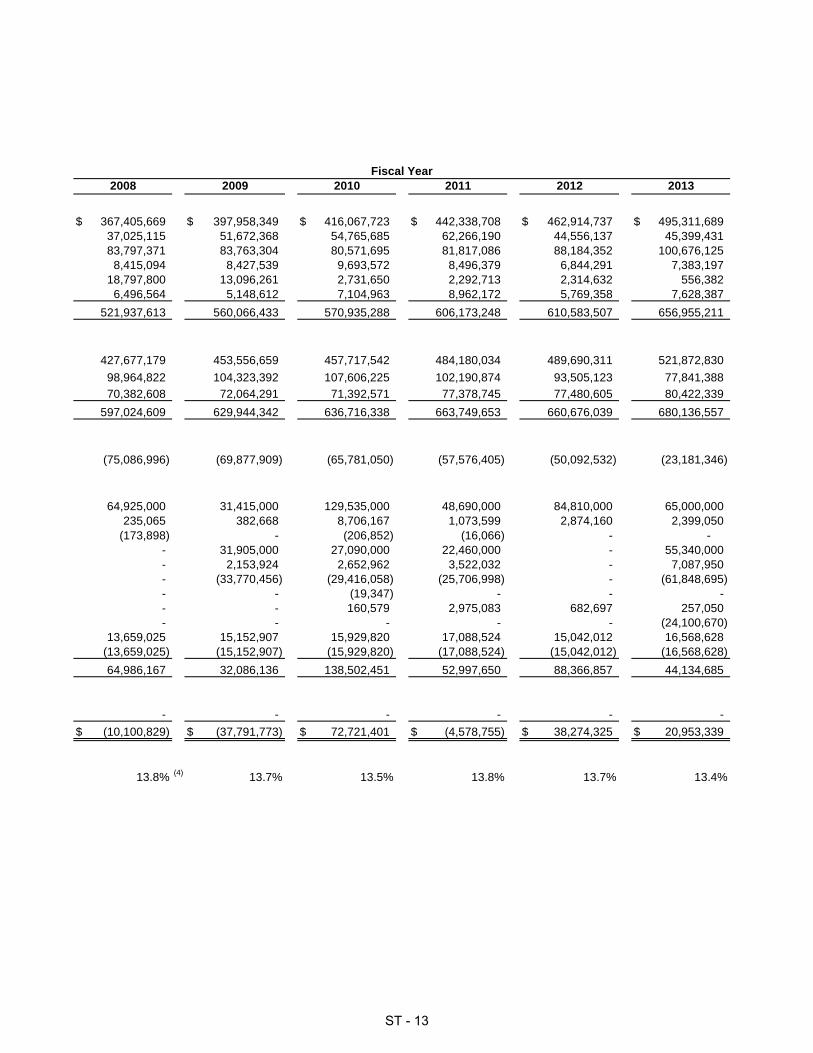
2008 2009 2010 2011 2012 2013
$ 367,405,669 $ 397,958,349 $ 416,067,723 $ 442,338,708 $ 462,914,737 $ 495,311,689 37,025,115 51,672,368 54,765,685 62,266,190 44,556,137 45,399,431 83,797,371 83,763,304 80,571,695 81,817,086 88,184,352 100,676,125
8,415,094 8,427,539 9,693,572 8,496,379 6,844,291 7,383,197 18,797,800 13,096,261 2,731,650 2,292,713 2,314,632 556,382
6,496,564 5,148,612 7,104,963 8,962,172 5,769,358 7,628,387 521,937,613 560,066,433 570,935,288 606,173,248 610,583,507 656,955,211
427,677,179 453,556,659 457,717,542 484,180,034 489,690,311 521,872,830 98,964,822 104,323,392 107,606,225 102,190,874 93,505,123 77,841,388 70,382,608 72,064,291 71,392,571 77,378,745 77,480,605 80,422,339
597,024,609 629,944,342 636,716,338 663,749,653 660,676,039 680,136,557
(75,086,996) (69,877,909) (65,781,050) (57,576,405) (50,092,532) (23,181,346)
64,925,000 31,415,000 129,535,000 48,690,000 84,810,000 65,000,000 235,065 382,668 8,706,167 1,073,599 2,874,160 2,399,050
(173,898) - (206,852) (16,066) - - - 31,905,000 27,090,000 22,460,000 - 55,340,000 - 2,153,924 2,652,962 3,522,032 - 7,087,950 - (33,770,456) (29,416,058) (25,706,998) - (61,848,695) - - (19,347) - - - - - 160,579 2,975,083 682,697 257,050 - - - - - (24,100,670)
13,659,025 15,152,907 15,929,820 17,088,524 15,042,012 16,568,628 (13,659,025) (15,152,907) (15,929,820) (17,088,524) (15,042,012) (16,568,628) 64,986,167 32,086,136 138,502,451 52,997,650 88,366,857 44,134,685
- - - - - - $ (10,100,829) $ (37,791,773) $ 72,721,401 $ (4,578,755) $ 38,274,325 $ 20,953,339
13.8% (4) 13.7% 13.5% 13.8% 13.7% 13.4%
Fiscal Year
ST - 13

Schedule 5
Fiscal Year 2004 2005 2006 2007
ExpendituresCurrent:
General government $ 54,077,332 $ 55,138,365 $ 59,867,786 $ 61,275,126 Justice system 82,691,555 89,034,598 94,672,961 102,659,675 Public safety 40,149,412 42,498,649 47,523,305 50,517,497 Corrections and rehabilitation 85,324,250 90,430,475 98,954,704 101,890,572 Health and human services 39,380,193 34,679,229 35,300,509 38,993,277 Infrastructure and environmental services 19,731,737 20,167,308 18,439,351 19,784,147 Community and economic development 5,007,552 5,738,841 6,354,678 6,709,049
Capital outlay(1) 57,008,391 36,706,409 72,630,959 56,082,201
Debt service:Refunding bond issuance costs - 1,196,336 126,921 281,796 Debt issuance costs 87,380 106,448 228,010 342,616 Advance / current refunding escrow - 824,750 - - Capital lease principal 100,719 122,065 128,942 147,899 Principal on general obligation debt 38,236,450 38,656,775 41,117,340 39,132,204 Interest and other charges 26,128,636 23,496,429 22,970,444 25,519,009
Total expenditures $ 447,923,607 $ 438,796,677 $ 498,315,910 $ 503,335,068
This schedule includes blended component units.
(1) Travis County contributed $10.5 million in 2004 to the State of Texas for joint road projects from debt proceeds.Travis County contributed $12.7 million in 2008 to developers in the Villages of Bee Cave for the cost of various road improvements.
Notes:
Travis County, TexasExpenditures by Function
Governmental FundsLast Ten Fiscal Years
(Unaudited)
Fiscal years 2007 and prior are reported in accordance with GAAP. Beginning with fiscal year 2008, the County followed the StatutoryBasis of Accounting. In fiscal year 2013, the County again began reporting in accordance with GAAP and fiscal year 2012 has beenrestated due to this change. Please see Note 15 of the Notes to the Financial Statements for additional information.
ST - 14

Fiscal Year2008 2009 2010 2011 2012 2013
$ 66,780,943 $ 70,318,978 $ 71,937,393 $ 80,956,464 $ 86,087,010 $ 93,989,180 114,343,861 122,710,476 125,475,054 128,290,674 130,461,470 134,223,728 57,109,115 59,209,046 59,466,221 67,411,054 67,378,510 76,105,420
110,846,512 113,199,712 115,632,480 118,080,023 120,520,737 126,293,126 44,445,897 49,767,907 51,216,067 55,569,293 52,134,317 54,706,194 26,586,414 29,815,646 25,741,657 25,182,151 24,444,275 27,291,234 7,564,437 8,534,894 8,248,670 8,690,375 8,663,992 9,263,948
98,964,822 104,323,392 107,606,225 102,190,874 93,505,123 77,841,388
- 280,123 277,086 259,809 - - 1,333,592 310,218 957,411 459,193 878,748 1,542,387
- 1,173,439 633,340 213,192 - 326,295 144,541 75,296 - - 473,444 415,140
39,754,555 41,947,901 47,060,000 49,370,000 49,885,000 53,085,000 29,149,920 28,277,314 22,464,734 27,076,551 26,243,413 25,053,517
$ 597,024,609 $ 629,944,342 $ 636,716,338 $ 663,749,653 $ 660,676,039 $ 680,136,557
ST - 15

ST - 16

TRAVIS COUNTY, TEXAS
REVENUE CAPACITY
ST - 17

ST - 18

Schedule 6 Travis County, Texas
Assessed Value and Actual Value of Taxable Property Last Ten Fiscal Years
(Unaudited)
This schedule has been prepared in the format required by GASB Statement No. 44, Economic Condition Reporting: The Statistical Section – an amendment of NCGA Statement 1 (GASB 44). Per the GASB, the intent of the schedule is “to present comparative rate data for other governmental bodies that extend rates against the reporting government’s revenue base, so that some sense of the “overall” burden on the government’s taxpayers or rate payers is communicated.” (1) We believe the citizenry, investors and creditors of Travis County will not be able to achieve this objective based solely on this information.
GASB 44 has established a direct tax rate, which is defined by the GASB based on the percentage applied to a tax base. This is not necessarily the rate established by that government for that year’s rate structure. When the government’s tax base, in our case the net taxable assessed value, encompasses the entire rate base, then the direct tax rate and the actual tax rate are the same. If the government includes a unit that does not encompass the entire rate base, then the direct rate is calculated to produce a result as if the rate were applied to the entire county’s tax base. In reality, no taxpayer would pay this rate, and those taxpayers who are subject to the rate would pay a much higher rate.
The following are Travis County’s and its component units’ fiscal year 2013 actual adopted tax rates:
Travis County
Northwest Travis County Road District No. 3
Travis County Bee Cave Road District No. 1
Total Taxable Assessed Value
$100,657,777,296
$434,914,360
$158,093,998
Actual Tax Rate 0.5001 0.1300 0.7000 The Direct Tax Rate for Northwest Travis County Road District No. 3 (NWTCRD No. 3) is calculated as follows:
NWTCRD No. 3Taxable Assessed ValueTravis County Taxable
Assessed Value
434,914,360$ 100,657,777,296$
The Direct Tax Rate for Travis County Bee Cave Road District No.1 (TCBCRD No. 1) is calculated as follows:
TCBCRD No. 1Taxable Assessed ValueTravis County Taxable
Assessed Value
158,093,998$ 100,657,777,296$
X TCBCRD No. 1Actual Tax Rate = TCBCRD No. 1
Direct Tax Rate
X 0.7000 = 0.0011
X NWTCRD No. 3Actual Tax Rate = NWTCRD No. 3
Direct Tax Rate
X 0.1300 = 0.0006
(1) GASB Statement No. 44, Paragraph 81.
ST - 19

Schedule 6 (continued)Travis County, Texas
Assessed Value and Actual Value of Taxable Property Last Ten Fiscal Years
(Unaudited)
Real Property
Fiscal Year
EndedSept. 30
ResidentialProperty(2)
CommercialProperty(2)
IndustrialProperty(2)
TotalReal Property(2)
PersonalProperty(2)
2004 $ $ $ $ 63,566,576,847 $ 7,821,535,589 2005 69,852,496,817 8,032,312,159 2006 57,470,303,212 15,816,551,007 1,009,551,001 74,296,405,220 8,261,223,086 2007 66,826,686,341 19,549,061,937 1,009,476,420 87,385,224,698 8,853,968,337 2008 75,592,582,680 22,684,319,129 1,041,727,326 99,318,629,135 9,915,257,758 2009 85,292,646,320 25,014,981,286 1,162,060,004 111,469,687,610 10,677,839,358 2010 90,285,702,337 24,217,215,999 1,302,658,972 115,805,577,308 10,393,976,398 2011 87,500,009,305 22,782,129,169 1,220,335,232 111,502,473,706 9,059,932,537 2012 88,672,200,823 23,505,958,657 1,162,356,460 113,340,515,940 9,996,694,779 2013 89,970,932,539 25,847,052,027 790,101,542 116,608,086,108 11,797,034,692
Source: Travis Central Appraisal District
Notes:
(1)
(2) Excludes applicable exemptions.
(3) Net of applicable exemptions.
GASB Statement No. 44 requires that the total direct rate be the weighted average of all individual direct rates applied by a government to a particularrevenue base. Therefore, tax rates shown in this schedule do not reflect the actual tax rates for NWTCRD No. 3 and TCBCRD No. 1. See Page 1 ofSchedule 6 for more information.
Taxes are levied on 100% of the taxable assessed value, net of exemptions.
No Data Available No Data Available No Data Available
ST - 20

Direct Tax Rate
Less:Tax-Exempt
PropertyTotal Net TaxableAssessed Value(3)
TravisCounty
NorthwestTravis County Road District
No. 3(1)
Total Direct
Tax Rate
$ 71,388,112,436 $ 11,729,409,978 $ 59,658,702,458 $ 0.4918 $ 0.0010 $ - $ 0.492877,884,808,976 17,606,061,860 60,278,747,116 0.4872 0.0010 - 0.488282,557,628,306 18,482,810,448 64,074,817,858 0.4993 0.0010 - 0.500396,239,193,035 21,494,274,966 74,744,918,069 0.4499 0.0008 - 0.4507
109,233,886,893 24,188,636,452 85,045,250,441 0.4216 0.0006 - 0.4222122,147,526,968 27,121,746,769 95,025,780,199 0.4122 0.0006 0.0009 0.4137126,199,553,706 27,143,292,323 99,056,261,383 0.4215 0.0006 0.0011 0.4232120,562,406,243 25,667,119,142 94,895,287,101 0.4658 0.0006 0.0011 0.4675123,337,210,719 27,152,845,800 96,184,364,919 0.4855 0.0006 0.0012 0.4873128,405,120,800 27,747,343,504 100,657,777,296 0.5001 0.0006 0.0011 0.5018
Travis County Bee Cave
Road District No. 1(1)
Total Taxable Assessed Value(2)
ST - 21

Schedule 7
2004 2005 2006 2007
County Direct RatesTravis County $ 0.4918 $ 0.4872 (2) $ 0.4993 $ 0.4499 Northwest Travis County Road District No. 3 (1) 0.0010 0.0010 0.0010 0.0008 Travis County Bee Cave Road District No. 1 (1) - - - -
Total direct rate 0.4928 0.4882 0.5003 0.4507
Special District RatesBastrop-Travis County ESD No. 1 $ - $ - $ - $ - Bella Vista MUD 0.9105 0.9105 0.8200 0.7979 Belvedere MUD - - - 0.4500 Cottonwood Creek MUD No. 1 0.9500 0.9500 0.9500 0.8968 Cypress Ranch WCID No. 1 - 0.6400 0.6900 0.7200 Hurst Creek MUD 0.4500 0.4420 0.4770 0.4821 Kelly Lane WCID No. 1 - - - 0.9500 Kelly Lane WCID No. 2 - - - - Lakeside WCID No. 1 0.8700 0.8700 0.8700 0.8700 Lakeside WCID No. 2-A - - - - Lakeside WCID No. 2-B 0.8700 0.8700 0.8700 0.8700 Lakeside WCID No. 2-C - 0.8700 0.8700 0.8200 Lakeside WCID No. 2-D - - - 0.8700 Lakeway MUD 0.2802 0.2818 0.2818 0.2305 Lazy Nine MUD No. 1-B - - - - Lost Creek MUD 0.1161 0.1229 0.1132 0.1164 Moore's Crossing MUD 0.7300 0.7300 0.7300 0.7300 Northeast Travis County Utility District 0.9300 0.9300 0.9300 0.9300 Northtown MUD 0.7500 0.7500 0.7500 0.7500 Norhtwest Austin MUD No. 1 0.2632 0.2600 0.3000 0.2900 Presidential Glen MUD - - - 0.5019 River Place MUD 0.5000 0.5000 0.4500 0.4000 Senna Hills MUD 0.6650 0.6650 0.6650 0.6075 Shady Hollow MUD 0.1732 0.1700 0.1500 0.1500 Sunfield MUD No. 2 - - - - Sunfield MUD No. 3 - - - - Tanglewood Forest Limited District 0.3300 0.3525 0.3525 0.3675 Travis Co. Emergency Svcs. Dist. No. 1 0.0999 0.0989 0.1000 0.1000 Travis Co. Emergency Svcs. Dist. No. 2 0.1000 0.1000 0.1000 0.1000 Travis Co. Emergency Svcs. Dist. No. 3 0.1000 0.1000 0.0994 0.1000 Travis Co. Emergency Svcs. Dist. No. 4 0.1000 0.1000 0.0982 0.0905 Travis Co. Emergency Svcs. Dist. No. 5 0.0708 0.1000 0.1000 0.1000 Travis Co. Emergency Svcs. Dist. No. 6 0.1000 0.1000 0.1000 0.1000 Travis Co. Emergency Svcs. Dist. No. 7 0.1000 0.1000 - - Travis Co. Emergency Svcs. Dist. No. 8 0.0800 0.0790 0.0900 0.0900 Travis Co. Emergency Svcs. Dist. No. 9 0.0710 0.0710 0.0800 0.0800 Travis Co. Emergency Svcs. Dist. No. 10 0.1000 0.0988 0.1000 0.1000 Travis Co. Emergency Svcs. Dist. No. 11 0.0800 0.0800 0.0900 0.0900 Travis Co. Emergency Svcs. Dist. No. 12 0.1000 0.0991 0.1000 0.1000 Travis Co. Emergency Svcs. Dist. No. 13 - - - 0.1000 Travis Co. Emergency Svcs. Dist. No. 14 0.0700 0.1000 0.1000 0.1000
Travis County, TexasDirect and Overlapping Property Tax Rates
Last Ten Fiscal Years(rate per $100 of assessed value)
(Unaudited)
Year Taxes Are Payable
ST - 22

2008 2009 2010 2011 2012 2013
$ 0.4216 $ 0.4122 $ 0.4215 $ 0.4658 $ 0.4855 $ 0.5001 0.0006 0.0006 0.0006 0.0006 0.0006 0.0006
- 0.0009 0.0011 0.0011 0.0012 0.0011 0.4222 0.4137 0.4232 0.4675 0.4873 0.5018
$ - $ 0.1000 $ 0.9720 $ 0.1000 $ 0.0952 $ 0.0954 0.7681 0.6056 0.5000 0.5042 0.5042 0.50420.4500 0.4500 0.4500 0.4500 0.4500 0.4500 0.8968 0.8968 0.8968 0.9500 0.9700 1.10000.7800 0.8150 0.9000 0.9000 0.9000 0.90000.4821 0.4320 0.4200 0.4490 0.4990 0.42700.9500 0.9500 0.9500 0.9500 0.9500 0.9500
- 0.9500 0.9500 0.9500 0.9500 0.95000.8500 0.8500 0.8500 0.9000 0.9000 0.8800
- 0.9700 0.9700 0.9700 0.9700 0.97000.9700 0.9700 0.9700 0.9700 0.9700 0.97000.9000 0.9000 0.9400 0.9700 0.9700 0.97000.9700 0.9700 0.9700 0.9700 0.9700 0.97000.2122 0.1922 0.1967 0.2052 0.2052 0.2052
- - - - - 1.01000.1716 0.1647 0.1711 0.1711 0.1711 0.1250 0.7595 0.7595 0.7595 0.9100 0.9100 0.99000.8993 0.8993 0.8993 0.8993 0.8993 0.89930.7500 0.7500 0.7500 0.7500 0.7500 0.75000.2750 0.2525 0.2427 - - - 0.5019 0.5019 0.5019 0.5019 0.5019 0.5019 0.3500 0.3500 0.3350 0.3350 0.3350 0.33500.5600 0.5400 0.5774 0.5774 0.5326 0.54900.1491 0.1469 0.0500 0.0500 0.0500 0.05000.9000 0.9000 0.9000 - - - 0.9000 0.9000 0.9000 - - - 0.2200 0.2100 0.2100 0.2030 0.2030 0.20300.1000 0.1000 0.1000 0.1000 0.1000 0.10000.1000 0.1000 0.0997 0.1000 0.1000 0.10000.1000 0.1000 0.1000 0.1000 0.1000 0.09890.1000 0.0986 0.1000 0.1000 0.1000 0.10000.1000 0.1000 0.1000 0.1000 0.1000 0.10000.1000 0.1000 0.1000 0.1000 0.1000 0.1000
- - - - - - 0.1000 0.1000 0.1000 0.1000 0.1000 0.10000.0800 0.0800 0.0850 0.0850 0.0858 0.08450.1000 0.1000 0.1000 0.1000 0.1000 0.10000.0900 0.1000 0.1000 0.1000 0.0997 0.09780.1000 0.1000 0.1000 0.1000 0.1000 0.10000.1000 0.1000 0.1000 0.1000 0.1000 0.10000.1000 0.1000 0.1000 0.1000 0.1000 0.1000
(continued)
Year Taxes Are Payable
ST - 23

Schedule 7 (continued)Travis County, TexasDirect and Overlapping Property Tax RatesLast Ten Fiscal Years(rate per $100 of assessed value)(Unaudited)
2004 2005 2006 2007
Special District Rates, cont.Travis County MUD No. 2 $ 0.9500 $ 0.9500 $ 0.9500 $ 0.9000 Travis County MUD No. 3 0.5950 0.5792 0.5692 0.5425 Travis County MUD No. 4 0.7316 0.6796 0.7264 0.6927 Travis County MUD No. 5 0.9089 0.9089 0.9089 0.9089 Travis County MUD No. 6 0.6555 0.6316 0.5861 0.5182 Travis County MUD No. 7 0.9089 0.9089 0.9089 0.9089 Travis County MUD No. 8 0.9089 0.9089 0.8489 0.7796 Travis County MUD No. 9 0.9089 0.9089 0.9089 0.8920 Travis County MUD No. 10 0.9500 0.8000 0.8000 0.7914 Travis County MUD No. 11 - - 0.7725 0.7725 Travis County MUD No. 12 - - - - Travis County MUD No. 13 - - - - Travis County MUD No. 14 0.8800 0.8800 0.8800 0.8800 Travis County MUD No. 15 0.6500 0.4940 0.2300 0.2500 Travis County MUD No. 16 - - - - Travis County WCID No. 10 0.0499 0.0506 0.0513 0.0463 Travis County WCID No. 17 0.0590 0.0600 0.0600 0.0599 Travis County WCID No. 17 - Comanche Trail Defined Area 0.1802 0.1573 0.1536 0.1036 Travis County WCID No. 17 - Flintrock Ranch Defined Area 0.1419 0.1238 0.4381 0.4205 Travis County WCID No. 17 - Serene Hills Defined Area - - - - Travis County WCID No. 17 - Steiner Ranch Defined Area 0.6150 0.6150 0.6300 0.5915 Travis County WCID No. 18 0.2845 0.2780 0.2729 0.2521 Travis County WCID No. 19 0.2300 0.2300 0.2300 0.2250 Travis County WCID No. 20 0.3700 0.3637 0.3637 0.3537 Travis County WCID - Point Venture 0.5469 0.5311 0.4982 0.4982 W. Travis County MUD No. 3 0.2400 0.2500 0.2300 0.0900 W. Travis County MUD No. 5 0.4050 0.4050 0.4050 0.3200 W. Travis County MUD No. 6 - 0.4500 0.4500 0.4500 W. Travis County MUD No. 8 - - 0.3500 0.5500 Wilbarger Creek MUD No. 1 0.9500 0.9500 0.9500 0.9500 Wilbarger Creek MUD No. 2 0.9500 0.9500 0.9500 0.9500 Williamson County WSID No. 3 - - - - Williamson-Travis County WCID No. 1-D 0.9000 0.8750 0.8250 0.7800 Williamson-Travis County WCID No. 1-G 0.9500 0.9400 0.8430 0.6816
County Line Special District RatesAnderson Mill MUD $ 0.46752 $ 0.46752 $ 0.44731 $ 0.4640 Lakeside MUD No. 3 - - - 0.9000 North Austin MUD No. 1 0.5000 0.5000 0.4500 0.4500 Ranch at Cypress Creek MUD No. 1 0.6618 0.6900 0.6927 0.6400 Sunfield MUD No. 1 - - - - Wells Branch MUD 0.5000 0.4800 0.4800 0.4800 Williamson-Travis County MUD No. 1 0.7765 0.7965 0.7842 0.7342 Williamson-Travis County WCID No. 1-F - 0.9500 0.9500 0.9500
City, Village, and Town RatesAustin $ 0.4928 $ 0.4430 (2) $ 0.4430 $ 0.4126 Bee Cave 0.0800 0.0800 0.0200 0.0200
Year Taxes Are Payable
ST - 24

2008 2009 2010 2011 2012 2013
$ 0.9000 $ 0.8800 $ 0.8800 $ 0.9700 $ 0.9700 $ 0.98000.5232 0.4950 0.4950 0.5000 0.5200 0.52000.6927 0.6715 0.7296 0.7296 0.7296 0.72960.9089 0.9089 0.8571 0.8571 0.8571 0.81200.4831 0.4531 0.4665 0.4750 0.4750 0.47500.9089 0.9089 0.9089 0.9089 0.9089 0.90890.7213 0.7213 0.7213 0.7213 0.7213 0.72130.8756 0.8756 0.8756 0.8756 0.8756 0.87560.7500 0.7470 0.7470 0.7470 0.7470 0.7270 0.7725 0.7725 0.7725 0.7725 0.7725 0.7725
- - - 1.0000 1.0000 0.7725- - - 1.0000 1.0000 0.7725
0.7909 0.7909 0.8500 0.9500 0.9900 1.07920.2500 0.2925 0.3325 0.3325 0.3325 0.3325
- 0.9000 0.9000 0.9500 0.9500 0.95000.0436 0.0402 0.0390 0.0260 0.0279 0.02880.0575 0.0575 0.0575 0.0600 0.0600 0.0600
- - - - - -
0.4382 0.3982 0.4000 0.4229 0.4500 0.4988
- - - 0.6500 0.6500 0.6500
0.6150 0.5494 0.5249 0.5248 0.5200 0.49260.2295 0.2136 0.2081 0.2081 0.2081 0.21560.2250 0.2250 0.2250 0.2600 0.2600 0.26000.3500 0.3250 0.3200 0.3200 0.3200 0.31250.4652 0.3913 0.3613 0.3613 0.3613 0.38510.1000 0.1200 0.1750 0.2500 0.2720 0.27200.3050 0.3000 0.3000 0.2800 0.2800 0.26000.4500 0.4500 0.4500 0.4500 0.4500 0.45000.6000 0.6000 0.8000 0.8894 0.8894 0.88940.9500 0.9500 0.9500 0.9500 0.9500 0.95000.9500 0.9500 0.9500 0.9500 0.9500 0.9500
- 0.7730 0.7999 0.8150 0.8150 0.81500.7426 0.5412 0.4210 0.4210 0.4210 - 0.6074 0.5761 0.5620 0.5758 0.5565 0.5562
$ 0.4640 $ 0.4000 $ 0.1300 $ 0.1300 $ 0.1300 $ 0.13000.9000 0.9000 0.9000 0.9000 0.9000 0.90000.4180 0.4050 0.3801 0.3819 0.3819 0.37190.6282 0.6102 0.6304 0.7065 0.7065 0.63330.9000 0.9000 0.9000 0.9000 0.9000 0.9000 0.4800 0.4700 0.4700 0.4700 0.4700 0.47000.7170 0.7225 0.7140 0.6640 0.6620 0.65700.9500 0.9000 0.9000 0.9000 0.9000 0.9000
$ 0.4034 $ 0.4012 $ 0.4209 $ 0.4571 $ 0.4811 $ 0.50290.0200 0.0200 0.0200 0.0200 0.0200 0.0200
(continued)
Year Taxes Are Payable
ST - 25

Schedule 7 (continued)Travis County, TexasDirect and Overlapping Property Tax RatesLast Ten Fiscal Years(rate per $100 of assessed value)(Unaudited)
2004 2005 2006 2007
City, Village, and Town Rates, cont.Briarcliff, Village of $ 0.0562 $ 0.0562 $ 0.0962 $ 0.0962 Cedar Park 0.46807 0.4881 0.51807 0.51807 Creedmoor 0.2799 0.2799 0.2799 0.2799 Elgin 0.6941 0.6866 0.7148 0.7300 Jonestown 0.6395 0.6255 0.6255 0.5625 Lago Vista 0.6990 0.6990 0.6754 0.5969 Lakeway 0.2200 0.2275 0.2275 0.2200 Leander 0.55845 0.556626 0.548291 0.598291 Manor 0.4953 0.4684 0.4908 0.3981 Mustang Ridge 0.2379 0.2518 0.2511 0.2423 Pflugerville 0.6417 0.6400 0.6350 0.6240 Point Venture, Village of 0.0400 0.0400 0.0400 0.0400 Rollingwood 0.1127 0.1256 0.1273 0.1200 Round Rock 0.357152 0.37972 0.37105 0.37105 San Leanna, Village of 0.2498 0.2498 0.2498 0.2498 The Hills, Village of 0.0400 0.0400 0.0400 0.0400 Volente, Village of 0.1330 0.1200 0.1210 0.1256 Webberville, Village of - 0.2500 0.2500 0.2750 Westlake Hills 0.0609 0.0638 0.0604 0.0534
School District RatesAustin ISD $ 1.6137 $ 1.6230 $ 1.6230 $ 1.4930 Del Valle ISD 1.7968 1.8063 1.8700 1.7277 Eanes ISD 1.7778 1.6705 1.6610 1.5625 Lago Vista ISD 1.7300 1.7150 1.7150 1.5650 Lake Travis ISD 1.7883 1.8025 1.8005 1.6186 Manor ISD 1.7291 1.8262 1.8000 1.7680
County Line School andCommunity College District Rates
Austin Community College $ 0.0771 $ 0.0900 $ 0.0991 $ 0.0965 Coupland ISD 1.5000 1.5000 1.5000 1.3700 Dripping Springs ISD 1.7554 1.7465 1.8260 1.6801 Elgin ISD 1.7300 1.8200 1.8500 1.6500 Hays Cons ISD 1.7295 1.7945 1.8763 1.7780 Johnson City ISD 1.3420 1.4932 1.6127 1.4325 Leander ISD 1.8300 1.7900 1.7500 1.6438 Marble Falls ISD 1.6420 1.6550 1.6400 1.4716 Pflugerville ISD 1.8500 1.8300 1.8500 1.6800 Round Rock ISD 1.864261 1.85721 1.833411 1.640646
Hospital District RatesCentral Health $ - $ 0.0779 (2) $ 0.0779 $ 0.0734
Source: Travis Central Appraisal District and various other governmental entities.(1)
(2) As a result of the voter-approved formation of the Travis County Healthcare District d/b/a Central Health effective October 1, 2004, healthcareexpenditures and the related taxing authority were transferred to Central Health from Travis County and the City of Austin. Therefore, the ad valorem taxrates for Travis County and the City of Austin were reduced by $0.0144 and $0.0635, respectively, and correspondingly Central Health established a rateof $0.0779.
GASB Statement No. 44 requires that the total direct rate be the weighted average of all individual direct rates applied by a government to a particularrevenue base. Therefore, these tax rates do not reflect the actual tax rates. See Page 1 of Schedule 6 for more information.
Year Taxes Are Payable
ST - 26

2008 2009 2010 2011 2012 2013
$ 0.0962 $ 0.0962 $ 0.0962 $ 0.0962 $ 0.1175 $ 0.11750.50807 0.489001 0.489001 0.493501 0.493501 0.493501
0.2799 0.2799 0.2799 0.3109 0.3109 0.41900.7580 0.7588 0.7588 0.7776 0.7539 0.75390.5425 0.5425 0.5350 0.5600 0.5600 0.57500.5800 0.5700 0.5700 0.6200 0.6300 0.63000.2139 0.1827 0.1929 0.1996 0.1996 0.1815
0.607591 0.60259 0.60042 0.65042 0.67042 0.67042 0.6135 0.6582 0.6734 0.8026 0.8212 0.89450.2493 0.2707 0.3065 0.3371 0.3578 0.38250.6190 0.6140 0.6090 0.6040 0.5990 0.59400.0600 0.0600 0.0900 0.0900 0.0900 0.09000.1159 0.1142 0.1116 0.1348 0.1446 0.2136
0.36522 0.36522 0.39661 0.41728 0.42321 0.420350.2498 0.2498 0.2498 0.2498 0.2498 0.24980.0400 0.0400 0.0400 0.0360 0.0298 0.02700.1230 0.1286 0.1286 0.1286 0.1286 0.12150.2750 0.3025 0.3025 0.3025 0.3025 0.28190.0534 0.0534 0.0534 0.0534 0.0534 0.0534
$ 1.1630 $ 1.2020 $ 1.2020 $ 1.2270 $ 1.2420 $ 1.24201.4800 1.4800 1.4800 1.5300 1.5300 1.53001.2025 1.2025 1.2025 1.2025 1.2125 1.21251.2000 1.1800 1.1800 1.1800 1.1800 1.32001.3585 1.3159 1.3159 1.3159 1.3159 1.40751.5150 1.5350 1.5150 1.5150 1.5150 1.5150
$ 0.0958 $ 0.0954 $ 0.0946 $ 0.0951 $ 0.0948 $ 0.09511.04005 1.04005 1.04005 1.04005 1.04005 1.04005 1.4153 1.4900 1.4900 1.4900 1.4900 1.49001.4400 1.4800 1.4500 1.5400 1.5400 1.54001.4613 1.4613 1.4613 1.4613 1.4613 1.46131.1780 1.1915 1.1860 1.1936 1.1930 1.1923 1.3334 1.37924 1.42234 1.4548 1.49976 1.511871.2350 1.2550 1.2850 1.2900 1.2900 1.28001.4700 1.4600 1.4600 1.4600 1.4800 1.5400
1.323805 1.332426 1.3800 1.3800 1.3350 1.3800
$ 0.0693 $ 0.0679 $ 0.0674 $ 0.0719 $ 0.0789 $ 0.078946(concluded)
Year Taxes Are Payable
ST - 27

Schedule 8Travis County, Texas
Principal Property Tax PayersCurrent Year and Nine Years Ago
(Unaudited)
2013
Taxpayer Type of Business
TaxableAssessed
Value Rank
Percentageof Total County
Net Taxable Assessed
Value(1)
Samsung Austin Semiconductor Electronics $ 2,931,700,345 1 2.91%
Thomas Properties Group, Inc. Property Management 815,137,425 2 0.81%
Columbia / St. David's Healthcare System, LP Health Care 476,514,921 3 0.47%
Freescale Semiconductor, Inc. Electronics 266,811,229 4 0.27%
IBM Corporation Electronics 242,656,839 5 0.24%
Brandywine Acquisition Partners LP Property Management 224,838,494 6 0.22%
Dell, Inc. Electronics 220,063,620 7 0.22%
Shopping Center at Gateway, LP Property Management 206,168,052 8 0.21%
HEB Grocery Company LP Supermarket 203,336,284 9 0.20%
Southwestern Bell Telephone Co. Telephone Utility 193,486,288 10 0.19%
Applied Materials, Inc. Electronics - -
FASL LLC Investments - -
Minnesota Mining & Manufacturing Manufacturing - -
Time Warner Entertainment Cable Television & Internet - -
Cisco Systems Electronics - -
$ 5,780,713,497 5.74%
Source: Travis Central Appraisal District
(1) Based on Net Taxable Value of $100,657,777,296 from the Travis Central Appraisal District's certified property values as of October 1, 2013.
(2) Based on Net Taxable Value of $59,658,702,458 from the Travis Central Appraisal District's certified property values as of October 16, 2004.
ST - 28

2004
TaxableAssessed
Value Rank
Percentageof Total County
Net Taxable Assessed
Value(2)
$ 147,860,341 7 0.25%
- -
- -
636,998,955 1 1.07%
279,708,052 6 0.47%
- -
405,308,942 3 0.68%
- -
- -
342,622,820 4 0.57%
480,088,380 2 0.80%
283,773,408 5 0.48%
123,129,980 8 0.21%
121,595,760 9 0.20%
119,891,600 10 0.20%
$ 2,940,978,238 4.93%
ST - 29

Schedule 9Travis County, Texas
Property Tax Levies and CollectionsLast Ten Fiscal Years
(Unaudited)
Collected within theFiscal Year of the Levy
Fiscal YearEnded
Sept. 30
Taxes Leviedfor the
Fiscal Year(Original Levy)(1) Adjustments(1)
TotalAdjusted Levy Amount
Percentageof Original
Levy
2004 $ 293,956,556 $ (515,705) $ 293,440,851 $ 290,349,643 98.77%
2005 294,373,746 (219,990) 294,153,756 291,230,051 98.93%
2006 320,641,731 (642,789) 319,998,942 317,429,564 99.00%
2007 337,068,278 (1,349,417) 335,718,861 333,633,387 98.98%
2008 359,169,811 (1,714,522) 357,455,289 355,631,270 99.01%
2009 393,142,145 (1,092,280) 392,049,865 388,857,502 98.91%
2010 419,251,124 (968,700) 418,282,424 414,392,697 98.84%
2011 443,696,819 (1,305,006) 442,391,813 439,395,849 99.03%
2012 468,832,365 (562,946) 468,269,419 464,902,750 99.16%
2013 505,145,476 - 505,145,476 501,474,160 99.27%
Source: Travis County Tax Office
Notes: The information in this schedule relates to the County's own property tax levies and does not include those it collects on behalf of other governments.
This schedule includes blended component units.
(1) The original levy is the levy at September 30th of each fiscal year. The adjustments column represents adjustments made to the levy in subsequent years.
ST - 30

Total Collections to Date Outstanding Delinquent Taxes
Collections
in SubsequentYears Amount
Percentageof Adjusted
LevyEnding Balance
Percentage of Adjusted
Levy
Ending Balance
(all levies)
$ 2,381,830 $ 292,731,473 99.76% $ 709,378 0.24% $ 12,703,662
2,434,790 293,664,841 99.83% 488,915 0.17% 12,491,032
1,930,048 319,359,612 99.80% 639,330 0.20% 14,298,385
1,489,288 335,122,675 99.82% 596,186 0.18% 13,617,948
1,153,994 356,785,264 99.81% 670,025 0.19% 14,352,254
2,239,718 391,097,220 99.76% 952,645 0.24% 15,348,765
2,718,908 417,111,605 99.72% 1,170,819 0.28% 17,098,278
1,500,859 440,896,708 99.66% 1,495,105 0.34% 17,648,111
1,441,770 466,344,520 99.59% 1,924,899 0.41% 17,903,631
- 501,474,160 99.27% 3,671,316 0.73% 18,158,772
ST - 31

Schedule 10
Fiscal Period
2004 $ 0.3926 $ 0.0992 $ 0.49182005 0.3850 0.1022 0.48722006 0.3994 0.0999 0.49932007 0.3623 0.0876 0.44992008 0.3405 0.0811 0.42162009 0.3394 0.0728 0.41222010 0.3517 0.0698 0.42152011 0.3858 0.0800 0.46582012 0.4085 0.0770 0.48552013 0.4217 0.0784 0.5001
Tax Levies Fiscal Period
2004 $ 234,175,136 $ 59,170,080 $ 293,345,2162005 232,132,291 61,620,572 293,752,8632006 255,990,372 64,029,640 320,020,0122007 270,954,385 65,513,674 336,468,0592008 289,656,646 68,990,173 358,646,8192009 322,588,666 69,194,033 391,782,6992010 348,409,208 69,146,894 417,556,1022011 366,137,029 75,922,660 442,059,6892012 392,981,776 74,074,900 467,056,6762013 424,544,403 78,928,815 503,473,218
Constitutional Funds LimitationGeneral $0.80
Statutory FundsRoad & Bridge $0.15Farm to Market Road $0.30
Taxes due by - January 31Taxes delinquent - February 1Penalty up to 12% by July 1, on July 1 also accrues up to 20% for attorney feesInterest 1% per month
Note: This schedule excludes blended component units.
County
Interest &Sinking Fund
TotalCounty
Maintenance
Maintenance& Operation
Interest &Sinking Fund
Tax Rates Per $100 Assessed Valuation
Travis County, TexasProperty Tax Rates and Levies
Last Ten Fiscal Years(Unaudited)
Total
& Operation
ST - 32

TRAVIS COUNTY, TEXAS
DEBT CAPACITY
ST - 33

ST - 34

ST - 35

Schedule 11
FiscalYear
GeneralObligation
BondsRefunding
Bonds
Certificatesof
ObligationCapitalLeases
Deferred Amounts Total
2004 $ 276,983,445 $ 82,365,073 $ 98,420,000 $ 1,192,392 $ 414,786 $ 459,375,696 2005 175,300,893 186,185,988 68,830,000 1,070,327 2,613,054 434,000,262 2006 222,232,299 171,547,705 76,470,000 941,385 1,968,924 473,160,313 2007 238,470,000 183,339,525 113,760,000 793,486 1,593,198 537,956,209 2008 266,005,000 166,835,286 124,215,000 648,945 2,724,851 560,429,082 2009 247,185,000 173,863,567 119,305,000 - 3,967,722 544,321,289 2010 223,630,000 185,705,905 212,920,000 - 13,780,860 636,036,765 2011 198,840,000 192,216,777 229,495,000 2,219,194 14,917,960 637,688,931 2012 240,960,000 178,516,335 236,090,000 1,745,750 15,897,692 673,209,777 2013 243,095,000 178,604,735 224,635,000 1,330,610 17,386,794 665,052,139
Notes: Details regarding the County's outstanding debt can be found in the Notes to the Financial Statements. This schedule includes blended component units. Prior years may have been updated by the source.
Sources: (a) Bureau of Economic Analysis, Department of Commerce(b) Travis Central Appraisal District(c) City of Austin Demographer
Travis County, TexasRatio of Outstanding Debt by Type
Last Ten Fiscal Years(Unaudited)
ST - 36

PersonalIncome(a)
(in thousands)
Percentageof Personal
Income
Net Taxable Assessed
Property Value(b)
Percentage of Net Taxable Assessed
Property Value Population(c)Per
Capita
$ 31,902,096 1.44% $ 59,658,702,458 0.77% 874,065 $ 525.56 34,530,234 1.26% 60,278,747,116 0.72% 893,295 485.84 37,985,310 1.25% 64,074,817,858 0.74% 920,544 514.00 39,250,649 1.37% 74,744,918,069 0.72% 948,160 567.37 42,894,280 1.31% 85,045,250,441 0.66% 978,976 572.46 41,324,095 1.32% 95,025,780,199 0.57% 1,008,345 539.82 43,286,456 1.47% 99,056,261,383 0.64% 1,033,553 615.39 48,041,333 1.33% 94,895,287,101 0.67% 1,049,873 607.40 50,733,585 1.33% 96,184,364,919 0.70% 1,076,119 625.59
100,657,777,296 0.66% 1,108,403 600.01 Not available
ST - 37

Schedule 12Travis County, Texas
Ratio of Net General Bonded Debt OutstandingLast Ten Fiscal Years
Net General Bonded Debt Outstanding
FiscalYear
GeneralObligation
BondsRefunding
Bonds
Certificatesof
ObligationNet General
Bonded Debt
2004 $ 276,983,445 $ 82,365,073 $ 98,420,000 $ 414,786 $ 458,183,304 $ (7,157,714) $ 451,025,590
2005 175,300,893 186,185,988 68,830,000 2,613,054 432,929,935 (7,197,456) 425,732,479
2006 222,232,299 171,547,705 76,470,000 1,968,924 472,218,928 (8,795,401) 463,423,527
2007 238,470,000 183,339,525 113,760,000 1,593,198 537,162,723 (11,300,206) 525,862,517
2008 266,005,000 166,835,286 124,215,000 2,724,851 559,780,137 (13,872,599) 545,907,538
2009 247,185,000 173,863,567 119,305,000 3,967,722 544,321,289 (13,608,314) 530,712,975
2010 223,630,000 185,705,905 212,920,000 13,780,860 636,036,765 (14,140,251) 621,896,514
2011 198,840,000 192,216,777 229,495,000 14,917,960 635,469,737 (14,910,298) 620,559,439
2012 240,960,000 178,516,335 236,090,000 15,897,692 671,464,027 (14,377,853) 657,086,174
2013 243,095,000 178,604,735 224,635,000 17,386,794 663,721,529 (18,264,468) 645,457,061
Notes:
Sources: (a) Bureau of Economic Analysis, Department of Commerce(b) Travis Central Appraisal District(c) City of Austin Demographer
(Unaudited)
Deferred Amounts
Details regarding the County's outstanding debt can be found in the Notes to the Financial Statements.This schedule includes blended component units.Prior years have been updated by the source.
Total
Less:Amounts
Restricted forRepaying Principal
ST - 38

Percentage ofPersonal Income
Net Taxable Assessed
Property Value(b)
Percentage of Net Taxable
Assessed Property Value Population(c)
PerCapita
$ 31,902,096 $ 59,658,702,458 874,065 $ 516.01
34,530,234 60,278,747,116 893,295 476.59
37,985,310 64,074,817,858 920,544 503.42
39,250,649 74,744,918,069 948,160 554.61
42,894,280 85,045,250,441 978,976 557.63
41,324,095 95,025,780,199 1,008,345 526.32
43,286,456 99,056,261,383 1,033,553 601.71
48,041,333 94,895,287,101 1,049,873 591.08
50,733,585 96,184,364,919 1,076,119 610.61
100,657,777,296 1,108,403 582.33
0.65%
0.68%
0.64%
1.29%
1.30%Not available
0.76%
0.71%
0.72%
0.70%
0.64%
0.56%
0.63%
1.23%
1.22%
1.34%
1.27%
1.28%
1.44%
PersonalIncome(a)
(in thousands)
1.41%
ST - 39

Schedule 13
AmountEstimated Direct Applicable toGross Debt (1) (3) Travis County
Governmental Subdivision: Travis County $ 632,884,735 100.00 % $ 632,884,735Northwest Travis County Road District No. 3 600,000 100.00 600,000Travis County Bee Cave Road District No. 1 12,850,000 100.00 12,850,000
Subtotal Governmental Subdivision 646,334,735 646,334,735
Special Districts:Bella Vista MUD 5,535,000 100.00 5,535,000Belvedere MUD 4,205,000 100.00 4,205,000Cottonwood Creek MUD No.1 4,719,297 100.00 4,719,297Cypress Ranch WCID No.1 7,435,000 100.00 7,435,000Hurst Creek MUD 6,415,000 100.00 6,415,000Kelly Lane WCID No. 1 6,270,000 100.00 6,270,000Lakeside WCID No. 1 5,090,000 100.00 5,090,000Lakeside WCID No. 2-B 5,880,000 100.00 5,880,000Lakeside WCID No. 2-C 6,175,000 100.00 6,175,000Lakeside WCID No. 2-D 3,945,000 100.00 3,945,000Lakeway MUD 12,998,465 100.00 12,998,465Moore's Crossing MUD 5,930,000 100.00 5,930,000Northeast Travis County Utility District 18,390,000 100.00 18,390,000Northtown MUD 25,935,000 100.00 25,935,000River Place MUD 3,795,000 100.00 3,795,000Senna Hills MUD 12,090,000 100.00 12,090,000Shady Hollow MUD 3,110,000 100.00 3,110,000Travis Co. Emergency Svcs. Dist. No. 1 1,495,000 100.00 1,495,000Travis Co. Emergency Svcs. Dist. No. 2 1,205,000 100.00 1,205,000Travis Co. Emergency Svcs. Dist. No. 3 3,120,000 100.00 3,120,000Travis Co. Emergency Svcs. Dist. No. 6 5,185,000 100.00 5,185,000Travis Co. Emergency Svcs. Dist. No. 9 1,185,000 100.00 1,185,000Travis County MUD No. 2 14,191,120 100.00 14,191,120Travis County MUD No. 3 37,229,056 100.00 37,229,056Travis County MUD No. 4 4,678,176 100.00 4,678,176Travis County MUD No. 5 8,850,720 100.00 8,850,720Travis County MUD No. 6 9,491,656 100.00 9,491,656Travis County MUD No. 8 5,602,312 100.00 5,602,312Travis County MUD No. 10 6,095,000 100.00 6,095,000Travis County MUD No. 11 12,880,000 100.00 12,880,000Travis County MUD No. 14 7,975,000 100.00 7,975,000Travis County MUD No. 15 7,890,000 100.00 7,890,000Travis County MUD No. 16 8,510,000 100.00 8,510,000Travis County WCID No. 17 - Flintrock Ranch Defined Area 18,739,997 100.00 18,739,997Travis County WCID No. 17 - Steiner Ranch Defined Area 89,645,140 100.00 89,645,140Travis County WCID No. 18 550,000 100.00 550,000Travis County WCID No. 20 3,875,000 100.00 3,875,000Travis County WCID - Point Venture 1,070,000 100.00 1,070,000W. Travis County MUD No. 3 1,055,000 100.00 1,055,000W. Travis County MUD No. 5 1,740,000 100.00 1,740,000W. Travis County MUD No. 6 8,380,000 100.00 8,380,000W. Travis County MUD No. 8 9,250,000 100.00 9,250,000Wilbarger Creek MUD No. 1 802,683 100.00 802,683Wilbarger Creek MUD No. 2 211,901 100.00 211,901Williamson-Travis WCID No. 1-G 15,490,000 100.00 15,490,000
Subtotal Special Districts 424,310,523 424,310,523
Percentage
Travis County, TexasSchedule of Direct and Estimated Overlapping Debt
(Unaudited)
Travis County(2)Applicable to
ST - 40

AmountEstimated Direct Applicable toGross Debt (1) (3) Travis County
County Line Special Districts:Lakeside MUD No. 3 4,900,000 98.81 4,841,690North Austin MUD No. 1 1,995,000 10.00 199,500Ranch at Cypress Creek MUD No. 1 5,370,000 22.48 1,207,176Sunfield MUD No. 1 10,065,000 0.27 27,176Wells Branch MUD 1,030,000 98.58 1,015,374Williamson Co. WSI&DD 27,110,000 19.78 5,362,358Williamson-Travis County MUD No. 1 5,950,000 22.53 1,340,535
Subtotal County Line Special Districts 56,420,000 13,993,809
Cities:Austin 1,331,874,994 94.97 1,264,881,682Bee Cave 3,765,000 100.00 3,765,000Briarcliff, Village of 2,305,000 100.00 2,305,000Cedar Park 155,755,000 5.78 9,002,639Creedmoor 335,000 100.00 335,000Elgin 24,414,000 13.65 3,332,511Jonestown 1,305,000 100.00 1,305,000Lago Vista 20,990,000 100.00 20,990,000Lakeway 6,505,000 100.00 6,505,000Leander 103,732,000 11.60 12,032,912Manor 11,280,000 100.00 11,280,000Pflugerville 153,275,000 99.67 152,769,193Rollingwood 12,420,000 100.00 12,420,000Round Rock 108,110,000 3.53 3,816,283
Subtotal Cities 1,936,065,994 1,504,740,220
School Districts:Austin ISD 810,298,405 100.00 810,298,405Del Valle ISD 155,559,999 100.00 155,559,999Eanes ISD 136,275,000 100.00 136,275,000Lago Vista ISD 42,463,999 100.00 42,463,999Lake Travis ISD 290,317,804 100.00 290,317,804Manor ISD 188,814,999 100.00 188,814,999
Subtotal School Districts 1,623,730,206 1,623,730,206
County Line School and Community College Districts:Austin Community College 85,258,659 75.32 64,216,822Dripping Springs ISD 123,589,999 1.38 1,705,542Elgin ISD 69,774,984 23.60 16,466,896Hays Cons ISD 281,400,000 0.50 1,407,000Johnson City ISD 7,965,000 1.28 101,952Leander ISD 1,113,545,964 41.48 461,898,866Marble Falls ISD 68,042,058 17.47 11,886,948Pflugerville ISD 306,575,000 99.91 306,299,083Round Rock ISD 664,400,000 23.49 156,067,560
Subtotal County Line School and Community College Districts 2,720,551,664 1,020,050,669
Hospital District:Central Health 14,160,000 100.00 14,160,000
Subtotal Hospital District 14,160,000 14,160,000
Total (estimated $4,734.13 per capita) $ 7,421,573,122 $ 5,247,320,162
Source: Texas Municipal Advisory Council
(1) Does not include unamortized premiums, discounts, and losses on refunding bonds.(2)
(3)
Percentage
As of September 30, 2013.
Applicable toTravis County(2)
This percentage is determined by dividing the portion of market value the overlapping government shares with TravisCounty by the total market value of the overlapping government.
ST - 41

Schedule 14
2004 2005 2006 2007
Assessed value of real property $ 63,566,576,847 $ 69,852,496,817 $ 74,296,405,220 $ 87,385,224,698
Debt limit rate x 25 % x 25 % x 25 % x 25 %
Amount of debt limit 15,891,644,212 17,463,124,204 18,574,101,305 21,846,306,175
Unlimited Tax Bonds 197,033,445 186,960,893 193,822,299 219,375,445
Legal debt margin $ 15,694,610,767 $ 17,276,163,311 $ 18,380,279,006 $ 21,626,930,730
1.24% 1.07% 1.04% 1.00%
Notes: Excludes applicable exemptions.This schedule includes blended component units.
Fiscal Year Ended September 30
Article 3, Section 52 of the Texas Constitution allows counties to issue bonds upon a vote of two-thirds majority of the voting qualifiedvoters affected by the issuance so long as the amount does not exceed one-fourth of the assessed valuation of the real property, and levyand collect taxes to pay the interest and provide a sinking fund for the redemption.
Section 52 bonds may be issued for 1) improvement of rivers, creeks, and streams to prevent overflows, to permit navigation and irrigationand in aid of such purposes, 2) construction and maintenance of pools, lakes, reservoirs, dams, canals, and waterways for the purposes ofirrigation, drainage, or navigation or in aid of such purposes, and 3) construction, maintenance, and operation of macadamized, graveled,or paved roads and turnpikes, or in aid of such purposes. For those bonds levied for roads and turnpikes, the County may levy and collecttaxes to pay the interest on the bonds as it becomes due and to provide a sinking fund for redemption of the bonds.
Total debt applicable to the limit as a percentage of debt limit
Travis County, TexasLegal Debt Margin Information
Bonds Issued Under Article 3, Section 52of the Texas Constitution
Last Ten Fiscal Years(Unaudited)
ST - 42

2008 2009 2010 2011 2012 2013
$ 99,318,629,135 $ 111,469,687,610 $ 115,805,577,308 $ 111,502,473,706 $ 113,340,515,940 $ 116,608,086,108
x 25 % x 25 % x 25 % x 25 % x 25 % x 25 %
24,829,657,284 27,867,421,903 28,951,394,327 27,875,618,427 28,335,128,985 29,152,021,527
246,505,212 235,218,567 211,230,905 189,426,777 198,166,335 207,334,735
$ 24,583,152,072 $ 27,632,203,336 $ 28,740,163,422 $ 27,686,191,650 $ 28,136,962,650 $ 28,944,686,792
0.99% 0.84% 0.73% 0.68% 0.70% 0.71%
Fiscal Year Ended September 30
ST - 43

Schedule 15
2004 2005 2006 2007
Assessed value of all taxable property $ 71,388,112,436 $ 77,884,808,976 $ 82,557,628,306 $ 96,239,193,035
Debt limit rate x 5 % x 5 % x 5 % x 5 %
Amount of debt limit 3,569,405,622 3,894,240,449 4,127,881,415 4,811,959,652
Gross bonded debt(1) 457,768,518 430,316,881 470,250,004 535,569,525
7,157,714 7,197,456 8,795,401 11,300,206
450,610,804 423,119,425 461,454,603 524,269,319
Legal debt margin $ 3,118,794,818 $ 3,471,121,024 $ 3,666,426,812 $ 4,287,690,333
12.62% 10.87% 11.18% 10.90%
Notes: Excludes applicable exemptions.This schedule includes blended component units.
(1) Includes General Obligation Bonds and Certificates of Obligation
Amount of debt applicable to debt limit:
Less: Amounts set aside to repay general debt
Total amount of net debt applicable to debt limit
Total net debt applicable to the limit as a percentage of debt limit
Bonds issued under the Texas General Laws have, in addition to the debt limit of 5 percent of assessed value of all taxable property, aconstitutional limit on the tax rate which may be levied to service general law bonds and provide funds for the general operations of theCounty. This limit for Travis County is $.80 annually on the $100 assessed valuation plus a levy of $.15 annually for the maintenance of publicroads.
Article VIII, Section 9 of the Texas Constitution, as amended, specified that the Commissioners' Court "shall levy whatever tax rate may beneeded for the four (4) constitutional purposes; namely, general fund, permanent improvement fund, road and bridge fund and jury fund solong as the Court does not impair any outstanding bonds or other obligations and so long as the total of the foregoing tax levies does notexceed Eighty Cents ($.80) on the One Hundred Dollars ($100) valuation in any one (1) year."
Fiscal Year Ended September 30
Travis County, TexasLegal Debt Margin Information
Bonds and Certificates of Obligation Issued Under Texas General LawsLast Ten Fiscal Years
(Unaudited)
ST - 44

2008 2009 2010 2011 2012 2013
$ 109,233,886,893 $ 122,147,526,968 $ 126,199,553,706 $ 120,562,406,243 $ 123,337,210,719 $ 128,405,120,800
x 5 % x 5 % x 5 % x 5 % x 5 % x 5 %
5,461,694,345 6,107,376,348 6,309,977,685 6,028,120,312 6,166,860,536 6,420,256,040
557,055,286 540,353,567 622,255,905 620,551,777 655,566,335 646,334,735
13,872,599 13,608,314 14,140,251 14,910,298 14,377,853 18,264,468
543,182,687 526,745,253 608,115,654 605,641,479 641,188,482 628,070,267
$ 4,918,511,658 $ 5,580,631,095 $ 5,701,862,031 $ 5,422,478,833 $ 5,525,672,054 $ 5,792,185,773
9.95% 8.62% 9.64% 10.05% 10.40% 9.78%
Fiscal Year Ended September 30
ST - 45

Schedule 16
Travis County, TexasRatio of Annual Debt Service
For General Bonded Debt to Total General ExpendituresLast Ten Fiscal Periods
Percentage of DebtFiscal Debt Debt Expenditures Service toPeriod Principal Interest Service(1) All Funds Total Expenditures
2004 $ 38,236,450 $ 26,041,761 $ 64,278,211 $ 447,923,607 14.35 %
2005 38,656,775 23,433,962 62,090,737 438,796,677 14.15 %
2006 41,117,340 22,914,855 64,032,195 498,315,910 12.85 %
2007 39,132,204 25,466,999 64,599,203 503,335,068 12.83 %
2008 39,754,555 29,109,929 68,864,484 597,024,609 11.53 %
2009 41,947,901 28,260,345 70,208,246 629,944,342 11.15 %
2010 47,060,000 22,464,734 69,524,734 636,716,338 10.92 %
2011 49,370,000 27,076,551 76,446,551 663,749,653 11.52 %
2012 49,885,000 26,243,413 76,128,413 660,676,039 11.52 %
2013 53,085,000 25,053,517 78,138,517 680,136,557 11.49 %
Note: This schedule includes blended component units.
(1) Excludes assets acquired through other debt or capital lease.
(Unaudited)
ST - 46

TRAVIS COUNTY, TEXAS
DEMOGRAPHIC AND ECONOMIC
INFORMATION
ST - 47

ST - 48

ST - 49

Schedule 17
Year Population(a)
PersonalIncome(b)
(in thousands)
Per CapitaPersonal Income
Estimated Gross Retail
Salesin Austin(c)
(in billions)
2004 874,065 $ 31,902,096 $ 36,499 $ 11.032005 893,295 34,530,234 38,655 12.30 (2)
2006 920,544 37,985,310 41,264 12.972007 948,160 39,250,649 41,397 13.722008 978,976 42,894,280 43,815 13.042009 1,008,345 41,324,095 40,982 11.912010 1,024,266 43,286,456 42,261 12.322011 1,049,873 48,041,333 45,759 13.662012 1,076,119 50,733,585 47,145 14.622013 1,108,403 12.00 (1)
Notes:
Sources: (a) City of Austin Demographer(b) Bureau of Economic Analysis, Department of Commerce(c) State Comptroller of Public Accounts(d) Texas A&M University, Real Estate Center (e) Travis County, Transportation and Natural Resources Department(f) Texas Workforce Commission
(1) Estimated retail sales through third quarter of fiscal year 2013.(2) State Comptroller began using Census Bureau's North American Industry Classification System.
Prior years may have been updated by the source.
Last Ten Fiscal YearsDemographic and Economic Statistics
Travis County, Texas
(Unaudited)
No data available
This schedule includes blended component units.
ST - 50

Single Family Home Sales in the
Austin Area(d)
Average Home Price in the
Austin Area(d)Site Development Permits Issued(e)
UnemploymentRate(f)
21,935 $ 199,788 3,555 4.9%26,010 206,290 4,121 4.5%29,806 226,614 4,787 3.9%29,263 243,112 3,415 3.8%23,973 245,068 2,446 4.6%19,511 237,314 1,673 7.0%20,837 244,131 1,597 6.6%20,644 252,575 1,664 7.3%24,295 260,583 1,893 5.3%29,788 283,473 2,282 5.3%
ST - 51

Schedule 18
2013
Employer(1) Product or Service Employees Rank
Percentageof Total CountyEmployment(a)
State of Texas(2) Government 38,399 1 6.05%
The University of Texas/Austin(5) Education, Research 25,414 2 4.00%
Dell, Inc. Electronics 14,000 3 2.21%
City of Austin(3) Government 13,622 4 2.15%
Seton Healthcare Family Health Services 12,609 5 1.99%
Austin Independent School District(4) Education 12,059 6 1.90%
HEB Grocery Co. Retail 11,277 7 1.78%
Federal Government(2) Government 10,121 8 1.59%
St. David's Healthcare Health Services 7,950 9 1.25%
IBM Corporation Electronics 6,000 10 0.94%
Freescale Semiconductor Electronics - -
151,451 23.86%
Sources: (1) Unless noted, data is from the Austin Business Journal (2) Texas Workforce Commission(3) City of Austin(4) Austin Independent School District(5) The University of Texas/ Austin
(a) Based on total Travis County employment, including nonresidents, of 634,732 Texas Workforce Commission(b) Based on total Travis County employment of 514,418 Texas Workforce Commission
Travis County, TexasPrincipal Employers
Current Year and Nine Years Ago(Unaudited)
ST - 52

2004
Employees Rank
Percentageof Total CountyEmployment(b)
45,700 1 8.88%
22,000 2 4.28%
16,500 3 3.21%
10,944 4 2.13%
7,500 T-6 1.46%
10,759 5 2.09%
7,500 T-6 1.46%
4,481 10 0.87%
- -
6,300 9 1.22%
6,500 8 1.26%
138,184 26.86%
ST - 53

ST - 54

TRAVIS COUNTY, TEXAS
OPERATING INFORMATION
ST - 55

ST - 56

ST - 57

Schedule 19
Function/Program 2004 2005 2006 2007
General government 514 527 534 569 Justice system 1,117 1,142 1,192 1,296 Public safety 521 533 556 592 Corrections and rehabilitation 1,276 1,279 1,336 1,383 Health and human services 176 173 176 188 Infrastructure and environmental services 268 269 268 277 Community and economic development 73 79 84 114
Total 3,945 4,002 4,146 4,419
Source: County's payroll system
Notes: A full-time employee is equivalent to approximately 2,080 hours per year.This schedule excludes vacant positions.This schedule includes blended component units.
Full-time Equivalent Employees as of September 30
Travis County, TexasFull-time Equivalent County Government Employees by Function
Last Ten Fiscal Years(Unaudited)
ST - 58

2008 2009 2010 2011 2012 2013
587 622 641 644 651 687 1,327 1,395 1,423 1,420 1,412 1,417
614 627 640 656 678 707 1,405 1,435 1,451 1,439 1,457 1,492
192 217 219 235 235 230 282 303 284 288 294 292 121 125 123 120 124 129
4,528 4,724 4,781 4,802 4,851 4,954
Full-time Equivalent Employees as of September 30
ST - 59

Schedule 20
Function/Program 2004 2005 2006
General GovernmentRegistered voters 586,612 534,892 558,374 Motor vehicle registrations 698,794 708,413 845,099
Justice SystemCivil cases filed - District Clerk 20,240 22,557 21,550 Civil cases filed - County Clerk 7,164 7,995 8,284 Criminal cases filed - District Clerk 13,004 14,123 14,039 Criminal cases filed - County Clerk 26,447 27,352 28,945
Public SafetyJail bookings 56,289 58,262 59,992 Autopsies performed - in County 542 558 594 Autopsies performed - out of County 860 790 825 911 calls 92,529 103,561 111,214
Corrections and RehabilitationAverage daily inmate population 2,333 2,535 2,583
Health and Human ServicesStarflight patient transports - in County 578 652 675 Starflight patient transports - out of County 347 415 480
Infrastructure and Environmental ServicesBalcones Canyonlands acres managed 4,573 4,885 4,789
Community and Economic DevelopmentPark visitors in fee collecting parks 510,199 595,653 578,237
Source: Travis County Adopted Budget and various other Travis County Offices/Departments
Notes: This schedule includes blended component units. Prior years may have been updated by the source. Current year data is generally an estimate and will be updated to actual in the subsequent year.
Fiscal Year
(Unaudited)
Travis County, TexasOperating Indicators by Function/Program
Last Ten Fiscal Years
ST - 60

2007 2008 2009 2010 2011 2012 2013
536,216 581,908 580,768 604,772 567,791 597,438 611,111 797,185 810,105 937,455 853,813 837,069 824,916 825,135
23,291 21,745 23,622 20,111 20,671 21,001 18,434 8,079 8,163 8,824 8,800 8,853 8,392 8,800
16,068 16,561 14,919 15,658 14,813 13,891 14,442 36,170 32,699 32,568 33,800 33,920 30,086 28,006
61,385 60,403 62,104 61,989 60,223 56,412 55,059 694 777 739 812 795 888 920 769 757 748 763 771 715 730
132,933 126,478 128,355 118,390 139,139 134,434 141,366
2,646 2,511 2,363 2,411 2,416 2,294 2,260
878 872 776 775 566 542 600 645 654 675 540 399 400 400
5,093 5,122 5,446 6,750 7,339 7,616 7,700
443,564 605,649 538,100 573,756 485,364 462,685 421,000
Fiscal Year
ST - 61

Schedule 21
Function/Program 2004 2005 2006 2007
Justice SystemCourthouse 2 2 2 2Juvenile detention center 1 1 1 1
Public SafetyLaw enforcement vehicles 435 482911 call center 1 1 1 1
Corrections and RehabilitationCorrectional facilities 2 2 2 2Correctional facility capacities 2,749 2,958 2,958 3,080
Health and Human ServicesAmbulances 11 14 14 17Starflight helicopters/Eurocopters 2 2 2 2
Infrastructure and Environmental ServicesBridges (1) 142 142 143 144
Community and Economic DevelopmentNumber of developed County parks 21 22 22 22Developed park acreage 2,004 2,518 2,518 2,518Boat ramps 9 9 9 9
Source: Auditor's OfficeSheriff's OfficeTransportation and Natural Resources Department
Note: This schedule includes blended component units.
Prior years may have been updated by the source.
(1) Beginning in fiscal year 2010, this category includes drainage structures.
Travis County, TexasCapital Asset Statistics by Function/Program
Last Ten Fiscal Years(Unaudited)
Fiscal Year
No data available
ST - 62

2008 2009 2010 2011 2012 2013
2 2 2 2 2 21 1 1 1 1 1
438 509 500 574 594 6421 1 1 1 1 1
2 2 2 2 2 23,121 3,008 3,094 3,095 3,167 3,167
19 17 20 20 20 252 2 3 3 3 3
144 144 194 194 191 191
22 22 22 22 22 212,518 2,552 2,552 2,817 2,817 5,194
9 9 9 9 9 9
Fiscal Year
ST - 63

ST - 64