Travis County, Texas Prepared by: Travis CAD Finance ...Travis County, Texas . Prepared by: Travis...
146
Travis County, Texas Prepared by: Travis CAD Finance Department
Transcript of Travis County, Texas Prepared by: Travis CAD Finance ...Travis County, Texas . Prepared by: Travis...
Travis County, Texas
Prepared by: Travis CAD Finance Department

Trav
is Ce
ntra
l App
raisa
l Dist
rict
CA
FR F
Y 20
16
Strategic Goals 1. Develop appraisals that
reflect market value and
ensure fairness and
uniformity
2. Be efficient in business
processes and ensure
that mission critical
tasks are completed in a
timely manner with a
high level of accuracy
3. Collect, create and
maintain accurate data
4. Ensure that the district
maintains a highly
educated, motivated and
skilled workforce
5. Provide customer
service that is
courteous, professional
and accurate
Our Mission
The mission of the Travis Central Appraisal District is to provide accurate appraisal of all property in Travis County at one hundred percent market value, equally and uniformly, in a
professional, ethical, economical and courteous manner, working to ensure that each taxpayer pays only their fair share of the
property tax burden.
Our Vision
The Travis Central Appraisal District will act in accordance with the highest principals of professional conduct, ethics,
accountability, efficiency, openness, skill and integrity. We approach our activities with a deep sense of purpose and
responsibility.
Our Values
• Appraise- fairly, efficiently, and effectively, balancing the needs of both taxpayers and the taxing units by adhering to the Texas Property Tax Code, USPAP, and generally accepted appraisal standards.
• Educate- taxpayers of their rights, remedies and responsibilities. • Communicate- collaboratively with and encourage communication
among the taxing units, taxpayer public, and the agency. • Service- provide exceptional customer service that is accessible,
responsible and transparent. • Performance- demand integrity, accountability and high standards
from all staff and strive continuously for excellence and efficiency.
The activities of the Travis Central Appraisal District are governed by the legislature, and the administrative rules adopted by the Comptroller’s Property Tax Assistance Division.
Travis Central Appraisal District CAFR FY 2016
Trav
is Ce
ntra
l App
raisa
l Dist
rict
CA
FR F
Y 20
16
Travis Central Appraisal District Comprehensive Annual Financial Report
Year Ended December 31, 2016
Board of Directors
Mr. Richard Lavine, Chair
Mr. Kristoffer S. Lands, Vice-Chair Austin ISD
City of Austin/Austin ISD
Mr. Ed Keller, Secretary
Mr. Bruce Grube Austin ISD
Travis County
Mr. James Valadez
Mr. Tom Buckle Travis County
West Travis County
Ms. Eleanor Powell
Mr. Rico Reyes City of Austin
East Travis County
Ms. Blanca Zamora-Garcia
Mr. Bruce Elfant City of Austin
Travis County Tax Assessor/Collector
Ms. Marya Crigler Chief Appraiser
Prepared by the TCAD Finance Department
Travis Central Appraisal District CAFR FY 2016
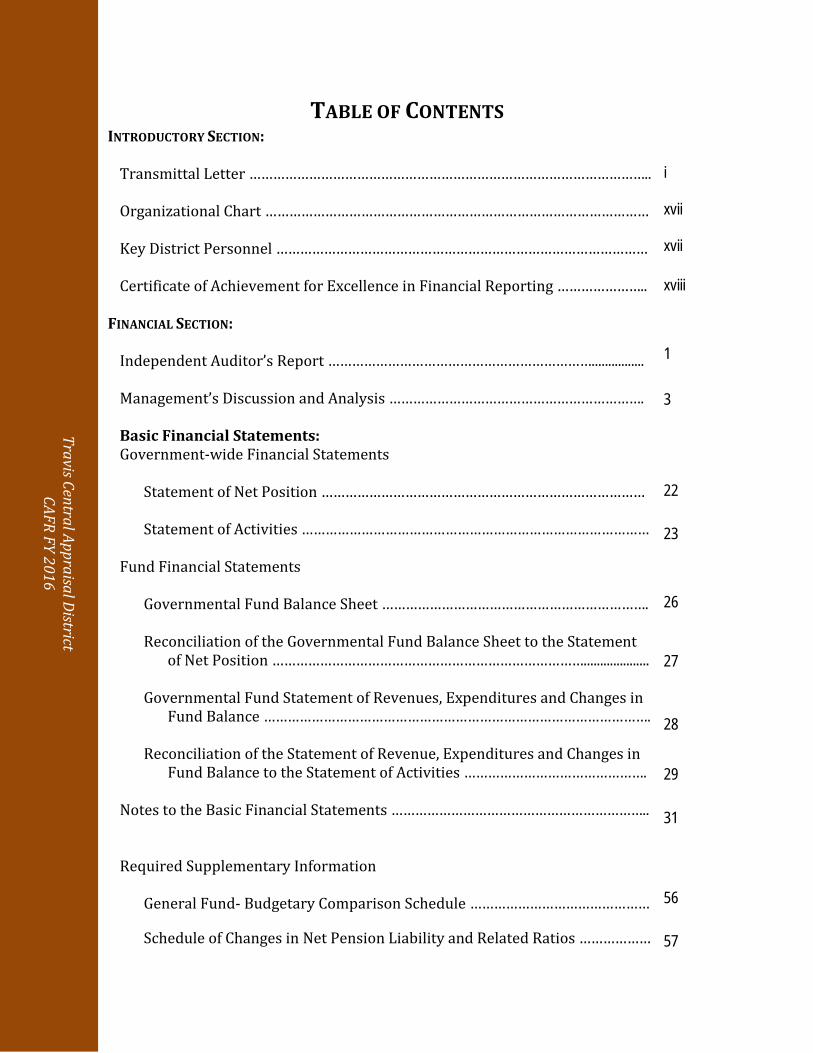
TABLE OF CONTENTS INTRODUCTORY SECTION:
Transmittal Letter ………………………………………………………………………………………..
Organizational Chart ……………………………………………………………………………………
Key District Personnel …………………………………………………………………………………
Certificate of Achievement for Excellence in Financial Reporting …………………..
FINANCIAL SECTION:
Independent Auditor’s Report …………………………………………………………................
Management’s Discussion and Analysis ……………………………………………………….
Basic Financial Statements: Government-wide Financial Statements
Statement of Net Position ………………………………………………………………………
Statement of Activities ……………………………………………………………………………
Fund Financial Statements
Governmental Fund Balance Sheet ………………………………………………………….
Reconciliation of the Governmental Fund Balance Sheet to the Statement of Net Position ……………………………………………………………………....................
Governmental Fund Statement of Revenues, Expenditures and Changes in Fund Balance …………………………………………………………………………………….
Reconciliation of the Statement of Revenue, Expenditures and Changes in Fund Balance to the Statement of Activities ……………………………………….
Notes to the Basic Financial Statements ………………………………………………………..
Required Supplementary Information
General Fund- Budgetary Comparison Schedule ………………………………………
Schedule of Changes in Net Pension Liability and Related Ratios ………………
i
xvii
xvii
xviii
1
3
22
23
26
27
28
29
31
56
57
Trav
is Ce
ntra
l App
raisa
l Dist
rict
CA
FR F
Y 20
16
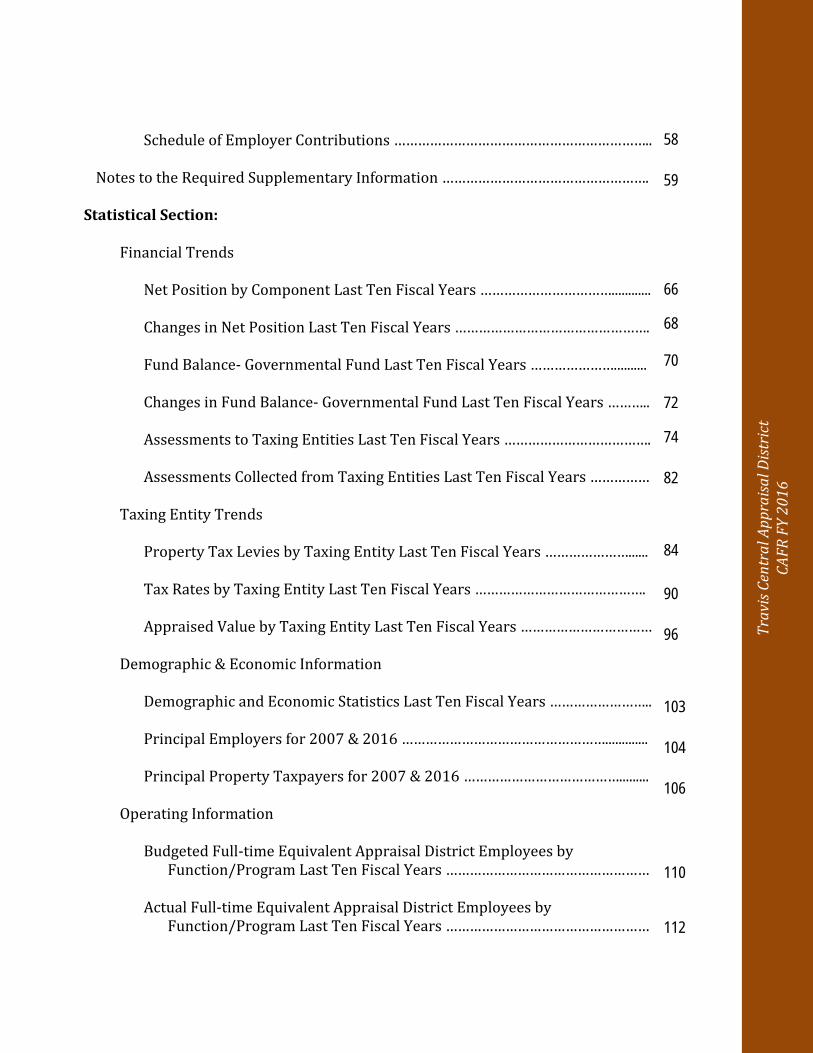
Schedule of Employer Contributions ……………………………………………………….. Notes to the Required Supplementary Information …………………………………………….
Statistical Section:
Financial Trends
Net Position by Component Last Ten Fiscal Years ……………………………............ Changes in Net Position Last Ten Fiscal Years …………………………………………. Fund Balance- Governmental Fund Last Ten Fiscal Years ………………….......... Changes in Fund Balance- Governmental Fund Last Ten Fiscal Years ……….. Assessments to Taxing Entities Last Ten Fiscal Years ………………………………. Assessments Collected from Taxing Entities Last Ten Fiscal Years ……………
Taxing Entity Trends
Property Tax Levies by Taxing Entity Last Ten Fiscal Years …………………...... Tax Rates by Taxing Entity Last Ten Fiscal Years ……………………………………. Appraised Value by Taxing Entity Last Ten Fiscal Years ……………………………
Demographic & Economic Information
Demographic and Economic Statistics Last Ten Fiscal Years …………………….. Principal Employers for 2007 & 2016 ……………………………………………............. Principal Property Taxpayers for 2007 & 2016 ………………………………….........
Operating Information
Budgeted Full-time Equivalent Appraisal District Employees by Function/Program Last Ten Fiscal Years ……………………………………………
Actual Full-time Equivalent Appraisal District Employees by
Function/Program Last Ten Fiscal Years ……………………………………………
58
59
66
68
70 72
74
82
84
90
96
103
104
106
110 112
Travis Central Appraisal District CAFR FY 2016
Operating Indicators by Function/Program Last Ten Fiscal Years ……………. Debt Information
Outstanding Debt by Type Last Ten Fiscal Years ……………………………………..
114
117

Introductory Section

i
Trav
is Ce
ntra
l App
raisa
l Dist
rict
In
trod
ucto
ry S
ectio
n
TRAVIS CENTRAL APPRAISAL DISTRICT BOARD OFFICERS RICHARD LAVINE CHAIRPERSON KRISTOFFER S. LANDS VICE CHAIRPERSON ED KELLER SECRETARY/TREASURER
MARYA CRIGLER CHIEF APPRAISER
BOARD MEMBERS TOM BUCKLE
JAMES VALDEZ BRUCE GRUBE
BRUCE ELFANT ELEANOR POWELL
RICO REYES BLANCA ZAMORA-GARCIA
May 24, 2017
Travis County Taxpayers, Travis CAD Board of Directors, and Ms. Marya Crigler, Chief Appraiser, Travis Central Appraisal District:
I am pleased to present the Comprehensive Annual Financial Report (CAFR) of the Travis Central Appraisal District (the District) for the fiscal year ended December 31, 2016. Responsibility for both the accuracy of the data and the completeness and fairness of presentation, including all disclosures, rests with the District. To the best of my knowledge and belief, the enclosed data is accurate in all material respects and is reported in a manner designed to fairly present the financial position and results of operations of the District. All disclosures necessary to enable the reader to gain an understanding of the District’s financial activities have been included.
The District’s financial statements have been audited by Weaver and Tidwell, LLP, a firm of certified public accountants. The independent auditor concluded, based upon the audit, that there was a reasonable basis for rendering an unmodified opinion (“clean”), and that the District’s financial statements for the fiscal year ended December 31, 2016 are fairly presented in conformity with generally accepted accounting principles (GAAP). The independent auditors’ report is presented as the first component of the financial section of this report.
Based on financial accountability criteria set forth under generally accepted accounting principles (GAAP) for state and local governments, there are no entities which are potential component units of the District.
THE ANNUAL FINANCIAL REPORT
Travis Central Appraisal District Introductory Section
ii
There are three main parts to the property tax system in Texas: • An appraisal district in each county sets the value of property each year. A chief
appraiser is the chief administrator and operates the appraisal office. • A citizen board, called the Appraisal Review Board (ARB), hears any disagreements
between a property owner and the appraisal district about a property’s value. • Local taxing units—city, county, school and special districts—decide how much money
they will spend by adopting a budget. Next, the taxing units set tax rates that will raise the revenue necessary to fund their budgets. The adopted budgets and the tax rates set to fund the budgets determine the total amount of taxes that a person will pay.
The property tax year has four stages: appraising taxable property, protesting the appraised values, adopting the tax rates and collecting the taxes. The following represents a summary of the process.
1. A large part of each appraisal district's job is to estimate what your property is worthon January 1. What a property is used for on January 1, market conditions at that timeand who owns the property on that date determine whether the property is taxed, itsvalue and who is responsible for paying the tax. The appraisal district also processesapplications for tax exemptions, agricultural appraisals and other tax relief.
2. Around May 15, the appraisal review board begins hearing protests from propertyowners who believe their property values are incorrect or who did not get correctexemptions or agricultural appraisals. When the ARB finishes its work, the appraisaldistrict gives each taxing unit a list of taxable property.
3. In August or September, the elected officials of each taxing unit adopt tax rates fortheir operations and debt payments. Several taxing units tax each property. Everyproperty is taxed by the county and the local school district. You also may pay taxes toa city and to special districts such as hospital, junior college, water, fire and others.
4. Tax collection starts around October 1 as tax bills go out. Taxpayers have until January31 of the following year to pay their taxes. On February 1, penalty and interest chargesbegin accumulating on most unpaid tax bills. Tax collectors may start legal action tocollect unpaid taxes on February 1.
HOW DOES THE PROPERTY TAX SYSTEM WORK?
iii iii
Trav
is Ce
ntra
l App
raisa
l Dist
rict
In
trod
ucto
ry S
ectio
n
The Travis Central Appraisal District was created under the 66th Texas State Legislature in 1979 under the provisions of Senate Bill 621 known as the Property Tax Code. The District is responsible for the appraisal of property subject to ad valorem taxation in Travis County, Texas. The District is governed by a board of nine directors serving two year terms, plus a tenth statutorily designated non-voting member who is the County Tax Assessor-Collector. Travis County appoints two board members, Austin ISD appoints two board members, City of Austin appoints two board members, and Austin ISD and City of Austin appoint one board member together. The remaining two board members are appointed by a vote of the eastern and western taxing entities within Travis County.
The District was formed in 1981 and formally began operations in 1982, pursuing its mission to provide accurate appraisal of all property in Travis County at one hundred percent of market value, equally and uniformly, in a professional, ethical, economical and courteous manner, working to ensure that each taxpayer pays only their fair share of the property tax burden. As stipulated under the Texas Property Tax Code, the District serves the citizens and taxpayers of Travis County and the taxing entities which lie within Travis County.
Travis County is located in south central Texas astride the Balcones Fault, the boundary between the Edwards Plateau to the west and the Blackland Prairies to the east. Its county seat, Austin, is the capital of Texas. Travis County’s population in 2016, according to the City of Austin demographer, is estimated to be 1,209,415. In the last five years, the population of Travis County has grown 15%
TRAVIS CENTRAL APPRAISAL DISTRICT
Travis Central Appraisal District Introductory Section
iv
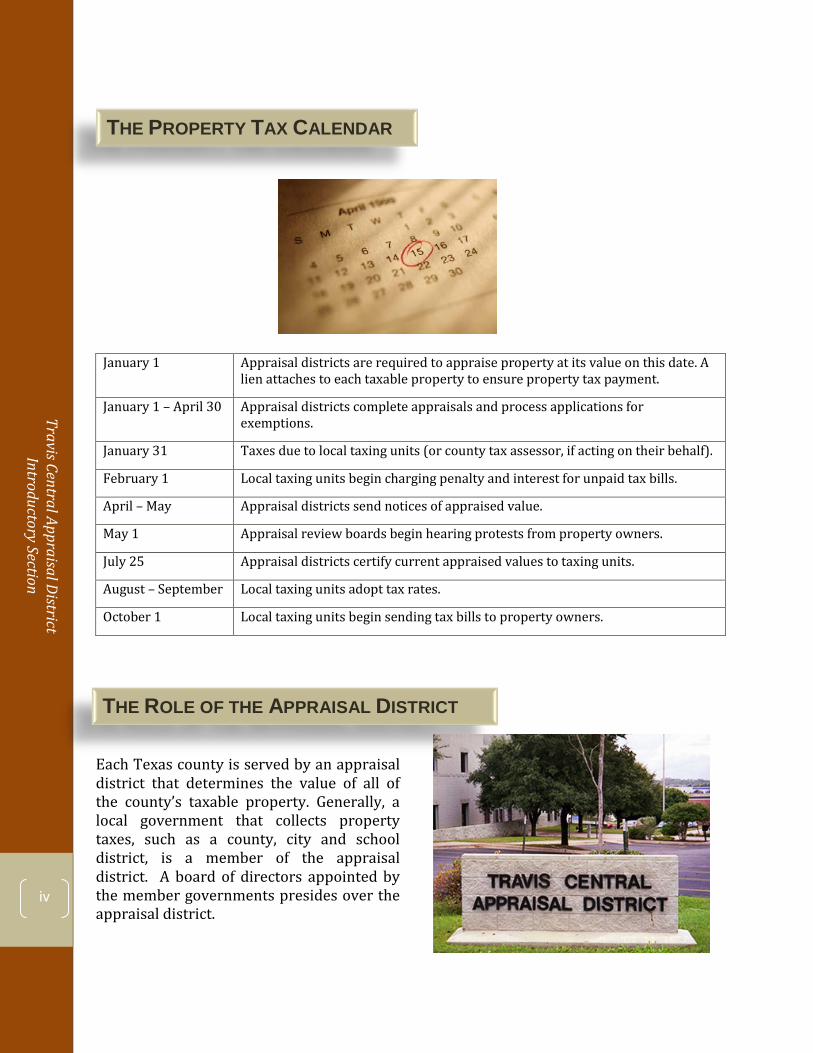
January 1 Appraisal districts are required to appraise property at its value on this date. A lien attaches to each taxable property to ensure property tax payment.
January 1 – April 30 Appraisal districts complete appraisals and process applications for exemptions.
January 31 Taxes due to local taxing units (or county tax assessor, if acting on their behalf).
February 1 Local taxing units begin charging penalty and interest for unpaid tax bills.
April – May Appraisal districts send notices of appraised value.
May 1 Appraisal review boards begin hearing protests from property owners.
July 25 Appraisal districts certify current appraised values to taxing units.
August – September Local taxing units adopt tax rates.
October 1 Local taxing units begin sending tax bills to property owners.
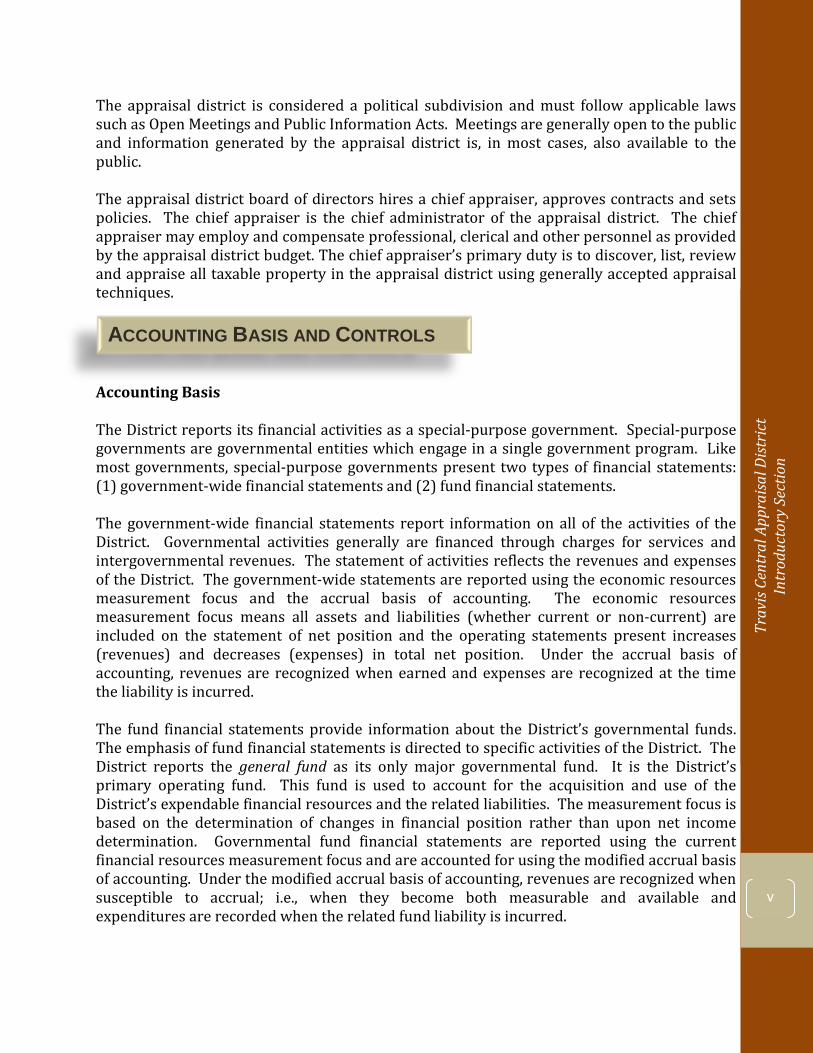
Each Texas county is served by an appraisal district that determines the value of all of the county’s taxable property. Generally, a local government that collects property taxes, such as a county, city and school district, is a member of the appraisal district. A board of directors appointed by the member governments presides over the appraisal district.
THE PROPERTY TAX CALENDAR
THE ROLE OF THE APPRAISAL DISTRICT
v v
Trav
is Ce
ntra
l App
raisa
l Dist
rict
In
trod
ucto
ry S
ectio
n
The appraisal district is considered a political subdivision and must follow applicable laws such as Open Meetings and Public Information Acts. Meetings are generally open to the public and information generated by the appraisal district is, in most cases, also available to the public.
The appraisal district board of directors hires a chief appraiser, approves contracts and sets policies. The chief appraiser is the chief administrator of the appraisal district. The chief appraiser may employ and compensate professional, clerical and other personnel as provided by the appraisal district budget. The chief appraiser’s primary duty is to discover, list, review and appraise all taxable property in the appraisal district using generally accepted appraisal techniques.
Accounting Basis
The District reports its financial activities as a special-purpose government. Special-purpose governments are governmental entities which engage in a single government program. Like most governments, special-purpose governments present two types of financial statements: (1) government-wide financial statements and (2) fund financial statements.
The government-wide financial statements report information on all of the activities of the District. Governmental activities generally are financed through charges for services and intergovernmental revenues. The statement of activities reflects the revenues and expenses of the District. The government-wide statements are reported using the economic resources measurement focus and the accrual basis of accounting. The economic resources measurement focus means all assets and liabilities (whether current or non-current) are included on the statement of net position and the operating statements present increases (revenues) and decreases (expenses) in total net position. Under the accrual basis of accounting, revenues are recognized when earned and expenses are recognized at the time the liability is incurred.
The fund financial statements provide information about the District’s governmental funds. The emphasis of fund financial statements is directed to specific activities of the District. The District reports the general fund as its only major governmental fund. It is the District’s primary operating fund. This fund is used to account for the acquisition and use of the District’s expendable financial resources and the related liabilities. The measurement focus is based on the determination of changes in financial position rather than upon net income determination. Governmental fund financial statements are reported using the current financial resources measurement focus and are accounted for using the modified accrual basis of accounting. Under the modified accrual basis of accounting, revenues are recognized when susceptible to accrual; i.e., when they become both measurable and available and expenditures are recorded when the related fund liability is incurred.
ACCOUNTING BASIS AND CONTROLS
Travis Central Appraisal District Introductory Section
vi
0.0%
1.0%
2.0%
3.0%
4.0%
2011 2012 2013 2014 2015
Annual Population Growth
Austin MSA
Texas
United States
Internal Controls
To provide a reasonable basis for making its representations, the District’s management team has established a comprehensive internal control framework. This framework is designed to provide reasonable assurance that assets are safeguarded against loss from unauthorized use or disposition, and that accounting transactions are executed in accordance with management’s authorization and properly recorded so that the financial statements can be prepared in conformity with generally accepted accounting principles (GAAP). The objective of the internal control framework is to provide reasonable, rather than absolute, assurance that the financial statements are free of any material misstatements. The concept of reasonable assurance recognizes that: (1) the cost of a control should not exceed the benefits likely to be derived; and (2) the evaluation of costs and benefits requires estimates and judgments by management. The design and operation of internal controls also ensures that all funds are expended in compliance with applicable laws and regulations.
All internal control evaluations occur within the above framework. During the fiscal year ended December 31, 2016, the District reviewed its internal controls. I believe that the District’s internal controls adequately safeguard assets and provide reasonable assurance of proper recording of financial transactions.
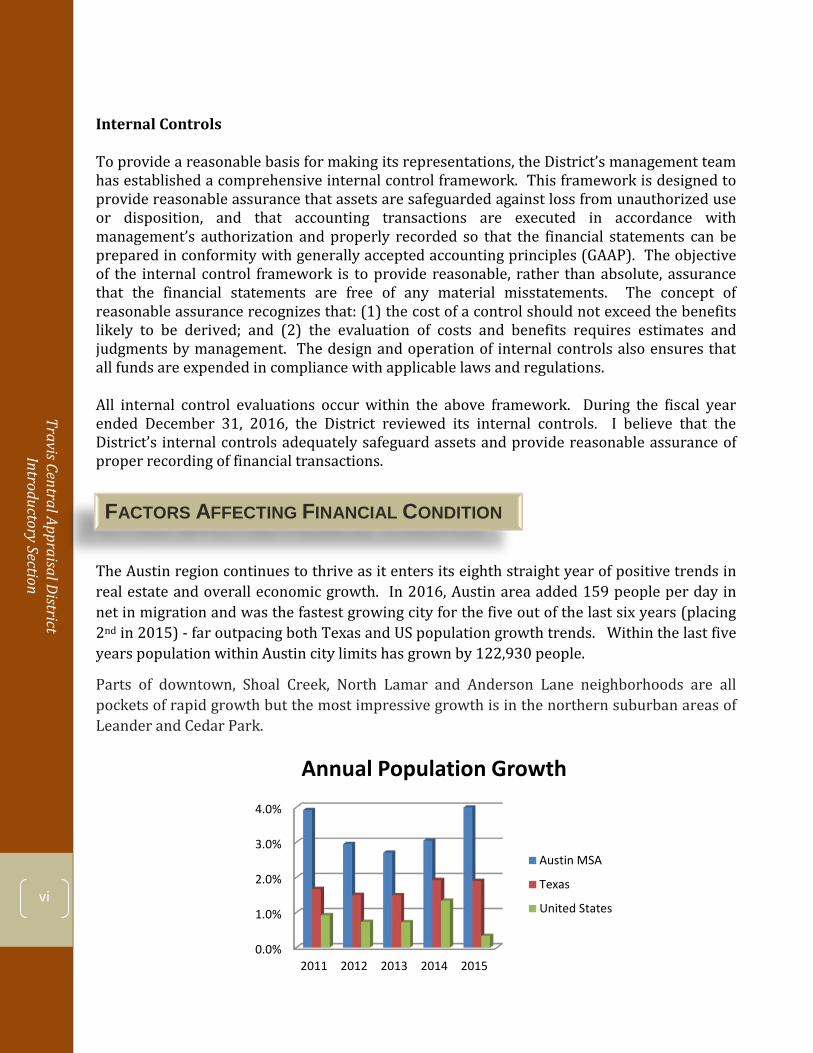
The Austin region continues to thrive as it enters its eighth straight year of positive trends in real estate and overall economic growth. In 2016, Austin area added 159 people per day in net in migration and was the fastest growing city for the five out of the last six years (placing 2nd in 2015) - far outpacing both Texas and US population growth trends. Within the last five years population within Austin city limits has grown by 122,930 people.
Parts of downtown, Shoal Creek, North Lamar and Anderson Lane neighborhoods are all pockets of rapid growth but the most impressive growth is in the northern suburban areas of Leander and Cedar Park.
FACTORS AFFECTING FINANCIAL CONDITION
vii vii
Trav
is Ce
ntra
l App
raisa
l Dist
rict
In
trod
ucto
ry S
ectio
n
According to city of Austin demographer Ryan Robinson “Austin's enormous population growth continues to be driven mainly by in-migrating households drawn here by sustained, robust job creation and a high quality of life. I keep looking for the crest of this huge wave of growth we're riding and I just don't see it yet, especially in light of these new data which strongly suggest we are still Boomtown, USA."
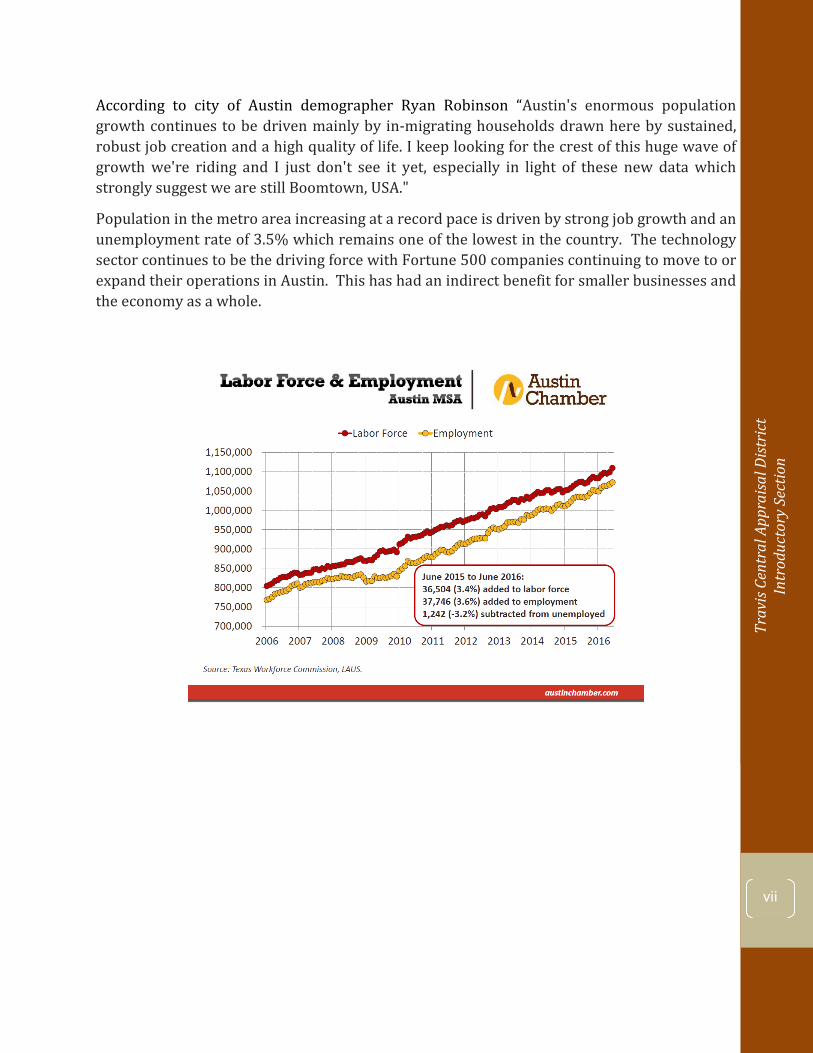
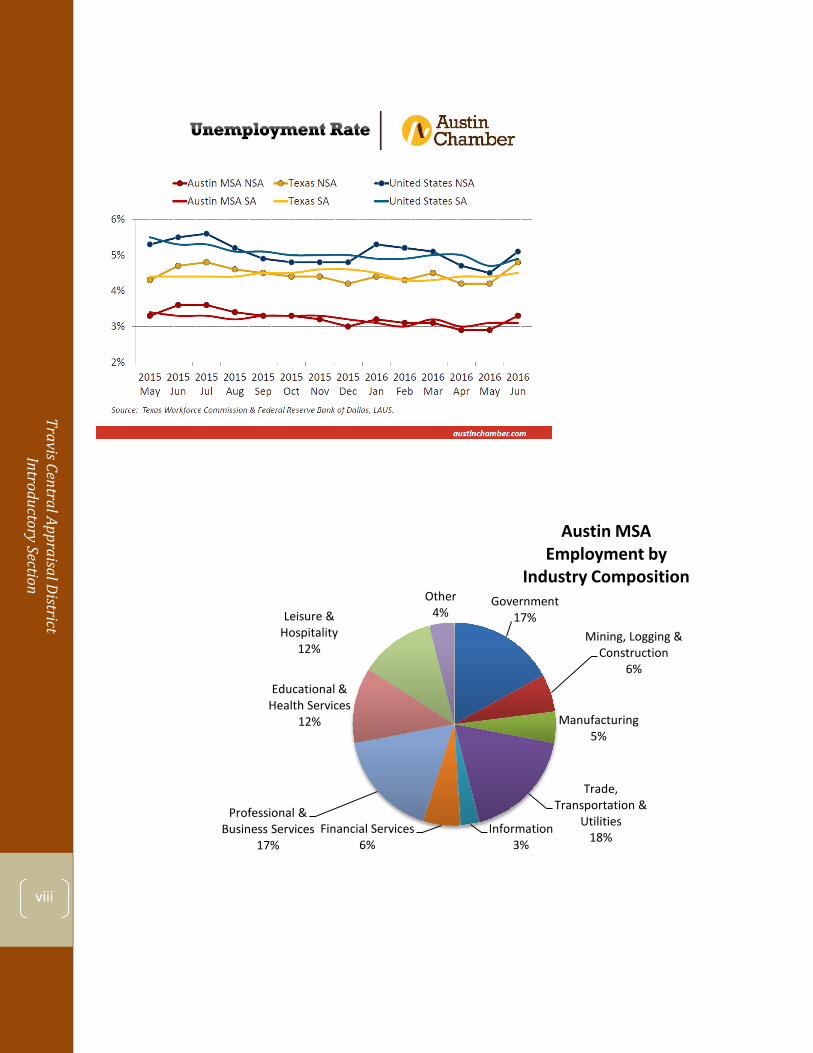
Population in the metro area increasing at a record pace is driven by strong job growth and an unemployment rate of 3.5% which remains one of the lowest in the country. The technology sector continues to be the driving force with Fortune 500 companies continuing to move to or expand their operations in Austin. This has had an indirect benefit for smaller businesses and the economy as a whole.
Travis Central Appraisal District Introductory Section
viii
Government 17%
Mining, Logging & Construction
6%
Manufacturing 5%
Trade, Transportation &
Utilities 18%
Information 3%
Financial Services 6%
Professional & Business Services
17%
Educational & Health Services
12%
Leisure & Hospitality
12%
Other 4%
Austin MSA Employment by
Industry Composition
ix ix
Trav
is Ce
ntra
l App
raisa
l Dist
rict
In
trod
ucto
ry S
ectio
n
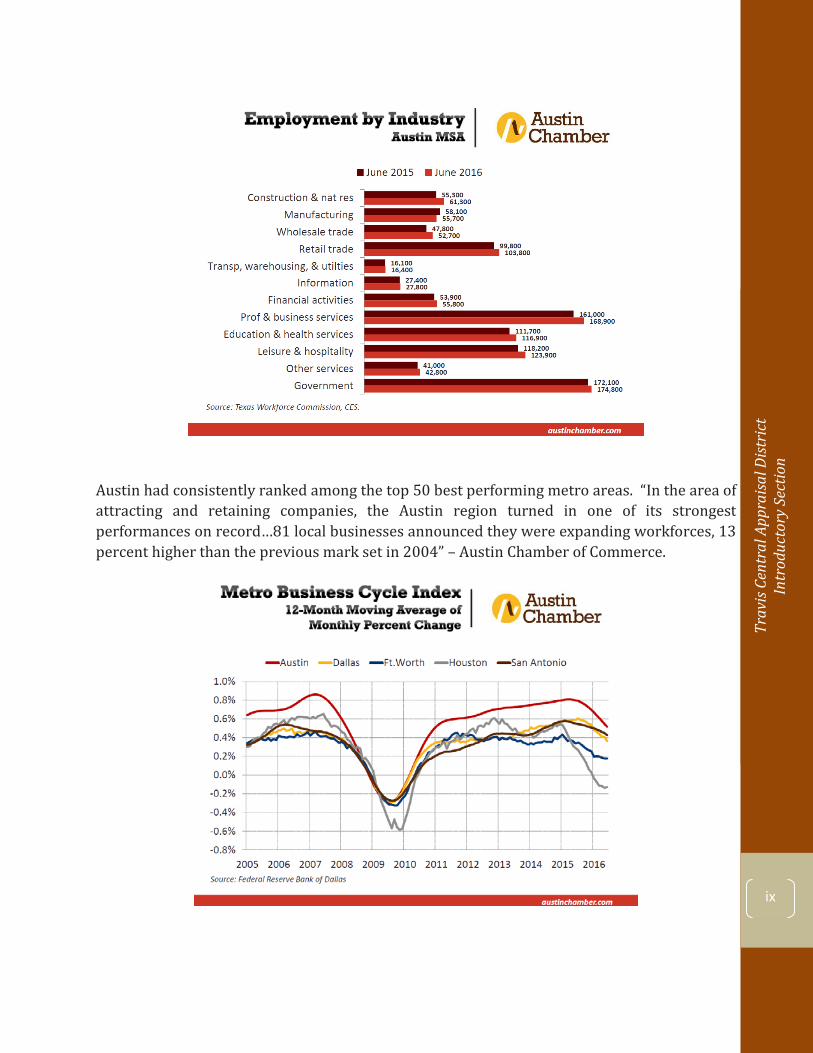
Austin had consistently ranked among the top 50 best performing metro areas. “In the area of attracting and retaining companies, the Austin region turned in one of its strongest performances on record…81 local businesses announced they were expanding workforces, 13 percent higher than the previous mark set in 2004” – Austin Chamber of Commerce.
Travis Central Appraisal District Introductory Section
x
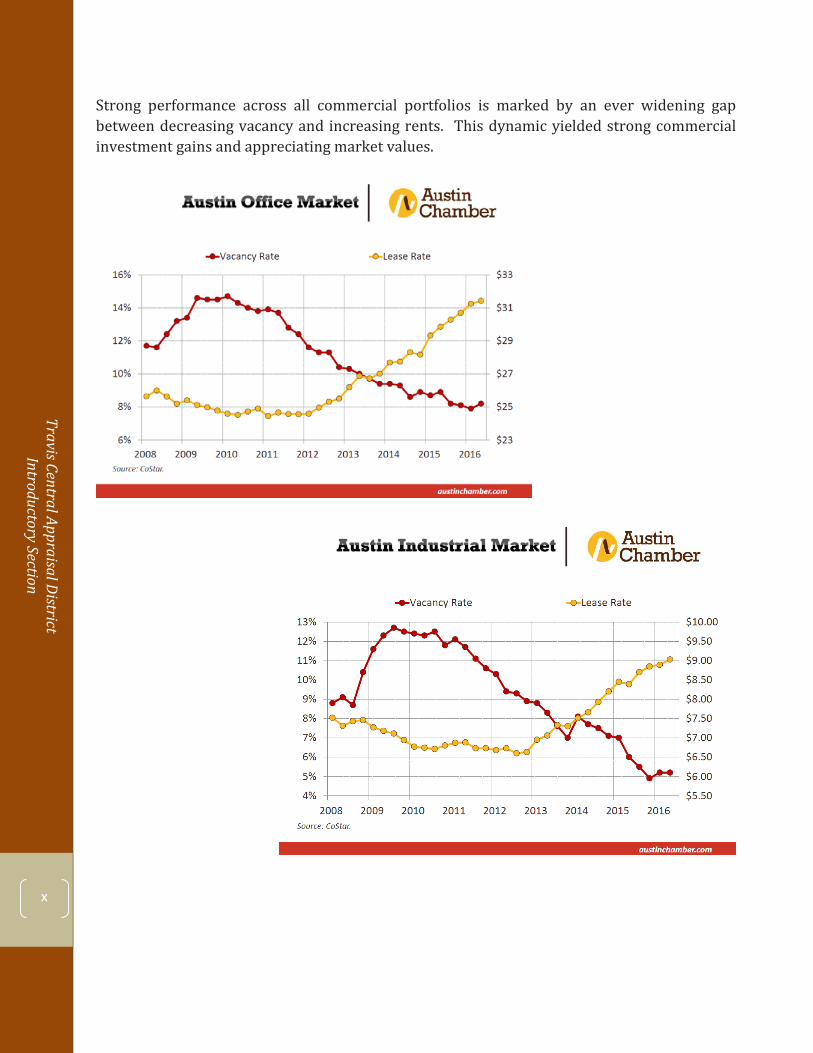
Strong performance across all commercial portfolios is marked by an ever widening gap between decreasing vacancy and increasing rents. This dynamic yielded strong commercial investment gains and appreciating market values.
xi
xi
Trav
is Ce
ntra
l App
raisa
l Dist
rict
In
trod
ucto
ry S
ectio
n
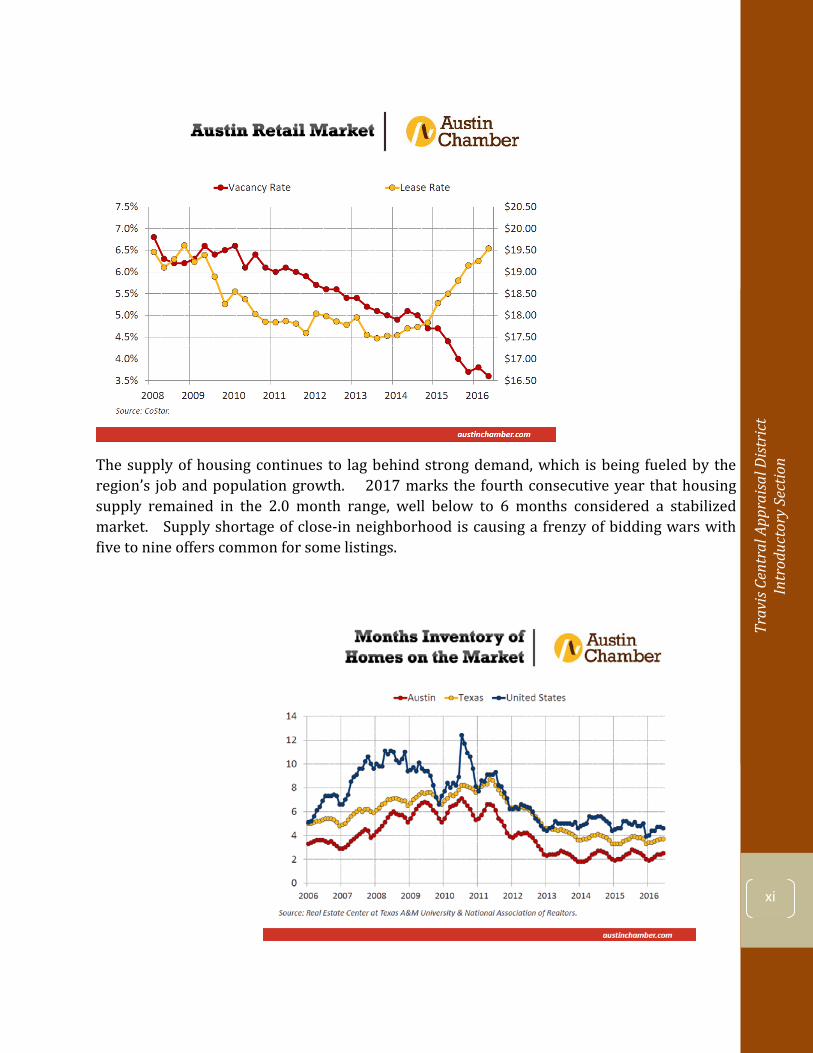
The supply of housing continues to lag behind strong demand, which is being fueled by the region’s job and population growth. 2017 marks the fourth consecutive year that housing supply remained in the 2.0 month range, well below to 6 months considered a stabilized market. Supply shortage of close-in neighborhood is causing a frenzy of bidding wars with five to nine offers common for some listings.
Travis Central Appraisal District Introductory Section
xii
xiii xiii
Trav
is Ce
ntra
l App
raisa
l Dist
rict
In
trod
ucto
ry S
ectio
n
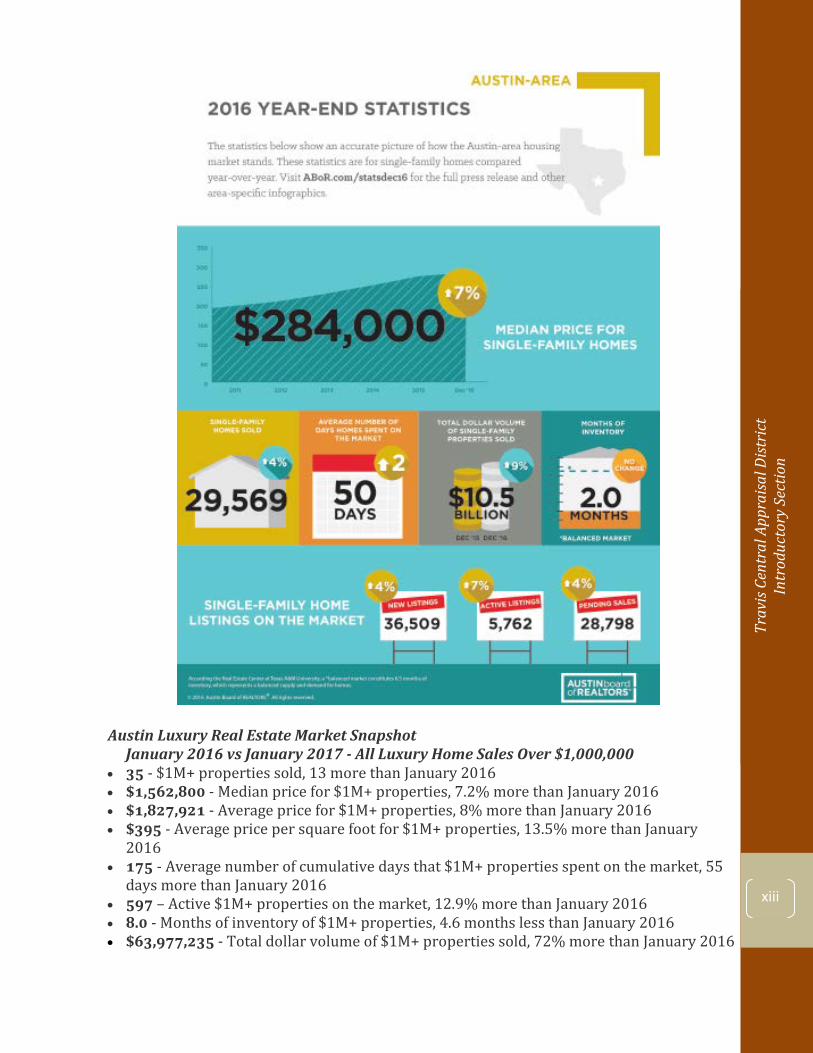
Austin Luxury Real Estate Market Snapshot January 2016 vs January 2017 - All Luxury Home Sales Over $1,000,000
• 35 - $1M+ properties sold, 13 more than January 2016• $1,562,800 - Median price for $1M+ properties, 7.2% more than January 2016• $1,827,921 - Average price for $1M+ properties, 8% more than January 2016• $395 - Average price per square foot for $1M+ properties, 13.5% more than January
2016 • 175 - Average number of cumulative days that $1M+ properties spent on the market, 55
days more than January 2016• 597 – Active $1M+ properties on the market, 12.9% more than January 2016• 8.0 - Months of inventory of $1M+ properties, 4.6 months less than January 2016• $63,977,235 - Total dollar volume of $1M+ properties sold, 72% more than January 2016
Travis Central Appraisal District Introductory Section
xiv
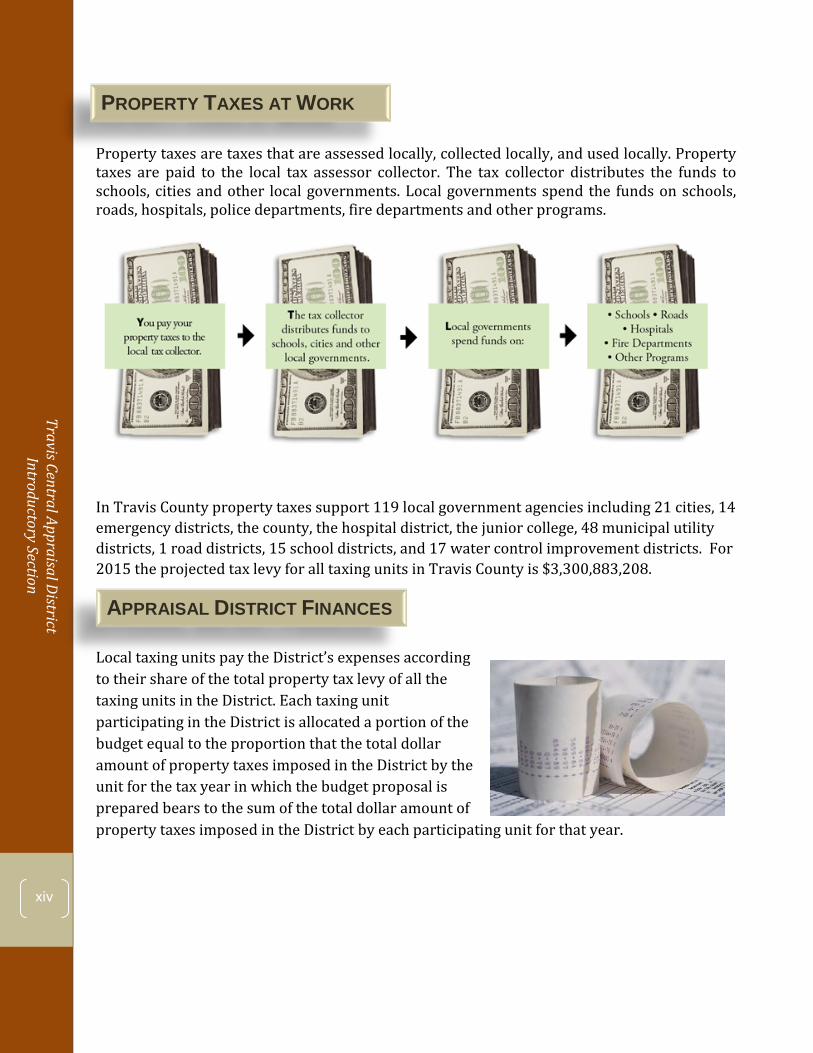
Property taxes are taxes that are assessed locally, collected locally, and used locally. Property taxes are paid to the local tax assessor collector. The tax collector distributes the funds to schools, cities and other local governments. Local governments spend the funds on schools, roads, hospitals, police departments, fire departments and other programs.
In Travis County property taxes support 119 local government agencies including 21 cities, 14 emergency districts, the county, the hospital district, the junior college, 48 municipal utility districts, 1 road districts, 15 school districts, and 17 water control improvement districts. For 2015 the projected tax levy for all taxing units in Travis County is $3,300,883,208.
Local taxing units pay the District’s expenses according to their share of the total property tax levy of all the taxing units in the District. Each taxing unit participating in the District is allocated a portion of the budget equal to the proportion that the total dollar amount of property taxes imposed in the District by the unit for the tax year in which the budget proposal is prepared bears to the sum of the total dollar amount of property taxes imposed in the District by each participating unit for that year.
PROPERTY TAXES AT WORK
APPRAISAL DISTRICT FINANCES
xv xv
Trav
is Ce
ntra
l App
raisa
l Dist
rict
In
trod
ucto
ry S
ectio
n
1. Develop appraisals that reflect market value and ensure fairness and uniformity.2. Be efficient in business processes and ensure that mission critical tasks are completed in a
timely manner with a high level of accuracy.3. Collect, create and maintain accurate data.4. Ensure that the district maintains a highly educated, motivated and skilled workforce.5. Provide customer service that is courteous, professional and accurate.
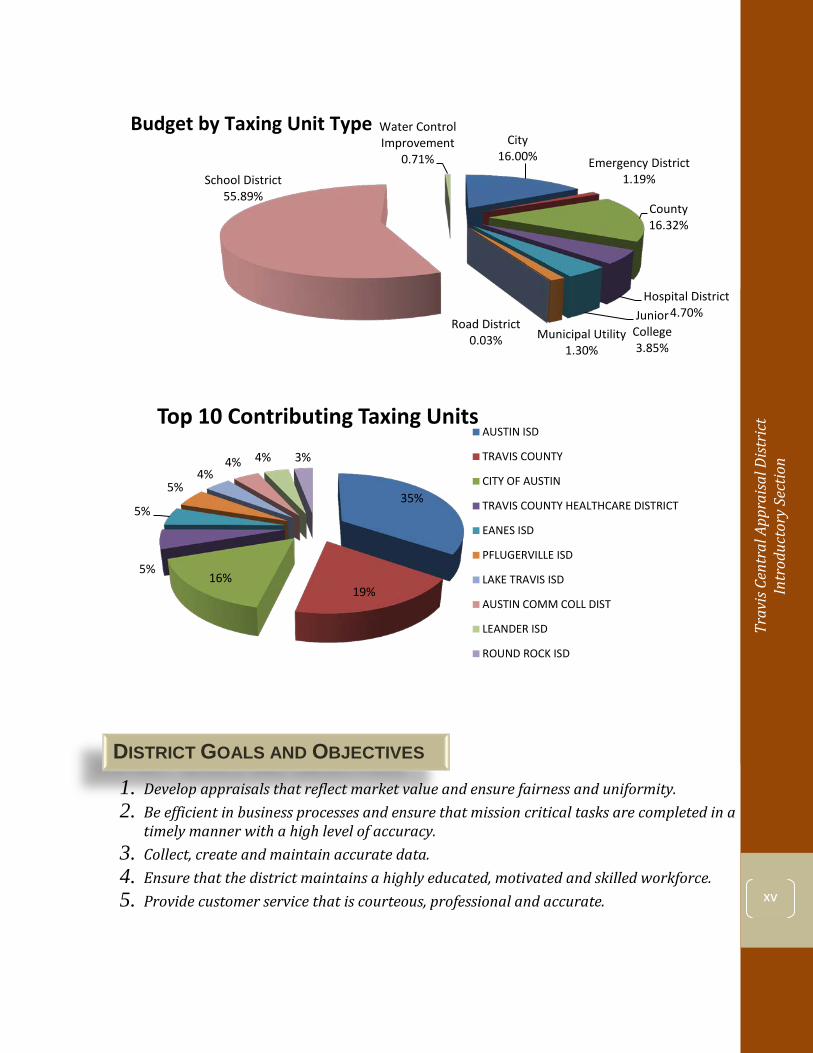
City 16.00% Emergency District
1.19%
County 16.32%
Hospital District 4.70% Junior
College 3.85%
Municipal Utility 1.30%
Road District 0.03%
School District 55.89%
Water Control Improvement
0.71%
Budget by Taxing Unit Type
DISTRICT GOALS AND OBJECTIVES
35%
19% 16%
5%
5%
5% 4%
4% 4% 3%
Top 10 Contributing Taxing Units AUSTIN ISD
TRAVIS COUNTY
CITY OF AUSTIN
TRAVIS COUNTY HEALTHCARE DISTRICT
EANES ISD
PFLUGERVILLE ISD
LAKE TRAVIS ISD
AUSTIN COMM COLL DIST
LEANDER ISD
ROUND ROCK ISD
Travis Central Appraisal District Introductory Section
xvi
The Government Finance Officers Association of the United States and Canada (GFOA) awarded a Certificate of Achievement for Excellence in Financial Reporting to the Travis Central Appraisal District for its comprehensive annual financial report (CAFR) for the fiscal year ended December 31, 2015. This was the fifth consecutive year that the District has achieved this prestigious award. In order to be awarded a Certificate of Achievement, a government must publish an easily readable and efficiently organized comprehensive annual financial report. This report must satisfy both generally accepted accounting principles and applicable legal requirements.
A certificate of Achievement is valid for a period of one year only. We believe that our current comprehensive annual financial report continues to meet the Certificate of Achievement Program’s requirements and we are submitting it to the GFOA to determine its eligibility for another certificate.
The Government Finance Officers Association of the United States and Canada (GFOA) presented a Distinguished Budget Presentation Award to the Travis Central Appraisal District, Texas for its annual budget for the fiscal year beginning January 1, 2017. This was the fifth consecutive year that the District achieved this prestigious award. In order to receive this award, a governmental unit must publish a budget document that meets program criteria as a policy document, as an operations guide, as a financial plan, and as a communications device. This award is valid for a period of one year only.
The independent auditor’s report is included in the financial section of this Comprehensive Annual Financial Report (CAFR). The firm Weaver and Tidwell, LLP was selected by the District’s Board of Directors to perform the fiscal year 2016 financial audit.
Respectfully submitted,
Leana H. Mann Finance & Facilities Director Travis Central Appraisal District
AWARDS AND ACKNOWLEDGMENTS

xvii xvii
Trav
is Ce
ntra
l App
raisa
l Dist
rict
In
trod
ucto
ry S
ectio
n
TRAVIS CENTRAL APPRAISAL DISTRICT
Organizational Chart December 31, 2016
Paul SnyderDeputy Chief of Appraisal
Marya CriglerChief Appraiser
Paula FugateDirector
Human Resources
Tawnya BlaylockDirector
Information Systems
Leana Hengst MannDirector
Finance and Facilities
Board of Directors Martin WilbanksTaxpayer Liaison
Sharon BaxterSr. Litigation Attorney
Eileen HylandDirector Customer Service
& Appraisal Support
Michael Kasper Director
Residential Appraisal
Lonnie HendryDirector
Commercial Appraisal
Key District Personnel December 31, 2016
Chief Appraiser Marya Crigler Deputy Chief of Appraisal Paul Snyder Director of Residential Appraisal Michael Kasper Director of Commercial and Personal Property Appraisal Lonnie Hendry Director of Appraisal Support & Customer Service Eileen Hyland Director of Information Technology (IT) Tawnya Blaylock Human Resources Director Paula Fugate Finance & Facilities Director Leana Mann Senior Litigation Attorney Sharon Baxter

Travis Central Appraisal District Introductory Section
xviii

Trav
is Ce
ntra
l App
raisa
l Dist
rict
Fi
nanc
ial S
ectio
n
1
INDEPENDENT AUDITOR’S REPORT
The Board of Directors Travis Central Appraisal District
We have audited the accompanying financial statements of the governmental activities and major fund of Travis Central Appraisal District (the District) as of and for the year ended December 31, 2016, and the related notes to the financial statements, which collectively comprise the District’s basic financial statements as listed in the table of contents.
Management’s Responsibility for the Financial Statements
The District’s management is responsible for the preparation and fair presentation of these financial statements in accordance with accounting principles generally accepted in the United States of America; this includes the design, implementation, and maintenance of internal control relevant to the preparation and fair presentation of financial statements that are free from material misstatement, whether due to fraud or error.
Auditor’s Responsibility
Our responsibility is to express opinions on these financial statements based on our audit. We conducted our audit in accordance with auditing standards generally accepted in the United States of America. Those standards require that we plan and perform the audit to obtain reasonable assurance about whether the financial statements are free from material misstatement.
An audit involves performing procedures to obtain audit evidence about the amounts and disclosures in the financial statements. The procedures selected depend on the auditor’s judgment, including the assessment of the risks of material misstatement of the financial statements, whether due to fraud or error. In making those risk assessments, the auditor considers internal control relevant to the entity’s preparation and fair presentation of the financial statements in order to design audit procedures that are appropriate in the circumstances, but not for the purpose of expressing an opinion on the effectiveness of the entity’s internal control. Accordingly, we express no such opinion. An audit also includes evaluating the appropriateness of accounting policies used and the reasonableness of significant accounting estimates made by management, as well as evaluating the overall presentation of the financial statements.
We believe that the audit evidence we have obtained is sufficient and appropriate to provide a basis for our audit opinions.
Opinions
In our opinion, the financial statements referred to above present fairly, in all material respects, the respective financial position of the governmental activities and major fund of Travis Central Appraisal District as of December 31, 2014, and the respective changes in financial position for the year then ended in accordance with accounting principles generally accepted in the United States of America
Travis Central Appraisal District Financial Section
2
The Board of Directors Travis Central Appraisal District
Other Matters
Required Supplementary Information
Accounting principles generally accepted in the United States of America require that the management’s discussion and analysis, general budgetary comparison schedule, schedule of changes in net pension liability and related ratios and schedule of employer contributions on pages 3 through 19 and pages 56 through 61, respectively, be presented to supplement the basic financial statements. Such information, although not a part of the basic financial statements, is required by the Governmental Accounting Standards Board who considers it to be an essential part of financial reporting for placing the basic financial statements in an appropriate operational, economic, or historical context. We have applied certain limited procedures to the required supplementary information in accordance with auditing standards generally accepted in the United States of America, which consisted of inquiries of management about the methods of preparing the information and comparing the information for consistency with management’s responses to our inquiries, the basic financial statements, and other knowledge we obtained during our audit of the basic financial statements. We do not express an opinion or provide any assurance on the information because the limited procedures do not provide us with sufficient evidence to express an opinion or provide any assurance.
Other Information
Our audit was conducted for the purpose of forming opinions on the financial statements that collectively comprise the District’s basic financial statements. The introductory section and statistical section are presented for purposes of additional analysis and are not a required part of the basic financial statements. The introductory and statistical sections have not been subjected to the auditing procedures applied in the audit of the basic financial statements and, accordingly, we do not express an opinion or provide any assurance on them.
WEAVER AND TIDWELL, L.L.P.
Austin, Texas May 24, 2017
Trav
is Ce
ntra
l App
raisa
l Dist
rict
Fi
nanc
ial S
ectio
n
3
TRAVIS CENTRAL APPRAISAL DISTRICT MANAGEMENT’S DISCUSSION AND ANALYSIS
YEAR ENDED DECEMBER 31, 2016 (UNAUDITED)
As management of the Travis Central Appraisal District (the District), we offer the readers of the District’s financial statements this overview and analysis of the financial activities for the fiscal year ended December 31, 2016. This discussion and analysis should be read in conjunction with the accompanying letter of transmittal, the basic financial statements, and the notes to those financial statements. For more detailed information on any of the topics contained in this discussion and analysis, please refer to the Notes to the Basic Financial Statements presented in the latter part of the financial section of this comprehensive annual financial report.
FINANCIAL HIGHLIGHTS
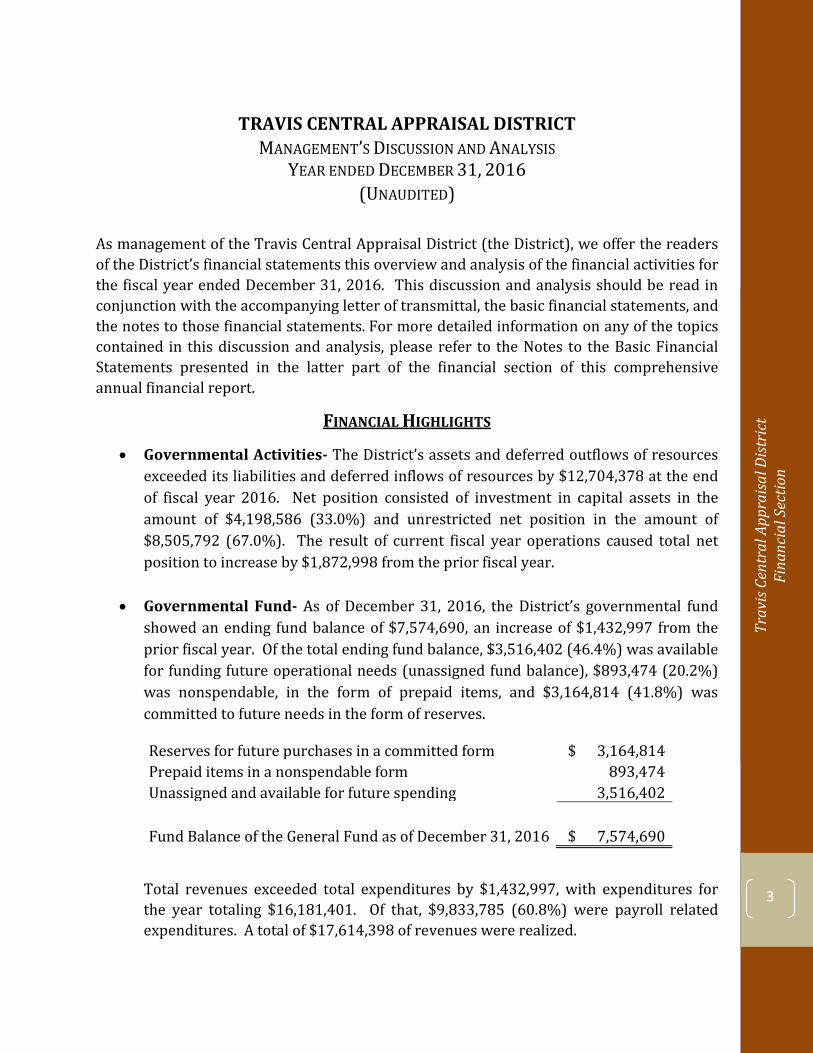
• Governmental Activities- The District’s assets and deferred outflows of resourcesexceeded its liabilities and deferred inflows of resources by $12,704,378 at the endof fiscal year 2016. Net position consisted of investment in capital assets in theamount of $4,198,586 (33.0%) and unrestricted net position in the amount of$8,505,792 (67.0%). The result of current fiscal year operations caused total netposition to increase by $1,872,998 from the prior fiscal year.
• Governmental Fund- As of December 31, 2016, the District’s governmental fundshowed an ending fund balance of $7,574,690, an increase of $1,432,997 from theprior fiscal year. Of the total ending fund balance, $3,516,402 (46.4%) was availablefor funding future operational needs (unassigned fund balance), $893,474 (20.2%)was nonspendable, in the form of prepaid items, and $3,164,814 (41.8%) wascommitted to future needs in the form of reserves.
Reserves for future purchases in a committed form $ 3,164,814 Prepaid items in a nonspendable form 893,474 Unassigned and available for future spending 3,516,402
Fund Balance of the General Fund as of December 31, 2016 $ 7,574,690
Total revenues exceeded total expenditures by $1,432,997, with expenditures for the year totaling $16,181,401. Of that, $9,833,785 (60.8%) were payroll related expenditures. A total of $17,614,398 of revenues were realized.

Travis Central Appraisal District Financial Section
4
OVERVIEW OF THE FINANCIAL STATEMENTS
This discussion and analysis is intended to serve as an introduction to the District’s basic financial statements. The basic financial statements are comprised of the following three components: (1) government-wide financial statements, (2) fund financial statements and (3) notes to the basic financial statements. This financial report also contains other supplementary information in addition to the basic financial statements.
Government-wide Financial Statements: The government-wide financial statements are designed to provide readers with a broad overview of the District’s finances, in a manner similar to a private-sector business. These statements provide information, both long-term and short-term, about the District’s overall financial condition. The government-wide financial statements can be found on page 22-23 of this report.
Statement of Net Position- The statement of net position reports all of the District’s assets and deferred outflows of resources and liabilities and deferred inflows of resources, both current and noncurrent, with the difference between the two reported as net position. Net position is one way to measure the District’s financial health. Over time, increases or decreases in the District’s net position may serve as an indicator of whether its financial health is improving or deteriorating, respectively. In the statement of net position, the assets, liabilities and net position are separately displayed for governmental activities and business-type activities. Activities of the District as a whole include only governmental activities. The District has no business-type activities or component units.
Statement of Activities- The statement of activities presents information showing how the District’s net position changed during the fiscal year. All changes in net position are reported as soon as the underlying event giving rise to the change occurs, regardless of the timing of related cash flows. Thus, revenues and expenses are reported in this statement for some items that will only result in cash flows in future fiscal periods (e.g., uncollected assessments and earned but unused compensated absences).
Fund Financial Statements: The fund financial statements provide more detailed information about the District’s most significant funds, not the District as a whole. Like many other local and state governments, the District utilizes fund accounting. A fund is a grouping of related accounts that is used to maintain control over resources that have been segregated for specific activities or objectives. The District uses fund accounting to ensure and demonstrate compliance with finance-related legal requirements.
There are three types of funds that government entities utilize, depending on their specific needs and requirements: (1) governmental funds, (2) proprietary funds and (3) fiduciary funds. The fund financial statements can be found on page 25-29 of this report.
Trav
is Ce
ntra
l App
raisa
l Dist
rict
Fi
nanc
ial S
ectio
n
5
Governmental Funds: Governmental funds are used to account for essentially the same functions reported as governmental activities in the government-wide financial statements. However, unlike the government-wide financial statements, governmental fund financial statements focus on near-term inflows and outflows or spendable resources, as well as on balances of spendable resources available at the end of the fiscal year. Such information may be useful in evaluating a government’s near-term financing requirements. Because the focus of government funds is narrower than that of the government-wide financial statements, it is useful to compare the information presented for governmental funds with similar information presented for governmental activities in the government-wide financial statements. By doing so, readers may better understand the long-term impact of the District’s near-term financial decisions. Both the governmental funds balance sheet and the government funds statement of revenues, expenditures and changes in fund balance provide reconciliations to facilitate this comparison. A fund column is presented for the District’s one major fund, the general fund, which is a governmental fund. The District had no other governmental funds during fiscal year 2016.
Proprietary Funds: Proprietary funds are used to account for a government’s ongoing organizational activities that are similar to those often found in the private sector. The District had no proprietary funds during fiscal year 2016.
Fiduciary Funds: Fiduciary funds are used to account for resources held for the benefit of parties outside the government. Fiduciary funds are not reflected in the government-wide financial statements because the resources of those funds are not available to support a government’s own programs. The District had no fiduciary funds during fiscal year 2016.
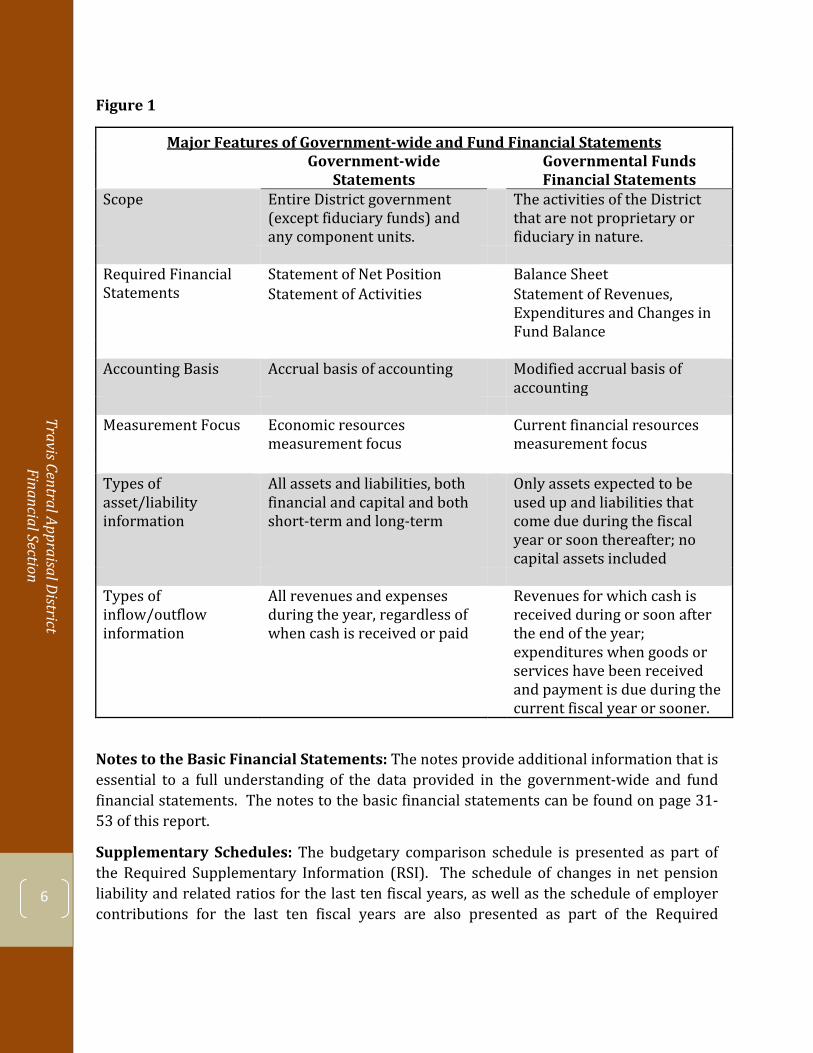
The Figure 1 on the following page summarizes the major features of the District’s financial statements.
Travis Central Appraisal District Financial Section
6
Figure 1
Major Features of Government-wide and Fund Financial Statements Government-wide
Statements Governmental Funds Financial Statements
Scope Entire District government (except fiduciary funds) and any component units.
The activities of the District that are not proprietary or fiduciary in nature.
Required Financial Statements
Statement of Net Position Balance Sheet Statement of Activities Statement of Revenues,
Expenditures and Changes in Fund Balance
Accounting Basis Accrual basis of accounting Modified accrual basis of accounting
Measurement Focus Economic resources measurement focus
Current financial resources measurement focus
Types of asset/liability information
All assets and liabilities, both financial and capital and both short-term and long-term
Only assets expected to be used up and liabilities that come due during the fiscal year or soon thereafter; no capital assets included
Types of inflow/outflow information
All revenues and expenses during the year, regardless of when cash is received or paid
Revenues for which cash is received during or soon after the end of the year; expenditures when goods or services have been received and payment is due during the current fiscal year or sooner.
Notes to the Basic Financial Statements: The notes provide additional information that is essential to a full understanding of the data provided in the government-wide and fund financial statements. The notes to the basic financial statements can be found on page 31-53 of this report.
Supplementary Schedules: The budgetary comparison schedule is presented as part of the Required Supplementary Information (RSI). The schedule of changes in net pension liability and related ratios for the last ten fiscal years, as well as the schedule of employer contributions for the last ten fiscal years are also presented as part of the Required
Trav
is Ce
ntra
l App
raisa
l Dist
rict
Fi
nanc
ial S
ectio
n
7
Supplementary Information (RSI). These schedule and the accompanying notes to the supplementary schedules can be found on page 55-61 of this report.
GOVERNMENT-WIDE FINANCIAL ANALYSIS
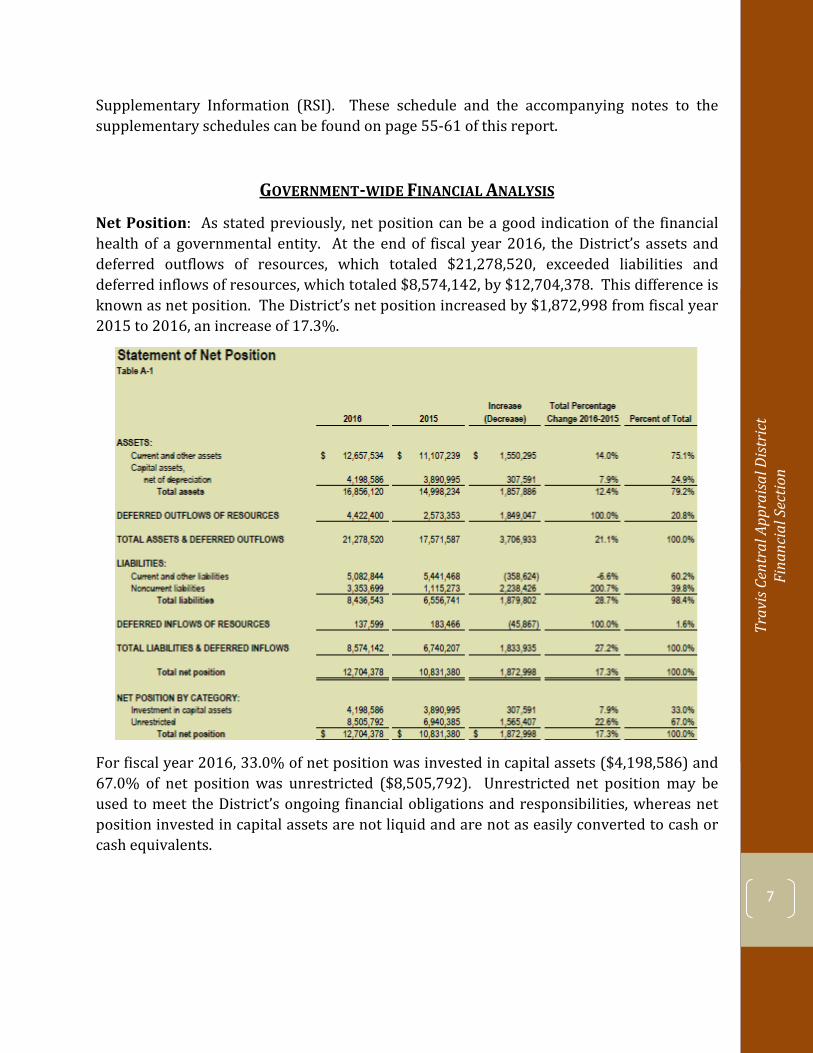
Net Position: As stated previously, net position can be a good indication of the financial health of a governmental entity. At the end of fiscal year 2016, the District’s assets and deferred outflows of resources, which totaled $21,278,520, exceeded liabilities and deferred inflows of resources, which totaled $8,574,142, by $12,704,378. This difference is known as net position. The District’s net position increased by $1,872,998 from fiscal year 2015 to 2016, an increase of 17.3%.
For fiscal year 2016, 33.0% of net position was invested in capital assets ($4,198,586) and 67.0% of net position was unrestricted ($8,505,792). Unrestricted net position may be used to meet the District’s ongoing financial obligations and responsibilities, whereas net position invested in capital assets are not liquid and are not as easily converted to cash or cash equivalents.
Travis Central Appraisal District Financial Section
8
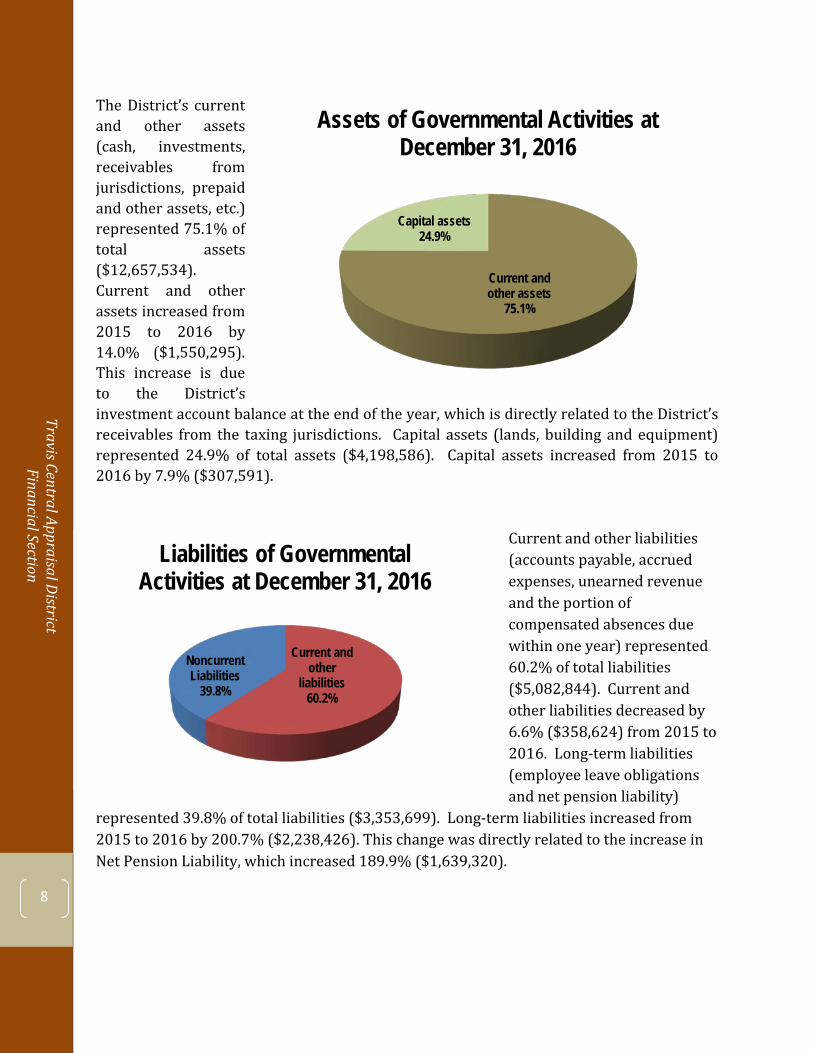
The District’s current and other assets (cash, investments, receivables from jurisdictions, prepaid and other assets, etc.) represented 75.1% of total assets ($12,657,534). Current and other assets increased from 2015 to 2016 by 14.0% ($1,550,295). This increase is due to the District’s investment account balance at the end of the year, which is directly related to the District’s receivables from the taxing jurisdictions. Capital assets (lands, building and equipment) represented 24.9% of total assets ($4,198,586). Capital assets increased from 2015 to 2016 by 7.9% ($307,591).
Current and other liabilities (accounts payable, accruedexpenses, unearned revenueand the portion of compensated absences due within one year) represented 60.2% of total liabilities ($5,082,844). Current and other liabilities decreased by 6.6% ($358,624) from 2015 to 2016. Long-term liabilities (employee leave obligations and net pension liability)
represented 39.8% of total liabilities ($3,353,699). Long-term liabilities increased from 2015 to 2016 by 200.7% ($2,238,426). This change was directly related to the increase in Net Pension Liability, which increased 189.9% ($1,639,320).
Current and other assets
75.1%
Capital assets24.9%
Assets of Governmental Activities at December 31, 2016
Current and other
liabilities 60.2%
Noncurrent Liabilities
39.8%
Liabilities of Governmental Activities at December 31, 2016
Trav
is Ce
ntra
l App
raisa
l Dist
rict
Fi
nanc
ial S
ectio
n
9
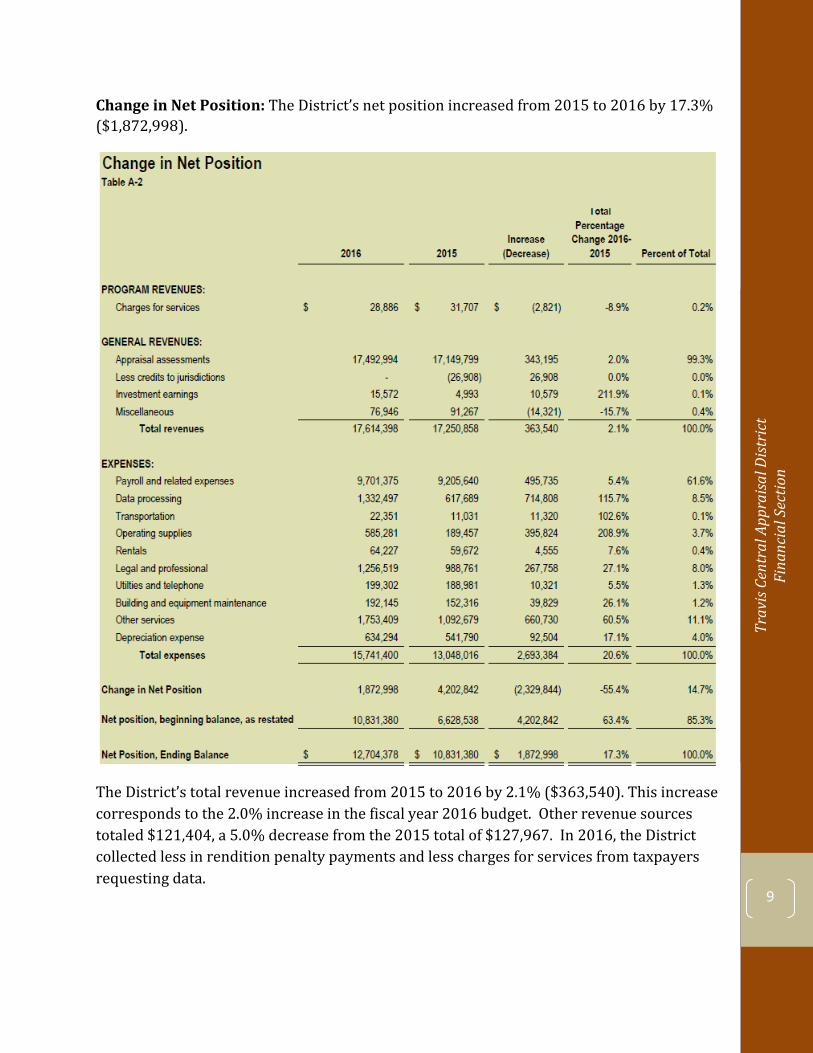
Change in Net Position: The District’s net position increased from 2015 to 2016 by 17.3% ($1,872,998).
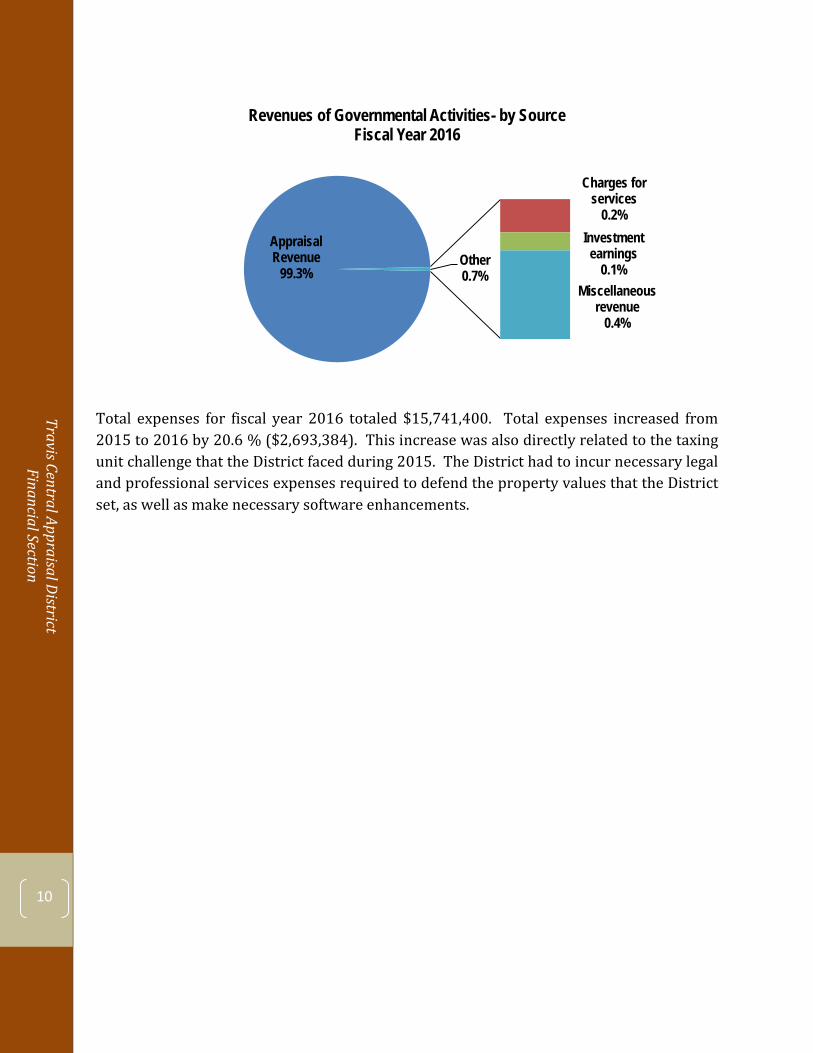
The District’s total revenue increased from 2015 to 2016 by 2.1% ($363,540). This increase corresponds to the 2.0% increase in the fiscal year 2016 budget. Other revenue sources totaled $121,404, a 5.0% decrease from the 2015 total of $127,967. In 2016, the District collected less in rendition penalty payments and less charges for services from taxpayers requesting data.
Travis Central Appraisal District Financial Section
10
Total expenses for fiscal year 2016 totaled $15,741,400. Total expenses increased from 2015 to 2016 by 20.6 % ($2,693,384). This increase was also directly related to the taxing unit challenge that the District faced during 2015. The District had to incur necessary legal and professional services expenses required to defend the property values that the District set, as well as make necessary software enhancements.
Appraisal Revenue
99.3%
Charges for services
0.2% Investment earnings
0.1% Miscellaneous
revenue 0.4%
Other 0.7%
Revenues of Governmental Activities- by Source Fiscal Year 2016
Trav
is Ce
ntra
l App
raisa
l Dist
rict
Fi
nanc
ial S
ectio
n
11
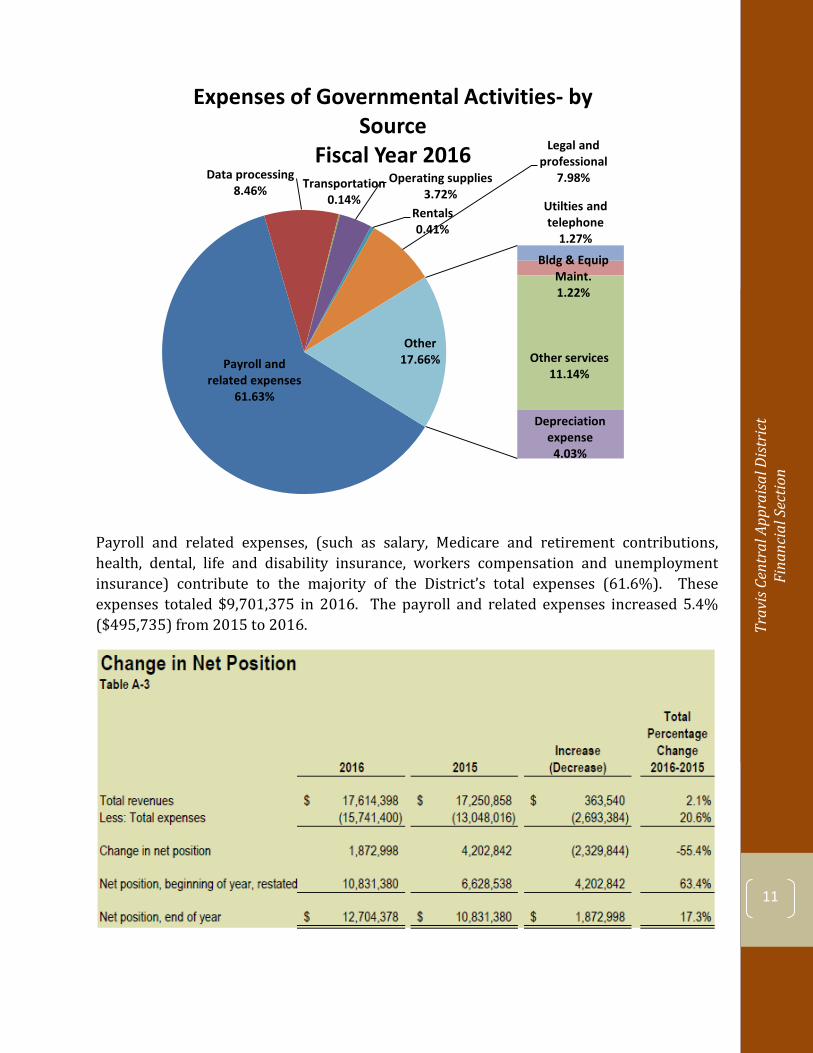
Payroll and related expenses, (such as salary, Medicare and retirement contributions, health, dental, life and disability insurance, workers compensation and unemployment insurance) contribute to the majority of the District’s total expenses (61.6%). These expenses totaled $9,701,375 in 2016. The payroll and related expenses increased 5.4% ($495,735) from 2015 to 2016.
Payroll and related expenses
61.63%
Data processing 8.46% Transportation
0.14%
Operating supplies 3.72%
Rentals 0.41%
Legal and professional
7.98%
Utilties and telephone
1.27%
Bldg & Equip Maint. 1.22%
Other services 11.14%
Depreciation expense
4.03%
Other 17.66%
Expenses of Governmental Activities- by Source
Fiscal Year 2016
Travis Central Appraisal District Financial Section
12
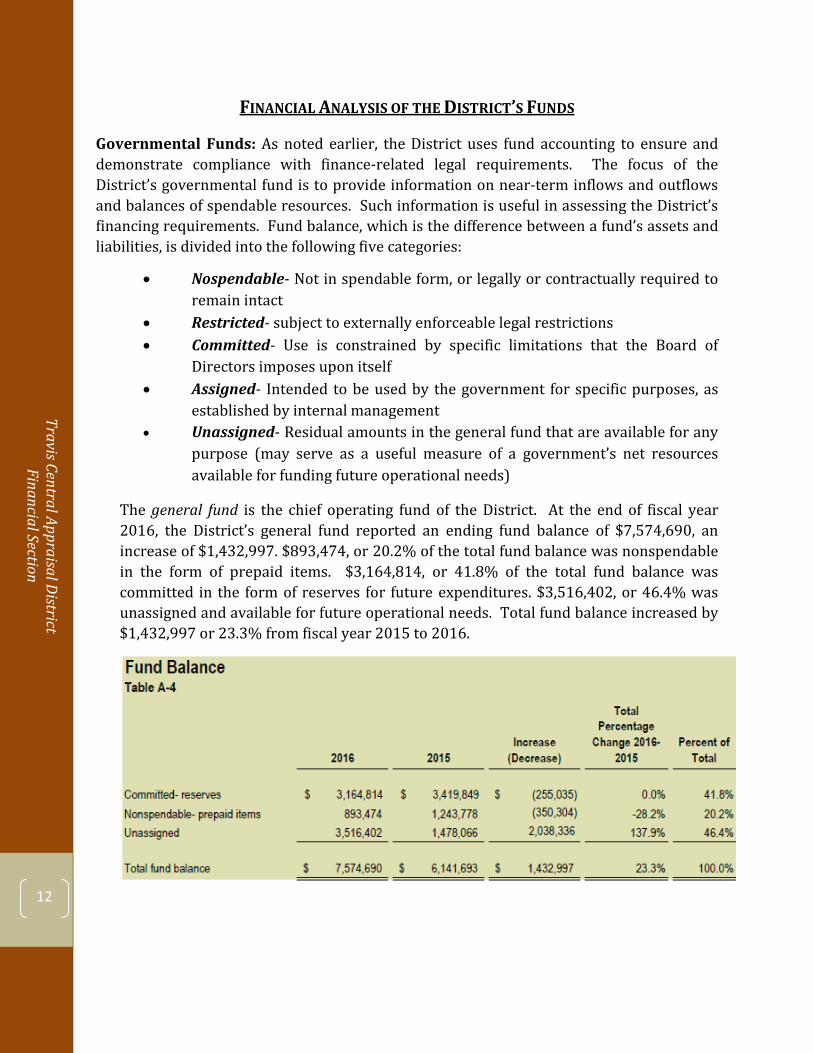
FINANCIAL ANALYSIS OF THE DISTRICT’S FUNDS
Governmental Funds: As noted earlier, the District uses fund accounting to ensure and demonstrate compliance with finance-related legal requirements. The focus of the District’s governmental fund is to provide information on near-term inflows and outflows and balances of spendable resources. Such information is useful in assessing the District’s financing requirements. Fund balance, which is the difference between a fund’s assets and liabilities, is divided into the following five categories:
• Nospendable- Not in spendable form, or legally or contractually required toremain intact
• Restricted- subject to externally enforceable legal restrictions• Committed- Use is constrained by specific limitations that the Board of
Directors imposes upon itself• Assigned- Intended to be used by the government for specific purposes, as
established by internal management• Unassigned- Residual amounts in the general fund that are available for any
purpose (may serve as a useful measure of a government’s net resourcesavailable for funding future operational needs)
The general fund is the chief operating fund of the District. At the end of fiscal year 2016, the District’s general fund reported an ending fund balance of $7,574,690, an increase of $1,432,997. $893,474, or 20.2% of the total fund balance was nonspendable in the form of prepaid items. $3,164,814, or 41.8% of the total fund balance was committed in the form of reserves for future expenditures. $3,516,402, or 46.4% was unassigned and available for future operational needs. Total fund balance increased by $1,432,997 or 23.3% from fiscal year 2015 to 2016.
Trav
is Ce
ntra
l App
raisa
l Dist
rict
Fi
nanc
ial S
ectio
n
13
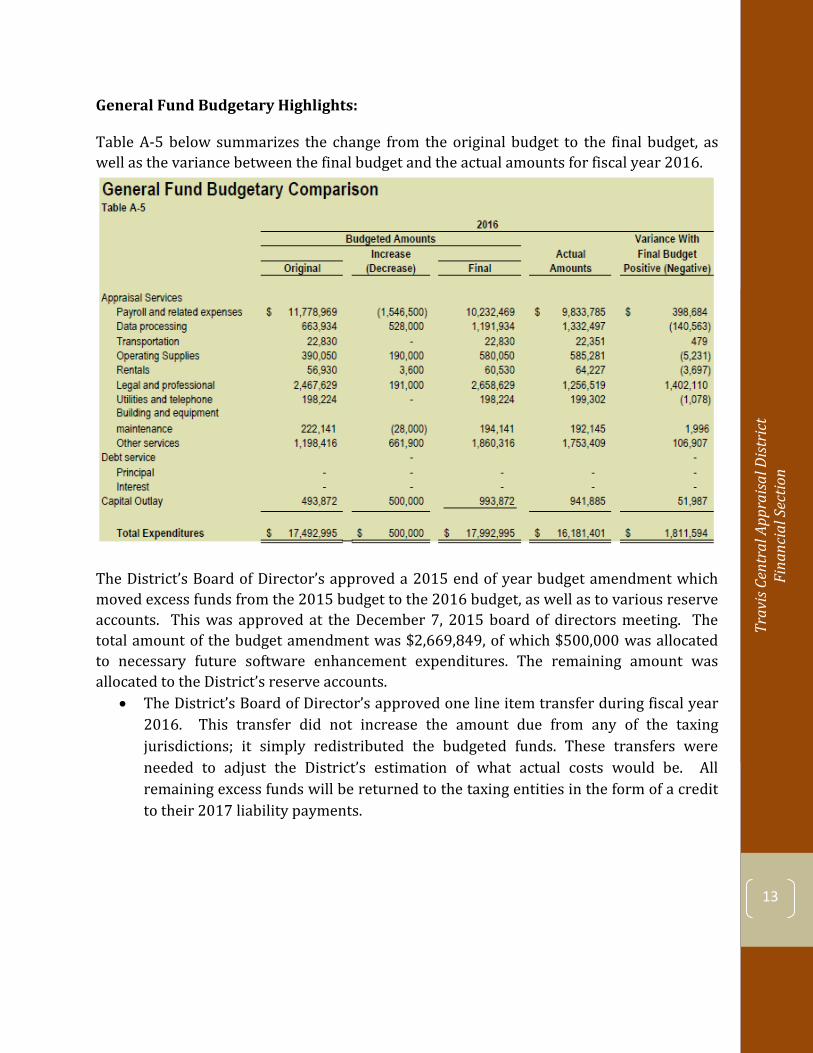
General Fund Budgetary Highlights:
Table A-5 below summarizes the change from the original budget to the final budget, as well as the variance between the final budget and the actual amounts for fiscal year 2016.
The District’s Board of Director’s approved a 2015 end of year budget amendment which moved excess funds from the 2015 budget to the 2016 budget, as well as to various reserve accounts. This was approved at the December 7, 2015 board of directors meeting. The total amount of the budget amendment was $2,669,849, of which $500,000 was allocated to necessary future software enhancement expenditures. The remaining amount was allocated to the District’s reserve accounts.
• The District’s Board of Director’s approved one line item transfer during fiscal year 2016. This transfer did not increase the amount due from any of the taxing jurisdictions; it simply redistributed the budgeted funds. These transfers were needed to adjust the District’s estimation of what actual costs would be. All remaining excess funds will be returned to the taxing entities in the form of a credit to their 2017 liability payments.
Travis Central Appraisal District Financial Section
14
Land 25.3%
Building & Improvements
39.6%
Furniture & Equipment
35.2%
Capital Assets, Net of Accumulated Depreciation at December 31, 2016
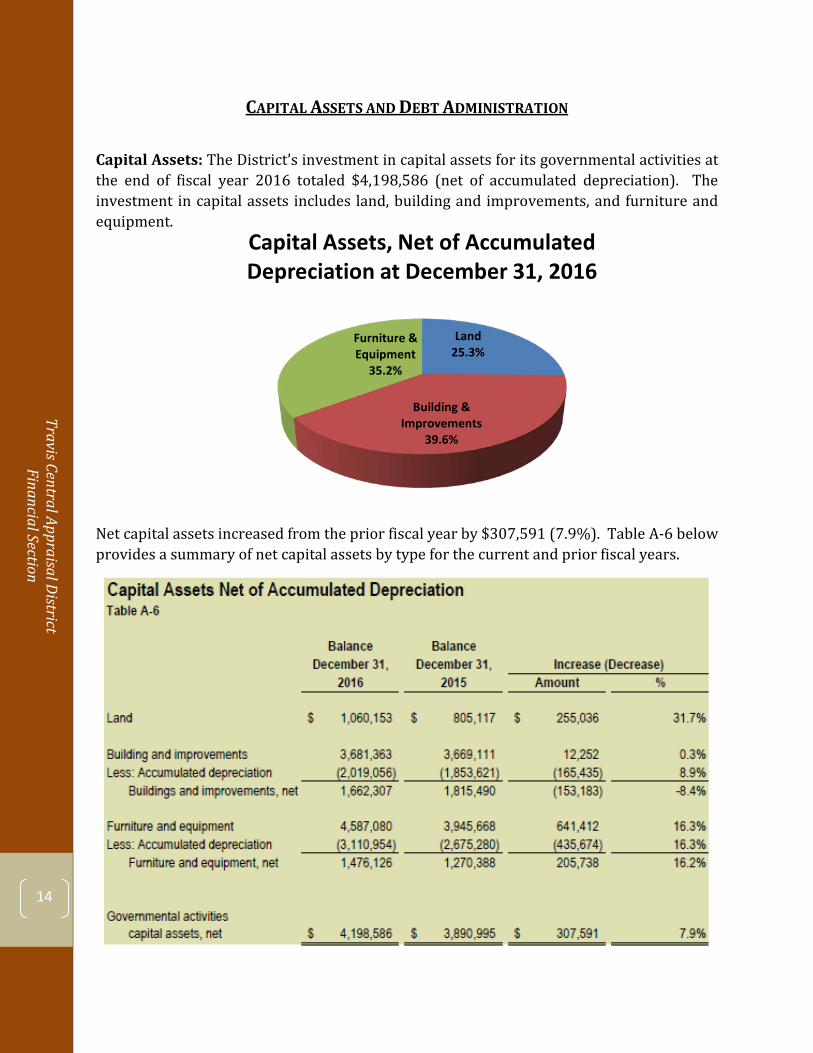
CAPITAL ASSETS AND DEBT ADMINISTRATION
Capital Assets: The District’s investment in capital assets for its governmental activities at the end of fiscal year 2016 totaled $4,198,586 (net of accumulated depreciation). The investment in capital assets includes land, building and improvements, and furniture and equipment.
Net capital assets increased from the prior fiscal year by $307,591 (7.9%). Table A-6 below provides a summary of net capital assets by type for the current and prior fiscal years.
Trav
is Ce
ntra
l App
raisa
l Dist
rict
Fi
nanc
ial S
ectio
n
15
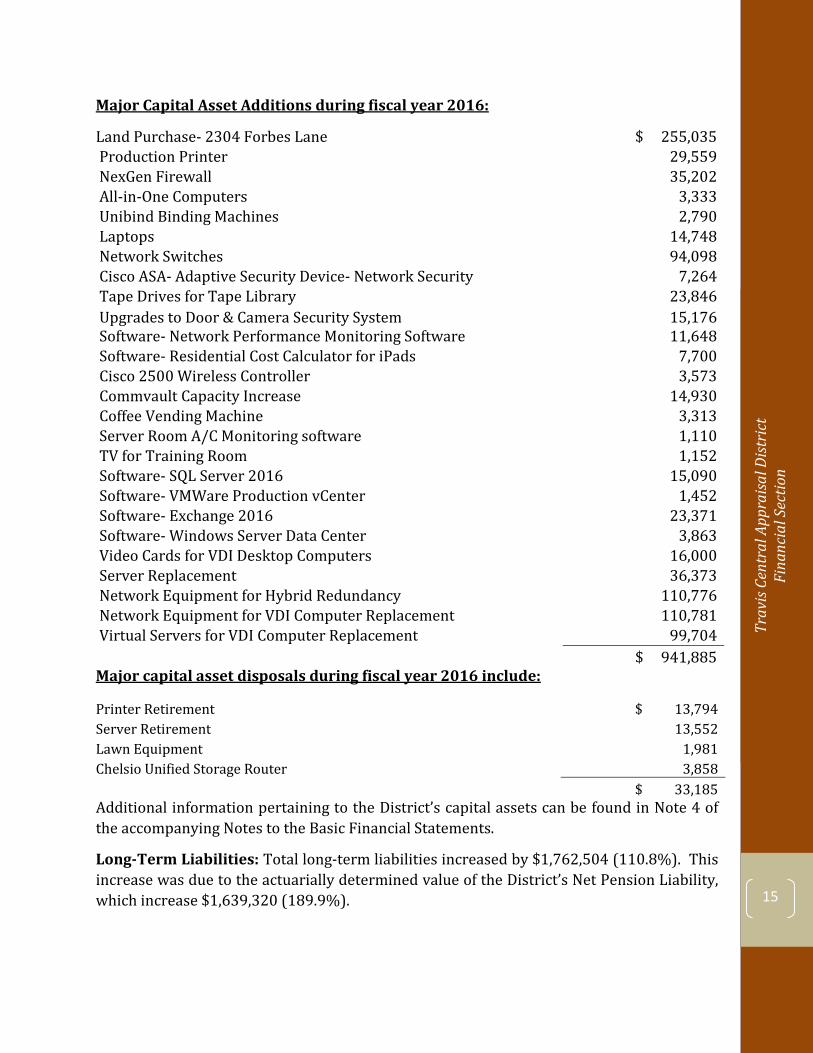
Major Capital Asset Additions during fiscal year 2016:
Land Purchase- 2304 Forbes Lane $ 255,035 Production Printer 29,559 NexGen Firewall 35,202 All-in-One Computers 3,333 Unibind Binding Machines 2,790 Laptops 14,748 Network Switches 94,098 Cisco ASA- Adaptive Security Device- Network Security 7,264 Tape Drives for Tape Library 23,846 Upgrades to Door & Camera Security System 15,176 Software- Network Performance Monitoring Software 11,648 Software- Residential Cost Calculator for iPads 7,700 Cisco 2500 Wireless Controller 3,573 Commvault Capacity Increase 14,930 Coffee Vending Machine 3,313 Server Room A/C Monitoring software 1,110 TV for Training Room 1,152 Software- SQL Server 2016 15,090 Software- VMWare Production vCenter 1,452 Software- Exchange 2016 23,371 Software- Windows Server Data Center 3,863 Video Cards for VDI Desktop Computers 16,000 Server Replacement 36,373 Network Equipment for Hybrid Redundancy 110,776 Network Equipment for VDI Computer Replacement 110,781 Virtual Servers for VDI Computer Replacement 99,704
$ 941,885
Major capital asset disposals during fiscal year 2016 include:
Printer Retirement $ 13,794 Server Retirement 13,552 Lawn Equipment 1,981 Chelsio Unified Storage Router 3,858
$ 33,185
Additional information pertaining to the District’s capital assets can be found in Note 4 of the accompanying Notes to the Basic Financial Statements.
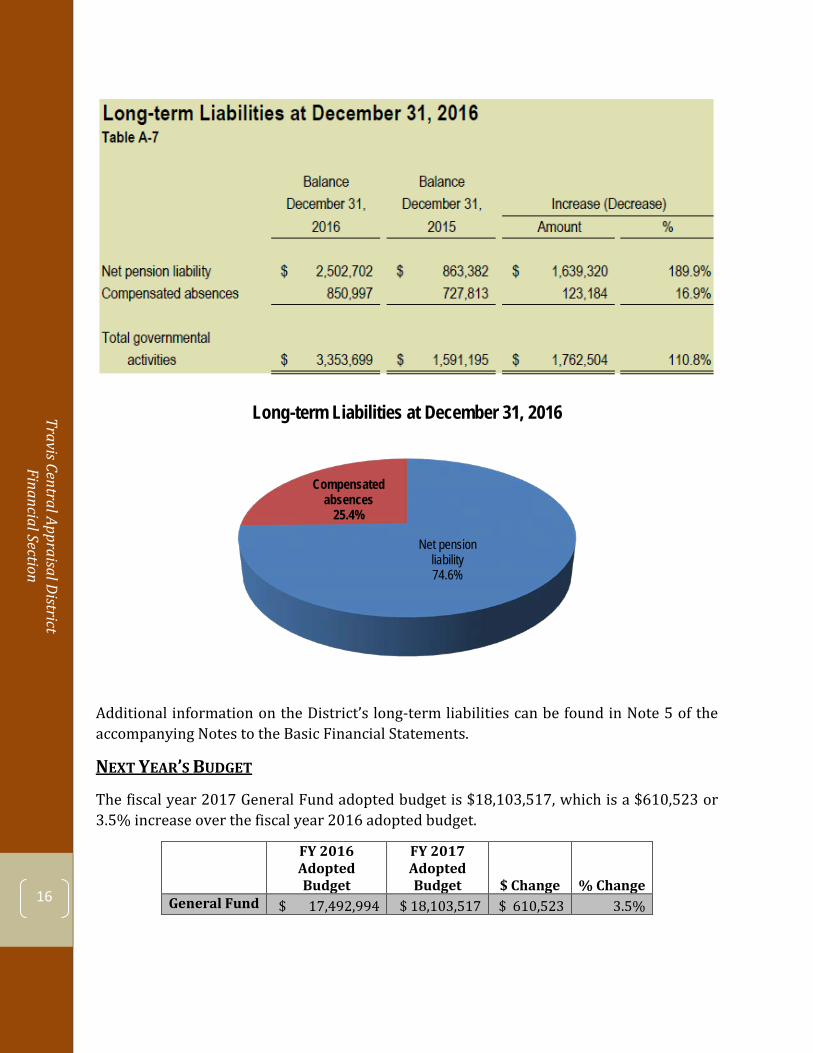
Long-Term Liabilities: Total long-term liabilities increased by $1,762,504 (110.8%). This increase was due to the actuarially determined value of the District’s Net Pension Liability, which increase $1,639,320 (189.9%).
Travis Central Appraisal District Financial Section
16
Additional information on the District’s long-term liabilities can be found in Note 5 of the accompanying Notes to the Basic Financial Statements.
NEXT YEAR’S BUDGET
The fiscal year 2017 General Fund adopted budget is $18,103,517, which is a $610,523 or 3.5% increase over the fiscal year 2016 adopted budget.
FY 2016 Adopted Budget
FY 2017 Adopted Budget $ Change % Change
General Fund $ 17,492,994 $ 18,103,517 $ 610,523 3.5%
Net pension liability 74.6%
Compensated absences
25.4%
Long-term Liabilities at December 31, 2016
Trav
is Ce
ntra
l App
raisa
l Dist
rict
Fi
nanc
ial S
ectio
n
17
The net increase reflects the impact of the following:
• 353.1% increase in seasonal and temporary expenditures for the increased costassociated with hiring temporary workers instead of full-time employees of theDistrict. This increase is cost is offset by the reduction in benefit costs
• 19.5% increase in legal and professional expenditures to cover the anticipatedincreased litigation costs associated with the taxing unit challenge and thenecessary increase to more aggressively defend the District’s values
• 175.1% increase in aerial photography for the higher quality images and changefinder software necessary to complete the desktop review process
• 20.59% decrease in appraisal services because the District decreased the number offee appraisals to be completed during fiscal year 2016
• 71.5% decrease in professional services for the removal of the expert review of highvalue properties that was conducted during the 2015 fiscal year
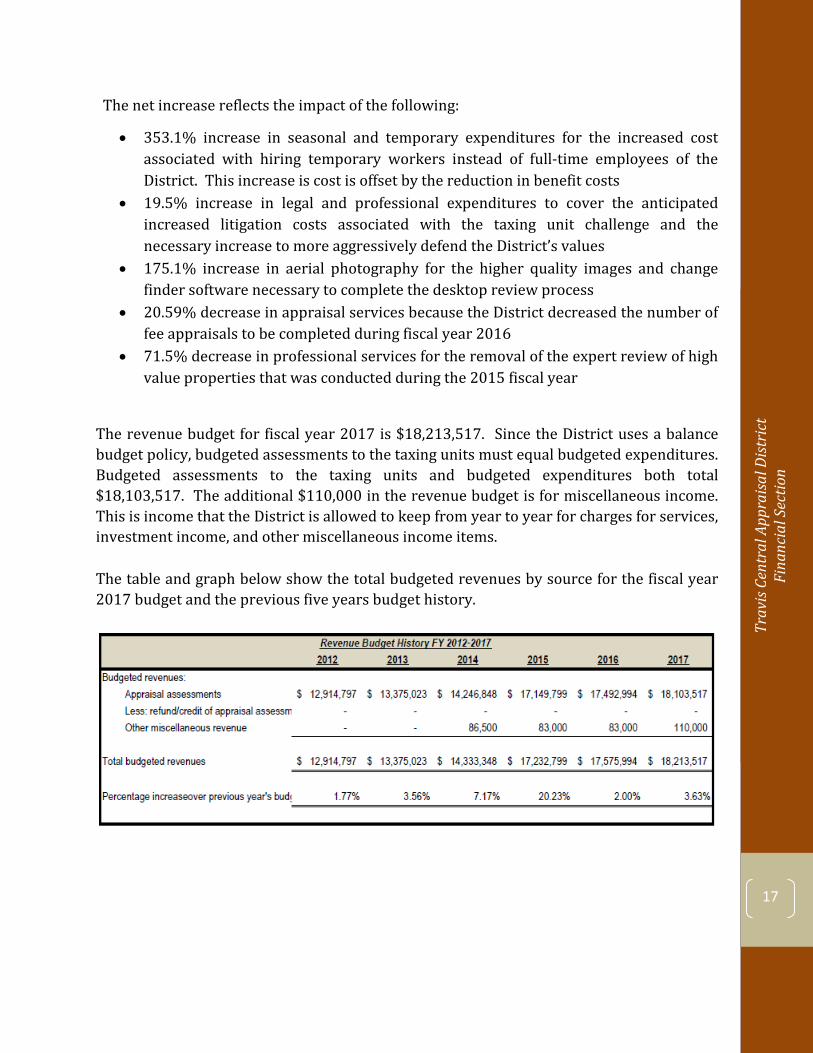
The revenue budget for fiscal year 2017 is $18,213,517. Since the District uses a balance budget policy, budgeted assessments to the taxing units must equal budgeted expenditures. Budgeted assessments to the taxing units and budgeted expenditures both total $18,103,517. The additional $110,000 in the revenue budget is for miscellaneous income. This is income that the District is allowed to keep from year to year for charges for services, investment income, and other miscellaneous income items.
The table and graph below show the total budgeted revenues by source for the fiscal year 2017 budget and the previous five years budget history.
Travis Central Appraisal District Financial Section
18
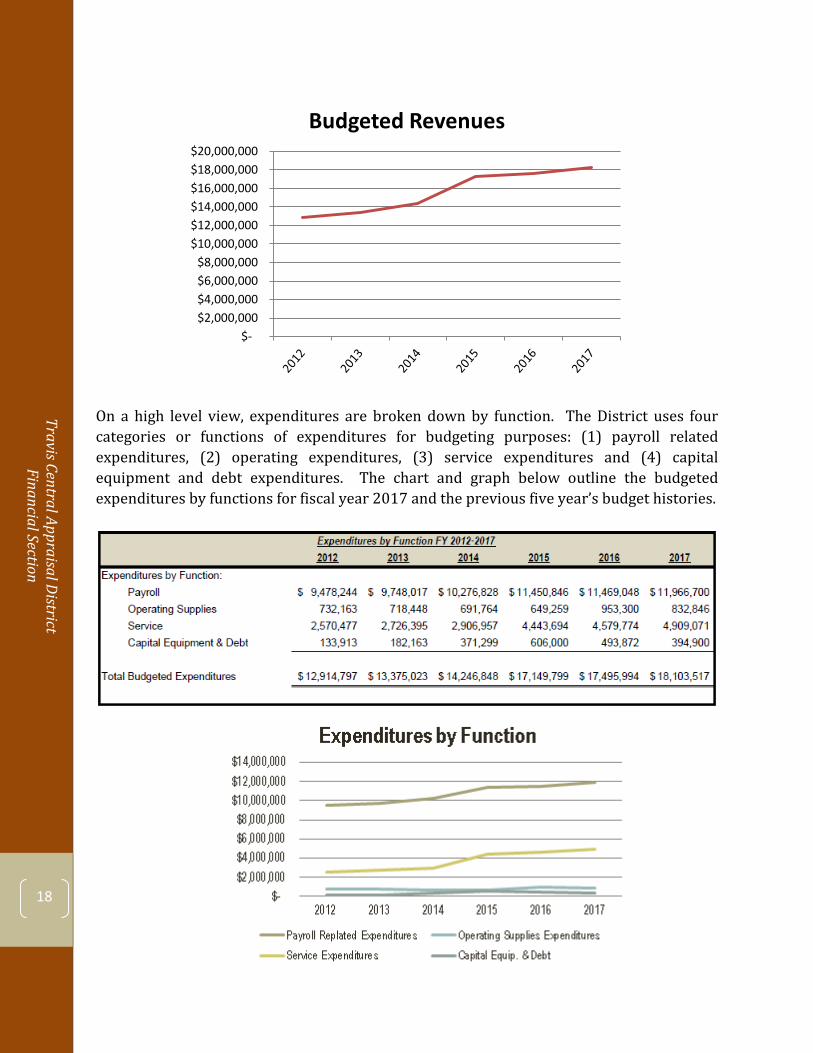
On a high level view, expenditures are broken down by function. The District uses four categories or functions of expenditures for budgeting purposes: (1) payroll related expenditures, (2) operating expenditures, (3) service expenditures and (4) capital equipment and debt expenditures. The chart and graph below outline the budgeted expenditures by functions for fiscal year 2017 and the previous five year’s budget histories.
$- $2,000,000 $4,000,000 $6,000,000 $8,000,000
$10,000,000 $12,000,000 $14,000,000 $16,000,000 $18,000,000 $20,000,000
Budgeted Revenues
Trav
is Ce
ntra
l App
raisa
l Dist
rict
Fi
nanc
ial S
ectio
n
19
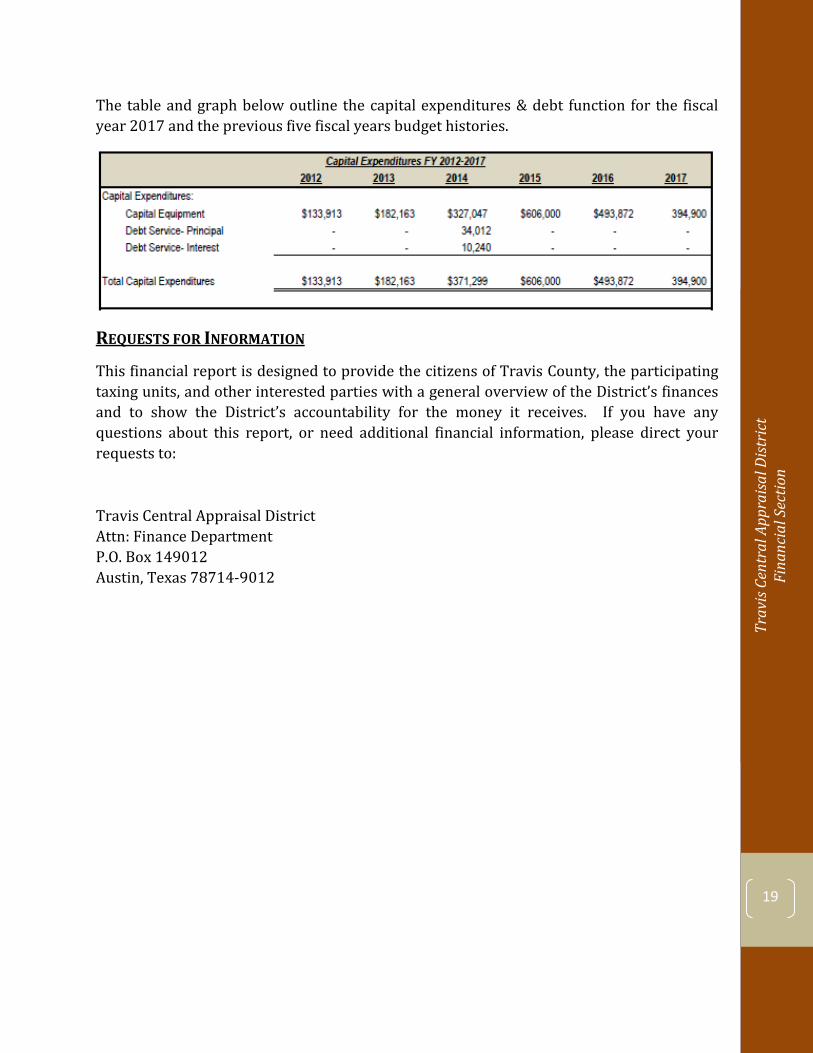
The table and graph below outline the capital expenditures & debt function for the fiscal year 2017 and the previous five fiscal years budget histories.
REQUESTS FOR INFORMATION
This financial report is designed to provide the citizens of Travis County, the participating taxing units, and other interested parties with a general overview of the District’s finances and to show the District’s accountability for the money it receives. If you have any questions about this report, or need additional financial information, please direct your requests to:
Travis Central Appraisal District Attn: Finance Department P.O. Box 149012 Austin, Texas 78714-9012
Travis Central Appraisal District Financial Section
20

Trav
is Ce
ntra
l App
raisa
l Dist
rict
Fi
nanc
ial S
ectio
n
21
GOVERNMENT-WIDE FINANCIAL STATEMENTS
Travis Central Appraisal District Financial Section
22
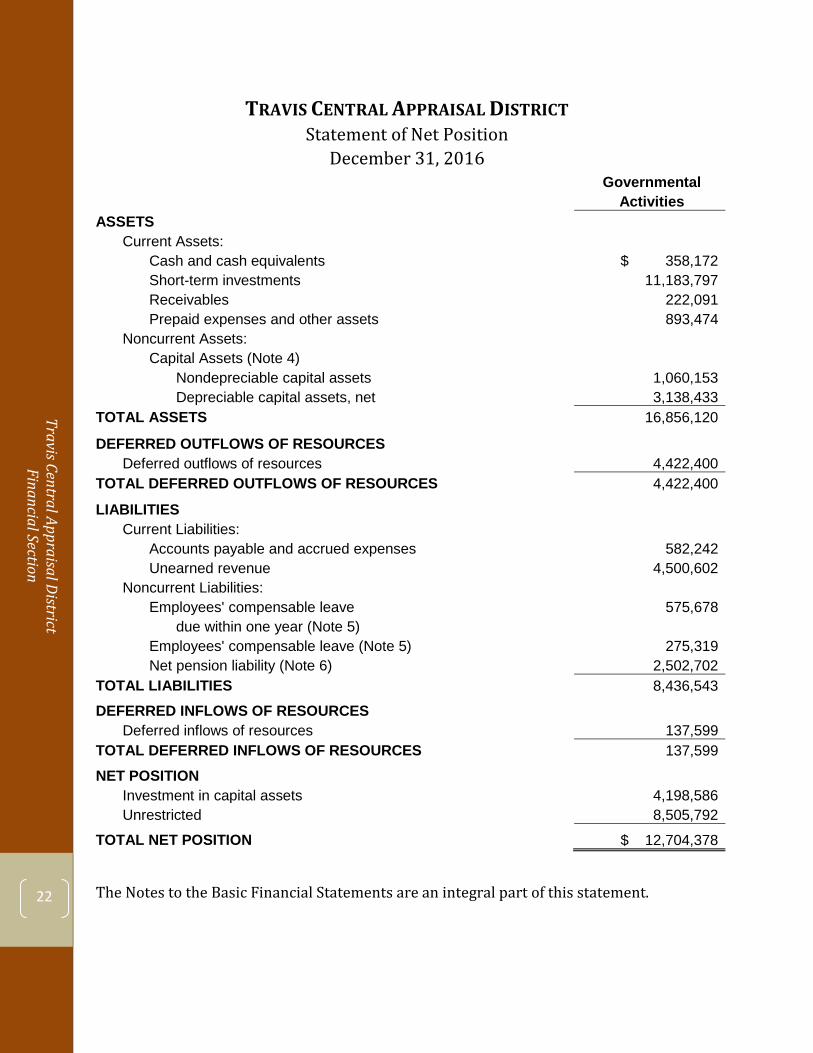
TRAVIS CENTRAL APPRAISAL DISTRICT Statement of Net Position
December 31, 2016 Governmental
Activities ASSETS
Current Assets: Cash and cash equivalents $ 358,172 Short-term investments 11,183,797 Receivables 222,091 Prepaid expenses and other assets 893,474
Noncurrent Assets: Capital Assets (Note 4)
Nondepreciable capital assets 1,060,153 Depreciable capital assets, net 3,138,433
TOTAL ASSETS 16,856,120
DEFERRED OUTFLOWS OF RESOURCES Deferred outflows of resources 4,422,400
TOTAL DEFERRED OUTFLOWS OF RESOURCES 4,422,400
LIABILITIES Current Liabilities:
Accounts payable and accrued expenses 582,242 Unearned revenue 4,500,602
Noncurrent Liabilities: Employees' compensable leave 575,678
due within one year (Note 5) Employees' compensable leave (Note 5) 275,319 Net pension liability (Note 6) 2,502,702
TOTAL LIABILITIES 8,436,543
DEFERRED INFLOWS OF RESOURCES Deferred inflows of resources 137,599
TOTAL DEFERRED INFLOWS OF RESOURCES 137,599
NET POSITION Investment in capital assets 4,198,586 Unrestricted 8,505,792
TOTAL NET POSITION $ 12,704,378
The Notes to the Basic Financial Statements are an integral part of this statement.
Trav
is Ce
ntra
l App
raisa
l Dist
rict
Fi
nanc
ial S
ectio
n
23
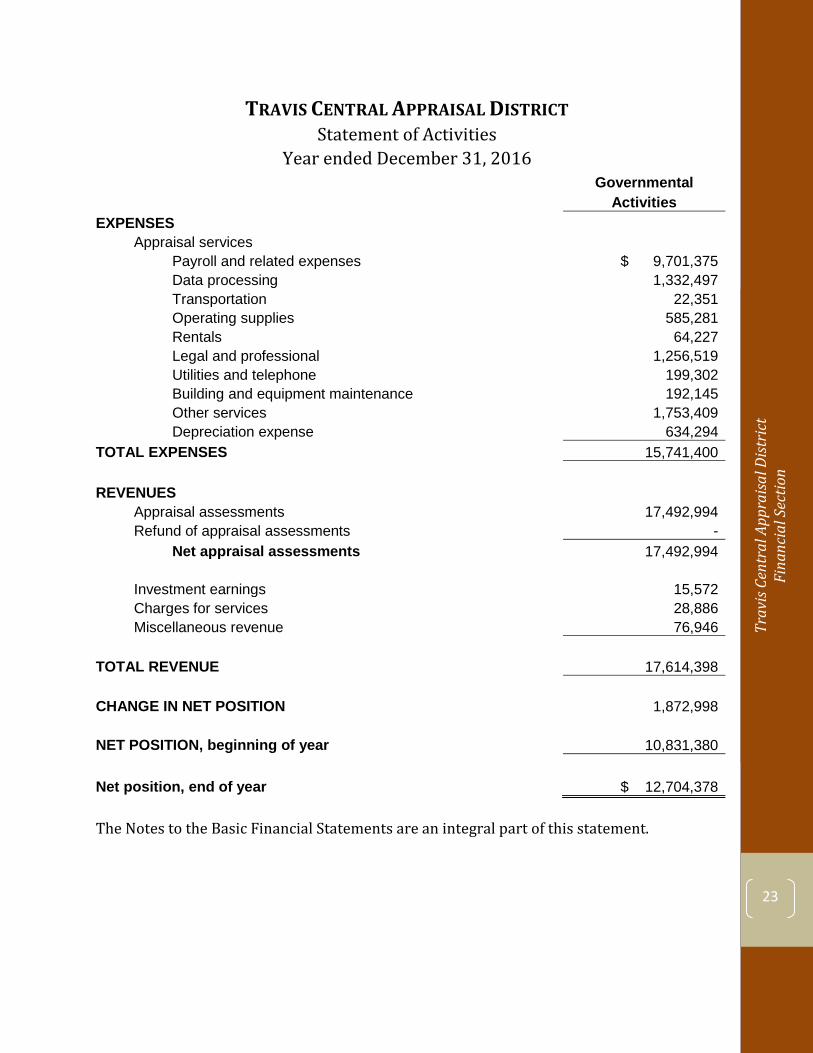
TRAVIS CENTRAL APPRAISAL DISTRICT Statement of Activities
Year ended December 31, 2016 Governmental
Activities EXPENSES
Appraisal services Payroll and related expenses $ 9,701,375 Data processing 1,332,497 Transportation 22,351 Operating supplies 585,281 Rentals 64,227 Legal and professional 1,256,519 Utilities and telephone 199,302 Building and equipment maintenance 192,145 Other services 1,753,409 Depreciation expense 634,294
TOTAL EXPENSES 15,741,400
REVENUES Appraisal assessments 17,492,994 Refund of appraisal assessments -
Net appraisal assessments 17,492,994
Investment earnings 15,572 Charges for services 28,886 Miscellaneous revenue 76,946
TOTAL REVENUE 17,614,398
CHANGE IN NET POSITION 1,872,998
NET POSITION, beginning of year 10,831,380
Net position, end of year $ 12,704,378
The Notes to the Basic Financial Statements are an integral part of this statement.

Travis Central Appraisal District Financial Section
24
Trav
is Ce
ntra
l App
raisa
l Dist
rict
Fi
nanc
ial S
ectio
n
25
FUND FINANCIAL STATEMENTS
Travis Central Appraisal District Financial Section
26
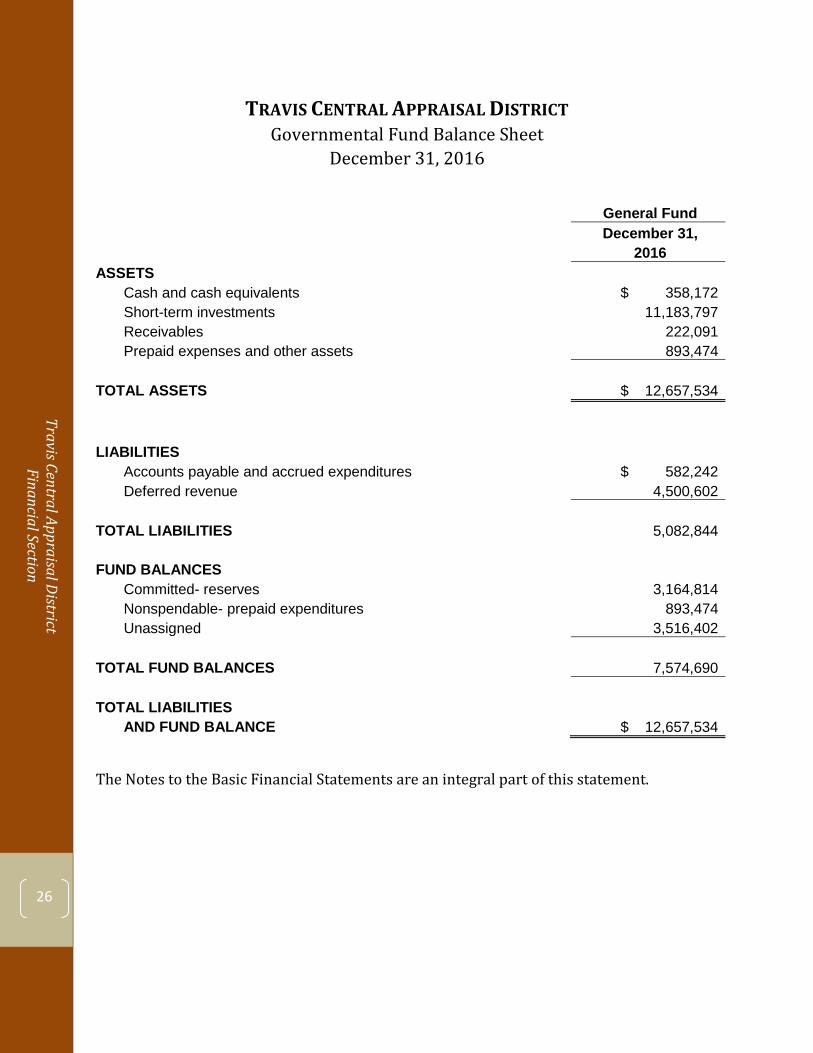
TRAVIS CENTRAL APPRAISAL DISTRICT Governmental Fund Balance Sheet
December 31, 2016
General Fund December 31,
2016 ASSETS
Cash and cash equivalents $ 358,172 Short-term investments 11,183,797 Receivables 222,091 Prepaid expenses and other assets 893,474
TOTAL ASSETS $ 12,657,534
LIABILITIES Accounts payable and accrued expenditures $ 582,242 Deferred revenue 4,500,602
TOTAL LIABILITIES 5,082,844
FUND BALANCES Committed- reserves 3,164,814 Nonspendable- prepaid expenditures 893,474 Unassigned 3,516,402
TOTAL FUND BALANCES 7,574,690
TOTAL LIABILITIES AND FUND BALANCE $ 12,657,534
The Notes to the Basic Financial Statements are an integral part of this statement.
Trav
is Ce
ntra
l App
raisa
l Dist
rict
Fi
nanc
ial S
ectio
n
27
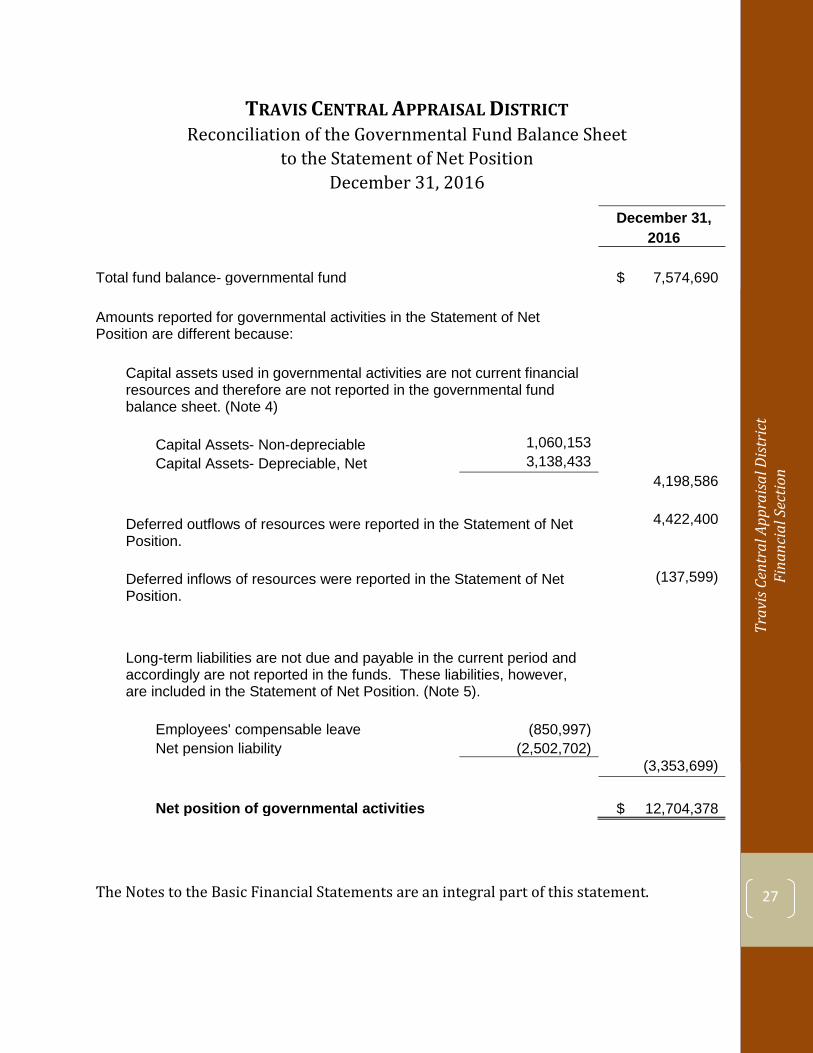
TRAVIS CENTRAL APPRAISAL DISTRICT Reconciliation of the Governmental Fund Balance Sheet
to the Statement of Net Position December 31, 2016
December 31,
2016
Total fund balance- governmental fund
$ 7,574,690
Amounts reported for governmental activities in the Statement of Net Position are different because:
Capital assets used in governmental activities are not current financial resources and therefore are not reported in the governmental fund balance sheet. (Note 4)
Capital Assets- Non-depreciable
1,060,153
Capital Assets- Depreciable, Net
3,138,433
4,198,586
Deferred outflows of resources were reported in the Statement of Net Position.
4,422,400
Deferred inflows of resources were reported in the Statement of Net Position.
(137,599)
Long-term liabilities are not due and payable in the current period and
accordingly are not reported in the funds. These liabilities, however, are included in the Statement of Net Position. (Note 5).
Employees' compensable leave
(850,997)
Net pension liability
(2,502,702)
(3,353,699)
Net position of governmental activities $ 12,704,378
The Notes to the Basic Financial Statements are an integral part of this statement.
Travis Central Appraisal District Financial Section
28
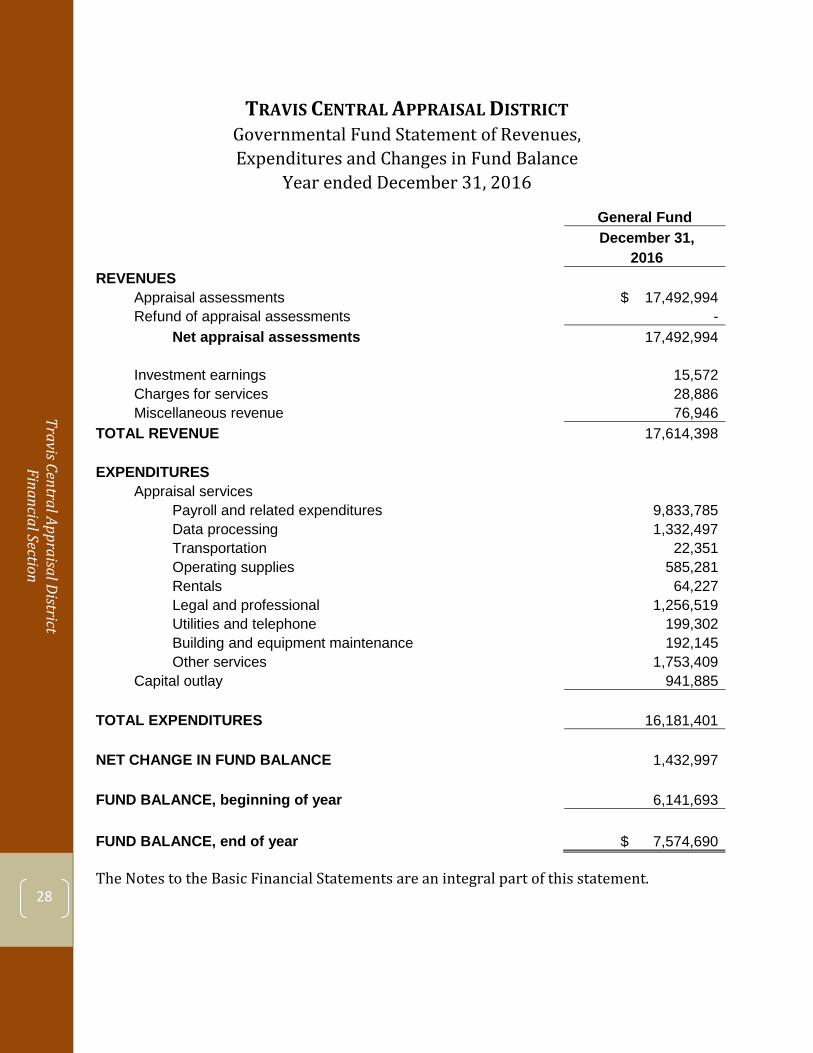
TRAVIS CENTRAL APPRAISAL DISTRICT Governmental Fund Statement of Revenues, Expenditures and Changes in Fund Balance
Year ended December 31, 2016
General Fund December 31,
2016 REVENUES
Appraisal assessments $ 17,492,994 Refund of appraisal assessments -
Net appraisal assessments 17,492,994
Investment earnings 15,572 Charges for services 28,886 Miscellaneous revenue 76,946
TOTAL REVENUE 17,614,398
EXPENDITURES Appraisal services
Payroll and related expenditures 9,833,785 Data processing 1,332,497 Transportation 22,351 Operating supplies 585,281 Rentals 64,227 Legal and professional 1,256,519 Utilities and telephone 199,302 Building and equipment maintenance 192,145 Other services 1,753,409
Capital outlay 941,885
TOTAL EXPENDITURES 16,181,401
NET CHANGE IN FUND BALANCE 1,432,997
FUND BALANCE, beginning of year 6,141,693
FUND BALANCE, end of year $ 7,574,690
The Notes to the Basic Financial Statements are an integral part of this statement.
Trav
is Ce
ntra
l App
raisa
l Dist
rict
Fi
nanc
ial S
ectio
n
29
TRAVIS CENTRAL APPRAISAL DISTRICT Reconciliation of the Statement of Revenues, Expenditures and Changes in
Fund Balance of the Governmental Fund to the Statement of Activities Year ended December 31, 2016
December 31, 2016
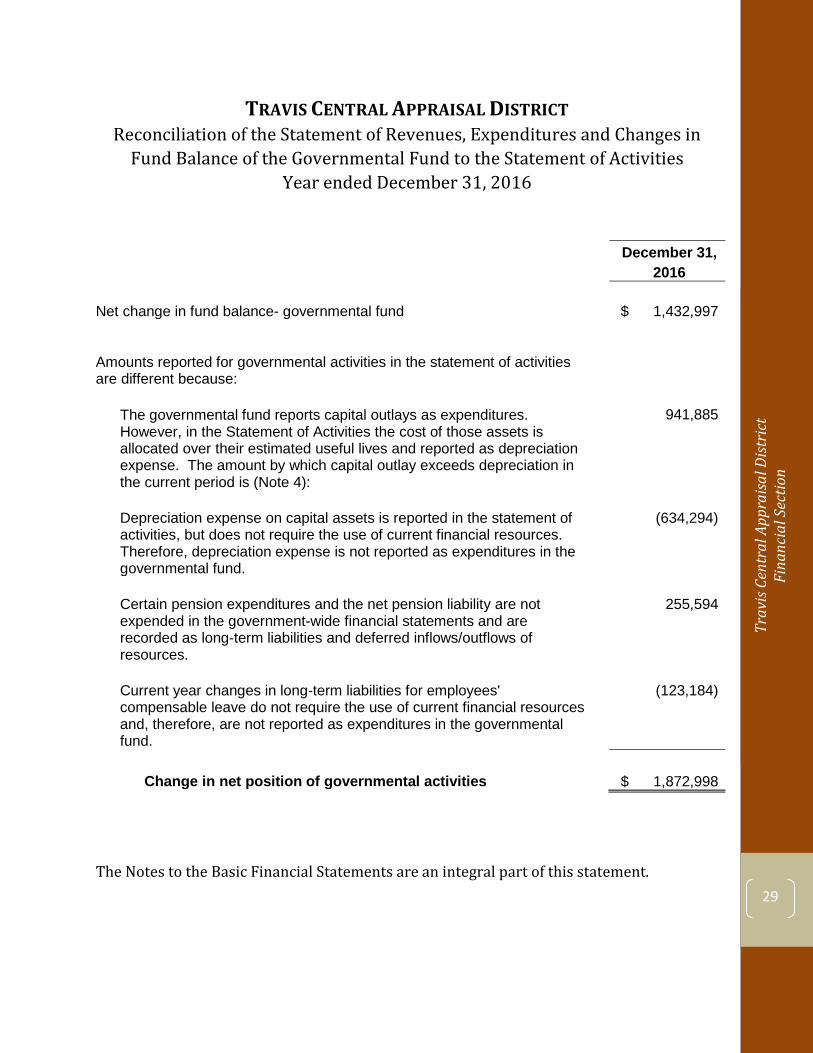
Net change in fund balance- governmental fund $ 1,432,997
Amounts reported for governmental activities in the statement of activities are different because:
The governmental fund reports capital outlays as expenditures. However, in the Statement of Activities the cost of those assets is allocated over their estimated useful lives and reported as depreciation expense. The amount by which capital outlay exceeds depreciation in the current period is (Note 4):
941,885
Depreciation expense on capital assets is reported in the statement of activities, but does not require the use of current financial resources. Therefore, depreciation expense is not reported as expenditures in the governmental fund.
(634,294)
Certain pension expenditures and the net pension liability are not expended in the government-wide financial statements and are recorded as long-term liabilities and deferred inflows/outflows of resources.
255,594
Current year changes in long-term liabilities for employees' compensable leave do not require the use of current financial resources and, therefore, are not reported as expenditures in the governmental fund.
(123,184)
Change in net position of governmental activities $ 1,872,998
The Notes to the Basic Financial Statements are an integral part of this statement.

Travis Central Appraisal District Financial Section
30
Trav
is Ce
ntra
l App
raisa
l Dist
rict
Fi
nanc
ial S
ectio
n
31
NOTES TO THE BASIC FINANCIAL STATEMENTS
Travis Central Appraisal District Financial Section
32
TRAVIS CENTRAL APPRAISAL DISTRICT Notes to the Basic Financial Statements
December 31, 2016
Note 1:
Note 2:
Note 3:
Note 4:
Note 5:
Note 6:
Note 7:
Note 8:
Summary of Significant Accounting Policies
Deposits and Investments
Receivables
Capital Assets
Long-term Liabilities
Defined Benefit Pension Plan
Commitments and Contingencies
Risk Management
Page
33
39
41
42
43
43
52
53
33
Trav
is Ce
ntra
l App
raisa
l Dist
rict
Fi
nanc
ial S
ectio
n
TRAVIS CENTRAL APPRAISAL DISTRICT Notes to the Basic Financial Statements
NOTE 1. SUMMARY OF SIGNIFICANT ACCOUNTING POLICIES
General
Travis Central Appraisal District (the District) was created by the 66th Texas State Legislature in 1979 under the provisions of Senate Bill 621 known as the Property Tax Code. The District is responsible for the appraisal of property subject to ad valorem taxation in Travis County, Texas. The District was formed in 1981 and began operations in 1982.
The District is governed by a board of nine directors serving two year terms, plus a tenth statutorily designated non-voting member who is the county tax assessor-collector. Travis County appoints two board members, Austin ISD appoints two board members, City of Austin appoints two board members, and Austin ISD and City of Austin appoint one board member together. The remaining two board members are appointed by a vote of the eastern and western taxing entities within Travis County.
Reporting Entity
For financial reporting purposes, management has considered all potential component units. The decision to include a potential component unit in the reporting entity was made by applying the criteria set forth in U.S. Generally Accepted Accounting Principles. The criteria used are as follows:
Financial Accountability- The primary government is deemed to be financially accountable if it appoints a voting majority of the organization’s governing body and (1) it is able to impose its will on that organization or (2) there is a potential for the organization to provide specific financial benefits to, or impose significant financial burdens on, the primary government. Additionally, the primary government may be financially accountable if an organization is fiscally dependent on the primary government regardless of whether the organization has a separately elected governing board, a governing board appointed by a higher level of government or a jointly appointed board.
There are no entities that are potential component units based upon the criteria above.
Travis Central Appraisal District Financial Section
34
NOTE 1. SUMMARY OF SIGNIFICANT ACCOUNTING POLICIES- CONTINUED
Basis of Presentation
In accordance with required reporting standards, the District reports its financial activities as a special-purpose government. Special-purpose governments are governmental entities which engage in a single governmental program. The government-wide financial statements report information on all the activities of the District. Governmental activities generally are financed through charges for services and intergovernmental revenues. The statement of activities reflects the revenues and expenses of the District. The fund financial statements provide information about the District’s governmental fund. The emphasis of fund financial statements is directed to specific activities of the District. The District reports the general fund as a major governmental fund. It is the District’s primary operating fund. This fund is used to account for the acquisition and use of the District’s expendable financial resources and the related liabilities. The measurement focus is based on the determination of changes in financial position rather than upon net income determination.
Measurement Focus/Basis of Accounting Measurement focus refers to what is being measured; basis of accounting refers to when revenues and expenditures are recognized in the accounts and reported in the financial statements. Basis of accounting relates to the timing of the measurement made, regardless of the measurement focus applied. The government-wide statements are reported using the economic resources measurement focus and the accrual basis of accounting. The economic resources measurement focus means all assets and liabilities (whether current or non-current) are included on the statement of net position and the operating statements present increases (revenues) and decreases (expenses) in total net position. Under the accrual basis of accounting, revenues are recognized when earned. Expenses are recognized at the time the liability is incurred.
35
Trav
is Ce
ntra
l App
raisa
l Dist
rict
Fi
nanc
ial S
ectio
n
NOTE 1. SUMMARY OF SIGNIFICANT ACCOUNTING POLICIES- CONTINUED
Governmental fund financial statements are reported using the current financial resources measurement focus and are accounted for using the modified accrual basis of accounting. Under the modified accrual basis of accounting, revenues are recognized when susceptible to accrual; i.e., when they become both measurable and available. “Measurable” means the amount of the transaction can be determined and “available” means collectible within the current period or soon enough thereafter (sixty days) to be used to pay liabilities of the current period. Expenditures are recorded when the related fund liability is incurred. However, debt service expenditures, as well as expenditures related to long-term liabilities are recorded only when payment is due.
Assessments and sales of public information materials are recognized under the susceptible to accrual concept. Interest income is recorded as earned, since it is measurable and available.
Budgetary Control
The annual budget for the General Fund must be prepared and adopted by the Board of Directors prior to the expenditure of funds.
Beginning in March, the budget goals and guidelines are established by the Chief Appraiser and the Board of Directors. Each department is requested to submit budgets based on goals established for the budget year. The budget includes proposed expenditures and the means of financing them. Public hearings are held for citizen comments. The Board of Directors approves the final budget through passage of a resolution and establishes the annual assessment due from taxing jurisdictions.
The District prepares its fund budget on a GAAP basis. The Chief Appraiser is authorized to transfer amounts between departments within the General Fund; however, revisions that alter total General Fund expenditures must be approved by the Board of Directors and the taxing jurisdictions. In 2015, the taxing entities approved a supplemental appropriation of 2015 surplus funds to the 2016 budget in the amount of $500,000. Unexpended appropriations lapse at year-end. The taxing entities also approved an appropriation of 2015 surplus funds to the District’s reserve accounts in the amount of $2,169,849. In December 2016, the taxing entities approved the appropriation of $1,000,000 in 2016 legal and professional surplus budget funds transferred to the litigation reserve through the budget amendment process.
Travis Central Appraisal District Financial Section
36
NOTE 1. SUMMARY OF SIGNIFICANT ACCOUNTING POLICIES- CONTINUED
Investments
Investments are stated at fair value, with the exception of investments in local government investment pools. The carrying value of investments in local government investment pools is determined by the valuation policy of the local government investment pool. The District is authorized to invest in certificates of deposit at the District’s depository bank, obligations of the United States of America, no-load money market mutual funds with an average stated maturity of 90 days or less, investment pools and certain other investments which meet the conditions of the State of Texas Public Funds Investment Act.
Assessments
If the District accumulates unreserved and undesignated excess funds, the Board of Directors shall refund the excess to the taxing entities. In addition, state law requires the District to refund any assessment revenue in excess of expenditures. During the fiscal year ending December 31, 2016, the District made no refunds of excess funds to the taxing entities.
Capital Assets
Capital assets, which include land, building and improvements, and furniture and equipment, are reported in the government-wide financial statements. All capital assets are valued at historical cost or estimated historical cost if actual historical cost is not available. Donated assets are valued at their acquisition value on the date donated. Repairs and maintenance are recorded as expenses.
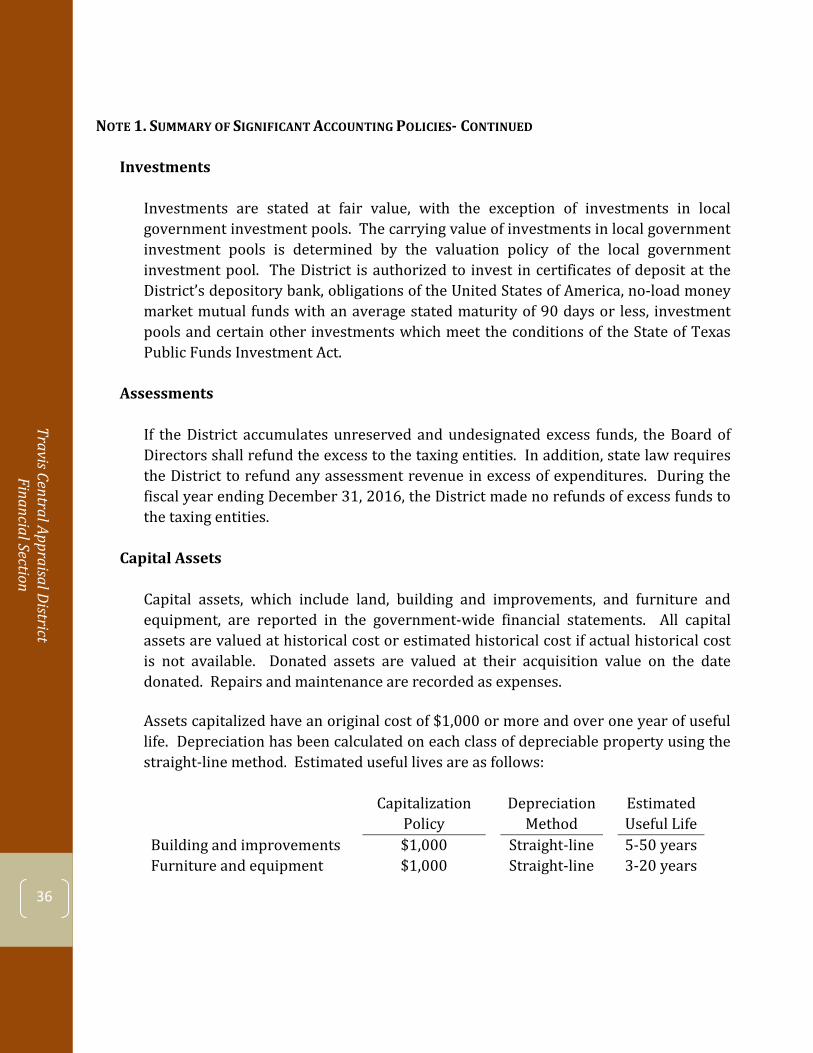
Assets capitalized have an original cost of $1,000 or more and over one year of useful life. Depreciation has been calculated on each class of depreciable property using the straight-line method. Estimated useful lives are as follows:
Capitalization Depreciation Estimated
Policy Method Useful Life
Building and improvements $1,000 Straight-line 5-50 years Furniture and equipment $1,000 Straight-line 3-20 years
37
Trav
is Ce
ntra
l App
raisa
l Dist
rict
Fi
nanc
ial S
ectio
n
NOTE 1. SUMMARY OF SIGNIFICANT ACCOUNTING POLICIES- CONTINUED
Compensated Absences
All full-time employees are granted vacation and sick leave benefits in varying amounts. In the event of termination, an employee is entitled to receive accumulated vacation pay and vested accumulated sick pay in a lump sum cash payment. Accumulated vacation pay and vested sick pay for all full-time employees are recorded in the government-wide statement of net position.
Prepaid Items
Prepaid balances are for payments made by the District in the current year to provide services in the subsequent fiscal year. The District uses the consumption method with regards to the treatment of prepaid items. When using the consumption method, the District recognizes the prepayment as an expenditure proportionately over the periods that service is provided.
Pensions
For purposes of measuring the net pension liability, deferred outflows of resources and deferred inflows of resources related to pensions, and pension expense, information about the fiduciary net position of the Texas County and District Retirement System (TCDRS) and additions to/deductions from TCDRS’s fiduciary net position have been determined on the same basis as they are reported for TCDRS. For this purpose, benefit payments are recognized when due and payable in accordance with the benefit terms. Investments are reported at fair value.
Deferred Inflows/Outflows of Resources
Deferred outflows of resources represent a consumption of net position that applies to a future period(s) and is not recognized as an outflow of resources (expense/expenditure) until then. The District records pension contributions after the measurement date, the difference in projected and actual earnings on pension assets, changes in assumptions, and differences between expected and actual experience as deferred outflows of resources. Deferred inflows of resources represent an acquisition of net position that applies to a future period(s) and is not recognized as an inflow of resources (revenue) until that time. The District records the difference between actual and projected experience as a deferred inflow of resources.
Travis Central Appraisal District Financial Section
38
NOTE 1. SUMMARY OF SIGNIFICANT ACCOUNTING POLICIES- CONTINUED
Net Position
Net position represents the difference between the total of assets and deferred outflows of resources and the total of liabilities and deferred inflows of resources. The net investment in capital assets component of net position consists of capital assets, net of accumulated depreciation, reduced by the outstanding balances of any borrowing used for the acquisition, construction or improvement of those assets, and adding back unspent proceeds. Net position is reported as restricted when there are limitations imposed on its use either through the enabling legislation adopted by the District or through external restrictions imposed by creditors, grantors, or laws and/or regulations of other governments.
Fund Balance Classification
Fund balance for the governmental fund is reported in classifications which are outlined in GASB Statement No. 54, Fund Balance Reporting and Governmental Fund Type Definitions (GASB 54). These classifications demonstrate the extent to which the District is bound by specific purposes for which funds can be spent. The governmental fund classifications are as follows:
Non-spendable- includes amounts that cannot be spent because they are either not in spendable form, or, for legal or contractual reasons, must be kept intact. This classification includes the District’s prepaid items. At December 31, 2016, the District had $893,474 in non-spendable fund balance.
Restricted- includes fund balance amounts that are constrained for specific purposes which are imposed by providers, such as creditors, or amounts restricted due to constitutional provisions or enabling legislation. This classification includes retirement of long-term debt, construction programs, and other federal and state grants. At December 31, 2016, the District had no restricted fund balance amounts.
Committed- includes fund balance amounts that are constrained for specific purposes that are internally imposed by the District through formal action in an open meeting of the highest level of decision making authority. Committed fund balance is reported pursuant to resolution passed by the Board of Directors. At December 31, 2016, the District had $3,164,814 in committed fund balance.
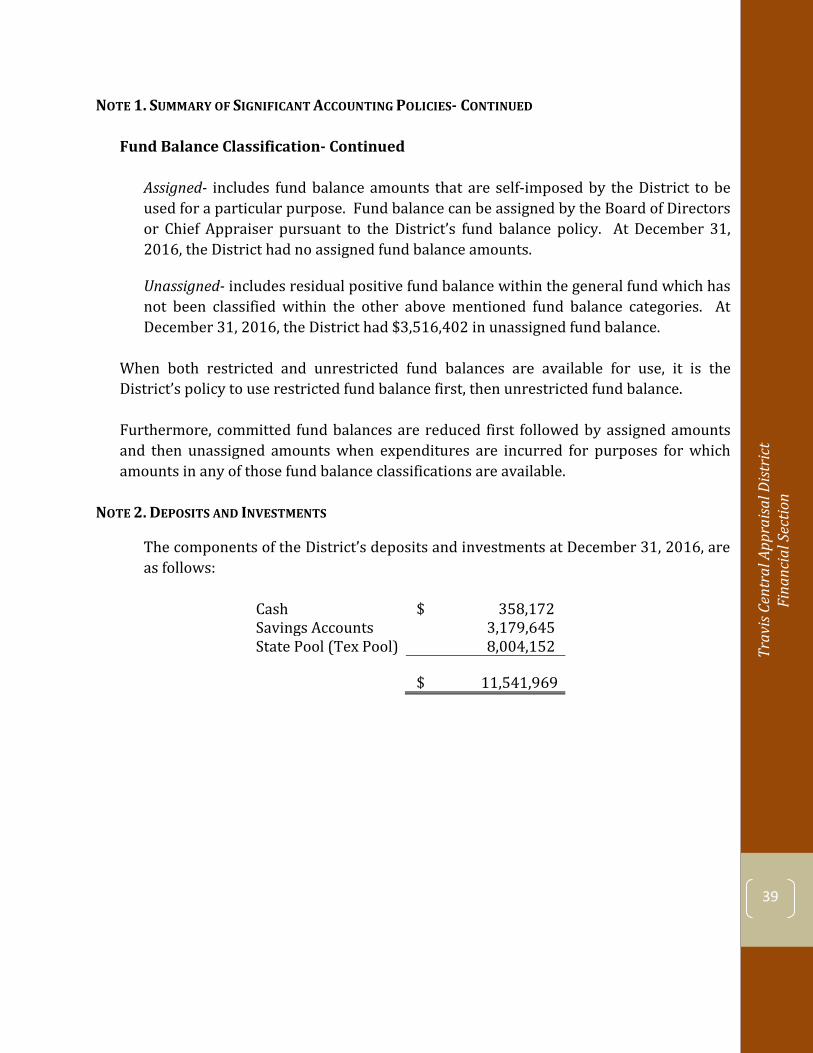
39
Trav
is Ce
ntra
l App
raisa
l Dist
rict
Fi
nanc
ial S
ectio
n
NOTE 1. SUMMARY OF SIGNIFICANT ACCOUNTING POLICIES- CONTINUED
Fund Balance Classification- Continued
Assigned- includes fund balance amounts that are self-imposed by the District to be used for a particular purpose. Fund balance can be assigned by the Board of Directors or Chief Appraiser pursuant to the District’s fund balance policy. At December 31, 2016, the District had no assigned fund balance amounts.
Unassigned- includes residual positive fund balance within the general fund which has not been classified within the other above mentioned fund balance categories. At December 31, 2016, the District had $3,516,402 in unassigned fund balance.
When both restricted and unrestricted fund balances are available for use, it is the District’s policy to use restricted fund balance first, then unrestricted fund balance.
Furthermore, committed fund balances are reduced first followed by assigned amounts and then unassigned amounts when expenditures are incurred for purposes for which amounts in any of those fund balance classifications are available.
NOTE 2. DEPOSITS AND INVESTMENTS
The components of the District’s deposits and investments at December 31, 2016, are as follows:
Cash $ 358,172 Savings Accounts 3,179,645 State Pool (Tex Pool) 8,004,152
$ 11,541,969
Travis Central Appraisal District Financial Section
40
NOTE 2. DEPOSITS AND INVESTMENTS- CONTINUED
Deposits
The District’s funds are required to be deposited and invested under the terms of a depository contract. The District’s agent bank approves pledged securities as collateral for bank deposits that exceed amounts covered by the Federal Deposit Insurance Corporation (“FDIC”) insurance coverage.
Custodial Credit Risk- Deposits. In the case of deposits, this is the risk that, in the event of the failure of a depository financial institution, a government will not be able to recover its deposits or will not be able to recover collateral securities that are in the possession of an outside party. At December 31, 2016, the District’s cash deposits were entirely covered by the FDIC insurance or by investments pledged as collateral. Therefore, the District is not exposed to custodial credit risk for its deposits.
Investments
Statutes of the State of Texas and policies mandated by the District’s Board of Directors authorize the District to invest obligations of the United States or its agencies and instrumentalities, direct obligations of the State of Texas or its agencies and instrumentalities, other obligations in which the principal and interest are unconditionally guaranteed or insured by the full faith and credit of this state or of the United States, joint investment pools of political subdivisions in the State of Texas, certificates of deposits issued by a depository institution that has its main office or branch office in Texas, and no-load money market mutual funds. During 2016, the District has invested only in the TexPool Government Investment Pool.
Custodial Credit Risk- Investment. For an investment, this is the risk that, in the event of the failure of the counterparty, the government will not be able to recover the value of its investments or collateral securities that are in possession of an outside party.
Credit Risk. This is the risk that an issuer of an investment will be unable to fulfill its obligations. The rating of securities by nationally recognized rating agencies is designed to give an indication of credit risk. The District’s investment policy limits investments in pooled investment funds to those rated not less than “AAA” or an equivalent rating by at least one nationally recognized rating service. As of December 31, 2016, the District’s investment in TexPool was rate “AAAm” by Standard & Poor’s, and therefore, meets the requirements of the District’s investment policy. Accordingly the District was not exposed to significant credit risk.
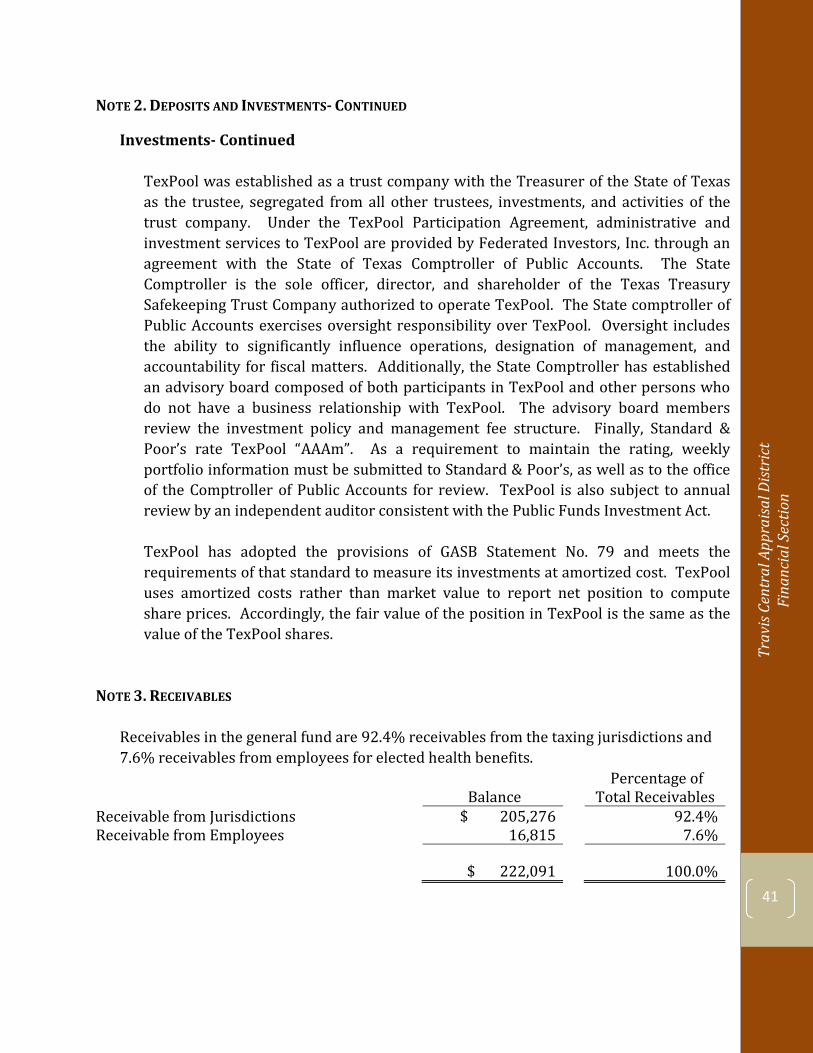
41
Trav
is Ce
ntra
l App
raisa
l Dist
rict
Fi
nanc
ial S
ectio
n
NOTE 2. DEPOSITS AND INVESTMENTS- CONTINUED
Investments- Continued
TexPool was established as a trust company with the Treasurer of the State of Texas as the trustee, segregated from all other trustees, investments, and activities of the trust company. Under the TexPool Participation Agreement, administrative and investment services to TexPool are provided by Federated Investors, Inc. through an agreement with the State of Texas Comptroller of Public Accounts. The State Comptroller is the sole officer, director, and shareholder of the Texas Treasury Safekeeping Trust Company authorized to operate TexPool. The State comptroller of Public Accounts exercises oversight responsibility over TexPool. Oversight includes the ability to significantly influence operations, designation of management, and accountability for fiscal matters. Additionally, the State Comptroller has established an advisory board composed of both participants in TexPool and other persons who do not have a business relationship with TexPool. The advisory board members review the investment policy and management fee structure. Finally, Standard & Poor’s rate TexPool “AAAm”. As a requirement to maintain the rating, weekly portfolio information must be submitted to Standard & Poor’s, as well as to the office of the Comptroller of Public Accounts for review. TexPool is also subject to annual review by an independent auditor consistent with the Public Funds Investment Act.
TexPool has adopted the provisions of GASB Statement No. 79 and meets the requirements of that standard to measure its investments at amortized cost. TexPool uses amortized costs rather than market value to report net position to compute share prices. Accordingly, the fair value of the position in TexPool is the same as the value of the TexPool shares.
NOTE 3. RECEIVABLES
Receivables in the general fund are 92.4% receivables from the taxing jurisdictions and 7.6% receivables from employees for elected health benefits.
Balance
Percentage of Total Receivables
Receivable from Jurisdictions $ 205,276 92.4% Receivable from Employees 16,815 7.6%
$ 222,091 100.0%
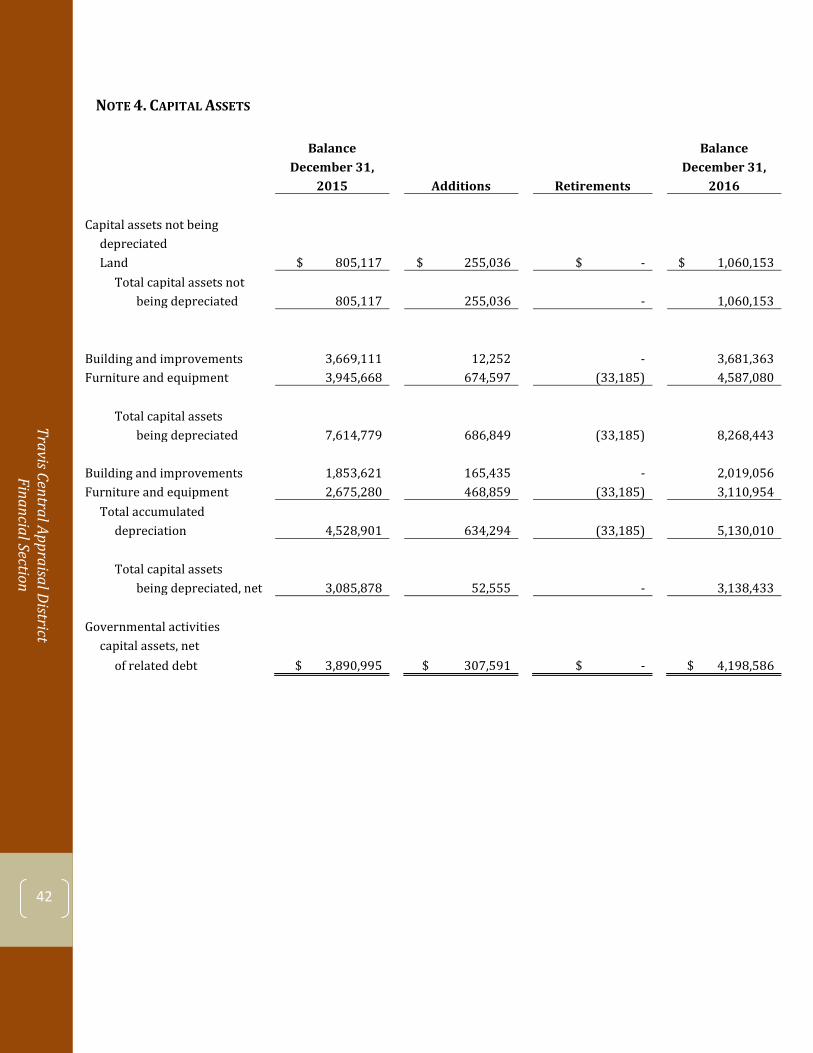
Travis Central Appraisal District Financial Section
42
NOTE 4. CAPITAL ASSETS
Balance Balance December 31, December 31,
2015 Additions Retirements 2016
Capital assets not being depreciated Land $ 805,117 $ 255,036 $ - $ 1,060,153
Total capital assets not being depreciated 805,117 255,036 - 1,060,153
Building and improvements 3,669,111 12,252 - 3,681,363 Furniture and equipment 3,945,668 674,597 (33,185) 4,587,080
Total capital assets being depreciated 7,614,779 686,849 (33,185) 8,268,443
Building and improvements 1,853,621 165,435 - 2,019,056 Furniture and equipment 2,675,280 468,859 (33,185) 3,110,954
Total accumulated depreciation 4,528,901 634,294 (33,185) 5,130,010
Total capital assets being depreciated, net 3,085,878 52,555 - 3,138,433
Governmental activities capital assets, net
of related debt $ 3,890,995 $ 307,591 $ - $ 4,198,586
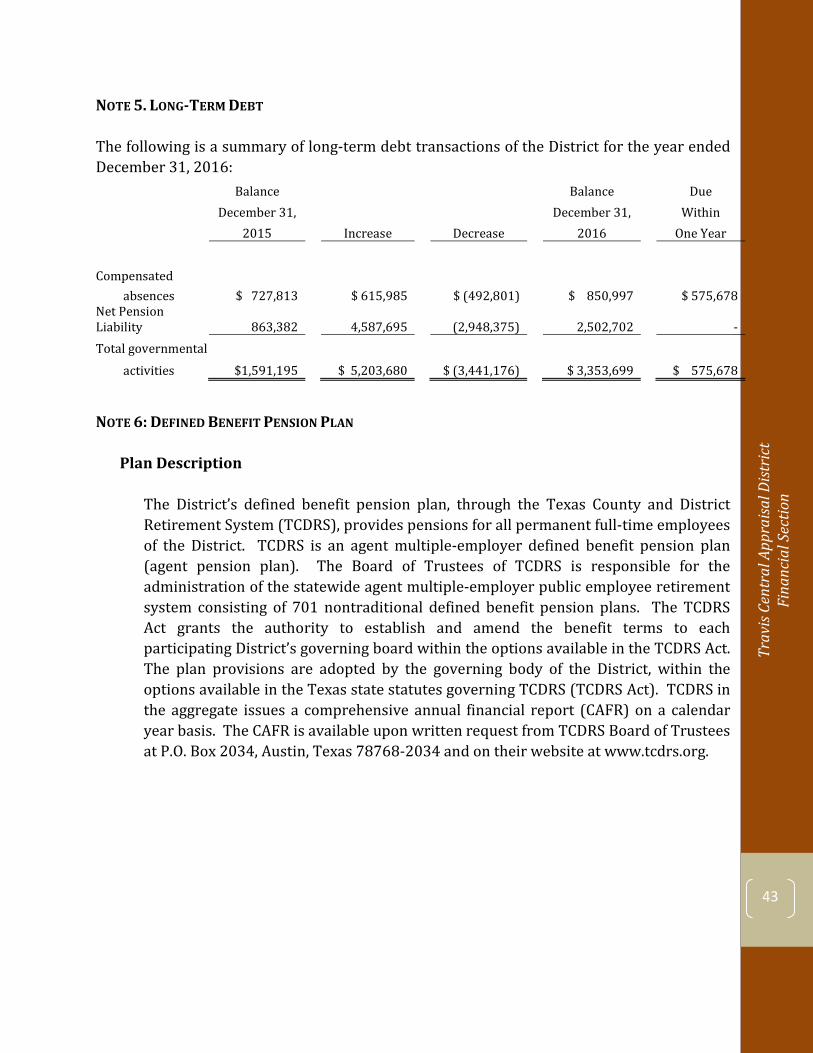
43
Trav
is Ce
ntra
l App
raisa
l Dist
rict
Fi
nanc
ial S
ectio
n
NOTE 5. LONG-TERM DEBT
The following is a summary of long-term debt transactions of the District for the year ended December 31, 2016:
Balance Balance Due December 31, December 31, Within
2015 Increase Decrease 2016 One Year
Compensated
absences $ 727,813 $ 615,985 $ (492,801) $ 850,997 $ 575,678
Net Pension Liability 863,382 4,587,695 (2,948,375) 2,502,702 - Total governmental
activities $1,591,195 $ 5,203,680 $ (3,441,176) $ 3,353,699 $ 575,678
NOTE 6: DEFINED BENEFIT PENSION PLAN
Plan Description
The District’s defined benefit pension plan, through the Texas County and District Retirement System (TCDRS), provides pensions for all permanent full-time employees of the District. TCDRS is an agent multiple-employer defined benefit pension plan (agent pension plan). The Board of Trustees of TCDRS is responsible for the administration of the statewide agent multiple-employer public employee retirement system consisting of 701 nontraditional defined benefit pension plans. The TCDRS Act grants the authority to establish and amend the benefit terms to each participating District’s governing board within the options available in the TCDRS Act. The plan provisions are adopted by the governing body of the District, within the options available in the Texas state statutes governing TCDRS (TCDRS Act). TCDRS in the aggregate issues a comprehensive annual financial report (CAFR) on a calendar year basis. The CAFR is available upon written request from TCDRS Board of Trustees at P.O. Box 2034, Austin, Texas 78768-2034 and on their website at www.tcdrs.org.
Travis Central Appraisal District Financial Section
44
NOTE 6: DEFINED BENEFIT PENSION PLAN- CONTINUED
Benefits Provided
TCDRS provides retirement, disability, and survivor benefits. TCDRS is a unique, savings-based plan. Members save for their retirement over the length of their careers. At retirement, benefits are based on a member’s final savings balance and employer matching. Employers with 10 years of service are eligible to retire at age 60. Any employee may retire when their years of service and age equal 75. This is known as the rule of 75. Employees may retire at any age after 30 years of service. An employee who leaves the District may withdraw his or her contributions, plus any accumulated interest. At December 31, 2015, the following employees were covered by the benefit terms:
Inactive employees or beneficiaries currently receiving benefits
62
Inactive employees entitled to but not yet receiving benefits
99
Active employees
106
267 Contributions
The District has elected the annually determined contribution rate (ADCR) plan provisions of the TCDRS Act. Under the TCDRS Act, the District has the option of selecting the plan benefits to provide in the future, while at the same time considering the level of the employer contribution rate required to adequately finance the plan. The plan is funded by monthly contributions from both employee members and the employer based on the covered payroll of employee members. The contribution rate of the employer is actuarially determined annually on a calendar year basis using the entry age actuarial cost method. The actuarially determined required contribution rate for fiscal year 2016 was 11.86%. However, during 2016, the District elected to continue contributions at the higher elected rate of 18.0%. The contribution rate payable by the employee is the rate of 7.0% as adopted by the governing body of the District. The employee contribution rate and the employer contribution rate may be changed by the governing body of the District within the options available in the TCDRS Act.
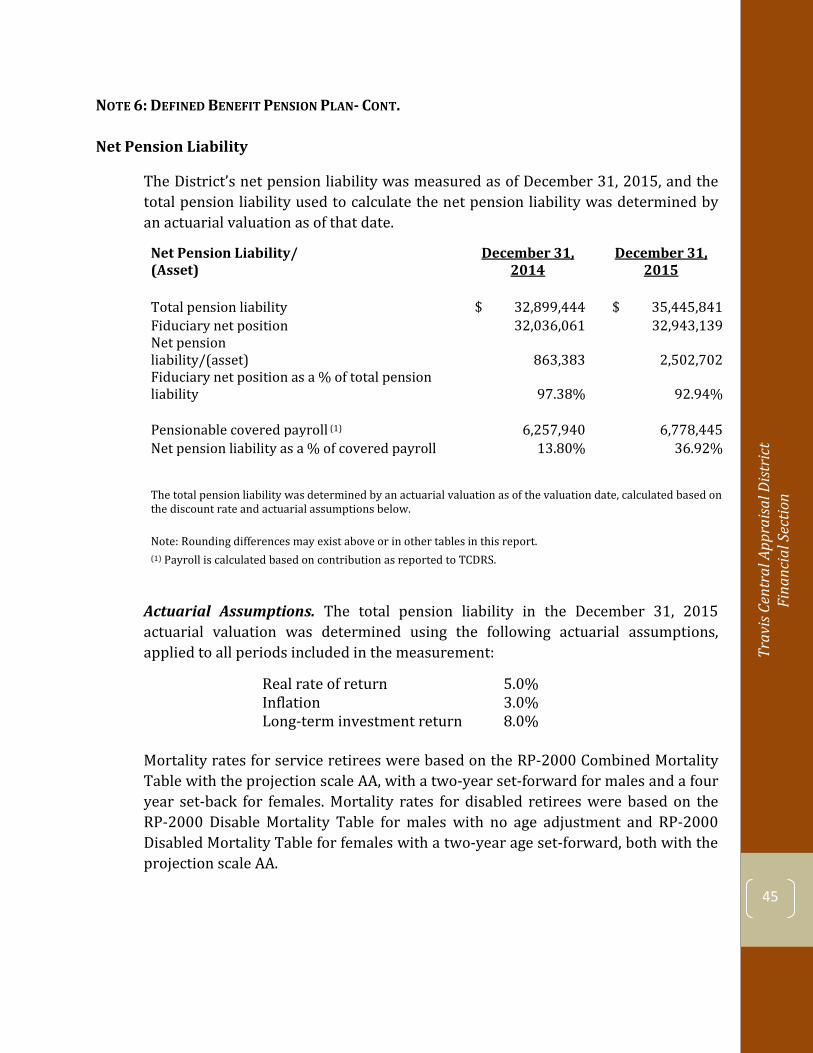
45
Trav
is Ce
ntra
l App
raisa
l Dist
rict
Fi
nanc
ial S
ectio
n
NOTE 6: DEFINED BENEFIT PENSION PLAN- CONT.
Net Pension Liability
The District’s net pension liability was measured as of December 31, 2015, and the total pension liability used to calculate the net pension liability was determined by an actuarial valuation as of that date.
Net Pension Liability/ (Asset)
December 31, 2014
December 31, 2015
Total pension liability
$ 32,899,444 $ 35,445,841 Fiduciary net position
32,036,061 32,943,139
Net pension liability/(asset)
863,383 2,502,702
Fiduciary net position as a % of total pension liability
97.38% 92.94%
Pensionable covered payroll (1) 6,257,940 6,778,445 Net pension liability as a % of covered payroll
13.80% 36.92%
The total pension liability was determined by an actuarial valuation as of the valuation date, calculated based on the discount rate and actuarial assumptions below. Note: Rounding differences may exist above or in other tables in this report. (1) Payroll is calculated based on contribution as reported to TCDRS.
Actuarial Assumptions. The total pension liability in the December 31, 2015 actuarial valuation was determined using the following actuarial assumptions, applied to all periods included in the measurement:
Real rate of return
5.0% Inflation
3.0%
Long-term investment return 8.0% Mortality rates for service retirees were based on the RP-2000 Combined Mortality Table with the projection scale AA, with a two-year set-forward for males and a four year set-back for females. Mortality rates for disabled retirees were based on the RP-2000 Disable Mortality Table for males with no age adjustment and RP-2000 Disabled Mortality Table for females with a two-year age set-forward, both with the projection scale AA.
Travis Central Appraisal District Financial Section
46
NOTE 6: DEFINED BENEFIT PENSION PLAN- CONT.
Net Pension Liability- Continued
The actuarial assumptions used in the December 31, 2015 valuation were based on the results of an actuarial experience study for the period of January 1, 2009 through December 31, 2012, except where required to be different by GASB 68.
The long-term expected rate of return on pension plan investments was determined by adding expected inflation to expected long-term real returns, and reflecting expected volatility and correlation. The capital market assumptions and information shown below are provided by TCDRS’ investment consultant, Cliffwater LLC. The numbers shown are based on January 2016 information for a 7-10 year time horizon.
The annual salary increase rates assumed for individual members vary by length of service and by entry-age group. The annual rates consist of a general wage inflation component of 3.5% (made up of 3.0% inflation and 0.5% productivity increase assumptions) and a merit, promotion and longevity component that on average approximates 1.4% per year for a career employee.
The rates do not include the wage inflation rate of 3.5% per year. For example, a member who entered the system at age 20 and is in the first year of service is assumed to receive an 8.93% total annual increase in his salary. The 8.93% is a combination of the 5.25% merit increase and the 3.5% wage inflation. Note that the two components are compounded, so it is a slightly different result than just adding the two percentages.
The payroll growth assumption is for the aggregate covered payroll of an employer.
New employees are assumed to replace any terminated employees and have similar entry ages. Members who become disabled are eligible to commence benefit payments regardless of age. Rates of disability are in a custom table based on TCDRS experience.
Growth in membership 0.0% Payroll growth 2.0%
47
Trav
is Ce
ntra
l App
raisa
l Dist
rict
Fi
nanc
ial S
ectio
n
NOTE 6: DEFINED BENEFIT PENSION PLAN- CONT.
Net Pension Liability- Continued
The probability of disablement from all other causes is applicable for members who are vested but not eligible for service retirement. Before a member is vested, only the work related disability provisions are applicable. Mortality rates for depositing members were based on the RP-2000 Active Employee Mortality Table for males with a two-year set-forward and the RP-2000 Active Employee Mortality Table for females with a four-year setback, both with the projection scale AA. For current retirees, beneficiary information is supplied by TCDRS. For purposes of calculating the Survivor Benefit for current depositing and non-depositing members, male members are assumed to have a female beneficiary who is three years younger. Female members are assumed to have a male beneficiary who is three years older.
Deferred members are assumed to retire (100% probability) at the later of: (a) age 60 or (b) the earliest retirement eligibility. For all eligible members ages 75 and older, retirement is assumed to occur immediately.
The rate of assumed future termination from active participation in the plan for reasons other than death, disability or retirement vary by length of service, entry-age group (age at hire) and sex. No termination after eligibility for retirement is assumed.
Members who terminate may either elect to leave their account with TCDRS or withdraw their funds. The probability that a member elects a withdrawal varies by length of service and vesting schedule. For non-depositing members who are not vested, 100% are assumed to elect withdrawal.
Discount Rate. The discount rate used to measure the total pension liability was 8.10%. This rate reflects the long-term assumed rate of return on assets for funding purposes of 8.00%, net of all expenses, increased by 0.10% to be gross of administrative expenses. TCDRS used an alternative method to determine the sufficiency of the fiduciary net position in all future years. The method reflects the funding requirements under the employer’s funding policy and the legal requirements under the TCDRS Act.
Travis Central Appraisal District Financial Section
48
NOTE 6: DEFINED BENEFIT PENSION PLAN- CONT.
Net Pension Liability- Continued
1. TCDRS has a funding policy where the Unfunded Actuarial Accrued Liability (UAAL) shall be amortized as a level percent of pay over 20-year closed layered periods.
2. Under the TCDRS Act, the employer is legally required to make the contribution specified in the funding policy.
3. The District’s assets are projected to exceed its accrued liabilities in 20 years or less. When this point is reached, the employer is still required to contribute at least the normal cost.
4. An increased cost due to the adoption of a COLA is required to be funded over a period of 15 years, if applicable.
Based on the assumptions above, the projected fiduciary net position was determined to be sufficient compared to projected benefit payments of current active and inactive employees. Therefore, the long-term expected rate of return on investments was applied to all periods of projected benefit payments to determine the total pension liability.
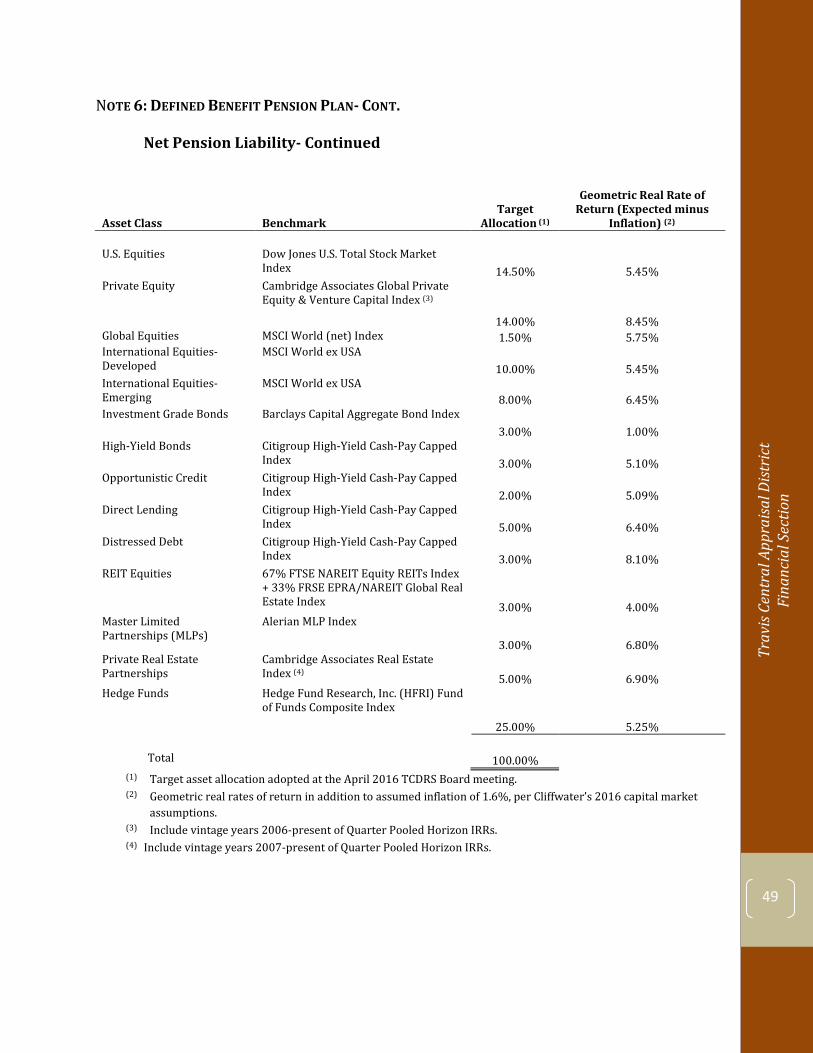
49
Trav
is Ce
ntra
l App
raisa
l Dist
rict
Fi
nanc
ial S
ectio
n
NOTE 6: DEFINED BENEFIT PENSION PLAN- CONT.
Net Pension Liability- Continued
Asset Class Benchmark Target
Allocation (1)
Geometric Real Rate of Return (Expected minus
Inflation) (2)
U.S. Equities Dow Jones U.S. Total Stock Market Index 14.50% 5.45%
Private Equity Cambridge Associates Global Private Equity & Venture Capital Index (3)
14.00% 8.45% Global Equities MSCI World (net) Index 1.50% 5.75% International Equities- Developed
MSCI World ex USA 10.00% 5.45%
International Equities- Emerging
MSCI World ex USA 8.00% 6.45%
Investment Grade Bonds Barclays Capital Aggregate Bond Index 3.00% 1.00%
High-Yield Bonds Citigroup High-Yield Cash-Pay Capped Index 3.00% 5.10%
Opportunistic Credit Citigroup High-Yield Cash-Pay Capped Index 2.00% 5.09%
Direct Lending Citigroup High-Yield Cash-Pay Capped Index 5.00% 6.40%
Distressed Debt Citigroup High-Yield Cash-Pay Capped Index 3.00% 8.10%
REIT Equities 67% FTSE NAREIT Equity REITs Index + 33% FRSE EPRA/NAREIT Global Real Estate Index 3.00% 4.00%
Master Limited Partnerships (MLPs)
Alerian MLP Index
3.00% 6.80% Private Real Estate Partnerships
Cambridge Associates Real Estate Index (4) 5.00% 6.90%
Hedge Funds Hedge Fund Research, Inc. (HFRI) Fund of Funds Composite Index
25.00% 5.25%
Total 100.00% (1) Target asset allocation adopted at the April 2016 TCDRS Board meeting. (2) Geometric real rates of return in addition to assumed inflation of 1.6%, per Cliffwater’s 2016 capital market
assumptions. (3) Include vintage years 2006-present of Quarter Pooled Horizon IRRs. (4) Include vintage years 2007-present of Quarter Pooled Horizon IRRs.
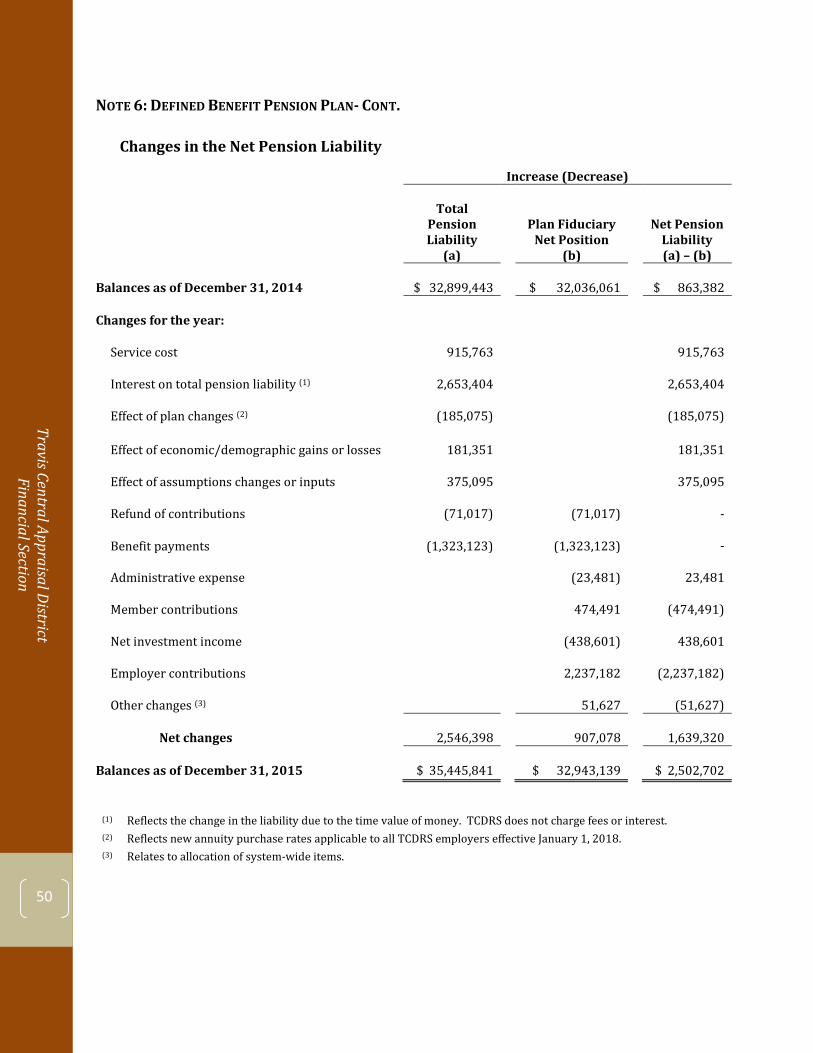
Travis Central Appraisal District Financial Section
50
NOTE 6: DEFINED BENEFIT PENSION PLAN- CONT. Changes in the Net Pension Liability
Increase (Decrease)
Total Pension Liability
(a)
Plan Fiduciary Net Position
(b)
Net Pension Liability (a) – (b)
Balances as of December 31, 2014 $ 32,899,443 $ 32,036,061 $ 863,382
Changes for the year: Service cost 915,763 915,763 Interest on total pension liability (1) 2,653,404 2,653,404 Effect of plan changes (2) (185,075) (185,075) Effect of economic/demographic gains or losses 181,351 181,351 Effect of assumptions changes or inputs 375,095 375,095 Refund of contributions (71,017) (71,017) -
Benefit payments
(1,323,123)
(1,323,123)
-
Administrative expense (23,481) 23,481 Member contributions 474,491 (474,491) Net investment income (438,601) 438,601 Employer contributions 2,237,182 (2,237,182) Other changes (3) 51,627 (51,627) Net changes 2,546,398 907,078 1,639,320 Balances as of December 31, 2015 $ 35,445,841 $ 32,943,139 $ 2,502,702
(1) Reflects the change in the liability due to the time value of money. TCDRS does not charge fees or interest. (2) Reflects new annuity purchase rates applicable to all TCDRS employers effective January 1, 2018.
(3) Relates to allocation of system-wide items.
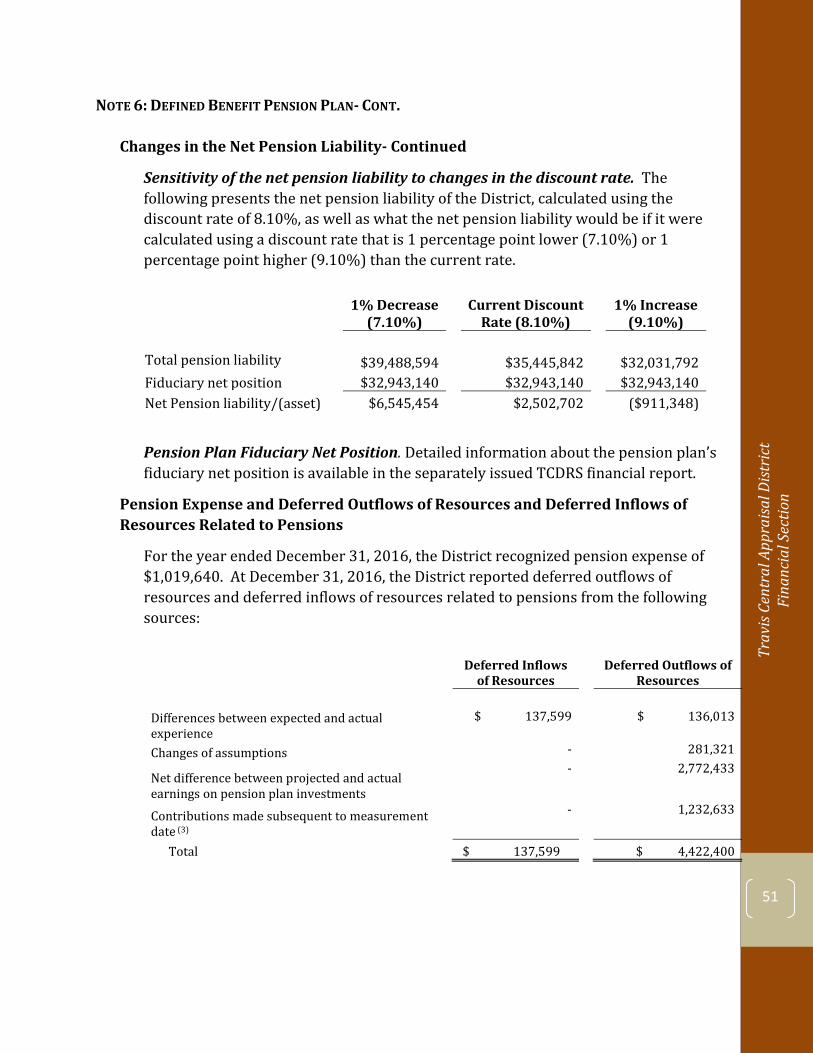
51
Trav
is Ce
ntra
l App
raisa
l Dist
rict
Fi
nanc
ial S
ectio
n
NOTE 6: DEFINED BENEFIT PENSION PLAN- CONT. Changes in the Net Pension Liability- Continued
Sensitivity of the net pension liability to changes in the discount rate. The following presents the net pension liability of the District, calculated using the discount rate of 8.10%, as well as what the net pension liability would be if it were calculated using a discount rate that is 1 percentage point lower (7.10%) or 1 percentage point higher (9.10%) than the current rate.
1% Decrease (7.10%)
Current Discount Rate (8.10%)
1% Increase (9.10%)
Total pension liability $39,488,594
$35,445,842
$32,031,792 Fiduciary net position
$32,943,140
$32,943,140
$32,943,140
Net Pension liability/(asset)
$6,545,454
$2,502,702
($911,348)
Pension Plan Fiduciary Net Position. Detailed information about the pension plan’s fiduciary net position is available in the separately issued TCDRS financial report.
Pension Expense and Deferred Outflows of Resources and Deferred Inflows of Resources Related to Pensions
For the year ended December 31, 2016, the District recognized pension expense of $1,019,640. At December 31, 2016, the District reported deferred outflows of resources and deferred inflows of resources related to pensions from the following sources:
Deferred Inflows of Resources
Deferred Outflows of Resources
Differences between expected and actual experience
$ 137,599 $ 136,013
Changes of assumptions
- 281,321
Net difference between projected and actual earnings on pension plan investments
- 2,772,433
Contributions made subsequent to measurement date (3)
- 1,232,633
Total
$ 137,599
$ 4,422,400
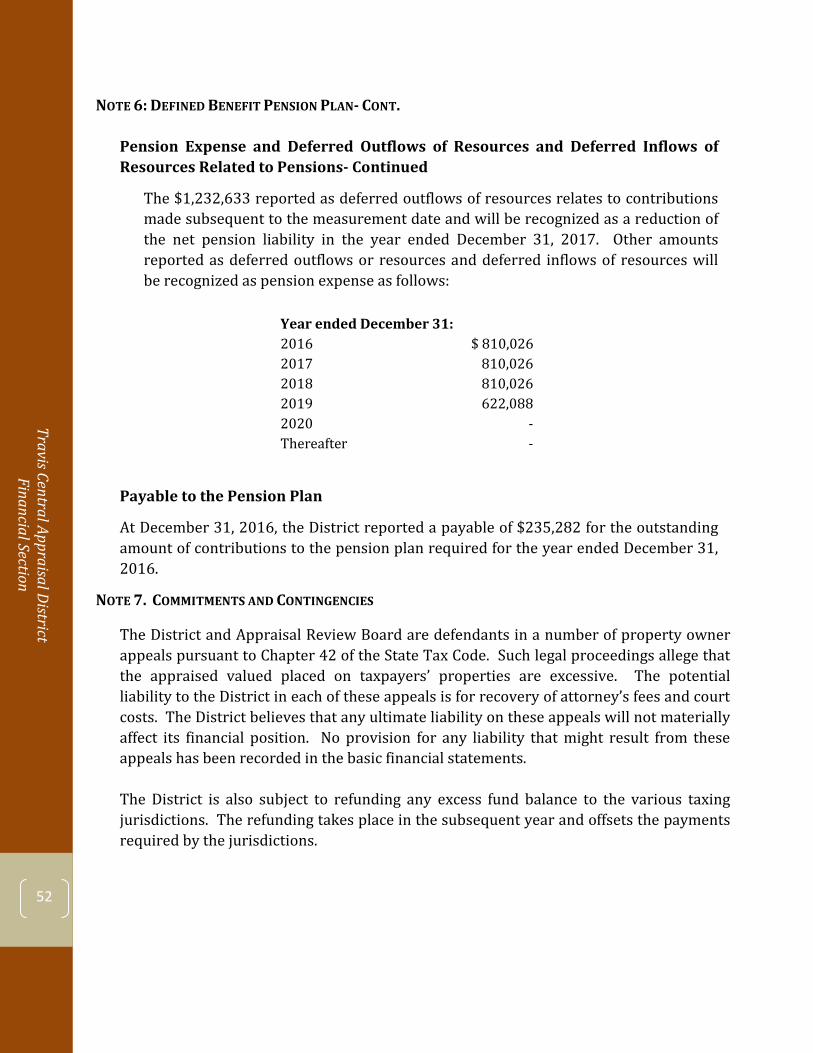
Travis Central Appraisal District Financial Section
52
NOTE 6: DEFINED BENEFIT PENSION PLAN- CONT.
Pension Expense and Deferred Outflows of Resources and Deferred Inflows of Resources Related to Pensions- Continued
The $1,232,633 reported as deferred outflows of resources relates to contributions made subsequent to the measurement date and will be recognized as a reduction of the net pension liability in the year ended December 31, 2017. Other amounts reported as deferred outflows or resources and deferred inflows of resources will be recognized as pension expense as follows:
Year ended December 31: 2016 $ 810,026 2017 810,026 2018 810,026 2019 622,088 2020 - Thereafter -
Payable to the Pension Plan
At December 31, 2016, the District reported a payable of $235,282 for the outstanding amount of contributions to the pension plan required for the year ended December 31, 2016.
NOTE 7. COMMITMENTS AND CONTINGENCIES
The District and Appraisal Review Board are defendants in a number of property owner appeals pursuant to Chapter 42 of the State Tax Code. Such legal proceedings allege that the appraised valued placed on taxpayers’ properties are excessive. The potential liability to the District in each of these appeals is for recovery of attorney’s fees and court costs. The District believes that any ultimate liability on these appeals will not materially affect its financial position. No provision for any liability that might result from these appeals has been recorded in the basic financial statements.
The District is also subject to refunding any excess fund balance to the various taxing jurisdictions. The refunding takes place in the subsequent year and offsets the payments required by the jurisdictions.
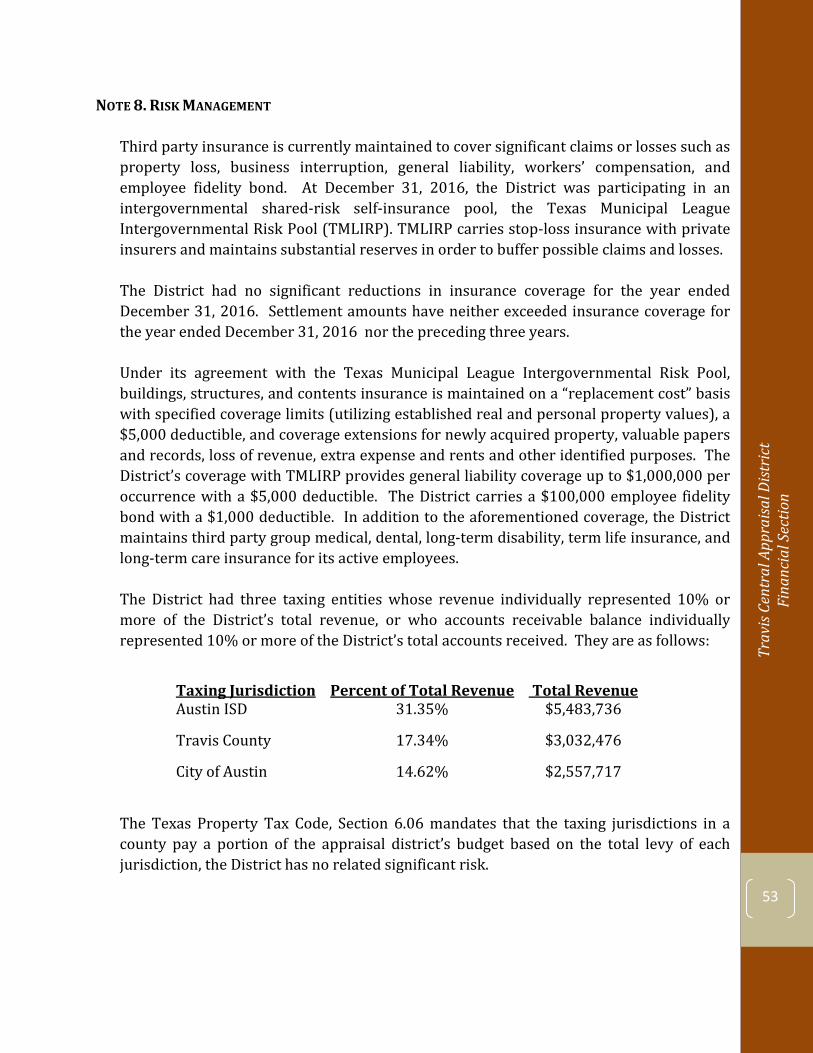
53
Trav
is Ce
ntra
l App
raisa
l Dist
rict
Fi
nanc
ial S
ectio
n
NOTE 8. RISK MANAGEMENT
Third party insurance is currently maintained to cover significant claims or losses such as property loss, business interruption, general liability, workers’ compensation, and employee fidelity bond. At December 31, 2016, the District was participating in an intergovernmental shared-risk self-insurance pool, the Texas Municipal League Intergovernmental Risk Pool (TMLIRP). TMLIRP carries stop-loss insurance with private insurers and maintains substantial reserves in order to buffer possible claims and losses. The District had no significant reductions in insurance coverage for the year ended December 31, 2016. Settlement amounts have neither exceeded insurance coverage for the year ended December 31, 2016 nor the preceding three years.
Under its agreement with the Texas Municipal League Intergovernmental Risk Pool, buildings, structures, and contents insurance is maintained on a “replacement cost” basis with specified coverage limits (utilizing established real and personal property values), a $5,000 deductible, and coverage extensions for newly acquired property, valuable papers and records, loss of revenue, extra expense and rents and other identified purposes. The District’s coverage with TMLIRP provides general liability coverage up to $1,000,000 per occurrence with a $5,000 deductible. The District carries a $100,000 employee fidelity bond with a $1,000 deductible. In addition to the aforementioned coverage, the District maintains third party group medical, dental, long-term disability, term life insurance, and long-term care insurance for its active employees. The District had three taxing entities whose revenue individually represented 10% or more of the District’s total revenue, or who accounts receivable balance individually represented 10% or more of the District’s total accounts received. They are as follows:
Taxing Jurisdiction Percent of Total Revenue Total Revenue Austin ISD 31.35% $5,483,736
Travis County 17.34% $3,032,476
City of Austin 14.62% $2,557,717
The Texas Property Tax Code, Section 6.06 mandates that the taxing jurisdictions in a county pay a portion of the appraisal district’s budget based on the total levy of each jurisdiction, the District has no related significant risk.

Travis Central Appraisal District Financial Section
54

55
Trav
is Ce
ntra
l App
raisa
l Dist
rict
Fi
nanc
ial S
ectio
n
REQUIRED SUPPLEMENTARY INFORMATION
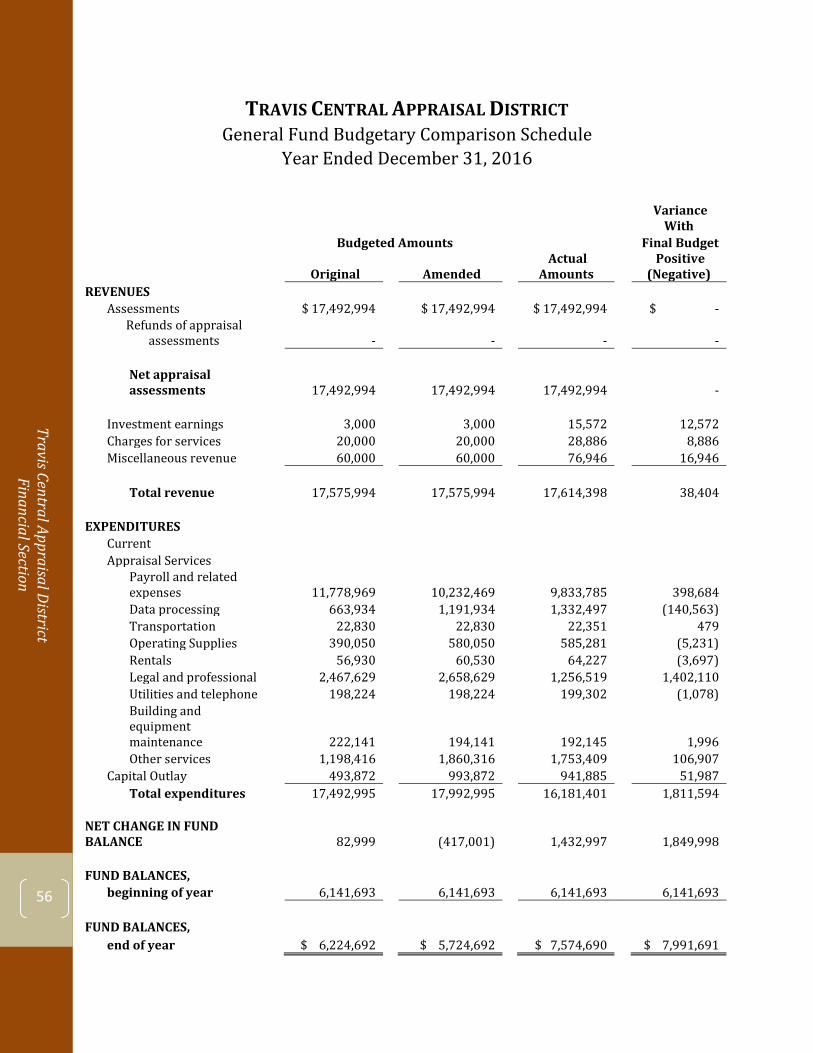
Travis Central Appraisal District Financial Section
56
TRAVIS CENTRAL APPRAISAL DISTRICT General Fund Budgetary Comparison Schedule
Year Ended December 31, 2016
Variance With
Budgeted Amounts
Final Budget
Original Amended Actual
Amounts Positive
(Negative) REVENUES
Assessments $ 17,492,994 $ 17,492,994 $ 17,492,994 $ - Refunds of appraisal
assessments - - - -
Net appraisal assessments 17,492,994 17,492,994 17,492,994 -
Investment earnings 3,000 3,000 15,572 12,572 Charges for services 20,000 20,000 28,886 8,886 Miscellaneous revenue 60,000 60,000 76,946 16,946
Total revenue 17,575,994 17,575,994 17,614,398 38,404
EXPENDITURES Current Appraisal Services
Payroll and related expenses 11,778,969 10,232,469 9,833,785 398,684 Data processing 663,934 1,191,934 1,332,497 (140,563) Transportation 22,830 22,830 22,351 479 Operating Supplies 390,050 580,050 585,281 (5,231) Rentals 56,930 60,530 64,227 (3,697) Legal and professional 2,467,629 2,658,629 1,256,519 1,402,110 Utilities and telephone 198,224 198,224 199,302 (1,078) Building and equipment maintenance 222,141 194,141 192,145 1,996 Other services 1,198,416 1,860,316 1,753,409 106,907
Capital Outlay 493,872 993,872 941,885 51,987 Total expenditures 17,492,995 17,992,995 16,181,401 1,811,594
NET CHANGE IN FUND BALANCE 82,999 (417,001) 1,432,997 1,849,998
FUND BALANCES, beginning of year 6,141,693 6,141,693 6,141,693 6,141,693
FUND BALANCES, end of year $ 6,224,692 $ 5,724,692 $ 7,574,690 $ 7,991,691
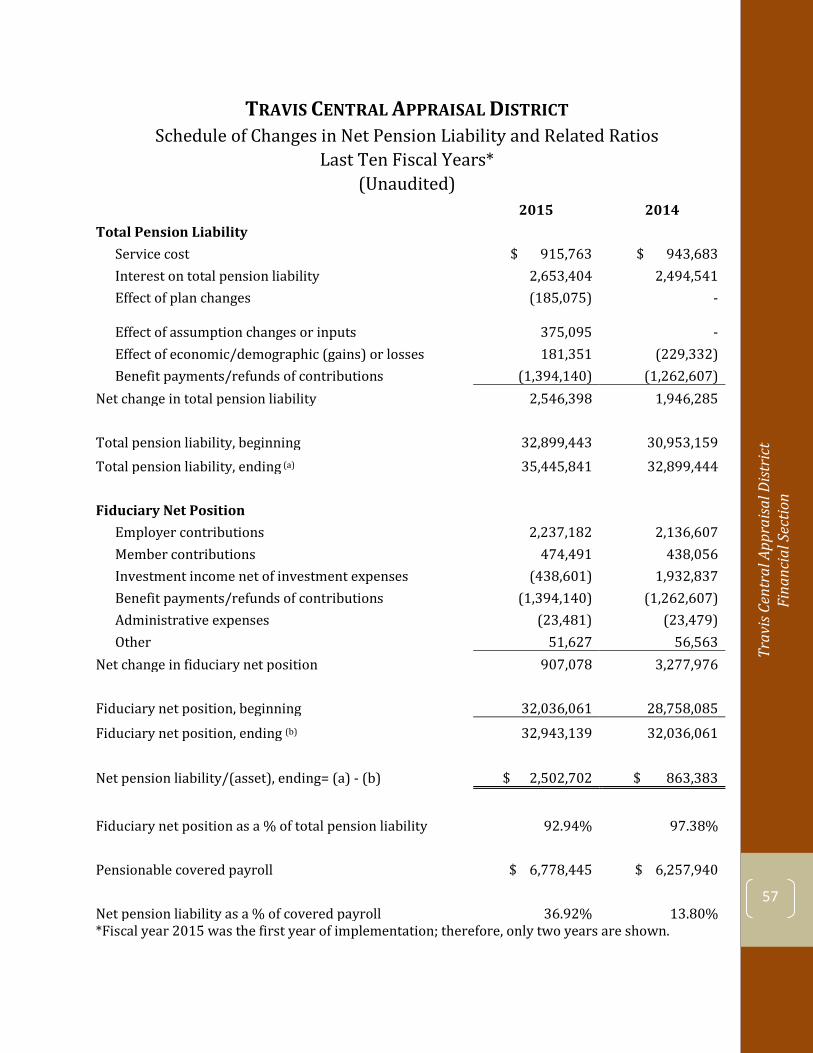
57
Trav
is Ce
ntra
l App
raisa
l Dist
rict
Fi
nanc
ial S
ectio
n
TRAVIS CENTRAL APPRAISAL DISTRICT Schedule of Changes in Net Pension Liability and Related Ratios
Last Ten Fiscal Years* (Unaudited)
2015 2014 Total Pension Liability
Service cost $ 915,763 $ 943,683 Interest on total pension liability 2,653,404 2,494,541 Effect of plan changes (185,075) -
Effect of assumption changes or inputs 375,095 - Effect of economic/demographic (gains) or losses 181,351 (229,332) Benefit payments/refunds of contributions (1,394,140) (1,262,607)
Net change in total pension liability 2,546,398 1,946,285
Total pension liability, beginning 32,899,443 30,953,159 Total pension liability, ending (a) 35,445,841 32,899,444
Fiduciary Net Position Employer contributions 2,237,182 2,136,607 Member contributions 474,491 438,056 Investment income net of investment expenses (438,601) 1,932,837 Benefit payments/refunds of contributions (1,394,140) (1,262,607) Administrative expenses (23,481) (23,479) Other 51,627 56,563
Net change in fiduciary net position 907,078 3,277,976
Fiduciary net position, beginning 32,036,061 28,758,085
Fiduciary net position, ending (b) 32,943,139 32,036,061
Net pension liability/(asset), ending= (a) - (b) $ 2,502,702 $ 863,383
Fiduciary net position as a % of total pension liability 92.94% 97.38%
Pensionable covered payroll $ 6,778,445 $ 6,257,940
Net pension liability as a % of covered payroll 36.92% 13.80% *Fiscal year 2015 was the first year of implementation; therefore, only two years are shown.
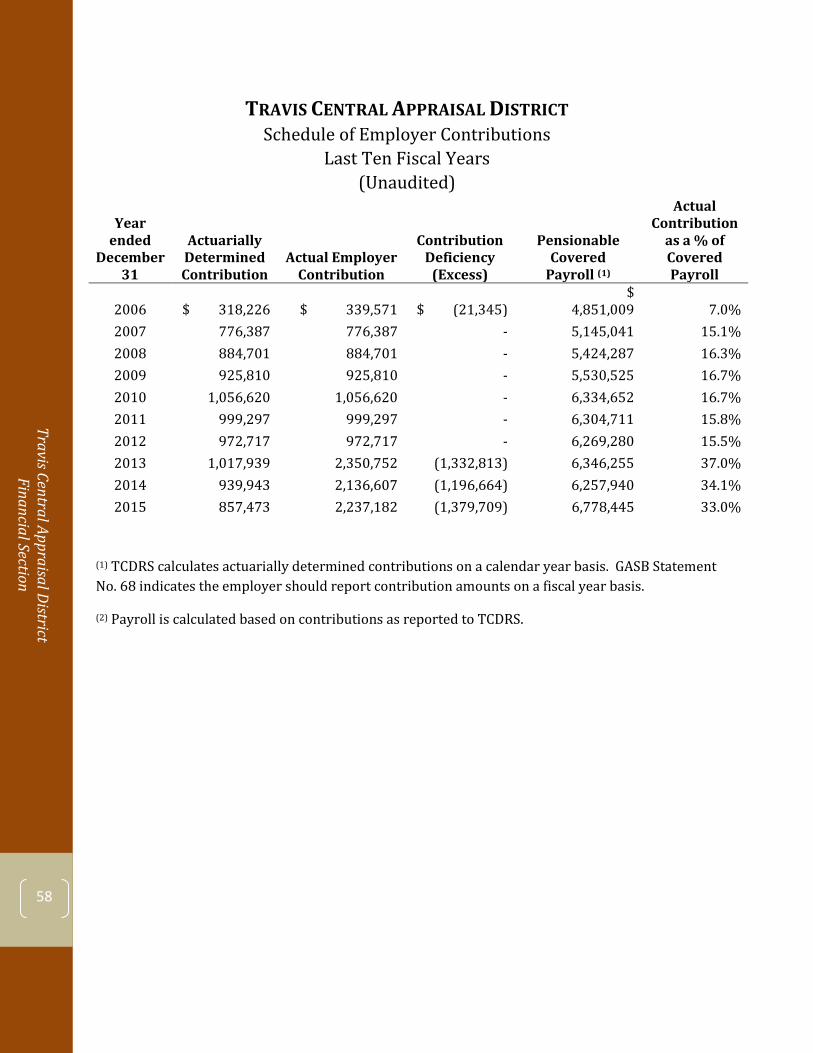
Travis Central Appraisal District Financial Section
58
TRAVIS CENTRAL APPRAISAL DISTRICT Schedule of Employer Contributions
Last Ten Fiscal Years (Unaudited)
Year ended
December 31
Actuarially Determined Contribution
Actual Employer Contribution
Contribution Deficiency
(Excess)
Pensionable Covered
Payroll (1)
Actual Contribution
as a % of Covered Payroll
2006 $ 318,226 $ 339,571 $ (21,345) $
4,851,009 7.0% 2007 776,387 776,387 - 5,145,041 15.1% 2008 884,701 884,701 - 5,424,287 16.3% 2009 925,810 925,810 - 5,530,525 16.7% 2010 1,056,620 1,056,620 - 6,334,652 16.7% 2011 999,297 999,297 - 6,304,711 15.8% 2012 972,717 972,717 - 6,269,280 15.5% 2013 1,017,939 2,350,752 (1,332,813) 6,346,255 37.0% 2014 939,943 2,136,607 (1,196,664) 6,257,940 34.1% 2015 857,473 2,237,182 (1,379,709) 6,778,445 33.0%
(1) TCDRS calculates actuarially determined contributions on a calendar year basis. GASB Statement No. 68 indicates the employer should report contribution amounts on a fiscal year basis.
(2) Payroll is calculated based on contributions as reported to TCDRS.
59
Trav
is Ce
ntra
l App
raisa
l Dist
rict
Fi
nanc
ial S
ectio
n
TRAVIS CENTRAL APPRAISAL DISTRICT Notes to the Required Supplementary Information
Budgetary Data
The Board adopts an appropriated budget on a basis consistent with GAAP for the general fund. At minimum, the District is required to present the original and final amended budgets for revenues and expenditures compared to actual revenues and expenditures for the general fund. The District uses the following procedures in establishing the budget reflected in the basic financial statements:
1. Prior to September 15, the Board of Directors is presented with a proposedbudget for the fiscal year beginning on the following January 1. The budgetincludes proposed expenditures and the means of financing them. The budgetalso serves as a basis for determining the annual assessments due from thetaxing jurisdictions.
2. Public hearings are conducted to obtain citizen’s comments.3. An annual budget is legally adopted for the General Fund. The budget is
adopted on a basis consistent with accounting principles generally accepted inthe United States of America.
4. The Chief Appraiser is authorized to transfer amounts between departmentswithin the General Fund; however, revisions that alter total General Fundexpenditures must be approved by the Board of Directors and the taxingjurisdictions. The fund level is the legal level of budgetary control.Appropriations lapse at year-end.
5. Budgeted amounts presented in the budgetary comparison schedule are asoriginally adopted by the Board of Directors on August 11, 2015. Nosupplementary appropriations have been enacted.
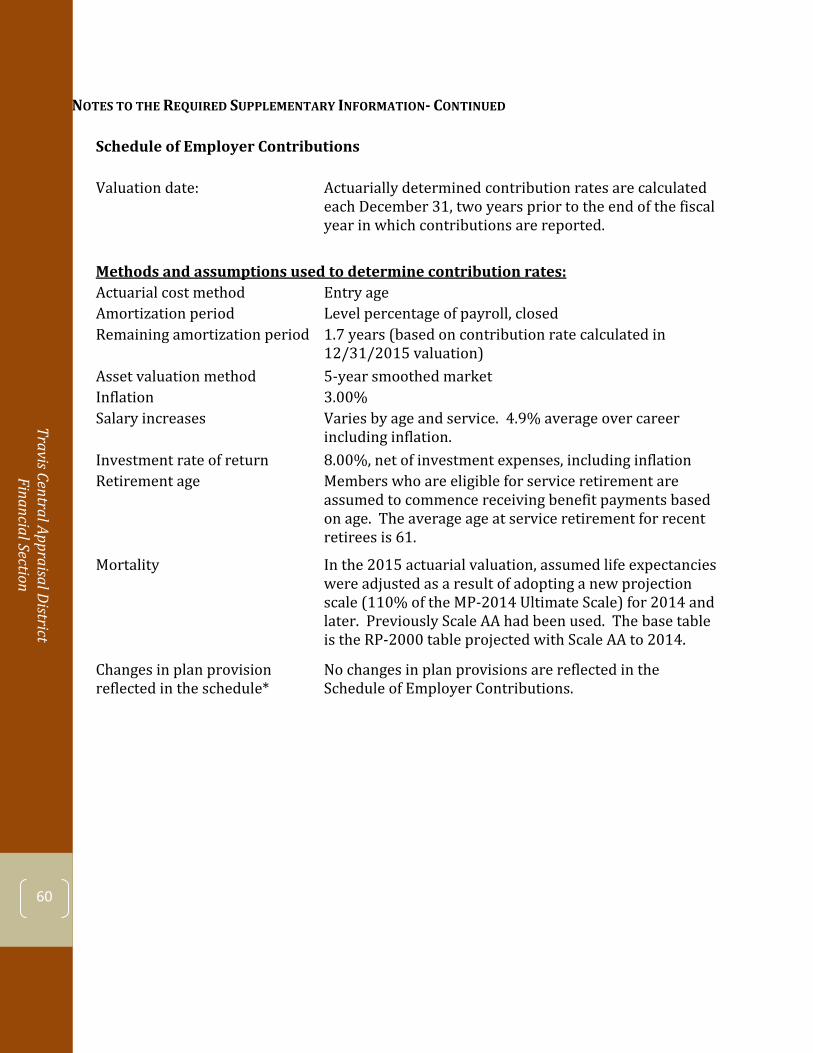
Travis Central Appraisal District Financial Section
60
NOTES TO THE REQUIRED SUPPLEMENTARY INFORMATION- CONTINUED
Schedule of Employer Contributions
Valuation date: Actuarially determined contribution rates are calculated each December 31, two years prior to the end of the fiscal year in which contributions are reported.
Methods and assumptions used to determine contribution rates: Actuarial cost method Entry age Amortization period Level percentage of payroll, closed Remaining amortization period 1.7 years (based on contribution rate calculated in
12/31/2015 valuation) Asset valuation method 5-year smoothed market Inflation 3.00% Salary increases Varies by age and service. 4.9% average over career
including inflation. Investment rate of return 8.00%, net of investment expenses, including inflation Retirement age Members who are eligible for service retirement are
assumed to commence receiving benefit payments based on age. The average age at service retirement for recent retirees is 61.
Mortality In the 2015 actuarial valuation, assumed life expectancies were adjusted as a result of adopting a new projection scale (110% of the MP-2014 Ultimate Scale) for 2014 and later. Previously Scale AA had been used. The base table is the RP-2000 table projected with Scale AA to 2014.
Changes in plan provision reflected in the schedule*
No changes in plan provisions are reflected in the Schedule of Employer Contributions.
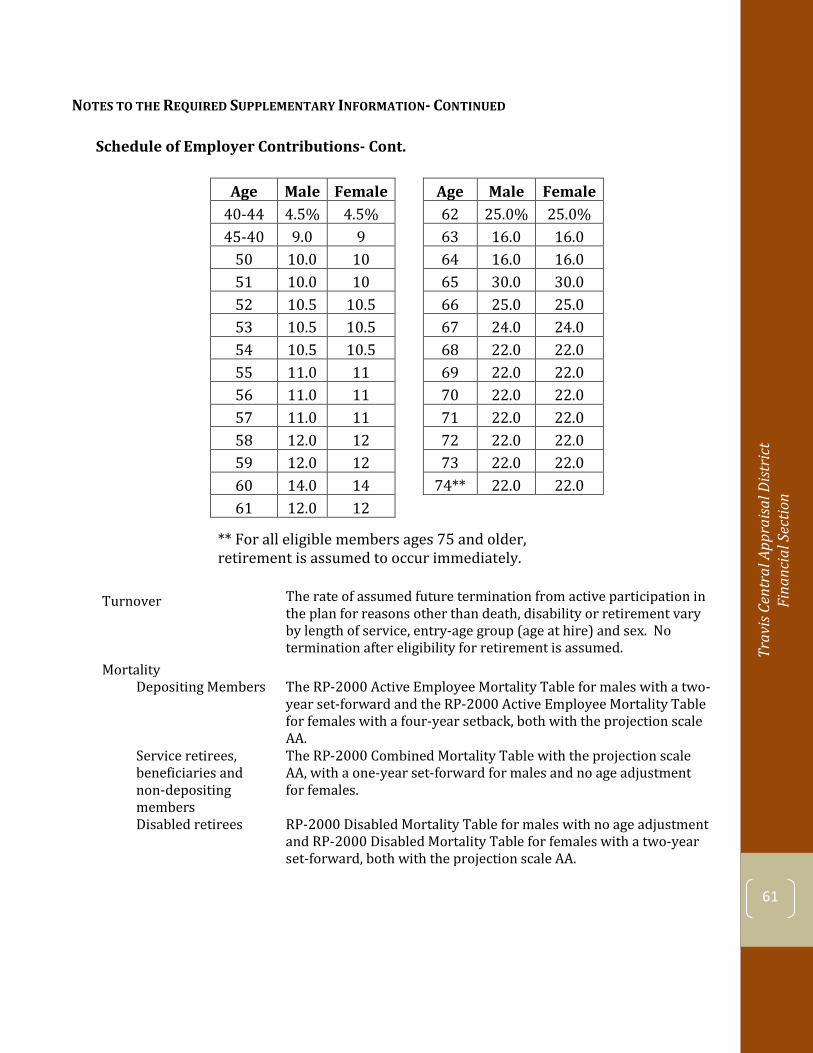
61
Trav
is Ce
ntra
l App
raisa
l Dist
rict
Fi
nanc
ial S
ectio
n
NOTES TO THE REQUIRED SUPPLEMENTARY INFORMATION- CONTINUED Schedule of Employer Contributions- Cont.
Age Male Female
Age Male Female
40-44 4.5% 4.5%
62 25.0% 25.0% 45-40 9.0 9
63 16.0 16.0
50 10.0 10
64 16.0 16.0 51 10.0 10
65 30.0 30.0
52 10.5 10.5
66 25.0 25.0 53 10.5 10.5
67 24.0 24.0
54 10.5 10.5
68 22.0 22.0 55 11.0 11
69 22.0 22.0
56 11.0 11
70 22.0 22.0 57 11.0 11
71 22.0 22.0
58 12.0 12
72 22.0 22.0 59 12.0 12
73 22.0 22.0
60 14.0 14
74** 22.0 22.0 61 12.0 12
** For all eligible members ages 75 and older, retirement is assumed to occur immediately.
Turnover
The rate of assumed future termination from active participation in the plan for reasons other than death, disability or retirement vary by length of service, entry-age group (age at hire) and sex. No termination after eligibility for retirement is assumed.
Mortality
Depositing Members The RP-2000 Active Employee Mortality Table for males with a two-year set-forward and the RP-2000 Active Employee Mortality Table for females with a four-year setback, both with the projection scale AA.
Service retirees, beneficiaries and non-depositing members
The RP-2000 Combined Mortality Table with the projection scale AA, with a one-year set-forward for males and no age adjustment for females.
Disabled retirees RP-2000 Disabled Mortality Table for males with no age adjustment and RP-2000 Disabled Mortality Table for females with a two-year set-forward, both with the projection scale AA.
Travis Central Appraisal District Financial Section
62
Trav
is Ce
ntra
l App
raisa
l Dist
rict
St
atist
ical
Sec
tion
63
TRAVIS CENTRAL APPRAISAL DISTRICTIntroduction to the Statistical Section
(Unaudited)
This section of the Travis Central Appraisal District’s Comprehensive Annual Financial Report (CAFR) presents detailed information as a context for understanding what the information in the financial statements, note disclosures, and required supplementary information, says about the District’s overall financial health.
Travis Central Appraisal District Financial Trends
Table 1 through 6 present multi-year financial data encompassing the District’s net position, General Fund balances, and revenues and expenditures. In reviewing this, it should be noted that the District is statutorily prohibited from incurring bonded indebtedness. Table 5 and table 6 depict the annual assessments, or funds paid, pursuant to the Texas Property Tax Code, by the various taxing entities in Travis County to fund the District’s annual budget.
Table 1 Net Position by Component Last Ten Fiscal Years Table 2 Change in Net Position Last Ten Fiscal Years Table 3 Fund Balance- Governmental Fund Last Ten Fiscal Years Table 4 Changes in Fund Balance- Governmental Fund Last Ten Fiscal Years Table 5 Assessments to Taxing Entities Last Ten Fiscal Years Table 6 Assessments Collected from Taxing Entities Last Ten Fiscal Years
Travis Central Appraisal District Taxing Entity Trends
Tables 7 through 9 provide multi-year financial data regarding property tax levies, property tax rates, and appraised values for each of the taxing entities the District services.
Table 7 Property Tax Levies by Taxing Entity Last Ten Fiscal Years Table 8 Tax Rates by Taxing Entity Last Ten Fiscal Years Table 9 Appraised Value by Taxing Entity Last Ten Fiscal Years
Demographic and Economic Information
Table 10 through 12 identify changes which have occurred, over time, in both the top ten property values and employers as well as county-wide population, per capita income, and other trends.
Table 10 Demographic and Economic Statistics Last Ten Fiscal Years
Travis Central Appraisal District Statistical Section
64
Table 11 Principal Employers for 2007 and 2016 Table 12 Principal Property Taxpayers for 2007 and 2016
Travis Central Appraisal District Operating Information
Table 13 through 15 contain information about the District’s staffing, workload, and capital assets.
Table 13 Budgeted Full-Time Equivalent Appraisal District Employees by Function/Program Last Ten Fiscal Years
Table 14 Actual Full-Time Equivalent Appraisal District Employees by Function/Program Last Ten Fiscal Years
Table 15 Operating Indicators by Function/Program Last Ten Fiscal Years
Travis Central Appraisal District Debt Information
Table 16 provides information about the District’s outstanding debt.
Table 16 Outstanding Debt by Type Last Ten Fiscal Years
Trav
is Ce
ntra
l App
raisa
l Dist
rict
St
atist
ical
Sec
tion
65
STATISTICAL SECTION FINANCIAL TRENDS
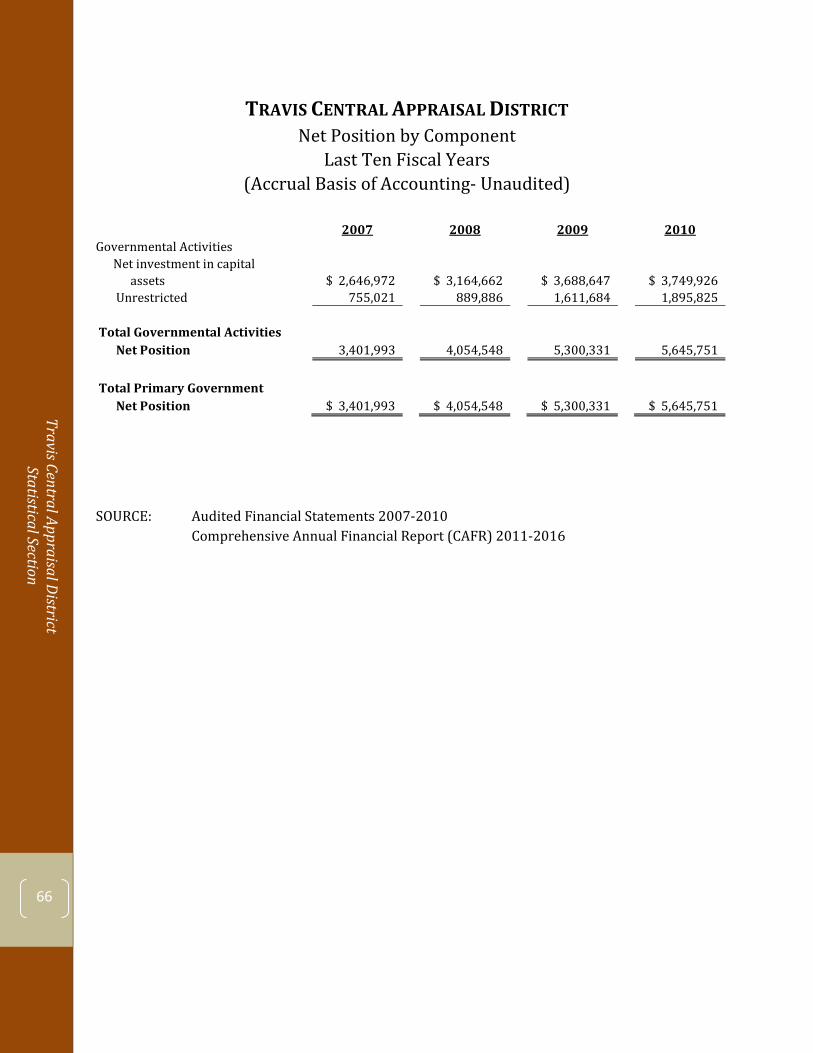
Travis Central Appraisal District Statistical Section
66
TRAVIS CENTRAL APPRAISAL DISTRICT
Net Position by Component Last Ten Fiscal Years
(Accrual Basis of Accounting- Unaudited)
2007
2008
2009
2010
Governmental Activities
Net investment in capital
assets
$ 2,646,972
$ 3,164,662
$ 3,688,647
$ 3,749,926
Unrestricted
755,021
889,886
1,611,684
1,895,825
Total Governmental Activities
Net Position
3,401,993
4,054,548
5,300,331
5,645,751
Total Primary Government
Net Position
$ 3,401,993
$ 4,054,548
$ 5,300,331
$ 5,645,751
SOURCE: Audited Financial Statements 2007-2010 Comprehensive Annual Financial Report (CAFR) 2011-2016
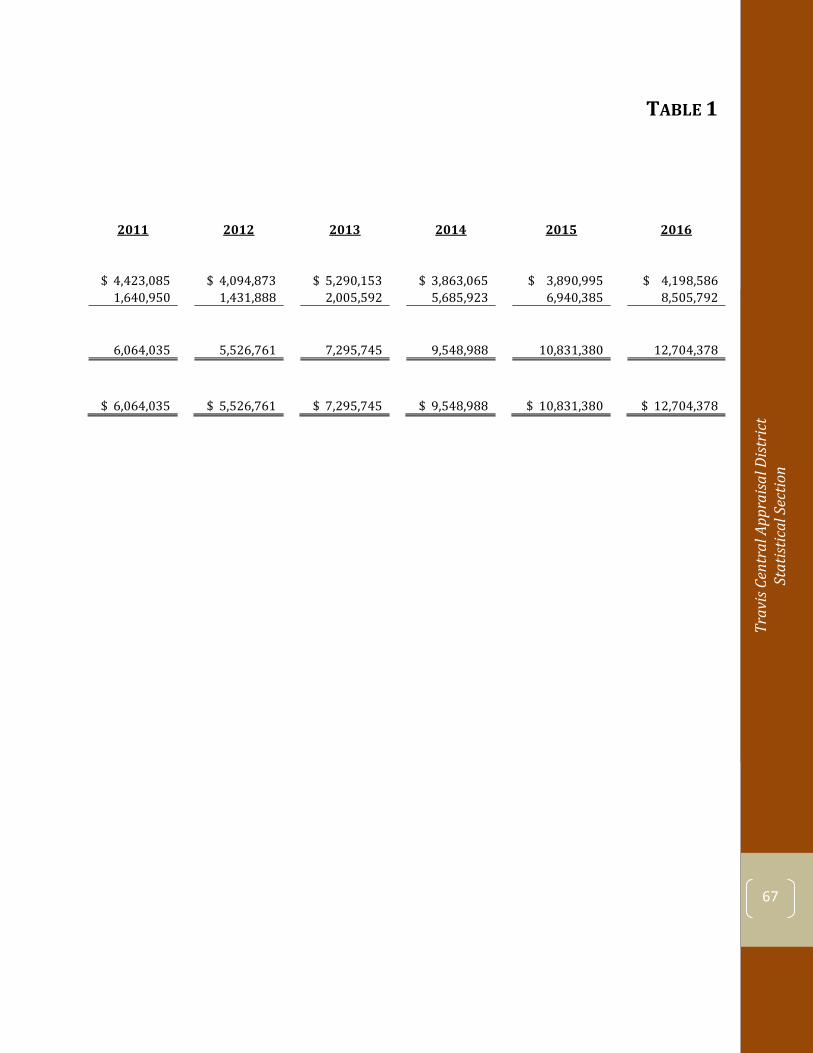
Trav
is Ce
ntra
l App
raisa
l Dist
rict
St
atist
ical
Sec
tion
67
TRAVIS CENTRAL APPRAISAL DISTRICT TABLE 1
Net Position by Component Last Ten Fiscal Years
(Accrual Basis of Accounting- Unaudited)
2011
2012
2013
2014
2015
2016
$ 4,423,085
$ 4,094,873
$ 5,290,153
$ 3,863,065
$ 3,890,995
$ 4,198,586
1,640,950
1,431,888
2,005,592
5,685,923
6,940,385
8,505,792
6,064,035
5,526,761
7,295,745
9,548,988
10,831,380
12,704,378
$ 6,064,035
$ 5,526,761
$ 7,295,745
$ 9,548,988
$ 10,831,380
$ 12,704,378
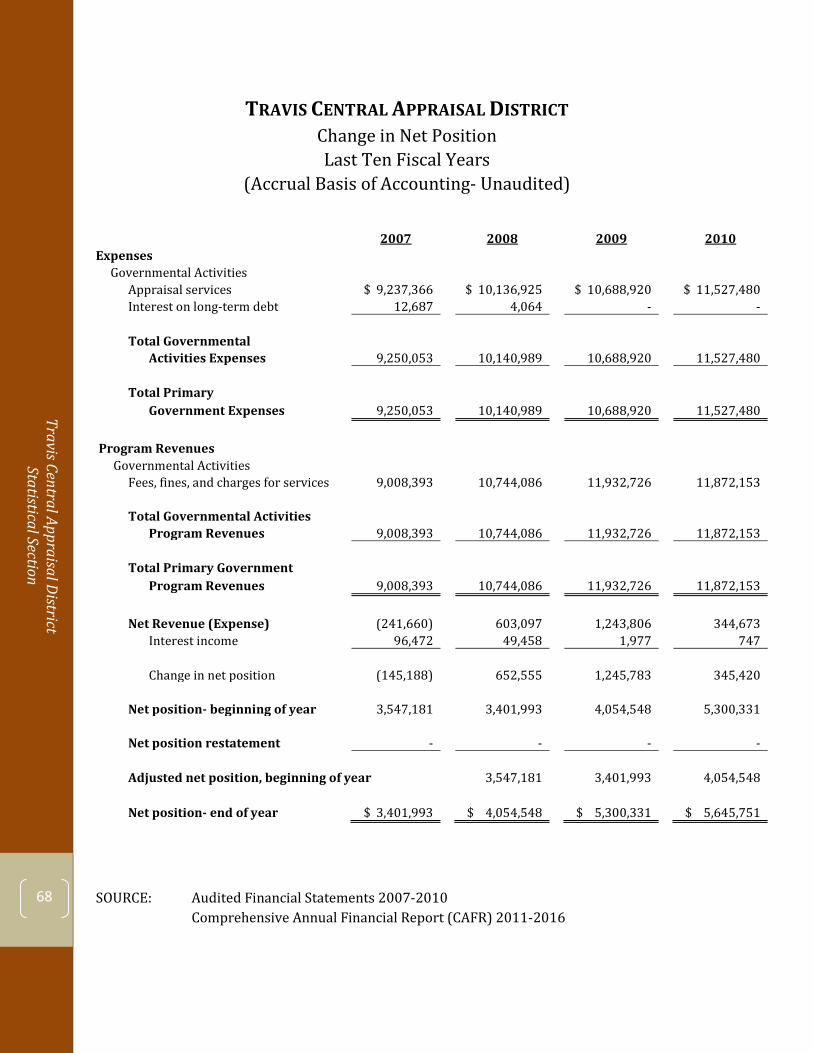
Travis Central Appraisal District Statistical Section
68
TRAVIS CENTRAL APPRAISAL DISTRICT
Change in Net Position Last Ten Fiscal Years
(Accrual Basis of Accounting- Unaudited)
2007
2008
2009
2010
Expenses
Governmental Activities
Appraisal services
$ 9,237,366
$ 10,136,925
$ 10,688,920
$ 11,527,480
Interest on long-term debt
12,687
4,064
-
-
Total Governmental
Activities Expenses
9,250,053
10,140,989
10,688,920
11,527,480
Total Primary
Government Expenses
9,250,053
10,140,989
10,688,920
11,527,480
Program Revenues
Governmental Activities
Fees, fines, and charges for services
9,008,393
10,744,086
11,932,726
11,872,153
Total Governmental Activities
Program Revenues
9,008,393
10,744,086
11,932,726
11,872,153
Total Primary Government
Program Revenues
9,008,393
10,744,086
11,932,726
11,872,153
Net Revenue (Expense)
(241,660)
603,097
1,243,806
344,673
Interest income
96,472
49,458
1,977
747
Change in net position
(145,188)
652,555
1,245,783
345,420
Net position- beginning of year
3,547,181
3,401,993
4,054,548
5,300,331
Net position restatement
-
-
-
-
Adjusted net position, beginning of year
3,547,181
3,401,993
4,054,548
Net position- end of year
$ 3,401,993
$ 4,054,548
$ 5,300,331
$ 5,645,751
SOURCE: Audited Financial Statements 2007-2010 Comprehensive Annual Financial Report (CAFR) 2011-2016
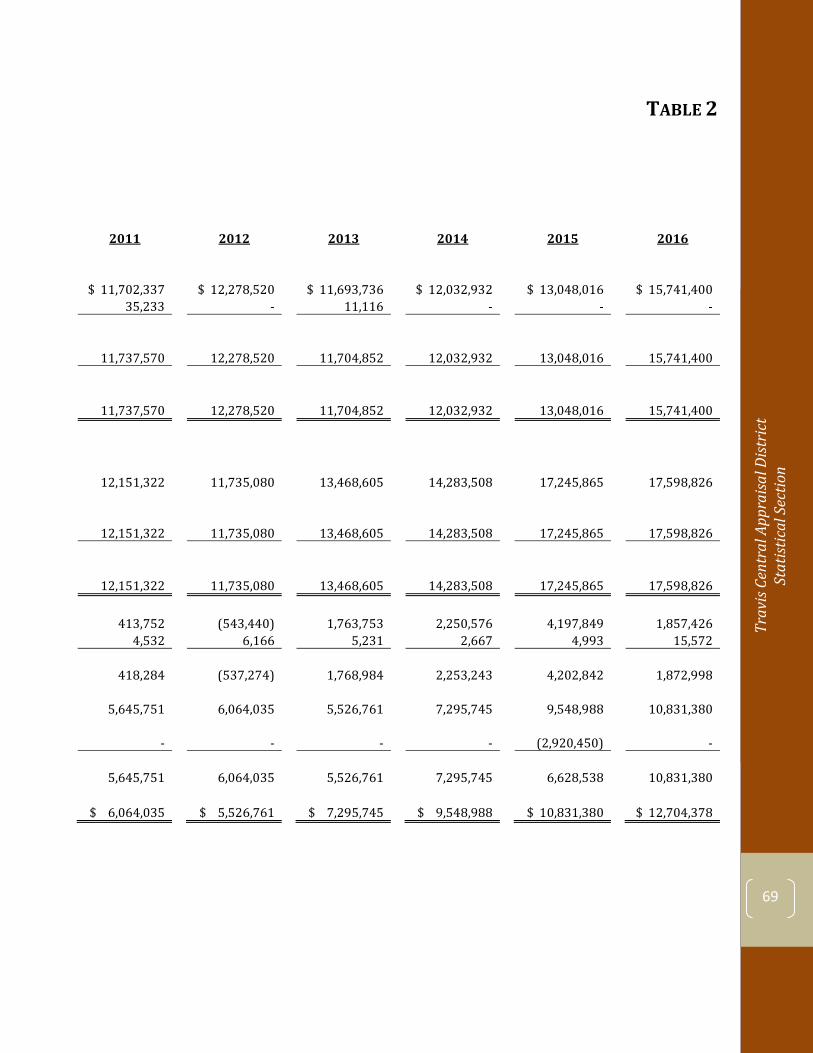
Trav
is Ce
ntra
l App
raisa
l Dist
rict
St
atist
ical
Sec
tion
69
TRAVIS CENTRAL APPRAISAL DISTRICT TABLE 2Change in Net Position Last Ten Fiscal Years
(Accrual Basis of Accounting- Unaudited)
2011 2012 2013 2014 2015 2016
$ 11,702,337 $ 12,278,520 $ 11,693,736 $ 12,032,932 $ 13,048,016 $ 15,741,400 35,233 - 11,116 - - -
11,737,570 12,278,520 11,704,852 12,032,932 13,048,016 15,741,400
11,737,570 12,278,520 11,704,852 12,032,932 13,048,016 15,741,400
12,151,322 11,735,080 13,468,605 14,283,508 17,245,865 17,598,826
12,151,322 11,735,080 13,468,605 14,283,508 17,245,865 17,598,826
12,151,322 11,735,080 13,468,605 14,283,508 17,245,865 17,598,826
413,752 (543,440) 1,763,753 2,250,576 4,197,849 1,857,426 4,532 6,166 5,231 2,667 4,993 15,572
418,284 (537,274) 1,768,984 2,253,243 4,202,842 1,872,998
5,645,751 6,064,035 5,526,761 7,295,745 9,548,988 10,831,380
- - - - (2,920,450) -
5,645,751 6,064,035 5,526,761 7,295,745 6,628,538 10,831,380
$ 6,064,035 $ 5,526,761 $ 7,295,745 $ 9,548,988 $ 10,831,380 $ 12,704,378
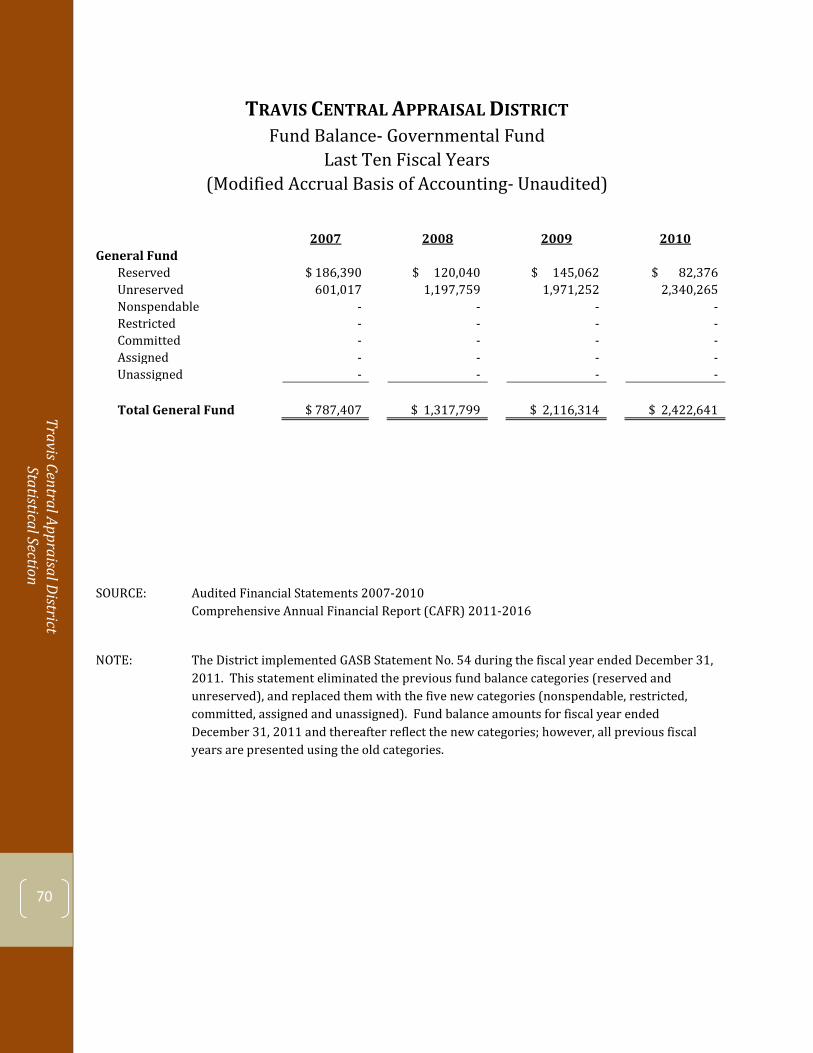
Travis Central Appraisal District Statistical Section
70
TRAVIS CENTRAL APPRAISAL DISTRICT
Fund Balance- Governmental Fund Last Ten Fiscal Years
(Modified Accrual Basis of Accounting- Unaudited)
2007
2008
2009
2010
General Fund
Reserved
$ 186,390
$ 120,040
$ 145,062
$ 82,376
Unreserved
601,017
1,197,759
1,971,252
2,340,265
Nonspendable
-
-
-
-
Restricted
-
-
-
-
Committed
-
-
-
-
Assigned
-
-
-
-
Unassigned
-
-
-
-
Total General Fund
$ 787,407
$ 1,317,799
$ 2,116,314
$ 2,422,641
SOURCE: Audited Financial Statements 2007-2010 Comprehensive Annual Financial Report (CAFR) 2011-2016
NOTE: The District implemented GASB Statement No. 54 during the fiscal year ended December 31, 2011. This statement eliminated the previous fund balance categories (reserved and unreserved), and replaced them with the five new categories (nonspendable, restricted, committed, assigned and unassigned). Fund balance amounts for fiscal year ended December 31, 2011 and thereafter reflect the new categories; however, all previous fiscal years are presented using the old categories.
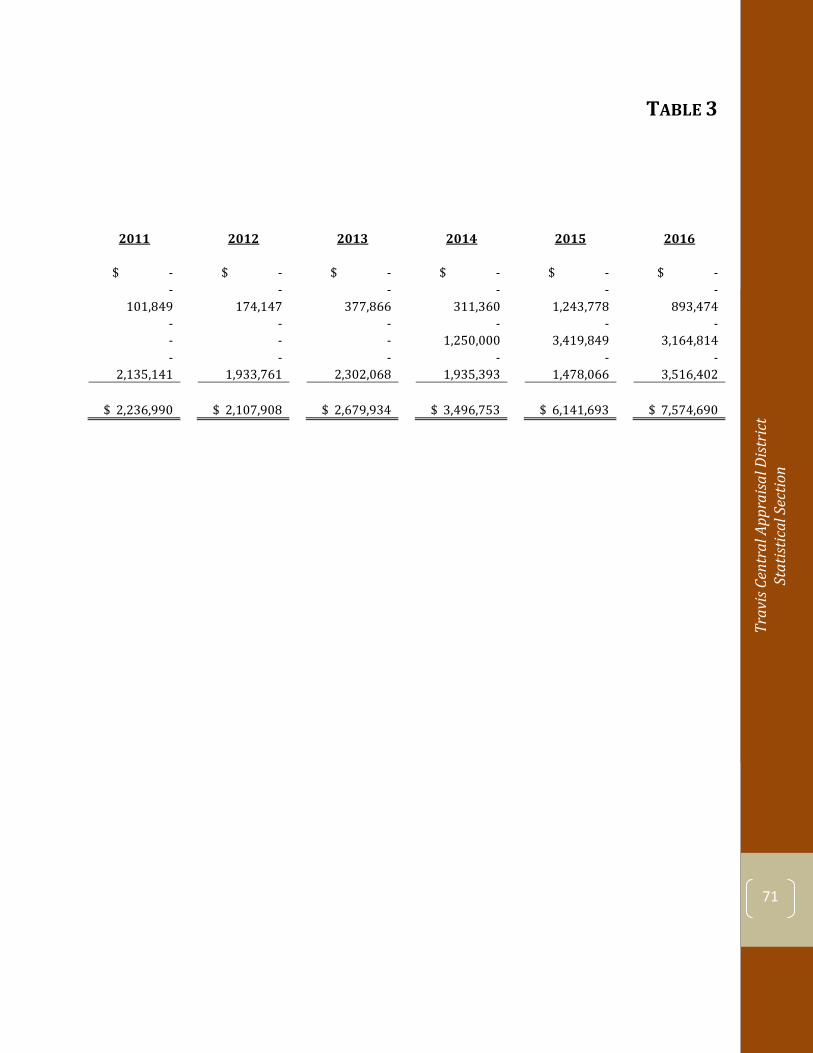
Trav
is Ce
ntra
l App
raisa
l Dist
rict
St
atist
ical
Sec
tion
71
TRAVIS CENTRAL APPRAISAL DISTRICT TABLE 3Change in Net Position Last Ten Fiscal Years
(Accrual Basis of Accounting- Unaudited)
2011 2012 2013 2014 2015 2016
$ - $ - $ - $ - $ - $ - - - - - - -
101,849 174,147 377,866 311,360 1,243,778 893,474 - - - - - - - - - 1,250,000 3,419,849 3,164,814 - - - - - -
2,135,141 1,933,761 2,302,068 1,935,393 1,478,066 3,516,402
$ 2,236,990 $ 2,107,908 $ 2,679,934 $ 3,496,753 $ 6,141,693 $ 7,574,690
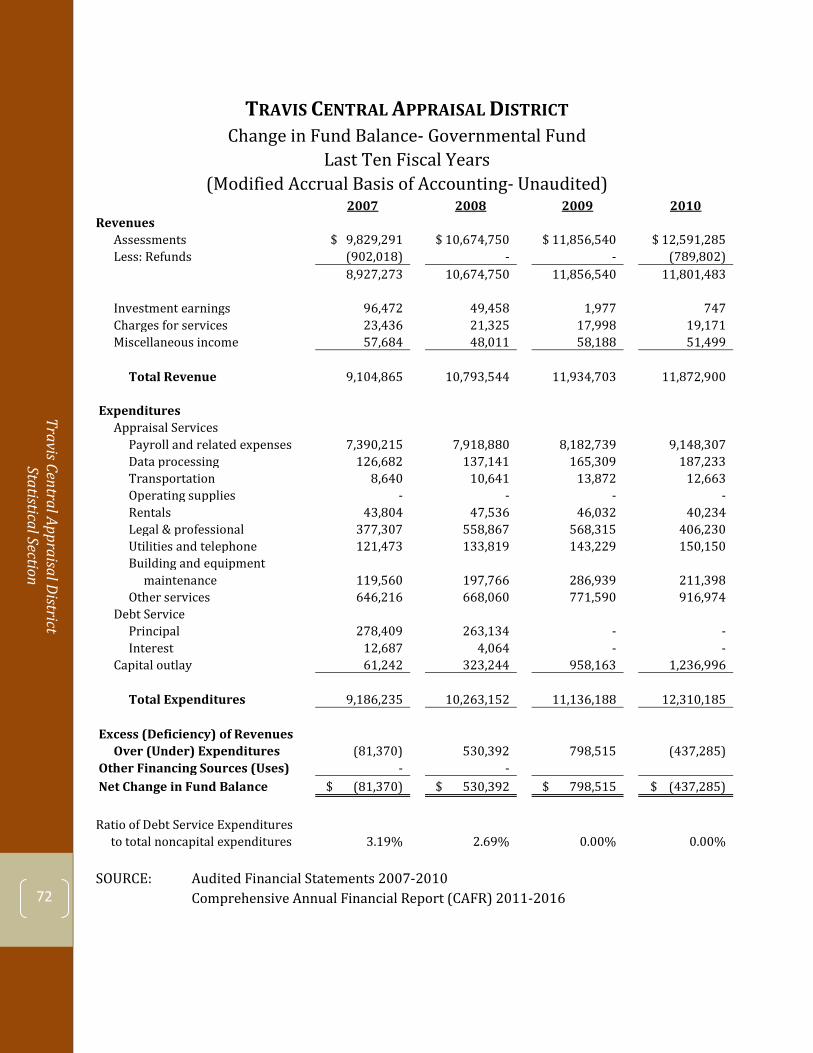
Travis Central Appraisal District Statistical Section
72
TRAVIS CENTRAL APPRAISAL DISTRICT
Change in Fund Balance- Governmental Fund Last Ten Fiscal Years
(Modified Accrual Basis of Accounting- Unaudited)
2007
2008
2009
2010
Revenues
Assessments
$ 9,829,291
$ 10,674,750
$ 11,856,540
$ 12,591,285
Less: Refunds
(902,018)
-
-
(789,802)
8,927,273
10,674,750
11,856,540
11,801,483
Investment earnings
96,472
49,458
1,977
747
Charges for services
23,436
21,325
17,998
19,171
Miscellaneous income
57,684
48,011
58,188
51,499
Total Revenue
9,104,865
10,793,544
11,934,703
11,872,900
Expenditures
Appraisal Services
Payroll and related expenses
7,390,215
7,918,880
8,182,739
9,148,307
Data processing
126,682
137,141
165,309
187,233
Transportation
8,640
10,641
13,872
12,663
Operating supplies
-
-
-
-
Rentals
43,804
47,536
46,032
40,234
Legal & professional
377,307
558,867
568,315
406,230
Utilities and telephone
121,473
133,819
143,229
150,150
Building and equipment
maintenance
119,560
197,766
286,939
211,398
Other services
646,216
668,060
771,590
916,974
Debt Service
Principal
278,409
263,134
-
-
Interest
12,687
4,064
-
-
Capital outlay
61,242
323,244
958,163
1,236,996
Total Expenditures
9,186,235
10,263,152
11,136,188
12,310,185
Excess (Deficiency) of Revenues
Over (Under) Expenditures
(81,370)
530,392
798,515
(437,285)
Other Financing Sources (Uses)
-
-
Net Change in Fund Balance
$ (81,370)
$ 530,392
$ 798,515
$ (437,285)
Ratio of Debt Service Expenditures
to total noncapital expenditures
3.19%
2.69%
0.00%
0.00%
SOURCE: Audited Financial Statements 2007-2010 Comprehensive Annual Financial Report (CAFR) 2011-2016
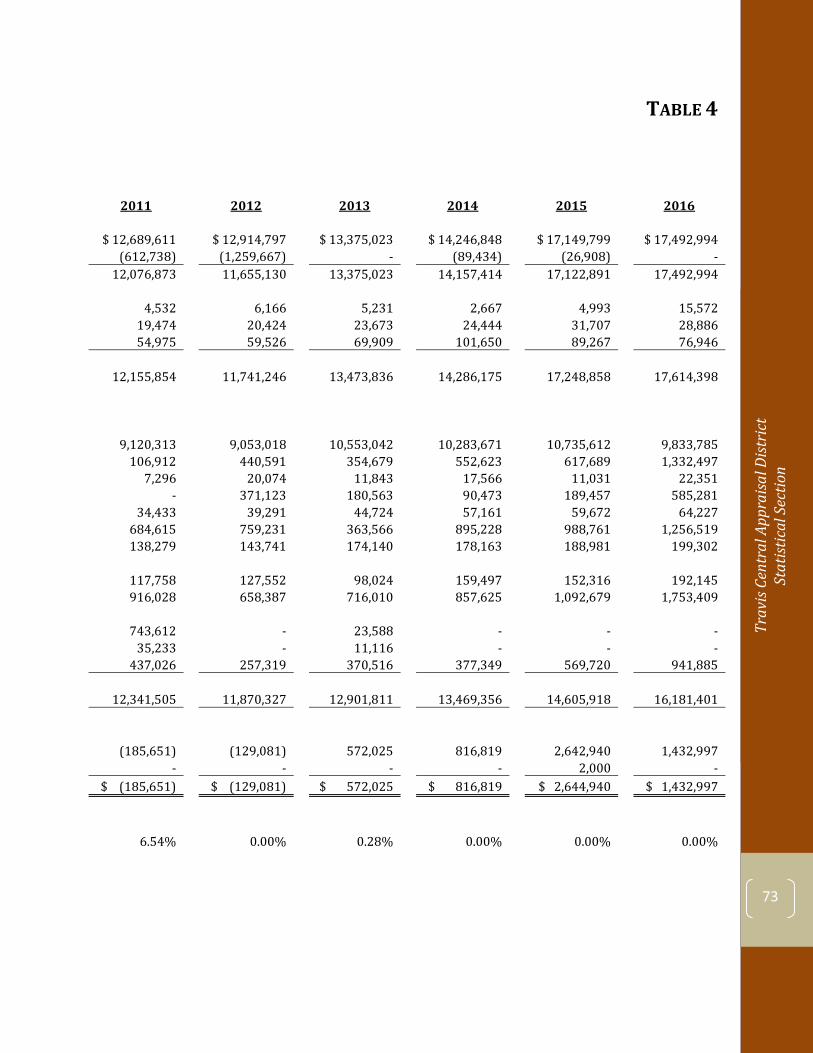
Trav
is Ce
ntra
l App
raisa
l Dist
rict
St
atist
ical
Sec
tion
73
TABLE 4
Change in Net Position cal Years
(Accruaed) 2011
2012
2013
2014
2015
2016
$ 12,689,611
$ 12,914,797
$ 13,375,023
$ 14,246,848
$ 17,149,799
$ 17,492,994 (612,738)
(1,259,667)
-
(89,434)
(26,908)
-
12,076,873
11,655,130
13,375,023
14,157,414
17,122,891
17,492,994
4,532
6,166
5,231
2,667
4,993
15,572 19,474
20,424
23,673
24,444
31,707
28,886
54,975
59,526
69,909
101,650
89,267
76,946
12,155,854
11,741,246
13,473,836
14,286,175
17,248,858
17,614,398
9,120,313
9,053,018
10,553,042
10,283,671
10,735,612
9,833,785
106,912
440,591
354,679
552,623
617,689
1,332,497 7,296
20,074
11,843
17,566
11,031
22,351
-
371,123
180,563
90,473
189,457
585,281 34,433
39,291
44,724
57,161
59,672
64,227
684,615
759,231
363,566
895,228
988,761
1,256,519 138,279
143,741
174,140
178,163
188,981
199,302
117,758
127,552
98,024
159,497
152,316
192,145 916,028
658,387
716,010
857,625
1,092,679
1,753,409
743,612
-
23,588
-
-
- 35,233
-
11,116
-
-
-
437,026
257,319
370,516
377,349
569,720
941,885
12,341,505
11,870,327
12,901,811
13,469,356
14,605,918
16,181,401
(185,651)
(129,081)
572,025
816,819
2,642,940
1,432,997
-
-
-
-
2,000
- $ (185,651)
$ (129,081)
$ 572,025
$ 816,819
$ 2,644,940
$ 1,432,997
6.54%
0.00%
0.28%
0.00%
0.00%
0.00%
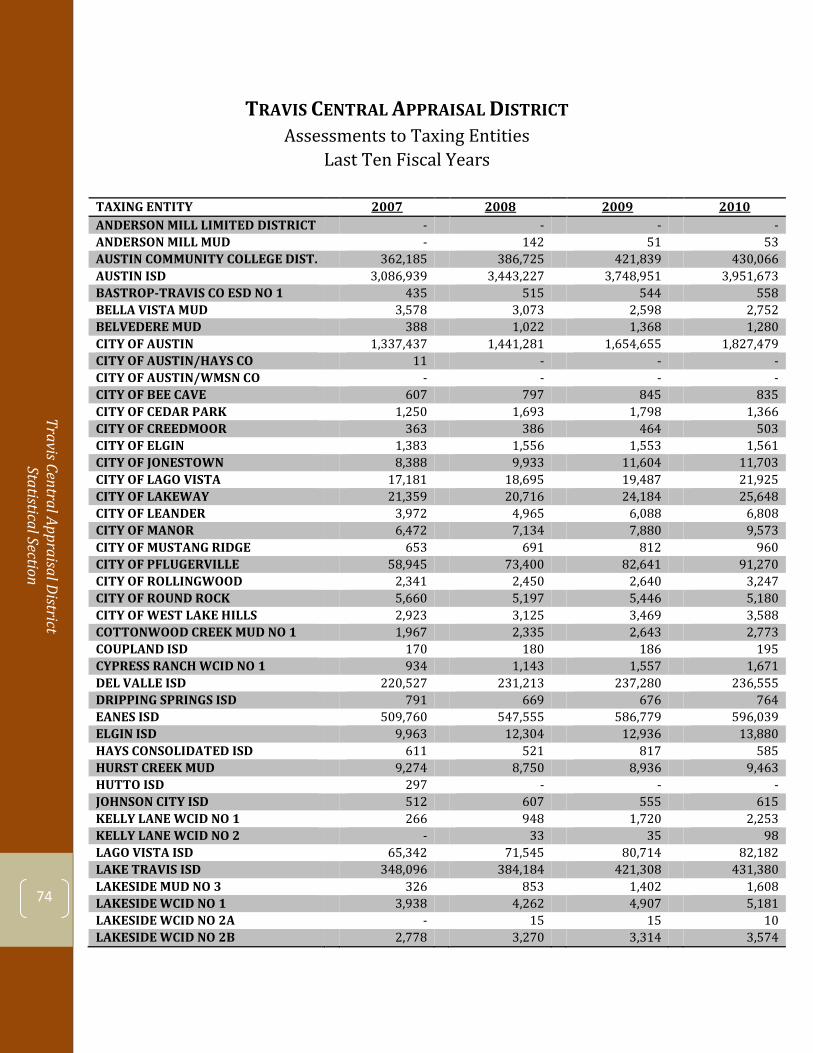
Travis Central Appraisal District Statistical Section
74
TRAVIS CENTRAL APPRAISAL DISTRICT
Assessments to Taxing Entities Last Ten Fiscal Years
TAXING ENTITY 2007 2008 2009 2010 ANDERSON MILL LIMITED DISTRICT - - - - ANDERSON MILL MUD - 142 51 53 AUSTIN COMMUNITY COLLEGE DIST. 362,185 386,725 421,839 430,066 AUSTIN ISD 3,086,939 3,443,227 3,748,951 3,951,673 BASTROP-TRAVIS CO ESD NO 1 435 515 544 558 BELLA VISTA MUD 3,578 3,073 2,598 2,752 BELVEDERE MUD 388 1,022 1,368 1,280 CITY OF AUSTIN 1,337,437 1,441,281 1,654,655 1,827,479 CITY OF AUSTIN/HAYS CO 11 - - - CITY OF AUSTIN/WMSN CO - - - - CITY OF BEE CAVE 607 797 845 835 CITY OF CEDAR PARK 1,250 1,693 1,798 1,366 CITY OF CREEDMOOR 363 386 464 503 CITY OF ELGIN 1,383 1,556 1,553 1,561 CITY OF JONESTOWN 8,388 9,933 11,604 11,703 CITY OF LAGO VISTA 17,181 18,695 19,487 21,925 CITY OF LAKEWAY 21,359 20,716 24,184 25,648 CITY OF LEANDER 3,972 4,965 6,088 6,808 CITY OF MANOR 6,472 7,134 7,880 9,573 CITY OF MUSTANG RIDGE 653 691 812 960 CITY OF PFLUGERVILLE 58,945 73,400 82,641 91,270 CITY OF ROLLINGWOOD 2,341 2,450 2,640 3,247 CITY OF ROUND ROCK 5,660 5,197 5,446 5,180 CITY OF WEST LAKE HILLS 2,923 3,125 3,469 3,588 COTTONWOOD CREEK MUD NO 1 1,967 2,335 2,643 2,773 COUPLAND ISD 170 180 186 195 CYPRESS RANCH WCID NO 1 934 1,143 1,557 1,671 DEL VALLE ISD 220,527 231,213 237,280 236,555 DRIPPING SPRINGS ISD 791 669 676 764 EANES ISD 509,760 547,555 586,779 596,039 ELGIN ISD 9,963 12,304 12,936 13,880 HAYS CONSOLIDATED ISD 611 521 817 585 HURST CREEK MUD 9,274 8,750 8,936 9,463 HUTTO ISD 297 - - - JOHNSON CITY ISD 512 607 555 615 KELLY LANE WCID NO 1 266 948 1,720 2,253 KELLY LANE WCID NO 2 - 33 35 98 LAGO VISTA ISD 65,342 71,545 80,714 82,182 LAKE TRAVIS ISD 348,096 384,184 421,308 431,380 LAKESIDE MUD NO 3 326 853 1,402 1,608 LAKESIDE WCID NO 1 3,938 4,262 4,907 5,181 LAKESIDE WCID NO 2A - 15 15 10 LAKESIDE WCID NO 2B 2,778 3,270 3,314 3,574
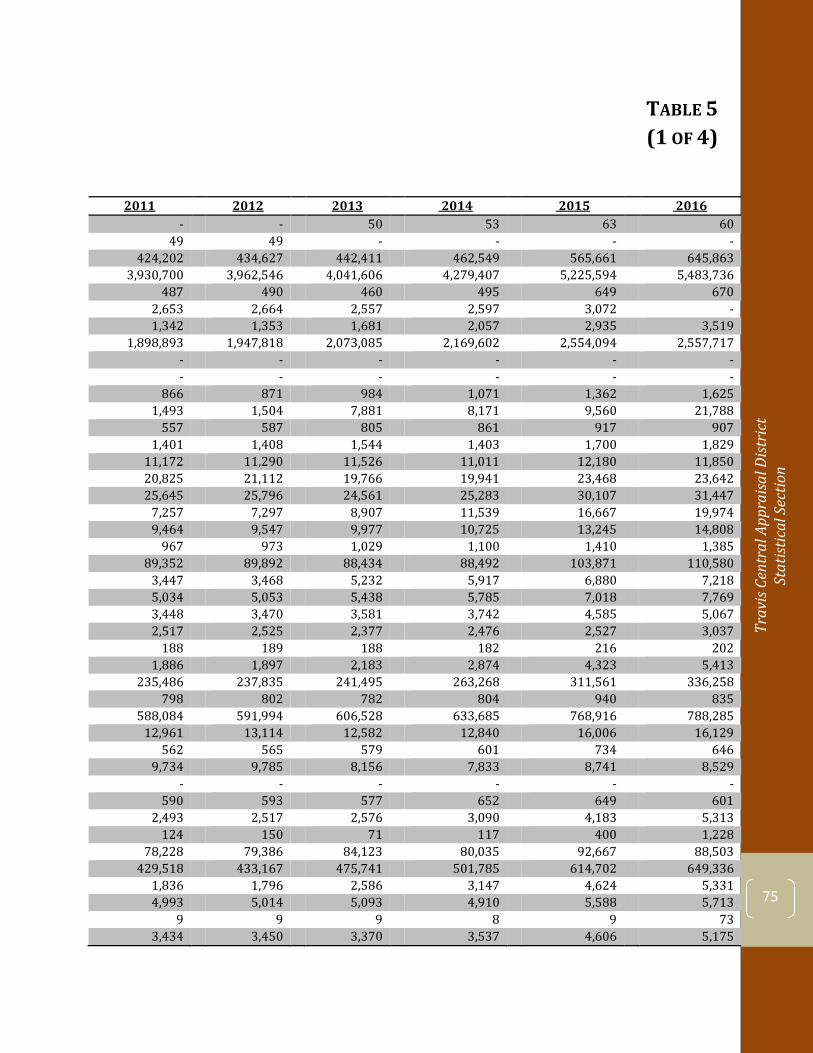
Trav
is Ce
ntra
l App
raisa
l Dist
rict
St
atist
ical
Sec
tion
75
TABLE 5Change in Net Position (1 OF 4)
TRAVIS CENTRAL APPRAISAL DISTRICT 2011 2012 2013 2014 2015 2016
- - 50 53 63 60 49 49 - - - -
424,202 434,627 442,411 462,549 565,661 645,863 3,930,700 3,962,546 4,041,606 4,279,407 5,225,594 5,483,736
487 490 460 495 649 670 2,653 2,664 2,557 2,597 3,072 - 1,342 1,353 1,681 2,057 2,935 3,519
1,898,893 1,947,818 2,073,085 2,169,602 2,554,094 2,557,717 - - - - - - - - - - - -
866 871 984 1,071 1,362 1,625 1,493 1,504 7,881 8,171 9,560 21,788
557 587 805 861 917 907 1,401 1,408 1,544 1,403 1,700 1,829 11,172 11,290 11,526 11,011 12,180 11,850 20,825 21,112 19,766 19,941 23,468 23,642 25,645 25,796 24,561 25,283 30,107 31,447 7,257 7,297 8,907 11,539 16,667 19,974 9,464 9,547 9,977 10,725 13,245 14,808
967 973 1,029 1,100 1,410 1,385 89,352 89,892 88,434 88,492 103,871 110,580 3,447 3,468 5,232 5,917 6,880 7,218 5,034 5,053 5,438 5,785 7,018 7,769 3,448 3,470 3,581 3,742 4,585 5,067 2,517 2,525 2,377 2,476 2,527 3,037
188 189 188 182 216 202 1,886 1,897 2,183 2,874 4,323 5,413
235,486 237,835 241,495 263,268 311,561 336,258 798 802 782 804 940 835
588,084 591,994 606,528 633,685 768,916 788,285 12,961 13,114 12,582 12,840 16,006 16,129
562 565 579 601 734 646 9,734 9,785 8,156 7,833 8,741 8,529
- - - - - - 590 593 577 652 649 601
2,493 2,517 2,576 3,090 4,183 5,313 124 150 71 117 400 1,228
78,228 79,386 84,123 80,035 92,667 88,503 429,518 433,167 475,741 501,785 614,702 649,336
1,836 1,796 2,586 3,147 4,624 5,331 4,993 5,014 5,093 4,910 5,588 5,713
9 9 9 8 9 73 3,434 3,450 3,370 3,537 4,606 5,175
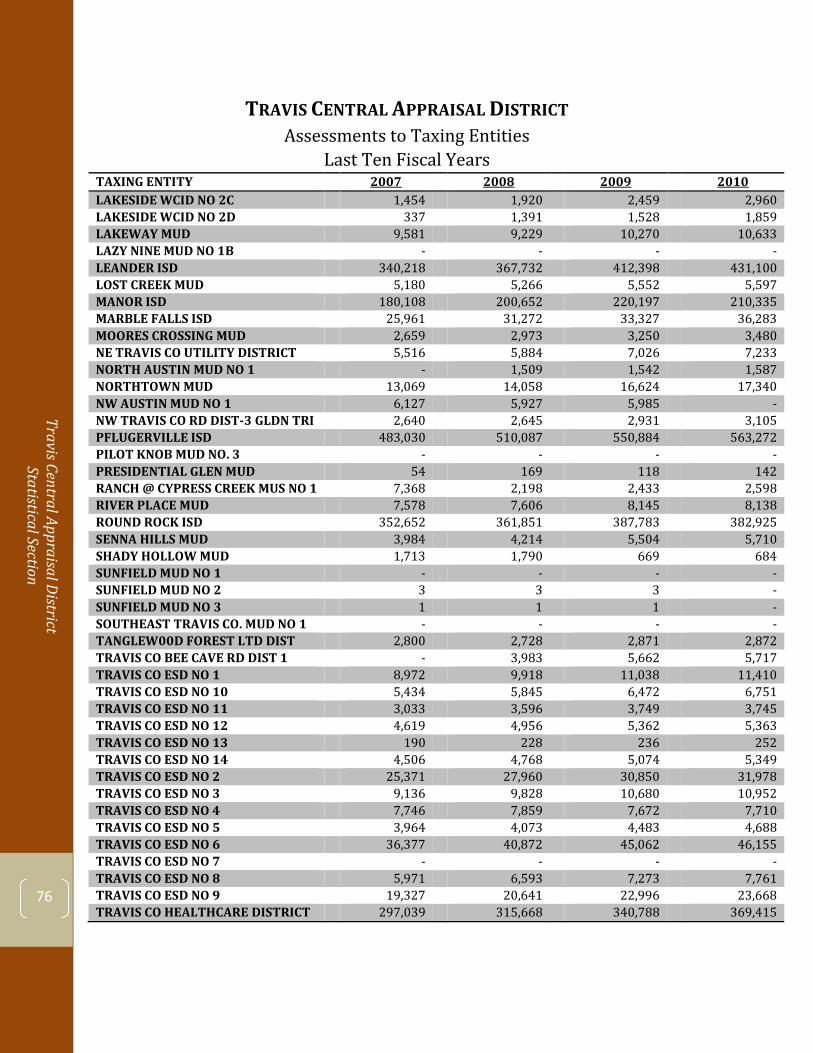
Travis Central Appraisal District Statistical Section
76
TRAVIS CENTRAL APPRAISAL DISTRICT
Assessments to Taxing Entities Last Ten Fiscal Years
TAXING ENTITY 2007 2008 2009 2010 LAKESIDE WCID NO 2C 1,454 1,920 2,459 2,960 LAKESIDE WCID NO 2D 337 1,391 1,528 1,859 LAKEWAY MUD 9,581 9,229 10,270 10,633 LAZY NINE MUD NO 1B - - - - LEANDER ISD 340,218 367,732 412,398 431,100 LOST CREEK MUD 5,180 5,266 5,552 5,597 MANOR ISD 180,108 200,652 220,197 210,335 MARBLE FALLS ISD 25,961 31,272 33,327 36,283 MOORES CROSSING MUD 2,659 2,973 3,250 3,480 NE TRAVIS CO UTILITY DISTRICT 5,516 5,884 7,026 7,233 NORTH AUSTIN MUD NO 1 - 1,509 1,542 1,587 NORTHTOWN MUD 13,069 14,058 16,624 17,340 NW AUSTIN MUD NO 1 6,127 5,927 5,985 - NW TRAVIS CO RD DIST-3 GLDN TRI 2,640 2,645 2,931 3,105 PFLUGERVILLE ISD 483,030 510,087 550,884 563,272 PILOT KNOB MUD NO. 3 - - - - PRESIDENTIAL GLEN MUD 54 169 118 142 RANCH @ CYPRESS CREEK MUS NO 1 7,368 2,198 2,433 2,598 RIVER PLACE MUD 7,578 7,606 8,145 8,138 ROUND ROCK ISD 352,652 361,851 387,783 382,925 SENNA HILLS MUD 3,984 4,214 5,504 5,710 SHADY HOLLOW MUD 1,713 1,790 669 684 SUNFIELD MUD NO 1 - - - - SUNFIELD MUD NO 2 3 3 3 - SUNFIELD MUD NO 3 1 1 1 - SOUTHEAST TRAVIS CO. MUD NO 1 - - - - TANGLEW00D FOREST LTD DIST 2,800 2,728 2,871 2,872 TRAVIS CO BEE CAVE RD DIST 1 - 3,983 5,662 5,717 TRAVIS CO ESD NO 1 8,972 9,918 11,038 11,410 TRAVIS CO ESD NO 10 5,434 5,845 6,472 6,751 TRAVIS CO ESD NO 11 3,033 3,596 3,749 3,745 TRAVIS CO ESD NO 12 4,619 4,956 5,362 5,363 TRAVIS CO ESD NO 13 190 228 236 252 TRAVIS CO ESD NO 14 4,506 4,768 5,074 5,349 TRAVIS CO ESD NO 2 25,371 27,960 30,850 31,978 TRAVIS CO ESD NO 3 9,136 9,828 10,680 10,952 TRAVIS CO ESD NO 4 7,746 7,859 7,672 7,710 TRAVIS CO ESD NO 5 3,964 4,073 4,483 4,688 TRAVIS CO ESD NO 6 36,377 40,872 45,062 46,155 TRAVIS CO ESD NO 7 - - - - TRAVIS CO ESD NO 8 5,971 6,593 7,273 7,761 TRAVIS CO ESD NO 9 19,327 20,641 22,996 23,668 TRAVIS CO HEALTHCARE DISTRICT 297,039 315,668 340,788 369,415
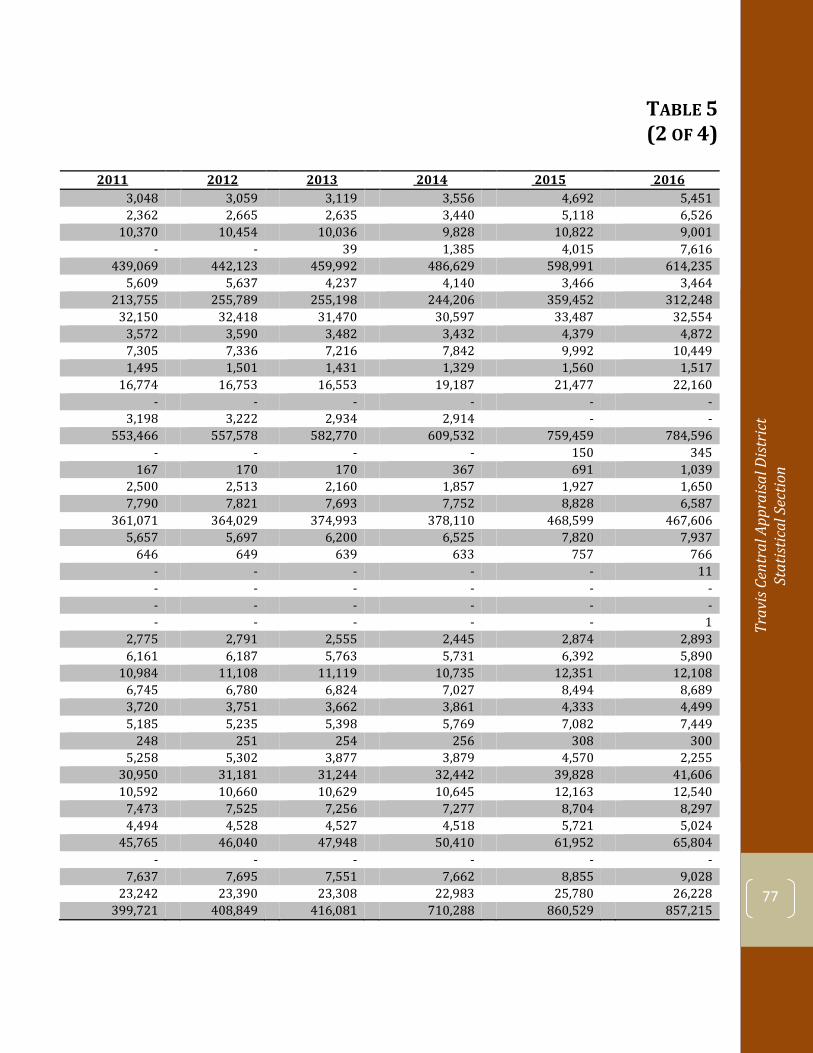
Trav
is Ce
ntra
l App
raisa
l Dist
rict
St
atist
ical
Sec
tion
77
TRAVIS CENTRAL APPRAISAL DISTRICT TABLE 5
Change in Net Position (2 OF 4)
2011 2012 2013 2014 2015 2016 3,048 3,059 3,119 3,556 4,692 5,451 2,362 2,665 2,635 3,440 5,118 6,526 10,370 10,454 10,036 9,828 10,822 9,001
- - 39 1,385 4,015 7,616 439,069 442,123 459,992 486,629 598,991 614,235 5,609 5,637 4,237 4,140 3,466 3,464
213,755 255,789 255,198 244,206 359,452 312,248 32,150 32,418 31,470 30,597 33,487 32,554 3,572 3,590 3,482 3,432 4,379 4,872 7,305 7,336 7,216 7,842 9,992 10,449 1,495 1,501 1,431 1,329 1,560 1,517 16,774 16,753 16,553 19,187 21,477 22,160
- - - - - - 3,198 3,222 2,934 2,914 - -
553,466 557,578 582,770 609,532 759,459 784,596 - - - - 150 345
167 170 170 367 691 1,039 2,500 2,513 2,160 1,857 1,927 1,650 7,790 7,821 7,693 7,752 8,828 6,587
361,071 364,029 374,993 378,110 468,599 467,606 5,657 5,697 6,200 6,525 7,820 7,937 646 649 639 633 757 766
- - - - - 11 - - - - - - - - - - - - - - - - - 1
2,775 2,791 2,555 2,445 2,874 2,893 6,161 6,187 5,763 5,731 6,392 5,890 10,984 11,108 11,119 10,735 12,351 12,108 6,745 6,780 6,824 7,027 8,494 8,689 3,720 3,751 3,662 3,861 4,333 4,499 5,185 5,235 5,398 5,769 7,082 7,449 248 251 254 256 308 300 5,258 5,302 3,877 3,879 4,570 2,255 30,950 31,181 31,244 32,442 39,828 41,606 10,592 10,660 10,629 10,645 12,163 12,540 7,473 7,525 7,256 7,277 8,704 8,297 4,494 4,528 4,527 4,518 5,721 5,024 45,765 46,040 47,948 50,410 61,952 65,804
- - - - - - 7,637 7,695 7,551 7,662 8,855 9,028 23,242 23,390 23,308 22,983 25,780 26,228 399,721 408,849 416,081 710,288 860,529 857,215
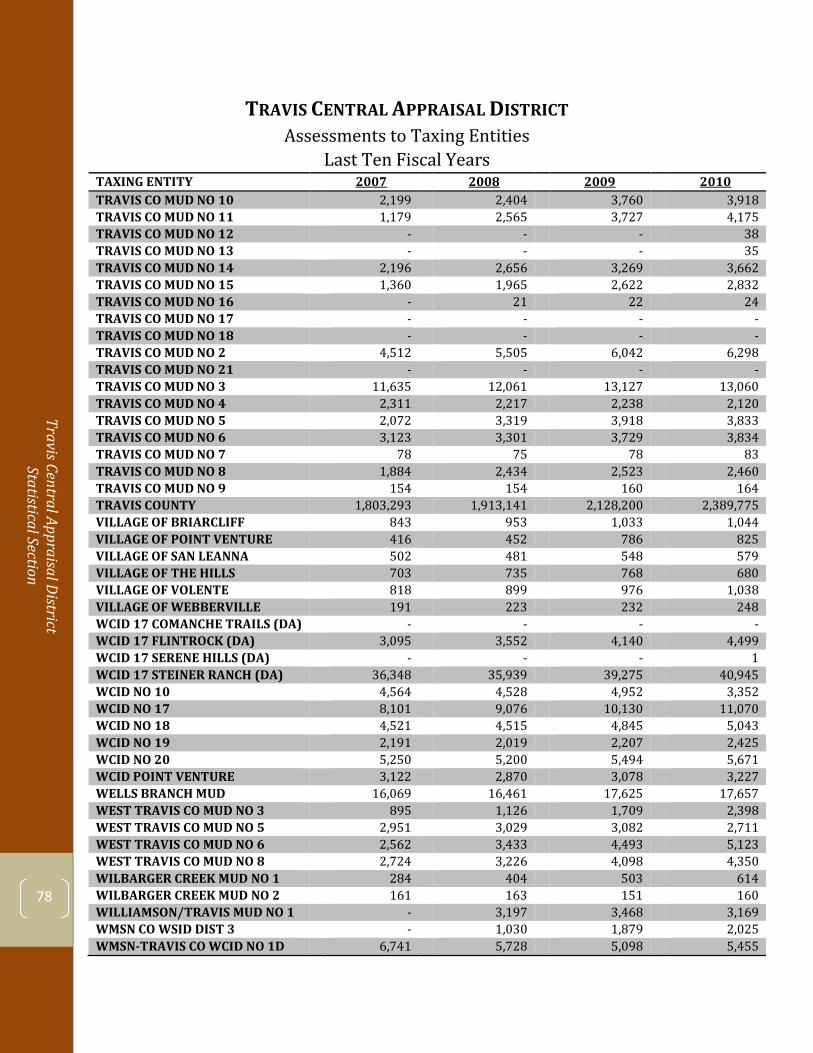
Travis Central Appraisal District Statistical Section
78
TRAVIS CENTRAL APPRAISAL DISTRICT
Assessments to Taxing Entities Last Ten Fiscal Years
TAXING ENTITY 2007 2008 2009 2010 TRAVIS CO MUD NO 10 2,199 2,404 3,760 3,918 TRAVIS CO MUD NO 11 1,179 2,565 3,727 4,175 TRAVIS CO MUD NO 12 - - - 38 TRAVIS CO MUD NO 13 - - - 35 TRAVIS CO MUD NO 14 2,196 2,656 3,269 3,662 TRAVIS CO MUD NO 15 1,360 1,965 2,622 2,832 TRAVIS CO MUD NO 16 - 21 22 24 TRAVIS CO MUD NO 17 - - - - TRAVIS CO MUD NO 18 - - - - TRAVIS CO MUD NO 2 4,512 5,505 6,042 6,298 TRAVIS CO MUD NO 21 - - - - TRAVIS CO MUD NO 3 11,635 12,061 13,127 13,060 TRAVIS CO MUD NO 4 2,311 2,217 2,238 2,120 TRAVIS CO MUD NO 5 2,072 3,319 3,918 3,833 TRAVIS CO MUD NO 6 3,123 3,301 3,729 3,834 TRAVIS CO MUD NO 7 78 75 78 83 TRAVIS CO MUD NO 8 1,884 2,434 2,523 2,460 TRAVIS CO MUD NO 9 154 154 160 164 TRAVIS COUNTY 1,803,293 1,913,141 2,128,200 2,389,775 VILLAGE OF BRIARCLIFF 843 953 1,033 1,044 VILLAGE OF POINT VENTURE 416 452 786 825 VILLAGE OF SAN LEANNA 502 481 548 579 VILLAGE OF THE HILLS 703 735 768 680 VILLAGE OF VOLENTE 818 899 976 1,038 VILLAGE OF WEBBERVILLE 191 223 232 248 WCID 17 COMANCHE TRAILS (DA) - - - - WCID 17 FLINTROCK (DA) 3,095 3,552 4,140 4,499 WCID 17 SERENE HILLS (DA) - - - 1 WCID 17 STEINER RANCH (DA) 36,348 35,939 39,275 40,945 WCID NO 10 4,564 4,528 4,952 3,352 WCID NO 17 8,101 9,076 10,130 11,070 WCID NO 18 4,521 4,515 4,845 5,043 WCID NO 19 2,191 2,019 2,207 2,425 WCID NO 20 5,250 5,200 5,494 5,671 WCID POINT VENTURE 3,122 2,870 3,078 3,227 WELLS BRANCH MUD 16,069 16,461 17,625 17,657 WEST TRAVIS CO MUD NO 3 895 1,126 1,709 2,398 WEST TRAVIS CO MUD NO 5 2,951 3,029 3,082 2,711 WEST TRAVIS CO MUD NO 6 2,562 3,433 4,493 5,123 WEST TRAVIS CO MUD NO 8 2,724 3,226 4,098 4,350 WILBARGER CREEK MUD NO 1 284 404 503 614 WILBARGER CREEK MUD NO 2 161 163 151 160 WILLIAMSON/TRAVIS MUD NO 1 - 3,197 3,468 3,169 WMSN CO WSID DIST 3 - 1,030 1,879 2,025 WMSN-TRAVIS CO WCID NO 1D 6,741 5,728 5,098 5,455
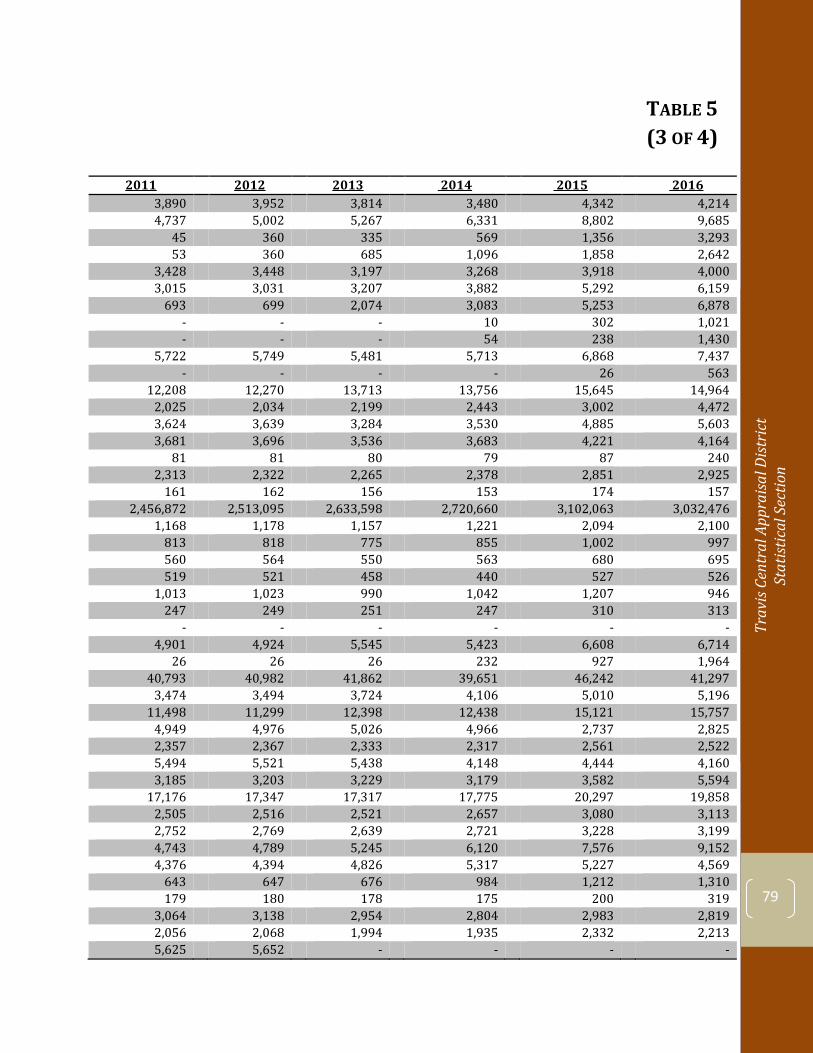
Trav
is Ce
ntra
l App
raisa
l Dist
rict
St
atist
ical
Sec
tion
79
TABLE 5
Change in Net Position (3 OF 4)
2011 2012 2013 2014 2015 2016 3,890 3,952 3,814 3,480 4,342 4,214 4,737 5,002 5,267 6,331 8,802 9,685 45 360 335 569 1,356 3,293 53 360 685 1,096 1,858 2,642 3,428 3,448 3,197 3,268 3,918 4,000 3,015 3,031 3,207 3,882 5,292 6,159 693 699 2,074 3,083 5,253 6,878
- - - 10 302 1,021 - - - 54 238 1,430
5,722 5,749 5,481 5,713 6,868 7,437 - - - - 26 563
12,208 12,270 13,713 13,756 15,645 14,964 2,025 2,034 2,199 2,443 3,002 4,472 3,624 3,639 3,284 3,530 4,885 5,603 3,681 3,696 3,536 3,683 4,221 4,164 81 81 80 79 87 240 2,313 2,322 2,265 2,378 2,851 2,925 161 162 156 153 174 157 2,456,872 2,513,095 2,633,598 2,720,660 3,102,063 3,032,476 1,168 1,178 1,157 1,221 2,094 2,100 813 818 775 855 1,002 997 560 564 550 563 680 695 519 521 458 440 527 526 1,013 1,023 990 1,042 1,207 946 247 249 251 247 310 313
- - - - - - 4,901 4,924 5,545 5,423 6,608 6,714 26 26 26 232 927 1,964 40,793 40,982 41,862 39,651 46,242 41,297 3,474 3,494 3,724 4,106 5,010 5,196 11,498 11,299 12,398 12,438 15,121 15,757 4,949 4,976 5,026 4,966 2,737 2,825 2,357 2,367 2,333 2,317 2,561 2,522 5,494 5,521 5,438 4,148 4,444 4,160 3,185 3,203 3,229 3,179 3,582 5,594 17,176 17,347 17,317 17,775 20,297 19,858 2,505 2,516 2,521 2,657 3,080 3,113 2,752 2,769 2,639 2,721 3,228 3,199 4,743 4,789 5,245 6,120 7,576 9,152 4,376 4,394 4,826 5,317 5,227 4,569 643 647 676 984 1,212 1,310 179 180 178 175 200 319 3,064 3,138 2,954 2,804 2,983 2,819 2,056 2,068 1,994 1,935 2,332 2,213 5,625 5,652 - - - -
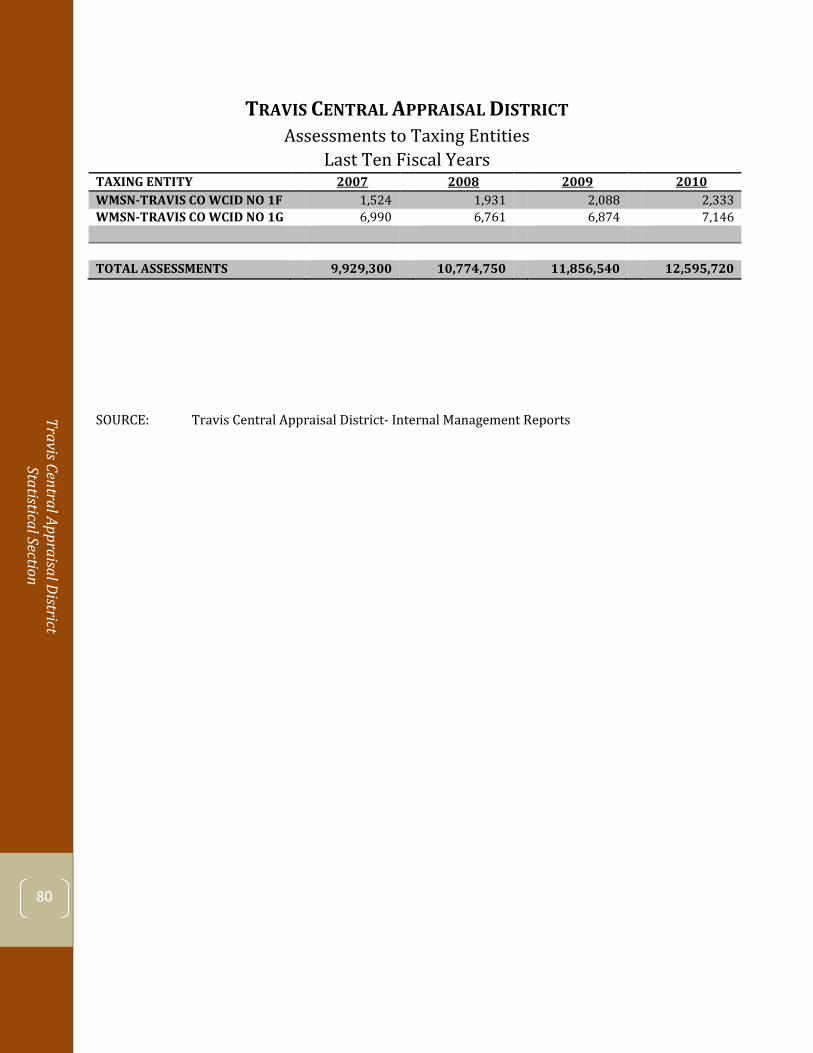
Travis Central Appraisal District Statistical Section
80
TRAVIS CENTRAL APPRAISAL DISTRICTAssessments to Taxing Entities
Last Ten Fiscal Years TAXING ENTITY 2007 2008 2009 2010 WMSN-TRAVIS CO WCID NO 1F 1,524 1,931 2,088 2,333 WMSN-TRAVIS CO WCID NO 1G 6,990 6,761 6,874 7,146
TOTAL ASSESSMENTS 9,929,300 10,774,750 11,856,540 12,595,720
SOURCE: Travis Central Appraisal District- Internal Management Reports
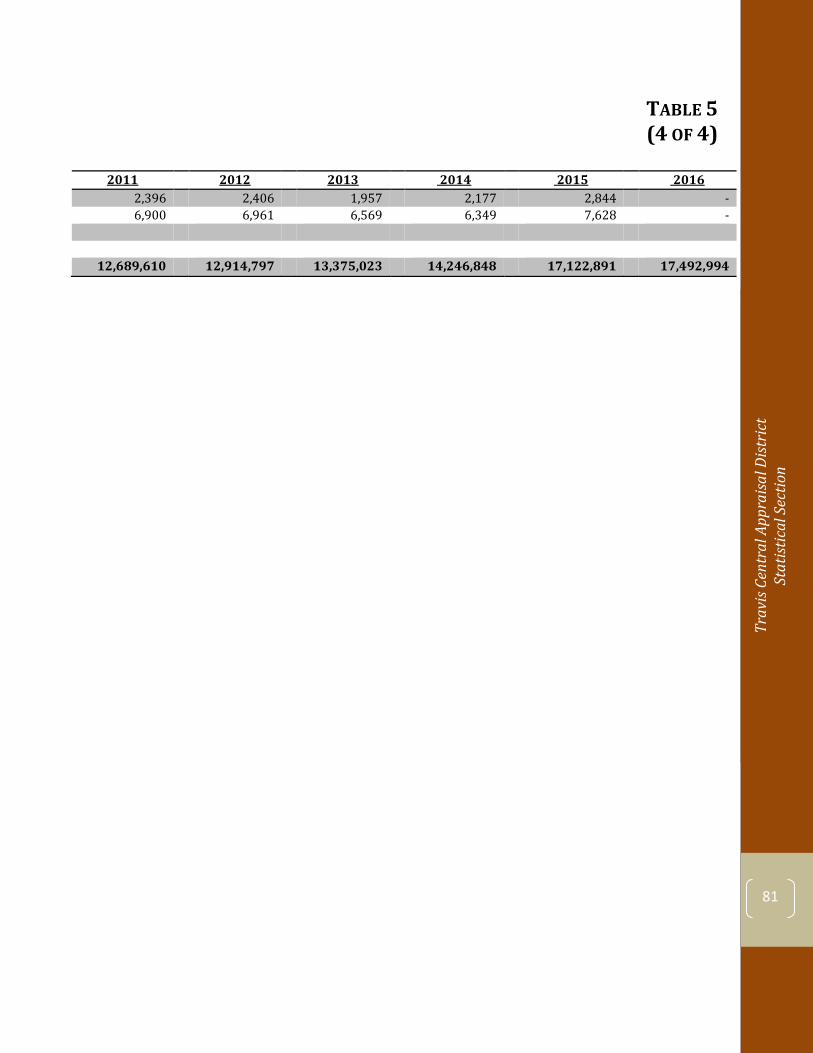
Trav
is Ce
ntra
l App
raisa
l Dist
rict
St
atist
ical
Sec
tion
81
TABLE 5Change in Net Position (4 OF 4)
2011 2012 2013 2014 2015 2016 2,396 2,406 1,957 2,177 2,844 - 6,900 6,961 6,569 6,349 7,628 -
12,689,610 12,914,797 13,375,023 14,246,848 17,122,891 17,492,994
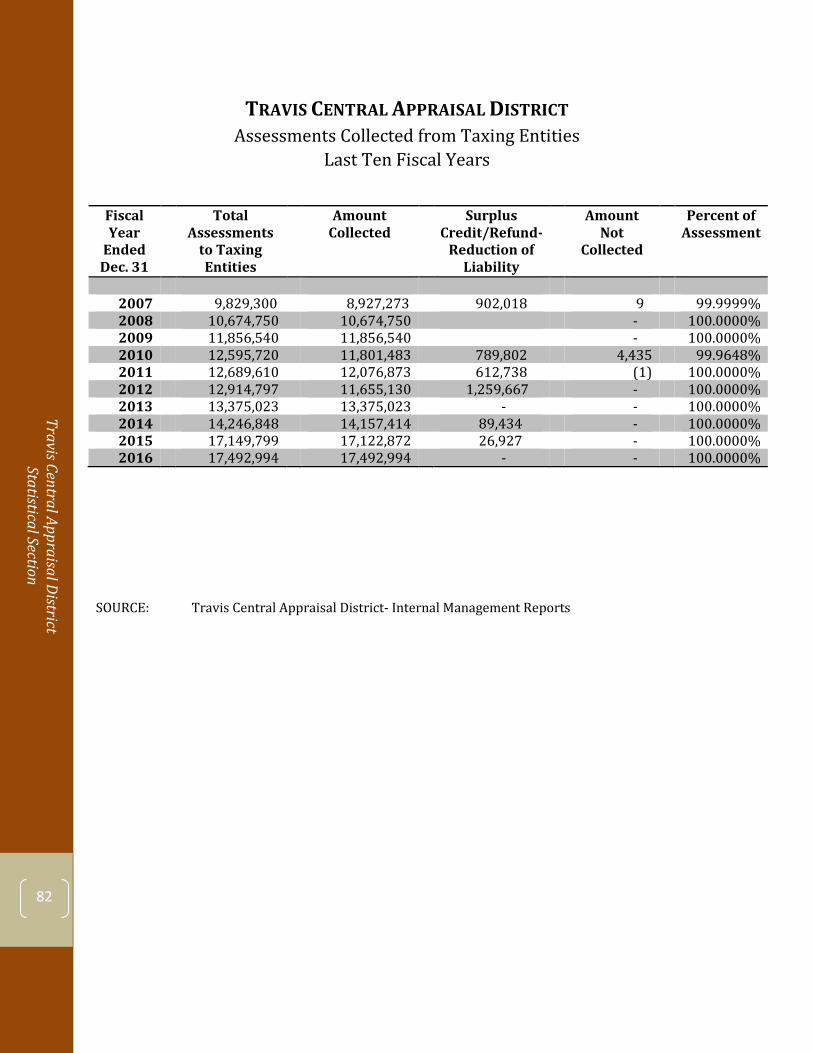
Travis Central Appraisal District Statistical Section
82
TRAVIS CENTRAL APPRAISAL DISTRICTAssessments Collected from Taxing Entities
Last Ten Fiscal Years
Fiscal Year
Ended Dec. 31
Total Assessments
to Taxing Entities
Amount Collected
Surplus Credit/Refund-
Reduction of Liability
Amount Not
Collected
Percent of Assessment
2007 9,829,300 8,927,273 902,018 9 99.9999% 2008 10,674,750 10,674,750 - 100.0000% 2009 11,856,540 11,856,540 - 100.0000% 2010 12,595,720 11,801,483 789,802 4,435 99.9648% 2011 12,689,610 12,076,873 612,738 (1) 100.0000% 2012 12,914,797 11,655,130 1,259,667 - 100.0000% 2013 13,375,023 13,375,023 - - 100.0000% 2014 14,246,848 14,157,414 89,434 - 100.0000% 2015 17,149,799 17,122,872 26,927 - 100.0000% 2016 17,492,994 17,492,994 - - 100.0000%
SOURCE: Travis Central Appraisal District- Internal Management Reports
Trav
is Ce
ntra
l App
raisa
l Dist
rict
St
atist
ical
Sec
tion
83
STATISTICAL SECTION TAXING ENTITY TRENDS
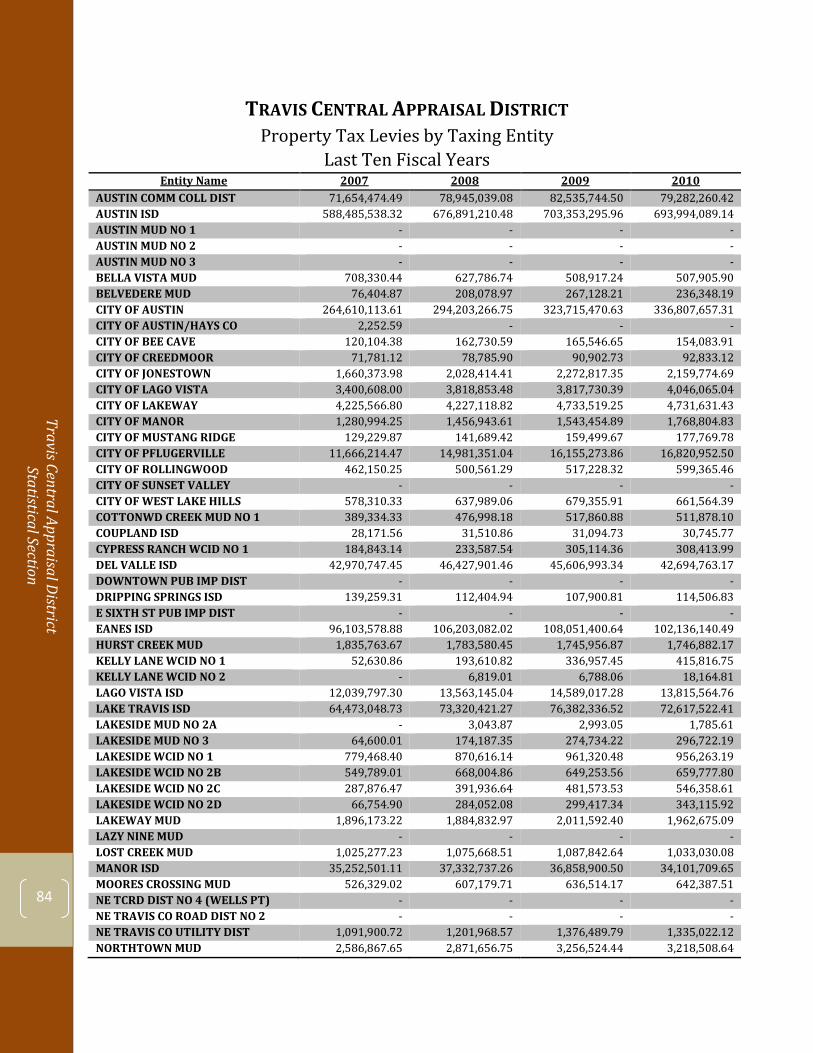
Travis Central Appraisal District Statistical Section
84
TRAVIS CENTRAL APPRAISAL DISTRICT
Property Tax Levies by Taxing Entity Last Ten Fiscal Years
Entity Name 2007 2008 2009 2010 AUSTIN COMM COLL DIST 71,654,474.49 78,945,039.08 82,535,744.50 79,282,260.42 AUSTIN ISD 588,485,538.32 676,891,210.48 703,353,295.96 693,994,089.14 AUSTIN MUD NO 1 - - - - AUSTIN MUD NO 2 - - - - AUSTIN MUD NO 3 - - - - BELLA VISTA MUD 708,330.44 627,786.74 508,917.24 507,905.90 BELVEDERE MUD 76,404.87 208,078.97 267,128.21 236,348.19 CITY OF AUSTIN 264,610,113.61 294,203,266.75 323,715,470.63 336,807,657.31 CITY OF AUSTIN/HAYS CO 2,252.59 - - - CITY OF BEE CAVE 120,104.38 162,730.59 165,546.65 154,083.91 CITY OF CREEDMOOR 71,781.12 78,785.90 90,902.73 92,833.12 CITY OF JONESTOWN 1,660,373.98 2,028,414.41 2,272,817.35 2,159,774.69 CITY OF LAGO VISTA 3,400,608.00 3,818,853.48 3,817,730.39 4,046,065.04 CITY OF LAKEWAY 4,225,566.80 4,227,118.82 4,733,519.25 4,731,631.43 CITY OF MANOR 1,280,994.25 1,456,943.61 1,543,454.89 1,768,804.83 CITY OF MUSTANG RIDGE 129,229.87 141,689.42 159,499.67 177,769.78 CITY OF PFLUGERVILLE 11,666,214.47 14,981,351.04 16,155,273.86 16,820,952.50 CITY OF ROLLINGWOOD 462,150.25 500,561.29 517,228.32 599,365.46 CITY OF SUNSET VALLEY - - - - CITY OF WEST LAKE HILLS 578,310.33 637,989.06 679,355.91 661,564.39 COTTONWD CREEK MUD NO 1 389,334.33 476,998.18 517,860.88 511,878.10 COUPLAND ISD 28,171.56 31,510.86 31,094.73 30,745.77 CYPRESS RANCH WCID NO 1 184,843.14 233,587.54 305,114.36 308,413.99 DEL VALLE ISD 42,970,747.45 46,427,901.46 45,606,993.34 42,694,763.17 DOWNTOWN PUB IMP DIST - - - - DRIPPING SPRINGS ISD 139,259.31 112,404.94 107,900.81 114,506.83 E SIXTH ST PUB IMP DIST - - - - EANES ISD 96,103,578.88 106,203,082.02 108,051,400.64 102,136,140.49 HURST CREEK MUD 1,835,763.67 1,783,580.45 1,745,956.87 1,746,882.17 KELLY LANE WCID NO 1 52,630.86 193,610.82 336,957.45 415,816.75 KELLY LANE WCID NO 2 - 6,819.01 6,788.06 18,164.81 LAGO VISTA ISD 12,039,797.30 13,563,145.04 14,589,017.28 13,815,564.76 LAKE TRAVIS ISD 64,473,048.73 73,320,421.27 76,382,336.52 72,617,522.41 LAKESIDE MUD NO 2A - 3,043.87 2,993.05 1,785.61 LAKESIDE MUD NO 3 64,600.01 174,187.35 274,734.22 296,722.19 LAKESIDE WCID NO 1 779,468.40 870,616.14 961,320.48 956,263.19 LAKESIDE WCID NO 2B 549,789.01 668,004.86 649,253.56 659,777.80 LAKESIDE WCID NO 2C 287,876.47 391,936.64 481,573.53 546,358.61 LAKESIDE WCID NO 2D 66,754.90 284,052.08 299,417.34 343,115.92 LAKEWAY MUD 1,896,173.22 1,884,832.97 2,011,592.40 1,962,675.09 LAZY NINE MUD - - - - LOST CREEK MUD 1,025,277.23 1,075,668.51 1,087,842.64 1,033,030.08 MANOR ISD 35,252,501.11 37,332,737.26 36,858,900.50 34,101,709.65 MOORES CROSSING MUD 526,329.02 607,179.71 636,514.17 642,387.51 NE TCRD DIST NO 4 (WELLS PT) - - - - NE TRAVIS CO ROAD DIST NO 2 - - - - NE TRAVIS CO UTILITY DIST 1,091,900.72 1,201,968.57 1,376,489.79 1,335,022.12 NORTHTOWN MUD 2,586,867.65 2,871,656.75 3,256,524.44 3,218,508.64
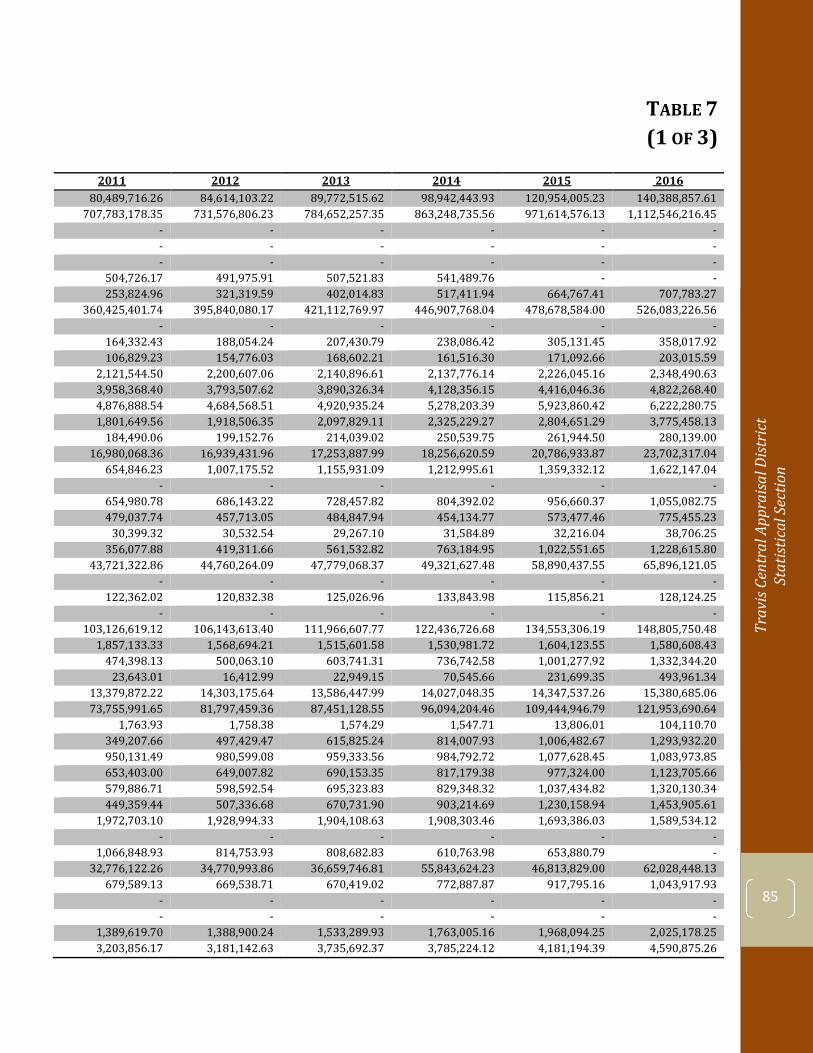
Trav
is Ce
ntra
l App
raisa
l Dist
rict
St
atist
ical
Sec
tion
85
TABLE 7Change in Net Position (1 OF 3)
2011 2012 2013 2014 2015 2016 80,489,716.26 84,614,103.22 89,772,515.62 98,942,443.93 120,954,005.23 140,388,857.61
707,783,178.35 731,576,806.23 784,652,257.35 863,248,735.56 971,614,576.13 1,112,546,216.45 - - - - - - - - - - - - - - - - - -
504,726.17 491,975.91 507,521.83 541,489.76 - - 253,824.96 321,319.59 402,014.83 517,411.94 664,767.41 707,783.27
360,425,401.74 395,840,080.17 421,112,769.97 446,907,768.04 478,678,584.00 526,083,226.56 - - - - - -
164,332.43 188,054.24 207,430.79 238,086.42 305,131.45 358,017.92 106,829.23 154,776.03 168,602.21 161,516.30 171,092.66 203,015.59
2,121,544.50 2,200,607.06 2,140,896.61 2,137,776.14 2,226,045.16 2,348,490.63 3,958,368.40 3,793,507.62 3,890,326.34 4,128,356.15 4,416,046.36 4,822,268.40 4,876,888.54 4,684,568.51 4,920,935.24 5,278,203.39 5,923,860.42 6,222,280.75 1,801,649.56 1,918,506.35 2,097,829.11 2,325,229.27 2,804,651.29 3,775,458.13
184,490.06 199,152.76 214,039.02 250,539.75 261,944.50 280,139.00 16,980,068.36 16,939,431.96 17,253,887.99 18,256,620.59 20,786,933.87 23,702,317.04
654,846.23 1,007,175.52 1,155,931.09 1,212,995.61 1,359,332.12 1,622,147.04 - - - - - -
654,980.78 686,143.22 728,457.82 804,392.02 956,660.37 1,055,082.75 479,037.74 457,713.05 484,847.94 454,134.77 573,477.46 775,455.23
30,399.32 30,532.54 29,267.10 31,584.89 32,216.04 38,706.25 356,077.88 419,311.66 561,532.82 763,184.95 1,022,551.65 1,228,615.80
43,721,322.86 44,760,264.09 47,779,068.37 49,321,627.48 58,890,437.55 65,896,121.05 - - - - - -
122,362.02 120,832.38 125,026.96 133,843.98 115,856.21 128,124.25 - - - - - -
103,126,619.12 106,143,613.40 111,966,607.77 122,436,726.68 134,553,306.19 148,805,750.48 1,857,133.33 1,568,694.21 1,515,601.58 1,530,981.72 1,604,123.55 1,580,608.43
474,398.13 500,063.10 603,741.31 736,742.58 1,001,277.92 1,332,344.20 23,643.01 16,412.99 22,949.15 70,545.66 231,699.35 493,961.34
13,379,872.22 14,303,175.64 13,586,447.99 14,027,048.35 14,347,537.26 15,380,685.06 73,755,991.65 81,797,459.36 87,451,128.55 96,094,204.46 109,444,946.79 121,953,690.64
1,763.93 1,758.38 1,574.29 1,547.71 13,806.01 104,110.70 349,207.66 497,429.47 615,825.24 814,007.93 1,006,482.67 1,293,932.20 950,131.49 980,599.08 959,333.56 984,792.72 1,077,628.45 1,083,973.85 653,403.00 649,007.82 690,153.35 817,179.38 977,324.00 1,123,705.66 579,886.71 598,592.54 695,323.83 829,348.32 1,037,434.82 1,320,130.34 449,359.44 507,336.68 670,731.90 903,214.69 1,230,158.94 1,453,905.61
1,972,703.10 1,928,994.33 1,904,108.63 1,908,303.46 1,693,386.03 1,589,534.12 - - - - - -
1,066,848.93 814,753.93 808,682.83 610,763.98 653,880.79 - 32,776,122.26 34,770,993.86 36,659,746.81 55,843,624.23 46,813,829.00 62,028,448.13
679,589.13 669,538.71 670,419.02 772,887.87 917,795.16 1,043,917.93 - - - - - - - - - - - -
1,389,619.70 1,388,900.24 1,533,289.93 1,763,005.16 1,968,094.25 2,025,178.25 3,203,856.17 3,181,142.63 3,735,692.37 3,785,224.12 4,181,194.39 4,590,875.26
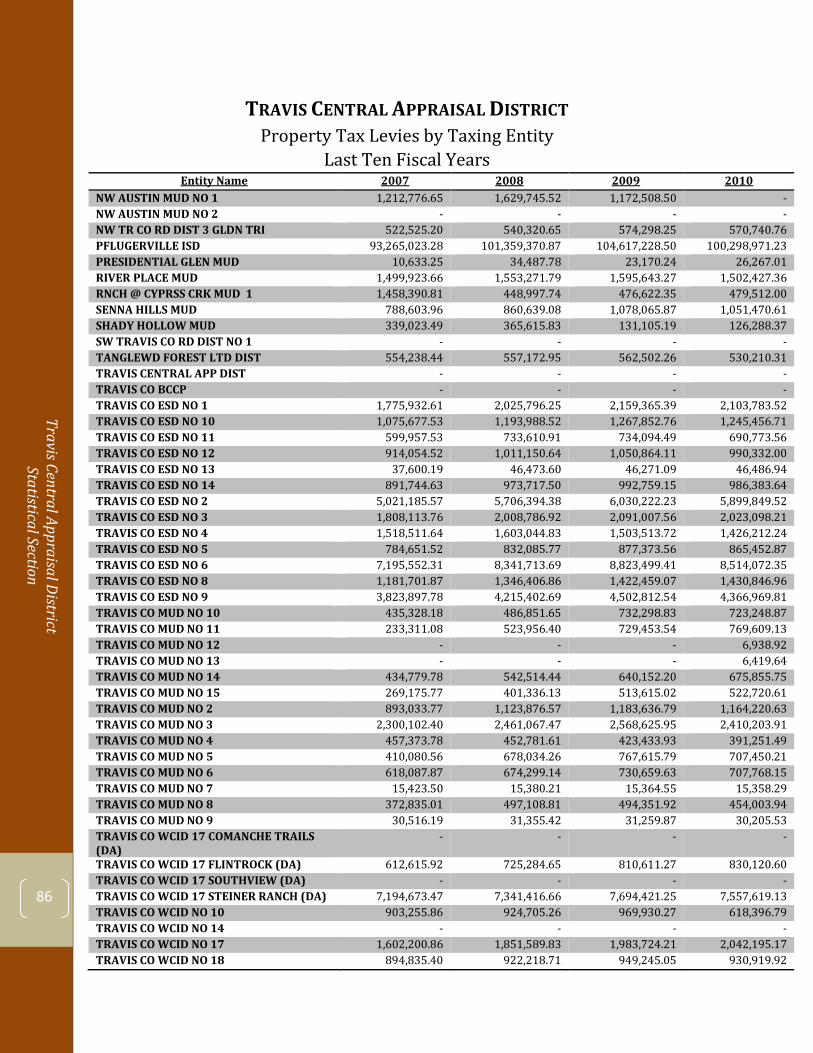
Travis Central Appraisal District Statistical Section
86
TRAVIS CENTRAL APPRAISAL DISTRICTProperty Tax Levies by Taxing Entity
Last Ten Fiscal Years Entity Name 2007 2008 2009 2010
NW AUSTIN MUD NO 1 1,212,776.65 1,629,745.52 1,172,508.50 - NW AUSTIN MUD NO 2 - - - - NW TR CO RD DIST 3 GLDN TRI 522,525.20 540,320.65 574,298.25 570,740.76 PFLUGERVILLE ISD 93,265,023.28 101,359,370.87 104,617,228.50 100,298,971.23 PRESIDENTIAL GLEN MUD 10,633.25 34,487.78 23,170.24 26,267.01 RIVER PLACE MUD 1,499,923.66 1,553,271.79 1,595,643.27 1,502,427.36 RNCH @ CYPRSS CRK MUD 1 1,458,390.81 448,997.74 476,622.35 479,512.00 SENNA HILLS MUD 788,603.96 860,639.08 1,078,065.87 1,051,470.61 SHADY HOLLOW MUD 339,023.49 365,615.83 131,105.19 126,288.37 SW TRAVIS CO RD DIST NO 1 - - - - TANGLEWD FOREST LTD DIST 554,238.44 557,172.95 562,502.26 530,210.31 TRAVIS CENTRAL APP DIST - - - - TRAVIS CO BCCP - - - - TRAVIS CO ESD NO 1 1,775,932.61 2,025,796.25 2,159,365.39 2,103,783.52 TRAVIS CO ESD NO 10 1,075,677.53 1,193,988.52 1,267,852.76 1,245,456.71 TRAVIS CO ESD NO 11 599,957.53 733,610.91 734,094.49 690,773.56 TRAVIS CO ESD NO 12 914,054.52 1,011,150.64 1,050,864.11 990,332.00 TRAVIS CO ESD NO 13 37,600.19 46,473.60 46,271.09 46,486.94 TRAVIS CO ESD NO 14 891,744.63 973,717.50 992,759.15 986,383.64 TRAVIS CO ESD NO 2 5,021,185.57 5,706,394.38 6,030,222.23 5,899,849.52 TRAVIS CO ESD NO 3 1,808,113.76 2,008,786.92 2,091,007.56 2,023,098.21 TRAVIS CO ESD NO 4 1,518,511.64 1,603,044.83 1,503,513.72 1,426,212.24 TRAVIS CO ESD NO 5 784,651.52 832,085.77 877,373.56 865,452.87 TRAVIS CO ESD NO 6 7,195,552.31 8,341,713.69 8,823,499.41 8,514,072.35 TRAVIS CO ESD NO 8 1,181,701.87 1,346,406.86 1,422,459.07 1,430,846.96 TRAVIS CO ESD NO 9 3,823,897.78 4,215,402.69 4,502,812.54 4,366,969.81 TRAVIS CO MUD NO 10 435,328.18 486,851.65 732,298.83 723,248.87 TRAVIS CO MUD NO 11 233,311.08 523,956.40 729,453.54 769,609.13 TRAVIS CO MUD NO 12 - - - 6,938.92 TRAVIS CO MUD NO 13 - - - 6,419.64 TRAVIS CO MUD NO 14 434,779.78 542,514.44 640,152.20 675,855.75 TRAVIS CO MUD NO 15 269,175.77 401,336.13 513,615.02 522,720.61 TRAVIS CO MUD NO 2 893,033.77 1,123,876.57 1,183,636.79 1,164,220.63 TRAVIS CO MUD NO 3 2,300,102.40 2,461,067.47 2,568,625.95 2,410,203.91 TRAVIS CO MUD NO 4 457,373.78 452,781.61 423,433.93 391,251.49 TRAVIS CO MUD NO 5 410,080.56 678,034.26 767,615.79 707,450.21 TRAVIS CO MUD NO 6 618,087.87 674,299.14 730,659.63 707,768.15 TRAVIS CO MUD NO 7 15,423.50 15,380.21 15,364.55 15,358.29 TRAVIS CO MUD NO 8 372,835.01 497,108.81 494,351.92 454,003.94 TRAVIS CO MUD NO 9 30,516.19 31,355.42 31,259.87 30,205.53 TRAVIS CO WCID 17 COMANCHE TRAILS (DA)
- - - -
TRAVIS CO WCID 17 FLINTROCK (DA) 612,615.92 725,284.65 810,611.27 830,120.60 TRAVIS CO WCID 17 SOUTHVIEW (DA) - - - - TRAVIS CO WCID 17 STEINER RANCH (DA) 7,194,673.47 7,341,416.66 7,694,421.25 7,557,619.13 TRAVIS CO WCID NO 10 903,255.86 924,705.26 969,930.27 618,396.79 TRAVIS CO WCID NO 14 - - - - TRAVIS CO WCID NO 17 1,602,200.86 1,851,589.83 1,983,724.21 2,042,195.17 TRAVIS CO WCID NO 18 894,835.40 922,218.71 949,245.05 930,919.92

Trav
is Ce
ntra
l App
raisa
l Dist
rict
St
atist
ical
Sec
tion
87
TABLE 7Change in Net Position (2 OF 3)
2011 2012 2013 2014 2015 2016 - - - - - - - - - - - -
604,815.75 562,037.70 566,544.53 - - - 101,220,205.07 106,655,109.90 113,150,641.48 127,137,408.63 140,655,240.23 159,800,083.00
31,771.25 32,723.26 72,499.52 121,501.40 196,238.65 205,873.56 1,482,088.19 1,477,773.99 1,512,938.44 1,552,577.17 1,242,505.65 1,203,966.89
475,325.42 415,461.35 362,682.77 340,094.65 311,598.17 330,219.30 1,074,672.71 1,193,665.63 1,274,275.29 1,378,239.49 1,499,161.73 1,559,501.76
122,850.55 122,957.42 123,576.19 133,547.58 144,692.03 123,822.82 - - - - - -
527,126.31 490,569.17 476,208.33 505,799.80 545,323.02 600,562.81 - - - - - - - - - - - -
2,087,599.00 2,134,765.98 2,093,778.04 2,164,968.79 2,279,008.07 2,422,842.81 1,282,010.56 1,310,827.55 1,372,332.96 1,498,155.39 1,638,969.85 1,776,685.94
706,999.25 703,127.77 752,156.42 760,721.23 847,438.86 930,185.40 986,769.99 1,037,450.02 1,128,483.38 1,237,543.37 1,400,960.13 1,605,678.90
47,114.76 48,650.94 49,980.82 53,571.38 56,411.22 60,352.85 999,926.80 740,551.23 756,021.94 811,246.78 425,572.33 449,646.71
5,886,151.18 5,989,808.20 6,325,848.77 7,000,733.75 7,821,185.82 9,381,905.87 2,014,971.01 2,045,130.82 2,075,326.67 2,143,907.70 2,364,316.22 2,897,411.73 1,423,738.88 1,395,552.71 1,420,473.54 1,532,514.63 1,564,038.89 1,885,836.08
855,173.12 869,760.75 883,685.23 1,009,332.09 949,476.99 1,155,787.73 8,709,166.81 9,191,208.06 9,834,195.81 10,889,082.60 12,404,056.84 13,759,251.78 1,452,683.65 1,450,528.55 1,492,779.34 1,565,017.67 1,704,515.53 1,871,575.59 4,419,033.70 4,473,539.01 4,486,011.57 4,539,206.21 4,945,327.68 4,942,444.55
740,025.68 710,383.43 678,312.93 765,619.19 798,700.73 799,660.79 904,721.07 1,012,004.02 1,227,213.29 1,548,588.96 1,826,439.16 1,837,503.66
8,488.95 64,508.76 111,150.98 238,783.76 621,981.62 784,538.23 10,175.79 131,920.44 213,630.97 326,508.65 499,015.04 657,463.56
653,286.13 614,301.58 638,625.77 691,054.92 755,243.26 829,383.99 570,950.28 613,288.06 757,283.71 932,798.34 1,162,628.61 1,412,399.58
1,090,311.31 1,056,986.62 1,114,150.27 1,210,609.46 1,404,384.94 1,539,329.10 2,322,021.63 2,638,821.82 2,667,326.74 2,757,330.24 2,823,385.21 3,039,532.79
385,325.12 423,499.37 477,393.83 529,450.13 824,537.24 938,248.37 689,157.76 631,958.95 673,323.02 840,651.49 1,047,885.10 1,422,328.43 700,367.84 673,987.57 719,576.58 744,763.56 782,458.59 759,274.19
15,335.55 15,381.87 15,401.12 15,420.10 45,346.98 14,897.92 440,034.46 435,040.36 461,525.59 500,857.47 550,646.31 632,391.78
30,654.66 29,972.73 29,935.91 30,754.96 29,618.53 30,041.92 - - - - - -
931,733.80 1,066,640.84 1,058,479.15 1,146,557.82 1,266,724.35 1,282,402.85 - - - - - -
7,743,105.20 8,012,165.50 7,735,841.91 8,104,593.64 7,798,699.18 6,718,837.32 660,351.46 713,179.70 800,922.23 877,960.99 978,872.13 2,506,752.00
- - - - - - 2,182,516.49 2,364,030.17 2,427,706.90 2,645,754.81 2,966,409.21 3,345,999.09
940,979.76 964,342.06 969,122.73 483,656.59 533,147.09 584,809.83
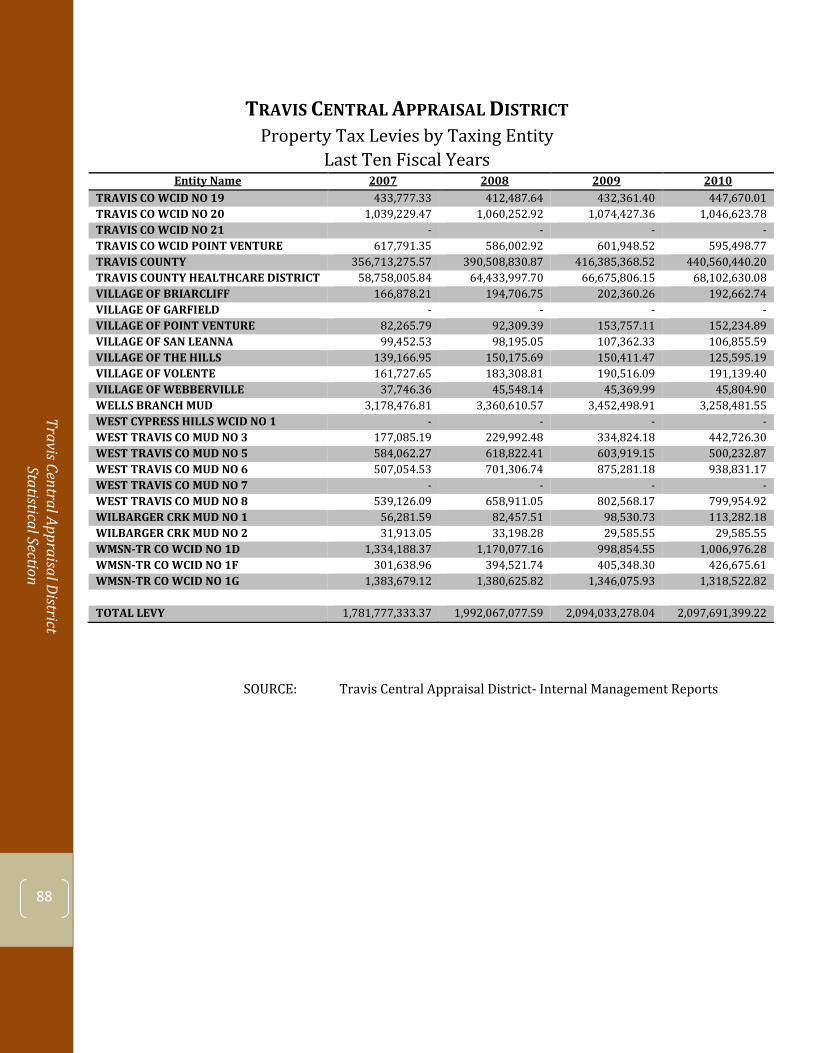
Travis Central Appraisal District Statistical Section
88
TRAVIS CENTRAL APPRAISAL DISTRICTProperty Tax Levies by Taxing Entity
Last Ten Fiscal Years Entity Name 2007 2008 2009 2010
TRAVIS CO WCID NO 19 433,777.33 412,487.64 432,361.40 447,670.01 TRAVIS CO WCID NO 20 1,039,229.47 1,060,252.92 1,074,427.36 1,046,623.78 TRAVIS CO WCID NO 21 - - - - TRAVIS CO WCID POINT VENTURE 617,791.35 586,002.92 601,948.52 595,498.77 TRAVIS COUNTY 356,713,275.57 390,508,830.87 416,385,368.52 440,560,440.20 TRAVIS COUNTY HEALTHCARE DISTRICT 58,758,005.84 64,433,997.70 66,675,806.15 68,102,630.08 VILLAGE OF BRIARCLIFF 166,878.21 194,706.75 202,360.26 192,662.74 VILLAGE OF GARFIELD - - - - VILLAGE OF POINT VENTURE 82,265.79 92,309.39 153,757.11 152,234.89 VILLAGE OF SAN LEANNA 99,452.53 98,195.05 107,362.33 106,855.59 VILLAGE OF THE HILLS 139,166.95 150,175.69 150,411.47 125,595.19 VILLAGE OF VOLENTE 161,727.65 183,308.81 190,516.09 191,139.40 VILLAGE OF WEBBERVILLE 37,746.36 45,548.14 45,369.99 45,804.90 WELLS BRANCH MUD 3,178,476.81 3,360,610.57 3,452,498.91 3,258,481.55 WEST CYPRESS HILLS WCID NO 1 - - - - WEST TRAVIS CO MUD NO 3 177,085.19 229,992.48 334,824.18 442,726.30 WEST TRAVIS CO MUD NO 5 584,062.27 618,822.41 603,919.15 500,232.87 WEST TRAVIS CO MUD NO 6 507,054.53 701,306.74 875,281.18 938,831.17 WEST TRAVIS CO MUD NO 7 - - - - WEST TRAVIS CO MUD NO 8 539,126.09 658,911.05 802,568.17 799,954.92 WILBARGER CRK MUD NO 1 56,281.59 82,457.51 98,530.73 113,282.18 WILBARGER CRK MUD NO 2 31,913.05 33,198.28 29,585.55 29,585.55 WMSN-TR CO WCID NO 1D 1,334,188.37 1,170,077.16 998,854.55 1,006,976.28 WMSN-TR CO WCID NO 1F 301,638.96 394,521.74 405,348.30 426,675.61 WMSN-TR CO WCID NO 1G 1,383,679.12 1,380,625.82 1,346,075.93 1,318,522.82
TOTAL LEVY 1,781,777,333.37 1,992,067,077.59 2,094,033,278.04 2,097,691,399.22
SOURCE: Travis Central Appraisal District- Internal Management Reports

Trav
is Ce
ntra
l App
raisa
l Dist
rict
St
atist
ical
Sec
tion
89
TABLE 7Change in Net Position (3 OF 3)
2011 2012 2013 2014 2015 2016 448,474.95 448,953.35 452,571.61 451,926.81 475,372.20 482,658.24
1,042,777.54 1,045,201.49 810,585.73 784,566.97 784,457.54 855,082.48 - - - - - -
605,319.32 621,546.09 619,607.38 632,485.67 1,055,988.29 1,121,348.93 466,185,498.63 502,210,891.63 527,466,091.69 542,015,031.18 567,325,667.46 594,500,041.27
75,843,153.60 79,344,749.00 137,691,785.57 150,253,067.08 160,363,907.00 171,294,976.32 222,185.84 222,272.30 238,062.65 368,795.66 396,170.99 427,260.68
- - - - - - 154,601.67 149,104.78 166,706.73 176,873.35 188,254.88 206,329.62 106,459.03 105,689.15 108,549.75 119,847.12 131,345.54 140,383.76
98,677.07 88,161.93 85,523.13 92,563.06 238,809.95 249,802.81 192,349.79 185,058.36 203,265.53 213,364.17 178,723.71 196,113.07
47,110.83 48,184.04 48,257.97 53,005.79 59,238.88 71,889.73 3,266,586.41 3,328,847.40 3,470,195.32 3,559,156.44 3,705,803.97 4,124,122.79
- - - - - - 476,560.67 485,369.78 519,246.81 543,389.55 588,064.28 619,767.98 523,617.91 508,080.11 531,581.73 569,642.71 604,236.07 623,867.84 905,010.64 1,005,112.02 1,196,336.57 1,341,118.03 1,728,117.57 2,132,167.85
- - - - - - 832,158.37 928,260.07 966,309.53 921,406.99 863,093.75 985,227.95 122,205.82 130,073.88 192,198.75 213,712.92 247,364.17 271,368.07
34,104.87 34,206.30 34,103.93 35,245.56 60,189.92 71,448.70 1,070,268.21 - - - - -
455,927.80 376,484.75 425,368.58 542,425.33 - - 1,312,032.39 1,264,547.79 1,239,874.86 1,345,010.52 - -
2,173,735,012.61 2,297,767,736.52 2,491,750,105.63 2,694,585,610.22 2,943,219,042.85 3,273,860,365.51
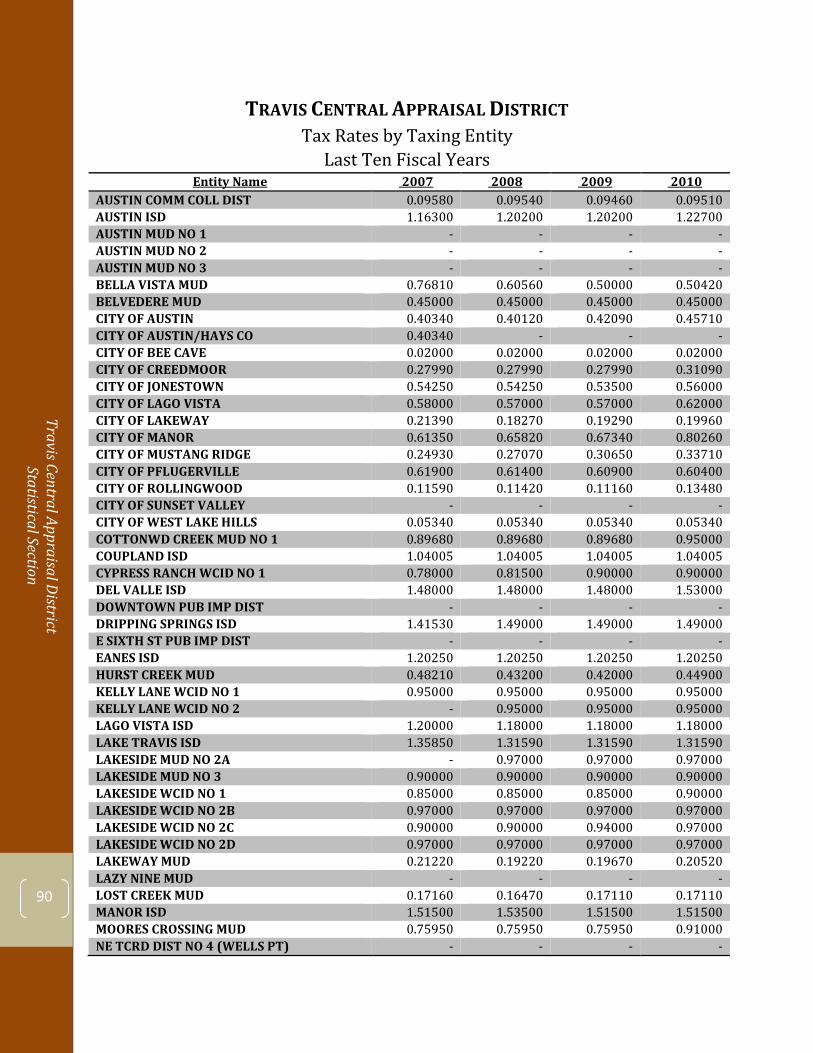
Travis Central Appraisal District Statistical Section
90
TRAVIS CENTRAL APPRAISAL DISTRICTTax Rates by Taxing Entity
Last Ten Fiscal Years Entity Name 2007 2008 2009 2010
AUSTIN COMM COLL DIST 0.09580 0.09540 0.09460 0.09510 AUSTIN ISD 1.16300 1.20200 1.20200 1.22700 AUSTIN MUD NO 1 - - - - AUSTIN MUD NO 2 - - - - AUSTIN MUD NO 3 - - - - BELLA VISTA MUD 0.76810 0.60560 0.50000 0.50420 BELVEDERE MUD 0.45000 0.45000 0.45000 0.45000 CITY OF AUSTIN 0.40340 0.40120 0.42090 0.45710 CITY OF AUSTIN/HAYS CO 0.40340 - - - CITY OF BEE CAVE 0.02000 0.02000 0.02000 0.02000 CITY OF CREEDMOOR 0.27990 0.27990 0.27990 0.31090 CITY OF JONESTOWN 0.54250 0.54250 0.53500 0.56000 CITY OF LAGO VISTA 0.58000 0.57000 0.57000 0.62000 CITY OF LAKEWAY 0.21390 0.18270 0.19290 0.19960 CITY OF MANOR 0.61350 0.65820 0.67340 0.80260 CITY OF MUSTANG RIDGE 0.24930 0.27070 0.30650 0.33710 CITY OF PFLUGERVILLE 0.61900 0.61400 0.60900 0.60400 CITY OF ROLLINGWOOD 0.11590 0.11420 0.11160 0.13480 CITY OF SUNSET VALLEY - - - - CITY OF WEST LAKE HILLS 0.05340 0.05340 0.05340 0.05340 COTTONWD CREEK MUD NO 1 0.89680 0.89680 0.89680 0.95000 COUPLAND ISD 1.04005 1.04005 1.04005 1.04005 CYPRESS RANCH WCID NO 1 0.78000 0.81500 0.90000 0.90000 DEL VALLE ISD 1.48000 1.48000 1.48000 1.53000 DOWNTOWN PUB IMP DIST - - - - DRIPPING SPRINGS ISD 1.41530 1.49000 1.49000 1.49000 E SIXTH ST PUB IMP DIST - - - - EANES ISD 1.20250 1.20250 1.20250 1.20250 HURST CREEK MUD 0.48210 0.43200 0.42000 0.44900 KELLY LANE WCID NO 1 0.95000 0.95000 0.95000 0.95000 KELLY LANE WCID NO 2 - 0.95000 0.95000 0.95000 LAGO VISTA ISD 1.20000 1.18000 1.18000 1.18000 LAKE TRAVIS ISD 1.35850 1.31590 1.31590 1.31590 LAKESIDE MUD NO 2A - 0.97000 0.97000 0.97000 LAKESIDE MUD NO 3 0.90000 0.90000 0.90000 0.90000 LAKESIDE WCID NO 1 0.85000 0.85000 0.85000 0.90000 LAKESIDE WCID NO 2B 0.97000 0.97000 0.97000 0.97000 LAKESIDE WCID NO 2C 0.90000 0.90000 0.94000 0.97000 LAKESIDE WCID NO 2D 0.97000 0.97000 0.97000 0.97000 LAKEWAY MUD 0.21220 0.19220 0.19670 0.20520 LAZY NINE MUD - - - - LOST CREEK MUD 0.17160 0.16470 0.17110 0.17110 MANOR ISD 1.51500 1.53500 1.51500 1.51500 MOORES CROSSING MUD 0.75950 0.75950 0.75950 0.91000 NE TCRD DIST NO 4 (WELLS PT) - - - -
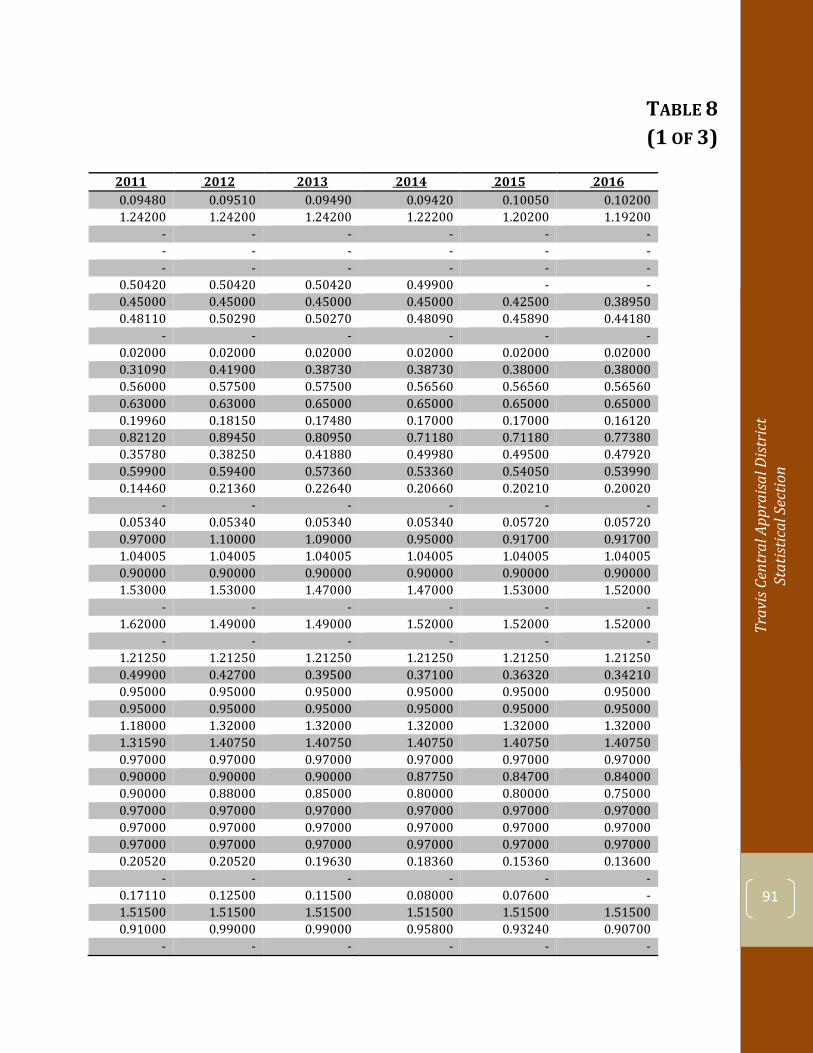
Trav
is Ce
ntra
l App
raisa
l Dist
rict
St
atist
ical
Sec
tion
91
TABLE 8 Change in Net Position (1 OF 3)
2011 2012 2013 2014 2015 2016 0.09480 0.09510 0.09490 0.09420 0.10050 0.10200 1.24200 1.24200 1.24200 1.22200 1.20200 1.19200
- - - - - - - - - - - - - - - - - -
0.50420 0.50420 0.50420 0.49900 - - 0.45000 0.45000 0.45000 0.45000 0.42500 0.38950 0.48110 0.50290 0.50270 0.48090 0.45890 0.44180
- - - - - - 0.02000 0.02000 0.02000 0.02000 0.02000 0.02000 0.31090 0.41900 0.38730 0.38730 0.38000 0.38000 0.56000 0.57500 0.57500 0.56560 0.56560 0.56560 0.63000 0.63000 0.65000 0.65000 0.65000 0.65000 0.19960 0.18150 0.17480 0.17000 0.17000 0.16120 0.82120 0.89450 0.80950 0.71180 0.71180 0.77380 0.35780 0.38250 0.41880 0.49980 0.49500 0.47920 0.59900 0.59400 0.57360 0.53360 0.54050 0.53990 0.14460 0.21360 0.22640 0.20660 0.20210 0.20020
- - - - - - 0.05340 0.05340 0.05340 0.05340 0.05720 0.05720 0.97000 1.10000 1.09000 0.95000 0.91700 0.91700 1.04005 1.04005 1.04005 1.04005 1.04005 1.04005 0.90000 0.90000 0.90000 0.90000 0.90000 0.90000 1.53000 1.53000 1.47000 1.47000 1.53000 1.52000
- - - - - - 1.62000 1.49000 1.49000 1.52000 1.52000 1.52000
- - - - - - 1.21250 1.21250 1.21250 1.21250 1.21250 1.21250 0.49900 0.42700 0.39500 0.37100 0.36320 0.34210 0.95000 0.95000 0.95000 0.95000 0.95000 0.95000 0.95000 0.95000 0.95000 0.95000 0.95000 0.95000 1.18000 1.32000 1.32000 1.32000 1.32000 1.32000 1.31590 1.40750 1.40750 1.40750 1.40750 1.40750 0.97000 0.97000 0.97000 0.97000 0.97000 0.97000 0.90000 0.90000 0.90000 0.87750 0.84700 0.84000 0.90000 0.88000 0.85000 0.80000 0.80000 0.75000 0.97000 0.97000 0.97000 0.97000 0.97000 0.97000 0.97000 0.97000 0.97000 0.97000 0.97000 0.97000 0.97000 0.97000 0.97000 0.97000 0.97000 0.97000 0.20520 0.20520 0.19630 0.18360 0.15360 0.13600
- - - - - - 0.17110 0.12500 0.11500 0.08000 0.07600 - 1.51500 1.51500 1.51500 1.51500 1.51500 1.51500 0.91000 0.99000 0.99000 0.95800 0.93240 0.90700
- - - - - -
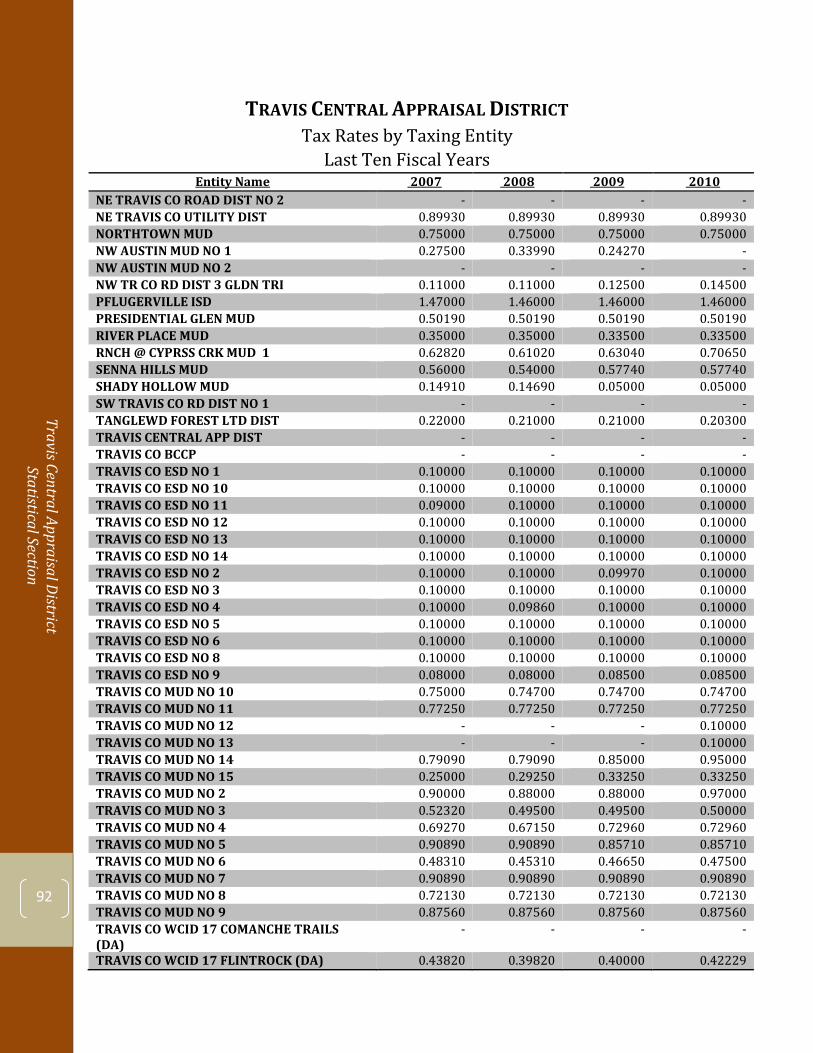
Travis Central Appraisal District Statistical Section
92
TRAVIS CENTRAL APPRAISAL DISTRICT
Tax Rates by Taxing Entity Last Ten Fiscal Years
Entity Name 2007 2008 2009 2010 NE TRAVIS CO ROAD DIST NO 2 - - - - NE TRAVIS CO UTILITY DIST 0.89930 0.89930 0.89930 0.89930 NORTHTOWN MUD 0.75000 0.75000 0.75000 0.75000 NW AUSTIN MUD NO 1 0.27500 0.33990 0.24270 - NW AUSTIN MUD NO 2 - - - - NW TR CO RD DIST 3 GLDN TRI 0.11000 0.11000 0.12500 0.14500 PFLUGERVILLE ISD 1.47000 1.46000 1.46000 1.46000 PRESIDENTIAL GLEN MUD 0.50190 0.50190 0.50190 0.50190 RIVER PLACE MUD 0.35000 0.35000 0.33500 0.33500 RNCH @ CYPRSS CRK MUD 1 0.62820 0.61020 0.63040 0.70650 SENNA HILLS MUD 0.56000 0.54000 0.57740 0.57740 SHADY HOLLOW MUD 0.14910 0.14690 0.05000 0.05000 SW TRAVIS CO RD DIST NO 1 - - - - TANGLEWD FOREST LTD DIST 0.22000 0.21000 0.21000 0.20300 TRAVIS CENTRAL APP DIST - - - - TRAVIS CO BCCP - - - - TRAVIS CO ESD NO 1 0.10000 0.10000 0.10000 0.10000 TRAVIS CO ESD NO 10 0.10000 0.10000 0.10000 0.10000 TRAVIS CO ESD NO 11 0.09000 0.10000 0.10000 0.10000 TRAVIS CO ESD NO 12 0.10000 0.10000 0.10000 0.10000 TRAVIS CO ESD NO 13 0.10000 0.10000 0.10000 0.10000 TRAVIS CO ESD NO 14 0.10000 0.10000 0.10000 0.10000 TRAVIS CO ESD NO 2 0.10000 0.10000 0.09970 0.10000 TRAVIS CO ESD NO 3 0.10000 0.10000 0.10000 0.10000 TRAVIS CO ESD NO 4 0.10000 0.09860 0.10000 0.10000 TRAVIS CO ESD NO 5 0.10000 0.10000 0.10000 0.10000 TRAVIS CO ESD NO 6 0.10000 0.10000 0.10000 0.10000 TRAVIS CO ESD NO 8 0.10000 0.10000 0.10000 0.10000 TRAVIS CO ESD NO 9 0.08000 0.08000 0.08500 0.08500 TRAVIS CO MUD NO 10 0.75000 0.74700 0.74700 0.74700 TRAVIS CO MUD NO 11 0.77250 0.77250 0.77250 0.77250 TRAVIS CO MUD NO 12 - - - 0.10000 TRAVIS CO MUD NO 13 - - - 0.10000 TRAVIS CO MUD NO 14 0.79090 0.79090 0.85000 0.95000 TRAVIS CO MUD NO 15 0.25000 0.29250 0.33250 0.33250 TRAVIS CO MUD NO 2 0.90000 0.88000 0.88000 0.97000 TRAVIS CO MUD NO 3 0.52320 0.49500 0.49500 0.50000 TRAVIS CO MUD NO 4 0.69270 0.67150 0.72960 0.72960 TRAVIS CO MUD NO 5 0.90890 0.90890 0.85710 0.85710 TRAVIS CO MUD NO 6 0.48310 0.45310 0.46650 0.47500 TRAVIS CO MUD NO 7 0.90890 0.90890 0.90890 0.90890 TRAVIS CO MUD NO 8 0.72130 0.72130 0.72130 0.72130 TRAVIS CO MUD NO 9 0.87560 0.87560 0.87560 0.87560 TRAVIS CO WCID 17 COMANCHE TRAILS (DA)
- - - -
TRAVIS CO WCID 17 FLINTROCK (DA) 0.43820 0.39820 0.40000 0.42229
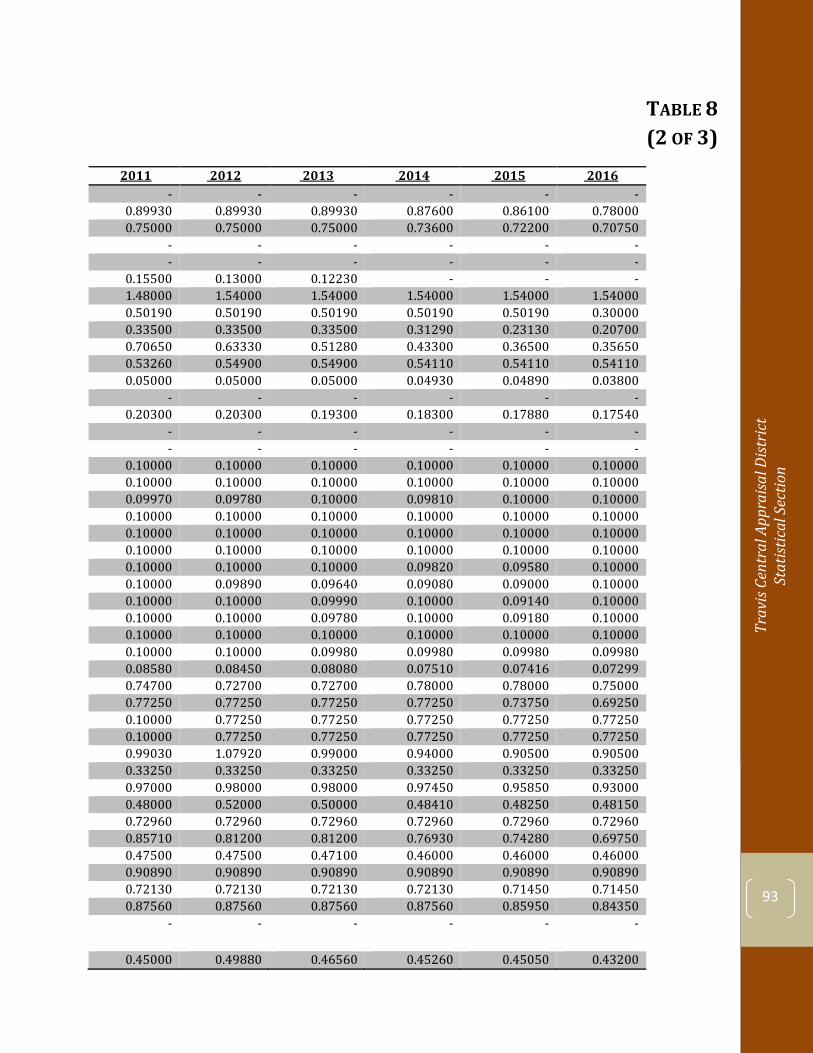
Trav
is Ce
ntra
l App
raisa
l Dist
rict
St
atist
ical
Sec
tion
93
TABLE 8 Change in Net Position (2 OF 3)
2011 2012 2013 2014 2015 2016 - - - - - -
0.89930 0.89930 0.89930 0.87600 0.86100 0.78000 0.75000 0.75000 0.75000 0.73600 0.72200 0.70750
- - - - - - - - - - - -
0.15500 0.13000 0.12230 - - - 1.48000 1.54000 1.54000 1.54000 1.54000 1.54000 0.50190 0.50190 0.50190 0.50190 0.50190 0.30000 0.33500 0.33500 0.33500 0.31290 0.23130 0.20700 0.70650 0.63330 0.51280 0.43300 0.36500 0.35650 0.53260 0.54900 0.54900 0.54110 0.54110 0.54110 0.05000 0.05000 0.05000 0.04930 0.04890 0.03800
- - - - - - 0.20300 0.20300 0.19300 0.18300 0.17880 0.17540
- - - - - - - - - - - -
0.10000 0.10000 0.10000 0.10000 0.10000 0.10000 0.10000 0.10000 0.10000 0.10000 0.10000 0.10000 0.09970 0.09780 0.10000 0.09810 0.10000 0.10000 0.10000 0.10000 0.10000 0.10000 0.10000 0.10000 0.10000 0.10000 0.10000 0.10000 0.10000 0.10000 0.10000 0.10000 0.10000 0.10000 0.10000 0.10000 0.10000 0.10000 0.10000 0.09820 0.09580 0.10000 0.10000 0.09890 0.09640 0.09080 0.09000 0.10000 0.10000 0.10000 0.09990 0.10000 0.09140 0.10000 0.10000 0.10000 0.09780 0.10000 0.09180 0.10000 0.10000 0.10000 0.10000 0.10000 0.10000 0.10000 0.10000 0.10000 0.09980 0.09980 0.09980 0.09980 0.08580 0.08450 0.08080 0.07510 0.07416 0.07299 0.74700 0.72700 0.72700 0.78000 0.78000 0.75000 0.77250 0.77250 0.77250 0.77250 0.73750 0.69250 0.10000 0.77250 0.77250 0.77250 0.77250 0.77250 0.10000 0.77250 0.77250 0.77250 0.77250 0.77250 0.99030 1.07920 0.99000 0.94000 0.90500 0.90500 0.33250 0.33250 0.33250 0.33250 0.33250 0.33250 0.97000 0.98000 0.98000 0.97450 0.95850 0.93000 0.48000 0.52000 0.50000 0.48410 0.48250 0.48150 0.72960 0.72960 0.72960 0.72960 0.72960 0.72960 0.85710 0.81200 0.81200 0.76930 0.74280 0.69750 0.47500 0.47500 0.47100 0.46000 0.46000 0.46000 0.90890 0.90890 0.90890 0.90890 0.90890 0.90890 0.72130 0.72130 0.72130 0.72130 0.71450 0.71450 0.87560 0.87560 0.87560 0.87560 0.85950 0.84350
- - - - - -
0.45000 0.49880 0.46560 0.45260 0.45050 0.43200
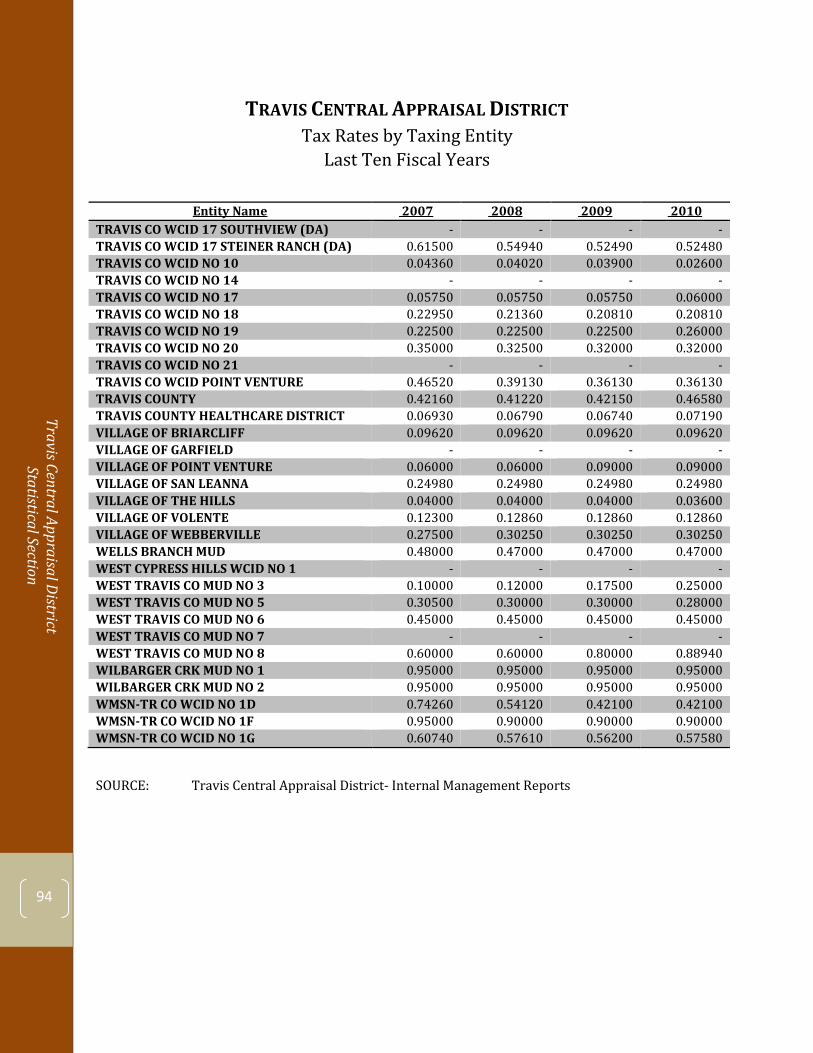
Travis Central Appraisal District Statistical Section
94
TRAVIS CENTRAL APPRAISAL DISTRICT Tax Rates by Taxing Entity
Last Ten Fiscal Years
Entity Name 2007 2008 2009 2010 TRAVIS CO WCID 17 SOUTHVIEW (DA) - - - - TRAVIS CO WCID 17 STEINER RANCH (DA) 0.61500 0.54940 0.52490 0.52480 TRAVIS CO WCID NO 10 0.04360 0.04020 0.03900 0.02600 TRAVIS CO WCID NO 14 - - - - TRAVIS CO WCID NO 17 0.05750 0.05750 0.05750 0.06000 TRAVIS CO WCID NO 18 0.22950 0.21360 0.20810 0.20810 TRAVIS CO WCID NO 19 0.22500 0.22500 0.22500 0.26000 TRAVIS CO WCID NO 20 0.35000 0.32500 0.32000 0.32000 TRAVIS CO WCID NO 21 - - - - TRAVIS CO WCID POINT VENTURE 0.46520 0.39130 0.36130 0.36130 TRAVIS COUNTY 0.42160 0.41220 0.42150 0.46580 TRAVIS COUNTY HEALTHCARE DISTRICT 0.06930 0.06790 0.06740 0.07190 VILLAGE OF BRIARCLIFF 0.09620 0.09620 0.09620 0.09620 VILLAGE OF GARFIELD - - - - VILLAGE OF POINT VENTURE 0.06000 0.06000 0.09000 0.09000 VILLAGE OF SAN LEANNA 0.24980 0.24980 0.24980 0.24980 VILLAGE OF THE HILLS 0.04000 0.04000 0.04000 0.03600 VILLAGE OF VOLENTE 0.12300 0.12860 0.12860 0.12860 VILLAGE OF WEBBERVILLE 0.27500 0.30250 0.30250 0.30250 WELLS BRANCH MUD 0.48000 0.47000 0.47000 0.47000 WEST CYPRESS HILLS WCID NO 1 - - - - WEST TRAVIS CO MUD NO 3 0.10000 0.12000 0.17500 0.25000 WEST TRAVIS CO MUD NO 5 0.30500 0.30000 0.30000 0.28000 WEST TRAVIS CO MUD NO 6 0.45000 0.45000 0.45000 0.45000 WEST TRAVIS CO MUD NO 7 - - - - WEST TRAVIS CO MUD NO 8 0.60000 0.60000 0.80000 0.88940 WILBARGER CRK MUD NO 1 0.95000 0.95000 0.95000 0.95000 WILBARGER CRK MUD NO 2 0.95000 0.95000 0.95000 0.95000 WMSN-TR CO WCID NO 1D 0.74260 0.54120 0.42100 0.42100 WMSN-TR CO WCID NO 1F 0.95000 0.90000 0.90000 0.90000 WMSN-TR CO WCID NO 1G 0.60740 0.57610 0.56200 0.57580
SOURCE: Travis Central Appraisal District- Internal Management Reports
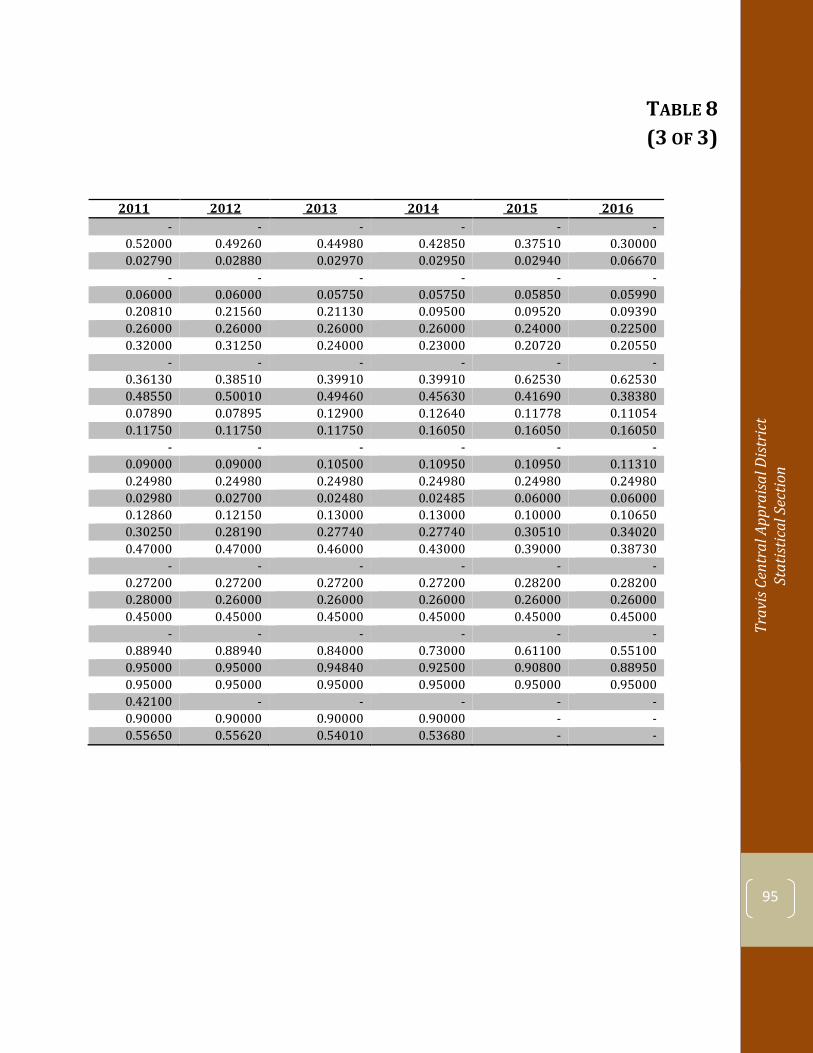
Trav
is Ce
ntra
l App
raisa
l Dist
rict
St
atist
ical
Sec
tion
95
TABLE 8 Change in Net Position (3 OF 3)
2011 2012 2013 2014 2015 2016 - - - - - -
0.52000 0.49260 0.44980 0.42850 0.37510 0.30000 0.02790 0.02880 0.02970 0.02950 0.02940 0.06670
- - - - - - 0.06000 0.06000 0.05750 0.05750 0.05850 0.05990 0.20810 0.21560 0.21130 0.09500 0.09520 0.09390 0.26000 0.26000 0.26000 0.26000 0.24000 0.22500 0.32000 0.31250 0.24000 0.23000 0.20720 0.20550
- - - - - - 0.36130 0.38510 0.39910 0.39910 0.62530 0.62530 0.48550 0.50010 0.49460 0.45630 0.41690 0.38380 0.07890 0.07895 0.12900 0.12640 0.11778 0.11054 0.11750 0.11750 0.11750 0.16050 0.16050 0.16050
- - - - - - 0.09000 0.09000 0.10500 0.10950 0.10950 0.11310 0.24980 0.24980 0.24980 0.24980 0.24980 0.24980 0.02980 0.02700 0.02480 0.02485 0.06000 0.06000 0.12860 0.12150 0.13000 0.13000 0.10000 0.10650 0.30250 0.28190 0.27740 0.27740 0.30510 0.34020 0.47000 0.47000 0.46000 0.43000 0.39000 0.38730
- - - - - - 0.27200 0.27200 0.27200 0.27200 0.28200 0.28200 0.28000 0.26000 0.26000 0.26000 0.26000 0.26000 0.45000 0.45000 0.45000 0.45000 0.45000 0.45000
- - - - - - 0.88940 0.88940 0.84000 0.73000 0.61100 0.55100 0.95000 0.95000 0.94840 0.92500 0.90800 0.88950 0.95000 0.95000 0.95000 0.95000 0.95000 0.95000 0.42100 - - - - - 0.90000 0.90000 0.90000 0.90000 - - 0.55650 0.55620 0.54010 0.53680 - -
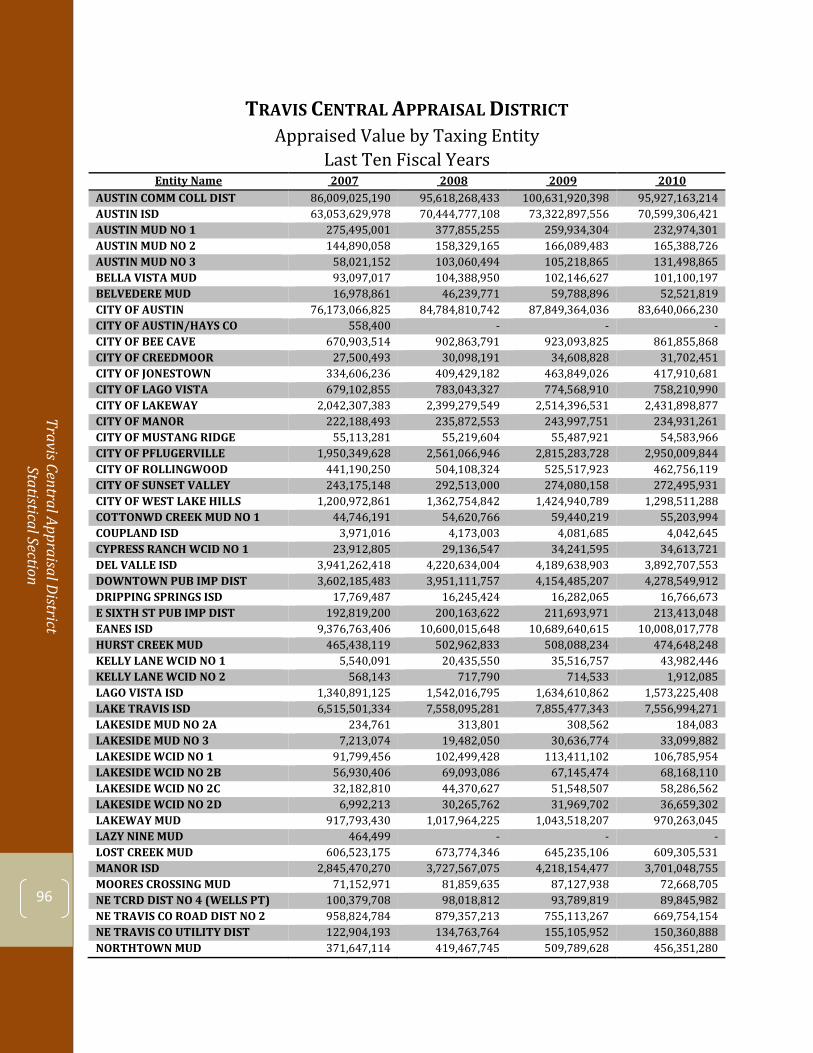
Travis Central Appraisal District Statistical Section
96
TRAVIS CENTRAL APPRAISAL DISTRICTAppraised Value by Taxing Entity
Last Ten Fiscal Years Entity Name 2007 2008 2009 2010
AUSTIN COMM COLL DIST 86,009,025,190 95,618,268,433 100,631,920,398 95,927,163,214 AUSTIN ISD 63,053,629,978 70,444,777,108 73,322,897,556 70,599,306,421 AUSTIN MUD NO 1 275,495,001 377,855,255 259,934,304 232,974,301 AUSTIN MUD NO 2 144,890,058 158,329,165 166,089,483 165,388,726 AUSTIN MUD NO 3 58,021,152 103,060,494 105,218,865 131,498,865 BELLA VISTA MUD 93,097,017 104,388,950 102,146,627 101,100,197 BELVEDERE MUD 16,978,861 46,239,771 59,788,896 52,521,819 CITY OF AUSTIN 76,173,066,825 84,784,810,742 87,849,364,036 83,640,066,230 CITY OF AUSTIN/HAYS CO 558,400 - - - CITY OF BEE CAVE 670,903,514 902,863,791 923,093,825 861,855,868 CITY OF CREEDMOOR 27,500,493 30,098,191 34,608,828 31,702,451 CITY OF JONESTOWN 334,606,236 409,429,182 463,849,026 417,910,681 CITY OF LAGO VISTA 679,102,855 783,043,327 774,568,910 758,210,990 CITY OF LAKEWAY 2,042,307,383 2,399,279,549 2,514,396,531 2,431,898,877 CITY OF MANOR 222,188,493 235,872,553 243,997,751 234,931,261 CITY OF MUSTANG RIDGE 55,113,281 55,219,604 55,487,921 54,583,966 CITY OF PFLUGERVILLE 1,950,349,628 2,561,066,946 2,815,283,728 2,950,009,844 CITY OF ROLLINGWOOD 441,190,250 504,108,324 525,517,923 462,756,119 CITY OF SUNSET VALLEY 243,175,148 292,513,000 274,080,158 272,495,931 CITY OF WEST LAKE HILLS 1,200,972,861 1,362,754,842 1,424,940,789 1,298,511,288 COTTONWD CREEK MUD NO 1 44,746,191 54,620,766 59,440,219 55,203,994 COUPLAND ISD 3,971,016 4,173,003 4,081,685 4,042,645 CYPRESS RANCH WCID NO 1 23,912,805 29,136,547 34,241,595 34,613,721 DEL VALLE ISD 3,941,262,418 4,220,634,004 4,189,638,903 3,892,707,553 DOWNTOWN PUB IMP DIST 3,602,185,483 3,951,111,757 4,154,485,207 4,278,549,912 DRIPPING SPRINGS ISD 17,769,487 16,245,424 16,282,065 16,766,673 E SIXTH ST PUB IMP DIST 192,819,200 200,163,622 211,693,971 213,413,048 EANES ISD 9,376,763,406 10,600,015,648 10,689,640,615 10,008,017,778 HURST CREEK MUD 465,438,119 502,962,833 508,088,234 474,648,248 KELLY LANE WCID NO 1 5,540,091 20,435,550 35,516,757 43,982,446 KELLY LANE WCID NO 2 568,143 717,790 714,533 1,912,085 LAGO VISTA ISD 1,340,891,125 1,542,016,795 1,634,610,862 1,573,225,408 LAKE TRAVIS ISD 6,515,501,334 7,558,095,281 7,855,477,343 7,556,994,271 LAKESIDE MUD NO 2A 234,761 313,801 308,562 184,083 LAKESIDE MUD NO 3 7,213,074 19,482,050 30,636,774 33,099,882 LAKESIDE WCID NO 1 91,799,456 102,499,428 113,411,102 106,785,954 LAKESIDE WCID NO 2B 56,930,406 69,093,086 67,145,474 68,168,110 LAKESIDE WCID NO 2C 32,182,810 44,370,627 51,548,507 58,286,562 LAKESIDE WCID NO 2D 6,992,213 30,265,762 31,969,702 36,659,302 LAKEWAY MUD 917,793,430 1,017,964,225 1,043,518,207 970,263,045 LAZY NINE MUD 464,499 - - - LOST CREEK MUD 606,523,175 673,774,346 645,235,106 609,305,531 MANOR ISD 2,845,470,270 3,727,567,075 4,218,154,477 3,701,048,755 MOORES CROSSING MUD 71,152,971 81,859,635 87,127,938 72,668,705 NE TCRD DIST NO 4 (WELLS PT) 100,379,708 98,018,812 93,789,819 89,845,982 NE TRAVIS CO ROAD DIST NO 2 958,824,784 879,357,213 755,113,267 669,754,154 NE TRAVIS CO UTILITY DIST 122,904,193 134,763,764 155,105,952 150,360,888 NORTHTOWN MUD 371,647,114 419,467,745 509,789,628 456,351,280

Trav
is Ce
ntra
l App
raisa
l Dist
rict
St
atist
ical
Sec
tion
97
TABLE 9Change in Net Position (1 OF 3)
2011 2012 2013 2014 2015 2016 98,757,698,527 103,391,804,742 110,345,523,195 125,296,393,315 146,743,193,000 168,510,792,820 72,348,197,023 74,718,236,096 80,512,260,458 92,069,380,723 108,912,819,116 126,154,141,027
308,694,516 - - - - - 160,827,331 - - - - - 125,770,511 - - - - - 100,867,600 98,278,999 101,553,199 112,212,017 - -
56,413,046 75,378,802 92,454,569 116,540,048 158,161,621 182,369,505 86,151,057,395 90,208,437,931 96,420,995,256 109,892,946,714 129,394,260,418 149,266,554,045
- - - - - - 924,755,064 1,060,603,226 1,176,887,511 1,364,909,282 1,755,599,524 2,091,417,834
36,021,506 38,765,459 45,305,639 46,651,072 50,145,458 58,298,641 409,917,975 413,109,478 402,631,731 414,881,305 434,072,108 459,395,596 735,372,165 702,283,031 694,639,169 755,395,541 809,817,751 889,052,043
2,511,413,285 2,656,013,251 2,948,362,492 3,256,143,646 3,644,539,766 4,039,893,022 234,992,597 231,408,695 289,600,608 366,208,766 446,188,693 587,950,279
54,069,780 54,170,852 53,129,724 52,607,027 55,368,492 64,360,433 3,014,518,185 3,057,767,980 3,472,047,142 4,000,610,729 4,482,482,803 5,094,240,964
466,241,244 492,598,717 532,079,568 631,175,475 750,896,683 860,555,956 280,385,798 - - - - -
1,276,125,408 1,343,245,801 1,439,947,128 1,646,805,002 1,842,687,853 2,074,320,062 50,175,224 42,197,555 44,991,637 49,712,571 84,531,306 109,132,639
4,002,906 3,972,805 3,942,300 4,500,383 4,545,023 5,178,645 40,289,430 47,314,575 63,566,923 85,893,934 115,192,920 138,380,713
3,978,438,319 4,043,162,609 4,404,109,584 4,803,244,060 5,714,458,731 6,129,736,657 5,241,939,052 - - - - -
21,552,348 27,158,734 27,670,572 35,358,113 44,750,978 45,172,755 221,871,283 - - - - -
10,056,344,294 10,478,351,993 11,191,095,715 12,563,182,736 14,162,308,322 15,835,431,849 454,741,453 448,015,786 485,904,812 527,248,610 559,387,267 586,368,026
50,150,907 52,844,983 63,978,693 78,592,626 109,896,095 144,256,518 2,488,738 1,727,683 2,415,700 7,426,022 24,560,299 52,436,412
1,549,856,216 1,507,925,524 1,458,078,005 1,543,139,364 1,619,126,098 1,767,647,786 7,748,648,111 8,040,553,253 8,681,240,950 9,672,034,534 11,105,891,163 12,454,521,588
181,848 181,276 162,298 223,463 1,485,937 10,836,028 39,345,768 56,433,393 69,456,609 94,604,331 122,731,240 157,100,923
106,122,085 112,007,976 113,686,943 125,229,757 138,976,633 147,300,229 67,487,556 67,026,532 71,496,900 85,193,138 102,936,112 119,259,565 61,552,212 63,561,315 84,247,952 95,229,322 118,862,165 149,223,158 47,656,848 53,751,637 71,174,589 96,465,434 130,852,411 154,328,232
973,449,061 952,073,562 993,306,678 1,068,908,293 1,129,346,553 1,200,127,007 - - - - - -
630,056,446 658,559,322 713,050,260 773,724,968 916,072,414 - 4,339,735,501 5,695,672,800 5,230,536,281 5,857,694,478 6,523,615,837 6,882,595,417
77,455,389 68,917,894 70,597,006 89,030,655 117,584,310 132,809,889 91,539,735 - - - - -
680,899,539 - - - - - 157,068,736 157,430,262 172,966,638 209,285,468 235,431,378 267,847,160 502,735,207 488,143,254 550,853,089 579,484,432 687,060,555 798,321,973
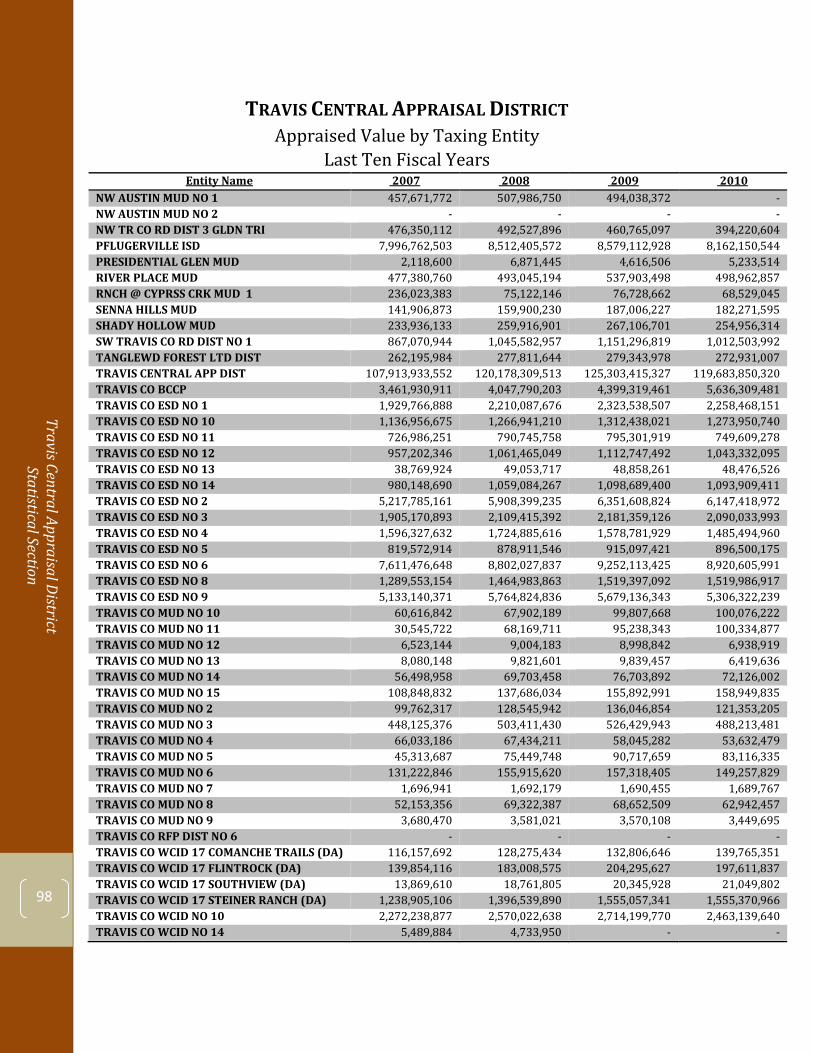
Travis Central Appraisal District Statistical Section
98
TRAVIS CENTRAL APPRAISAL DISTRICTAppraised Value by Taxing Entity
Last Ten Fiscal Years Entity Name 2007 2008 2009 2010
NW AUSTIN MUD NO 1 457,671,772 507,986,750 494,038,372 - NW AUSTIN MUD NO 2 - - - - NW TR CO RD DIST 3 GLDN TRI 476,350,112 492,527,896 460,765,097 394,220,604 PFLUGERVILLE ISD 7,996,762,503 8,512,405,572 8,579,112,928 8,162,150,544 PRESIDENTIAL GLEN MUD 2,118,600 6,871,445 4,616,506 5,233,514 RIVER PLACE MUD 477,380,760 493,045,194 537,903,498 498,962,857 RNCH @ CYPRSS CRK MUD 1 236,023,383 75,122,146 76,728,662 68,529,045 SENNA HILLS MUD 141,906,873 159,900,230 187,006,227 182,271,595 SHADY HOLLOW MUD 233,936,133 259,916,901 267,106,701 254,956,314 SW TRAVIS CO RD DIST NO 1 867,070,944 1,045,582,957 1,151,296,819 1,012,503,992 TANGLEWD FOREST LTD DIST 262,195,984 277,811,644 279,343,978 272,931,007 TRAVIS CENTRAL APP DIST 107,913,933,552 120,178,309,513 125,303,415,327 119,683,850,320 TRAVIS CO BCCP 3,461,930,911 4,047,790,203 4,399,319,461 5,636,309,481 TRAVIS CO ESD NO 1 1,929,766,888 2,210,087,676 2,323,538,507 2,258,468,151 TRAVIS CO ESD NO 10 1,136,956,675 1,266,941,210 1,312,438,021 1,273,950,740 TRAVIS CO ESD NO 11 726,986,251 790,745,758 795,301,919 749,609,278 TRAVIS CO ESD NO 12 957,202,346 1,061,465,049 1,112,747,492 1,043,332,095 TRAVIS CO ESD NO 13 38,769,924 49,053,717 48,858,261 48,476,526 TRAVIS CO ESD NO 14 980,148,690 1,059,084,267 1,098,689,400 1,093,909,411 TRAVIS CO ESD NO 2 5,217,785,161 5,908,399,235 6,351,608,824 6,147,418,972 TRAVIS CO ESD NO 3 1,905,170,893 2,109,415,392 2,181,359,126 2,090,033,993 TRAVIS CO ESD NO 4 1,596,327,632 1,724,885,616 1,578,781,929 1,485,494,960 TRAVIS CO ESD NO 5 819,572,914 878,911,546 915,097,421 896,500,175 TRAVIS CO ESD NO 6 7,611,476,648 8,802,027,837 9,252,113,425 8,920,605,991 TRAVIS CO ESD NO 8 1,289,553,154 1,464,983,863 1,519,397,092 1,519,986,917 TRAVIS CO ESD NO 9 5,133,140,371 5,764,824,836 5,679,136,343 5,306,322,239 TRAVIS CO MUD NO 10 60,616,842 67,902,189 99,807,668 100,076,222 TRAVIS CO MUD NO 11 30,545,722 68,169,711 95,238,343 100,334,877 TRAVIS CO MUD NO 12 6,523,144 9,004,183 8,998,842 6,938,919 TRAVIS CO MUD NO 13 8,080,148 9,821,601 9,839,457 6,419,636 TRAVIS CO MUD NO 14 56,498,958 69,703,458 76,703,892 72,126,002 TRAVIS CO MUD NO 15 108,848,832 137,686,034 155,892,991 158,949,835 TRAVIS CO MUD NO 2 99,762,317 128,545,942 136,046,854 121,353,205 TRAVIS CO MUD NO 3 448,125,376 503,411,430 526,429,943 488,213,481 TRAVIS CO MUD NO 4 66,033,186 67,434,211 58,045,282 53,632,479 TRAVIS CO MUD NO 5 45,313,687 75,449,748 90,717,659 83,116,335 TRAVIS CO MUD NO 6 131,222,846 155,915,620 157,318,405 149,257,829 TRAVIS CO MUD NO 7 1,696,941 1,692,179 1,690,455 1,689,767 TRAVIS CO MUD NO 8 52,153,356 69,322,387 68,652,509 62,942,457 TRAVIS CO MUD NO 9 3,680,470 3,581,021 3,570,108 3,449,695 TRAVIS CO RFP DIST NO 6 - - - - TRAVIS CO WCID 17 COMANCHE TRAILS (DA) 116,157,692 128,275,434 132,806,646 139,765,351 TRAVIS CO WCID 17 FLINTROCK (DA) 139,854,116 183,008,575 204,295,627 197,611,837 TRAVIS CO WCID 17 SOUTHVIEW (DA) 13,869,610 18,761,805 20,345,928 21,049,802 TRAVIS CO WCID 17 STEINER RANCH (DA) 1,238,905,106 1,396,539,890 1,555,057,341 1,555,370,966 TRAVIS CO WCID NO 10 2,272,238,877 2,570,022,638 2,714,199,770 2,463,139,640 TRAVIS CO WCID NO 14 5,489,884 4,733,950 - -
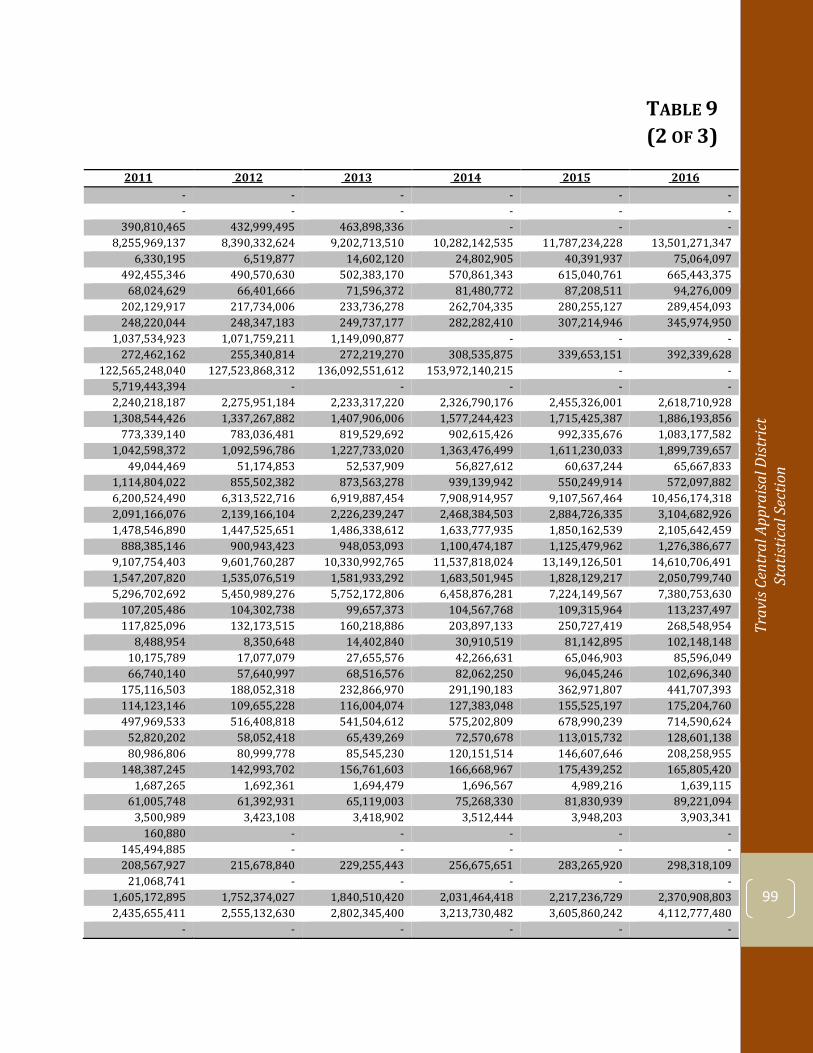
Trav
is Ce
ntra
l App
raisa
l Dist
rict
St
atist
ical
Sec
tion
99
TABLE 9Change in Net Position (2 OF 3)
2011 2012 2013 2014 2015 2016 - - - - - - - - - - - -
390,810,465 432,999,495 463,898,336 - - - 8,255,969,137 8,390,332,624 9,202,713,510 10,282,142,535 11,787,234,228 13,501,271,347
6,330,195 6,519,877 14,602,120 24,802,905 40,391,937 75,064,097 492,455,346 490,570,630 502,383,170 570,861,343 615,040,761 665,443,375
68,024,629 66,401,666 71,596,372 81,480,772 87,208,511 94,276,009 202,129,917 217,734,006 233,736,278 262,704,335 280,255,127 289,454,093 248,220,044 248,347,183 249,737,177 282,282,410 307,214,946 345,974,950
1,037,534,923 1,071,759,211 1,149,090,877 - - - 272,462,162 255,340,814 272,219,270 308,535,875 339,653,151 392,339,628
122,565,248,040 127,523,868,312 136,092,551,612 153,972,140,215 - - 5,719,443,394 - - - - - 2,240,218,187 2,275,951,184 2,233,317,220 2,326,790,176 2,455,326,001 2,618,710,928 1,308,544,426 1,337,267,882 1,407,906,006 1,577,244,423 1,715,425,387 1,886,193,856
773,339,140 783,036,481 819,529,692 902,615,426 992,335,676 1,083,177,582 1,042,598,372 1,092,596,786 1,227,733,020 1,363,476,499 1,611,230,033 1,899,739,657
49,044,469 51,174,853 52,537,909 56,827,612 60,637,244 65,667,833 1,114,804,022 855,502,382 873,563,278 939,139,942 550,249,914 572,097,882 6,200,524,490 6,313,522,716 6,919,887,454 7,908,914,957 9,107,567,464 10,456,174,318 2,091,166,076 2,139,166,104 2,226,239,247 2,468,384,503 2,884,726,335 3,104,682,926 1,478,546,890 1,447,525,651 1,486,338,612 1,633,777,935 1,850,162,539 2,105,642,459
888,385,146 900,943,423 948,053,093 1,100,474,187 1,125,479,962 1,276,386,677 9,107,754,403 9,601,760,287 10,330,992,765 11,537,818,024 13,149,126,501 14,610,706,491 1,547,207,820 1,535,076,519 1,581,933,292 1,683,501,945 1,828,129,217 2,050,799,740 5,296,702,692 5,450,989,276 5,752,172,806 6,458,876,281 7,224,149,567 7,380,753,630
107,205,486 104,302,738 99,657,373 104,567,768 109,315,964 113,237,497 117,825,096 132,173,515 160,218,886 203,897,133 250,727,419 268,548,954
8,488,954 8,350,648 14,402,840 30,910,519 81,142,895 102,148,148 10,175,789 17,077,079 27,655,576 42,266,631 65,046,903 85,596,049 66,740,140 57,640,997 68,516,576 82,062,250 96,045,246 102,696,340
175,116,503 188,052,318 232,866,970 291,190,183 362,971,807 441,707,393 114,123,146 109,655,228 116,004,074 127,383,048 155,525,197 175,204,760 497,969,533 516,408,818 541,504,612 575,202,809 678,990,239 714,590,624
52,820,202 58,052,418 65,439,269 72,570,678 113,015,732 128,601,138 80,986,806 80,999,778 85,545,230 120,151,514 146,607,646 208,258,955
148,387,245 142,993,702 156,761,603 166,668,967 175,439,252 165,805,420 1,687,265 1,692,361 1,694,479 1,696,567 4,989,216 1,639,115
61,005,748 61,392,931 65,119,003 75,268,330 81,830,939 89,221,094 3,500,989 3,423,108 3,418,902 3,512,444 3,948,203 3,903,341
160,880 - - - - - 145,494,885 - - - - - 208,567,927 215,678,840 229,255,443 256,675,651 283,265,920 298,318,109
21,068,741 - - - - - 1,605,172,895 1,752,374,027 1,840,510,420 2,031,464,418 2,217,236,729 2,370,908,803 2,435,655,411 2,555,132,630 2,802,345,400 3,213,730,482 3,605,860,242 4,112,777,480
- - - - - -
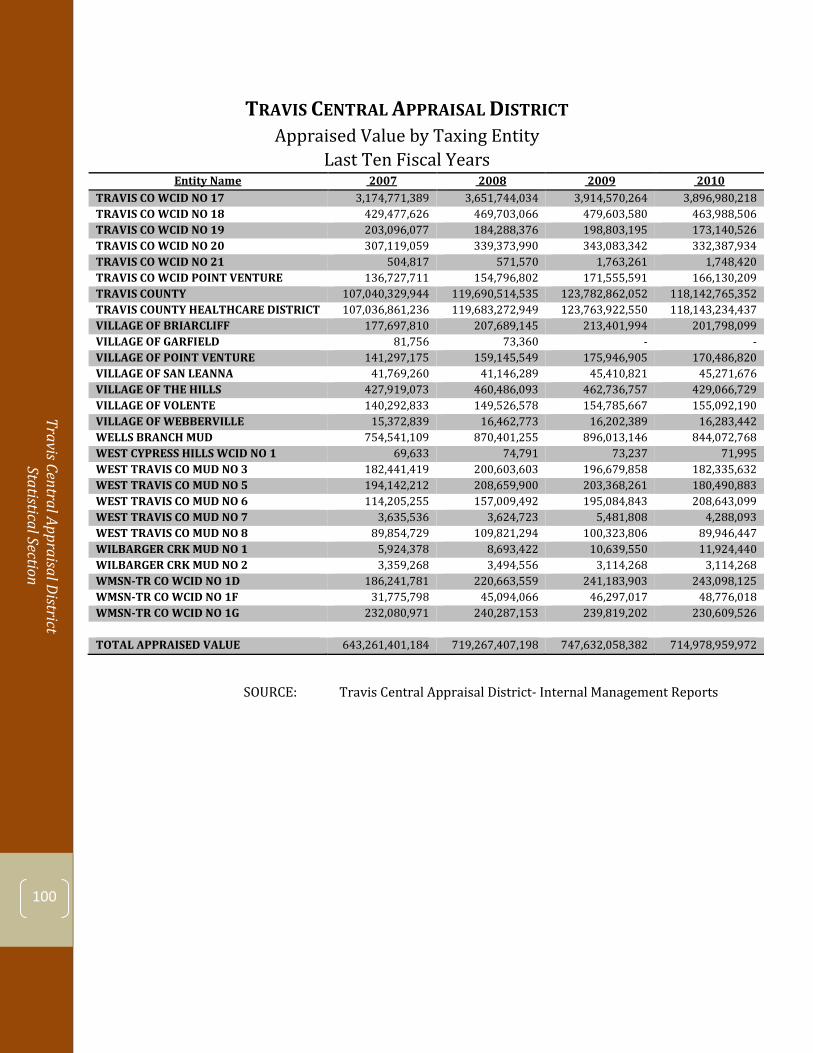
Travis Central Appraisal District Statistical Section
100
TRAVIS CENTRAL APPRAISAL DISTRICTAppraised Value by Taxing Entity
Last Ten Fiscal Years Entity Name 2007 2008 2009 2010
TRAVIS CO WCID NO 17 3,174,771,389 3,651,744,034 3,914,570,264 3,896,980,218 TRAVIS CO WCID NO 18 429,477,626 469,703,066 479,603,580 463,988,506 TRAVIS CO WCID NO 19 203,096,077 184,288,376 198,803,195 173,140,526 TRAVIS CO WCID NO 20 307,119,059 339,373,990 343,083,342 332,387,934 TRAVIS CO WCID NO 21 504,817 571,570 1,763,261 1,748,420 TRAVIS CO WCID POINT VENTURE 136,727,711 154,796,802 171,555,591 166,130,209 TRAVIS COUNTY 107,040,329,944 119,690,514,535 123,782,862,052 118,142,765,352 TRAVIS COUNTY HEALTHCARE DISTRICT 107,036,861,236 119,683,272,949 123,763,922,550 118,143,234,437 VILLAGE OF BRIARCLIFF 177,697,810 207,689,145 213,401,994 201,798,099 VILLAGE OF GARFIELD 81,756 73,360 - - VILLAGE OF POINT VENTURE 141,297,175 159,145,549 175,946,905 170,486,820 VILLAGE OF SAN LEANNA 41,769,260 41,146,289 45,410,821 45,271,676 VILLAGE OF THE HILLS 427,919,073 460,486,093 462,736,757 429,066,729 VILLAGE OF VOLENTE 140,292,833 149,526,578 154,785,667 155,092,190 VILLAGE OF WEBBERVILLE 15,372,839 16,462,773 16,202,389 16,283,442 WELLS BRANCH MUD 754,541,109 870,401,255 896,013,146 844,072,768 WEST CYPRESS HILLS WCID NO 1 69,633 74,791 73,237 71,995 WEST TRAVIS CO MUD NO 3 182,441,419 200,603,603 196,679,858 182,335,632 WEST TRAVIS CO MUD NO 5 194,142,212 208,659,900 203,368,261 180,490,883 WEST TRAVIS CO MUD NO 6 114,205,255 157,009,492 195,084,843 208,643,099 WEST TRAVIS CO MUD NO 7 3,635,536 3,624,723 5,481,808 4,288,093 WEST TRAVIS CO MUD NO 8 89,854,729 109,821,294 100,323,806 89,946,447 WILBARGER CRK MUD NO 1 5,924,378 8,693,422 10,639,550 11,924,440 WILBARGER CRK MUD NO 2 3,359,268 3,494,556 3,114,268 3,114,268 WMSN-TR CO WCID NO 1D 186,241,781 220,663,559 241,183,903 243,098,125 WMSN-TR CO WCID NO 1F 31,775,798 45,094,066 46,297,017 48,776,018 WMSN-TR CO WCID NO 1G 232,080,971 240,287,153 239,819,202 230,609,526
TOTAL APPRAISED VALUE 643,261,401,184 719,267,407,198 747,632,058,382 714,978,959,972
SOURCE: Travis Central Appraisal District- Internal Management Reports
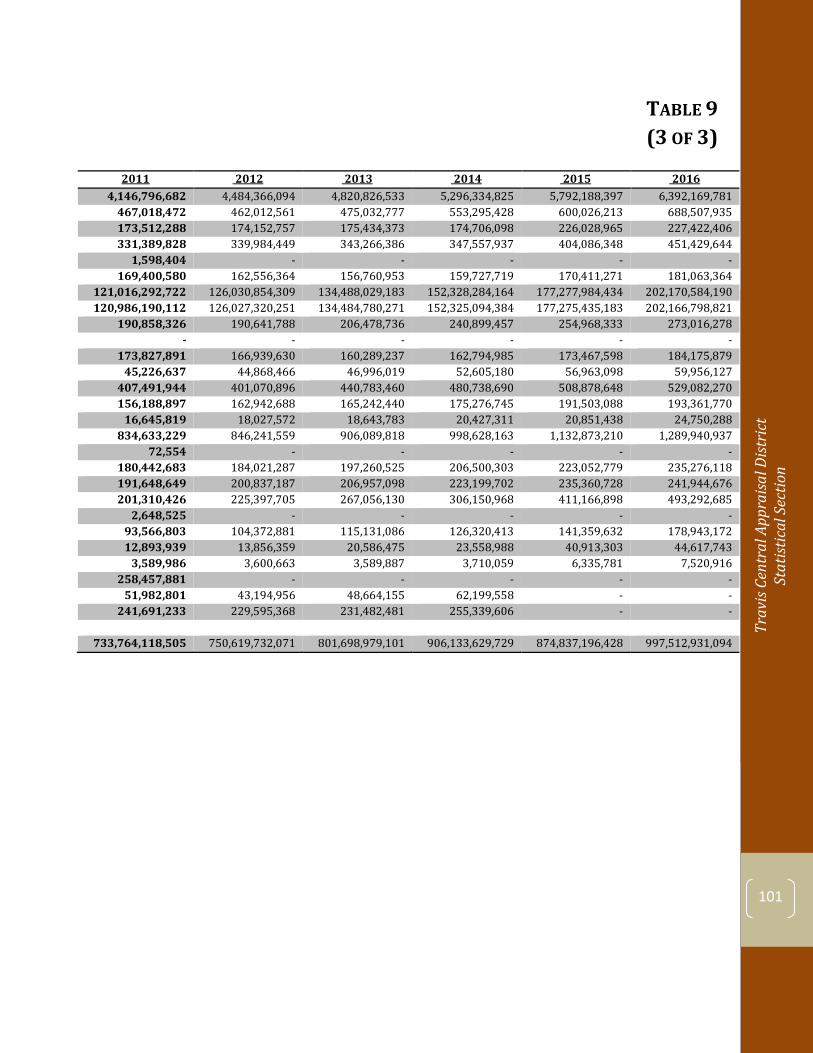
Trav
is Ce
ntra
l App
raisa
l Dist
rict
St
atist
ical
Sec
tion
101
TABLE 9Change in Net Position (3 OF 3)
2011 2012 2013 2014 2015 2016 4,146,796,682 4,484,366,094 4,820,826,533 5,296,334,825 5,792,188,397 6,392,169,781
467,018,472 462,012,561 475,032,777 553,295,428 600,026,213 688,507,935 173,512,288 174,152,757 175,434,373 174,706,098 226,028,965 227,422,406 331,389,828 339,984,449 343,266,386 347,557,937 404,086,348 451,429,644
1,598,404 - - - - - 169,400,580 162,556,364 156,760,953 159,727,719 170,411,271 181,063,364
121,016,292,722 126,030,854,309 134,488,029,183 152,328,284,164 177,277,984,434 202,170,584,190 120,986,190,112 126,027,320,251 134,484,780,271 152,325,094,384 177,275,435,183 202,166,798,821
190,858,326 190,641,788 206,478,736 240,899,457 254,968,333 273,016,278 - - - - - -
173,827,891 166,939,630 160,289,237 162,794,985 173,467,598 184,175,879 45,226,637 44,868,466 46,996,019 52,605,180 56,963,098 59,956,127
407,491,944 401,070,896 440,783,460 480,738,690 508,878,648 529,082,270 156,188,897 162,942,688 165,242,440 175,276,745 191,503,088 193,361,770
16,645,819 18,027,572 18,643,783 20,427,311 20,851,438 24,750,288 834,633,229 846,241,559 906,089,818 998,628,163 1,132,873,210 1,289,940,937
72,554 - - - - - 180,442,683 184,021,287 197,260,525 206,500,303 223,052,779 235,276,118 191,648,649 200,837,187 206,957,098 223,199,702 235,360,728 241,944,676 201,310,426 225,397,705 267,056,130 306,150,968 411,166,898 493,292,685
2,648,525 - - - - - 93,566,803 104,372,881 115,131,086 126,320,413 141,359,632 178,943,172 12,893,939 13,856,359 20,586,475 23,558,988 40,913,303 44,617,743
3,589,986 3,600,663 3,589,887 3,710,059 6,335,781 7,520,916 258,457,881 - - - - -
51,982,801 43,194,956 48,664,155 62,199,558 - - 241,691,233 229,595,368 231,482,481 255,339,606 - -
733,764,118,505 750,619,732,071 801,698,979,101 906,133,629,729 874,837,196,428 997,512,931,094
Travis Central Appraisal District Statistical Section
102
STATISTICAL SECTION
DEMOGRAPHIC & ECONOMIC INFORMATION
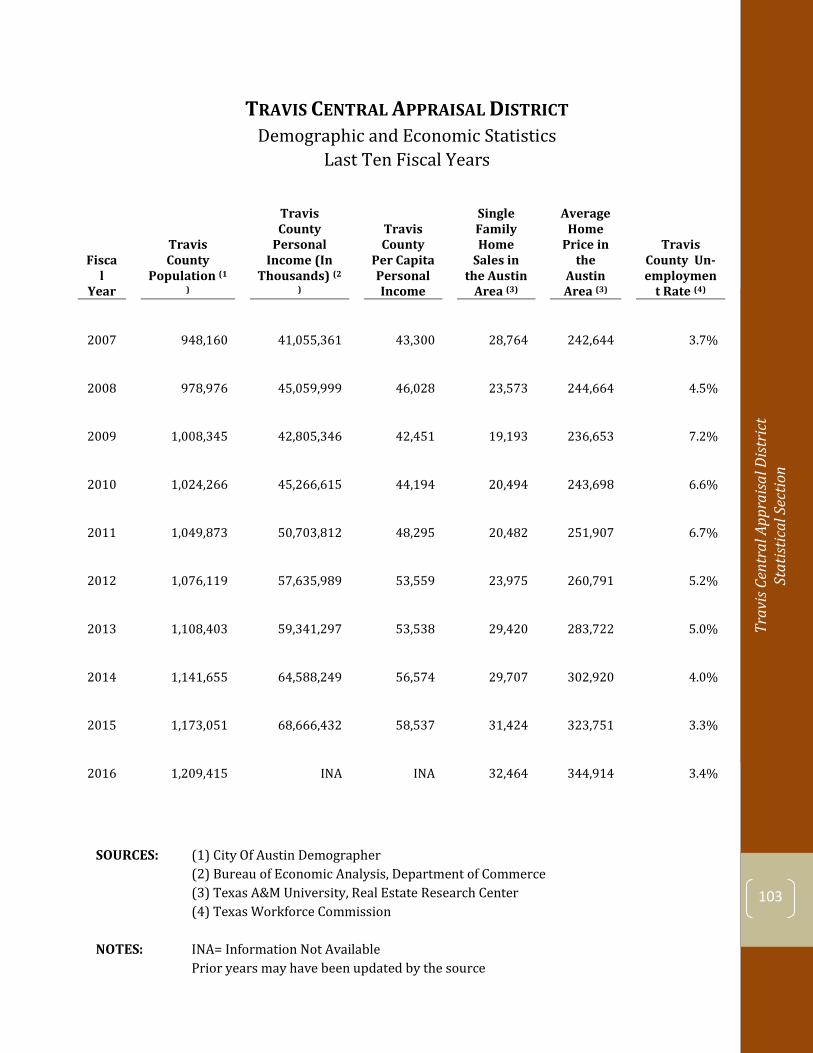
Trav
is Ce
ntra
l App
raisa
l Dist
rict
St
atist
ical
Sec
tion
103
TRAVIS CENTRAL APPRAISAL DISTRICTDemographic and Economic Statistics
Last Ten Fiscal Years
Fiscal
Year
Travis County
Population (1
)
Travis County
Personal Income (In
Thousands) (2
)
Travis County
Per Capita Personal Income
Single Family Home
Sales in the Austin
Area (3)
Average Home
Price in the
Austin Area (3)
Travis County Un- employmen
t Rate (4)
2007 948,160 41,055,361 43,300 28,764 242,644 3.7%
2008 978,976 45,059,999 46,028 23,573 244,664 4.5%
2009 1,008,345 42,805,346 42,451 19,193 236,653 7.2%
2010 1,024,266 45,266,615 44,194 20,494 243,698 6.6%
2011 1,049,873 50,703,812 48,295 20,482 251,907 6.7%
2012 1,076,119 57,635,989 53,559 23,975 260,791 5.2%
2013 1,108,403 59,341,297 53,538 29,420 283,722 5.0%
2014 1,141,655 64,588,249 56,574 29,707 302,920 4.0%
2015 1,173,051 68,666,432 58,537 31,424 323,751 3.3%
2016 1,209,415 INA INA 32,464 344,914 3.4%
SOURCES: (1) City Of Austin Demographer (2) Bureau of Economic Analysis, Department of Commerce (3) Texas A&M University, Real Estate Research Center (4) Texas Workforce Commission
NOTES: INA= Information Not Available Prior years may have been updated by the source
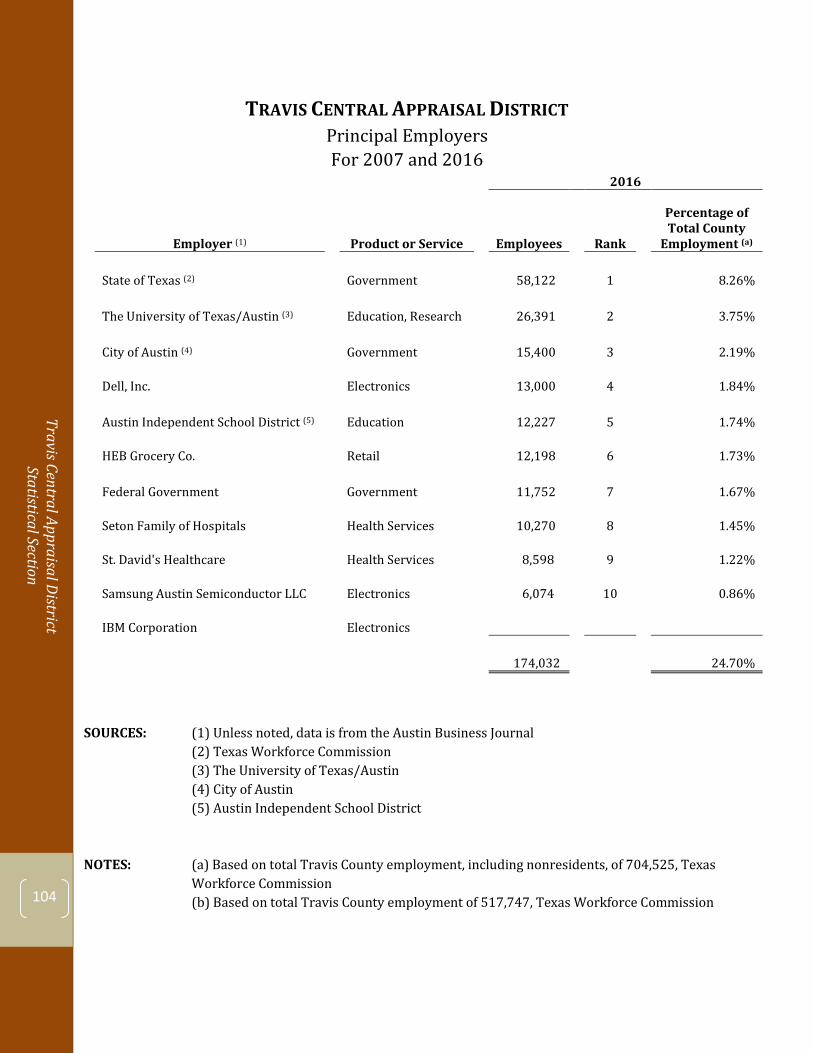
Travis Central Appraisal District Statistical Section
104
TRAVIS CENTRAL APPRAISAL DISTRICTPrincipal Employers For 2007 and 2016
2016
Employer (1) Product or Service Employees Rank
Percentage of Total County
Employment (a)
State of Texas (2) Government 58,122 1 8.26%
The University of Texas/Austin (3) Education, Research 26,391 2 3.75%
City of Austin (4) Government 15,400 3 2.19%
Dell, Inc. Electronics 13,000 4 1.84%
Austin Independent School District (5) Education 12,227 5 1.74%
HEB Grocery Co. Retail 12,198 6 1.73%
Federal Government Government 11,752 7 1.67%
Seton Family of Hospitals Health Services 10,270 8 1.45%
St. David's Healthcare Health Services 8,598 9 1.22%
Samsung Austin Semiconductor LLC Electronics 6,074 10 0.86%
IBM Corporation Electronics
174,032 24.70%
SOURCES: (1) Unless noted, data is from the Austin Business Journal (2) Texas Workforce Commission (3) The University of Texas/Austin (4) City of Austin (5) Austin Independent School District
NOTES: (a) Based on total Travis County employment, including nonresidents, of 704,525, Texas Workforce Commission (b) Based on total Travis County employment of 517,747, Texas Workforce Commission
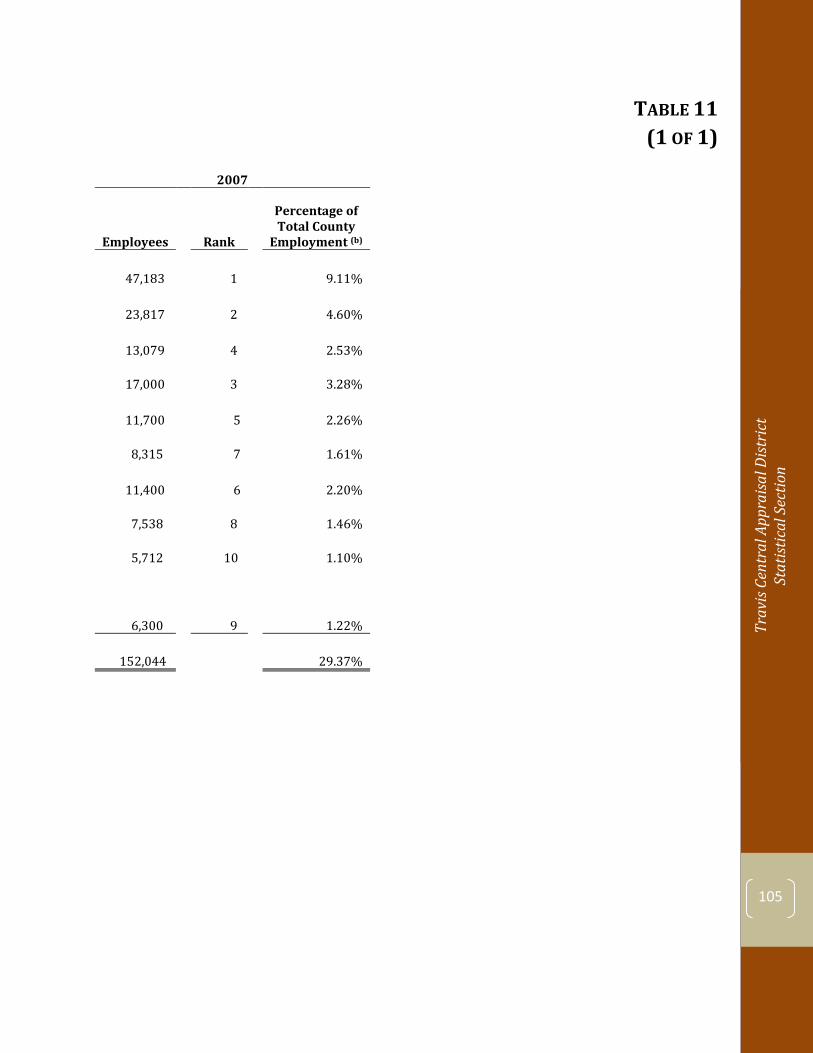
Trav
is Ce
ntra
l App
raisa
l Dist
rict
St
atist
ical
Sec
tion
105
TABLE 11Change in Net Position (1 OF 1)
2007
Employees Rank
Percentage of Total County
Employment (b)
47,183 1 9.11%
23,817 2 4.60%
13,079 4 2.53%
17,000 3 3.28%
11,700 5 2.26%
8,315 7 1.61%
11,400 6 2.20%
7,538 8 1.46%
5,712 10 1.10%
6,300 9 1.22%
152,044 29.37%
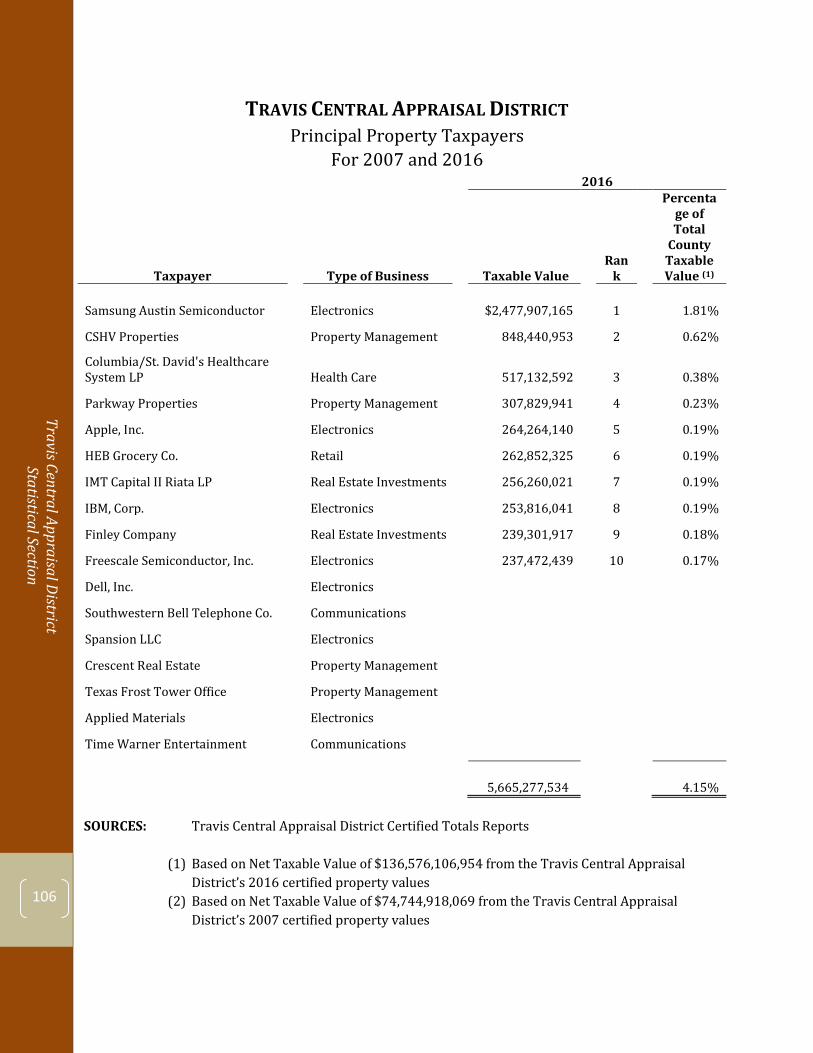
Travis Central Appraisal District Statistical Section
106
TRAVIS CENTRAL APPRAISAL DISTRICT Principal Property Taxpayers
For 2007 and 2016 2016
Taxpayer Type of Business Taxable Value Ran
k
Percentage of Total
County Taxable Value (1)
Samsung Austin Semiconductor Electronics $2,477,907,165 1 1.81%
CSHV Properties Property Management 848,440,953 2 0.62%
Columbia/St. David's Healthcare System LP Health Care 517,132,592 3 0.38%
Parkway Properties Property Management 307,829,941 4 0.23%
Apple, Inc. Electronics 264,264,140 5 0.19%
HEB Grocery Co. Retail 262,852,325 6 0.19%
IMT Capital II Riata LP Real Estate Investments 256,260,021 7 0.19%
IBM, Corp. Electronics 253,816,041 8 0.19%
Finley Company Real Estate Investments 239,301,917 9 0.18%
Freescale Semiconductor, Inc. Electronics 237,472,439 10 0.17%
Dell, Inc. Electronics
Southwestern Bell Telephone Co. Communications
Spansion LLC Electronics
Crescent Real Estate Property Management
Texas Frost Tower Office Property Management
Applied Materials Electronics
Time Warner Entertainment Communications
5,665,277,534 4.15%
SOURCES: Travis Central Appraisal District Certified Totals Reports
(1) Based on Net Taxable Value of $136,576,106,954 from the Travis Central Appraisal District’s 2016 certified property values
(2) Based on Net Taxable Value of $74,744,918,069 from the Travis Central Appraisal District’s 2007 certified property values
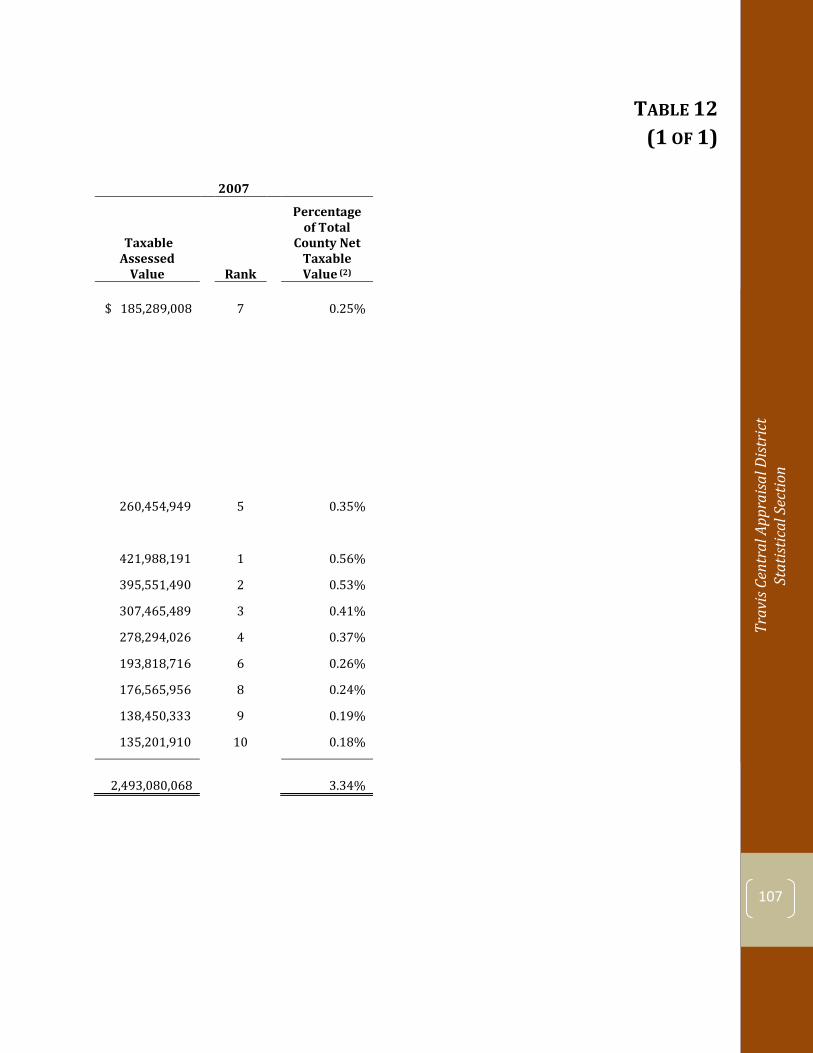
Trav
is Ce
ntra
l App
raisa
l Dist
rict
St
atist
ical
Sec
tion
107
TABLE 12Change in Net Position (1 OF 1)
2007
Taxable Assessed
Value Rank
Percentage of Total
County Net Taxable Value (2)
$ 185,289,008 7 0.25%
260,454,949 5 0.35%
421,988,191 1 0.56%
395,551,490 2 0.53%
307,465,489 3 0.41%
278,294,026 4 0.37%
193,818,716 6 0.26%
176,565,956 8 0.24%
138,450,333 9 0.19%
135,201,910 10 0.18%
2,493,080,068 3.34%

Travis Central Appraisal District Statistical Section
108
Trav
is Ce
ntra
l App
raisa
l Dist
rict
St
atist
ical
Sec
tion
109
STATISTICAL SECTION
OPERATING INFORMATION
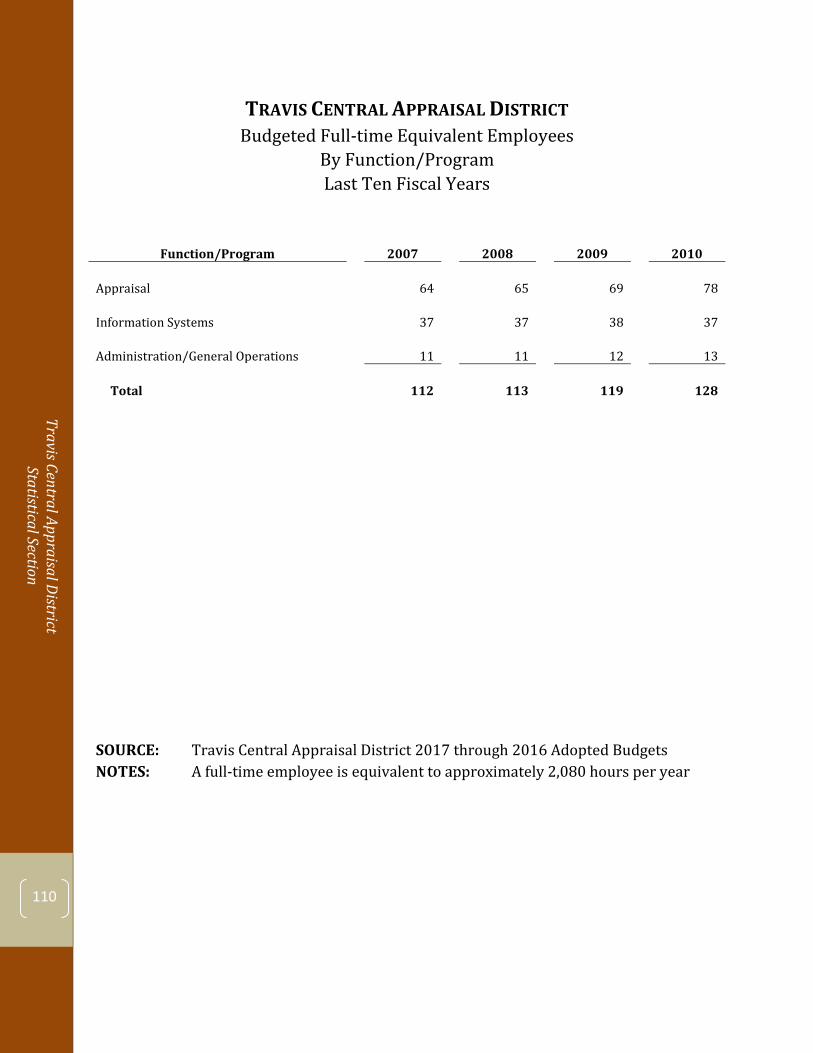
Travis Central Appraisal District Statistical Section
110
TRAVIS CENTRAL APPRAISAL DISTRICTBudgeted Full-time Equivalent Employees
By Function/Program Last Ten Fiscal Years
Function/Program 2007 2008 2009 2010
Appraisal 64 65 69 78
Information Systems 37 37 38 37
Administration/General Operations 11 11 12 13
Total 112 113 119 128
SOURCE: Travis Central Appraisal District 2017 through 2016 Adopted Budgets NOTES: A full-time employee is equivalent to approximately 2,080 hours per year
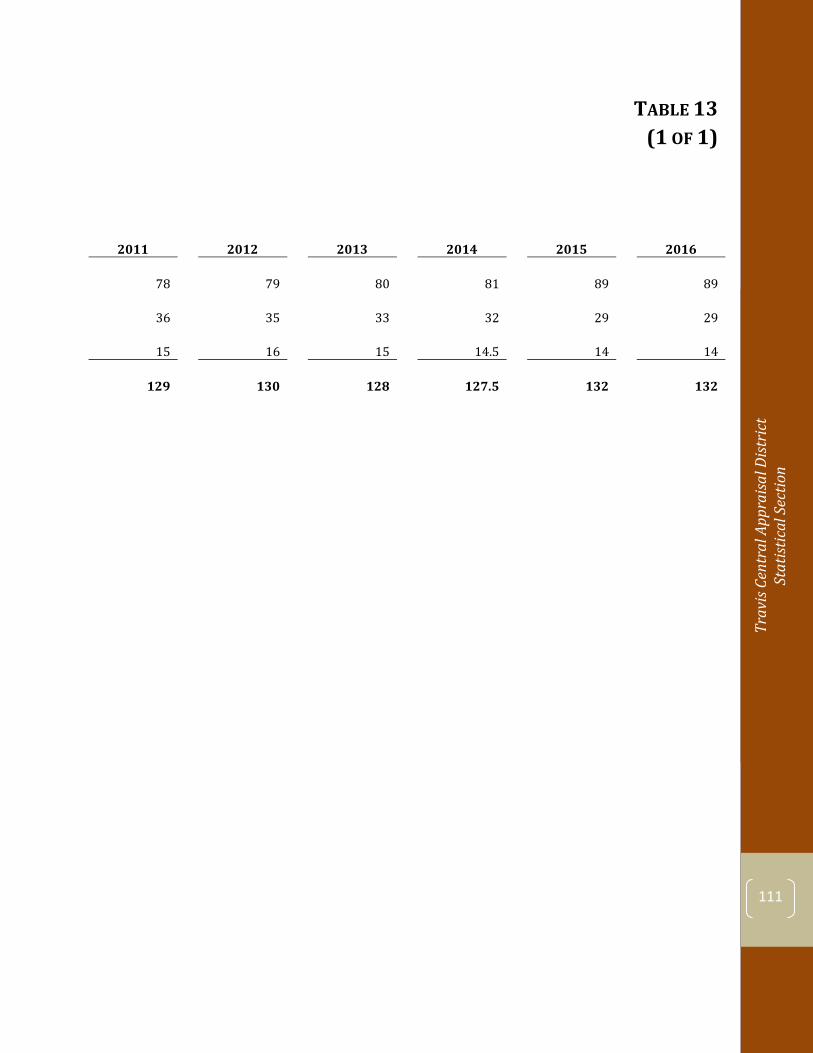
Trav
is Ce
ntra
l App
raisa
l Dist
rict
St
atist
ical
Sec
tion
111
TABLE 13Change in Net Position (1 OF 1)
2011 2012 2013 2014 2015 2016
78 79 80 81 89 89
36 35 33 32 29 29
15 16 15 14.5 14 14
129 130 128 127.5 132 132
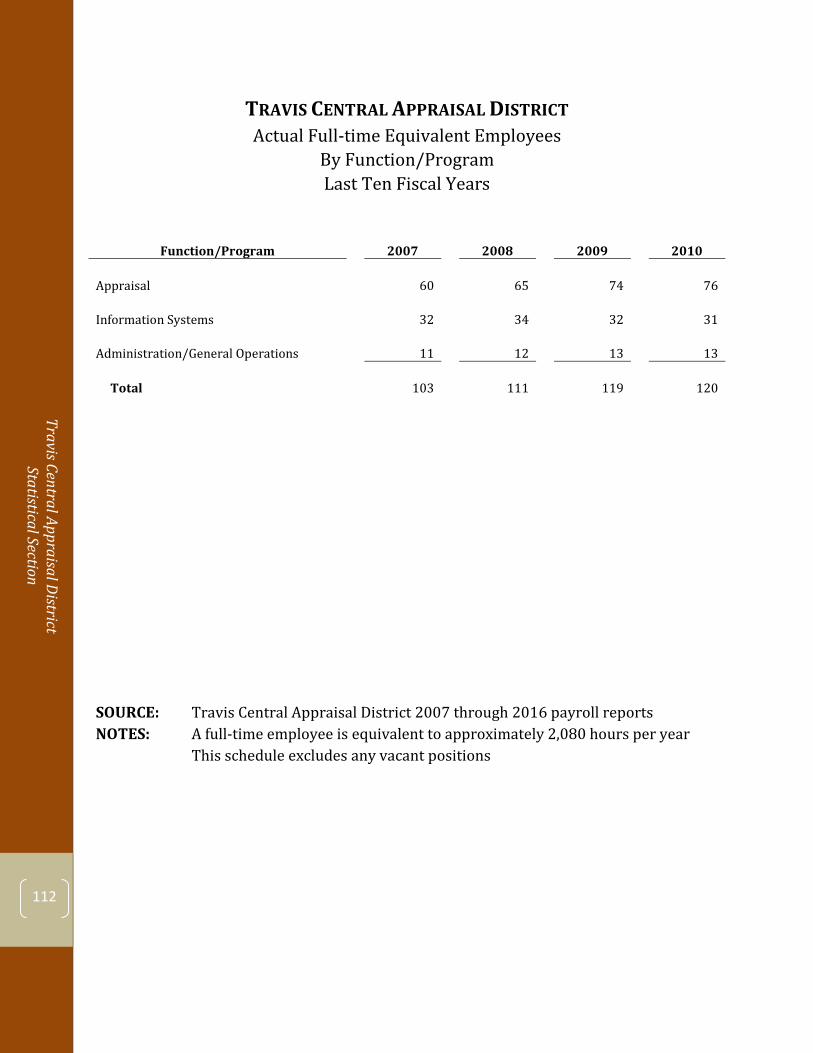
Travis Central Appraisal District Statistical Section
112
TRAVIS CENTRAL APPRAISAL DISTRICT
Actual Full-time Equivalent Employees By Function/Program Last Ten Fiscal Years
Function/Program
2007
2008
2009
2010
Appraisal
60
65
74
76
Information Systems
32
34
32
31
Administration/General Operations
11
12
13
13
Total
103
111
119
120
SOURCE: Travis Central Appraisal District 2007 through 2016 payroll reports NOTES: A full-time employee is equivalent to approximately 2,080 hours per year This schedule excludes any vacant positions

Trav
is Ce
ntra
l App
raisa
l Dist
rict
St
atist
ical
Sec
tion
113
TABLE 14Change in Net Position (1 OF 1)
2011 2012 2013 2014 2015 2016
76 76 76 70 88 61
31 26 25 25 27 32
16 15 12 12 12 9
123 117 113 107 127 102
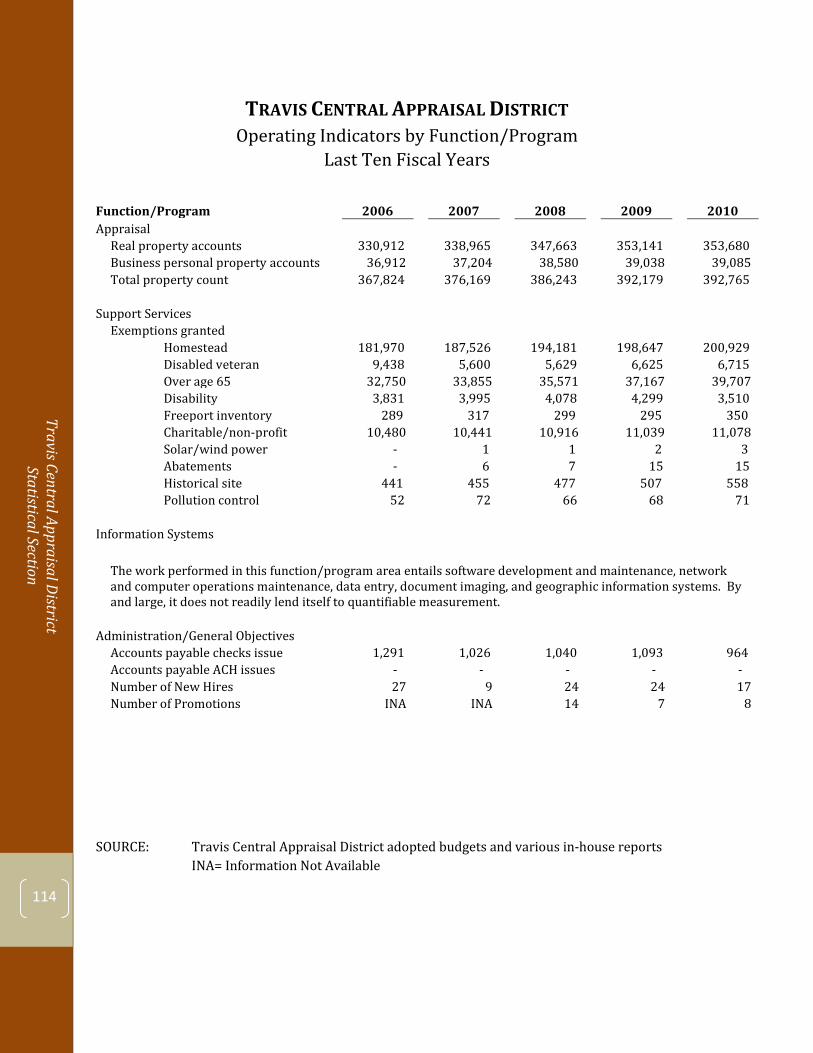
Travis Central Appraisal District Statistical Section
114
TRAVIS CENTRAL APPRAISAL DISTRICTOperating Indicators by Function/Program
Last Ten Fiscal Years
Function/Program 2006 2007 2008 2009 2010 Appraisal
Real property accounts 330,912 338,965 347,663 353,141 353,680 Business personal property accounts 36,912 37,204 38,580 39,038 39,085 Total property count 367,824 376,169 386,243 392,179 392,765
Support Services Exemptions granted
Homestead 181,970 187,526 194,181 198,647 200,929 Disabled veteran 9,438 5,600 5,629 6,625 6,715 Over age 65 32,750 33,855 35,571 37,167 39,707 Disability 3,831 3,995 4,078 4,299 3,510 Freeport inventory 289 317 299 295 350 Charitable/non-profit 10,480 10,441 10,916 11,039 11,078 Solar/wind power - 1 1 2 3 Abatements - 6 7 15 15 Historical site 441 455 477 507 558 Pollution control 52 72 66 68 71
Information Systems
The work performed in this function/program area entails software development and maintenance, network and computer operations maintenance, data entry, document imaging, and geographic information systems. By and large, it does not readily lend itself to quantifiable measurement.
Administration/General Objectives Accounts payable checks issue 1,291 1,026 1,040 1,093 964 Accounts payable ACH issues - - - - - Number of New Hires 27 9 24 24 17 Number of Promotions INA INA 14 7 8
SOURCE: Travis Central Appraisal District adopted budgets and various in-house reports INA= Information Not Available
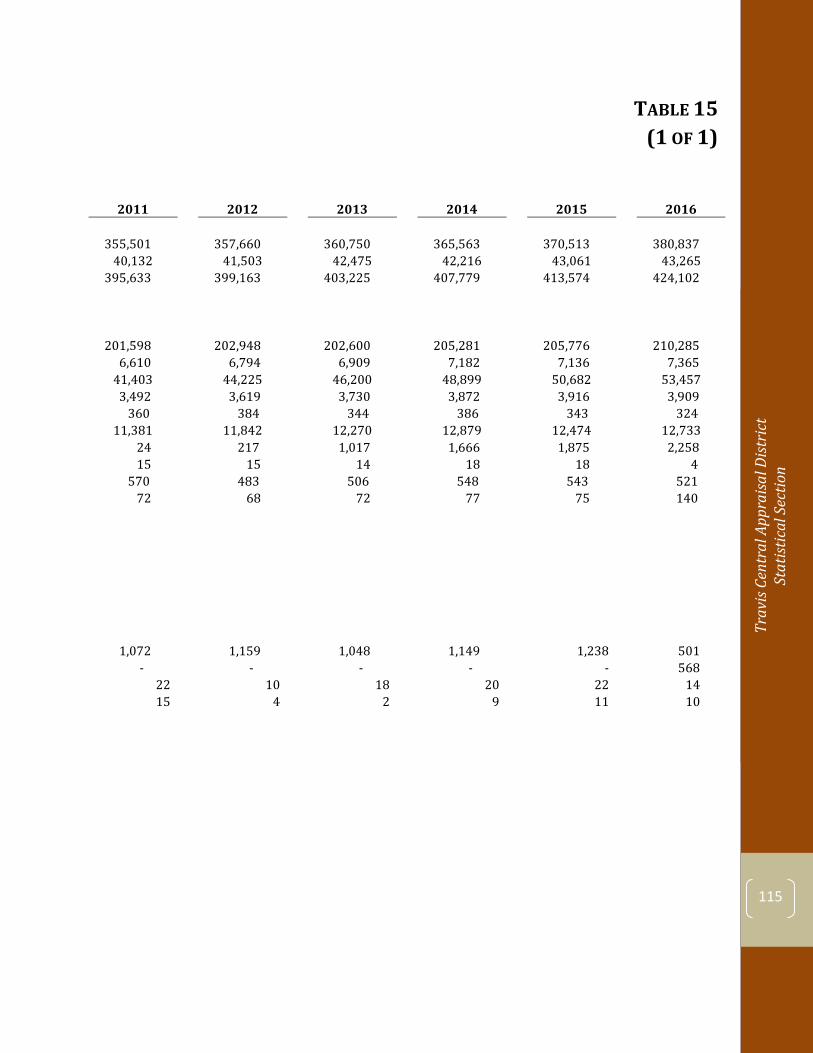
Trav
is Ce
ntra
l App
raisa
l Dist
rict
St
atist
ical
Sec
tion
115
TABLE 15Change in Net Position (1 OF 1)
2011 2012 2013 2014 2015 2016
355,501 357,660 360,750 365,563 370,513 380,837 40,132 41,503 42,475 42,216 43,061 43,265
395,633 399,163 403,225 407,779 413,574 424,102
201,598 202,948 202,600 205,281 205,776 210,285 6,610 6,794 6,909 7,182 7,136 7,365
41,403 44,225 46,200 48,899 50,682 53,457 3,492 3,619 3,730 3,872 3,916 3,909
360 384 344 386 343 324 11,381 11,842 12,270 12,879 12,474 12,733
24 217 1,017 1,666 1,875 2,258 15 15 14 18 18 4
570 483 506 548 543 521 72 68 72 77 75 140
1,072 1,159 1,048 1,149 1,238 501 - - - - - 568
22 10 18 20 22 14 15 4 2 9 11 10
Travis Central Appraisal District Statistical Section
116
STATISTICAL SECTION
DEBT INFORMATION
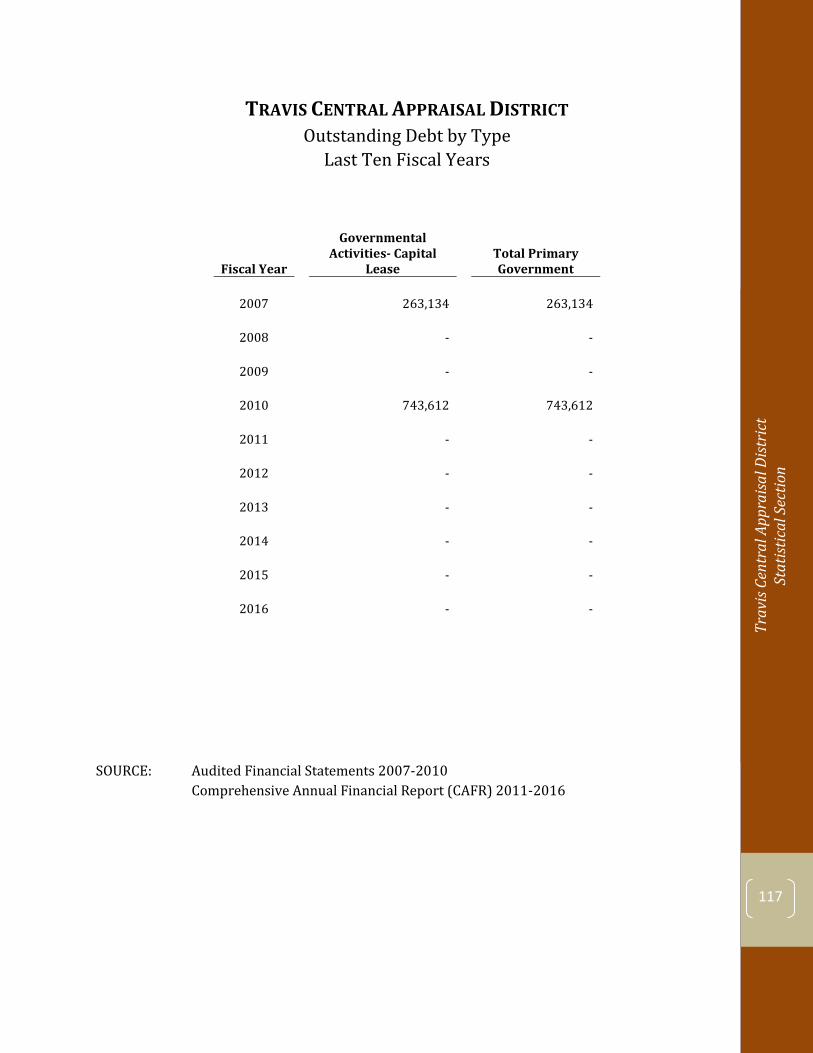
Trav
is Ce
ntra
l App
raisa
l Dist
rict
St
atist
ical
Sec
tion
117
TRAVIS CENTRAL APPRAISAL DISTRICTOutstanding Debt by Type
Last Ten Fiscal Years
Fiscal Year
Governmental Activities- Capital
Lease Total Primary Government
2007 263,134 263,134
2008 - -
2009 - -
2010 743,612 743,612
2011 - -
2012 - -
2013 - -
2014 - -
2015 - -
2016 - -
SOURCE: Audited Financial Statements 2007-2010 Comprehensive Annual Financial Report (CAFR) 2011-2016
Travis Central Appraisal District Statistical Section
118