
TRAVEL INDUSTRY SURVEY 2016 · travel industry survey 2016 section 2 of 2 october 24, 2016 ......
15
TRAVEL INDUSTRY SURVEY 2016 SECTION 2 of 2 OCTOBER 24, 2016 WWW.TRAVELWEEKLY.COM
Transcript of TRAVEL INDUSTRY SURVEY 2016 · travel industry survey 2016 section 2 of 2 october 24, 2016 ......
TRAVEL INDUSTRY SURVEY 2016
SECTION 2 of 2OCTOBER 24, 2016WWW.TRAVELWEEKLY.COM
01TIS1024;7.indd T1 10/7/16 1:38 PM

T6 T8DATA:
GLOBAL CONCERNS EXPERT: Phil Otterson of
Abercrombie & Kent talks sell-ing security amid uncertainty.
DATA: AGENCY JOBS
EXPERT: ASTA’S Eben Peck on the health of agency employ-
ment trends.
T24DATA:
PREFERRED METHODEXPERT: Drew Daly of
CruiseOne and Dream Vacations on preferred relationships.
T12
T13 T16
DATA:HOME GROWN
EXPERT: Joanie Ogg of Ogg Marketing Group discusses
home-based revenue growth.
DATA:THE FEE FACTOREXPERT: Travel Leaders
Network’s Roger Block on fees vs. commission.
DATA POINTSA snapshot of the trends that are shaping the travel
industry in 2016.
T20DATA:
SOCIAL MEDIA EXPERT: Cruise Planners’ Vicky Garcia on how agents are har-
nessing social media.
MATERIALS IN THIS PUBLICATION MAY NOT BE REPRODUCED IN ANY FORM WITHOUT PERMISSION.
TRAVEL WEEKLY® IS A REGISTERED TRADEMARK. PRINTED IN THE U.S.
SENIOR VICE PRESIDENT/EDITOR IN CHIEF:
ARNIE WEISSMANN
EDITOR: ROB FIXMER
MANAGING EDITOR: REBECCA TOBIN
NEWS EDITOR:JOHANNA JAINCHILL
DEPUTY MANAGING EDITOR:GERRY BOURBEAU
DESTINATIONS EDITOR:ERIC MOYA
CREATIVE DIRECTOR: THOMAS LECHLEITER
CONTRIBUTORS: JERI CLAUSING,
SARAH FELDBERGJAMIE BIESIADA
TOM STIEGHORST
COPY EDITOR: NEIL COHEN
GRAPHIC DESIGNER: JENNIFER MARTINS
PRODUCTION: MICHELE M. GARTH,
LISA GONZALES, GAYLE GRAIZZARO
PUBLISHER, TRAVEL WEEKLY/TRAVELAGE WEST:BRUCE SHULMAN
PRESIDENT, TRAVEL GROUP:BOB SULLIVAN
NORTHSTAR TRAVEL GROUP, LLC CHAIRMAN AND CHIEF
EXECUTIVE OFFICER: THOMAS L. KEMP
W W W . T R A V E L W E E K L Y . C O M T3
TABLE OFCONTENTS
INTRODUCTIONA look at some of the statistical outliers — the num-
bers in a chart that turn left when all the others turn
right — in this year’s Travel Industry Survey, by editor in
chief Arnie Weissmann.
T10
T26 T27
T4
BUSINESS PROFILEA look at who we surveyed based on agency type,
annual revenue and business mix.
METHODOLOGYHow the Travel Industry Survey was conducted.
DATA: OUT ON TOUR
EXPERT: Ensemble Travel Group’s Suzanne Hall on the
‘experiential’ tour trend.
03TIS1024;23.indd T3 10/7/16 3:23 PM

SIZE OF HOME-BASED AGENCIES, BY REVENUE
0% 5% 10% 15% 20% 25% 30% 35%
25%21%
23%18%
35%32%
15%26%
2%3%
Less than $25,000
$25,001 to $100,000
$100,001 to $500,000
$500,001 to $2 million
More than $2 million
2014 2015
0%
25%
50% Traditional agencies Home-based agents
Total <$1M $1M-$3M $3M-$10M >$10M <$100K $100K-$500K >$500K
Family travel Luxury Wedding Adventure travel
40%
44%
41%
35% 35%
32%
48%
42%
34%
22%
18%
8%
17%
6%8%
18%
7% 7%5%
10%12%
6%
20%
30%
9%
14%16%
11%
24%
30%
11%10%
T4 O C T O B E R 2 4 , 2 0 1 6
TRAVEL INDUSTRY SURVEY 2016
INTRODUCTIONBy Arnie Weissmann
One learns a lot from trend lines, but I always find myself spending a fair amount of time thinking about outliers, those numbers in a chart that turn left when all the others turn right.
sell considerably more air, and the smallest of home-based agents (under $100,000 in annual sales) don’t sell as much interna-tional (they’re about 50/50 international/domestic).
But looking over some of the detailed charts, there are some jumps and dips whose cause is not as easily discerned.
The number of home-based agents who rose to the $500,000-to-$2 million range of annual sales now represents 26% of all home-based agents, up from only 15% a year ago, and the gain is a result of other agents moving up rather than down.
Good news, right? Not completely. Look-ing elsewhere in the data, one finds a pos-sible explanation that has some negative connotations. The average tenure of home-
based agents rose to 8.5 years, a jump of almost a year. Concurrently, the
proportion of those who have been in business two years or less fell from 27% to 21%. Taken togeth-er, this suggests a decline in new
entrants. While I remain optimistic that retail travel is an attractive career for young people,
it would appear that there were
fewer entrants in this survey than previous years.
When it comes to business mix and agen-cy size, some patterns emerge that could be of keen interest to certain suppliers:
· For both traditional and home-based agencies, the smaller the agency, the more likely it is to sell more family travel than larger agencies. There’s no apparent reason why, unless that for agencies with less than $100,000 in gross sales, a larger proportion of their sales is to their own family.
· It appears that the higher the gross sales, the more luxury is sold. That expla-nation becomes self-evident if you write the sentence in reverse: The more luxury sold, the higher the gross sales.
· For some reason, adventure travel seems to be a sweet spot for traditional agencies with sales of $3 million to $10 million. On average, 10% of agencies put some focus on adventure, but those mid-size agencies come in at 18%. With wed-dings, however, slightly smaller agencies tend to take the lead: it’s 11% overall vs. 17% for agencies with $1 million to $3 mil-lion in sales.
OK, enough with anomalies and outli-ers. The rest of this special issue puts focus and provides context for major industry trends with wider applications and, per-haps, implications.
Arnie Weissmann
FOCUS ON NICHE PRODUCTS: TYPES OF TRAVEL SOLD BY TYPE AND SIZE OF AGENCY
Generally speaking, there is a remark-able directional consistency within our annual Travel Industry Survey from year to year, and I regard that as a good thing. Absent an unusual outside influence, it speaks to the survey’s reliability when trends move along at a somewhat predict-able pace until, as often occurs, they level off or gently reverse.
There were, in fact, three long-term trends that leveled off this year:
· The percentage of advisers who are home-based seems to have stabilized at around 50%.
· Air bookings, as a percentage of to-tal sales, has been dropping for years but seems to have settled at an average of around 17% of most agencies’ mix.
· The long-term, steady rise in international bookings vs. do-mestic seems to have plateaued at around a 3 to 2 ratio.
When you begin to look at the breakdowns of agency size, there are a few not-too-surpris-ing exceptions in the numbers above. Larger agencies, which also have a higher per-centage of corporate travel in their mix,
04TIS1024;19.indd T4 10/10/16 1:01 PM
TRAVEL INDUSTRY SURVEY 2016
T6 O c t O b e r 2 4 , 2 0 1 6
EVENTS THAT AGENTS BELIEVE WILL IMPACT REVENUE IN
THE NEXT TWO YEARS
EVENTS WITH THEMOST NEGATIVE IMPACT ON BUSINESS LAST YEAR
Security/terrorism fears Foreign health issues Internet competition
Rising airfares and fees Soft U.S. economy Rising fuel costs
Geopolitical tensions and security/terrorism fears Internet competition Foreign health issues
Rising airfares and fees Airport hassles, delays Increased costs of travel
Soft U.S. economy Unfavorable opinion of U.S. Natural disasters
Rising fuel costs Devaluation of the dollar Other
0%
20%
40%
60%
80%
2008 2009 2010 2011 2012 2013 2014 2015 2016
0%
20%
40%
60%
80%62%
34%
32% 31% 28% 25%20%
10% 9% 9% 8%2%
14%17%
17%
23%26% 25%
28%
29% 37%39%
68%
32%
12%10%5%6%7%5%4%
33%
44%
36% 34%
37% 38% 38% 40% 40%
28%23%
43%
52%55%
58%
50%
46%
40%
70%
48%
64%
49%
46%
47%
31%
22% 15% 13%
6%
24%
13%
36%

GLOBAL CONCERNS
w w w . t r a v e l w e e k l y . c O m T7
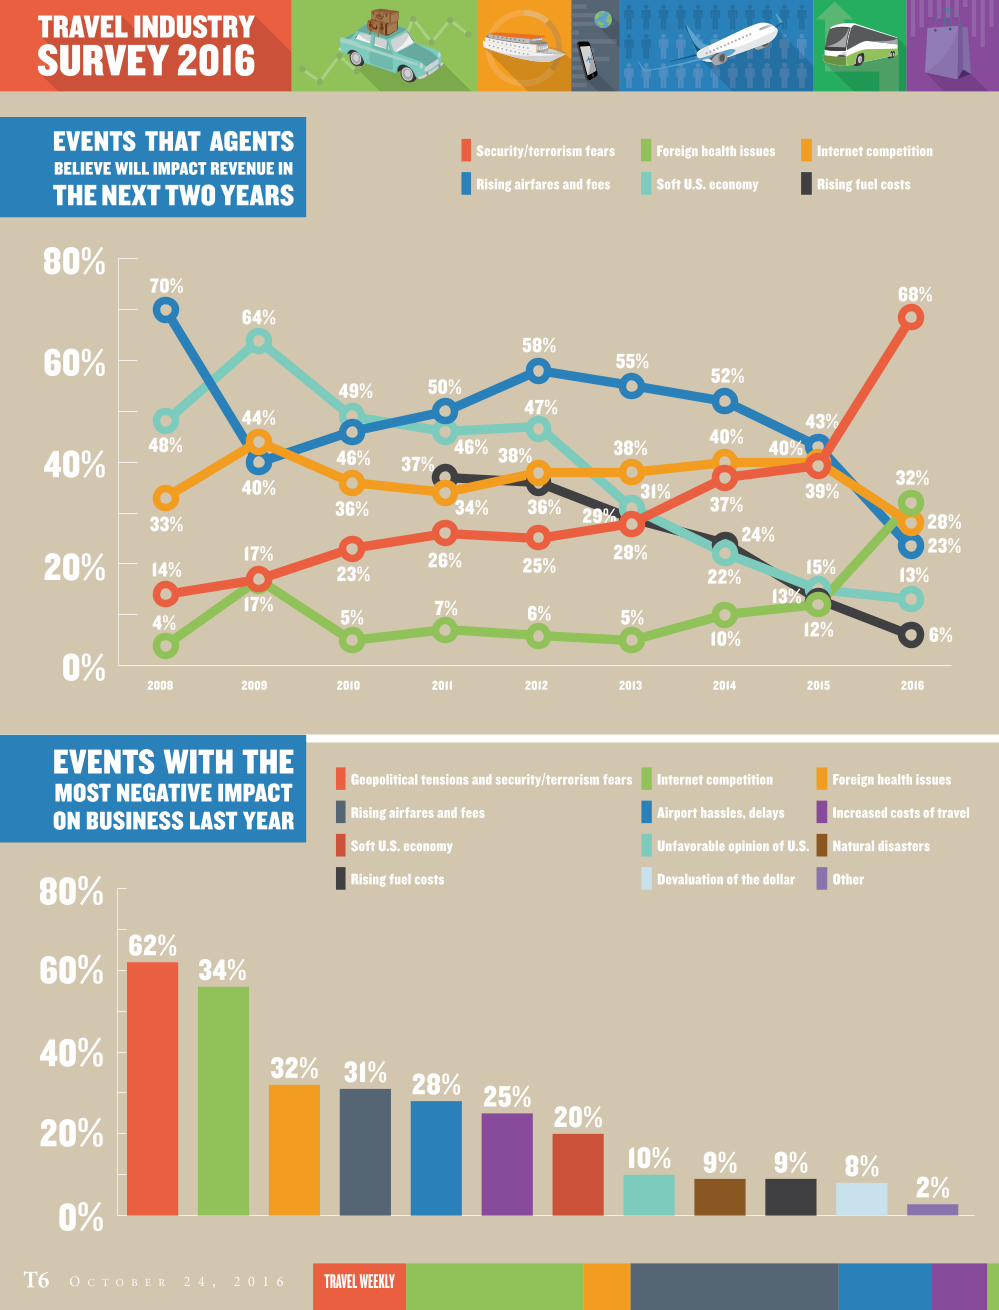
It’s difficult to imagine these days that in 2008, rising airfares and an ailing economy were the issues that kept travel agents up at night the most, while terrorism and disease barely registered.
When Travel Weekly’s Travel Industry Survey asked agents in 2008 what issues would most negatively impact their busi-ness over the next two years, terrorism was cited by just 14% of agents, while rising airfares and fees topped the list.
In an almost complete reversal, airfare and fees dropped to 23% this year while se-curity/terrorism fears overtook all concerns at 68%.
Although the overall shift has been gradual, the 2016 survey shows a dramatic change even from 2015, when rising air-fares and fees were still the single most-cited issue, with 43% of agents saying they be-lieved the cost of air travel would have the most im-pact on their bot-tom line over the next two years.
Reflecting the recent Zika and Ebola outbreaks, foreign health is-sues jumped from a mere 4% in 2008 to 32% this year.
Travel Weekly contributing editor Jeri Clausing talked to Phil Otterson, president of Abercrombie & Kent USA, about how traveler concerns about global tensions, ter-rorism and security are affecting the indus-try, and what A&K is doing to address the issue.
Q: Do these survey results surprise you at all?
A: No. I’ve been in the business for, I hate to tell you how long. I can think
back to 1985 when for me, personally, the first terrorism incidents occurred.
That would have been the hijacking of the TWA flight [in Athens], with the fa-mous picture of a gun being held to the pilot’s head. And the Achille Lauro was the same year, where [hijackers] threw Leon Klinghoffer’s body overboard.
That was the first time I had really expe-rienced that, and I remember traveling to Europe soon after and seeing soldiers with machine guns in the Vienna airport. So this has been with us my entire career.
I think we go through difficult times throughout history when we are all more aware, and it is up to tour operators and travel companies to mitigate these issues as much as they possibly can.
One of the secrets to A&K’s success when it comes to this issue is that we have local contacts through our own employ-ees.
We have hundreds of employees in Egypt, for instance, which gives us a high-er level of safety [through information
about potential concerns before they are more broadly recognized.] Q: Even with this knowledge, how do
you help assuage client concerns af-ter there is an incident, to reassure them
without promising them that they will be safe, which we know no one can guarantee?
70Years of Hospitality
Celebrating
*Numbers are approximate and can fl uctuate. Best Western and Best Western marks are service marks or registered service marks of Best Western International, Inc. ©2016 Best Western International, Inc. All rights reserved. Each Best Western® branded hotel is independently owned and operated.
SM®
With seven brands under the Best Western® Hotels and Resorts name, fi nding one perfect for your client has never been easier. With more than 4,100 hotels worldwide*, there’s
a Best Western that’s perfect for every client and destination wherever life takes them. Check out today’s Best Western Hotels and Resorts. As always, Best Western rewards our travel partners with fully commissionable rates, guaranteed payments, and 24/7 support.
Wherever Life Takes You, Best Western Is There.®
GDS code: BWbestwestern.com | 1-800-WESTERN
Phil OttersonAbercrombie & Kent USA
See IMPACT on Page 30

TRAVEL INDUSTRY SURVEY 2016
T8 O c t O b e r 2 4 , 2 0 1 6
AGENCY EMPLOYMENTSince 2008 the Travel Industry Survey has asked traditional agencies to break down the status of their employees. Over the years, the average number of full-time em-ployees has fallen from 29.3 to 19.6. This year, Travel Weekly added a category to the survey, independent contractors (ICs), and found that the average agency employs 11.8 ICs. Eben Peck, ASTA’s senior vice president of government and industry affairs, spoke with news editor Johanna Jainchill about these numbers and what they say about the agent sector.
Q: Do the TIS numbers correspond with your own data?
A: According to our most recent ASTA agency profile report, the overall av-
erage number of full-time employees is 10, part-time is two and ICs is 10. This is a survey of all ASTA members, not just “traditional agency locations.” This may explain some of the discrepancy.
For retail/office locations only (exclud-ing home-based and independent) it’s seven full-time employees, 2.1 part-time employees and 13.3 ICs.
Q: Is this breakdown indicative of a healthy industry?
sumer awareness campaigns from ASTA and the consortia have driven home this message with great results.
Q: ASTA created a new membership cat-egory for independent contractors
this year. Does that have to do with a rise in ICs?
A: It does. In mid-2016 ASTA [created] a new independent-contractor mem-
bership category of $199 per year for ICs who are affiliated with an ASTA Premium Agency mem-ber and who sign a two-year agreement or who are already a National Association of Career Travel Agents member.
For the past two years ASTA’s large consortia mem-bers have been showing an enhanced commitment to the association by subsidizing and mandating membership. We believe a tiered membership structure is the best way for
members to pay according to their ability based on sales, and the new IC category is another way to help those agents who want to join ASTA to do so. Engaging this grow-ing part of the industry is key to ASTA’s fu-ture growth.
Q: Considering recent regulations re-garding ICs, do agencies have to be
more adept at learning how to properly employ them?
A: Yes, agencies have to be careful in terms of how they engage ICs. We
recommend that agencies look carefully at the totality of the circumstances of their relationship with ICs and engage the worker as an entity, as opposed to as an individual.
We also recommend agencies direct ICs to provide their own access to software and booking tools or pay the agency for access. It is also advisable to pay the IC on a straight commission basis, as opposed to hourly, and having a written fixed-term contract in place with the IC.
The stakes are high. If an agency is clas-sifying workers as ICs and they are reclas-sified as employees by the Department of Labor, agency owners would be respon-sible for back payroll taxes that were not deducted. There is also some potential li-ability for overtime and minimum-wage requirements and possible penalties and fines.
ASTA has a number of member-only resources available that provide guidance to agencies seeking to ensure their IC re-lationships will pass muster.
Eben PeckASTA
A: It’s indicative of an evolving industry. In terms of overall industry health, you
would have to look at revenue growth, etc. This is notoriously hard to pin down, but we are seeing positive signs all around. Last year, 70% of our members reported realiz-ing a profit, up from 54% in 2012. Further, our consumer research study found that in the past 12 months, 22% of consumers booked through a travel agent, the highest share reported in the past three years.
Q: I know that in 2015 you found that travel agency
employment had reached a five-year high. What do you attribute that to?
A: We think the industry has reached a tipping point, to
the benefit of the travel agency community. At this point, con-sumers have tried it all: they’ve booked online, they’ve gone direct and they’ve used a travel agent. Our consumer study dispelled once and for all the myth that booking direct with suppliers or spending hours online yourself gets you a better deal or gives you a happier travel experience. In short, if consumers want a better travel experience, they should use an agent. Con-
2008 2009 2010 2011 2012 2013 2014 2015 2016
AVERAGE NUMBEROF AGENTS WORKING FOR TRADITIONAL AGENCIES
0
5
10
15
20
25
3029.3
6.4
4.9
Full time Home-based agents Part time Independent contractors*
* Not asked until 2016
17
2.6
6.7
25.9
5.8
6.4
22.9
3.5
9.8
18.4
2.9
10
19.2
3.1
13.814.9
2.6
13.9
18.8
3.3
11.6
19.6
3.9
7.9
11.8

TRAVEL INDUSTRY SURVEY 2016
OUT ON TOUR When the 2016 Travel Industry Survey asked travel agents what types of suppliers they used for tours and packages, traditional tour operators were still overwhelmingly the most popular suppliers, but they were down to 84% compared with 90% in the 2015 sur-vey. For the largest retail agencies, that fig-ure dropped to 80%.
Senior editor Sarah Feldberg spoke to En-semble Travel Group’s Suzanne Hall, senior
having a really, really good year with them. What you’re finding would be contrary to what our numbers are indicating. That said, it’s no surprise that experiential travel, however that is booked, is on the rise, be-cause that is what most consumers are re-questing.
It’s also true that most of the consumers who are using a travel specialist are prob-ably those who require or wish for some-
thing that is a little bit more local in flavor and color.
Q: Is that trend affecting suppliers?
A: I think that if one were
to just ask the broad question: Are your custom-ers seeking less traditional travel? I think the answer is yes.
How a travel agent ultimately decides to book that can happen in a number of ways, be it with a local destination manage-ment company (DMC), with a company that is very niche or with a tour operator they have used and trusted over the years that has successfully been able to incor-porate elements within what they offer so they deliver what the customer wants.
And this year, there have been challeng-es: You’ve had Zika, you’ve had terrorism, you’ve had real uncertainty and concerns about travel.
Q: When you talk about the rise in ex-periential travel and the preference
for local color, are there suppliers you see growing to serve that?
A: Now, in 2017, just about everyone’s incorporating that local flavor into
what they do. There have always been spe-cialty suppliers, [and] that’s always been their platform. That’s what they do. Maybe they’re reaping the benefit of having had the experience of really honing that concept, but I also think there’s so much out there that others can incorporate into the prod-uct.
Q: What other tour or package suppli-ers do you think are on the rise?
A: This is more niche, so the numbers aren’t going to be there, but in keep-
ing with the trend of looking for more hands-on experiences and off the beaten path, definitely for sure travel agents are using the local DMC to construct their tailor-made packages.
I think we’re going to see more and more of that.
That [fully independent traveler], the tailor-made FIT, before going through a traditional tour operator, some of that is now going to the local DMC.
Certainly consortia, we all have our pro-grams. Our program’s called Ensemble on Location, but we all have this global net-work of in-country specialists, and our members can go to them for customized FIT, or they can use them for shore excur-sions or however they feel is best suited for their customer.
There has been an interest in seeing the value of using a local partner. That I do be-lieve is increasing.
0%
20%
40%
60%
80%
100%
Traditional tour operators
Cruise packages
Packages you assemble
River cruise packages
Airline branded packages
Hotel branded packages
Online packagers
MOST POPULAR TYPES OF TOURS AND PACKAGES AMONG AGENTS
84%67% 62%
49%38%
24%14%
Suzanne HallEnsemble Travel Group
director of hotel & resort and land suppliers, about the data.
Q: Is this trend something you’re see-ing at Ensemble?
A: I don’t think so. This is an odd year, because it was a little bit all over the
map. We have actually seen an increase in es-
corted tours. Globus, for example, we’re
WHO MOST USES TRADITIONAL
TOUR OPERATORS
0%
20%
40%
60%
90%
80%
100%
Total <$1M $1M-$3M $3M-$10M >$10M <$100K $100K-500K >$500K
2015 2016
84%
95%89%
94%91%
94%
87% 88%
80%75% 73%
93%
85%
94%90%
Traditional agencies Home-based agents
T10 O c t O b e r 2 4 , 2 0 1 6
BREAKDOWN OF HOME-BASED
AGENT REVENUE
T12 O c t O b e r 2 4 , 2 0 1 6
TRAVEL INDUSTRY SURVEY 2016
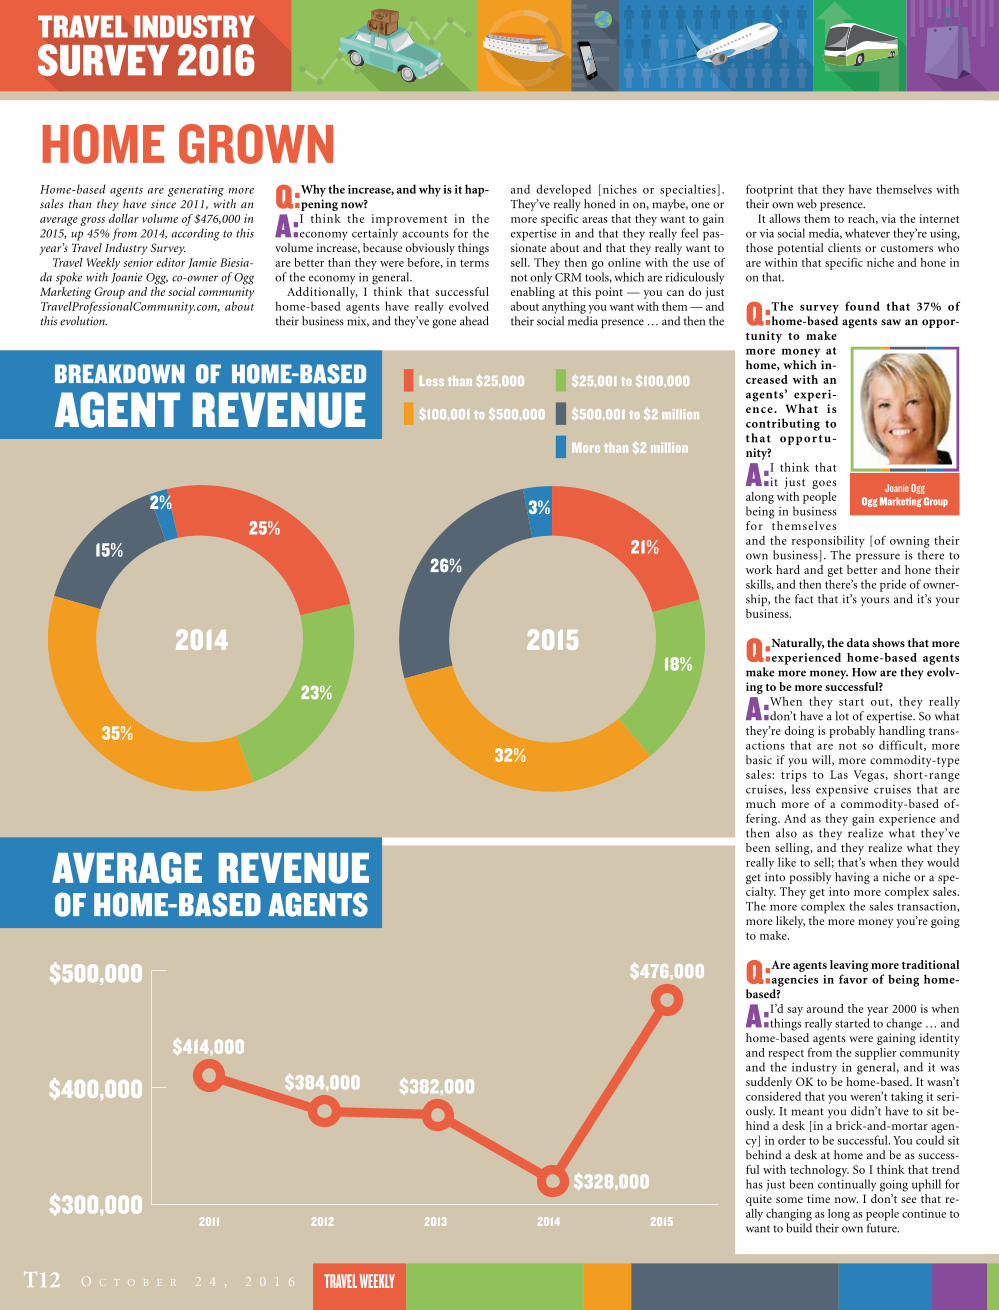
HOME GROWNHome-based agents are generating more sales than they have since 2011, with an average gross dollar volume of $476,000 in 2015, up 45% from 2014, according to this year’s Travel Industry Survey.
Travel Weekly senior editor Jamie Biesia-da spoke with Joanie Ogg, co-owner of Ogg Marketing Group and the social community TravelProfessionalCommunity.com, about this evolution.
and developed [niches or specialties]. They’ve really honed in on, maybe, one or more specific areas that they want to gain expertise in and that they really feel pas-sionate about and that they really want to sell. They then go online with the use of not only CRM tools, which are ridiculously enabling at this point — you can do just about anything you want with them — and their social media presence … and then the
Q: Why the increase, and why is it hap-pening now?
A: I think the improvement in the economy certainly accounts for the
volume increase, because obviously things are better than they were before, in terms of the economy in general.
Additionally, I think that successful home-based agents have really evolved their business mix, and they’ve gone ahead
footprint that they have themselves with their own web presence.
It allows them to reach, via the internet or via social media, whatever they’re using, those potential clients or customers who are within that specific niche and hone in on that.
Q: The survey found that 37% of home-based agents saw an oppor-
tunity to make more money at home, which in-creased with an agents’ experi-ence. What is contributing to t h a t opp or t u -nity?
A: I think that it just goes
along with people being in business for themselves and the responsibility [of owning their own business]. The pressure is there to work hard and get better and hone their skills, and then there’s the pride of owner-ship, the fact that it’s yours and it’s your business.
Q: Naturally, the data shows that more experienced home-based agents
make more money. How are they evolv-ing to be more successful?
A: When they start out, they really don’t have a lot of expertise. So what
they’re doing is probably handling trans-actions that are not so difficult, more basic if you will, more commodity-type sales: trips to Las Vegas, short-range cruises, less expensive cruises that are much more of a commodity-based of-fering. And as they gain experience and then also as they realize what they’ve been selling, and they realize what they really like to sell; that’s when they would get into possibly having a niche or a spe-cialty. They get into more complex sales. The more complex the sales transaction, more likely, the more money you’re going to make.
Q: Are agents leaving more traditional agencies in favor of being home-
based?
A: I’d say around the year 2000 is when things really started to change … and
home-based agents were gaining identity and respect from the supplier community and the industry in general, and it was suddenly OK to be home-based. It wasn’t considered that you weren’t taking it seri-ously. It meant you didn’t have to sit be-hind a desk [in a brick-and-mortar agen-cy] in order to be successful. You could sit behind a desk at home and be as success-ful with technology. So I think that trend has just been continually going uphill for quite some time now. I don’t see that re-ally changing as long as people continue to want to build their own future.
Joanie OggOgg Marketing Group
Less than $25,000 $25,001 to $100,000
$100,001 to $500,000 $500,001 to $2 million
More than $2 million
21%25%
18%
23%
32%35%
26%15%
3%2%
2014 2015
AVERAGE REVENUE OF HOME-BASED AGENTS
$300,000
$400,000
$500,000
2011 2012 2013 2014 2015
$414,000
$384,000 $382,000
$328,000
$476,000
w w w . t r a v e l w e e k l y . c O m T13
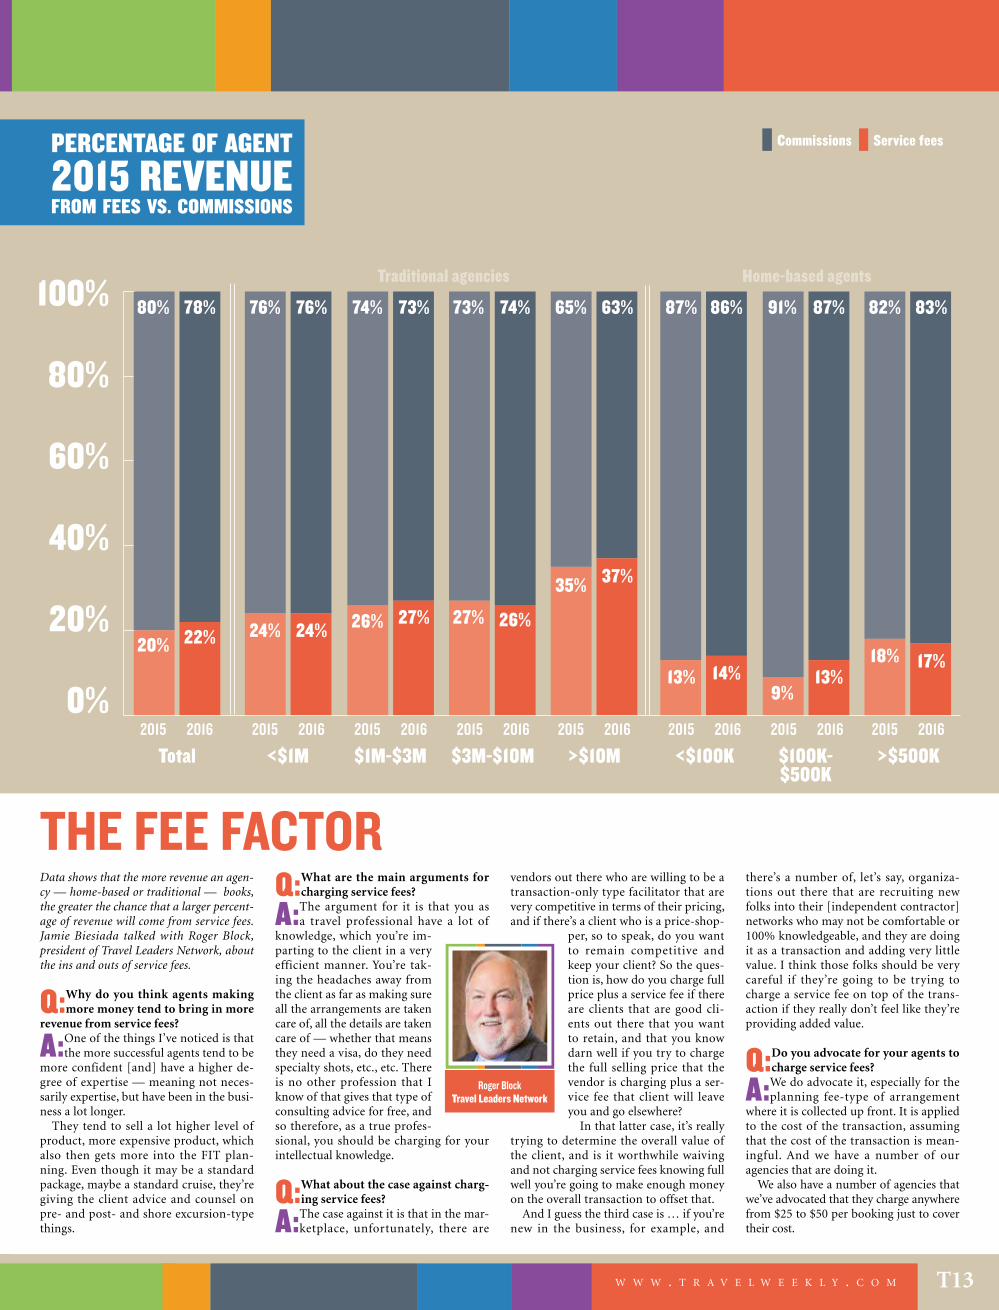
THE FEE FACTOR Data shows that the more revenue an agen-cy — home-based or traditional — books, the greater the chance that a larger percent-age of revenue will come from service fees. Jamie Biesiada talked with Roger Block, president of Travel Leaders Network, about the ins and outs of service fees.
Q: Why do you think agents making more money tend to bring in more
revenue from service fees?
A: One of the things I’ve noticed is that the more successful agents tend to be
more confident [and] have a higher de-gree of expertise — meaning not neces-sarily expertise, but have been in the busi-ness a lot longer.
They tend to sell a lot higher level of product, more expensive product, which also then gets more into the FIT plan-ning. Even though it may be a standard package, maybe a standard cruise, they’re giving the client advice and counsel on pre- and post- and shore excursion-type things.
vendors out there who are willing to be a transaction-only type facilitator that are very competitive in terms of their pricing, and if there’s a client who is a price-shop-
per, so to speak, do you want to remain competitive and keep your client? So the ques-tion is, how do you charge full price plus a service fee if there are clients that are good cli-ents out there that you want to retain, and that you know darn well if you try to charge the full selling price that the vendor is charging plus a ser-vice fee that client will leave you and go elsewhere?
In that latter case, it’s really trying to determine the overall value of the client, and is it worthwhile waiving and not charging service fees knowing full well you’re going to make enough money on the overall transaction to offset that.
And I guess the third case is … if you’re new in the business, for example, and
Q: What are the main arguments for charging service fees?
A: The argument for it is that you as a travel professional have a lot of
knowledge, which you’re im-parting to the client in a very efficient manner. You’re tak-ing the headaches away from the client as far as making sure all the arrangements are taken care of, all the details are taken care of — whether that means they need a visa, do they need specialty shots, etc., etc. There is no other profession that I know of that gives that type of consulting advice for free, and so therefore, as a true profes-sional, you should be charging for your intellectual knowledge.
Q: What about the case against charg-ing service fees?
A: The case against it is that in the mar-ketplace, unfortunately, there are
there’s a number of, let’s say, organiza-tions out there that are recruiting new folks into their [independent contractor] networks who may not be comfortable or 100% knowledgeable, and they are doing it as a transaction and adding very little value. I think those folks should be very careful if they’re going to be trying to charge a service fee on top of the trans-action if they really don’t feel like they’re providing added value.
Q: Do you advocate for your agents to charge service fees?
A: We do advocate it, especially for the planning fee-type of arrangement
where it is collected up front. It is applied to the cost of the transaction, assuming that the cost of the transaction is mean-ingful. And we have a number of our agencies that are doing it.
We also have a number of agencies that we’ve advocated that they charge anywhere from $25 to $50 per booking just to cover their cost.
Roger BlockTravel Leaders Network
PERCENTAGE OF AGENT 2015 REVENUE FROM FEES VS. COMMISSIONS
0%
20%
40%
60%
80%
100%
Total2015 2015 2015 2015 2015 2015 2015 20152016 2016 2016 2016 2016 2016 2016 2016
<$1M $1M-$3M $3M-$10M >$10M <$100K $100K- $500K
>$500K
Traditional agencies Home-based agents
Commissions Service fees
80%
20%
78%
22%
76%
24%
76%
24%
74%
26%
87%
13%
73%
27%
86%
14%
73%
27%
91%
9%
65%
35%
82%
18%
74%
26%
87%
13%
63%
37%
83%
17%
TRAVEL INDUSTRY SURVEY 2016
T16 O c t O b e r 2 4 , 2 0 1 6
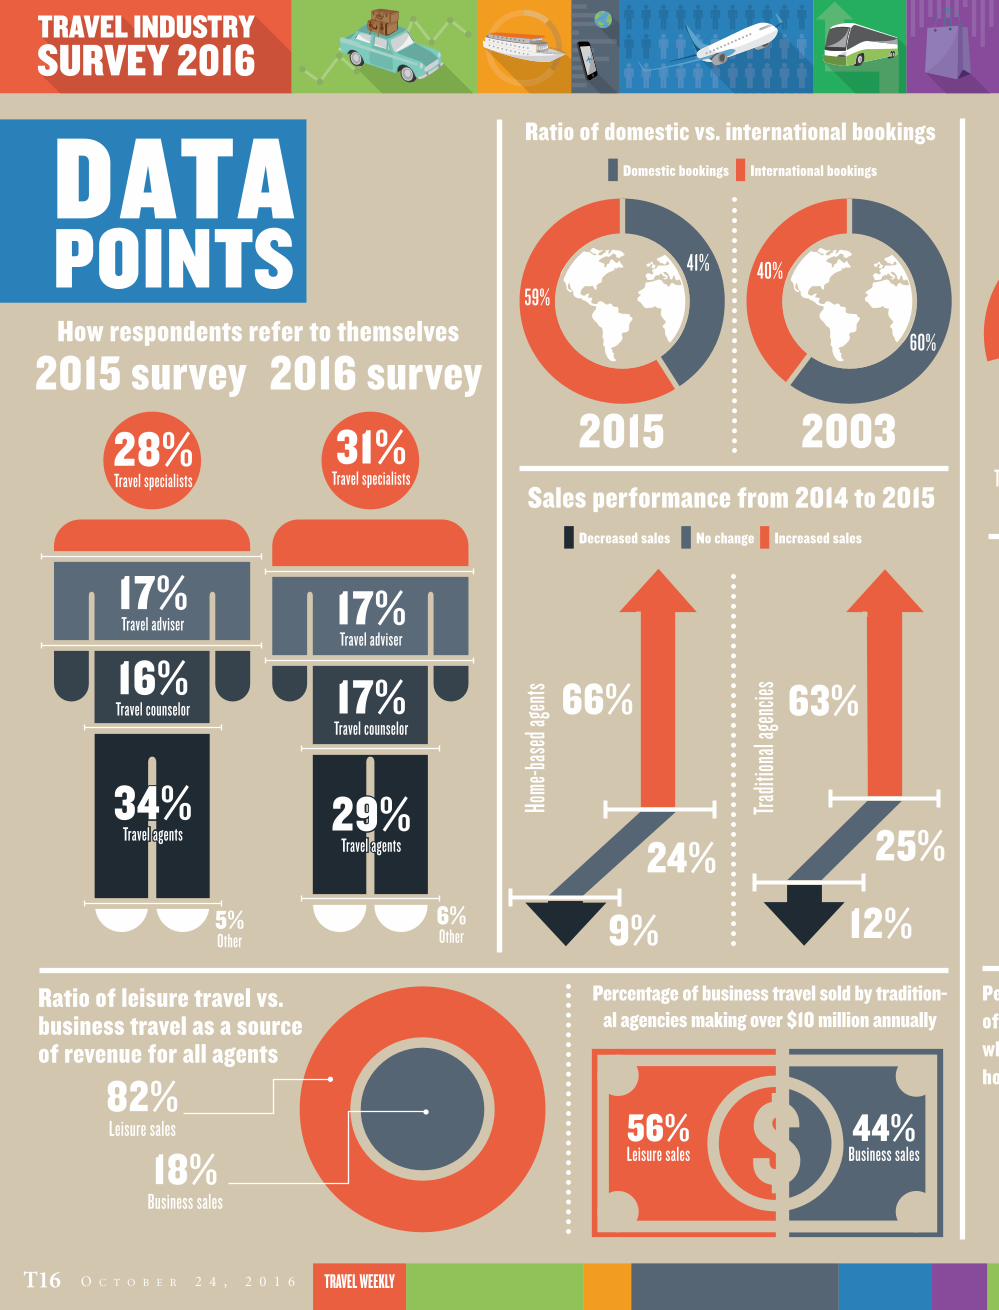
DATAPOINTS
29%Travel agents
17%Travel counselor
17%Travel adviser
34%Travel agents
16%Travel counselor
17%Travel adviser
31%Travel specialists
28%Travel specialists
2016 survey2015 survey2015
Sales performance from 2014 to 2015
How respondents refer to themselves
Ratio of leisure travel vs. business travel as a source of revenue for all agents
Percentage of business travel sold by tradition-al agencies making over $10 million annually
Ratio of domestic vs. international bookings Percentage of revenue earnedfrom air bookings
Use of social media sites for marketing has increased
2003
Domestic bookings International bookings
All other forms of travel bookings Air bookings
59%40%41%
60%
Decreased sales No change Increased sales
66%
9%
63%
12%
82%Leisure sales
Traditional agencies that make more than $10 million annually
18%Business sales
56%Leisure sales
44%Business sales
29%
Percentage of agents who are home-based
5%Other
6%Other
Home
-base
d age
nts
Tradit
ional
agen
cies
24% 25%
w w w . t r a v e l w e e k l y . c O m T17
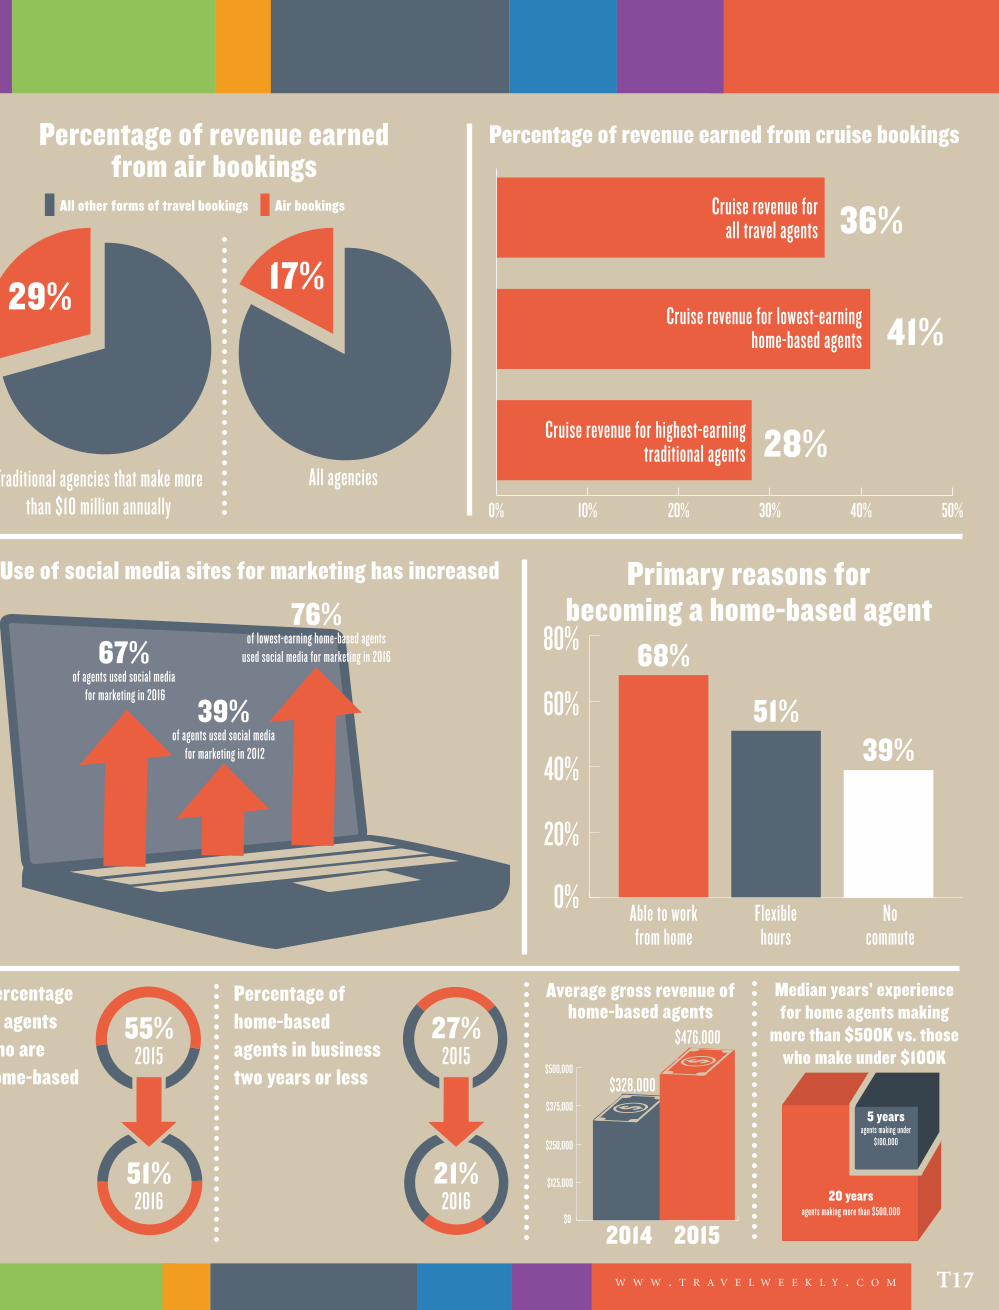
Percentage of revenue earnedfrom air bookings
Percentage of revenue earned from cruise bookings
Use of social media sites for marketing has increased Primary reasons for becoming a home-based agent
All other forms of travel bookings Air bookings
Traditional agencies that make more than $10 million annually
All agencies
51%2016
21%2016
29%
36%
41%
28%
17%
0% 10% 20% 30% 40% 50%
Cruise revenue for all travel agents
Cruise revenue for lowest-earninghome-based agents
Cruise revenue for highest-earningtraditional agents
67%of agents used social media
for marketing in 2016
Able to workfrom home
Flexiblehours
No commute
39%of agents used social media
for marketing in 2012
76%of lowest-earning home-based agents
used social media for marketing in 2016
0%
20%
40%
60%
80% 68%
51%39%
Percentage of agents who are home-based
Percentage of home-based agents in business two years or less
Average gross revenue of home-based agents
55%2015
27%2015
$0
$125,000
$250,000
$375,000
$500,000
2014 2015
$328,000
$476,000
Median years’ experiencefor home agents making
more than $500K vs. thosewho make under $100K
5 yearsagents making under
$100,000
20 years agents making more than $500,000

TRAVEL INDUSTRY SURVEY 2016
T20 O C T O B E R 2 4 , 2 0 1 6
SOCIAL MEDIAA: Across the board, the most popular
is Facebook. It lends itself so well to travel in terms of the photos of travel. As agents themselves travel and they post their experiences, it shows they’re an ex-
SOCIAL MEDIA ADOPTION BY CONSUMERS
VS TRAVEL AGENTS
perienced travel adviser. So it really goes hand in hand with the business.
Q: Earlier this year we did a survey of consumers that showed that almost
90% of travelers have a Facebook ac-count, but platform use in other areas is growing strongly. The numbers are even higher among travelers who used a travel agent re-cently. But in the Travel Industry Survey, only 37% overall said they use Twitter for business, 33% said they use In-stagram and only 22% said Pinter-est. What do you think accounts for the differ-ence?
A: We’re seeing Twitter on the declining statistic. People can’t elaborate that
much in 140 characters or less about trav-el; it’s a complex thing. Pinterest, I think, is a great opportunity. However, I caution agents because if you start pinning and making boards and all those links go right back to suppliers, it does you a disservice. We teach Pinterest, and we [say]: “You can use it, you just have to be a little more tech-nical, and you have to think your strategy out.” … Facebook is a lot easier to go, post, here’s my picture, I traveled, I’m going on a river cruise, I can’t wait to tell you about it.
Social accounts of consumers who have used an agent in the past 12 months*
Platforms used by travel agents who use social media for marketing
Vicky GarciaCruise Planners
See SOCIAL on Page 23
0%
20%
40%60%
80%
100%
Facebook LinkedIn Twitter Instagram Pinterest YouTube Snapchat Other
94% 94%
75%
41%
76%
37%
74%
33%
74%
22%
88%
16%
65%
4%
13%9%
Training hundreds of Cruise Planners inde-pendent owners to use social media market-ing is a priority for COO Vicky Garcia, who walks the walk. (“If I’m going to tell agents to try this, I have to do it.”) She spoke with
MOST IMPORTANT MARKETING APPROACHES
managing editor Rebecca Tobin about current social media trends for travel professionals.
Q: Which social media platforms do the majority of your agents use?
Email Socialmedia
Agencywebsite
Newsletter Charity/community
events
Travel nights/over coffee
Flyers Internet ads Mobile Newspaperads
Telemarketing Radio ads
78% 78%
64%67%
55% 57%
27% 28%25% 24% 23% 22%
26%21% 21% 18%
14% 12% 12% 10% 8% 8%4%4%
2015 2016
0%
20%
40%60%
80%
100%
*Data from Travel Weekly’s consumer research. See Methodology, P. T27
Respondents were asked to choose the four most important approaches.
2023TIS1024;24.indd T20 10/10/16 1:24 PM
W W W . T R A V E L W E E K L Y . C O M T23
Rewards speak louder than words.
We appreciate all you do, and show you with Agent Gold Rewards.Book a weekly or weekend rental using your PVA CDP# and receivegreater client discounts, AGR points, plus commission.
Not an Agent Gold Rewards member? Join today at AgentGoldRewards.com*
*Visit www.agentgoldrewards.com for details and terms. ® Reg. U.S. Pat. Off © 2016 Hertz System, Inc.
SOCIALContinued from Page 20
Instagram, we’re definitely seeing on the rise. I think it’s making some changes to make it a little better. We’re seeing even the age group get higher on Instagram ... We teach our agents, look: wrap your arms around one or two of these main tools and be avid on it. Post a lot on it so people fol-low you because you’re giving them good information. [And] if that one client might want to Snapchat you, know enough about it to be able to respond, [even if] it’s not your main way to promote yourself.
I think your question is: What are they doing for business? I think, especially, our agents use social media also for their life-style. Where they’re pinning their own things or their own vacation, their destina-tion inspiration, but they’re not necessarily using it as a hard sell for business. ... And maybe they’re using [platforms] more so-cially and more personally, and that is ulti-mately helping their brand and their busi-ness, but it might not be a business selling tool the way other platforms are.
Q: According to our survey, social media is the second most-popular medium
agents use to attract new clients; email is first. Is social media that powerful?
A: Oh, yeah. We’re seeing it . I mean, our most successful agents most of the
time attribute [success] to it, especially Facebook, just because they’re posting.
Q: What kind of training, resources or advice do you offer your agencies
with regard to social marketing?
A: We do regional boot camps [with] some social media training . We an-
nually hire a social media expert to do webinar training, so we’ll incorporate that into our online university. We hired a social media expert … she did an online series that we paid for the content , and then she offered a one-on-one coaching product to take on the next 30 days. So for those who wanted to dig deeper, they hired her as an add-on. At our conven-tion there’s always several components of social media … We have a platform that we provide our agents. It literally ties their business page to ours. We post on their behalf two to three times a week, so that if they’re busy traveling or just to give them more content, their Facebook page won’t go dark. It’s mainly on Facebook, but now we’re launching where if an agent wants to attach their Twitter handle, their LinkedIn and their Instagram, it will also post there.
Q: Social media co-op is last on the list of importance of support from sup-
pliers. I wonder if that will change as so-cial continues to be so prevalent?
A: One of the things we do to help our preferred sales is when a supplier
comes in to do a lunch-and-learn with our business development team … we’ll do a short video, whether it be an announce-ment or a short training about product, and then we push it on our social media, closed Cruise Planners groups. Just to help
share, “We just got a great training deliv-ered here.” Say there’s a call to action, they have an offer going on right now, let’s get it via video. Because we know video is a great source; we’re in travel, we can talk about destinations and show pictures.
Q: Which platform do you like the best?
A: [Laughs] Obviously. Facebook ... And Facebook Live, I think, is so cool now.
We’re seeing our agents now really adopt it. [During the Regent Explorer naming] I
did a tour of the cabins, I was up on deck and showed where they were setting up the christening. I had Andrea Bocelli live, and everyone back at the office was like, “That’s so cool!” It was a great way to bring some-one on a trip and talk about what you do.
2023TIS1024;24.indd T23 10/10/16 1:24 PM

TRAVEL INDUSTRY SURVEY 2016
T24 O C T O B E R 2 4 , 2 0 1 6
PREFERRED METHOD The Travel Industry Survey has consistently found that a higher percentage of cruises are sold through preferred suppliers than any other travel product. Travel Weekly se-nior editor Tom Stieghorst spoke about why that is with Drew Daly, general manager of network engagement and performance at CruiseOne and Dream Vacations .
Q: Why do you think more cruises are sold through preferred suppliers
than any of the other products?
A: We do a very significant business in the cruise space, so we do have
strong partnerships and agreements with the biggest partners. Cruising is still very much of a niche market, and there’s still a big piece of the pie in helping people come on the ship and be more educated and aware of the value of a cruise vaca-tion .
We [also] have solid preferred sup-plier agreements with companies that offer tours, hotels and air. That said, I would think the reason why it is a lower percentage [in other areas] in the survey
A: No. 1, higher commission structures are in place, based on what we agreed
upon. In addition to that, we’re able to collaborate on certain strategic market-ing opportunities and events. So whether
it’s a promotion or a product focus area or exclusive pricing, we have those types of ameni-ties, even if it’s for group-type stuff.
They have access to better training, some of it exclusive to our groups like the Semi-nars at Sea that we do, or fams. It’s really targeted that way so they get to network with the supplier.
Q: Does the Cr uiseOne t e a m a d vo c a t e t h a t
agents use preferred suppliers?
A: Yes, it would be myself, my team, any-one within our organization.
We collaborate on virtual cruise nights where we broadcast [a preferred supplier’s message to a franchisee’s] customers. Ev-
eryone is very much an advocate for all of our preferred partners.
Another thing we get is local support, and that’s paramount with our agents be-cause it helps them grow their business lo-cally.
It could be co-op advertising, it could be a local [business development man-ager] or district sales manager for each of the suppliers out there. Sometimes the BDM will say, “I have this business oppor-tunity, and because you’re with Cruise-One we want to partner with you.”
Q: As a travel product becomes more like a commodity, it’s less likely to
be sold under preferred arrangement. Why?
A: With a cruise, there’s a lot of puts and takes in the details of what
they’re offering. The supplier has to be sure they’re partnering with the right agency. An airline or a car rental compa-ny, it’s something [consumers] might be using more. It has a bigger footprint than a cruise.
is because these products have a greater propensity to be available at different promotions and rates from different com-panies. For instance, you can purchase a hotel from the hotel direct, a tour opera-tor or an online booking por-tal.
Q: Many franchisers and consortia have relation-
ships with a broad swath of the cruise industry. In what situation is a cruise sold out-side a preferred agreement?
A: We always focus our ef-forts on our preferred
suppliers. There are times when a customer or agent wants something very unique that we may not have within the realm of our preferred supplier agreements. The agents find other options, but it’s very rare that it happens.
Q: What is the incentive for travel agents to use preferred suppliers?
Drew DalyCruiseOne and
Dream Vacations
PERCENTAGEOF PRODUCT SOLDTHROUGH PREFERREDS
Oceancruises
Rivercruises
Tours Carrentals
Hotels/resorts Air travel Other
85%
0%
20%
40%
60%
80%
100%85%
80%73% 73%
69%
82%
24TIS1024;17.indd T24 10/7/16 1:51 PM
TO BECOME A NEW ORLEANS CERTIFIED TRAVEL AGENT, VISITNEWORLEANS4AGENTS.COM
TO�REGISTER�FOR�CHRISTMAS�NEW�ORLEANS�STYLE�FAM��VISITwww.neworleanscvb.com/DecFAMregister
FOR�MORE�INFORMATION��CONTACT�THU�TRAN800-748-8695 x.5053 • [email protected]
ENJOY SPECIAL TRAVEL AGENT FAM RATES!DURING DECEMBER 1-29, 2016
AT FABULOUS NEW ORLEANS HOTELS*Excludes special events. Some blackout dates apply.
AGENT FAM HOTEL RATES FROM $69 +TAXES
TRAVEL INDUSTRY SURVEY 2016
T30 O C T O B E R 2 4 , 2 0 1 6
IMPACTContinued from Page 7
A: It really comes down to relaying honest information, that there is an
issue that happened somewhere, a natu-ral disaster or an event. The important
thing is to be honest and accurate in your description. When an incident occurs, we will immediately be in contact with our [local agents]. We create a holding statement that we will be able to com-municate. Then we take every precaution to provide the safest atmosphere that is
possible. We have a lot of experience and local connections. It’s not like Joe Blow Tours.
Q:What impact did you see follow-ing the recent terrorist attacks in
Europe? Did you have a lot of cancella-
tions?
A: We didn’t see a lot of cancellations from France or other parts of Eu-
rope. I think it’s fair to say that bookings in Europe are soft this year, but they are stronger for next year, so we are gaining momentum. I think that the desire to travel and the desire to be free to travel is an American attribute, that “I don’t think about it” attitude. If I am going to Lon-don tomorrow, it never occurs to me that the plane may crash or there may be an attack. It’s not going to happen. I’m going to be safe. I’m going to do my work and come home. That’s the feeling that over-rides the fear of travel. I think that there is a lot of resilience that comes from the current acts around the world that have been happening.
Q: What kinds of changes do you make in response to, say, the terrorist at-
tacks in Nice, France? Do you recom-mend that travelers going to Africa book flights that avoid European connections or change your marketing strategies?
A:There is always going to be a certain segment of the population that stays
home. But I don’t think that’s our demo-
graphic. We have not made any changes like that. We are always very cognizant of safety, depending again on our local con-nections.
I think the patterns that we have seen related to events are usually short term. I don’t think anyone in their right mind thinks there’s never going to be another hurricane, another earthquake or another terrorist attack. So what we have to do is adjust our mindset … and choose a com-pany to travel with that is reliable and is in touch locally.
Q:What impacts are you seeing in different markets right now from
things like Zika and terrorism? What markets are strong and what markets are soft? I assume Turkey is not very popular.
A:No doubt, our bookings to Turkey are down, and bookings to Iceland
are up.South America has been soft. But now
it is coming back. There has been fear of Zika. I think the Olympics [and the ab-sence of Zika cases there] were really a positive sign for that. People watched, and the “Z word” didn’t come up. They were more worried about Ryan Lochte.
Europe and South America are two areas where it has been softer in the past year, but both are showing resilience and coming back.
Q: What about Africa?
A:Africa is strong. We’ve had a rocky road in the past … but that resilience
of short memories has kicked in and is very positive. The [modern luxury] sa-fari, the ultimate adventure trip that we invented in 1962, is still viewed as one of the most adventurous, exciting things to do.
060730TIS1024;27.indd T30 10/7/16 2:51 PM