Transporting CO2 From Source to Sink using GIS Mission 2013, 12.000 Wednesday, September 30, 2009...
25
Transporting CO2 From Source to Sink using GIS Mission 2013, 12.000 Wednesday, September 30, 2009 Daniel Sheehan
-
Upload
dorothy-rydell -
Category
Documents
-
view
214 -
download
0
Transcript of Transporting CO2 From Source to Sink using GIS Mission 2013, 12.000 Wednesday, September 30, 2009...

Transporting CO2 From Source to Sink using GIS
Mission 2013, 12.000
Wednesday, September 30, 2009
Daniel Sheehan

Outline• What is a GIS
– Data Types– Symbolizing data
• Useful data for Carbon Sequestration– Power plants– Potential Sinks
• Processing– Network Analysis– Cost Path Analysis

What is a GIS (Geographic Information System)?
• GIS is a tool for managing data about where features are (geographic coordinate data) and what the features are like (attribute data). A GIS provides the ability to query, manipulate, and analyze these data.

Vector Data
• Points
• Line
• Polygons
• All are scale dependent
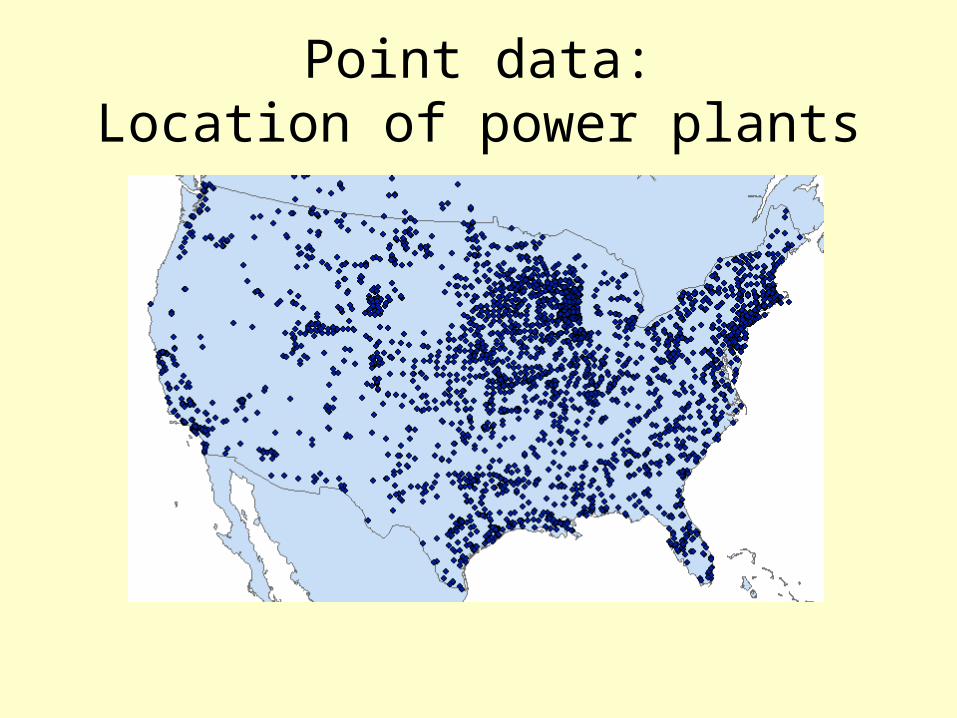
Point data:Location of power plants

CO2 from power plants
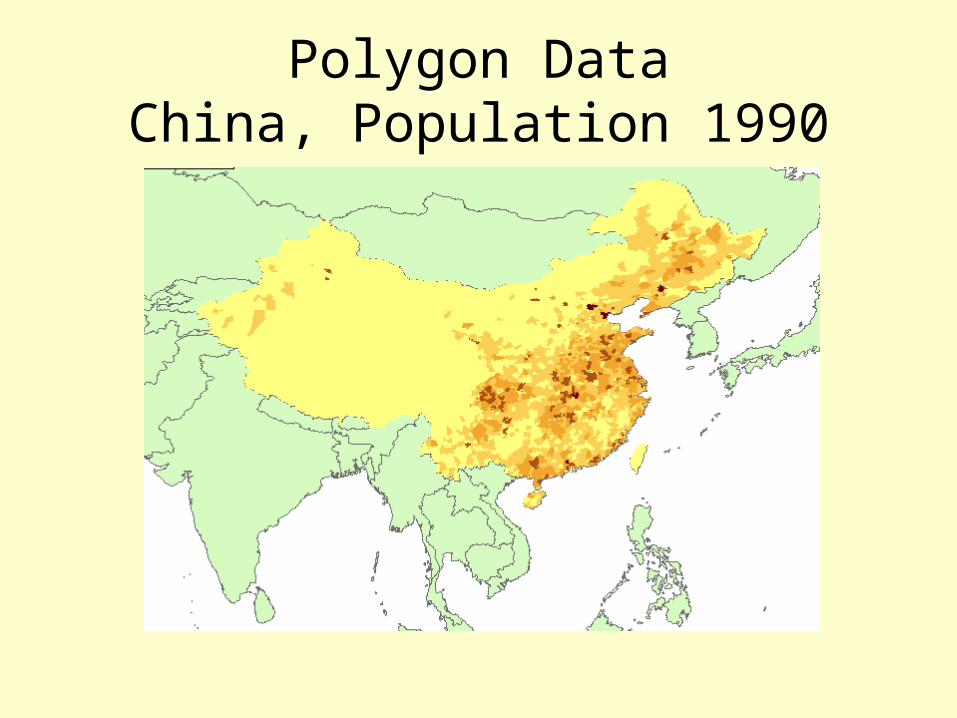
Polygon DataChina, Population 1990

Attributes

Metadata describing attributes

Combing Maps: Power plants in Massachusetts and Population

Boston area power plants

MIT power plant in Google Earth
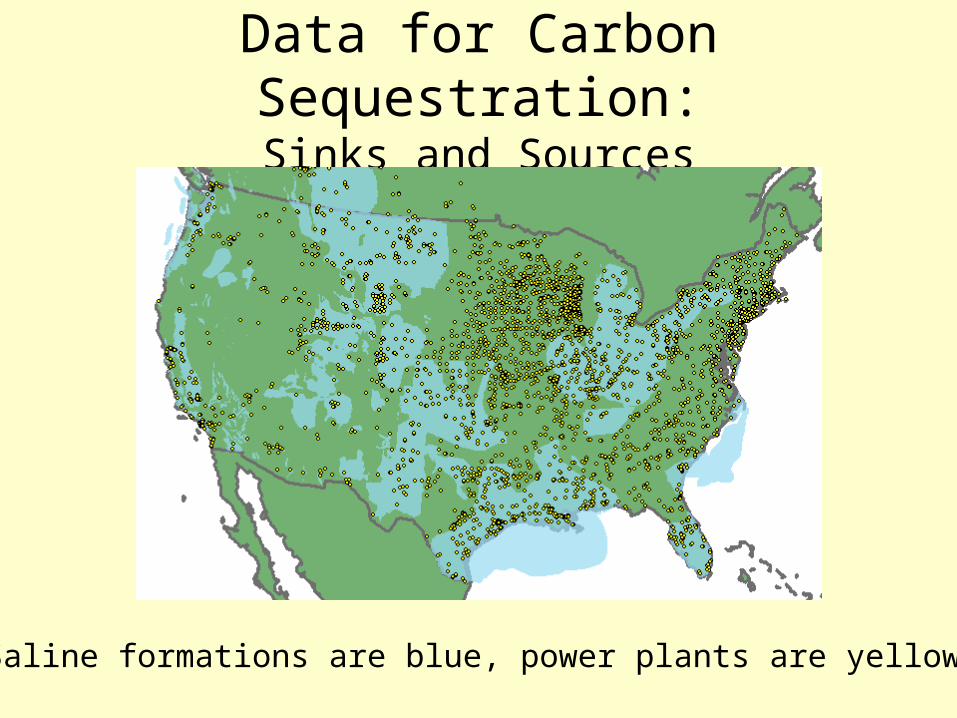
Data for Carbon Sequestration:Sinks and Sources
Deep Saline formations are blue, power plants are yellow dots

Transportation problemRouting piplelines from Carbon Sources to
Carbon sinks
CO2 sources near Cambridge
Nearest deep saline formation

Routing from power plants to a single pipeline

Single network vs multiple pipelines
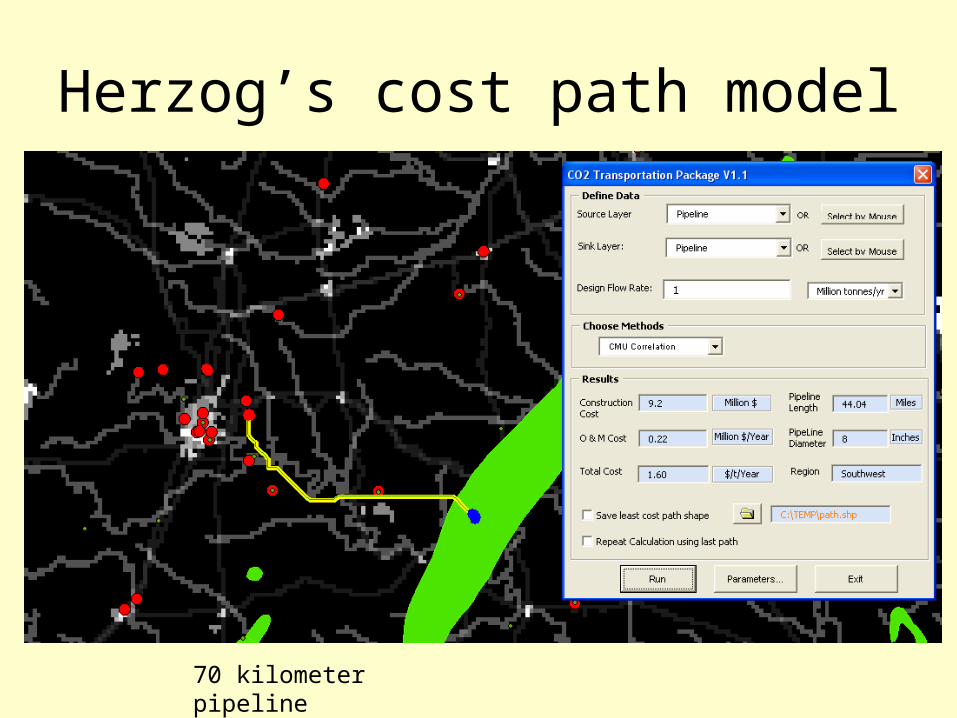
Herzog’s cost path model
70 kilometer pipeline

Development of Terrascope model in GIS workshops
• You will need to create your own cost surface (required for cost path model)– river crossings– zoning/land use restrictions– construction costs
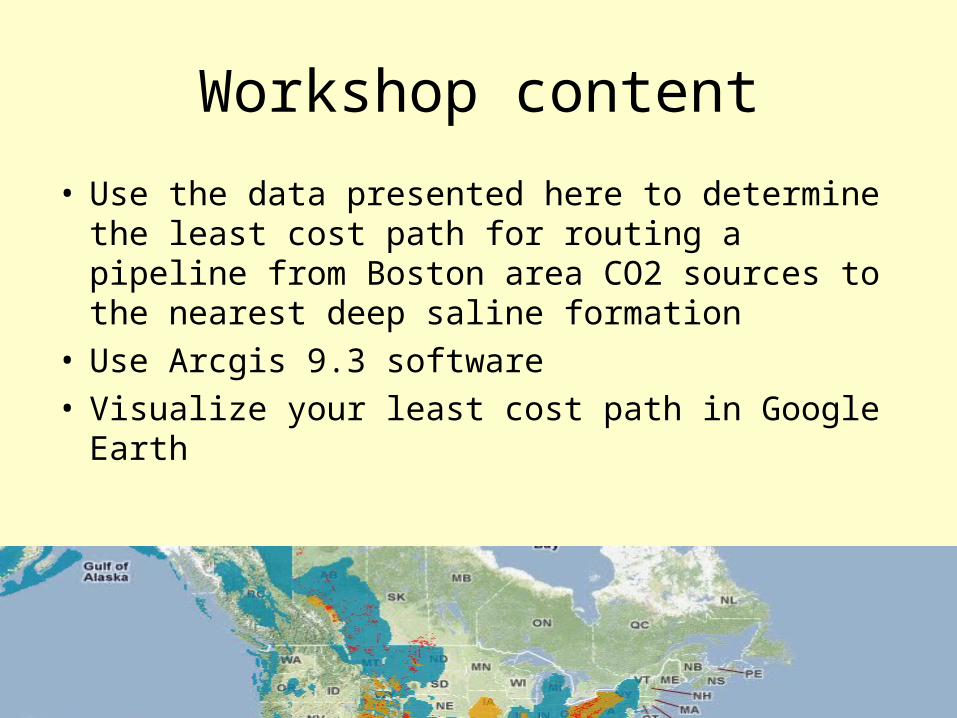
Workshop content
• Use the data presented here to determine the least cost path for routing a pipeline from Boston area CO2 sources to the nearest deep saline formation
• Use Arcgis 9.3 software• Visualize your least cost path in Google Earth

GIS Workshops• Scheduled for 7:30-9PM, limit of 22 people per session• Additional sessions can be scheduled
– October 7– October 14– October 15– Must sign up with Seth Burgess
([email protected])– Determine construction costs before lab

Geologic Maps
• For teams 4 and 5, you will need to know what minerals are where. Geologic data is not always available in digital form. Maps will be helpful for you. In Barton, maps are searchable. See, for example:
http://library.mit.edu/item/000179757, Bedrock Geologic Map of Massachusetts

Google Maps API

Where to get more infomation• GIS Lab, Rotch Library, Building 7
– 6 PCs with Arcgis and Google Earth Pro installed– staffed 12:30PM – 4:00PM Monday through Thursday
and by appointment– email [email protected] or [email protected]
• 37-312, Windows Cluster in Building 37– 23 high end PCs with Arcgis installed

Web sites
• http://atlas.utah.gov/WESTCARB-GIS-data/
• http://www.natcarb.org/
Both sites sponsored by the U.S. Department of Energy's National Energy Technology Laboratory

• MIT Geodata Reposity– http://web.mit.edu/geoweb
• Example Google Maps API– http://web.mit.edu/dsheehan/www/terrascope
2012.html
• Download Google Earth– http://earth.google.com/download-earth.html
• Sign up for Arcgis for your machine– https://web.mit.edu/ist/products/vsls/forms/
esri.html