Transportation Rate Analysis: Gulf Intracoastal …docs.trb.org/prp/14-1146.pdf · Transportation...
18
Paper Submittal for Presentation at TRB 93 rd Annual Meeting January 2014, Publication in the Compendium of Papers, and Publication in the Transportation Research Record Paper # 14-1146 Transportation Rate Analysis: Gulf Intracoastal Waterway–East (GIWW-E), Arkansas River, Red River By Annie Protopapas, Ph.D., P.E. (Corresponding Author) Associate Research Engineer, Multimodal Freight Transportation Programs Texas A&M Transportation Institute, Texas A&M University System 2929 Research Parkway, 338 Gilchrist, College Station, TX 77843-3135 Tel: (979) 862-2709 Fax: (979) 862-2708 E-mail: [email protected] C. James Kruse Director, Center for Ports & Waterways Texas A&M Transportation Institute, Texas A&M University System 701 N. Post Oak, Suite 430, Houston, TX 77024 Tel: (713) 686-2971 Ext. 15110 Fax: (713) 686-5396 E-mail: [email protected] Leslie E. Olson Associate Research Scientist, Multimodal Freight Transportation Programs Texas A&M Transportation Institute, Texas A&M University System 2929 Research Parkway, 337 Gilchrist, College Station, TX 77843-3135 Tel: (979) 862-2846 Fax: (979) 862-2708 E-mail: [email protected] Michael B. Donelan Lecturer, Maritime Administration Texas A&M University, Galveston 58 Lazy Lane, The Woodlands, TX 77380 Tel: (409) 740-4478 E-mail: [email protected] Words in Text: 4,706 (Abstract: 247) Tables: 7 (@250) Figures: 1 (@250) Total Words: 6,706 18 October 2013 TRB 2014 Annual Meeting Paper revised from original submittal.
Transcript of Transportation Rate Analysis: Gulf Intracoastal …docs.trb.org/prp/14-1146.pdf · Transportation...

Paper Submittal for Presentation at TRB 93rd
Annual Meeting January 2014, Publication in the
Compendium of Papers, and Publication in the Transportation Research Record
Paper # 14-1146
Transportation Rate Analysis: Gulf Intracoastal Waterway–East (GIWW-E),
Arkansas River, Red River
By
Annie Protopapas, Ph.D., P.E. (Corresponding Author)
Associate Research Engineer, Multimodal Freight Transportation Programs
Texas A&M Transportation Institute, Texas A&M University System
2929 Research Parkway, 338 Gilchrist, College Station, TX 77843-3135
Tel: (979) 862-2709 Fax: (979) 862-2708 E-mail: [email protected]
C. James Kruse
Director, Center for Ports & Waterways
Texas A&M Transportation Institute, Texas A&M University System
701 N. Post Oak, Suite 430, Houston, TX 77024
Tel: (713) 686-2971 Ext. 15110 Fax: (713) 686-5396 E-mail: [email protected]
Leslie E. Olson
Associate Research Scientist, Multimodal Freight Transportation Programs
Texas A&M Transportation Institute, Texas A&M University System
2929 Research Parkway, 337 Gilchrist, College Station, TX 77843-3135
Tel: (979) 862-2846 Fax: (979) 862-2708 E-mail: [email protected]
Michael B. Donelan
Lecturer, Maritime Administration
Texas A&M University, Galveston
58 Lazy Lane, The Woodlands, TX 77380
Tel: (409) 740-4478 E-mail: [email protected]
Words in Text: 4,706 (Abstract: 247) Tables: 7 (@250) Figures: 1 (@250) Total Words: 6,706
18 October 2013
TRB 2014 Annual Meeting Paper revised from original submittal.

Protopapas, Kruse, Olson, Donelan
1
ABSTRACT 1 2
This research effort developed transportation rates ($/net ton) from origin to destination––3
including transfer and handling fees––for a non-statistically-significant sample of 200 4
waterborne movements and their alternative least-cost all-overland routings (i.e., rail and/or 5
truck). The sample consisted of originating, terminating, internal, or through movements on 3 6
waterways: Gulf Intracoastal Waterway–East (GIWW-E––100); Arkansas River (50); and Red 7
River (50). Water linehaul rates obtained from two major barge operators and handling rates 8
obtained from terminal operators were compared to the corresponding rates obtained from the 9
Barge Costing Model (BCM). It was found that the BCM underestimates waterborne charges, 10
and that its definitions of cost components are inconsistent with real-world barge operations. 11
Terminal operators interviewed were not aware of any—nor could identify any—specific off-12
river origins or destinations, so none were associated with any of the movements. Linehaul rail 13
rates were obtained from the Surface Transportation Board’s Carload Waybill Samples 2009 and 14
2010 and Uniform Railroad Costing System. Truck rates were obtained from national and 15
interstate motor carriers. In most cases (171/200 movements) the least-cost, most practical land-16
only linehaul alternative to barge was found to be rail. Overall, this research concluded that 17
barge shipment is the least-cost transportation alternative for every commodity group on the 18
GIWW-E and Red, and for the majority of commodity groups on the Arkansas, resulting in 19
annual savings of $2.85B. Additional field data collection efforts based on larger, statistically 20
significant samples are needed in order to implement improvements in the BCM. 21
22
TRB 2014 Annual Meeting Paper revised from original submittal.

Protopapas, Kruse, Olson, Donelan
2
INTRODUCTION 1
2 The objective of this research was to facilitate the calculations of the National Economic 3
Development (NED) benefits attributable to navigation through the Gulf Intracoastal Waterway-4
East (GIWW-E) which stretches from New Orleans, Louisiana to St. Marks River, Florida; the 5
Arkansas River; and the Red River (Figure 1). To accomplish this objective, the study developed 6
a full range of transportation routings, linehaul rates, and supplemental costs for a sample of 200 7
movements (originating, terminating, internal, or through) on the 3 waterways: GIWW-E––100; 8
Arkansas––50; and Red––50. All 200 movements were contained in and selected from the 2010 9
Waterborne Commerce Statistics Center’s (WCSC) commodity movement data. 10
Previous transportation rate analyses were originally intended to be based on data 11
collected via on-site or remote surveys and interviews with each origin and destination water 12
facility/terminal. However, limitations in collecting confidential financial information in this 13
manner made this approach unfruitful and use of the Barge Costing Model (BCM) was the only 14
alternative to obtain the existing water routing rates. In addition, the previous research efforts 15
concluded that there are only two practical alternatives for gathering accurate, complete, and up-16
to-date field data required to conduct more accurate rate and routing analyses in the Lower 17
Mississippi-GIWW geographic region: 18
1. Conduct face-to-face field interviews at the sites in question, an approach that, again, 19
proved to be ineffective on a benefit-cost basis through the previous studies, or 20
2. Collect information directly from targeted and selected barge and facility/terminal 21
operators––a more promising course of action. 22
23
This transportation rate analysis implemented the second recommendation and succeeded 24
in procuring actual waterborne charges from targeted selected barge and facility/terminal 25
operators for 96% of the sampled movements. 26
Freight rates for each sampled movement were developed based on the actual water-27
inclusive routing and for a competing (least-cost) all-overland alternative. All rates and fees were 28
stated in 4th
Quarter 2012 (2012Q4) U.S. dollars per net ton. Results were documented on a 29
movement-by-movement basis (unique origin/destination/commodity––or ODC––combination) 30
via a separate rate sheet for each observation. These movement data were also integrated into one 31
data table for each waterway. (Note: All references to “movement” herein refer to these unique 32
ODC combinations, not individual physical movements.) 33
This document describes the study’s scope and guidelines; parameters and data sources; 34
methods employed; findings and results of the transportation rate data collection, research, 35
construction, and analysis; limitations encountered; supporting assumptions; and conclusions and 36
recommendations from this work for future reference. 37
38
TRB 2014 Annual Meeting Paper revised from original submittal.

Protopapas, Kruse, Olson, Donelan
3
1 FIGURE 1 Mississippi River System and Gulf Intracoastal Waterway. 2
3
4
TRB 2014 Annual Meeting Paper revised from original submittal.

Protopapas, Kruse, Olson, Donelan
4
WATERBORNE MOVEMENT SAMPLE 1 2
The USACE provided 3 datasets consisting of a total of 3,693 waterborne movements: 1,901 3
movements routed over the GIWW-E; 1,125 over the Arkansas; and 667 over the Red in 2010. A 4
total of 33 movements that involved passenger vessels were removed (22 from GIWW-E and 11 5
from Red), resulting in a population of 3,660 movements (1,879 for GIWW-E, 1,125 for 6
Arkansas, and 656 for Red). These movements represented total annual tonnage flows for each 7
specific origin-destination-commodity (ODC) triple; not individual trip tonnages. As directed by 8
USACE and stated in the project scope of work, a sample of 200 movements (100 from GIWW-9
E, 50 from Arkansas, and 50 from Red) were then selected for inclusion in the sample to mirror 10
the populations as accurately as possible, i.e., such that the distribution of tonnage by WCSC 11
commodity group in each waterway sample mirrored the distribution of tonnage by commodity 12
group in the WCSC population of movements that utilized the respective waterway in 2010. This 13
was accomplished by classifying the movements in each waterway’s population by commodity 14
group, ranking the movements in each commodity group by descending tonnage, and then 15
selecting movements from each commodity group using a top-down iterative method, until both 16
the tonnage distribution by commodity group and the total number of movements for the specific 17
waterway sample converged to the prescribed specifications. The non-statistically significant 18
sample of 100 movements in the GIWW-E sample corresponded to approximately 5% of 19
movements and 48% of tonnage in the GIWW-E population; the 50-movement Arkansas sample 20
corresponded to 4% of movements and 27% of tonnage in the Arkansas population; and the 50-21
movement Red sample corresponded to 8% of movements and 46% of tonnage in the Red 22
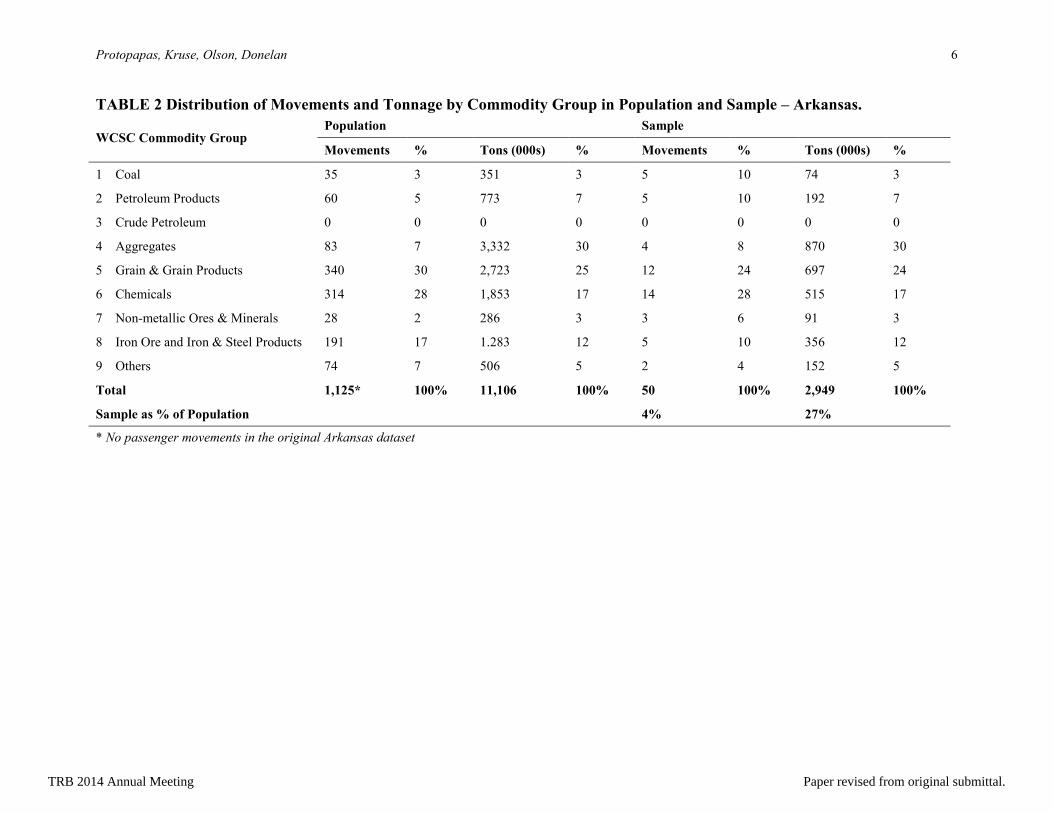
population. (Table 1, Table 2, Table 3) 23
TRB 2014 Annual Meeting Paper revised from original submittal.

Protopapas, Kruse, Olson, Donelan
5
TABLE 1 Distribution of Movements and Tonnage by Commodity Group in Population and Sample – GIWW-E.
WCSC Commodity Group Population Sample
Movements % Tons (000s) % Movements % Tons (000s) %
1 Coal 169 9 19,402 46 4 4 9,363 46
2 Petroleum Products 509 27 7,905 19 36 36 3,952 19
3 Crude Petroleum 58 3 2,220 5 4 4 1,003 5
4 Aggregates 100 5 2,568 6 4 4 1,143 6
5 Grain & Grain Products 37 2 123 0 0 0 0 0
6 Chemicals 313 17 3,757 9 16 16 1,773 9
7 Non-metallic Ores & Minerals 52 3 485 1 5 5 295 1
8 Iron Ore and Iron & Steel Products 400 21 2,954 7 21 21 1,409 7
9 Others 241 13 2.818 7 10 10 1,518 7
Total 1,879* 100% 42,232 100% 100 100% 20,455 100%
Sample as % of Population 5% 48%
* After 22 passenger movements were removed from 1,901 movements in the original GIWW-E dataset
TRB 2014 Annual Meeting Paper revised from original submittal.
Protopapas, Kruse, Olson, Donelan
6
TABLE 2 Distribution of Movements and Tonnage by Commodity Group in Population and Sample – Arkansas.
WCSC Commodity Group Population Sample
Movements % Tons (000s) % Movements % Tons (000s) %
1 Coal 35 3 351 3 5 10 74 3
2 Petroleum Products 60 5 773 7 5 10 192 7
3 Crude Petroleum 0 0 0 0 0 0 0 0
4 Aggregates 83 7 3,332 30 4 8 870 30
5 Grain & Grain Products 340 30 2,723 25 12 24 697 24
6 Chemicals 314 28 1,853 17 14 28 515 17
7 Non-metallic Ores & Minerals 28 2 286 3 3 6 91 3
8 Iron Ore and Iron & Steel Products 191 17 1.283 12 5 10 356 12
9 Others 74 7 506 5 2 4 152 5
Total 1,125* 100% 11,106 100% 50 100% 2,949 100%
Sample as % of Population 4% 27%
* No passenger movements in the original Arkansas dataset
TRB 2014 Annual Meeting Paper revised from original submittal.

Protopapas, Kruse, Olson, Donelan
7
TABLE 3 Distribution of Movements and Tonnage by Commodity Group in Population and Sample – Red.
WCSC Commodity Group Population Sample
Movements % Tons (000s) % Movements % Tons (000s) %
1 Coal 1 0 18 0 0 0 0 0
2 Petroleum Products 174 27 2,376 27 11 22 1,106 22
3 Crude Petroleum 33 5 734 8 4 8 325 8
4 Aggregates 102 16 3,645 41 8 16 1,711 16
5 Grain & Grain Products 92 14 421 5 13 26 207 26
6 Chemicals 133 20 1,279 14 5 10 546 10
7 Non-metallic Ores & Minerals 65 10 227 3 8 16 111 16
8 Iron Ore and Iron & Steel Products 11 2 24 0 0 0 0 0
9 Others 45 7 178 2 1 2 125 2
Total 656* 100% 8,901 100% 50 100% 4,131 100%
Sample as % of Population 8% 46%
* After 11 passenger movements were removed from 667 movements in the original Red dataset
TRB 2014 Annual Meeting Paper revised from original submittal.
Protopapas, Kruse, Olson, Donelan
8
EXISTING WATER ROUTING 1 2
Through examination of the individual ports/docks and telephone discussions with selected 3
terminals and facilities it was discovered that off-river origins and/or destinations were either 4
nonexistent, unidentifiable, infinite, or unknown. In many instances privately owned and 5
operated docks serve as holding docks for adjoining/nearby industrial facilities; midstream 6
holding docks between sibling facilities of the same corporation; import/export docks; or 7
receiving/distribution points to an infinite number of off-river origins/destinations, e.g., grain 8
elevators. Loading/unloading of barges is typically performed via pump, conveyor belt, crane 9
with clamshell, etc. directly from/to the port/dock. In summation, there was inadequate 10
information to confidently support inclusion of origin or destination leg land movements beyond 11
the water origins/destinations. The researchers concluded that since no land movement per se 12
beyond a facility port/dock could be isolated and identified, the water origin/destination had to 13
be assumed to be the “ultimate” origin/destination in both the existing water routing and the 14
least-cost all-overland routing. 15
Two major barge operators provided estimated water linehaul rates in 2010 dollars for 16
192 of the 200 movements (96%). Rates for the remaining 8 movements, i.e. 4 Coal movements 17
on GIWW-E and 4 Aggregates movements on Arkansas, were obtained from movements in the 18
same commodity groups on the remaining 2 waterways, as applicable (please see footnotes in 19
corresponding tables). The operator rates were compared to the rates produced by the Barge 20
Costing Model (BCM) in order to investigate the model’s ability to reflect the real world and to 21
identify areas in which it could be improved. The BCM was originally developed by the 22
Tennessee Valley Authority (TVA) over 20 years ago and has been updated and used 23
continuously, extensively, and successfully for USACE’s study and analysis purposes; thus it can 24
be described as a “legacy model.” The BCM is designed to provide shipper cost information on 25
the linehaul movement of commodities between points on the Inland Waterway System. 26
Additionally, the model calculates transfer costs to and from barge, i.e., the barge operator’s cost 27
of time to load or unload a barge for the routing being analyzed. The model utilizes information 28
obtained from a variety of sources: 29
USACE’s Lock Performance Monitoring System (LPMS) and WCSC databases, 30
Inland River Record (barge and towboat characteristics) (1), 31
Shallow Draft Vessel Costs (fixed and variable cost data) (2), 32
Shippers and receivers, and 33
Barge and Towing industry. 34
35
The latest update of the model took place in 2011Q4. 36
37
The BCM was used to obtain rates for all 200 movements for comparison purposes and 38
statistically significant differences were found between the BCM rates and the operator rates. 39
First, the F-test Two-Sample for Variances (the operator rate vs. the BCM rate for each 40
movement) was conducted for each waterway. Overall, the F-tests concluded that the variances 41
were unequal. Specifically, the variance of operator rates was greater than the variance of BCM 42
rates for GIWW-E and Red, while for Arkansas the variance of BCM rates was greater/equal 43
than the variance of operator rates, at a 95% level of confidence. Hence, the T-test Two-Sample 44
Assuming Unequal Variances was conducted for each waterway. The T-tests concluded that the 45
mean of operator rates was greater than the mean of BCM rates for GIWW-E and Red, while for 46
TRB 2014 Annual Meeting Paper revised from original submittal.

Protopapas, Kruse, Olson, Donelan
9
Arkansas the mean of BCM rates was greater/equal than the mean of operator rates, at a 95% 1
level of confidence. The statistical analysis based on this small and non-statistically significant 2
sample can help indicate possible population trends. However, greater confidence could be 3
acquired in future research efforts through additional statistical analyses based on larger, 4
statistically significant movement samples. 5
The rates for 8 movements were not provided by the operators so these had to be inferred 6
from rates for comparable movements that were provided. The researchers decided it was wiser 7
to report the operator rate, whether it was direct or inferred, for all movements due to greater 8
confidence than the rate output by the BCM. Water linehaul distances and times, load/unload 9
times, and any supplemental times were reported as calculated by the BCM. All movement data 10
were presented in individual rate sheets. Water handling (loading/unloading) costs for dry bulk 11
movements (for liquid bulk see discussion below) in 2012Q4 dollars were obtained from 6 12
additional industrial facilities and barge and terminal operators on a confidential basis by a 13
member of the research team who is a retired barge company executive with 35 years of 14
experience in barge transportation contracting. 15
To be precise, it was discovered that no separate and distinct handling charge exists 16
where liquid bulk is concerned (commodity groups 2 (Petroleum Products), 3 (Crude Petroleum), 17
and 6 (Chemicals)). In contrast to dry bulk, liquid bulk terminals have a completely different cost 18
structure for cargo transfers involving marine vessels, including barges. Generally, cargo 19
handling costs are included in rental charges for liquid storage tanks paid by the shipper, with a 20
maximum number of tank turnovers per rental period; in other words, a certain number of cargo 21
transfers are built into the rates. The logistics calculation performed by shippers is not as simple 22
as adding several dollars per ton to the barge freight rate to account for cargo handling costs. 23
Using hypothetical numbers, a storage tank with volumetric capacity of 100,000 barrels (1 barrel 24
= 42 gallons) suitable to store petroleum or petrochemicals could be rented for perhaps $80,000 25
per year in a major port. Such a tank might cost $4 million to build. The rental cost includes a 26
specific volume of total throughput per year. As a working rule, petroleum cargoes may be 27
allowed 12 inventory turnovers annually, while petrochemicals are typically allowed 4 turnovers. 28
Excess throughput is charged at rates on the order of $0.02 per gallon. Depending on vessel size, 29
a certain amount of free time (2 to 4 hours) is allowed to accomplish cargo sampling and testing, 30
line flushing and so on, in addition to normal cargo pumping time. Thereafter, marine delay 31
charges are assessed for use of the dock ($300-600 per hour). Accessorial charges such as tank 32
cleaning, cargo heating, vapor recovery and excess manpower are additional. 33
The operators’ linehaul rates were adjusted to 2012Q4 dollars using the Association of 34
American Railroads’ (AAR) Rail Cost Adjustment Factor (RCAF) since cost escalation in the 35
rail and barge industry is similar (3). All costs output by the BCM were in 2011Q4 dollars and 36
were subsequently adjusted to 2012Q4 dollars as well, through the AAR’s All-Inclusive Index 37
Less Fuel (All-LF). This index provides a parallel measure of the RCAF without the influence of 38
the fuel cost component. The fuel price was adjusted within the model by using the Energy 39
Information Administration’s (EIA) latest (April 2012) published Refiner Petroleum Product 40
Price for Ultra Low Sulfur Diesel Fuel (4). The fuel price used was $3.36/gallon plus federal tax 41
of $0.20/gallon (barge operators pay federal tax only). 42
43
44
TRB 2014 Annual Meeting Paper revised from original submittal.

Protopapas, Kruse, Olson, Donelan
10
LEAST-COST ALL-OVERLAND ROUTING 1 2
As described in the previous section, the researchers concluded that since no land movement per 3
se beyond a facility port/dock could be isolated and identified, the water origin/destination had to 4
be assumed to be the “ultimate” origin/destination in both the existing water routing and the 5
least-cost all-overland routing. It is possible that in the absence of waterway transportation some 6
ODCs may be able to be routed all-overland from the “ultimate” land origin to the “ultimate” 7
land destination without going through the existing water origin and/or destination. This could 8
reduce the all-overland routing costs and hence could reduce the savings due to the existing 9
water routing. However there was inadequate information about land origins or destinations 10
beyond the water origins/destinations to support an analysis to this level for individual ODCs. 11
A close examination of each origin/destination via online photography and satellite 12
images (5), the 2011 National Transportation Atlas Database (NTAD) (6), and the USACE’s 13
Port Series Reports (7) showed that the majority of docks were attached to facilities with on-site 14
access to/from a rail mainline (rail connector or spur). Given the bulk, low-end value per unit of 15
weight nature of the commodities involved, it stands to reason that the least-cost linehaul 16
alternative would likely be rail in the absence of barge transportation. In cases where either or 17
both the origin and/or destination facility did not have on-site rail access to a rail mainline, the 18
nearest railhead with transloading capabilities was identified. A short truck haul, 15 miles on 19
average, was estimated to be required between each such facility and the nearest railhead. The 20
requisite truck charges were added to the rail linehaul charges as applicable in order to obtain the 21
cost of the all-overland routing. Please see below for further truck details. 22
For a total of 95 movements (56––GIWW-E, 20––Arkansas, and 19––Red), rail mileage 23
and rate (revenue per net ton) were obtained from the Surface Transportation Board’s (STB) 24
Carload Waybill Samples 2010 (latest available) and 2009 (confidential files) which were 25
provided through USACE for purposes of this work (8). Each Waybill was analyzed for 26
movements of similar origin-destination-commodity (ODC) triples at two geographic levels, the 27
county Federal Information Processing Standard (FIPS) level and the Business Economic Area 28
(BEA) level, and at the 5-digit or 2-digit Standard Transportation Commodity Code (STCC) 29
system used by railroads (9) due to the absence of waybills for ODC triples identical or similar to 30
waterborne movements in terms of geographical as well as commodity detail. A BEA typically 31
includes one or more counties. Differences between the WCSC commodity classification system 32
and the STCC system sometimes only permitted matching the 5-digit WCSC code to the 2-digit 33
STCC code. For example, the closest match to Benzene, Pure (WCSC code 51122) at the 5-digit 34
STCC level was STCC 28141 Crude Products From Coal Tar, Natural Gas. However, an 35
equivalent ODC triple combination could only be found at the 2-digit STCC level (28 Chemicals 36
and Allied Products). Waybills did not exist for many ODC triples. The absence of waybills for 37
ODC triples identical or similar to waterborne movements is not surprising since waterborne 38
transportation competes effectively with rail, especially for the movements included in this 39
sample. 40
Hence, for a total of 76 movements (31––GIWW-E, 27––Arkansas, and 18––Red) the 41
STB’s Uniform Railroad Costing System (URCS) program, whose latest update was based on the 42
2010 Waybill Sample, was used to obtain rail linehaul rates per ton (10). The term “cost” in the 43
URCS documentation is used to refer to the “rail shipment cost”, i.e. what shippers pay to the 44
railroads, which is precisely the same thing as “railroad revenue”. Hence, these two terms can be 45
used interchangeably. The URCS only allows for commodity matching at an aggregate 2-digit 46
TRB 2014 Annual Meeting Paper revised from original submittal.

Protopapas, Kruse, Olson, Donelan
11
STCC level. In addition, the Waybill-reported rail rates were all-inclusive but URCS calculates 1
shipper costs based on mileage and switching by railroad, hence it requires the user to enter 2
mileage by railroad for each rail route. NTAD was used to trace rail routes and determine 3
mileage on individual railroads’ networks in order for URCS to account for linehaul and 4
switching charges. The URCS cost in dollars per carload was converted to dollars per net ton 5
based on a carload weight of 110 tons. 6
Costs obtained from the Waybill Samples and the URCS were then adjusted to 2012Q4 7
dollars via the AAR’s Rail Cost Adjustment Factor (RCAF) (3), which measures the rate of 8
inflation in all seven railroad inputs: labor, fuel, materials and supplies, equipment rents, 9
depreciation, interest, and other expenses. 10
Based on the researchers’ experience, the reported system average speed of 26.2 mph for 11
Union Pacific Railroad, the largest of the Class I railroads, was reduced to 21 mph in order to 12
reflect en-route terminal dwell times and was used to calculate the mainline rail trip time in days 13
(11). Two days were added to origin legs and one day to destination legs with on-site or nearby 14
rail line access to account for the rail load/unload time, travel time, and dwell/switch time 15
required for local rail service between mainline railheads and individual facilities or transload 16
terminals. 17
It was assumed that a total of 29 movements (13––GIWW-E, 3––Arkansas, and 13––18
Red) movements with about 100 rail miles or less between origin and destination would take 19
place solely by truck at an average speed of 40 mph. This hypothesis was supported by the fact 20
that no waybills with even remotely similar combinations of ODC triples or even distance-21
commodity doubles were found in either Waybill Sample for such movements. Short truck hauls 22
between facilities without on-site rail access and the nearest railhead with transloading capability 23
were estimated to be 15 miles on average at an average speed of 40 mph. Truck trip times ––24
either for linehaul or short haul to the nearest railhead–– were reported in days, to enable 25
comparison with rail and water trip times. Short haul truck miles, time, and rates were added to 26
linehaul rail miles, time, and rates, as applicable, in order to obtain the all-overland routing 27
figures. Truck rates per net ton-mile for dry and liquid bulk were obtained through telephone and 28
email communication with 20 national interstate and local motor carriers and individual 29
facilities. The rates consisted of a base rate and a fuel surcharge expressed in dollars per pound, 30
gallon, day, truckload, representative commodity, or fixed miles/route. They also stated that they 31
did allow for typical load/unload time but that there was no separate and distinct cost figure 32
attached to it. A truckload net cargo weight of 25 tons (50,000 lbs), densities of representative 33
commodities, and trip distances and durations were taken into consideration in order to calculate 34
a truck cost in dollars per ton-mile for all commodities on a nationwide basis. 35
All calculations included requisite handling costs (load/unload and transfer) as 36
applicable. Load/unload costs at facilities to/from rail or truck, as well as transfer costs at 37
transload terminals, in terms of dollars per net ton, were assumed to be equal to the load/unload 38
costs obtained from facilities and operators for the water routing. Separate and distinct 39
load/unload costs were applied to dry bulk only; rail and truck rates for liquid bulk were assumed 40
to include built-in load/unload costs on the premise that the same shipper-facility contracts 41
would likely apply independently of the mode of transportation used. 42
Load/unload times involving rail or truck are likely to be different than barge but it is not 43
possible to estimate them without knowing the size of individual shipments, truck or railcar 44
availability, or facility/terminal load/unload capacity etc. Hence, rule-of-thumb figures of half a 45
day for truck or rail loading at the origin facility and truck-rail transfer at the transload terminal, 46
TRB 2014 Annual Meeting Paper revised from original submittal.
Protopapas, Kruse, Olson, Donelan
12
and a quarter day for truck or rail unloading at the destination facility and rail-truck transfer at 1
the transload terminal were adopted, as applicable. In the case of rail loading, unloading, and 2
transloading, these were a subset of the above-mentioned two days for origin rail legs and one 3
day for destination rail legs. In the case of facilities without on-site rail access, an additional half 4
day for truck loading at the origin facility and an additional quarter day for truck unloading at the 5
destination facility were assumed. 6
It must be noted that the logistics involved in a theoretical modal shift from barge to rail 7
or truck are likely to be prohibitive in reality, considering the significant capacity advantage of 8
barges: one dry cargo barge is equivalent to 16 railcars or 70 trucks while one tank barge is 9
equivalent to 46 railcars or 144 trucks (12, 13). 10
11
12
RESEARCH RESULTS 13 14
The method applied in selecting the movement sample from the population of each waterway 15
was based on tonnage distribution by WCSC commodity group on that waterway and was non-16
statistically significant. However, the rates in dollars per net ton-mile obtained for the 17
movements in each commodity group in each waterway sample served as a proxy for 18
extrapolation to obtain rates associated with all movements of the same commodity group in 19
each waterway’s movement population. The rates in dollars per net ton-mile obtained for the 20
existing water routing, the least-cost all-overland routing, and the ratio of least-cost all-overland 21
route miles to existing water route miles obtained for each movement were averaged by 22
commodity group for each waterway (Table 4, Table 5, Table 6). Findings that appear to be 23
“irregular” e.g., the water rate being higher than the least-cost all-overland rate for a commodity 24
group on the whole or for individual movements within a commodity group may be attributed to 25
the limited, non-statistically significant sample size (in total number of movements and in 26
particular in the number of movements for Arkansas and Red); limited availability and capability 27
of supporting data and tools; or special characteristics associated with the individual movements. 28
It is quite possible that a desire to constrain moving the waterborne commodities by means of 29
company-owned equipment, the lack of good connecting infrastructure, the lack of power units 30
(e.g., locomotives or tractors), or a number of other factors could cause such anomalies. Overall, 31
however, this research concluded that barge shipment is the least-cost transportation alternative 32
for every commodity group on the GIWW-E and Red, and for the majority of commodity groups 33
on the Arkansas. 34
35
TRB 2014 Annual Meeting Paper revised from original submittal.

Protopapas, Kruse, Olson, Donelan
13
TABLE 4 Transportation Rates per Net Ton-Mile by Commodity Group – GIWW-E. 1
WCSC Commodity Group
Average Transportation Rate ($/net ton-mile) Average
Ratio
Land/Water
Miles Existing Water
Routing
Least-Cost All-Overland
Routing
1 Coal* $0.09 $0.38 0.89
2 Petroleum Products $0.08 $0.19 1.19
3 Crude Petroleum $0.05 $0.08 0.92
4 Aggregates $0.02 $0.10 0.75
5 Grain & Grain Products –– –– ––
6 Chemicals $0.08 $0.19 1.38
7 Non-metallic Ores & Minerals $0.16 $0.28 0.85
8 Iron Ore and Iron & Steel Products $0.08 $0.23 0.78
9 Others $0.03 $0.11 1.06
–– = No Movements in this commodity group in the sample
* Water routing rates inferred from Coal commodity group in Arkansas
2
TABLE 5 Transportation Rates per Net Ton-Mile by Commodity Group – Arkansas. 3
WCSC Commodity Group
Average Transportation Rate ($/net ton-mile) Average
Ratio
Land/Water
Miles Existing Water
Routing
Least-Cost All-Overland
Routing
1 Coal $0.02 $0.08 0.83
2 Petroleum Products $0.09 $0.07 0.74
3 Crude Petroleum –– –– ––
4 Aggregates* $1.74 $0.80 2.45
5 Grain & Grain Products $0.03 $0.08 0.92
6 Chemicals $0.08 $0.07 0.85
7 Non-metallic Ores & Minerals $0.03 $0.15 0.73
8 Iron Ore and Iron & Steel Products $0.04 $0.18 0.70
9 Others $0.02 $0.07 0.80
–– = No Movements in this commodity group in the sample
* Water routing rates inferred from Aggregates commodity group in GIWW-E and Red
4
TRB 2014 Annual Meeting Paper revised from original submittal.

Protopapas, Kruse, Olson, Donelan
14
TABLE 6 Transportation Rates per Net Ton-Mile by Commodity Group – Red. 1
WCSC Commodity Group
Average Transportation Rate ($/net ton-mile) Average
Ratio
Land/Water
Miles Existing Water
Routing
Least-Cost All-Overland
Routing
1 Coal –– –– ––
2 Petroleum Products $0.06 $0.14 0.88
3 Crude Petroleum $0.13 $0.15 1.11
4 Aggregates $0.02 $0.09 0.85
5 Grain & Grain Products $0.08 $0.27 0.82
6 Chemicals $0.05 $0.06 0.76
7 Non-metallic Ores & Minerals $0.23 $0.29 0.98
8 Iron Ore and Iron & Steel Products –– –– ––
9 Others $0.02 $0.23 0.82
–– = No Movements in this commodity group in the sample
2
The actual transportation rates obtained from the research were applied to the 200 3
sampled movements. The average transportation rates per net ton-mile and ratio of land miles to 4
water miles by commodity group were applied to the unsampled movements in the same 5
commodity group in each waterway (total of 3,460 unsampled movements) in order to calculate 6
the total existing water routing cost, the total least-cost all-overland routing cost, and the annual 7
savings (in 2012Q4 dollars) realized by each movement due to the utilization of the water mode. 8
Naturally, extrapolation could only be supported if there was at least one sampled movement for 9
that commodity group for that waterway. Commodity groups with minimal percent tonnage of 10
the waterway population’s tonnage were not sampled. The following equations were applied to 11
each unsampled movement in each sampled commodity group in each waterway’s population: 12
13
Total Cost of Existing Water Routing = Average Transportation Rate of Existing Water 14
Routing ($/net ton-mile) x Existing Water Routing Miles x Annual Tons 15
16
Total Cost of Least-Cost All-Overland Routing = Average Transportation Rate of Least-17
Cost All-Overland Routing ($/net ton-mile) x Existing Water Routing Miles x Average 18
Ratio Land/Water Miles x Annual Tons 19
20
Annual Savings due to Utilization of Water Routing = Total Cost of Least-Cost All-21
Overland Routing – Total Cost of Least-Cost All-Overland Routing 22
23
This methodology was applied to every movement in the population and the results in 2012Q4 24
dollars are summarized below (Table 7). 25
26
TRB 2014 Annual Meeting Paper revised from original submittal.

Protopapas, Kruse, Olson, Donelan
15
TABLE 7 Transportation Costs and Savings by Waterway. 1
Waterway Existing Water Routing Least-Cost All-Overland Routing Annual Savings
GIWW-E $978.4M $3,238.0M $2,259.6M
Arkansas $1,442.0M $1,739.6M $297.6M
Red $293.3M $586.1M $292.8M
Total $2,713.7M $5,563.7M $2,850.0M
2
3
CONCLUSIONS AND RECOMMENDATIONS 4 5
This transportation rate analysis for the GIWW-E, Arkansas river, and Red river succeeded in 6
procuring actual charges for 96% of the sampled movements from targeted selected barge and 7
facility/terminal operators. It therefore became possible to “validate” the rates output by the 8
BCM and it was found that the BCM significantly underestimates real-world water shipping 9
charges and that some of its definitions are inconsistent with real-world barge operations. 10
Overall, this research concluded that barge shipment is the least-cost transportation 11
alternative for every commodity group on the GIWW-E and Red, and for the majority of 12
commodity groups on the Arkansas. The analysis estimated that annual savings of $2.85B (over 13
100%) were realized in 2010 due to the utilization of the water mode over the least-cost all-14
overland alternative mode for the population of barge movements on the GIWW-E, Arkansas, 15
and Red––in other words, the least-cost all-overland alternative would cost more than twice as 16
much as the water routing. 17
In most cases the least-cost, most practical land-only linehaul alternative was found to be 18
rail: 87 movements for the GIWW-E, 47 for Arkansas, and 37 for Red. 19
External or supplementary datasets and models, information from rail and motor carriers, 20
and the researchers’ experience were used to develop the least-cost overland transportation rates. 21
Published data issues and limitations encountered in previous studies that still remain include: 22
The port/dock information included in the WCSC is in need of thorough updating. 23
The port/dock information included in USACE’s Port Series Reports is in similar need. 24
The different commodity classification systems used by different modes and government 25
agencies should either be integrated into a single, one-size-fits-all classification scheme 26
or a “dictionary” that “translates” among the various modal commodity classification 27
systems should be developed. 28
29
This study concluded that additional research efforts based on larger, statistically 30
significant samples, using similar methods should be conducted in order to obtain additional field 31
data and compare them to the corresponding BCM output. This will help identify areas in which 32
the BCM could be improved through modification of its code, the base data it uses, and its cost 33
definitions so that it reflects actual barge operations more accurately. Future research efforts 34
should incorporate these improvements in order to ultimately increase confidence in the BCM 35
output. 36
These additional research efforts should also provide for expanded data collection efforts 37
related to “ultimate” land origins and destinations thereby allowing for development of more 38
TRB 2014 Annual Meeting Paper revised from original submittal.

Protopapas, Kruse, Olson, Donelan
16
accurate least-cost all-overland routings, commensurate costs, and ultimately savings due to the 1
existing water routing. 2
3
ACKNOWLEDGEMENTS 4
5 This study was conducted for the U.S. Army Corps of Engineers–Huntington District under 6
contract with Nick J. Rahall, II Appalachian Transportation Institute at Marshall University. The 7
authors would like to thank the barge and terminal/facility operators; and Mr. Chris Dager of the 8
Center for Transportation Research at the University of Tennessee, Knoxville for their assistance 9
in this work. 10
11
REFERENCES 12
1 The Waterways Journal. Inland River Record.
http://www.waterwaysjournal.net/IRR%20site/IRR_about.html Accessed December 2012.
2 U.S. Army Corps of Engineers, Economic Guidance Memo #05-06: Shallow Draft Vessels
Operating Costs FY 2004 http://planning.usace.army.mil/toolbox/library/EGMs/egm05-
06.pdf Accessed November 2011.
3 Association of American Railroads (AAR). Rail Cost Indexes.
http://www.aar.org/StatisticsAndPublications/Rail-Cost-Indexes.aspx Accessed December
2012
4 Energy Information Administration (EIA). Refiner Petroleum Product Prices by Sales Type.
http://www.eia.gov/dnav/pet/pet_pri_refoth_dcu_nus_m.htm Accessed December 2012.
5 Google® Earth. http://earth.google.com Accessed December 2012.
6 U.S. Department of Transportation, Research and Innovative Technology Administration,
Bureau of Transportation Statistics. National Transportation Atlas Database 2011.
https://2bts.rita.dot.gov/pdc/user/products/src/products.xml?p=3194&c=5 Accessed
December 2012.
7 U.S. Army Corps of Engineers, Navigation Data Center. Port Series Reports.
http://www.iwr.usace.army.mil/ndc/ports/ps/psbooks.htm Accessed December 2012.
8 Surface Transportation Board. Carload Waybill Sample.
http://www.stb.dot.gov/stb/industry/econ_waybill.html Accessed December 2012.
9 Railinc Corporation Standard Transportation Commodity Code.
https://www.railinc.com/rportal/web/guest/37 Accessed December 2012.
10 Uniform Railroad Costing System (URCS). http://www.stb.dot.gov/stb/industry/urcs.html
Accessed December 2012.
11 Union Pacific AAR and STB Reports, AAR-UP Monthly Performance Measures, Current–
2012. http://www.up.com/investors/reports/index.shtml Accessed December 2012.
12 Kruse, J., Protopapas, A., and Olson, L. A Modal Comparison of Domestic Freight
Transportation Effects on the General Public 2001-2009. National Waterways Foundation.
Texas Transportation Institute, College Station, TX, February 2012.
http://www.nationalwaterwaysfoundation.org/Research.html Accessed December 2012.
13 Protopapas, A., Kruse, J., and Olson, L. Modal Comparison of Domestic Freight
Transportation Effects on the General Public. In Transportation Research Record: Journal
of the Transportation Research Board, No. 2330, Transportation Research Board of the
TRB 2014 Annual Meeting Paper revised from original submittal.

Protopapas, Kruse, Olson, Donelan
17
National Academies, Washington, D.C., 2013, pp. 55-62.
http://trb.metapress.com/content/pg736221p6u558p1/fulltext.pdf Accessed October 2013.
TRB 2014 Annual Meeting Paper revised from original submittal.