St. Andrew Bay - USGS · 2007-05-22 · Gulf Intracoastal Waterway connecting western St. Andrew...
15
St. Andrew Bay By Michael S. Brim 1 and Lawrence R. Handley 2 1 U.S. Fish and Wildlife Service. 2 U.S. Geological Survey. Background St. Andrew Bay has a watershed of approximately 297,576 ha (735,300 acres, or 1,149 mi 2 ) (Beck and others, 2000) (fig. 1). The bay is almost entirely within Bay County, an area of over 2,590 km 2 (1,000 mi 2 ), which has a resident population of more than 148,000 (U.S. Census Bureau, 2002). Panama City is the largest of seven municipalities surrounding the bay. Much of the county, however, is unincorporated land traditionally supporting silviculture. The primary industries in Bay County are tourism and the military, with Tyndall Air Force Base playing a dominant role in the community. The U.S. Navy’s Coastal Systems Station and the U.S. Coast Guard also share the bay’s shoreline. Most tourist activity occurs on Panama City Beach or upon bay waters. Other significant industries include the Smurfit- Stone Container Corporation paper mill, Arizona Chemical, Port Panama City, the Panama City-Bay County International Airport, and the Gulf Power Lansing Smith generation plant. St. Andrew Bay has a rich history. The bay undoubtedly received its name from some of the early Spanish navigators who explored the northeast gulf coast in the 16th century, between 1516 and 1558 (West, 1922). Archaeological evidence supports that the first Native Americans in the area found food in the bay and shelter along its shores. A skirmish took place within the bay during the Civil War. In 1836, James Watson built a sawmill on what is now Watson Bayou (West, 1922). In 1931, International Paper constructed Florida’s first paper mill on the site. The mill (currently owned by Smurfit- Stone Container Corporation) is still in operation. In 1938, the U.S. Army Corps of Engineers (USACE) constructed the main entrance channel by excavating through a barrier peninsula to create a rock-jettied inlet some 9.7 km (6 mi) west of the historical East Pass entrance that was once used by the Spanish explorers. In about 1950, USACE constructed the Gulf Intracoastal Waterway connecting western St. Andrew Bay with Choctawhatchee Bay and connecting eastern St. Andrew Bay with Lake Wimico and with St. Joseph Bay via the Gulf County Canal. In the 1960s, a dam was constructed across a portion of North Bay to create Deer Point Lake. St. Andrew Bay is unique because of its wealth of biological diversity. Keppner (2002) documented the diversity associated with the bay and compared it with surveys of Indian River Lagoon, Fla., which has been touted as the most biologically diverse estuary in North America. His report documents 2,913 species of plants and animals associated with St. Andrew Bay, nearly 400 more species than found in the lagoon. The bay is, however, a fragile ecosystem. Because of its high-salinity waters, the depths of the bay, the lack of significant freshwater inflow from land drainage, and the minimal tidal regime, the bay is highly susceptible to becoming polluted or contaminated. Chemicals and nutrients are not readily flushed from this bay, and the nature of the deep sediments (rich in fine clays, silt, and organic carbon) is such that they could easily become reservoirs for metals and organic-compound contaminants. While several point- source discharges occur in the bay, the greatest future threat to water and sediment quality (and thus to the diverse biota) is urbanization and its associated stormwater runoff. Additional and more detailed descriptions of St. Andrew Bay and its resources can be found in the ecosystem management plan (Keppner and Keppner, 2001) and the State Surface Water Improvement and Management (SWIM) Plan for the bay (Northwest Florida Water Management District, 2000). Scope of Area St. Andrew Bay covers an area of about 27,714 ha (68,480 acres, or 107 mi 2 ). It is unique among gulf coast estuaries for several reasons. Waters are deep and clear because little fresh water flows into the bay (Saloman and others, 1982), the primary source being Econfina Creek, which has an average discharge of just 15.3 m 3 /s (538 ft 3 /s) (U.S. Geological Survey, 1990). The total discharge of all natural surface-water sources entering this estuary is probably less than 28.3 m 3 /s (1,000 ft 3 /s) (Brim, 1998). By comparison, the average flow of the Apalachicola River into Apalachicola Bay to the east is about 707 m 3 /s (25,000 ft 3 /s). Because of the absence of a large river emptying into St. Andrew Bay, there is little sedimentation and associated turbidity in this bay, a situation contrary to that of most “true” estuaries, which have
Transcript of St. Andrew Bay - USGS · 2007-05-22 · Gulf Intracoastal Waterway connecting western St. Andrew...

St. Andrew Bay
By Michael S. Brim1 and Lawrence R. Handley2
1 U.S. Fish and Wildlife Service.
2 U.S. Geological Survey.
BackgroundSt. Andrew Bay has a watershed of approximately
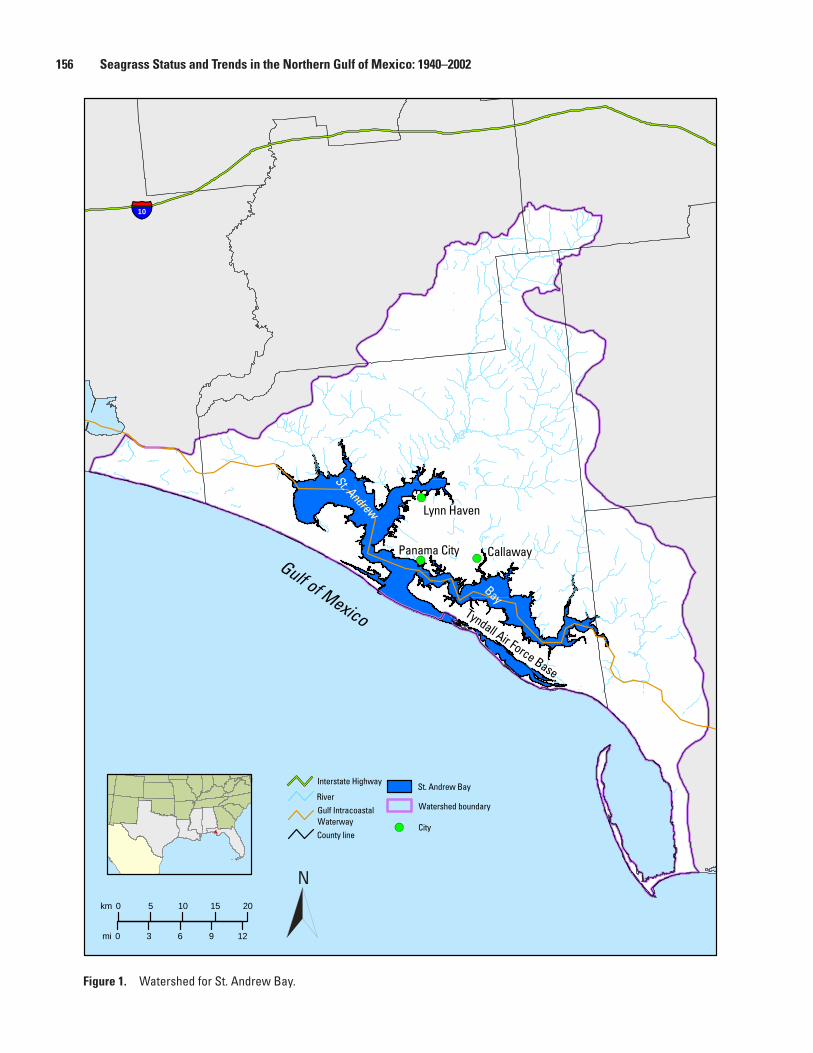
297,576 ha (735,300 acres, or 1,149 mi2) (Beck and others, 2000) (fig. 1). The bay is almost entirely within Bay County, an area of over 2,590 km2 (1,000 mi2), which has a resident population of more than 148,000 (U.S. Census Bureau, 2002). Panama City is the largest of seven municipalities surrounding the bay. Much of the county, however, is unincorporated land traditionally supporting silviculture.
The primary industries in Bay County are tourism and the military, with Tyndall Air Force Base playing a dominant role in the community. The U.S. Navy’s Coastal Systems Station and the U.S. Coast Guard also share the bay’s shoreline. Most tourist activity occurs on Panama City Beach or upon bay waters. Other significant industries include the Smurfit-Stone Container Corporation paper mill, Arizona Chemical, Port Panama City, the Panama City-Bay County International Airport, and the Gulf Power Lansing Smith generation plant.
St. Andrew Bay has a rich history. The bay undoubtedly received its name from some of the early Spanish navigators who explored the northeast gulf coast in the 16th century, between 1516 and 1558 (West, 1922). Archaeological evidence supports that the first Native Americans in the area found food in the bay and shelter along its shores. A skirmish took place within the bay during the Civil War. In 1836, James Watson built a sawmill on what is now Watson Bayou (West, 1922). In 1931, International Paper constructed Florida’s first paper mill on the site. The mill (currently owned by Smurfit-Stone Container Corporation) is still in operation. In 1938, the U.S. Army Corps of Engineers (USACE) constructed the main entrance channel by excavating through a barrier peninsula to create a rock-jettied inlet some 9.7 km (6 mi) west of the historical East Pass entrance that was once used by the Spanish explorers. In about 1950, USACE constructed the Gulf Intracoastal Waterway connecting western St. Andrew Bay with Choctawhatchee Bay and connecting eastern St. Andrew Bay with Lake Wimico and with St. Joseph Bay via the Gulf County Canal. In the 1960s, a dam was constructed across a portion of North Bay to create Deer Point Lake.
St. Andrew Bay is unique because of its wealth of biological diversity. Keppner (2002) documented the diversity associated with the bay and compared it with surveys of Indian River Lagoon, Fla., which has been touted as the most biologically diverse estuary in North America. His report documents 2,913 species of plants and animals associated with St. Andrew Bay, nearly 400 more species than found in the lagoon.
The bay is, however, a fragile ecosystem. Because of its high-salinity waters, the depths of the bay, the lack of significant freshwater inflow from land drainage, and the minimal tidal regime, the bay is highly susceptible to becoming polluted or contaminated. Chemicals and nutrients are not readily flushed from this bay, and the nature of the deep sediments (rich in fine clays, silt, and organic carbon) is such that they could easily become reservoirs for metals and organic-compound contaminants. While several point-source discharges occur in the bay, the greatest future threat to water and sediment quality (and thus to the diverse biota) is urbanization and its associated stormwater runoff.
Additional and more detailed descriptions of St. Andrew Bay and its resources can be found in the ecosystem management plan (Keppner and Keppner, 2001) and the State Surface Water Improvement and Management (SWIM) Plan for the bay (Northwest Florida Water Management District, 2000).
Scope of AreaSt. Andrew Bay covers an area of about 27,714 ha
(68,480 acres, or 107 mi2). It is unique among gulf coast estuaries for several reasons. Waters are deep and clear because little fresh water flows into the bay (Saloman and others, 1982), the primary source being Econfina Creek, which has an average discharge of just 15.3 m3/s (538 ft3/s) (U.S. Geological Survey, 1990). The total discharge of all natural surface-water sources entering this estuary is probably less than 28.3 m3/s (1,000 ft3/s) (Brim, 1998). By comparison, the average flow of the Apalachicola River into Apalachicola Bay to the east is about 707 m3/s (25,000 ft3/s). Because of the absence of a large river emptying into St. Andrew Bay, there is little sedimentation and associated turbidity in this bay, a situation contrary to that of most “true” estuaries, which have
10
0 5 10 15 20 km
0 3 6 9 12 mi
Callaway
Lynn Haven
Panama City
St. Andrew
BayTyndall Air Force Base
Interstate Highway
River Gulf Intracoastal Waterway County line
St. Andrew Bay
Watershed boundary
City
Gulf of Mexico
N
Figure 1. Watershed for St. Andrew Bay.
156 Seagrass Status and Trends in the Northern Gulf of Mexico: 1940–2002

robust rivers draining into them. Bay depths of 12 m (40 ft) are not uncommon, and seagrasses flourish because of the clear, high-salinity waters. Furthermore, tidal flushing is minimal, with spring tides having a vertical amplitude of only about 0.67 m (2.2 ft) and neap tides often only 0.06 m (0.2 ft).
The St. Andrew Bay system lies in the Coastal Plain physiographic province, has a surface stratigraphy composed largely of post-Pleistocene sands, and is classified as coastal integrated drainage because of the set of small local streams draining its coastal regions (Young and others, 1987; Wolfe and others, 1988; Fernald and Purdum, 1992; Hydroqual, Inc., and Barry A. Vittor and Associates, Inc., 1993). The sediment composition within the bay varies, but several studies have revealed a positive correlation of increased silt and clay content as distance from the inlet increases. Deepwater sampling stations within the bay that were farthest from the jettied inlet, in the vicinity of Dyers Point and Bear Point, had sediments containing 67%–68% fine material (silts and clays) (U.S. Army Corps of Engineers, 1994).
St. Andrew Bay, which surrounds the Panama City metropolitan area on three sides, is about an equal distance (160 km, or 100 mi) from Pensacola to the west and Tallahassee to the east. The study area for this vignette extends from approximately 290 57’ to 300 18’ N. latitude and from 850 24’ to 850 51’ W. longitude. The gulf’s coastline at this location is a northwest/southeast axis.
The study area is divided into five logical segments (fig. 2): St. Andrew Bay (specifically the lower bay area); East Bay, North Bay, and West Bay (the three named arms); and St. Andrew Sound (a separate lagoonal embayment to the southeast). Information about the size and volume of these segments is taken from McNulty and others (1972).
St. Andrew Bay Segment
The first segment constitutes that southern portion of the bay between the two major bridges (Hathaway and DuPont) and extending south to the gulf inlets. The bay has two inlets: the recently reopened historical East Pass at the eastern end of Shell Island and the rock-jettied West Pass, which serves as the entrance for commercial vessels. Shell Island is an 11-km (7-mi) barrier island separating the lower bay from the gulf. The St. Andrew Bay segment covers 10,607 ha (26,209 acres), with a mean high water (mhw) volume of 5 x 10⁸ m3 (405,512 acre-feet).
West Bay Segment
West Bay is defined as the bay water northwest of an imaginary line connecting West Bay Point with Shell Point. It covers 7,113 ha (17,576 acres), with a mhw volume of 1.7 x 10⁸ m3 (136,135 acre-feet). Freshwater inflow comes primarily from two small creeks: Burnt Mill and Crooked Creeks. The Gulf Intracoastal Waterway enters West Bay on its west side. Botheration Bayou enters the bay at its southeast end.
The municipally treated effluent discharge from the City of Panama City Beach enters West Bay on the southern shoreline.
North Bay Segment
North Bay is east of West Bay and north of the Hathaway Bridge. It covers 2,702 ha (6,676 acres) and has a mhw volume of approximately 68 million m3 (55,189 acre-feet). It is primarily characterized by the presence of Deer Point Lake at its northeast end. The lake, a reservoir constructed in 1961, was once the most estuarine portion of St. Andrew Bay, the point at which Econfina Creek flowed into the system. Deer Point Dam impounded approximately 2,226 ha (5,500 acres) of estuarine area (Barkuloo, 1963); eventually the reservoir became a freshwater lake, which now serves as the potable water source for Bay County and its municipalities. North Bay’s east shoreline is highly urbanized and is also the location of the Panama City-Bay County International Airport. Sixteen bayous are found along the North Bay shoreline.
East Bay Segment
East Bay extends southeast of the DuPont Bridge. It covers 7,551 ha (18,659 acres) and has a mhw volume of 2.9 x 10⁸ m3 (231,705 acre-feet). East Bay is characterized by the presence of Tyndall Air Force Base, which includes almost all of the bay’s southern shoreline. Two creeks, Sandy and Wetappo, enter the bay’s eastern end, and 10 bayous are found along the shoreline. The Gulf Intracoastal Waterway enters East Bay along an alignment that cuts through the Wetappo Creek historical pathway. East Bay’s northern shoreline has extensive residential development to the west and moderate or sparse to the east.
St. Andrew Sound Segment
St. Andrew Sound is a lagoon not connected with St. Andrew Bay. The sound is approximately due south of East Bay. This lagoon extends along a northwest/southeast axis, is roughly 16 km (10 mi) long and 1.6 km (1 mi) wide, and covers an area of 1,905 ha (4,707 acres). The area features Tyndall Air Force Base, which covers approximately 95% of the shoreline, including the two barrier peninsulas which separate the sound from the gulf.
Methodology Employed To Determine and Document Current Status
The most current mapping study of seagrass coverage for the St. Andrew Bay area was conducted more than 10 yr ago by the U.S. Geological Survey (USGS) National Wetlands Research Center (NWRC) by using natural-color aerial
Methodology Employed To Determine and Document Current Status 157

1
2
3
4
5
km mi
4
4
00
8
8
Gulf
of M
exic
o
Wes
t Bay
East
Bay
North Bay
St. A
ndre
w B
ay
Pana
ma
City
Pana
ma
City
-Bay
Cou
nty
Inte
rnat
iona
l Airp
ort
Deer
Poi
ntDa
m
Deer
Poi
ntLa
keBa
iley
Brid
ge
Hath
away
Brid
ge
Both
erat
ion
Bayo
u
Shel
lPo
int
Wes
t Ba
y
Cour
tney
Poi
nt
Tynd
all
Air
Fo
rce
Bas
e
DuPo
ntBr
idge
St. And
rew Sou
nd
Pana
ma
City
Bea
ch
Stud
y a
rea
NFlorida
Wes
t Bay
St. A
ndre
w B
ay
St. A
ndre
w S
ound
Nor
th B
ay
East
Bay
Segm
ent
Gulf
Intra
coas
tal W
ater
way
3 52 41
Figu
re 2
. C
aptio
n w
ill a
ppea
r her
e an
d w
ill b
e co
nstra
ined
to a
sin
gle
line.
Figu
re 2
. Sc
ope
of a
rea
for t
he S
t. An
drew
Bay
vig
nette
.
158 Seagrass Status and Trends in the Northern Gulf of Mexico: 1940–2002

photography taken in 1992 at a 1:24,000 scale as part of the northeastern Gulf of Mexico seagrass mapping project.
The mapping protocol for the project consisted of stereoscopic photointerpretation, cartographic transfer, and digitization in accordance with strict mapping standards and conventions. Other important aspects of the protocol included the development of a classification system, groundtruthing, quality control, and peer review.
The primary data source was 1:24,000-scale natural color aerial photography flown by the National Aeronautics and Space Administration (NASA) Stennis Space Center in fall 1992. In those cases in which the data were inadequate or incomplete, contemporary supplemental data were acquired from other sources and used to complete the photographic coverage. The information derived from the photography was subsequently transferred by using a zoom transfer scope onto a stable medium overlaying USGS 1:24,000-scale quadrangle base maps.
The seagrass classification system that was developed consisted of two classes of open water habitats—RIV (riverine, fresh water) and EST (estuarine or marine open water)—and five classes of seagrass habitats (see appendix 1 for full description). One seagrass habitat class is continuous seagrass, CSG, for which no density distinction was made. The other four classes are patchy seagrass based on percent ground cover of patches in 5% increments: PSG1 (0%–10%, very sparse), PSG2 (15%–40%, sparse), PSG3 (45%–70%, moderate), and PSG4 (75%–95%, dense).
The groundtruthing phase included the participation of field staff from the U.S. Fish and Wildlife Service and the Florida Department of Environmental Protection. Draft maps were sent out to these agencies for review and comments. All comments received were incorporated into the final maps.
Methodology Employed To Analyze Historical Trends
From 1995 through 1998, the NWRC produced a series of historical seagrass maps for the U.S. Fish and Wildlife Service’s Panama City Ecological Services and Fisheries Resources Office to use in producing a trend analysis for St. Andrew Bay. Black and white photography from 1953 at a 1:20,000 scale, black and white photography from 1964 at a 1:20,000 scale, and natural color photography from 1980 at a 1:24,000 scale were used to develop the trend analysis. Each group of aerial photography was analyzed with stereoscopic visual equipment; seagrasses were delineated onto Mylar® (DuPont Teijin Films) overlays by using a zoom transfer scope and USGS 1:24,000-scale topographic quadrangles as the base maps. The overlays were digitized by using the Wetland Analytical Mapping System (WAMS) and converted into ArcInfo (Environmental Systems Research Institute, Inc., Redlands, Calif.) format files. All groups of photography were of good to high quality for delineating seagrasses.
Classification of the seagrass for the trend analysis followed the same protocol as the development of the northeastern Gulf of Mexico seagrass mapping using the 1992 aerial photography (see appendix 1). The seagrass classification system consisted of two classes of open water—RIV (riverine, fresh water) and EST (estuarine or marine open water)—and five classes of seagrass habitats. One seagrass habitat class is continuous seagrass, CSG, for which no density distinction was made. The other four classes are patchy seagrass based on percent ground cover of patches in 5% increments: PSG1 (0%–10%, very sparse), PSG2 (15%–40%, sparse), PSG3 (45%–70%, moderate), and PSG4 (75%–95%, dense).
Draft maps were sent out to the U.S. Fish and Wildlife Service for review and comments. All comments received were incorporated into the final maps. Although there was some limited groundtruthing in 1982–83 by NWRC and the U.S. Environmental Protection Agency (EPA) of the 1980 aerial photography, no groundtruthing took place for historical seagrass delineation.
The NWRC currently holds the aerial photography, the interpreted overlays, and the Mylar® overlays for the 1953, 1964, and 1980 maps.
Status and TrendsStatus and trends for the study area and segments will be
described by using just two density classifications, continuous and patchy, except where specific conditions warrant a more detailed description.
Entire Study Area
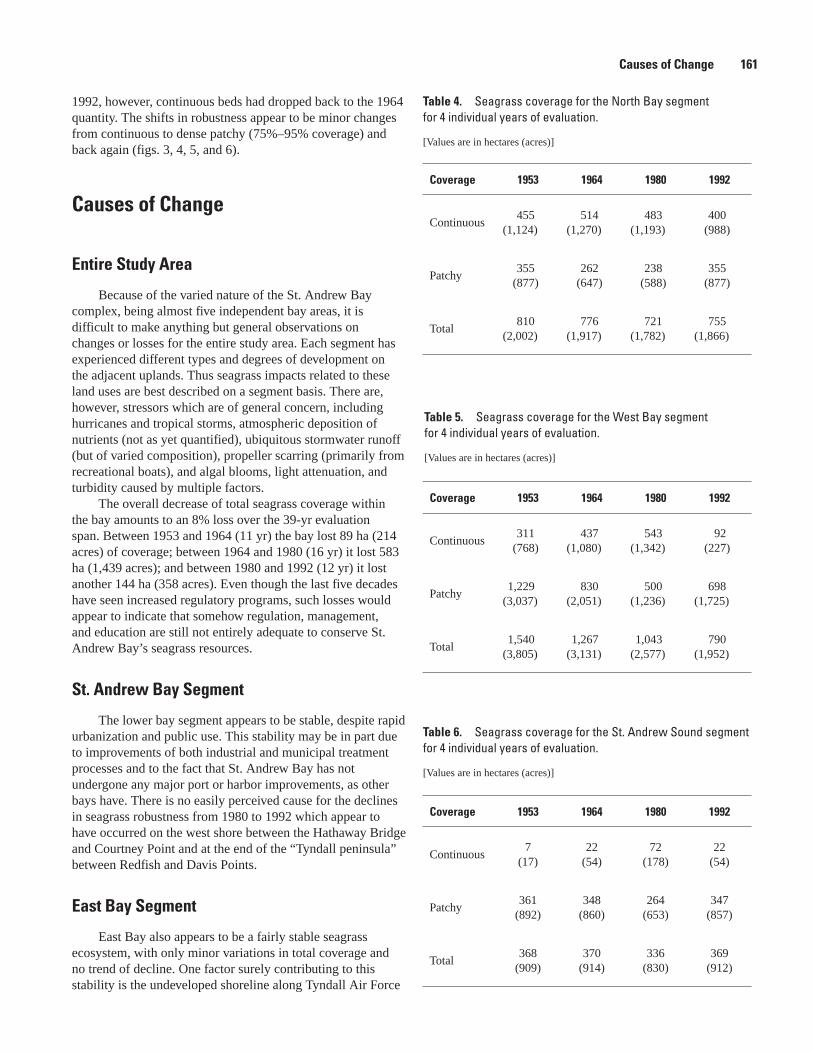
As of 1992, the study area contained 1,710 ha (4,225 acres) of continuous beds and 2,269 ha (5,607 acres) of patchy beds (table 1). Table 1 reveals a trend which ends with a total loss (of both types of coverage) amounting to 816 ha (2,011 acres) between 1953 and 1992, an 8% decrease. Furthermore, between 1980 and 1992, the system experienced a 592-ha (1,463-acre) loss of continuous coverage, while patchy coverage increased by 448 ha (1,107 acres). Both the areal extent and the robustness of the seagrasses in the study area have declined significantly.
St. Andrew Bay Segment
The St. Andrew Bay segment comprises 10,607 surface hectares (26,210 acres). Table 2 reveals the same general trend of seagrass areal loss and robustness in the St. Andrew Bay segment as that which is typical for the overall study area.
While total seagrass coverage is almost the same for 1953 and 1992, there was a loss of about 102 ha (250 acres) of total coverage between 1964 and 1992. Also, the decline Fi
gure
2.
Scop
e of
are
a fo
r the
St.
Andr
ew B
ay v
igne
tte.
Status and Trends 159

in seagrass robustness between 1980 and 1992 amounted to a loss of nearly 157 ha (400 acres) of continuous beds. In that same period, a total loss of 63 ha (157 acres) of any type of coverage occurred.
Specifically, conditions appear to have improved in the beds behind Shell Island but have declined along the west shoreline south of the Hathaway Bridge, from the bridge to Courtney Point, and also along the shoreline from Redfish Point to Davis Point. Most of this change appears to have occurred between 1980 and 1992.
East Bay Segment
The East Bay segment comprises 7,551 surface hectares (18,659 acres). This segment appears to have experienced an increase in overall bed robustness from 263 ha (650 acres) of continuous-type coverage in 1953 to 660 ha (1,631 acres) in 1992 (table 3). In that same period, the total coverage of seagrass (both coverage types) has remained nearly unchanged.
North Bay Segment
The North Bay segment comprises 2,702 surface hectares (6,677 acres). The seagrasses in this segment have declined in total coverage from 1953 to 1992 by 55 ha (134 acres) (table 4). This decline appears to be due to a shift in robustness, with continuous beds declining from 455 ha (1,123 acres) in 1953 to 400 ha (988 acres) by 1992. Patchy coverage, at 355 ha (877 acres), is identical for those same two years. Most of the decline was lowest in 1980, with some recovery by 1992.
West Bay Segment
The West Bay segment comprises 7,113 surface hectares (17,576 acres). This segment has suffered the greatest seagrass loss in the St. Andrew Bay system (table 5). Continuous beds, which peaked in 1980 at 543 ha (1,343 acres), dropped to just 92 ha (227 acres) by 1992, an 83% decline in 12 yr. Patchy beds, which peaked in 1953 at 1,229 ha (3,037 acres), steadily declined to a 1992 total of 698 ha (1,725 acres), a 43% decline. Total loss of seagrass coverage (both categories) occurred in a steady downward trend, with a net loss of seagrass coverage between 1953 and 1992 of 750 ha (1,853 acres).
St. Andrew Sound Segment
The St. Andrew Sound segment comprises 1,905 surface hectares (4,707 acres). Seagrass coverage in this segment has not varied much over the 39-yr study span (table 6). Total coverage has ranged from a minimum of 336 ha (832 acres) to a maximum 370 ha (914 acres). The most notable shift appears to be a peak in seagrass robustness, with a tripling of the occurrence of continuous beds from 1964 to 1980. By
Coverage 1953 1964 1980 1992
Continuous263
(650)643
(1,589)510
(1,260)660
(1,631)
Patchy778
(1,922)504
(1,245)403
(996)360
(890)
Total1,041
(2,572)1,147
(2,834)913
(2,256)1,020
(2,520)
Table 3. Seagrass coverage for the East Bay segment for 4 individual years of evaluation.
[Values are in hectares (acres)]
Coverage 1953 1964 1980 1992
Continuous491
(1,213)567
(1,401)693
(1,712)536
(1,324)
Patchy543
(1,342)580
(1,433)415
(1,025)509
(1,258)
Total1,034
(2,555)1,147
(2,834)1,108
(2,738)1,045
(2,582)
Table 2. Seagrass coverage for the St. Andrew Bay segment for 4 individual years of evaluation.
[Values are in hectares (acres)]
Coverage 1953 1964 1980 1992
Continuous1,527
(3,773)2,183
(5,394)2,302
(5,688)1,710
(4,225)
Patchy3,268
(8,075)2,523
(6,234)1,821
(4,500)2,269
(5,607)
Total 4,795 (11,848)
4,706 (11,629)
4,123 (10,190)
3,979 (9,832)
Table 1. Seagrass coverage for the entire St. Andrew Bay study area for 4 individual years of evaluation.
[Values are in hectares (acres)]
160 Seagrass Status and Trends in the Northern Gulf of Mexico: 1940–2002
Coverage 1953 1964 1980 1992
Continuous455
(1,124)514
(1,270)483
(1,193)400
(988)
Patchy355
(877)262
(647)238
(588)355
(877)
Total810
(2,002)776
(1,917)721
(1,782)755
(1,866)
Table 4. Seagrass coverage for the North Bay segment for 4 individual years of evaluation.
[Values are in hectares (acres)]
Coverage 1953 1964 1980 1992
Continuous311
(768)437
(1,080)543
(1,342)92
(227)
Patchy1,229
(3,037)830
(2,051)500
(1,236)698
(1,725)
Total1,540
(3,805)1,267
(3,131)1,043
(2,577)790
(1,952)
Table 5. Seagrass coverage for the West Bay segment for 4 individual years of evaluation.
[Values are in hectares (acres)]
Coverage 1953 1964 1980 1992
Continuous7
(17)22
(54)72
(178)22
(54)
Patchy361
(892)348
(860)264
(653)347
(857)
Total368
(909)370
(914)336
(830)369
(912)
Table 6. Seagrass coverage for the St. Andrew Sound segment for 4 individual years of evaluation.
[Values are in hectares (acres)]
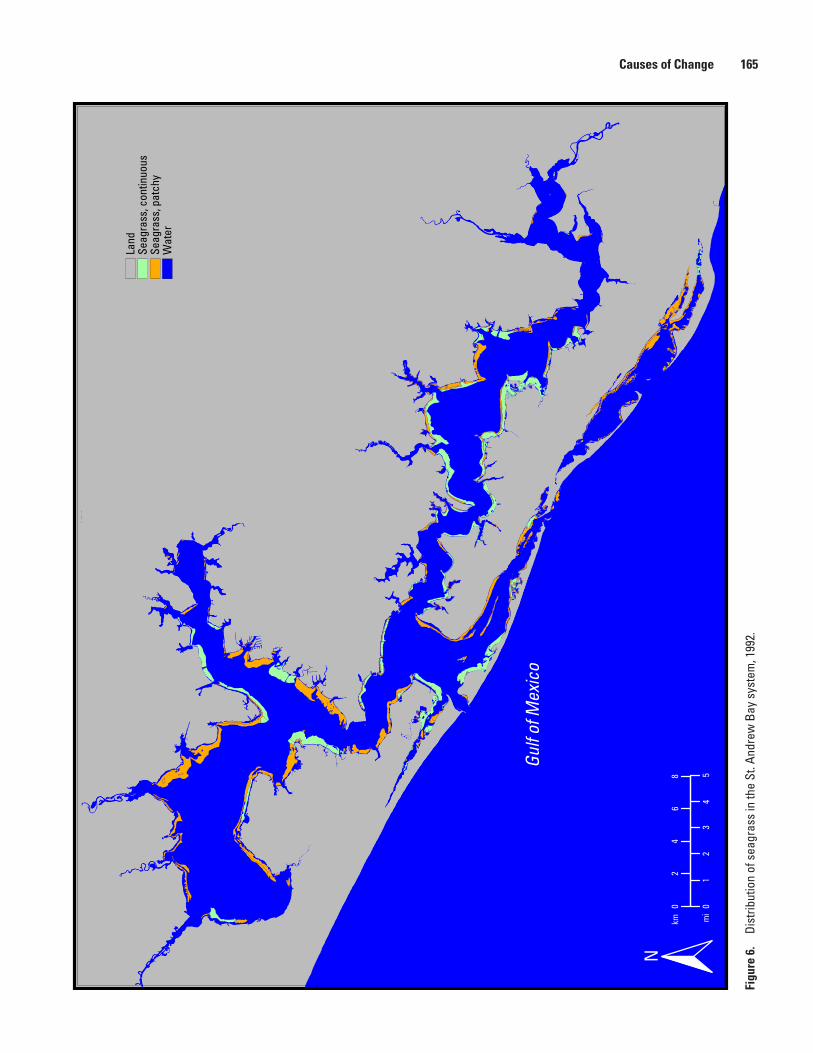
1992, however, continuous beds had dropped back to the 1964 quantity. The shifts in robustness appear to be minor changes from continuous to dense patchy (75%–95% coverage) and back again (figs. 3, 4, 5, and 6).
Causes of Change
Entire Study Area
Because of the varied nature of the St. Andrew Bay complex, being almost five independent bay areas, it is difficult to make anything but general observations on changes or losses for the entire study area. Each segment has experienced different types and degrees of development on the adjacent uplands. Thus seagrass impacts related to these land uses are best described on a segment basis. There are, however, stressors which are of general concern, including hurricanes and tropical storms, atmospheric deposition of nutrients (not as yet quantified), ubiquitous stormwater runoff (but of varied composition), propeller scarring (primarily from recreational boats), and algal blooms, light attenuation, and turbidity caused by multiple factors.
The overall decrease of total seagrass coverage within the bay amounts to an 8% loss over the 39-yr evaluation span. Between 1953 and 1964 (11 yr) the bay lost 89 ha (214 acres) of coverage; between 1964 and 1980 (16 yr) it lost 583 ha (1,439 acres); and between 1980 and 1992 (12 yr) it lost another 144 ha (358 acres). Even though the last five decades have seen increased regulatory programs, such losses would appear to indicate that somehow regulation, management, and education are still not entirely adequate to conserve St. Andrew Bay’s seagrass resources.
St. Andrew Bay Segment
The lower bay segment appears to be stable, despite rapid urbanization and public use. This stability may be in part due to improvements of both industrial and municipal treatment processes and to the fact that St. Andrew Bay has not undergone any major port or harbor improvements, as other bays have. There is no easily perceived cause for the declines in seagrass robustness from 1980 to 1992 which appear to have occurred on the west shore between the Hathaway Bridge and Courtney Point and at the end of the “Tyndall peninsula” between Redfish and Davis Points.
East Bay Segment
East Bay also appears to be a fairly stable seagrass ecosystem, with only minor variations in total coverage and no trend of decline. One factor surely contributing to this stability is the undeveloped shoreline along Tyndall Air Force
Causes of Change 161

Gulf
of M
exic
o
Wat
er
Seag
rass
, pat
chy
Seag
rass
, con
tinuo
us
Land
0km
01
23
45
m
i
N
24
68
Figu
re 3
. Di
strib
utio
n of
sea
gras
s in
the
St. A
ndre
w B
ay s
yste
m, 1
953.
162 Seagrass Status and Trends in the Northern Gulf of Mexico: 1940–2002

Gulf
of M
exic
o
N
Wat
erSe
agra
ss, p
atch
y Se
agra
ss, c
ontin
uous
La
nd
km mi
02
46
8
01
23
45
Figu
re 4
. Di
strib
utio
n of
sea
gras
s in
the
St. A
ndre
w B
ay s
yste
m, 1
964.
Causes of Change 163

Gulf
of M
exic
o
N
Wat
erSe
agra
ss, p
atch
y Se
agra
ss, c
ontin
uous
La
nd
km mi
02
46
8
01
23
45
Figu
re 5
. Di
strib
utio
n of
sea
gras
s in
the
St. A
ndre
w B
ay s
yste
m, 1
980.
164 Seagrass Status and Trends in the Northern Gulf of Mexico: 1940–2002
Gulf
of M
exic
o
N
Wat
erSe
agra
ss, p
atch
y Se
agra
ss, c
ontin
uous
La
nd
km mi
02
46
8
01
23
45
Figu
re 6
. Di
strib
utio
n of
sea
gras
s in
the
St. A
ndre
w B
ay s
yste
m, 1
992.
Causes of Change 165

Base covering almost all of the south shore of East Bay. Other factors include the relatively moderate urban development and a lack of any significant heavy industry on the north shore. Careful management of north shore development will be crucial to maintaining the seagrass resources of East Bay.
North Bay Segment
Most seagrass decline in this segment was along the south and southwest shorelines of North Bay where urban development has occurred.
From Little Oyster Bar Point southward to the Hathaway Bridge, seagrass abundance declined from continuous to patchy beds between 1964 and 1992 (see figs. 4–6). This is an area that was subject to the creation of numerous dead-end residential canals which can be seen in figure 6. In addition, a treated effluent discharge was once located south of Posten Bayou, but that point source has been removed and relocated to the lower bay, and effluent treatment levels improved. Only future seagrass monitoring will reveal whether or not any further decline in bed robustness has taken place since 1992.
Losses of beds and a decline in bed robustness can also be observed in North Bay along the south shore between the “Bailey” bridge and the dam at Deer Point Lake. The municipal sewage effluent once drained into Beatty Bayou and could have contributed undesirable nutrients to the bay. This outfall has since been relocated, treatment has been improved, and this possible source of seagrass stress has been eliminated. Other causes of seagrass decline along this shallow shore zone may include increased urban runoff associated with moderate to heavy urbanization in the Lynn Haven area.
West Bay Segment
In 1953, West Bay had a total coverage of 1,540 ha (3,805 acres); this segment lost 750 ha (1,312 acres) of seagrass by 1992, when total coverage had been reduced to just 790 ha (1,952 acres). The history of West Bay and the possible causes for these seagrass losses are complex and complicated. The losses are probably the result of cumulative stresses from several sources. These currently unquantified stresses can only be qualitatively described at this point; however, a restoration effort (described later in this vignette) may shed light on the most significant causes.
The first consideration within West Bay is the Gulf Intracoastal Waterway (GIWW). Over the last four decades, increased vessel traffic, larger vessels, and unstabilized banks may have adversely affected the West Bay system by transporting fine sediments and nutrients into the bay. West Bay is connected with Choctawhatchee Bay by a 29-km (18-mi) long GIWW land cut. At least one incident of complete blockage of the land cut occurred in September 1988 because of sediment runoff and accumulation. In addition, the hydrologic interaction between West Bay and Choctawhatchee Bay via the GIWW is not well defined. The
sometimes sediment-laden Choctawhatchee River enters the eastern end of Choctawhatchee Bay not far from the GIWW land cut leading to West Bay. The long-term hydrologic interactions and sediment exchange of this canal have not been clearly defined and quantified. The GIWW could be a source of stresses which may adversely affect seagrass health, even though the land cut connecting the two bays is many kilometers long.
In 1970, two events took place that may have significantly affected the welfare of seagrass beds in southern West Bay. In that year the State of Florida, the USACE, and the EPA issued permits for two separate major projects.
The permits for the first project were issued to the City of Panama City Beach for the discharge of treated municipal effluent into the bay. The city’s effluent enters the bay via a 1.6-km-long (1-mi-long) drainage ditch. Discharge commenced with an initial volume of about 9.5 million liters/day (2.5 million gallons/day). Although the treatment level of the effluent has been significantly improved since 1970, currently the permitted discharge volume to the bay is 26.5 million liters/day (7 million gallons/day). Plans by the city and regulatory agencies are in place to remove the discharge from the bay upon or before expiration of the current EPA National Pollutant Discharge Elimination System permit. Nutrients from this discharge, particularly during the 1970s, could have adversely affected seagrass growth by encouraging the excessive growth of epiphytic algae on the seagrass leaves or by stimulating excessive growth of light-blocking phytoplankton on the water surface above seagrass beds.
Permits for the second project were issued in 1970 to a company named Marifarms for a commercial shrimp-farming operation. A permit and lease allowed the netting-off of 1,012 ha (2,500 acres) of southern West Bay with a net made of mesh with holes less than 1 cm2 (0.4 inch2), the size required to confine raised shrimp to the leased area. The confining net was approximately 3 m (10 ft) in depth and 5,500 m (18,000 ft) in length (U.S. Army Corps of Engineers, 1970). To ensure confinement, two nets (with a combined total of 11,000 m (36,000 ft) of netting) were kept in place. The permit also allowed the removal of marine fishes within the netted area through the application of rotenone. Fish removal was necessary to prevent unwanted predation upon the shrimp crop. A complaint detailing and challenging the legalities of the Marifarms project was filed in the Circuit Court of the Second Judicial District on August 3, 1970, by the Organized Fishermen of Florida (Circuit Court of the Second Judicial District of Florida, 1970).
The Marifarms company operated from 1970 through 1975, when Hurricane Eloise tore out the netting, and the company subsequently went bankrupt. It was not until 1999, however, that it was discovered that the netting had been treated with an antifouling compound to keep it free of the growth of various marine organisms (algae, tunicates, hydroids, barnacles, etc.). In that year, the shrimp off-loading area and net-treatment location were rediscovered, and paint chips from the treatment operation were chemically analyzed.
166 Seagrass Status and Trends in the Northern Gulf of Mexico: 1940–2002

The 25-yr-old paint chips still contained nearly 3% copper and 0.2% organo-tin (Hemming and others, 2003).
The effects of continuous shrimp harvesting by trawl, chemical treatment of the nets, and removal of native fish species from the 1,012-ha (2,501-acre) shrimp grow-out area may all have had a significant adverse effect on seagrass survival.
Other potential causes of the West Bay seagrass losses could include less-than-optimal silviculture practices adjacent to the bay. Although residential development is still minimal along West Bay, future development plans are extensive and include the proposed relocation of the international airport to north of West Bay, between Crooked and Burnt Mill Creeks. For these reasons, extensive and careful management is being undertaken to protect and restore the seagrass beds of West Bay.
St. Andrew Sound Segment
The seagrass beds in St. Andrew Sound and their health have remained relatively stable over the 39-yr span of evaluation, probably because of the almost entirely encompassing presence of Tyndall Air Force Base. The shoreline around the sound has remained almost completely unaltered because of the Air Force presence and management.
The only noteworthy event within the sound during the span of study was Hurricane Eloise, which altered the area geologically and hydrologically. The storm and its surge effects have been documented by Burdin (1976). Prior to 1975, the entrance to the sound was an inlet at the northwest end, but in September 1975 the hurricane breached the 16-km-long (10-mi-long) barrier peninsula at its midpoint. Within 2 yr, the northwest inlet had closed. The present-day entrance is at the midpoint of the sound. This relocation of the inlet appears to have had some moderate effects on seagrass distribution.
Species InformationSeveral species of seagrasses occur within St. Andrew
Bay and St. Andrew Sound, and their presence has been reported regularly (Saloman and others, 1982; Florida Department of Natural Resources, 1991; Fonseca, 1994; Koenig and others, 1998).
The dominant seagrass species, undoubtedly providing the most valuable seagrass habitat, is turtle grass (Thalassia testudinum). This subtidal species grows to depths of 1.8–2.4 m (6–8 ft) mean low water in the southern bay areas near the gulf (St. Andrew Bay segment) and in St. Andrew Sound. Light penetration appears to limit maximum growth depths to 1.2–1.8 m (4–6 ft) in the interior bay segments.
The intertidal and subtidal species shoal grass (Halodule wrightii) dominates the shallow and intertidal bay areas. These beds are often exposed to the air in winter when north
winds create “wind tides” and push large amounts of water from the bay and in spring when the north winds combine with low tide conditions of the solunar spring tide. Manatee grass (Syringodium filiforme) can be found scattered within turtle grass beds, or sometimes in pure stands thriving near the influence of clear, highly saline water entering the bay from the gulf. While it is not a dominant species, it provides valuable diversity and cover where it is present. Wigeon grass (Ruppia maritima) occurs in some of the fresher parts of the bay, including areas of some bayous. Finally, the presence of star grass and paddle grass (Halophila spp.) has been noted, albeit rarely, amongst turtle grass beds of the southern bay.
Monitoring for Seagrass HealthThe St. Andrew Bay Resource Management Association,
in partnership with Gulf Coast Community College and the Florida Department of Environmental Protection, initiated in 2000 a seagrass monitoring program at three locations in the St. Andrew Bay estuarine system. Transects have been established at sites near Shell Island, in Grand Lagoon (both within the St. Andrew Bay segment), and in West Bay. Monitoring is accomplished in fall each year. Data collected include species composition, shoot density, percent cover, and canopy height. In addition, water-quality data, including turbidity and photosynthetically active radiation, are collected monthly at each site. The work is supported by a grant from the National Oceanic and Atmospheric Administration to the Florida Department of Community Affairs. Because the program is only 3 yr old, no trends regarding seagrass health, gains, or losses have yet been documented.
Mapping and Monitoring NeedsSeagrasses within the St. Andrew Bay system and
St. Andrew Sound have not been mapped since 1992. The ecosystem management plan developed by the St. Andrew Bay Environmental Study Team (Keppner and Keppner, 2001), however, includes an action plan (SG1) encouraging monitoring of seagrass beds by aerial photography and interpretation every 5 yr in partnership with the U.S. Fish and Wildlife Service. The action plan also encourages continuing the St. Andrew Bay Resource Management Association-Gulf Coast Community College seagrass monitoring program in the bay. New aerial photography for the Florida Panhandle was taken in October 2003, and the resulting maps and geographic information system data layers will be made available to agencies, participating conservation groups, and county and municipal government planning departments in 2005.
The other action plans (Keppner and Keppner, 2001) regarding seagrasses are discussed in the following section.
Mapping and Monitoring Needs 167

Restoration and Enhancement Opportunities
The Bay Environmental Study Team (BEST) for St. Andrew Bay is composed of all users of the bay including State, Federal, and municipal governments, industries, academic institutions, conservation organizations, commercial fishing interests, and the general public. BEST is structured very similar to the EPA National Estuary Program and serves a similar purpose for St. Andrew Bay.
The BEST ecosystem management plan for St. Andrew Bay includes other action plans, besides the previously explained SG1 (above), to protect and preserve seagrasses:
SG2, Protection of Seagrass Beds, calls for pursuit of additional State, Federal, and local legislation that would provide additional protection for the seagrass beds in the St. Andrew Bay ecosystem. The action plan will also include actions on the bay such as the placement of marker buoys and channel markers to reduce propeller scarring in seagrass beds.
SG3, Restoration of Lost or Damaged Seagrass Beds (anywhere within the bay), includes work for inventorying all of the bay, identifying areas of loss, and designing and imple menting restoration at any sites where such action is appropriate.
SG4, Restoration of Seagrass Loss in West Bay, is aimed at the restoration of the lost West Bay seagrass beds. Currently BEST is the project sponsor for this USACE Aquatic Ecosystem Restoration Project (under the authority provided by section 206 of the Water Resources Development Act of 1996). The project was initially evaluated by the Mobile District Corps of Engineers in 2001. In spring 2002, the Preliminary Restoration Plan was completed (U.S. Army Corps of Engineers, 2002). To date, the scope of work is being developed for the Ecosystem Restoration Report, a study which should provide critical information regarding seagrass stressors and their elimination, as well as an optimal strategy for reestablishing seagrass beds.
SG5, Education About the Significance of Seagrass Meadows in the Ecosystem, involves (1) the production of an underwater video depicting the importance of seagrass meadows, (2) the production of a video about seagrass monitoring, (3) distribution of “A Boater’s Guide to St. Andrew Bay,” (4) placement of educational signs at boat ramps, and (5) the development of an educational display about seagrasses for use at conservation meetings and other public gatherings.
•
•
•
•
SG6, Innovative Pier and Dock Construction, is aimed at developing and encouraging the use of pier and dock materials and designs which encourage seagrass growth beneath them, are minimally disruptive to seagrasses, and are created of materials that are chemically compatible (nontoxic) with seagrasses or estuarine organisms.
References Cited
Barkuloo, J.M., 1963, Fish management plans and proposals for North Bay freshwater reservoir, Bay County, Florida: Florida Game and Fresh Water Fish Commission, internal report.
Beck, M.W., Odaya, M., Bachant, J.J., Keller, B., Martin, R., Mathews, C., and Ramseur, P.G., 2000, Identification of priority sites for conservation in the northern Gulf of Mexico: an ecoregional plan: Arlington, Va., The Nature Conservancy, 49 p.
Brim, M.S., 1998, Environmental contaminants evaluation of St. Andrew Bay, Florida: Panama City, Fla., U.S. Fish and Wildlife Service, Panama City Field Office, publication no. PCFO-EC 98-01, 3 v.
Burdin, W.W., 1976, Surge effects from Hurricane Eloise. Proceedings—Mississippi Water Resources Conference, 1976: Mississippi State University, Water Resources Institute.
Circuit Court of the Second Judicial District of Florida, 1970, Complaint filed by the Organized Fishermen of Florida regarding the activities of Marifarms, Inc. in West Bay, St. Andrew Bay, Bay County, Florida.
Fernald, E.A., and Purdum, E.D., eds., 1992, Atlas of Florida: University Presses Florida, Institute of Science and Public Affairs, 280 p.
Florida Department of Natural Resources, 1991, St. Andrews State Park—aquatic preserve management plan.
Fonseca, M.S., 1994, A guide to planting seagrasses in the Gulf of Mexico: Texas A & M University Sea Grant College Program, TAMU-SG-94-601.
Hemming, J.M., Brim, M., and Jarvis, R., 2003, Water quality survey report for potential seagrass restoration in West Bay of the St. Andrew Bay system in northwest Florida: Panama City, Fla., U.S. Fish and Wildlife Service, Panama City Field Office, publication no. PCFO-EC 03-01.
•
168 Seagrass Status and Trends in the Northern Gulf of Mexico: 1940–2002

Hydroqual, Inc., and Barry A. Vittor and Associates, Inc., 1993, Environmental studies in St. Andrew Bay, Florida. May, 1993: Mahwah, N.J.
Keppner, E.J., 2002, An inventory of the biological resources reported from the St. Andrew Bay estuarine system, Bay County, Florida. A revision: St. Andrew Bay Environmental Study Team, Inc., February 2002.
Keppner, E.J. and Keppner, L.A., 2001, The St. Andrew Bay ecosystem, our environment. A revision of “a look to the future”: St. Andrew Bay Environmental Study Team (BEST) publication #0004, vii + 90 p.
Koenig, C., Ruckelshaus, M., and Coleman, F., 1998, Seagrass habitat quality: criteria for the management of economically important finfishes of the northwest coast of Florida: Florida State University, Department of Biological Sciences, report for the Florida Department of Environmental Protection.
McNulty, J.K., Lindall, W.N., and Sykes, J.E., 1972, Cooperative Gulf of Mexico estuarine inventory and study, Florida: phase I, area description: National Oceanic and Atmospheric Administration, technical report, National Marine Fisheries Service, CIRC-368.
Northwest Florida Water Management District, 2000, St. Andrew Bay watershed: Surface Water Improvement and Management (SWIM) plan, September 2000, program development series 00-2, 151 p.
Saloman, C.H., Naughton, S.P., and Taylor, J.L., 1982, Benthic faunal assemblages of shallow water sand and seagrass habitats, St. Andrew Bay, Florida: Panama City, Fla., U.S. Fish and Wildlife Service, Division of Ecological Services, 565 p.
U.S. Army Corps of Engineers, 1970, February 18, 1970, letter (and enclosed permit) sent to Marifarms, Inc., P.O. Box 2414, Panama City, Florida, from Robert E. Snetzer, Colonel and District Engineer, U.S. Army Corps of Engineers, Mobile, Ala.
U.S. Army Corps of Engineers, 1994, A general investigation of St. Andrew Bay, Florida: Prepared for U.S. Army Engineer District, Mobile, Ala., Waterways Experiment Station, Coastal Ecology Branch Environmental Laboratory.
U.S. Army Corps of Engineers, 2002, Preliminary restoration plan, West Bay aquatic ecosystem restoration project, Bay County, Florida: U.S. Army Corps of Engineers, Mobile District.
U.S. Census Bureau, 2002, American FactFinder, http://factfinder.census.gov.
U.S. Geological Survey, 1990, Water resources data, Florida, v. 4, Northwest Florida: Report FL-90-4.
West, G.M., 1960, St. Andrews, Florida: historical notes upon St. Andrews and St. Andrews Bay (3d ed.): St. Andrews, Fla., Panama City Publishing Company.
Wolfe, S.H., Reidenauer, J.A., and Means, D.B., 1988, An ecological characterization of the Florida Panhandle: New Orleans, La., U.S. Department of the Interior, U.S. Fish and Wildlife Service, Minerals Management Service, USFWS Biological Report 88(12), OCS Study MMS 88-063, 277 p.
Young, W.T., Butts, G.L., Donelan, L.W., and Ray, D.H., 1987, Biological and physico-chemical assessment of St. Andrew Bay estuaries 1986–1987: Florida Department of Environmental Regulation, Northwest District, Biology Section, special monitoring project basin survey, 24 p.
References Cited 169