Transportation Impacts - Welcome to MassDOT
56
Transportation Impacts of the Massachusetts Turnpike Authority and the Central Artery/Third Harbor Tunnel Project Volume I February 2006 After Before
Transcript of Transportation Impacts - Welcome to MassDOT
Transportation Impacts of the
Massachusetts Turnpike Authority and the
Central Artery/Third Harbor Tunnel Project
Volume I February 2006
After
Before

IFC
EEccoonnoommiicc IImmppaacctt ooff tthhee MMaassssaacchhuusseettttssTTuurrnnppiikkee AAuutthhoorriittyy && RReellaatteedd PPrroojjeeccttss
VVoolluummee II::
TThhee TTuurrnnppiikkee AAuutthhoorriittyy aass aa TTrraannssppoorrttaattiioonn PPrroovviiddeerr
Prepared for:
MMaassssaacchhuusseettttss TTuurrnnppiikkee AAuutthhoorriittyy10 Park Plaza, Suite 4160, Boston, MA 02116
Prepared by:
EEccoonnoommiicc DDeevveellooppmmeenntt RReesseeaarrcchh GGrroouupp,, IInncc..2 Oliver Street, 9th Floor, Boston, MA 02109
Table of Contents
Table of Contents Preface ......................................................................................................................... i
Summary of Volume I Findings................................................................................... i
Introduction ................................................................................................................ 1 1.1 Analysis Methodology............................................................................................1 1.4 Organization of the Report .....................................................................................2
Overview of Projects................................................................................................... 3 2.1 I-93 Central Artery Projects ...................................................................................3 2.2 I-90 Turnpike Extension to Logan Airport.............................................................5 2.3 New Public Safety Services for Boston Area Highways........................................6 2.4 I-90 Improvements West of Route 128 ..................................................................6 2.5 Other Services ........................................................................................................8
Highway Projects & Facilities in Boston .................................................................... 9 3.1 Methodology for Measuring Economic Benefits ...................................................9 3.2 Interstate-93 Central Artery..................................................................................10 3.3 Interstate-90 / Massachusetts Turnpike Extension ...............................................12 3.4 Harbor Crossings: Callahan, Sumner and Ted Williams Tunnels........................15 3.5 Storrow Drive and Charles River Crossings ........................................................19 3.6 Summary of Downtown Traffic Changes.............................................................20 3.7 Fast Lane Program – Boston Region....................................................................25 3.8 Emergency Response............................................................................................25
Highway Projects and Facilities Outside of Boston .................................................. 27 4.1 Traffic Levels .......................................................................................................28 4.2 New Interchange 10A...........................................................................................29 4.3 Traveler Information Services ..............................................................................29 4.4 Service Plazas.......................................................................................................30 4.5 Fast Lane Program – Western Turnpike...............................................................33
The MTA as an Employer and Contractor ................................................................ 34 5.1 Definitions and Methodology...............................................................................34 5.2 MTA Revenue & Expense Overview...................................................................35 5.3 MTA and Turnpike Employment and Payroll......................................................36 5.4 Vendors of Supplies and Services ........................................................................37 5.5 Effects On The Massachusetts Economy .............................................................39 5.6 Tax and Other Non-toll Revenues Generated.......................................................41
Acknowledgements................................................................................................... 43
Table of Contents
List of Tables Table 3-1. Changes in Volumes & Times: Central Artery ............................................... 11 Table 3-2. Change in Volumes & Times Between Airport and I-90/I-93 Junction.......... 13 Table 3-3. Changes in Total Daily Volumes: Harbor Tunnels to Airport ........................ 17 Table 3-4. Changes in Peak Hour Volumes & Times: Harbor Tunnels to Airport .......... 18 Table 3-5. Changes in Vehicle-Miles and Vehicle-Hours of Travel ................................ 21 Table 3-6. Comparison of VHT Changes with Original Projections................................ 22 Table 3-7. Change in Value of Time and Operating Cost ................................................ 24 Table 3-8. Use of Transponders at Facilities of the Metropolitan Highway System....... 25 Table 3-9. Emergency Stations and Platforms Profile...................................................... 26 Table 4-1. Growth in Turnpike Traffic Levels : 1994 – 2003 ......................................... 28 Table 4-2. Visitor Information Center Customer Growth: 1994 – 2003 .......................... 29 Table 4-3. Service Plaza Locations and Tenants ............................................................. 31 Table 4-4. Service Plazas Sales Revenue: 1994 & 2003 .................................................. 33 Table 5-1: MTA and Service Plazas: Direct Employment & Payroll (as of 2003) ......... 36 Table 5-2. MTA Ongoing and Turnpike Startup Expenditures ........................................ 37 Table 5-3. Breakdown of MTA Non-Capital Expenses.................................................... 38 Table 5-4. Breakdown of MTA Capital Expenses............................................................ 38 Table 5-5. Impacts on the Mass. Economy from MTA Vendor Purchases ...................... 39 Table 5-6. Impacts on the Mass. Economy from Respending of Worker Income............ 40 Table 5-7. Total Economic Impact of the MTA and Related Facilities............................ 40 Table 5-8. State/Local Government Tax Impacts Generated by MTA Operations .......... 41
List of Figures Figure 2-1. Central Artery/Tunnel Projects ........................................................................ 4 Figure 3-1. Extended Area Within 40 Minutes Of Logan Airport* ................................. 15 Figure 4-1. Map of Massachusetts Turnpike Interchanges............................................... 27 Figure 4-2. Map of Turnpike Visitor Information and Service Plazas ............................. 30 Figure 4-3. Growth in MTA Rents from Tenants at Service Centers............................... 32 Figure 5-1. Breakdown of MTA Revenue ........................................................................ 35 Figure 5-2. Massachusetts Jobs Generated by MTA ........................................................ 41
Preface
The Economic Impact of the Massachusetts Turnpike Authority p-i
PREFACE The Massachusetts Turnpike Authority was created by 1952 legislation in order to oversee the construction, operation and maintenance of an express toll highway running east-west between the New York state line and the Boston area. The original Turnpike opened in 1957, consisting of a 123-mile toll way between the New York state line and the Route 128 beltway. It was designated as I-90 in the Interstate Highway System. The Turnpike’s 12-mile “Boston Extension” continued the route from Route 128 (now also known as I-95) to downtown Boston. That extension was opened in two stages -- to the Allston-Brighton toll plaza in 1964, and to I-93 downtown in 1965. A final 3-mile continuation of the Turnpike’s Boston Extension across Boston Harbor (via the Ted Williams Tunnel) to Logan Airport and Route 1A opened in 2003. In 1958, the Authority was authorized to acquire the Sumner Tunnel (constructed in 1934) from the City of Boston as well as to construct and operate a parallel Callahan Tunnel. The twin tunnels began joint operation in 1962. In 1997, the Metropolitan Highway System (MHS) law gave the Turnpike Authority a new set of responsibilities. The MHS was defined to include major highway facilities within the Route 128 belt – including the 15-mile Boston Extension of I-90 between Route 128/I-95 and Route 1A in East Boston (including the Ted Williams Tunnel and Fort Point Channel Tunnel), the Sumner and Callahan tunnels, the I-93 Central Artery project (including the Zakim Bunker Hill Bridge and Storrow Drive Connector Bridge), the Central Artery North Area (City Square tunnel) and other connecting Central Artery facilities. The law divided the Turnpike Authority into two parts: the original 123-mile Turnpike (referred to as the “Western Turnpike” and the MHS. Today, the Turnpike Authority operates the Western Turnpike and the MHS as two independent and financially self-sustaining road systems. Once completed, all facilities completed as part of the Central Artery project will officially become part of the Massachusetts Turnpike Authority’s MHS. A year earlier, in 1996, the Turnpike Authority issued a study authored by the Donahue Institute and University of Massachusetts Transportation Center that analyzed the economic impact of the agency and its highway facilities. Many changes have occurred in the nine years since that report, including extension of the I-90 Turnpike across Boston Harbor to Logan Airport, near completion of the I-93 Central Artery project (that is now operated by the MTA), and a wide variety of safety improvements made to the Turnpike and to Boston highways under the jurisdiction of the MTA. Given the nature of these changes, the Authority commissioned Economic Development Research Group, Inc. of Boston to assess the magnitude of economic impacts associated with the Turnpike and these projects. This report has two volumes. Volume I describes the economic impact of the MTA as a transportation provider. This analysis includes the economic impacts of the Turnpike
Preface
The Economic Impact of the Massachusetts Turnpike Authority p-ii
west of Boston and the impacts due to new transportation infrastructure and services in the city from Central Artery/Third Harbor Tunnel projects, known collectively as the “Big Dig,” and ensuing changes of traffic volumes, traffic patterns and travel efficiencies. In addition, Volume I considers the contribution to the Massachusetts’ economy of Turnpike Authority as a business enterprise. Volume II describes the physical transformation of Boston as a result of transportation improvements, beginning with the 10-mile extension of the Turnpike from Route 128 into Boston’s Back Bay and ending with the “Big Dig.” The original Turnpike extension was built in the early 1960s and was intertwined with air rights development of the Prudential Center, which later led to the development of Copley Place and Back Bay as a high-end shopping, hotel, dining and office district. Volume II reviews this history and discusses parallels to current conditions 40 years later, removal of the elevated Central Artery has opened up the long-suppressed development potential of Boston’s waterfront as well as the Rose Fitzgerald Kennedy Greenway above the depressed highway, and is creating demand for office and residential development with waterfront views. The facilities that are the subject of this analysis were funded by federal transportation funds, the Commonwealth of Massachusetts, as well as by users of the Turnpike and related facilities though tolls. The Turnpike Authority is the final custodian of the Central Artery/Third Harbor Tunnel projects.
Summary of Findings: Volume I
The Economic Impact of the Massachusetts Turnpike Authority s-i
SUMMARY OF VOLUME I FINDINGS The Massachusetts Turnpike Authority (MTA) has taken on a wide range of responsibilities over time. The MTA was created by 1952 legislation to oversee construction and operation of a 123-mile tollway (I-90) between the New York state line and the Boston area. Subsequently, the state legislature designated the MTA to take over operation of the Sumner and Callahan Tunnels under Boston Harbor, extension of I-90 between Route 128/I-95 and East Boston (including the new Ted Williams and Fort Point Channel Tunnels), the I-93 Central Artery Project (including the Leonard P. Zakim Bunker Hill Bridge and Storrow Drive Connector), the Central Artery North Area (City Square Tunnel) and other connecting Central Artery facilities. Overtime, the Turnpike Authority has also come to take on responsibilities for development of emergency response stations, tourism information facilities, fiber optic trunk lines, parks development and urban development projects on parcels and corridors that it controls. This report identifies and evaluates the ways in which the economy of Boston, its suburbs, communities throughout the state and the entire state have been affected by the various facilities and services that the MTA manages and operates. It does not address benefit/cost issues. Key findings include the following: 1. For travelers to/from downtown Boston, there have been significant changes in traffic patterns, vehicle mileage and travel times as a result of the near completion of the Central Artery/Tunnel project.
• The new underground I-93 Central Artery, together with the I-90 Turnpike extension through the Ted Williams Tunnel, has dramatically improved peak period travel times through downtown Boston. For instance, the average afternoon peak hour northbound travel time on I-93 through downtown has dropped from 19.5 minutes to 2.8 minutes. Altogether, the actual reductions in travel times are consistent with projected travel time improvements forecast back in 1990 for a Supplemental Final Environmental Impact Statement.
• These improvements are now providing approximately $168 million annually in time and cost savings for travelers. This includes $25 million of savings in vehicle operating cost plus a value of $143 million of time savings. Slightly over half of that time savings value ($73 million) is for work-related trips, and can be viewed as a reduction in the costs of doing business in Boston.
• MTA has implemented six emergency response stations for Boston highways, which will serve to further reduce delays.
• The “Fast Lane” automated vehicle identification program has also sped up toll payments for many travelers on the Turnpike Extension and Sumner or Williams tunnels to Boston. Its use has now exceeded 36.8 million payments a year on MTA facilities inside Route 128.
Summary of Findings: Volume I
The Economic Impact of the Massachusetts Turnpike Authority s-ii
2. For Massachusetts residents living south or west of Boston, there has been a significant reduction in travel time to Logan Airport as a result of the now complete I-90 extension through the Ted Williams Tunnel to East Boston.
• Average travel times from the I-90/93 interchange to Logan Airport during peak periods have decreased between 42% and 74%, depending on direction and time of day. For instance, average travel times to the airport during the afternoon peak decreased from an average of 16 minutes to 4 minutes. However, the effective time savings for many travelers has been far greater, since travel times had formerly varied widely from 10 to 25 minutes, requiring travelers to leave earlier to allow for the possibility of the longer travel time.
• The opening of the Turnpike Extension to Logan Airport has added 800,000 residents to the previous total of 1.7 million who can access the airport within a 40-minute drive of their home.
3. For residents of Central and Western Massachusetts, the rebuilding and expansion of MTA service plazas and interchanges are also benefiting travelers.
• The “Western Turnpike” (west of Route 128) has been serving an increasing volume of travelers – now 101 million trips a year, up 38% since 1994.
• The expansion and reconstruction of all 11 service plazas has led to expanded use of those facilities. They now serve 10.6 million customers annually and generate business sales more than double (126% greater) than that occurring in 1994 (after adjusting for inflation).
• The new Interchange 10A at Rt. 146 in the Millbury/Worcester area now serves over 2.7 million trips per year, and saves its users over $2 million per year in vehicle operating costs.
• The upgraded tourism information centers on the Massachusetts Turnpike now serve over 616,000 customers annually, up from around 503,000 in 1994. The centers provide information on tourism attractions sites to visit, though no information is available on the exact dollar value of the additional tourist spending that they help to generate.
• The “Fast Lane” automated vehicle identification program has also sped up toll payments for roughly half of travelers on the Turnpike west of Route 128. Its use now exceeds 49.6 million payments a year on that portion of the Turnpike.
4. For residents of Massachusetts, MTA operations and capital investments are supporting jobs and business activity in the state.
• The MTA has developed an underground corridor across Massachusetts for inter-state “fiber optic” trunk lines, used for high speed telecommunications. The MTA collects $3.5 million annually for leasing its corridor to four telecom companies. These lines are expected to become increasingly important in the future to support the growth of technology industries in Massachusetts.
Summary of Findings: Volume I
The Economic Impact of the Massachusetts Turnpike Authority s-iii
• Operations of the MTA and its traveler service plazas directly provide 3,565 jobs. Adding in MTA vendor purchases and respending of worker income leads to a total of $514 million of business activity throughout the Massachusetts economy, including $224 million of wages supporting an estimated 6,089 jobs in Massachusetts.1
Altogether, these findings indicate that the MTA operations, facilities and project investments are having a broad range of travel and economic impacts for residents across the Commonwealth of Massachusetts. Many of these impacts are still unfolding.
1 Service plazas are made available as a convenience to travelers on the Turnpike, and the convenience
factor, as well as the recent expansion of all 11 plazas, These figures represent travelers likely increases the amount that otherwise would require diversions from
the highway. Also, these consumer purchases are a direct result of east-west travel on the Turnpike.
Introduction
The Economic Impact of the Massachusetts Turnpike Authority 1
INTRODUCTION
1.1 Analysis Methodology This report examines three types of economic and non-economic impacts related to the MTA, its facilities and projects. Each involves a different methodology and interpretation: • Breadth of Programs and Projects: Use and Benefits -- Over the last eight years, a
number of highway-related projects have been implemented under the jurisdiction of the MTA. These include not only new and expanded highway facilities, but also safety improvements, traveler information facilities and traveler services. The study team worked with MTA staff to compile information on the nature of these projects, their scale or size, and the extent to which they are being implemented to benefit travelers or are being used by travelers.
• Economic Benefit of Highway System Expansion and Improvement – Over the last
eight years, new highway system facilities have been constructed as part of the Central Artery/Tunnel Project, which comprise an upgraded Metropolitan Highway System. To evaluate the economic benefit of these highway improvements to travelers, the study team worked with staff of the Massachusetts Highway Department (MHD) as well as the MTA to compile information on changes in traffic volume, travel speeds and mileage. Measures of change in total Vehicle-Miles of Travel (VMT) and Vehicle-Hours of Travel (VHT) were then translated into annual labor and expense cost savings for the businesses and households.
• Economic Contribution of the MTA – The MTA as an organization provides income
for its employees and also spends money supporting a wide range of vendor and supplier businesses. The study team, working with MTA staff, compiled information to profile the nature of the MTA budget and the various elements of payroll and vendor expenses. An economic model of the Massachusetts economy (IMPLAN input-output model) was then applied to estimate the extent to which businesses and jobs in other industries within the state are also supported by these activities. This information is presented to provide an understanding of how the MTA activities affect the economy; it is not intended to represent impacts associated with any hypothetical proposals to expand or contract future responsibilities of the MTA.
Note that the economic magnitude of land and air rights development projects are examined in Volume II of this study.
1
Introduction
The Economic Impact of the Massachusetts Turnpike Authority 2
1.4 Organization of the Report This Volume is organized into five chapters. Chapter One provides an introduction and overview. Chapter Two then provides a summary of the various highway related projects and programs that have been initiated or completed within the past eight years. Chapters Three and Four describe the most important projects and programs that have been implemented in Boston and elsewhere in Massachusetts. Chapter Three provides a detailed analysis of changes in traffic patterns and travel times in downtown Boston since the opening of major parts of the Central Artery/Tunnel Project. Chapter Four then provides a profile of the magnitude of use for new programs and upgraded facilities and services along the Turnpike outside of the Boston area. Finally, Chapter Five presents an analysis of the jobs, income and business sales that are supported by MTA operations and capital investment, and their effects on suppliers of products and services throughout the Massachusetts economy. The consequences for tax revenues are also identified. It is important to note that there are likely to be additional public safety benefits (accident reduction) and environmental benefits (air pollution emissions reduction) accruing from the major highway system improvements in downtown Boston. Both of these issues are currently the subject of ongoing analysis efforts. Those results will become available to the public in months ahead.
Overview of Projects & Facilities
The Economic Impact of the Massachusetts Turnpike Authority 3
OVERVIEW OF PROJECTS Since completion of the 1996 report on economic impacts of the Massachusetts Turnpike Authority (MTA), there have been many improvements and changes made to the Turnpike (I-90) and the MTA’s jurisdiction has been broadened to encompass projects and facilities comprising Boston’s “Metropolitan Highway System” (MHS), including the Central Artery and harbor tunnels. This section gives a brief description of the nature of the various projects conducted over the 1996-2004 period, which are now under MTA management.
2.1 I-93 Central Artery Projects The I-93 Central Artery improvements include: 1) the replacement of the deteriorating elevated Central Artery (I-93) with an underground expressway (new eight to ten-lane underground I-93 in downtown Boston); 2) the Leonard P. Zakim Bunker Hill Bridge; 3) the Storrow Drive Connector Bridge; and 4) a surface restoration and beautification program. See Figure 2-1 on the next page. I-93 Central Artery The Central Artery (Fitzgerald Expressway) was built in 1954 as a 1.7 mile, 6-lane expressway through downtown Boston. The elevated structure was demolished in 2004, after being replaced by a new 8-10 lane underground highway, featuring a pair of 1.5 mile tunnels. The underground tunnels carry I-93 as deep as 120 ft below the surface through one of the most congested parts of Boston. A new underground northbound portion of the central corridor was opened in March 2003. Two additional northbound lanes, to carry traffic from the Sumner Tunnel and North End to the Zakim Bridge, were opened by March 2005. The new southbound portion of the central corridor had an interim opening (with the portion under Dewey Square only two lanes wide) in December 2003. Full opening of all southbound lanes (four to six lanes wide) occurred in March 2005. Leonard P. Zakim Bunker Hill Bridge The 1,432-foot Leonard P. Zakim Bunker Hill Bridge is the world’s widest cable-stayed bridge. The 10-lane, 180-foot wide bridge carries I-93 traffic from the Central Artery in downtown Boston across the Charles River, where it connects with both I-93 and US Route 1. In March 2003, the Zakim Bridge opened four lanes to northbound I-93 traffic. The southbound four lanes of the bridge, opened along with the southbound Central Artery tunnel, in December 2003. Two additional cantilevered lanes opened in May 2005 to accommodate northbound traffic from the Sumner Tunnel and North End.
2
Overview of Projects & Facilities
The Economic Impact of the Massachusetts Turnpike Authority 4
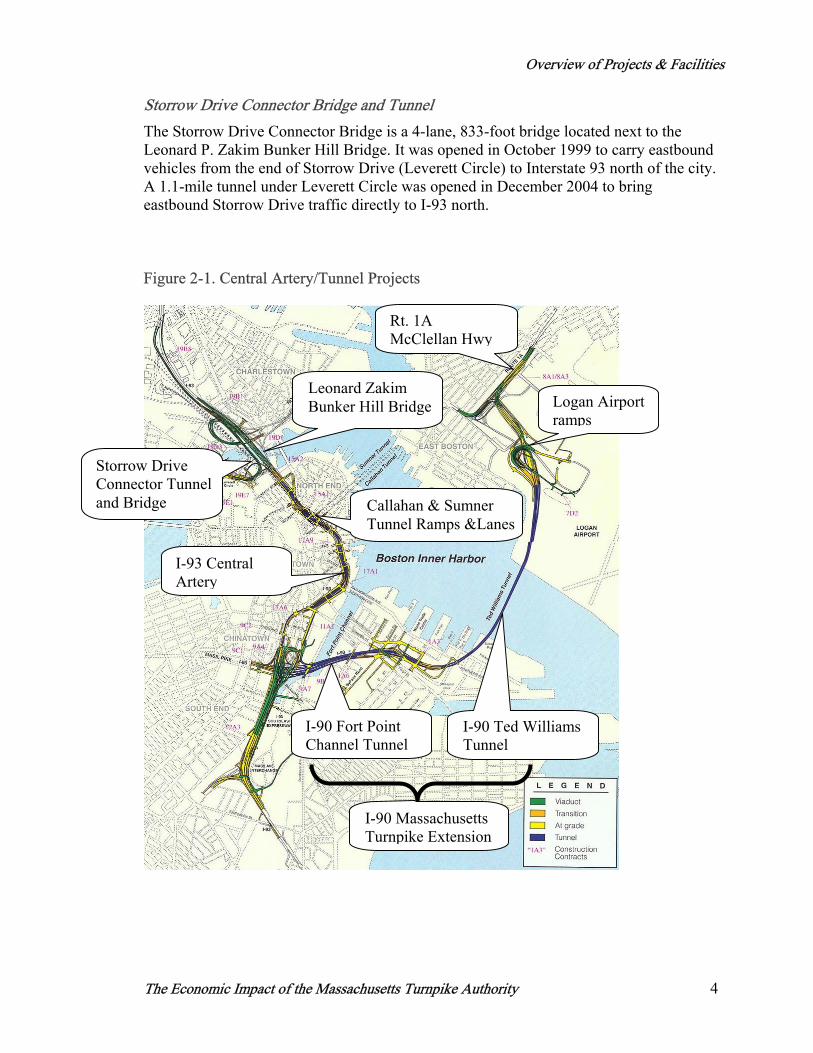
Storrow Drive Connector Bridge and Tunnel The Storrow Drive Connector Bridge is a 4-lane, 833-foot bridge located next to the Leonard P. Zakim Bunker Hill Bridge. It was opened in October 1999 to carry eastbound vehicles from the end of Storrow Drive (Leverett Circle) to Interstate 93 north of the city. A 1.1-mile tunnel under Leverett Circle was opened in December 2004 to bring eastbound Storrow Drive traffic directly to I-93 north. Figure 2-1. Central Artery/Tunnel Projects
I-93 Central Artery
Leonard Zakim Bunker Hill Bridge
Storrow Drive Connector Tunnel and Bridge
I-90 Fort Point Channel Tunnel
I-90 Ted Williams Tunnel
I-90 Massachusetts Turnpike Extension
Callahan & Sumner Tunnel Ramps &Lanes
Logan Airport ramps
Rt. 1A McClellan Hwy
Overview of Projects & Facilities
The Economic Impact of the Massachusetts Turnpike Authority 5
Surface Restoration and Beautification Demolition of the elevated highway has created 27 acres of new open space along the Central Artery Corridor. Three quarters of that new space will become parks and open space, with the rest dedicated to modest commercial and residential development. Over 150 acres of additional parks and open space are being created by the Central Artery/Tunnel Project in other locations as well, including 105 acres at Spectacle Island, 40 acres along the Charles River, the new Bremen Street Park, and 7 acres as part of an expanded Memorial Stadium Park in East Boston. The Massachusetts Turnpike Authority and the City of Boston have formed a partnership to work on park and open space development for these areas. The parks are discussed in more detail in Section 3.9 and land development is examined further in Chapter 5.
2.2 I-90 Turnpike Extension to Logan Airport The extension of I-90 to Logan International Airport includes two major projects: 1) a new connector tunnel under Fort Port Channel in South Boston, extending I-90 past the interchange with I-93 to a mostly underground interchange near the South Boston waterfront area, continuing to 2) the Ted Williams Tunnel, which goes under Boston Harbor, continuing the I-90 route to Logan Airport and US Route 1A (McClellan Highway). Fort Point Channel Crossing Fort Point Channel is a narrow extension of Boston Harbor into South Boston, located just east of the I-90/I-93 (South Bay) interchange. The Fort Point Channel Tunnel is a 4-lane tunnel and connecting ramp system extending the Massachusetts Turnpike for 1.4 miles under the Fort Point Channel and on to a new interchange at the South Boston waterfront/convention center area. In addition to the four lanes of mainline tunnel, the three major dedicated ramps are: from I-93 NB -Ramp L; from South Boston -Ramp D; and an HOV Ramp from South Bay with additional connecting off-ramps to I-93 and the South Bay interchange. Ted Williams Tunnel The Ted Williams Tunnel is a 2.0 mile continuation of the I-90 Massachusetts Turnpike route from South Boston, under Boston Harbor, to Logan Airport and Route 1A. The core portion of this route is an 8,500-foot-long 1.5 mile tunnel, of which three-quarters of a mile crosses under Boston Harbor. It was completed in December 1995. From December 1995 until January 2003, the Ted Williams Tunnel was only open to taxis, buses and commercial vehicles on weekdays, and open to all vehicles on weekends. The restrictions were lifted in January of 2003, when the Fort Point Channel tunnel was completed, linking the Ted Williams Tunnel with the rest of I-90.
Overview of Projects & Facilities
The Economic Impact of the Massachusetts Turnpike Authority 6
2.3 New Public Safety Services for Boston Area Highways The Massachusetts Turnpike Authority has overseen three new projects affecting the Metropolitan Highway System (MHS): 1) a new traffic incident monitoring facility, 2) new emergency response facilities, and 3) new safety barriers and lighting for the Turnpike from Route 128 to Boston. Traffic Incident Monitoring Facility As part of the Central Artery/Tunnel Project, an Operation Control Center (OCC) was built to monitor traffic in the I-90/I-93 system of tunnels, ramps, and surface highways in downtown Boston, as well as in the Sumner, Callahan, Prudential, and CANA (City Square) tunnels and on I-90 from Boston to Route 128. The OCC system utilizes more than 35,000 data collection points to manage traffic and incidents, fire detection and response, security, ventilation, lighting, and air quality. It includes over 430 closed-circuit, color, pan-tilt-zoom video cameras that will pinpoint the site, type, and severity of incidents, air quality detectors in 35 zones, and laser height detectors. Emergency Response Facilities An emergency response network consisting of 10 emergency response facilities, including six emergency stations and four emergency platforms has been planned to minimize disruptions to normal traffic operations on the I-90/I-93 underground highway routes in downtown Boston. The emergency response stations are operated 24 hours and seven days. The four emergency platforms are staffed during morning and evening peak hours on weekdays.
Turnpike Safety Upgrades During 2004, the Turnpike Authority completed a safety upgrade project along seven miles of the Turnpike between the Weston interchange and the Allston/Brighton interchange. This project involved replacing all of the central guardrails with new concrete median barriers which are designed to prevent cars from vaulting the median. It also involved replacing all of the wiring and lighting along this portion of the turnpike, to reduce nighttime glare from oncoming traffic.
2.4 I-90 Improvements West of Route 128 During the study period from 1996-2004, the Massachusetts Turnpike Authority has overseen three new projects affecting the 123-mile portion of the Turnpike between the New York state line and Route 128. These projects are: 1) a new interchange at Route 146 in Millbury, 2) rebuilding all 11 service plazas along the Turnpike Corridor, and 3) new noise barrier walls. In addition, the MTA has been funding three notable programs serving this area: 4) upgraded tourism information centers, 5) a local tourism grant program, and 6) a Park-N-Ride Program.
Overview of Projects & Facilities
The Economic Impact of the Massachusetts Turnpike Authority 7
New Interchange 10A In 1998, the Massachusetts Turnpike Authority completed a new $33 million interchange in Millbury, which provides a connection to Massachusetts Route 146 -- the Worcester-Providence Turnpike, which was itself upgraded to a freeway facility. Route 146 improvements by MHD, however are still underway. Service Plazas The Massachusetts Turnpike Authority entered into a long-term agreement with McDonald Corporation & Tosco/Conoco Phillips to demolish the outdated MTA service area facilities and design and construct 11 new full-service food and fuel facilities at a cost of over $24 million and at no cost to the MTA. The new service plaza facilities are larger and broader assortment of restaurants and amenities, including convenience stores. In calendar year 2003, the plazas served 10.6 million travelers2. Annually, the MTA also offers free space to Massachusetts farmers to sell their locally grown products at all 11 service plazas. Noise Barrier Program The MTA is in the process of installing noise barrier walls at strategic locations along the Turnpike Corridor between the New York state line and Route 128. The first installation of noise barriers was done in 2004 in Newton, Ludlow and Natick.. The next installation will bring barriers again to Newton, Ludlow and to Framingham. Tourist Information Centers Tourist information centers are located in three locations, one in Lee and two in Charlton (Eastbound and Westbound). In year 2003, over 616,000 Turnpike customers visited the tourist information centers. Approximately 250 different tourism-related companies advertise and feature their services at the three tourist information centers, generating nearly $40,000 of revenue for the MTA. Tourism Grant Program A tourism grant program was established by the Massachusetts Legislature and expanded in 1997 for eligible cities and towns along the Turnpike east of Route 128. The grant program supports local tourism projects in cities and towns along the Turnpike and contiguous to the Metropolitan Highway System. In year 2003, the MTA awarded grants worth $750,000, of which MHS communities received $250,000 and Western Turnpike communities received another $500,000.
2 Massachusetts Turnpike Authority, Business Development Division
Overview of Projects & Facilities
The Economic Impact of the Massachusetts Turnpike Authority 8
Park-N-Ride Program The MTA offers approximately 2,100 free commuter parking spaces at 16 different “Park-N-Ride Lots.” Annually, $360,000 is budgeted on the Park-N-Ride programs.
2.5 Other Services Electronic Toll Collection (FAST LANE Program) FAST LANE is the high-speed electronic toll collection system introduced in 1998. The system increases vehicle traffic through toll plazas. Since 1999, it has been operable at all toll facilities along the Turnpike, as well as the Ted Williams Tunnel and the Sumner Tunnel. More than 700,000 transponders are linked to a FAST LANE account, and the system now accounts for more than 50 percent of all toll transactions on the Turnpike.3 A FAST LANE membership also provides a discount on passenger vehicle tolls inside Route 128 and the Sumner and Ted Williams Tunnels. “Take a Hike on the Pike” Program The “Take a Hike on the Pike” program allows local communities and organizations to list their tourism events via the MTA website at http://www.masspike.com. Joint advertising with regional visitor bureaus is also conducted. Approximately 200 companies feature their business via the MTA website and “Take a Hike on the Pike” program.
3 The number of transponders linked to Fast Lane has continued to grow since the research for this report
was completed.
Highway Projects & Facilities in Boston
The Economic Impact of the Massachusetts Turnpike Authority 9
HIGHWAY PROJECTS & FACILITIES IN BOSTON This chapter examines the current and emerging economic impacts of improvements being made to elements of Boston’s Metropolitan Highway System (MHS) – routes that are now operated and maintained by the Massachusetts Turnpike Authority. These projects – the I-93 Central Artery project and the extension of I-90 to Logan Airport and East Boston – are causing significant changes on traffic patterns, vehicle mileage and travel times in the Boston area. The traffic changes, in turn, also affect vehicle operating costs, business labor costs and personal time (which can also be valued). Other improvements that have been recently made to improve travel speeds and reliability throughout the MHS include implementation of automated toll collection (on the Turnpike, Ted Williams and Sumner Tunnels) and a new safety monitoring and emergency response system for all of these highway system segments. All of these upgrades to the highway system have been completed in the 1998-2005 period. However, not all improvements were in place at the time of most recent data collection (2003). Thus, the findings here represent only initial economic benefits.
3.1 Methodology for Measuring Economic Benefits The methodology for measuring economic benefits has four steps: Step 1 – Identify the nature of highway system changes (that affect travel times and trip distances). Sections 3.2 - 3.4 (below) start with identification of the nature of highway system changes, the subsets of travelers that are affected, and the ways in which these changes affect travel time and trip distances. For various segments of the MHS, these changes include: (a) additional lane capacity, (b) redesign of roadway and on/off-ramp configurations to reduce weaving, (c) opening of new highway and tunnel routes that shift traffic off of previously congested routes, (d) automatic toll collection and (e) a new traffic monitoring and emergency response system. Step 2 – Measure actual changes occurring in travel times and travel distances. The Massachusetts Highway Department and Central Artery/Tunnel Project staff measured daily and peak period traffic volumes as well as peak period travel times on major highway segments in 1994 and as new highway segments opened in 2003-2005. We compared those measurements to identify the magnitude of observed changes in traffic volumes and travel times, and calculated the changes in total vehicle-miles of travel (VMT) and total vehicle-hours of travel (VHT) over this period, which represents observations before and after completion of major MHS improvements.
3
Highway Projects & Facilities in Boston
The Economic Impact of the Massachusetts Turnpike Authority 10
Step 3 – Identify expected benefits associated with soon-to-be (but not yet) completed projects. Since not all of the highway system improvements were completed at the time of the most recent traffic counts and measurements, it is important to also identify the nature of additional improvements being implemented later in 2004-2005, and the magnitude of their expected impacts on the benefit measures. Step 4 – Calculate Annual Dollar Value of Benefits. The last step is to translate the changes in VHT and VMT into income and operating cost savings for businesses and households, as well as valuation of personal time savings. Reductions in vehicle-hours of travel (VHT) represent savings in business and personal time costs, as well as savings in vehicle engine running time (and hence fuel costs). Changes in vehicle-miles of travel (VMT) also represent changes in total car mileage, which in turn affects fuel consumption. These dollar benefits are further considered in the broader context of effects on business competitiveness in Chapter 5.
3.2 Interstate-93 Central Artery
Highway System Changes. The elevated I-93 Central Artery structure was closed down and replaced with a new underground I-93 highway in 2003, though additional lanes of the underground route opened in phases through March 2005. This has led to faster trip times for Central Artery travelers, as a consequence of improved highway design, additional lanes, and reduction in traffic volume. (The reduction in Central Artery traffic volumes has occurred as some travelers have shifted to use the new I-90 Turnpike extension to access Logan Airport instead of traveling on the I-93 Central Artery to access the Callahan Tunnel or returning via the Sumner Tunnel).
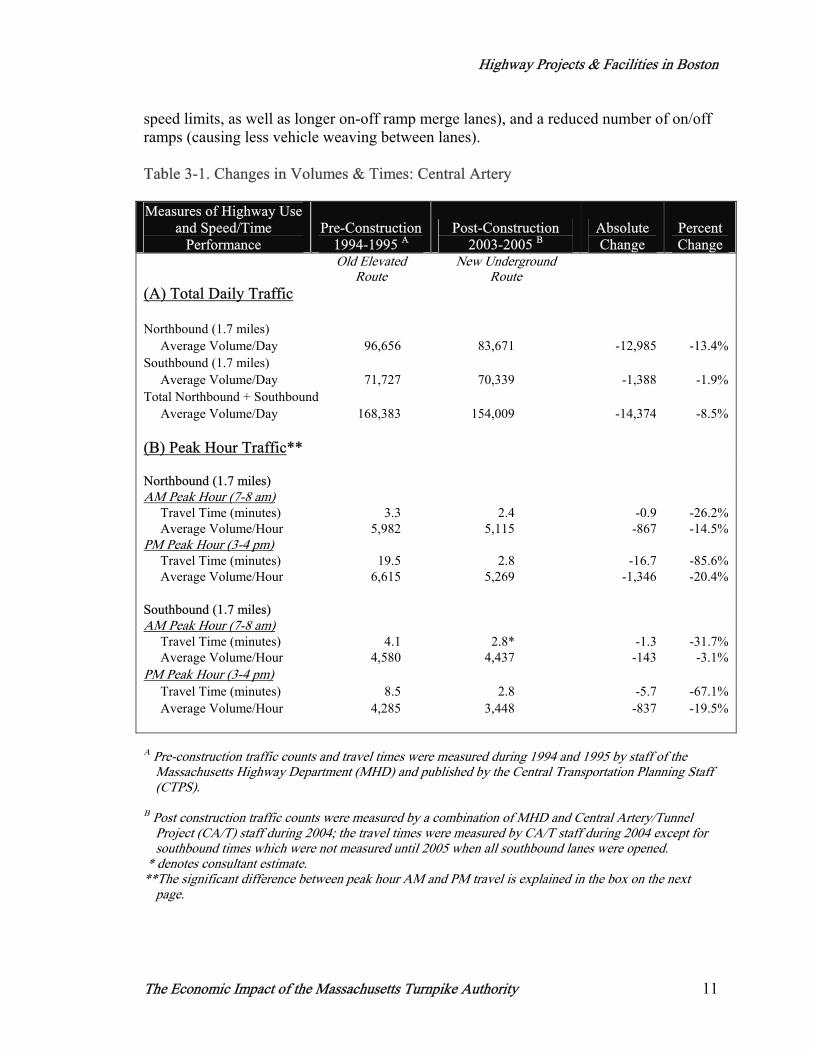
Traffic Volume Changes. Table 3-1(A) shows a comparison of total daily traffic on the I-93 Central Artery (north of I-90 and south of the Charles River), as counted in 1995 and at the end of 2003. It shows that total daily traffic volume has declined as a result of the opening of the I-90 extension via the Ted Williams Tunnel. The latter route serves as an alternative route to Logan Airport for travelers from the south or west, who no longer need to drive through the Central Artery to access airport tunnels. The traffic counts made in late 2003 show a decline in northbound volume by more than 13%, while peak period traffic in that direction declined even more dramatically. The reduction was less dramatic in the southbound direction, partly because all the underground southbound lanes had not yet opened as of that date.
Time Savings. Table 3-1(B) shows the comparison of peak hour travel times through the Central Artery. It shows that replacement of the elevated highway with an underground highway has led to faster travel for Central Artery travelers, as a consequence of increased capacity (4-5 lanes in each direction rather than 3 lanes in the former elevated highway) and reduced traffic volume (as some travelers shifted off of the Central Artery to the I-90 Ted Williams Tunnel route to the airport). Other improvements allowing for faster travel include improved highway design (providing a straighter route with higher
Highway Projects & Facilities in Boston
The Economic Impact of the Massachusetts Turnpike Authority 11
speed limits, as well as longer on-off ramp merge lanes), and a reduced number of on/off ramps (causing less vehicle weaving between lanes).
Table 3-1. Changes in Volumes & Times: Central Artery Measures of Highway Use
and Speed/Time Performance
Pre-Construction 1994-1995 A
Post-Construction 2003-2005 B
Absolute Change
Percent Change
Old Elevated
Route New Underground
Route (A) Total Daily Traffic Northbound (1.7 miles) Average Volume/Day 96,656 83,671 -12,985 -13.4% Southbound (1.7 miles) Average Volume/Day 71,727 70,339 -1,388 -1.9% Total Northbound + Southbound Average Volume/Day 168,383 154,009 -14,374 -8.5% (B) Peak Hour Traffic** Northbound (1.7 miles) AM Peak Hour (7-8 am) Travel Time (minutes) 3.3 2.4 -0.9 -26.2% Average Volume/Hour 5,982 5,115 -867 -14.5% PM Peak Hour (3-4 pm) Travel Time (minutes) 19.5 2.8 -16.7 -85.6% Average Volume/Hour 6,615 5,269 -1,346 -20.4% Southbound (1.7 miles) AM Peak Hour (7-8 am) Travel Time (minutes) 4.1 2.8* -1.3 -31.7% Average Volume/Hour 4,580 4,437 -143 -3.1% PM Peak Hour (3-4 pm) Travel Time (minutes) 8.5 2.8 -5.7 -67.1% Average Volume/Hour 4,285 3,448 -837 -19.5% A Pre-construction traffic counts and travel times were measured during 1994 and 1995 by staff of the
Massachusetts Highway Department (MHD) and published by the Central Transportation Planning Staff (CTPS).
B Post construction traffic counts were measured by a combination of MHD and Central Artery/Tunnel
Project (CA/T) staff during 2004; the travel times were measured by CA/T staff during 2004 except for southbound times which were not measured until 2005 when all southbound lanes were opened.
* denotes consultant estimate. **The significant difference between peak hour AM and PM travel is explained in the box on the next
page.
Highway Projects & Facilities in Boston
The Economic Impact of the Massachusetts Turnpike Authority 12
The travel time values for northbound traffic reflect speed measurements made in late 2003, while the travel time values for southbound traffic reflect an updated measurement of afternoon peak travel speeds made in the Spring of 2005. These measurements show dramatic improvements in peak period travel times for both directions. However, it should be noted that the southbound afternoon peak through the Central Artery is sometimes still subject to backups caused by delays further south of downtown on the Southeast Expressway portion of I-93.
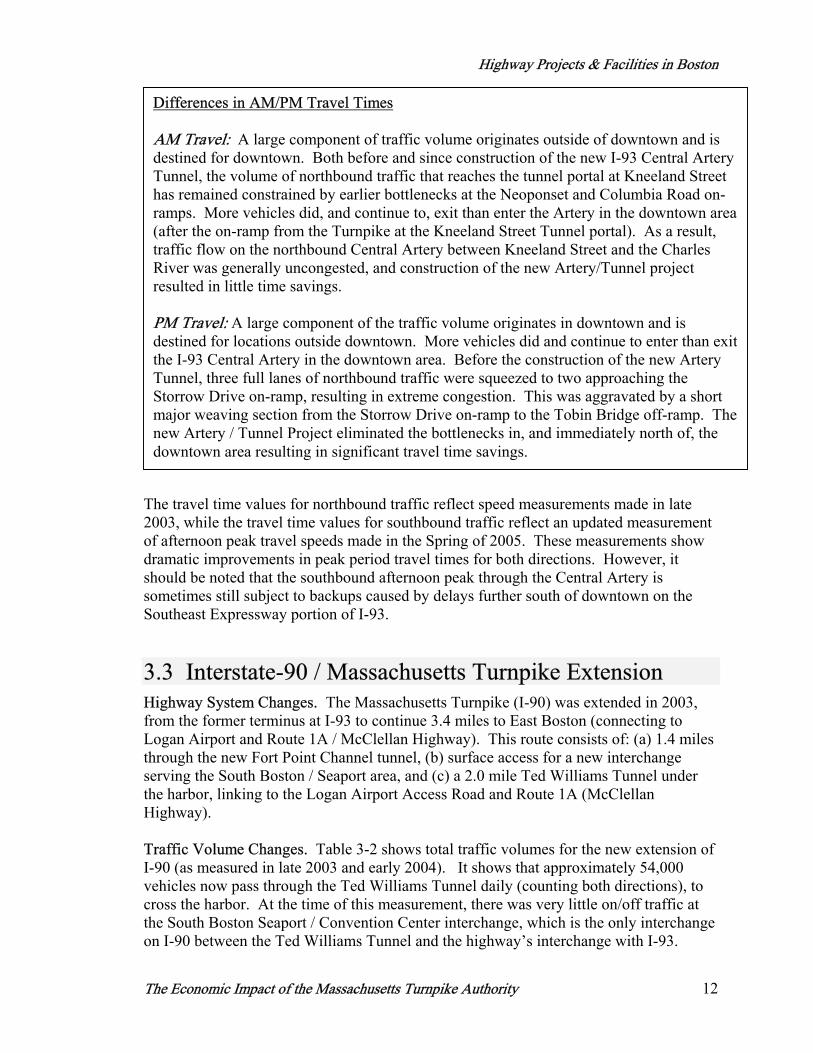
3.3 Interstate-90 / Massachusetts Turnpike Extension Highway System Changes. The Massachusetts Turnpike (I-90) was extended in 2003, from the former terminus at I-93 to continue 3.4 miles to East Boston (connecting to Logan Airport and Route 1A / McClellan Highway). This route consists of: (a) 1.4 miles through the new Fort Point Channel tunnel, (b) surface access for a new interchange serving the South Boston / Seaport area, and (c) a 2.0 mile Ted Williams Tunnel under the harbor, linking to the Logan Airport Access Road and Route 1A (McClellan Highway). Traffic Volume Changes. Table 3-2 shows total traffic volumes for the new extension of I-90 (as measured in late 2003 and early 2004). It shows that approximately 54,000 vehicles now pass through the Ted Williams Tunnel daily (counting both directions), to cross the harbor. At the time of this measurement, there was very little on/off traffic at the South Boston Seaport / Convention Center interchange, which is the only interchange on I-90 between the Ted Williams Tunnel and the highway’s interchange with I-93.
Differences in AM/PM Travel Times AM Travel: A large component of traffic volume originates outside of downtown and is destined for downtown. Both before and since construction of the new I-93 Central Artery Tunnel, the volume of northbound traffic that reaches the tunnel portal at Kneeland Street has remained constrained by earlier bottlenecks at the Neoponset and Columbia Road on-ramps. More vehicles did, and continue to, exit than enter the Artery in the downtown area (after the on-ramp from the Turnpike at the Kneeland Street Tunnel portal). As a result, traffic flow on the northbound Central Artery between Kneeland Street and the Charles River was generally uncongested, and construction of the new Artery/Tunnel project resulted in little time savings. PM Travel: A large component of the traffic volume originates in downtown and is destined for locations outside downtown. More vehicles did and continue to enter than exitthe I-93 Central Artery in the downtown area. Before the construction of the new Artery Tunnel, three full lanes of northbound traffic were squeezed to two approaching the Storrow Drive on-ramp, resulting in extreme congestion. This was aggravated by a short major weaving section from the Storrow Drive on-ramp to the Tobin Bridge off-ramp. The new Artery / Tunnel Project eliminated the bottlenecks in, and immediately north of, the downtown area resulting in significant travel time savings.
Highway Projects & Facilities in Boston
The Economic Impact of the Massachusetts Turnpike Authority 13
Thus, this traffic count is considered to be a reasonable estimate of the total traffic traveling the full 3.4 miles between (a) I-90 at the I-93 interchange and (b) East Boston / Logan Airport. Historical traffic data also indicate that roughly 54,000 vehicles were previously using the I-93 route to travel between the I-93/I-90 interchange and on-/off-ramps at the Callahan/Sumner Tunnels, before opening of the new I-90 Turnpike extension. Table 3-2. Change in Volumes & Times Between Airport and I-90/I-93 Junction Comparison of Old Route (via Central Artery to Callahan/Sumner Tunnels) to New Route (via Mass Turnpike Extension)
Measures of Highway Use and Speed/Time Performance
Pre-Construction (1994-1995) *
Post-Construction (2003-2004)
Absolute Change
Percent Change
Eastbound Trip to Airport via I-93 to
Callahan Tunnel via I-90 Ext. to Ted
Williams Tunnel Trip Length (miles) 3.1 3.4 0 9.7% Total Daily Travel Average Volume/Day * 29,279 28,547 -732 -2.5% AM Peak Hour (7-8 am) Travel Time (minutes) 5.3 2.5 -3 -52.8% Average Volume/Hour * 1,916 1,858 -58 -3.0% PM Peak Hour (3-4 pm) Travel Time (minutes) 16.2 4.2 -12 -74.1% Average Volume/Hour * 2,227 2,046 -181 -8.1%
Westbound Trip from Airport via Sumner Tunnel
to I-93 Via Ted Williams
Tunnel to I-90 Ext. Trip Length (miles) 3.1 3.4 0 9.7% Total Daily Travel Average Volume/Day * 24,629 25,380 751 3.0% AM Peak Hour (7-8 am) Travel Time (minutes) 14.1 5.6 -9 -60.3% Average Volume/Hour * 2,022 1,897 -125 -6.2% PM Peak Hour (3-4 pm) Travel Time (minutes) 17.2 10 -7 -41.9% Average Volume/Hour * 1,759 1,998 239 13.6% Total Eastbound + Westbound Trips to/from Airport
via I-93 and Callahan / Sumner Tunnels
via I-90 and Ted Williams Tunnel
Average Volume/Day * 53,908 53,927 19 0.0%
*Pre-construction traffic volume counts only through trips traveling between Logan Airport/East Boston and the I-90/93 junction. Other I-93 traffic is not counted.
Source: Pre-construction traffic counts and travel times were measured during 1994-1995 by staff of the Massachusetts Highway Department (MHD) and published by the Central Transportation Planning Staff (CTPS). Post construction traffic counts were measured during 2003-2004 by a combination of MHD and Central Artery/Tunnel Project (CA/T) staff; the travel times were measured by CA/T staff.
Travel Distance Change. The new route from the I-90/93 interchange to Logan Airport
Highway Projects & Facilities in Boston
The Economic Impact of the Massachusetts Turnpike Authority 14
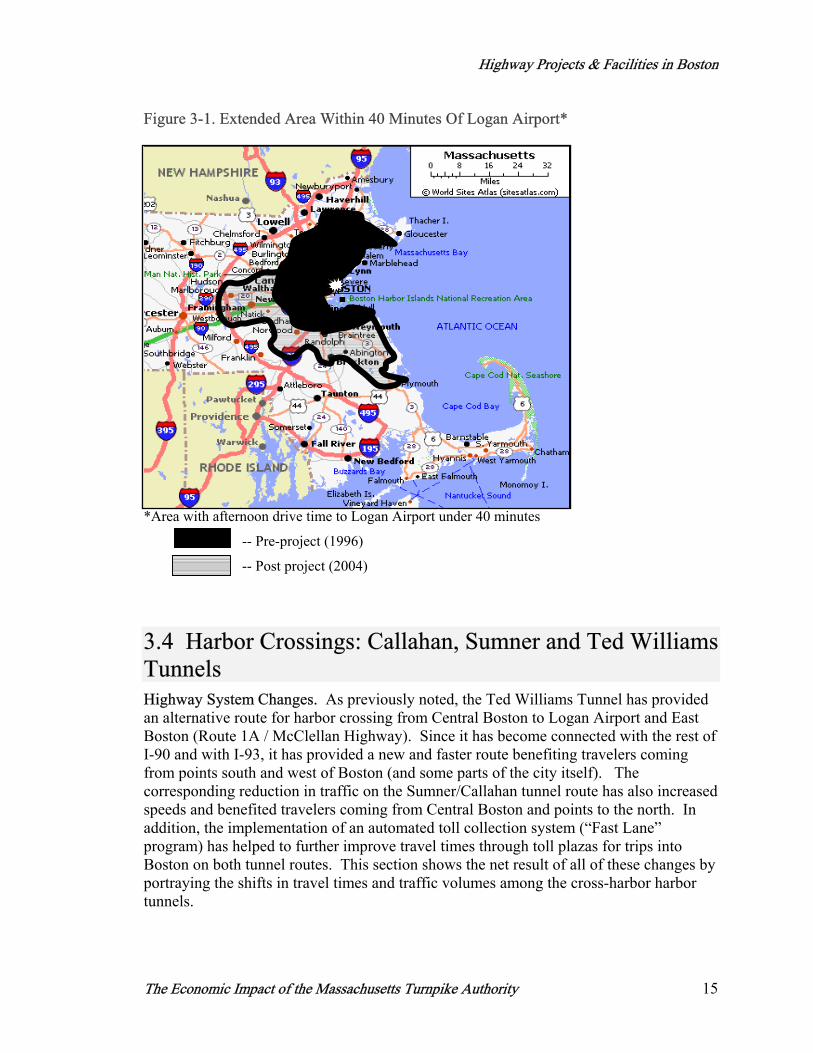
via the MTA extension is actually 0.3 miles longer than the older and slower route via I-93 and the Callahan/Sumner Tunnels. As a result, traffic now using the new route is actually causing a 9.5% increase in total daily vehicle-miles of travel (VMT), though that impact is more than offset by the substantial time savings involved (as discussed below). Travel Time Changes. While the new Turnpike Extension route is longer in distance, the travel time between the I-90/I-93 interchange and the Logan Airport for the new route in 2003 is substantially faster than the old route was in 1995. As shown in Table 3-2, both westbound and eastbound movements are now taking roughly half of the travel time than they previously took via the old route in 1995, and that finding holds for both the morning and afternoon peaks. The reduction in average peak period travel time varies between 42% and 74%, depending on the direction and time of day. It is important to note that these numbers represent the change in average travel time and do not account for changes in the variation or uncertainty of travel time to the airport. In fact, with the old elevated highway, many travelers formerly experienced wide variation in travel time between the airport and the I-93 / I-90 interchange. So while the afternoon average travel time was 16 – 17 minutes for the 3.1 mile trip, actual travel times often ranged between from 10 to 25 minutes and travelers had to plan their schedules to allow for the possibility of the longer travel time. Thus, by reducing congestion and hence variation in travel time, the effective time savings for many travelers may be more than double the average values shown here. Another aspect of the improvement in travel time to Logan Airport from the I-90 / I-93 interchange is that it has extended the effective market area which can access Logan Airport via car or bus. Figure 3-1 shows a graphical representation of the area that was within 40 minutes driving time of Logan Airport in the afternoon, before and after the Turnpike was extended to the airport. Before completion of the Turnpike extension to the airport, approximately 1.7 million residents were within 40 minutes drive time of Logan Airport. After completion of the project, this area broadened out to the west and south, allowing approximately 800,000 more residents to access the airport within a 40 minute drive, for a total of 2.5 million residents.
Highway Projects & Facilities in Boston
The Economic Impact of the Massachusetts Turnpike Authority 15
Figure 3-1. Extended Area Within 40 Minutes Of Logan Airport*
*Area with afternoon drive time to Logan Airport under 40 minutes
-- Pre-project (1996)
-- Post project (2004)
3.4 Harbor Crossings: Callahan, Sumner and Ted Williams Tunnels Highway System Changes. As previously noted, the Ted Williams Tunnel has provided an alternative route for harbor crossing from Central Boston to Logan Airport and East Boston (Route 1A / McClellan Highway). Since it has become connected with the rest of I-90 and with I-93, it has provided a new and faster route benefiting travelers coming from points south and west of Boston (and some parts of the city itself). The corresponding reduction in traffic on the Sumner/Callahan tunnel route has also increased speeds and benefited travelers coming from Central Boston and points to the north. In addition, the implementation of an automated toll collection system (“Fast Lane” program) has helped to further improve travel times through toll plazas for trips into Boston on both tunnel routes. This section shows the net result of all of these changes by portraying the shifts in travel times and traffic volumes among the cross-harbor harbor tunnels.
Highway Projects & Facilities in Boston
The Economic Impact of the Massachusetts Turnpike Authority 16
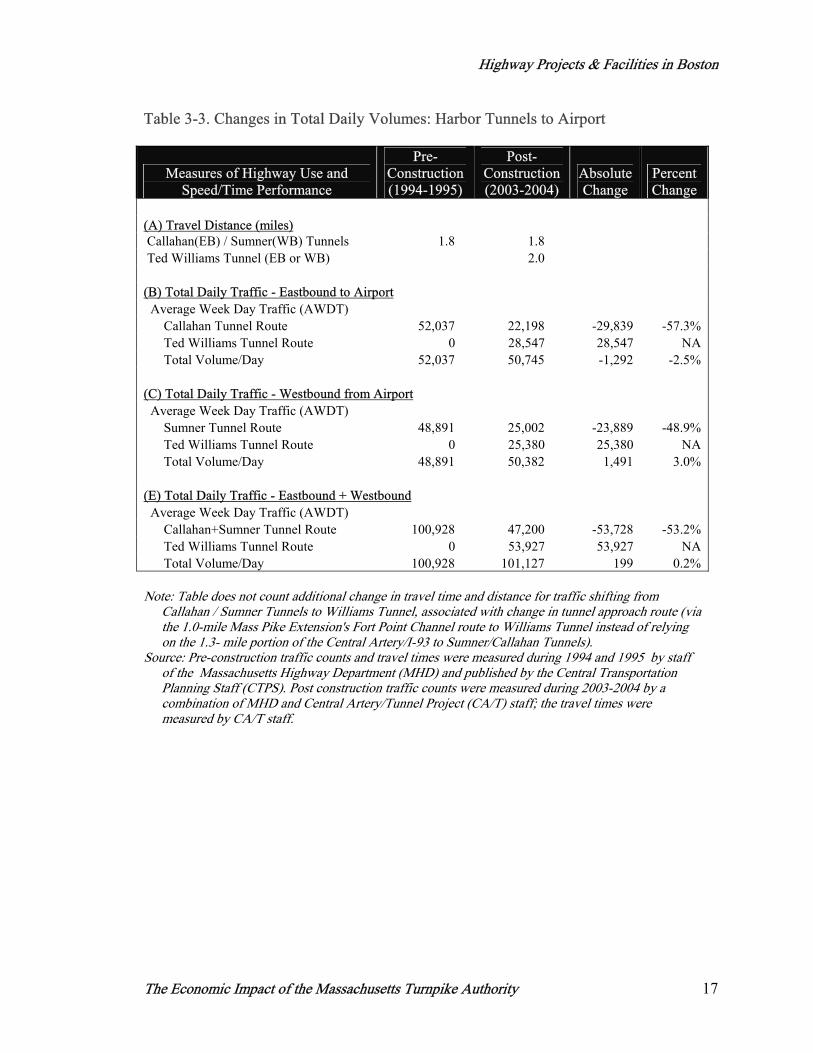
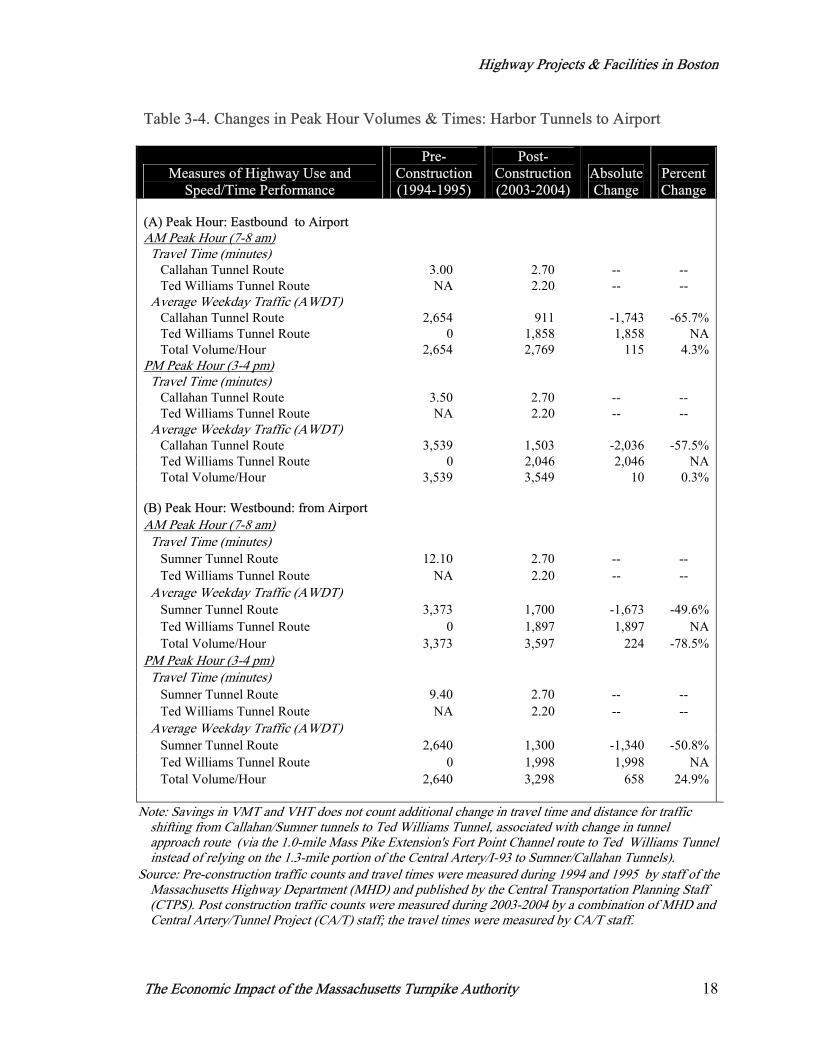
Traffic Volume Changes. Before completion of the I-90 Turnpike extension to Logan Airport, the primary route from downtown Boston to Logan Airport and East Boston was through the Callahan (eastbound) and Sumner (westbound) Tunnels, accessed via the Central Artery. With the completion of the I-90 Turnpike extension, travelers from points west and south of Boston (as well as southern parts of downtown) gained a more convenient alternative, which is through the Ted Williams Tunnel. Table 3-3 shows that use of the new tunnel led to a 57% drop in daily traffic on the eastbound Callahan Tunnel and a 49% drop in traffic on the westbound Sumner Tunnel. Since the traffic counts are subject to some day-to-day variation (assuming +/- 5% for weekdays), it is fair to say that the general result was a shift of roughly half of the traffic off of the Sumner and Callahan Tunnels. The loss of this traffic on the older tunnels was almost exactly offset by a similar increase in traffic on the new Ted Williams Tunnel. The overall traffic level charged for all MTA harbor-crossing tunnels added together was essentially zero. Time Savings. Not surprisingly, the reduction in traffic levels and congestion in the Sumner and Callahan Tunnels has led to shortened travel time through those facilities. Because the westbound Sumner Tunnel feeds directly into the Central Artery (which had formerly been highly congested), the reduction in travel time was most dramatic for that tunnel. Table 3-4 shows that travel time has dropped from 12.1 minutes to 2.7 minutes for the morning peak and from 9.4 to 2.7 minutes for the afternoon peak. This represents a shift from slow moving traffic to essentially free flow (speed limit) traffic movement. The travel times also dropped for the eastbound Callahan Tunnel, though that facility (leading away from the Central Artery) had never been as congested and so its changes were less dramatic, shifting from 3.0 to 2.7 minutes in the morning and from 3.5 to 2.7 in the afternoon peak.
Highway Projects & Facilities in Boston
The Economic Impact of the Massachusetts Turnpike Authority 17
Table 3-3. Changes in Total Daily Volumes: Harbor Tunnels to Airport
Measures of Highway Use and Speed/Time Performance
Pre-Construction (1994-1995)
Post-Construction (2003-2004)
Absolute Change
Percent Change
(A) Travel Distance (miles) Callahan(EB) / Sumner(WB) Tunnels 1.8 1.8 Ted Williams Tunnel (EB or WB) 2.0 (B) Total Daily Traffic - Eastbound to Airport Average Week Day Traffic (AWDT) Callahan Tunnel Route 52,037 22,198 -29,839 -57.3% Ted Williams Tunnel Route 0 28,547 28,547 NA Total Volume/Day 52,037 50,745 -1,292 -2.5% (C) Total Daily Traffic - Westbound from Airport Average Week Day Traffic (AWDT) Sumner Tunnel Route 48,891 25,002 -23,889 -48.9% Ted Williams Tunnel Route 0 25,380 25,380 NA Total Volume/Day 48,891 50,382 1,491 3.0% (E) Total Daily Traffic - Eastbound + Westbound Average Week Day Traffic (AWDT) Callahan+Sumner Tunnel Route 100,928 47,200 -53,728 -53.2% Ted Williams Tunnel Route 0 53,927 53,927 NA Total Volume/Day 100,928 101,127 199 0.2% Note: Table does not count additional change in travel time and distance for traffic shifting from
Callahan / Sumner Tunnels to Williams Tunnel, associated with change in tunnel approach route (via the 1.0-mile Mass Pike Extension's Fort Point Channel route to Williams Tunnel instead of relying on the 1.3- mile portion of the Central Artery/I-93 to Sumner/Callahan Tunnels).
Source: Pre-construction traffic counts and travel times were measured during 1994 and 1995 by staff of the Massachusetts Highway Department (MHD) and published by the Central Transportation Planning Staff (CTPS). Post construction traffic counts were measured during 2003-2004 by a combination of MHD and Central Artery/Tunnel Project (CA/T) staff; the travel times were measured by CA/T staff.
Highway Projects & Facilities in Boston
The Economic Impact of the Massachusetts Turnpike Authority 18
Table 3-4. Changes in Peak Hour Volumes & Times: Harbor Tunnels to Airport
Measures of Highway Use and Speed/Time Performance
Pre-Construction (1994-1995)
Post-Construction (2003-2004)
Absolute Change
Percent Change
(A) Peak Hour: Eastbound to Airport AM Peak Hour (7-8 am) Travel Time (minutes) Callahan Tunnel Route 3.00 2.70 -- -- Ted Williams Tunnel Route NA 2.20 -- -- Average Weekday Traffic (AWDT) Callahan Tunnel Route 2,654 911 -1,743 -65.7% Ted Williams Tunnel Route 0 1,858 1,858 NA Total Volume/Hour 2,654 2,769 115 4.3% PM Peak Hour (3-4 pm) Travel Time (minutes) Callahan Tunnel Route 3.50 2.70 -- -- Ted Williams Tunnel Route NA 2.20 -- -- Average Weekday Traffic (AWDT) Callahan Tunnel Route 3,539 1,503 -2,036 -57.5% Ted Williams Tunnel Route 0 2,046 2,046 NA Total Volume/Hour 3,539 3,549 10 0.3% (B) Peak Hour: Westbound: from Airport AM Peak Hour (7-8 am) Travel Time (minutes) Sumner Tunnel Route 12.10 2.70 -- -- Ted Williams Tunnel Route NA 2.20 -- -- Average Weekday Traffic (AWDT) Sumner Tunnel Route 3,373 1,700 -1,673 -49.6% Ted Williams Tunnel Route 0 1,897 1,897 NA Total Volume/Hour 3,373 3,597 224 -78.5% PM Peak Hour (3-4 pm) Travel Time (minutes) Sumner Tunnel Route 9.40 2.70 -- -- Ted Williams Tunnel Route NA 2.20 -- -- Average Weekday Traffic (AWDT) Sumner Tunnel Route 2,640 1,300 -1,340 -50.8% Ted Williams Tunnel Route 0 1,998 1,998 NA Total Volume/Hour 2,640 3,298 658 24.9%
Note: Savings in VMT and VHT does not count additional change in travel time and distance for traffic shifting from Callahan/Sumner tunnels to Ted Williams Tunnel, associated with change in tunnel approach route (via the 1.0-mile Mass Pike Extension's Fort Point Channel route to Ted Williams Tunnel instead of relying on the 1.3-mile portion of the Central Artery/I-93 to Sumner/Callahan Tunnels).
Source: Pre-construction traffic counts and travel times were measured during 1994 and 1995 by staff of the Massachusetts Highway Department (MHD) and published by the Central Transportation Planning Staff (CTPS). Post construction traffic counts were measured during 2003-2004 by a combination of MHD and Central Artery/Tunnel Project (CA/T) staff; the travel times were measured by CA/T staff.
Highway Projects & Facilities in Boston
The Economic Impact of the Massachusetts Turnpike Authority 19
3.5 Storrow Drive and Charles River Crossings Highway System Changes. The old (6-lane) I-93 Charles River bridge has been torn down and replaced by two new bridges. The new (10-lane) Leonard P. Zakim Bunker Hill Bridge serves the main I-93 route between downtown Boston and Charlestown. Next to it is the (4-lane) Storrow Drive Connector bridge, which now carries traffic between the eastern end of Storrow Drive (at Leverett Circle in downtown Boston) and I-93 in Charlestown. Before that bridge was completed, traffic from Storrow Drive was merged with I-93 onto a single bridge before its crossing of the river. A new interchange north of the Charles River allows traffic to split between the route to the Zakim Bridge and the route to the Storrow Drive Connector Bridge. In addition, a 1.1 mile tunnel under the Leverett Circle Underpass tunnel was opened in December 2004 to bring eastbound Storrow Drive traffic directly to I-93 North without traffic lights. As of 2004, the 8-lane main portion of the Zakim Bridge was open, serving through traffic on I-93 across the Charles River. By spring of 2005, the 2-lane cantilever portion of the bridge was also open to accommodate northbound traffic coming from the Sumner Tunnel and the North End, thus further lessening traffic volumes that now travel on the I-93 main line underground traffic lanes through downtown Boston and across the Charles River. Traffic Volume and Travel Time Changes. The “Leverett Circle Underpass” tunnel serves traffic moving from Storrow Drive eastbound to I-93 Northbound. Before the opening of that tunnel in December 2004, eastbound Storrow Drive terminated at Leverett Circle, where a traffic light controlled access to I-93 highway ramps. As a result, traffic often backed up at that traffic light for extended periods. Measurement was made of the savings in travel time between the Berkeley Street on-ramp merge with Storrow Drive eastbound and the ramp merge to I-93. During the afternoon peak hour, an average of 1400 trips made this movement. Average travel time on this 1.1 mile route was found to drop from 16.0 minutes before opening of the tunnel to 3.1 minutes after completion of the tunnel. Additional travel time savings are realized for traffic moving across the Charles River between Boston and Charlestown. The combination of the Zakim Bridge and Storrow Drive Connector Bridge benefits travelers going both northbound and southbound across the Charles River by providing a less dangerous route with substantially more total lanes, and substantially less merging of traffic with different origins and destinations on both sides of the river. However, measures of traffic volume and travel time changes have not yet been recorded, so it is not possible to analyze those changes. In addition, at the time of the traffic measurements, the cantilevered part of the Zakim Bridge had not yet opened and northbound Central Artery traffic from the Sumner Tunnel and North End had not yet been moved onto new dedicated lanes. Thus, the measurement of traffic flow and time savings improvements associated with Charles River Crossings cannot be calculated at this time.
Highway Projects & Facilities in Boston
The Economic Impact of the Massachusetts Turnpike Authority 20
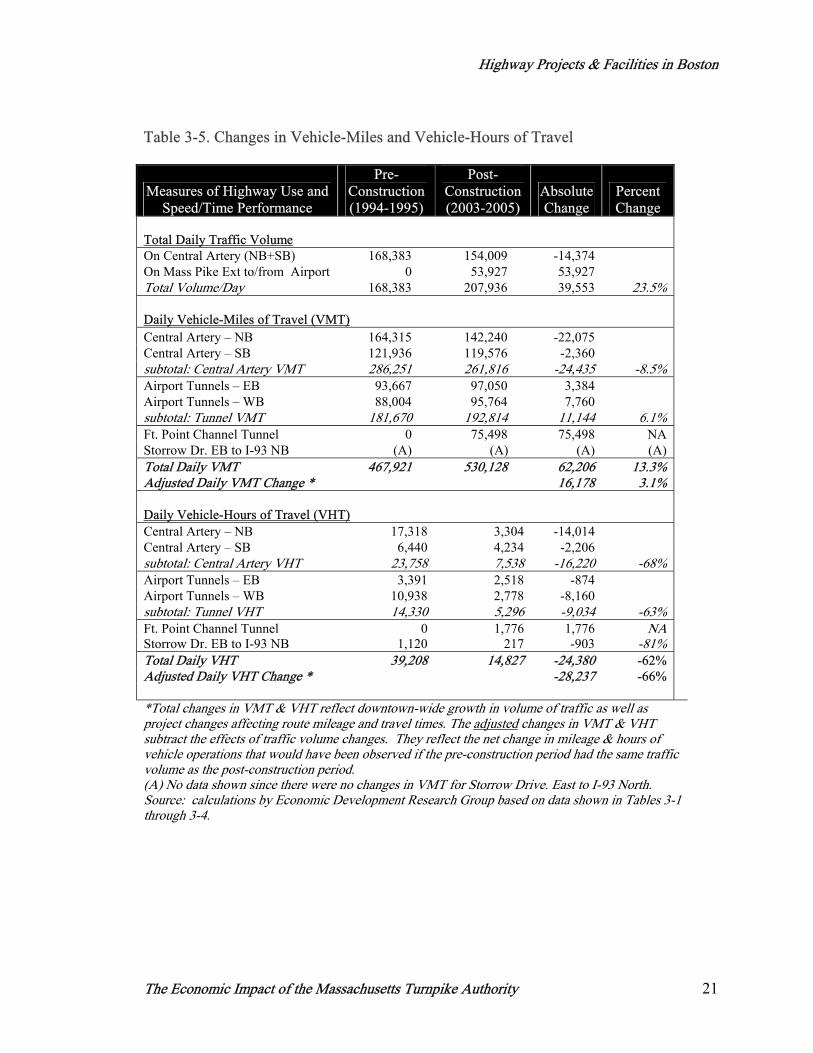
3.6 Summary of Downtown Traffic Changes The analysis of changes in traffic volumes and travel times shown in Sections 3-2 through 3-5 provides a snapshot of traffic improvements and travel time savings that are occurring in initial years as the Metropolitan Highway System improvements are being implemented. Larger improvements are to be expected once the full system of highway improvements is completed. Table 3-5 summarizes calculation of total annual changes in total vehicle-miles of travel (VMT) and total vehicle-hours of travel (VHT) occurring downtown over a period representing times immediately before and after completion of major MHS improvements. Reductions in VHT represent savings in business and personal time costs, as well as savings in vehicle engine running time (and hence fuel costs). Changes in VMT represent changes in total vehicle mileage, which also affects fuel consumption. Changes in Total Traffic and Mileage. Adding together the Central Artery, all harbor tunnels and connectors to them, Table 3-5 shows a 23.5% growth in traffic volume from 1995 to 2004. That is partly a reflection of the extension of the highway system, and some vehicles traveling between I-93 and I-90 may have been counted twice. Thus, it is more meaningful to compare vehicle-miles of travel (VMT), which increased 13% over the period. The VMT increase can actually be split into two components – 10% growth due to traffic volume increase over the time period, and 3% due to the slightly longer mileage involved for those trips that are now using the Massachusetts Turnpike Extension through the Ted Williams Tunnel (in place of the Central Artery/Callahan Tunnel route to the Airport). Changes in Total Vehicle Time. The time savings impact is much more dramatic than the mileage changes. Table 3-5 shows that total vehicle-hours of travel (VHT) on the Central Artery and harbor crossing routes dropped 62% between 1995 and 2003, due to improvements in traffic flow and substantial reductions in traffic delay. It is useful to note that, without these road system improvements, natural growth in downtown traffic volume over the time period would have led to an increase rather than a savings in VHT. If we assume that the pre-construction period had the same traffic volume as the post-construction period, then the net improvement in VHT would actually exceed 66%. Looking more carefully at Table 3-5, we can see that the VHT drop on the Central Artery is due in large part to the improvement in northbound movement, where effective average speeds improved from 10 to 43 miles per hour. Average speed for all harbor tunnels also improved, from 13 to 36 miles per hour. In addition, average speed from Storrow Drive eastbound to I-93 northbound improved from 4 to 21 miles per hour. When the project is completed, we can expect to see additional VHT savings associated with the southbound Central Artery and Charles River Crossings.
Highway Projects & Facilities in Boston
The Economic Impact of the Massachusetts Turnpike Authority 21
Table 3-5. Changes in Vehicle-Miles and Vehicle-Hours of Travel
Measures of Highway Use and Speed/Time Performance
Pre-Construction (1994-1995)
Post-Construction (2003-2005)
Absolute Change
Percent Change
Total Daily Traffic Volume On Central Artery (NB+SB) 168,383 154,009 -14,374 On Mass Pike Ext to/from Airport 0 53,927 53,927 Total Volume/Day 168,383 207,936 39,553 23.5% Daily Vehicle-Miles of Travel (VMT) Central Artery – NB 164,315 142,240 -22,075 Central Artery – SB 121,936 119,576 -2,360 subtotal: Central Artery VMT 286,251 261,816 -24,435 -8.5% Airport Tunnels – EB 93,667 97,050 3,384 Airport Tunnels – WB 88,004 95,764 7,760 subtotal: Tunnel VMT 181,670 192,814 11,144 6.1% Ft. Point Channel Tunnel 0 75,498 75,498 NA Storrow Dr. EB to I-93 NB (A) (A) (A) (A) Total Daily VMT 467,921 530,128 62,206 13.3% Adjusted Daily VMT Change * 16,178 3.1% Daily Vehicle-Hours of Travel (VHT) Central Artery – NB 17,318 3,304 -14,014 Central Artery – SB 6,440 4,234 -2,206 subtotal: Central Artery VHT 23,758 7,538 -16,220 -68% Airport Tunnels – EB 3,391 2,518 -874 Airport Tunnels – WB 10,938 2,778 -8,160 subtotal: Tunnel VHT 14,330 5,296 -9,034 -63% Ft. Point Channel Tunnel 0 1,776 1,776 NA Storrow Dr. EB to I-93 NB 1,120 217 -903 -81% Total Daily VHT 39,208 14,827 -24,380 -62% Adjusted Daily VHT Change * -28,237 -66% *Total changes in VMT & VHT reflect downtown-wide growth in volume of traffic as well as project changes affecting route mileage and travel times. The adjusted changes in VMT & VHT subtract the effects of traffic volume changes. They reflect the net change in mileage & hours of vehicle operations that would have been observed if the pre-construction period had the same traffic volume as the post-construction period. (A) No data shown since there were no changes in VMT for Storrow Drive. East to I-93 North. Source: calculations by Economic Development Research Group based on data shown in Tables 3-1 through 3-4.
Highway Projects & Facilities in Boston
The Economic Impact of the Massachusetts Turnpike Authority 22
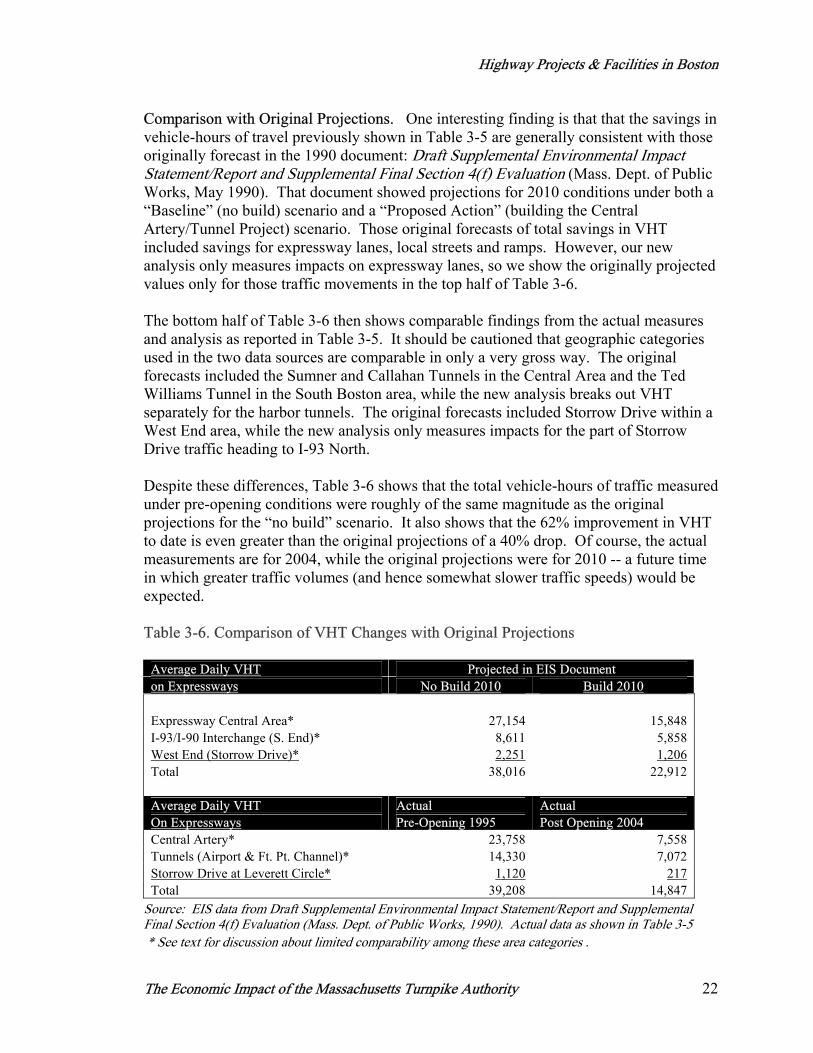
Comparison with Original Projections. One interesting finding is that that the savings in vehicle-hours of travel previously shown in Table 3-5 are generally consistent with those originally forecast in the 1990 document: Draft Supplemental Environmental Impact Statement/Report and Supplemental Final Section 4(f) Evaluation (Mass. Dept. of Public Works, May 1990). That document showed projections for 2010 conditions under both a “Baseline” (no build) scenario and a “Proposed Action” (building the Central Artery/Tunnel Project) scenario. Those original forecasts of total savings in VHT included savings for expressway lanes, local streets and ramps. However, our new analysis only measures impacts on expressway lanes, so we show the originally projected values only for those traffic movements in the top half of Table 3-6. The bottom half of Table 3-6 then shows comparable findings from the actual measures and analysis as reported in Table 3-5. It should be cautioned that geographic categories used in the two data sources are comparable in only a very gross way. The original forecasts included the Sumner and Callahan Tunnels in the Central Area and the Ted Williams Tunnel in the South Boston area, while the new analysis breaks out VHT separately for the harbor tunnels. The original forecasts included Storrow Drive within a West End area, while the new analysis only measures impacts for the part of Storrow Drive traffic heading to I-93 North. Despite these differences, Table 3-6 shows that the total vehicle-hours of traffic measured under pre-opening conditions were roughly of the same magnitude as the original projections for the “no build” scenario. It also shows that the 62% improvement in VHT to date is even greater than the original projections of a 40% drop. Of course, the actual measurements are for 2004, while the original projections were for 2010 -- a future time in which greater traffic volumes (and hence somewhat slower traffic speeds) would be expected. Table 3-6. Comparison of VHT Changes with Original Projections
Average Daily VHT Projected in EIS Document on Expressways No Build 2010 Build 2010 Expressway Central Area* 27,154 15,848 I-93/I-90 Interchange (S. End)* 8,611 5,858 West End (Storrow Drive)* 2,251 1,206 Total 38,016 22,912 Average Daily VHT Actual Actual On Expressways Pre-Opening 1995 Post Opening 2004 Central Artery* 23,758 7,558 Tunnels (Airport & Ft. Pt. Channel)* 14,330 7,072 Storrow Drive at Leverett Circle* 1,120 217 Total 39,208 14,847
Source: EIS data from Draft Supplemental Environmental Impact Statement/Report and Supplemental Final Section 4(f) Evaluation (Mass. Dept. of Public Works, 1990). Actual data as shown in Table 3-5 * See text for discussion about limited comparability among these area categories .
Highway Projects & Facilities in Boston
The Economic Impact of the Massachusetts Turnpike Authority 23
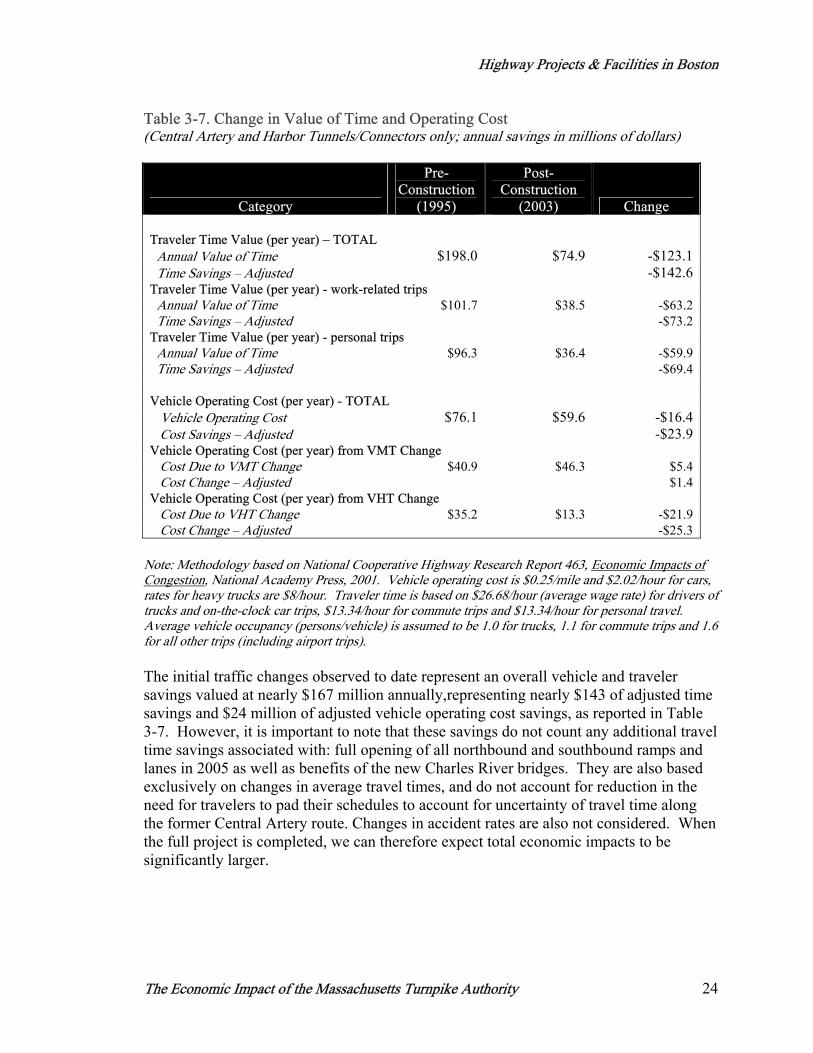
Value of Total Vehicle Mileage and Time Changes. The aggregate savings in VMT and VHT directly translate into economic impacts, shown in Table 3-7. • Traveler Time Cost. The change in VHT translates into traveler time savings, which
has an economic impact that differs depending on the type of trip. For “on-the-clock” business-related trips (including truck deliveries and professional services trips), the time savings typically translates directly into labor cost savings for businesses. For commuting trips, time savings has been shown to improve worker availability and also save businesses some costs. For other travelers on personal trips, time savings also has a clear value (that has been shown in terms of travelers’ willingness to pay money to save time), though the time savings does not necessarily add spending money into their pockets. Table 3-7 shows that the level of annual traveler time savings observed so far is valued at nearly $143 million each year, compared to the time cost that would have occurred without the downtown highway projects. Over $73 million of that traveler time savings represents a reduction in the costs of doing business in Boston, while the rest is a value of personal time.
• Vehicle Operating Cost. Both VMT and VHT affect vehicle operating cost. The
added mileage (VMT) caused by the slightly longer length of the Ted Williams Tunnel route to the airport adds to vehicle operating costs. However, the reduction in vehicle idling and traveling time directly translates into a much larger savings in fuel use and thus vehicle operating cost. Thus the total impact on vehicle operating cost is a substantial economic savings.4
The types of traffic changes observed so far represent over $25 million of savings in vehicle operating (fuel) costs each year, compared to the cost that would have occurred without the downtown highway projects. (See Table 3-7.)
4 The predominant user benefit from the project is a reduction in travel time rather than travel distances. The values for savings per vehicle-hour of travel time are based on a current estimate of the cost of operating a motor vehicle for an hour, including costs of fuel, oil and maintenance due to additional engine operation. These values are also consistent with values per vehicle hour of operation used in earlier reports of the Federal Highway Administration (Highway Economic Requirement System, 1997) and the National Cooperative Highway Research Program (Economic Implications of Congestion, NCHRP 463, 2001).
Highway Projects & Facilities in Boston
The Economic Impact of the Massachusetts Turnpike Authority 24
Table 3-7. Change in Value of Time and Operating Cost (Central Artery and Harbor Tunnels/Connectors only; annual savings in millions of dollars)
Category
Pre-Construction
(1995)
Post-Construction
(2003) Change Traveler Time Value (per year) – TOTAL Annual Value of Time $198.0 $74.9 -$123.1 Time Savings – Adjusted -$142.6Traveler Time Value (per year) - work-related trips Annual Value of Time $101.7 $38.5 -$63.2 Time Savings – Adjusted -$73.2 Traveler Time Value (per year) - personal trips Annual Value of Time $96.3 $36.4 -$59.9 Time Savings – Adjusted -$69.4 Vehicle Operating Cost (per year) - TOTAL Vehicle Operating Cost $76.1 $59.6 -$16.4 Cost Savings – Adjusted -$23.9Vehicle Operating Cost (per year) from VMT Change Cost Due to VMT Change $40.9 $46.3 $5.4 Cost Change – Adjusted $1.4 Vehicle Operating Cost (per year) from VHT Change Cost Due to VHT Change $35.2 $13.3 -$21.9 Cost Change – Adjusted -$25.3
Note: Methodology based on National Cooperative Highway Research Report 463, Economic Impacts of Congestion, National Academy Press, 2001. Vehicle operating cost is $0.25/mile and $2.02/hour for cars, rates for heavy trucks are $8/hour. Traveler time is based on $26.68/hour (average wage rate) for drivers of trucks and on-the-clock car trips, $13.34/hour for commute trips and $13.34/hour for personal travel. Average vehicle occupancy (persons/vehicle) is assumed to be 1.0 for trucks, 1.1 for commute trips and 1.6 for all other trips (including airport trips). The initial traffic changes observed to date represent an overall vehicle and traveler savings valued at nearly $167 million annually,representing nearly $143 of adjusted time savings and $24 million of adjusted vehicle operating cost savings, as reported in Table 3-7. However, it is important to note that these savings do not count any additional travel time savings associated with: full opening of all northbound and southbound ramps and lanes in 2005 as well as benefits of the new Charles River bridges. They are also based exclusively on changes in average travel times, and do not account for reduction in the need for travelers to pad their schedules to account for uncertainty of travel time along the former Central Artery route. Changes in accident rates are also not considered. When the full project is completed, we can therefore expect total economic impacts to be significantly larger.
Highway Projects & Facilities in Boston
The Economic Impact of the Massachusetts Turnpike Authority 25
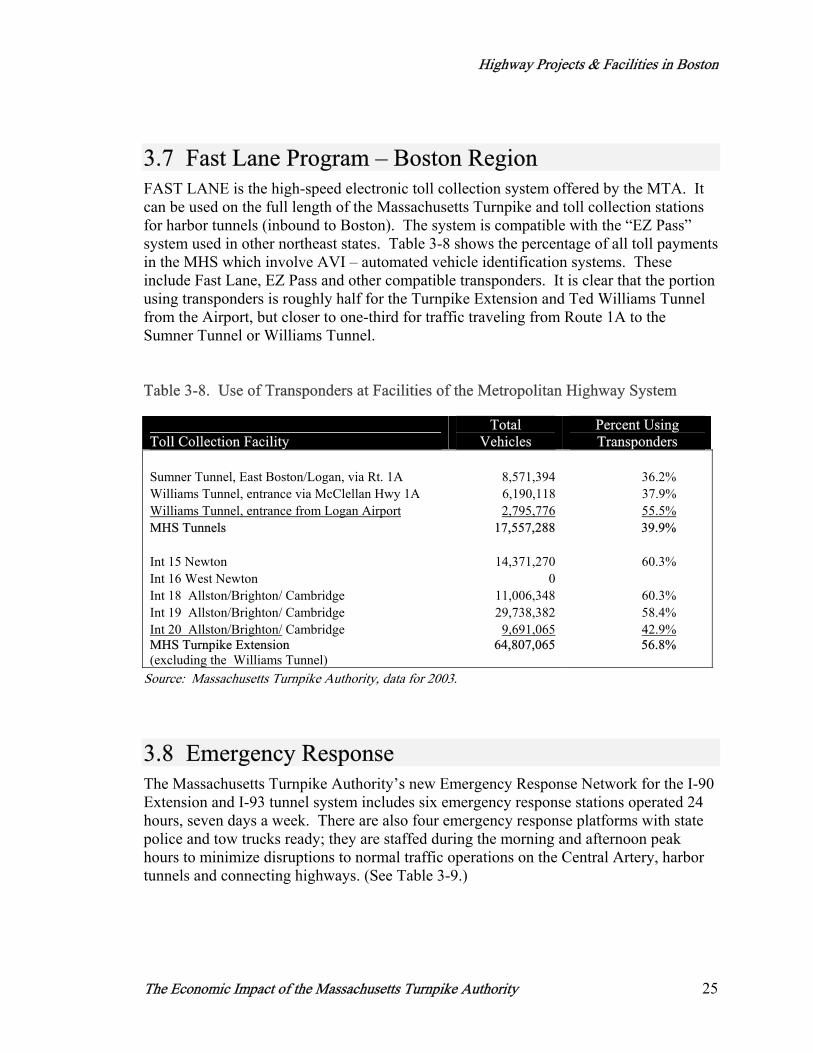
3.7 Fast Lane Program – Boston Region FAST LANE is the high-speed electronic toll collection system offered by the MTA. It can be used on the full length of the Massachusetts Turnpike and toll collection stations for harbor tunnels (inbound to Boston). The system is compatible with the “EZ Pass” system used in other northeast states. Table 3-8 shows the percentage of all toll payments in the MHS which involve AVI – automated vehicle identification systems. These include Fast Lane, EZ Pass and other compatible transponders. It is clear that the portion using transponders is roughly half for the Turnpike Extension and Ted Williams Tunnel from the Airport, but closer to one-third for traffic traveling from Route 1A to the Sumner Tunnel or Williams Tunnel. Table 3-8. Use of Transponders at Facilities of the Metropolitan Highway System
Toll Collection Facility Total
Vehicles Percent Using Transponders
Sumner Tunnel, East Boston/Logan, via Rt. 1A 8,571,394 36.2% Williams Tunnel, entrance via McClellan Hwy 1A 6,190,118 37.9% Williams Tunnel, entrance from Logan Airport 2,795,776 55.5% MHS Tunnels 17,557,288 39.9% Int 15 Newton 14,371,270 60.3% Int 16 West Newton 0 Int 18 Allston/Brighton/ Cambridge 11,006,348 60.3% Int 19 Allston/Brighton/ Cambridge 29,738,382 58.4% Int 20 Allston/Brighton/ Cambridge 9,691,065 42.9% MHS Turnpike Extension (excluding the Williams Tunnel)
64,807,065 56.8%
Source: Massachusetts Turnpike Authority, data for 2003.
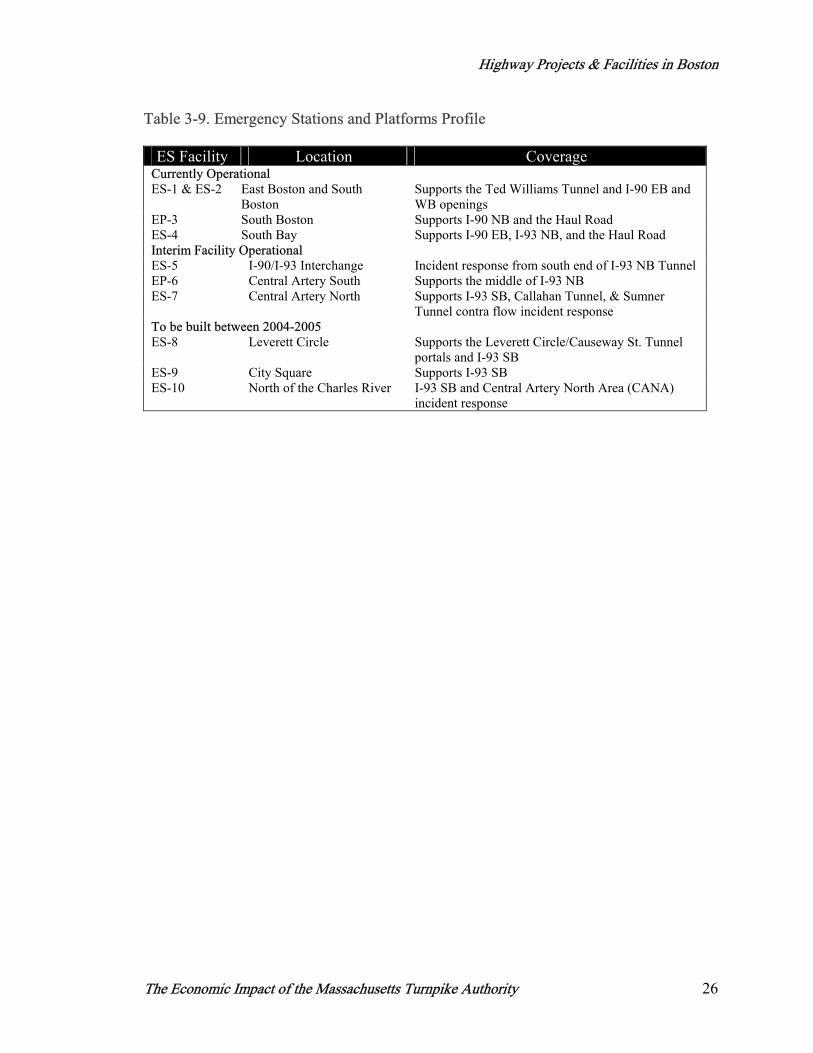
3.8 Emergency Response The Massachusetts Turnpike Authority’s new Emergency Response Network for the I-90 Extension and I-93 tunnel system includes six emergency response stations operated 24 hours, seven days a week. There are also four emergency response platforms with state police and tow trucks ready; they are staffed during the morning and afternoon peak hours to minimize disruptions to normal traffic operations on the Central Artery, harbor tunnels and connecting highways. (See Table 3-9.)
Highway Projects & Facilities in Boston
The Economic Impact of the Massachusetts Turnpike Authority 26
Table 3-9. Emergency Stations and Platforms Profile
ES Facility Location Coverage Currently Operational ES-1 & ES-2 East Boston and South
Boston Supports the Ted Williams Tunnel and I-90 EB and WB openings
EP-3 South Boston Supports I-90 NB and the Haul Road ES-4 South Bay Supports I-90 EB, I-93 NB, and the Haul Road Interim Facility Operational ES-5 I-90/I-93 Interchange Incident response from south end of I-93 NB Tunnel EP-6 Central Artery South Supports the middle of I-93 NB ES-7 Central Artery North Supports I-93 SB, Callahan Tunnel, & Sumner
Tunnel contra flow incident response To be built between 2004-2005 ES-8 Leverett Circle Supports the Leverett Circle/Causeway St. Tunnel
portals and I-93 SB ES-9 City Square Supports I-93 SB ES-10 North of the Charles River I-93 SB and Central Artery North Area (CANA)
incident response
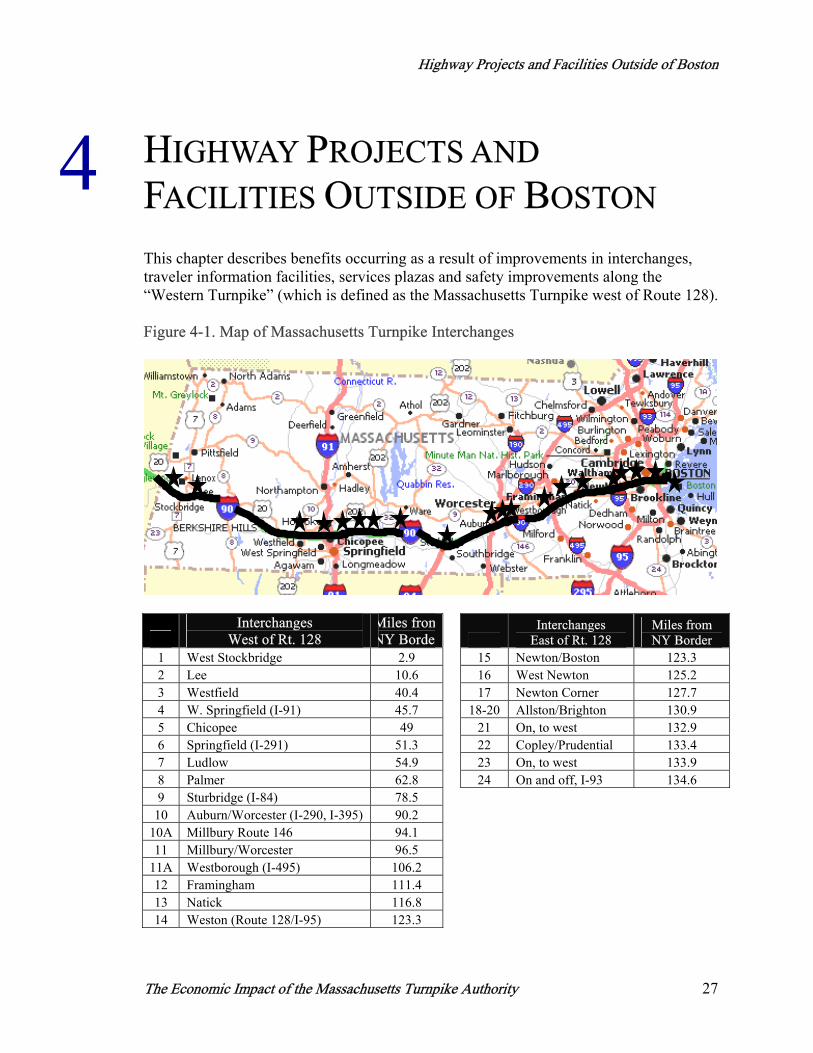
Highway Projects and Facilities Outside of Boston
The Economic Impact of the Massachusetts Turnpike Authority 27
HIGHWAY PROJECTS AND FACILITIES OUTSIDE OF BOSTON This chapter describes benefits occurring as a result of improvements in interchanges, traveler information facilities, services plazas and safety improvements along the “Western Turnpike” (which is defined as the Massachusetts Turnpike west of Route 128). Figure 4-1. Map of Massachusetts Turnpike Interchanges
Interchanges
West of Rt. 128 Miles from NY Border
Interchanges East of Rt. 128
Miles from NY Border
1 West Stockbridge 2.9 15 Newton/Boston 123.3 2 Lee 10.6 16 West Newton 125.2 3 Westfield 40.4 17 Newton Corner 127.7 4 W. Springfield (I-91) 45.7 18-20 Allston/Brighton 130.9 5 Chicopee 49 21 On, to west 132.9 6 Springfield (I-291) 51.3 22 Copley/Prudential 133.4 7 Ludlow 54.9 23 On, to west 133.9 8 Palmer 62.8 24 On and off, I-93 134.6 9 Sturbridge (I-84) 78.5
10 Auburn/Worcester (I-290, I-395) 90.2 10A Millbury Route 146 94.1 11 Millbury/Worcester 96.5
11A Westborough (I-495) 106.2 12 Framingham 111.4 13 Natick 116.8 14 Weston (Route 128/I-95) 123.3
4
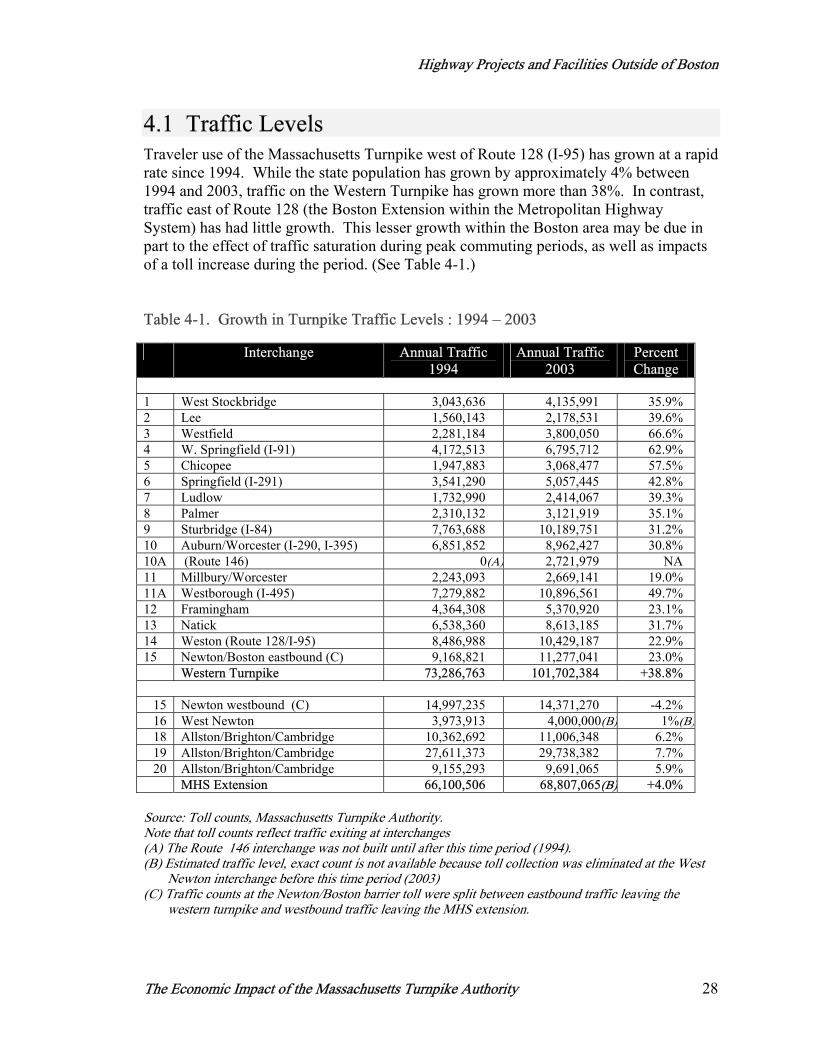
Highway Projects and Facilities Outside of Boston
The Economic Impact of the Massachusetts Turnpike Authority 28
4.1 Traffic Levels Traveler use of the Massachusetts Turnpike west of Route 128 (I-95) has grown at a rapid rate since 1994. While the state population has grown by approximately 4% between 1994 and 2003, traffic on the Western Turnpike has grown more than 38%. In contrast, traffic east of Route 128 (the Boston Extension within the Metropolitan Highway System) has had little growth. This lesser growth within the Boston area may be due in part to the effect of traffic saturation during peak commuting periods, as well as impacts of a toll increase during the period. (See Table 4-1.) Table 4-1. Growth in Turnpike Traffic Levels : 1994 – 2003
Source: Toll counts, Massachusetts Turnpike Authority. Note that toll counts reflect traffic exiting at interchanges (A) The Route 146 interchange was not built until after this time period (1994). (B) Estimated traffic level, exact count is not available because toll collection was eliminated at the West
Newton interchange before this time period (2003) (C) Traffic counts at the Newton/Boston barrier toll were split between eastbound traffic leaving the
western turnpike and westbound traffic leaving the MHS extension.
Interchange Annual Traffic 1994
Annual Traffic 2003
Percent Change
1 West Stockbridge 3,043,636 4,135,991 35.9% 2 Lee 1,560,143 2,178,531 39.6% 3 Westfield 2,281,184 3,800,050 66.6% 4 W. Springfield (I-91) 4,172,513 6,795,712 62.9% 5 Chicopee 1,947,883 3,068,477 57.5% 6 Springfield (I-291) 3,541,290 5,057,445 42.8% 7 Ludlow 1,732,990 2,414,067 39.3% 8 Palmer 2,310,132 3,121,919 35.1% 9 Sturbridge (I-84) 7,763,688 10,189,751 31.2% 10 Auburn/Worcester (I-290, I-395) 6,851,852 8,962,427 30.8% 10A (Route 146) 0(A) 2,721,979 NA 11 Millbury/Worcester 2,243,093 2,669,141 19.0% 11A Westborough (I-495) 7,279,882 10,896,561 49.7% 12 Framingham 4,364,308 5,370,920 23.1% 13 Natick 6,538,360 8,613,185 31.7% 14 Weston (Route 128/I-95) 8,486,988 10,429,187 22.9% 15 Newton/Boston eastbound (C) 9,168,821 11,277,041 23.0% Western Turnpike 73,286,763 101,702,384 +38.8%
15 Newton westbound (C) 14,997,235 14,371,270 -4.2% 16 West Newton 3,973,913 4,000,000(B) 1%(B)18 Allston/Brighton/Cambridge 10,362,692 11,006,348 6.2% 19 Allston/Brighton/Cambridge 27,611,373 29,738,382 7.7% 20 Allston/Brighton/Cambridge 9,155,293 9,691,065 5.9%
MHS Extension 66,100,506 68,807,065(B) +4.0%
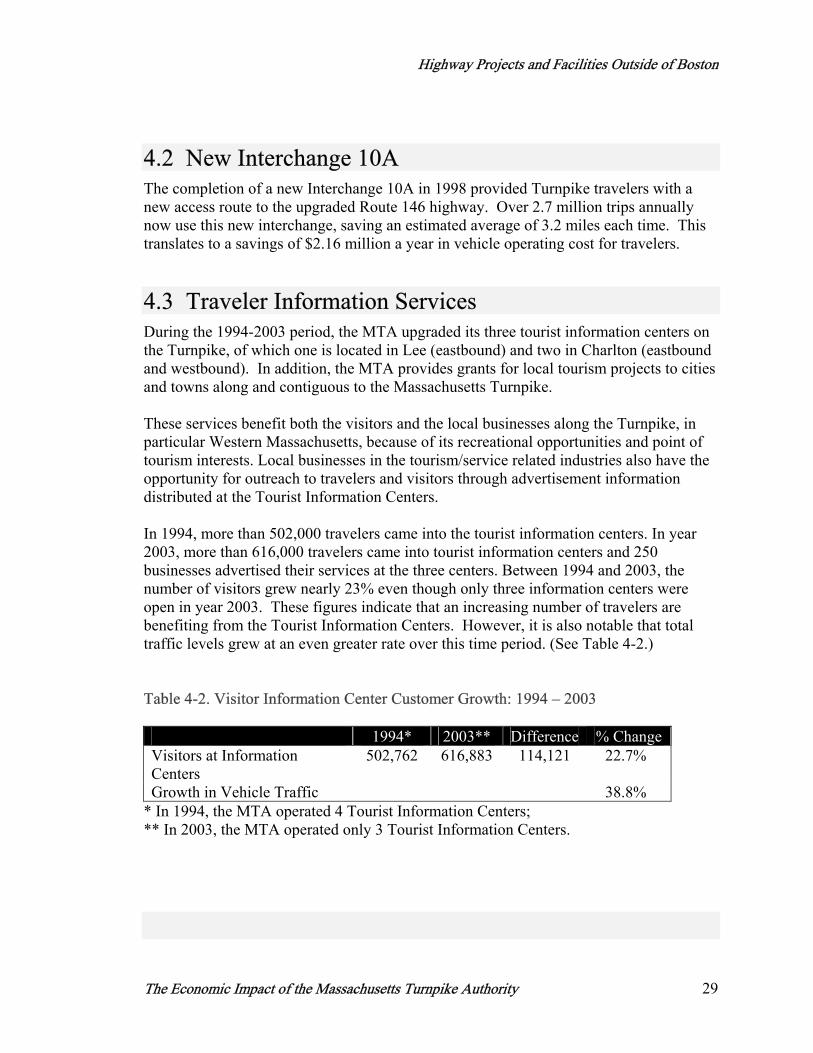
Highway Projects and Facilities Outside of Boston
The Economic Impact of the Massachusetts Turnpike Authority 29
4.2 New Interchange 10A The completion of a new Interchange 10A in 1998 provided Turnpike travelers with a new access route to the upgraded Route 146 highway. Over 2.7 million trips annually now use this new interchange, saving an estimated average of 3.2 miles each time. This translates to a savings of $2.16 million a year in vehicle operating cost for travelers.
4.3 Traveler Information Services During the 1994-2003 period, the MTA upgraded its three tourist information centers on the Turnpike, of which one is located in Lee (eastbound) and two in Charlton (eastbound and westbound). In addition, the MTA provides grants for local tourism projects to cities and towns along and contiguous to the Massachusetts Turnpike. These services benefit both the visitors and the local businesses along the Turnpike, in particular Western Massachusetts, because of its recreational opportunities and point of tourism interests. Local businesses in the tourism/service related industries also have the opportunity for outreach to travelers and visitors through advertisement information distributed at the Tourist Information Centers. In 1994, more than 502,000 travelers came into the tourist information centers. In year 2003, more than 616,000 travelers came into tourist information centers and 250 businesses advertised their services at the three centers. Between 1994 and 2003, the number of visitors grew nearly 23% even though only three information centers were open in year 2003. These figures indicate that an increasing number of travelers are benefiting from the Tourist Information Centers. However, it is also notable that total traffic levels grew at an even greater rate over this time period. (See Table 4-2.) Table 4-2. Visitor Information Center Customer Growth: 1994 – 2003 1994* 2003** Difference % Change Visitors at Information Centers
502,762 616,883 114,121 22.7%
Growth in Vehicle Traffic 38.8% * In 1994, the MTA operated 4 Tourist Information Centers; ** In 2003, the MTA operated only 3 Tourist Information Centers.
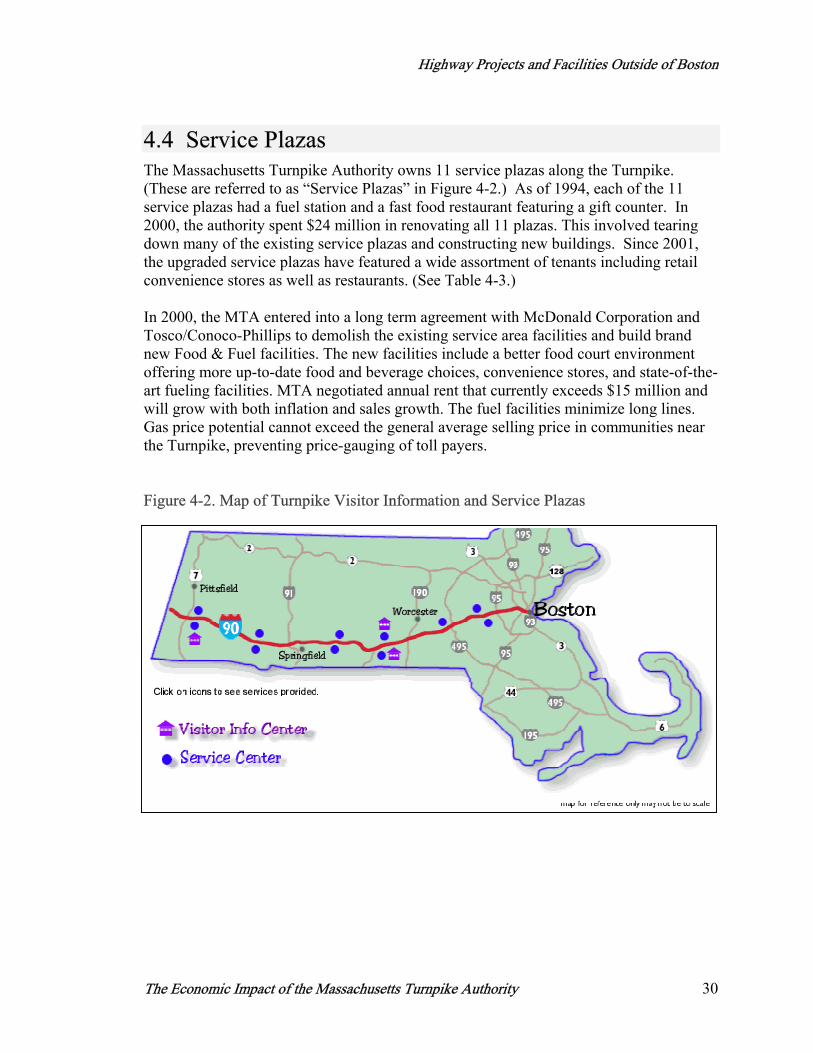
Highway Projects and Facilities Outside of Boston
The Economic Impact of the Massachusetts Turnpike Authority 30
4.4 Service Plazas The Massachusetts Turnpike Authority owns 11 service plazas along the Turnpike. (These are referred to as “Service Plazas” in Figure 4-2.) As of 1994, each of the 11 service plazas had a fuel station and a fast food restaurant featuring a gift counter. In 2000, the authority spent $24 million in renovating all 11 plazas. This involved tearing down many of the existing service plazas and constructing new buildings. Since 2001, the upgraded service plazas have featured a wide assortment of tenants including retail convenience stores as well as restaurants. (See Table 4-3.) In 2000, the MTA entered into a long term agreement with McDonald Corporation and Tosco/Conoco-Phillips to demolish the existing service area facilities and build brand new Food & Fuel facilities. The new facilities include a better food court environment offering more up-to-date food and beverage choices, convenience stores, and state-of-the-art fueling facilities. MTA negotiated annual rent that currently exceeds $15 million and will grow with both inflation and sales growth. The fuel facilities minimize long lines. Gas price potential cannot exceed the general average selling price in communities near the Turnpike, preventing price-gauging of toll payers. Figure 4-2. Map of Turnpike Visitor Information and Service Plazas
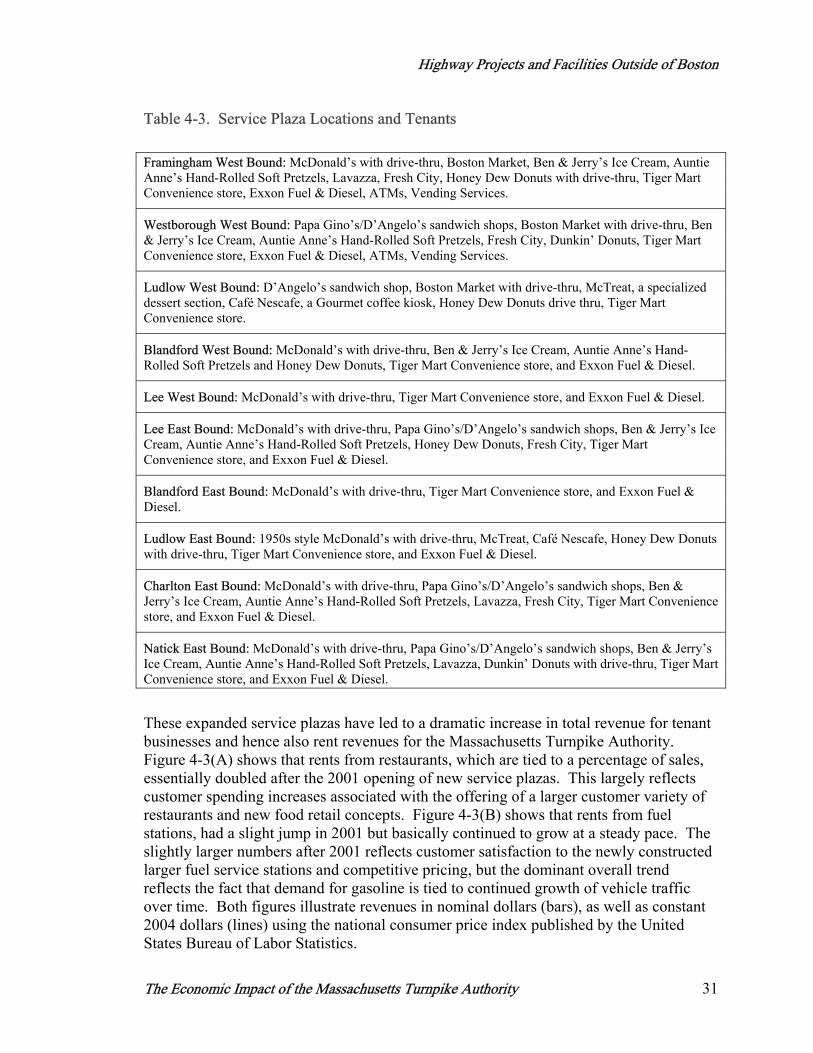
Highway Projects and Facilities Outside of Boston
The Economic Impact of the Massachusetts Turnpike Authority 31
Table 4-3. Service Plaza Locations and Tenants Framingham West Bound: McDonald’s with drive-thru, Boston Market, Ben & Jerry’s Ice Cream, Auntie Anne’s Hand-Rolled Soft Pretzels, Lavazza, Fresh City, Honey Dew Donuts with drive-thru, Tiger Mart Convenience store, Exxon Fuel & Diesel, ATMs, Vending Services.
Westborough West Bound: Papa Gino’s/D’Angelo’s sandwich shops, Boston Market with drive-thru, Ben & Jerry’s Ice Cream, Auntie Anne’s Hand-Rolled Soft Pretzels, Fresh City, Dunkin’ Donuts, Tiger Mart Convenience store, Exxon Fuel & Diesel, ATMs, Vending Services.
Ludlow West Bound: D’Angelo’s sandwich shop, Boston Market with drive-thru, McTreat, a specialized dessert section, Café Nescafe, a Gourmet coffee kiosk, Honey Dew Donuts drive thru, Tiger Mart Convenience store.
Blandford West Bound: McDonald’s with drive-thru, Ben & Jerry’s Ice Cream, Auntie Anne’s Hand-Rolled Soft Pretzels and Honey Dew Donuts, Tiger Mart Convenience store, and Exxon Fuel & Diesel.
Lee West Bound: McDonald’s with drive-thru, Tiger Mart Convenience store, and Exxon Fuel & Diesel.
Lee East Bound: McDonald’s with drive-thru, Papa Gino’s/D’Angelo’s sandwich shops, Ben & Jerry’s Ice Cream, Auntie Anne’s Hand-Rolled Soft Pretzels, Honey Dew Donuts, Fresh City, Tiger Mart Convenience store, and Exxon Fuel & Diesel.
Blandford East Bound: McDonald’s with drive-thru, Tiger Mart Convenience store, and Exxon Fuel & Diesel.
Ludlow East Bound: 1950s style McDonald’s with drive-thru, McTreat, Café Nescafe, Honey Dew Donuts with drive-thru, Tiger Mart Convenience store, and Exxon Fuel & Diesel.
Charlton East Bound: McDonald’s with drive-thru, Papa Gino’s/D’Angelo’s sandwich shops, Ben & Jerry’s Ice Cream, Auntie Anne’s Hand-Rolled Soft Pretzels, Lavazza, Fresh City, Tiger Mart Convenience store, and Exxon Fuel & Diesel.
Natick East Bound: McDonald’s with drive-thru, Papa Gino’s/D’Angelo’s sandwich shops, Ben & Jerry’s Ice Cream, Auntie Anne’s Hand-Rolled Soft Pretzels, Lavazza, Dunkin’ Donuts with drive-thru, Tiger Mart Convenience store, and Exxon Fuel & Diesel.
These expanded service plazas have led to a dramatic increase in total revenue for tenant businesses and hence also rent revenues for the Massachusetts Turnpike Authority. Figure 4-3(A) shows that rents from restaurants, which are tied to a percentage of sales, essentially doubled after the 2001 opening of new service plazas. This largely reflects customer spending increases associated with the offering of a larger customer variety of restaurants and new food retail concepts. Figure 4-3(B) shows that rents from fuel stations, had a slight jump in 2001 but basically continued to grow at a steady pace. The slightly larger numbers after 2001 reflects customer satisfaction to the newly constructed larger fuel service stations and competitive pricing, but the dominant overall trend reflects the fact that demand for gasoline is tied to continued growth of vehicle traffic over time. Both figures illustrate revenues in nominal dollars (bars), as well as constant 2004 dollars (lines) using the national consumer price index published by the United States Bureau of Labor Statistics.
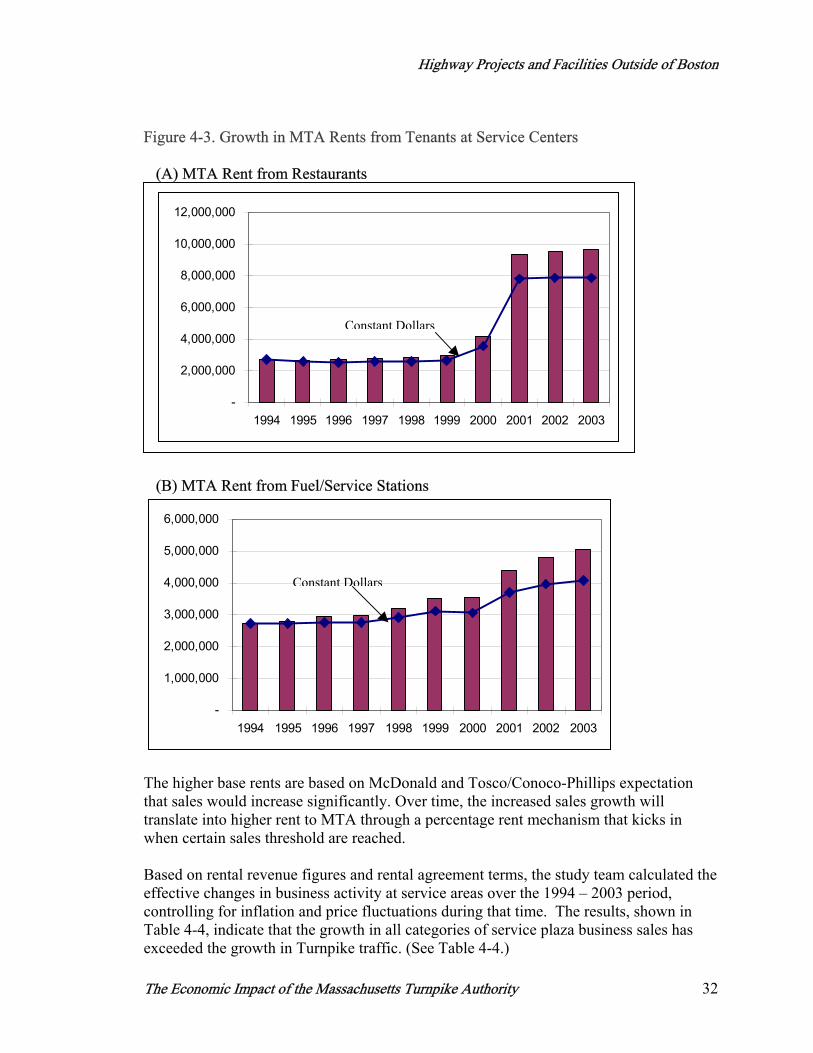
Highway Projects and Facilities Outside of Boston
The Economic Impact of the Massachusetts Turnpike Authority 32
Figure 4-3. Growth in MTA Rents from Tenants at Service Centers (A) MTA Rent from Restaurants
(B) MTA Rent from Fuel/Service Stations
-
1,000,000
2,000,000
3,000,000
4,000,000
5,000,000
6,000,000
1994 1995 1996 1997 1998 1999 2000 2001 2002 2003
The higher base rents are based on McDonald and Tosco/Conoco-Phillips expectation that sales would increase significantly. Over time, the increased sales growth will translate into higher rent to MTA through a percentage rent mechanism that kicks in when certain sales threshold are reached. Based on rental revenue figures and rental agreement terms, the study team calculated the effective changes in business activity at service areas over the 1994 – 2003 period, controlling for inflation and price fluctuations during that time. The results, shown in Table 4-4, indicate that the growth in all categories of service plaza business sales has exceeded the growth in Turnpike traffic. (See Table 4-4.)
-
2,000,000
4,000,000
6,000,000
8,000,000
10,000,000
12,000,000
1994 1995 1996 1997 1998 1999 2000 2001 2002 2003
Constant Dollars
Constant Dollars
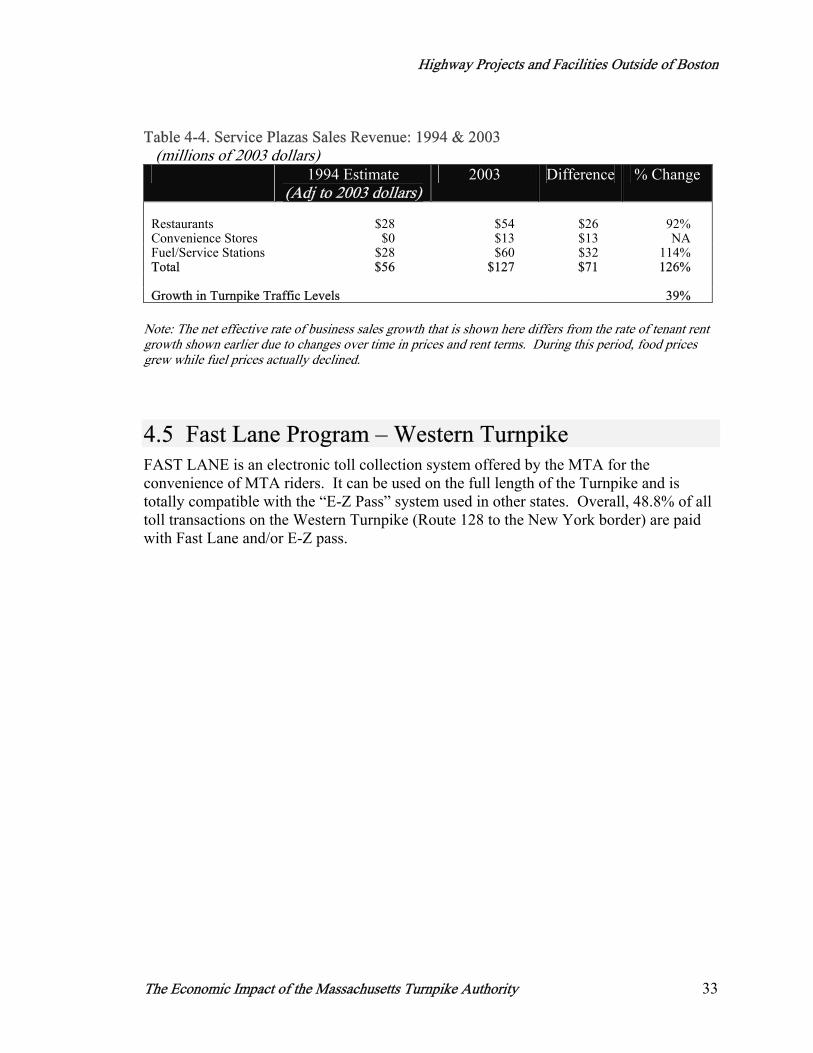
Highway Projects and Facilities Outside of Boston
The Economic Impact of the Massachusetts Turnpike Authority 33
Table 4-4. Service Plazas Sales Revenue: 1994 & 2003 (millions of 2003 dollars) 1994 Estimate
(Adj to 2003 dollars) 2003 Difference % Change
Restaurants $28 $54 $26 92%Convenience Stores $0 $13 $13 NAFuel/Service Stations $28 $60 $32 114%Total $56 $127 $71 126% Growth in Turnpike Traffic Levels 39%
Note: The net effective rate of business sales growth that is shown here differs from the rate of tenant rent growth shown earlier due to changes over time in prices and rent terms. During this period, food prices grew while fuel prices actually declined.
4.5 Fast Lane Program – Western Turnpike FAST LANE is an electronic toll collection system offered by the MTA for the convenience of MTA riders. It can be used on the full length of the Turnpike and is totally compatible with the “E-Z Pass” system used in other states. Overall, 48.8% of all toll transactions on the Western Turnpike (Route 128 to the New York border) are paid with Fast Lane and/or E-Z pass.
The MTA as an Economic Engine
The Economic Impact of the Massachusetts Turnpike Authority 34
THE MTA AS AN EMPLOYER AND CONTRACTOR This chapter describes the economic role played by the Massachusetts Turnpike Authority (and its operations) in supporting jobs and income throughout the Massachusetts economy.
5.1 Definitions and Methodology Economic effects of the MTA can be classified into two categories: • Direct Effects – The Massachusetts Turnpike Authority employs workers and
distributes wages to them. Private companies, which operate restaurant and fuel/service stations at Turnpike-owned service areas, also employ a smaller number of workers and distribute wages to them. The employment, payroll and total sales revenue or spending of these organizations comprise the direct economic effects.
• “Spin-off” Effects – There are additional economic impacts throughout the
Massachusetts economy as a result of two types of spin-off effects. First, the Turnpike Authority and its tenants purchase a wide variety of goods and services from vendors. The jobs, income and business sales of those vendors are commonly referred to as “indirect effects.” In addition, the workers employed at the MTA, its tenants and the various vendors all respend much of their income on purchases of food, clothing, housing, entertainment, consumer and personal services. This generates even broader impacts on business sales in those industries. These other impacts are commonly referred to as “induced effects.”
During the year 2004, the consultant study team worked with MTA staff to profile the nature of the MTA budget and the various elements of payroll and vendor expenses. Complete information was compiled for the year 2003. Additional analysis was conducted to establish that these annual costs (except for special Central Artery/Tunnel startup expenses which are noted) have been recurring annually at roughly the same level each year. The study team then applied an economic model of the Massachusetts economy (IMPLAN input-output model) to estimate the extent to which businesses and jobs in other industries within the State are also supported by these activities.
5
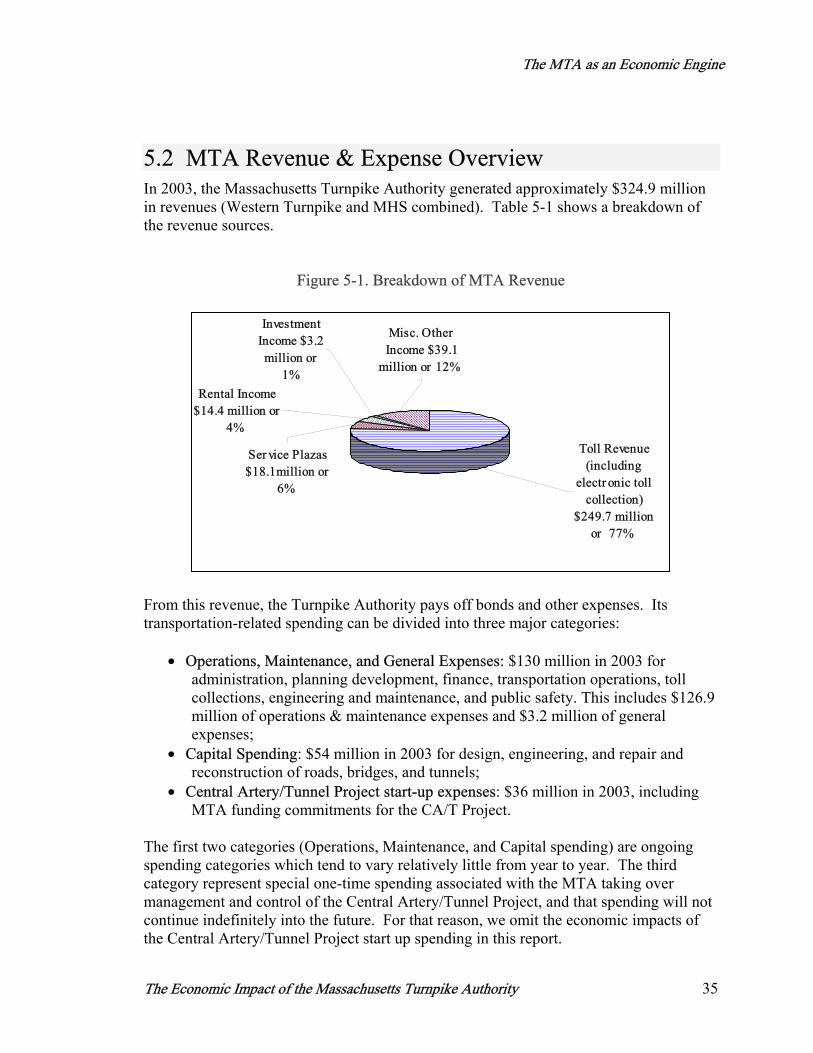
The MTA as an Economic Engine
The Economic Impact of the Massachusetts Turnpike Authority 35
5.2 MTA Revenue & Expense Overview In 2003, the Massachusetts Turnpike Authority generated approximately $324.9 million in revenues (Western Turnpike and MHS combined). Table 5-1 shows a breakdown of the revenue sources.
Figure 5-1. Breakdown of MTA Revenue
Investment
Income $3.2 million or
1%Rental Income
$14.4 million or 4%
Misc. Other Income $39.1
million or 12%
Ser vice Plazas $18.1million or
6%
Toll Revenue (including
electr onic toll collection)
$249.7 million or 77%
From this revenue, the Turnpike Authority pays off bonds and other expenses. Its transportation-related spending can be divided into three major categories:
• Operations, Maintenance, and General Expenses: $130 million in 2003 for administration, planning development, finance, transportation operations, toll collections, engineering and maintenance, and public safety. This includes $126.9 million of operations & maintenance expenses and $3.2 million of general expenses;
• Capital Spending: $54 million in 2003 for design, engineering, and repair and reconstruction of roads, bridges, and tunnels;
• Central Artery/Tunnel Project start-up expenses: $36 million in 2003, including MTA funding commitments for the CA/T Project.
The first two categories (Operations, Maintenance, and Capital spending) are ongoing spending categories which tend to vary relatively little from year to year. The third category represent special one-time spending associated with the MTA taking over management and control of the Central Artery/Tunnel Project, and that spending will not continue indefinitely into the future. For that reason, we omit the economic impacts of the Central Artery/Tunnel Project start up spending in this report.
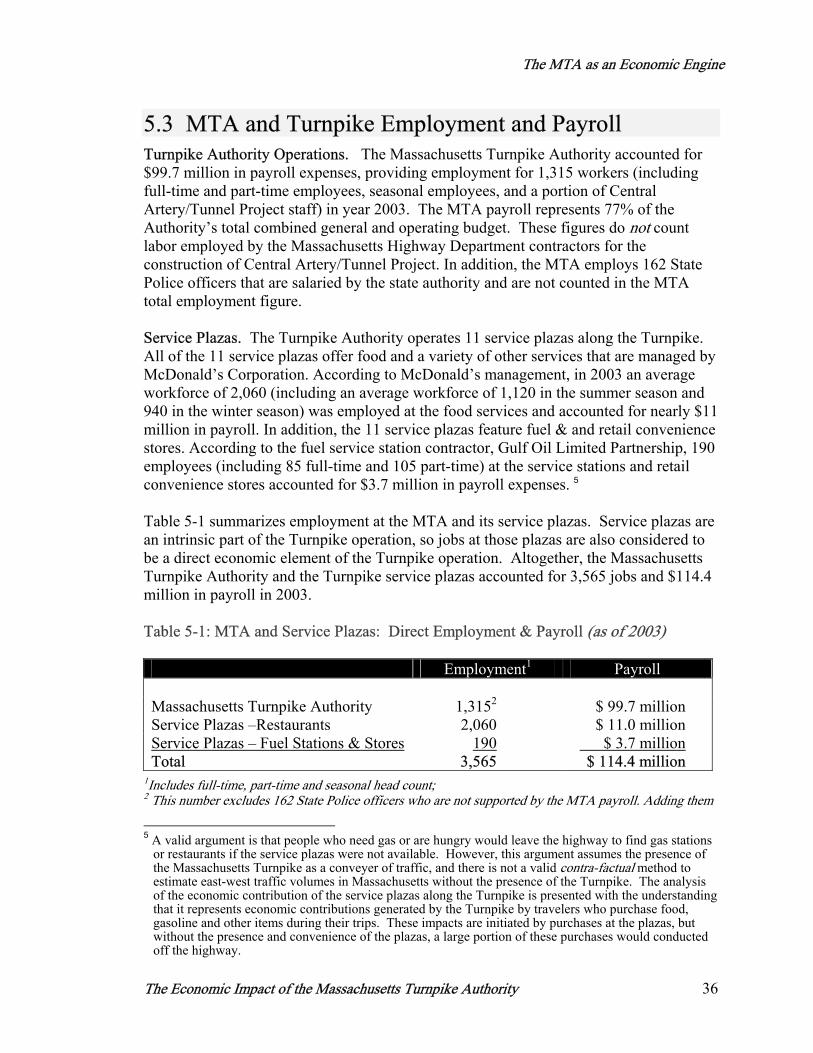
The MTA as an Economic Engine
The Economic Impact of the Massachusetts Turnpike Authority 36
5.3 MTA and Turnpike Employment and Payroll Turnpike Authority Operations. The Massachusetts Turnpike Authority accounted for $99.7 million in payroll expenses, providing employment for 1,315 workers (including full-time and part-time employees, seasonal employees, and a portion of Central Artery/Tunnel Project staff) in year 2003. The MTA payroll represents 77% of the Authority’s total combined general and operating budget. These figures do not count labor employed by the Massachusetts Highway Department contractors for the construction of Central Artery/Tunnel Project. In addition, the MTA employs 162 State Police officers that are salaried by the state authority and are not counted in the MTA total employment figure. Service Plazas. The Turnpike Authority operates 11 service plazas along the Turnpike. All of the 11 service plazas offer food and a variety of other services that are managed by McDonald’s Corporation. According to McDonald’s management, in 2003 an average workforce of 2,060 (including an average workforce of 1,120 in the summer season and 940 in the winter season) was employed at the food services and accounted for nearly $11 million in payroll. In addition, the 11 service plazas feature fuel & and retail convenience stores. According to the fuel service station contractor, Gulf Oil Limited Partnership, 190 employees (including 85 full-time and 105 part-time) at the service stations and retail convenience stores accounted for $3.7 million in payroll expenses. 5 Table 5-1 summarizes employment at the MTA and its service plazas. Service plazas are an intrinsic part of the Turnpike operation, so jobs at those plazas are also considered to be a direct economic element of the Turnpike operation. Altogether, the Massachusetts Turnpike Authority and the Turnpike service plazas accounted for 3,565 jobs and $114.4 million in payroll in 2003. Table 5-1: MTA and Service Plazas: Direct Employment & Payroll (as of 2003) Employment1 Payroll Massachusetts Turnpike Authority 1,3152 $ 99.7 million Service Plazas –Restaurants 2,060 $ 11.0 million Service Plazas – Fuel Stations & Stores 190 $ 3.7 million Total 3,565 $ 114.4 million
1Includes full-time, part-time and seasonal head count; 2 This number excludes 162 State Police officers who are not supported by the MTA payroll. Adding them
5 A valid argument is that people who need gas or are hungry would leave the highway to find gas stations
or restaurants if the service plazas were not available. However, this argument assumes the presence of the Massachusetts Turnpike as a conveyer of traffic, and there is not a valid contra-factual method to estimate east-west traffic volumes in Massachusetts without the presence of the Turnpike. The analysis of the economic contribution of the service plazas along the Turnpike is presented with the understanding that it represents economic contributions generated by the Turnpike by travelers who purchase food, gasoline and other items during their trips. These impacts are initiated by purchases at the plazas, but without the presence and convenience of the plazas, a large portion of these purchases would conducted off the highway.
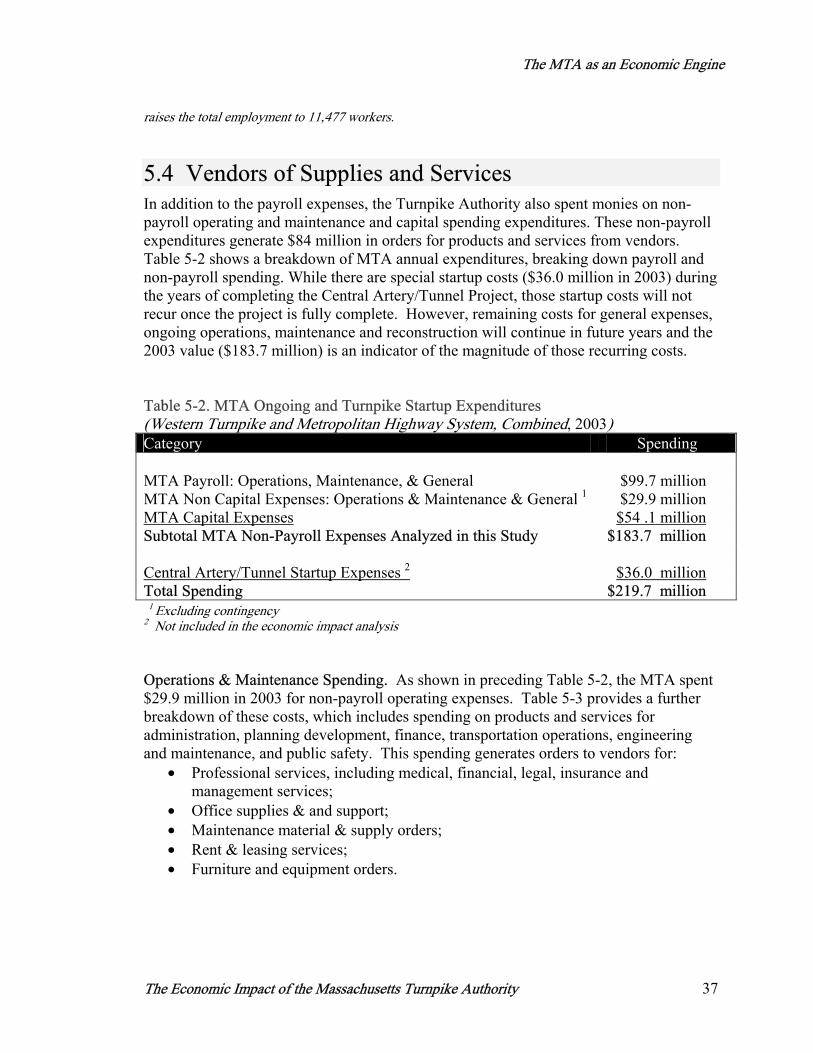
The MTA as an Economic Engine
The Economic Impact of the Massachusetts Turnpike Authority 37
raises the total employment to 11,477 workers.
5.4 Vendors of Supplies and Services In addition to the payroll expenses, the Turnpike Authority also spent monies on non-payroll operating and maintenance and capital spending expenditures. These non-payroll expenditures generate $84 million in orders for products and services from vendors. Table 5-2 shows a breakdown of MTA annual expenditures, breaking down payroll and non-payroll spending. While there are special startup costs ($36.0 million in 2003) during the years of completing the Central Artery/Tunnel Project, those startup costs will not recur once the project is fully complete. However, remaining costs for general expenses, ongoing operations, maintenance and reconstruction will continue in future years and the 2003 value ($183.7 million) is an indicator of the magnitude of those recurring costs. Table 5-2. MTA Ongoing and Turnpike Startup Expenditures (Western Turnpike and Metropolitan Highway System, Combined, 2003) Category Spending MTA Payroll: Operations, Maintenance, & General $99.7 million MTA Non Capital Expenses: Operations & Maintenance & General 1 $29.9 million MTA Capital Expenses $54 .1 million Subtotal MTA Non-Payroll Expenses Analyzed in this Study $183.7 million Central Artery/Tunnel Startup Expenses 2 $36.0 million Total Spending $219.7 million
1 Excluding contingency 2 Not included in the economic impact analysis
Operations & Maintenance Spending. As shown in preceding Table 5-2, the MTA spent $29.9 million in 2003 for non-payroll operating expenses. Table 5-3 provides a further breakdown of these costs, which includes spending on products and services for administration, planning development, finance, transportation operations, engineering and maintenance, and public safety. This spending generates orders to vendors for:
• Professional services, including medical, financial, legal, insurance and management services;
• Office supplies & and support; • Maintenance material & supply orders; • Rent & leasing services; • Furniture and equipment orders.
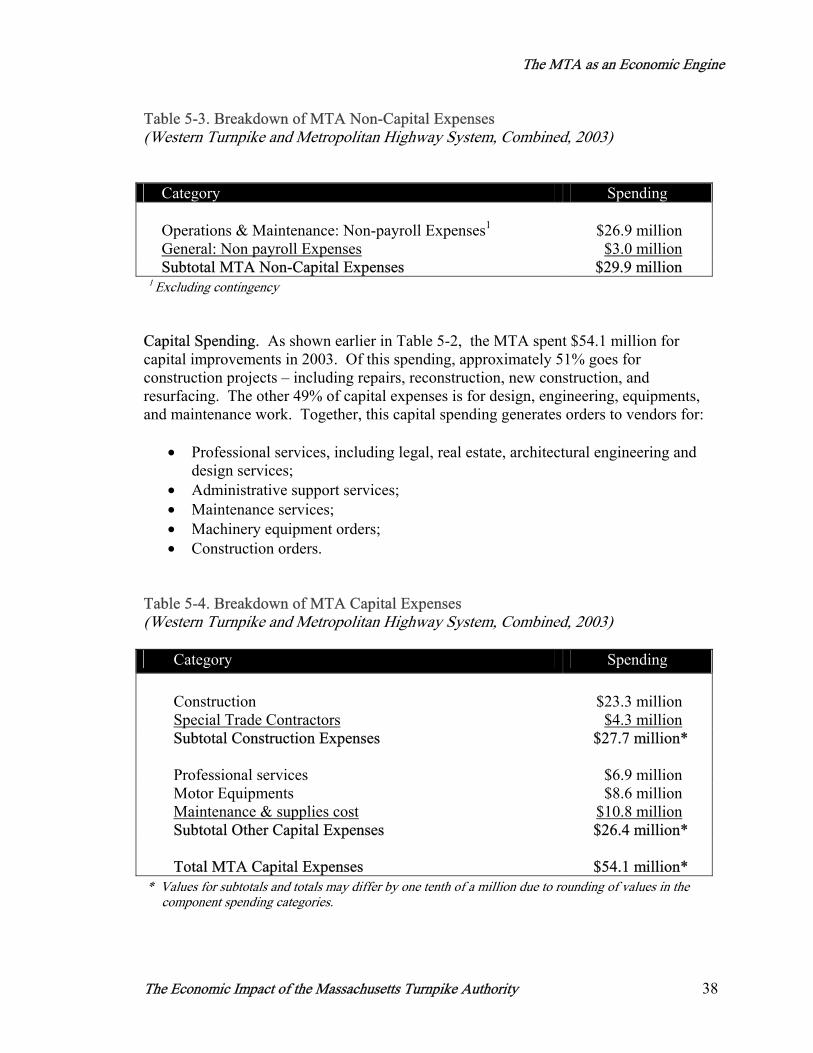
The MTA as an Economic Engine
The Economic Impact of the Massachusetts Turnpike Authority 38
Table 5-3. Breakdown of MTA Non-Capital Expenses (Western Turnpike and Metropolitan Highway System, Combined, 2003)
Category Spending Operations & Maintenance: Non-payroll Expenses1 $26.9 million General: Non payroll Expenses $3.0 million Subtotal MTA Non-Capital Expenses $29.9 million
1 Excluding contingency
Capital Spending. As shown earlier in Table 5-2, the MTA spent $54.1 million for capital improvements in 2003. Of this spending, approximately 51% goes for construction projects – including repairs, reconstruction, new construction, and resurfacing. The other 49% of capital expenses is for design, engineering, equipments, and maintenance work. Together, this capital spending generates orders to vendors for:
• Professional services, including legal, real estate, architectural engineering and design services;
• Administrative support services; • Maintenance services; • Machinery equipment orders; • Construction orders.
Table 5-4. Breakdown of MTA Capital Expenses (Western Turnpike and Metropolitan Highway System, Combined, 2003)
Category Spending Construction $23.3 million Special Trade Contractors $4.3 million Subtotal Construction Expenses $27.7 million* Professional services $6.9 million Motor Equipments $8.6 million Maintenance & supplies cost $10.8 million Subtotal Other Capital Expenses $26.4 million* Total MTA Capital Expenses $54.1 million*
* Values for subtotals and totals may differ by one tenth of a million due to rounding of values in the component spending categories.
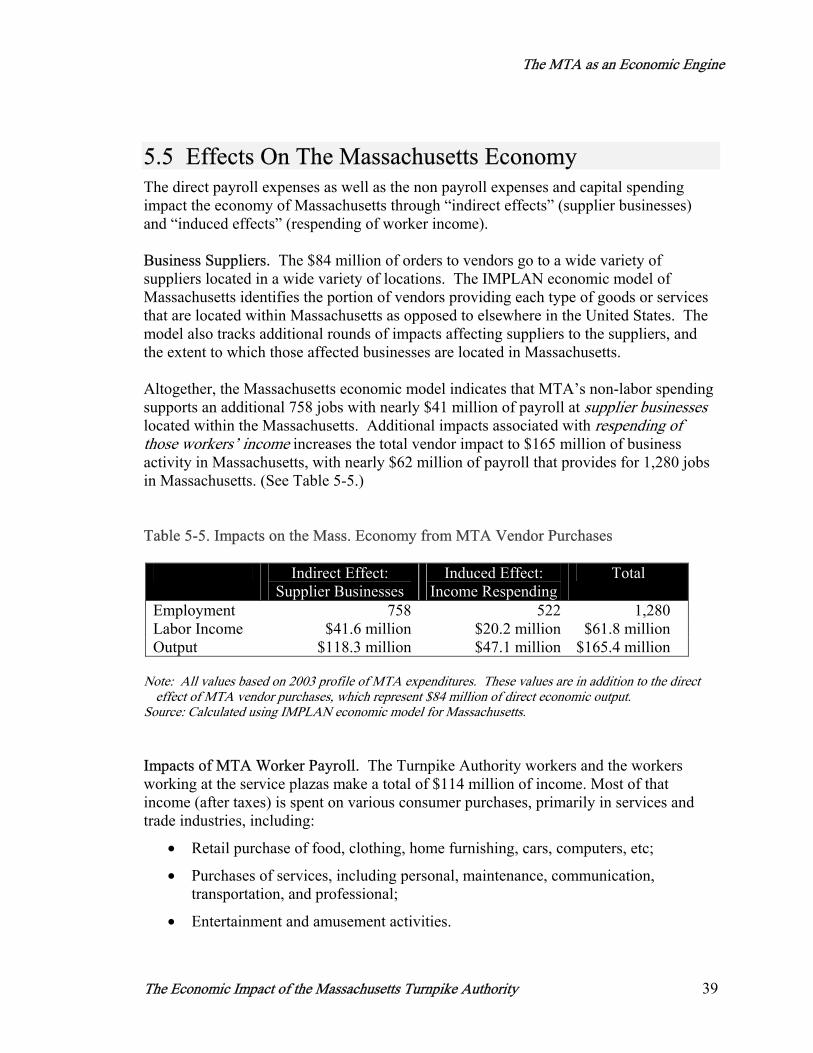
The MTA as an Economic Engine
The Economic Impact of the Massachusetts Turnpike Authority 39
5.5 Effects On The Massachusetts Economy The direct payroll expenses as well as the non payroll expenses and capital spending impact the economy of Massachusetts through “indirect effects” (supplier businesses) and “induced effects” (respending of worker income). Business Suppliers. The $84 million of orders to vendors go to a wide variety of suppliers located in a wide variety of locations. The IMPLAN economic model of Massachusetts identifies the portion of vendors providing each type of goods or services that are located within Massachusetts as opposed to elsewhere in the United States. The model also tracks additional rounds of impacts affecting suppliers to the suppliers, and the extent to which those affected businesses are located in Massachusetts. Altogether, the Massachusetts economic model indicates that MTA’s non-labor spending supports an additional 758 jobs with nearly $41 million of payroll at supplier businesses located within the Massachusetts. Additional impacts associated with respending of those workers’ income increases the total vendor impact to $165 million of business activity in Massachusetts, with nearly $62 million of payroll that provides for 1,280 jobs in Massachusetts. (See Table 5-5.) Table 5-5. Impacts on the Mass. Economy from MTA Vendor Purchases
Indirect Effect: Supplier Businesses
Induced Effect: Income Respending
Total
Employment 758 522 1,280 Labor Income $41.6 million $20.2 million $61.8 million Output $118.3 million $47.1 million $165.4 million
Note: All values based on 2003 profile of MTA expenditures. These values are in addition to the direct
effect of MTA vendor purchases, which represent $84 million of direct economic output. Source: Calculated using IMPLAN economic model for Massachusetts. Impacts of MTA Worker Payroll. The Turnpike Authority workers and the workers working at the service plazas make a total of $114 million of income. Most of that income (after taxes) is spent on various consumer purchases, primarily in services and trade industries, including:
• Retail purchase of food, clothing, home furnishing, cars, computers, etc;
• Purchases of services, including personal, maintenance, communication, transportation, and professional;
• Entertainment and amusement activities.
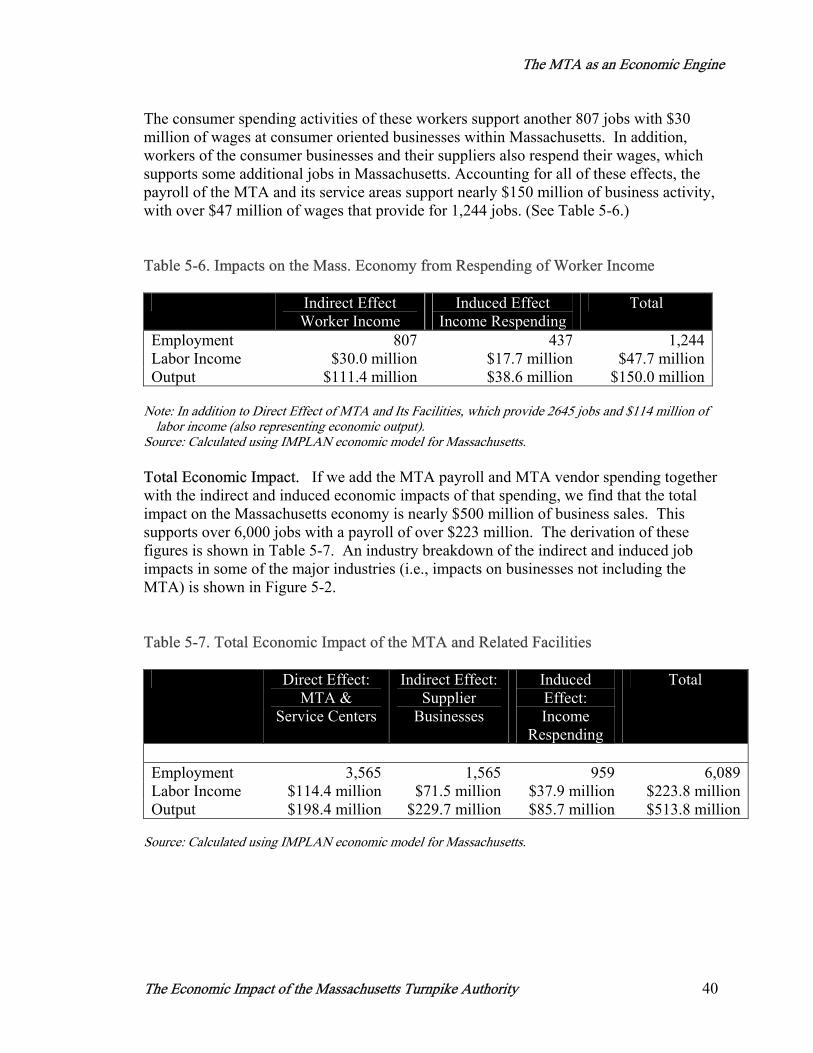
The MTA as an Economic Engine
The Economic Impact of the Massachusetts Turnpike Authority 40
The consumer spending activities of these workers support another 807 jobs with $30 million of wages at consumer oriented businesses within Massachusetts. In addition, workers of the consumer businesses and their suppliers also respend their wages, which supports some additional jobs in Massachusetts. Accounting for all of these effects, the payroll of the MTA and its service areas support nearly $150 million of business activity, with over $47 million of wages that provide for 1,244 jobs. (See Table 5-6.)
Table 5-6. Impacts on the Mass. Economy from Respending of Worker Income Indirect Effect
Worker Income Induced Effect
Income Respending Total
Employment 807 437 1,244Labor Income $30.0 million $17.7 million $47.7 millionOutput $111.4 million $38.6 million $150.0 million
Note: In addition to Direct Effect of MTA and Its Facilities, which provide 2645 jobs and $114 million of
labor income (also representing economic output). Source: Calculated using IMPLAN economic model for Massachusetts. Total Economic Impact. If we add the MTA payroll and MTA vendor spending together with the indirect and induced economic impacts of that spending, we find that the total impact on the Massachusetts economy is nearly $500 million of business sales. This supports over 6,000 jobs with a payroll of over $223 million. The derivation of these figures is shown in Table 5-7. An industry breakdown of the indirect and induced job impacts in some of the major industries (i.e., impacts on businesses not including the MTA) is shown in Figure 5-2. Table 5-7. Total Economic Impact of the MTA and Related Facilities Direct Effect:
MTA & Service Centers
Indirect Effect: Supplier
Businesses
Induced Effect: Income
Respending
Total
Employment 3,565 1,565 959 6,089Labor Income $114.4 million $71.5 million $37.9 million $223.8 millionOutput $198.4 million $229.7 million $85.7 million $513.8 million
Source: Calculated using IMPLAN economic model for Massachusetts.
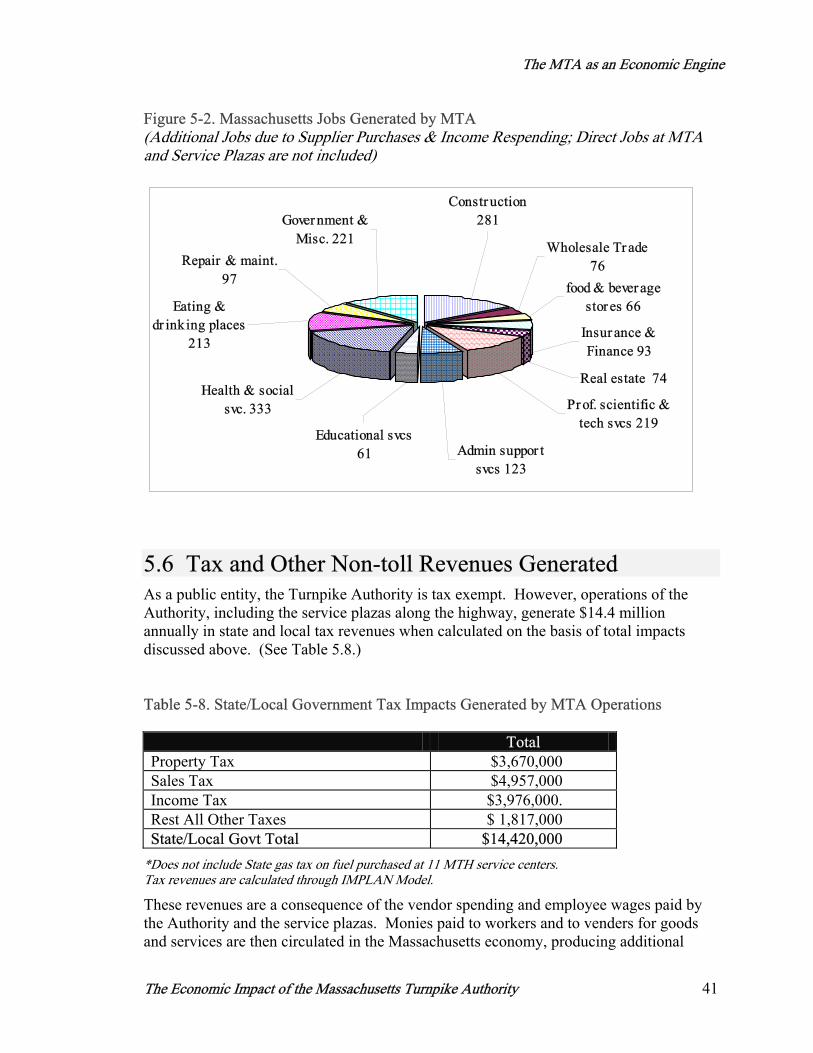
The MTA as an Economic Engine
The Economic Impact of the Massachusetts Turnpike Authority 41
Figure 5-2. Massachusetts Jobs Generated by MTA (Additional Jobs due to Supplier Purchases & Income Respending; Direct Jobs at MTA and Service Plazas are not included)
Educational svcs 61
Health & social svc. 333
Eating & dr inking places
213
Repair & maint. 97
Gover nment & Misc. 221
Construction 281
Wholesale Tr ade 76
food & bever age stores 66
Insur ance & Finance 93
Real estate 74
Pr of. scientific & tech svcs 219
Admin suppor t svcs 123
5.6 Tax and Other Non-toll Revenues Generated As a public entity, the Turnpike Authority is tax exempt. However, operations of the Authority, including the service plazas along the highway, generate $14.4 million annually in state and local tax revenues when calculated on the basis of total impacts discussed above. (See Table 5.8.) Table 5-8. State/Local Government Tax Impacts Generated by MTA Operations Total Property Tax $3,670,000 Sales Tax $4,957,000 Income Tax $3,976,000. Rest All Other Taxes $ 1,817,000 State/Local Govt Total $14,420,000
*Does not include State gas tax on fuel purchased at 11 MTH service centers. Tax revenues are calculated through IMPLAN Model.
These revenues are a consequence of the vendor spending and employee wages paid by the Authority and the service plazas. Monies paid to workers and to venders for goods and services are then circulated in the Massachusetts economy, producing additional
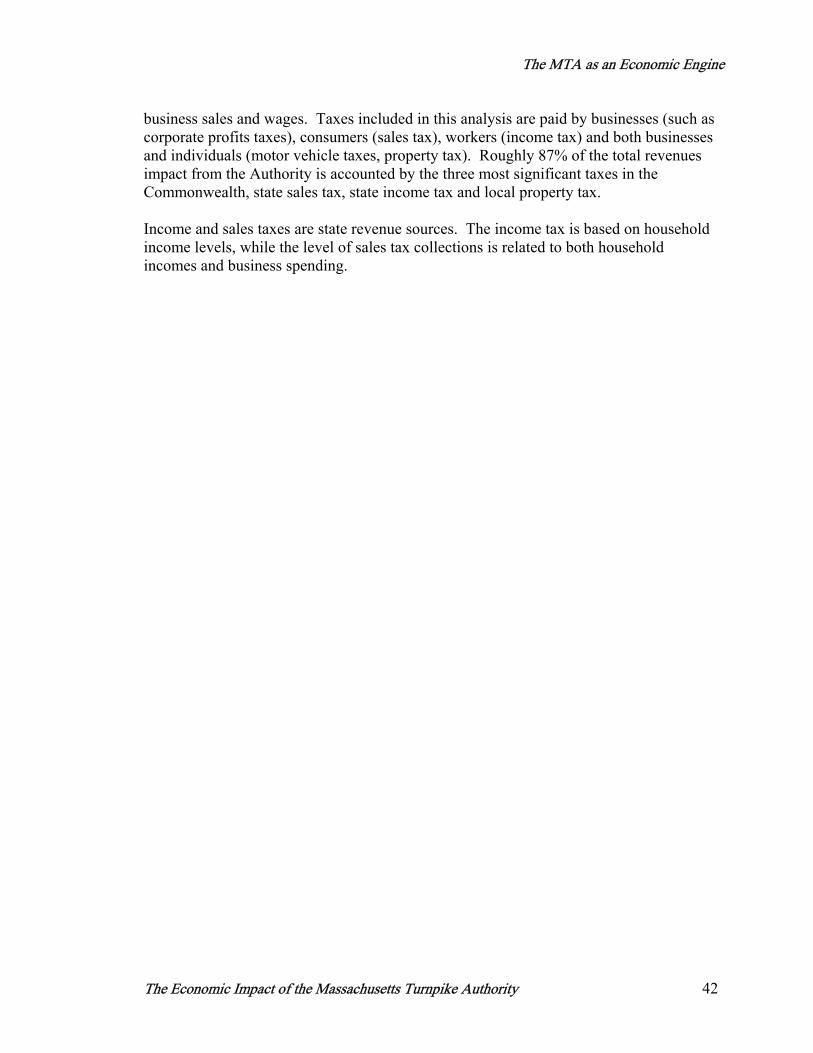
The MTA as an Economic Engine
The Economic Impact of the Massachusetts Turnpike Authority 42
business sales and wages. Taxes included in this analysis are paid by businesses (such as corporate profits taxes), consumers (sales tax), workers (income tax) and both businesses and individuals (motor vehicle taxes, property tax). Roughly 87% of the total revenues impact from the Authority is accounted by the three most significant taxes in the Commonwealth, state sales tax, state income tax and local property tax. Income and sales taxes are state revenue sources. The income tax is based on household income levels, while the level of sales tax collections is related to both household incomes and business spending.
The MTA as an Economic Engine
The Economic Impact of the Massachusetts Turnpike Authority 43
ACKNOWLEDGEMENTS This study was conducted by staff of Economic Development Research Group -- Steven Landau, Glen Weisbrod, Susan Moses, Brett Piercy, Margaret Collins and Manisha Gupta, The project benefited from substantial work assembling information about activities of the Massachusetts Turnpike Authority. Assistance in this effort was provided by many staff members of the Massachusetts Turnpike Authority, covering the areas of accounting, finance, architecture and urban planning, planning and development, business development, and government affairs (including Kevin Coen, Bernard Meyler, Eric Waaramaa, Domenic Tringale, Fred Yalouris, John Naughton, Steve Jacques and Stephen Hines). The study team also benefited from additional information and insight provided by staff of the Artery Business Committee (Richard Dimino and Thomas Nally), Northeastern University (Barry Bluestone), Goulston & Storrs (James Aloisi), Boston Redevelopment Authority (Planning Staff), Central Artery/Tunnel Project (Owen McDonald, Steve Collins, Daniel Murphy, Peter Donahue), Central Transportation Planning Staff (William Kutner), Greater Boston Chamber of Commerce (Jim Klocke), Massachusetts State Police (Brian Menton), and the Metropolitan Area Planning Council (Barbara Lucas). The authors are also grateful to all of the abovementioned organizations and their staff, including additional staff members not named above who also supported the project effort. However, any errors or omissions in this report are the responsibility of the authors.


IBC

Massachusetts Turnpike Authority10 Park Plaza, Suite 4160Boston, MA 02116
Printed on recycled paper.