Transitioning from analog to digital audio recording … · Transitioning from analog to digital...
25
Transitioning from analog to digital audio recording in childhood speech sound disorders LAWRENCE D. SHRIBERG 1 , JANE L. McSWEENY 1 , BRUCE E. ANDERSON 1 , THOMAS F. CAMPBELL 2 , MICHAEL R. CHIAL 1 , JORDAN R. GREEN 3 , KATHERINA K. HAUNER 1 , CHRISTOPHER A. MOORE 4 , HEATHER L. RUSIEWICZ 2 , & DAVID L. WILSON 1 1 University of Wisconsin–Madison, WI, USA, 2 University of Pittsburgh, PA, USA, 3 University of Nebraska, Omaha, NE, USA, and 4 University of Washington, Seattle, WA, USA (Received 27 January 2004; accepted 22 March 2004) Abstract Few empirical findings or technical guidelines are available on the current transition from analog to digital audio recording in childhood speech sound disorders. Of particular concern in the present context was whether a transition from analog- to digital-based transcription and coding of prosody and voice features might require re-standardizing a reference database for research in childhood speech sound disorders. Two research transcribers with different levels of experience glossed, transcribed, and prosody-voice coded conversational speech samples from eight children with mild to severe speech disorders of unknown origin. The samples were recorded, stored, and played back using representative analog and digital audio systems. Effect sizes calculated for an array of analog versus digital comparisons ranged from negligible to medium, with a trend for participants’ speech competency scores to be slightly lower for samples obtained and transcribed using the digital system. We discuss the implications of these and other findings for research and clinical practise. Keywords: Articulation, assessment, phonology, prosody, transcription Introduction As is widely occurring among professionals in such disciplines as medicine, law, and business informatics, researchers and clinicians in communicative disorders are transition- ing from analog to digital methods to record, store, and play back audio and video information. A brief sample of the wide-ranging sources of information relevant to the transition to digital methods for audio recording in communicative disorders includes early and more recent discussions of the advantages and disadvantages of digital recording and signal processing (e.g., Titze, Horii, & Scherer, 1987; Doherty & Shipp, 1988; Perry, Ingrisano, & Blair, 1996; Farinella, DeLeo, Metz, Schiavetti, & Whitehead, 1998; Evans & Miller, 1999; Zafar, Overhage, & McDonald, 1999; Bunta, Ingram, & Ingram, 2003), Correspondence: Lawrence D. Shriberg, Phonology Project, Waisman Center, University of Wisconsin–Madison, 1500 Highland Avenue, Madison, WI 53705, USA. E-mail: [email protected] Clinical Linguistics & Phonetics, June 2005; 19(4): 335–359 ISSN 0269-9206 print/ISSN 1464-5076 online # 2005 Taylor & Francis Ltd DOI: 10.1080/02699200500085426
Transcript of Transitioning from analog to digital audio recording … · Transitioning from analog to digital...
Transitioning from analog to digital audio recording inchildhood speech sound disorders
LAWRENCE D. SHRIBERG1, JANE L. McSWEENY1, BRUCE E.
ANDERSON1, THOMAS F. CAMPBELL2, MICHAEL R. CHIAL1, JORDAN
R. GREEN3, KATHERINA K. HAUNER1, CHRISTOPHER A. MOORE4,
HEATHER L. RUSIEWICZ2, & DAVID L. WILSON1
1University of Wisconsin–Madison, WI, USA, 2University of Pittsburgh, PA, USA, 3University of
Nebraska, Omaha, NE, USA, and 4University of Washington, Seattle, WA, USA
(Received 27 January 2004; accepted 22 March 2004)
AbstractFew empirical findings or technical guidelines are available on the current transition from analog todigital audio recording in childhood speech sound disorders. Of particular concern in the presentcontext was whether a transition from analog- to digital-based transcription and coding of prosodyand voice features might require re-standardizing a reference database for research in childhoodspeech sound disorders. Two research transcribers with different levels of experience glossed,transcribed, and prosody-voice coded conversational speech samples from eight children with mild tosevere speech disorders of unknown origin. The samples were recorded, stored, and played back usingrepresentative analog and digital audio systems. Effect sizes calculated for an array of analog versusdigital comparisons ranged from negligible to medium, with a trend for participants’ speechcompetency scores to be slightly lower for samples obtained and transcribed using the digital system.We discuss the implications of these and other findings for research and clinical practise.
Keywords: Articulation, assessment, phonology, prosody, transcription
Introduction
As is widely occurring among professionals in such disciplines as medicine, law, and
business informatics, researchers and clinicians in communicative disorders are transition-
ing from analog to digital methods to record, store, and play back audio and video
information. A brief sample of the wide-ranging sources of information relevant to the
transition to digital methods for audio recording in communicative disorders includes early
and more recent discussions of the advantages and disadvantages of digital recording and
signal processing (e.g., Titze, Horii, & Scherer, 1987; Doherty & Shipp, 1988; Perry,
Ingrisano, & Blair, 1996; Farinella, DeLeo, Metz, Schiavetti, & Whitehead, 1998; Evans &
Miller, 1999; Zafar, Overhage, & McDonald, 1999; Bunta, Ingram, & Ingram, 2003),
Correspondence: Lawrence D. Shriberg, Phonology Project, Waisman Center, University of Wisconsin–Madison, 1500 Highland
Avenue, Madison, WI 53705, USA. E-mail: [email protected]
Clinical Linguistics & Phonetics, June 2005; 19(4): 335–359
ISSN 0269-9206 print/ISSN 1464-5076 online # 2005 Taylor & Francis Ltd
DOI: 10.1080/02699200500085426
database storage and access issues (e.g., Bamattre, 1995; Long, 1999; Beukelman, 2000;
Bunta et al., 2003; MacWhinney, 2005), and training suggestions for digitally based
phonetic transcription and other acoustic-perceptual tasks (Wolfe, Martin, Borton, &
Youngblood, 2003). Except for the useful tutorial by Bunta, Ingram, and Ingram (2003) as
well as the more general guidelines in Plichta (2002) and Ladefoged (2003), a literature
review yielded few sources specifically focused on the topic of interest—the assembly of
digital systems for glossing, phonetic transcription, and prosody-voice coding of samples
from children with speech sound disorders. The following sections discuss two types of
information needed by researchers and clinicians transitioning to digital audio systems for
these purposes.
Psychometric issues associated with digital audio systems
A primary need in transitioning from analog to digital audio media is for a quantitative
comparison of findings obtained with digital systems to extant archival data obtained with
analog systems. As in most other areas of communicative disorders, the reference standards
that continue to be used to describe and classify typical and atypical speech acquisition
were obtained using analog recording and playback media. The reliability and validity of
these audio-recorded data were assessed in a number of early methodological studies
comparing transcription and scoring of live speech to that of recorded samples (see reviews
in Shriberg & Lof, 1991; Shriberg & Kent, 2003). Findings from these studies generally
supported the validity and reliability of transcription from audio-taped recordings.
Surprisingly, however, there is no body of clinical-research studies that has compared
transcription from earlier reel-to-reel recorders with transcription from later and current
generations of audiocassette recorders. Notwithstanding certain attractive efficiency
features of some of the more widely used (but lower-end) audiocassette recorders,
technical limitations in characteristics such as bandwidth, signal-to-noise ratio, and
dynamic range have yielded recordings of generally poorer quality than those produced
with an earlier generation of higher-end reel-to-reel recorders.
Configuring a digital audio system for speech sampling
A second and related need on this topic in the laboratory and clinic is for guidance in
selecting the appropriate format and specific hardware and software to configure a digital
audio system to record, store, and play back speech samples. During the period when
dedicated analog devices were the only available choice for audio recording, purchasing
decisions were primarily based on the answers to three questions: which type, brand, and
model of reel-to-reel or audiocassette recorder is technically appropriate and financially
feasible for the intended speech sampling tasks (e.g., sound quality, portability, reliability,
ease of use, purchase price, maintenance costs)? Which microphone best meets the
technical and substantive requirements of one or more speech sampling tasks (e.g.,
sensitivity, frequency response, directionality, signal-to-noise ratio)? Which type of audio
tape is most suitable for recording and storage needs (e.g., frequency response and bias,
resistance to stretching, playing time)? For playback purposes, the primary consideration
was to choose a device, including matched earphones and/or loudspeaker(s), that was
technically adequate and efficient for the repeated playbacks needed for auditory-
perceptual tasks (e.g., glossing, transcribing, scoring real and nonsense words, scoring
diadochokinetic speech tasks, rating intelligibility, coding prosody-voice features).
336 L. D. Shriberg et al.
In contrast to analog technology, contemporary digital formats for audio speech
sampling include a large array of recording-storage-playback options, generally based on
recording and/or storage medium needs (e.g., digital audio tape [DAT], compact
discs [CD], minidiscs [MD], digital versatile discs [DVD]). Selecting, purchasing,
assembling, and maintaining the several components of a digital audio system,
particularly as they interface with desktop or notebook computers, are typically
guided by consultation with experienced colleagues or local audio vendors. Such sources
of guidance may not always be effective for persons responsible for one or multiple
digital systems for use in academic, research, or clinical settings. Colleagues may not be
acquainted with the range of available technical and vendor options; technical consultants
or vendors may not be acquainted with the requirements and specific constraints associated
with recording, glossing, and transcribing the speech of young children with speech
sound disorders.
Statement of the problem
The present report describes an analog-to-digital transition experience in a clinical-research
context. The general need was to configure multiple, laptop-based playback stations for use
by research transcribers to reduce auditory-perceptual data from the digital recordings of
assessment protocols administered to typical and atypical speakers across the life span. The
primary focus of the present study was on conversational speech sampling from young
children with moderate to severe speech disorders. However, the system was also intended
to be used for other assessment tasks, such as citation-form articulation tests, word-phrase
and sentence-length imitation tasks, and intelligibility assessment. The research design
addressed the following question: do data obtained using a representative digital audio
system differ significantly from data obtained using a representative analog audio system?
As indicated in the discussion above, the primary concern was whether a transition from
analog- to digitally-based transcription and prosody-voice coding would require re-
standardizing a reference database.
Method
Participants
Eight conversational speech samples were selected from a set of 35 samples from children
whose speech had been assessed at the Children’s Hospital of Pittsburgh. These speakers,
each of whom was referred by a certified speech-language pathologist as having a speech
production disorder, were participants in an ongoing collaborative study of physiological
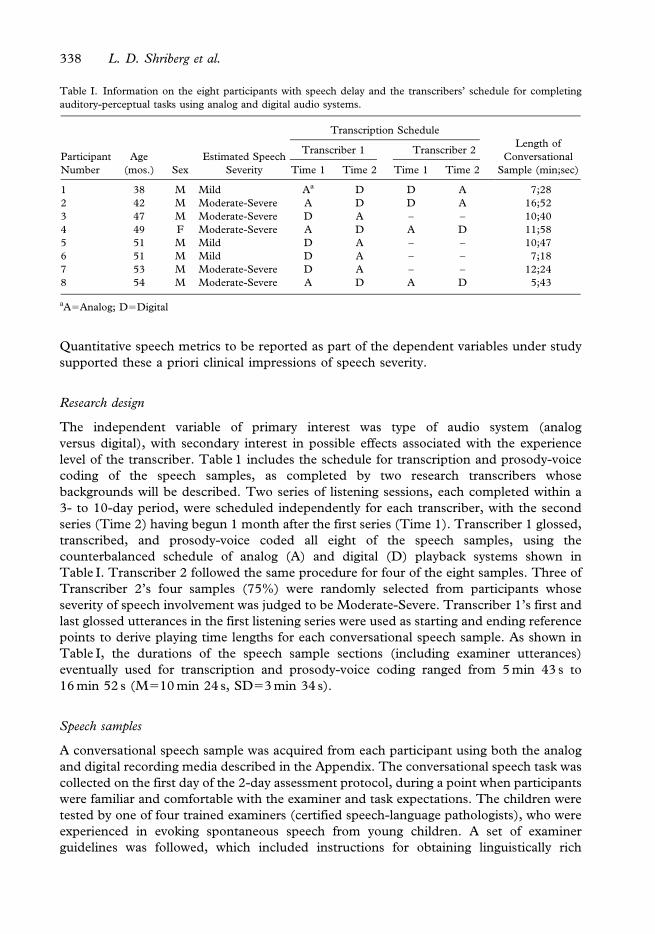
correlates of child speech sound disorders. Table I includes descriptive information for the
eight participants with speech delay whose conversational speech samples were glossed,
transcribed, and prosody-voice coded for the present study.
As shown in Table I, the eight speakers ranged in age from 3 years, 2 months to 4 years,
6 months (mean age: 4 years, 2 months). This average age is comparable to the mean age of
4 years, 3 months reported in a study profiling several hundred children with speech delay
referred to a local university speech clinic (Shriberg & Kwiatkowski, 1994). Seven of the
eight (88%) children were males, which is slightly higher than the distribution of 70%
males reported in Shriberg and Kwiatkowski (1994). As shown in Table I, five of the eight
(63%) children sampled for the present study had Moderate-to-Severe speech involvement.
Analog to digital audio recording 337
Quantitative speech metrics to be reported as part of the dependent variables under study
supported these a priori clinical impressions of speech severity.
Research design
The independent variable of primary interest was type of audio system (analog
versus digital), with secondary interest in possible effects associated with the experience
level of the transcriber. Table 1 includes the schedule for transcription and prosody-voice
coding of the speech samples, as completed by two research transcribers whose
backgrounds will be described. Two series of listening sessions, each completed within a
3- to 10-day period, were scheduled independently for each transcriber, with the second
series (Time 2) having begun 1 month after the first series (Time 1). Transcriber 1 glossed,
transcribed, and prosody-voice coded all eight of the speech samples, using the
counterbalanced schedule of analog (A) and digital (D) playback systems shown in
Table I. Transcriber 2 followed the same procedure for four of the eight samples. Three of
Transcriber 2’s four samples (75%) were randomly selected from participants whose
severity of speech involvement was judged to be Moderate-Severe. Transcriber 1’s first and
last glossed utterances in the first listening series were used as starting and ending reference
points to derive playing time lengths for each conversational speech sample. As shown in
Table I, the durations of the speech sample sections (including examiner utterances)
eventually used for transcription and prosody-voice coding ranged from 5 min 43 s to
16 min 52 s (M510 min 24 s, SD53 min 34 s).
Speech samples
A conversational speech sample was acquired from each participant using both the analog
and digital recording media described in the Appendix. The conversational speech task was
collected on the first day of the 2-day assessment protocol, during a point when participants
were familiar and comfortable with the examiner and task expectations. The children were
tested by one of four trained examiners (certified speech-language pathologists), who were
experienced in evoking spontaneous speech from young children. A set of examiner
guidelines was followed, which included instructions for obtaining linguistically rich
Table I. Information on the eight participants with speech delay and the transcribers’ schedule for completing
auditory-perceptual tasks using analog and digital audio systems.
Participant
Number
Age
(mos.) Sex
Estimated Speech
Severity
Transcription Schedule
Length of
Conversational
Sample (min;sec)
Transcriber 1 Transcriber 2
Time 1 Time 2 Time 1 Time 2
1 38 M Mild Aa D D A 7;28
2 42 M Moderate-Severe A D D A 16;52
3 47 M Moderate-Severe D A – – 10;40
4 49 F Moderate-Severe A D A D 11;58
5 51 M Mild D A – – 10;47
6 51 M Mild D A – – 7;18
7 53 M Moderate-Severe D A – – 12;24
8 54 M Moderate-Severe A D A D 5;43
aA5Analog; D5Digital
338 L. D. Shriberg et al.
conversational samples, for monitoring the recording level to maximize signal quality, and
for glossing of strings of questionably intelligible speech. Concerning the latter need, the
examiner would gloss what she perceived as the child’s intended linguistic targets, repeating
the utterance approximately word-for-word on the audio recording.
Analog and digital audio systems
The Appendix provides technical information on the analog and digital audio systems used
to record and play back the speech samples. Essentially, the conversational speech samples
in the parent study were recorded with a common audio signal routed to an audiocassette
recorder for the analog samples, and a digital audio tape recorder for the digital samples. As
described in the Appendix, the playback component of the analog system was a foot-pedal
operated device used in prior research in child speech sound disorders. The playback
software for the digital system running on a personal computer was a foot-pedal operated
media player developed specifically for this project.
Phonetic transcription and prosody-voice coding
Training. Transcriber 1 (author McSweeny) had 10 years’ experience in obtaining,
glossing, transcribing, and prosody-voice coding speech samples from children with speech
disorders of known and unknown origin. Transcriber 2, an undergraduate student in
Communicative Disorders, had 4 months’ experience in glossing, transcribing, and
prosody-voice coding conversational samples. This 4-month period included a 2.5-month
training program conducted by Transcriber 1 and included both knowledge components
and auditory-perceptual skills training. Knowledge-based training consisted of directed
reading assignments in articulatory phonetics that provided (a) rules for use of the 42
phonetic and 43 diacritic characters included in the system for narrow phonetic
transcription described in Shriberg and Kent (2003), (b) rules for the use of 31
exclusionary and 32 prosody-voice codes included in the system for prosody-voice coding
described in Shriberg, Kwiatkowski, and Rasmussen (1990), and (c) rules and guidelines
for the array of glossing and formatting principles included in a software program described
originally in Shriberg (1986) and updated in Shriberg, Allen, McSweeny, and Wilson
(2001). Skills-based training included the completion of all auditory modules in the
previous references, additional training on samples of children with mild to severely delayed
speech, and corrective feedback based on assessments of interjudge agreement with
Transcriber 1. All training was conducted using an analog playback device similar to the
one used in the present study. Brief training was also provided in use of the digital playback
software.
Procedure. Glossing, phonetic transcription, and prosody-voice coding of the
conversational speech samples were completed in a small listening room. The analog
playback system and the tabletop computer for the digital system were positioned on the
same work surface, with their corresponding foot pedals also placed adjacently. The order
of the conversational samples in both listening series followed the counterbalanced analog-
digital design shown in Table I. During and immediately after each session, the transcribers
used worksheets both to log elapsed times for each auditory perceptual task and to annotate
their observations about the operational features of each audio system, including any
personal preferences.
Analog to digital audio recording 339
Analyses. Transcribers’ glosses, phonetic transcriptions, and prosody-voice codes were first
checked for formatting accuracy and then were entered into a software suite using editing
utilities (Shriberg et al., 2001). The software included outputs that provided detailed
quantitative information for all study questions.
Effect sizes and their associated 95% confidence intervals, using pooled standard
deviations and Hedges’ correction (Hedges & Olkin, 1985; Cohen, 1988), were selected
from the statistical options in the analysis software. These metrics estimated the clinical-
research significance of any obtained differences in the completion times, reliability, and
validity comparisons of data obtained using the analog versus digital audio systems.
Cohen’s (1988) traditional descriptor system and magnitude criteria were used to
characterize three effect size (ES) ranges as follows: (.195negligible, .20–.495small,
.50–.795medium. To provide a means to differentiate among effect sizes greater
than Cohen’s largest ES descriptor (i.e., ..795large), such values were redefined as large
(.80–.99), very large (1.0–1.99), and extremely large (>2.0; see Hopkins, 2003, for a
discussion of rationale for these distinctions). Following the usual convention, 95% ES
confidence intervals not containing 0 were considered statistically significant. To aid the
reader in examination of the several data tables, however, we also provide the equivalent
inferential statistical findings from two-sample, pooled variance t tests. Given the goals of
this initial study, and its limitations due to small cell sizes, the inferential statistical findings
were deemed only advisory. Rather, any pattern of comparisons yielding medium and
especially large effect sizes was of primary interest for issues associated with standardization
and other issues in clinical-research applications of digital audio systems.
Results and discussion
Glossing
The first auditory-perceptual task for each speech sample was to gloss the sample until
100 different word types (i.e., unique lexical entries termed first occurrence words: cf.
Shriberg & Kwiatkowski, 1980) had been glossed. The speech samples from Participants
2 and 4, whose speech was considerably unintelligible, yielded only 79 and 83 first
occurrence words, respectively, but were included in the analyses nevertheless. To allow
estimates of intrajudge and interjudge agreement for all three auditory-perceptual tasks
using the two audio systems, Transcriber 2 first glossed each sample but subsequently
used Transcriber 1’s glosses for transcription and prosody-voice coding. Thus, Transcriber
2’s glosses provided the information from which intrajudge glossing agreement
percentages were obtained, but her use of Transcriber 1’s gloss for transcription and
prosody-voice coding data allowed the agreement software to calculate intrajudge and
interjudge agreement percentages for these tasks based on similar presumed linguistic
targets.
Completion time
Findings. Table II includes completion time data for glossing completed by Transcriber 1
(eight samples) and Transcriber 2 (four samples), at the first (Time 1) and second (Time 2)
listening series using the two audio systems (analog, digital). The completion time data
for glossing in Table II are longer than would normally occur for transcription alone,
because they included the time needed to indicate utterances that had to be excluded from
340 L. D. Shriberg et al.
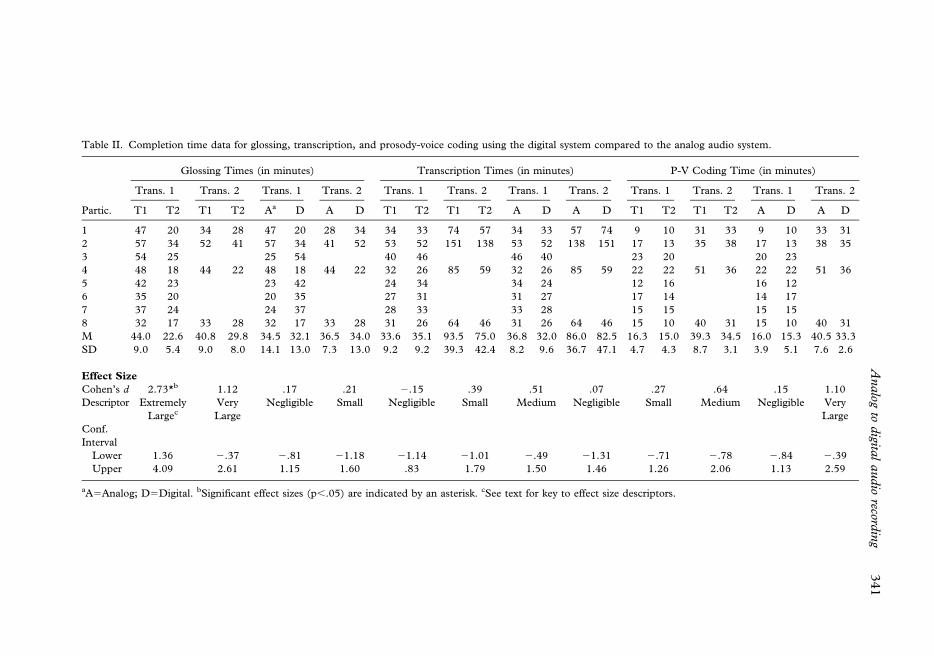
Table II. Completion time data for glossing, transcription, and prosody-voice coding using the digital system compared to the analog audio system.
Partic.
Glossing Times (in minutes) Transcription Times (in minutes) P-V Coding Time (in minutes)
Trans. 1 Trans. 2 Trans. 1 Trans. 2 Trans. 1 Trans. 2 Trans. 1 Trans. 2 Trans. 1 Trans. 2 Trans. 1 Trans. 2
T1 T2 T1 T2 Aa D A D T1 T2 T1 T2 A D A D T1 T2 T1 T2 A D A D
1 47 20 34 28 47 20 28 34 34 33 74 57 34 33 57 74 9 10 31 33 9 10 33 31
2 57 34 52 41 57 34 41 52 53 52 151 138 53 52 138 151 17 13 35 38 17 13 38 35
3 54 25 25 54 40 46 46 40 23 20 20 23
4 48 18 44 22 48 18 44 22 32 26 85 59 32 26 85 59 22 22 51 36 22 22 51 36
5 42 23 23 42 24 34 34 24 12 16 16 12
6 35 20 20 35 27 31 31 27 17 14 14 17
7 37 24 24 37 28 33 33 28 15 15 15 15
8 32 17 33 28 32 17 33 28 31 26 64 46 31 26 64 46 15 10 40 31 15 10 40 31
M 44.0 22.6 40.8 29.8 34.5 32.1 36.5 34.0 33.6 35.1 93.5 75.0 36.8 32.0 86.0 82.5 16.3 15.0 39.3 34.5 16.0 15.3 40.5 33.3
SD 9.0 5.4 9.0 8.0 14.1 13.0 7.3 13.0 9.2 9.2 39.3 42.4 8.2 9.6 36.7 47.1 4.7 4.3 8.7 3.1 3.9 5.1 7.6 2.6
Effect Size
Cohen’s d 2.73*b 1.12 .17 .21 2.15 .39 .51 .07 .27 .64 .15 1.10
Descriptor Extremely
Largec
Very
Large
Negligible Small Negligible Small Medium Negligible Small Medium Negligible Very
Large
Conf.
Interval
Lower 1.36 2.37 2.81 21.18 21.14 21.01 2.49 21.31 2.71 2.78 2.84 2.39
Upper 4.09 2.61 1.15 1.60 .83 1.79 1.50 1.46 1.26 2.06 1.13 2.59
aA5Analog; D5Digital. bSignificant effect sizes (p,.05) are indicated by an asterisk. cSee text for key to effect size descriptors.
Analog
todigita
laudio
recordin
g341
prosody-voice coding (termed exclusion coding: cf. Shriberg et al., 1990), due to technical
and/or linguistic confounds.
As shown in Table II, glossing times (in minutes) for both transcribers were considerably
reduced for the second listening series period relative to the first series. The extremely large
(2.73) ES (effect size) for Transcriber 1 was statistically significant, with the completion
time for glossing the eight speech samples reduced by approximately 50% from the first
(M544.0 min) to the second (M522.6 min) listening series. The very large ES (1.12) for
Transcriber 2 (who glossed only four samples) was not statistically significant, with samples
reduced by approximately 25% from the first (M540.8 min) to the second (M529.8 min)
listening series. Transcriber 1 averaged 34.5 min and 32.1 min using the analog and digital
systems, respectively; Transcriber 2 averaged 36.5 min and 34.0 min for each system,
respectively. As shown in Table II, the ESs associated with these approximately 4–9%
reductions in time from analog to digital for both transcribers were negligible and small,
respectively, and not statistically significant.
Discussion. The anecdotal logs from the transcribers indicated that the statistically
significant reductions in gloss times in the second series, regardless of which audio
system was used (see individual comparisons in Table II), were due to a memory confound.
Although both transcribers had transcribed many other samples since the first listening
series one month previously, Transcriber 1 reported that she remembered some
conversational content from the first series, and Transcriber 2 reported that she
remembered a great deal of the content from the first series of samples. The recalled
information aided in reducing the number of playbacks needed to identify and recheck
glosses of initially unintelligible words. Notwithstanding this methodological confound, the
transcribers’ glossing times were not significantly different using the digital system
compared to the analog audio system.
Reliability
Between-session agreement. The glossing agreement data in the left section of Table III begin
with reliability information on the total number of utterances and words glossed by each
transcriber in each session (first two row variables), including means and standard
deviations for the per-sample occurrence rates. As indicated by the negligible ES values for
all four comparisons, the total number of utterances and words glossed was considered
comparable in the two listening sessions.
The remaining four rows in Table III provide the percentage of glossing agreements,
Time 1/Time 2 totals, and per-sample average values (means, standard deviations) for
four classes of glossed words: words a transcriber could readily gloss (non-questionables),
non-questionable words that by rule were excluded from the speech analyses (disregards;
e.g., multiple sequential repetitions of a word), words a transcriber could gloss with
some difficulty (questionables), and words a transcriber could not gloss (unintelligibles).
As shown in Table III, the between-session percentages of exact agreement for these
four glossing categories across the two audio systems ranged widely from 21.5% to
84.8% point-to-point agreement (excluding the low occurrence of questionables
for Transcriber 2). However, associated ESs for differences in the total occurrence
of each word class in the two sessions ranged from .02 to .57, with only the ES asso-
ciated with disregards for Transcriber 1 (ES5.57) reaching the criterion for a medium
difference.
342 L. D. Shriberg et al.
Between-system agreement. The primary reliability analysis (right section of Table III)
yielded comparable numbers of utterances and words for each transcriber’s gloss using the
digital compared to the analog system (ESs from 2.01 to 2.08) and comparable numbers
for each of the four word classes (ESs from .07 to 2.34). Four of the latter seven computed
ESs were classified as negligible to small and were not statistically significant. Point-to-
point exact percentages of agreement between transcribers within each audio system ranged
from 19.4% to 88.4% for the four types of glossed words.
Discussion. The low levels of exact point-to-point intrajudge (between-session) and
interjudge (between-system) agreement for some of the four word classes are consistent
with the difficulties in glossing the speech of children with moderate to severe intelligibility
problems (Shriberg & Lof, 1991; Weston & Shriberg, 1992). Both transcribers noted that
most of these samples were among the most challenging they had ever been assigned to
gloss and transcribe. Additional discussion of factors and processes underlying examiners’
and transcribers’ ‘‘guesses’’ at children’s intended word forms goes beyond the scope of the
present paper. From the present methodological perspective, it is important to note that
some types of between-class differences in glossing have greater consequences than others
for validity issues (e.g., for classification of children’s speech status, or for treatment
recommendations). In the present context, the most important word class data are the
values for the non-questionable words. As shown in Table III, the two audio systems have
comparable total numbers of non-questionable words, comparable percentages of non-
questionable words in the sample, and a relatively high percentage of exact agreement for
non-questionable words (ranging from 79.3% to 88.4% across the four estimates). The
glossing agreement data for each of the word classes in Table III are interpreted as
indicating that auditory-perceptual judgments based on the signal provided by the analog
system were comparable to those based on the signal provided by the digital system.
Phonetic transcription
Completion time analyses. Findings. Table II includes completion time data for narrow
phonetic transcription of the eight and four samples transcribed by Transcriber 1 and
Transcriber 2, respectively, for each of the two listening series and two audio systems. ES
estimates for the four listening series comparisons ranged from negligible to medium, with
none statistically significant. As shown in both the per-sample and summary data for each
listening series, there were substantial differences in the lengths of time needed by each
transcriber to complete transcription. Transcriber 2 averaged 93.5 min and 75.0 min for the
four samples she transcribed in the first and second listening series respectively, whereas
Transcriber 1 averaged only 33.6 min and 35.1 min for the eight samples she transcribed in
the first and second listening series. Comparable completion time differences were
obtained for the four samples transcribed by both transcribers.
Discussion. As with the completion time findings for glossing (Table II), the completion
time data for phonetic transcription indicated that there were no significant time differences
associated with the digital versus the analog system. Unlike the findings for the glossing
data, however, which indicated that the two transcribers took about the same length of time
to gloss the four samples, the inexperienced transcriber (Transcriber 2) took considerably
more time than the experienced transcriber to phonetically transcribe the samples using
either audio system. As shown in Table II, Transcriber 2 averaged approximately one and
Analog to digital audio recording 343
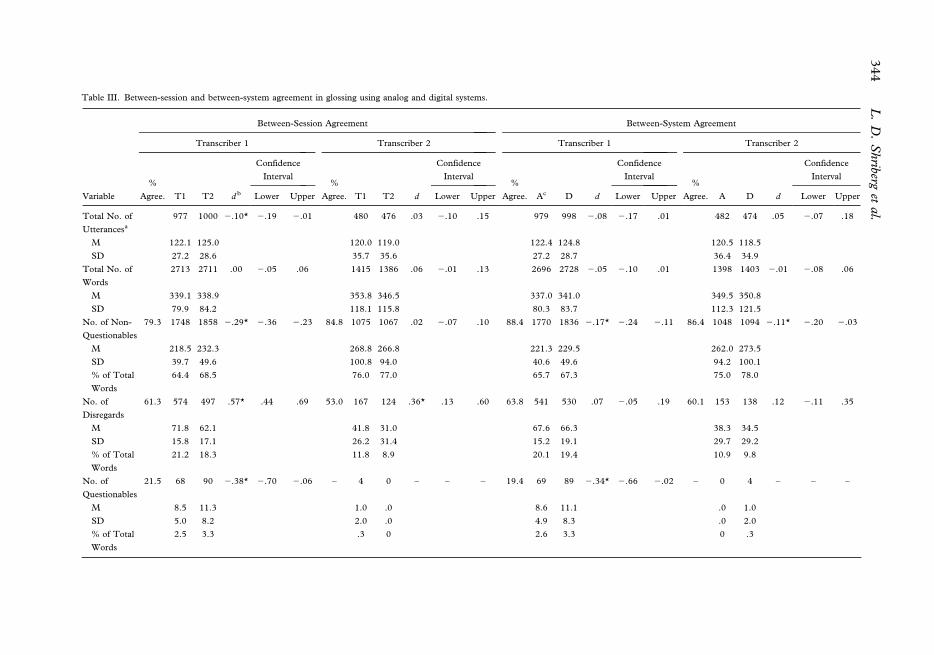
Table III. Between-session and between-system agreement in glossing using analog and digital systems.
Variable
Between-Session Agreement Between-System Agreement
Transcriber 1 Transcriber 2 Transcriber 1 Transcriber 2
%
Agree. T1 T2 d b
Confidence
Interval%
Agree. T1 T2 d
Confidence
Interval%
Agree. Ac D d
Confidence
Interval%
Agree. A D d
Confidence
Interval
Lower Upper Lower Upper Lower Upper Lower Upper
Total No. of
Utterancesa
977 1000 2.10* 2.19 2.01 480 476 .03 2.10 .15 979 998 2.08 2.17 .01 482 474 .05 2.07 .18
M 122.1 125.0 120.0 119.0 122.4 124.8 120.5 118.5
SD 27.2 28.6 35.7 35.6 27.2 28.7 36.4 34.9
Total No. of
Words
2713 2711 .00 2.05 .06 1415 1386 .06 2.01 .13 2696 2728 2.05 2.10 .01 1398 1403 2.01 2.08 .06
M 339.1 338.9 353.8 346.5 337.0 341.0 349.5 350.8
SD 79.9 84.2 118.1 115.8 80.3 83.7 112.3 121.5
No. of Non-
Questionables
79.3 1748 1858 2.29* 2.36 2.23 84.8 1075 1067 .02 2.07 .10 88.4 1770 1836 2.17* 2.24 2.11 86.4 1048 1094 2.11* 2.20 2.03
M 218.5 232.3 268.8 266.8 221.3 229.5 262.0 273.5
SD 39.7 49.6 100.8 94.0 40.6 49.6 94.2 100.1
% of Total
Words
64.4 68.5 76.0 77.0 65.7 67.3 75.0 78.0
No. of
Disregards
61.3 574 497 .57* .44 .69 53.0 167 124 .36* .13 .60 63.8 541 530 .07 2.05 .19 60.1 153 138 .12 2.11 .35
M 71.8 62.1 41.8 31.0 67.6 66.3 38.3 34.5
SD 15.8 17.1 26.2 31.4 15.2 19.1 29.7 29.2
% of Total
Words
21.2 18.3 11.8 8.9 20.1 19.4 10.9 9.8
No. of
Questionables
21.5 68 90 2.38* 2.70 2.06 – 4 0 – – – 19.4 69 89 2.34* 2.66 2.02 – 0 4 – – –
M 8.5 11.3 1.0 .0 8.6 11.1 .0 1.0
SD 5.0 8.2 2.0 .0 4.9 8.3 .0 2.0
% of Total
Words
2.5 3.3 .3 0 2.6 3.3 0 .3
344
L.
D.
Shriberg
etal.
Table III. Between-session and between-system agreement in glossing using analog and digital systems. (Continued )
Variable
Between-Session Agreement Between-System Agreement
Transcriber 1 Transcriber 2 Transcriber 1 Transcriber 2
%
Agree. T1 T2 db
Confidence
Interval%
Agree. T1 T2 d
Confidence
Interval%
Agree. Ac D d
Confidence
Interval%
Agree. A D d
Confidence
Interval
Lower Upper Lower Upper Lower Upper Lower Upper
No.
Unintelligibles
57.1 323 266 .13 2.03 .30 169 195 2.10 2.31 .11 60.1 316 273 .10 2.06 .26 58.8 197 167 .12 2.09 .32
M 40.4 33.3 42.3 48.8 39.5 34.1 49.3 41.8
SD 55.7 43.9 54.0 68.6 55.9 43.8 68.0 54.7
% of Total
Words
11.9 9.8 11.9 14.1 11.7 10 14.1 11.9
aThe glossing numbers are from the unedited versions of the glosses. The agreement percentages are based on the gloss agreement analyses generated from edited versions of the transcripts, with the
number of edits (i.e., additional disagreements) added to the denominators. bSignificant Cohen’s d effect sizes (p,.05) are indicated by an asterisk; see text for key to effect size descriptors. cA5Analog;
D5Digital.
Analog
todigita
laudio
recordin
g345
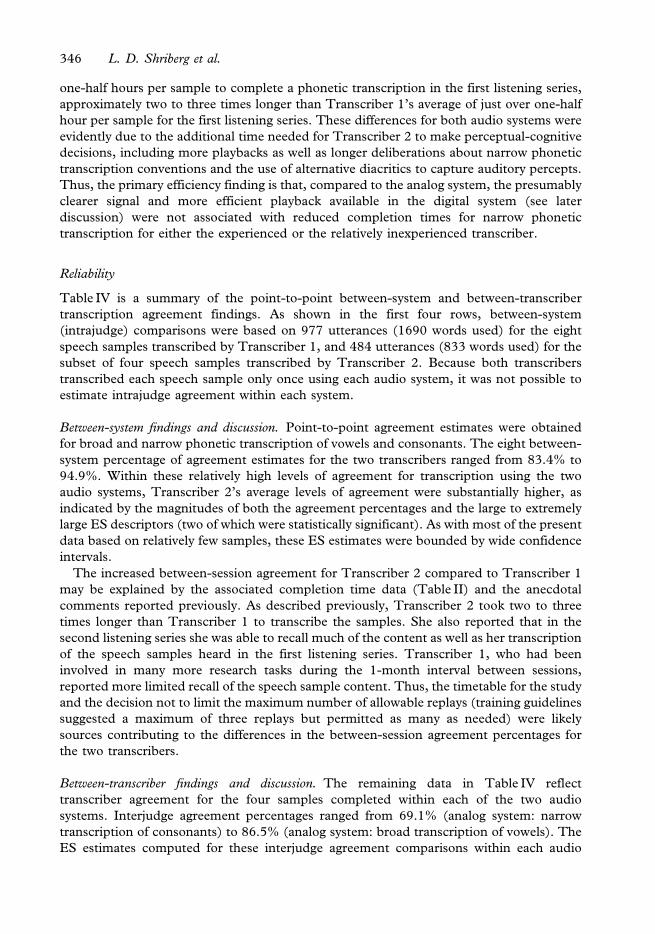
one-half hours per sample to complete a phonetic transcription in the first listening series,
approximately two to three times longer than Transcriber 1’s average of just over one-half
hour per sample for the first listening series. These differences for both audio systems were
evidently due to the additional time needed for Transcriber 2 to make perceptual-cognitive
decisions, including more playbacks as well as longer deliberations about narrow phonetic
transcription conventions and the use of alternative diacritics to capture auditory percepts.
Thus, the primary efficiency finding is that, compared to the analog system, the presumably
clearer signal and more efficient playback available in the digital system (see later
discussion) were not associated with reduced completion times for narrow phonetic
transcription for either the experienced or the relatively inexperienced transcriber.
Reliability
Table IV is a summary of the point-to-point between-system and between-transcriber
transcription agreement findings. As shown in the first four rows, between-system
(intrajudge) comparisons were based on 977 utterances (1690 words used) for the eight
speech samples transcribed by Transcriber 1, and 484 utterances (833 words used) for the
subset of four speech samples transcribed by Transcriber 2. Because both transcribers
transcribed each speech sample only once using each audio system, it was not possible to
estimate intrajudge agreement within each system.
Between-system findings and discussion. Point-to-point agreement estimates were obtained
for broad and narrow phonetic transcription of vowels and consonants. The eight between-
system percentage of agreement estimates for the two transcribers ranged from 83.4% to
94.9%. Within these relatively high levels of agreement for transcription using the two
audio systems, Transcriber 2’s average levels of agreement were substantially higher, as
indicated by the magnitudes of both the agreement percentages and the large to extremely
large ES descriptors (two of which were statistically significant). As with most of the present
data based on relatively few samples, these ES estimates were bounded by wide confidence
intervals.
The increased between-session agreement for Transcriber 2 compared to Transcriber 1
may be explained by the associated completion time data (Table II) and the anecdotal
comments reported previously. As described previously, Transcriber 2 took two to three
times longer than Transcriber 1 to transcribe the samples. She also reported that in the
second listening series she was able to recall much of the content as well as her transcription
of the speech samples heard in the first listening series. Transcriber 1, who had been
involved in many more research tasks during the 1-month interval between sessions,
reported more limited recall of the speech sample content. Thus, the timetable for the study
and the decision not to limit the maximum number of allowable replays (training guidelines
suggested a maximum of three replays but permitted as many as needed) were likely
sources contributing to the differences in the between-session agreement percentages for
the two transcribers.
Between-transcriber findings and discussion. The remaining data in Table IV reflect
transcriber agreement for the four samples completed within each of the two audio
systems. Interjudge agreement percentages ranged from 69.1% (analog system: narrow
transcription of consonants) to 86.5% (analog system: broad transcription of vowels). The
ES estimates computed for these interjudge agreement comparisons within each audio
346 L. D. Shriberg et al.
Table IV. Between-system and between-transcriber agreement in phonetic transcriptions using analog and digital audio systems.
Data Set
Between-System Agreement Between-Transcriber Agreement
Trans. 1 Trans. 2
Cohen’s
d
Confidence Interval
Effect Size Analog Digital
Cohen’s
d
Confidence Interval
DescriptorLower Upper Lower Upper
No. of
transcripts
8 4 4 4
No. of
utterances
977 484 484 484
No. of possible
words
2713 1404 1404 1404
No. of words
used
1690 833 825 815
Point-by-point Agreement (%)
Vowels
Broad
transcription
90.3 (2.1)a 94.9 (1.5) 22.19*b 23.94 2.44 Extremely
Largec
86.5 (3.5) 85.4 (4.0) .25 21.14 1.65 Small
Narrow
transcription
83.4 (3.8) 90.9 (1.7) 22.21* 23.97 2.45 Extremely
Large
80.3 (4.8) 78.2 (4.3) .40 21.00 1.80 Small
Consonants
Broad
transcription
88.6 (3.6) 93.0 (2.3) 21.27 22.78 .25 Very Large 76.1 (9.8) 78.1 (6.5) 2.21 21.60 1.18 Small
Narrow
transcription
83.5 (3.2) 88.1 (4.8) 2.98 22.45 .49 Large 69.1 (10.6) 71.5 (7.3) 2.23 21.62 1.16 Small
aStandard deviations for the mean agreement percentages are enclosed in parentheses. bSignificant effect sizes (p,.05) are indicated by an asterisk. cSee text for key to
effect size descriptors.
Analog
todigita
laudio
recordin
g347
system were small, with none meeting criteria for statistical significance. Thus, for the
total of four speech samples, transcribers’ interjudge agreement was not significantly
higher for transcription completed with the digital system compared to the analog audio
system.
In addition to the summary statistics shown in Table IV, the agreement software
provided detailed information aggregated by place-manner features, phonemes, and
diacritics. These outputs were examined in an attempt to identify the primary sources of
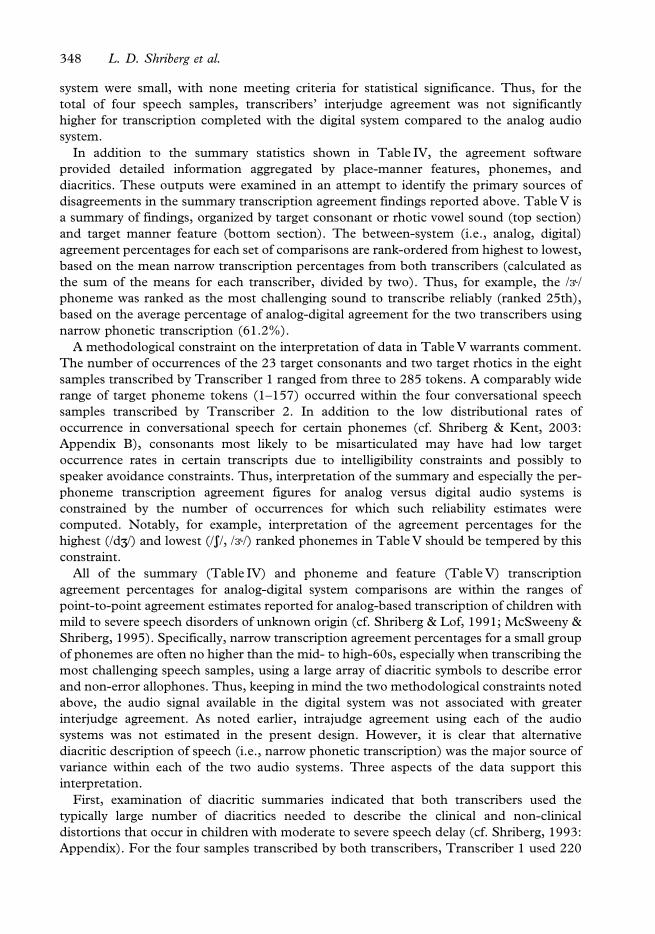
disagreements in the summary transcription agreement findings reported above. Table V is
a summary of findings, organized by target consonant or rhotic vowel sound (top section)
and target manner feature (bottom section). The between-system (i.e., analog, digital)
agreement percentages for each set of comparisons are rank-ordered from highest to lowest,
based on the mean narrow transcription percentages from both transcribers (calculated as
the sum of the means for each transcriber, divided by two). Thus, for example, the /k/
phoneme was ranked as the most challenging sound to transcribe reliably (ranked 25th),
based on the average percentage of analog-digital agreement for the two transcribers using
narrow phonetic transcription (61.2%).
A methodological constraint on the interpretation of data in Table V warrants comment.
The number of occurrences of the 23 target consonants and two target rhotics in the eight
samples transcribed by Transcriber 1 ranged from three to 285 tokens. A comparably wide
range of target phoneme tokens (1–157) occurred within the four conversational speech
samples transcribed by Transcriber 2. In addition to the low distributional rates of
occurrence in conversational speech for certain phonemes (cf. Shriberg & Kent, 2003:
Appendix B), consonants most likely to be misarticulated may have had low target
occurrence rates in certain transcripts due to intelligibility constraints and possibly to
speaker avoidance constraints. Thus, interpretation of the summary and especially the per-
phoneme transcription agreement figures for analog versus digital audio systems is
constrained by the number of occurrences for which such reliability estimates were
computed. Notably, for example, interpretation of the agreement percentages for the
highest (/dz/) and lowest (/s/, /k/) ranked phonemes in Table V should be tempered by this
constraint.
All of the summary (Table IV) and phoneme and feature (Table V) transcription
agreement percentages for analog-digital system comparisons are within the ranges of
point-to-point agreement estimates reported for analog-based transcription of children with
mild to severe speech disorders of unknown origin (cf. Shriberg & Lof, 1991; McSweeny &
Shriberg, 1995). Specifically, narrow transcription agreement percentages for a small group
of phonemes are often no higher than the mid- to high-60s, especially when transcribing the
most challenging speech samples, using a large array of diacritic symbols to describe error
and non-error allophones. Thus, keeping in mind the two methodological constraints noted
above, the audio signal available in the digital system was not associated with greater
interjudge agreement. As noted earlier, intrajudge agreement using each of the audio
systems was not estimated in the present design. However, it is clear that alternative
diacritic description of speech (i.e., narrow phonetic transcription) was the major source of
variance within each of the two audio systems. Three aspects of the data support this
interpretation.
First, examination of diacritic summaries indicated that both transcribers used the
typically large number of diacritics needed to describe the clinical and non-clinical
distortions that occur in children with moderate to severe speech delay (cf. Shriberg, 1993:
Appendix). For the four samples transcribed by both transcribers, Transcriber 1 used 220
348 L. D. Shriberg et al.
diacritics when transcribing with the analog system and 203 with the digital system (an 8%
decrease), averaging approximately 55 and 51 diacritics per sample, respectively. For the
same samples, Transcriber 2 used 291 diacritics with the analog system and 332 with the
digital system (a 14% increase), averaging approximately 73 and 83 diacritics, respectively,
per sample.
Table V. Rank-ordered disagreement findings for transcription completed using the two audio systems. Rank
ordering is based on the mean agreement for both transcribers for narrow transcription.
Rank Ordered Agreement by Target Consonant Sounda
Rank
Target
Sound
Mean of Both
Transcribers Transcriber 1 (eight samples) Transcriber 2 (four samples)
Broad Narrow n Broad Narrow n Broad Narrow
1 /dz/ 100.0 100.0 3 100.0 100.0 2 100.0 100.0
2 /w/ 100.0 98.7 113 100.0 97.3 48 100.0 100.0
3 /h/ 99.3 98.6 136 98.5 97.1 72 100.0 100.0
4 /b/ 98.9 96.6 92 97.8 96.7 56 100.0 96.4
5 /j/ 96.6 94.0 67 95.5 92.5 44 97.7 95.5
6 /n/ 97.6 93.4 285 96.5 91.6 147 98.6 95.2
7 /d/ 94.2 93.3 118 95.8 94.1 53 92.5 92.5
8 /m/ 95.6 92.1 167 93.4 89.8 87 97.7 94.3
9 /s/ 94.6 89.7 169 95.3 90.5 98 93.9 88.8
10 /ts/ 88.8 88.8 26 84.6 84.6 14 92.9 92.9
11 /k/ 90.2 87.5 125 92.0 88.0 69 88.4 87.0
12 /p/ 96.7 87.4 114 96.5 87.7 62 96.8 87.1
13 /g/ 90.3 87.0 47 87.2 87.2 15 93.3 86.7
14 /v/ 82.8 82.8 14 92.9 92.9 11 72.7 72.7
15 /t/ 91.4 79.6 223 89.2 78.9 157 93.6 80.3
16 /f/ 78.6 78.6 21 90.5 90.5 9 66.7 66.7
17 /r/ 87.5 76.7 127 85.0 69.3 69 89.9 84.1
18 /n/ 79.3 75.7 14 78.6 71.4 10 80.0 80.0
19 /z/ 91.4 74.3 98 89.8 69.4 43 93.0 79.1
20 /h/ 78.6 71.5 7 57.1 42.9 5 100.0 100.0
21 /6/ 75.9 69.2 20 60.0 55.0 12 91.7 83.3
22 /l/ 82.3 67.2 64 73.4 50.0 90 91.1 84.4
23 /ð/ 66.7 66.7 41 63.4 63.4 10 70.0 70.0
24 /s/ 66.7 66.7 3 33.3 33.3 1 100.0 100.0
25 /6/ 83.4 61.2 11 66.7 55.6 3 100.0 66.7
M 88.3 83.1 84.2 84.5 78.8 47.5 92.0 87.3
SD 9.9 11.7 74.4 16.7 19.0 44.1 9.7 10.6
Rank Ordered Agreement by Target Manner Feature
Rank
Target
Class
Mean of Both
Transcribers
Transcriber 1
(eight samples)
Transcriber 2
(four samples)
Broad Narrow n Broad Narrow n Broad Narrow
1 glide 98.6 96.7 180 98.3 95.6 92 98.9 97.8
2 nasal 96.2 92.3 466 94.8 90.3 244 97.5 94.3
3 affricate 90.0 90.0 29 86.2 86.2 16 93.8 93.8
4 stop 93.4 86.8 719 92.9 87.2 412 93.9 86.4
5 fricative 92.0 86.7 489 91.2 84.9 249 92.8 88.4
6 liquid 85.9 73.6 191 81.2 62.8 159 90.6 84.3
M 92.7 87.7 345.7 90.8 84.5 195.3 94.6 90.8
SD 4.5 7.8 255.4 6.2 11.3 138.8 3.1 5.2
aExcluding the infrequent /z/ but including the two rhotic vowels /k/ and /6/.
Analog to digital audio recording 349
Second, as shown in Table V, the greatest agreement discrepancies between broad and
narrow transcription occurred on target sounds that have a variety of error and non-error
allophones. For example, the large differences in the broad and narrow agreement
percentages for the /z/ phoneme, and for fricatives as a manner class, are associated with the
many error (e.g., dentalized, lateralized) and non-error (e.g., palatalized, retroflexed)
allophones produced by children with speech sound disorders (cf. Shriberg, 1993:
Appendix). The relatively large differences in the broad versus narrow agreement
percentages for /t/ were associated with narrow transcription of the several non-error
allophonic variations of /t/ (e.g., aspirated/unaspirated, released/unreleased, frictionalized).
A third source of support indicating that diacritic use was the primary source of
disagreements in both systems concerns the rank-ordering of analog/digital agreement as
listed in Table V. The order of entries in the Target Sound column is highly concordant
with the order of consonant acquisition in both typical and atypical speakers. That is, later
acquired sounds are more often in error, including distortion error-types that require
diacritic-level (i.e., narrow) transcription to describe. Rather than per-sound or per-feature
concordance, however, the order of entries in the Target Sound column is consistent with
the division of speech acquisition into three developmental sound classes termed the Early-8
(/m/, /b/, /j/, /n/, /w/, /d/, /p/, /h/), Middle-8 (/t/, /n/, /k/, /g/, /f/, /v/, /ts/, /dz/), and Late-8 (/s/,/h/, /s/, /z/, /ð/, /l/, /r/, /z/) sounds (Shriberg, 1993). Validity data for the construct of similar
developmental classes in children with both typical speech and speech delay of unknown
origin indicate that the eight sounds of each class are acquired before all of the sounds of
each later developing class (Shriberg, 1993). As shown in table 5, the order of sounds based
on transcription agreement using analog and digital systems is generally concordant
(concordance587.5%) with the eight sounds listed above for each of the three
developmental sound classes. The only three exceptions (excluding the two rhotic vowels)
for the 24 consonants are /dz/ (which is based on only a few tokens), /n/, and /s/. Notice also
that the ordering of agreement by manner features at the bottom of Table V generally
follows the developmental order of speech acquisition.
To summarize, these quantitative agreement analyses indicated that transcribers
obtained the same levels of interjudge agreement using analog versus digital audio systems
that investigators have reported for transcription agreement within and between analog
systems. Until estimates can be obtained from larger-scale studies in which many samples
are transcribed at least twice by many transcribers using a variety of digital compared to
analog systems, the present data do not allow conclusions about the likelihood of enhanced
transcriber reliability using digital systems. However, the last section of this report provides
some qualitative information supporting this possibility.
Prosody-voice coding
Following standard procedures for the screening instrument used in this study, prosody-
voice data were obtained from the first 24 utterances in the sample that were classified as
eligible for prosody-voice coding (Shriberg et al., 1990). As noted previously, glossing a
conversational speech sample for the purpose of prosody-voice coding includes a set of
procedures to exclude utterances that are not appropriate to code due to technical,
behavioral, or linguistic factors (e.g., microphone distance, examiner overtalk). For two of
the eight participants, this resulted in only 16 utterances available for prosody-voice coding.
It is important to note that although the speech samples in the present study purposely
over-sampled more severely involved children, utterances with inappropriate prosody are
350 L. D. Shriberg et al.
characteristically infrequent in children with speech delay of unknown origin, at all levels of
severity of speech sound involvement (Shriberg & Kwiatkowski, 1994).
Completion time analyses. Table II includes the completion time data for prosody-voice
coding of the eight or four samples completed by each transcriber using the two audio
systems. Average prosody-voice coding times for the second compared to the first listening
series for Transcriber 1 (15.0 min, 16.3 min, respectively) and Transcriber 2 (34.5 min,
39.3 min) were shorter, with small (0.27) and medium (0.64) ESs associated respectively
with these differences. As found for glossing and phonetic transcription completion times,
Transcriber 2 averaged over twice as long to complete prosody-voice coding of the subset of
four speech samples as Transcriber 1.
As tabulated by audio system, both transcribers took less time to complete prosody-voice
coding with the digital compared to the analog system, although neither of the ESs was
statistically significant. Transcriber 1 averaged 16.0 min using the analog system and
15.3 min using the digital system (ES50.15; negligible). Transcriber 2 averaged 40.5 min
using the analog system and 33.3 min using the digital system (ES51.10; very large). As
shown in the individual sample comparisons in Table II, Transcriber 2 appeared to have
substantially reduced prosody-voice coding times for at least one of the four speech samples
using the digital (36 min) compared to the analog (51 min) system.
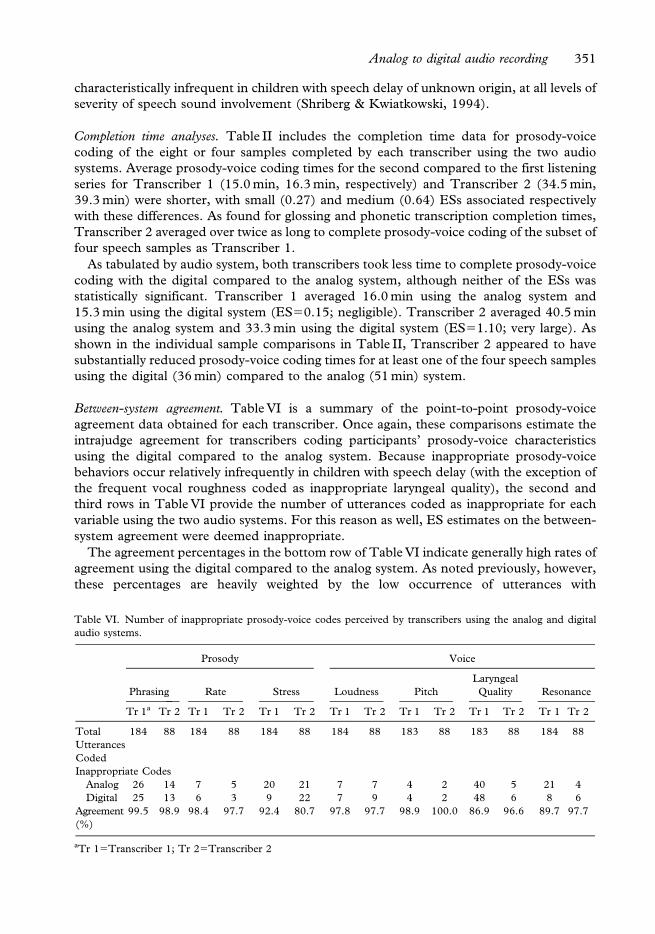
Between-system agreement. Table VI is a summary of the point-to-point prosody-voice
agreement data obtained for each transcriber. Once again, these comparisons estimate the
intrajudge agreement for transcribers coding participants’ prosody-voice characteristics
using the digital compared to the analog system. Because inappropriate prosody-voice
behaviors occur relatively infrequently in children with speech delay (with the exception of
the frequent vocal roughness coded as inappropriate laryngeal quality), the second and
third rows in Table VI provide the number of utterances coded as inappropriate for each
variable using the two audio systems. For this reason as well, ES estimates on the between-
system agreement were deemed inappropriate.
The agreement percentages in the bottom row of Table VI indicate generally high rates of
agreement using the digital compared to the analog system. As noted previously, however,
these percentages are heavily weighted by the low occurrence of utterances with
Table VI. Number of inappropriate prosody-voice codes perceived by transcribers using the analog and digital
audio systems.
Prosody Voice
Phrasing Rate Stress Loudness Pitch
Laryngeal
Quality Resonance
Tr 1a Tr 2 Tr 1 Tr 2 Tr 1 Tr 2 Tr 1 Tr 2 Tr 1 Tr 2 Tr 1 Tr 2 Tr 1 Tr 2
Total
Utterances
Coded
184 88 184 88 184 88 184 88 183 88 183 88 184 88
Inappropriate Codes
Analog 26 14 7 5 20 21 7 7 4 2 40 5 21 4
Digital 25 13 6 3 9 22 7 9 4 2 48 6 8 6
Agreement
(%)
99.5 98.9 98.4 97.7 92.4 80.7 97.8 97.7 98.9 100.0 86.9 96.6 89.7 97.7
aTr 15Transcriber 1; Tr 25Transcriber 2
Analog to digital audio recording 351
inappropriate prosody-voice. A more sensitive comparison of possible analog/digital
differences is provided in the middle two rows in Table VI, which include the number of
utterances coded as inappropriate for each variable using the two audio systems. The
intrajudge data are fairly similar for most comparisons, excepting Transcriber 1’s analog/
digital data for Stress and Resonance. For both variables, Transcriber 1 coded fewer
utterances as inappropriate using the digital system. Discussion of these findings is deferred
to the last section, which provides qualitative data on the transcribers’ observations and
preferences.
Validity
A series of 24 speech and prosody-voice profile outputs from the software suite (Shriberg
et al., 2001) provided statistical comparisons of findings based on transcription and
prosody-voice coding data, using the digital compared to the analog audio system. These
comparisons were viewed as concurrent validity estimates, because they tested whether
children’s speech and prosody-voice scores based on the digital system differed from their
severity scores based on the analog system (i.e., as indicated by the magnitude of effect
sizes). The speech profiles included comparisons of targets cross-tabulated by several types
of linguistic units, including (a) class (sonorants, obstruents; consonants, vowels/
diphthongs), (b) feature (place, manner, voicing), (c) context (singletons, clusters, position
in word), (d) phoneme (individual sounds), (e) speech error type (omission, substitution,
distortion), (f) natural process (e.g., final consonant deletion), and (g) error (e.g.,
dentalized sibilants) and non-error (e.g., palatalized sibilants) allophone. The prosody-
voice profiles, as described previously, included scores in seven suprasegmental domains
and subtypes within each domain.
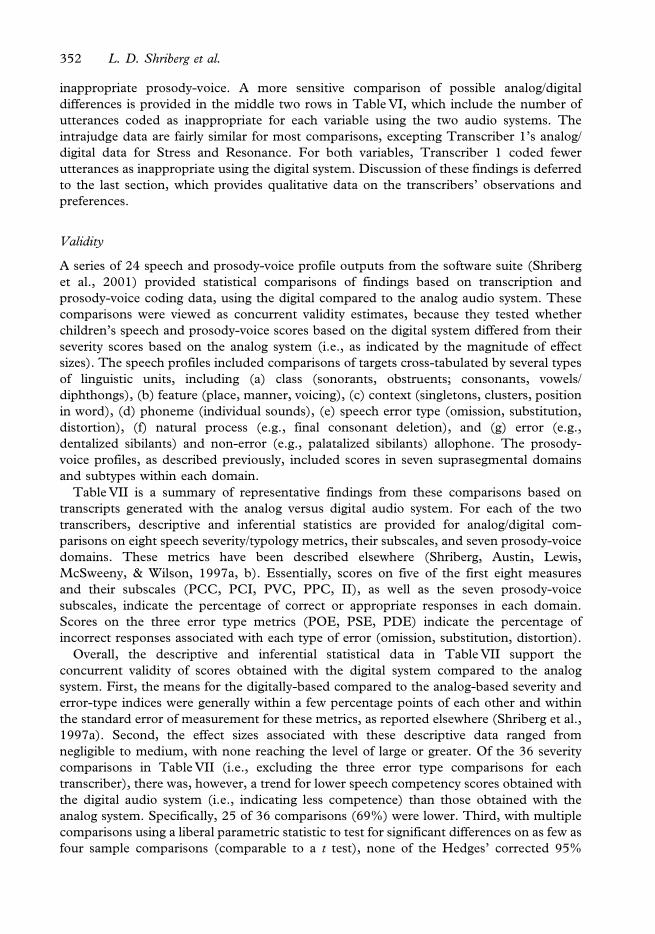
Table VII is a summary of representative findings from these comparisons based on
transcripts generated with the analog versus digital audio system. For each of the two
transcribers, descriptive and inferential statistics are provided for analog/digital com-
parisons on eight speech severity/typology metrics, their subscales, and seven prosody-voice
domains. These metrics have been described elsewhere (Shriberg, Austin, Lewis,
McSweeny, & Wilson, 1997a, b). Essentially, scores on five of the first eight measures
and their subscales (PCC, PCI, PVC, PPC, II), as well as the seven prosody-voice
subscales, indicate the percentage of correct or appropriate responses in each domain.
Scores on the three error type metrics (POE, PSE, PDE) indicate the percentage of
incorrect responses associated with each type of error (omission, substitution, distortion).
Overall, the descriptive and inferential statistical data in Table VII support the
concurrent validity of scores obtained with the digital system compared to the analog
system. First, the means for the digitally-based compared to the analog-based severity and
error-type indices were generally within a few percentage points of each other and within
the standard error of measurement for these metrics, as reported elsewhere (Shriberg et al.,
1997a). Second, the effect sizes associated with these descriptive data ranged from
negligible to medium, with none reaching the level of large or greater. Of the 36 severity
comparisons in Table VII (i.e., excluding the three error type comparisons for each
transcriber), there was, however, a trend for lower speech competency scores obtained with
the digital audio system (i.e., indicating less competence) than those obtained with the
analog system. Specifically, 25 of 36 comparisons (69%) were lower. Third, with multiple
comparisons using a liberal parametric statistic to test for significant differences on as few as
four sample comparisons (comparable to a t test), none of the Hedges’ corrected 95%
352 L. D. Shriberg et al.
confidence interval tests were significant at the .05 level or beyond. Finally, comparisons
at the diacritic level (e.g., dentalized, lateralized, palatalized sibilants) not shown in
Table VII also indicated that there were no notable differences in scores assigned to
children based on transcriptions obtained using the digital system compared to the analog
audio system.
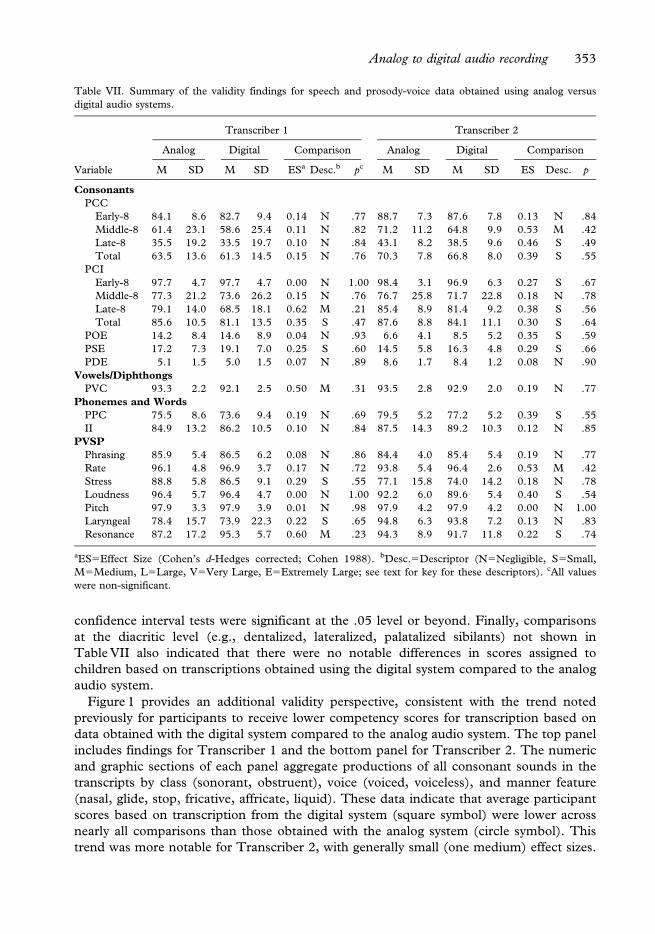
Figure 1 provides an additional validity perspective, consistent with the trend noted
previously for participants to receive lower competency scores for transcription based on
data obtained with the digital system compared to the analog audio system. The top panel
includes findings for Transcriber 1 and the bottom panel for Transcriber 2. The numeric
and graphic sections of each panel aggregate productions of all consonant sounds in the
transcripts by class (sonorant, obstruent), voice (voiced, voiceless), and manner feature
(nasal, glide, stop, fricative, affricate, liquid). These data indicate that average participant
scores based on transcription from the digital system (square symbol) were lower across
nearly all comparisons than those obtained with the analog system (circle symbol). This
trend was more notable for Transcriber 2, with generally small (one medium) effect sizes.
Table VII. Summary of the validity findings for speech and prosody-voice data obtained using analog versus
digital audio systems.
Variable
Transcriber 1 Transcriber 2
Analog Digital Comparison Analog Digital Comparison
M SD M SD ESa Desc.b pc M SD M SD ES Desc. p
Consonants
PCC
Early-8 84.1 8.6 82.7 9.4 0.14 N .77 88.7 7.3 87.6 7.8 0.13 N .84
Middle-8 61.4 23.1 58.6 25.4 0.11 N .82 71.2 11.2 64.8 9.9 0.53 M .42
Late-8 35.5 19.2 33.5 19.7 0.10 N .84 43.1 8.2 38.5 9.6 0.46 S .49
Total 63.5 13.6 61.3 14.5 0.15 N .76 70.3 7.8 66.8 8.0 0.39 S .55
PCI
Early-8 97.7 4.7 97.7 4.7 0.00 N 1.00 98.4 3.1 96.9 6.3 0.27 S .67
Middle-8 77.3 21.2 73.6 26.2 0.15 N .76 76.7 25.8 71.7 22.8 0.18 N .78
Late-8 79.1 14.0 68.5 18.1 0.62 M .21 85.4 8.9 81.4 9.2 0.38 S .56
Total 85.6 10.5 81.1 13.5 0.35 S .47 87.6 8.8 84.1 11.1 0.30 S .64
POE 14.2 8.4 14.6 8.9 0.04 N .93 6.6 4.1 8.5 5.2 0.35 S .59
PSE 17.2 7.3 19.1 7.0 0.25 S .60 14.5 5.8 16.3 4.8 0.29 S .66
PDE 5.1 1.5 5.0 1.5 0.07 N .89 8.6 1.7 8.4 1.2 0.08 N .90
Vowels/Diphthongs
PVC 93.3 2.2 92.1 2.5 0.50 M .31 93.5 2.8 92.9 2.0 0.19 N .77
Phonemes and Words
PPC 75.5 8.6 73.6 9.4 0.19 N .69 79.5 5.2 77.2 5.2 0.39 S .55
II 84.9 13.2 86.2 10.5 0.10 N .84 87.5 14.3 89.2 10.3 0.12 N .85
PVSP
Phrasing 85.9 5.4 86.5 6.2 0.08 N .86 84.4 4.0 85.4 5.4 0.19 N .77
Rate 96.1 4.8 96.9 3.7 0.17 N .72 93.8 5.4 96.4 2.6 0.53 M .42
Stress 88.8 5.8 86.5 9.1 0.29 S .55 77.1 15.8 74.0 14.2 0.18 N .78
Loudness 96.4 5.7 96.4 4.7 0.00 N 1.00 92.2 6.0 89.6 5.4 0.40 S .54
Pitch 97.9 3.3 97.9 3.9 0.01 N .98 97.9 4.2 97.9 4.2 0.00 N 1.00
Laryngeal 78.4 15.7 73.9 22.3 0.22 S .65 94.8 6.3 93.8 7.2 0.13 N .83
Resonance 87.2 17.2 95.3 5.7 0.60 M .23 94.3 8.9 91.7 11.8 0.22 S .74
aES5Effect Size (Cohen’s d-Hedges corrected; Cohen 1988). bDesc.5Descriptor (N5Negligible, S5Small,
M5Medium, L5Large, V5Very Large, E5Extremely Large; see text for key for these descriptors). cAll values
were non-significant.
Analog to digital audio recording 353
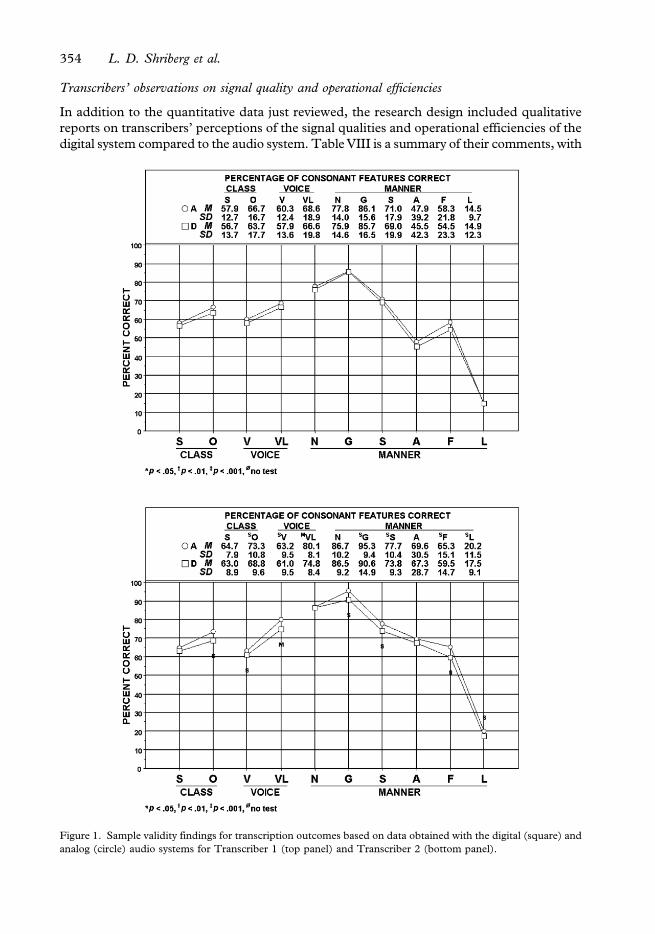
Transcribers’ observations on signal quality and operational efficiencies
In addition to the quantitative data just reviewed, the research design included qualitative
reports on transcribers’ perceptions of the signal qualities and operational efficiencies of the
digital system compared to the audio system. Table VIII is a summary of their comments, with
Figure 1. Sample validity findings for transcription outcomes based on data obtained with the digital (square) and
analog (circle) audio systems for Transcriber 1 (top panel) and Transcriber 2 (bottom panel).
354 L. D. Shriberg et al.
plus (‘‘+’’) and minus (‘‘2’’) signs used to indicate a perceived strength or limitation of each
system, with the signs for qualified or conditional observations placed within parentheses.
Based on a simple tally of the number and type of observations for each system,
transcribers appeared to favor the digital system for glossing, transcription, and prosody-
voice coding. In comparison to the analog system, the digital system was perceived as
having a higher quality signal and more efficient operational features. It is important to note
another efficiency feature associated with the digital system that transcribers did not
comment on until after the study. Transcribers reported that, in comparison to the analog
system, the digital system allowed them to find the speech sample much more easily and
rapidly among other recorded tasks in the assessment protocol.
Summary and conclusions
Several methodological constraints limiting generalizations from this small-scale study have
been noted in the subsection discussions. Primary needs to address in larger studies include
(a) greater number of transcribers reflecting different levels of training, (b) greater numbers
and variability of speech samples, including those from speakers with more severe prosody-
voice involvement, (c) increased time intervals between listening series, and (d) increased
Table VIII. Transcribers’ anecdotal observations on the strengths and weaknesses of the two audio systems.
Observations on Signal Quality Analog Digital
Could hear some things more clearly on digital system but would need to listen to
the same sample on each system side by side to confirm this impression
(+)
When the original audio was ‘‘muffled,’’ quiet, or not clear, it was degraded on both
the analog and digital systems. Still, I was able to hear some things more clearly in
the digital system.
+
I felt more confident transcribing using the digital system because the sound quality
was generally better than that from the analog system. The signal seemed less
distorted, and I was better able to hear fricative distortions, voicing changes, and
the presence (or absence) of word final consonants, which are typically brief
and weak.
+
There seemed to be fewer times when I used the ‘‘benefit of the doubt’’a rule
using the digital system. For example, I was more likely to perceive a dentalized
/s/ without second guessing myself.
+
Observations on Operational Features
The tapes had to be rewound, fast-forwarded, and played at regular speeds to
find the conversational speech sample among the other speech tasks in the
assessment protocol.
(2)
One tape was ‘‘eaten’’ by the analog system and it took me 20 minutes to repair
the tape. After repair, the tape was still a little wrinkled and frayed, and that
section did not play well.
2
The disc drive was sometimes noisy (humming, rattling) when the disc was spinning
in the drive. But once loaded, the disc could be removed from the drive so that
this noise was not a problem during glossing, transcription, and coding.
(2)
I felt less confident judging appropriate resonance using the digital system
compared to the analog system.
2
It took anywhere from 30 seconds to almost 2 minutes to open a .wav file in the
digital system.
2
aThe ‘‘benefit of the doubt’’ convention is used when a transcriber is in doubt about the transcription. The
convention is to transcribe all such occurrences as correct.
Analog to digital audio recording 355
comparisons among alternative types of analog and digital recording and playback systems
(e.g., monaural versus stereo configurations, alternative microphones, alternative ear-
phones). Until data from such cross-validation and extension studies become available, we
suggest that the findings from the present study support the following conclusions and
recommendations.
First, as indicated in Table VIII, both transcribers appeared to prefer digital playback
systems of the type described in this report to the type of analog playback device used for
the past several decades in the clinic and laboratory. At least for speech signals, digital
systems appear to have better signal fidelity (currently, there is heated debate on analog/
digital sound quality issues among music aficionados) as well as many operational
efficiencies. A study series currently in progress in our laboratory is assessing additional
variables, using a laptop system for both audio playback and on-line transcript entry and
transcript analysis. For readers interested in more information on this topic, Chial (2003)
has assembled a technical report that includes guidelines on transitioning to digital
technology for recording, storing, and playback of speech tasks for the purposes of
perceptual and acoustic analyses. This technical report can be downloaded at http://
www.waisman.wisc.edu/phonology/TREP13.PDF.
Second, the data from this study suggest that there may be some differences associated
with transcription using digital systems that might affect standardization. Although the
concurrent validity data suggested that group-level outcomes were generally not
significantly different, the signal quality differences cited by the transcribers and several
of the glossing and reliability findings suggest the need for caution at the level of individual
samples when interpreting clinical and research data obtained with digital compared to
extant analog audio recording and playback systems. Until larger-scale studies identify and
quantify potentially important differences associated with each system, including per-
speaker contrasts in addition to grouped data, it would seem prudent to include control
groups assessed using digital systems in every study requiring a critical comparison of
digital samples to reference data. In clinical and research contexts, speech-language
pathologists could assess possibly relevant local speech differences (e.g., dialectal) using
analog/digital comparisons similar to those used in the present study. Optimally sensitive
studies might compare findings from the most difficult tokens presented to listeners in live
voice, analog, and digital signal conditions.
Finally, as concluded in most methodological studies of phonetic transcription and
prosody-voice coding, auditory-perceptual approaches appear to have limits on reliability
that may be unacceptable for certain clinical and research needs. Although not directly
tested in the present study, even high quality digital recording and playback systems lack
the information on speech events that is needed to maximize the validity and reliability of
narrow phonetic transcription. As in other areas of communicative disorders, transcription
systems that include simultaneous displays of signal properties (e.g., wave forms,
spectrograms) provide substantial assistance in identifying specific speech errors and
differences. Such acoustic-aided systems are currently available, although transcripts
derived from these instruments also require comparative research study relative to
standardization issues.
Acknowledgements
We thank the following research assistants in Pittsburgh and Madison for their important
contributions to this study: Mitzi Ahn, Denise Balason, Jill Brady, Stacey Carr, Catherine
356 L. D. Shriberg et al.
Coffey, Stephanie Nixon, and Alison Scheer. Special thanks to Christie Tilkens for her
assistance with transcription and prosody-voice coding. This research was supported by
collaborative grants from the National Institute on Deafness and Other Communicative
Disorders, NIDCD DC00496 and NIDCD DC00822.
References
Bamattre, R. (1995). How two small hospitals moved from analog to digital transcription. Journal of the American
Health Information Management Association, 66, 48–49.
Beukelman, D. (2000). Recording, refining, transferring, and storing audio samples using Apple Macintosh
computer technology. Retrieved 22 February, 2005, available at: http://aac-rerc.com/archive_aac-rerc/pages/
wtpapers.html
Bunta, F., Ingram, K., & Ingram, D. (2003). Bridging the digital divide: Aspects of computerized data collection
and analysis for language professionals. Clinical Linguistics and Phonetics, 17, 217–240.
Chial, M. R. (2003). Suggestions for computer-based audio recording of speech samples for perceptual and
acoustic analyses (Tech. Rep. No. 13). Phonology Project, Waisman Center, University of Wisconsin–
Madison. Retrieved 22 February, 2005, available at: http://www.waisman.wisc.edu/phonology/TREP13.PDF
Cohen, J. (1988). Statistical Power Analysis for the Behavioral Sciences. Hillsdale, NJ: Lawrence Erlbaum.
Doherty, E. T., & Shipp, T. (1988). Tape recorder effects on jitter and shimmer extraction. Journal of Speech and
Hearing Research, 31, 485–490.
Evans, J. L., & Miller, J. (1999). Language sample analysis in the 21st century. Seminars in Speech and Language,
20, 101–116.
Farinella, K., DeLeo, J., Metz, D. E., Schiavetti, N., & Whitehead, R. L. (1998). Influence of analog versus digital
recordings on speech naturalness judgments. Contemporary Issues in Communication Science and Disorders, 25,
49–53.
Hedges, L., & Olkin, I. (1985). Statistical Methods for Meta-Analysis (pp. 75–106). New York: Academic Press.
Hopkins, W. G. (2003). A new view of statistics. Retrieved 22 February, 2005, available at: http://
www.sportsci.org/resource/stats/effect.html
Ladefoged, P. (2003). Phonetic Data Analysis: An Introduction to Fieldwork and Instrumental Techniques. Malden,
MA: Blackwell.
Long, S. H. (1999). Technology applications in the assessment of children’s language. Seminars in Speech and
Language, 20, 117–132.
MacWhinney, B. (2005). Talkbank: Digital Audio Guide. Retrieved 22 February, 2005, available at: http://
talkbank.org/da/
McSweeny, J. L., & Shriberg, L. D. (1995). Segmental and suprasegmental transcription reliability (Tech. Rep.
No. 2). Phonology Project, Waisman Center, University of Wisconsin–Madison. Retrieved 22 February, 2005,
available at: http://www.waisman.wisc.edu/phonology/TREP02.PDF
Perry, C. K., Ingrisano, D. R. S., & Blair, W. B. (1996). The influence of recording systems on jitter and shimmer
estimates. American Journal of Speech-Language Pathology, 5, 86–90.
Plichta, B. (2002). Best practices in the acquisition, processing and analysis of acoustic speech signals. Eleventh
International Conference on Methods in Dialectology, Joensuu, Finland. Retrieved 22 February, 2005,
available at: http://www.historicalvoices.org/flint/extras/Audio-technology.pdf
Shriberg, L. D. (1986). PEPPER: Programs to Examine Phonetic and Phonologic Evaluation Records. Hillsdale, NJ:
Lawrence Erlbaum.
Shriberg, L. D. (1993). Four new speech and prosody-voice measures for genetics research and other studies in
developmental phonological disorders. Journal of Speech and Hearing Research, 36, 105–140.
Shriberg, L. D., Allen, C. T., McSweeny, J. L., & Wilson, D. L. (2001). PEPPER: Programs to Examine Phonetic
and Phonologic Evaluation Records, computer software. Madison, WI: Waisman Center Research Computing
Facility, University of Wisconsin–Madison.
Shriberg, L. D., Austin, D., Lewis, B. A., McSweeny, J. L., & Wilson, D. L. (1997a). The Percentage of
Consonants Correct (PCC) metric: Extensions and reliability data. Journal of Speech, Language, and Hearing
Research, 40, 708–722.
Shriberg, L. D., Austin, D., Lewis, B. A., McSweeny, J. L., & Wilson, D. L. (1997b). The Speech Disorders
Classification System (SDCS): Extensions and lifespan reference data. Journal of Speech, Language, and Hearing
Research, 40, 723–740.
Shriberg, L. D., & Kent, R. D. (2003). Clinical Phonetics, third edition. Boston, MA: Allyn & Bacon.
Analog to digital audio recording 357
Shriberg, L. D., & Kwiatkowski, J. (1980). Natural Process Analysis: A Procedure for Phonological Analysis of
Continuous Speech Samples. New York: Macmillan.
Shriberg, L. D., & Kwiatkowski, J. (1994). Developmental phonological disorders I: A clinical profile. Journal of
Speech and Hearing Research, 37, 1100–1126.
Shriberg, L. D., Kwiatkowski, J., & Rasmussen, C. (1990). The Prosody-Voice Screening Profile. Tucson, AZ:
Communication Skill Builders.
Shriberg, L. D., & Lof, G. L. (1991). Reliability studies in broad and narrow phonetic transcription. Clinical
Linguistics and Phonetics, 5, 225–279.
Titze, I. R., Horii, Y., & Scherer, R. C. (1987). Some technical considerations in voice perturbation
measurements. Journal of Speech and Hearing Research, 30, 252–260.
Weston, A. D., & Shriberg, L. D. (1992). Contextual and linguistic correlates of intelligibility in children with
developmental phonological disorders. Journal of Speech and Hearing Research, 35, 1316–1332.
Wolfe, V., Martin, D., Borton, T., & Youngblood, H. C. (2003). The effect of clinical experience on cue trading
for the /r–w/ contrast. American Journal of Speech-Language Pathology, 12, 221–228.
Zafar, A., Overhage, J. M., & McDonald, C. J. (1999). Continuous speech recognition for clinicians. Journal of the
American Medical Informatics Association, 6, 195–204.
Appendix
Description of the recording and playback devices used in this study.
Recording
Conversational speech samples were recorded using a Shure omnidirectional UHF
Wireless microphone system (Model UI-UA), with mouth-to-microphone distance
monitored at approximately 6 inches. The audio signal was routed from the body-pack
transmitter to the dual channel diversity receiver of the Shure system and to a Mackie
1202-VLZ Pro 12-channel mixer. Signal amplitudes were adjusted at the beginning of the
session for maximum gain without distortion and were not subsequently changed. The
output from the Mackie mixer fed a TEAC GX-1 integrated recorder. The TEAC was used
to digitally record the conversational speech samples (.dat files) on a Sony SDX1-25C
170m Advanced Intelligent Tape (AIT) recorder.
Of the eight conversational samples used in the present study, three were digitized at a
sampling rate of 20 kHz and five at 50 kHz, both with 16 bits of amplitude resolution
(quantization factor). The monaural acoustic waveform was monitored using a Dataq
Instruments DI-700 USB data acquisition system and WinDaq/Lite waveform acquisition
software. The .dat files were subsequently converted to .wav files using GX View software.
The eight files for the present study were then copied onto a CD-R using Prassi Primo
DVD 2.0 software. For the present study, the acoustic signal was also transmitted from the
systems described above to a Marantz PMD 502 stereo cassette recorder, where it was
recorded on Maxell Professional Communicator Series C60-Low Noise/High Output
analog cassette tapes. Prior to each recording, the signal on the Marantz recorder was
adjusted for optimum gain without distortion and not subsequently changed.
Playback
Analog system. The analog playback system was a Dictaphone Thought Master 2250
transcriber, one of several 280 and 2250 machines in the Thought Master series used by the
Madison group in prior reported studies of child speech sound disorders. Technical
specifications listed in the manual for these rugged playback devices include a frequency
358 L. D. Shriberg et al.
response of 200 Hz to 5000 Hz¡3 dB, a signal to noise ratio of 40 dB, wow and flutter of
.5%, and a harmonic distortion of 3.0% maximum at 400 Hz at the rated power output of
750 milliwatts. The length of playbacks was adjustable; and start/stop, replays, and fast
forward/rewind functions were controlled either by function levers or buttons on the
console or by a foot pedal.
Digital system. The digital playback system hardware included a 933 MHz Intel Pentium III
computer with 384 MB memory, two 80 GB disk drives running Windows 98 second
edition, and a Creative Technology (Audigy 2, SB0240) sound card. The audio signal was
played through a pair of Yamaha YST-M101W magnetically shielded stereo speakers
(rated at 3 watts/speaker and a frequency response of 80 Hz to 20 000 Hz¡3 dB)
positioned at approximately the same distance from the transcriber as the speaker in the
Dictaphone machine.
The application used for playback was a locally developed, C++ programme that uses
Windows routines operating within the PEPPER software environment (Shriberg et al.,
2001). The system included an XKeys foot pedal from P.I. Engineering (http://
www.xkeys.com/xkeys/xkfoot.php) that provided the same stop/start, variable rewind,
and fast forward/rewind capabilities as the Dictaphone analog playback device.
A technical note. It may be useful, for others transitioning to digital recording/playback
devices, to describe a technical challenge experienced when configuring the playback
system to accommodate the 50 kHz sampling rate for some of the conversational samples.
We initially tried to play these speech samples on the same computer system described
above, using a Creative Technology Sound Blaster PCI 128 (CT4750) sound card. The
playback was noticeably slower than the original speech and contained audible clicks. A
series of diagnostic analyses indicated two problems. First, the PCI 128 sound card could
not keep pace with the sampling rate. Switching to the Audigy 2 sound card resolved the
problem, as confirmed by oscilloscopic inspection of test .wav files and perceptual
evaluation. The test files consisted of sample square waves with 50 samples per cycle and
sample rates ranging from 20 kHz to 50 kHz. Second, the driver for the sound card did not
work with the recommended driver (WDM) but did work with an alternative (VXD). The
point of this note is not a concern with the specifics of this system, because hardware and
software options are always evolving. Rather, as discussed in the technical report motivated
by this study (Chial, 2003), the general point is to underscore the array of challenging
technical issues that require careful attention when assembling digital-based audio
recording and playback systems for clinical and research applications.
Analog to digital audio recording 359