Hypersonic Laminar-Turbulent Transition on Circular Cones and Scramjet Forebodies

Brigham Young UniversityBYU ScholarsArchive
All Theses and Dissertations
1971-5
Transition from Laminar to Turbulent Flow for aTwo-Phase MixtureMohammed Sharief QureshiBrigham Young University - Provo
Follow this and additional works at: https://scholarsarchive.byu.edu/etd
Part of the Mechanical Engineering Commons
This Thesis is brought to you for free and open access by BYU ScholarsArchive. It has been accepted for inclusion in All Theses and Dissertations by anauthorized administrator of BYU ScholarsArchive. For more information, please contact [email protected], [email protected].
BYU ScholarsArchive CitationQureshi, Mohammed Sharief, "Transition from Laminar to Turbulent Flow for a Two-Phase Mixture" (1971). All Theses andDissertations. 7174.https://scholarsarchive.byu.edu/etd/7174

TRANSITION FROM LAMINAR TO TURBULENT FLOW
C'l d.06~2-
•/ < h i
FORA TWO-PHASE MIXTURE
Q,
A T hesis
P resented to the
D epartm ent of M echanical Engineering Science
Brigham Young University
In P artia l Fulfillm ent
of the R equirem ents for the D egree
M aster of Science
by
Mohammed Sharief Q ureshi
May 1971

T his th e s is , by Mohammed Sharief Q ureshi, is accepted in its
p resen t form by the Departm ent of M echanical Engineering Science of
Brigham Young U niversity as satisfy ing the th esis requ irem en t for the
degree of M aster of Science.
/ 3 * Ac]. 7 o_________Date
Typed by K atherine Shepherd

To my paren ts

ACKNOWLEDGMENTS
The author w ishes to ex p ress his appreciation to D r. John N.
Cannon fo r suggesting the topic of th is study and for h is a ss is tan ce on the
many technical problem s a ris in g in th is study, and to Bill Hayes for making
the facilities of the departm ent laborato ry and shop read ily available during
the construction of the ap p ara tu s .
IV

TABLE OF CONTENTS
ACKNOWLEDGMENTS ............................................................. iv
LIST OF FIGURES . . . . . . . . . . . . . . . . . . . . . . . . . . . . . . . . . . . vii
NOMENCLATURE . ix
C hapterI. INTRODUCTION .......................... 1
Purpose of the study Scope of the study
II. DESCRIPTION OF APPARATUS.................... 7
Pump and m otor Valving and flow control T est section Flow m easurem ent Flow visualization P re ssu re drop m easurem ent T em pera tu re m easurem ents M ixer
III. TEST PROCEDURE . . . . . . . . . . . . . . . . . . . . . . . . . . . . . . .
G eneral observationsP ressu re drop m easurem ents in w aterP ressu re drop and flow m easurem ents fo r tw o-phase m ixer T em perature m easurem ent Special observation
IV. DISCUSSION OF RESULTS. . . . . . . . . . . . . . . . . . . . . . . . . . .
16
20
Method of data p resen ta tionT ransition from lam in ar to turbulent flowExperim ental re su ltsCom parison with Bingham p lastic model
v

C hapterV. CONCLUSIONS AND RECOMMENDATIONS 39
ConclusionsRecommendations
APPENDIXES . . . . . . . . . . . ........................ .. .............. ..
APPENDIX A. A nalysis of Experim ental Uncertainty APPENDIX B. A nalysis of U ncertainty in Specific Gravity
of Lucite Beads APPENDIX C . Analysis of U ncertainty in Specific Gravity
of M eriam Oil APPENDIX D. Settling-V elocity of Lucite Beads APPENDIX E . Com m ents on Pump Selection APPENDIX F . Tabulation of Data
LIST OF REFERENCES......................................................................
41
. 64
vi

LIST OF FIGURES
Figure Page
1. Representative fundam ental sh ea r d iag ram s fo r Newtonian,B ingham -plastic, p seudo-p lastic , and dilatant m a te ria lsin pipes ................... . . . . . . . . . . . . . . . . . . . . 3
2. Lucite bead size spectrum by sieve analysis . . . . . . . . . . . . . . 6
3 . Schematic d iagram of te s t a p p a r a tu s .................... 8
4 . Pump and flow control valves ....................................................... 10
5 . A general view of the te s t section ......................................... 10
6 . P ressu re drop m easurem ent, m anom eters ' s e ttin g ....................... . 12
7 . Flow m easurem ent (catch bucket, sca le s , and m ixing drum ) . . . 12
8 . Product of friction fac to r and Reynolds num ber v e rsu s Reynoldsnum ber. ....................................................................................................... 22
9. Rate of sh ear v e rsu s sh ea r ra te fo r w ater and various concentra tio n s of the Lucite s lu r ry . ............................................ 23
10. Lam inar velocity p ro files fo r pow er-law fluids (8, 10) . . . . . . . 25
11. P ressu re drop v e rsu s m ass flow ra te fo r 5% Lucite s lu rry . . . . 27
12. P ressu re drop v e rsu s m ass flow ra te fo r 10% Lucite s lu r ry . . . . 28
13. P ressu re drop v e rsu s m ass flow ra te fo r 15% Lucite s lu r ry . . . . 29
14. P ressu re drop v e rsu s m ass flow ra te fo r w ater . . . . . . . . . . . . 30
15. Modified Reynolds num ber v e rsu s Fanning friction fac to r . . . . . 31
16. M ass flow ra te v e rsu s p re s su re drop fo r 5% A .S .P . s lu rry . . . . 32
vii

Figure Page17 . M ass flow ra te v e rsu s p re s su re drop fo r 7 .5% A „S „P. s lu rry „ . 33
18. M ass flow ra te v e rsu s p re s su re drop fo r 9% A .S .P . s lu rry . . . . 34
viii

NOMENCLATURE
A A rea of pipe c ro ss section
ASP Aluminum silicate pigment
D Pipe d iam eter
f Darcy-Wdsbach friction fac to r (dim ensionless)
Cf Fanning friction fac to r (dim ensionless)
ft Feet
^ m ftgr G ravitation constant = 3 2 .1 7 --------- —^f sec^
gm G ram s
gpm Gallons p e r minute
hg Inches deflection on m anom eter
hf P ressu re drop, inches of w ater»
K’ Coefficient in Equation (2), (lb°force)(secn ) /(sq .f t„ )
K Fluid consistency index defined by Equation (1)
L Pipe length
li>£ Pound force
lbm Pound m ass
n" Exponent in Equation (2), dim ensionless
n Flow -behavior index (dim ensionless) defined by Equation (1)
A P P ressu re drop

Re
Re’
sec
t
u
V
W
6
A
yMe
<S~
t
w
T '
Reynolds num ber (Re = ?VD )
Modified Reynolds num ber (Re’n ’ 2 -n ’ D v g
gcK!8n - l )
Seconds
Time
Local velocity
Mean velocity
Weight
Small change
Absolute v iscosity
Effective viscosity (see Reference 4)
Density
Standard deviation
Yield s tre ss
Wall sh ear s tre s s
Shear s tre s s
Kinem atic v iscosity

CHAPTER I
INTRODUCTION
A phase is sim ply one of the s ta tes of m a tte r . M ultiphase flow is
the sim ultaneous flow of severa l p h a se s . Two-phase flow is the s im p le s t
case of m ultiphase flow.
Many common exam ples of two--phase flow occur in nature and
everyday p ra c tic e . Biological system s contain very few pure liqu ids. Body
flu ids, such as blood, m ilk, e tc . , a re a ll m ultiphase, containing a v a rie ty
of c e lls , p a r tic le s , o r d roplets in suspension. Exam ples a re equally p ro
fuse in the in dustria l field, and much chem ical engineering is concerned
with m ultiphase flow s. Many industria l p ro cesses such as power g e n e ra
tion, re frig e ra tio n , and d istilla tion depend on evaporation and condensation
cy c le s . Steel making, paper m anufacturing, and food p rocessing a ll con
tain c ritic a l steps which depend on the p ro p er functioning of m ultiphase flow
d e v ic e s . Many problem s of a ir and w ater pollution a re due to unwanted
tw o-phase flu id s.
One exam ple of a tw o-phase system is a suspension of p a rtic le s
in a flu id . T his system is usually m ore sim ple than the equivalent g a s -
liquid o r liquid-liquid d isp ers io n . N evertheless, many com plications a r is e
in p rac tice due to fac to rs such as the wide varie ty of s izes and shapes of1
the p a rtic le s , non-uniform flow p a tte rn s , agglom eration, and in te r-p a rtic le
fo rce s . Fluidized beds fo r reduction of uranium o re , p lastic coating, soil
compaction, plasm a spraying, e tc . , a re som e engineering applications of
th is type of flow.
S olids-in-liquid suspensions and solutions are c lassified acc o rd
ing to the general type of functional dependence of the sh ea r s tre s s on the
ra te of shear; that is , accord ing to the general shape of the sh ear d iagram ,
o r plot of ra te of sh ea r v e rsu s sh ea r s t r e s s . T here a re two main c la s s if i
cations; Newtonian and non-N ew tonian. The Newtonian fluids a re c h a ra c te r
ized by a constant v iscosity which is independent of the ra te of sh e a r . A
typical sh ear d iagram fo r such a m ate ria l is given by curve "A" in F ig
ure 1. The v iscosity in th is case is given by the inverse slope as follows:
A - gc r /(-d V r /d r )
Non-Newtonian fluids, on the o th er hand, exhibit a variab le v iscosity
dependent upon the ra te of sh ea r, and in some cases upon the duration of
sh e a r . These m a te ria ls a re subdivided into five general types; (a) Bingham
p lastic , (b) p seudo-p lastic , (c) d ilaten t, (d) th ixotropic, and (e) rheopectic
( 5) .
Most solutions and suspensions a re Newtonian a t low co n cen tra
tions, changing to one of the non-Newtonian classification when a certa in
c ritic a l concentration is reached . In the case of suspensions, this c r itic a l
concentration depends upon p artic le size and shape and upon degree of

Rat
e of
She
ar,
8V/D
3
F ig . 1 . --R epresen ta tive fundam ental sh ea r diagram s for Newtonian, B ingham -plastic, p seudo-p lastic , and dilatant m ate ria ls in p ip es.

dispersion as well as upon concentration of the solid phase .
As in the case of true liquids, lam inar and turbulent s ta tes of
flow ex ist fo r non-Newtonian flu id s. Various c r i te r ia have been proposed
fo r defining the end of the lam inar flow regim e, depending upon the
em pirica l m odifications, specialization , and generalization of the conven
tional Reynolds num ber.
In the case of Bingham p lastics it was found (3) that the in itiation
of turbulence in the tubes occurs a t the same Reynolds num ber as for New
tonian fluids ( 2100) when the Reynolds num ber is defined as DV?//*-e
w h e r e i s the approxim ate effective v iscosity for Bingham p lastics at
corresponding Reynolds num ber.
Winding, Baumann, and K ranich (14) proposed that lam inar flow
of pseudoplastic fluids in tubes would end when the Reynolds num ber
defined as reaches 2100, whereyd/0 is the v iscosity at ze ro sh ear
r a te .
M etzner and Reed (8) stated that because of the close resem blance
between highly non-Newtonian fluids at low sh ear ra te and true so lids,
little eddies of the fluid in turbulent motion should behave m ore n early like
solid p a rtic le s and, for exam ple, not b reak up so readily as do the eddies
of Newtonian f lu id s . The net effect of th is difference would be to increase
the Reynolds num ber range beyond the usual (1800 to 6000) Reynolds num
b e r values found fo r Newtonian fluids (7, 9).

Purpose of the study
The purpose of th is study was to investigate the transition R ey
nolds num ber region of a tw o-phase m ix tu re . Any observed difference in
the transition p rocess between these m ix tures and plain w ater would aid in
explaining the m echanism . T ransition was v isually identified and recorded
when it o ccu rred .
Scope of the study
An apparatus was built which could rec ircu la te the tw o-phase m ix
tu re through a 40 foot length of c le a r acry lic p lastic pipe. Aluminum powder
was used to make the flow p a tte rn s v is ib le . A ttem pts were made to identify
visually the s ta r t and the end of tran s itio n . Runs w ere made with tap w ater
and at various concentrations of solid phase . The solid phase used was
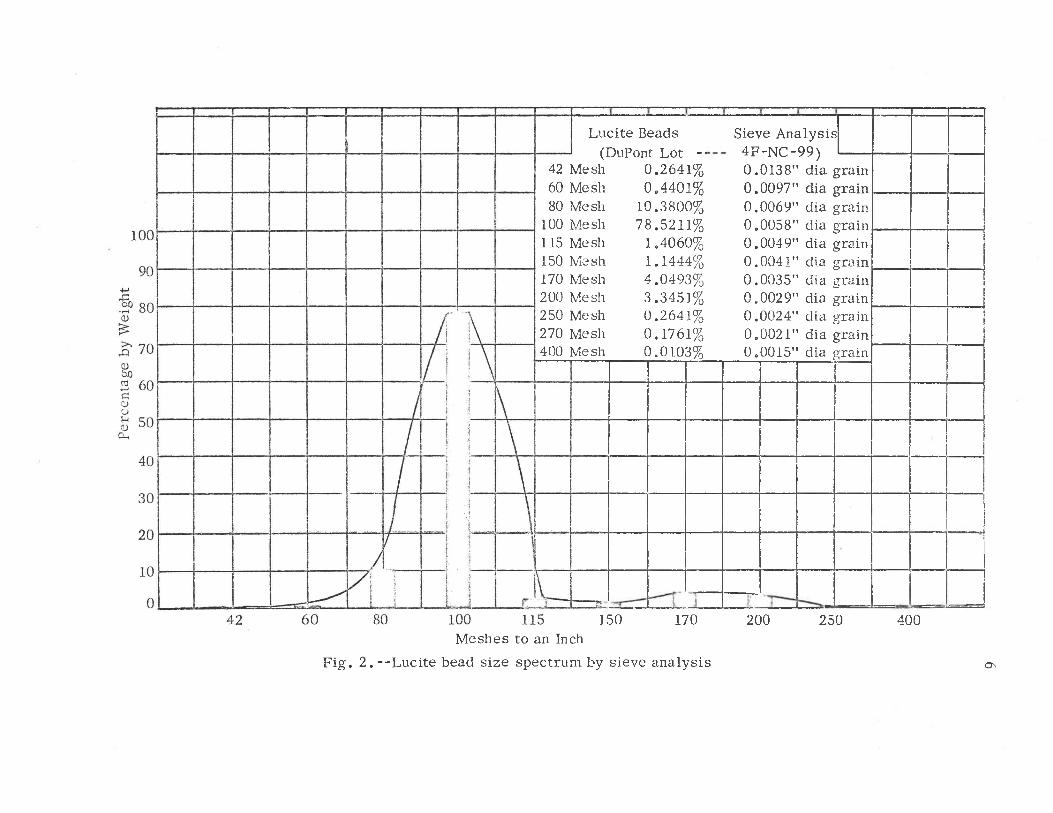
Lucite beads with specific gravity of 1.1115, and an average size of 100
m esh (0.0058 in . d ia .) . In o rd e r to confirm the size of the beads, a sp ec
trum analysis was made (see F igure 2). The specific gravity of beads was
a lso confirm ed and an analysis of uncertain ty was made (see Appendix B).
T ransition fo r w ater and tw o-phase m ixtures was visually observed along
with m easurem ents of the p re s su re drop a c ro ss the te st section fo r the
various flow ra te s .
Lucite Beads (DuPont Lot -•
Sieve A nalysis 4F-N C -99)
42 Mesh 0.2641% 0.0138" dia grain60 Mesh 0.4401% 0.0097" dia grain80 Mesh 10.3800% 0.0069" dia grain
100 Mesh 78.5211% 0.0058" dia grain115 Mesh 1.4060% 0.0049" dia grain150 Mesh 1.1444% 0.0041" dia grain170 Mesh 4.0493% 0.0035" dia grain200 Mesh 3.3451% 0.0029" dia grain250 Mesh 0.2641% 0.0024" dia grain270 Mesh 0.1761% 0.0021" dia grain400 Mesh 0.0103% 0.0015" dia grain
150 170 200 250M eshes to an Inch
F ig . 2 . —Lucite bead size spectrum by sieve analy sis
400
ON

CHAPTER II
DESCRIPTION OF APPARATUS
The apparatus was designed and built to provide the following five
functions:
1. C irculation of the sam ple fluid through the te s t sec tion .
2 . Mixing of the Lucite beads and alum inum powder with the flu id ,
3 . M easurem ent of the flow ra te through the test sec tion .
4 . M easurem ent of the p re s su re drop through the te s t sec tion .
5 . To provide a very long visual tube length.
F igure 3 is a schem atic d iagram of the apparatus showing the d irection of
the flow and the arrangem ent of the component p a r ts .
Pump and m otor
The pump was a centrifugal type of unknown m ake and model (see
F igure 4) obtained from governm ent su rp lu s . The im p e lle r d iam eter was
5 inches. Both the suction and d ischarge p o rts w ere 1 -1 /4 inches in d iam
e te r . The pump was capable of providing 49 .4 gpm through the te s t section
a t 1725 rpm (2). This corresponds to a Reynolds num ber of approxim ately
90,000 for c lea r w ater a t 70°F .
The m otor was a KN type made by Brown and Sharpe Company with a
7

F ig . 3 .--S ch em atic d iagram ol te s t apparatus 00

ra ted capacity of 1/2 hp.
Valving and flow control
T hree gate valves of d ifferent sizes (1-1/4 in ., 1/2 in ., and 1/4
in .) and one needle valve w ere provided fo r the flow co n tro l. The needle
valve was used for fine control during lam in ar flow and tran sitio n , w hereas
the two o thers w ere meant for fully developed turbulent flow. The 1-1 /4 in .
d iam eter valve was used fo r flushing the system to re lieve the se ttling p ro b
lem with the beads. Between the two taps, which w ere provided fo r flow
m easurem ent, a fifth valve was in sta lled . The purpose of th is valve was to
iso late the system from the mixing d ru m . W henever th is valve was open
and the two taps w ere closed , the fluid was trapped into the loop. This was
used as a m eans of preventing w ater m arks from form ing in the c le a r p lastic
pipe during overnight periods and other tim es between runs when the pump
was shut off, and a lso fo r rec ircu la tin g the sam e fluid through the te st s e c
tion fo r v isual study of flow.
One m ore gate valve was provided in the rec ircu la tion loop which
was always kept wide open. In the fa r end of the te s t section a 1/4 in . gate
valve was a lso used to contro l the a ir t ra p .
T est section
The te s t section was a 40 foot length of c lea r cast acry lic p lastic
pipe (see Figure 5). The inside d iam eter was 1.25 inches and the wall
thickness was 0.25 inches. Since the pipe was not available as a single

10
F ig . 4 . --Pump and flow control valves
F ig . 5 .--A general view of the te s t section

11
40 foot length, the te s t section had to be constructed by joining nine se p
a ra te sections of pipe, each about 4 feet 2 inches long. Each two sections
w ere joined by p lastic flanges. P lastic flanges w ere made separately and
then glued with the round ends of the pipe by m eans of a p lastic cem en t. No
problem was faced in joining the m etal pipe with the plastic pipe as two such
sections w ere a lready available (2).
Flow m easu rem ent
A ven turi m eter was insta lled in the flow loop, but p re ssu re d iffe r
en tials were so sm all fo r the low flow ra te s involved that it was v e ry d iffi
cult to get good read in g s .
The weigh bucket method was used to determ ine die flow' r a t e .
The rubber hose at the d ischarge end was able to move m anually from the
m ixing drum to the catch bucket so that a ll the fluid leaving the te s t section
in a given tim e period could be caught and weighed. Toledo sca les, model
2081, w ere used fo r all w'eight m easu rem en t. The resolution fo r these
sca les was 1/2 o z . (See F igures 6 and 7 .)
Flow v isualiza ti on
In o rd e r to identify the point w here the tu rbs s ta rted and where
the flow becam e fully turbulent, it was n ecessa ry to make the flow p a tte rn s
v isible . Very fine aluminum powder was added to the w ater and to the two-
phase m ixture fo r th is p u rp o se . During lam inar flow the p a rtic le s w ere
d istribu ted evenly through the flow, while during the turbulent flow the

12
Fig. 6 . --P re ssu re drop m easurem ent, m anom eters' setting
F ig . 7 . --F low m easurem ent (catch bucket, sca les, and m xing drum).

p a rtic le s swept along by the tu rbs produced dark and light a re a s c o r re s -
13
ponding to the m ovement of the flu id .
T his flow v isualization system was sa tisfac to ry , allowing a ll flow
p a tte rn s to be determ ined v isually , and also showing flow p ro files a c ro ss
the tube except with the aluminum silicate te s t s . During lam inar flow with
w ater and alum inum flakes the fa s te r flow at the core as well as the slow er
flow n ear the wall was c lea rly v is ib le .
P ressu re drop m easurem ent
P ressu re taps w ere placed in the te s t section wall 26 feet, 4 -1 /2
inches a p a r t. The upstream tap was 10 feet from the beginning of the te s t
sec tio n . Thus the flow was well developed in the te s t sec tion . Also, the
turbulence c rea ted by the 90° elbow hastened the flow developm ent. T ests
with plain w a ter showed that the data fo r lam inar, tran s itio n , and turbulent
flow com pared very favorably with Moody's curve for smooth pipes (see
Figure 8).
The p re s su re drop a c ro ss the te s t section was v e ry sm all during
lam inar flow. In o rd er to reduce the high percentage of uncertain ty fo r
the calculation of the friction fac to r and the Reynolds num ber, it was felt
that the b i-flu id m anom eter m ust give sufficient deflection a t a low flow
r a te . Many fluids wre re tr ied , but Meriam. oil of specific gravity 1.04 was
found to be b est suited fo r th is pu rpose . T his reduced the experim ental
uncertain ty to a very large ex ten t. (See Appendix A fo r the calculated value

of uncerta in ty .)
14
Two M eriam bi-flu id m anom eters w ere used together fo r p re s su re
drop m easu rem en t. The lower fluid was M eriam oil w ith a specific gravity
of 1.20 in one and was M eriam oil with a specific g rav ity of 1„04 in the
o th e r. The p re ssu re taps w ere connected to them by m eans of tee joints
which divided the flow into two d irections and each w as connected to each
m anom eter. Polyflow 1/4 in , p lastic tubing was used fo r making a ll the con
nections (see Figure 6). At low flow ra te s , and even a t high flow ra te s ,
M eriam bi-flu id m anom eter with specific gravity 1.04 was a fine indication
of p re ssu re drop, w hereas the o ther one was a co arse indication of the sam e.
At a very high flow ra te it was found to be n ecessa ry to shut the low specific
gravity fluid m anom eter because of the very high p re s s u re d iffe ren tia ls .
Readings w ere taken in inches and tenths of inches. The following form ula
was used fo r conversion of gauge reading to inches of w ater:
Inches of w ater = ( Q0il - £w ater) hg
- (1.2 - 1.0) hg
= (0.2) hg for 1.2 m anom eter o il
(0.04) hg for 1.04 m anom eter oil
T em peratu re m easurem ents
An iron-Constantine therm ocouple together with a Brown portable
potentiom eter, model 126 \V3, was used fo r the tem p era tu re m easurem ent.
An ice bath was provided fo r keeping the re ference junction at 32°F . The

15
one end of the therm ocouple was pinned with the pipe th read s a t the fa r end
of the te s t section w hereas the o ther end was held a t a constant tem p era tu re .
M ixer
The m ixer used was a Lightning m ix er, of which the purpose was to
keep the flow turbulent in the m ixing d ru m . T his was n e ce ssa ry to avoid
any settling problem in the drum that would a lte r the concentration ra tio in
the te s t sec tion . The m ixer consisted of an e lec tric m o to r with a long shaft
33 inches in length. Two p ro p e lle rs w ere provided in the end. The m otor
was made by Mixing Equipment Company with Model NC4, 1725 rpm , 1/4 hp.

CHAPTER III
TEST PROCEDURE
Five d ifferen t te s t p rogram s w ere made with this a p p ara tu s . The
purpose of each te s t p rogram will be explained in the following descrip tion
of the te s t procedure .
G eneral observations
The purpose of this te st p rogram was to learn how the apparatus
would behave and how to control the flow. A secondary objective was to
look fo r any unusual phenomena which would w arran t special investigation.
To s ta r t , the mixing drum was filled with 30 gallons of c le a r w a te r .
The w ater tem p era tu re was m easured using an iron-Constantine th e rm o
couple and was reco rd ed . The pump was s ta rted and the w ater was allowed
to c irc u la te . W ater and 50 gms of aluminum powder w ere mixed with th ree
drops of a Jet Dry detergent in a flask and w ell shaken . It was then allowed
to stand for about five m inu tes. A fter th is length of tim e, the aluminum
powder would a ll be settled to the bottom of the fla sk . The w ater from the
top was poured off and the washed alum inum powder was poured into the
mixing d rum . D ifferent flow ra te s w ere then tr ie d , and the flow p a tte rn s
w ere observed . No flow ra te m easurem ents, o r p re s su re drop m easurem ents,
16

w ere m ade.
17
T hese te s ts showed that the turbulent flow p a tte rn s w ere c lea rly
v is ib le . It was learned that with approxim ately 50 gins of alum inum powder
in the system , the flow p a tte rn s w ere c lea rly seen . The lam inar, tran sitio n ,
and turbulent flow regions could all be distinguished v isu a lly . The turbulent
slugs w ere defined very c lea rly in the transition reg io n .
P re ssu re drop m easurem ents in w ater
The m ixing drum was filled with 30 gallons of w a te r . The a lu m i
num powder was added as described above, and the w a te r tem p era tu re was
noted and re c o rd e d . With the flow control valves set fo r no flow through
the te s t section , the b i-flu id m anom eters w ere checked fo r a ir bubbles to
make su re the p re ssu re d ifferen tia ls m easured would be as nearly c o rre c t
as p o ssib le .
D ifferent flow ra te s w ere sent through the te s t sec tion . F o r each
valve setting the p re ssu re drop a c ro ss the te s t section w as m easured and
reco rd ed . T h is procedure was repeated until lam inar, tran sitio n , and fully
developed turbulent flow had been observed .
P ressu re drop and flow m easurem ents fo r tw o-phase m ixture
A fter testing with the w ater, te s t runs w ere m ade with 5 p e r cent,
10 p e r cent, and 15 p e r cent load ra tio s of Lucite beads added . To s ta r t
w ith, the m ixing drum was filled with 83500 cc of pure w a te r . A carefu lly

18
weighed quantity of Lucite beads was added. A few drops of Jet Dry d e te r
gent w ere a lso poured in the m ixing d ru m . The m ixer was then s ta rted to
m ake the 5 p e r cent concentration s lu r ry . The pump was now s ta rted and
the s lu rry was allowed to c irc u la te . D ifferent flow ra tes w ere then sent
through the te st section and fo r each valve setting , p re ssu re drops and flow
ra te s w ere m easured in the sam e w as as in the case of w a te r . The sam e
procedure was repeated fo r 10 p e r cent and 15 p e r cent concentration
s lu r r i e s .
S im ilar te s ts w ere made with aluminum silicate solids a t 5 p e r
cent, 7 -1 /2 p e r cent, and 9 p e r cent loading ra tio s . Aluminum flakes were
added a t 5 p e r cent loading but the flow patterns were not v is ib le . No a lum
inum flakes w ere added at 7 -1 /2 p e r cent and 9 p e r cent loadings.
T em peratu re m easure ment
An iron-Constantine therm ocouple was used for tem pera tu re m ea
su rem en t. During the experim ental p rocedure a very careful observation
was made to note any significant change in tem p era tu re during the experim ental
p ro c e ss . No change was observed , and the tem peratu re was a lm ost constant
during the experim ental runs for both w ater and Lucite s lu r r ie s .
Special observation
The purpose of th is te s t was to detect any roughness in the te s t
section and a lso to find the effects of s tre s s c racks on flow p a tte rn s which
w ere observed in the te s t section due to unknown rea so n s .

19
To te s t fo r roughness, the flow was adjusted so that it was well
below the transition reg ion . The tap on the d ischarge end of the flow would
then be suddenly opened so that the flow would jump well up into the turbulent
reg ion . Any roughness along the te s t section would then cause the flow to
tra n s is t at the cite of roughness to turbulent flow.
The te s t section was a lm ost com pletely smooth as no appearance
of the above phenomenon w as observed .

CHAPTER IV
DISCUSSION OF RESULTS
Method of data p resen ta tion
It has been found experim entally (8, 10, 13) that the rela tionsh ip
between sh ea r s tre s s and ra te of sh ea r for a g rea t many non-Newtonian
fluids, possibly the m ajo rity , may be rep resen ted closely over wide ranges
of sh ea r ra te by a tw o-constant pow er function of the form
(1)
The ( ------ ) is the sh ea r ra te w ritten fo r flow within a c irc u la r duct. And r
equation of th is type, though em p irica l, appears to rep resen t the rheological
p ro p ertie s fo r a wide v arie ty of non-Newtonian fluids b e tte r than m ost other
proposed equations and certa in ly b e tte r than any o ther available two “constant
equation. F o r th is reason the pow er-law rheological model w ill be adopted
in this p resen t analysis .
When the flow is in a c irc u la r tube, it can be shown (8) that
where
“C w =DAP
4L= K ' ( ^ ) n ’
v D
, d In (DAP/4L)n =--------------------------- = n
d In (8V/D)
20
(2)
( 3 )

K’ = K (3n' - 1
/,
21
and ) (4)4n'
The valves of n ' and K' can be determ ined experim en tally by m easuring the
p re ssu re d ro p and the flow ra te s in a tube. The va lv es of DAP/4L can then
be plotted ve rsu s valves of 8V/D on log-log co o rd in a tes . The slop of the
line in the lam inar region is n ' and the in tercep t fo r 8V/D = 1 is the valve
of K' (see Figure 9).
The coefficient n ' is generally known as the physical property of
the fluid which ch arac te rizes its degree of non-Newtonian behav io r. If it
is a constant with the valve of unity, Equation (2) becom es
T w * K’ ( ------ ) - .................... (5)d r
which is the linear relationship between sh ea r ra te of Newtonian flu id s.
On the other hand, if n ’ is le ss than unity, one will obltain the Ostwald
equation for pseudoplastic fluids, v i s . ,
“ K ( — ) . . e . o o o . (6)d r
Sim ilarly , if n ' is g re a te r tiian unity, the fluid is dilattant in c h a ra c te r .
The g re a te r the divergence of n ' from unity (in e ith e r d irection), the m ore
non-Newtonian the fluid is .
It is noted that n' defines the degree of non-Newtonian behavior
of the fluid and K' defines its consistency . The large;r the valve of K ',
the th icker o r "m ore viscous" the flu id .

(Fri
ctio
n F
acto
r) (
Rey
nold
s N
umbe
r),
f . R
e22
F ig . 8 . --Product of friction fac to r and Reynolds num ber ve rsu s Reynolds num ber.

Shea
r S
tres
s (D
£>P/
4L),
lbf/
ft23
Rate of Shear (8V/D, Sec-1)F ig . 9. --R ate of shear v e rsu s sh ea r ra te fo r w ater and various co n cen tra
tions of the Lucite s lu rry .

24
In R eference 8 i t was found that the p re s su re drop v e rsu s flow ra te
data can be re la ted by the modified Newtonian re la tionsh ip
Cf = 16/R e' . . . . . . . . . . . . . . . . .(7 )
w here the modified Reynolds num ber is defined as
Dn ' y 2 ~n 'g
ScK' ^• ( 8)
F or Newtonian fluids in lam inar flow the velocity is p a rab o lic .
As n ’ d ec rea se s tow ards ze ro , the lam inar-velocity p rofile becom es p ro
g ressive ly f la tte r , and in the lim iting case of n ' =0 it i.s perfectly f la t. On
passing from the lam inar to the turbulent flow region th e lam inar-velocity
profile is flattened by a net turbulent momentum tra n s fe r from the high to
the low velocity a r e a s . Hence turbulence leads to the sam e general effect
on the velocity profile as does a decreasing valve of n '„ F u rth e rm o re , when
n ' is c lose to z e ro , the velocity p rofile is so nearly flail that it can be a lte red
only very little on passing from lam inar to turbulent flow . In the lim iting
case of n ' = 0 w here the lam inar-velocity p rofile is p e rfec tly fla t, th e re can
be no distinction between lam inar - and turbulent-m ean velocity p ro files (see
F igure 10 fo r various velocity p ro file s).
T ransition fro m lam inar to turbulent flow
The tran s itio n from lam inar to tu rbulent flow o c cu rs fo r a certa in
range of the Reynolds num ber, depending upon the in le t conditions and

25
n=0
Local velocity , U f t/se c
n=0»l
0 ¥ 10 Local velocity, U ft/sec
Local velocity , U f t/se c Local velocity, U f t/se c
Newtonian fluid
Local velocity , U f t/se c Local velocity, U f t/se c
F ig . 1 0 .--L am in a r velocity p ro files fo r power-law fluids (8, 10)

26
roughness conditions inside the p ipe . In th is flow loop, the transition range
was observed to begin a t about a Reynolds num ber of 1746 and end a t about
5136 fo r plain w a te r . While the flow is in the transition range it consists of
regions of turbulent spots called turbulent slugs or spots, and regions of
lam inar flow. The size of the turbulent spots in the pipe v a rie s depending
on how high the Reynolds num ber is , and how fa r along the pipe the flow has
trav e led .
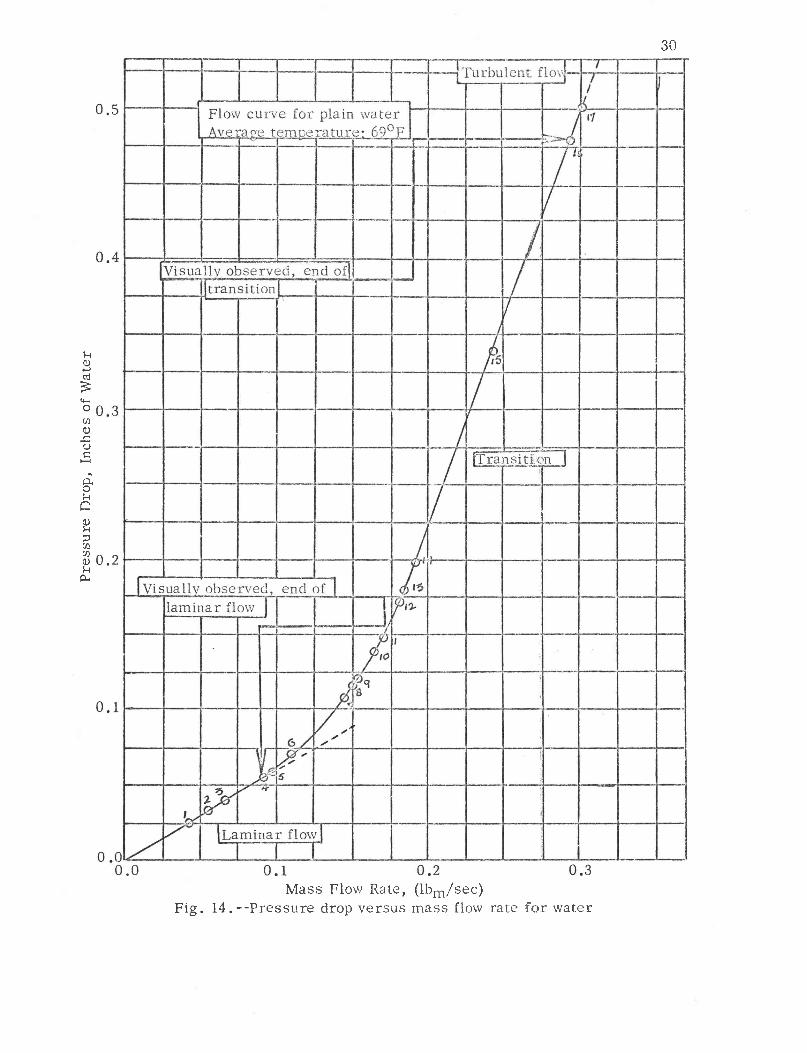
Experim ental re su lts
S tre s s -sh e a r d iagram s of the tw o-phase m ixture and w ater a re
given in F igures 11, 12, 13, and 14. F igure 9 shows the data of the lam inar
flow on logarithm ic co o rd ina tes . The pow er law constant (n'), and the con
sistency index (K') a re determ ined from the curves in F igure 9 . These
cu rves a re stra igh t lines fo r a ll th ree concentration ra tio s . This indicates
that the power law rheological model will fit the data reasonably w ell.
The m ost fam ilia r method of p resen ting data of fluid flow is the
graph re la ting the Fanning friction fac to r to the Reynolds num ber. In the
case of non-Newtonian fluids, a modified Reynolds num ber a s defined p r e
viously is u sed . A plot of the Fanning friction fac to r versus the modified
Reynolds num ber is shown in F igure 15, which contains a ll the lam inar
data points obtained in th is study.
F o r the non-Newtonian system s studied by Dodge and M itzner (5),
with n ' less than unity, the onset of turbulence always occurred at Rey
nolds num ber slightly g re a te r than those fo r Newtonian sy s tem s . F u rth e r-

Pre
ssur
e D
rop,
Inc
hes
of W
ater
27
0 .5
0 .4
0 .3
0 . 2
0 .1
0 .00 .0 0.1 0.2 0.3
M ass Flow Rate, (lbm /se c )F ig . 1 1 .--P re ssu re drop v e rsu s m ass flow ra te fo r 5% Lucite s lu rry

Pre
ssur
e D
rop,
In
ches
of
Wat
er28
O.E
0.4
0.3
0.2
0.1
0 .00 .0 0.1 0 .2 0 .3
Mass Flow Rate, (lbm/s e c )F ig . 1 2 .--P re ssu re drop versus m ass flow r a te for 13% Lucite s lu rry

Pre
ssur
e D
rop,
Inc
hes
of W
ater29
M ass Flow Rate, (lbm /se c )F ig . 1 3 .--P re ssu re drop versu s m ass flow ra te for 15% Lucite s lu rry
Pre
ssur
e D
rop,
Inc
hes
of W
ater
30
M ass Flow Rate, (lbm/s e c )F ig . 1 4 .- -P re ssu re drop v e rsu s m ass flow ra te fo r w ater

Fann
ing
Fri
ctio
n F
acto
r, C
f31
5 6 7 8 ? # 2Modified Reynolds Number, Re'
F ig . 1 5 .--M odified Reynolds num ber v e rsu s Fanning friction factor

ress
ure
Dro
p, I
nche
s of
Wat
er
s l u r r y .F ig . 1 6 . --M ass flow ra te ve rsus p re s su re drop for 5% A .S .P .

Pre
ssur
e D
rop,
In
ches
of
Wat
er
.33
F ig . 1 7 .--M ass flow ra te v e rsu s p re ssu re drop fo r 7.5% A .S .P . s lu rry .

Pre
ssur
e D
rop,
Inc
hes
of W
ater
s l u r r y .F ig . 1 8 . --M ass flow ra te versus p re s su re d rop for 9% A .S .P .

35
m o re , th e ir data showed some evidence that the Reynolds num ber c o r r e
sponding to the onset of turbulence in c rease s slowly with decreasing values
of n ' . F or exam ple, with n ’ of 0 .726, they observed the s ta r t of the t r a n s i
tion region a t a Reynolds num ber of about 2700, w hereas for an n' of 0.38
the onset of turbulence was observed a t a Reynolds num ber of about 3100.
The values of n ' obtained, from F igure 9 show the pseudoplastic
behavior of the m ix tu re . Values of n ' increase slightly with the in c rease of
concentration ra tio s , but th is in c rease is not la rg e . Increase of co n cen tra
tion from 5 to 10 p e r cent changes the value of n ' from 0 .6 to 0 .605 and a
fu r th e r increase up to 15 p e r cent changes to 0.62 only. However, these
d ifferences a re within the experim ental e r r o r and may therefo re not r e p r e
sent d ifferent values; i . e . , the above a sc rib ed influence due to concen tra
tions may not ex ist at a l l .
F igure 14, which is a plot of Cf-Re' shows the delay in transition
p ro cess due to the non-Newtonian behavior of the m ix tu re . The c ritic a l
Reynolds num ber in all th ree cases lie s very close to each o th e r. They
actually show a slight delay due to the in c rease of concentration. The con
clusion which apparently can be drawn front th is is that an in c rease in the
concentration re su lts in an increase of flow behavior index, which in turn
re su lts in an in c rease of c ritic a l Reynolds num ber. This is inconsistant
with the re su lts of Dodge and M etzner (5) described in the last parag rap h .
The s ta r t of the transition region is generally identified by the
deviation of the flow data from the lam inar Cf = 16/R e' line . Dodge and

and M etzner in th e ir study w ere not su re about the effect of change of n '
36
on c ritic a l Reynolds num ber, because the experim en tal data close to die
onset of turbulence exhibited sufficient sc a tte r to p roh ib it a p re c ise defin i
tion of the tran sitio n reg ion . The tran sitio n -reg io n portion of the friction
fac to r curves was located somewhat a rb i tra r i ly .
This study, although lim ited , was different from a ll the previous
w ork. During experim ental procedure a ll the atten tion was paid in observing
visually the s ta r t of the transition reg ion . Several runs w ere made to v isu
ally identify the end of the lam in ar flow and the end of the transition reg ion .
It has a lready been stated above that an in c re a se of concentration
ra tio in c reases the value of n* and th is re su lts in an in c re a se of the c ritic a l
Reynolds num ber. This is only a p re lim inary conclusion . The values of
n ’ obtained from the data in th is study lie very close to each o ther and a
slight change of the slope of curves in F igure 9 can m ake them alm ost equal.
The slope of die lines can be changed slightly by jo in ing the data points in a
slightly d ifferent way. The sam e is tru e fo r the values of K '. Although
every effort was made while plotting these lines the p o ss ib ilitie s s till
e x is t. The values of the c ritic a l Reynolds num ber fo r each concentration
ra tio shows a slight delay in the tran sitio n p ro c e ss , but the values lie so
close to each other that it looks like that transition begins a lm ost a t the
sam e c ritic a l Reynolds num ber fo r each concentration r a t io .
The deviation from purely lam in ar o r s tream line motion has been
observed to occur a t Reynolds num ber as low as about 1000 for lam inar

37
flow (8). The form ation of tru ly p e rs is te n t eddies and substan tia l deviation
of the velocity profile from the parabola of the lam in a r region occurs ra th e r
suddenly over a narrow range of Reynolds num ber n e a r 2100. M etzner and
Reed in th e ir paper (8) show that the non-Newtonian d a ta should begin to
deviate appreciably from the lam inar f=64/Nre line a t approxim ately the
sam e ra tio of viscous sh ea r to in e rtia fo rces as do Newtonian data fo r
smooth pipes; nam ely a t C f=0.008. T here should be a n in c rease in the
transition Reynolds num ber ran g e . The breadth of the tran s itio n region
in c reases as n ’ d e c re a se s . It has been proposed a f te r co rre la tin g a ll l i t e r
a tu re data on non-Newtonian fluids that both Newtonian and non-Ne wtonian
fluids leave the region of stable s tream line flow when ff f i r s t drops to a
value of about 0 .008 o r less (8).
The data obtained from this study w ere a lm ost in agreem ent with
the above sta tem en t. The deviation from lam inar flow s ta r te d with the value
of Cf dropped below 0.00526 in the case of the two-phasie m ixture and 0.008
in the case of w a te r . In the case of w ater fo r which n*--l, the transition
region was from Reynolds num ber 1746 to 5136. When th e value of n' had
dropped to 0 .6 (in the case of the tw o-phase m ixture) th e transition region
was extended to 8400.
Com parison with Bingham p lastic model
The power law rheological model was adopted In a ll the above
analy sis , which was fa irly sa tisfac to ry as the curves off the ra te of sh ea r

38
and shear s tre s s w ere s tra ig h t lines (F igure 9). The s tra ig h t line (F igures
11, 12, and 13) extrapolated to non-zero values of sh e a r s tre s s a t ze ro
shear ra te like the yield s tre s s in a Bingham p lastic m a te r ia l . The
extrapolated data suggest that the value of yield s tre s s in c re a se s slightly
a s the concentration ra tio in c re a se s . At 5 p e r cent load fraction the ex trap o
lated value is 1.01225 x 10~4 psf, w hereas a t 10 p e r cen t and 15 p e r cent
-4load fraction the extrapolation in c reases to 1.1565 x 10 psf and 1.9275
-4x 10 p sf, fo r the Lucite beads.

CHAPTER V
CONCLUSIONS AND RECOMMENDATIONS
The purpose of th is study was to observe how a tw o-phase m ixture
tran s is ted from lam inar to turbulent flow. This was done sa tisfac to rily
and the s ta r t and end of the transition region w ere v isu ally observed for
w ater and the Lucite tw o-phase m ix tu res .
Conclusions
The following conclusions can be drawn from the p re sen t study:
1. T ransition from lam inar to turbulent flow with tw o-phase m ix
tu re s was found to take place within a Reynolds num ber range h igher than
the Newtonian transition reg ion .
2 . The low er c ritic a l Reynolds num ber co rresponding to the onset
of turbulence appeared to in c rease with decreasing valuses of the flow
behavior index. At rd equal to 0 .6 the onset of turbulence was observed
at a Reynolds num ber of about 3040.
3 . The tran sitio n region was found to be extended with the d e c re a s
ing values of flow behavior index .
4 . No significant evidence of any difference betw een the transition
p rocess fo r the d ifferent concentrations of Lucite beads could be seen . This
39

40
was an indication that the transition p rocess was independent of the concen
tra tion ra tio up to 15 p e r cent concentration of Lucite beads.
The above conclusions a re based on data taken with plain tap w ater
and Lucite s lu r r ie s .
Recom m endations
1 . Since the low er c ritic a l Reynolds num ber and the broadness
of the tran sitio n region in c reases with the decreasing values of n ', te s ts
should be run at d ifferent values of n ' than w ere covered by th is study to
fu r th e r investigate th is effect.
2 . A serious problem of plugging the flow control valves was
observed during experim ental runs of the tw o-phase m ixture . L a is was a
ve ry se rio u s p rob lem . Instrum entation should be built to avoid th is p ro b
lem . A p re ssu rized system with the flow con tro l by the regulation of p r e s
su re would be the one best suited for this purpose .
3 . In the end of th is study it was observed that an ordinary w ater
pump was not suited fo r pumping of the s lu r ry . Pump selection m ust be
m ade accord ing to the nature of the fluid to be pumped (see Appendix E
fo r com m ents on pump selection).
4 . A homogeneous solid phase m ust be used for fu rth er studies of
so lid -liqu id suspensions of non-Newtonian s lu r r ie s .
5 . Work in th is a rea needs to be extended into the high Reynolds
4number (> 1 0 ) turbulent reg ion .

APPENDIXES

APPENDIX A
ANALYSIS OF EXPERIMENTAL UNCERTAINTY

43
The table below shows the quantities m easured during the runs for
plain w ater, along with the estim ated uncertainty in the m easu rem en t. The
data for points 1 and 17, F igure 8, w ere selected fo r analysis to dem on
s tra te how the uncertain ty fo r the plotted values of the friction fac to r varied
with increasing flow ra te s .
The v iscosity and density w ere taken from tables in S tree te r (12)
w here they a re given as functions of tem p era tu re . Since the undertainty in
the tem peratu re m easurem ent was - 0 .2 5 °F , the estim ated uncertain ties
for v iscosity and density a re based on the change in these quantities for a
- 0 .025°F change in tem p e ra tu re .
Quantity Magnitude U ncerta in tyPercentage of
U ncertainty
a p 0.6485 in . ± 0 .0 1 in . ± 1.54200
w 4.2500 lbm ± 0 .0 5 lbm ± 1.17647
t 62.7500 se c . ± 0 .1 0 s e c . ± 0 .15936
D 1.2500 in . ± 0 .0 1 in . ± 0.80000
L 26.4000 f t. ± 0 .0 4 f t. ±0.15152
e 62.2965 lbm/ f t 3 ±0.00156 lbm/ f t 3 ±0.002512
1.06775xl0~5 fth r
±0 .00344x l0"5 ft h r
±0.32217
Co 1.0402 gm /cc — 0.0001547 gm /cc ±0.01472
Point 1

Point 17
44
Quantity Magnitude U ncertaintyPercentage o Uncertainty
AP 12 „ 15 in . 0 .02 in . 0.16461
W 18.80 lbm 0.15 lbm 0.79787
t 62.00 s e c . 0 .10 s e c „ 0.16129
D 1.25 in . 0.01 in . 0.80000
L 26.40 f t . 0 .04 f t . 0.1515
Q 62.29465 iiA L ft?
0.00156 ^ ft3
0.00251
1.0402 gm /cc 0.0001547 gm /cc 0.01472
1.06775 ft2/h r 0.00344 ft2/h r 0.32217
The percentage of uncertain ty in the calculated values for the
friction facto r and fo r the Reynolds num ber can be estim ated as the sum
and the difference of the u ncerta in ties in the m easured data used to make
the ca lcu la tio n s .
Since Re = VD/^
it can a lso be stated as
Re = 4W/ -rc 9 i. t D
As m = w/t and V = riV £ A = 4 m / ^ D 2
then
S Re 6 W 2 _w ; ; ( f )2 -(Ai)2 (“ )2D 11/2
Re. - (I)
AP
W
t
D
L
Q

The percentage of uncertain ty in the friction fa c to r can be e s t i
mated in the sam e fashion.
t -- Ilf / (L /D ) ( V2/2g)
h ( = < ^ > < g o )
12
Finally ,
2 AP Co D g
L V2
2 AP eo D g T\?D2-------------------- ( - )
L 4m z
2 AP D g ( a ?D 2 t 2
L 4 W2
TTg Q nD3 Z t 22 W2
Then,
b f=v
6AP 2 — > 4
S?o ^^o
- / 2 $W .21 w ' ) i
U ncertainty in f.R e is given by
& (f .Re) f.R e
( 2 )
\.<t >2 4 <t t >2 ] 1 / 2 .......... <3>
Plugging in values in Equations (1), (2), and (3) re su lted in the estim ated
uncertain ties shown below .
45

46
Point Percentage of Percentage of Percentage ofNo. U ncertainty in f U ncertainty in Re Uncertainty in (f.Re)
1 ± 1.6485588 ± 0.784148 ± 1.825504
17 ± 1.8328830 ±0.230726 ±1.8328830

APPENDIX B
ANALYSIS OF UNCERTAINTY IN SPECIFIC
GRAVITY OF LUCITE BEADS

The table below shows the density of Lucite beads m easured in
the lab o ra to ry .
Reading D ensity gm /cc
1 1.12
2 1 .10
3 1.106
4 1.120
^L M = 4 .446 /4 = 1 .1115 g m s/c c
Reading ^ L " ?LM "di
1 0.0085 72 .20
2 -0.0115 132.20
3 -0.0055 30 .25
4 0.0085 72 .20
^ - k \ t ( ? lLi = l
- ?M)2] V 2
z]~ x 306.85 x 10"6J 1 /2
= (76.71 x 1 0 '6 ; 1/2
= 0.876 x 10~2
= 0.00876 gm s/cc
48

(1.1115 - 0.00876) g m /c c
1.1115 ! 0.79%
Percentage of uncertain ty = - 0.79%
^ M
or
49

APPENDIX C
ANALYSIS OF UNCERTAINTY IN SPECIFIC GRAVITY
OF MERIAM OIL
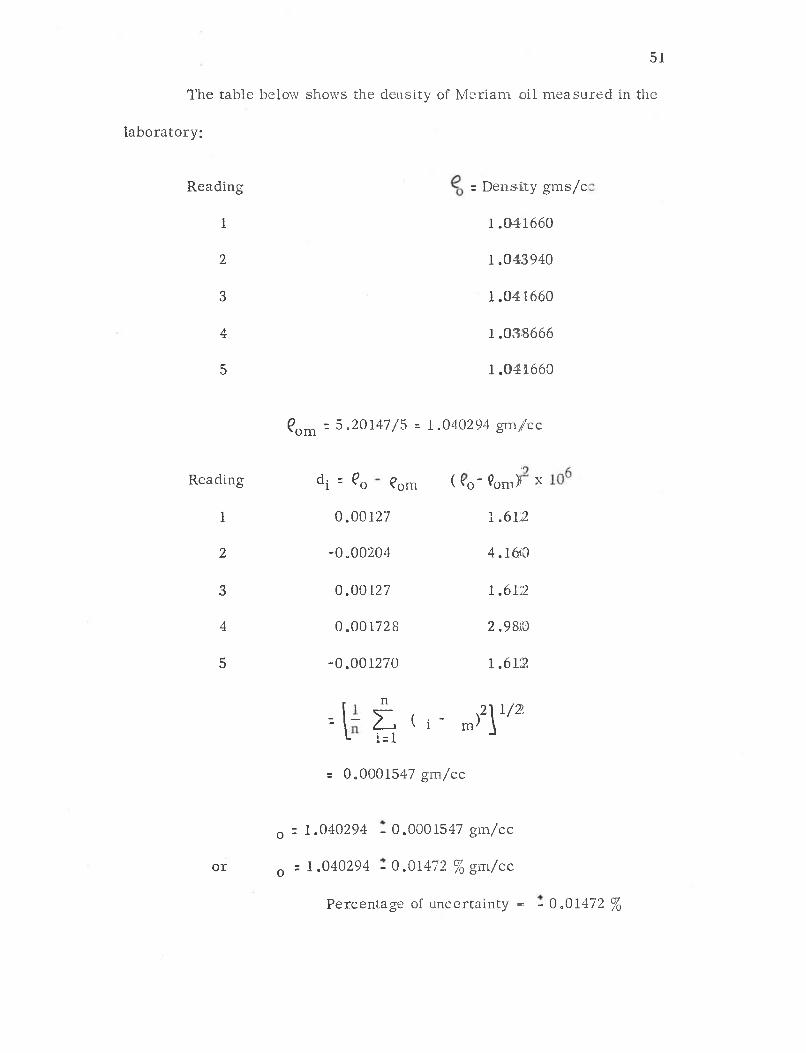
The table below shows the density of M eriam oil m easured in the
laboratory :
Reading z D ensity g m s /c
1 1.041660
2 1.043940
3 1.041660
4 1.038666
5 1.041660
?om = 5.20147/5 = 1.040294 g m /cc
Reading i = ^o ?om ( *o" ^om) x
1 0.00127 1 . 6 0
2 -0.00204 4.1610
3 0.00127 1.612
4 0.001728 2.98(0
5 -0.001270 1 .612
- [ - i t < i - m>T/2>- 1=1
= 0.0001547 gm /cc
0 ; 1.040294 - 0.0001547 gm /cc
o r 0 = 1.040294 - 0.01472 % gm /cc
Percentage of uncertain ty «= - 0.01472 %
51

APPENDIX D
SETTLING-VELOCITY OF LUCITE BEADS

53
The free settling velocity of a sm all p a rtic le can be obtained by a
force balance (3).
Dg * B - mg = 0
Ds ■* B = mg
G"^Ut r Q ■» 4/3 r Q3 ^ g = 4/3 r Q3 € sg
Ut = ^ r o ( ^ s" &
At 70°F
Qs = 1.1115 gm s/cc
eL = i .0000 g m s/cc
g = 980.0000 c m s/se c
yU= 1.0100 x 10~3 g m -se c /c m 3
o r 9 .9 x 10 3 d y n es-sec /cm 3
( 1 )
The average d iam eter of the p a rtic le = 0.006 inches
r Q = 3 x 10~3 inch
or r 0 = 7 .62 x 1 0 '3 cm
Plugging a ll these values in Equation (1), the settling velocity is
given by
ut = 0.1424 cm /sec
With th is value of te rm ina l velocity , the tim e requ ired fo r the

beads to settle down com pletely in the p lastic te st section is 22.3 s e c s .
54
Actual settling was m ore rapid than 22.3 se c . as a ll beads do not begin
a t the top of the tube . Thus those beads n ear the bottom of the pipe as
they en ter the te s t section settle out f i r s t .

APPENDIX E
COMMENTS ON PUMP SELECTION

56
Almost no inform ation is available in the l i te ra tu re on the s e le c
tion of pumps fo r non-Newtonian m a te r ia ls . The following inform ation
was obtained from R eference 1.
In pumping Bingham -plastic pseudoplastic , and thixotropic m a te ria ls ,
a centrifugal pump can be used . The head and efficiency as given for w ater
can be co rrec ted for m a te ria ls to be pumped by m eans of the head and
efficiency fa c to rs . T hese fac to rs a re given (11) as a fuinction of a pump
Reynolds num ber. This Reynolds num ber can be b ased on the density of the
m ixture and the turbulent v isco s ity . If the turbulent v isco sity has not been
determ ined, the coefficient of rig id ity fo r B ingham -plastics o r the lim iting
v iscosity , for pseudoplastics can be used . Open Im p e lle rs should be
employed where the p a rtic le size is large o r w here the p a r tic le s would tend
to plug the sm all passages in a closed im p e lle r. A cem trifugal pump p ro
duces high ra te s of sh ea r and thus reduces the v isco s ity of the m a te ria l, a
d esirab le resu lt from the pumping standpoint; how ever, degradation and
d ispersion of the p a rtic le s may take place and in some teases be u n d e s ir
a b le . F o r these applications it may be p referab le to u se diaphragm pumps
vOi;, in some ca se s , piston pum ps. R o ta ry -g ear pumps cannot be used with
suspensions because of the rapid w e a r.
In pumping dilatan t m a te ria ls , it is n ecessa ry to use a slow-m oving
pump in o rd e r to keep the v iscosity as low as p o ss ib le . Pumps of this type
a re diaphragm , squeegee types, piston, and screw .
Blow cases can be used fo r any type of m a te r ia l . Agitation may

57
be requ ired for cases of rapidly settling so lid s . C are should be exercised
not to perm it a i r to en te r the line, a s it is very difficult to separa te the a ir
from p lastic and viscous m a te r ia ls .

APPENDIX F
TABULATION OF DATA

W ater (F igures 8 and 14)
55!
No. m
I o
'I l+
h f_ f.R e
1 0.04460 0.0260 0.07819 63.95909
2 0.05698 0.0336 0.06190 64.68873
3 0.06750 0.0400 0.05217 64.79361
4 0.09524 0.0560 0.03694 64.49027
5 0.09760 0.0570 0.03580 64.04620
6 0.11002 0.0700 0.03460 69.78820
7 0.14554 0.1060 0.02994 79.87014
8 0.15220 0.1160 0.02996 83.58840
9 0.15532 0.1200 0.02914 84.78854
10 0.16282 0.1380 0.03114 92.95290
11 0.17312 0.1460 0.03001 94.98730
12 0.18467 0.1760 0.03087 104.54095
13 0.18581 0.1800 0.03119 106.26542
14 0.19292 0.2220 0.03568 126.20016
15 0.24684 0.3400 0.03388 151.06269
16 0.29541 0.4800 0.03296 169.29202
17 0.30323 0.5100 0.03318 184.46614

60
5 Per cent Lucite S lurry by Weight (F igure 11)
No. m bf
1 0.0834 0.050
2 0.1030 0.056
3 0.1430 0.070
4 0.1600 0.072
5 0.1540 0.090
6 0.1632 0.110
7 0.1585 0.120
8 0.1630 0.130
9 0.1725 0.160
10 0.1915 0.200
11 0.1980 0.280
12 0.2970 0.480
13 0.300 0.540
10 Per Cent Lucite S lurry by Weight (F igure 12)
1 0.085 0.055
2 0.1025 0.0625
3 0.115 0.0670
4 0.1450 0.0800
5 0.1520 0.0900
6 0.1650 0.1015

61
No. m hfX
7 0.1675 0.1250
8 0.2075 0.2075
9 0.2325 0.2725
10 0.2575 0.3500
11 0.2887 0.4325
12 0.3050 0.4900
13 0.3250 0.5650
15 Per Cent Lucite S lurry by Weight (F igure 13)
1 0.0875 0.060
2 0.1175 0.070
3 0.1500 0.075
4 0.1675 0.100
5 0.2150 0.200
6 0.4525 0.530
5 Per Cent A .S .P . S lurry by Weight (F igure 16)
1 0.0233 0.03
2 0.0433 0.04
3 0.0733 0.05
4 0.1050 0.06
5 0.1300 0.12
6 0.1683 0.27
15 Per Cent Lucite S lurry by Weight (F igure 13)
5 Per Cent A .S .P . S lu rry by Weight (F igure 16)

62
No. m hf
7 0.2333 0.52
8 0.3067 0.76
7 .5 Per Cent A .S .P . S lurry by Weight (F igure 17)
1 0.0034 0.018
2 0.0082 0.021
3 0.0833 0.075
4 0.0902 0.080
5 0.1300 0.1080
6 0.1716 0.218
7 0.1883 0.32
8 0.1900 0.34
9 0.1983 0.37
10 0.2400 0.82
11 0.3233 1.5
12 0.400 1.885
9 Per Cent A .S .P . S lurry by Weight (F igure 18)
1 0.01166 0.022
2 0.0833 0.092
3 0.1266 0.130
4 0.1433 0.175
5 0.1766 0.520
7 .5 Per Cent A .S .P . S lurry by Weight (F igure 17)
9 Per Cent A .S .P . S lurry by Weight (F igure 18)

63
6 0.2400 1.04
7 0.246 1.10
8 0.366 1.81
No. m hf_

LIST OF REFERENCES
LIST OF REFERENCES
1. A lves, G. E . , and Boucher, D. E . "Pipeline Design fo r Non-NewtonianSolutions and Suspensions," Chem ical Engineering P ro g re ss , Vol.48 (1942), 385.
2 . Bates, L . D. "V isual Flow Loop Design fo r Particle-L aden F lu id s ."Unpublished M aste r 's p ro jec t, Brigham Young U niversity , 1970.
3 . Binder, R. C ., and Busher, J . E . "Turbulent Flow of Non-NewtonianS y s tem s," Journal of Applied M echanics, Vol. 13A (1946), 101.
4 . Brodkey, R . S . The Phenomena of Fluid M otions. Los A ngeles, C a lifo rn ia; Addison-W elly Publishing Company, 1970.
5 . Dodge, D. W ., and M etzner, A . B. "Turbulent Flow of NonHMewtonianSystem s , " Journal A m erican institu te of Chem ical Engin e e r s , V o l.5 (1959), 189. “
6 . K rieg er, I . M ., and M ar on, S. H. Journal of Applied Phy sics , Vol. 23(1952), 147.
7 . McAdams, W. H. Heat T ra n sm iss io n . New York: McGraw Hill, 1964.
8. M etzner, A . B ., and Reed, J . C . "Flow of Non-Newtonian FluidsC orre la tion of the L am inar, T ransition , and Turbulent Flow R egion ,” Journal Am erican Institute of Chem ical Engineers, Vol. 5 (1955),434. ~~ —
9. Senecal, V . E ., and Rothfus, R . R. Chem ical Engineering P ro g ress ,V ol. 44 (1953), 537.
10. Skelland, A . H. P . Non-Newtonian Flow and Heat T ra n s fe r . New York:John Wiley and Sons, 1967.
11. Stepanoff, A . J. C entrifugal and Axial Flow Pum ps. New York: JohnWiley and Sons, 1948.
12. S tre e te r , V. L . Handbook of Fluid D ynam ics. New York: M cGraw-HillBook Company, 1961,
65

66
13. W eltmann, R . N . Industria l Engineering C h em istry , V ol. 48 (1956),386.
14. Winding. C . C .; Baumann, G. P .; and K ranich, W. L . Chem icalEngineering P ro g ress , Vol. 43 (1947), 527, 613.

TRANSITION FROM LAMINAR TO TURBULENT FLOW
FOR A TWO-PHASE MIXTURE
Mohammed Sharief Q ureshi
D epartm ent of M echanical Engineering Science
M . S. D egree, May 1971
ABSTRACT
T ransition from lam inar to turbulent flow fo r a tw o-phase m ixture was observed in a c lea r p lastic p ipe . Aluminum powder was used to make the flow p a tte rn s v is ib le .
The transition p ro cess fo r the tw o-phase m ixture was delayed over that of plain w ater and occurred over a w ider range of flow.
The low er c ritic a l Reynolds num ber as well as the length of die tran sitio n Reynolds num bers region appeared to increase with the decreasing value of the non-Newtonian flow behavior index. No significant difference in the c ritic a l Reynolds num ber for transition w as observed due to the increase of loading ra tio for the Lucite b ead s . T here was some change, however, with the aluminum silicate s lu rry loading.
COMMITTEE APPROVAL: