Transit and Aging in Place Technical Memo
35
Connecting Polk County’s Senior Population to Transit Prepared by URS Corporation January 2014 Aging in Place
description
Â
Transcript of Transit and Aging in Place Technical Memo

Connecting Polk County’s Senior Population to Transit
Prepared by URS CorporationJanuary 2014
Aging in Place
Transit and Aging in Place Page i
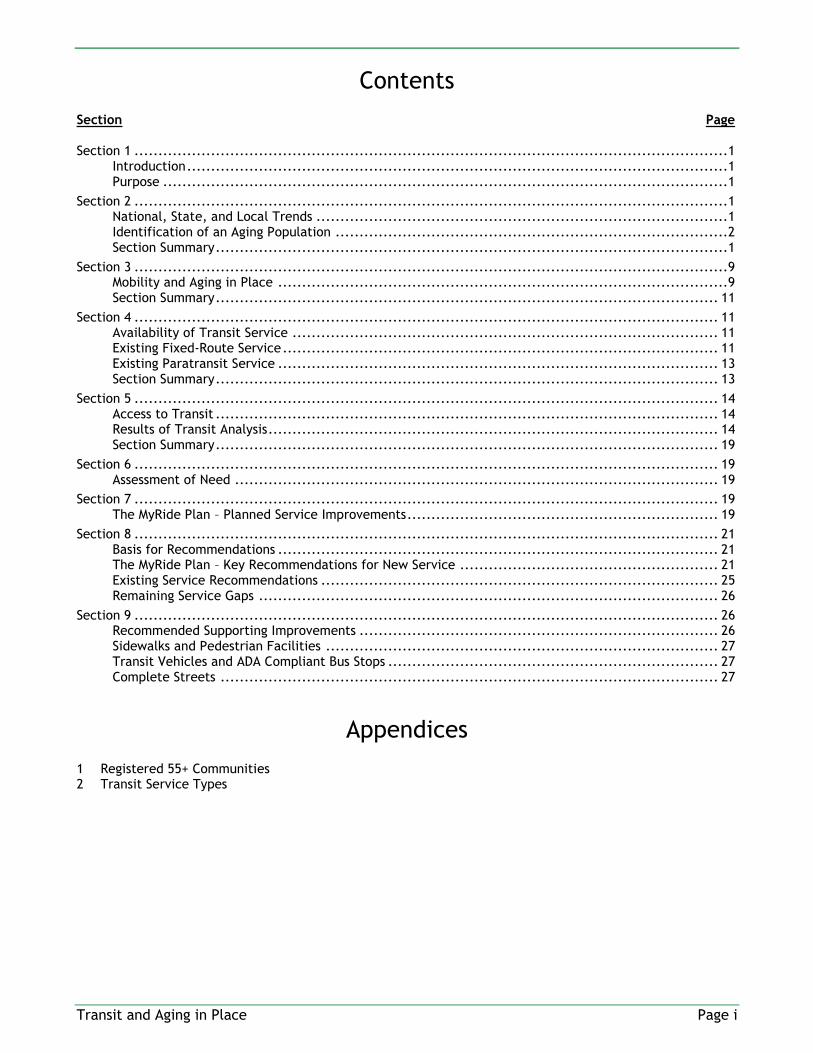
Contents
Section Page
Section 1 ............................................................................................................................ 1 Introduction ................................................................................................................. 1 Purpose ...................................................................................................................... 1
Section 2 ............................................................................................................................ 1 National, State, and Local Trends ...................................................................................... 1 Identification of an Aging Population .................................................................................. 2 Section Summary ........................................................................................................... 1
Section 3 ............................................................................................................................ 9 Mobility and Aging in Place .............................................................................................. 9 Section Summary ......................................................................................................... 11
Section 4 .......................................................................................................................... 11 Availability of Transit Service ......................................................................................... 11 Existing Fixed-Route Service ........................................................................................... 11 Existing Paratransit Service ............................................................................................ 13 Section Summary ......................................................................................................... 13
Section 5 .......................................................................................................................... 14 Access to Transit ......................................................................................................... 14 Results of Transit Analysis .............................................................................................. 14 Section Summary ......................................................................................................... 19
Section 6 .......................................................................................................................... 19 Assessment of Need ..................................................................................................... 19
Section 7 .......................................................................................................................... 19 The MyRide Plan – Planned Service Improvements ................................................................. 19
Section 8 .......................................................................................................................... 21 Basis for Recommendations ............................................................................................ 21 The MyRide Plan – Key Recommendations for New Service ...................................................... 21 Existing Service Recommendations ................................................................................... 25 Remaining Service Gaps ................................................................................................ 26
Section 9 .......................................................................................................................... 26 Recommended Supporting Improvements ........................................................................... 26 Sidewalks and Pedestrian Facilities .................................................................................. 27 Transit Vehicles and ADA Compliant Bus Stops ..................................................................... 27 Complete Streets ........................................................................................................ 27
Appendices
1 Registered 55+ Communities 2 Transit Service Types
Transit and Aging in Place Page ii
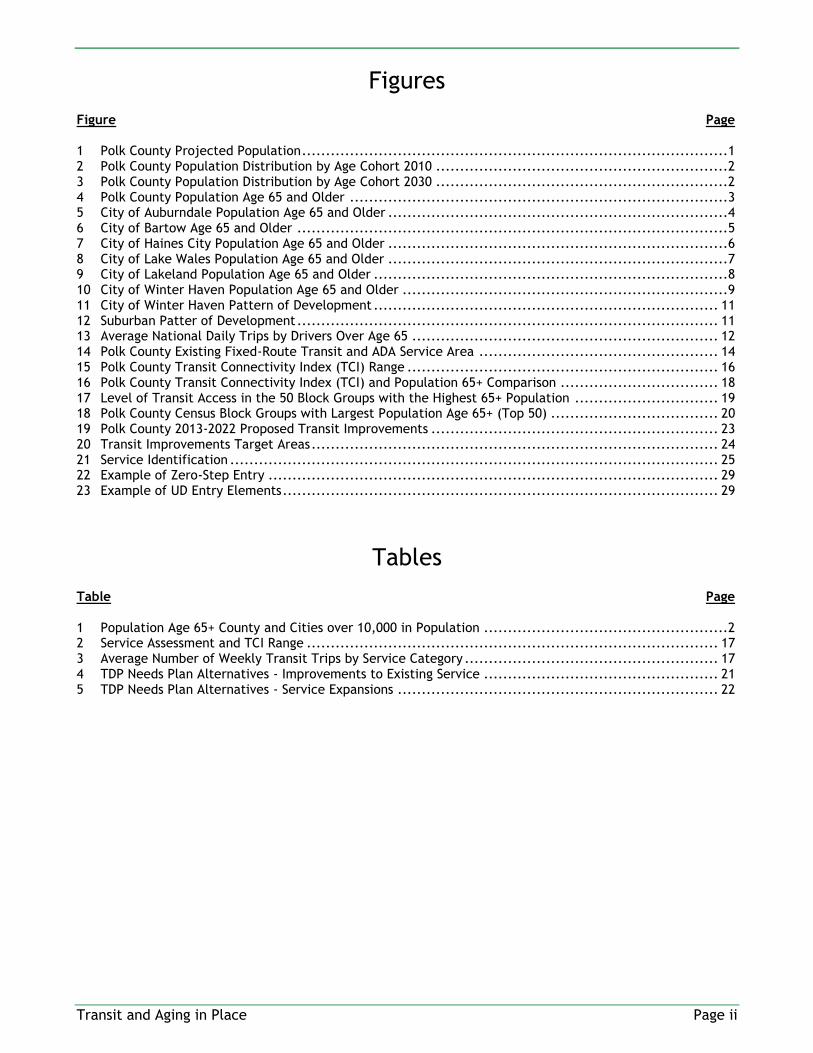
Figures
Figure Page
1 Polk County Projected Population ......................................................................................... 1 2 Polk County Population Distribution by Age Cohort 2010 ............................................................. 2 3 Polk County Population Distribution by Age Cohort 2030 ............................................................. 2 4 Polk County Population Age 65 and Older ............................................................................... 3 5 City of Auburndale Population Age 65 and Older ....................................................................... 4 6 City of Bartow Age 65 and Older .......................................................................................... 5 7 City of Haines City Population Age 65 and Older ....................................................................... 6 8 City of Lake Wales Population Age 65 and Older ....................................................................... 7 9 City of Lakeland Population Age 65 and Older .......................................................................... 8 10 City of Winter Haven Population Age 65 and Older .................................................................... 9 11 City of Winter Haven Pattern of Development ........................................................................ 11 12 Suburban Patter of Development ........................................................................................ 11 13 Average National Daily Trips by Drivers Over Age 65 ................................................................ 12 14 Polk County Existing Fixed-Route Transit and ADA Service Area .................................................. 14 15 Polk County Transit Connectivity Index (TCI) Range ................................................................. 16 16 Polk County Transit Connectivity Index (TCI) and Population 65+ Comparison ................................. 18 17 Level of Transit Access in the 50 Block Groups with the Highest 65+ Population .............................. 19 18 Polk County Census Block Groups with Largest Population Age 65+ (Top 50) ................................... 20 19 Polk County 2013-2022 Proposed Transit Improvements ............................................................ 23 20 Transit Improvements Target Areas ..................................................................................... 24 21 Service Identification ...................................................................................................... 25 22 Example of Zero-Step Entry .............................................................................................. 29 23 Example of UD Entry Elements ........................................................................................... 29
Tables
Table Page
1 Population Age 65+ County and Cities over 10,000 in Population ................................................... 2 2 Service Assessment and TCI Range ...................................................................................... 17 3 Average Number of Weekly Transit Trips by Service Category ..................................................... 17 4 TDP Needs Plan Alternatives - Improvements to Existing Service ................................................. 21 5 TDP Needs Plan Alternatives - Service Expansions ................................................................... 22

Transit and Aging in Place Page 1
With approximately 10,000 baby boomers
turning 65 each day, the nation’s senior
population is expected to increase to 71.5
million (19.7 percent overall) by Year 2030
Projections estimate that by Year 2030, the senior
population in Florida will increase to 7.8 million and
account for 27.1 percent of the state’s population.
Section 1
Introduction
The Polk Transportation Planning Organization (TPO) is
engaged in the Livable Polk Initiative, an effort to
identify action that local public and private sector groups
can take to make Polk County a healthier, safer, and
more enjoyable place to live.
One element of the Livable Polk Initiative focuses on the
development of a transit system that will support the
mobility of seniors in Polk County as they age.
Approximately 18 percent of the Polk County population
is made up of residents age 65 and older (65+). However,
over the next two decades, the 65+ population is
expected to grow by more than 89,000 residents and
account for nearly 25 percent of the County’s overall
population as shown in Figure 1. The importance of
developing a transportation system that supports the
changing needs of an aging population has never been
greater.
Figure 1: Polk County Projected Population
Sources: U.S. Census Bureau, Population Division, Interim State Population Projections, 2005. *U.S. Census Bureau, 2010.
Purpose
This memorandum addresses the provision of transit
service to an aging population and describes solutions
that range from specific route improvements to more
general best practices. All recommendations are
intended to further support the development of a
transportation system that helps maintain the
independence of Polk County’s population as it ages.
Photo: Bus at Winter Haven Transit Center Loads
Passengers
Source: URS Field Review, August 2013.
Section 2
National, State, and Local Trends
Nationally - America’s population is aging. Advances in
medicine, shifts in birthrates, and the coming of age of
the baby boom generation have fostered a demographic
shift in the U.S. The number of Americans age
65+ increased from 35 million (12.4 percent
overall) in Year 2000 to 40.3 million (13 percent
overall) in Year 20101. With approximately 10,000
baby boomers turning 65 each day, the nation’s
senior population is expected to increase to 71.5
million (19.7 percent overall) by Year 20302.
State - With 2.3 million older residents (age 65+),
Florida is second only to California in total senior
population, and leads the nation in proportion of
the population over the age of 65 (with 17.6
percent). Projections estimate that by Year 2030, the
senior population in Florida will increase to 7.8 million
and account for 27.1 percent of the state’s population.

Transit and Aging in Place Page 2
Locally – Polk County is expected to follow the state’s
trend in population growth. As shown previously, Figure
1 depicts the projected growth of the population in Polk
County presenting figures for Years 2010, 2020, and 2030.
As noted in Figure 1, the total population in Polk County
is projected to increase by 199,460 by Year 2030 (a
population larger than the combined total of residents
living in Polk County’s six largest cities in 2010). The
proportion of the population age 65+ in the County is
expected to increase from 18 percent to 24.7 percent.
Figures 2 and 3 illustrate the population distribution by
age grouping in Polk County in Year 2010 and the shift in
the composition of the population by Year 2030,
respectively. A comparison between the figures shows
the large increase in the senior population, particularly
those over age 65.
Figure 2: Polk County Population Distribution by Age Cohort 2010
Source: Population Projections 2008 – 2030 Bureau of Economic and Business Research, 2009.
Figure 3: Polk County Population Distribution by Age Cohort 2030
Source: Population Projections 2008 – 2030 Bureau of Economic and Business Research, 2009.

Transit and Aging in Place Page 1
In 2010, approximately 86 percent of the general
population lived within Polk County’s urban areas
(including census designated urbanized areas and
urban clusters) with 77 percent of the County’s
population located within the Lakeland and Winter
Haven urban areas.
Polk County’s senior households are generally located
in a suburban setting. This result is not unexpected
as research at the national level has shown that more
than half (11.5 million)1 of the 23.1 million 65+
households in the U.S. are located in the suburbs.
Identification of an Aging Population
To make transit systems that better service to the senior
population in Polk County, it is important first to identify
the location of that population. In 2010, Polk County was
home to 602,095 residents, of which approximately
108,000 (18%) were age 65 and over. Table 1 identifies
the population for Polk’s six largest cities (those with a
population over 10,000). The table also provides specific
reference to the number of residents 65+ in each
jurisdiction.
Table 1: Population Age 65+
County and Cities Over 10,000 in Population
Jurisdiction 2010
Population Population
65+
Auburndale 13,507 1,881
Bartow 17,298 2,563
Haines City 20,535 3,077
Lake Wales 14,225 3,274
Lakeland 97,422 20,199
Winter Haven 33,874 7,542
Source: U.S. Census, 2010.
To facilitate a spatial analysis of the population, a series
of maps were developed using 2010 U.S. Census data. To
provide the highest level of detail in location, the maps
present the number of residents age 65+ at the census
block level. However, subsequent analysis uses
population aggregated to the census block group level to
link population data with other socio-economic factors.
The population maps are presented as Figures 4 through
10, and reflect the jurisdictions listed in Table 1.
Florida law requires that age-restricted communities
register with the Florida Commission on Human Relations
(FHCR), the state agency charged with enforcing the
state’s fair housing laws. Location information taken
from the FHCR database in June 2013 served as the basis
for the 55+ Community map. A database of registered 55+
communities was reviewed to help in the identification of
areas containing a high population of seniors; 159
communities were located within Polk County. Figures 5
through 10 list those 55+ communities present within the
area of the map. A full list of the registered 55+
communities is provided in Appendix 1.
In 2010, approximately 86 percent of the general
population lived within Polk County’s urban areas
(including census designated urbanized areas and urban
clusters) with 77 percent of the County’s population
located within the Lakeland and Winter Haven urban
areas. Analysis of the supporting census data shows that
the 65+ population is not separate from the general
population, but is generally distributed across the County
in the same manner. Analysis of the 65+ population
showed the same geographic dispersion. The trend is
most apparent when reviewing the maps of Lakeland
(Figure 9) and Winter Haven (Figure 10). Both maps show
a distinct ring of highly populated census blocks located
at the periphery of the municipalities.
To better understand the distribution of the senior
population within the County, 50 (of 331 Countywide
total) census block groups with the highest number of
senior residents were identified. Of these 50, 45 occur in
the census defined urbanized areas, yet just 16 occur
within Polk County’s 17 cities. This statistic suggests that
Polk County’s senior households are generally located in
a suburban setting. This result is not unexpected as
research at the national level has shown that more than
half (11.5 million)3 of the 23.1 million 65+ households in
the U.S. are located in the suburbs.
Section Summary
Over the next two decades, Polk County’s 65+ population
is expected to grow by more than 89,000 residents and
account for nearly 25 percent of the County’s overall
population.
Approximately 86 percent of the general population lives
within Polk County’s urbanized areas with 77 percent of
the general population located within the Lakeland and
Winter Haven urbanized areas.
Of the 50 census block groups with the highest 65+
population, 45 occur in the census defined urbanized
areas, yet just 16 occur within Polk County’s 17 cities. A
statistic that suggests Polk County’s senior households
are generally located in a suburban setting.

Transit and Aging in Place Page 2

Transit and Aging in Place Page 3

Transit and Aging in Place Page 4

Transit and Aging in Place Page 5

Transit and Aging in Place Page 6

Transit and Aging in Place Page 7

Transit and Aging in Place Page 8

Transit and Aging in Place Page 9
Based on a 2010 AARP survey, nearly 90 percent of
American’s over age 65 want to stay in their
residence for as long as possible, and 80 percent
believe their current residence is where they will
always live.
Based on the findings of a 2004 report, more than
one in five (21 percent) Americans age 65+ do not
drive.
Older non-drivers in the U.S. make 15 percent fewer
trips to the doctor, 59 percent fewer shopping trips
and visits to restaurants, and 65 percent fewer trips
for social, family, and religious activities.
Section 3
Mobility and Aging in Place
Based on a 2010 AARP survey, nearly 90 percent of
American’s over age 65 want to stay in their residence
for as long as possible, and 80 percent believe their
current residence is where they will always live4.
National statistics confirm that many seniors remain in
their homes. A 2007 national housing survey reported
that approximately 93 percent of survey respondents over
the age of 65 live in a traditional community. Only about
four percent of the 65+ population reside in long-term
care facilities such as nursing homes, and approximately
2 percent live in community housing with at least one
service available5. Considering the national trend, the
majority of seniors currently living throughout Polk
County intend to remain in their same communities as
they age.
Throughout Polk County, geography, lands use patterns,
neighborhood design, and other factors may contribute to
limited mobility and present a challenge to seniors
wanting to remain in their homes. In rural areas, large
distances may separate homes from shopping or
community services, and automobiles are often the only
viable means of transportation. In urban and suburban
settings, homes may be closer to neighboring uses, but
are still often isolated.
As intended, many suburban developments buffer
residential neighborhoods from adjacent uses by limiting
through traffic and by separating homes from potentially
disruptive uses (i.e., commercial or industrial). Though
the general form of suburban development works well in
achieving its quality of life goals, the resultant sprawling
development pattern serves to extend the trip length
necessary to move between the residential areas and
other destinations, and reduce alternative modal
opportunities.
Figures 11 and 12 provide aerial photos of two types of
neighborhoods in Polk County to help illustrate the
extended trips made necessary by suburban
development. The first depicts a traditional urban
neighborhood in downtown Winter Haven. The second, a
newer suburban development located just north of US 92
east of Lakeland. The red lines laid over the photos
highlight the roadway networks, and show the variety of
routes present in the urban areas (Figure 11) and lack of
connectivity (Figure 12) within the suburban
development.
Figure 11: City of Winter Haven Pattern of
Development
Figure 12: Suburban Pattern of Developmet

Transit and Aging in Place Page 10
A 2011 survey of City of St Petersburg, Florida
residents showed that 40 percent of respondents
have no idea how they will get around once they can
no longer drive.
In 2011, combined transit service in Polk County
supported approximately 2.25 million trips.
Additionally, the photos make clear the mix of uses
present in the urban neighborhood (Figure 11), and the
standard single use present (Figure 11) in the suburban
area. The isolating street pattern and separation of
residential use from other areas illustrated in Figure 12
serve to extend necessary trip lengths making an
automobile necessary for virtually every trip. An
unfortunate effect of the suburban development pattern
is that once the use of an automobile is no longer a
viable means of travel, residents are often unable to
make trips. Though limitations on mobility for non-drivers
are not restricted to suburban development, the effects
in suburban locaitons can be more prononunced.
Figure 13 provides a comparison of the average national
number of daily trips taken by older drivers versus those
taken by older non-drivers (2009 NHTS).
Figure 13: Average National Daily Trips By Drivers
Over Age 65
Source: Mattson, 2012.
Means of Personal Mobility - The relevance of the effects
of development rests with the decision of many of Polk’s
seniors to remain in their homes as they age, and the
location of these homes in rural or suburban areas. As
people age, many choose to stop driving based on a
variety of reasons (including decline in health or abilities,
concern over safety, no access to a car, and personal
preference). Based on the findings of a 2004 report, more
than one in five (21 percent) Americans age 65+ do not
drive.6
Once seniors stop driving, their connection with the
community is reduced. Information from the National
Household Transportation Survey (NHTS) showed that
more than 50 percent of non-drivers age 65+ (3.6 million
Americans) stay home on any given day partially because
they lack transportation options. Based on data taken
from the same survey, older non-drivers have a
decreased ability to participate in the community and the
economy. Compared with older drivers, older non-drivers
in the U.S. make 15 percent fewer trips to the doctor, 59
percent fewer shopping trips and visits to restaurants,
and 65 percent fewer trips for social, family, and
religious activities.7
Many of the seniors that plan to age in place have fewer
options to remain mobile as they grow older, particularly
if transportation options are limited. Many have not
identified how they will remain connected to their
communities if they choose to stop driving. A 2011 survey
of City of St Petersburg, Florida residents showed that 40
percent of respondents have no idea how
they will get around once they can no
longer drive8.
Often friends and relatives step in to
provide necessary rides for non-driving
seniors. However, a 2002 AARP survey of
adults found that many older people are
uncomfortable asking for rides. About half
surveyed said that they have "feelings of
dependency" and "concerns about
imposing on others" when they ask for
rides.9 Non-drivers in more urbanized
areas generally have more options with
regard to mobility and have shown some
willingness to walk to access local
shopping and services. NHTS results show approximately
11 percent of trips made by seniors are done so by
walking or riding a bicycle. However, the decrease in trip
frequency discussed previously includes the senior urban
population.
Regardless of location, fewer options exist for non-driving
seniors when necessary trips take them outside of their
immediate neighborhood. The role of transit in
connecting the non-driving senior population with the
larger community is of great importance in sustaining
mobility and a high quality of life. Bus service may be
the only way that many seniors who chose to age in
place, or are unable to move to a new location, can stay
connected with their communities.

Transit and Aging in Place Page 11
Photo: Sign in Haines City Directing Travelers to
Local Activity Centers Including the Bethune
Neighborhood Senior Center
Source: URS Field Review, August 2013.
Section Summary
The distances to access services associated with suburban
and rural development patterns often require the use of
an automobile to support daily trips.
Nearly 90 percent of American’s over age 65 want to stay
in their residence for as long as possible, and 80 percent
believe their current residence is where they will always
live.
More than one in five (21 percent) Americans age 65+ do
not drive.
Older non-drivers have a decreased ability to participate
in the community and the economy. Compared with older
drivers, older non-drivers in the U.S. make 15 percent
fewer trips to the doctor, 59 percent fewer shopping
trips and visits to restaurants, and 65 percent fewer trips
for social, family, and religious activities.
The role of transit in connecting the non-driving senior
population with the larger community is of great
importance in sustaining mobility and a high quality of
life.
Section 4
Availability of Transit Service
Currently, three agencies operate transit in Polk County:
Lakeland Area Mass Transit District (LAMTD), Winter
Haven Area Transit (WHAT), and Polk County Transit
Service (PCTS). A fourth, Central Florida Regional
Transportation Authority (LYNX), provides service through
an agreement with PCTS. In total, 24 fixed-routes and
two specialized paratransit systems serve to connect the
residents of Polk County with shopping, services, and
community activities. Figure 14 provides a depiction of
the fixed-routes and specialized service areas operating
in the County as of June 2013. The following information
taken from Polk’s 2013-2022 MyRide Plan provides a
description of the existing service.10
Existing Fixed-Route Service
Citrus Connection, operated by LAMTD, includes 14 fixed-
routes with service to portions of Lakeland and
connections to the cities of Auburndale, Bartow, and
Mulberry. Citrus Connection weekday service spans from
6:05 a.m. to 7:05 p.m. Saturday service spans from
7:15 a.m. to 5:25 p.m. Service frequencies are typically
between 30 and 60 minutes. In 2011, LAMTD carried just
over 1,450,000 passengers.
WHAT currently operates six fixed bus routes in Winter
Haven and surrounding areas including Lake Wales, Lake
Alfred, and Haines City. WHAT service is available on
weekdays from 6:00 a.m. to 7:00 p.m. and on Saturdays
from 7:00 a.m. to 6:00 p.m. Service frequencies are 60
minutes or more. In 2011, WHAT carried just over
525,000 passengers.
Photo: Passenger Loads a Bicycle before Boarding
a Bus Bound for LEGOLAND
Source: URS Field Review, August 2013.

Transit and Aging in Place Page 12

Transit and Aging in Place Page 13
PCTS operates two fixed-routes that serve Fort Meade
and Frostproof. Both routes offer deviated fixed-route
service (Flex Service) that allows the bus to travel up to
¾ mile from its service route to accommodate scheduled
pick-ups and drop-offs. Service is provided on weekdays
from 6:10 a.m. to 7:00 p.m. and Saturdays from 6:10
a.m. to 5:00 p.m. Service frequencies range from 45
minutes to 120 minutes. In 2011, PCTS supported 63,754
passenger trips.
LYNX, contracted for service in Polk County by PCTS,
operates two fixed-routes (416 and 427) and two areas of
demand responsive service all in the Poinciana area.
LYNX operates 7 days a week from 5:30 a.m. to 8:00 p.m.
The demand responsive service termed NeighborLink
operates in two designated service areas (601 and 603) in
Poinciana. Residents in the designated service areas
must call at least two hours in advance to schedule a
pickup time. The NeighborLink service provides
transportation anywhere within a designated service area
or to a LYNX local bus stop. In 2011, the LYNX
NeighborLink 603 carried 13,123 riders in Polk County.
Existing Paratransit Service
The fixed-route transit system in Polk County is
augmented by two specialized types of paratransit
service: Americans with Disabilities Act (ADA) and
Transportation Disadvantaged (TD) service. Based on
figures reported by the Florida Commission for the
Transportation Disadvantaged, in total, 216,310 trips
were supported by paratransit in Polk County in 2011.
The first, ADA service, is an important complement to
the fixed-route system. ADA transit service is provided
within a ¾-mile buffer of each fixed-route transit line.
ADA service supports those members of the community
who through disability are unable to access traditional
fixed-route transit. Users of ADA service must pre-qualify
for service by submitting an application that proves
disability. Age and/or the economic status of the
applicant is not used as certification for this service. Both
LAMTD and PCTS operate ADA service. ADA service
availability is consistent with that of the fixed-route
service spans.
The second paratransit service provided within Polk
County is termed TD service. PCTS coordinates the TD
service, which is provided through a network of
transportation operators. TD service is offered to Polk
County residents who live outside of the ¾ mile ADA
service area and are unable to access transit due to a
documented disability, or based on a circumstance where
no other transportation is available. TD service is
provided Monday through Saturday from 5:00 a.m. to
6:00 p.m. Sunday service is available on a pre-arranged
case-by-case basis only. Reservations are required to be
made a minimum of 72 hours in advance and may be
made up to 7 days in advance. Curb-to-curb TD service is
provided for ambulatory, wheelchair, and stretcher
clients.
Photo: Citrus Connection “Handy Bus” Provides
Curb-to-Curb Service to Shopping on US 98 in
Lakeland
Source: URS Field Review, August 2013.
Section Summary
Currently, three agencies (Citrus Connection, WHAT, and
PCTS) operate transit in Polk County, and a fourth, LYNX,
provides service through an agreement with PCTS.
In total, 24 fixed-routes and two specialized paratransit
systems serve to connect Polk County residents with
shopping, services, and community activities.
Most transit routes in Polk County operate at greater than
30 minute headways Monday – Friday from 6:00 a.m. to
7:00 p.m. Limited services are offered on Saturdays for
some routes.
In 2011, transit service in Polk County carried
approximately 2.25 million riders.

Transit and Aging in Place Page 14
Section 5
Access to Transit
The previous sections identified both the location of the
senior population and the transit services available in
Polk County. To match the population 65+ to available
transit service, an analysis was completed to assess the
level of access that Polk County’s 65+ population has to
the existing fixed-route transit network.
The methodology selected allowed for an assessment of
the location, intensity, and frequency of transit service
within a given geography (census block group). The
evaluation method selected results in the calculation of
an index score, termed Transit Connectivity Index (TCI)xi.
The higher the TCI, the better the transit coverage within
a given area. The formula for the index is as follows:
Notes: Route buffer area = ¼-mile buffer around transit line (sq mi) Total Weekly Trips = Sum of weekly transit trips that pass within
Block Group (or neighborhood) Base geography = Census Block Group (or neighborhood)
The data inputs used in the development of the index
included the identification of a base geography layer
(census block group), location of fixed-transit routes, and
summary of the number of weekly transit trips by route.
A TCI was developed for Polk County based on 2010 U.S.
Census Block Group Geography and existing route
location/frequency information collected from local
transit agencies in June 2013. A ¼-mile buffer applied to
the transit route centerline (representative of the
distance generally accepted as maximum walk to access
bus service) served as the basis for the block group
intersection area. Conservation lands and water bodies
were removed from the block group area calculation.
The decision to remove these categories from the TCI
calculation was based on extensive areas of Polk County
occupied by both conservation lands and water, and the
total lack of ridership present in these areas.
Figure 15 depicts the TCI divided into four subsets. The
ranges highlight comparable differences in transit service
across Polk County. The following section describes the
results of the analysis.
Figure 16 displays the TCI data combined with
population data for the 65+ age group.
The TCI did not take into consideration the service
provided through Polk County’s paratransit system. As
described in the previous section, regions of the County
not connected to fixed-route transit are served by Polk’s
paratransit system.
Results of Transit Analysis
The TCI scores calculated for Polk County range from a
high of 1,547 to a low of zero. The mean score was found
to be 136 with 90 percent of the TCI scores falling below
a total of 376.
To facilitate a comparative analysis, the census block
groups present within Polk County (331 in total) were
divided into ranges based on the TCI score. The first
range included those block groups with no fixed-route
transit service (TCI of zero); 83 census block groups were
identified as part of this group.
Next, the remaining 248 block groups were divided into
six equal sets based on an ordinal ranking of the TCI. The
ranking of the TCI groupings allowed for a relative
comparison of transit service within Polk County. The top
scoring group termed “High 1 - Fixed-Route Access”
included 42 census block groups and represented the
highest level of transit access within the county. The
subsequent TCI groupings included a similar number of
census block groups and represented a spectrum of
service ranging from high to minimal. Table 2 provides a
full listing of transit access rankings. The assessment of
service was broken down into seven categories to provide
detail in both mapping and analysis. However, the
categories may be combined to four summary categories
to simplify the discussion of transit access.
Table 2: Service Assessment and TCI Range
Summary Category Service Assessment
TCI Score Range
High High 1 - Fixed-Route Access
364 – 1,547
High 2 - Fixed-Route Access 164 – 362
Moderate
Moderate 1 - Fixed-Route Access
75-161
Moderate 2 - Fixed-Route Access
35-73
Minimal Minimal 1 - Fixed-Route Access 14-35
Minimal 2 - Fixed-Route Access 0-13
No No Fixed-Route Access 0
*Note: TCI Score Ranges break at the decimal level.

Transit and Aging in Place Page 15

Transit and Aging in Place Page 16

Transit and Aging in Place Page 17
Generally, those households with no access to a
vehicle or those with lower incomes are more likely
to utilize transit.
The TCI scoring provided a means of assessing the
location and frequency of transit service within Polk
County. Generally, higher Service Assessment Categories
occurred in areas characterized by a greater number of
bus trips and larger area within ¼ mile of a transit line.
However, the general service present may additionally
characterized by describing the average number of
weekly trips present within the block groups, see Table
3.
Table 3: Average Number of Weekly Transit Trips
by Service Category
Summary Category Service Assessment
Average Number of
Weekly Transit Trips
High High 1 - Fixed-Route Access 715
High 2 - Fixed-Route Access 320
Moderate
Moderate 1 - Fixed-Route Access
224
Moderate 2 - Fixed-Route Access
167
Minimal
Minimal 1 Fixed-Route Access
127
Minimal 2 - Fixed-Route Access
121
No No Fixed-Route Access 0
Figure 15 presented the TCI by service assessment
category for Polk County, and showed that the highest
TCI scores typically coincided with the most populated
areas of the County. Those areas with the lowest TCI
scores typically occurred in areas with fewer residents
that included large tracts of conservation and state
managed lands.
Having developed the TCI based on census geography, the
TCI values were associated with the range of
demographic data collected by the U.S. Census
Bureau. When data for age, taken from the 2007-
2011 American Community Survey (ACS), was
joined with the TCI, the following was made
apparent:
◊ 74.3 percent (78,965) of residents age 65+ live in an area (census block group) that has some access to fixed-route transit service. 16.2 percent (17,108) of residents age
65+ live in an area that has a high level of fixed-route transit access.
28.7 percent (30,543) of residents 65+ live in an area with a moderate level of transit access.
29.4 percent (31,314) of residents 65+
live in an area with a minimal level of transit service.
◊ 25.7 percent (27,368) of residents 65+ live in an area with no fixed-route transit.
Additional analysis of the combined datasets showed that
of the 50 block groups in Polk County with the highest
number of residents age 65+; 20 have high or moderate
levels of fixed-route transit access, 17 are minimally
served, and 13 of the 50 block groups had no fixed-route
transit service. See Figure 17.
In addition to age, the U.S. Census Bureau collects other
socio-economic data that may be used to identify subsets
of the senior population that may be more likely to rely
on transit as they age. These factors include limited
automobile access and income level. Generally, those
households with no access to a vehicle or those with
lower incomes are more likely to utilize transit12. When
the total population with no access to a vehicle was
examined within the 50 block groups with the highest 65+
population, 16 block groups were identified as having a
higher percentage of residents with no access to a
vehicle than the rate generally present within Polk
County (5.9 percent)13. Also, when the poverty rate was
examined within the same 50 Census block groups, nine
were found to have a rate of poverty that exceeded the
County average (16.4 percent). Figure 18 depicts the 50
block groups identified as having the highest total
population of residents over the age of 65, as well as
those identified as having limited vehicle access and high
poverty rate.
Figure 17: Level of Transit Access in the 50 Block
Groups with the Highest 65+ Population

Transit and Aging in Place Page 18

Transit and Aging in Place Page 19
National statistics show that approximately 38
percent of older households (65+) have at least one
member with a disability.
“the kinds of public transit improvements that would
attract a greater number of older riders are likely to
attract more riders of all groups.”
A comparison between the demographic data and TCI
allowed for the comparison between transit access and
potentially transit dependent populations. The
identification of three demographic elements helped to
focus attention to those areas where transit
improvements may be most prudent.
Section Summary
To match the population 65+ to available transit service,
an analysis was completed to assess the level of access
that Polk County’s 65 + population has to the existing
fixed-route transit network.
74.3 percent (78,965) of residents age 65+ live in an area
(census block group) that has some access to fixed-route
transit service.
25.7 percent (27,368) of residents 65+ live in an area
with no fixed-route transit. Of the 50 block groups in
Polk County with the highest number of residents age
65+; 20 have high or moderate levels of fixed-route
transit access, 17 are minimally served, and 13 of the 50
block groups have no fixed-route transit service.
Section 6
Assessment of Need
In addressing the needs of 65+ transit users, it is
important to understand that the transportation needs of
the senior population are relatively consistent with those
of the overall population. Researchers from the Transit
Cooperative Research Program (TCRP) note that, “the
kinds of public transit improvements that would attract a
greater number of older riders are likely to attract more
riders of all groups.”14
Much of the difference between the transit needs of 65+
riders and that of the general population centers on
physical limitations. National statistics show that
approximately 38 percent of older households (65+) have
at least one member with a disability. Additionally, the
same figures show that disability and age are linked;
approximately 26 percent of households aged 65-74 have
at least one member that is disabled, a figure that
increases to 44 percent in households with residents age
75-84, and to 64 percent in households with members
85+15.
The higher disability rates among 65+ residents translate
to common limitations in accessing and riding transit.
Common limitations related to the senior population’s
use of transit noted as part of TCRP Report 82 included:
◊ Walking long distances to a bus stop,
◊ Waiting for extended periods for a bus to arrive,
◊ Climbing stairs to board a vehicle,
◊ Standing while a vehicle is in motion, and
◊ Needing additional time to board and exit a bus.
Transit improvements that increase frequency and
increase service coverage would address many of these
limitations.
Additionally, research conducted by the TCRP at the
national level provided insight into the preferences of
65+ transit users. The TCRP identified the characteristics
of transit service that seniors felt were most important.
The result of the TCRP effort concluded that, “The
transportation services that seniors most highly value are
reliable, frequent, comfortable, low-cost, curb-to-curb
spontaneous services that access a large variety of
destinations over extended periods of time.”16 A lot is
contained in that summary statement, but each element
represents a characteristic that should be considered in
the identification of services intended to support the 65+
population.
Section 7
The MyRide Plan – Planned Service
Improvements
In 2012, Polk County’s three transit agencies (PCTS,
WHAT, and LAMTD) combined efforts to develop the
2013-2022 Transit Development Plan (TDP) titled
“MyRide.” The MyRide Plan is a document used by the
transit agencies to guide the growth and operation of the
transit system. The transit improvements listed in the

Transit and Aging in Place Page 20
MyRide Plan serve as the basis for the transit
enhancements recommended as part of this
memorandum.
Tables 4 and 5 provide a listing of the transit
improvements identified in the MyRide document. Table
4 provides a summary of needed improvements to
existing service, and Table 5 provides a list of needed
system expansion.
Table 4: TDP Needs Plan Alternatives –
Improvements to Existing Service
Route Name Description Mode
10 Frequency, span, and Sunday
service improvement Traditional fixed-route
15 (WHAT) Frequency, span, and Sunday
service improvement Traditional fixed-route
3 Frequency, span, and Sunday
service improvement Traditional fixed-route
22XL Frequency and span
improvement Traditional fixed-route
22XW Frequency and span
improvement Traditional fixed-route
12 Frequency and span
improvement Traditional fixed-route
45 Frequency, span, and Sunday
service improvement Traditional fixed-route
1 Frequency, span, and Sunday
service improvement Traditional fixed-route
11 Frequency and span
improvement Traditional fixed-route
14 Frequency and span
improvement Traditional fixed-route
15 (Citrus Connection)
Frequency and span improvement
Traditional fixed-route
Eagle Ridge-Lake Wales
Frequency and span improvement
Flex
47 Span improvement Traditional fixed-route
50 Frequency and span
improvement Traditional fixed-route
40/44 Frequency and span
improvement Traditional fixed-route
30 Frequency, span, and Sunday
service improvement Traditional fixed-route
Bartow-Fort Meade
Span improvement Flex
Lake Wales-Frostproof
Frequency and span improvement
Flex
Carter Rd Walmart-Bradley
Span improvement Flex
Source: MyRide, 2012.
Several types or “modes” of transit service are proposed
as part of the need listing. The variety of modes
presented in the plan reflects the wide-range of services
used to support a diverse population in a variety of
environments. Appendix 2 includes a full description of
each type of service.
Table 5: TDP Needs Plan Alternatives –
Service Expansions
Route Name Description Mode
Haines City Circulator New service Traditional fixed-route
Lakeland-Bartow Express New service Express
Lake Davenport-Haines City New service Flex
Bartow Circulator New service Traditional fixed-route
Downtown Lakeland Premium
New service Premium bus
service
Haines City-Poinciana New service Flex
Lakeland-Winter Haven Express
New service Express
Lake Davenport New service Call & ride
Mulberry Circulator New service Traditional fixed-route
Haines City-Eagle Ridge Mall
New service Traditional fixed-route
Lake Wales Circulator New service Traditional fixed-route
Lakeland-Sunrail Terminal Express
New service Express
Auburndale/Florida Polytechnic
New service Traditional fixed-route
Frostproof New service Call & ride
Fort Meade New service Call & ride
Crooked Lake Park/Hillcrest Heights
New service Call & ride
Poinciana New service Call & ride
I-4 Intercounty Express New service Express
Winter Haven Logistics Center
New service Call & ride
North Lakeland Circulator New service Traditional fixed-route
Lakeland/Florida Polytechnic Connector
New service Traditional fixed-route
Mulberry/Lake Wales New service Flex
Source: MyRide, 2012.
The service types include:
◊ Premium Bus Service (Bus Rapid Transit)
◊ Express Service
◊ Traditional Fixed-Route Service (Urban)
◊ Traditional Fixed-Route Service (Rural)
◊ Flex Service

Transit and Aging in Place Page 21
◊ Call-and-Ride Service
◊ Community Transit Options
◊ Commuter Services/Vanpools
◊ Taxi-Access Program
Figure 19 provides a depiction of the full list of proposed
transit improvements identified in MyRide. The project
listed in the following two tables serve as the source for
the recommendations made in the subsequent section.
The previous discussion has focused on the development
of fixed-route service. This memorandum recognizes it is
likely much of the demand for transit service created by
the 65+ population will be supported by the County’s
paratransit system. As new fixed-route services are
added or expanded, the required ADA service will expand
as well. Both the ADA paratransit service and Countywide
TD program provide specialized services supporting the
disabled, low-income, and elderly.
However, It is the goal of the County to provide cost-
effective and efficient transportation. Thus, the County
works to ensure that TD trips are served by fixed-route
transit where ever possible. Therefore, the focus of the
recommendations made in this memorandum center on
the maximization of ridership associated with fixed-route
services.
Section 8
Basis for Recommendations
The purpose of this memorandum is to identify transit
improvements that would enhance senior access to
transit and support the transportation needs of Polk
County’s seniors as they age. Having engaged in an
analysis to identify the level of transit access available to
Polk’s senior population; investment may now be
directed to improve service in those areas with the
highest need that are currently deficient in service.
Figure 20 provides a comparison of the senior population
and TCI data. This map allows for the identification of
target investment areas where large numbers of seniors
live with minimal or no access to transit. Target areas
were identified based on the presence for two or more
top 50 (65+) block groups with minimal or no transit
access in close proximity to one another. Figure 21
compares these target areas with planned transit
investment, and allows for the identification of
improvements that would serve areas of Polk County that
currently have a minimal level of fixed-route transit
service and are home to a large number of senior
residents.
The following recommendations were made first with
regard to the extension of service into areas that have
either no or minimal existing access, and second to the
enhancement of existing service. All recommendations
are made with consideration given to the unique needs of
65+ transit riders.
The MyRide Plan – Key
Recommendations for New Service
Five of the new transit routes described in the MyRide
Plan would affect areas of the County that through the
analysis outlined above have been shown to be
underserved by transit and support large senior
populations. The numbered improvements listed below
serve as a priority list of transit enhancements that
would affect the mobility needs of Polk’s senior
population. These improvements are identified in Figure
21.
1. Haines City to Eagle Ridge Mall: This new service
would introduce traditional fixed-route service along
a 12-mile segment of SR 17. The new route would
serve the cities of Lake Hamilton, Lake Wales,
Dundee, and Haines City. The route would pass
through two of the top 50 block groups (65+), and
within 1 mile of an additional five. The route would
operate in an area currently void of fixed-route
transit service, and pass within ¼ mile of three
registered 55+ communities.
Service Benefit to 65+ Riders: The service would
introduce transit into an area of the County currently
not served by fixed-route service. The route would
provide frequent headways connecting residential
areas with services and shopping.
2. Auburndale/Florida Polytechnic Circulator: This
service would introduce traditional fixed-route
service in the area of Florida Polytechnic University.
The circulator would pass through two of the top 50
block groups (65+) and connect large residential
developments north of I-4 with the University and the
City of Auburndale.
Service Benefit to 65+ Riders: The service would
introduce transit into an area of the County currently
not served by fixed-route service. The route would
provide frequent headways connecting residential
areas with services and shopping.

Transit and Aging in Place Page 22

Transit and Aging in Place Page 23

Transit and Aging in Place Page 24

Transit and Aging in Place Page 25
3. Poinciana Call & Ride: This service would build upon
the LYNX NeighborLink service now operating in
Poinciana. The Call & Ride service area would cover
the most populated portions of two of the top 50
block groups (65+). Additionally, both 65+ block
groups contain demographic characteristics that
suggest increased transit dependency.
Service Benefit to 65+ Riders: The demand responsive
service would provide curb-to-curb transportation
eliminating the need to travel to a transit stop. A
minimum 2-hour advanced reservation would allow
for flexibility and compatibility with individual
schedules.
4. Frostproof Call & Ride Service: This improvement
would introduce a new Call & Ride service area in the
vicinity of the City of Frostproof. Three of the top 50
block groups (65+) fall within the proposed service
area. The Call & Ride service area would greatly
expand the curb-to-curb service currently provided
by Route 35.
Service Benefit to 65+ Riders: With benefits similar
to those discussed for the Poinciana service, the new
demand responsive service would provide curb-to-
curb transportation eliminating the need to travel to
a transit stop. A minimum 2-hour advanced
reservation would allow for flexibility and
compatibility with individual schedules.
5. Lake Wales Circulator: This circulator would
introduce traditional fixed-route service to portions
of the City of Lake Wales not currently served by
fixed-route service. The extension of transit service
eastward toward the core of the city would
incorporate one of the top 50 block groups (65+)
which also shows to have a higher rate of poverty.
Service Benefit to 65+ Riders: The new service would
introduce transit into an area that has a dense
population and high level of supporting
infrastructure. The route would provide frequent
service connecting residential areas with services and
shopping.
Existing Service Recommendations
In addition to the expansion of services outlined above,
the MyRide Plan also identifies a series of enhancements
that would improve service along existing routes. Though
the TCI scores present along most fixed-routes are
moderate or higher, a comparative analysis was used to
assess the proximity of the existing routes to areas with
large 65+ populations. Transit service enhancements with
the greatest anticipated effect on areas with the highest
65+ population include the following:
1. LAMTD Route 47: This route operates traditional
fixed-route service in the area of northern Lakeland.
The route passes through six of the top 50 block
groups (65+) that have a combined total senior
population of 4,489. Two of the block groups also
have additional demographic characteristics that
suggest an increased transit dependency. The
proposed enhancement would extend the service
span of the route that operates in an area of the
County with a relatively high population density.
Service Benefit to 65+ Riders: The span improvement
to the service proposed in the TDP would extend the
route’s service span to 6:30 a.m. to 10:00 p.m. The
extended hours of operation would allow riders an
additional three hours of evening service. Extending
the period would allow the 65+ riders to be more
engaged in community activity.
2. WHAT Route 15: This route operates as traditional
fixed-route service connecting Winter Haven and
Haines City. The route passes through six of the top
50 block groups (65+) that combine to total 5,040
residents age 65+. The proposed service
improvements would include frequency, span, and
weekend improvements. Route 15 would operate 7
days per week with weekday headways of 30 minutes
and a service span from 6:00 a.m. to 10:00 p.m.
Service Benefit to 65+ Riders: The improved
frequency of buses would limit wait times at stops.
The service span improvement would extend the
portion of the day seniors could be active and travel
within the community. The weekend service
improvements would allow mobility for travelers on
Sunday.
3. WHAT Route 30: This route operates as traditional
fixed-route service connecting Winter Haven and
Haines City. The route passes through five of the top
50 block groups (65+) that combine to total 4,689
residents age 65+. The proposed service
improvements would include frequency, service span,
and weekend service improvements. Route 15 would
operate 7 days per week with weekday headway of
30 minutes and weekday service span from 6:00 a.m.
to 10:00 p.m.
Service Benefit to 65+ Riders: The improved
frequency of buses would limit wait times at stops.

Transit and Aging in Place Page 26
According to the center for Smart Growth, almost 40
percent of Americans over the age of 50 say their
neighborhoods lack adequate sidewalks, 55 percent
report inadequate bike lanes or paths, and 48
percent have no comfortable place to wait for the
bus.
The service span improvement would extend the
portion of the day seniors could be active and travel
within the community. The weekend service
improvements would allow increased weekend
mobility for travelers.
4. WHAT Route 35: This route operates Flex service in
the area of Lake Wales and Frostproof. The route
passes through five of the top 50, 65+ block groups
that have a combined senior population of 4,721.
Additionally, three of the five top 50 block groups
(65+) affected by the route currently have minimal
transit access. The proposed service enhancement
would increase the frequency and span of the Flex
route.
Service Benefit to 65+ Riders: The flex service route
provides curb-to-curb transportation eliminating the
need to walk to a transit stop. A regularly scheduled
service that requires a 2-hour advanced reservation
would provide predictable service that allows
flexibility with individual schedules.
Remaining Service Gaps
Though many of the transit service improvements
proposed in the MyRide Plan will improve service to many
of Polk County’s senior residents, gaps in the fixed-route
service will remain. Figure 21 identifies three areas
(marked as yellow circles) of Polk County that support
large senior populations, but have minimal fixed-route
transit service and no planned improvement in service
identified in the MyRide Plan. In the absence of fixed-
route service, the mobility needs of the senior
populations present in both areas identified below will
likely be supported by paratransit service.
Service Gap North of Lakeland: The first area exists just
north of the City of Lakeland. Three of the top 50 block
groups (65+) are located along US 98. This area includes
several 55+ communities including the Cypress Lakes
development. The senior population present in the three
relatively compact block groups totals 3,180.
Service Gap North of US 92: The second area of limited
service occurs just north of US 92 midway between the
cities of Lakeland and Auburndale. Two of the top 50
block groups (65+) with a total population of 2,012 exist
in this area and have minimal or no fixed-route transit
access. Transit service in the area diverts from US 92 to
CR 542 placing many of the nearest stops just beyond a
¼-mile of both block groups.
Service Gap West of Lake Hamilton: The third area of
limited service occurs partly within the City of Winter
Haven and generally west of Lake Hamilton. Six of the
top 50 block groups (65+) with a total population of 4,279
exist in this area and have minimal or no fixed-route
transit access. Several transit improvements are
proposed in adjacent areas, but none would extend into
the six underserved block groups.
Section 9
Recommended Supporting Improvements
The transit investments outlined above will play a key
role in maintaining the mobility of Polk County’s senior
populations as they age. However, transit service itself is
just one part of the transportation network that will be
needed to support the mobility of the population as it
ages.
Infrastructure that supports accessibility is a priority in
serving the 65+ population. The quality of the
connections between trip origins and destinations, and
the form of the urban environment influence
accessibility. According to the center for Smart Growth,
almost 40 percent of Americans over the age of 50 say
their neighborhoods lack adequate sidewalks, 55 percent
report inadequate bike lanes or paths, and 48 percent
have no comfortable place to wait for the bus.
Additionally, these incomplete streets had deadly results
amongst older residents. In 2008, older pedestrians were
overrepresented in fatalities; while comprising 13
percent of the national population, they accounted for 18
percent of related fatalities.17
It is necessary to advance the infrastructure involved in
the complete transit trip. This trip is from door-to-door
whether using paratransit or fixed-route service.
Therefore, it is imperative to consider the trip from the
origin of an individual to the transit bus stop, and the trip
from the final bus stop to the individual’s ultimate
destination. Key infrastructure elements that support
connectivity are sidewalks and other pedestrian facilities,

Transit and Aging in Place Page 27
transit vehicles and ADA compliance, complete streets,
and universal design.
Photo: Polk County Resident Waiting for a Bus on
Combee Road in the Shade of a Utility Pole
Source: URS Field Review, August 2013.
Sidewalks and Pedestrian Facilities
Every fixed-route transit trip involves a pedestrian trip at
the beginning and end of the trip.
It is imperative that sidewalks are complete and well-
maintained in order to allow the senior population to
access fixed-route transit safely. Sidewalks that end
abruptly, lack ramps at side streets, or are in disrepair
could cause falls, or make it difficult or even impossible
to access bus stop locations (especially for those who rely
upon mobility devices). Pedestrian facilities at
intersections that are easy to access and well-maintained
are also imperative in the trip between the origin and the
bus stop and the bus stop and ultimate destination for
the senior population.
It is recommended that a detailed sidewalk and
intersection inventory be completed to determine where
deficiencies exist in the sidewalk network and pedestrian
facilities at intersections. This study should focus at a
minimum on the areas identified as the top 50 block
groups with 65+ population and those with existing or
planned transit service.
Transit Vehicles and ADA Compliant Bus
Stops
One of the limitations identified for the 65+ population is
climbing stairs into the bus. Low-floor vehicles should be
considered to allow for boarding without the need to
climb stairs. This would assist seniors and allow them to
board in a more timely fashion. This would also
contribute to better on-time performance on routes that
serve large numbers of older residents.
In addition, it is recommended that a complete inventory
of bus stops be conducted to determine which bus stops
are not in compliance with ADA. Locations within the
block groups with high densities of 65+ population should
be considered in the prioritization of the projects that
would bring these bus stops into ADA compliance.
Complete Streets
The TDP discusses transit-oriented development (TOD) in
order to direct transit investment to areas with the
potential for higher density, mixed-use, and transit
supportive land uses. As development codes are written
for new transit supportive development, it is important
to consider the 65+ population. Complete street
components are intended to balance safety and
convenience to support the use of fixed-route transit.
Components that can be included in a complete street
initiative include, but are not limited to:
◊ Complete sidewalks;
◊ Bicycle lanes or wide, paved shoulders;
◊ Designated bus lanes and bus pull outs;
◊ ADA compliant bus stops;
◊ Pedestrian refuge islands;
◊ Accessible pedestrian facilities at intersections; and
◊ Curb extensions.
In addition, Universal Design (UD) principles focus on
accommodation of the population as a whole including
the elderly and disabled.

Transit and Aging in Place Page 28
UD promotes accessibility, safety, flexibility,
functionality, simplicity, and comfort without
compromising the aesthetics of space. One of the key
concepts of UD is visitability, meaning that all land uses
meet minimum levels of accessibility to enable persons
with disabilities to visit and navigate freely and without
barriers. The basic requirements for visitability include
zero-step entries, wide doorways, and at least a half-
bath on the first floor of each residential unit. Figure 22
illustrates the zero step entry. Additionally, to be
accessible, doorways must provide 32 inches of clear
width. A required 32-inch entry is mandated by ADA.
However, an entry based on UD principles would build
upon the basic accessibility requirement and consider
user ability and ease of use in its design. A UD entryway
may incorporate elements such as wider entry, automatic
sliding doors, lighter weight door materials, or
specialized door handle configurations18
. Figure 23
illustrates some of the specialized entry elements.
Figure 22: Example of Zero-Step Entry
Disability access to public buildings and projects has been
incorporated within zoning codes to include such
requirements as the number of parking spaces reserved
for people with disabilities and the availability of ramps
or elevators. Accessibility in public buildings is mandated
within ADA compliance. Currently, in most of the nation,
visit ability principles are optional. They and other UD
principles could be applied to future TOD and new uses,
including but not limited to residential, commercial, and
retail. 19
UD Entry Elements ◊ Wide door
◊ Lever handles
◊ No steps
◊ Covered entry
◊ Package shelf
◊ Motion lights ◊ Chair for resting

Transit and Aging in Place Page 29
Figure 23: Example of UD Entry Elements20

Transit and Aging in Place Page 30
1 US Census Bureau. 2011. The Older Population, Washington
DC. http://www.census.gov/prod/cen2010/briefs/c2010br-09.pdf
2 US Census Bureau. 2010. The Next Four Decades: The older Population in the United States 2010 to 2050, Washington DC. http://www.census.gov/prod/2010pubs/p25-1138.pdf
3 Center for Housing Policy. 2012. Housing an Aging Population: Are We Prepared? Tabulations of the 2009 American Housing Survey (AHS). Washington DC. http://www.nhc.org/media/files/AgingReport2012.pdf
4 National Conference of State Legislatures and AARP Public Policy Institute. 2011. Aging in Place: A State Survey of Livability Policies and Practices. Washington DC. http://assets.aarp.org/rgcenter/ppi/liv-com/aging-in-place-2011-full.pdf
5 American Planning Association. 2008. Housing an Aging Population. Tabulations of the Centers for Medicare and Medicaid Services, Medicare Beneficiary Survey. Chicago. http://www.planning.org/pas/infopackets/pdf/EIP-21.pdf
6 Surface Transportation Policy Project. 2004. Aging Americans: Stranded Without Options. Author. http://www.transact.org/report.asp?id=232
7 Surface Transportation Policy Partnership. 2001. Analysis of the National Household Transportation Survey. http://www.transact.org/library/reports_html/seniors/exec_sum.asp
8 Salmon, Jennifer, Aging Research Group. 2011. Planning for an Aging Saint Petersburg: Results of a Survey of the Age 45 and Older Population. City of Saint Petersburg. St Petersburg. http://www.communitiesforalifetime.org/docs/Planning_for_an_Aging_Society_Final_Report.pdf
9 Ritter, A.S., Straight, A., and E. Evans. 2002. Understanding Senior Transportation: Report and Analysis of a Survey of Consumers Age 50+. AARP. http://assets.aarp.org/rgcenter/il/2002_04_transport.pdf
10 Polk Transit. 2012. My Ride: Polk Consolidated Transit Development Plan FY 2013-2022. Bartow FL. http://polktpo.com/downloads/1374-2013-2022-Transit-Development-Plan
xi Transportation Research Record. Journal of the Transportation Research Board. No. 2077. Estimating Transportation Costs by Characteristics of Neighborhood and Household. Transportation Research Board of the National Academies, Washington. http://htaindex.cnt.org/downloads/Estimating-Transportation-Costs.pdf
12 Transit Cooperative Research Program (TCRP). 1998. TCRP Report 20: Transit Markets of the Future, The Challenge of Change. Washington DC. http://onlinepubs.trb.org/onlinepubs/tcrp/tcrp_rpt_28-a.pdf
13 US Census Bureau. 2012. 2077-2011 American Community Survey 5 year Estimate, DP02. http://factfinder2.census.gov/faces/nav/jsf/pages/index.xhtml
14 Transit Cooperative Research Program (TCRP). 2002. TCRP Report 82: Improving Public Transit Options for Older Persons, Volume 2: Final Report. Washington. http://www.transitwiki.org/TransitWiki/images/2/2e/TCRP_Report82.pdf
15 Center for Housing Policy. 2012. Housing an Aging Population: Are We Prepared? Tabulations of the 2009 American Housing Survey (AHS). Washington DC. http://www.nhc.org/media/files/AgingReport2012.pdf
16 Ibid. 17 National Complete Streets Coalition. 2013. Older Adults.
http://www.smartgrowthamerica.org/complete-streets/complete-streets-fundamentals/factsheets/older-adults
18 City of New York Department of Design and Construction. 2003. Universal Design New York 2, New York. http://www.nyc.gov/html/ddc/downloads/pdf/udny/udny2.pdf
19 American Planning Association. 2009. Multigenerational Planning,: Using smart growth and universal design to link the needs of children and the aging population. Chicago. http://www.planning.org/research/family/briefingpapers/multigenerational.htm
20 The Center for Universal Design, NC State University College
of Design. 2006. Residential Rehabilitation, Remodeling and Universal Design. Raleigh. http://www.ncsu.edu/ncsu/design/cud/pubs_p/docs/residential_remodelinl.pdf.