TransGraph Research Consulting Technology TransGraph Research Consulting Technology Commodity Price...
45
TransGraph Research Consulting Technology Commodity Price Risk Management solutions Impact of Currency on commodity markets and price outlook of currency, meal, maize and sugar June 2015
-
Upload
melina-burke -
Category
Documents
-
view
219 -
download
0
Transcript of TransGraph Research Consulting Technology TransGraph Research Consulting Technology Commodity Price...
TransGraph Research Consulting
TechnologyCommodity Price Risk Management
solutions
Impact of Currency on commodity markets and price outlook of
currency, meal, maize and sugarJune 2015
© TransGraph Consulting Pvt Ltd Slide
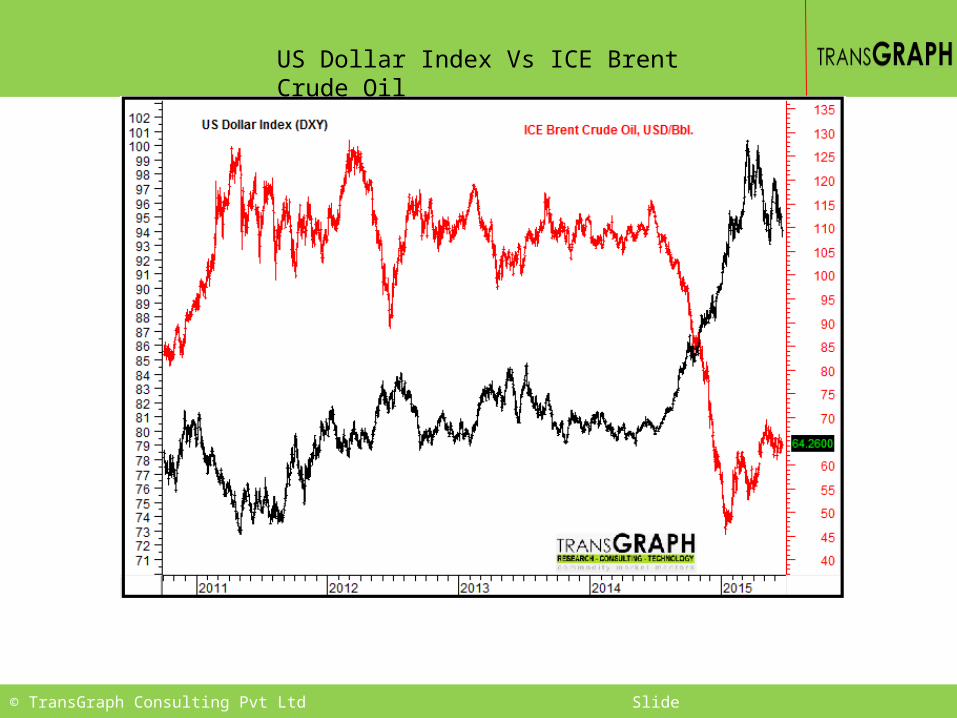
US Dollar Index Vs ICE Brent Crude Oil
© TransGraph Consulting Pvt Ltd Slide
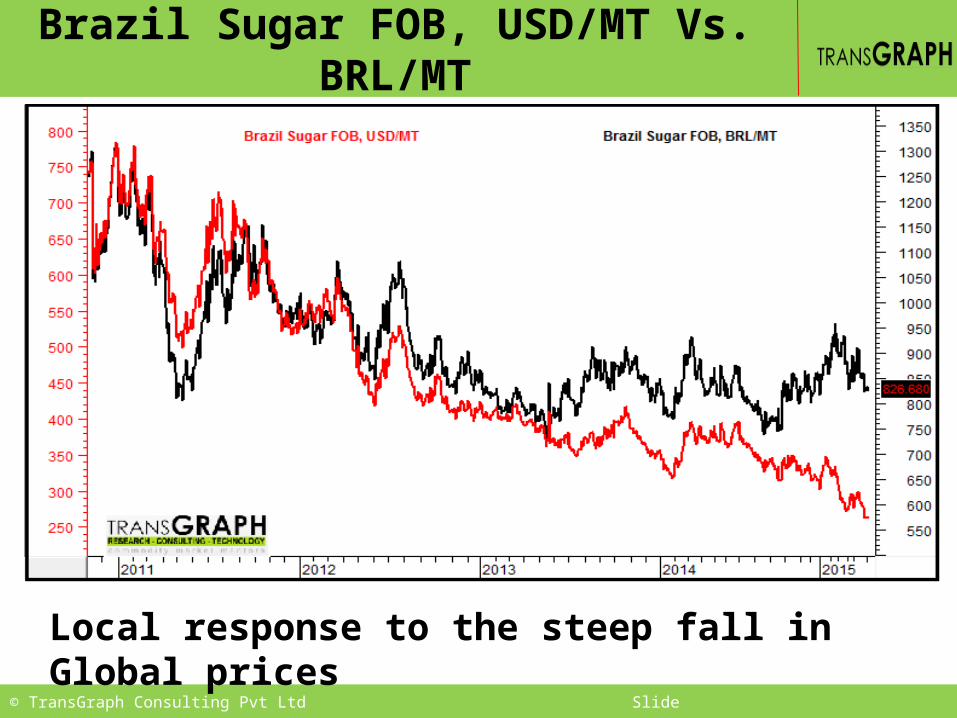
Brazil Sugar FOB, USD/MT Vs. BRL/MT
Local response to the steep fall in Global prices
© TransGraph Consulting Pvt Ltd Slide
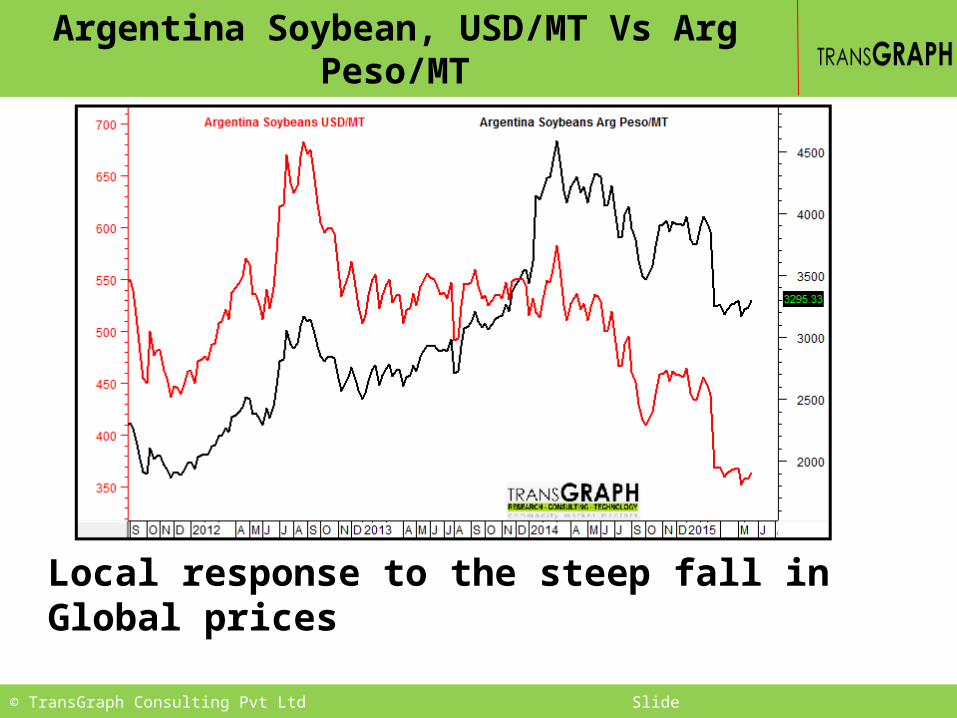
Argentina Soybean, USD/MT Vs Arg Peso/MT
Local response to the steep fall in Global prices

© TransGraph Consulting Pvt Ltd Slide
• Since last September, the whole world is basking under the glory of US dollar.
• Import dependent countries, countries with negative trade balance, countries with low forex reserves suffering from the mighty dollar.
• Who else is left?
• Malaysia with positive trade balance and India with negative trade balance both are witnessing depreciation of their currencies.
• It is important to take view on dollar before we finalize a view on any commodity.
Strong inverse relationship between USD and commodities
© TransGraph Consulting Pvt Ltd Slide 6
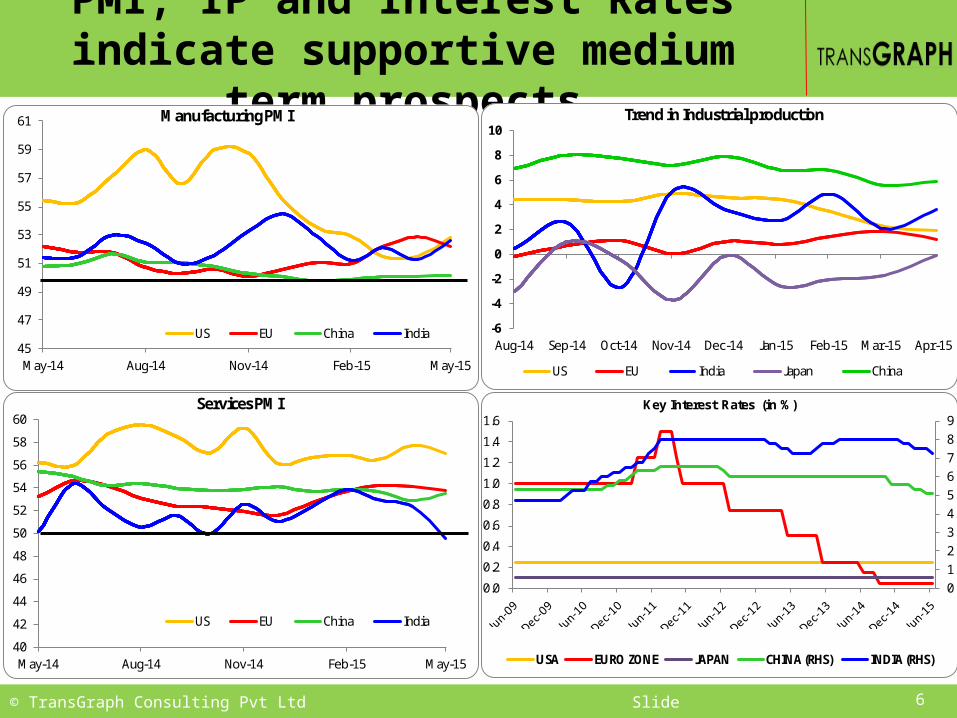
PMI, IP and Interest Rates indicate supportive medium term prospects
45
47
49
51
53
55
57
59
61
May-14 Aug-14 Nov-14 Feb-15 May-15
Manufacturing PMI
US EU China India
40
42
44
46
48
50
52
54
56
58
60
May-14 Aug-14 Nov-14 Feb-15 May-15
Services PMI
US EU China India
0123456789
0.0
0.2
0.4
0.6
0.8
1.0
1.2
1.4
1.6Key Interest Rates (in %)
USA EURO ZONE JAPAN CHINA (RHS) INDIA (RHS)
-6
-4
-2
0
2
4
6
8
10
Aug-14 Sep-14 Oct-14 Nov-14 Dec-14 Jan-15 Feb-15 Mar-15 Apr-15
Trend in Industrial production
US EU India Japan China
© TransGraph Consulting Pvt Ltd Slide
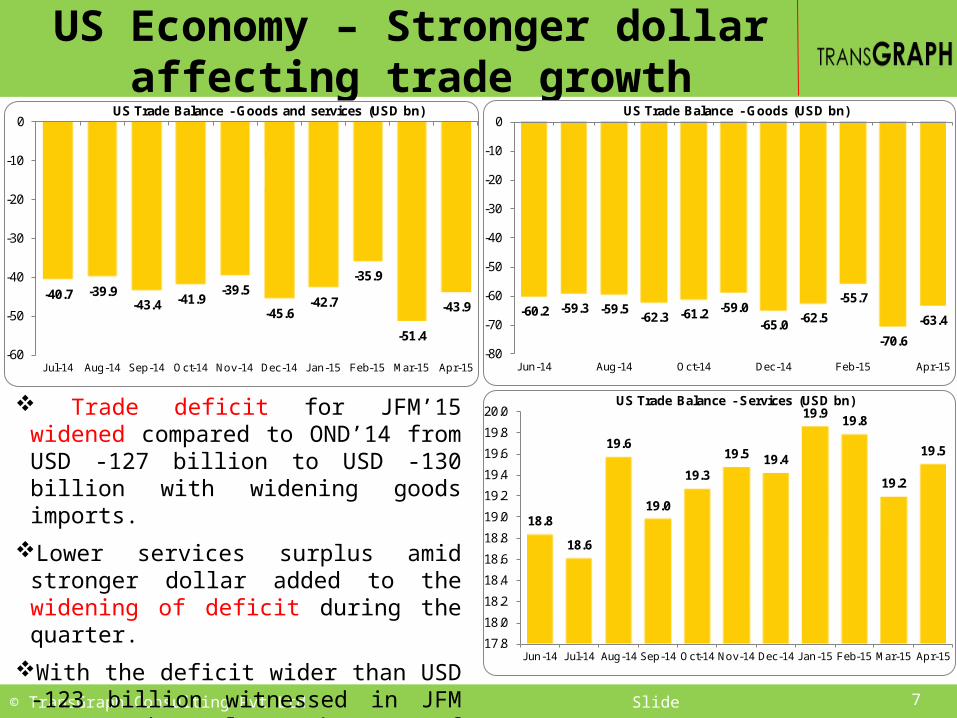
US Economy – Stronger dollar affecting trade growth
7
-60.2 -59.3 -59.5-62.3 -61.2 -59.0
-65.0 -62.5
-55.7
-70.6
-63.4
-80
-70
-60
-50
-40
-30
-20
-10
0
Jun-14 Aug-14 Oct-14 Dec-14 Feb-15 Apr-15
US Trade Balance - Goods (USD bn)
18.8
18.6
19.6
19.0
19.3
19.5 19.4
19.9 19.8
19.2
19.5
17.8
18.0
18.2
18.4
18.6
18.8
19.0
19.2
19.4
19.6
19.8
20.0
Jun-14 Jul-14 Aug-14 Sep-14 Oct-14 Nov-14 Dec-14 Jan-15 Feb-15 Mar-15 Apr-15
US Trade Balance - Services (USD bn)
-40.7 -39.9-43.4 -41.9
-39.5
-45.6-42.7
-35.9
-51.4
-43.9
-60
-50
-40
-30
-20
-10
0
Jul-14 Aug-14 Sep-14 Oct-14 Nov-14 Dec-14 Jan-15 Feb-15 Mar-15 Apr-15
US Trade Balance - Goods and services (USD bn)
Trade deficit for JFM’15 widened compared to OND’14 from USD -127 billion to USD -130 billion with widening goods imports.
Lower services surplus amid stronger dollar added to the widening of deficit during the quarter.
With the deficit wider than USD -123 billion witnessed in JFM 2014, the clear impact of stronger dollar shall be a deterrent for the US Fed to hike interest rates.
© TransGraph Consulting Pvt Ltd Slide
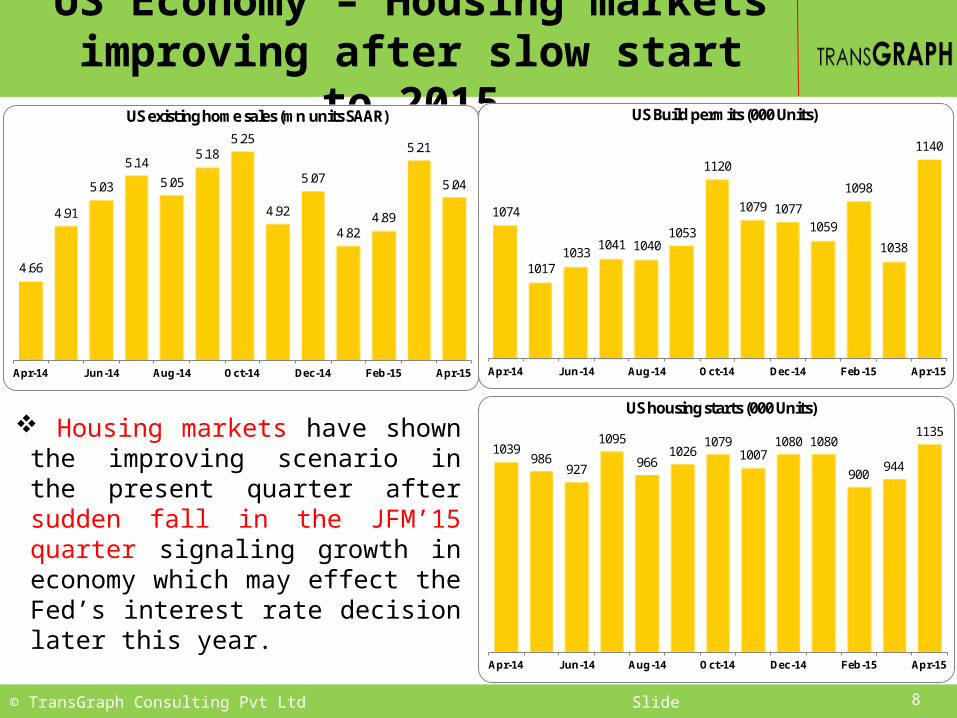
US Economy – Housing markets improving after slow start to 2015
8
1074
10171033
1041 10401053
1120
1079 10771059
1098
1038
1140
Apr-14 Jun-14 Aug-14 Oct-14 Dec-14 Feb-15 Apr-15
US Build permits (000 Units)
1039986
927
1095
9661026
10791007
1080 1080
900944
1135
Apr-14 Jun-14 Aug-14 Oct-14 Dec-14 Feb-15 Apr-15
US housing starts (000 Units)
4.66
4.91
5.03
5.14
5.05
5.185.25
4.92
5.07
4.824.89
5.21
5.04
Apr-14 Jun-14 Aug-14 Oct-14 Dec-14 Feb-15 Apr-15
US existing home sales (mn units SAAR)
Housing markets have shown the improving scenario in the present quarter after sudden fall in the JFM’15 quarter signaling growth in economy which may effect the Fed’s interest rate decision later this year.
© TransGraph Consulting Pvt Ltd Slide
US Economy – Improving housing and labor markets to aid improvement in Q2 growth
9
3.50%
-2.10%
4.60% 5.00%
2.20%
-0.70%
1.20%
Dec-13 Mar-14 Jun-14 Sep-14 Dec-14 Mar-15 Jun-15
US GDP (QoQ annualized)
329
201
264
85
223 2425.8
5.6
5.7
5.5
5.5
5.4
Dec-14 Jan-15 Feb-15 Mar-15 Apr-15 May-15
US Nonfarm Payrolls and Unemployment Rate
US Nonfarm Payroll Change ('000)US Unemployment rate (%)
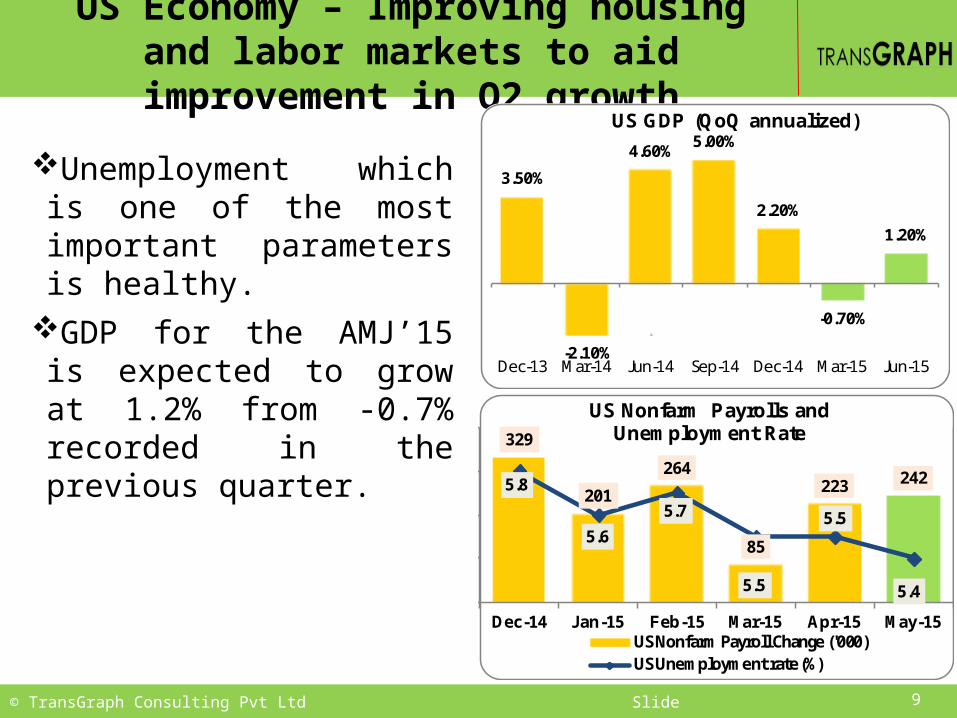
Unemployment which is one of the most important parameters is healthy.
GDP for the AMJ’15 is expected to grow at 1.2% from -0.7% recorded in the previous quarter.
© TransGraph Consulting Pvt Ltd Slide
US GDP expectation revised lower for 2015
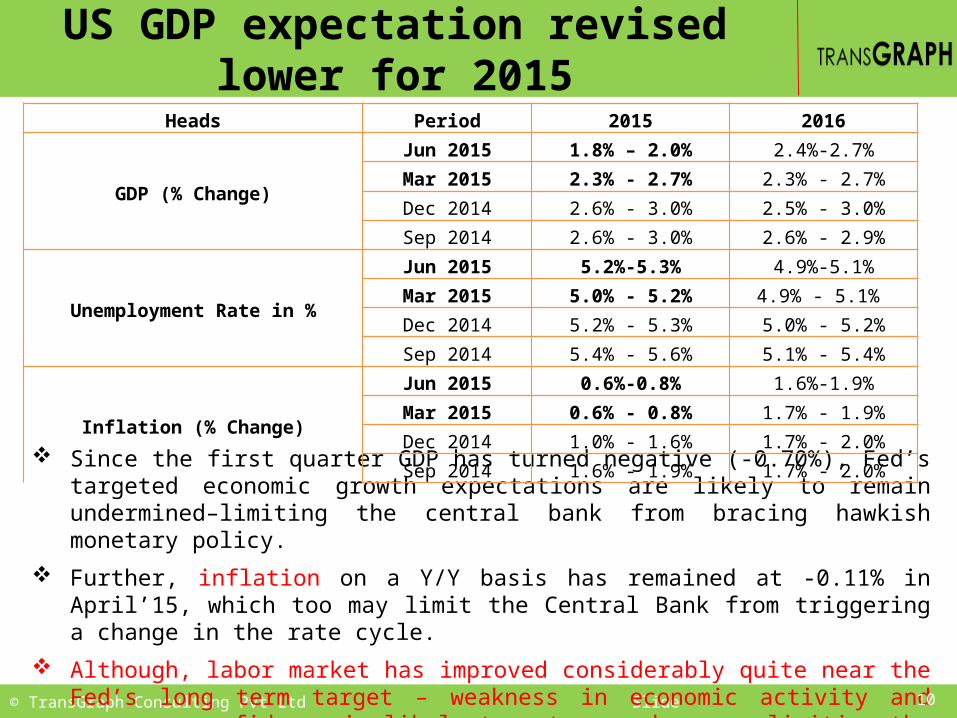
Since the first quarter GDP has turned negative (-0.70%), Fed’s targeted economic growth expectations are likely to remain undermined–limiting the central bank from bracing hawkish monetary policy.
Further, inflation on a Y/Y basis has remained at -0.11% in April’15, which too may limit the Central Bank from triggering a change in the rate cycle.
Although, labor market has improved considerably quite near the Fed’s long term target – weakness in economic activity and consumer confidence is likely to act as a dampener limiting the upside move in the greenback.
10
Heads Period 2015 2016
GDP (% Change)
Jun 2015 1.8% – 2.0% 2.4%-2.7%Mar 2015 2.3% - 2.7% 2.3% - 2.7%Dec 2014 2.6% - 3.0% 2.5% - 3.0%Sep 2014 2.6% - 3.0% 2.6% - 2.9%
Unemployment Rate in %
Jun 2015 5.2%-5.3% 4.9%-5.1%Mar 2015 5.0% - 5.2% 4.9% - 5.1% Dec 2014 5.2% - 5.3% 5.0% - 5.2%Sep 2014 5.4% - 5.6% 5.1% - 5.4%
Inflation (% Change)
Jun 2015 0.6%-0.8% 1.6%-1.9%Mar 2015 0.6% - 0.8% 1.7% - 1.9%Dec 2014 1.0% - 1.6% 1.7% - 2.0%Sep 2014 1.6% - 1.9% 1.7% - 2.0%
© TransGraph Consulting Pvt Ltd Slide
US FOMC consensus view on policy rates (Jun 2015 meeting)
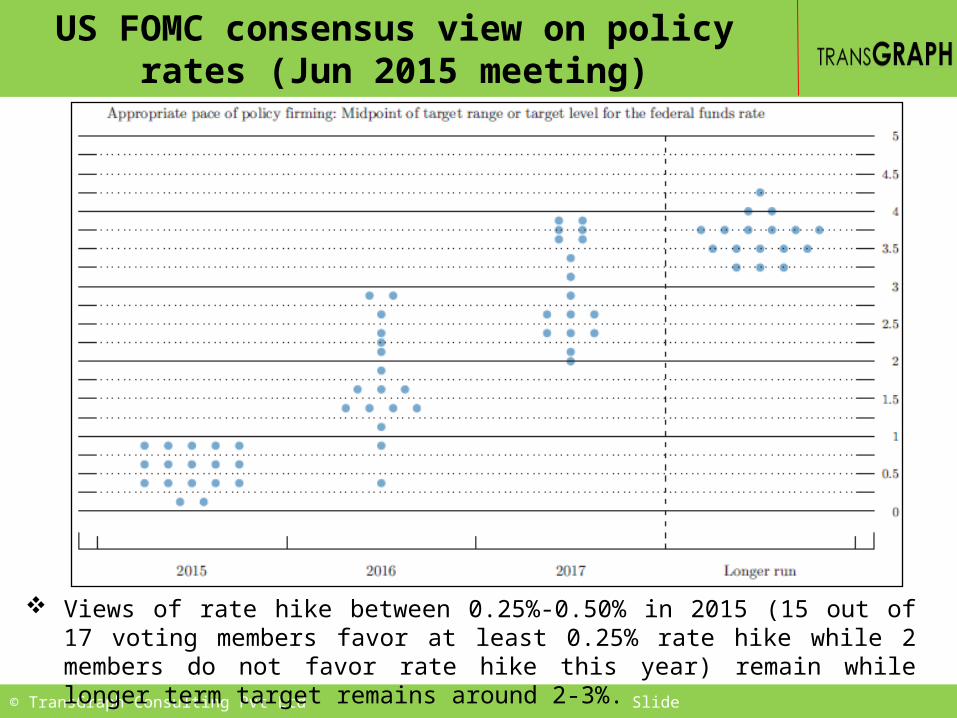
Views of rate hike between 0.25%-0.50% in 2015 (15 out of 17 voting members favor at least 0.25% rate hike while 2 members do not favor rate hike this year) remain while longer term target remains around 2-3%.
© TransGraph Consulting Pvt Ltd Slide
Dollar Index price outlook
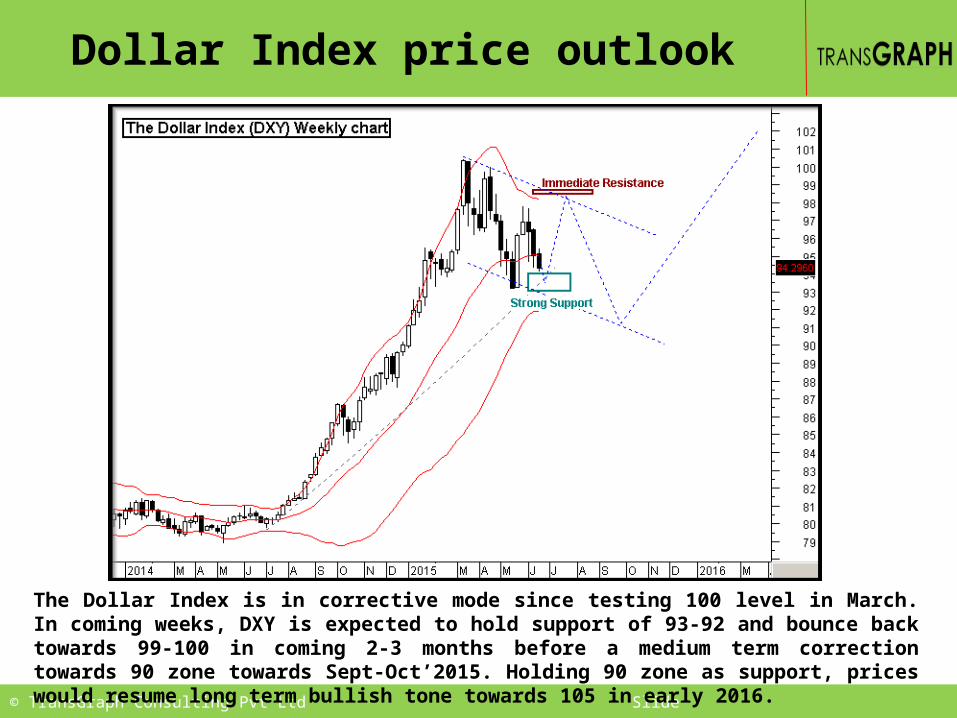
The Dollar Index is in corrective mode since testing 100 level in March. In coming weeks, DXY is expected to hold support of 93-92 and bounce back towards 99-100 in coming 2-3 months before a medium term correction towards 90 zone towards Sept-Oct’2015. Holding 90 zone as support, prices would resume long term bullish tone towards 105 in early 2016.

© TransGraph Consulting Pvt Ltd Slide
Weaker EURO aiding German growth
German economy has shown the growth of 1.1% in the first quarter of 2015.
Recent business surveys and PMI numbers point to negative impact on business conditions.
Going ahead, reducing PMI and future debt repayment risk from Greece by Jul’15 is likely to remain a key downside threat.
13
52.352.0
52.4
51.4
49.9
51.4
49.5
51.250.9 51.1
52.8
52.1
51.4
May-14 Jul-14 Sep-14 Nov-14 Jan-15 Mar-15 May-15
German Manufacturing PMI
17.5 18.216.5
21.4
17.518.7
20.8
17.9
21.6
19.6 20.0 19.3 19.5
Apr-14 Jun-14 Aug-14 Oct-14 Dec-14 Feb-15 Apr-15
German Trade Balance (Bln EUR)
© TransGraph Consulting Pvt Ltd Slide
Consumer confidence
14
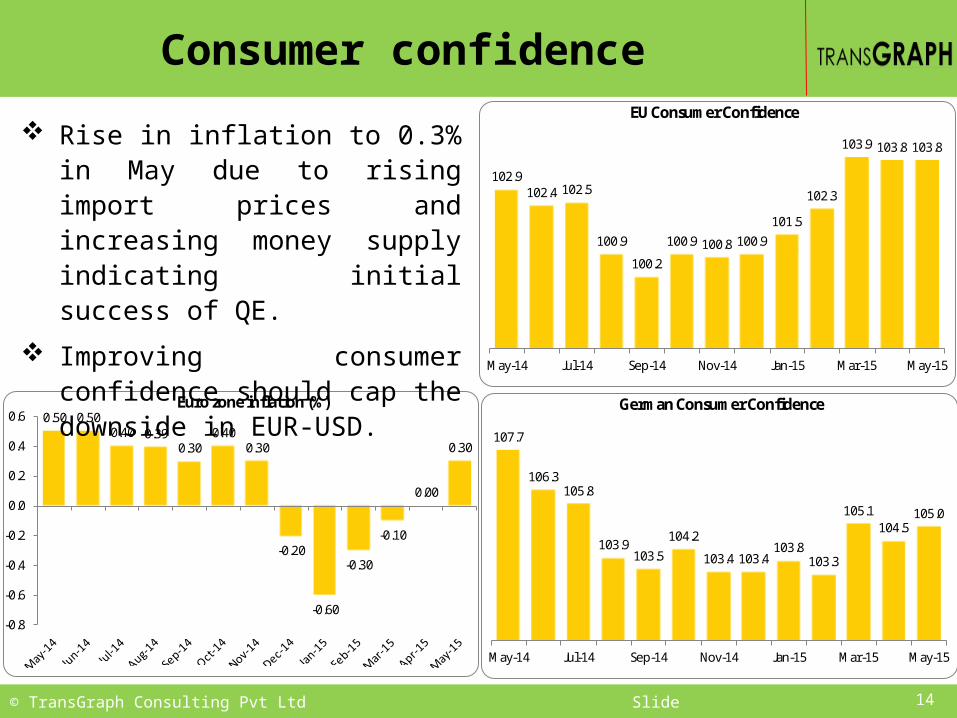
102.9102.4 102.5
100.9
100.2
100.9 100.8 100.9101.5
102.3
103.9 103.8 103.8
May-14 Jul-14 Sep-14 Nov-14 Jan-15 Mar-15 May-15
EU Consumer Confidence
107.7
106.3105.8
103.9103.5
104.2
103.4 103.4103.8
103.3
105.1104.5
105.0
May-14 Jul-14 Sep-14 Nov-14 Jan-15 Mar-15 May-15
German Consumer Confidence0.50 0.50
0.40 0.390.30
0.400.30
-0.20
-0.60
-0.30
-0.10
0.00
0.30
-0.8
-0.6
-0.4
-0.2
0.0
0.2
0.4
0.6Euro zone inflation (%)
Rise in inflation to 0.3% in May due to rising import prices and increasing money supply indicating initial success of QE.
Improving consumer confidence should cap the downside in EUR-USD.
© TransGraph Consulting Pvt Ltd Slide
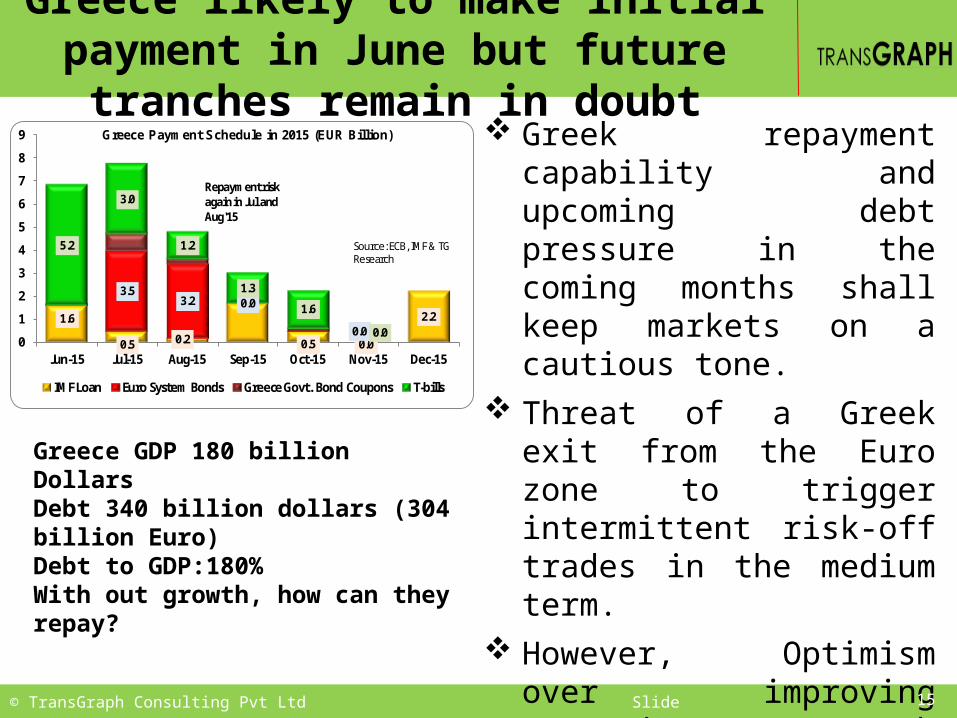
Greece likely to make initial payment in June but future tranches remain in doubt
Greek repayment capability and upcoming debt pressure in the coming months shall keep markets on a cautious tone.
Threat of a Greek exit from the Euro zone to trigger intermittent risk-off trades in the medium term.
However, Optimism over improving economic growth expectation from 1.2% to 1.5% by EU commission and vague hopes of Greek debt payment is likely to cap weakness in euro.
15
1.6
0.5 0.2 0.5 0.0
2.2
3.53.2 0.0
0.0
5.2
3.0
1.2
1.3
1.6
0.00
1
2
3
4
5
6
7
8
9
Jun-15 Jul-15 Aug-15 Sep-15 Oct-15 Nov-15 Dec-15
Greece Payment Schedule in 2015 (EUR Billion)
IMF Loan Euro System Bonds Greece Govt. Bond Coupons T-bills
Source: ECB, IMF & TG Research
Repayment risk again in Jul and Aug'15
Greece GDP 180 billion DollarsDebt 340 billion dollars (304 billion Euro)Debt to GDP:180%With out growth, how can they repay?
© TransGraph Consulting Pvt Ltd Slide
ECB stimulus and Greece concerns to keep EURO under pressure in the longer term
Concisely we expect concerns over Greece debt repayment and Fed rate hike expectations is likely to weigh on euro in the medium term.
German economy has shown the growth of 1.1% in the first quarter of 2015. We expect the other economies in euro zone are likely to show the improving economic picture in second quarter.
Optimism over improving economic growth expectation from 1.2% to 1.5% by EU commission and vague hopes of Greek debt payment is likely to cap weakness in euro.
We expect Greece will make the successful payments to IMF and exit from euro zone remains a distant future.
From the longer term perspective, improving fundamentals have certainly eased concerns about a deflationary spiral
However, as the ECB continues its QE into 2016 and the Fed begins to hike policy rates (likely in late 2015), the euro should weaken further towards parity to the dollar (1) in 2016.
© TransGraph Consulting Pvt Ltd Slide
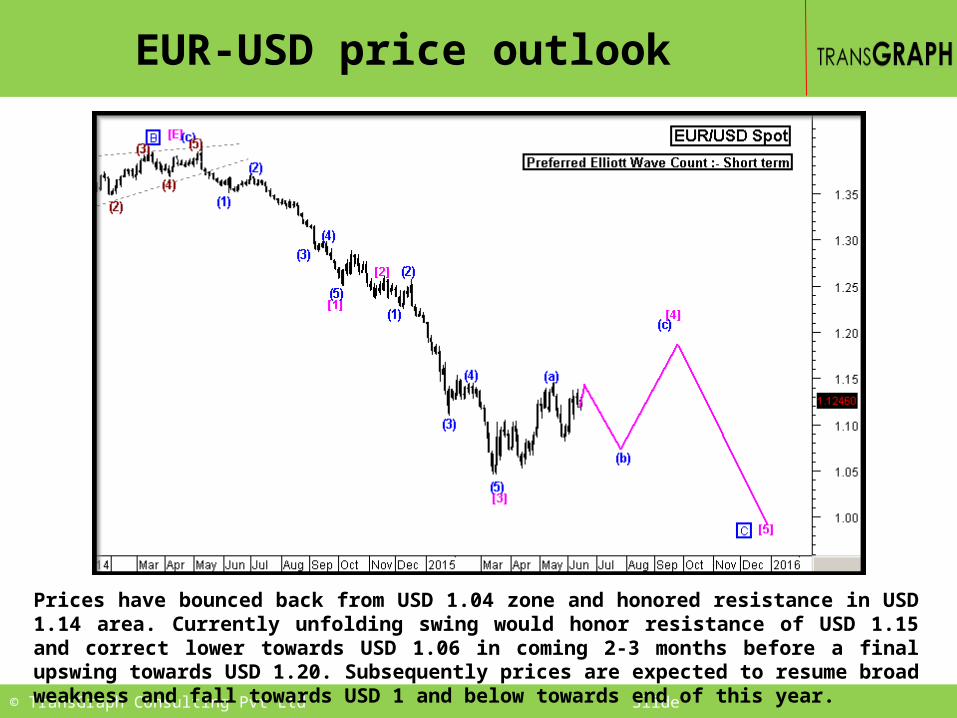
EUR-USD price outlook
Prices have bounced back from USD 1.04 zone and honored resistance in USD 1.14 area. Currently unfolding swing would honor resistance of USD 1.15 and correct lower towards USD 1.06 in coming 2-3 months before a final upswing towards USD 1.20. Subsequently prices are expected to resume broad weakness and fall towards USD 1 and below towards end of this year.
© TransGraph Consulting Pvt Ltd Slide
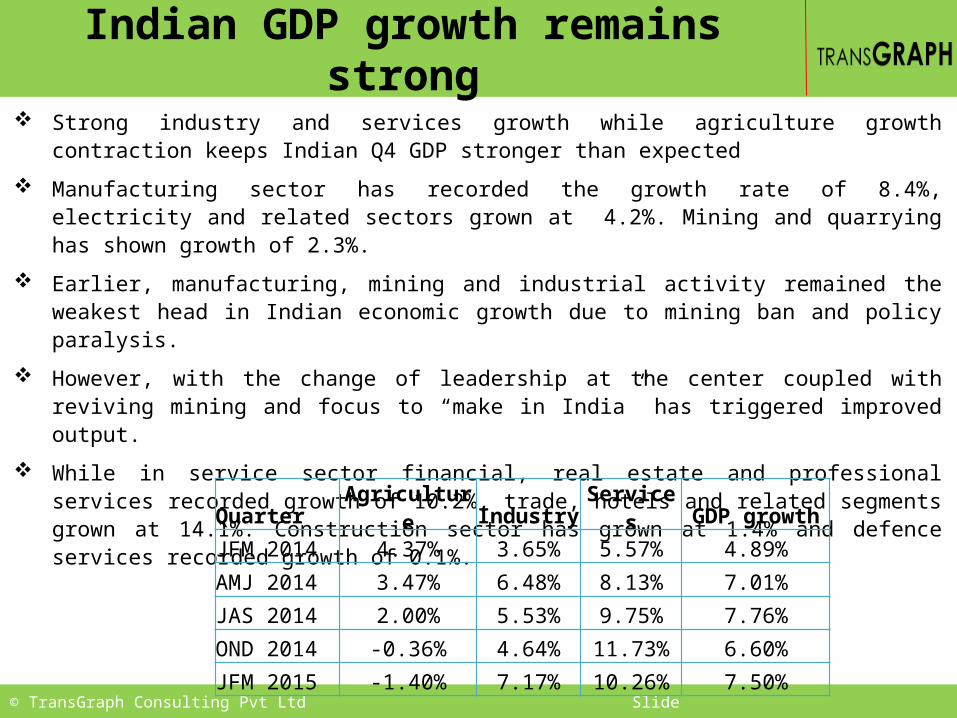
Indian GDP growth remains strong Strong industry and services growth while agriculture growth contraction keeps Indian Q4 GDP
stronger than expected
Manufacturing sector has recorded the growth rate of 8.4%, electricity and related sectors grown at 4.2%. Mining and quarrying has shown growth of 2.3%.
Earlier, manufacturing, mining and industrial activity remained the weakest head in Indian economic growth due to mining ban and policy paralysis.
However, with the change of leadership at the center coupled with reviving mining and focus to “make in India” has triggered improved output.
While in service sector financial, real estate and professional services recorded growth of 10.2%, trade, hotels and related segments grown at 14.1%. Construction sector has grown at 1.4% and defence services recorded growth of 0.1%.
Quarter Agriculture Industry Services GDP growth
JFM 2014 4.37% 3.65% 5.57% 4.89%
AMJ 2014 3.47% 6.48% 8.13% 7.01%
JAS 2014 2.00% 5.53% 9.75% 7.76%
OND 2014 -0.36% 4.64% 11.73% 6.60%
JFM 2015 -1.40% 7.17% 10.26% 7.50%
© TransGraph Consulting Pvt Ltd Slide
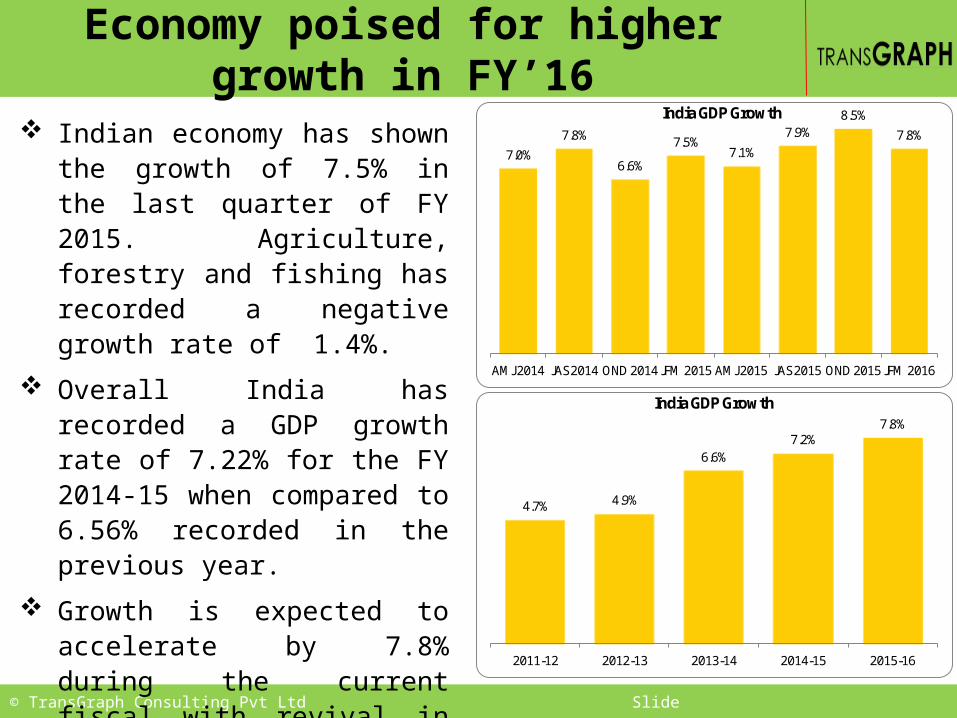
Economy poised for higher growth in FY’16
Indian economy has shown the growth of 7.5% in the last quarter of FY 2015. Agriculture, forestry and fishing has recorded a negative growth rate of 1.4%.
Overall India has recorded a GDP growth rate of 7.22% for the FY 2014-15 when compared to 6.56% recorded in the previous year.
Growth is expected to accelerate by 7.8% during the current fiscal with revival in industrial growth aiding growth
7.0%
7.8%
6.6%
7.5%7.1%
7.9%8.5%
7.8%
AMJ 2014 JAS 2014 OND 2014 JFM 2015 AMJ 2015 JAS 2015 OND 2015 JFM 2016
India GDP Growth
4.7% 4.9%
6.6%7.2%
7.8%
2011-12 2012-13 2013-14 2014-15 2015-16
India GDP Growth
© TransGraph Consulting Pvt Ltd Slide
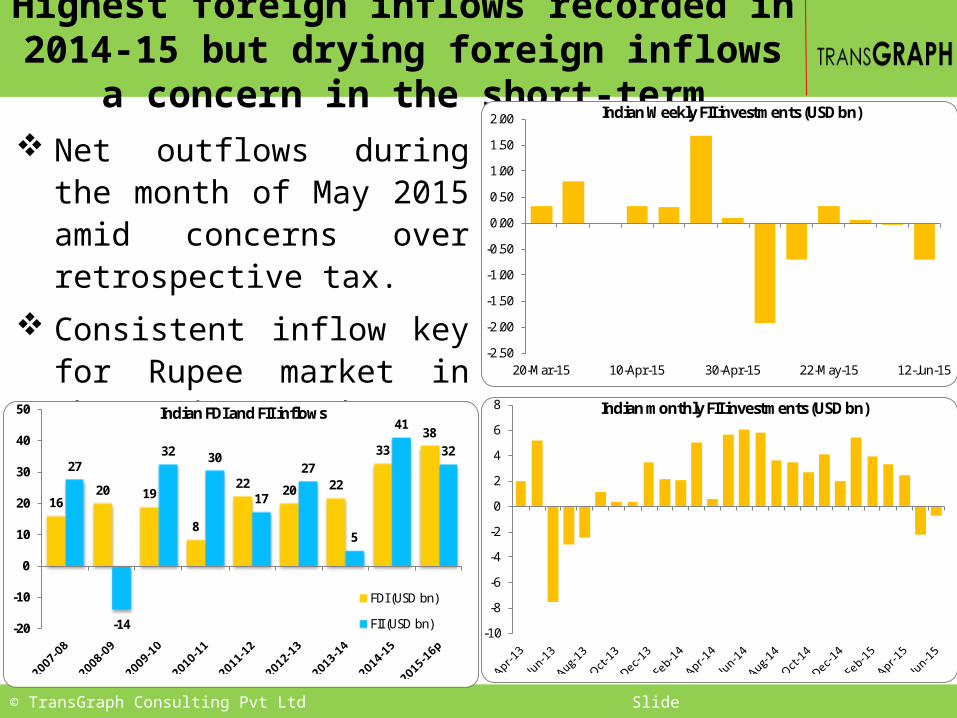
Highest foreign inflows recorded in 2014-15 but drying foreign inflows a concern in the short-term
Net outflows during the month of May 2015 amid concerns over retrospective tax.
Consistent inflow key for Rupee market in the coming months
-2.50
-2.00
-1.50
-1.00
-0.50
0.00
0.50
1.00
1.50
2.00
20-Mar-15 10-Apr-15 30-Apr-15 22-May-15 12-Jun-15
Indian Weekly FII investments (USD bn)
-10
-8
-6
-4
-2
0
2
4
6
8 Indian monthly FII investments (USD bn)
1620 19
8
22 20 22
3338
27
-14
32 30
17
27
5
41
32
-20
-10
0
10
20
30
40
50 Indian FDI and FII inflows
FDI (USD bn)
FII (USD bn)
© TransGraph Consulting Pvt Ltd Slide 21
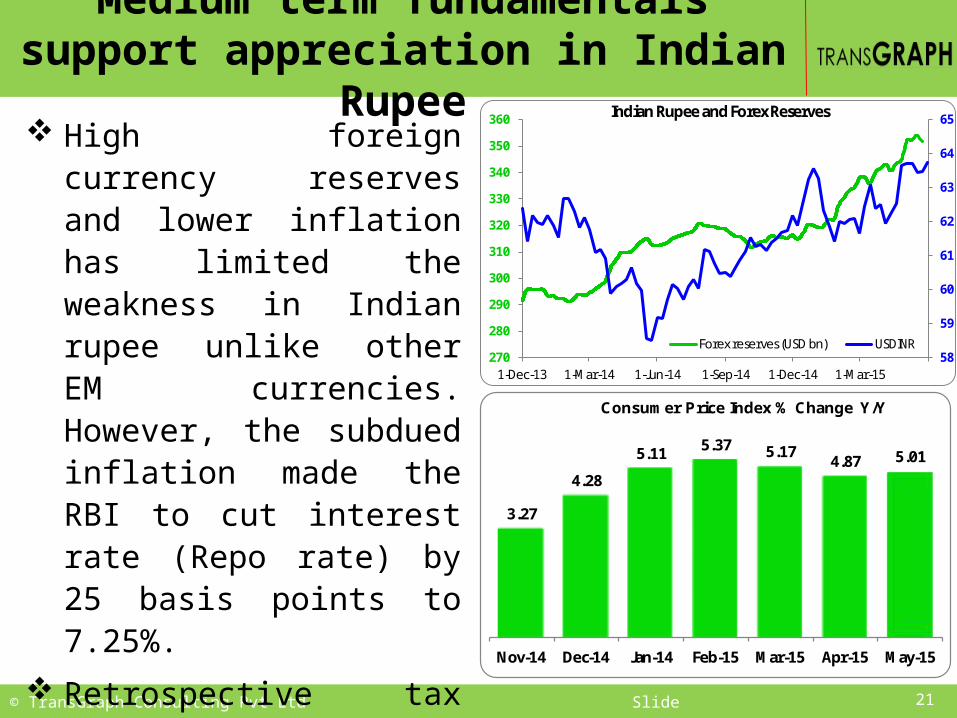
Medium term fundamentals support appreciation in Indian Rupee
High foreign currency reserves and lower inflation has limited the weakness in Indian rupee unlike other EM currencies. However, the subdued inflation made the RBI to cut interest rate (Repo rate) by 25 basis points to 7.25%.
Retrospective tax for foreign investors (MAT) and delay in monsoon remains the key downside risk to the Indian rupee.
58
59
60
61
62
63
64
65
270
280
290
300
310
320
330
340
350
360
1-Dec-13 1-Mar-14 1-Jun-14 1-Sep-14 1-Dec-14 1-Mar-15
Indian Rupee and Forex Reserves
Forex reserves (USD bn) USDINR
3.27
4.28
5.11 5.37 5.174.87 5.01
Nov-14 Dec-14 Jan-14 Feb-15 Mar-15 Apr-15 May-15
Consumer Price Index % Change Y/Y
© TransGraph Consulting Pvt Ltd Slide
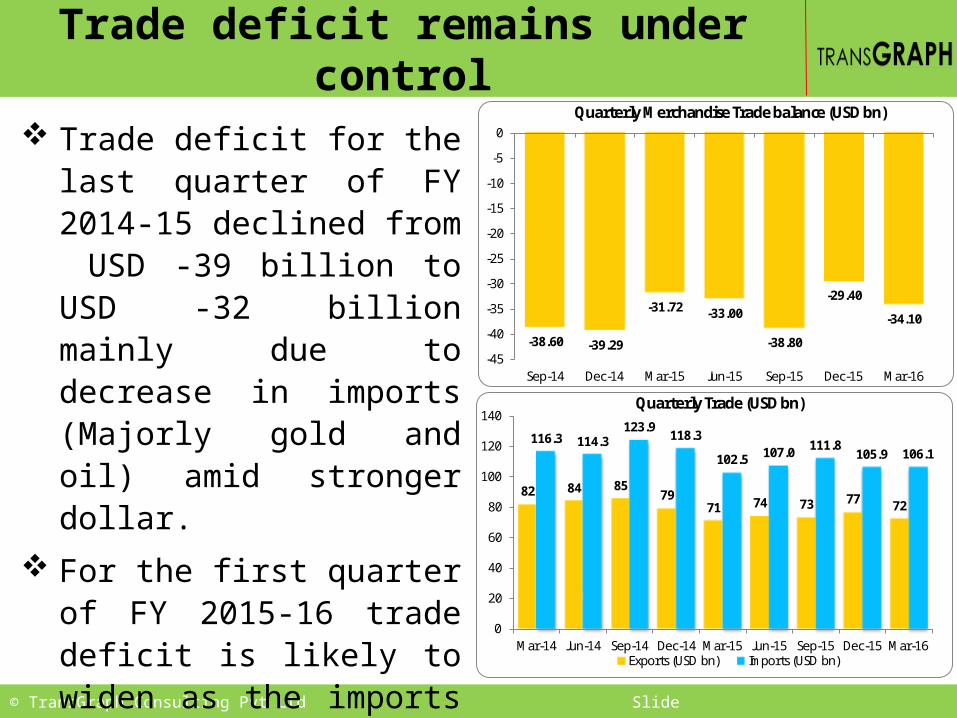
Trade deficit remains under control
Trade deficit for the last quarter of FY 2014-15 declined from USD -39 billion to USD -32 billion mainly due to decrease in imports (Majorly gold and oil) amid stronger dollar.
For the first quarter of FY 2015-16 trade deficit is likely to widen as the imports are likely to grow although there is slight uptick in exports.
-38.60 -39.29
-31.72 -33.00
-38.80
-29.40
-34.10
-45
-40
-35
-30
-25
-20
-15
-10
-5
0
Sep-14 Dec-14 Mar-15 Jun-15 Sep-15 Dec-15 Mar-16
Quarterly Merchandise Trade balance (USD bn)
82 84 8579
71 74 73 77 72
116.3 114.3123.9
118.3
102.5 107.0 111.8105.9 106.1
0
20
40
60
80
100
120
140
Mar-14 Jun-14 Sep-14 Dec-14 Mar-15 Jun-15 Sep-15 Dec-15 Mar-16
Quarterly Trade (USD bn)
Exports (USD bn) Imports (USD bn)
© TransGraph Consulting Pvt Ltd Slide 23
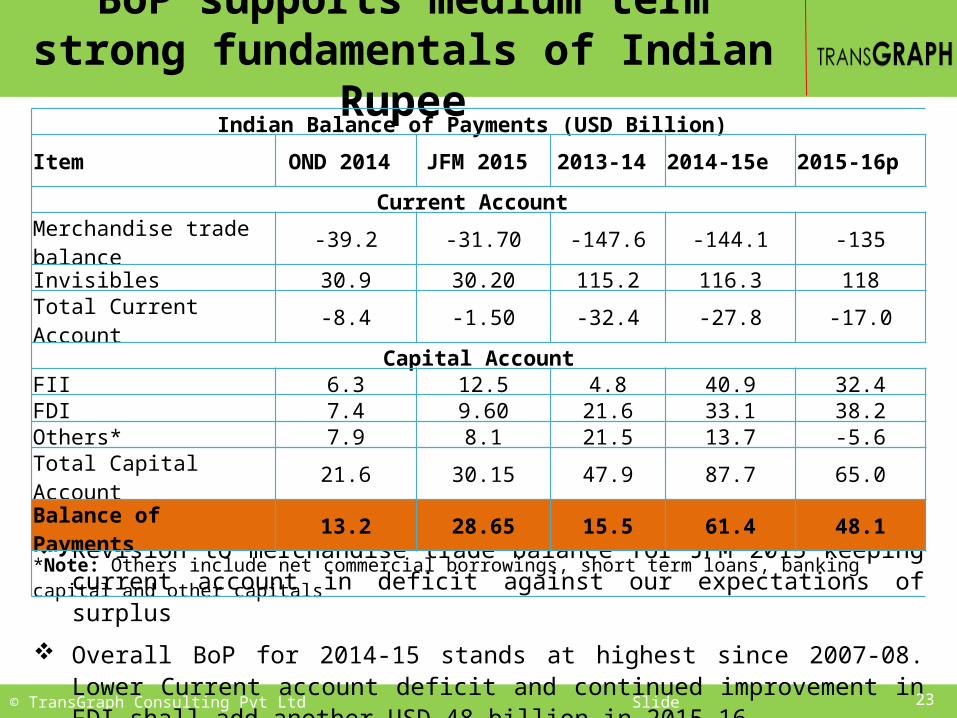
BoP supports medium term strong fundamentals of Indian Rupee
Revision to merchandise trade balance for JFM 2015 keeping current account in deficit against our expectations of surplus
Overall BoP for 2014-15 stands at highest since 2007-08. Lower Current account deficit and continued improvement in FDI shall add another USD 48 billion in 2015-16
Indian Balance of Payments (USD Billion)
Item OND 2014 JFM 2015 2013-14 2014-15e 2015-16p
Current Account
Merchandise trade balance -39.2 -31.70 -147.6 -144.1 -135
Invisibles 30.9 30.20 115.2 116.3 118Total Current Account -8.4 -1.50 -32.4 -27.8 -17.0
Capital AccountFII 6.3 12.5 4.8 40.9 32.4FDI 7.4 9.60 21.6 33.1 38.2Others* 7.9 8.1 21.5 13.7 -5.6Total Capital Account 21.6 30.15 47.9 87.7 65.0Balance of Payments 13.2 28.65 15.5 61.4 48.1*Note: Others include net commercial borrowings, short term loans, banking capital and other capitals
© TransGraph Consulting Pvt Ltd Slide
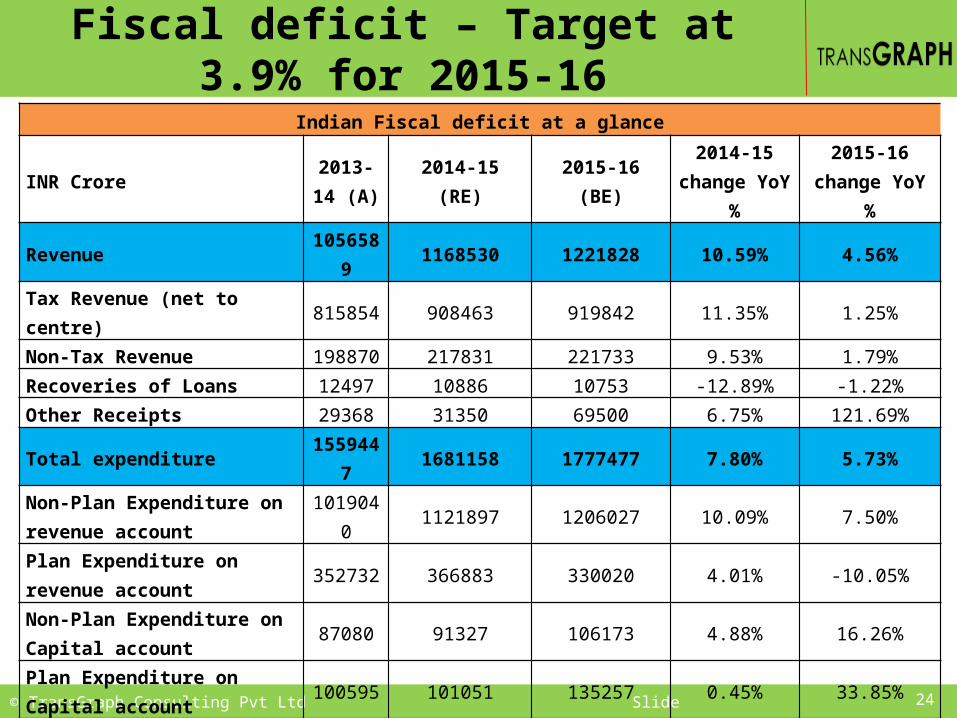
Fiscal deficit – Target at 3.9% for 2015-16Indian Fiscal deficit at a glance
INR Crore 2013-14 (A) 2014-15 (RE) 2015-16 (BE) 2014-15
change YoY %2015-16 change
YoY %Revenue 1056589 1168530 1221828 10.59% 4.56%Tax Revenue (net to centre) 815854 908463 919842 11.35% 1.25%Non-Tax Revenue 198870 217831 221733 9.53% 1.79%Recoveries of Loans 12497 10886 10753 -12.89% -1.22%Other Receipts 29368 31350 69500 6.75% 121.69%Total expenditure 1559447 1681158 1777477 7.80% 5.73%Non-Plan Expenditure on revenue account 1019040 1121897 1206027 10.09% 7.50%
Plan Expenditure on revenue account 352732 366883 330020 4.01% -10.05%
Non-Plan Expenditure on Capital account 87080 91327 106173 4.88% 16.26%
Plan Expenditure on Capital account 100595 101051 135257 0.45% 33.85%
Fiscal deficit (Expenditure-Revenue) 502858 512628 555649 1.94% 8.39%
Interest Payments 374254 411354 456145 9.91% 10.89%Primary deficit (FD-IP) 128604 101274 99504 -21.25% -1.75%Source: Indian Union budget, A=Actual, RE=Revised estimate, BE=Budget estimate
24
© TransGraph Consulting Pvt Ltd Slide
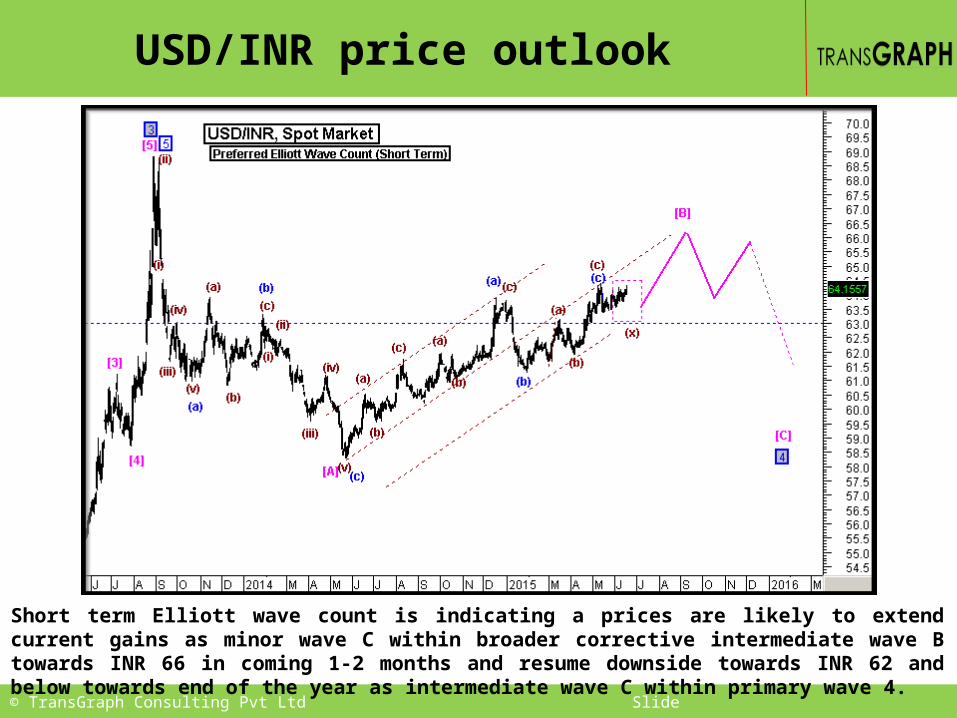
USD/INR price outlook
Short term Elliott wave count is indicating a prices are likely to extend current gains as minor wave C within broader corrective intermediate wave B towards INR 66 in coming 1-2 months and resume downside towards INR 62 and below towards end of the year as intermediate wave C within primary wave 4.
© TransGraph Consulting Pvt Ltd Slide
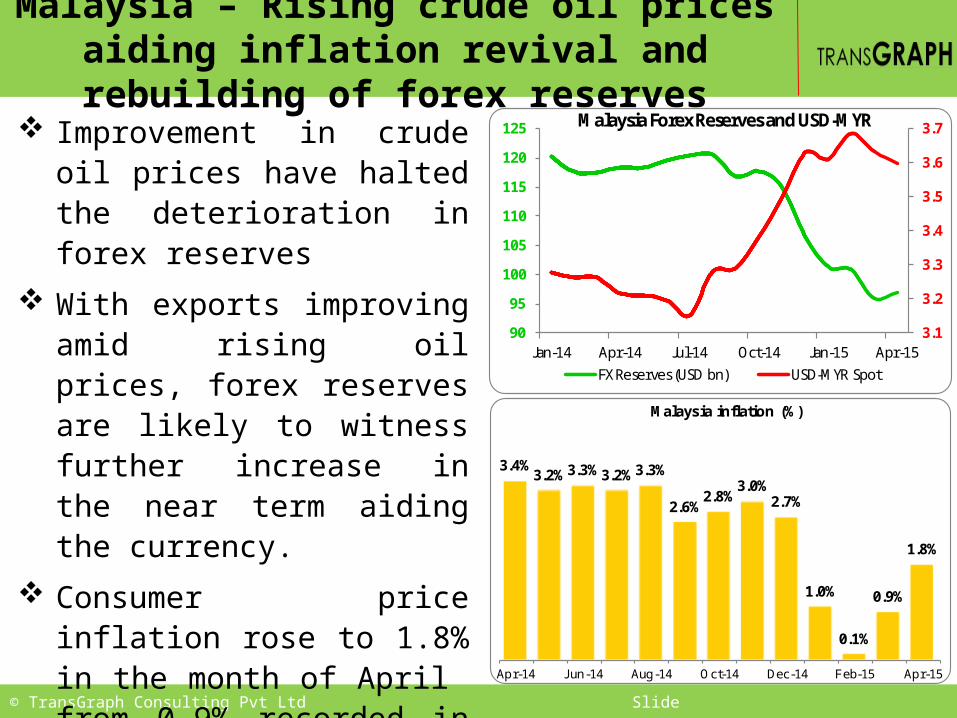
Malaysia – Rising crude oil prices aiding inflation revival and rebuilding of forex reserves
Improvement in crude oil prices have halted the deterioration in forex reserves
With exports improving amid rising oil prices, forex reserves are likely to witness further increase in the near term aiding the currency.
Consumer price inflation rose to 1.8% in the month of April from 0.9% recorded in the previous month signaling improvement in growth of economy.
3.1
3.2
3.3
3.4
3.5
3.6
3.7
90
95
100
105
110
115
120
125
Jan-14 Apr-14 Jul-14 Oct-14 Jan-15 Apr-15
Malaysia Forex Reserves and USD-MYR
FX Reserves (USD bn) USD-MYR Spot
3.4%3.2% 3.3% 3.2% 3.3%
2.6%2.8%
3.0%2.7%
1.0%
0.1%
0.9%
1.8%
Apr-14 Jun-14 Aug-14 Oct-14 Dec-14 Feb-15 Apr-15
Malaysia inflation (%)

© TransGraph Consulting Pvt Ltd Slide
Malaysia –subdued economic outlook
Economy grew by 5.6% in the first quarter of FY 2015-16 due to increase in private consumption, investments and improvement in manufacturing sector.
Compared to nearly 6% GDP growth in 2014, the economy is expected to grow around 5.4% in 2015.
Industrial production growth declined to 4% in April compared to 6.9% in March indicating weak manufacturing activity in the second quarter.
However, trade balance is likely to improve further in the coming months amid increasing exports.
5.1
6.2 6.5
5.6 5.7 5.6
Dec-13 Mar-14 Jun-14 Sep-14 Dec-14 Mar-15
Malaysia GDP (% Change Y/Y)
4.7%
7.4% 7.0%
5.2%
6.9%
4.0%
Nov-14 Dec-14 Jan-15 Feb-15 Mar-15 Apr-15
Malaysia Industrial Production (% Change Y/Y)
© TransGraph Consulting Pvt Ltd Slide
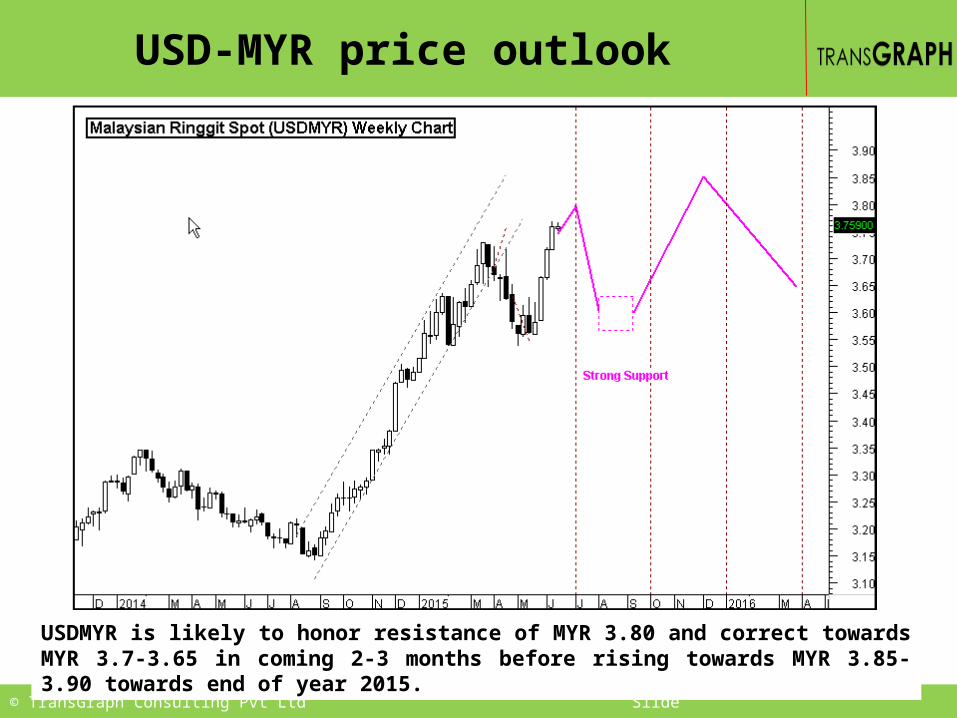
USD-MYR price outlook
USDMYR is likely to honor resistance of MYR 3.80 and correct towards MYR 3.7-3.65 in coming 2-3 months before rising towards MYR 3.85-3.90 towards end of year 2015.
© TransGraph Consulting Pvt Ltd Slide
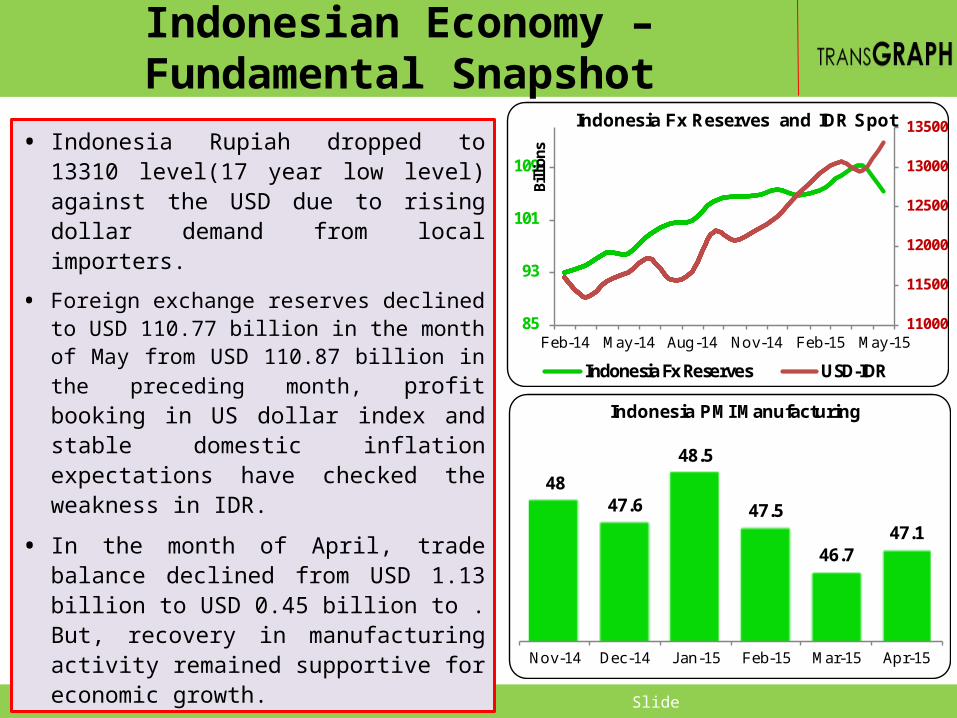
Indonesian Economy – Fundamental Snapshot
• Indonesia Rupiah dropped to 13310 level(17 year low level) against the USD due to rising dollar demand from local importers.
• Foreign exchange reserves declined to USD 110.77 billion in the month of May from USD 110.87 billion in the preceding month, profit booking in US dollar index and stable domestic inflation expectations have checked the weakness in IDR.
• In the month of April, trade balance declined from USD 1.13 billion to USD 0.45 billion to . But, recovery in manufacturing activity remained supportive for economic growth.
4847.6
48.5
47.5
46.747.1
Nov-14 Dec-14 Jan-15 Feb-15 Mar-15 Apr-15
Indonesia PMI Manufacturing
11000
11500
12000
12500
13000
13500
85
93
101
109
Feb-14 May-14 Aug-14 Nov-14 Feb-15 May-15
Billi
ons
Indonesia Fx Reserves and IDR Spot
Indonesia Fx Reserves USD-IDR
© TransGraph Consulting Pvt Ltd Slide
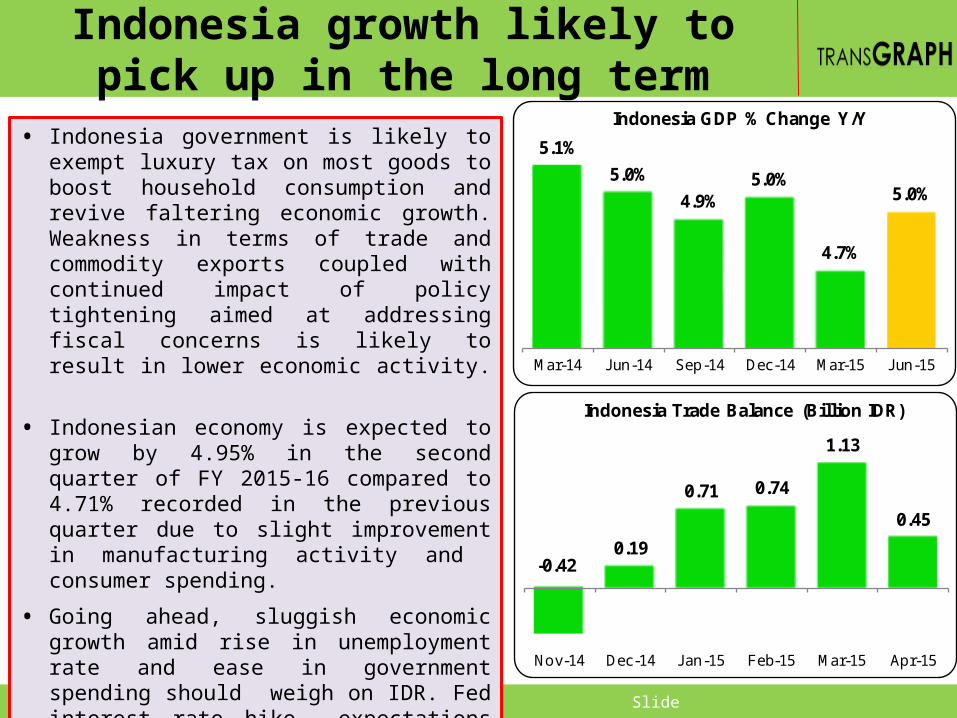
Indonesia growth likely to pick up in the long term
• Indonesia government is likely to exempt luxury tax on most goods to boost household consumption and revive faltering economic growth. Weakness in terms of trade and commodity exports coupled with continued impact of policy tightening aimed at addressing fiscal concerns is likely to result in lower economic activity.
• Indonesian economy is expected to grow by 4.95% in the second quarter of FY 2015-16 compared to 4.71% recorded in the previous quarter due to slight improvement in manufacturing activity and consumer spending.
• Going ahead, sluggish economic growth amid rise in unemployment rate and ease in government spending should weigh on IDR. Fed interest rate hike expectations later this year and volatile bond yields is likely to pressurize IDR in the medium term.
5.1%5.0%
4.9%5.0%
4.7%
5.0%
Mar-14 Jun-14 Sep-14 Dec-14 Mar-15 Jun-15
Indonesia GDP % Change Y/Y
-0.420.19
0.71 0.74
1.13
0.45
Nov-14 Dec-14 Jan-15 Feb-15 Mar-15 Apr-15
Indonesia Trade Balance (Billion IDR)
© TransGraph Consulting Pvt Ltd Slide
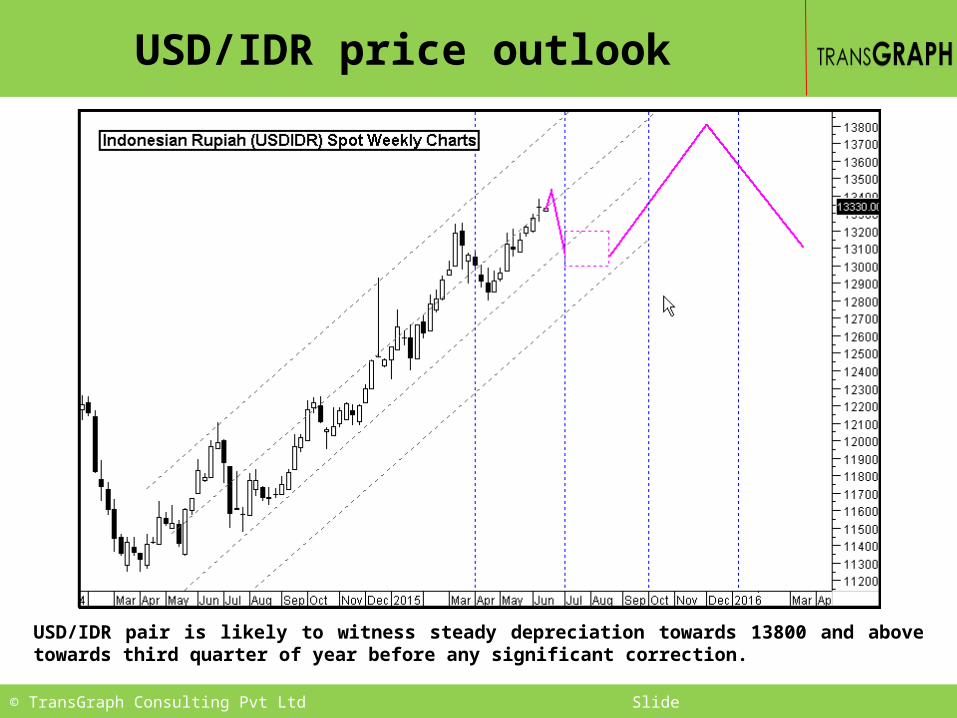
USD/IDR price outlook
USD/IDR pair is likely to witness steady depreciation towards 13800 and above towards third quarter of year before any significant correction.
© TransGraph Consulting Pvt Ltd Slide
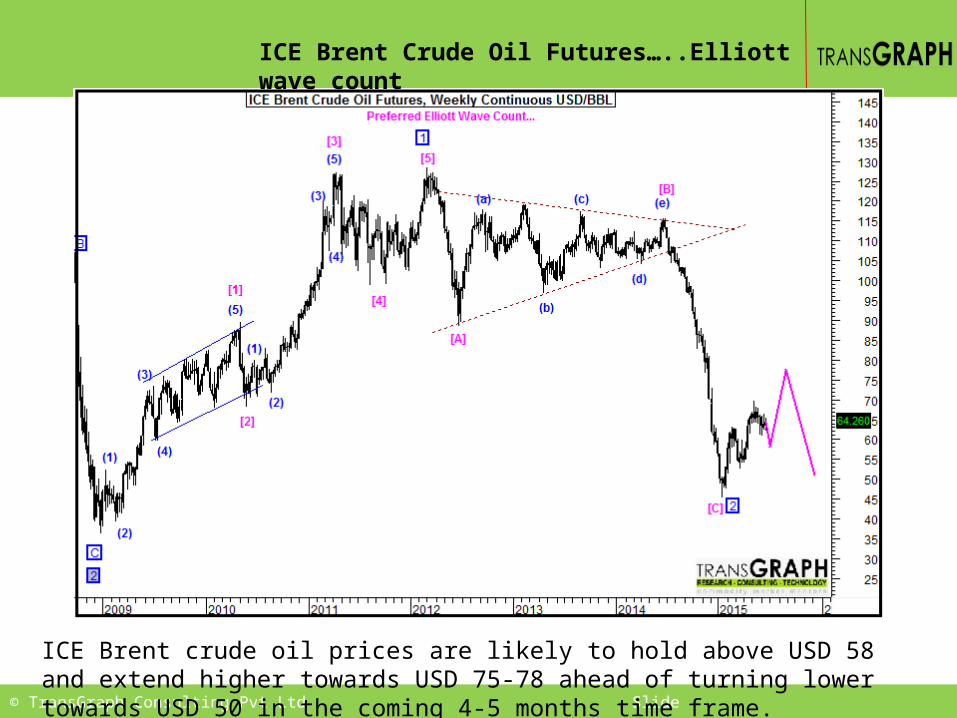
ICE Brent Crude Oil Futures…..Elliott wave count
ICE Brent crude oil prices are likely to hold above USD 58 and extend higher towards USD 75-78 ahead of turning lower towards USD 50 in the coming 4-5 months time frame.
© TransGraph Consulting Pvt Ltd Slide
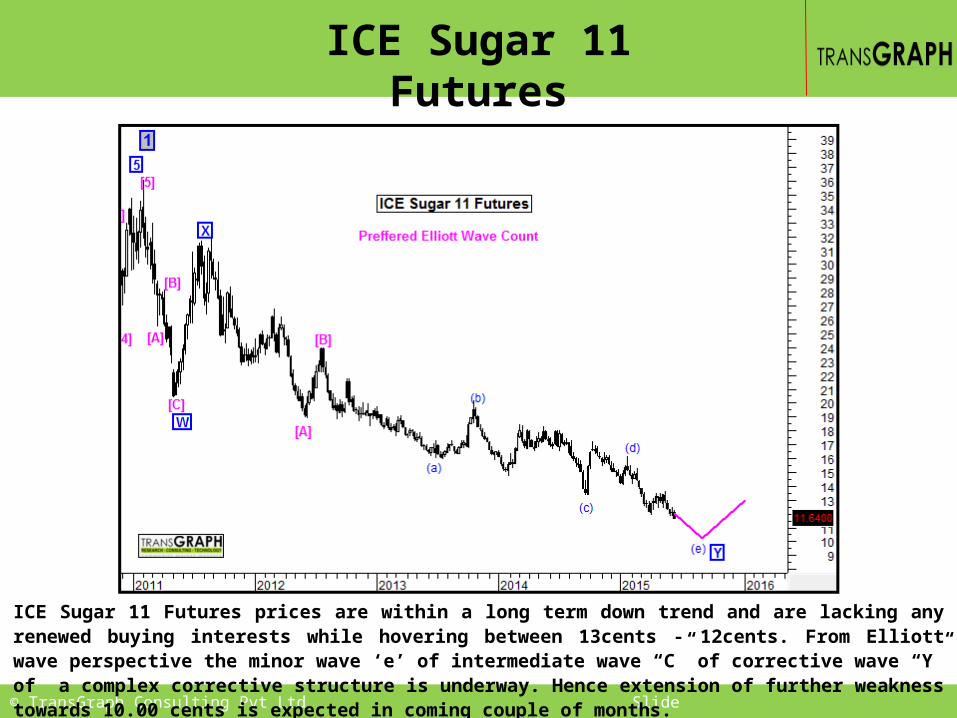
ICE Sugar 11 Futures
ICE Sugar 11 Futures prices are within a long term down trend and are lacking any renewed buying interests while hovering between 13cents - 12cents. From Elliott wave perspective the minor wave ‘e’ of intermediate wave “C” of corrective wave “Y” of a complex corrective structure is underway. Hence extension of further weakness towards 10.00 cents is expected in coming couple of months.
© TransGraph Consulting Pvt Ltd Slide
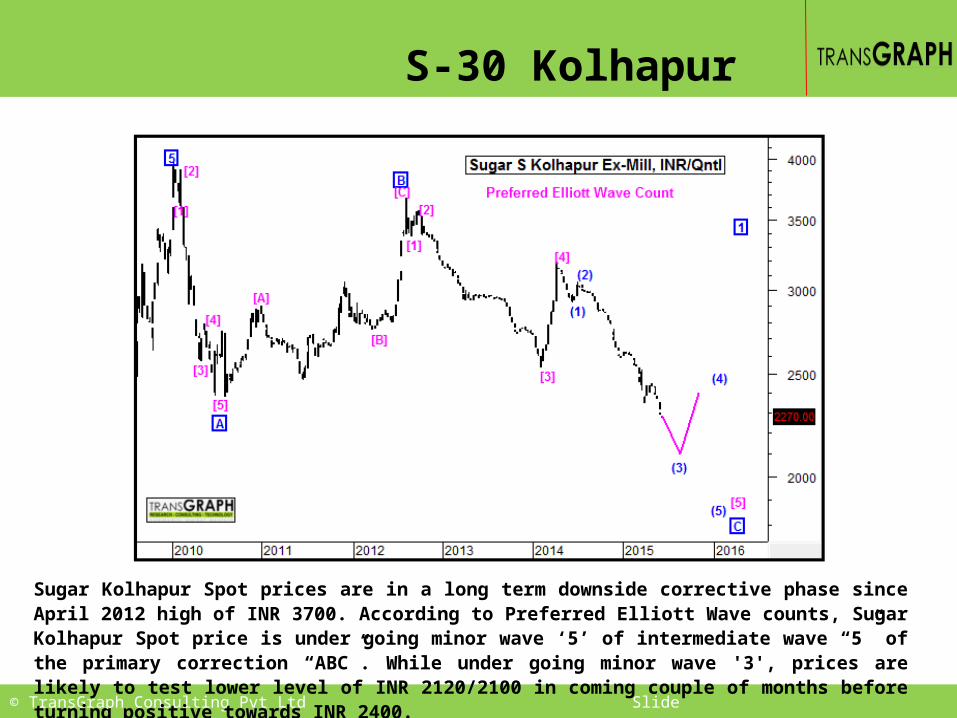
S-30 Kolhapur
Sugar Kolhapur Spot prices are in a long term downside corrective phase since April 2012 high of INR 3700. According to Preferred Elliott Wave counts, Sugar Kolhapur Spot price is under going minor wave ‘5’ of intermediate wave “5” of the primary correction “ABC”. While under going minor wave '3', prices are likely to test lower level of INR 2120/2100 in coming couple of months before turning positive towards INR 2400.
© TransGraph Consulting Pvt Ltd Slide
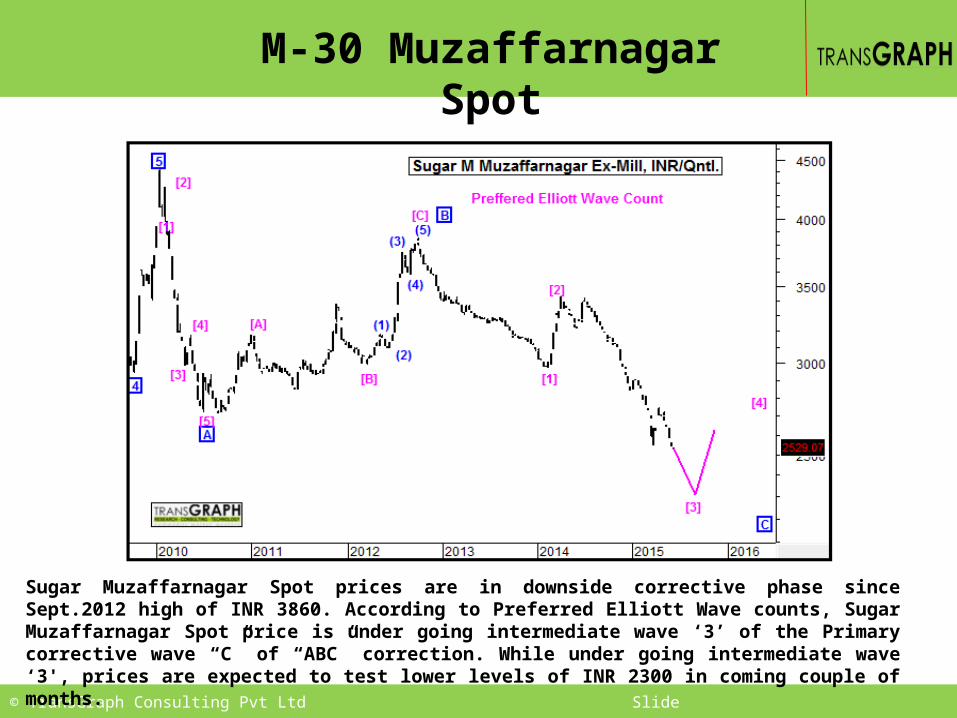
M-30 Muzaffarnagar Spot
Sugar Muzaffarnagar Spot prices are in downside corrective phase since Sept.2012 high of INR 3860. According to Preferred Elliott Wave counts, Sugar Muzaffarnagar Spot price is under going intermediate wave ‘3’ of the Primary corrective wave “C” of “ABC” correction. While under going intermediate wave ‘3', prices are expected to test lower levels of INR 2300 in coming couple of months.
© TransGraph Consulting Pvt Ltd Slide
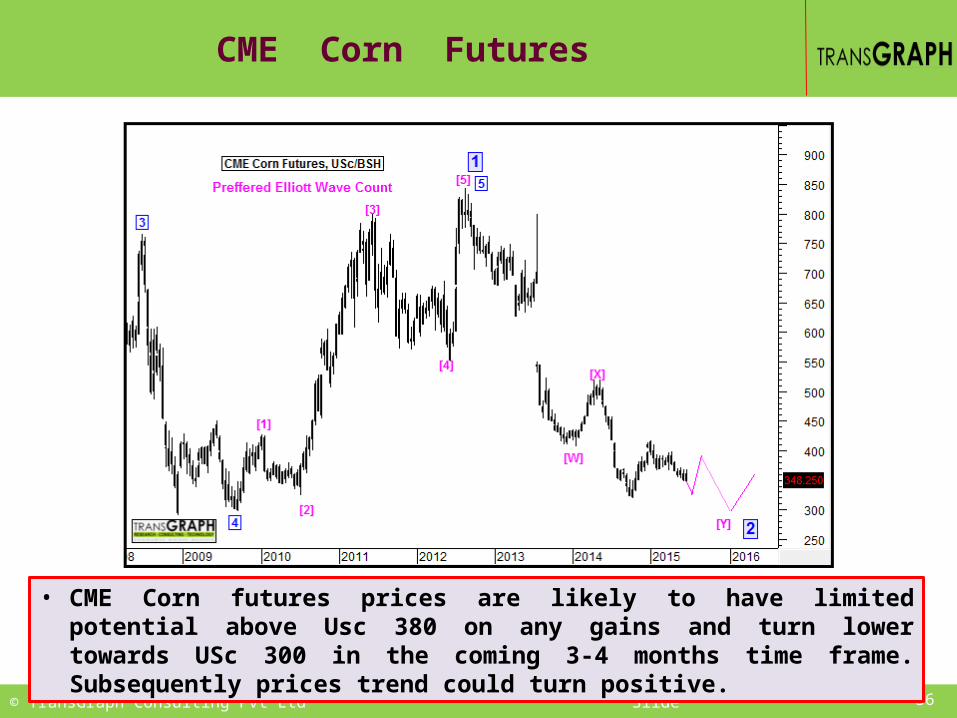
CME Corn Futures
36
• CME Corn futures prices are likely to have limited potential above Usc 380 on any gains and turn lower towards USc 300 in the coming 3-4 months time frame. Subsequently prices trend could turn positive.

© TransGraph Consulting Pvt Ltd Slide
Maize Nizamabad Spot Price, INR/Qtl.
37
• Maize Nizamabad Spot Prices are trading on positive notes with gradual rise since Oct.2014. Prices are expected to continue its positive trend and may test higher levels of INR 1380-1450 by July/Aug 2015, followed by a downside move towards INR 1250 by Oct./Nov/2015.
© TransGraph Consulting Pvt Ltd Slide
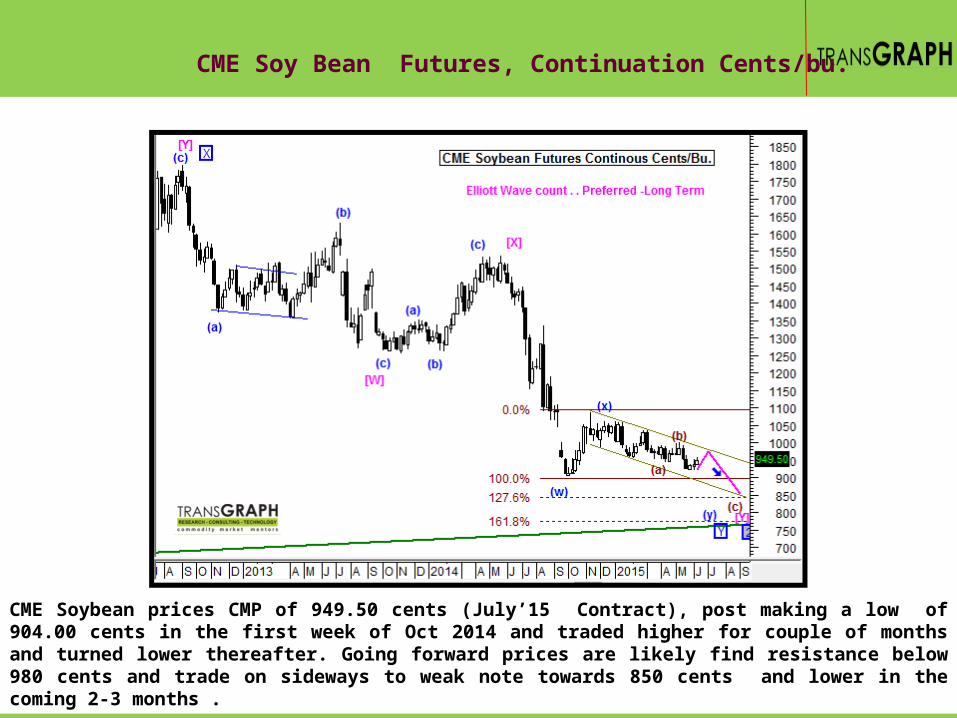
CME Soy Bean Futures, Continuation Cents/bu.
CME Soybean prices CMP of 949.50 cents (July’15 Contract), post making a low of 904.00 cents in the first week of Oct 2014 and traded higher for couple of months and turned lower thereafter. Going forward prices are likely find resistance below 980 cents and trade on sideways to weak note towards 850 cents and lower in the coming 2-3 months .
© TransGraph Consulting Pvt Ltd Slide
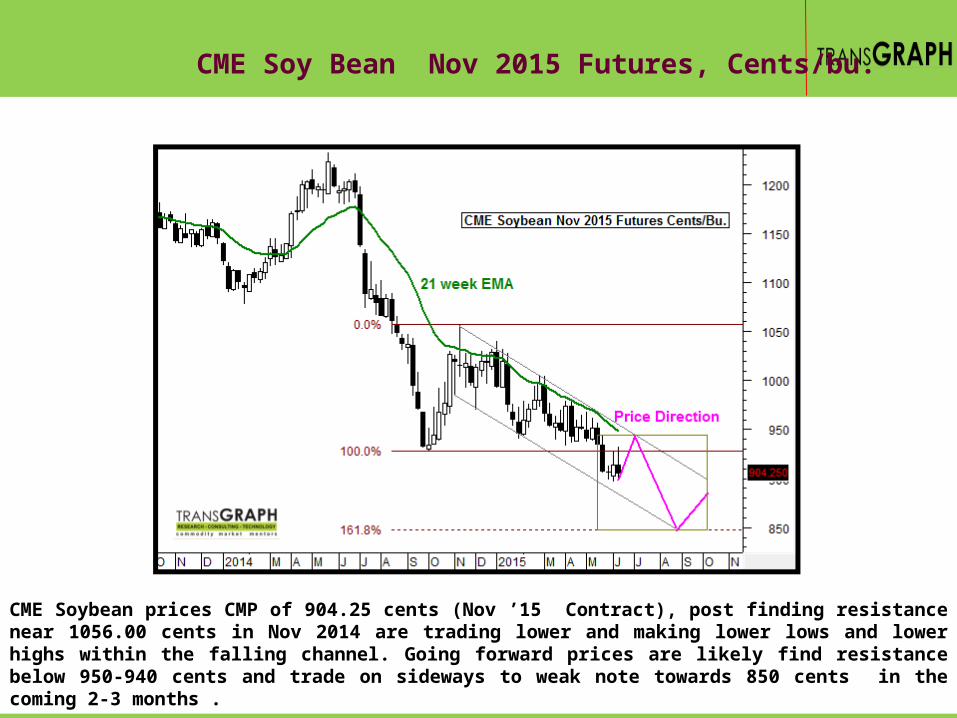
CME Soy Bean Nov 2015 Futures, Cents/bu.
CME Soybean prices CMP of 904.25 cents (Nov ’15 Contract), post finding resistance near 1056.00 cents in Nov 2014 are trading lower and making lower lows and lower highs within the falling channel. Going forward prices are likely find resistance below 950-940 cents and trade on sideways to weak note towards 850 cents in the coming 2-3 months .

© TransGraph Consulting Pvt Ltd Slide
CME Soy-meal futures prices CMP at USD 313.40 (July-15 Futures) post finding support at USD 295.10 in the first week of October 2014 rallied sharply and tested high of USD 417 and turned lower thereafter. Going ahead prices are likely to find resistance below USD 330 and trade on sideways to weak note towards USD 280-270 in the coming 2-3 months.
CME Soy Meal Futures, Conti USD/Short Ton.
© TransGraph Consulting Pvt Ltd Slide
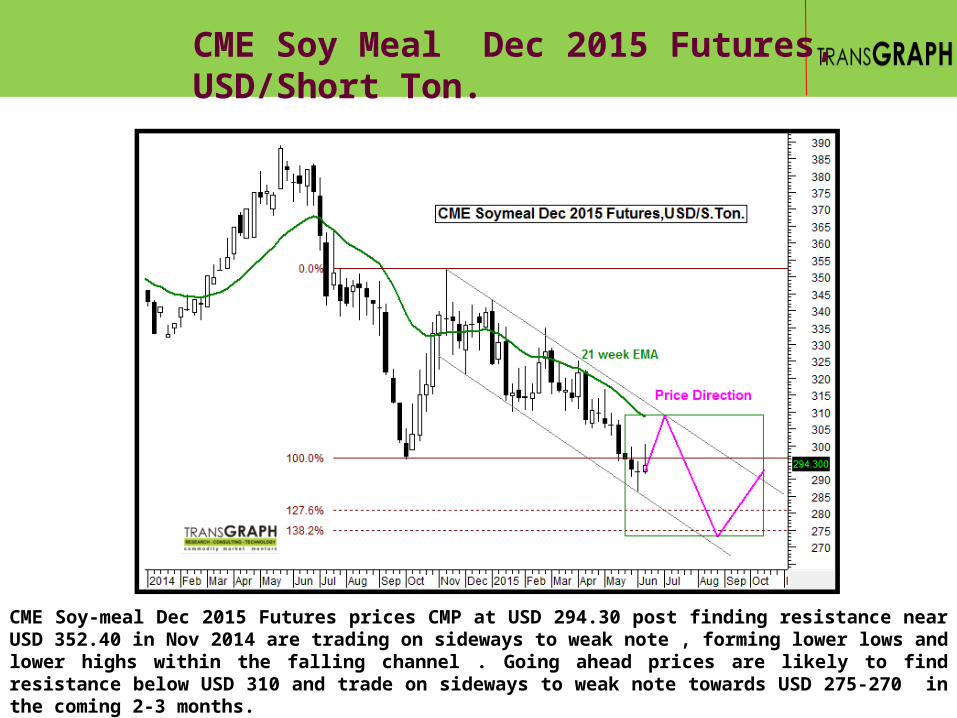
CME Soy-meal Dec 2015 Futures prices CMP at USD 294.30 post finding resistance near USD 352.40 in Nov 2014 are trading on sideways to weak note , forming lower lows and lower highs within the falling channel . Going ahead prices are likely to find resistance below USD 310 and trade on sideways to weak note towards USD 275-270 in the coming 2-3 months.
CME Soy Meal Dec 2015 Futures, USD/Short Ton.
© TransGraph Consulting Pvt Ltd Slide
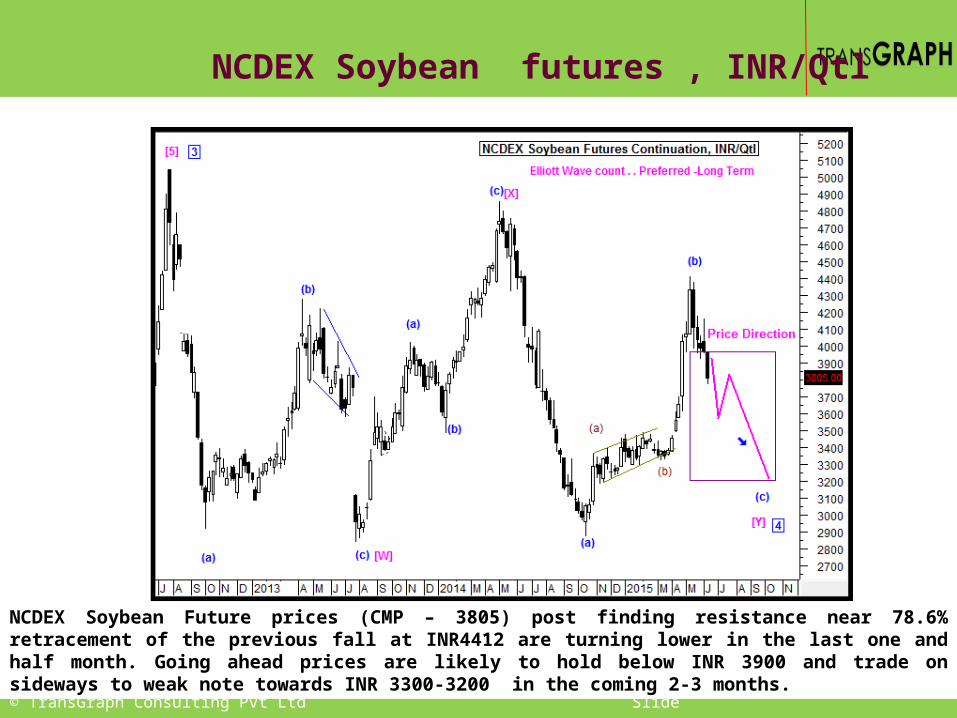
NCDEX Soybean futures , INR/Qtl
NCDEX Soybean Future prices (CMP – 3805) post finding resistance near 78.6% retracement of the previous fall at INR4412 are turning lower in the last one and half month. Going ahead prices are likely to hold below INR 3900 and trade on sideways to weak note towards INR 3300-3200 in the coming 2-3 months.
© TransGraph Consulting Pvt Ltd Slide
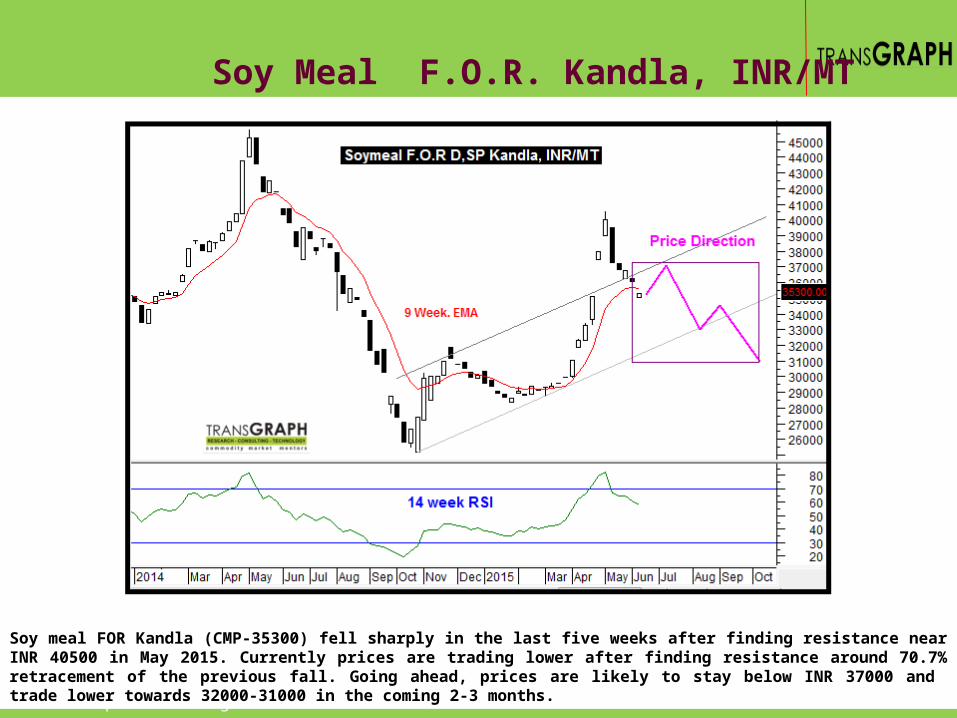
Soy Meal F.O.R. Kandla, INR/MT
Soy meal FOR Kandla (CMP-35300) fell sharply in the last five weeks after finding resistance near INR 40500 in May 2015. Currently prices are trading lower after finding resistance around 70.7% retracement of the previous fall. Going ahead, prices are likely to stay below INR 37000 and trade lower towards 32000-31000 in the coming 2-3 months.

Thanking you for your attention.
TransGraph Consulting Private Limited6C-A, Melange Tower, Sy no.80-84, Ratnadeep Supermarket Lane Patrika Nagar, Hitech city, Madhapur, Hyderabad, Telangana 500081, India.
+91-40-46619999 [email protected]@transgraph.com www.transgraph.com
WWW
44
LEGAL INFORMATION
This document is the whole property of Transgraph Consulting Private Limited, Hyderabad, India (hereafter “TransGraph”).
The following acts are strictly prohibited: Reproduction and/or forwarding for sale or any other uses Posting on any communication medium Transmittal via the Internet
Terms of usageUpon receipt of this document either directly or indirectly, it is understood that the user will and must fully comply with the other terms and conditions of TransGraph. By accepting this document the user agrees to be bound by the foregoing limitations.
This publication is prepared by TransGraph and protected by copyright laws. Unless otherwise noted in the Service Agreement, the entire contents of this publication are copyrighted by TransGraph, and may not be reproduced, stored in another retrieval system, posted on any communication medium, or transmitted in any form or by any means without prior written consent of TransGraph. Unauthorized reproduction or distribution of this publication, or any portion of it, may result in severe civil and criminal penalties, and will be prosecuted to the maximum extent necessary to protect the rights of TransGraph.
The information and opinions contained in this report have been obtained from sources TransGraph believed to be reliable, but no representation or warranty, express or implied, is made that such information is accurate or complete and it should not be relied upon as such.
This report does not constitute a prospectus or other offering document or an offer or solicitation to buy or sell any assets (commodities, currencies, etc) or other investment. Information and opinions contained in the report are published for the assistance of recipients, but are not to be relied upon as authoritative or taken in substitution for the exercise of judgment by any recipient; they are subject to change without any notice and not intended to provide the sole basis of any evaluation of the instruments discussed herein. Any views expressed reflect the current views of the analysts, which do not necessarily correspond to the opinions of TransGraph or its affiliates. Opinions expressed may differ from views set out in other documents, including research, published by TransGraph.
Any reference to past performance should not be taken as an indication of future performance. No member in the public related to TransGraph accepts any liability whatsoever for any direct or consequential loss arising from any use of material contained in this report.
Analyst CertificationEach analyst responsible for the preparation of this report certifies that (i) all views expressed in this report accurately reflect the analyst's views about any and all of the factors and assets (commodities, currencies, etc) named in this report, and (ii) no part of the analyst's compensation is directly or indirectly, related to the execution of the specific recommendations or views expressed herein.
Copyright © TransGraph Consulting Private Limited, Hyderabad, India.
Prepared by Consulting Team – TransGraph6C-A, Melange Tower Sy no.80-84, Ratnadeep Supermarket Lane Patrika Nagar, Hitech city, Madhapur, Hyderabad, Telangana 500081, India.Phone: +91-40-46619999| E-mail: [email protected] | Internet: www.transgraph.com
454545