Transcription control by the ENL YEATS domain in acute ...the YEATS (Yaf9, ENL, AF9, Taf14, Sas5)...
14
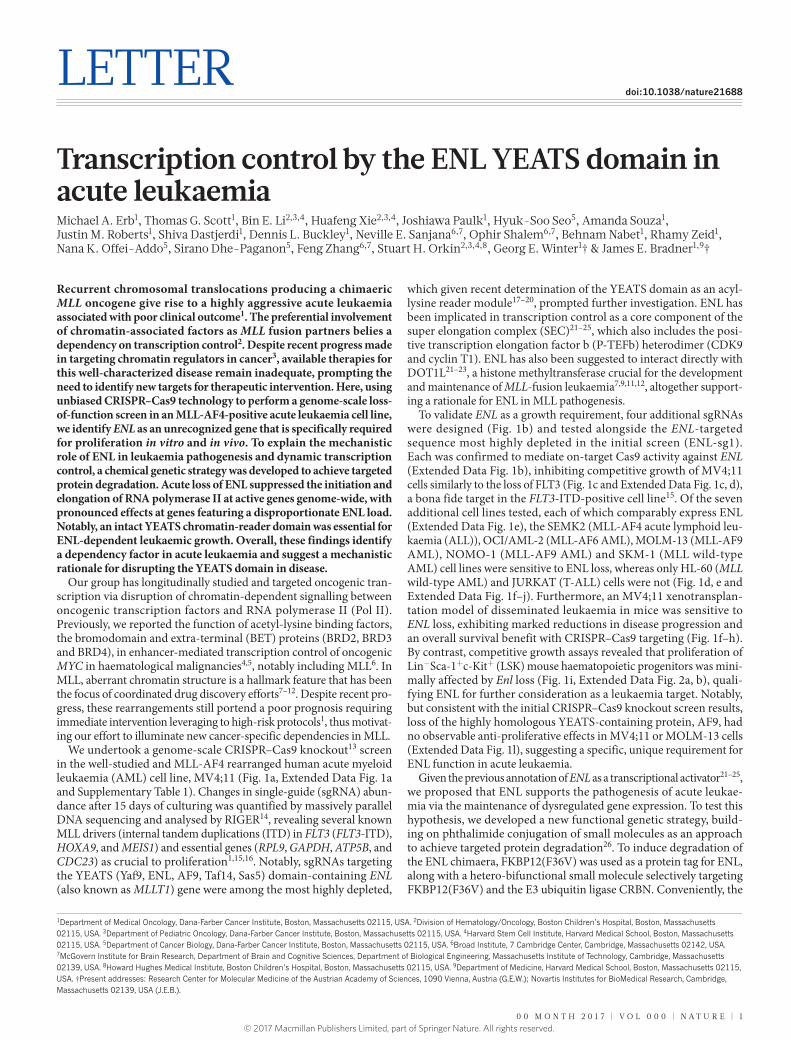
00 MONTH 2017 | VOL 000 | NATURE | 1 LETTER doi:10.1038/nature21688 Transcription control by the ENL YEATS domain in acute leukaemia Michael A. Erb 1 , Thomas G. Scott 1 , Bin E. Li 2,3,4 , Huafeng Xie 2,3,4 , Joshiawa Paulk 1 , Hyuk-Soo Seo 5 , Amanda Souza 1 , Justin M. Roberts 1 , Shiva Dastjerdi 1 , Dennis L. Buckley 1 , Neville E. Sanjana 6,7 , Ophir Shalem 6,7 , Behnam Nabet 1 , Rhamy Zeid 1 , Nana K. Offei-Addo 5 , Sirano Dhe-Paganon 5 , Feng Zhang 6,7 , Stuart H. Orkin 2,3,4,8 , Georg E. Winter 1 † & James E. Bradner 1,9 † Recurrent chromosomal translocations producing a chimaeric MLL oncogene give rise to a highly aggressive acute leukaemia associated with poor clinical outcome 1 . The preferential involvement of chromatin-associated factors as MLL fusion partners belies a dependency on transcription control 2 . Despite recent progress made in targeting chromatin regulators in cancer 3 , available therapies for this well-characterized disease remain inadequate, prompting the need to identify new targets for therapeutic intervention. Here, using unbiased CRISPR–Cas9 technology to perform a genome-scale loss- of-function screen in an MLL-AF4-positive acute leukaemia cell line, we identify ENL as an unrecognized gene that is specifically required for proliferation in vitro and in vivo. To explain the mechanistic role of ENL in leukaemia pathogenesis and dynamic transcription control, a chemical genetic strategy was developed to achieve targeted protein degradation. Acute loss of ENL suppressed the initiation and elongation of RNA polymerase II at active genes genome-wide, with pronounced effects at genes featuring a disproportionate ENL load. Notably, an intact YEATS chromatin-reader domain was essential for ENL-dependent leukaemic growth. Overall, these findings identify a dependency factor in acute leukaemia and suggest a mechanistic rationale for disrupting the YEATS domain in disease. Our group has longitudinally studied and targeted oncogenic tran- scription via disruption of chromatin-dependent signalling between oncogenic transcription factors and RNA polymerase II (Pol II). Previously, we reported the function of acetyl-lysine binding factors, the bromodomain and extra-terminal (BET) proteins (BRD2, BRD3 and BRD4), in enhancer-mediated transcription control of oncogenic MYC in haematological malignancies 4,5 , notably including MLL 6 . In MLL, aberrant chromatin structure is a hallmark feature that has been the focus of coordinated drug discovery efforts 7–12 . Despite recent pro- gress, these rearrangements still portend a poor prognosis requiring immediate intervention leveraging to high-risk protocols 1 , thus motivat- ing our effort to illuminate new cancer-specific dependencies in MLL. We undertook a genome-scale CRISPR–Cas9 knockout 13 screen in the well-studied and MLL-AF4 rearranged human acute myeloid leukaemia (AML) cell line, MV4;11 (Fig. 1a, Extended Data Fig. 1a and Supplementary Table 1). Changes in single-guide (sgRNA) abun- dance after 15 days of culturing was quantified by massively parallel DNA sequencing and analysed by RIGER 14 , revealing several known MLL drivers (internal tandem duplications (ITD) in FLT3 (FLT3-ITD), HOXA9, and MEIS1) and essential genes (RPL9, GAPDH, ATP5B, and CDC23) as crucial to proliferation 1,15,16 . Notably, sgRNAs targeting the YEATS (Yaf9, ENL, AF9, Taf14, Sas5) domain-containing ENL (also known as MLLT1) gene were among the most highly depleted, which given recent determination of the YEATS domain as an acyl- lysine reader module 17–20 , prompted further investigation. ENL has been implicated in transcription control as a core component of the super elongation complex (SEC) 21–25 , which also includes the posi- tive transcription elongation factor b (P-TEFb) heterodimer (CDK9 and cyclin T1). ENL has also been suggested to interact directly with DOT1L 21–23 , a histone methyltransferase crucial for the development and maintenance of MLL-fusion leukaemia 7,9,11,12 , altogether support- ing a rationale for ENL in MLL pathogenesis. To validate ENL as a growth requirement, four additional sgRNAs were designed (Fig. 1b) and tested alongside the ENL-targeted sequence most highly depleted in the initial screen (ENL-sg1). Each was confirmed to mediate on-target Cas9 activity against ENL (Extended Data Fig. 1b), inhibiting competitive growth of MV4;11 cells similarly to the loss of FLT3 (Fig. 1c and Extended Data Fig. 1c, d), a bona fide target in the FLT3-ITD-positive cell line 15 . Of the seven additional cell lines tested, each of which comparably express ENL (Extended Data Fig. 1e), the SEMK2 (MLL-AF4 acute lymphoid leu- kaemia (ALL)), OCI/AML-2 (MLL-AF6 AML), MOLM-13 (MLL-AF9 AML), NOMO-1 (MLL-AF9 AML) and SKM-1 (MLL wild-type AML) cell lines were sensitive to ENL loss, whereas only HL-60 (MLL wild-type AML) and JURKAT (T-ALL) cells were not (Fig. 1d, e and Extended Data Fig. 1f–j). Furthermore, an MV4;11 xenotransplan- tation model of disseminated leukaemia in mice was sensitive to ENL loss, exhibiting marked reductions in disease progression and an overall survival benefit with CRISPR–Cas9 targeting (Fig. 1f–h). By contrast, competitive growth assays revealed that proliferation of Lin − Sca-1 + c-Kit + (LSK) mouse haematopoietic progenitors was mini- mally affected by Enl loss (Fig. 1i, Extended Data Fig. 2a, b), quali- fying ENL for further consideration as a leukaemia target. Notably, but consistent with the initial CRISPR–Cas9 knockout screen results, loss of the highly homologous YEATS-containing protein, AF9, had no observable anti-proliferative effects in MV4;11 or MOLM-13 cells (Extended Data Fig. 1l), suggesting a specific, unique requirement for ENL function in acute leukaemia. Given the previous annotation of ENL as a transcriptional activator 21–25 , we proposed that ENL supports the pathogenesis of acute leukae- mia via the maintenance of dysregulated gene expression. To test this hypothesis, we developed a new functional genetic strategy, build- ing on phthalimide conjugation of small molecules as an approach to achieve targeted protein degradation 26 . To induce degradation of the ENL chimaera, FKBP12(F36V) was used as a protein tag for ENL, along with a hetero-bifunctional small molecule selectively targeting FKBP12(F36V) and the E3 ubiquitin ligase CRBN. Conveniently, the 1 Department of Medical Oncology, Dana-Farber Cancer Institute, Boston, Massachusetts 02115, USA. 2 Division of Hematology/Oncology, Boston Children’s Hospital, Boston, Massachusetts 02115, USA. 3 Department of Pediatric Oncology, Dana-Farber Cancer Institute, Boston, Massachusetts 02115, USA. 4 Harvard Stem Cell Institute, Harvard Medical School, Boston, Massachusetts 02115, USA. 5 Department of Cancer Biology, Dana-Farber Cancer Institute, Boston, Massachusetts 02115, USA. 6 Broad Institute, 7 Cambridge Center, Cambridge, Massachusetts 02142, USA. 7 McGovern Institute for Brain Research, Department of Brain and Cognitive Sciences, Department of Biological Engineering, Massachusetts Institute of Technology, Cambridge, Massachusetts 02139, USA. 8 Howard Hughes Medical Institute, Boston Children’s Hospital, Boston, Massachusetts 02115, USA. 9 Department of Medicine, Harvard Medical School, Boston, Massachusetts 02115, USA. †Present addresses: Research Center for Molecular Medicine of the Austrian Academy of Sciences, 1090 Vienna, Austria (G.E.W.); Novartis Institutes for BioMedical Research, Cambridge, Massachusetts 02139, USA (J.E.B.). © 2017 Macmillan Publishers Limited, part of Springer Nature. All rights reserved.
Transcript of Transcription control by the ENL YEATS domain in acute ...the YEATS (Yaf9, ENL, AF9, Taf14, Sas5)...
0 0 M O N T H 2 0 1 7 | V O L 0 0 0 | N A T U R E | 1
LETTERdoi:10.1038/nature21688
Transcription control by the ENL YEATS domain in acute leukaemiaMichael A. Erb1, Thomas G. Scott1, Bin E. Li2,3,4, Huafeng Xie2,3,4, Joshiawa Paulk1, Hyuk-Soo Seo5, Amanda Souza1, Justin M. Roberts1, Shiva Dastjerdi1, Dennis L. Buckley1, Neville E. Sanjana6,7, Ophir Shalem6,7, Behnam Nabet1, Rhamy Zeid1, Nana K. Offei-Addo5, Sirano Dhe-Paganon5, Feng Zhang6,7, Stuart H. Orkin2,3,4,8, Georg E. Winter1† & James E. Bradner1,9†
Recurrent chromosomal translocations producing a chimaeric MLL oncogene give rise to a highly aggressive acute leukaemia associated with poor clinical outcome1. The preferential involvement of chromatin-associated factors as MLL fusion partners belies a dependency on transcription control2. Despite recent progress made in targeting chromatin regulators in cancer3, available therapies for this well-characterized disease remain inadequate, prompting the need to identify new targets for therapeutic intervention. Here, using unbiased CRISPR–Cas9 technology to perform a genome-scale loss-of-function screen in an MLL-AF4-positive acute leukaemia cell line, we identify ENL as an unrecognized gene that is specifically required for proliferation in vitro and in vivo. To explain the mechanistic role of ENL in leukaemia pathogenesis and dynamic transcription control, a chemical genetic strategy was developed to achieve targeted protein degradation. Acute loss of ENL suppressed the initiation and elongation of RNA polymerase II at active genes genome-wide, with pronounced effects at genes featuring a disproportionate ENL load. Notably, an intact YEATS chromatin-reader domain was essential for ENL-dependent leukaemic growth. Overall, these findings identify a dependency factor in acute leukaemia and suggest a mechanistic rationale for disrupting the YEATS domain in disease.
Our group has longitudinally studied and targeted oncogenic tran-scription via disruption of chromatin-dependent signalling between oncogenic transcription factors and RNA polymerase II (Pol II). Previously, we reported the function of acetyl-lysine binding factors, the bromodomain and extra-terminal (BET) proteins (BRD2, BRD3 and BRD4), in enhancer-mediated transcription control of oncogenic MYC in haematological malignancies4,5, notably including MLL6. In MLL, aberrant chromatin structure is a hallmark feature that has been the focus of coordinated drug discovery efforts7–12. Despite recent pro-gress, these rearrangements still portend a poor prognosis requiring immediate intervention leveraging to high-risk protocols1, thus motivat-ing our effort to illuminate new cancer-specific dependencies in MLL.
We undertook a genome-scale CRISPR–Cas9 knockout13 screen in the well-studied and MLL-AF4 rearranged human acute myeloid leukaemia (AML) cell line, MV4;11 (Fig. 1a, Extended Data Fig. 1a and Supplementary Table 1). Changes in single-guide (sgRNA) abun-dance after 15 days of culturing was quantified by massively parallel DNA sequencing and analysed by RIGER14, revealing several known MLL drivers (internal tandem duplications (ITD) in FLT3 (FLT3-ITD), HOXA9, and MEIS1) and essential genes (RPL9, GAPDH, ATP5B, and CDC23) as crucial to proliferation1,15,16. Notably, sgRNAs targeting the YEATS (Yaf9, ENL, AF9, Taf14, Sas5) domain-containing ENL (also known as MLLT1) gene were among the most highly depleted,
which given recent determination of the YEATS domain as an acyl- lysine reader module17–20, prompted further investigation. ENL has been implicated in transcription control as a core component of the super elongation complex (SEC)21–25, which also includes the posi-tive transcription elongation factor b (P-TEFb) heterodimer (CDK9 and cyclin T1). ENL has also been suggested to interact directly with DOT1L21–23, a histone methyltransferase crucial for the development and maintenance of MLL-fusion leukaemia7,9,11,12, altogether support-ing a rationale for ENL in MLL pathogenesis.
To validate ENL as a growth requirement, four additional sgRNAs were designed (Fig. 1b) and tested alongside the ENL-targeted sequence most highly depleted in the initial screen (ENL-sg1). Each was confirmed to mediate on-target Cas9 activity against ENL (Extended Data Fig. 1b), inhibiting competitive growth of MV4;11 cells similarly to the loss of FLT3 (Fig. 1c and Extended Data Fig. 1c, d), a bona fide target in the FLT3-ITD-positive cell line15. Of the seven additional cell lines tested, each of which comparably express ENL (Extended Data Fig. 1e), the SEMK2 (MLL-AF4 acute lymphoid leu-kaemia (ALL)), OCI/AML-2 (MLL-AF6 AML), MOLM-13 (MLL-AF9 AML), NOMO-1 (MLL-AF9 AML) and SKM-1 (MLL wild-type AML) cell lines were sensitive to ENL loss, whereas only HL-60 (MLL wild-type AML) and JURKAT (T-ALL) cells were not (Fig. 1d, e and Extended Data Fig. 1f–j). Furthermore, an MV4;11 xenotransplan-tation model of disseminated leukaemia in mice was sensitive to ENL loss, exhibiting marked reductions in disease progression and an overall survival benefit with CRISPR–Cas9 targeting (Fig. 1f–h). By contrast, competitive growth assays revealed that proliferation of Lin−Sca-1+c-Kit+ (LSK) mouse haematopoietic progenitors was mini-mally affected by Enl loss (Fig. 1i, Extended Data Fig. 2a, b), quali-fying ENL for further consideration as a leukaemia target. Notably, but consistent with the initial CRISPR–Cas9 knockout screen results, loss of the highly homologous YEATS-containing protein, AF9, had no observable anti-proliferative effects in MV4;11 or MOLM-13 cells (Extended Data Fig. 1l), suggesting a specific, unique requirement for ENL function in acute leukaemia.
Given the previous annotation of ENL as a transcriptional activator21–25, we proposed that ENL supports the pathogenesis of acute leukae-mia via the maintenance of dysregulated gene expression. To test this hypothesis, we developed a new functional genetic strategy, build-ing on phthalimide conjugation of small molecules as an approach to achieve targeted protein degradation26. To induce degradation of the ENL chimaera, FKBP12(F36V) was used as a protein tag for ENL, along with a hetero-bifunctional small molecule selectively targeting FKBP12(F36V) and the E3 ubiquitin ligase CRBN. Conveniently, the
1Department of Medical Oncology, Dana-Farber Cancer Institute, Boston, Massachusetts 02115, USA. 2Division of Hematology/Oncology, Boston Children’s Hospital, Boston, Massachusetts 02115, USA. 3Department of Pediatric Oncology, Dana-Farber Cancer Institute, Boston, Massachusetts 02115, USA. 4Harvard Stem Cell Institute, Harvard Medical School, Boston, Massachusetts 02115, USA. 5Department of Cancer Biology, Dana-Farber Cancer Institute, Boston, Massachusetts 02115, USA. 6Broad Institute, 7 Cambridge Center, Cambridge, Massachusetts 02142, USA. 7McGovern Institute for Brain Research, Department of Brain and Cognitive Sciences, Department of Biological Engineering, Massachusetts Institute of Technology, Cambridge, Massachusetts 02139, USA. 8Howard Hughes Medical Institute, Boston Children’s Hospital, Boston, Massachusetts 02115, USA. 9Department of Medicine, Harvard Medical School, Boston, Massachusetts 02115, USA. †Present addresses: Research Center for Molecular Medicine of the Austrian Academy of Sciences, 1090 Vienna, Austria (G.E.W.); Novartis Institutes for BioMedical Research, Cambridge, Massachusetts 02139, USA (J.E.B.).
© 2017 Macmillan Publishers Limited, part of Springer Nature. All rights reserved.

2 | N A T U R E | V O L 0 0 0 | 0 0 M O N T H 2 0 1 7
LETTERRESEARCH
previously identified F36V mutation produces a ‘hole’ in the protein surface that accommodates a complementary steric ‘bump’ on the ligand27, thereby avoiding targeting of wild-type FKBP12.
With a haemagglutinin (HA) epitope tag used for detection, ENL was expressed as amino- and carboxy-terminal FKBP12(F36V) fusions in MV4;11-Cas9 cells and efficiently degraded at nanomolar concen-trations by both dTAG-7 and dTAG-13 (Fig. 2a and Extended Data Fig. 3a–d), notably within 30 min and 1 h, respectively (Fig. 2b and Extended Data Fig. 3e). This system proved amenable for use in several cellular systems (Extended Data Fig. 3f–h), and durable over several days after a single treatment (Extended Data Fig. 3i, j), particularly with dTAG-13 treatment, which led to its selection for further charac-terization. Upon selective inactivation of endogenous ENL and clonal expansion of lines bearing N- and C-terminal fusions (Extended Data Fig. 4a, b), expression proteomics revealed exclusive loss of ENL with a single 3-h dTAG-13 exposure (Fig. 2c,) whereas wild-type FKBP12 is spared by this ‘bump-hole’ strategy.
Administration of dTAG produced dose-responsive decreases in viability and potently suppressed proliferation in the absence of endogenous ENL (Fig. 2d and Extended Data Fig. 4c–f), with unde-tectable effects in wild-type MV4;11 cells (Extended Data Fig. 4g, h). We focused subsequent analyses on the C-terminally tagged MV4;11 cell line (Cas9+, ENL-FKBP12(F36V)–HA+, ENL−/−) as it featured a doubling time (31.3 h, least-squares nonlinear regression, R2 = 0.956) closer to that of wild-type MV4;11 cells (25.8 h, R2 = 0.994) than did the N-terminally tagged line (35.0 h, R2 = 0.995). BrdU staining revealed that growth impairment downstream of pharmacological ENL degra-dation can be attributed to rapid induction of G1 arrest and an accu-mulation of sub-G1 cells over 72 h (Fig. 2e and Extended Data Fig. 4i).
Consistent with previous annotations of ENL as a transcriptional activator, we observed subtle loss of gene expression by cell-count normalized RNA sequencing (RNA-seq) at 8 h, followed by global downregulation of active transcripts at 24 and 96 h (Fig. 2f). We noted that several well-characterized leukaemic drivers, including HOXA10, MYC, MYB, and MEIS1, were among the earliest and most severely downregulated transcripts, whereas the myeloid differentiation marker ITGAM (also known as CD11b or MAC-1) was upregulated (Fig. 2g). Underlying global transcriptional defects at 24 h was a concomitant decrease in RNA Pol II abundance at transcription start sites (TSS) and gene bodies of active genes (Fig. 2h, i).
By chromatin immunoprecipitation and next-generation DNA sequencing (ChIP–seq), we found genomic localization of ENL-FKBP12(F36V) (using an HA-directed antibody) in MV4;11 (Cas9+, ENL-FKBP12(F36V)–HA, ENL−/−) cells to be closely correlated with wild-type ENL in the parental MV4;11 cells (Extended Data Fig. 5a), with each factor preferentially enriched at TSS (Fig. 3a and Extended Data Fig. 5b, c). Enrichment also correlated with epigenomic localiza-tion of the reported YEATS-domain substrates17–20 H3K9ac, H3K18ac and H3K27ac (Extended Data Fig. 5d–i). Notably, ranking ENL-bound loci uncovered an asymmetric distribution of ENL on the genome in which a small fraction (ENL: 4.0%; ENL-FKBP: 2.5%) of all bound sites were enriched for a disproportionate amount of total ENL (ENL: 51.2%; ENL-FKBP: 50.1%) (Fig. 3b, c and Extended Data Fig. 5j). Within the set of asymmetrically loaded targets, we identified a large number of leukaemogenic genes such as MYC, MYB, HOXA10 and MEIS1. A similar phenomenon was observed in MOLM-13 cells with preferential localization of ENL to promoters (Extended Data Fig. 6a), notably correlated with H3K27ac enrichment (Extended Data Fig. 6b;
Figure 1 | ENL is required for growth of acute leukaemia. a, RIGER analysis of pooled CRISPR–Cas9 screen in MV4;11 cells. Selected essential and leukaemic driver genes are shown in black and blue, respectively. NES, normalized enrichment score. b, Schematic depiction of the ENL domain structure: YEATS, polyproline region (P), and Anc1 homology domain (AHD). Numbering indicates sgRNA exon targets in c–e (sg1, sg2, sg3, sg11 and sg12). c–e, Competition-based CRISPR–Cas9 mutagenesis assays. The GFP+ (sgRNA+) subpopulation percentage is depicted for the indicated day (D) after lentiviral transduction. sgRNA against ribosomal gene RPS19 was used as a positive control. Mean ± s.d., n = 3. f, Luminescence of MV4;11 (Cas9+, luciferase+) cells in a disseminated
model of leukaemia at the indicated day after xenotransplantation. Rosa-sg denotes a control sgRNA targeting the mouse Rosa26 locus (non-targeting in human cells). P values obtained via two-tailed Student’s t-tests, comparing each ENL sgRNA against the Rosa26 sgRNA. Mean ± s.e.m., n = 10. g, Representative images of mice from f. The same mice are depicted at each time point. h, Kaplan–Meier plot for overall survival of mice from f. n = 10, P value obtained from Mantel–Cox test. i, Competition-based CRISPR–Cas9 mutagenesis in mouse LSK cells. Percentage GFP+ (sgRNA+) after doxycycline (Dox) induction of Cas9 expression. sgRNA against Rpa3 was used as a positive control. Mean ± s.d., n = 3. *P < 0.05, **P < 0.01, ***P < 0.001, ****P < 0.0001.
a
–3 –2 –1 0
–3
–2
–1
0
Replicate 1 log10 NES
Rep
licat
e 2
log 10
NE
S
FLT3 MEIS1
HOXA9RPL9
CDC23
ATP5B
GAPDH
ENL
AF9
b
c
Day 10
Ros
a-sg
sg1
Day 32
sg12
Day 35
2.0
1.0
0.5
1.5
40
20
10
30
40
20
10
30
0 25 30 40 50 600
50
100
Sur
viva
l (%
)
Rosa-sg
ENL-sg1
ENL-sg12
***
Rosa-
sg
Rpa3-s
g
Enl-sg
0
25
50
75
100
125
GFP
+ (%
) (+
Dox
/–D
ox
norm
aliz
ed t
o D
3) D3D6D9
SEC DOT1L
YEATS P AHD
sg1 sg2 sg3 sg11 sg12
Chromatin
0
50
100
MV4;11-Cas9 (MLL-AF4)
D3
D11
D18
D21
D25
RPS19
Lucif
eras
e
mChe
rry sg1
sg2
sg3sg
11sg
120
50
100
GFP
+ (%
)(n
orm
aliz
ed t
o D
3)G
FP+ (%
)(n
orm
aliz
ed t
o D
3)
GFP
+ (%
)(n
orm
aliz
ed t
o D
3)
OCI/AML-2-Cas9 (MLL-AF6)
D3
D7
D11
D16
D21
d
0
50
100
MOLM13-Cas9 (MLL-AF9)
D3
D10
D14
D18
e
fR
adia
nce
(pho
tons
s–1
cm
–2 s
r–1) ×
106
Radiance (photons s–1 cm–2 sr–1) ×106
ENL-sg1
ENL-sg12
Rosa-sg
0
5
10
15
20
3 6 10 13 17 20 24 28 32
Time after injection (days)
Time after injection (days)
******** ** ******
*****
** **
********
*****
g
h
i
ENL-sg
RPS19
Lucif
eras
e
mChe
rry sg1
sg2
sg3sg
11sg
12
ENL-sg
RPS19
Lucif
eras
e
mChe
rry sg1
sg2
sg3sg
11sg
12
ENL-sg
EN
L-sg
© 2017 Macmillan Publishers Limited, part of Springer Nature. All rights reserved.

0 0 M O N T H 2 0 1 7 | V O L 0 0 0 | N A T U R E | 3
LETTER RESEARCH
GEO accession GSM1652920; ref. 28) and asymmetrically distributed on the genome (Extended Data Fig. 6c, d).
By integrating these gene sets with kinetic gene expression profil-ing following dTAG-13 exposure, we uncovered preferential down-regulation of asymmetrically enriched ENL target genes (Fig. 3d and Extended Data Fig. 7a–c), prompting further interrogation of class- specific RNA Pol II dynamics at ENL target genes. By ChIP–seq with cell-count normalization (ChIP–Rx), we uncovered a preferential loss of RNA Pol II from the gene bodies of asymmetrically loaded targets, but with comparatively minimal effects at their TSS, reflecting a pause release defect at those genes (Fig. 3e and Extended Data Fig. 7d, e). Given previous characterization of ENL as a member of the SEC, we reasoned that these effects might be consequences of SEC recruitment to chromatin. To test this idea, we focused on the chromatin localiza-tion of AFF4 and CDK9, which are scaffolding and catalytic subunits of the SEC, respectively. After a 6-h treatment with dTAG-13, we uncov-ered an evident loss of AFF4 from promoters of asymmetrically, but not typically, loaded targets (Fig. 3f, h, i and Extended Data Fig. 7f, i), which was also accompanied by a preferential loss of CDK9 from the promoters of those genes (Fig. 3g–i and Extended Data Fig. 7g, i). This suggested that ENL may contribute to the recruitment of the SEC to asymmetrically loaded target genes to promote productive elongation. We thus focused on the catalytic output of CDK9 activity (phospho-rylation of serine 2 (S2P) of the RNA Pol II C-terminal domain hepta-peptide repeat) as a marker of elongating polymerase29. After 24 h of dTAG-13 treatment, we observed diminished Pol II S2P enrichment specifically within gene bodies of ENL targets with asymmetric enrich-ment (Fig. 3h, i and Extended Data Fig. 7h, i).
As ENL has been reported to bind to DOT1L directly21–23, we explored the functional relationship between these two factors. The rapid anti-proliferative response to ENL destabilization suggests a
mechanism distinct from DOT1L function, as both genetic and chemi-cal targeting of DOT1L is characterized by a delayed (7–10 day) effect on MLL growth and viability7,9. Indeed, bulk levels of H3K79me2 were minimally changed by ENL degradation and only modest effects on locus-specific H3K79me2 were observed at asymmetric ENL target genes by ChIP–seq (Extended Data Fig. 8a–c). As any changes to H3K79me2 occur several days after the first gene-expression changes occur following ENL degradation (96 h versus 6 h), we interpret these effects as secondary events attributable to the effect of ENL loss. To dissect DOT1L-independent and DOT1L-dependent ENL phenotypes further, we leveraged the rapid kinetics afforded by the dTAG/ENL system, finding that cell cycle and gene expression effects after ENL degradation were antecedent to those induced by DOT1L inhibition (Extended Data Fig. 8d, e). Moreover, combination treatments for 96 h revealed an additive effect on the suppression of MYC and HOXA9 transcription compared to either single agent treatment (Extended Data Fig. 8f). Also, while we were able to reproduce previous reports that DOT1L inhibition specifically downregulates MLL fusion target genes7,9, we did not uncover preferential suppression of published MLL-AF4 target genes after dTAG-13 treatment, and MLL-AF4 target genes exhibit minimal overlap with asymmetrically loaded ENL targets10,30 (Extended Data Fig. 8g–i). Together, these data suggest that ENL degradation produces anti-leukaemic effects on gene expression that occur, at least in part, through DOT1L-independent mechanisms. This agrees with the apparent ENL requirement in wild-type MLL acute leukaemia (Extended Data Fig. 1h), whereas DOT1L is selectively required in MLL-rearranged leukaemia7,9.
Given the evident addiction to ENL in acute leukaemia cells, we used saturating CRISPR–Cas9 mutagenesis to aid in the qualification of functionally relevant protein domains for drug-discovery efforts31. We observed strong negative selection from sgRNAs targeting all annotated
0.25
0.50
1.00
2.00
Rel
ativ
e ab
und
ance
adTAG-13
MeOOMe
OMe
O
NO
O
MeO
MeO
O
NH
OO
N
NH
O
OO
O
DM
SO
dTA
G-1
3
DM
SO
dTA
G-1
3
DM
SO
dTA
G-1
3
DM
SO
dTA
G-1
3
DM
SO
dTA
G-1
3
DM
SO
dTA
G-1
3
0.5 1 2 3 6 24 Time (h)
ENL-FKBP12(F36V)ENL
HA
500 nM
GAPDH
b
c d
–10 –9 –8 –7 –6 –5 –40
25
50
75
100
log[dTAG-13, M]
Nor
mal
ized
lum
ines
cenc
e
IC50 = 49.7 nM
DMSO
0
20
40
60
80
100
Per
cent
age
Sub-G1
G1
G2
S
dTAG-13 (h)
15 0Distance
Hei
ght
8 h 24 h 96 h0
0.6
–2 0 2log2 fold change expression
dTAG-13:
e
f
24 48 72
0
20
40
60
80
100
Pol
II (m
ean
RR
PM
)
–3 kb TSS TTR +3 kb
0
15
TTR +3 kb
DMSOdTAG-13
0.1 1 10 1000
0.2
0.4
0.6
0.8
1.0
Travelling ratio
Frac
tion
of g
enes
DMSOdTAG-13
Increased pausing
g
0 –2 –4 –6
–3
–2
–1
0
1
2
3
dTAG-13 (8 h)
log10 P value log10 P value log10 P value
log 2
fold
cha
nge
exp
ress
ion
(DM
SO
nor
mal
ized
)
MYB
HOXA10MYC
MEIS1
ITGAM
MYB
HOXA10
MYC
MEIS1
ITGAM
0 –2 –4 –6
dTAG-13 (24 h)
MYB
HOXA10
MYC
MEIS1
ITGAM
0 –2 –4 –6
dTAG-13 (96 h)
hi
ENL
FKBP12
log10 P value (Student’s t-test)–5 –4 –3 –2 –1 0
Figure 2 | ENL degradation induces growth arrest and transcription defects genome-wide. a, Chemical structure of dTAG-13. b, Kinetic evaluation of ENL-FKBP12(F36V) degradation in MV4;11 (Cas9+, ENL-FKBP12(F36V)–HA+) cells. c, Quantification of protein abundance after 3-h DMSO or dTAG-13 treatment (500 nM) in MV4;11 (Cas9+, ENL-FKBP12(F36V)–HA+, ENL−/−) cells for proteins with three or more quantified spectral counts, n = 3. d, DMSO-normalized cellular viability in MV4;11 (Cas9+, ENL-FKBP12(F36V)–HA+) cells after 72-h treatment with dTAG-13 approximated by ATP-lite assay. Mean ± s.d., n = 4. e, Cell cycle analysis with DMSO or dTAG-13 (500 nM) treatment by BrdU incorporation. Mean ± s.d., n = 3. f, Heat map representation of DMSO-normalized fold changes in cell-count-normalized gene expression values caused by dTAG-13 (500 nM). g, Volcano plot of data shown in f. P value derived from two-tailed Student’s t-test, n = 3. h, Meta-gene representation of cell-count-normalized ChIP–seq (ChIP–Rx) of RNA Pol II at active genes after DMSO or dTAG-13 (500 nM) treatment for 24 h. RRPM, reference-adjusted reads per million; TTR, transcription termination region. i, Cumulative distribution plot of RNA Pol II travelling ratios from data shown in h.
© 2017 Macmillan Publishers Limited, part of Springer Nature. All rights reserved.

4 | N A T U R E | V O L 0 0 0 | 0 0 M O N T H 2 0 1 7
LETTERRESEARCH
regions of ENL, with no regions emerging as a clear outlier (Fig. 4a). Given the sensitivity of CRISPR–Cas9 directed at the YEATS domain, and our positive experience approaching acetyl-lysine recognition motifs with discovery chemistry, we explored whether ENL-dependent
growth was contingent on YEATS domain function. Informed by published structure–function studies of the highly homologous AF9 protein17, we engineered ENL mutations predicted to either mini-mally or severely affect acetyl-lysine recognition by featuring alanine
a H3K9ac ENL-F
RP
M p
er b
p
3.0
0
ENL
TSS–5 kb +5 kb MYB
40
40
40
RP
M p
er b
p
ENL-F
ENL
H3K9ac
ACTBFBXL18
15 kb
0
150
100
50
4,0002,0000
MEIS1 (4) SATB1 (1)
MYB (12)RUNX1 (31)
FLT3 (57)MYC (102)
HOXA9/10 (38)
BCL2 (142)
Rank-ordered ENL loci
EN
L lo
ad (R
PM
) (×1
03 )
174 assymetric loci
b c
d0.001 0.01
Gen
e ex
pre
ssio
nlo
g 2 fo
ld c
hang
e
8 h 24 h 96 h
Typical ENL loadAsymmetric ENL load–2
–1
0
1
–3
–2
–1
0
1
2
Asymmetric ENL load
TSS Gene body
P = 0.0008
Pol
II o
ccup
ancy
log 2
fold
cha
nge
Typical ENL load
eTSS regions ranked by change in AFF4 signal
AFF
4 oc
cup
ancy
(log 2
fold
cha
nge)
–2
–1
0
1
2TypicalAsymmetric
MYB MEIS1HOXA10
MYC
TSS regions ranked by change in CDK9 signal–2
–1
0
1
2TypicalAsymmetric
MYB
MEIS1
HOXA10MYC
MYB
AFF
4C
DK
9P
ol II
dTAG-13
DMSO
ACTB
Pol
II S
2P
150
150
60
60
100
100
150
150
400
400
20
20
30
30
400
400
6 h24 h
h
f
CD
K9
occu
pan
cy(lo
g 2 fo
ld c
hang
e)
g
–2–1012
AFF4
ChI
P–R
x si
gnal
(log 2
fold
cha
nge) CDK9 Pol II S2P
AsymmetricTypical
P = 6 × 10⁻⁵
P = 3 × 10⁻⁶
P = 1 × 10–15
P = 2 × 10⁻¹⁰ P = 1 × 10–14
i
TypicalAsymmetric
Figure 3 | ENL degradation attenuates SEC recruitment and activity. a, ENL promoter localization. Rank-ordered heat map of H3K9ac, ENL-FKBP12(F36V) (ENL-F), and ENL ChIP–seq signal at ENL-FKBP12(F36V)-bound promoters, sorted by ENL-FKBP12(F36V) signal. bp, base pairs; RPM, reads per million. b, Asymmetric localization of ENL. ENL ChIP–seq signal at each location is plotted against its rank among all ENL-occupied regions. Red depicts asymmetrically loaded loci. Numbers in parentheses denote the ranking of the ENL-bound loci. c, Gene tracks of ChIP–seq signal at examples of asymmetrically and typically enriched ENL-target genes. d, Boxplot of DMSO-normalized fold change in cell-count-normalized RNA-seq values after dTAG-13 (500 nM) treatment. e, Boxplots of DMSO-normalized fold change in RNA Pol II ChIP–Rx
signal after 24 h dTAG-13 (500 nM) treatment. f, Waterfall plot of change in AFF4 ChIP–Rx signal at promoters (TSS ± 5 kb) of ENL-target genes (2,303 total) after dTAG-13 (500 nM) treatment for 6 h. g, As in f, but for CDK9 ChIP–Rx. h, Boxplots of change in ChIP–Rx signal for AFF4 and CDK9 at promoters (TSS ± 5 kb) and for Pol II S2P at gene bodies of ENL-target genes after dTAG-13 (500 nM) treatment (6 h for AFF4 and CDK9, 24 h for Pol II S2P). i, Gene tracks of ChIP–Rx signal (RRPM per bp) at examples of asymmetrically and typically enriched ENL-target genes. P values are from Welch’s two-tailed t-tests. In d, e, h, errors bars denote 1.5× the interquartile range, lines denote median, top and bottom of boxes denote first and third quartile values.
–2
0
2
–2
0
2MV4;11
MOLM-13
YEATS P AHDNH2- -COOH
a
b
0 5 10 15 20 25
H3(1–19)unmodK9ac
R8me2sK9acR8me2aK9ac
R8CitrK9acK9acS10PK9acT11P
K9acK14acR8me2sK9acS10PR8me2sK9acT11PR8me2aK9acS10PR8me2aK9acT11P
R8me2aK9acS10PT11PR2me2aK4me1K9acR2me2aK4me2K9acR2me2aK4me3K9ac
R2me2aK4acK9acK4me1R8me2sK9acK4me2R8me2sK9acK4me3R8me2sK9ac
K4acR8me2sK9acK4me1R8me2aK9acK4me2R8me2aK9acK4me3R8me2aK9ac
K4acR8me2aK9acR2me2sK4me1R8me2sK9acR2me2sK4me2R8me2sK9acR2me2sK4me3R8me2sK9ac
R2me2sK4acR8me2sK9acR2me2aK4me1R8me2sK9acR2me2aK4me2R8me2sK9acR2me2aK4me3R8me2sK9ac
R2me2aK4acR8me2sK9acR2me2sK4me1R8me2aK9acR2me2sK4me2R8me2aK9acR2me2sK4me3R8me2aK9ac
R2me2sK4acR8me2aK9acR2me2aK4me1R8me2aK9acR2me2aK4me2R8me2aK9acR2me2aK4me3R8me2aK9ac
R2me2aK4acR8me2aK9ac
0 5 10 15 20 25
Fold enrichment (over unmodi�ed peptide)
0 5 10 15 20 25
ENL WT ENL(F47A) ENL(Y78A)
1 2 1 2
Chr7:27,249,800 Chr7:27,187,542
20
HOXA cluster1011 913 7
ENL-FKBP12(F36V)
RP
Mp
er b
p
0
0.2
0.4
0.6
0
0.2
0.4
0.6
ChI
P/in
put
(%)
WT
F47A
Y78A
Primer Primer
c
d
0 10 20 300
25
50
75
100
Day
GFP
+ (%
)(D
3 no
rmal
ized
)
1 20
0.2
0.4
0.6
ChI
P/in
put
(%)
Primer
MEIS1
1 2
ChI
P/in
put
(%)
Primer
MYBe
fWT
F47AParentY78A
0.8
0
0.2
0.4
0.6
0.8
WT
F47A
Y78A
WT
F47A
Y78A
EN
L-sg
ab
und
ance
D18
/D3
log 2
fold
cha
nge
Figure 4 | The YEATS domain is essential for ENL-dependent leukaemic growth. a, Scanning mutagenesis of ENL by pooled CRISPR–Cas9 targeting of all exonic protospacer adjacent motifs (PAMs) for competitive growth assays. b, Quantification of histone peptide microarray spots containing H3K9ac after probing with cellular lysates from 293T cells overexpressing wild-type (WT) or mutant 3×HA–ENL. Mean ± s.d., n = 2. c, YEATS-dependent chromatin localization of ENL. Top, gene track view of ENL-FKBP12(F36V) ChIP–seq signal. Bottom, ChIP and quantitative PCR (qPCR) signal at the indicated locus by two independent primer pairs. Mean ± s.d., triplicate PCR analysis. d, e, As in c, but for the 5′ region of the indicated gene. Mean ± s.d., triplicate PCR analysis. f, Rescue of endogenous ENL loss by exogenous expression of wild-type and mutant ENL. The percentage of the GFP+ (endogenous ENL-targeted sgRNA+) subpopulation is depicted for the indicated day after lentiviral transduction. Mean ± s.e.m., n = 3.
© 2017 Macmillan Publishers Limited, part of Springer Nature. All rights reserved.

0 0 M O N T H 2 0 1 7 | V O L 0 0 0 | N A T U R E | 5
LETTER RESEARCH
replacements at Phe47 or Tyr78, respectively (Extended Data Fig. 9a). As previously reported for AF9, we confirmed the ability of wild-type ENL to bind H3K9ac and H3K27ac, and although this interaction was moderately affected by mutation of Phe47 to alanine, ENL(Y78A) exhibited a nearly complete inability to bind acetyl-lysine (Fig. 4b and Extended Data Fig. 9b–d). Despite equivalent expression, unaf-fected nuclear localization, and thermal stability in MV4;11-Cas9 cells (Extended Data Fig. 9e–h) the ENL(F47A) and ENL(Y78A) mutants exhibited moderate and severe defects in the localization to chroma-tin, respectively (Fig. 4c–e). Ultimately, these findings are consistent with the ability of each construct to rescue loss of endogenous ENL (Fig. 4f), providing genetic validation of the YEATS domain as a func-tional, emerging therapeutic target in leukaemia.
In advance of identifying direct-acting inhibitors of ENL, we present data in support of a facile chemical biology platform to study dynamic cellular processes. We anticipate broad applicability of this techno logy beyond the scope of this study. We use the dTAG system to study the ‘fast biology’ of transcription activation and elongation, capable of disentangling immediate versus secondary effects, complementing if not improving genetic perturbations (such as short interfering RNA (siRNA) and CRISPR). Together, these studies provide support for a DOT1L-independent mechanism of leukaemic maintenance, in which ENL recruitment of the SEC to promoters contributes to transactivation of as-yet undruggable oncogenes, such as MYC, MYB and HOXA10. Notably, although the role of ENL as a frequent fusion partner of MLL in leukaemia has been known1, we report wild-type ENL, and specifi-cally its YEATS domain, as an unrecognized cancer-specific depend-ency target in acute leukaemia. We and others may now pursue the discovery of chromatin-competitive antagonists of the ENL YEATS domain, with mechanistic guidance, as leukaemia therapy.
Online Content Methods, along with any additional Extended Data display items and Source Data, are available in the online version of the paper; references unique to these sections appear only in the online paper.
Data Availability The ChIP–seq and RNA-seq data have been deposited in the Gene Expression Omnibus (GEO) under the accession GSE82118.
Received 22 May 2016; accepted 3 February 2017.
Published online 1 March 2017.
1. Krivtsov, A. V. & Armstrong, S. A. MLL translocations, histone modifications and leukaemia stem-cell development. Nat. Rev. Cancer 7, 823–833 (2007).
2. Slany, R. K. When epigenetics kills: MLL fusion proteins in leukemia. Hematol. Oncol. 23, 1–9 (2005).
3. Cai, S. F., Chen, C.-W. & Armstrong, S. A. Drugging chromatin in cancer: recent advances and novel approaches. Mol. Cell 60, 561–570 (2015).
4. Ott, C. J. et al. BET bromodomain inhibition targets both c-Myc and IL7R in high-risk acute lymphoblastic leukemia. Blood 120, 2843–2852 (2012).
5. Delmore, J. E. et al. BET bromodomain inhibition as a therapeutic strategy to target c-Myc. Cell 146, 904–917 (2011).
6. Zuber, J. et al. RNAi screen identifies Brd4 as a therapeutic target in acute myeloid leukaemia. Nature 478, 524–528 (2011).
7. Bernt, K. M. et al. MLL-rearranged leukemia is dependent on aberrant H3K79 methylation by DOT1L. Cancer Cell 20, 66–78 (2011).
8. Daigle, S. R. et al. Potent inhibition of DOT1L as treatment of MLL-fusion leukemia. Blood 122, 1017–1025 (2013).
9. Daigle, S. R. et al. Selective killing of mixed lineage leukemia cells by a potent small-molecule DOT1L inhibitor. Cancer Cell 20, 53–65 (2011).
10. Guenther, M. G. et al. Aberrant chromatin at genes encoding stem cell regulators in human mixed-lineage leukemia. Genes Dev. 22, 3403–3408 (2008).
11. Krivtsov, A. V. et al. H3K79 methylation profiles define murine and human MLL-AF4 leukemias. Cancer Cell 14, 355–368 (2008).
12. Okada, Y. et al. hDOT1L links histone methylation to leukemogenesis. Cell 121, 167–178 (2005).
13. Shalem, O. et al. Genome-scale CRISPR–Cas9 knockout screening in human cells. Science 343, 84–87 (2014).
14. Luo, B. et al. Highly parallel identification of essential genes in cancer cells. Proc. Natl Acad. Sci. USA 105, 20380–20385 (2008).
15. Levis, M. et al. A FLT3-targeted tyrosine kinase inhibitor is cytotoxic to leukemia cells in vitro and in vivo. Blood 99, 3885–3891 (2002).
16. Wang, T. et al. Identification and characterization of essential genes in the human genome. Science 350, 1096–1101 (2015).
17. Li, Y. et al. AF9 YEATS domain links histone acetylation to DOT1L-mediated H3K79 methylation. Cell 159, 558–571 (2014).
18. Li, Y. et al. Molecular coupling of histone crotonylation and active transcription by AF9 YEATS domain. Mol. Cell 62, 181–193 (2016).
19. Andrews, F. H. et al. The Taf14 YEATS domain is a reader of histone crotonylation. Nat. Chem. Biol. 12, 396–398 (2016).
20. Shanle, E. K. et al. Association of Taf14 with acetylated histone H3 directs gene transcription and the DNA damage response. Genes Dev. 29, 1795–1800 (2015).
21. Mueller, D. et al. A role for the MLL fusion partner ENL in transcriptional elongation and chromatin modification. Blood 110, 4445–4454 (2007).
22. Yokoyama, A., Lin, M., Naresh, A., Kitabayashi, I. & Cleary, M. L. A higher-order complex containing AF4 and ENL family proteins with P-TEFb facilitates oncogenic and physiologic MLL-dependent transcription. Cancer Cell 17, 198–212 (2010).
23. He, N. et al. Human polymerase-associated factor complex (PAFc) connects the super elongation complex (SEC) to RNA polymerase II on chromatin. Proc. Natl Acad. Sci. USA 108, E636–E645 (2011).
24. Rubnitz, J. E., Morrissey, J., Savage, P. A. & Cleary, M. L. ENL, the gene fused with HRX in t(11;19) leukemias, encodes a nuclear protein with transcriptional activation potential in lymphoid and myeloid cells. Blood 84, 1747–1752 (1994).
25. Zeisig, D. T. et al. The eleven-nineteen-leukemia protein ENL connects nuclear MLL fusion partners with chromatin. Oncogene 24, 5525–5532 (2005).
26. Winter, G. E. et al. Phthalimide conjugation as a strategy for in vivo target protein degradation. Science 348, 1376–1381 (2015).
27. Clackson, T. et al. Redesigning an FKBP-ligand interface to generate chemical dimerizers with novel specificity. Proc. Natl Acad. Sci. USA 95, 10437–10442 (1998).
28. Rathert, P. et al. Transcriptional plasticity promotes primary and acquired resistance to BET inhibition. Nature 525, 543–547 (2015).
29. Peterlin, B. M. & Price, D. H. Controlling the elongation phase of transcription with P-TEFb. Mol. Cell. 23, 297–305 (2006).
30. Wilkinson, A. C. et al. RUNX1 is a key target in t(4;11) leukemias that contributes to gene activation through an AF4-MLL complex interaction. Cell Reports 3, 116–127 (2013).
31. Shi, J. et al. Discovery of cancer drug targets by CRISPR–Cas9 screening of protein domains. Nat. Biotechnol. 33, 661–667 (2015).
Supplementary Information is available in the online version of the paper.
Acknowledgements The authors thank S. A. Armstrong, C. D. Allis, and X. Shi for transparent and supportive dialogue. We also thank J. A. Perry for editing the manuscript and N. S. Gray and C. J. Ott for suggestions. Quantitative proteomics studies were performed by R. Kunz. This research was supported by philanthropic gifts from K. Lubin and E. Woods, as well as NIH grants (R01-CA176745 and P01-CA109901 to J.E.B.). G.E.W. was supported by an EMBO long-term fellowship. D.L.B. is a Merck Fellow of the Damon Runyon Cancer Research Foundation (DRG-2196-14). N.E.S. is supported by a Pathway to Independence Award (R00-HG008171) from the NHGRI.
Author Contributions M.A.E. performed experiments and analysed data. G.E.W. designed plasmids for the dTAG system with J.M.R. and performed CRISPR–Cas9 screens collaboratively with N.E.S., O.S. and F.Z. T.G.S. assisted cellular assays. B.E.L., H.X. and S.H.O. performed experiments on HSPCs. J.P., H.-S.S., N.K.O.-A. and S.D.-P. performed protein biochemistry. A.S. performed mouse experiments. S.D. and D.L.B. designed and synthesized dTAG molecules. B.N. assisted in sgRNA validation. R.Z. assisted in exon-scanning CRISPR–Cas9. M.A.E., G.E.W. and J.E.B. designed the experimental strategy and wrote the manuscript.
Author Information Reprints and permissions information is available at www.nature.com/reprints. The authors declare competing financial interests: details are available in the online version of the paper. Readers are welcome to comment on the online version of the paper. Correspondence and requests for materials should be addressed to J.E.B. ([email protected]).
© 2017 Macmillan Publishers Limited, part of Springer Nature. All rights reserved.

LETTERRESEARCH
Extended Data Figure 1 | ENL, but not AF9, is required for growth of acute leukaemia. a, Summary of CRISPR–Cas9 knockout screen results in MV4;11 cells showing the number of hits (NES < 0.1 and P < 0.05 in both replicates) and the percentage of hits known to be essential genes. Right, top 15 hits in essential and non-essential protein-coding genes. b, Immunoblot of ENL 5 days after transduction with the indicated sgRNA. c, Immunoblot of FLT3 5 days after transduction with the indicated sgRNA. d, Competition-based CRISPR–Cas9 mutagenesis in
MV4;11-Cas9 cells. Percentage GFP+ subpopulation (sgRNA+) after transduction with lentiviral constructs co-expressing GFP and the sgRNA indicated. Mean ± s.d., n = 3. e, ENL protein expression by immunoblot of all cell lines tested for ENL-dependent growth. f–j, As in d but for the cell lines and sgRNAs indicated. k, Indel quantification by TIDE (tracking of indels by sequence trace decomposition) analysis 5 days after transduction with the sgRNA indicated in MV4;11-Cas9 cells. l, As in d for the cell lines and sgRNAs indicated, n = 4 for MV4;11, n = 3 for MOLM-13.
© 2017 Macmillan Publishers Limited, part of Springer Nature. All rights reserved.
LETTER RESEARCH
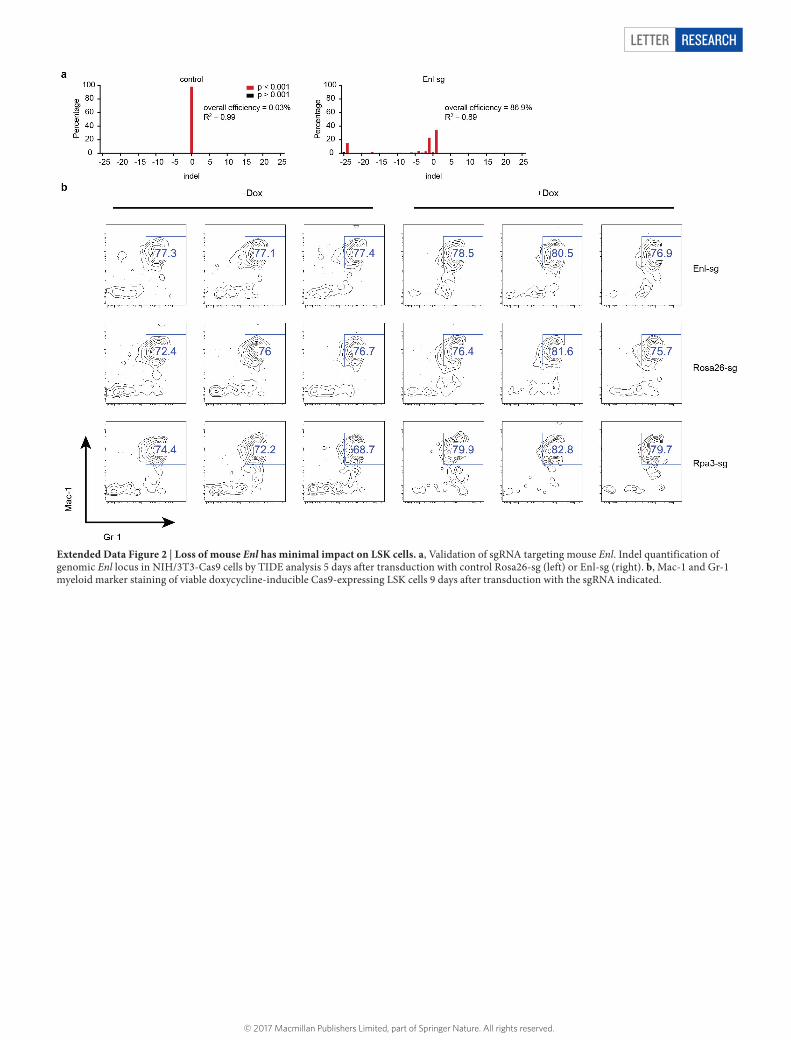
Extended Data Figure 2 | Loss of mouse Enl has minimal impact on LSK cells. a, Validation of sgRNA targeting mouse Enl. Indel quantification of genomic Enl locus in NIH/3T3-Cas9 cells by TIDE analysis 5 days after transduction with control Rosa26-sg (left) or Enl-sg (right). b, Mac-1 and Gr-1 myeloid marker staining of viable doxycycline-inducible Cas9-expressing LSK cells 9 days after transduction with the sgRNA indicated.
© 2017 Macmillan Publishers Limited, part of Springer Nature. All rights reserved.

LETTERRESEARCH
Extended Data Figure 3 | Characterization of dTAG-ENL system. a, Chemical structure of dTAG-7. b, Dose-responsive FKBP12(F36V)-ENL degradation detected by immunoblot after 16 h treatment of MV4;11 (Cas9+, ENL-FKBP12(F36V)–HA-ENL+) cells with DMSO (−) or dTAG-7 at the indicated concentration. c, As in b, but with dTAG-13. d, Immunoblot detection of ENL-FKBP12(F36V) degradation in MV4;11 (Cas9+, ENL-FKBP12(F36V)–HA+) after 16 h. e, Kinetic evaluation of FKBP12(F36V)-ENL degradation by dTAG-7 (500 nM) in MV4;11
(Cas9+, FKBP12(F36V)–HA-ENL+) cells. f, Degradation of ENL-FKBP12(F36V) in MOLM-13 cells after a 4-h treatment of ENL-FKBP12(F36V)-expressing cells with dTAG-13 (500 nM). g, As in f, but with NOMO-1 cells expressing ENL-FKBP12(F36V). h, As in f, but with JURKAT cells expressing ENL-FKBP12(F36V). i, Long-term kinetic evaluation of ENL-FKBP12(F36V) degradation by a single dose of dTAG-7 (500 nM) in MV4;11 (Cas9+, ENL-FKBP12(F36V)–HA+) cells. j, As in i, but with dTAG-13 (500 nM).
© 2017 Macmillan Publishers Limited, part of Springer Nature. All rights reserved.

LETTER RESEARCH
Extended Data Figure 4 | Response to dTAG-7 and dTAG-13. a, CRISPR–Cas9 knockout of endogenous ENL in MV4;11 (Cas9+, ENL-FKBP12(F36V)–HA+) cells. ENL/HA immunoblot in MV4;11 (Cas9+, ENL-FKBP12(F36V)–HA+) (P, parental) and MV4;11 (Cas9+, ENL-FKBP12(F36V)–HA+, ENL−/−) cells. b, CRISPR–Cas9 knockout of endogenous ENL in MV4;11 (Cas9+, FKBP12(F36V)–HA-ENL+) cells. c, DMSO-normalized cellular viability of MV4;11 (Cas9+, ENL-FKBP12(F36V)–HA+, ENL−/−) cells after 72-h treatment with dTAG-13 approximated by ATP-lite assay. Mean ± s.d., n = 4. d, DMSO-normalized
cellular viability of MV4;11 (Cas9+, FKBP12(F36V)–HA-ENL+, ENL−/−) cells after 72-h treatment with dTAG-7 or dTAG-13 approximated by ATP-lite assay. Mean ± s.d., n = 4. e, Growth over time of MV4;11 (Cas9+, ENL-FKBP12(F36V)–HA+, ENL−/−) cells treated with DMSO or dTAG-13 (500 nM). Total number of viable cells as approximated by trypan blue exclusion is plotted over time. Mean ± s.d., n = 3. f, g, As in e, but with cell line indicated at top. h, As in d, but with wild-type MV4;11 cells. i, Representative plots of BrdU incorporation used for cell cycle analysis shown in Fig. 2f.
© 2017 Macmillan Publishers Limited, part of Springer Nature. All rights reserved.
LETTERRESEARCH
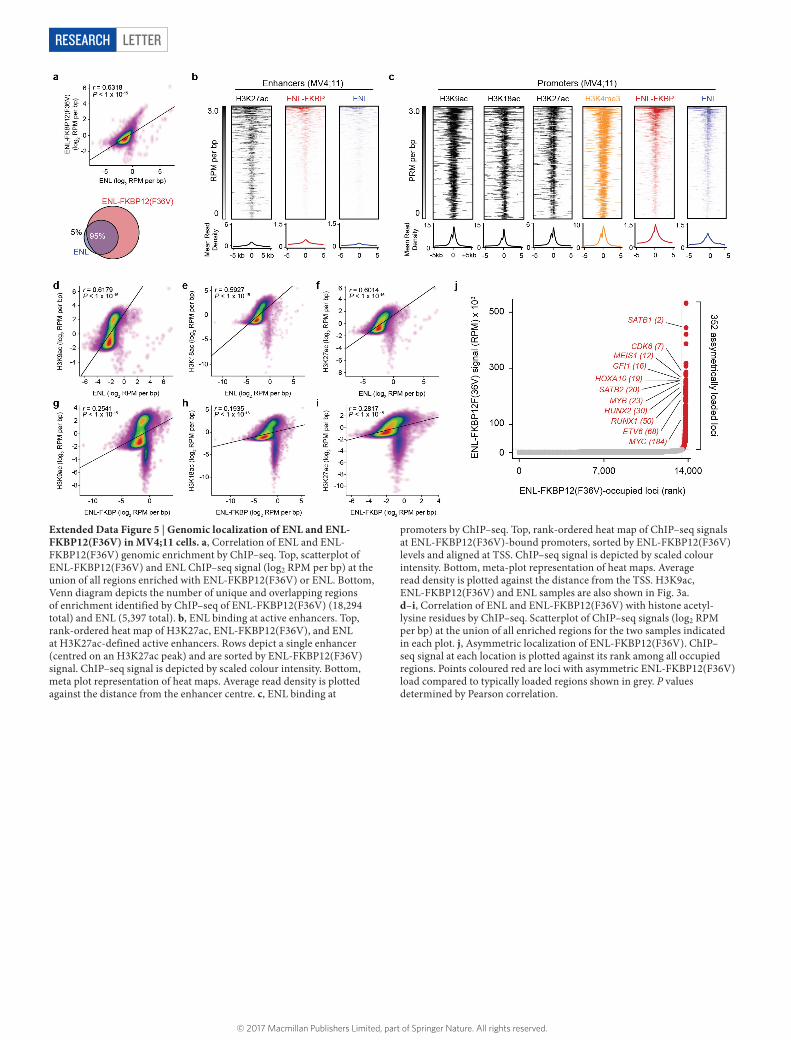
Extended Data Figure 5 | Genomic localization of ENL and ENL-FKBP12(F36V) in MV4;11 cells. a, Correlation of ENL and ENL-FKBP12(F36V) genomic enrichment by ChIP–seq. Top, scatterplot of ENL-FKBP12(F36V) and ENL ChIP–seq signal (log2 RPM per bp) at the union of all regions enriched with ENL-FKBP12(F36V) or ENL. Bottom, Venn diagram depicts the number of unique and overlapping regions of enrichment identified by ChIP–seq of ENL-FKBP12(F36V) (18,294 total) and ENL (5,397 total). b, ENL binding at active enhancers. Top, rank-ordered heat map of H3K27ac, ENL-FKBP12(F36V), and ENL at H3K27ac-defined active enhancers. Rows depict a single enhancer (centred on an H3K27ac peak) and are sorted by ENL-FKBP12(F36V) signal. ChIP–seq signal is depicted by scaled colour intensity. Bottom, meta plot representation of heat maps. Average read density is plotted against the distance from the enhancer centre. c, ENL binding at
promoters by ChIP–seq. Top, rank-ordered heat map of ChIP–seq signals at ENL-FKBP12(F36V)-bound promoters, sorted by ENL-FKBP12(F36V) levels and aligned at TSS. ChIP–seq signal is depicted by scaled colour intensity. Bottom, meta-plot representation of heat maps. Average read density is plotted against the distance from the TSS. H3K9ac, ENL-FKBP12(F36V) and ENL samples are also shown in Fig. 3a. d–i, Correlation of ENL and ENL-FKBP12(F36V) with histone acetyl-lysine residues by ChIP–seq. Scatterplot of ChIP–seq signals (log2 RPM per bp) at the union of all enriched regions for the two samples indicated in each plot. j, Asymmetric localization of ENL-FKBP12(F36V). ChIP–seq signal at each location is plotted against its rank among all occupied regions. Points coloured red are loci with asymmetric ENL-FKBP12(F36V) load compared to typically loaded regions shown in grey. P values determined by Pearson correlation.
© 2017 Macmillan Publishers Limited, part of Springer Nature. All rights reserved.

LETTER RESEARCH
Extended Data Figure 6 | Genomic localization of ENL in MOLM-13 cells. a, ENL binding at enhancers and promoters. Top, mean H3K27ac and ENL ChIP–seq signal across all H3K27ac-defined active enhancers in MOLM-13 cells. Average read density is plotted against the distance from the enhancer centre. Bottom, mean H3K27ac and ENL ChIP–seq signal at ENL-bound TSS regions in MOLM-13 cells. Average read density is plotted against the distance from the TSS. Dataset for H3K27ac was obtained from GEO accession GSM1652920. b, Correlation of H3K27ac and ENL genomic enrichment by ChIP–seq. Scatterplot of H3K27ac and
ENL ChIP–seq signal at the union of all H3K27ac and ENL enriched regions genome-wide. P value determined by Pearson correlation. c, Asymmetric localization of ENL in MOLM-13 cells. ChIP–seq signal at each location is plotted against its rank among all occupied regions. Points coloured red are loci with asymmetric ENL load compared to typically loaded regions shown in grey. d, Gene tracks of ChIP–seq signal at examples of asymmetrically (MYB) and typically enriched (ACTB) ENL target genes.
© 2017 Macmillan Publishers Limited, part of Springer Nature. All rights reserved.

LETTERRESEARCH
Extended Data Figure 7 | Loss of ENL disrupts SEC recruitment and activity. a, Boxplot of DMSO-normalized fold changes in gene expression of typically enriched (grey) and asymmetrically enriched (red) ENL-FKBP12(F36V) target genes with dTAG-13 (500 nM) treatment. P values from Welch’s two-tailed t-test. b, c, Gene set enrichment analysis (GSEA) of DMSO-normalized gene-expression changes with 8 h dTAG-13 (500 nM) treatment compared to the set of asymmetrically loaded ENL (b) and ENL-FKBP12(F36V) (c) target genes. d, Boxplots of change in RNA Pol II ChIP–Rx signal (RRPM) at TSS and gene-body regions of typically enriched (grey) and asymmetrically enriched (red) ENL-FKBP12(F36V) target genes after 24 h dTAG-13 (500 nM) treatment. P values from Welch’s two-tailed t-test. e, Cumulative distribution plot of RNA Pol II travelling
ratio at asymmetrically loaded ENL (left) and ENL-FKBP12(F36V) (right) target genes determined by RNA Pol II ChIP–Rx after 24 h DMSO or dTAG-13 (500 nM) treatment. f, Waterfall plot (left) and boxplot (right) of change in AFF4 ChIP–Rx signal (RRPM) at promoters (TSS ± 5 kb) of ENL-FKBP12(F36V) target genes (typically enriched in grey, asymmetrically enriched in red) after 6 h dTAG-13 treatment (500 nM). P value from Welch’s two-tailed t-test. g, As in f, but for CDK9. h, Meta-gene representations of Pol II S2P ChIP–Rx signal at ENL and ENL-FKBP12(F36V) target genes after 24 h dTAG-13 (500 nM) treatment. i, Gene tracks of ChIP–seq signal at an example of an asymmetrically enriched ENL target gene, MEIS1.
© 2017 Macmillan Publishers Limited, part of Springer Nature. All rights reserved.

LETTER RESEARCH
Extended Data Figure 8 | Comparison of MV4;11 response to ENL degradation and DOT1L inhibition. a, Immunoblot for H3K79me2 after 96 h DMSO, dTAG-13 (500 nM), or EPZ-5676 (500 nM) treatment. Bottom, semi-quantitative representation of H3-normalized H3K79me2 signal as a percentage of DMSO treatment. b, Gene track view of H3K79me2 ChIP–seq signal at examples of ENL target genes (asymmetric load: MYB and MEIS1; typical load: ACTB) after 96 h DMSO or dTAG13 (500 nM) treatment. c, Meta gene representation of H3K79me2 ChIP–seq mean read density at typically loaded (left) and asymmetrically loaded (right) ENL target genes. d, Kinetic comparison of dTAG-13 (500 nM) and EPZ-5676 (500 nM) on gene expression changes in MV4;11 (Cas9+, ENL-FKBP12(F36V)–HA+, ENL−/−) cells. Gene expression quantified by quantitative PCR with reverse transcription (qRT–PCR) (ΔΔCt method). Student’s t-tests comparing DMSO to EPZ-5676 and dTAG-13 are in grey and red, respectively. Mean ± s.d., triplicate PCR analysis. e, Cell cycle analysis via propidium iodide staining of MV4;11 (Cas9+, ENL-FKBP12(F36V)–HA+, ENL−/−) cells treated with DMSO, dTAG-13
(500 nM), or EPZ-5676 (500 nM). Percentage of G1 cells were compared by two-tailed t-tests. Mean ± s.d., n = 3. f, Gene expression changes in MV4;11 (Cas9+, ENL-FKBP12(F36V)–HA+, ENL−/−) cells with combination treatments of dTAG-13 (500 nM) and EPZ-5676 (500 nM). Gene expression quantified by qRT–PCR (ΔΔCt method). P values by Student’s t-test. Mean ± s.d., triplicate PCR analysis. g, Overlap analysis of published MLL-AF4 target genes and asymmetrically loaded ENL or ENL-FKBP12 target genes. h, Heat map of DMSO-normalized fold changes in gene expression caused by dTAG-13 (500 nM) or EPZ-5676 (500 nM) treatment for the indicated amount of time. Raw expression values determined by RNA-seq were cell-count-normalized by spike-in of synthetic ERCC RNA standards. dTAG-13 data are redundant with data shown in Fig. 2g. i, GSEA of DMSO-normalized gene-expression changes with dTAG-13 (500 nM) or EPZ-5676 (500 nM) treatment compared to MLL-AF4 target genes. *P < 0.05, **P < 0.01, ***P < 0.001, ****P < 0.0001. Not significant (n.s.) P > 0.05.
© 2017 Macmillan Publishers Limited, part of Springer Nature. All rights reserved.

LETTERRESEARCH
Extended Data Figure 9 | Characterization of ENL YEATS mutations. a, Sequence alignment of AF9 and ENL YEATS domains. Identical residues are highlighted in grey. Two of these residues are coloured red to denote sites in in which mutations were engineered into ENL for interrogation of YEATS function. b, Histone peptide microarray probed with lysates from 293T cells overexpressing full-length wild-type ENL, or mutants F47A or Y78A, with a 3×HA epitope tag. Select residues known to be YEATS-domain substrates and showing YEATS-domain-dependent signals have been boxed in red, blue or orange. Several other spots showed high signal, but not enriched over the corresponding unmodified peptide, and not YEATS-dependent. These have not been boxed in. c, Quantification of histone peptide microarray spots containing H3K18ac or H3K27ac after probing with cellular lysates from 293T cells overexpressing wild-type or mutant 3×HA–ENL. Mean ± s.d., n = 2.
d, Isothermal titration calorimetry (ITC) measurements showing wild-type ENL bound to H34–10K9ac in a 1:0.943 stoichiometry with binding affinity (dissociation constant, Kd) of 30.1 μM. Interaction was not detected with ENL Y78A. e, Subcellular localization of ENL. MV4;11 cells stably expressing 3×HA–ENL (wild-type, F47A or Y78A) were fractionated and probed by immunoblot. Cy, cytoplasm; N nucleoplasm; Ch, chromatin. f, Thermal stability of ENL in cells. MV4;11 cells stably expressing 3×HA–ENL (wild-type, F47A or Y78A) were heated to the indicated temperature to induce irreversible aggregation. Remaining soluble protein was isolated and probed by immunoblot. g, Quantification of band intensity in e showing the temperature of aggregation (Tagg). h, Immunoblot to determine expression level of exogenously expressed ENL constructs used for rescue and ChIP–qPCR experiments.
© 2017 Macmillan Publishers Limited, part of Springer Nature. All rights reserved.