Transcription and imprinting dynamics in developing...
14
RESOURCE/METHODOLOGY Transcription and imprinting dynamics in developing postnatal male germline stem cells Saher Sue Hammoud, 1,2,3,4,14 Diana H.P. Low, 5,14 Chongil Yi, 1,2,3 Chee Leng Lee, 5 Jon M. Oatley, 6 Christopher J. Payne, 7,8,9 Douglas T. Carrell, 10,11,12 Ernesto Guccione, 5,13 and Bradley R. Cairns 1,2,3 1 Howard Hughes Medical Institute, 2 Department of Oncological Sciences, 3 Huntsman Cancer Institute, University of Utah School of Medicine, Salt Lake City, Utah 84112, USA; 4 Department of Human Genetics, University of Michigan, Ann Arbor, Michigan 48109, USA; 5 Division of Cancer Genetics and Therapeutics, Institute of Molecular and Cell Biology (IMCB), A ∗ STAR (Agency for Science, Technology, and Research), Singapore 138673, Singapore; 6 Center for Reproductive Biology, School of Molecular Biosciences, Washington State University, Pullman, Washington 99164, USA; 7 Department of Pediatrics, 8 Department of Obstetrics and Gynecology, Northwestern University Feinberg School of Medicine, Chicago, Illinois 60611, USA; 9 Human Molecular Genetics Program, Ann and Robert H. Lurie Children’s Hospital of Chicago, Chicago, Illinois 60614, USA; 10 Department of Surgery (Urology), 11 Department of Obstetrics and Gynecology, 12 Department of Human Genetics, University of Utah School of Medicine, Salt Lake City, Utah 84112, USA; 13 Department of Biochemistry, Yong Loo Lin School of Medicine, National University of Singapore, Singapore 117597, Singapore Postnatal spermatogonial stem cells (SSCs) progress through proliferative and developmental stages to populate the testicular niche prior to productive spermatogenesis. To better understand, we conducted extensive genomic pro- filing at multiple postnatal stages on subpopulations enriched for particular markers (THY1, KIT, OCT4, ID4, or GFRa1). Overall, our profiles suggest three broad populations of spermatogonia in juveniles: (1) epithelial-like spermatogonia (THY1 + ; high OCT4, ID4, and GFRa1), (2) more abundant mesenchymal-like spermatogonia (THY1 + ; moderate OCT4 and ID4; high mesenchymal markers), and (3) (in older juveniles) abundant spermatogonia com- mitting to gametogenesis (high KIT + ). Epithelial-like spermatogonia displayed the expected imprinting patterns, but, surprisingly, mesenchymal-like spermatogonia lacked imprinting specifically at paternally imprinted loci but fully restored imprinting prior to puberty. Furthermore, mesenchymal-like spermatogonia also displayed develop- mentally linked DNA demethylation at meiotic genes and also at certain monoallelic neural genes (e.g., protocad- herins and olfactory receptors). We also reveal novel candidate receptor–ligand networks involving SSCs and the developing niche. Taken together, neonates/juveniles contain heterogeneous epithelial-like or mesenchymal-like spermatogonial populations, with the latter displaying extensive DNA methylation/chromatin dynamics. We speculate that this plasticity helps SSCs proliferate and migrate within the developing seminiferous tubule, with proper niche interaction and membrane attachment reverting mesenchymal-like spermatogonial subtype cells back to an epithelial-like state with normal imprinting profiles. [Keywords: germline; stem cells; imprinting; spermatogonia; DNA methylation; monoallelic] Supplemental material is available for this article. Received March 11, 2015; revised version accepted October 7, 2015. The pool of spermatogonial stem cells (SSCs), which en- sures male fertility throughout adult life, is established early after birth by prospermatogonia (gonocytes). The pre- cursors of prospermatogonia, the primordial germ cells (PGCs), originate at 5.5 d post-coitum (dpc) in mice (Ohinata et al. 2009). During their migration toward the gonads, PGCs undergo a global DNA demethylation (which includes complete erasure of parental imprints) 14 These authors contributed equally to this work. Corresponding authors: [email protected], [email protected] .edu.sg, [email protected] Article is online at http://www.genesdev.org/cgi/doi/10.1101/gad.261925. 115. © 2015 Hammoud et al. This article is distributed exclusively by Cold Spring Harbor Laboratory Press for the first six months after the full-issue publication date (see http://genesdev.cshlp.org/site/misc/terms.xhtml). After six months, it is available under a Creative Commons License (Attri- bution-NonCommercial 4.0 International), as described at http:// creativecommons.org/licenses/by-nc/4.0/. 2312 GENES & DEVELOPMENT 29:2312–2324 Published by Cold Spring Harbor Laboratory Press; ISSN 0890-9369/15; www.genesdev.org Cold Spring Harbor Laboratory Press on November 29, 2016 - Published by genesdev.cshlp.org Downloaded from
Transcript of Transcription and imprinting dynamics in developing...

RESOURCE/METHODOLOGY
Transcription and imprinting dynamicsin developing postnatal male germlinestem cellsSaher Sue Hammoud,1,2,3,4,14 Diana H.P. Low,5,14 Chongil Yi,1,2,3 Chee Leng Lee,5 Jon M. Oatley,6
Christopher J. Payne,7,8,9 Douglas T. Carrell,10,11,12 Ernesto Guccione,5,13 and Bradley R. Cairns1,2,3
1HowardHughesMedical Institute, 2Department of Oncological Sciences, 3HuntsmanCancer Institute, University of Utah Schoolof Medicine, Salt Lake City, Utah 84112, USA; 4Department of Human Genetics, University of Michigan, Ann Arbor, Michigan48109, USA; 5Division of Cancer Genetics and Therapeutics, Institute of Molecular and Cell Biology (IMCB), A∗STAR (Agency forScience, Technology, and Research), Singapore 138673, Singapore; 6Center for Reproductive Biology, School of MolecularBiosciences, Washington State University, Pullman, Washington 99164, USA; 7Department of Pediatrics, 8Department ofObstetrics and Gynecology, Northwestern University Feinberg School of Medicine, Chicago, Illinois 60611, USA; 9HumanMolecularGenetics Program,Ann andRobertH. LurieChildren’sHospital of Chicago, Chicago, Illinois 60614,USA; 10Departmentof Surgery (Urology), 11Department of Obstetrics and Gynecology, 12Department of HumanGenetics, University of Utah School ofMedicine, Salt Lake City, Utah 84112, USA; 13Department of Biochemistry, Yong Loo Lin School ofMedicine, National Universityof Singapore, Singapore 117597, Singapore
Postnatal spermatogonial stem cells (SSCs) progress through proliferative and developmental stages to populate thetesticular niche prior to productive spermatogenesis. To better understand, we conducted extensive genomic pro-filing at multiple postnatal stages on subpopulations enriched for particular markers (THY1, KIT, OCT4, ID4, orGFRa1). Overall, our profiles suggest three broad populations of spermatogonia in juveniles: (1) epithelial-likespermatogonia (THY1+; highOCT4, ID4, andGFRa1), (2) more abundantmesenchymal-like spermatogonia (THY1+;moderate OCT4 and ID4; high mesenchymal markers), and (3) (in older juveniles) abundant spermatogonia com-mitting to gametogenesis (high KIT+). Epithelial-like spermatogonia displayed the expected imprinting patterns,but, surprisingly, mesenchymal-like spermatogonia lacked imprinting specifically at paternally imprinted loci butfully restored imprinting prior to puberty. Furthermore, mesenchymal-like spermatogonia also displayed develop-mentally linked DNA demethylation at meiotic genes and also at certain monoallelic neural genes (e.g., protocad-herins and olfactory receptors). We also reveal novel candidate receptor–ligand networks involving SSCs and thedeveloping niche. Taken together, neonates/juveniles contain heterogeneous epithelial-like or mesenchymal-likespermatogonial populations, with the latter displaying extensive DNA methylation/chromatin dynamics. Wespeculate that this plasticity helps SSCs proliferate and migrate within the developing seminiferous tubule, withproper niche interaction andmembrane attachment revertingmesenchymal-like spermatogonial subtype cells backto an epithelial-like state with normal imprinting profiles.
[Keywords: germline; stem cells; imprinting; spermatogonia; DNA methylation; monoallelic]
Supplemental material is available for this article.
Received March 11, 2015; revised version accepted October 7, 2015.
The pool of spermatogonial stem cells (SSCs), which en-sures male fertility throughout adult life, is establishedearly after birth byprospermatogonia (gonocytes). Thepre-cursors of prospermatogonia, the primordial germ cells
(PGCs), originate at 5.5 d post-coitum (dpc) in mice(Ohinata et al. 2009). During their migration towardthe gonads, PGCs undergo a global DNA demethylation(which includes complete erasure of parental imprints)
14These authors contributed equally to this work.Corresponding authors: [email protected], [email protected], [email protected] is online at http://www.genesdev.org/cgi/doi/10.1101/gad.261925.115.
© 2015 Hammoud et al. This article is distributed exclusively by ColdSpring Harbor Laboratory Press for the first six months after the full-issuepublication date (see http://genesdev.cshlp.org/site/misc/terms.xhtml).After sixmonths, it is available under a Creative Commons License (Attri-bution-NonCommercial 4.0 International), as described at http://creativecommons.org/licenses/by-nc/4.0/.
2312 GENES & DEVELOPMENT 29:2312–2324 Published by Cold Spring Harbor Laboratory Press; ISSN 0890-9369/15; www.genesdev.org
Cold Spring Harbor Laboratory Press on November 29, 2016 - Published by genesdev.cshlp.orgDownloaded from

(Seki et al. 2005; Dawlaty et al. 2011; Hackett et al. 2012,2013; Seisenberger et al. 2012) by both active and passivemechanisms (Seki et al. 2005; Dawlaty et al. 2011; Hack-ett et al. 2012, 2013; Seisenberger et al. 2012; Ohno et al.2013). Subsequently (between embryonic day 13.5 [E13.5]and E16.5), DNA methylation (DNAme) is gradually re-stored, and both maternal- and paternal-specific imprintsare thought to be fully established by birth in the maleprospermatogonia.At birth, these prospermatogonia are mitotically arrest-
ed but start cycling at postnatal days 1–2 (P1–P2) (Culty2009). During the subsequentweek (P3–P10), cycling sper-matogonia proliferate and populate the seminiferous tu-bule; here, a portion gives rise to the self-renewing SSCs,and the remainder proceeds to differentiation (becominghighly KIT+) without self renewal, originating the firstwave of spermatogenesis (Kluin and de Rooij 1981; Yosh-ida et al. 2006), or instead commits apoptosis. This phaseof germ cell development is therefore crucial to initiateand maintain male fertility throughout adult life.Following puberty, adult SSCs either self-renew (form-
ing two single unpaired cells [As]) or divide into pairedcells (Apr) connected by an intracellular cytoplasmicbridge. This is the first step toward differentiation, whichculminates in the production of mature sperm (Hess andRenato de Franca 2008). These sequential transitions co-incide with global changes in the epigenome (Khalilet al. 2004; Delaval et al. 2007; Oakes et al. 2007; Turner2007; Soumillon et al. 2013; Hammoud et al. 2014), whichsimultaneously reflect the cellular developmental path,its current transcriptional program, and its future com-mitment to differentiate.We provide here an in-depth epigenomic and tran-
scriptomic analysis of male germline development thatsuggests three broad SSC populations in juveniles: epithe-lial-like cells, mesenchymal-like cells, and cells commit-ting to gametogenesis, which were defined by differentsignatures related to known SSC markers, cell adhesion/migration markers, and SSC differentiation markers. Wealso reveal novel candidate receptor–ligand networks in-volving SSCs and the niche. Curiously, we reveal novelandunexpectedDNAme/imprintingdynamics in themes-enchymal-like population. Together, this study and datasets provide foundational new information about sperma-togonial cell development.
Results
Genomic profiling of developing SSCs
THY1 and KIT are useful markers for distinguishing self-renewing/transplantable SSCs (THY1+-enriched) fromnontransplantable cells committing to gametogenesis/meiosis (KIT+-enriched) (Kubota et al. 2004; Oatley et al.2009;Hammoudet al. 2014).Althoughproportions changeduring postnatal development, a combination of immu-nostaining and FACS analyses (at P7, for example) revealsthat most postnatal cells are KIT+ (∼50%–60%), a some-what smaller proportion is THY1+ (30%–40%), and∼10%–20% of cells appear both KIT+ and THY1+ (data
not shown). To examine THY1+- or KIT+-enriched cells,we initially implemented antibody-based magnetic cellsorting (MACS) from the testes of newborn (P0; THY1+-only) or juvenile (P7, P12, and P14; THY1+, KIT+, or com-bined GFRa1+ and THY1+) mice (Fig. 1A; SupplementalFig. 1A). THY1+ selections provide a population enrichedfor cells yielding successful transplantation or culturing.Here, our MACS procedure provided a population thatwas ∼86% positive for PLZF (Supplemental Fig. 1C) butstill heterogeneous forotherSSCmarkers, promptingaddi-tional isolations of less abundant subpopulations such asthose with high OCT4, GFRa1, or ID4, as they may bemore stem-like (Chan et al. 2014). These isolations in-volved fluorescence-activated cell sorting (FACS) and iso-lation of high-GFP+ cells from newborn (P0) transgenicanimals (Oct4-GFP) (Yoshimizu et al. 1999) and P7 trans-genic animals (Oct4-GFP and Id4-GFP). Here, we notethat GFP+ cells from Oct4-GFP transgenics representonly a subset of the total OCT4+ cells (by immunohisto-chemistry) in postnatal SSCs, typically with the highestOCT4 (Supplemental Fig. 1B). We also isolated the high-VASA (high-GFP+) spermatogonia atP0andP7.Wetypical-ly isolated two biological replicates of each sample type,which were processed separately. We note that althoughMACS and FACS highly enrich, they do not fully purifycell populations; however, we chose stringent parametersto gate FACS populations, isolating only cells with rela-tively high levels of GFP (see the Materials and Methods).Transcriptional profiling involved strand-specific RNA
sequencing (RNA-seq) of total RNA from biologicalreplicates, whereas DNAme analyses involved whole-genome bisulfite sequencing (WGBS) using 101-base-pair(bp) paired-end reads and, typically, >20× genome coverage(for statistics and replicates, see Supplemental Table 1).To enable comparisons, we reprocessed published datafrom embryonic stem cells (ESCs) and PGCs (Stadleret al. 2011; Seisenberger et al. 2012). We also comparedwith our prior data sets of “AGSCs,” which are referredto here as “adult SSCs” to better align with the field no-menclature. Our profiling of 5hmC and histone modifica-tions in germ cells used standard methods and werecompared with existing ESC and/or PGC data sets (Mik-kelsen et al. 2007; Ng et al. 2013).
Overall comparisons of postnatal spermatogonia
To compare overall profiles, we employed multidimen-sional scaling (MDS) (Fig. 1B) as well as pairwise compar-isons (Fig. 1C). The MDS profiles reveal three groups:PGCs, postnatal spermatogonia/SSCs, and adult SSCs.The heterogeneous postnatal SSC stages form a relativelybroad region in the MDS plot, requiring further analyses(correlation plots, clustering, and gene set analyses) todefine their similarities and differences. As KIT+ cellsshowgreatly reduced transplantation,wefocusedourcom-parisons on the highly transplantable SSC populations(THY1+, ID4+, and OCT4+); KIT+ comparisons are provid-ed in the Supplemental Figures and Data Sets, with onlythe most notable features highlighted in the main text.Our data sets can be compared in multiple ways, and we
Transcriptome/methylome profiling of spermatogonia
GENES & DEVELOPMENT 2313
Cold Spring Harbor Laboratory Press on November 29, 2016 - Published by genesdev.cshlp.orgDownloaded from

PGCMigration
Birth
ProSpermatogonia P7 - SSC P12/14 - SSCNiche
(Sertoli cells)
Puberty
Adult SSC & Prog.Niche
(Sertoli and Leydig cells)Transcriptomes
MethylomesChromatin
PGCSpecification
Chromatin
Seminiferous Tubule (ST)A
D
B C
THY1+ SSC
−1 0 1Row Z−Score
P0 P7 P12 P14 Adult
spermatogenesis
sexual reproductiondefense response
hematopoietic cell lineage
cell adhesionextracellular structure organization
intracellular signaling cascademetabolic processes
cell cycleDNA metabolic processes
PGC
P0 OCT4 GFP+
P0 THY1+
P7 OCT4+
P7 ID4+
P7 VASA THY1+
P7 THY1+P7 KIT+
P12 THY1+
P12 KIT+
P14 THY1+P14 KIT+Adult THY1+
Adult KIT+
−100
−50
0
50
0 100 200M1
M2
0
0.1
0.2
0.3
0.4
0.5
0.6
0.7
0.8
0.9
1
0.88
0.82
0.89
0.89
0.88
0.85
0.87
0.85
0.86
0.84
0.88
0.6
0.66
0.89
0.98
0.97
0.96
0.93
0.94
0.92
0.93
0.9
0.93
0.66
0.7
0.88
0.86
0.89
0.93
0.93
0.93
0.9
0.86
0.87
0.63
0.7
0.98
0.97
0.94
0.95
0.93
0.95
0.91
0.94
0.67
0.71
0.96
0.92
0.94
0.91
0.94
0.9
0.94
0.65
0.69
0.94
0.96
0.95
0.96
0.91
0.96
0.67
0.72
0.97
0.97
0.96
0.88
0.92
0.69
0.75
0.96
0.97
0.91
0.96
0.67
0.74
0.97
0.9
0.92
0.7
0.75
0.91
0.96
0.7
0.75
0.94
0.76
0.8
0.69
0.76 0.93
P0 THY1+
P7 THY1+
P7 KIT+
P12 THY1+
P12 KIT+
P14 THY1+
P14 KIT+
Adult THY1+
Adult KIT+
P7 OCT4+
P7 ID4+
PGC
P0 OCT4 GFP+
P7 VASATHY1+
E Core Pluripotency
0
2
4
8
Klf4
Lefty1
Nanog
Pou5f1
Prdm14Sox2
6
0
2
4
6
Bcl6bEtv5
Gfra1
Id4
Sox3
Taf4b
Zbtb16
Germ cell factors
PGC P0 P7 P12 P14 AdultPGC P0 P7 P12 P14 Adult
Tgfb3Tgfb2Tgfb1Tgfbr2Smad3Smad2Bmpr2Bmpr1aBmp7Bmp6Bmp4Bmp2Fgf1Fgf2Fgfr3Fgfr2Fgfr1LifrLifKlf4Stat3
Signaling factors for self renewal
LIF
FGF
BMP
TGFB
log2(FPKM+1)2 4 6
P0 P7 P12 P14 Adult PGC
F
log2
(FP
KM
+1)
G
Lhx1
P0
THY
1+
P7
THY
1+
P7
KIT
+
P12
TH
Y1+
P12
KIT
+
P14
TH
Y1+
P14
KIT
+
Adu
lt TH
Y1+
Adu
lt K
IT+
P7
OC
T4+
P7
ID4+
PG
C
P0
OC
T4 G
FP+
P7
VAS
ATH
Y1+
Figure 1. Transcriptional changes accompanying SSC development. (A) Graphical summary of the biology of germline stem cell speci-fication, transitions, and data sets generated in this study. (B) Multidimensional scaling (MDS) plot comparing transcriptional profiles ofPGCs, undifferentiated SSCs (THY1+, high-ID4,OCT4, or VASA), and differentiating SSCs (KIT+) fromall tested developmental stages. (C )Pairwise RNA sequencing (RNA-seq) correlationmatrix plot of all data sets generated. The color intensity and the size of the circle reflectthe correlation between the data sets. (D) RNA-seq hierarchical clustering of developing THY1+-enriched SSCs, with enriched gene on-tology terms at the right. Note that all cell purifications were performed usingMACS or FACS. (E,F ) Line plots depicting the dynamics ofgenes involved in germline THY1+ SSC maintenance or self-renewal (E) or embryonic stem cell pluripotency (F ). The X-axis is the chro-nological developmental time course, and theY-axis is log2 (FPKM [fragments per kilobase permillionmapped fragments] + 1). (G) Expres-sion heat map summarizing signaling pathways involved in self-renewal or maintenance. Scale is log2 FPKM.
Hammoud et al.
2314 GENES & DEVELOPMENT
Cold Spring Harbor Laboratory Press on November 29, 2016 - Published by genesdev.cshlp.orgDownloaded from

first addressed changes in themajority population (THY1+)over the postnatal developmental time course and notedthat high-ID4/OCT4 cells are also THY1+ (Fig. 1E) andtherefore are included within the THY1+ population.
Transcriptional dynamics of THY1+-enriched SSCsduring postnatal development
We first focused on genes with dynamic expression acrossthe THY1+-enriched spermatogonia data sets (P0–P14)(Fig. 1D; Supplemental Fig. 2A) and performed gene ontol-ogy (GO)/Kyoto Encyclopedia of Genes and Genomes(KEGG) analyses (Supplemental Table 2). Categories pro-minent at P0 include cell adhesion and morphogenesis(consistent with gonad colonization) and the piRNA sys-tem, which is active at this time (e.g., Piwil2 and Tdrd9)(SupplementalTable 2). P7 cells emphasize cell cycle/divi-sion, histone synthesis, RNA splicing, and translation,consistent with their proliferation and expansion withinthe seminiferous tubule. P12 cells experience changes inmetabolic programs and signaling pathways. Thus, GO/KEGG analysis reflects the expected developmental tran-sitions of postnatal SSCs, which are explored in pathway-and gene-specific detail below.
Developmentally regulated changesin transcription factors
We then examined developmental transcription dynam-ics in THY1+-enriched cells, choosing factors linked toprocesses of known function (or interest) in developingSSCs, and hereafter use the following FPKM (fragmentsper kilobase per million mapped fragments) scale: silent/low, <1; moderate, 2–5; high, 5–25; and very high, >25.We first examined whether factors important for PGCspecification (e.g., Blimp1/Prdm1, AP2g/Tcfap2c, Wnt3,T, and Prdm14) remain present in SSCs. Interestingly,we observed silencing of these markers between P0 andP14 (Supplemental Fig. 2B), suggesting their lack of in-volvement in maintaining a germline stem cell state.For transcription factors of known importance in SSC de-velopment, we foundZbtb16/Plzf and Bcl6b low/silent inPGCs but highly activated from P0 to P14 (Fig. 1E), Lxh1high from PGCs to P7 but silent by P12, Sox3 low to mod-erate in PGCs and at P0 but high or very high in SSCs, andEtv5 high or very high at all stages but noticeably lower inKIT+ cells.Regarding pluripotency, certain key genes are expressed
in early PGCs (e.g., Pou5f1/Oct4, Klf4, Nanog, Sox2,Lefty, and Prdm14), but a subset (e.g., Sox2 and Nanog)decline later in PGC development (Seisenberger et al.2012; Lesch et al. 2013; Sachs et al. 2013). Accordingly,we found Nanog, Lefty, and Prdm14 silent at P0 andSox2 silenced by P7 (Fig. 1F) Thus, SSCs lack many corepluripotency factors but express alternative adult stemcell factors, including noncoding RNAs (e.g., Lin28a)linked to pluripotency in postnatal SSCs (SupplementalFig. 2C), prompting further study. Although HOX familygenes are generally silent in SSCs, we found Hoxd8 andthe HOX-related Rhox1, Rhox10, and Rhox13 genes ex-
pressed at low to moderate levels in SSCs, with Rhox13peaking at P7 (Supplemental Fig. 2D). This aligns with re-cent work showing that Rhox13 is needed for progressionfrom P3 to P7 (Song et al. 2012).For proliferation, we found Myc and Mycn high in
postnatal SSC stages but low in THY1+ adult SSCs.Also, Sox3 and Sox4 are silent in adult SSCs, whereasSox5 and Sox30 are active, suggesting a possible handoff.Additional switches in transcription familymembers dur-ing development were observed for the TBX (e.g., Tbx2)and FOX (e.g., Foxj1) families, among others (Sup-plemental Table 2). Chromatin remodeling factors are of-ten needed for major developmental transitions, and thegermline also assembles and uses testis-specific histoneproteins and linker histones. Notably, SSCs pass throughdevelopmental states that employ only the Brg1-contain-ing BAF complex (neonate and adult) or only the Brm-containing BAF complex (at P7) (Supplemental Fig. 2E).Likewise for chromatin assembly factors, CAF1 complexmembers (Chaf1a/b), the testis-specific histone chaper-ones (Tspy1l/2), and other chromatin factors show cleardevelopmental specificity (Supplemental Fig. 2E). Finally,we examined expression dynamics of the ZNF-KRABfamily of proteins, which bind and repress retrotranspo-sons in the germline (Supplemental Fig. 2F; SupplementalTable 2). We found the vastmajority of ZNF-KRAB familygenes expressed during this time course and cohorts withhigher expression in PGCs, neonates, P7, or P14/adult(Supplemental Table 2); however, we did not observe clus-tering/colocation of ZNF-KRAB genes expressed at simi-lar time points. Finally, we found transcripts encodingthe adaptor/repressor protein TRIM28 (which interactswith ZNF-KRAB proteins and repressive chromatin fac-tors) extremely high throughout postnatal develop-ment (FPKM ∼250), consistent with the high levels ofZNF-KRAB partners.
Signaling pathways impacting SSCself renewal and differentiation
We then examined signaling factors of known importancein SSC biology and/or culturing. LIF enhances SSC cultur-ing and promotes STAT3 and KLF4 activity in ESCs (Hallet al. 2009). Accordingly, Stat3, Klf4, and LIF receptor(Lifr) are expressed at high levels throughout postnatalSSCs. Likewise, FGF2 is needed for SSC culturing (Ishiiet al. 2012), and most FGF receptors (e.g., Fgfr1 andFgfr3) are expressed in SSCs, but FGF2 is only expressedat P0. Regarding BMP signaling, BMP2, BMP4, andBMP6 are expressed at P0; reduced in prepubertal SSCs;and absent in adult SSCs, whereas many BMP receptorsare expressed throughout SSC development (Fig. 1G).Thus, the results for BMP and FGF suggest transitionsfrom autocrine to paracrine after P0.Gfra1 is silent in PGCs but high in prepubertal SSCs
(Fig. 1E; Supplemental Fig. 2G), and its ligand (Gdnf) islow (Supplemental Fig. 2G), consistent with known pro-duction by Sertoli cells (Meng et al. 2000; Hofmannet al. 2005). Curiously, both appeared low in THY1+ adultSSCs; however, immunostaining and Western blot
Transcriptome/methylome profiling of spermatogonia
GENES & DEVELOPMENT 2315
Cold Spring Harbor Laboratory Press on November 29, 2016 - Published by genesdev.cshlp.orgDownloaded from

analysis suggest translational control, as GFRa1 proteinwas still detected in Thy1+ SSCs (Supplemental Fig. 2H,I). Notably,Gfra2 andGfra4 (which bind neurturin prefer-ably to GDNF) were both high in THY1+ adult SSCs butnot in postnatal stages, suggesting utilization of addition-al GFRA receptor subtypes in adult SSCs (SupplementalFig. 2G–I). For theWNT pathway, canonicalWNT ligandswere absent in SSCs, whereasWNT receptors (Fzd and Lrpgenes) and transducers were expressed in SSCs (Sup-plemental Fig. 2G), suggesting a paracrine mechanism.Notably, only neonates expressed noncanonical WNT re-ceptors at moderate levels (e.g., Ror1/2), whereas all SSCstages expressed high Ryk. For RAS signaling, we foundHras, Rras, Rras2, and Nras all moderately to highly ex-pressed in SSCs (Supplemental Fig. 2G).
Finally, regarding differences between THY1+ and KIT+
cells along this time course, we found THY1+ SSCs andKIT+ spermatogonia quite similar at P7 (r = 0.97) (Fig. 1B,C) but developing modest and increasing differences; byP14 (r = 0.94) (Fig. 1B,C), this modest difference is domi-nated by the activation of genes for meiosis and gameto-genesis (Supplemental Table 2) and the lowering ofcertain SSC stem-like genes (e.g., Zbtb16/Plzf, Etv5) inKIT+-enriched cells, as these spermatogonia commit tothe first wave of spermatogenesis.
Features of SSC subpopulations at P7
As THY1+-enriched cells are heterogeneous, we sought tobetter understand similarities and differences among thesubpopulations. First, correlation plots (Fig. 1C) and MDSplots (Figs. 1B, 2A) show the high similarity between high-ID4 and high-OCT4 cells at P7 (r = 0.98). Furthermore,high-OCT4 cells at P0 highly resembled high-OCT4 cellsat P7 (r = 0.98), showing that high-OCT4 and high-ID4cells differ only modestly in transcriptional profiles inthese stages. However, as high-OCT4 cells (high GFP)are the minority at P0 and P7 (Supplemental Fig. 1B), wecompared them with the larger population (THY1+ and/or VASA+), which revealed moderate differences (Fig.2A), suggesting heterogeneity.
For comparison, we determined differentially expressedgenes (FPKM> 1, greater than twofold change betweenany two cell types, yielding∼4000 genes), whichwere sub-jected to clustering analyses. First, high-OCT4/ID4 cellsexpress higher levels of many of the known stem cellmarkers for SSCs (e.g., Zbtb16/Plzf and Gfra1) comparedwith the THY1+ population (Fig. 2B). High-OCT4/ID4cells also express higher levels of factors involved inDNA repair and chromatin (Fig. 2C, cluster 4). Interesting-ly, the THY1+-enriched population showed only modest
20
0
-20
-40-60 -30 300
PC
2
PC1
P7 ID4+
P7 OCT4+
P7 VASA THY1+
P7 THY1+
P7 KIT+
P7
OC
T4-G
FP+
P7
ID4-
GFP
+
P7
VAS
A T
HY
1+
P7
TH
Y1+
P7
KIT
+
A
B
D
2
4
6
P7 OCT4+ P7 ID4+ P7 VASA THY1+ P7 THY1+ P7 KIT+
log2
(FP
KM
+1)
Bcl6bEtv5Gfra1
Id4
Pax7
Pou5f1
Sox3
Taf4bZbtb16
Stem Cell Program
0.0
2.5
5.0
7.5
log2
(FP
KM
+1)
Cdh1
Cdh2Cited2
Ctgf
Tgfb2
Tgfbr1
Tgfbr2Tgfbr3
Vim
Zeb2
EMT
−1 0 1Row Z−Score
Txn factors
TFEB
HIF1ASMARCA4
SPDEFGLI1NR5A1KMT2DSMARCA4
NUPR1E2F6MITF
HSP90IPMKCCND1NFATC4
C
vasculature developmentblood vessel developmentcellular hormone metabolic processtranscription
nucleosome assemblyprotein-DNA complex assemblychromatin assembly or disassemblydefense response, inflammatory responseDNA packaging
M phase of meiotic cell cyclemeiotic cell cycle
DNA metabolic processDNA repair, response to DNA damage stimulusDNA recombination, packagingchromosome organizationnucleosome & chromatin assemblybase-excision repairprotein-DNA complex assemblypositive regulation of axonogenesischromatin assembly or disassembly
protein phosphorylationcell adhesionblood vessel morphogenesisresponse to proteinenzyme linked receptor protein signaling pathwaydeath, regulation of apoptotic processcell migration, localization of cellactin cytoskeleton organizationactin filament-based processcellular component movementregulation of growth, regulation of cell proliferationresponse to hypoxia
N.S.
GO Biological Processes
WWTR1STAT3STAT1NOTCH1RUNX1NUPR1TWIST1
AHRATF4EGR1NFKB2ETS1ARMAXNFIL3
1
2
3
4
5
6
P7 OCT4+ P7 ID4+ P7 VASA THY1+ P7 THY1+ P7 KIT+
Figure 2. Postnatal SSC subtypes can resemble stem-like ormesenchymal-like states. (A) MDS plot comparing transcriptional profiles ofSSC populations at P7. (B–D) Line plots depicting the dynamics of genes involved in SSCmaintenance self renewal (B) and epithelial–mes-enchymal transition (D). The X-axis is the chronological developmental time course, and the Y-axis is log2 (FPKM+ 1). (C ) RNA-seq heatmap of all transitioning THY1+ SSCs, with enriched GO terms at the right. Note that all cell purifications were performed using eitherFACS or MACS.
Hammoud et al.
2316 GENES & DEVELOPMENT
Cold Spring Harbor Laboratory Press on November 29, 2016 - Published by genesdev.cshlp.orgDownloaded from

reductions in stem-related genes but instead appearedmore mesenchymal, with higher levels of many key mes-enchymal markers (e.g., Zeb2 and Vimentin) (Fig. 2D),lower levels of key epithelial markers (e.g., Cdh1), andenrichment of GO categories such as cell adhesion, cellmigration, and vasculature (Fig. 2C, clusters 1 and 5), cat-egories that coenrich for mesenchymal genes. Finally,KIT+-enriched cells had lower levels of many SSC genescompared with the THY1+-enriched subtype.
SSCs display DNA hypomethylation andbivalency of developmental genes
Prior work revealed bivalent loci with underlying DNAhypomethylation at somatic developmental genes (and es-pecially developmental transcription factors) in spermand adult SSCs (Hammoud et al. 2014). To examine lociin postnatal SSCs, we performed chromatin immuno-precipitation (ChIP) experiments profiling the locationsof H3K4me3 (typically correlated with activation) andH3K27me3 (typically correlated with silencing) in P7THY1+-enriched SSCs. Here, we observed bivalent chro-matin (coincident H3K4me3 and H3K27me3) and DNAhypomethylation at the promoters of many genes impor-tant for embryo development, including Hox, Sox, Fox,Tbx, andGata family transcription factors ( e.g.,HoxA lo-cus) (Supplemental Fig. 3A,B), but not housekeepinggenes. These properties are sharedwith PGCs, ESCs, adultSSCs, and sperm (Seisenberger et al. 2012; Lesch et al.2013; Sachs et al. 2013; Hammoud et al. 2014), reinforcingthe emerging notion that this bivalent/DNA hypomethy-lation status of developmental genes might be generallypresent throughout the entire germline cycle. We notethat genes shown to be bivalent in THY1+-enrichedSSCs were likewise silent in high-OCT4/ID4 cells butwere not directly tested for bivalency here. Finally, this bi-valent/DNA hypomethylated state was also observed atP7 at the promoters or enhancers of the silent/poisedNanog, Sox2, Lefty, and Prdm14 genes, as noted previous-ly in adult SSCs (Hammoud et al. 2014).
DNAme reprogramming in THY1-enriched SSCsof genes for gametogenesis, olfactory receptors,and protocadherins (PCs)
To examine DNAme dynamics across germline develop-ment, we set thresholds for changes in CG methylation(>30% change) at either repetitive elements or gene pro-moters (2 kb, promoters centered on the transcriptionalstart site [TSS], yielding ∼3000 dynamic promoters) andperformed clustering, de novo transcription factor-bindingmotif analyses, andGO/KEGG analyses (Fig. 3A).We notethat high-ID4 profiles were omitted from Figure 3A due tolow to moderate sequencing depth, but where coveragemet thresholds, themethylation statuswas virtually iden-tical to high OCT4 (e.g., Fig. 4D; data not shown).Examination of changes in promoter DNAme (via clus-
tering) revealed considerable differences between the epi-thelial-like and stem-like high-OCT4 population and thealternative mesenchymal-like THY1+- and/or VASA-
enriched cell types. For example, within clusters 1 and 6(Fig. 3A), promoters fromTHY1+- or VASA+-enriched cellsare methylated at P0 and then progressively lose methyl-ation over the developmental time course. In contrast,these promoters in high-OCT4 cells are already hypome-thylated at P0 and remain so throughout development.Cluster 1 is highly enriched for categories of sexual repro-duction, meiosis, and gametogenesis and includes Piwil1,Sohlh2,Mael,Ctcfl, Stra8,Rad51, Sycp, and Syce (Fig. 3B).Recent studies established that meiotic genes are DNA-methylated in PGCs but fully DNA-hypomethylated inadult SSCs (and “poised” by low/moderate H3K4me3)(Hammoud et al. 2014) but had not addressed whenDNA hypomethylation occurs. Our results suggest thatthese genes are differentially DNA-methylated in thesetwo populations. Furthermore, we observed a bimodal al-lelic distribution of DNAme in THY1+- or VASA+-en-riched cells between P0 and P7, suggesting that allelesgradually (but asynchronously) convert from largelymethylated to largely unmethylated rather than synchro-nous partial/diminishing methylation (Supplemental Fig.3C). Thus, in the mesenchymal-like THY1+- or VASA+-enriched cells, meiotic gene promoters lose DNAme inadvance of their future expression in spermatocytes. Curi-ously, we found low/moderate H3K4me3 at these meioticpromoters in P7 THY1+-enriched SSCs, far prior to theirexpression in spermatocytes (data not shown), and highlevels of Tet2 and Tet3 transcripts (Supplemental Fig.4C). However, whether the presence of H3K4me3 alonedeters DNMTs or whether active DNA demethylationmachinery is used remains to be determined.Interestingly, two prominent gene families are also pre-
sent in Figure 3A clusters 1 and 6: PCs and olfactory recep-tors. Olfactory receptor genes are located either in geneclusters (e.g., on chromosomes 11, 13 and 15) or as individ-ual genes. Here, with THY1+- or VASA+-enriched cells, weobserved ∼50 olfactory receptor genes (scattered through-out the clusters) undergoingDNAdemethylation, primar-ily between P7 and P12. Specifically, both the promoterand the entire gene undergo pronouncedDNAdemethyla-tion (Fig. 3C; Supplemental Fig. 3D,E) and further acquireH3K27me3 during the round spermatid stage (Fig. 3C).Most PCs reside in one of three linked PC clusters on chro-mosome 18, termed the α, β, and γ classes (Fig. 3D–F). Atthese PC clusters, we observed striking DNA demethyla-tion focally focused at each of the separate promoters foreach variable exon (58 of 58 PC genes) (Fig. 3D–F) but gen-erally not at the dispersed PC δ class (only one of 20 genes).Regarding mechanism, we did not observe 5hmC at theseloci (data not shown). Taken together, in THY1+- orVASA+-enriched cells, a large fraction of olfactory receptorgenes and especially PCs undergo extensive DNAme/chromatin reprogrammingduringSSCdevelopment; nota-bly, these two gene families share neuronal utilization,combinatorial regulation, and knownmonoallelic expres-sion. Finally, beyond PC and olfactory receptor genes, weobserved a large number of promoters (∼500) that likewiseundergo pronounced focal DNA demethylation duringSSC development, including melanocortin receptors, cy-tokines, and interleukins.
Transcriptome/methylome profiling of spermatogonia
GENES & DEVELOPMENT 2317
Cold Spring Harbor Laboratory Press on November 29, 2016 - Published by genesdev.cshlp.orgDownloaded from
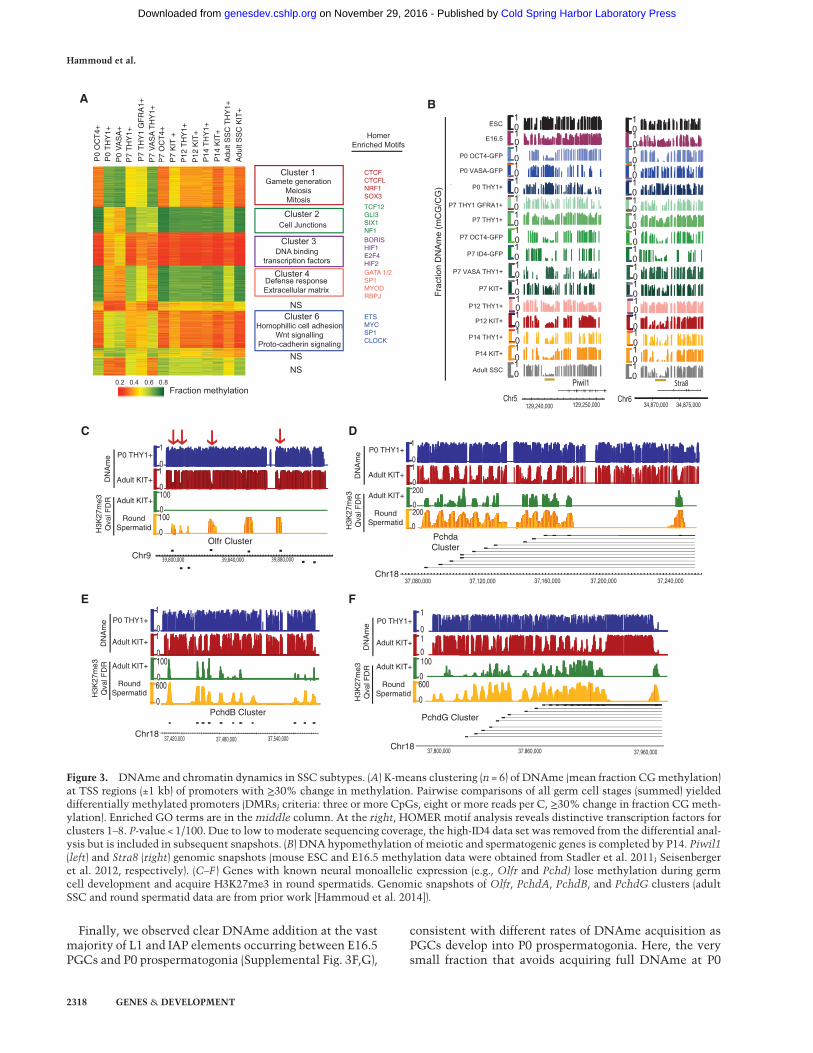
Finally, we observed clear DNAme addition at the vastmajority of L1 and IAP elements occurring between E16.5PGCs and P0 prospermatogonia (Supplemental Fig. 3F,G),
consistent with different rates of DNAme acquisition asPGCs develop into P0 prospermatogonia. Here, the verysmall fraction that avoids acquiring full DNAme at P0
AP
0 T
HY
1+
P7
TH
Y1+
P7
KIT
+
P7
TH
Y1
GF
RA
1+
P12
TH
Y1+
P12
KIT
+
Adu
lt S
SC
TH
Y1+
Adu
lt S
SC
KIT
+ B
C1
01
0
0
100
0100
39,800,000 39,840,000 39,880,000
D1
01
0
0
200
0200
37,080,000 37,120,000 37,160,000 37,200,000 37,240,000
1
01
0
0
100
0600
37,420,000 37,480,000 37,540,000
1
01
0
0
100
0600
37,800,000 37,960,00037.860,000
E F
P14
TH
Y1+
P14
KIT
+
P0 THY1+
Adult KIT+
RoundSpermatid
DN
Am
eH
3K27
me3
Qva
l FD
R
DN
Am
eH
3K27
me3
Qva
l FD
R
Olfr Cluster
Chr9
Chr18
PchdaCluster
PchdB Cluster
Chr18
DN
Am
eH
3K27
me3
Qva
l FD
R
DN
Am
eH
3K27
me3
Qva
l FD
R
PchdG Cluster
Chr18
1010101010
01
01
10
01
01
01
01
01
01
01
01
Frac
tion
DN
Am
e (m
CG
/CG
)
129,240,000 129,250,000
Piwil1
Chr5
1010101010
01
01
10
01
01
01
01
01
01
01
01
34,870,000Chr6
34,875,000
Stra8
P0
OC
T4+
P0
VA
SA
+
P7
VA
SA
TH
Y1+
P7
OC
T4+
Cluster 1Gamete generation
MeiosisMitosis
HomerEnriched Motifs
Cluster 2 Cell Junctions
Cluster 3 DNA binding
transcription factors
Defense responseExtracellular matrix
Cluster 4
Cluster 6Homophillic cell adhesion
Wnt signallingProto-cadherin signaling
NS
NSNS
CTCFCTCFLNRF1SOX3
TCF12GLI3SIX1NF1BORISHIF1E2F4HIF2GATA 1/2SP1MYODRBPJ
ETSMYCSP1CLOCK
0.2 0.4 0.6 0.8Fraction methylation
Adult KIT+
P0 THY1+
Adult KIT+
RoundSpermatid
Adult KIT+
P0 THY1+
Adult KIT+
RoundSpermatid
Adult KIT+
P0 THY1+
Adult KIT+
RoundSpermatid
Adult KIT+
ESC
E16.5
P0 OCT4-GFP
P0 VASA-GFP
P0 THY1+
P7 THY1 GFRA1+
P7 THY1+
P7 VASA THY1+
P7 KIT+
P12 THY1+
P12 KIT+
P14 THY1+
P14 KIT+
Adult SSC
P7 OCT4-GFP
P7 ID4-GFP
Figure 3. DNAme and chromatin dynamics in SSC subtypes. (A) K-means clustering (n = 6) of DNAme (mean fraction CGmethylation)at TSS regions (±1 kb) of promoters with ≥30% change in methylation. Pairwise comparisons of all germ cell stages (summed) yieldeddifferentially methylated promoters (DMRs; criteria: three or more CpGs, eight or more reads per C, ≥30% change in fraction CG meth-ylation). Enriched GO terms are in the middle column. At the right, HOMER motif analysis reveals distinctive transcription factors forclusters 1–8. P-value < 1/100. Due to low to moderate sequencing coverage, the high-ID4 data set was removed from the differential anal-ysis but is included in subsequent snapshots. (B) DNA hypomethylation of meiotic and spermatogenic genes is completed by P14. Piwil1(left) and Stra8 (right) genomic snapshots (mouse ESC and E16.5 methylation data were obtained from Stadler et al. 2011; Seisenbergeret al. 2012, respectively). (C–F ) Genes with known neural monoallelic expression (e.g., Olfr and Pchd) lose methylation during germcell development and acquire H3K27me3 in round spermatids. Genomic snapshots of Olfr, PchdA, PchdB, and PchdG clusters (adultSSC and round spermatid data are from prior work [Hammoud et al. 2014]).
Hammoud et al.
2318 GENES & DEVELOPMENT
Cold Spring Harbor Laboratory Press on November 29, 2016 - Published by genesdev.cshlp.orgDownloaded from

(or remains unmethylated throughout germline develop-ment) is found in intergenic regions that are not linkedto known gene promoters.
A subpopulation of postnatal SSCs bears high DNAmeat most paternally expressed imprinted loci
Previous studies in themale germline have suggested thatthe establishment of all paternal/maternal imprints andimprinting control regions (ICRs) begin in utero and arecompleted by birth. This expectation was met when ex-amining high-OCT4 SSCs and was also met for all otherSSC subpopulations tested when solely considering thepaternally imprinted ICRs (Igf2/H19, Dlk1/Gtl2, andRsgrf1), which were generally fully methylated (>0.8 frac-tion methylation) at birth (Fig. 4A–C). Interestingly, inTHY1+- or VASA+-enriched SSCs at P0 or P7 (but nothigh-OCT4 SSCs), we found ∼70% (24 of 37 genes) of allknown paternally expressed imprinted (those normally
DNA hypomethylated) genes to be DNA methylated(Fig. 4A,B,D). As additional confirmation, THY1+ andGFRa1+ SSCs at P7 also showed DNAme at the samegenes. As a further test, single-cell DNAme assays wereperformed using Fluidigm Biomark arrays on P7 THY1+
SSCs separately isolated from an alternative mouse colo-ny. This analysis, which relies on a methylation-sensitiveenzymatic digestion (Lorthongpanich et al. 2013), like-wise revealed clearDNAme of promoters of the paternallyexpressed imprinted loci tested (Airn, Igf2, Impact, Mest,Nap1l5, Peg10, Peg3, Plagl1, Snrpn, and Xist) (Fig. 4B,D;Supplemental Fig. 4A,B; data not shown). Moreover, theseresults confirmed the normal/expected high DNAme atknown methylated paternal ICRs (H19-Igf2, Gtl2-Dlk1,and Rasgrf1) (Fig. 4B,C). Furthermore, whereas the pro-moters of most maternally expressed imprinted genesshowed the expected promoter DNA hypomethylationin all subpopulations tested, three genes (Meg3, Cdkn1c,and Gnas) deviated and bore DNAme at P0 in THY1+- or
D
B P7 THY1+ spermatogonia Spermatocytes
C
A+-
C
Gtl2/Meg3
Chr14110,700,000 110,740,000
Gtl2-Dlk1
1010101010
01
01
10
01
01
01
01
01
01
01
01
Dlk1110,720,000 110,760,000 110,780,000 110,800,000
ESC
E16.5
101010P0 OCT4-GFP
10P0 VASA-GFP
10P0 THY1+
01
P7 THY1 GFRA1+
01P7 THY1+
10
01
01
P7 VASA THY1+
01
P7 KIT+
01
P12 THY1+
01P12 KIT+
01P14 THY1+
01P14 KIT+
01Adult SSC
Frac
tion
DN
Am
e(m
CG
/CG
)
H19
149,760,000 149,768,000Chr7
H19-Igf2
149,764,000
Frac
tion
DN
Am
e(m
CG
/CG
)
1010101010
01
01
10
01
01
01
01
01
01
01
01
Peg104,700,000
Chr6
Sgce
1010101010
01
01
10
01
01
01
01
01
01
01
01
100,670,000 100,680,000ChrX
Xist
Tsix
Paternal ICRs Paternally-expressed imprinted loci
0.8
0.6
0.4
0.2
Pat
erna
lIC
Rs
Pat
erna
lly-e
xpre
ssed
impr
inte
d lo
ciM
ater
nally
-exp
ress
edim
prin
ted
loci
P0
THY
1+P
7 G
FRA
1+
P7
KIT
+
P7
THY
1 +
P12
TH
Y1
+P
12 K
IT +
P14
TH
Y1
+P
14 K
IT +
Adu
lt S
SC
P0
OC
T4+
P0
VASA
+
P7
OC
T4 +
P7
ID4
+P
7 V
AS
A +
Mcts2NnatNesp
NespasGnas
Peg10Mest
Nap1l5Peg3
SnrpnInpp5f
Lit1
Gtl2/Dlk1H19/Igf2Rasgraf1
Gpr1/Zdbf2
Zac/Plagl1GRB10U2AF1Peg13
Igf2r / AirImpact
Pat
erna
lIC
Rs
Pat
erna
lly-e
xpre
ssed
impr
inte
d lo
ci
ND
ND
P7 OCT4-GFP
P7 ID4-GFP
Fam18a
Phlda2
Hoxd1
H19-Igf2Gtl2-Dlk1
Rasgrf1
Prm1
Peg10Peg3Airn
ImpactPlagl1
Nap1l5Mest
SnrpnXist
MethylatedUnmethylated
Frac
tion
DN
Am
e
ESC
E16.5
P0 OCT4-GFP
P0 VASA-GFP
P0 THY1+
P7 THY1 GFRA1+
P7 THY1+
P7 VASA THY1+
P7 KIT+
P12 THY1+
P12 KIT+
P14 THY1+
P14 KIT+
Adult SSC
P7 OCT4-GFP
P7 ID4-GFP
Figure 4. THY1+-enriched SSCs have improper imprinting (high DNAme) at most paternally expressed imprinted loci. (A) Heat mapsummarizing the fractionDNAme of theDMRat all known paternal imprinting control regions (ICRs) and paternally expressed imprintedloci. Grey boxes with ND (not determined) within are regions with insufficient sequencing coverage in high-ID4 data sets. (B) Single-cellDNAme validation of 16 loci in P7 THY1+-enriched SSCs and in spermatocytes using the Fluidigm Biomark system. Genomic loci ana-lyzed include known methylated (M) and unmethylated (U) control loci, paternally imprinted ICRs (highlighted in dark blue), paternallyexpressed imprinted loci (highlighted in light blue), and maternally expressed imprinted loci (highlighted in pink). (C ) DNAme genomicsnapshots of paternally imprinted ICRs (e.g.,H19/Igf2 andDlk1/Gtl2). The dark-blue bar depicts the ICR. (Y-axis) Fraction CG DNAme.(D) DNAme genomic snapshots of paternally expressed imprinted loci (e.g., Xist [left] and Peg10 [right]). (Y-axis) Fraction CG DNAme inESCs, PGCs, and prepubertal and adult SSCs. The blue bar depicts previously defined imprinted loci.
Transcriptome/methylome profiling of spermatogonia
GENES & DEVELOPMENT 2319
Cold Spring Harbor Laboratory Press on November 29, 2016 - Published by genesdev.cshlp.orgDownloaded from

VASA+-enriched SSCs but not in high-OCT4 SSCs(which display normal imprinting). Curiously, many ofthe genes that displayed improper imprinting displayedimproper expression as well (Supplemental Fig. 4A,B).However, all paternal and maternal imprints and geneexpression patterns resolve to the normal/expected pat-tern in late juveniles (P14) (Supplemental Fig. 4A,B).Taken together, whereas high-OCT4 cells (and high-ID4cells, where threshold coverage is available) displayedexpected imprinting patterns, other subpopulations (P0THY1+, P0 VASA-cre [GFP-sorted], P7 THY1+ GFRa1+,P7 THY1+, and single-cell formats) displayed unexpectedpatterns (Fig. 4C,D); with these, the majority of pater-nally expressed imprinted genes and three maternallyexpressed imprinted genes lacked full imprinting atP0/P7 but resolved to the expected imprinting patternsby P12/P14, prior to the onset of puberty and adultgametogenesis.
Discussion
Germline stemcells are specified at approximately E5.5 asPGCs and soon after undergo remarkable phases ofgenome-wide DNA demethylation—coupled to imprinterasure—followed by the re-establishment of parental im-prints prior to gametogenesis. Beyond imprinting, thesecells pass through multiple developmental stages fromPGCs to adult SSCs that involve complex migration andproliferation phases and culminate in adult SSCs that bal-ance self-renewal and differentiation through communi-cation with niche cells. Although prior genetic andmolecularworkprovidedsignificant insights into involvedgenes and physiology,much remained unknown regardingthe transcription, chromatin, imprinting, and signalingprograms that drive or accompany these developmentalphases and also imprinting regulation.Here,weconductedextensive genomic profiling of several postnatal subtypesto reveal the transcription networks, chromatin programs,and signaling systems (inferred by transcription) that driveand/oraccompanythesedevelopmental stages, providinga
foundation for functional studies and revealing several un-expected features (Fig. 5).
To aid in the interpretation of these data, we first pre-sented challenges and limitations. One clear challengewas the known heterogeneity of postnatal SSCs, requiringisolation and comparison of multiple subtypes during de-velopment. Here, we profiled multiple subtypes and fo-cused on markers best correlated with transplantation(and comparisons with poorly transplanting KIT+ sperma-togonia). However, these profilings were not exhaustive,so informative subtypes likely remain untested. Second,SSC subtypes were isolated by cell surface markers (e.g.,THY1 or KIT) or GFP sorting (e.g., for high OCT4 andID4) using MACS or FACS, respectively. Both methodsare enrichment rather than purification procedures, andgenes expressed at high levels in rare contaminating cellscan impact RNA-seq profile interpretations. Third, ourGFP sortings involved transgenic animals of nonidenticalgenetic background, which could impact profiles. Fourth,our interpretations assumed that changes in transcriptionimpact protein levels, which remain untested. Neverthe-less, these data sets provide high-resolution genomic pro-filing of multiple SSC/spermatogonial subpopulationsspanning from birth to puberty, providing foundationaldata sets for comparisons and analyses.
Transcription and chromatin programsof germline stem cells
Here, we profiled the majority THY1+ SSC populationfrom P0 to P14 and compared it with prior data setsfrom PGCs and adult SSCs, revealing many dynamicchanges. First, we found PGC specification factors declin-ing in P0 prospermatogonia and low/absent in SSCs,strongly suggesting that PGC specification factors arenot required for the maintenance of SSC identity. In addi-tion, several transcription factors linked to pluripotencyand self-renewal in ESCs are absent in SSCs (e.g., SOX2,PRDM14, NANOG, and LEFTY), while others that con-tribute to self-renewal in ESCs and other stem cells
OCT4+ ,ID4+ (epithelial-like SSCs)
P0 P12 P14
Cell cycle, M-phase, DNA replication, spliceosomeSpermatogenesis, Sexual reproduction, Gamete generation
Hormone/RA metabolic processesMAPK signaling pathway
P7 Adult
DNA packaging, chromatin assemblyactin cytoskeleton organization
PGCs
Cell adhesion
Mature Sperm
DN
A m
ethy
latio
nE
xpre
ssio
n
CG methylation in male germ cells
E12.5E8.5
Paternally-expressed imprinted loci
Paternal ICRs
Maternally-expressed imprinted loci
THY1+, KIT+ (mesenchymal-like SSCs)
Figure 5. Summary schematic depicting changes in DNAme and transcription during germ cell development. (Top panel) Whereas post-natal SSCs with high OCT4/ID4 (epithelial-like SSCs) display normal imprinting patterns, THY1+-enriched SSCs (mesenchymal-likeSSCs) at P0–P7 display imprinting defects (high DNAme) at paternally expressed imprinted genes and certain monoallelically expressedgenes but resolve to normal/expected patterns before puberty. THY1+-enriched SSCs transcriptomes enrich for particular GO categoriesduring development, aligned with needed processes and the germ cell–niche codevelopment.
Hammoud et al.
2320 GENES & DEVELOPMENT
Cold Spring Harbor Laboratory Press on November 29, 2016 - Published by genesdev.cshlp.orgDownloaded from

remain present, prompting future work on their involve-ment in self-renewal. Regarding chromatin, we extendto P7 SSCs our earlier observations in adult SSCs thatbivalency and DNA hypomethylation reside at the pro-moters or enhancers of the silent/poised Nanog, Sox2,Lefty, and Prdm14 genes (Hammoud et al. 2014), whichwe speculatemay underlie their ability to be activated fol-lowing normal fertilization (or during their conversion topluripotent embryonic germ cells in vitro).Regarding DNAme changes in the germline, DNAme is
low in early PGCs (reflecting recent genome-wide DNAdemethylation). However, we found that bulk DNAmelevels are largely restored by P0. In keeping with this, L1and LTR elements are largely highly methylated by P0.Furthermore, we found the piRNA system highly ex-pressed in P0 prospermatogonia (e.g., Piwil2 and Tdrd9),consistent with their function in DNAme maintenanceand retrotransposon silencing at this stage. Moreover,we observed stage-specific expression of many ZNF-KRAB family proteins. Thus, we reveal the developmentaltranscriptional timing of many factors involved in innateimmune defense against transposons.
Signaling pathway dynamics in developinggermline stem cells
Our examination of signaling pathways (inferred by tran-scription) reveals changes in signaling pathway compo-nents during SSC development. For FGF and BMPpathways, our work supports a shift from autocrine tolargely paracrine signaling (using the niche) as postnatalSSCs develop into adult SSCs. In contrast, our profilessupport WNT signaling through a paracrine system, ascanonical WNT ligands are generally silent in SSCs,but the receptors (Fzd and Lrp genes) are expressed. No-tably, we also found noncanonical WNT receptorsexpressed but only in neonates. We also observed partic-ular transitions in GDNF signaling components duringdevelopment. For example, very high levels of the recep-tor (Gfra1) and partnered signaling factors (e.g., Ret)were observed in the juvenile, in contrast to low expres-sion levels in adult SSCs. However, we found GFRA1protein still clearly present in adult SSCs although atlower levels than in differentiating spermatocytes. In-stead, adult SSCs express high levels of GFRA2, whichpreferably binds neurturin to GDNF. Together, these re-sults provide new information for designing more ad-vanced cell culturing systems for SSCs and for geneticinvestigation.
SSC subtypes differ transcriptionally, revealingepithelial-like or mesenchymal-like properties
Transcriptional profiles of high-OCT4 and high-ID4 cellsproved highly similar (r = 0.98), and prior work revealsthem both as highly transplantable subtypes. In accor-dance with their stem-like potential, they express factorsknown to promote SSC maintenance (e.g., Zbtb16/Plzfand Gfra1) at levels moderately higher than THY1+-en-riched cells (which also transplant well). Notably, KIT+-
enriched cells had even lower levels of these SSCmarkerscompared with the THY1+-enriched subtype, which mayresult in poor transplantation. GO categories enriched in-clude DNA repair and chromatin organization, whichmay help ensure genome integrity. Perhaps the moststriking differencewas the higher levels of many keymes-enchymal markers (e.g., Zeb2 and Vimentin) (Fig. 2D) inthe THY1+-enriched subtypes, along with lower levels ofkey epithelial markers (e.g., Cdh1), and enrichment ofGO categories such as cell adhesion and migration (Fig.2C, clusters 1 and 5), categories that coenrich for mesen-chymal genes. Here, we speculate that this heterogeneouspopulation of SSCs may transition between more epithe-lial-like states and more mesenchymal-like states, whichhelps enable proliferation, migration, and attachment ofthese SSCs to the basement membrane of the seminifer-ous tubule during these postnatal stages.
Dynamics of monoallelic genes in THY1+-enriched SSCs
Interestingly, THY1+-enriched SSCs, but not high-OCT4/ID4 SSCs, display DNAme/chromatin changes at a largeproportion of olfactory receptor and PC loci during postna-tal SSC development. However, all SSC subtypes arrive atthe same DNAme status for these genes by P14: hypome-thylated. Notably, these two gene families share neuronalutilization, combinatorial regulation, and knownmonoal-lelic expression (Singh et al. 2003; Esumi et al. 2005; Chess2013). Finally, beyond PC and olfactory receptor genes, weobserved a large number of promoters (∼500) that likewiseundergo pronounced focal DNA demethylation during de-velopment in theTHY1+-enriched subtype, includingmel-anocortin receptors, cytokines, and interleukins. Thesegene promoters are generally DNA hypomethylated inboth mature sperm (Hammoud et al. 2014) and oocytes(Smith et al. 2012).Here, future studies areneeded todeter-mine which transcription and chromatin factors conductthis phase of reprogramming and their impact on SSCbiology.
Dynamics of imprinting in developinggermline stem cells
Interestingly, we found that THY1+ and KIT+ cells fromneonates and P7 mice display normal imprinting of pater-nal and maternal ICRs but surprisingly lack full imprint-ing of most paternally expressed imprinted genes andthree specific maternally expressed imprinted genes (Fig.5). However, these genes/loci attain their full/expectedimprinting prior to puberty. In contrast, the high-OCT4/ID4 subtypes displayed expected paternal imprintsthroughout postnatal development, supporting recentwork in high-OCT4 neonatal SSCs (Kubo et al. 2015).Here we note that the subset of THY1+ and KIT+ sper-matogonia that shows both imprinting defects and mes-enchymal-like features may contribute to the pool ofspermatogonia that participates in the first wave of game-togenesis (Yoshida et al. 2006). Future work will examinetargeting proteins and the mechanism of demethylation(passive vs. active, including TET family proteins) as
Transcriptome/methylome profiling of spermatogonia
GENES & DEVELOPMENT 2321
Cold Spring Harbor Laboratory Press on November 29, 2016 - Published by genesdev.cshlp.orgDownloaded from

well as whether the imprinting/transcription status ofthese imprinted genes (and the monoallelic genes de-scribed above) affects proliferation or themoremesenchy-mal-like properties of these SSC subtypes.
The extensive changes in DNAme/chromatin occur-ring during the postnatal phase of mouse SSC develop-ment are striking and focused on regulatory regionsrather than the repetitive regions observed in PGCs.Whether these same phenomena extend to humans re-mains unknown; however, epidemiological studies in hu-mans and animals suggest that caloric restriction orovereating during the prepubertal period impacts risk forcardiovascular disease, obesity, and diabetes in the nextgeneration (Kaati et al. 2002; Skorupa et al. 2008; Nget al. 2010; Ost et al. 2014; Rechavi et al. 2014). Therefore,these epidemiological findings underscore a phase of pre-pubertal germline plasticity where heritable perturba-tions to the epigenome may occur.
Materials and methods
Mouse husbandry and germ cell isolation
Allmiceweremaintained on a normal 12-h/12-h light/dark cycle.Isolation of either the THY1+ or c-KIT+ stem cell fractionwas car-ried out with a MACS separator (Miltenyi Biotec) using anti-CD117 antibody (KIT) or anti-CD90.2 (Thy1) (Miltenyi Biotec).Quantitative PCR was used to confirm stem cell purity. RNAand DNAwas harvested from SSCs as biological replicates as de-scribed in the detailed Supplemental Material and are availablefor all RNA-seq data sets. FACS analysis involved isolationsfrom P0 Vasa-GFP+ (The Jackson Laboratory, 006954), P0 andP7 Oct4-GFP+ (The Jackson Laboratory, 008214), and P7 Id4-GFP+ (J. Oatley’s laboratory). Cells were sorted using FACSCali-bur (BD Biosciences). The percentage of live cells was >95%, byexclusion of propidium iodide.
ChIP combined with deep sequencing (ChIP-seq)
ChIP was performed as described previously (Hammoud et al.2014). Prior to library preparation, ChIP samples were amplifiedusing SEQX (SEQX-50RXN, Sigma Aldrich) due to very low im-munoprecipitation yield.After amplification andprimer removal,librarieswere prepared using standard Illumina pipeline. Librarieswere sequencedusing50-bp single-end reads onan IlluminaHiSeq2000or 2500.Theantibodiesusedwereanti-H3K27ac (ActiveMo-tif, 39135), H3K4me3 (ActiveMotif, 39159), and H3K27me3 (Up-state Biotechnology, 07-449).
Single-cell DNAme
Single-cell DNAme analysis was carried out based on prior meth-ods (Lorthongpanich et al. 2013). Spermatocytes and spermatogo-nia were single-cell FACS-sorted into 96-well plates. DNAme-sensitive restriction digest was performed using Haiti (New En-gland Biolabs). Long and short primers were designed for each an-alyzed site (Supplemental Table 3). Preamplification was thenperformed by initial denaturation for 10 min at 95°C followedby 22 cycles of 30 sec of denaturation at 95°C and 4min of anneal-ing/extension at 60°C. Site-specific real-time amplification wasperformed on 48.48 dynamic arrays using the Biomark System(Fluidigm).
Immunostaining analysis
Mouse testes were fixed in 4% PFA overnight at 4°C, cut, and an-alyzed. Immunostaining was performed using the primary anti-bodies anti-GFRa1 (ab8026), anti-Cd90 (ab3105), anti-Oct4(ab196585), and anti-GFP (Fischer, PIMA515256) followed byAlexa fluor secondary antibodies 488, 594, and 647 (Invitrogen).Nuclear counterstaining was performed using DAPI (Invitrogen).Fluorescent images were acquired using a Leica Sp5 or an Olym-pus FluoView FV1000 BX2.
Mouse RNA extraction and library preparation
RNA extractions were performed following Ambion standardprotocol (Ambion Life Technologies). Total RNA was DNase-treated (Ambion, AM1907). Long directional RNA-seq libraries(Ribozero-treated) were constructed according to Illumina’s pro-tocol and sequenced using a 50-bp single-end format on an Illu-mina HiSeq 2000 or 2500.
Mouse BisSeq and library preparation
Extracted genomic DNA (50 ng–1 µg) was spiked with 1% unme-thylated λDNA (Promega), and the library was constructed usingthe EpiGnome Methyl-Seq sample prep kit (Epicenter, Inc.) andsequenced using a 101-bp paired-end format on an IlluminaHiSeq2000 or 2500.
Bioinformatics analysis
Bioinformatics analysis was performed as previously described(Hammoud et al. 2014). Briefly, Fastq files from BisSeq librarieswere aligned to the mm9 mouse genome assembly using No-voalign (Novocraft, Inc.) and analyzed using the USEQ package(http://useq.sourceforge.net). ChIP-seq libraries were aligned us-ing Bowtie (http://bowtie-bio.sourceforge.net). RNA-seq align-ments were done using TopHat version 2.0.9 (http://tophat.cbcb.umd.edu). ChIP-seq, RNA-seq, and DNAme BisSeq downstreamanalysis were done using the USEQ package, Cufflinks suite, andcummeRbund R package.
Data access
All data described in this study may be downloaded from GeneExpression Omnibus under the accession project GSE62355.This includes raw Fastq files and processed files for BisSeq,ChIP-seq, RNA-seq, and 5hmC enrichment experiments.
Acknowledgments
We thank B. Dalley for sequencing expertise; Ken Boucher forstatistical analysis; David Nix, Tim Mosbruger, Brett Milash,Darren Ames, and Tim Parnell for bioinformatics assistance;and Candice Wike for microscopy assistance. We thank SusannaDolci for germ cell purification protocols, and Marco Bezzi andShun Xie Teo for help with mouse husbandry. We acknowledgethe technical expertise provided by the Advanced MolecularPathology Laboratory at Institute of Molecular and Cell Biology.Financial support includes the Biomedical Research Council ofA*STAR (Agency for Science, Technology, and Research, Singa-pore), and Joint Council A*STAR grant 1234c00017 (to D.H.P.L.,C.L.L., and E.G.), the Department of Urology (genomics), theHoward Hughes Medical Institute (genomics and biologicals),and CA24014 for the Huntsman Cancer Institute core facilities.
Hammoud et al.
2322 GENES & DEVELOPMENT
Cold Spring Harbor Laboratory Press on November 29, 2016 - Published by genesdev.cshlp.orgDownloaded from

S.S.H. is funded by the Helen HayWhitney Foundation. B.R.C. isan Investigator with the Howard Hughes Medical Institute.
References
Chan F, Oatley MJ, Kaucher AV, Yang QE, Bieberich CJ, Shashi-kant CS, Oatley JM. 2014. Functional and molecular featuresof the Id4+ germline stem cell population in mouse testes.Genes Dev 28: 1351–1362.
Chess A. 2013. Random and non-randommonoallelic expression.Neuropsychopharmacology 38: 55–61.
CultyM. 2009. Gonocytes, the forgotten cells of the germ cell lin-eage. Birth Defects Res C Embryo Today 87: 1–26.
Dawlaty MM, Ganz K, Powell BE, Hu YC, Markoulaki S, ChengAW, Gao Q, Kim J, Choi SW, Page DC, et al. 2011. Tet1 is dis-pensable for maintaining pluripotency and its loss is compat-ible with embryonic and postnatal development. Cell StemCell 9: 166–175.
Delaval K, Govin J, Cerqueira F, Rousseaux S, Khochbin S, Feil R.2007. Differential histone modifications mark mouse im-printing control regions during spermatogenesis. EMBO J 26:720–729.
Esumi S, Kakazu N, Taguchi Y, Hirayama T, Sasaki A, Hirabaya-shi T, Koide T, Kitsukawa T, Hamada S, Yagi T. 2005. Mono-allelic yet combinatorial expression of variable exons of theprotocadherin-α gene cluster in single neurons. Nat Genet37: 171–176.
Hackett JA, Zylicz JJ, Surani MA. 2012. Parallel mechanisms ofepigenetic reprogramming in the germline. Trends Genet 28:164–174.
Hackett JA, Sengupta R, Zylicz JJ, Murakami K, Lee C, DownTA,Surani MA. 2013. Germline DNA demethylation dynamicsand imprint erasure through 5-hydroxymethylcytosine. Sci-ence 339: 448–452.
Hall J, Guo G, Wray J, Eyres I, Nichols J, Grotewold L, Morfopou-lou S, Humphreys P, MansfieldW, Walker R, et al. 2009. Oct4and LIF/Stat3 additively induce Kruppel factors to sustain em-bryonic stem cell self-renewal. Cell Stem Cell 5: 597–609.
Hammoud SS, LowDH, Yi C, Carrell DT, Guccione E, Cairns BR.2014. Chromatin and transcription transitions of mammalianadult germline stem cells and spermatogenesis. Cell StemCell 15: 239–253.
Hess RA, Renato de Franca L. 2008. Spermatogenesis and cycle ofthe seminiferous epithelium. Adv Exp Med Biol 636: 1–15.
HofmannMC, Braydich-Stolle L, DymM. 2005. Isolation of malegerm-line stem cells; influence of GDNF. Dev Biol 279:114–124.
Ishii K, Kanatsu-Shinohara M, Toyokuni S, Shinohara T. 2012.FGF2 mediates mouse spermatogonial stem cell self-renewalvia upregulation of Etv5 and Bcl6b through MAP2K1 activa-tion. Development 139: 1734–1743.
Kaati G, Bygren LO, Edvinsson S. 2002. Cardiovascular and diabe-tes mortality determined by nutrition during parents’ andgrandparents’ slow growth period. Eur J Hum Genet 10:682–688.
Khalil AM, Boyar FZ, Driscoll DJ. 2004. Dynamic histone modi-fications mark sex chromosome inactivation and reactivationduring mammalian spermatogenesis. Proc Natl Acad Sci 101:16583–16587.
Kluin PM, de Rooij DG. 1981. A comparison between the mor-phology and cell kinetics of gonocytes and adult type undiffer-entiated spermatogonia in themouse. Int J Androl 4: 475–493.
Kubo N, Toh H, Shirane K, Shirakawa T, Kobayashi H, Sato T,Sone H, Sato Y, Tomizawa S, Tsurusaki Y, et al. 2015. DNA
methylation and gene expression dynamics during spermato-gonial stem cell differentiation in the early postnatal mousetestis. BMC Genomics 16: 624.
Kubota H, Avarbock MR, Brinster RL. 2004. Culture conditionsand single growth factors affect fate determination of mousespermatogonial stem cells. Biol Reprod 71: 722–731.
Lesch BJ, Dokshin GA, Young RA, McCarrey JR, Page DC. 2013.A set of genes critical to development is epigenetically poisedin mouse germ cells from fetal stages through completion ofmeiosis. Proc Natl Acad Sci 110: 16061–16066.
Lorthongpanich C, Cheow LF, Balu S, Quake SR, Knowles BB,Burkholder WF, Solter D, Messerschmidt DM. 2013. Single-cell DNA-methylation analysis reveals epigenetic chimerismin preimplantation embryos. Science 341: 1110–1112.
MengX, LindahlM,HyvonenME, ParvinenM, deRooij DG,HessMW, Raatikainen-Ahokas A, Sainio K, Rauvala H, Lakso M,et al. 2000. Regulation of cell fate decision of undifferentiatedspermatogonia by GDNF. Science 287: 1489–1493.
Mikkelsen TS, KuM, Jaffe DB, Issac B, Lieberman E, GiannoukosG,Alvarez P, BrockmanW,KimTK,KocheRP, et al. 2007.Ge-nome-wide maps of chromatin state in pluripotent and line-age-committed cells. Nature 448: 553–560.
Ng SF, Lin RC, Laybutt DR, Barres R, Owens JA,MorrisMJ. 2010.Chronic high-fat diet in fathers programs β-cell dysfunction infemale rat offspring. Nature 467: 963–966.
Ng JH, Kumar V, Muratani M, Kraus P, Yeo JC, Yaw LP, Xue K,Lufkin T, Prabhakar S, Ng HH. 2013. In vivo epigenomic pro-filing of germ cells reveals germ cell molecular signatures.Dev Cell 24: 324–333.
Oakes CC, La Salle S, Smiraglia DJ, Robaire B, Trasler JM. 2007.Developmental acquisition of genome-wide DNA methyla-tion occurs prior to meiosis in male germ cells. Dev Biol307: 368–379.
Oatley JM, Oatley MJ, Avarbock MR, Tobias JW, Brinster RL.2009. Colony stimulating factor 1 is an extrinsic stimulatorof mouse spermatogonial stem cell self-renewal. Develop-ment 136: 1191–1199.
OhinataY,OhtaH, ShigetaM,YamanakaK,WakayamaT, SaitouM. 2009. A signaling principle for the specification of the germcell lineage in mice. Cell 137: 571–584.
Ohno R, NakayamaM, Naruse C, Okashita N, Takano O, Tachi-bana M, Asano M, Saitou M, Seki Y. 2013. A replication-de-pendent passive mechanism modulates DNA demethylationin mouse primordial germ cells. Development 140:2892–2903.
Ost A, Lempradl A, Casas E, Weigert M, Tiko T, Deniz M, Pan-tano L, BoenischU, Itskov PM, StoeckiusM, et al. 2014. Pater-nal diet defines offspring chromatin state andintergenerational obesity. Cell 159: 1352–1364.
Rechavi O, Houri-Ze’evi L, Anava S, Goh WS, Kerk SY, HannonGJ, Hobert O. 2014. Starvation-induced transgenerational in-heritance of small RNAs in C. elegans. Cell 158: 277–287.
Sachs M, Onodera C, Blaschke K, Ebata KT, Song JS, Ramalho-Santos M. 2013. Bivalent chromatin marks developmentalregulatory genes in the mouse embryonic germline in vivo.Cell Rep 3: 1777–1784.
Seisenberger S, Andrews S, Krueger F, Arand J, Walter J, Santos F,Popp C, Thienpont B, DeanW, ReikW. 2012. The dynamics ofgenome-wide DNA methylation reprogramming in mouseprimordial germ cells. Mol Cell 48: 849–862.
Seki Y, Hayashi K, Itoh K,MizugakiM, SaitouM,Matsui Y. 2005.Extensive and orderly reprogramming of genome-wide chro-matin modifications associated with specification and earlydevelopment of germ cells in mice. Dev Biol 278: 440–458.
Transcriptome/methylome profiling of spermatogonia
GENES & DEVELOPMENT 2323
Cold Spring Harbor Laboratory Press on November 29, 2016 - Published by genesdev.cshlp.orgDownloaded from

Singh N, Ebrahimi FA, Gimelbrant AA, Ensminger AW, TackettMR, Qi P, Gribnau J, Chess A. 2003. Coordination of the ran-dom asynchronous replication of autosomal loci. Nat Genet33: 339–341.
Skorupa DA, Dervisefendic A, Zwiener J, Pletcher SD. 2008. Di-etary composition specifies consumption, obesity, and life-span in Drosophila melanogaster. Aging cell 7: 478–490.
Smith ZD, Chan MM, Mikkelsen TS, Gu H, Gnirke A, Regev A,Meissner A. 2012. A unique regulatory phase of DNAmethyl-ation in the early mammalian embryo. Nature 484: 339–344.
Song HW, Dann CT, McCarrey JR, Meistrich ML, Cornwall GA,WilkinsonMF. 2012. Dynamic expression pattern and subcel-lular localization of the Rhox10 homeobox transcription fac-tor during early germ cell development. Reproduction 143:611–624.
Soumillon M, Necsulea A, Weier M, Brawand D, Zhang X, Gu H,Barthes P, Kokkinaki M, Nef S, Gnirke A, et al. 2013. Cellular
source and mechanisms of high transcriptome complexity inthe mammalian testis. Cell Rep 3: 2179–2190.
Stadler MB, Murr R, Burger L, Ivanek R, Lienert F, Scholer A, vanNimwegen E, Wirbelauer C, Oakeley EJ, Gaidatzis D, et al.2011. DNA-binding factors shape the mouse methylome atdistal regulatory regions. Nature 480: 490–495.
Turner JM. 2007. Meiotic sex chromosome inactivation. Devel-opment 134: 1823–1831.
Yoshida S, SukenoM, Nakagawa T, Ohbo K, Nagamatsu G, SudaT,NabeshimaY. 2006. The first round ofmouse spermatogen-esis is a distinctive program that lacks the self-renewing sper-matogonia stage. Development 133: 1495–1505.
Yoshimizu T, Sugiyama N, De Felice M, Yeom YI, Ohbo K,Masuko K, Obinata M, Abe K, Scholer HR, Matsui Y. 1999.Germline-specific expression of the Oct-4/green fluorescentprotein (GFP) transgene in mice. Dev Growth Differ 41:675–684.
Hammoud et al.
2324 GENES & DEVELOPMENT
Cold Spring Harbor Laboratory Press on November 29, 2016 - Published by genesdev.cshlp.orgDownloaded from

10.1101/gad.261925.115Access the most recent version at doi: 2015 29: 2312-2324 Genes Dev.
Saher Sue Hammoud, Diana H.P. Low, Chongil Yi, et al. germline stem cellsTranscription and imprinting dynamics in developing postnatal male
Material
Supplemental
http://genesdev.cshlp.org/content/suppl/2015/11/06/29.21.2312.DC1.html
References
http://genesdev.cshlp.org/content/29/21/2312.full.html#ref-list-1
This article cites 42 articles, 14 of which can be accessed free at:
License
Commons Creative
.http://creativecommons.org/licenses/by-nc/4.0/at Creative Commons License (Attribution-NonCommercial 4.0 International), as described
). After six months, it is available under ahttp://genesdev.cshlp.org/site/misc/terms.xhtmlsix months after the full-issue publication date (see This article is distributed exclusively by Cold Spring Harbor Laboratory Press for the first
ServiceEmail Alerting
click here.right corner of the article orReceive free email alerts when new articles cite this article - sign up in the box at the top
http://genesdev.cshlp.org/subscriptionsgo to: Genes & Development To subscribe to
© 2015 Hammoud et al.; Published by Cold Spring Harbor Laboratory Press
Cold Spring Harbor Laboratory Press on November 29, 2016 - Published by genesdev.cshlp.orgDownloaded from