
TRAINING REACTOR AKR-2 - TU Dresden · Radiation Protection The reactor is designed to keep the...
180
Technical University Dresden Telefon: +49-351-463 33831 Faculty of Mechanical Science and Engineering Fax: +49-351-463 33831 Institute of Power Engineering E-Mail: [email protected] Training Reactor http://tu-dresden.de/mw/akr 01062 Dresden Faculty of Mechanical Science and Engineering Institute of Power Engineering TRAINING REACTOR AKR-2 EXPERIMENTS IN REACTOR PHYSICS AND RADIATION PROTECTION Dresden, January 2019
Transcript of TRAINING REACTOR AKR-2 - TU Dresden · Radiation Protection The reactor is designed to keep the...

Technical University Dresden Telefon: +49-351-463 33831 Faculty of Mechanical Science and Engineering Fax: +49-351-463 33831 Institute of Power Engineering E-Mail: [email protected] Training Reactor http://tu-dresden.de/mw/akr 01062 Dresden
Faculty of Mechanical Science and Engineering Institute of Power Engineering
TRAINING REACTOR AKR-2
EXPERIMENTS
IN REACTOR PHYSICS AND RADIATION PROTECTION
Dresden, January 2019

TRAINING COURSE AT AKR-2
Experiments in Reactor Physics and Radiation Protection Content: 1....... Description of the Reactor Facility and Procedure of Operation 2....... Reactor Start-up Procedure 3....... Control Rod Calibration 4....... Critical Experiment 5....... Adjoint Flux Function 6....... Neutron Flux Distribution 7....... Gamma Dosimetry and Dose Rate Determination 8....... Activation and Decay of Radioactive Nuclides 9....... Identification of Unknown Radionuclides ( γ - Spectrometry )

TECHNICAL UNIVERSITY
DRESDEN
Institute of Power Engineering Training Reactor
Training Reactor AKR-2
Description of the Reactor FacilityProcedure of Operation

- 1 -
Technical Description and Procedure of Operation for the Reactor Facility AKR-2
Content:
1. . . . . . . . . Description of the Training Reactor AKR-2
1.1. . . . . . . Introduction
1.2. . . . . . . Safety Features
1.3 . . . . . . . Radiation Protection
1.4. . . . . . . Review of Technical Parameters of the AKR-2
1.5. . . . . . . Technical Design of the Facility
1.6. . . . . . . Instrumentation and Control (I&C) System with TELEPERM XS
1.6.1. . . . . . Architecture of the I&C System
1.6.2. . . . . . Nuclear Instrumentation
1.6.2.1. . . . Wide-Range Channels (Start-up/Middle/Power Range)
1.6.2.2. . . . Power-Range Channel
1.6.3. . . . . . Safety and Control System
1.6.4. . . . . . Safety Relevant Protective Logic
1.6.4.1. . . . Protective Logic for Reactor Start-up
1.6.4.2. . . . Protective Logic for the Critical Experiment
1.6.5. . . . . . Operational Functions
1.6.5.1. . . . Automatic Reactor Power Control
1.6.5.2. . . . Control Rod Drop
1.6.5.3. . . . SCRAM
1.6.6. . . . . . System Messages
1.6.6.1. . . . Reactor Signalisation System
1.6.6.2. . . . Safety Alarms
1.6.6.2.1. . . Process-Orientated Safety Alarms
1.6.6.2.2. . . Safety Alarms of I&C Units
1.6.6.3. . . . Fault Signals
1.6.6.4. . . . Releases / Status Messages
1.6.7. . . . . . Service Equipment (Diagnostics Interface)
1.6.8. . . . . . Gateway Interface Computer
1.6.9. . . . . . Interconnection between I&C units
2. . . . . . . . . Instruction for Reactor Start-up Procedure
2.1. . . . . . . General Remarks
2.2. . . . . . . Start- and Stop-Procedure of the Safety and Control System
2.3. . . . . . . Preparation for Reactor Start-up
2.4. . . . . . . Safety Check of the Fast Shut-down System
2.5. . . . . . . Normal Restart of the Reactor
2.6. . . . . . . Protocol Records in the Operation Logbook
3. . . . . . . . . Fields of Application of the AKR-2
3.1. . . . . . . Education and Training
3.2. . . . . . . Application in Research Projects
3.3. . . . . . . Information Centre for the Public
- 2 -
4. . . . . . . . . Examples of Typical Fundamental Training Experiments at AKR-2
4.1. . . . . . . Reactor Start-up Procedure
4.2. . . . . . . Control Rod Calibration
4.3. . . . . . . Critical Experiment
4.4. . . . . . . Adjoint Flux Function
4.5. . . . . . . Measurement of Radial Neutron Flux Distribution
4.6. . . . . . . Pile-Oscillation Experiment
4.7. . . . . . . Demonstration of Neutron Activation and Decay of Various Radioisotopes
4.8. . . . . . . Identification of Radionuclides by means of High Resolution Gamma Spectroscopy
4.9. . . . . . . Radiation Protection and Shielding
4.10. . . . . . Radiation Measurement Techniques
Figures:
Fig. 1 . . . . Vertical Cross Section of the Training and Research Reactor AKR-2
Fig. 2 . . . . Horizontal Cross Section of the Training and Research Reactor AKR-2 at Core Level
Fig. 3 . . . . Cross Section of the Reactor Hall AKR-2
Fig. 4 . . . . Control Desk of AKR-2
Fig. 5 . . . . Conventional Operation and Signal Panel
Fig. 6 . . . . Monitor Screen, Picture 1
Fig. 7 . . . . Monitor Screen, Picture 2
Fig. 8 . . . . Monitor Screen, Picture 3
Fig. 9 . . . . Monitor Screen, List of System Messages (example)
Fig. 10 . . . Signal and Key Panel for Peripheral Units
Fig. 11 . . . Protective Logic for Reactor Start-up Procedure
Fig. 12 . . . Combination of the Safety and Control System (SUS)
Fig. 13 . . . Check List for Reactor Start-up and Operation (with English comments)
(issued: March 2015)

- 3 -
1. Description of the Training Reactor AKR-2
1.1. Introduction
The training and research reactor AKR-2 (from the German Ausbildungskernreaktor) of the
Technical University Dresden is a thermal, homogeneous, solid moderated zero-power reactor
with maximum continuous (thermal) power of 2 Watt.
That means:
- nuclear fission is mainly caused by thermal neutrons,
- nuclear fuel and moderator material are distributed homogeneously in the fuel plates,
- the moderator material is solid polyethylene (and not any liquid like water!),
- the extremely low nuclear power of only 2 Watt ("zero power") allows effects of temperature,
fuel burnup, formation of nuclear waste, activation of structural materials, Xe-poisoning and
others to be neglected.
Advantages of the design of the AKR are:
- application of low enriched uranium (LEU), i.e. U-235 content in the fuel is < 20 %,
- low absolute amount of nuclear fuel (total mass of U-235 in the reactor < 1 kg),
- desired characteristics of the reactor with respect to its inherent safety features (negative
temperature coefficient of reactivity; integrity of the core maintained in case of power
excursion),
- simple construction resulting in high reliability, low costs for inspections, maintenance and
operation,
- strict avoidance of any liquid in the facility (no corrosion, no danger of contamination in case
of leakage, no maintenance of water systems, no substitution or cleaning procedures of liquids),
- miscellaneous irradiation capabilities in the experimental channels (Φ ≈ 2.5·10 n/(cm² · s)),max
7
- free space above the core for possible installation of additional experimental equipment.
Precursor of the AKR-2 was the AKR-1. The AKR-1 training and research reactor of the TUD
was put into operation in 1978 based on the concept of the proven training reactor SUR-100 from
SIEMENS company. For more than 25 years, the AKR-1was successfully used for training and
education of students, for nuclear research projects, and as an information centre for the public.
In 1998, a new licensing procedure began with the goal of completing a comprehensive refurbish-
ment of the reactor in order to update the facility concerning the current level of science and
technology.
The refurbishment took place in 2004 and included civil work as well as new electrical and I&C
equipment, based on the digital reactor protection instrumentation and control system TELE-
PERM XS (by AREVA GmbH Erlangen, Germany) and new installation of 3 channels for the
neutron flux monitoring: two (logarithmic) wide-range and one (linear) power-range channel.
On the other hand, the nuclear design of the reactor itself remained the unchanged and no internal
components or structures (reactor core, control rods, reflector, shielding, neutron detectors etc.)
had to be replaced with the exception of a few minor details. Also the same nuclear fuel can be
used furthermore for the whole reactor life expectancy.

- 4 -
After having successfully completed all start-up requirements (nuclear commissioning with the
critical experiment on March 23, 2005), the regulatory body authorized normal operations of the
new AKR-2 reactor in April 2005.
Currently, AKR-2 is the most up-to-date training reactor in Germany.
Main purpose of the AKR-2 is education and training of students in nuclear and reactor physics
as well as in nuclear engineering and radiological protection. Fundamental experiments are
provided and carried out in practical exercises (see chapters 3 and 4 in more detail).
According to its physical properties, the AKR is also included in specific research projects of the
institute or is used as irradiation facility.
Additionally, the reactor facility and its equipment is also used as an general information centre
providing practical experience in nuclear and reactor physics, nuclear energetics and radiation
protection for
- interested students of all faculties of the university,
- pupils of the grammar schools of Dresden City and its surroundings or
- organised groups and individuals from the public.
1.2. Safety Features
Safe and foolproof operation of the reactor is guaranteed by a combination of
- inherent safety,
- designed safety and
- administrative procedures.
The design and operation conditions of the AKR are based upon the following considerations:
- prompt criticality must not occur at all and
- undue increase of the power must not endanger the operators, the environment or the reactor
itself.
The safe nuclear operation of the reactor is secured by the following measures:
- The excess reactivity is restricted to a maximum value of ∆k/k ≤ 0.3 %.
- All three control rods are designed as combined control and safety rods. The reactivity value
of each of them is sufficiently high to shut-down the reactor. Thus, even in case of failure of
single rods the AKR will be shut-down reliably.
- Independently on control rod movement, a separation of the two core sections by 50 mm
reduces the reactivity by ∆k/k = - 5.8 %. In case of a scram this negative reactivity becomes
effective within about 100 ms. It ensures a fast shut-down of the reactor and a high degree of
nuclear safety in the shut-down state.
- The temperature coefficient of reactivity is negative. From measurements a value of
(2.90 ± 0.05) ¢/K was found out. Estimations have shown that power excursions would be self-
limiting before damages occur at the reactor itself or in its environment. This high inherent
safety results from the physical properties of the fuel elements.
- By monitoring the core temperature and including the measured value into the protective logic

- 5 -
circuit it is prevented that additional positive reactivity could be introduced due to decreasing
core temperature.
- All drives were dimensioned in such a way that the rates of reactivity changes are below
0.0001 s .-1
Due to these measures, a power excursion with harmful consequences can be virtually excluded.
1.3. Radiation Protection
The reactor is designed to keep the external as well as the inner radiation exposure for the reactor
operational staff and the people in the surroundings of the AKR-2 down to be negligible.
The operation of the AKR-2 as a zero-power reactor (or a so-called critical assembly) with
extremely low nuclear power causes only a negligible low uranium fuel consumption and hence,
a minimum production of radioactive fission products. After 30 years estimated continuous non-
stop operation at 2 Watts power the resulting activity in the facility would be less than 100 GBq.
The multiple barrier concept with the capsuled core and the reactor tank as an additional
subatmospheric pressure barrier guarantees that no fission products can be released into the
surrounding of the reactor.
For supervising the ambient local dose rate around the reactor there are 5 gamma-ray measuring
channels installed. If well defined dose rate levels would be exceeded, it would be indicated by
optical as well as acoustic alarm signals and would be registered in the logfile.
1.4. Review of Technical Parameters of the AKR-2
Reactor Vessel: Total Diameter: 250 cm
Total Height: 350 cm (reactor vessel 280 cm)
Fuel Elements: Plates: N 250 mm, height 2 - 23 mm
Material: homogeneous mixture from Uranium oxide (UO , enrich-2
ment 19.8 %) and PE
Critical Mass: 794 g U-235
Reflector: Material: pure graphite (ρ = 1.75 g/cm )3
Thickness: 32 cm radial, 20 cm axial
Neutron Source: Am-Be: source strength: 2.2 · 10 n/s6
Control Rods: 3 independent combined control and safety rods
Material: Cadmium (0.5 mm thick sheets)
Total reactivity: about 37 ¢ per rod

- 6 -
Nuclear Instrumentation:2 (logarithmic) wide-range channels with fission chamber detectors
1 (linear) power-range channel with γ-compensated ionisation chamber
Biological Shield:axial: 48 cm heavy concrete
radial: 15 cm paraffin and 58 cm heavy concrete
Experimental Irradiation Channels:horizontal: 4, M . 2.5 · 10 n/(cm · s)
max
7 2
vertical: 2
Fast Shut-Down Possibilities: drop down of the lower core section for about 5 cm
drop down of the 3 control rods
Maximum Excess Reactivity: 0.3 %
Maximum Continuous Power: 2 W
1.5. Technical Design of the Facility
The design of the reactor is shown in Figs. 1 and 2 (vertical and horizontal cross section). The
cylindrical core has a diameter of 250 mm and a critical height of 275 mm. The disk-shaped fuel
elements consist of a homogeneous dispersion of polythene and uranium oxide (19.8 % enriched
in Uranium-235, O/U ratio 2.27). The Uranium-235 density in the fuel elements amounts to
0.060 g/cm³.
The core is completely surrounded by a graphite reflector (density 1.75 g/cm³). The axial and
radial thicknesses are 20 cm and 32 cm, respectively. Therefore, the critical mass is relatively
small (about 790 g U-235). Within certain constraints the AKR is a minimum-critical-mass
reactor.
For safety reasons, the core consists of two separable sections. The fuel elements of each section
are enclosed in a hermetically sealed aluminium container. A second, larger gas-tight reactor tank
encloses both, core sections and parts of the reflector. The pressure inside the reactor tank is
lowered by (8…18) kPa compared to the ambient atmospheric pressure. This subatmospheric
pressure barrier prevents an uncontrolled leakage of radioactive fission products even in the
unlikely case that all the other internal retention barriers would fail. This subatmospheric pressure
in the tank is continously maintained by a pre-vacuum pump. Control is automatically performed
by means of a pressure controller even when the reactor is shut down.
In the shut-down position the distance between the lower and the upper core section is about
50 mm. The lower section is lifted by means of a core drive mechanism including an electro-
magnetic holder of the core section. Through a tube within this mechanism the start-up neutron
source (Am-Be, neutron yield 2.2·10 s ) is moved from the source container to the bottom side6 -1
of the core. The distance between the bottom side of the core and the middle of the source
container measures about 800 mm.

- 7 -
The reactor is controlled by three cadmium absorber plates. These plates are moved vertically
in a gap within the reflector outside the reactor tank. They are designed as combined control and
safety rods.
The lower core section and the control rods are held by electromagnets in their "working"
positions. Any scram signal opens the direct-pull holding magnets allowing the rods and the lower
core section to fall down in the shut-down position simply by influence of gravity.
Reactor core, reactor tank, graphite reflector and control rods are arranged on a horizontal steel
plate (diameter 1000 mm, thickness 30 mm) inside the reactor vessel. This is a cylindrical
double-walled vessel containing the biological shield and having an outer diameter of 2500 mm
and a height of 2800 mm.
The top cover of the reactor is removable. The free space above the core could be used for e.g.
installing a thermal column or a subcritical assembly.
There are four horizontal and two vertical experimental channels with different diameters and
shapes. They provide adequate inpile irradiation volume with different neutron spectra.
The permissible power level is limited only by the effectiveness of the biological shield. It
consists of paraffin and baryte heavy concrete with an overall thickness of 75 cm inside the
reactor vessel. Proceeding from the condition, that the dose rate equivalent just outside the shield
should not exceed 10 µSv/h, a continuous 2 Watt operation is possible. At 2 Watt power level
the maximum flux density of thermal neutrons in the central experimental channel amounts to
about 2.5·10 n/(cm · s).7 2
The reactor vessel is arranged on the ground floor of the building on a separately grounded
fundament as additional shock protection e.g. for the unlikely event of an earthquake. The drives
for lower core or start-up neutron source movement and the control rods are accessible from the
basement.
An overview of the plan of the reactor hall is given in Fig. 3.
The control desk (Fig. 4) and the separate cabinet with the reactor protection system are also
located in the reactor hall in about 6 m distance from the reactor. The cabinet hosts the modules
of three redundant channels for neutron flux measurement and the computers of the digital reactor
protection system (TelepermXS by AREVA GmbH, Erlangen, Germany) whereas the operational
units are hosted in the control desk.
The control desk holds all operating elements, signal displays and operational instruments
required for the control of the reactor. It has an operation and signal panel with conventional
display and operational elements (Fig. 5) and 3 monitor screens for reactor control and supervi-
sing. On each of these 3 different screens all operational soft-buttons and parameters (Figs. 6,
7 and 8) can be displayed. Alternatively, I&C system announcements or alerts (example in Fig.
9) or different graphic presentations of reactor parameters can be shown. User access permits are
possible by means of key-switches on the conventional operation and signal tableau. The reactor
control is done by point-and-click on the corresponding soft-buttons on the screens.In order to
avoid unwanted reactivity change (especially positive reactivity rise) all corresponding operations

- 8 -
has to be chosen first and then confirmed by a second mouse-click.
Signals of peripheral technical units (ventilation system, subatmospheric pressure in the reactor
tank, local dose rate limits etc.) are displayed on an independent signal panel in the reactor hall
next to the control desk (Fig. 10) even in the case of shut-down reactor.
1.6. Instrumentation and Control (I&C) System with TELEPERM XS
1.6.1. Architecture of the I&C System
The I&C system of the reactor comprises
- the nuclear instrumentation and
- the operational instrumentation with the safety and control system (German abreviation: SUS)
and the control and display units on the control desk.
Purpose of the measuring channels for neutron flux density (nuclear instrumentation) is to control
the reactor in its shut-down subcritical state as well as to supervise the conditions for reactor start-
up and operation in the whole power range.
For this purpose, it provides
- a signal, which is proportional to the reactor power and which quickly follows temporary
changes,
- a signal, which is proportional to the relative neutron flux exchange speed and thus proportional
to the reciprocal reactor period (the so-called RELFAEG signal).
These signals are input parameters for the safety and control system (SUS) and for the control
and display units on the control desk. They are used by the safety and control system (SUS) as
shut-down criteria or for prevention of reactor start-up in case of reactivity irregularities or
malfunction of instrumentation units. Furthermore, these signals are used in the operational
instrumentation in order to allow only permitted operations by the operators.
The digital safety system TELEPERM XS (by AREVA GmbH Erlangen, Germany) serves as
the basis for the technical solution (reactor protection as well as operational instrumentation).
1.6.2. Nuclear Instrumentation
The nuclear instrumentation consists of three independent redundant channels for neutron flux
measurement (digital system TK250, MGP Instruments GmbH Munich, Germany):
- two (logarithmic) wide-range channels (DAK 250-i, pulse measurement with fission chamber
detectors),
- one (linear) power-range channel (DAK 250-g, DC measurement with γ-compensated ionisation
chamber detector).
The neutron flux channels of the TK250 system were developed for BWR and PWR applications
and are designed and certified according to the requirements of the German KTA-3501 safety
standards.

- 9 -
1.6.2.1. Wide-Range Channels (Start-up/Middle/Power Range)
The logarithmic wide-range (start-up/middle/power range) monitors with two redundant
measuring channels DAK 250-i cover 6 decades (approx. 2 ... 2×10 n·cm ·s ) of neutron flux6 -2 -1
density at the measuring location outside the graphite reflector. Fission chambers (type 9R100)
are used as detectors.
In the safety system, the absolute fission chamber signals and the so-called RELFAEG signals
(being reciprocal to the reactor period) are evaluated for the following limits (prevention of the
reactor start-up as well as release SCRAM):
- minimum neutron flux required for reactor start-up (1∪ 2 logic),
- SCRAM signal for exceeding maximum reactor power (1∪ 3 logic together with the signal of
the power-range channel,
- SCRAM signal for too small reactor period (1∪ 2 logic) or too high relative neutron flux
exchange speed (RELFAEG), respectively.
1.6.2.2. Power-Range Channel
The linear power-range channel, DAK 250-g, measures the upper 2 - 3 decades (approximately
5×10 - 2×10 n·cm ·s ) of the neutron flux density at a detector position outside the graphite3 6 -2 -1
reflector. A γ-compensated ionisation chamber is used as a neutron detector. In the safety system,
the chamber signal is evaluated for following limits (release SCRAM):
- SCRAM signal for exceeding maximum reactor power (1∪ 3 together with the signals of the
wide-range channels).
1.6.3. Safety and Control System
The safety and control (German: SUS) system should protect the facility from inadmissible
demands and shall minimize the effects on the staff, the surroundings and the reactor in case of
accidents. The safety and control system causes automatic reactor shut-down (SCRAM) in the
following cases:
- malfunction of drives of control rods, neutron source or core,
- too fast power increase (reactor doubling time < 10 s, warning signal at 20 s),
- too high absolute reactor power (> 2.4 W, warning signal at 2.2 W),
- too low moderator temperature (< 18°C),
- too high pressure in the reactor tank (> -8 kPa),
- in case of malfunctions in the safety and control system,
- non-availability of the I&C computer,
- in case of malfunction in an external experiment (optional),
- in case of malfunctions in the I&C rack,
- an implicit SCRAM is initiated in case of a safety computer failure (fail-safe by closed-circuit
connection).

- 10 -
1.6.4. Safety Relevant Protective Logic
1.6.4.1. Protective Logic for Reactor Start-up
The protective logic for reactor start-up (Fig. 11) guarantees that rector operation is only possible
in the case that all initial requirements are fulfilled and the correct command sequence is
maintained.
Initial conditions are:
- no SCRAM signal, no warning signal, no alarm signal,
- neutron start-up source is in its container AND position signalisation works correctly,
- lower core section is in lower end position AND position signalisation works correctly,
- all control rods are in their end position (shut-down position) AND position signalisation works
correctly,
- key-lock for RESA-Reset (SCRAM) was triggered.
If all conditions are fulfilled, the start-up neutron source drive will be released.
The lower core section drive mechanism is released for lifting, if
- start-up neutron source is in its upper end position AND required minimum count rate at the
neutron instrumentation was measured (about 2-3 cps).
The drive mechanism for control rod withdrawal is released, if
- lower core section is in its upper end position (upper and lower core sections close together)
AND minimum required neutron count rate at the neutron instrumentation was measured (about
2-3 cps) AND key-lock for reactor start-up is in its ON-position.
An interlock circuit guarantees that not more than only one control rod can be withdrawn from
the core at the same time.
At a reactor power >0.25 W the start-up neutron source can be driven back down into the
container.
1.6.4.2. Protective Logic for the Critical Experiment
In the critical experiment it must be possible to withdraw the control rods even in that case that
the lower core section is not in its upper end position.
At first, initial conditions are the same as in 1.6.4.1.:
- no SCRAM signal, no warning signal, no alarm signal,
- neutron start-up source is in its container AND position signalisation works correctly,
- lower core section is in lower end position AND position signalisation works correctly,
- all control rods are in their end position (shut-down position) AND position signalisation works
correctly,
- key-lock for RESA-Reset (SCRAM) was triggered.
If all conditions are fulfilled, the start-up neutron source drive will be released.

- 11 -
If the start-up neutron source is in its upper end position AND required minimum count rate at
the neutron instrumentation was measured (about 2-3 cps) AND, additionally, the key-lock
"Simulation KHZ" was triggered, than the control rods can be withdrawn even in the case that
the lower and upper core sections are not connected.Also in this case, the interlock circuit for
control rod movement is active, that only one control rod after the other one can be withdrawn.
1.6.5. Operational Functions
1.6.5.1. Automatic Reactor Power Control
At AKR-2, an automatic reactor power control is available with following properties:
- preset of a desired value of reactor power on the monitor screen of the control desk,
- selection of control rod for automatic power control (on the screen of the control desk),
- switch for manual/automatic power control (on the screen of the control desk),
- in the case that the selected control rod could go to its end position without obtaining the
desired power value, the next control rod is automatically used for control,
- manual movement of a non selected rod is possible in the automatic mode, too, unless the end
position has been reached.
1.6.5.2. Control Rod Drop
The possibility exists, to switch off manually the holding magnets of any single (or all together)
control rods via soft-buttons on the monitor screens of the control desk.In that case, the control
rod(s) drop into the shut-down position very fast only by gravity. For quality assurance, the drop
down time is measured and can be displayed on the monitor screen of the control desk (Fig. 8).
1.6.5.3. SCRAM
Fast reactor shut-down (SCRAM, or in German: RESA) is activated in case of according criteria
of the safety and control system (SUS). Additionally, SCRAM is possible at any time by manual
activation (red button "Hand-RESA" on the conventional operation and signal panel left on the
control desk, see Fig. 5), which has to be released after activation.
For fast reactor shut-down (SCRAM), there are two shut-down systems available in diversity:
- drop-down of the control rods (triple redudancy) and
- disconnection of the two core sections (drop-down of the lower core section)
Both shut-down mechanisms are effective only by gravity, i.e. no any additional energy supply
is required.
For quality assurance, the drop-down time of the control rods and of the lower core section to
reach their shut-down positions are measured and can be displayed on the monitor screen of the
control desk (Fig. 8).
- 12 -
1.6.6. System Messages
1.6.6.1. Reactor Signalisation System
Three categories of signals are initiated according to their safety-related relevance:
- Status signals (Zustandsmeldungen) are messages, which inform the operator about the status
of the system (drive ON/OFF, release of any action available / not available). At AKR-2 status
signals are shown on the screens of the control desk.
- Fault signals (Störmeldungen) indicate a not specified abnormal operation in the operational
or (as far as this signal is integrated in a safety alarm signal (see below)) in the safety system.
At AKR-2 fault signals are shown on the monitor screens of the control desk (list of system
messages, see Fig. 9) and have to be acknowledged by the operator on the screen. Fault signals
will be saved in the reactor log datafile.
- Safety alarms (Gefahrenmeldungen) indicate a not specified abnormal operation in the safety
system with audible and/or visual signals and must be prompted by the operator to clear the
malfunction.
Safety alarms are displayed at the conventional operation and signal panel on the control desk
as follows:
- incoming or newly excited signal (unconfirmed): fast flashing
- still existing signal (confrmed): permanent light
- going signal: slow flashing
- deleted signal: dark (no light)
Both, the safety alarms itself as well as the single alarms, from which they are generated, are
additionally displayed on the screens of the control desk and filed and saved in the operational
instrumentation.
1.6.6.2. Safety Alarms
1.6.6.2.1. Process-Orientated Safety Alarms
As process-orientated safety alarms all those criteria are summarised, which result in a reactor
SCRAM due to exceeding specified safety thresholds or malfunctions of drives:
- "Neutron flux density > max"
(1∪ 3 link of the thresholds in the wide-range channels WB1/WB2 and power-range channel
LB)
- "doubling time < min"
(1∪ 2 link of the thresholds in the wide-range channels WB1/2)
- "moderator temperature < min"
(1∪ 2 link of the thresholds of the temperature 1/2 moderator < min)
- "reactor tank subatmospheric pressure > max"
- "any drive working without control signal"
(contactor of a control rod OR of the lower core section OR of the neutron start-up source
- 13 -
closed AND accordant control signal is not available).
For any of these safety alarms reactor SCRAM (RESA) is initiated.This is displayed on the
screens of the control desk as a status message. After the activation of SCRAM it is checked that
all addressed units have reached their intended shut-down position (control rods and lower core
section in accordant end position). If not, the collective message "Rückmeldung nicht vollzählig"
(response incomplete) will be displayed.
1.6.6.2.2. Safety Alarms of I&C Units
Safety alarms of I&C units are collective messages, which combine all detected malfunctions
in supervised parameters of I&C hardware and software.
- "Schrankstörung" (malfunction in the I&C cabinet)
This alarm is initiated by (at least) one of the following single events:
- "Störung Schrankstromversorgung" (malfunction in I&C cabinet power supply) - Fuse
activated as a collective message for the whole cabinet. This can (depending on the fuse)
result in reactor SCRAM or in non-availability of the control system or of single binary
signals.
- "Einstecküberwachung" (Plug-in supervision) - (unit(s) in the cabinet are pulled out /
removed as a collective message for the whole cabinet). This can (depending on unit) also
result in a SCRAM.
- "Temperatur-/Lüfterüberwachung" (temperature and cooler supervision) - cooler failure or
temperature in the TXS units too high). This results automatically in a shut-down of the
corresponding computer (and furthermore to reactor SCRAM, if the computer of the reactor
safety system is concerned, or to the non-availability of the control system).
- "BASP/WDG angesprochen" ("BefehlsAusgabeSPerren/WatchDoG") - failures of the
computer hardware / cycle time exceeded). This results automatically in the shut-down of
the corresponding computer (and furthermore to reactor SCRAM, if the computer of the
reactor safety system is concerned, or to the non-availability of the control system).
- "Schranktür offen" (door of the TELEPERM XS cabinet open)
The operator is caused to close the door(s) of the cabinet, because they have to keep closed
during operation due to EMC-reasons.
- "Leittechnikstörung 1" (malfunction in I&C system 1)
Summary of all malfunctions as collective message, which are recognised within the computer
of the reactor safety system.
- missing antivalence in binary changeover contacts
- errors in signal input or output in I/O-units
- errors in sending or receiving signals via computer bus-system.
Additionally integration of the message that the computer of the operational intrumentation
is not on cyclical operation.
- "Leittechnikstörung 2" (malfunction in I&C system 2)
Summary of all malfunctions as collective message, which are recognised within the computer
of the operational intrumentation.

- 14 -
- missing antivalence on binary changeover contacts
- errors in signal input or output in I/O-units
- errors in sending or receiving signals via computer serial bus system.
Additionally integration of the message that the computer of the reactor safety system is not
on cyclical operation.
The detailed localisation of malfunctions for the last mentioned two messages is preferably
possible by means of the service computer. The messages which originate in the cabinet
additionally activate a lamp at the top outside of the cabinet.
1.6.6.3. Fault Signals
Fault signals give detailed information on the current status of the I&C system. Fault signals are
displayed on the monitor screens of the reactor control desk and visualised, logged and saved in
the computer-aided operational and supervising system.
1.6.6.4. Releases / Status Messages
The information on the reactor control desk offers a wide overview about the general status of
the I&C system, partly with conventional equipment technology (operation and signal panel) and
partly with screens (3 monitors).
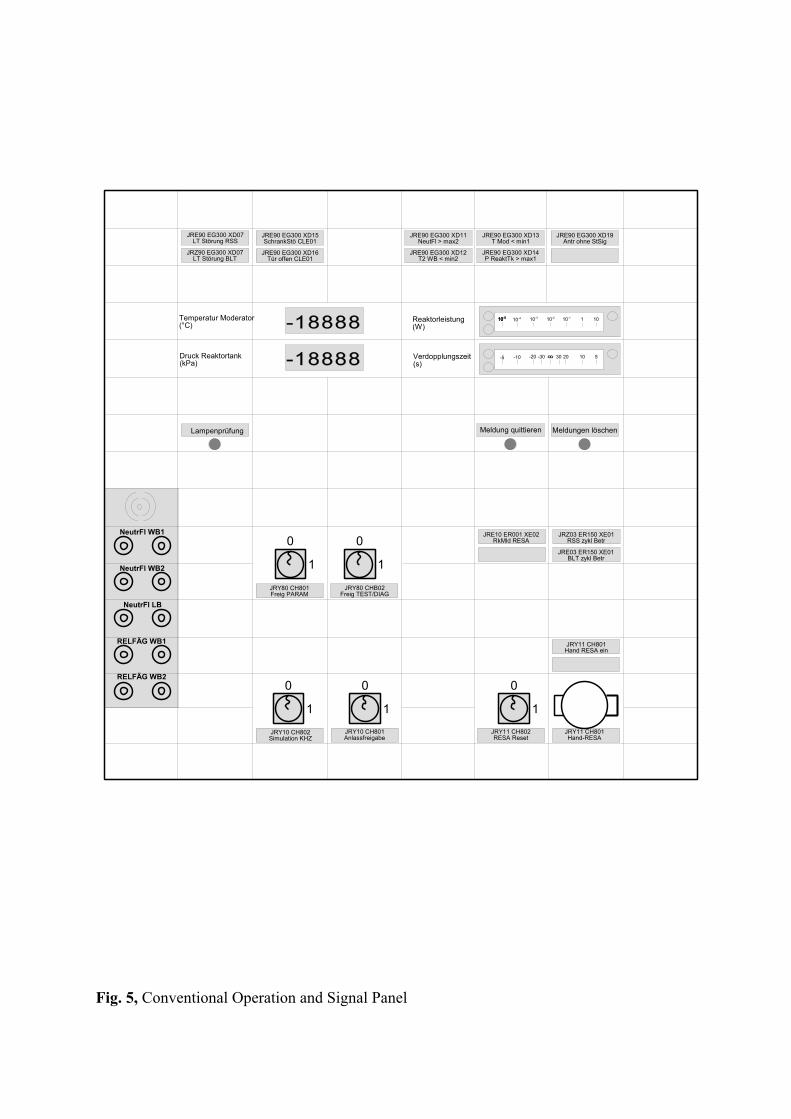
The operation and signal panel (Fig. 5) with conventional equipment technology includes:
- safety alarms class 1,
- key-switches for release and simulation "Kernhälfte in oberer Endlage" (lower core section in
upper end position),
- pushbutton to confirm and delete safety alarms and to check lamps,
- analogous panel meters "Neutronenflussdichte Weitbereich" (neutron flux density wide range),
"Verdopplungszeit" (doubling time),
- digital display of "Temperatur Moderator" (moderator temperature) and "Unterdruck Reaktor"
(subatmospheric pressure in reactor tank).
Additional control elements in conventional techniques on the control panel:
- covered latching button for manual reactor SCRAM ("Hand-RESA"),
- key-switch for RESA-Reset,
- key-switches for releases to change operational modes of the computers.
The reactor facility is controlled and supervised by means of 3 monitor screens on the control
desk, on which messages and facility pictures are displayed (Figs. 6 to 9). These pictures provide
all information for reactor control and displaying of process parameters.
1.6.7. Service Equipment (Diagnostics Interface)
The service equipment is used for planning, configuration, monitoring, maintenance and
modification of the reactor safety system such as:

- 15 -
- diagnostics,
- modification of I&C components,
- modification of parameters,
- documentation and saving of hardware and software specifications.
It can be distinguished between services without required communication with TELEPERM XS
and those with access to the safety units. The following properties characterise the service
equipment:
- It is not part of the safety I&C; therefore, it can be switched off.
- It is never used for reactor operation process management.
- A hierarchically arranged operating surface is provided for user prompts.
- Unauthorized access protection to the service equipment is given by administrative measures
(login/logout function) and additionally by key-operated switches.
- The software is protected against modifications by setting read-only features and additionally
by backup procedures on data storage (CD-ROM).
- The service computer is located in the reactor control desk behind a locked door.
1.6.8. Gateway Interface Computer
The gateway computer sends information from the reactor safety and protection system to the
control and monitoring system (and never in the opposite direction!). The gateway computer is
located in the reactor control desk behind a locked door.
1.6.9. Interconnection between I&C Units
Communications between the reactor protection and the operational computers in the
TELEPERM XS cabinet to the gateway and service computers in the reactor operator control desk
takes place via a fiber optic cable. In a media converter, the signals are converted into electric
signals and transmitted to the gateway and service computers via an Ethernet switch.
Normally, all three monitor screens of the reactor control desk are connected to the gateway
computer. Optionally, the monitor on the right hand side of the control desk can swapped by a
switchbox to the service computer (Fig. 12).
- 16 -
2. Instruction for Reactor Start-up Procedure
2.1. General Remarks
1. In the operation of the AKR-2 three modes of reactor start-up procedures are to distinguish:
- Wiederholungsstart (normal restart),
- Anfahrexperiment (comprehensive start-up experiment),
- kritisches Experiment (critical experiment).
The normal restart is the start-up procedure in routine reactor operation. Restarts are possible,
if nothing has changed since last reactor operation with effect on the reactivity properties of
the facility, neither in the reactor itself nor in the internal experimental arrangements.The
reactivity characteristics and the control rod positions in the critical state of the reactor are
known.
A comprehensive start-up experiment is necessary for a safe reactor start-up after small
material or geometry changes (e.g. new installation of internal experimental arrangements),
which do not require a critical experiment. The behavior and the reactivity properties of the
reactor are known, i.e. the fuel loading, the reflector properties and the reactivity characteri-
stics of the control rods.
A critical experiment has to be carried out, if the physical parameters (e.g. critical mass,
reactivity characteristics of the control rods, excess reactivity etc.) are only known from
calculations. That applies in any case to the first start-up of a newly build reactor and to any
further start-up after all such variations of the assembly when considerable change in the
reactivity behavior is expected.
2. For any reactor start-up a valid written service instruction (BA) signed by the director of the
AKR (Leiter AKR) and the radiation protection commissioner (SSB-AKR) or the correspon-
ding deputies is required.
3. An experiment can be carried out with the same service instruction (BA) several times under
the same conditions if it fits the period of validity of the BA.
4. Before each reactor start-up, a check of the proper function of the units is mandatory.
5. The preparation, the functional check of the equipment and the progress of the starting-up
procedure have to be recorded in the operation logbook of the AKR-2. For that purpose a
given flowchart of the checking and start-up process has to be used (Fig. 13).
6. In the comprehensive start-up experiment and in the critical experiment, the loading of the
experimental channels in the core and in the reflector area as well as the measured pulse rates
have to be recorded in the operation logbook.
7. When the reactor is in the supercritical state, the values of the doubling time, the correspon-
ding control rod positions and after being in the critical state the critical control rod positions
have to be recorded in the operation logbook according to the given flowchart.
- 17 -
8. At all changes in and at the reactor, especially
- adding of extra fuel,
- changes in the experimental channels,
- movement (upwards) of the lower core section,
- withdrawal of the control rods,
- movement of the start-up neutron source
the displays (especially doubling time and reactor power) have to be watched carefully.
In case of fast power increase (in connection with constant doubling times below 30 s) the
reactor has to be down-regulated. At doubling times below 10 s the reactor has to be shut-
down instantly (unless automatically happened).
9. If in the critical experiment and the comprehensive start-up experiment only low pulse rates
(i.e. < 5 cps) are measured, then for each pulse channel all pulse rates have to be determined
as the average from at least 3 single measurements. A valid pulse rate, which shall be
measured only once, must have at least 15 cps.
10. The correct sequence of operational steps in the start-up procedure is assured by the protective
logic (Fig. 11). By means of soft-buttons on the screens of the control desk first step is to
move the start-up neutron source to its upper end position, afterwards to do the same with
lower core section. The successful execution of these steps is required to let the reactor safety
system give release for withdrawing the control rods. This is possible not earlier until the
start-up neutron source AND the lower core section have reached their respective end
positions AND a pre-defined minimum count rate is measured at the neutron flux channels
AND the key-lock "Anlassfreigabe" (start-up release) on the control desk is activated. Thus,
operation errors, which affect the safety of the reactor, are impossible.
11. Too fast power increase (i.e. too short doubling time) or too high absolute power in the start-
up procedure result in an automatic shut-down of the reactor by the safety system.
12. The pictures on the monitor screens of the control desk show a symbolic illustration of each
drive and each control command, which can be addressed by mouse click on soft-buttons.
At the same time (according to the context of the picture), releases, current positions and end
positions of the drives as well as measured doubling time or pulse rates are displayed in order
to see the success and the consequences of the action.
13. All operations have to be done on the control desk manually. Operational elements are
conventional keys and pushbuttons as well as the computer-aided operational and supervising
system which requires actions by keyboard or mouse on soft-buttons on the screens. Only
the (operative classified) power control and the (safety related) fast reactor shut-down
(SCRAM) as well as the optical and acoustical alarm signals in cases of failures work
automatically.
14. On one of the control desk screens, the list of system messages can be displayed as a message
sequence (example see Fig. 9). All fault and alarm signals are listed in this table in the order
of their appearance (and disappearance).Coming as well as going messages are registered.
Coming messages are announced also acoustically, they have to be confirmed by the reactor
operator.
- 18 -
Additionally, alarm signals are displayed on the conventional alarm and signal panel of the
control desk and are acoustically announced. Confirmation also of these signals by the reactor
operator is mandatory. Normally, all alarm signals result in a SCRAM initiated by the reactor
safety system.
15. Since the delay of the subatmospheric pressure control in the ventilation system in the reactor
hall can be up to 20 min, the reactor operation may start not earlier than having passed this
delay time after switching on the ventilation, and if, additionally, LED H13 on the signal
panel does not indicate any failure.
2.2. Start- and Stop-Procedure of the Safety and Control System
For starting the safety and control (SUS) system, there is a combined mains switch on the control
desk to switch on the power supply for the TELEPERM XS cabinet and the control desk of the
reactor. The gateway computer (located in the control desk of the reactor), which connects to the
safety and control system, and in which the operation and supervising system is integrated, has
to be started afterwards manually. The computers in the TELEPERM XS cabinet boot automati-
cally when connected to the power supply. After booting, the reactor protection is in a state, in
which the signal "Reaktor abschalten (RESA)" (= SCRAM) is activated and the electro-magnets
for the control rods and the lower core section are disconnected. The reactor is shut down.
The software of the computer-aided operational and supervising system of the AKR-2 is
programmed in the programming language WinCC.
In detail the safety and control system is put into operation as following:
1. Switch-on the main switch on the right-hand side of the control desk (no. 10 in Fig. 4).
Hereby, the power supply for both the I&C cabinet (24V DC) and the computers in the
control desk (230V AC) is switched on.
2. The TELEPERM XS system in the cabinet starts running automatically.
3. The computers (gateway and service device) have to be switched on manually. The gateway
computer runs automatically until WinCC software is executed. The plant video display is
shown on all three monitor screens.
While WinCC is running the access to the operating system level (Taskmanager, Wind-
ows-Explorer etc.) and to quit WinCC by unauthorised action is blocked. This is only possible
after entering a pre-defined username and a password and is only permitted to the staff. When
clicking a click button the message “Keine Berechtigung” (no authorisation) is displayed.
Pressing <STRG+Tab+n> an entry mask appears, in which the login and the password is to
enter (only permitted to the staff). With the correct entry the click buttons are unblocked for
two minutes.
4. Push the <STRG>-key of the right-hand keyboard on the control desk twice quickly in order
to switch the right monitor screen to the service device.
5. Login at the service device (any user but root).
6. Start the Service-Monitor-Server (SMS) by double click on the button “Start SMS”. This is
required, because TXS, while booting, checks the communication to the gateway and to the
service device. The connection is accepted to be correct not earlier than confirmation signals
from the computers (via the SMS) arrive the TXS processing units. Without successful
confirmation the RESA(=SCRAM)-signal cannot be reset.

- 19 -
7. Afterwards the SMS could be stopped and the service device could be shut down. But
reasonably the SMS should be left running in order to have available possible failure
messages (e.g. telegram failure), which are recorded in the log-datafile of the SMS, for a long
term analysis.
8. Press the <STRG>-key on the right-hand keyboard twice quickly to switch the right monitor
screen back to the gateway.
The safety and control system is switched off like following:
1. Press the <STRG>-key on the right-hand keyboard twice quickly to switch the right monitor
screen to the service device.
2. Quit the SMS (i.e.enter <q> into the window of the SMS + <return>)
3. Quit WinCC:
By pressing <STRG+Tab+n> an entry mask appears, in which the username and the password
has to be entered (only permitted to the staff). With the correct entries the click buttons are
unblocked for two minutes.
4. Shut down the gateway interface computer and the service device in the reactor control desk
(any order).
5. Switch off the mains switch on the right side of the reactor control desk.
2.3. Preparation for Reactor Start-up
For starting the reactor, the signal “Reaktor abschalten (RESA)” (fast reactor shut-down
(SCRAM)), which is saved in the safety system, has to be reset. This is done with a key-switch
on the conventional operation and signal panel of reactor control desk, and only successful in that
case if no shut-down criteria, no alarm signals or operational related failures are queued. After
successful reset of the RESA (SCRAM) signal, the holding magnets for the control rods and the
lower core section are supplied with power and are coupled.
The pre-defined operation actions required for starting the reactor are effected by soft-buttons
on the monitor screens (Figs. 6 and 7) on the reactor control desk. The required and possible
sequence of the reactor operator’s actions is pre-defined technically by the protective logic
(Fig. 11) and administratively by a check list for reactor start-up and operation procedure (Fig. 13)
in the operation logbook and is supervised by the reactor safety system. Operation systems are
blocked until the accordant release conditions are existent.
The preparation for the reactor start includes the check of the radiation protection equipment:
- proper function of the hand-foot-clothes-contamination-monitor (HFK),
- personal equipment with film batches and/or dosemeters for direct reading,
- availability and proper function of the gauged portable, battery-powered X-ray and gamma
dosemeter,
- availability and proper function of the portable, battery-powered neutron dose rate meter,
- operational reliability of the stationary gamma local dose rate devices in the reactor hall (green
panels lighting).

- 20 -
2.4. Safety Check of the Fast Shut-down System
- The reactor facility is started according 2.2. and prepared for start-up according 2.3.
- The neutron source is lifted to its upper end position at lower core section. The position of the
source is displayed on the monitor screen, additionally the arrival at the end position is signaled.
- The lower core section is lifted out of its lower end position. The position of the lower core
section is displayed on the monitor screen. The movement has to be stopped, when the lower
core section has left its lower end position, which is signaled on the monitor screen.
- On the conventional operation and signal panel of the reactor control desk, RESA (=SCRAM)
signal is initiated manually by pressing the red pushbutton "Hand-RESA".
- On the monitor screen, it has to be checked that the lower core section has dropped down
reliably (confirmation by showing the light signal for reaching the lower end position).
For the critical experiment, another extended safety check is necessary:
- The proper shut-down function of the lower core section is checked by the described safety
check according 2.4.
- Additionally to the previous procedure, also the correct drop of the control rods has to be
checked. For this purpose, the protective logic signal "Kernhälften zusammen" (core sections
joined) has to be simulated by turning the key-switch "Simulation KHZ"” (simulation of core
sections in joined state) on the conventional operation and signal panel of the control desk. This
key-switch administratively ensures that switching over to this operating state can only be done
consciously.
- All three control rods are moved out from their internal end position one after another. The
movement has to be stopped, when the corresponding control rod has left its end position,
which is signaled on the monitor screen.
- On the conventional operation and signal panel of the reactor control desk, RESA (SCRAM)
signal is initiated manually by pressing the red pushbutton "Hand-RESA".
- On the monitor screen, it has to be checked that all control rods have dropped down reliably
(confirmation by showing light signals for reaching their end positions).
After this safety check, the facility must not switched off until finishing the critical experiment.
2.5. Normal Restart of the Reactor
1. Before beginning any restart, the reactor facility has to be prepared according chapters 2.2.
and 2.3., and the safety check has to be done according to chapter 2.4. The results of the
safety check have to be recorded in the operation logbook according the flowchart stamp print
(Fig. 13). If all required conditions are met, the reactor can be started.
2. The neutron source is lifted to its upper end position at lower core section. The position of
the source is displayed on the monitor screen, additionally the arrival at the end position is
signaled (end position about 800).
3. After the source is completely in its upper end position and the required neutron flux is
measured, the lower core section is lifted. The position of the lower core section is shown
on the monitor screen. While lifting the lower core section, the displays of the doubling time
and the power meter channels have to be watched carefully. The arrival at end position is
signaled (end position about 506).
4. With the key-switch of the starting release the drives of the control rods are unblocked. The
rod drives are connected in such a way that only one single rod can be selected and moved

- 21 -
in pull-out direction. The sequence of pulling out is arbitrary (if not indicated different
administratively in the service instruction), because each rod approximately has the same
reactivity equivalent.
5. By pulling out the control rods the reactivity change has to be limited. If the control rod
characteristic is not known, a rod must not be lifted more than 5 cm (about 500 digits) at a
time. Between each step a break for at least 1 min must be maintained. The power and
doubling time meters have to be watched carefully at any time.
6. In case of a constant doubling time combined with a permanent power increase the reactor
is supercritical. Now, the rod position may only be changed in such a way that the doubling
time does not fall shorter than 30 s (acoustic alert at 20 s, automatic RESA (SCRAM) at 10 s).
7. The start neutron source can be run out manually at a power exceeding 0.25 W. A small
influence on the reactor behavior has to be expected. The possibly resulting reactivity change
must be compensated by adequate movement of the control rods, so that the reactor power
still increases with a doubling time >30 s.
8. When the intended reactor power given in the service instruction is approaching, the doubling
time is to control to "infinite" (i.e. display of the doubling time at 1000 s) to adjust the critical
state at the required power.
9. The restart is finished by writing the values of the control rod positions, the reactor power
and the time of reaching the critical state into the flowchart stamp in the operation logbook
(Fig. 13).
2.6. Protocol Records in the Operation Logbook
Detailed records of all operations at nuclear facilities are mandatory. These records are important
documents. All entries into the operation logbook have to be done well legible and with ink or
ball-point pen. The sequence of all operations must be reproducible by means of the logbook.
Therefore, all actions at the facility have to be instantly registered with date and time (according
the clock at the reactor facility) and signature.
This is relieved by the pre-defined algorithm of a flowchart control stamp in the operation
logbook (Fig. 13). Entries, which are not pre-defined in the stamp, are written down formlessly
and manually in chronological order below the stamp in the operation logbook with date and
signature of the reactor operator.
For each experiment at the reactor, a corresponding service instruction (BA) with the respective
date is required, from which the number of the instruction, the name of the experiment and the
name of the responsible person for the experiment have to be copied into the flowchart stamp
in the operation logbook.
Before any operation of the AKR-2, the dosemeter equipment of the staff and all other participa-
ting persons as well as the proper function of the instruments and the systems necessary for fast
reactor shut-down (SCRAM) have to be checked. The result is to be noted in the stamp (time of
check and in case of the positive result "i.O." (= o.k.)) and signed by the reactor operator.
Also the core temperature displayed on the conventional operation and signal panel (Fig. 5) has
to be checked and noted in the logbook. All steps of reactor start-up procedure are recorded
during or instantly after their execution.

- 22 -
Usually, the end of any reactor experiment is the shut-down of the facility. The time of this action
has also to be recorded in the logbook. The log is finished with the signature of the operator.

- 23 -
3. Fields of Application of the AKR-2
3.1. Education and Training
The main purpose of AKR-2 and its design basis was and is the education of students in nuclear
and reactor physics, in nuclear engineering as well as to teach fundamental knowledge and rules
in radiation protection and radiation dosimetry (see chapter 4).
3.2. Application in Research Projects
Due to its physical characteristics, a zero power reactor as the AKR-2 offers only limited
possibilities for research. However, it can be used for all those projects where high neutron fluxes
are not required but variable operational conditions and low costs are requested, e.g. investiga-
tions on sophisticated neutron detectors, development of radiation measuring techniques, radiation
spectrometry in mixed neutron-photon fields.
3.3. Information Centre for the Public
One of the great advantages of small, low power training reactors on the campus of a university
is their central location and that not such strict admittance restrictions exist as in many other
nuclear installations. Hence, it is suitable for using these facilities also as information centres for
groups or individuals of the interested public. Besides the transfer of fundamental knowledge,
it is of high importance to enhance the quality of the public discussion about nuclear energy.
4. Examples of Typical Fundamental Training Experiments at AKR-2
A variety of exercises in fundamental neutron, reactor, nuclear and radiation physics as well as
in radiation protection were developed at AKR. For any exercise, scripts are available and can
mostly be downloaded from the AKR-website describing the theoretical basis of the experiment
and providing practical procedures, values to be determined, evaluation procedures as well as
how to discuss results etc. In advance of any practical work, the preparation of the students to
the special exercise is tested by means of a PC-based check list. Results of these tests are used
by the lecturer to identify deficiencies in knowledge or in preparation and to correspondingly
concentrate efforts in colloquia.
4.1. Reactor Start-up Procedure
This is the basic exercise for all programs at the reactor and in most cases the first contact of the
students with the facility. The exercise comprises start-up of the reactor, the adjustment of the
critical state at various power levels, changes of the power level (increasing, decreasing), various
inspections and safety checks of the instrumentation and control units.
- 24 -
Included in that part is the study of fundamental reactor physics effects as:
- correlation between reactivity, reactor period (or doubling time) and reactor power,
- subcritical multiplication of the neutron start-up source,
- prompt reactivity steps,
- stable positive reactor period with exponential power increase in supercritical reactor state,
- correlation between prompt and delayed neutrons,
- control of stable reactor power,
- independence of control rod position in critical reactor state on absolute power level (if effects
of temperature and fuel burnup are negligible as in a zero power reactors),
- influence of the neutron start-up source on the critical reactor,
- dependence of neutron and gamma dose rate on the reactor power and on the distance from the
reactor.
Usually, this part is also the first close contact of the students with the special rules of radiation
protection measures (changing clothes, wearing overshoes and dosemeters, rules of conduct
according to the ALARA-principle, check of contamination when leaving the radiation protection
area etc.).
4.2. Control Rod Calibration
For safe operation of a nuclear reactor it is of high importance to know:
- reactivity values of all control rods in dependence on their position,
- excess reactivity,
- shut-down reactivity brought about by the control rods.
In the exercise position-dependent reactivity values of all control rods are determined by
measurements of the stable reactor period in combination with the reactivity compensation
method. Physical background of the evaluation method is the INHOUR-equation.
Results of the exercise are the integral reactivity curves (total reactivity) as well as the differential
reactivity curves (characterisation of the efficiency of a control rod in a given position). Fur-
thermore, the excess reactivity is calculated as the maximum available reactivity to be released
by withdrawal of all control rods, starting from the critical core. In contrary, the shut-down
reactivity of the control rods is calculated as the negative reactivity value when all control rods
are in their shut-down positions.
4.3. Critical Experiment
The critical experiment is a check of proper fuel loading (critical mass) and core configuration
of a nuclear reactor. At AKR-2 with its well sealed core no exchange of fuel elements is feasible
in student's exercise. Instead, a stepwise variation of the distance of both core sections is carried
out leading to a corresponding variation of the subcritical multiplication of the neutron source.
For any step, the multiplication factor k of the reactor and the corresponding reactivity ρ of the
system are iteratively calculated. The result of this kind of critical experiment is the critical
distance between both core sections.

- 25 -
4.4. Adjoint Flux Function
The intention of the exercise is to investigate influences on reactivity by introducing samples of
different materials (e.g. PVC as a neutron absorber, PE or graphite as typical neutron scattering
materials) into the central irradiation channel of the reactor. The samples are shifted stepwise
inside the channel and the reactor response is measured. The reactivity ρ(x) is evaluated in
dependence on the distance x of the sample from the core centre and compared to calculations.
4.5. Measurement of Radial Neutron Flux Distribution
The knowledge of space dependent radial and axial neutron flux distribution Φ(r) and Φ(z),
respectively, is of high importance in any reactor facility, e.g. in research reactors as entry value
for many experiments (neutron source strength in irradiations) or in power reactors as heat source
distribution. In the experiment, the flux distribution of thermal neutrons Φ (r) is measured inth
radial direction over the diameter of the reactor in the horizontal plane of the central experimental
channel by means of neutron activation technology in Mn activation samples.
4.6. Pile-Oscillation Experiment
While the exercise "control rod calibration" and "adjoint flux function" are based on the
measurement of the stable reactor period (i.e. in the equilibrium state between prompt and delayed
neutrons) pile oscillation experiments require a more detailed way of looking at the theoretical
basics of reactor kinetics including the solution of point kinetic equations for time dependent
reactivities ρ(t). By means of a mechanical pile-oscillator fitted to the central experimental
channel of the reactor the function x(t) as sample position in dependence on time is measured
using a multichannel analyser which is operated in multi-scaling mode. This function is weighted
with the result of the adjoint flux function ρ(x) in order to get ρ(t). The experimental result will
be compared with an independent calculation.
4.7. Demonstration of Neutron Activation and Decay of Various Radioisotopes
The production of radionuclides by neutron capture is one important application of many research
reactors. Of course, in the low neutron flux density of a zero power training reactor no real
production of nuclides is possible in industrial scale, but the effect of the production of radioactive
nuclei itself can be demonstrated as well. Activation, saturation and subsequent decay can be
investigated in dependence on reactor power (i.e. neutron flux density), time, capture cross
section, half live time, sample size etc. Students get the experience that materials are activated
in the neutron field but they acknowledge in the same way that activity decreases subsequent to
the irradiation according to the law of radioactive decay. Experimental results are compared to
calculations on relative and absolute scale.
- 26 -
4.8. Identification of Radionuclides by means of High Resolution Gamma Spectroscopy
High resolution gamma spectrometry is one of the mostly used techniques for non-ambiguous
identification of radionuclides. Physical properties of different kinds of detectors (e.g. simple
traditional NaJ-scintillator/photomultiplier-combinations with their high efficiency but compara-
bly poor energy resolution and actual HPGe semiconductor detectors) and required features of
amplifiers and multichannel analysers are investigated. The HPGe-spectrometer is calibrated in
its energy scale as well as with respect to absolute energy dependent efficiency using a set of well
known calibration sources. The procedure of neutron activation analysis (NAA) is demonstrated
by activation of "unknown" samples in an irradiation channel of the reactor and subsequent
identification of the isotopic composition qualitatively and quantitatively. Traces of radionuclides
can be measured and identified in samples taken from natural environment (e.g. K-40) or
industrial goods (e.g. ancient tiles or watches). Another issue of NAA is the use of activation foils
for the determination of absolute neutron flux densities in different energy ranges at nuclear
facilities according to the conversion of the formula for activation with respect to the neutron flux
as unknown value.
4.9. Radiation Protection and Shielding
In this experiment, the students obtain knowledge of dosimetric units and of dosimetric limits
defined in the German Radiation Protection Ordinance. Characteristics of ionising radiation are
highlighted and from these characteristics essential principles of radiation protection are derived
and deepened. The student gets experience in the correct use of suitable kind of measuring devices
for the different types of radiation and measuring conditions as well as in the evaluation of
measured values. Fundamental rules of radiation protection according to the ALARA-principle
are demonstrated experimentally such as: keep distance, use shieldings, shorten time in radiation
fields.
The fundamental physical dependences of dose rates or of total doses on these parameters are
explored. Efficiencies of several shielding materials as Pb, Fe or different qualities of concrete
are investigated and shielding coefficients are derived and compared with data in literature. Using
these data, required thicknesses of shieldings can be calculated and experimentally verified in
order to get defined dose rates meeting given conditions at the reactor.
4.10. Radiation Measurement Techniques
Fundamental characteristics of different kinds of radiation detectors are explored with special
attention to gas-filled ionisation detectors like ionisation chambers, proportional and Gei-
ger-Mueller-counters. The dependence of the counting rate on high voltage is measured and
discussed with reference to the adjustment of suitable parameters for proper application. Students
become familiar with the statistical character of any measured value being essential for assess-
ment of accuracy (Gaussian-distribution of measured data, arithmetic mean value, statistical
uncertainties, standard deviation). Attenuation curves are measured for different materials and
linear as well as mass attenuation coefficients are determined and discussed.

reactor vessel with biological shield
experimental channels (vertical)
top cover of the reactor
graphite reflector
experimental channels (horizontal)
reactor core
neutron source
control rods
vacuum system(reactor tank)
container of theneutron source
drive mechanism forlower core section andneutron source
vacuum pump
radial experimentalchannel
vacuum controller
ground floor level
1 m
Fig. 1, Vertical Cross Section of the Training and Research Reactor AKR-2

2
1
baryte heavyconcrete(58 cm)
reactor tank withcore
horizontal experimental channels:1 - 2 central channel3 - 4 tangential channel5 - 6 tangential channel7 radial channel
paraffin(15 cm)
steel vesselwalls
graphitereflector(32 cm)
air gap(7 cm)
combined controland safety rods(1 to 3)
1 m
Fig. 2, Horizontal Cross Section of the Training and Research Reactor AKR-2 at Core Level
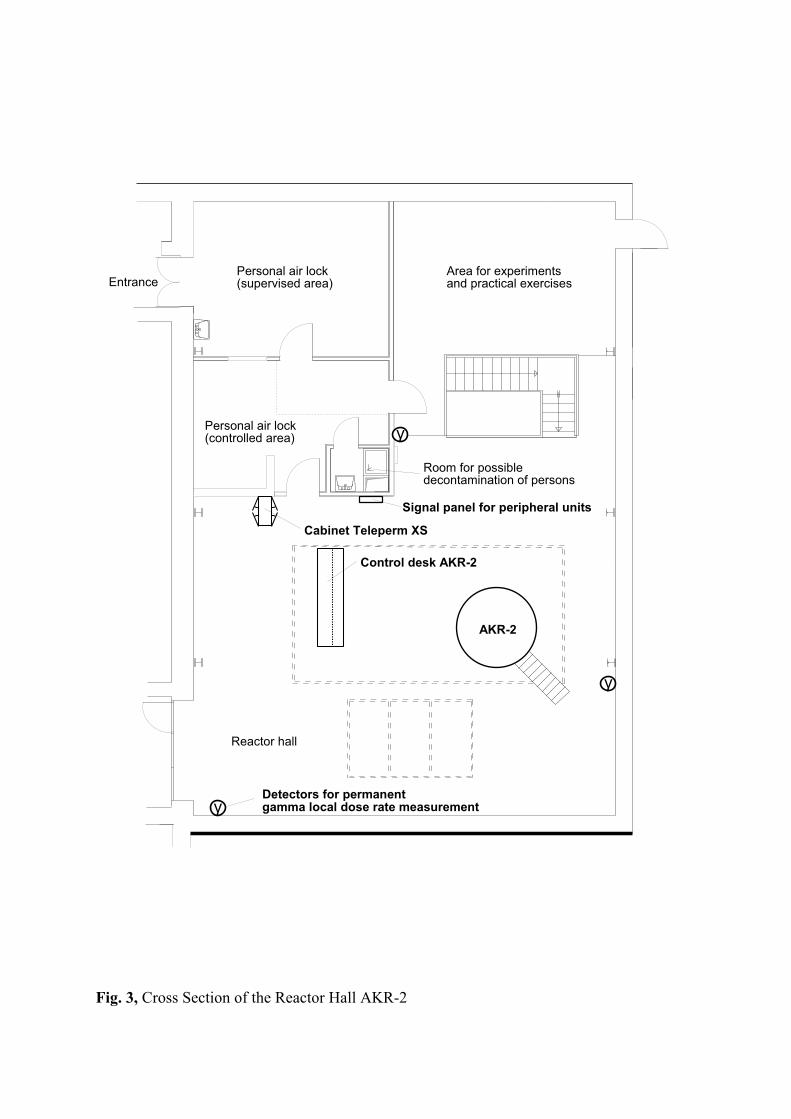
AKR-2
Personal air lock(supervised area)
Area for experimentsand practical exercises
Personal air lock(controlled area)
Room for possibledecontamination of persons
Control desk AKR-2
Reactor hall
Cabinet Teleperm XS
Entrance
Signal panel for peripheral units
Detectors for permanentgamma local dose rate measurement
γ
γ
γ
Fig. 3, Cross Section of the Reactor Hall AKR-2

3
4
5 6
1 22 2
9
87
10
1 Conventional Operation and Signal Panel
2 Monitor screens
3 Service computer (Diagnostics Interface)
4 Gateway Interface Computer
5 Keyboard for Gateway Interface Computer
6 Keyboard for Service Computer
7 PC-Mouse for AKR-2 Control
8 PC-Mouse for Service Computer
9 Hardcopy Printer
10 Mains Switch (for Electrical Power Supply of Reactor)
Fig. 4, Control Desk of AKR-2
0
1
JRY80 CH801Freig PARAM
JRY80 CHB02Freig TEST/DIAG
JRY10 CH802Simulation KHZ
JRY10 CH801Anlassfreigabe
NeutrFl WB1
NeutrFl WB2
NeutrFl LB
RELFÄG WB1
RELFÄG WB2
Reaktorleistung(W)
Verdopplungszeit(s)
10-5
10-5
10-410
-510
-310
-210
-11 10
-5 -10 -30 30 10 5
JRY11 CH802RESA Reset
JRY11 CH801Hand-RESA
Lampenprüfung Meldung quittieren Meldungen löschen
Druck Reaktortank(kPa)
Temperatur Moderator(°C)
JRE90 EG300 XD07LT Störung RSS
JRZ90 EG300 XD07LT Störung BLT
JRE90 EG300 XD15SchrankStö CLE01
JRE90 EG300 XD16Tür offen CLE01
JRE90 EG300 XD11NeutFl > max2
JRE90 EG300 XD12T2 WB < min2
JRE90 EG300 XD13T Mod < min1
JRE90 EG300 XD14P ReaktTk > max1
JRE90 EG300 XD19Antr ohne StSig
JRE10 ER001 XE02RkMld RESA
JRZ03 ER150 XE01RSS zykl Betr
JRE03 ER150 XE01BLT zykl Betr
JRY11 CH801Hand RESA ein
20-20
0
1
0
1
0
1
0
1
Fig. 5, Conventional Operation and Signal Panel

JDA01
+0
+2000
+4000
Ein-heiten
Einheiten0
oE
JDA02
+0
+2000
+4000
Ein-heiten
Einheiten0
oE
oE
JDA03
+0
+2000
+4000
Ein-heiten
Einheiten0
AusfahrstellungSteuerstäbe
oE
uE
uE
Melde-liste
Grafik konfig.
NeutrFl WB1 2
0,000023
PHI-WB1
Reaktorleistung (W)
WINDOWS-Explorer
NeutrFl LB
T2 WB1 2
T1/2 Mod
P ReaktTk
Reg Sollwert
Stellung ANQ
Stellung uKH
Stellung Stäbe
Bild 1 Bild 2Bild 1
Bild 3
Bild 1
Tabelle
0,000027
PHI-WB2
0,2
Impulsrate (Imp/s)
0,3
887
Verdopplungszeit T2 (s)
1000
21,6
T1 Mod
Moderatortemperatur (°C)
21,7
T2 Mod
-15,0
P ReaktTK
Unterdruck Reaktortank (kPa)
PHI-LB
Reaktorleistung (W)
0,50+520
+260
+0
Ein-heiten
Einheiten0
Stellunguntere Kernhälfte
JDE01
+800
+400
+0
Ein-heiten
Einheiten0
StellungAnfahrneutronenquelle
JKB01
Melde-liste
Grafik konfig.
NeutrFl WB1 2
NeutrFl LB
T2 WB1 2
T1/2 Mod
P ReaktTk
Reg Sollwert
Stellung ANQ
Stellung uKH
Stellung Stäbe
Bild 1 Bild 2Bild 1
Bild 3
Bild 2Rechner zyklischer Betrieb
keine RESA-Auslösung
ANQ in unterer Endstellung
uKH in unterer Endstellung
StSta 1-3 obere Endstellung
ANQ in oberer Endstellung
MindestneutrFl vorhanden
uKH in oberer Endstellung
Simulation KH zusammen
Anlassschalter EIN
StSta1
ANQ
uKH
StSta2 StSta3
Hand/Auto
höher/tiefer
Einheiten
0,06
Anfahrneutronenquelle
untere Kernhälfte
Steuerstab 1 Steuerstab 2 Steuerstab 3
Regelung
Stellung
Stellung Stellung Stellung
0 Einheiten
Einheiten Einheiten Einheiten
0
Stellung
Regelungssollwert
Freigabe: Einfahren Ausfahren
Freigabe: Heben Senken
Freigabe: Einfahren Ausfahren Einfahren Ausfahren Einfahren Ausfahren
Autoanwahl
StSta1 StSta2 StSta3
0 0 0
Hand Auto
W
Fig. 6, Monitor Screen, Picture 1
Fig. 7, Monitor Screen, Picture 2

Grafik konfig.
NeutrFl WB1 2
NeutrFl LB
T2 WB1 2
T1/2 Mod
P ReaktTk
Reg Sollwert
Stellung ANQ
Stellung uKH
Stellung Stäbe
Bild 1 Bild 2Bild 1
Bild 3
Bild 3Fallzeiten (ms)
0 00 0
untere KH StSta1 StSta2 StSta3
Melde-liste
Grafik konfig.
NeutrFl WB1 2
NeutrFl LB
T2 WB1 2
T1/2 Mod
P ReaktTk
Reg Sollwert
Stellung ANQ
Stellung uKH
Stellung Stäbe
Bild 1 Bild 2Bild 1
Bild 3
... Art Variable Meldetext Grenzwert/Funktion Zustand Datum Uhrzeit
1 Status JRG00EG360XD42 BLT zyklischer Betrieb angesprochen 19.07.05 11:21:45 2 Status JRG10ER200XE13 Neutronenfluss WB1 < min1 2 Imp/s angesprochen 19.07.05 11:21:45 3 Status JRG10ER200XE23 Neutronenfluss WB2< min1 2 Imp/s angesprochen 19.07.05 11:21:45 4 Status JRG00EG360XD51 ANQ uE angesprochen 19.07.05 11:21:45 5 Status JRG00EG360XD53 untere KH uE angesprochen 19.07.05 11:21:45 6 Status JRG00EG360XD54 Steuerstab 1 oE angesprochen 19.07.05 11:21:45 7 Status JRG00EG360XD55 Steuerstab 2 oE angesprochen 19.07.05 11:21:45 8 Status JRG00EG360XD56 Steuerstab 3 oE angesprochen 19.07.05 11:21:45 9 Status JRG00EG360XD57 Steuerstäbe1-3 oE angesprochen 19.07.05 11:21:45 10 Status JRG00EG360XD43 RSS zyklischer Betrieb angesprochen 19.07.05 11:21:45 11 Status JRZ10ER211XE01 Antrieb untere KH uE angesprochen 19.07.05 11:21:45 12 Status JRZ10ER212XE11 Antrieb Steuerstab 1 uE angesprochen 19.07.05 11:21:45 13 Status JRZ10ER212XE11 Antrieb Steuerstab 2 uE angesprochen 19.07.05 11:21:45 14 Status JRZ10ER212XE31 Antrieb Steuerstab 3 uE angesprochen 19.07.05 11:21:45 15 Status JRZ10ER902XE61 ANQ einfahren Freigabe angesprochen 19.07.05 11:21:45 16 Status JRZ52DX107XE12 Hand-Reaktorregelung ein angesprochen 19.07.05 11:21:45
AlleMeldungenquittieren
Fig. 8, Monitor Screen, Picture 3
Fig. 9, Monitor Screen, List of System Messages (example)

AKR=EP1-EA01
Unterdruck Reaktortank
Aus Ein
Zu- /Abluftanlage
SollwertRaumtemperatur
Quittierung LED-Prüfung
Ortsdosisleistung erhöht
Räumung
Betrieb Reaktor
Störung Brandmeldeanlage
Störung Einbruchmeldeanlage
Störung USV
Störung Notlicht
Bereitschaft Zu- / Abluftanlage Reaktorhalle
Betrieb Zuluftanlage Reaktorhalle
Betrieb Abluftanlage Reaktorhalle
Störung Zu- / Abluftanlage Reaktorhalle
Störung Unterdruck Reaktorhalle
Betrieb Abluftanlage Handschuhkasten
Störung Abluftanlage Handschuhkasten
Automatikbetrieb Abluftanlage Reaktortank
Störung Unterdruck Reaktortank
Störung Auffanganlage
Störung Leckage Pumpensumpf
Indicators:Ortsdosisleistung erhöht Local dose rate above thresholdRäumung EvacuationBetrieb Reaktor Reactor in operationStörung Brandmeldeanlage Fault in fire alarm systemStörung Einbruchmeldeanlage Fault in alarm system for detection of un-authorised accessStörung USV Fault in uninterruptible power supplyStörung Notlicht Fault in emergency lightBereitschaft Zu-/Abluftanlage Reaktorhalle Standby of ventilation in reactor hallBetrieb Zuluftanlage Reaktorhalle Operation of supply air system in reactor hallBetrieb Abluftanlage Operation of extracted air system in reactor hallStörung Zu-/Abluftanlage Reaktorhalle Fault in ventilation system in reactor hallStörung Unterdruck Reaktorhalle Fault in subatmospheric pressure in reactor hallBetrieb Abluftanlage Handschuhkasten Operation of extracted air system in glove boxAutomatikbetrieb Abluftanlage Reaktortank Automatic operation of subatmospheric pressure system in
reactor tankStörung Unterdruck Reaktortank Fault in subatmospheric pressure system in reactor tankStörung Auffanganlage Fault in drain pan for possibly contaminated waterStörung Leckage Pumpensumpf Fault in pump sump on basement floorUnterdruck Reaktortank (kPa) Value of subatmospheric pressure in reactor tank (kPa)
Keys / Switches:Sollwert Raumtemperatur Desired value of room temperature in reactor hallZu-/Abluftanlage Ein/Aus Ventilation system in reactor hall ON/OFFQuittierung Acknowledgement of signalsLED-Prüfung Functional check of LED-lights
Fig. 10, Signal and Key Panel for Peripheral Units

Hauptschalter “EIN”
Rechner zyklischer Betrieb
keine Abschaltkriterien, Warn-meldungen, leittechnische Störungen
"Reaktor abschalten (RESA)"zurückgesetzt
ANQ in unterer Endstellung
uKH in unterer Endstellung
StSta 1-3 obere Endstellung
Neutronenquelle im Reaktor
Mindestneutronenfluss vorhanden
uKH in oberer Endstellung
Anlassschalter EIN
Mindestleistung vorhanden
ANQ ausfahrbar
Reaktor kritisch
Kernhubwerk freigegeben (heben)Lower core section drive released (up)
Steuerstäbe einzeln ausfahrbereitControl rod drives released (out)
Quellenantrieb freigegeben (ausfahren)Neutron start-up source released (down)
Antrieb ANQ freigegeben (einfahren)Neutron start-up source released (up)
Mains power switch ON
Computers in cyclical operation
No SCRAM criteria, alarm signals,detected faults in instrumentation
SCRAM signal cleared
Neutron start-up source in container
Lower core section in shut-down position
Control rods 1-3 in shut-down position
Neutron start-up source in reactor
Minimal required neutron flux detected
Lower core section in upper end position
Start-up key-lock ON
Mains power switch ON
Minimal reactor power detected
Neutron start-up source can bedriven down into the container
Reactor in critical state
Fig. 11, Protective Logic for Reactor Start-up Procedure

TXS cabinetCLE01
Reactor control deskCWA01
Monitor 3 Monitor 2 Monitor 1
Switchbox
Service unit Gateway
PrinterSwitch
BLT:
Port 4
RSS:
Port 2
Media converter
Reactorprotectionsystem(RSS)
Operationalinstrumen-tation(BLT)
∼∼
Fig. 12, Combination of the Safety and Control System (SUS)
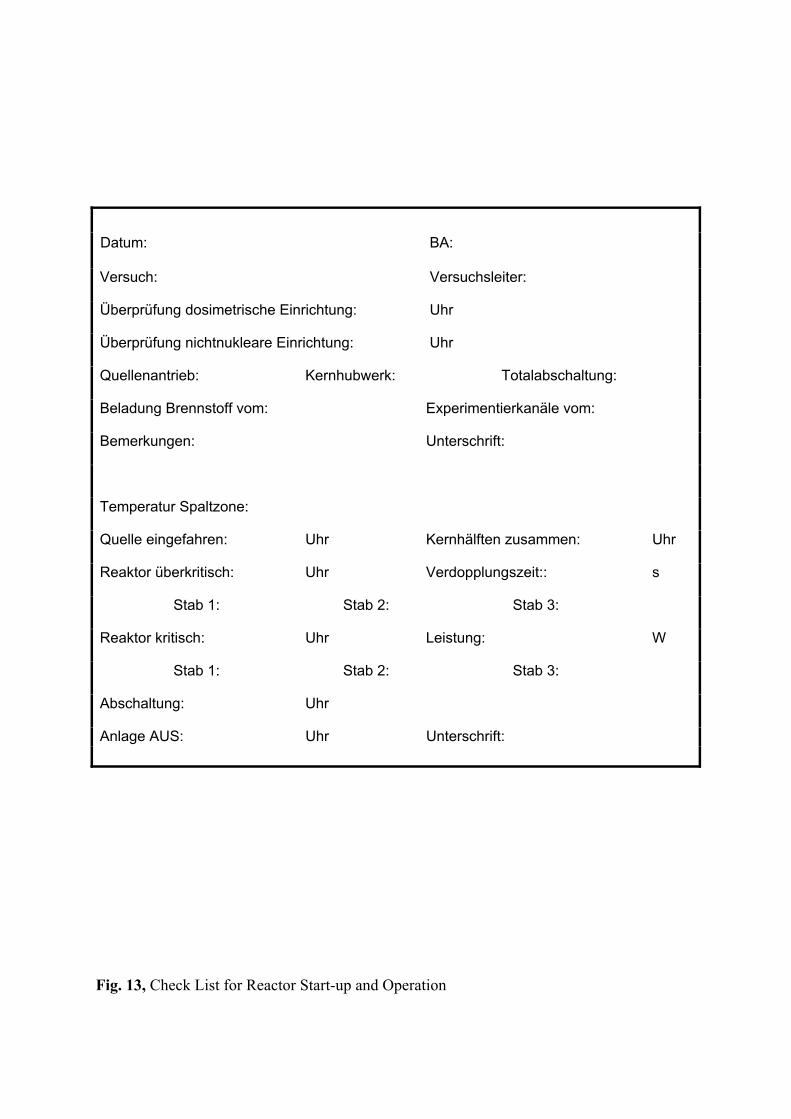
Datum: BA:
Versuch: Versuchsleiter:
Überprüfung dosimetrische Einrichtung: Uhr
Überprüfung nichtnukleare Einrichtung: Uhr
Quellenantrieb: Kernhubwerk: Totalabschaltung:
Beladung Brennstoff vom: Experimentierkanäle vom:
Bemerkungen: Unterschrift:
Temperatur Spaltzone:
Quelle eingefahren: Uhr Kernhälften zusammen: Uhr
Reaktor überkritisch: Uhr Verdopplungszeit:: s
Stab 1: Stab 2: Stab 3:
Reaktor kritisch: Uhr Leistung: W
Stab 1: Stab 2: Stab 3:
Abschaltung: Uhr
Anlage AUS: Uhr Unterschrift:
Fig. 13, Check List for Reactor Start-up and Operation
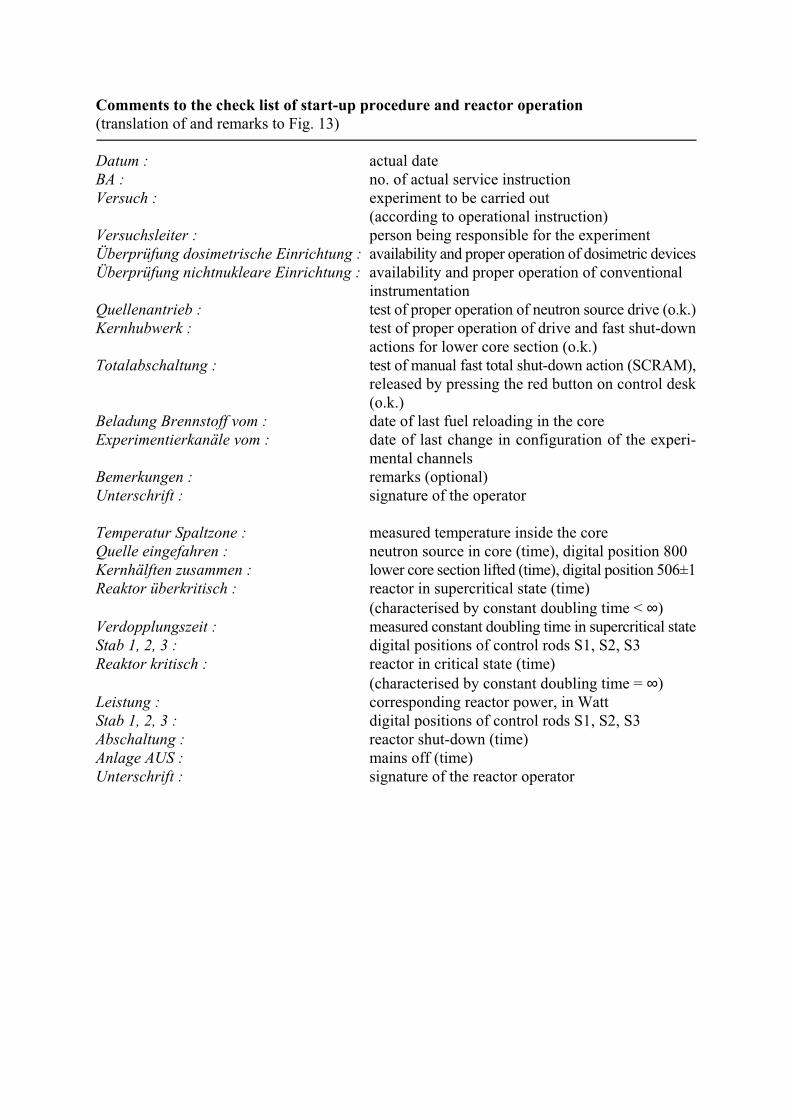
Comments to the check list of start-up procedure and reactor operation
(translation of and remarks to Fig. 13)
Datum : actual date
BA : no. of actual service instruction
Versuch : experiment to be carried out
(according to operational instruction)
Versuchsleiter : person being responsible for the experiment
Überprüfung dosimetrische Einrichtung : availability and proper operation of dosimetric devices
Überprüfung nichtnukleare Einrichtung : availability and proper operation of conventional
instrumentation
Quellenantrieb : test of proper operation of neutron source drive (o.k.)
Kernhubwerk : test of proper operation of drive and fast shut-down
actions for lower core section (o.k.)
Totalabschaltung : test of manual fast total shut-down action (SCRAM),
released by pressing the red button on control desk
(o.k.)
Beladung Brennstoff vom : date of last fuel reloading in the core
Experimentierkanäle vom : date of last change in configuration of the experi-
mental channels
Bemerkungen : remarks (optional)
Unterschrift : signature of the operator
Temperatur Spaltzone : measured temperature inside the core
Quelle eingefahren : neutron source in core (time), digital position 800
Kernhälften zusammen : lower core section lifted (time), digital position 506±1
Reaktor überkritisch : reactor in supercritical state (time)
(characterised by constant doubling time < ∞)
Verdopplungszeit : measured constant doubling time in supercritical state
Stab 1, 2, 3 : digital positions of control rods S1, S2, S3
Reaktor kritisch : reactor in critical state (time)
(characterised by constant doubling time = ∞)
Leistung : corresponding reactor power, in Watt
Stab 1, 2, 3 : digital positions of control rods S1, S2, S3
Abschaltung : reactor shut-down (time)
Anlage AUS : mains off (time)
Unterschrift : signature of the reactor operator

Glossary (German / English)
Alarmmeldung alarm signal / safety alarm
Betriebliche Leittechnik operational I&C system, operational instrumentation
Betriebsanweisung (BA) service instruction
Betriebsfunktionen operational functions
Betriebsjournal operation logbook
Freigabe release
Gateway Gateway interface computer
Leistungsmesskanal (linear) power-range channel
Meldeliste list of system messages
Meldetableau (conventional) operation and signal panel
Nukleare Instrumentierung nuclear instrumentation
rechnergestütztes
Bedien- und Beobachtungssystem computer-aided operational and supervising system
RESA fast reactor shut-down (SCRAM)
Schlüsselschalter key-lock
Service-Gerät service equipment (diagnostic interface)
Sicherheitsleittechnik reactor protection
Steuerpult control desk
Störmeldung fault signal
SUS safety and control system
Systemsignalisation system messages
Verriegelungskreis protective logic
Weitbereichsmesskanal (logarithmic) wide-range channel
Zustandsmeldung status signal / status message

TECHNICAL UNIVERSITY
DRESDEN
Institute of Power Engineering Training Reactor
Reactor Training Course
Experiment
"Reactor Start-up Procedure"

- 1 -
Instruction for
Experiment “Reactor Start-up”
Content:
1. . . . Motivation
2. . . . Tasks
3. . . . Types of Reactor Start-up
4. . . . Theoretical Background
4.1. . Prompt and Delayed Neutrons
4.2. . Subcritical Reactor
4.3. . Supercritical Reactor
4.3.1. Delayed Supercritical Reactor ( ρ < ß )
4.3.2. Prompt Supercritical Reactor ( ρ > ß )
4.4. . Influence of Reactivity Change Rate
5. . . . Procedure of the Experiment
5.1. . Design and Operation of the AKR-2
5.2. . Normal Restart
5.3. . Power Change
5.4. . Determination of the Operation Condition
6. . . . Instructions Concerning the Protocol
7. . . . Index of Relevant Variables
8. . . . Questions to Answer
Figures:
Fig. 1: Times required for 95 % and 99 % approximation to the maximum asymptotic neutron
density n in dependence on the multiplication factor k and the reactivity ρ max
Fig. 2: Dependence of reactor power on time following a positive reactivity jump (0 < ρ < ß)
Fig. 3: Behaviour of the reactivity for an infinitely slow reactor start-up and for a real reactor
start-up
Fig. 4: Functional layout of the AKR
Fig. 5: Flow chart of the start-up procedure (protective logic)
Fig. 6: Behaviour of reactor power and doubling time in dependence on reactivity ρ
(issued: March 2015)

- 2 -
1. Motivation
With help of training reactor AKR-2 of the Technical University Dresden it can be studied:
- the principle design of a thermal nuclear reactor,
- the function of main components required for a controlled nuclear fission chain reaction,
- basic design of a digital reactor instrumentation and control (I&C) system.
In order to understand the typical control behaviour, the results of the reactor theory which can
be derived from the kinetic reactor equations should be known. By means of reactor power control
display and of the reactor period readings the reactor status should be certainly recognised.
2. Tasks
1. The safety check of the reactor has to be carried out and recorded in the operation logbook
in accordance with the pre-defined check list.
2. The reactor has to be put into operation by a normal restart and should become critical at that
thermal power given in the service instruction (BA) or by the supervisor.
3. For qualitative investigation of the behaviour of a zero-power reactor, power changes have
to be carried out according to instructions by the supervisor.
4. The gamma-ray dose rate has to be measured in dependence on thermal reactor power at
selected test points in the reactor hall.
5. Critical control rod positions have to be determined and discussed in dependence on the
thermal power of the reactor.
3. Types of Reactor Start-up
Starting-up a nuclear reactor means to generate a controlled nuclear fission chain reaction. This
process needs to be controlled clearly and handled safely at all times.
The start-up of a nuclear power plant reactor, i.e. the restart from shut-down condition to high
thermal power (> 1000 megawatts) is an extraordinary complex process because of the necessary
heat removal. The basics of reactor physics can be studied more easily at so-called Zero-Power
Reactors like the AKR-2.
Zero-power reactors are operated only at such low power (watts to kilowatts) that power effects
like
- fuel burn-up,
- poisoning or
- temperature effects
can be virtually neglected during the time of the training. Hence, every start of such a zero-power
reactor corresponds, regarding its nuclear part, to a cold start-up of a power reactor.
Any start-up of zero-power reactors can be classified into three categories:
- normal restart,
- comprehensive start-up experiment,
- critical experiment.
- 3 -
The normal restart is the start-up in routine reactor operation. Restarts are possible, if nothing
has changed since last reactor operation with effect on the reactivity properties of the facility,
neither in the reactor itself nor in the internal experimental arrangements.The reactivity characteri-
stics and the control rod positions in the critical condition of the reactor are known.
A comprehensive start-up experiment is necessary for a safe reactor start-up after minor material
or geometry changes (e.g. after the installation of new internal experimental arrangements) which
do not require a critical experiment. The behaviour and the reactivity properties of the reactor
are known, i.e. the fuel loading, the reflector properties, and the reactivity characteristics of the
control rods.
A critical experiment has to be carried out, if the physical parameters (e.g. critical mass,
reactivity characteristics of the control rods, excess reactivity etc.) are known from calculations
only. This applies, in any case, to the first start-up of a newly build reactor and to any further
start-up after variations of the assembly which let expect a considerable change in the reactivity
behaviour.
4. Theoretical Background
At zero-power reactors, the neutron flux density Φ (unit: neutrons/(cm² · s)) is the quantity to be
controlled. It is proportional to the neutron density (unit: neutrons/cm³) as well as to the reactor
power (unit: watt) and to the total number of the neutrons N in the reactor.
Normally, the shut-down reactor contains almost no free neutrons. Its state regarding neutron
reproduction is characterised by the multiplication factor k < 1. This subcritical condition is
maintained by material and/or geometric conditions in the core, e.g. due to addition of neutron
absorbers, removal of moderator or reflector material, separation of the core into subcritical
masses, etc. By gradually eliminating these conditions, the reactor state can be converted to the
critical condition (k = 1) or to a supercritical condition (k > 1).
In this process it is remarkable, that the neutron flux density rises by several orders of magnitude,
i.e. from a few neutrons up to many millions of neutrons per second and cm² depending on the
eventual power. Therefore, certain start-up rules have to be kept to avoid start-up incidents.
These rules avoid
- mistakes of the reactor operators resulting from misinterpretation of the reactor state,
- too high reactivity change rates,
- a too high excess reactivity ( ρ > ß ). excess
Since criticality can be achieved also at very low power levels, there is the danger of exceeding
the critical point already at very low neutron flux densities and without the reactor operator being
aware of it. Because of the statistical fluctuations at low neutron flux densities, measurements
require detectors with a sluggish time response. The time delay between the occurrence and the
display of flux density changes may cause the operator to assess the reactor state incorrectly and
possibly to increase the multiplication factor to inadmissible supercritical ranges. The resulting
very fast increase of the neutron flux density might be recognised only when intervention is

k 'N
gen
Nabs
% Nleakage
'number of neutrons at time t % l
number of neutrons at time t
- 4 -
(1)
already impossible. Then, harm to the operational staff and damage to the facility could be a
consequence.
Thus, following prerequisites ensure a safe reactor start-up:
- The reactor must be started from an adequately high value of the neutron flux density. The
initial neutron flux density has to be raised such that the neutron detectors deliver proper values.
Usually, at zero-power reactors, an artificial (external) neutron source is used for controlling
the subcritical condition. The subcritical multiplication of the source neutrons provide the
reqiured values of the flux density for the neutron detectors of the reactor instrumentation.
At high power reactors, also neutrons from spontaneous fission and (γ,n)-reactions may be
sufficient for this purpose.
- Limitation of the positive reactivity change rate:
Only those positive values of the reactivity change rate are allowed that
C the reactor can be controlled safely manually during normal operation and
C the I&C-system of the reactor is able to shut-down the reactor reliably if required
(international recommended limit: (dρ/dt) = 10 s ).max
-4 -1
- Limitation of the excess reactivity:
The excess reactivity is limited to values of ρ < ß (at AKR-2: ρ ≈ 0.3 % ). excess excess
4.1. Prompt and Delayed Neutrons
Fission of nuclei of the reactor fuel (e.g. U-235) releases fast neutrons. These neutrons are
released either immediately after the nuclear fission as the so-called prompt neutrons or
originate from a special case of radioactive decay as the so-called delayed neutrons.
The average time between the birth of a fast neutron and the next nuclear fission after slowing
down and diffusion with the formation of a new generation of fission neutrons is called neutron
life time l.
The neutron life time consists of the moderation time (from fast to thermal energy, about 10 s),-5
the diffusion time (entering of the neutron into the fissionable nucleus, about 10 s) and the-4
reaction time (nuclear fission, about 10 s).-15
Consequently, the total time is determined by the longest part, which is the diffusion time.
All neutrons that arise within one neutron life time are considered as one neutron generation.
These neutrons vanish by leakage out of the reactor ( N ) and by absorption ( N ) withinleakage abs
the reactor core. Partly, absorption causes new fissions (provided that the absorption is in the
fuel).
At the time t + l, a new neutron generation has been produced ( N ). Therefore, the multiplica-gen
tion factor k can be written in the following form:

dN
dt' k
N
l&N
l' N
k & 1
l
dN
N'k & 1
ldt
N(t) ' N0@ e
k & 1
l@ t
' N0@ e
t
T with T 'l
k & 1
T2' ln2 @ T
N(t % 1s)
N(t)' e
1.001 & 1
0.0001 s@ 1s
. 22000
- 5 -
(2)
(3)
(4)
(5)
(6)
Consequently, the number of neutrons per time unit being in the reactor is the balance of those
neutrons being produced ( k · N / l ) and those disappearing ( - N / l ). Hence, the change of the
number of neutrons is given by:
or
which is solved by
where T is called reactor period. The reactor period is that time interval during which the
neutron number N (or in same way M, n or P) increases by a factor of e (≈ 2.71). Because it is
more convenient to determine a change for a factor of 2 (instead of e), it is often common practice
to use the doubling time T instead of reactor period. Reactor period and doubling time are2
connected with each other by the simple relation:
Thus, according to equation (4), the time behaviour of a reactor follows always an exponential
function.
For the assumption that only prompt neutrons would exist in a nuclear reactor (with typical life
times l ≈ 10 s ), a change of the multiplication factor from 1 to 1.001 would cause an enormous-4
increase of the neutron number and consequently of the reactor power within only one second
by a factor of
Such dynamics would be virtually uncontrollable. A nuclear reactor with a controlled chain
reaction would not be feasible.
The control of the chain reaction is possible only due to the existence of the delayed neutrons,
whose properties are summarised in Tab. 1. Delayed neutrons arise in 6 groups (from 6 groups

ldelayed
'1
8'
1
$j6
i'1
$i
8i
' 13.00 s
l ' ldelayed
@ 0.00641 % lprompt
@ 0.99359 ' 0.083s
- 6 -
(7)
(8)
of radioactive precursor nuclei as a very special case of nuclear decay) with half-lives T1/2
between 0.23 s and 56 s. From fission of U-235 only a fraction of ß = 0.641 % is released as
delayed neutrons. The remaining 99.359 % are prompt neutrons.
Group pre- average T 8=ln2/T fraction ß relative neutrons per
i cursor kinetic / s / s compared fraction 10 fissions
energy to all fission a = ß / ß (absolute va-
/ keV neutrons lue)
1/2 i 1/2
-1
i
/ %
i i
3
1 Br-87 250 55.72 0.0124 0.021 0.033 0.52
2 J-137 560 22.72 0.0305 0.140 0.219 3.46
3 Br-89 430 6.22 0.111 0.126 0.196 3.10
4 ? 620 2.30 0.301 0.253 0.395 6.24
5 ? 420 0.61 1.14 0.074 0.115 1.82
6 ? - 0.23 3.01 0.027 0.042 0.66
total 0.641 1.000 15.80
Tab. 1, Properties of delayed neutrons caused by fission of U-235
/Reactor Physics Constants, ANL-5800/
The fraction of delayed neutrons compared to all fission neutrons can also be derived using the
last column of Tab. 1. Considering an average of 2.47 released neutrons per fission of a U-235
nucleus, it results ß = 15.80/1000/2.47 = 0.0064 = 0.64 %.
The value ß can vary between 0.5 % and 0.7 % depending on the fuel enrichment, on the
moderator temperature, and in particular on fuel burn-up. At a given nuclear reactor, the fraction
of delayed neutrons is called ß .eff
For reasons of simplicity, the 6 groups of delayed neutrons can be approximately condensed to
one single group with averaged parameters. Thus, using the values of Tab. 1, the average life time
l of the delayed neutrons, can be written asdelayed
This corresponds to an average decay constant 8 = 0.0769 s .-1
For prompt and delayed neutrons together, an effective life time can be calculated by

N(t % 1s)
N(t)' e
1.001 & 1
0.083 s@ 1s
. 1.01
n (t'4) ' S @ l1
1 & k
M '1
1 & k
- 7 -
(9)
(10)
(11)
If the power increase within one second is now calculated again according to (6), taking into
account a change of the multiplication factor from 1 to 1.001, it results
i.e. an increase of reactor power by only 1 %, which can be controlled without any difficulties.
4.2. Subcritical reactor
It can be assumed that the reactor does not contain any free neutrons at the beginning of start-up
( n = 0 ). At the time t = 0, a neutron source shall be inserted into the reactor. After t = l (l =(t=0)
life time of a neutron generation ), the source has produced an average neutron source density
n = S · l . After another neutron generation life time l, this value has increased by the factorSource
k according to equation (1) while, at same time, the source has released additional n = S · lSource
neutrons. Hence, one has
n(t=l) = n = S · l1
n(t=2·l) = n = S · l + S · l · k2
After another life time, n has got multiplied by k again while at same time, the source has2
released additionally n = S · l neutrons, resulting inSource
n(t=3·l) = n = S · l + (S · l + S · l · k) · k3
or in general
n(t) = S · l · (1 + k + k + k + ... )2 3
This is a geometric series that has the limit (in given case of a subcritical reactor with k < 1)
The factor
is called the subcritical multiplication factor.
Equation (10) has the following consequences:
- The subcritical reactor acts as a neutron amplifier (for the neutrons released by the source).
- For the critical reactor ( k = 1 ), after inserting a neutron source, the neutron density would
increase linearly up to infinity. That is because after every single fission, exactly one neutron
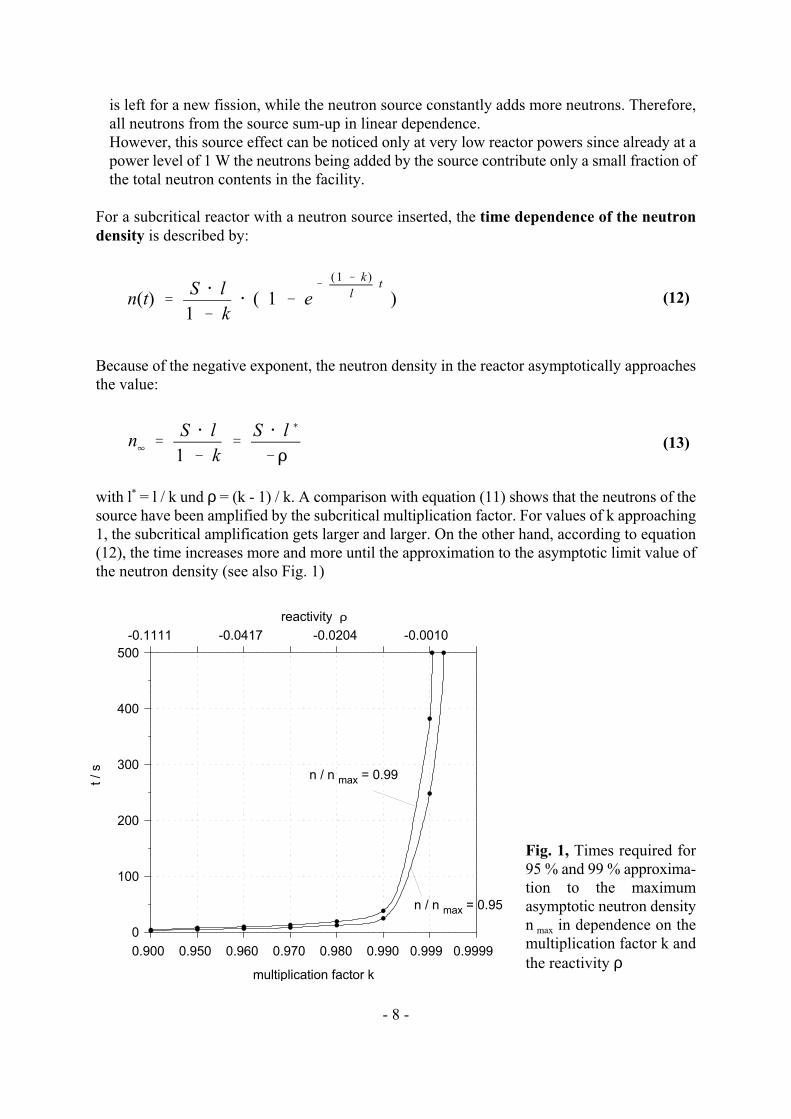
n(t) 'S @ l
1 & k@ ( 1 & e
&(1 & k )
lt
)
n4'S @ l
1 & k'S @ l (
&D
multiplication factor k
0
100
200
300
400
500
t /
s
reactivity ρ
0.900 0.950 0.960 0.970 0.980 0.990 0.999 0.9999
-0.1111 -0.0417 -0.0204 -0.0010
n / n max = 0.99
n / n max = 0.95
- 8 -
(12)
(13)
is left for a new fission, while the neutron source constantly adds more neutrons. Therefore,
all neutrons from the source sum-up in linear dependence.
However, this source effect can be noticed only at very low reactor powers since already at a
power level of 1 W the neutrons being added by the source contribute only a small fraction of
the total neutron contents in the facility.
For a subcritical reactor with a neutron source inserted, the time dependence of the neutron
density is described by:
Because of the negative exponent, the neutron density in the reactor asymptotically approaches
the value:
with l = l / k und ρ = (k - 1) / k. A comparison with equation (11) shows that the neutrons of the*
source have been amplified by the subcritical multiplication factor. For values of k approaching
1, the subcritical amplification gets larger and larger. On the other hand, according to equation
(12), the time increases more and more until the approximation to the asymptotic limit value of
the neutron density (see also Fig. 1)
Fig. 1, Times required for
95 % and 99 % approxima-
tion to the maximum
asymptotic neutron density
n in dependence on the max
multiplication factor k and
the reactivity ρ

nprompt
' k @n & ß @k @n ' n @k (1 & ß)
dnprompt
dt'n @k (1 & ß) & n
l'n
l[k @ (1 & ß) & 1]
dndelayed
dt' j
6
i'1
8i@C
i
dn
dt'dn
prompt
dt%dn
delayed
dt% S '
n
l[k · (1&ß)&1] % j
6
i'1
8i@C
i% S
dn
dt'
D & ß
l (@ n % j
6
i'1
8i@C
i% S
dCi
dt'ß
i
l (@ n & 8
i@C
i( i ' 1, ... , 6 )
- 9 -
(14)
(15)
(16)
(17)
(18)
4.3. Supercritical reactor
With ß being the fraction of delayed neutrons arising from nuclear fission, the number of prompt
neutrons being produced in the reactor within one neutron life time is
For the change of the prompt neutron density within one neutron life time one has:
At the same time, delayed neutrons n result from radioactive decay of certain radionuclides delayed
(delayed neutron precursors) which have been produced in previous fissions. The number of
delayed neutrons can be calculated by means of the law of radioactive decay (considering all 6
groups of delayed neutrons):
Consequently, the total change of the neutron density within one neutron life time is:
Additional application of l* = l / k und k = (k - 1)/k to equation (17) gives the so-called reactor
kinetic equations:
with n @ ß / l* being the number of generated delayed neutron precursors and 8 @ C being thei i i
number of precursors decaying under emission of one neutron. Equations (18) are a system of
7 coupled differential equations. A quite simple approximated solution is achievable by summari-
zing the 6 groups of delayed neutrons in only one single group with the following averaged values
(see also chapter 4.1.):
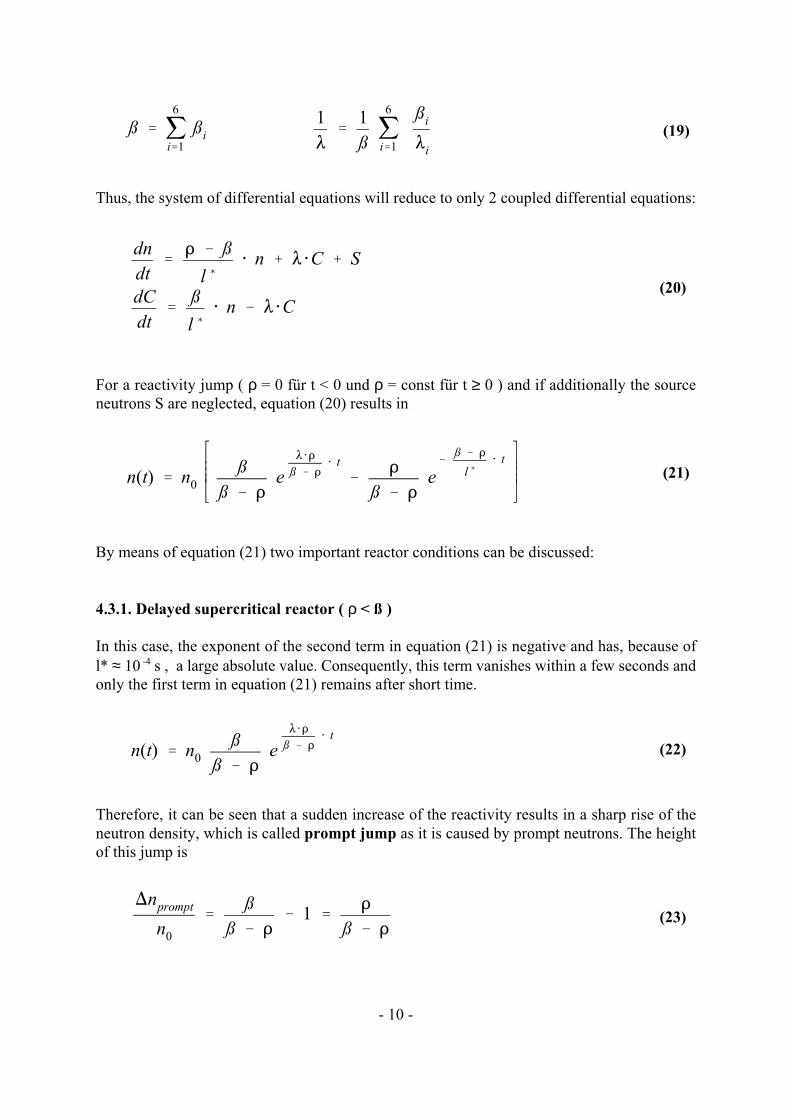
ß ' j6
i'1
ßi
1
8'
1
ßj6
i'1
ßi
8i
dn
dt'
D & ß
l (@ n % 8 @C % S
dC
dt'ß
l (@ n & 8 @C
n(t) ' n0
ß
ß & De
8 @D
ß & D@ t
&D
ß & De!
ß & D
l (@ t
n(t) ' n0
ß
ß & De
8 @D
ß & D@ t
)nprompt
n0
'ß
ß & D& 1 '
D
ß & D
- 10 -
(19)
(20)
(21)
(22)
(23)
Thus, the system of differential equations will reduce to only 2 coupled differential equations:
For a reactivity jump ( ρ = 0 für t < 0 und ρ = const für t ≥ 0 ) and if additionally the source
neutrons S are neglected, equation (20) results in
By means of equation (21) two important reactor conditions can be discussed:
4.3.1. Delayed supercritical reactor ( ρ < ß )
In this case, the exponent of the second term in equation (21) is negative and has, because of
l* ≈ 10 s , a large absolute value. Consequently, this term vanishes within a few seconds and -4
only the first term in equation (21) remains after short time.
Therefore, it can be seen that a sudden increase of the reactivity results in a sharp rise of the
neutron density, which is called prompt jump as it is caused by prompt neutrons. The height
of this jump is
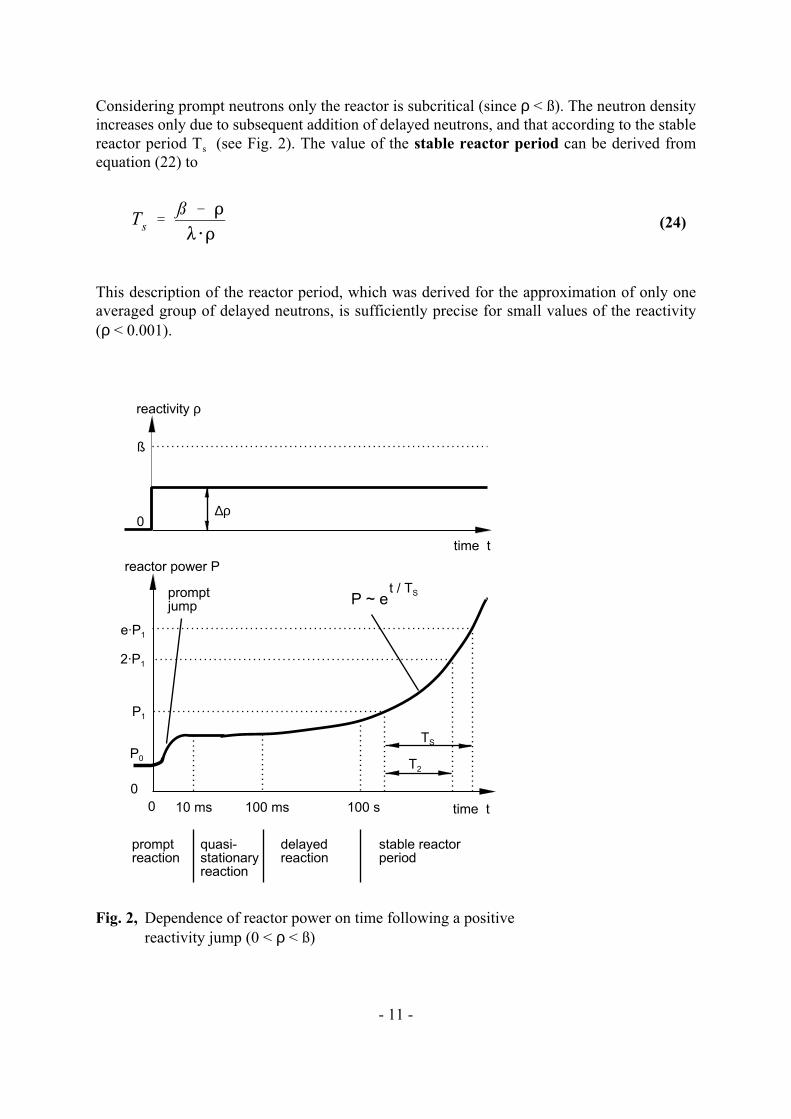
Ts'ß & D
8 @D
reactivity ρ
10 ms
P0
P1
2·P1
e·P1
0
0 100 ms 100 s
quasi-stationaryreaction
promptreaction
delayedreaction
stable reactorperiod
TS
T2
P ~ et / TSprompt
jump
reactor power P
time t
time t
ß
∆ρ0
- 11 -
(24)
Fig. 2, Dependence of reactor power on time following a positive
reactivity jump (0 < ρ < ß)
Considering prompt neutrons only the reactor is subcritical (since ρ < ß). The neutron density
increases only due to subsequent addition of delayed neutrons, and that according to the stable
reactor period T (see Fig. 2). The value of the stable reactor period can be derived froms
equation (22) to
This description of the reactor period, which was derived for the approximation of only one
averaged group of delayed neutrons, is sufficiently precise for small values of the reactivity
(ρ < 0.001).

- 12 -
4.3.2. Prompt Supercritical Reactor ( ρ > ß )
In this case, both, the second term in equation (21) becomes positive as well as its exponent.
Consequently, the neutron density rises very fast (because of l* ≈ 10 s). The reactor is super- -4
critical only by the prompt neutrons. The reactor period would be in the order of milliseconds.
Thus, the reactor power would increase so fast that the control rods could not be used reasonably
for reactor control. This case is the accident of an uncontrollable power excursion and must never
occur. Therefore, it is of high importance to keep ρ < ß at any time and under any circumstances.
Table 2 summarises possible reactor conditions, resulting reactor power behaviour and the
corresponding multiplication factors k and reactivity values ρ.
Because of the exceptional safety relevant importance of the transition from the controlled reactor
to the uncontrollable reactor (i.e. from the delayed supercritical condition to the prompt super-
critical condition), a particular artificial unit ρ’ has been introduced for describing the reactivity.
By relating the reactivity ρ to the fraction of delayed neutrons ß the reactivity ρ’ = ρ / ß is defined
with the advantage that in case of safe delayed supercritical reactor ρ’ remains smaller than 1.
For distinguishing the two definitions of reactivity, the quantity ρ’ has been added by the arbitrary
unit $ (Dollar, 1 $ = 100 Cents). Thus, the transition from the delayed supercritical condition to
the prompt supercritical condition occurs at the impressive value of ρ’ = 1 $.
Reactor Reactor Power Multiplication Reactivity
Condition Behaviour Factor kρ = ( k - 1 ) / k ρ’ = ρ / ß [ $ ]
subcritical < 1 < 0 < 0
critical = 1 = 0 = 0
(delayed) 1 < k < 1+ß
supercritical0 < ρ < ß 0 < ρ’ < 1 $
prompt
supercriticalk ≥ 1+ß ρ ≥ ß ρ ≥ 1 $
Tab. 2, Summary of possible reactor conditions with corresponding reactor parameters
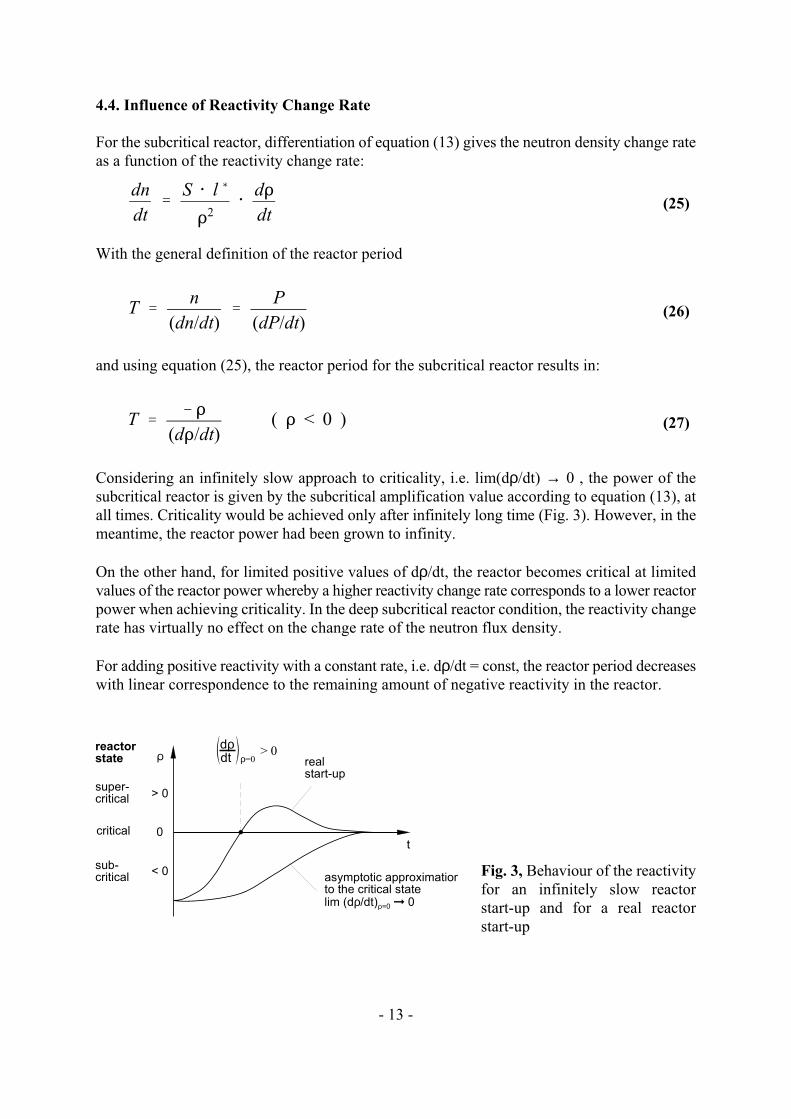
dn
dt'S @ l (
D2@dD
dt
T 'n
(dn/dt)'
P
(dP/dt)
T '!D
(dD/dt)( D < 0 )
t
D
0
> 0
< 0
super-critical
sub-critical
critical
reactor
state
asymptotic approximationto the critical statelim (dρ/dt)D=0 ! 0
realstart-up
> 0dt ρ=0‰ �dρ
- 13 -
(25)
(26)
(27)
4.4. Influence of Reactivity Change Rate
For the subcritical reactor, differentiation of equation (13) gives the neutron density change rate
as a function of the reactivity change rate:
With the general definition of the reactor period
and using equation (25), the reactor period for the subcritical reactor results in:
Considering an infinitely slow approach to criticality, i.e. lim(dρ/dt) → 0 , the power of the
subcritical reactor is given by the subcritical amplification value according to equation (13), at
all times. Criticality would be achieved only after infinitely long time (Fig. 3). However, in the
meantime, the reactor power had been grown to infinity.
On the other hand, for limited positive values of dρ/dt, the reactor becomes critical at limited
values of the reactor power whereby a higher reactivity change rate corresponds to a lower reactor
power when achieving criticality. In the deep subcritical reactor condition, the reactivity change
rate has virtually no effect on the change rate of the neutron flux density.
For adding positive reactivity with a constant rate, i.e. dρ/dt = const, the reactor period decreases
with linear correspondence to the remaining amount of negative reactivity in the reactor.
Fig. 3, Behaviour of the reactivity
for an infinitely slow reactor
start-up and for a real reactor
start-up
- 14 -
The more the reactor approaches to its critical condition, the more the neutron density (and reactor
power and reactor period as well) depend on the reactivity change rate.
The reactor start-up would be very time consuming, if the operator would wait for the ap-
proximation to the (subcritical) asymptotic limit of the reactor power n after each increase of∞reactivity. Instead of this, it is the common procedure of a normal reactor restart to rise the
criticality first onto the supercritical reactor condition and then adjust criticality afterwards at
the desired power level (compare to Fig. 3).
When approaching the desired reactor power, the (negative) reactivity change rate is continuously
lowered to values that are appropriate for the respective differences of the actual reactor power
and the desired reactor power. The reactor is critical (k = 1), if the stable reactor period is infinite
( T = ∞ ).S
5. Procedure of the Experiment
5.1. Design and Operation of the AKR-2
The AKR-2 is a homogeneous thermal zero-power reactor. A detailed description of its design
and operation is given in Ref. /2/. A basic functional layout of the AKR-2 facility is shown in
Fig. 4. For safety reasons, the cylindrical core (diameter 250 mm, height 275 mm) consists of
two separate sections. Each section contains still the initial fuel loading as it was assembled
stepwise from the disk-shaped fuel elements having various thicknesses in the critical experiment
during commissioning of the reactor in 1978.
The fuel elements consist of a homogeneous mixture of nuclear fuel (uraniumoxide, enriched to
19.8 % U-235) and the moderator (polyethylene). The critical mass of the core is about 790 g
of U-235. The core is surrounded on all sides by a graphite reflector of about 30 cm thickness.
Both, the upper and the lower core sections are each hermetically enclosed in an aluminium
container. A second, larger gas-tight reactor tank encloses the two core sections and parts of the
reflector. The pressure inside the reactor tank is lowered by (8…18) kPa compared to the ambient
atmospheric pressure. This subatmospheric pressure barrier prevents an uncontrolled leakage of
radioactive fission products even in the unlikely case that all the other internal retention barriers
would fail.
In the shut-down condition of the reactor, the lower core section is lowered by about 50 mm.
When starting the reactor, it is moved upwards by a drive mechanism and a threaded spindle
including an electromagnetic holder of the core section until close contact with the upper core
section is given. Prior to this, inside the spindle, the start-up neutron source ( Am-Be, source241
strength 2.2·10 s ) is driven up to the lower side of the core.6 -1
Three control rods made from cadmium are available for both, the control of the reactor and for
safety shut-down. The positions of the neutron source, of the lower core section and of the three
control rods are displayed digitally and analogously on the monitor screens at the control desk.

0 ... 4000
digital analogeouscontrol rod position
1
2
3
electromagneticholder for control rod
control rod
uppercore section
lower
electromagneticholder for lowercore section
0 ... 506
0 ... 800
drive mechanism forlower core section
drive mechanism forneutron source
neutron source
signalprocessing
thresholdcontrol
reactor protection(safety and control system)
neutron flux density(reactor power)
reactor period(doubling time)
shut-down signals to holding magnets(3 control rods and lower core section
3 neutron detectors
0 ... 4000
0 ... 4000
- 15 -
Fig. 4, Functional layout of the AKR

- 16 -
Three neutron detectors of different types and sensitiveness are used for measuring the neutron
flux density in the reactor and in this way for supervising the operating condition of the reactor.
They provide electrical signals (pulse densities, currents) that are proportional to the neutron flux
density and are used, in consequence, for calculation of reactor power and reactor period.
These signals are supervised with safety threshold monitors. When exceeding the pre-defined
thresholds, the safety and control system (SUS-System) gives shut-down (SCRAM) signals that
release the holding magnets of the control rods and of the lower core section. These magnets lose
their electricity supply and consequently the control and safety units (i.e. lower core section and
all three control rods) drop down and interrupt the nuclear chain reaction, i.e. the reactor is shut-
down.
5.2. Normal Restart
It must be definitely excluded that inadmissible operating conditions and disturbances during the
start-up of a reactor due to improper operation can occur. Therefore, the instrumentation is
designed in such a way that necessary safety requirements are kept automatically and undue
actions of the operator have no effect or lead to automatic reactor shut-down.
During the reactor start-up, the protective logic ensures the correct sequence of actions, i.e. the
start-up procedure can only succeed if a certain pre-defined sequence of starting conditions is
maintained and by strictly following the given necessary actions.
A flow chart of the start-up procedure is given in Fig. 5.
The processing and completion of the particular steps is indicated on the monitor screens of the
control desk. The operating condition of the reactor can be concluded from the time behaviour
of the reactor power and the reactor period (or doubling time). Warning and alarm signals inform
the operator about inadmissible operational parameters both, visually and acoustically.
The safety and control system (SUS) supervises compliance with the given threshold conditions
at any time, already during the reactor start-up. It causes automatic reactor shut-down (SCRAM)
under the following conditions:
- any fault in the protective logic
- neutron flux density > 120 % in 1 of the 3 neutron measuring channels
- doubling time of the reactor power < 10 s in 1 of 2 neutron measuring wide-range channels.
Before every start-up of the reactor, all electronic and mechanical parts that are essential for a
safe operation have to be checked.
The procedures of both, the functional check and the start-up procedure have to follow fixed
sequences (see Ref. /2/). The results have to be documented in the operation logbook.
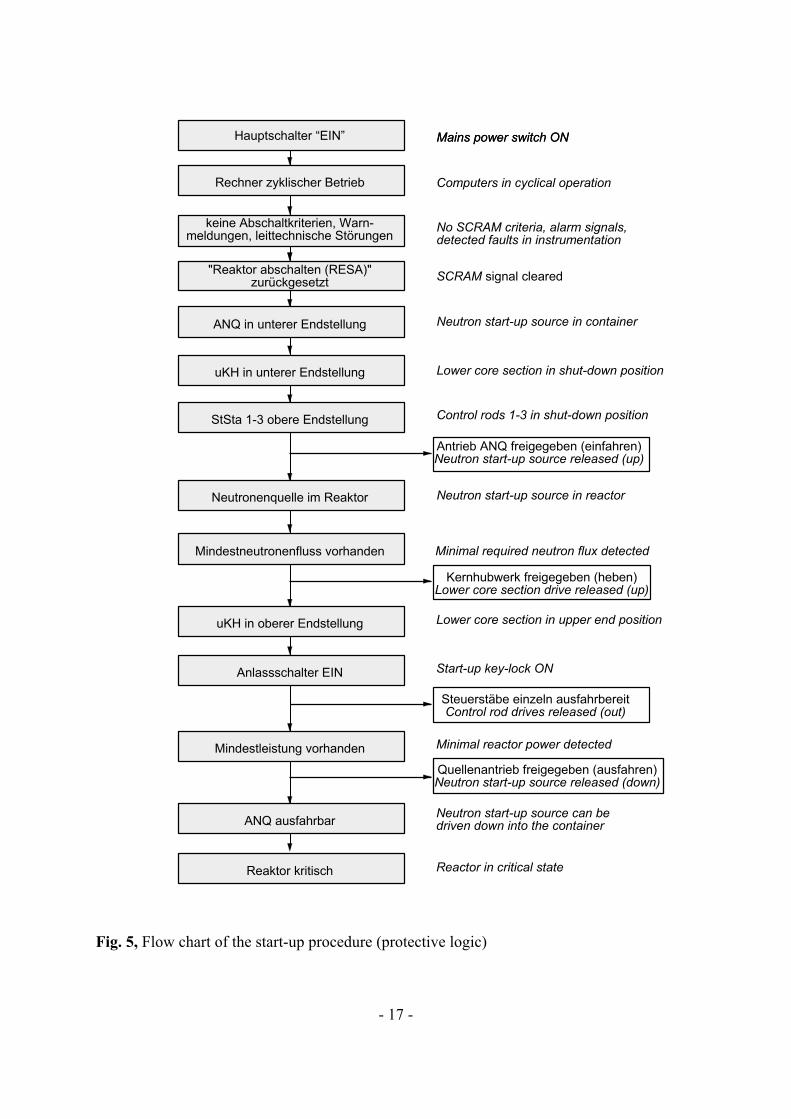
Hauptschalter “EIN”
Rechner zyklischer Betrieb
keine Abschaltkriterien, Warn-meldungen, leittechnische Störungen
"Reaktor abschalten (RESA)"zurückgesetzt
ANQ in unterer Endstellung
uKH in unterer Endstellung
StSta 1-3 obere Endstellung
Neutronenquelle im Reaktor
Mindestneutronenfluss vorhanden
uKH in oberer Endstellung
Anlassschalter EIN
Mindestleistung vorhanden
ANQ ausfahrbar
Reaktor kritisch
Kernhubwerk freigegeben (heben)Lower core section drive released (up)
Steuerstäbe einzeln ausfahrbereitControl rod drives released (out)
Quellenantrieb freigegeben (ausfahren)Neutron start-up source released (down)
Antrieb ANQ freigegeben (einfahren)Neutron start-up source released (up)
Mains power switch ON
Computers in cyclical operation
No SCRAM criteria, alarm signals,detected faults in instrumentation
SCRAM signal cleared
Neutron start-up source in container
Lower core section in shut-down position
Control rods 1-3 in shut-down position
Neutron start-up source in reactor
Minimal required neutron flux detected
Lower core section in upper end position
Start-up key-lock ON
Mains power switch ON
Minimal reactor power detected
Neutron start-up source can bedriven down into the container
Reactor in critical state
- 17 -
Fig. 5, Flow chart of the start-up procedure (protective logic)

- 18 -
Consequently, the reactor start-up has to be carried out in the following order:
1. Information about pre-defined conditions of the subsequent reactor start-up by reading the
adequate service instruction (BA) and about previous conditions of reactor operation,
especially about corresponding critical control rod positions, by reading the entries in the
operation logbook.
2. Functional check in accordance with test instruction. The reactor is free to be started-up only
at full availability of all components of the system!
3. Reactor start-up in accordance with the check list for reactor start-up and operation.
Remarks:
- The neutron source can be withdrawn at reactor power values > 0.25 W.
- If the reactor power has about 80 % of the desired power level, the (positive) reactivity has to
be reduced by moving cautiously the control rod(s) in direction to the core until the desired
reactor power is obtained with a reactor period of T ≈ ∞.S
5.3. Power Change
Power change means any intended rise or reduction in the reactor power.
Power rise:
A rise in the power is achieved by drawing out one or several of the control rods with correspon-
ding increase of reactivity. The rods can be pulled out only stepwise and one after another.
The required change in the rod position can be pre-determined with the help of the rod reactivity
characteristics. The reactor doubling time should not fall below 30 s.
If the rod reactivity characteristics are not available, the control rods have to be moved in
accordance with the display for the doubling time, i.e. before obtaining the value of 30 s, the
movement of the control rods has to be stopped.
Power reduction:
A reduction in reactor power is obtained by moving the control rods into the core with correspon-
ding decrease of reactivity to negative values. The value of the resulting negative reactor period
is not safety-relevant. Therefore, all three control rods can be moved simultaneously.
5.4. Determination of the Operation Condition
The effects of changes in the positions of the neutron source, of the lower core section and of
the control rods on the reactor can be expressed by means of one common physical quantity, i.e.
the reactivity ρ (t). The reactivity is influenced by these changes in a defined way and can be
seen as a global time-dependent reactor control parameter ρ = ρ(t).

reactivity ρ'
0
100
+
-
time t
1 $
automatic shut-down level: 120%
Zeit t
reactor power P [W]
prompt supercritical = prohibited region !
alarm level: 110%
4
automatic shut-down level : 10 s
time t
doubling time T2 [s]
alarm level : 20 s
0
5030
+
-100-50
--20
Tstable
2 W
1 W
administrative level: 30 s
- 19 -
The AKR-2 (as most of other reactors, too) has no instruments for direct measurement of the
reactivity. Therefore, the reactor operator has to determine the operating condition of the reactor
from the behaviour of the reactor power and the reactor period (or doubling time).
The typical behaviour of the reactor power and of the reactor doubling time in dependence on
reactivity for start-up and power changes is presented in Fig. 6.
At constant reactor power, the reactor period (or the doubling time as displayed on the control
desk) is infinite. Any power increase or power reduction corresponds to a positive reactor period
or a negative reactor period, respectively. After any reactivity change, the reactor takes about
1 min in order to show a stable reactor period T (time for getting the equilibrium betweenS
production of prompt and delayed neutrons).
At very small reactor power levels, the signal for the reactor period may fluctuate slightly because
the statistical fluctuations of the neutron density have larger relative amplitudes at low powers
than at high powers.
Fig. 6, Behaviour of reactor power and doubling time in dependence on reactivity ρ

- 20 -
6. Instructions Concerning the Protocol
The protocol should contain:
- short description of the experiment
- copy of the record in the operation logbook about the functional check
- log of the start-up procedure
- critical control-rod positions as a function of the power
C measured values including error ranges
C analysis and discussion of the control rod position
- measurement of gamma and neutron dose rates in dependence on the reactor power
C cross section of the reactor hall with the points of the measurements indicated
C graphical representation of the measured data including error ranges
C analysis and discussion of the results
7. Index of Relevant Variables
n neutron density (proportional to the neutron flux density Φ, to the number of neutrons N
and to the reactor power P)
k multiplication factor
ρ reactivity, ρ = ( k - 1 ) / k
ß total fraction of delayed neutrons from fission (for U-235: ß = 0.641 %)
l neutron life time, l = l / k*
λ averaged decay constant for precursors of delayed neutrons
C concentration of the delayed neutron precursors
T reactor period, i.e. time interval for reactor power change for the factor of e ≈ 2.71

- 21 -
8. Questions to Answer
1. Which are the main components for construction and operation of a thermal reactor and how
do they work?
2. What is a zero-power reactor?
3. Which parameter describes the reactor with regard to the criticality and the transient
behaviour?
4. What is the purpose of the neutron source for operating a nuclear reactor?
5. What neutron-physical phenomenon enables the safe control of a nuclear reactor?
Give a prove using the respective formalism!
6. Which components guarantee the safe operation of a nuclear reactor and how do they work?
7. Why should a reactor have a negative temperature coefficient of the reactivity?
8. What does a reactor operator has to take care for in a reactor start-up and what is the
procedure of a start-up?
9. What does the reactor operator have to do in a safety-relevant event (exceptional event)?
References:
/1/ Glasstone, S., Edlund, M.C., The Elements of Nuclear Reactor Theory, New York 1952
/2/ Technical Description and Procedure of Operation for the Reactor Facility AKR-2, TU
Dresden, Institute of Power Engineering
/3/ Ackermann, G. (ed.), Betrieb und Instandhaltung von Kernkraftwerken, Leipzig 1982

TECHNICAL UNIVERSITY
DRESDEN
Institute of Power Engineering Training Reactor
Reactor Training Course
Experiment
"Control Rod Calibration"

Instruction for
Experiment “Control Rod Calibration”
Content:
1. . . . . Motivation
2. . . . . Tasks
3. . . . . Introduction
4. . . . . Methods for Reactivity Determination
5. . . . . Procedure of the Experiment
6. . . . . Calculation of the Total Reactivity of the Control Rods and Determination of the Excess
Reactivity and of the Shut-Down Reactivity
7. . . . . Comments on the Protocol
8. . . . . Questions to Answer
Figures:
Fig. 1: Cylindrical reactor core with control rod and axial neutron flux density distribution Φz
Fig. 2: Control rod characteristics, differential (left) and integral (right, normalised)
Fig. 3: Time behaviour of the reactor power after a positive reactivity jump
( 0 < ρ << $ at time t = 0 )
Fig. 4: Schematic presentation of the solutions ω of the INHOUR equationi
Fig. 5: Relation between doubling time or reactor period, respectively, and reactivity according
to the INHOUR equation
Fig. 6: Determinationof the excess reactivity based on measured control rod characteristics
Appendix: Mathematical derivation of the INHOUR equation
(issued: March 2015)

- 2 -
1. Motivation
For the safe operation of a nuclear reactor it is of high importance to know:
- the reactivity characteristics of all control units (mainly the control rods),
- the maximum available positive reactivity reserve (excess reactivity), and
- the shut-down reactivity.
By calibrating a control rod, the influence on the reactivity by inserting a neutron absorber into
the reactor core will be investigated quantitatively and the theoretical relation with other
quantities of reactor physics will be illustrated.
2. Tasks
1. A control rod of the reactor AKR-2 has to be calibrated in dependence on the rod position by
the method of stable positive reactor period measurement. Based on measured doubling
times of the reactor power the corresponding stable reactor periods and, furthermore, the
reactivity equivalents according to the INHOUR equation have to be calculated.
If the obtained positive reactivity change is compensated by movement of another control
rod such that the reactor returns to criticality, it is possible to calibrate a second control rod
by the compensation method at the same time.
2. Graphical representations of
- the differential control rod characteristics, as well as
- the integral control rod characteristics
both with respect to the rod position have to be prepared for two control rods of the AKR-2.
3. Including the reactivity characteristic of the third control rod of the AKR-2, which is
available at the facility:
- the excess reactivity, and
- the shut-down reactivity (for partial shut-down)
have to be calculated and discussed.
3. Introduction
The characteristic reactivity values of the control rods (and of all other control units) are
essential reactor-physical parameters of a nuclear reactor. They need to be known on account of
nuclear safety. Consequently, the reactivity efficiencies of the control rods need to be quantified
in the cases of first criticality of a reactor or first criticality after substantial changes in the
reactor core (materials and/or geometry).
If the reactivity characteristics of the control rods are known, it is also possible to determine the
excess reactivity of a reactor using the positions of its calibrated control rods in the critical
condition. Furthermore, the control rod characteristics can be used for easily quantifying the
changes in reactivity, which may be induced by various reasons.

zz
H
2
Mz, max
Mz
dz
control rod reactor core
0
H
Mz' M
z, max@ sin (
B @ z
H)
- 3 -
Fig. 1, Cylindrical reactor core with control rod and axial neutron flux density distribution Φ z
(1)
The reactivity characteristic of any control rod can also be determined by theoretical considera-
tions. But the determination of the rod reactivities by calculation is a rather difficult problem,
which can be solved with reasonable effort only by applying various approximations. Anyways,
calculated reactivity values need to be proven by experiments.
For illustration, consider the arrangement shown in Fig. 1. A neutron absorber moves vertically
parallel to the z-axis of the cylindrical core of a thermal reactor. Considering the point of origin
to be in the middle plane of the reactor core, the axial component of the neutron flux density can
be written as
The parameter H represents the height of the core. By moving a neutron absorber into the core,
the number of free neutrons decreases, i.e. the reactivity is lowered. The decrease in reactivity
which is caused by a differential rod slice dz being located at the position z is the larger,
- the larger the macroscopic absorption cross section Σ ,a
- the larger the neutron flux density Φ at the position z, andz
- the longer the slice dz is.
Moreover, the influence of losing free neutrons across the surface of the reactor (leakage) needs
to be considered. Those neutrons originating in the center of the reactor core have the maximum
probability to remain in the core and to cause fission reactions. On the other hand, the probabili-
ty for neutron leakage has its maximum in the region of low neutron density near the surface of
the core. Consequently, the various neutrons contribute unequally to the neutron balance and
hence, they have an unequal influence on the reactivity. Thus, this function of influence, also
called adjoint flux function, varies in space approximately in same way as the neutron flux
density, i.e. both functions are proportional to each other, and the magnitude of reactivity loss

dD - Ea@ M
2
z @ dz
dD
dz' C @ E
a@ N
2
z
)D 'm
z2
z1
dD 'm
z2
z1
C @ Ea@ N
2
z @ dz.
D(z) 'm
z
0
C @ Ea@ M
2
z @ dz.
D(z) ' C @ Ea@ M
2
z, max @H
B
B @z
2 @H&
1
4sin
2 @B @z
H
Dmax
' C @ Ea@ M
2
z, max @H
2
- 4 -
(2)
is determined by two effects
- absorption ( ~ Σ @ Φ @ dz )a z
- space-dependent adjoint flux ( ~ Φ )z
According to probability theory the total probability is the product of the particular contribu-
tions. Therefore, the total effect can be written as
By introducing a constant of proportionality C, the equation for the differential control rod
characteristic results in
(3)
A control rod which is moved into the reactor core by a finite length ∆z = z2 - z1 changes the
reactivity by
(4)
Integration over the whole rod length up to the position z gives the integral control rod
characteristic ρ(z)
(5)
Applying the neutron flux distribution shown in Fig. 1 into equation (5) gives
(6)
and integration up to the full length 0 ... H gives the integral reactivity value of the complete rod
(7)
After normalising the reactivity to the maximum value ρ , the integral control rod characteri- max
stic gets the shape which is shown in Fig. 2.
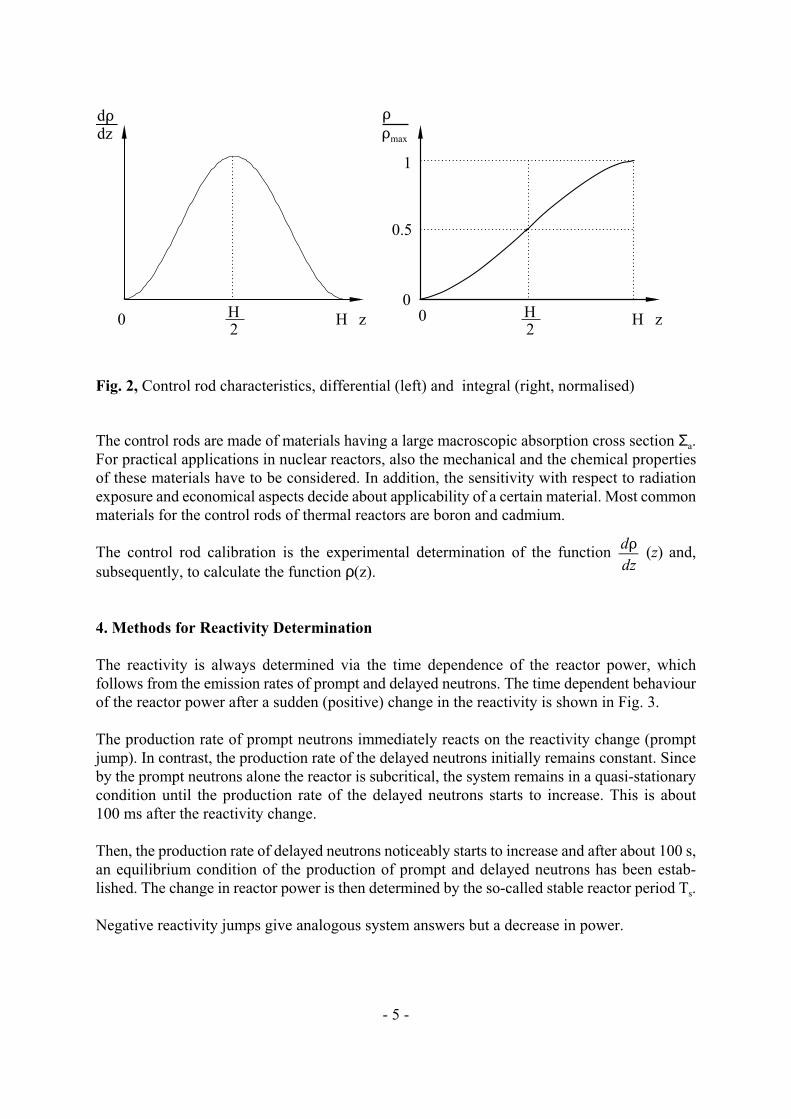
dDdz
zH
20 H
DDmax
zH
20 H
0.5
1
0
dD
dz(z)
- 5 -
Fig. 2, Control rod characteristics, differential (left) and integral (right, normalised)
The control rods are made of materials having a large macroscopic absorption cross section Σ .a
For practical applications in nuclear reactors, also the mechanical and the chemical properties
of these materials have to be considered. In addition, the sensitivity with respect to radiation
exposure and economical aspects decide about applicability of a certain material. Most common
materials for the control rods of thermal reactors are boron and cadmium.
The control rod calibration is the experimental determination of the function and,
subsequently, to calculate the function ρ(z).
4. Methods for Reactivity Determination
The reactivity is always determined via the time dependence of the reactor power, which
follows from the emission rates of prompt and delayed neutrons. The time dependent behaviour
of the reactor power after a sudden (positive) change in the reactivity is shown in Fig. 3.
The production rate of prompt neutrons immediately reacts on the reactivity change (prompt
jump). In contrast, the production rate of the delayed neutrons initially remains constant. Since
by the prompt neutrons alone the reactor is subcritical, the system remains in a quasi-stationary
condition until the production rate of the delayed neutrons starts to increase. This is about
100 ms after the reactivity change.
Then, the production rate of delayed neutrons noticeably starts to increase and after about 100 s,
an equilibrium condition of the production of prompt and delayed neutrons has been estab-
lished. The change in reactor power is then determined by the so-called stable reactor period T .s
Negative reactivity jumps give analogous system answers but a decrease in power.
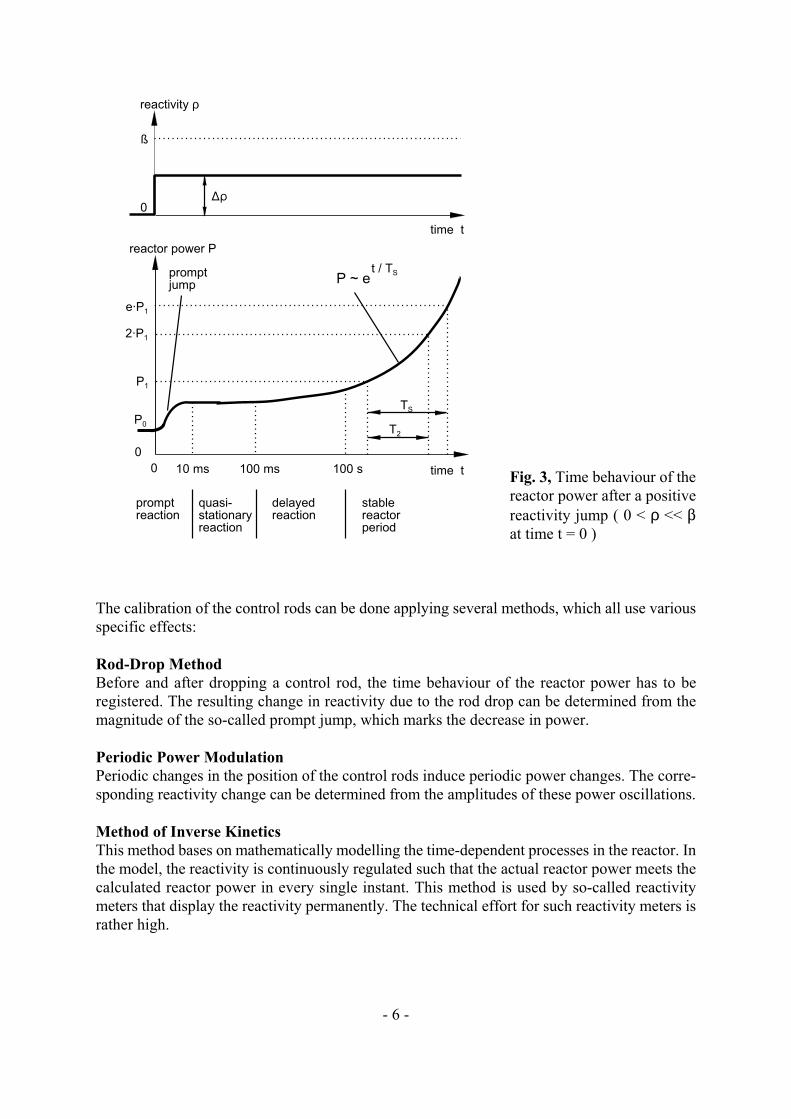
time t
reactivity ρ
10 ms
P0
P1
2·P1
e·P1
0
0 100 ms 100 s
quasi-stationaryreaction
promptreaction
delayedreaction
stablereactorperiod
TS
T2
P ~ et / T
Spromptjump
reactor power P
time t
ß
)D0
- 6 -
Fig. 3, Time behaviour of the
reactor power after a positive
reactivity jump ( 0 < ρ << $at time t = 0 )
The calibration of the control rods can be done applying several methods, which all use various
specific effects:
Rod-Drop Method
Before and after dropping a control rod, the time behaviour of the reactor power has to be
registered. The resulting change in reactivity due to the rod drop can be determined from the
magnitude of the so-called prompt jump, which marks the decrease in power.
Periodic Power Modulation
Periodic changes in the position of the control rods induce periodic power changes. The corre-
sponding reactivity change can be determined from the amplitudes of these power oscillations.
Method of Inverse Kinetics
This method bases on mathematically modelling the time-dependent processes in the reactor. In
the model, the reactivity is continuously regulated such that the actual reactor power meets the
calculated reactor power in every single instant. This method is used by so-called reactivity
meters that display the reactivity permanently. The technical effort for such reactivity meters is
rather high.

dn
dt'
D & ß
l (@ n % j
6
i'1
8i@C
i% S
dCi
dt'ß
i
l (@ n & 8
i@C
i( i ' 1 , ... , 6 )
ni(t) ' n
i, 0@e
Ti@ t
resp. Ci(t) ' C
i, 0@e
Ti@ t
n(t) ' n0@e
T0@ t% n
1@e
T1@ t% ... % n
6@e
T6@ t
- 7 -
(8)
(9)
(10)
Positive period method (measurement of stable reactor period T )s
This is a conventional method for the determination of the reactivity. It will be applied also in
the given experiment.
The relation between the measured stable reactor period and the unknown value of reactivity is
given by the so-called INHOUR equation (derived from "inverse hour"). This equation follows
from the reactor-kinetic equations (for a detailed derivation see the appendix)
with:
l* = average effective life-time of prompt neutrons,
ρ = reactivity,
$ = absolute fraction of the i-th group of delayed neutrons,i
C = concentration of the delayed-neutron precursors of the i-th group,i
8 = decay constant of the delayed-neutron precursors of the i-th group, andi
S = source strength of the external neutron source in the reactor.
This system of ordinary differential equations has 7 solutions corresponding to the 7 eigenvalu-
es ω. The system can be solved using the ansatzi
As a consequence of the linearity of the system the neutron density n(t) is a linear combination
of the 7 solutions, which have the form given in equation (9):
Its solutions ω are given schematically in Fig. 4.i
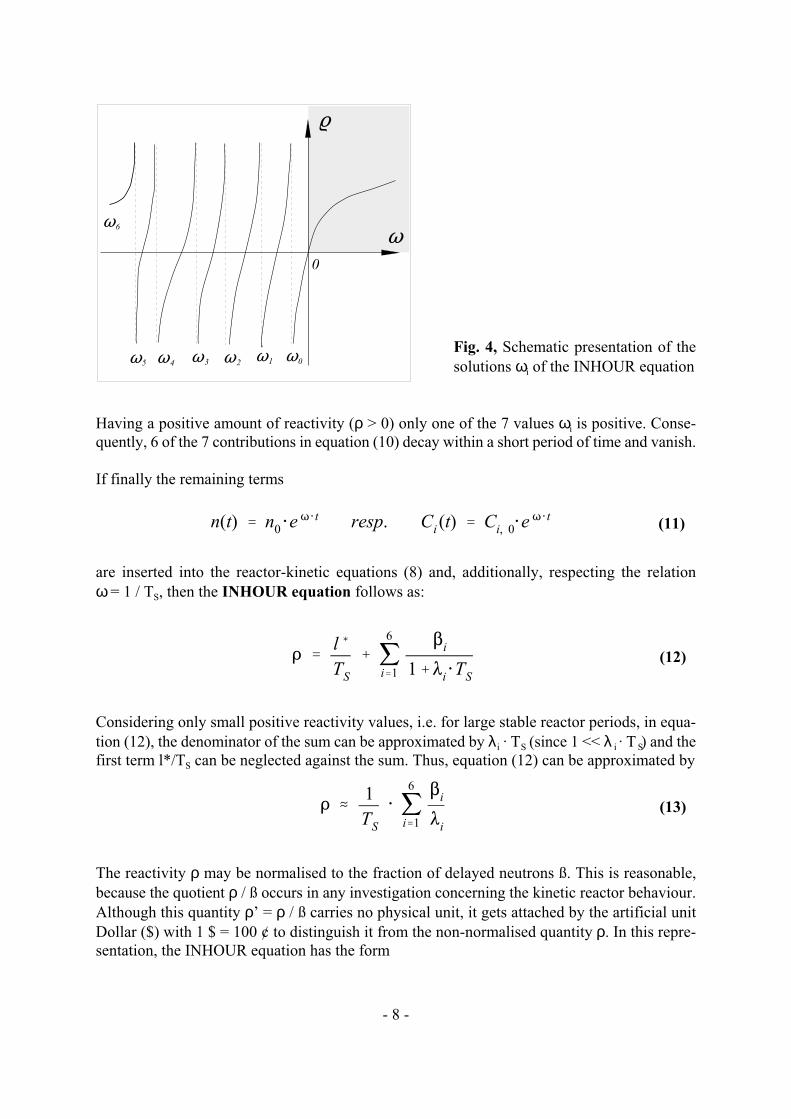
k
T1
TT6
T4T 3 T2
0
T5T0
n(t) ' n0@e T @ t resp. C
i(t) ' C
i, 0@e T @ t
D 'l (
TS
% j6
i'1
$i
1%8i@T
S
D .1
TS
@ j6
i'1
$i
8i
- 8 -
(11)
Fig. 4, Schematic presentation of the
solutions ω of the INHOUR equationi
Having a positive amount of reactivity (ρ > 0) only one of the 7 values ω is positive. Conse-i
quently, 6 of the 7 contributions in equation (10) decay within a short period of time and vanish.
If finally the remaining terms
are inserted into the reactor-kinetic equations (8) and, additionally, respecting the relation
ω = 1 / T , then the INHOUR equation follows as:S
(12)
Considering only small positive reactivity values, i.e. for large stable reactor periods, in equa-
tion (12), the denominator of the sum can be approximated by λ · T (since 1 << λ · T ) and thei S i S
first term l*/T can be neglected against the sum. Thus, equation (12) can be approximated byS
(13)
The reactivity ρ may be normalised to the fraction of delayed neutrons ß. This is reasonable,
because the quotient ρ / ß occurs in any investigation concerning the kinetic reactor behaviour.
Although this quantity ρ’ = ρ / ß carries no physical unit, it gets attached by the artificial unit
Dollar ($) with 1 $ = 100 ¢ to distinguish it from the non-normalised quantity ρ. In this repre-
sentation, the INHOUR equation has the form
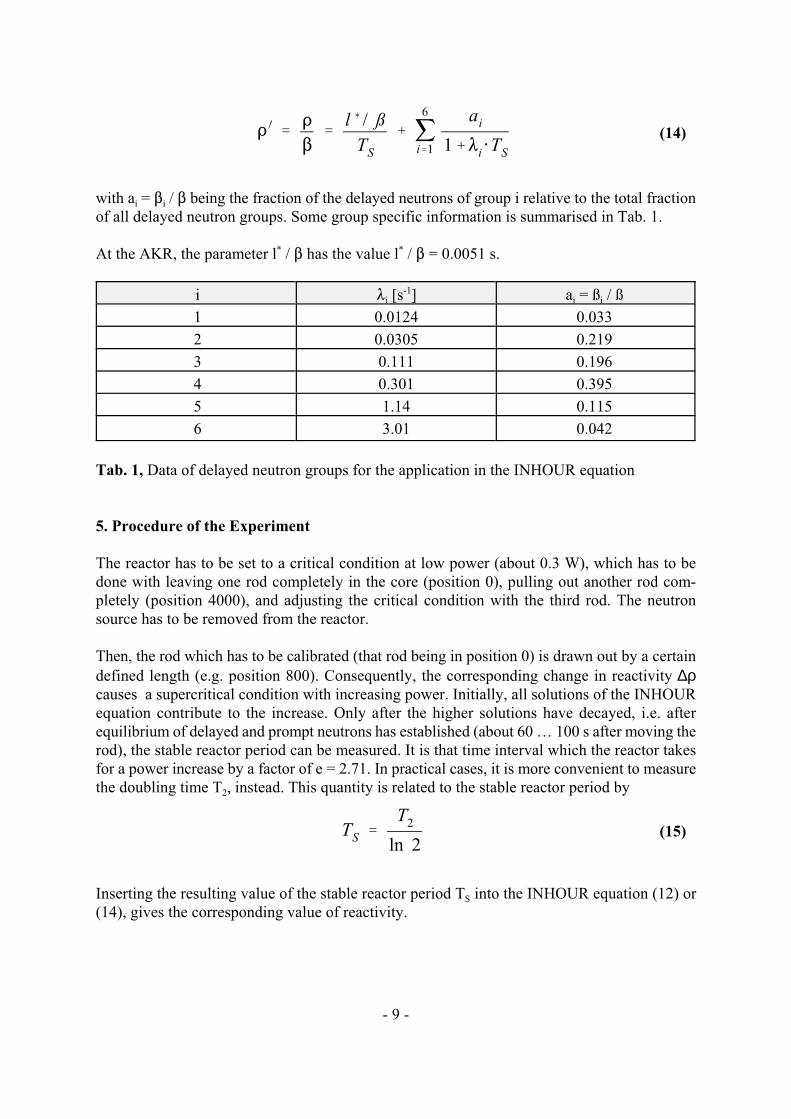
D) 'D
$'l ( / ß
TS
% j6
i'1
ai
1%8i@T
S
TS'
T2
ln 2
- 9 -
(14)
with a = $ / $ being the fraction of the delayed neutrons of group i relative to the total fractioni i
of all delayed neutron groups. Some group specific information is summarised in Tab. 1.
At the AKR, the parameter l / $ has the value l / $ = 0.0051 s.* *
i 8 [s ] a = ß / ßi
-1
i i
1 0.0124 0.033
2 0.0305 0.219
3 0.111 0.196
4 0.301 0.395
5 1.14 0.115
6 3.01 0.042
Tab. 1, Data of delayed neutron groups for the application in the INHOUR equation
5. Procedure of the Experiment
The reactor has to be set to a critical condition at low power (about 0.3 W), which has to be
done with leaving one rod completely in the core (position 0), pulling out another rod com-
pletely (position 4000), and adjusting the critical condition with the third rod. The neutron
source has to be removed from the reactor.
Then, the rod which has to be calibrated (that rod being in position 0) is drawn out by a certain
defined length (e.g. position 800). Consequently, the corresponding change in reactivity ∆ρcauses a supercritical condition with increasing power. Initially, all solutions of the INHOUR
equation contribute to the increase. Only after the higher solutions have decayed, i.e. after
equilibrium of delayed and prompt neutrons has established (about 60 … 100 s after moving the
rod), the stable reactor period can be measured. It is that time interval which the reactor takes
for a power increase by a factor of e = 2.71. In practical cases, it is more convenient to measure
the doubling time T , instead. This quantity is related to the stable reactor period by2
(15)
Inserting the resulting value of the stable reactor period T into the INHOUR equation (12) orS
(14), gives the corresponding value of reactivity.

0 10 20 30 40 50 60reactivity ρ' = ρ / ß in cent
2
5
2
5
2
5
10
100
time
in s
doubling time
reactor period
- 10 -
By application of a trick even a second control rod can be calibrated in a single experiment atthe same time (compensation method). For this purpose, after measuring the doubling time andcalculating the positive reactivity, a second control rod (that is totally pulled out at the begin-ning in position 4000) is used to re-establish the critical condition. By this way, the sameabsolute amount of reactivity is fed to the reactor as before, but with negative sign. The corre-sponding change in the position of the second control rod can be determined from the displayon the control panel.
After adjusting the critical reactor condition at about 0.3 W reactor power, again, the first rodcan be drawn out of the core by a defined length for the second time. According to the procedu-re explained above, the doubling time has to be measured and afterwards, the positive amountof reactivity due to the movement of the first rod has to be compensated by moving in thesecond rod, again.
This procedure has to be repeated until the first rod has reached its upper end position (position4000). The second rod is supposed to have the position 0 after the compensation assuming thereactivity values of both rods are identical.
The calculation of the reactivity values according to equations (12) or (14) is time consuming,since for each value of the stable reactor period, all 6 groups of delayed neutrons contribute tothe sum in the equation. For this reason, preferably a programmable calculator or a computercode should be used to evaluate the measured doubling times. Such a computer program isprovided at the working place.
Fig. 5 shows the relation between doubling time (or stable reactor period, respectively) and thereactivity according to the INHOUR equation using the parameter values from Tab. 1.
Fig. 5, Relation between doub-ling time or reactor period, re-spectively, and reactivity accor-ding to the INHOUR equation

Dexcess
' D1,excess
% D2,excess
% D3,excess
control rod 1
z000
z0
0
z0
0
z 1, crit. z 2, crit. z 3, crit.
control rod 2 control rod 3
DD D
- 11 -
Fig. 6, Determinationof the excess reactivity based on measured control rod characteristics
The determination of the reactivity by measuring the stable reactor period is easy to perform at
least for determination of small reactivity changes, since only a relation between the reactivity
and the stable reactor period is needed. Further physical quantities describing the reactor are
unnecessary to know at this point. But it must be mentioned, that the application of the IN-
HOUR equation is restricted to small reactivity range (0 … 20 ¢) only, because higher reactivity
values would cause too large rates of power increase and a too strong influence of drift or noise
effects. Moreover, this method is rather time-consuming since for the determination of the
characteristic of a complete rod, several subsequent measurements of the reactor period has to
be carried out.
6. Calculation of the Total Reactivity of the Control Rods and Determination of the
Excess Reactivity and of the Shut-Down Reactivity
The total reactivity value of a control rod is given by the the integral control rod characteristic
determined over the complete rod length (Fig. 2).
The excess reactivity is that amount of positive reactivity which results from drawing out all
control rods each to its upper end position, starting from a critical reactor condition. Based on
the integral control rod characteristic of each control rod i (at the AKR is i = 1, 2, 3), it is
determined which positive reactivity ρ can be still fed into the reactor by complete pullingi, excess
out of all control rods starting from their positions in critical reactor condition. For the de-
termination of the total excess reactivity, the individual critical positions of the rods relative to
each other are irrelevant, since the total excess reactivity is the sum of the excess reactivities of
all rods
Fig. 6 illustrates the idea of calculating the excess reactivity from the measured control rod
characteristics.

Dshut&down
' Dtotal
! Dexcesss
- 12 -
In the given reactor experiment at AKR-2, usually only two of the three control rods are
calibrated. Since the calculation of the total excess reactivity requires the characteristic of the
third rod, too, this characteristic will be approximated by the average of the integral rod charac-
teristics of the other two rods. Such an assumption is justified, because all three rods are
designed identically and positioned symmetrically in the reactor.
The starting point for the determination of the excess reactivity is always a critical reactor
condition - no matter what particular positions of the rods relative to another mark the critical
condition. Conveniently, that critical rod configuration should be chosen which marks the
critical condition at the start of the experiment. Doing so, the entire reactivity of the first rod
contributes to the excess reactivity (full rod length is available) while for the second rod no
contribution has to be taken into account (rod is already in its upper end position). Only the
excess reactivity of the third rod has to be determined by interpolation of the corresponding
characteristic.
The total excess reactivity is an important criterion for the nuclear safety of a nuclear reactor.
If the total excess reactivity ρ of a reactor does not exceed the fraction of delayed neutronsexcess
ß, i.e. for keeping ρ < ß (or identically ρ’ < 1 $), such a reactor can never reach aexcess excess
prompt-supercritical condition - neither due to technical failure nor due to wrong action of the
reactor operator. At the AKR, the criterion ρ < ß is fulfilled and defined in the operationexcess
licence of the facility. An important result of the given experiment is to prove this condition!
In contrast to the previously discussed quantity, the shut-down reactivity (of the partially
shut-down reactor) is that amount of negative reactivity which results from dropping all control
rods to their lower end position 0, starting again from critical condition. The determination of
the shut-down reactivity goes along with that of the excess reactivity but with opposite direction
of rod moving. In case the excess reactivity is already known, the shut-down reactivity can be
calculated as the difference of the total reactivity and the excess reactivity
7. Comments on the Protocol
- short description of the experiment and its procedure
- table containing all measured values including measurement uncertainties
- numerical analysis and discussion of the errors
- graphical representation of the (differential and integral) control rod characteristics
- determination of the excess reactivity and the shut-down reactivity (for partial shut-down)

- 13 -
8. Questions to Answer
1. Explain the derivation of the INHOUR equation and discuss its solutions for the cases:
a) ρ < 0 b) ρ = 0 c) ρ > 0 !
2. What is the time behaviour of the reactor power for a negative reactivity jump?
3. What is the so-called stable reactor period in the context of the time behaviour of a reactor?
4. What is the excess reactivity and how it can be determined from the control rod characteri-
stics? What is the maximum value of the excess reactivity such that the reactor would be
safely controllable?
5. What is the idea of the calibration of a control rod simultaneously to the calibration of
another control rod (compensation method)? How to determine the end value of the reactivi-
ty of the second rod, in case the total amounts of reactivity of the rods are unequal?
6. What is the benefit of the control rod calibration?
7. What are the physical and technical requirements for the material properties of a control
rod?

dn
dt'
k & ß
l (· n % j
6
i'1
8i·C
i
dCi
dt'
ßi
l (· n & 8
i·C
i
n(t) ' n0·e T·t
Y
dn
dt' n
0·e T · t · T ' n · T
Ci(t) ' C
0,i· e T·t
Y
dCi
dt' C
0,i·e T · t · T ' C
i· T
Ci
· T '
ßi
l (· n & 8
i·C
i
Ci
(T % 8i) '
ßi
l (· n
Ci'
ßi
· n
l ( · (T % 8i)
Ci
· 8i'
8i
· ßi
· n
l ( · (T % 8i)
n · T '
k & ß
l (·n % j
6
i'1
8i
· ßi
· n
l ( · (T % 8i)
l ( · T ' k&ß % j6
i'1
8i
· ßi
T % 8i
Appendix: Derivation of the INHOUR equation
Fundamentals are the point-kinetic equations:
(A1)
(A2)
Solutions correspond to:
(A3)
(A4)
from (A2) follows by insertion of (A4):
respectively
(A5)
insertion of (A5) and (A3) in (A1) results in:
by multiplication of both sides by l*/n follows:
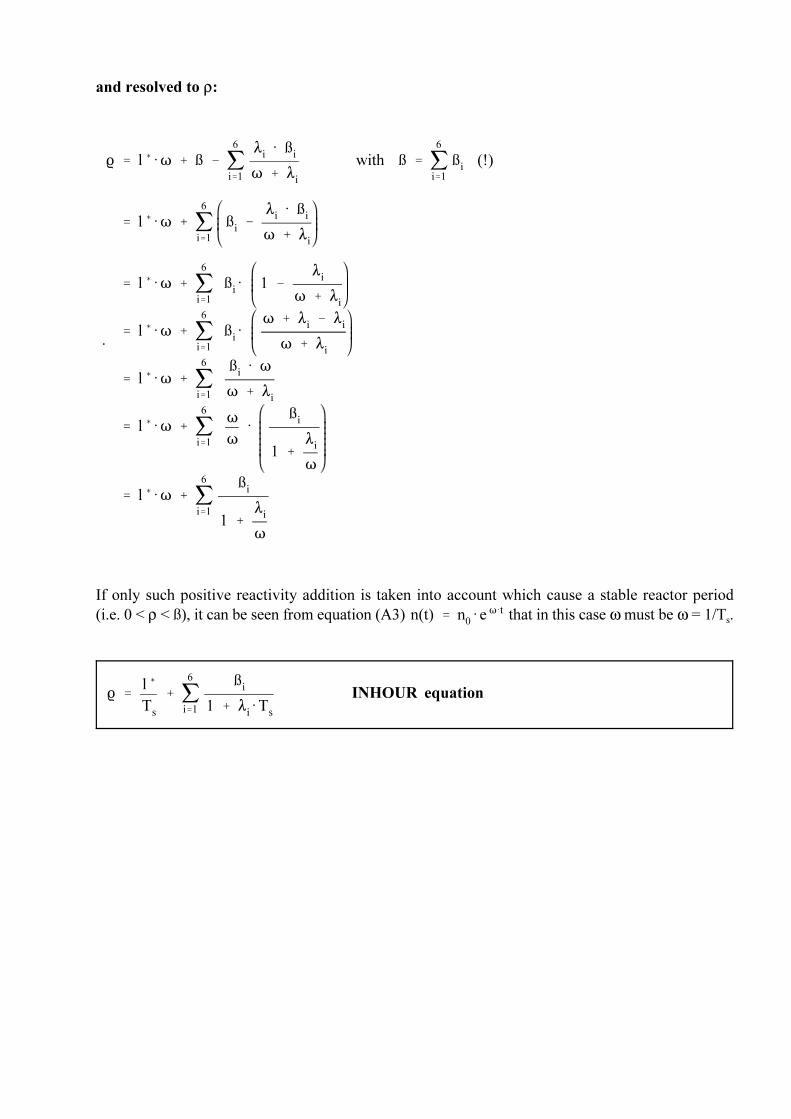
.
k ' l ( ·T % ß & j6
i'1
8i
· ßi
T % 8i
with ß ' j6
i'1
ßi
(!)
' l ( ·T % j6
i'1
ßi&
8i
· ßi
T % 8i
' l ( ·T % j6
i'1
ßi· 1 &
8i
T % 8i
' l ( ·T % j6
i'1
ßi·
T % 8i& 8
i
T % 8i
' l ( ·T % j6
i'1
ßi
· T
T % 8i
' l ( ·T % j6
i'1
T
T·
ßi
1 %
8i
T
' l ( ·T % j6
i'1
ßi
1 %
8i
T
n(t) ' n0·e T·t
k '
l (
Ts
% j6
i'1
ßi
1 % 8i·T
s
INHOUR equation
and resolved to ρ:
If only such positive reactivity addition is taken into account which cause a stable reactor period
(i.e. 0 < ρ < ß), it can be seen from equation (A3) that in this case ω must be ω = 1/T .s

TECHNICAL UNIVERSITY
DRESDEN
Institute of Power Engineering Training Reactor
Reactor Training Course
Experiment
"Critical Experiment"

- 1 -
Instruction for
Experiment “Critical Experiment”
Content:
1. . . . . Motivation
2. . . . . Tasks
3. . . . . General Remarks
4. . . . . Theoretical Background
5. . . . . Procedure of the Experiment
6. . . . . Further Comments on the Experiment
7. . . . . Questions to Answer
Figures:
Fig. 1: Dependence of the multipliation factor k on the critical parameter z of the critical
experiment
Fig. 2: Schematic arrangement of the experiment
Fig. 3: Neutron density over time with approaching to the asymptotic value for reduction of the
distance between the two core sections
Fig. 4: Reciprocal pulse rate 1/N(x) over position x of the lower core section for the determina-
tion of x by extrapolationcrit
Fig. 5: Expected result of the critical experiment
Appendix:
- Protocol Sheet of the Critical Experiment
- Template for diagram
(issued: March 2015)
- 2 -
1. Motivation
The critical experiment is a procedure for checking experimentally the correct core loading of
a nuclear reactor with nuclear fuel. It is carried out in case of the initial commissioning of a
nuclear reactor or in case after modification of the reactor core (geometry and/or material
changes) if the critical mass and the critical control rod positions are only known from calcula-
tions.
The critical experiment ensures
- that, on the one hand, the reactor is actually loaded with sufficient fuel for obtaining criticality
and
- that, on the other hand, the reactor core does not contain too much nuclear fuel to avoid that
the permitted excess reactivity would be exceeded or that the reactor could even become prompt
supercritical.
The reactor must be controllable by the control rods at any time, i.e. control rod movements must
guarantee that both, multiplication factors k>1 and (for safety reasons even more important) k<1
can be adjusted.
For example, it may never happen that due to a too high fuel loading the AKR becomes critical
or even supercritical already while the core sections still approach one to another, because in that
case, control by the control rods would be impossible.
The critical experiment requires profound professional knowledge regarding the physical
processes in a nuclear reactor and also a high level of responsibility of the operating staff. The
critical experiment needs to be performed with special caution and care.
The training experiment aims at conveying the measurement and analysis methods for a critical
experiment which enable
- an always safe approach to criticality and
- the reliable predetermination of the critical reactor parameters.
At the AKR, a critical experiment can be carried out in two ways:
- enlarging the amount of fuel in the reactor core by stepwise adding fuel-element plates or
- stepwise approach of the core sections to each other with having a fixed fuel loading in each
of the sections.
For the initial commissioning of the AKR, the critical mass was adjusted by stepwise adding of
fuel plates.
Because the manipulation of nuclear fuel requires a lot of effort and additional comprehensive
precautions and prescriptions and is very time consuming, in the training procedure the critical
experiment will be carried out by stepwise approach of the lower core section to the upper one.
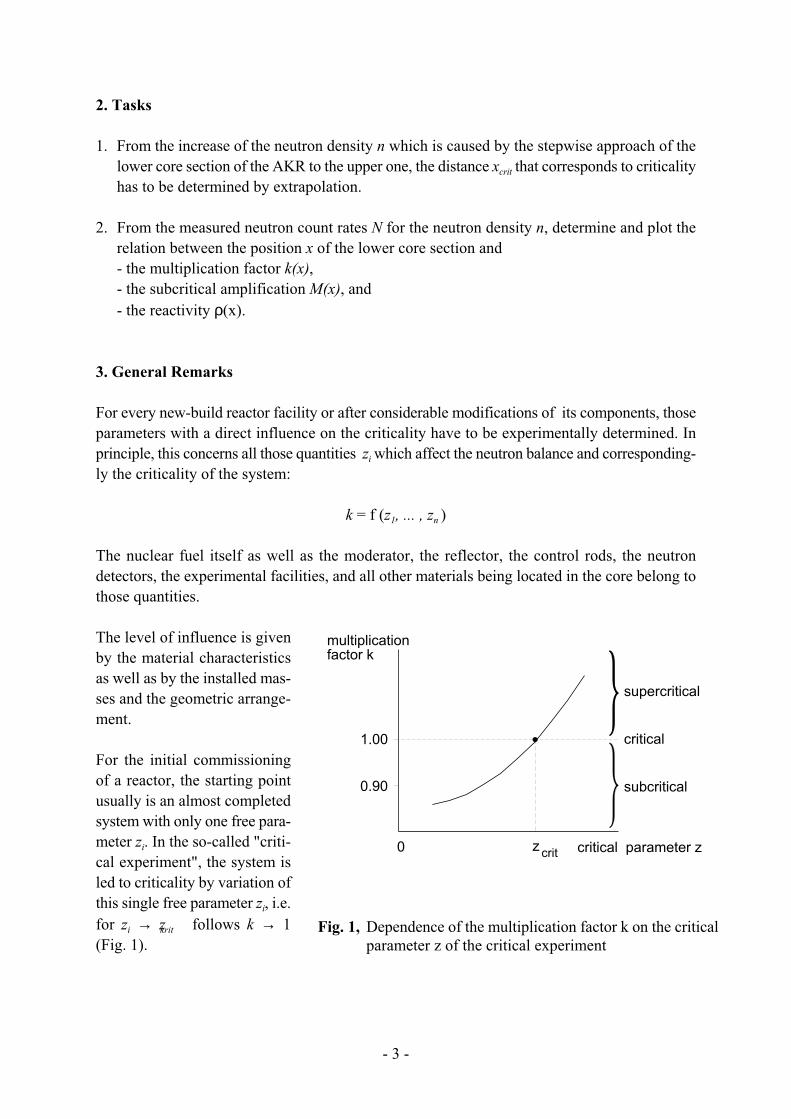
1.00
0.90
0 critical parameter zzcrit
multiplicationfactor k
supercritical
critical
subcritical
- 3 -
Fig. 1, Dependence of the multiplication factor k on the critical
parameter z of the critical experiment
2. Tasks
1. From the increase of the neutron density n which is caused by the stepwise approach of the
lower core section of the AKR to the upper one, the distance x that corresponds to criticalitycrit
has to be determined by extrapolation.
2. From the measured neutron count rates N for the neutron density n, determine and plot the
relation between the position x of the lower core section and
- the multiplication factor k(x),- the subcritical amplification M(x), and
- the reactivity ρ(x).
3. General Remarks
For every new-build reactor facility or after considerable modifications of its components, those
parameters with a direct influence on the criticality have to be experimentally determined. In
principle, this concerns all those quantities z which affect the neutron balance and corresponding-i
ly the criticality of the system:
k = f (z , ... , z )1 n
The nuclear fuel itself as well as the moderator, the reflector, the control rods, the neutron
detectors, the experimental facilities, and all other materials being located in the core belong to
those quantities.
The level of influence is given
by the material characteristics
as well as by the installed mas-
ses and the geometric arrange-
ment.
For the initial commissioning
of a reactor, the starting point
usually is an almost completed
system with only one free para-
meter z . In the so-called "criti-i
cal experiment", the system is
led to criticality by variation of
this single free parameter z , i.e.i
for z → z follows k → 1i krit
(Fig. 1).

0
x
508 upper
lower
neutronsource
uppercore section
lowercore section
end position
movement bycore drive
- 4 -
Fig. 2, Schematic arrangement of the experiment
For achieving criticality of a reactor for the first time, mostly the fuel mass ( z = m ) is chosenfuel
as the free parameter in the critical experiment. Starting from a subcritical loading, the amount
of fuel is enlarged stepwise until the reactor is critical or supercritical.
Another feasible procedure is to approach cautiously two subcritical masses which would give
together a critical mass. In this case, the distance between the two subcritical masses represents
the critical parameter. This alternative is applied in the given experiment (the critical parameter
z is the position of the lower core section).i
4. Theoretical Background
At the beginning of the experiment, the lower core section of the AKR is in its lowest position,
the reactor is reliably subcritical (x = 0). The arrangement is shown schematically in Fig. 2.
A subcritical reactor contains almost no free neutrons. By inserting the neutron source, which
has a source strength S and emits neutrons into the reactor core, the neutron density is increased
to such level that
- a sufficient count rate at the neutron detectors is available, and
- therefore statistically safe measurements of the reactor state are possible.
For determining the reactor state, the neutron density n(t→∞) is used, which is the result of the
subcritical amplification of the neutron source. Theoretically, it is reached only after infinitely
long time. The neutron density n is proportional to the neutron flux density Φ in the reactor,

n(t!4)
(-M,-P,-N) ' S · l % S · l ·k % (S · l ·k) ·k % ...
' S · l (1 % k % k 2 % k 3 % ... )
' S · l ·1
1&k(limit value of the geometric series with k<1)
n(t) 'S · l
1 & k(1 & e
!(1 ! k)
l· t
)
n (x, t!4) ' S · l ·1
1&k(x)
M(x) '1
1 & k(x)
- 5 -
(1)
(2)
(3)
(4)
proportional to the reactor power P as well as proportional to the count rates N measured by the
neutron detectors.
The asymptotic neutron density n after infinitely long time is
with S source strength of the neutron source
l neutron generation time
k multiplication factor of the (subcritical) reactor
The time dependence for approaching the asymptotic neutron density is
After infinitely long time, equation (2) results in equation (1). As it can be seen from equation
(2), the nearer the system is to the critical state (k → 1), the slower the approach to the asymptotic
value continues n (t→∞).
At the beginning of the experiment and for t < 0, the distance between the two core sections be
x and the entire arrangement has the multiplication factor k(x ) = k .0 0 0
At t = 0, the distance between the core sections is reduced by the value )x. The resulting
multiplication factor corresponding to the new position x shall be k(x). The neutron density n
increases according to equation (2). After a sufficient time period (t → ∞), the neutron density
has virtually reached its asymptotic value n (t→∞) (equation (3)):
The factor
is also known as the subcritical amplification.
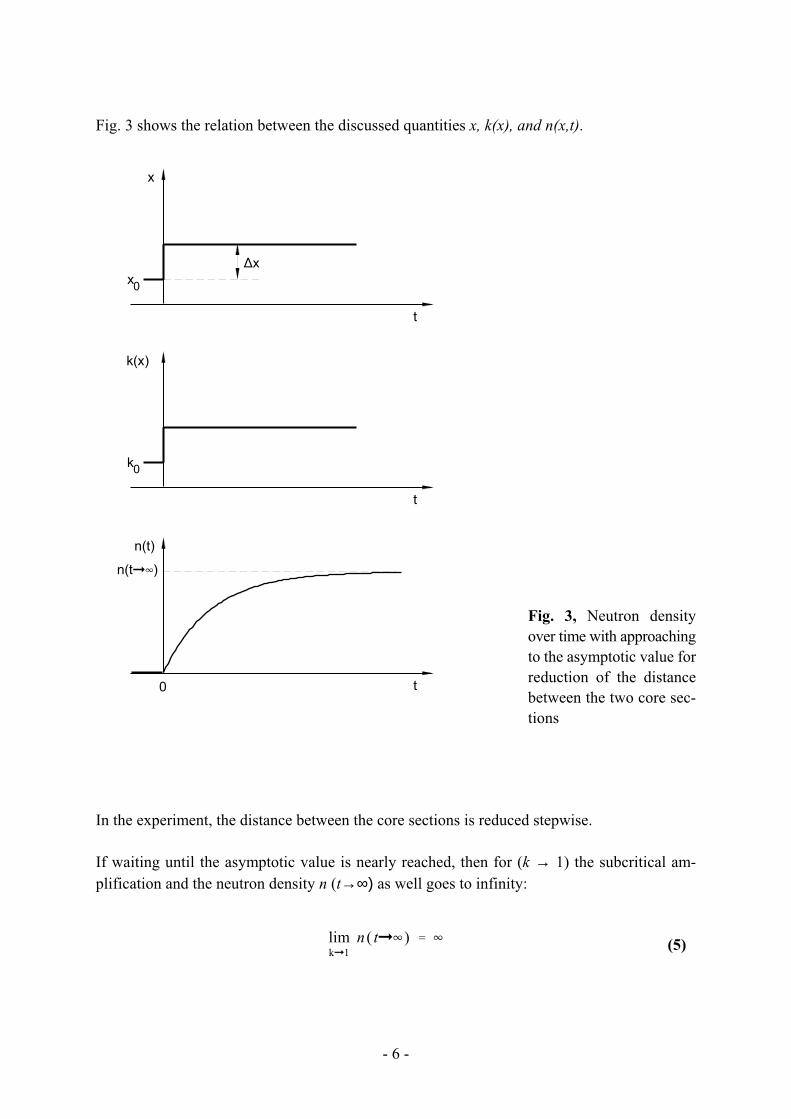
t
x
x0
)x
t
k(x)
k0
0
n(t)
n(t!4)
t
limk!1
n ( t!4 ) ' 4
- 6 -
(5)
Fig. 3 shows the relation between the discussed quantities x, k(x), and n(x,t).
Fig. 3, Neutron density
over time with approaching
to the asymptotic value for
reduction of the distance
between the two core sec-
tions
In the experiment, the distance between the core sections is reduced stepwise.
If waiting until the asymptotic value is nearly reached, then for (k → 1) the subcritical am-
plification and the neutron density n (t→∞) as well goes to infinity:

limk!1
(1/n ( t!4 )) ' 0
N - n resp. N ' C @ n
1/N(x) '1
C @n ( t!4 )'
1&k(x)
C @S @ l
1/N(xkrit
) ' 0
1/N
xxcrit0
0
dangerous
ideal
safe
- 7 -
(6)
(7)
(8)
(9)
Fig. 4, Reciprocal pulse rate 1/N over position x of the lower core section for the determination
of x by extrapolationcrit
Hence, for (k → 1), the reciprocal value of the neutron density 1/n(t→∞) tends to zero:
Since the pulse rate N of a neutron detector of the reactor instrumentation is directly proportional
to the neutron density n, it can also be written:
The constant C depends on the positioning and on the sensitivity of the neutron detector.
After approaching the asymptotic value n(t→∞), the inverse pulse rate of a channel 1/N is:
If plotting 1/N(x) over x, the point of intersection of the resulting curve with the abscissa axis
gives the position x of the lower core section that marks exact criticality (Fig. 4).crit

)N ' N(x%)x)&N(x) ' C @S @ lk(x%)x)&k(x)
(1&k(x%)x)) @ (1&k(x))
k(x%)x) ' 1 %N(x)
N(x%)x)(k(x)&1)
M(x) '1
1 & k(x)
D(x) 'k(x) & 1
k(x)
)D(x) 'dD
dx@)x
dD
dxx
' &D(x)
N(x)@
N(x%)x)&N(x)
)x
- 8 -
(10)
(11)
(12)
(13)
(14)
(15)
In principle, three shapes of the curve 1/N(x) are possible:
- ideal shape (linear),
- dangerous (concave with respect to abscissa), and
- safe (convex with respect to abscissa).
The shape of the measured curve depends essentially on the positions of the neutron source and
the neutron detector.
For the stepwise movement of the lower core section by steps of the distance )x, the neutron
pulse rate N increases by an amount )N:
Division by N(x) eliminates the unknown constants and gives
Thus, using the known previous value of the multiplication factor the next respective value can
be calculated iteratively. The initial value k = k(x ) must be known for this procedure. At the0 0
AKR, the multiplication factor for completely separated core sections is k = 0.945.0
If k(x) is known then also the subcritical amplification M as a function of x can be calculated:
The reactivity ρ is defined on basis of the multiplication factor k. From known values k(x), ρ can
be calculated as follows
The change in reactivity )D(x) is given by
with

- 9 -
Because the function dρ/dx may occasionally be increasing tremendously in the vicinity of
criticality (dangerous shape in Fig. 4) the approach to criticality has to be carried out with
continuously decreasing step width )x in order to avoid the increase in reactivity )D(x), i.e. the
product (dD/dx)·)x, to become too high.
5. Procedure of the Experiment
5.1. A prerequisite for carrying out the critical experiment through stepwise movement of the
lower core section is an experimentally secured facility status. The excess reactivity of the
reactor must not exceed the limit of 0.3 % for completely joined core sections.
5.2. First, the facility is checked in the same way as for a normal restart (i.e., among others, by
movement of the lower core section by about 30 digits and by subsequent total shut-down
by activating the push-button "Hand-RESA" (SCRAM)).
Additionally, the correct drop-off of the control rods has to be checked:
- For this purpose, the limit switch "Kernhälften zusammen" (core sections joined) has
to be bridged by turning the key-switch "Simulation Kernhälften zusammen" (simulation
of joined core sections). The key-switch administratively ensures that this operational
state can be intentionally set only.
- The control rods are moved from their inner end position consecutively. The movement
is interrupted, when the control-panel display shows that the respective control rod left
its lower end position.
- A manual SCRAM ("Hand-RESA") signal is released at the control panel.
- The drop-off of the control rods has to be checked on the monitor screens of the control
desk (confirmation by indication of the lower end position).
After this check, the facility must not be shut down until the end of the critical experiment.
The correct operation of the partial and the total shut-down systems is a condition for
the start of the critical experiment.
5.3. When starting the experiment, the core sections are completely separated. Then, the start
neutron source is moved in and the signal "Kernhälften zusammen" (core sections joined)
is bridged via the key-switch "Simulation Kernhälften zusammen" (simulation of joined
core sections). Subsequently, all control rods have to be withdrawn out of the reactor core
up to their end positions.
5.4. Using the wide-range channels i (i=1,2), the pulse rates N (1,i) are measured for theout
completely separated core sections. The control rods are drawn in and the pulse rates
N (1,i) are measured. The measured values of the wide-range channels are displayedin
directly on the monitor screen of the control desk or indirectly from the presented graphical
diagram. These values have to be recorded according to the protocol sheet in the appendix
of this instruction. For improving the reliability of the output values, the average of three

)xmax
'xcrit,min
& x
2# 100 digit
- 10 -
(16)
measurements is used.
5.5. The lower core section is lifted by 10 mm (100 digits). The control rods are pulled out and
the pulse rates N (2,i) are measured. The control rods are drawn in, again, and the pulseout
rates N (2,i) are measured. For improving the reliability of the measurement, the averagein
values of two measurements each are used.
For each wide-range channel i the ratios W (2,i) = N (1,i) / N (2,i) and W (2,i) =out out out in
N (1,i) / N (2,i) are calculated and recorded in the protocol sheet.in in
The resulting values W (2,i) and W (2,i) are plotted versus the position x of the lowerout in
core section and connected each via a straight line with the points W (1,i) and W (1,i)out in
[W (1,i) = N (1,i) / N (1,i) = 1 and W (1,i) = N (1,i) / N (1,i) = 1]. The extra-out out out in in in
polation of both the lines to the abscissa gives the estimated positions x (i) and x (i)crit, out crit, in
for the critical reactor with drawn out control rods and drawn in rods (Fig. 5). The differen-
ce between x (i) and x (i) is a measure for the control range of the rods expressedcrit, out crit, in
in terms of lower core section positions for the critical reactor. For a successful end of the
critical experiment, the technically possible maximum position x (position for joined coremax
section) must range between x (i) und x (i).crit, out crit, in
5.6. The smallest of the values x (i) is set as the estimated critical position. In the next step,crit, out
the lower core section is lifted by the half of the difference between the current position
and the minimal critical position, but not more than 10 mm (100 digits), i.e.
Then, new pulse rates N (3,i) and N (3,i) are measured with control rods drawn out andout in
in. The ratios W (3,i) = N (1,i) / N (3,i) and W (3,i) = N (1,i) / N (3,i) are calculatedout out out in in in
and plotted in the diagram. A straight line is drawn between the points W (2,i) andout
W (3,i) as well as between W (2,i) and W (3,i). The extrapolation of the resultingout in in
straight lines to the abscissa gives new (more precise than before) critical positions x (i)crit, out
and x (i) of the lower core section.crit, in
5.7. Item 5.6 is repeated as long as the extrapolation intersections with the abscissa do reliably
fulfil the condition x (i) < x < x (i). Fig. 5 corresponds to the expected result ofcrit, out max crit, in
the experiment.
5.8. If x (i) > x , the reactor core contains too less fuel, i.e. the reactor will not becomecrit, out max
critical. If x (i) < x , the reactor core contains too much fuel. The reactor has to be shutcrit, in max
down immediatly and fuel has to be removed.
5.9. After providing the condition in item 5.7, the distance between the two core sections has
to be reduced to zero using smaller steps for finishing the critical experiment (core sections

0 100 200 300 400 500 600
Position Lower Core Section / digits
0.0
0.1
0.2
0.3
0.4
0.5
0.6
0.7
0.8
0.9
1.0
Ra
tio
s o
f C
ou
nt R
ate
s N
0 /
N x
xmax
control range
of control rods
in terms of lower
core section position
control rods OUT (Pos. 4000)
control rods IN (Pos. 0)
- 11 -
Fig. 5, Expected result of the critical experiment
completely joined). The gain in reactivity has to be compensated by drawing in the control
rods.
5.10. By turning back the key-switch "Simulation Kernhälften zusammen" (simulation of joined
core sections) the bridge of the limit switch "Kernhälften zusammen" (core sections joined)
is interrupted. The critical experiment ends with record of the critical control rod position
and the time of achieving the critical state in the operation logbook.

- 12 -
6. Further Comments on the Experiment
The graphical representations of the measurements for determining the critical positions have
to be prepared during the experiment.
For this purpose, the following items are needed:
- millimetre paper (see also appendix)
- rulers
- pocket calculator
The following values have to be recorded in a table or calculated (each for drawn in or drawn
out control rods).
Position Control rod Count rates Ratios Multiplica- Subcritical Reactivity
of lower position N(x,i) W(x,i) tion factor amplification D(x) / %
core section in / out k(x) M(x)
x / digitsi
An example for the table is provided in the appendix.
7. Questions to Answer
1. Why is it mandatory to carry out a critical experiment before initial commissioning of a
nuclear reactor ?
2. Give some quantities that affect the criticality of a nuclear facility!
3. What are the possible operational states of a nuclear reactor ? What operational states are
allowed and what operational states must be avoided in any case? Justify the answers!
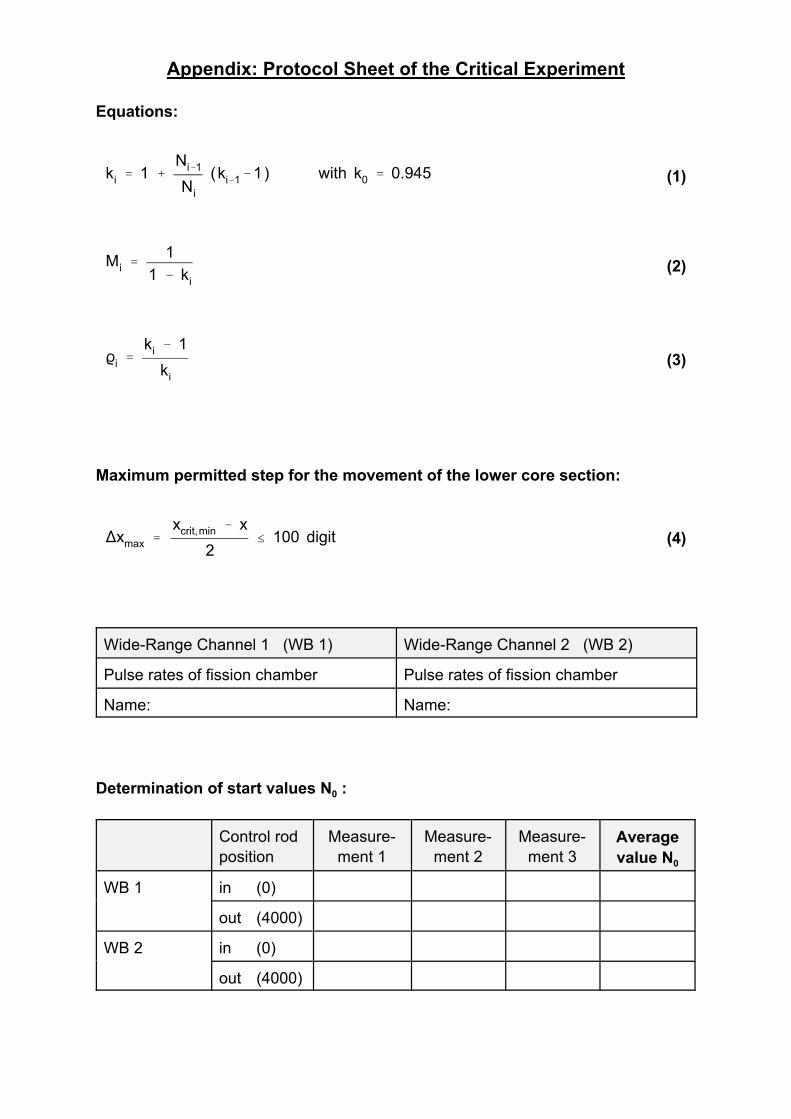
ki' 1 %
Ni&1
Ni
(ki&1
&1) with k0' 0.945
Mi'
1
1 & ki
ki'
ki& 1
ki
)xmax
'xcrit,min
& x
2
# 100 digit
(1)
(2)
(3)
(4)
Appendix: Protocol Sheet of the Critical Experiment
Equations:
Maximum permitted step for the movement of the lower core section:
Wide-Range Channel 1 (WB 1) Wide-Range Channel 2 (WB 2)
Pulse rates of fission chamber Pulse rates of fission chamber
Name: Name:
Determination of start values N :0
Control rod Measure- Measure- Measure-
position ment 1 ment 2 ment 3
Average
value N0
WB 1 in (0)
out (4000)
WB 2 in (0)
out (4000)

No. of wide-range channel ( WB1 / WB2 ) : ............
Position Control Count rates Ratios Multipli- Subcritical Reactivity
of lower rod posi- N / N̄ cation amplifica- k
core sect. tion factor tion
x / digits k Mi
0 i
i i
i
N N N̄i, 1 i, 2 i
0 in 1.00 0.945 18.18 -0.0582
out 1.00 0.945 18.18 -0.0582
100 in
out
in
out
in
out
in
out
in
out
in
out
in
out
in
out
in
out
in
out
in
out
TECHNICAL UNIVERSITY
DRESDEN
Institute of Power Engineering
Training Reactor
Reactor Training Course
Experiment
"Adjoint Flux Function"
M
MrM2
M
MrM%2
- 1 -
Instruction
Experiment "Adjoint Flux Function"
Content:
1. . . . Motivation
2. . . . Tasks
3. . . . Introduction
4. . . . Instructions Concerning the Experiment
5. . . . Instructions Concerning the Protocol
6. . . . Questions to Answer
Appendix 1: Physical Background
Appendix 2: Application of Perturbation Theory to Experiments at the AKR
(One-Group Theory)
Appendix 3: Application of Perturbation Theory to Experiments at the AKR
(Two-Group Theory)
Appendix 4: Protocol forms
Figures:
Fig. 1: Experimental setup
Fig. 2: Normalised BESSEL functions I und I and its squares for the radial dimensions 0 1
of the AKR
Fig. 3a: Radial distribution of the neutron fluxes and of the adjoint fluxes at the AKR
Fig. 3b: Radial distribution of and at the AKR
Fig. 4: Typical shape of an absorber characteristic in the AKR
Fig. 5: Typical shape of a scatterer characteristic in the AKR
(issued: March 2015)
- 2 -
1. Motivation
For the safe operation of a nuclear reactor it is necessary to know all effects that result from
changes of both, the material composition and the geometry of the reactor core.
The influence of such changes on the reactor-physical behaviour can be described globally by
the resulting reactivity changes.
By measuring reactivity characteristics for samples made from different materials the qualitative
and quantitative influence of typical structural materials of nuclear reactors on the reactivity
balance can be investigated.
2. Tasks
1. The movement of structural material samples within the central experimental channel of the
reactor is realised by a thin-walled aluminum leading tube. Within the tube, the respective
sample is fixed at a particular position by distance holders. The tube is labeled in such a way
that the position of the sample inside the reactor is determined as function of the distance
r from the reactor core center (symmetry axis).
2. Before measuring the samples, the background reactivity of the leading tube is measured
after filling it with distance holder elements only (i.e. without any structural material sample)
and completely inserting it into the central experimental channel EK 1-2.
3. The reactivity characteristics ρ(r) are measured for samples made from different materials
(e.g. absorber, scatterer, fuel, cavity).
For this reason, the reactivity changes caused by position changes of the sample in the reactor
is compensated using calibrated control rods. With help of the control rod characteristics
(available at the facility as a result of control rod calibration) the corresponding value of
change in reactivity can be determined.
4. The measured reactivity characteristics have to be discussed.
5. The composite and the interaction cross section of an unknown sample can be determined
by comparison of the reactivity characteristic of the unknown sample with those of known
samples.
3. Introduction
In the experiment "Control Rod Calibration", the influence of an absorber with small spatial
dimension on the reactor core has already been discussed. It was shown that the reactivity loss
caused by a differential part of the rod dz located at the position z is the larger
- the larger the macroscopic absorption cross section is,
- the larger the neutron flux density Φ at the position z is, and
- the longer the rod part dz is.
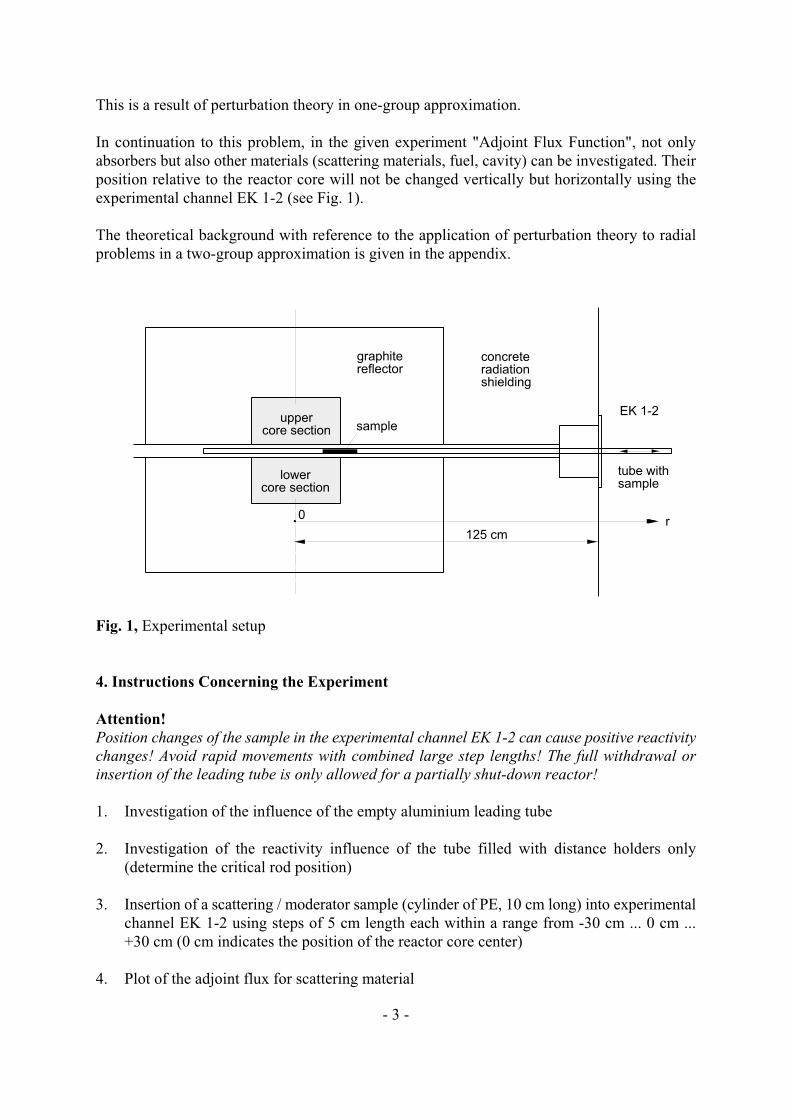
concreteradiationshielding
EK 1-2
tube withsample
r0
125 cm
uppercore section
lowercore section
sample
graphitereflector
- 3 -
This is a result of perturbation theory in one-group approximation.
In continuation to this problem, in the given experiment "Adjoint Flux Function", not only
absorbers but also other materials (scattering materials, fuel, cavity) can be investigated. Their
position relative to the reactor core will not be changed vertically but horizontally using the
experimental channel EK 1-2 (see Fig. 1).
The theoretical background with reference to the application of perturbation theory to radial
problems in a two-group approximation is given in the appendix.
Fig. 1, Experimental setup
4. Instructions Concerning the Experiment
Attention!
Position changes of the sample in the experimental channel EK 1-2 can cause positive reactivitychanges! Avoid rapid movements with combined large step lengths! The full withdrawal orinsertion of the leading tube is only allowed for a partially shut-down reactor!
1. Investigation of the influence of the empty aluminium leading tube
2. Investigation of the reactivity influence of the tube filled with distance holders only
(determine the critical rod position)
3. Insertion of a scattering / moderator sample (cylinder of PE, 10 cm long) into experimental
channel EK 1-2 using steps of 5 cm length each within a range from -30 cm ... 0 cm ...
+30 cm (0 cm indicates the position of the reactor core center)
4. Plot of the adjoint flux for scattering material

- 4 -
5. Insertion of an absorber sample (cylinder of PVC, 5cm long) into experimental channel
EK 1-2 using steps of 5 cm length each within a range from -30 cm ... 0 cm ... +30 cm
(0 cm indicates the position of the core center)
6. Plot of the adjoint flux for absorber material
7. Possible repetition of points 5 and 6 e.g. for a graphite or a fuel sample
5. Instructions Concerning the Protocol
- Short description of the objectives of the experiment
- Tables of the measured values
- Analysis of the measurements including intermediate results
- Graphical presentation of the experimentally found characteristics. For the absorber material,
a comparison with the theoretically found characteristic should be given. The characteristic
of the scatterer has to be discussed qualitatively.
- An error analysis has to be provided
6. Questions to Answer
1. Make sure how to determine the reactivity, which is due to a particular sample and is
compensated by a control rod, using a differential or integral rod characteristics!
2. What is the methodical difference between the determination of an integral control rod
characteristics and the determination of the characteristics of a sample whose dimensions
are small compared to those of the reactor core?
3. Consider a graphite sample (assuming: only D ≠ 0) being as a scatterer in the center of the
reactor core (r = 0). Why not ρ = 0 has to be expected?
4. Make sure the procedure for the determination of the Uranium content in a sample using the
reactivity characteristics!

D '1
3·Etr
'1
3(ET&E
s·µ)
, µ '2
3·A
Erem
' Ea,1
% Es,162
, Es,162
'Es,1
1
.ln
Eo
Eg
keff
' k´eff
& )keff
' 1
div(D1· gradM
1) & E
remM1% g·<·E
f,2M2' 0
div(D2· gradM
2) & E
a,2M2% p·E
s,162M1' 0
M M ' 0
k 'k´eff&1
k´eff
… 0
k´eff ' koeff
% )keff … 1
koeff
' 1
- 5 -
Appendix 1: Physical Background
As an approximation for the description of neutron transport we use the diffusion equation in the
two-group approximation.
(1)
with
and
Small perturbations in the context of perturbation theory are deviations of the coefficients D1,
D2, Σ , Σ , Σ , Σ , while it is assumed that the neutron flux distribution in the reactorrem a, 2 f, 2 s, 162
is not changed by the sample.
Equation (1) has the following matrix representation:
(2)
If the sample that causes the perturbation S is introduced into the reactor, the reactor becomes
subcritical or supercritical, i.e.
(3)
with ... perturbed state
and ... unperturbed state
The perturbation caused by the change in the coefficients is compensated, e.g., by re-adjustment
of the control rods. It results:
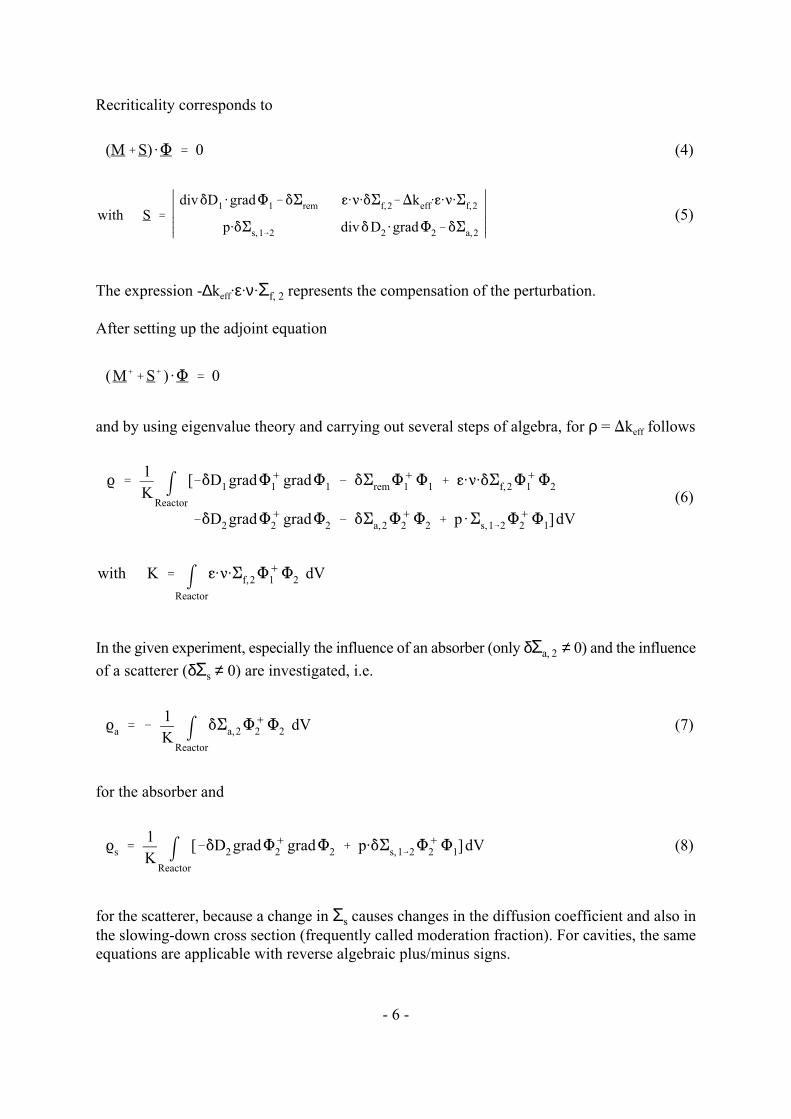
with K ' mReactor
g·<·Ef,2M%1M2
dV
(M%S) ·M ' 0
with S ' /0000/0000
div*D1·gradM
1&*E
remg·<·*E
f,2&)k
eff·g·<·E
f,2
p·*Es,162
div*D2·gradM
2&*E
a,2
(M%%S% ) ·M ' 0
k '1
K mReactor
[&*D1gradM%
1gradM
1& *E
remM%1M1% g·<·*E
f,2M%1M2
&*D2gradM%
2gradM
2& *E
a,2M%2M2% p·E
s,162M%2M1]dV
ka' &
1
K mReactor
*Ea,2M%2M2
dV
ks'
1
K mReactor
[&*D2gradM%
2gradM
2% p·*E
s,162M%2M1]dV
- 6 -
Recriticality corresponds to
(4)
(5)
The expression -∆k ·ε·ν·Σ represents the compensation of the perturbation.eff f, 2
After setting up the adjoint equation
and by using eigenvalue theory and carrying out several steps of algebra, for ρ = )k followseff
(6)
In the given experiment, especially the influence of an absorber (only δΣ ≠ 0) and the influencea, 2
of a scatterer (δΣ ≠ 0) are investigated, i.e.s
(7)
for the absorber and
(8)
for the scatterer, because a change in Σ causes changes in the diffusion coefficient and also ins
the slowing-down cross section (frequently called moderation fraction). For cavities, the same
equations are applicable with reverse algebraic plus/minus signs.

ka' &
1
K· *E
a,2M%2M2)V
ks'
1
K(&*D
2gradM%
2gradM
2% p·*E
s,162M%2M1))V
- 7 -
Equation (6) shows that an increase in the cross sections δΣ und δΣ is weighted with Φ Φ,a s, 162+
but a change of D is weighted with gradΦ gradΦ. An increase in the absorption cross sections+
results in a negative reactivity contribution. In the same way, an increase in the diffusion
coefficient causes a negative reactivity contribution, since this corresponds to an increase in the
leakage term.
Assuming that the perturbation occupies only a small part ∆V of the total volume of the reactor
with negligible influence of the neutrons, the integration in equations (7) and (8) can be avoided
with the result:
(9)

0 5 10 15 20
r / cm
0.0
0.2
0.4
0.6
0.8
1.0
1.2
I 0
I 02
I 1
I 1
2
reactor core reflector
M
MrM
M ' Mmax
· I0
·2.405
R%*· r
M
MrM ' M
max·
2.405
R%*· I
1·
2.405
R%*· r
- 8 -
Appendix 2: Application of Perturbation Theory to Experiments at the AKR
(One-Group Theory)
In one-group theory, it is Φ = Φ und Φ = Φ .1 2 1 1
+
Having a cylindrical geometry like that of the AKR, the radial shape of Φ and can be
expressed using BESSEL functions:
with R = 12.5 cm and δ = 6.35 cm.
The approximation using one-group theory is well applicable for absorbers with small reactivities.
Fig. 2, Normalised BESSEL functions I und I and its squares for the radial dimensions 0 1
of the AKR
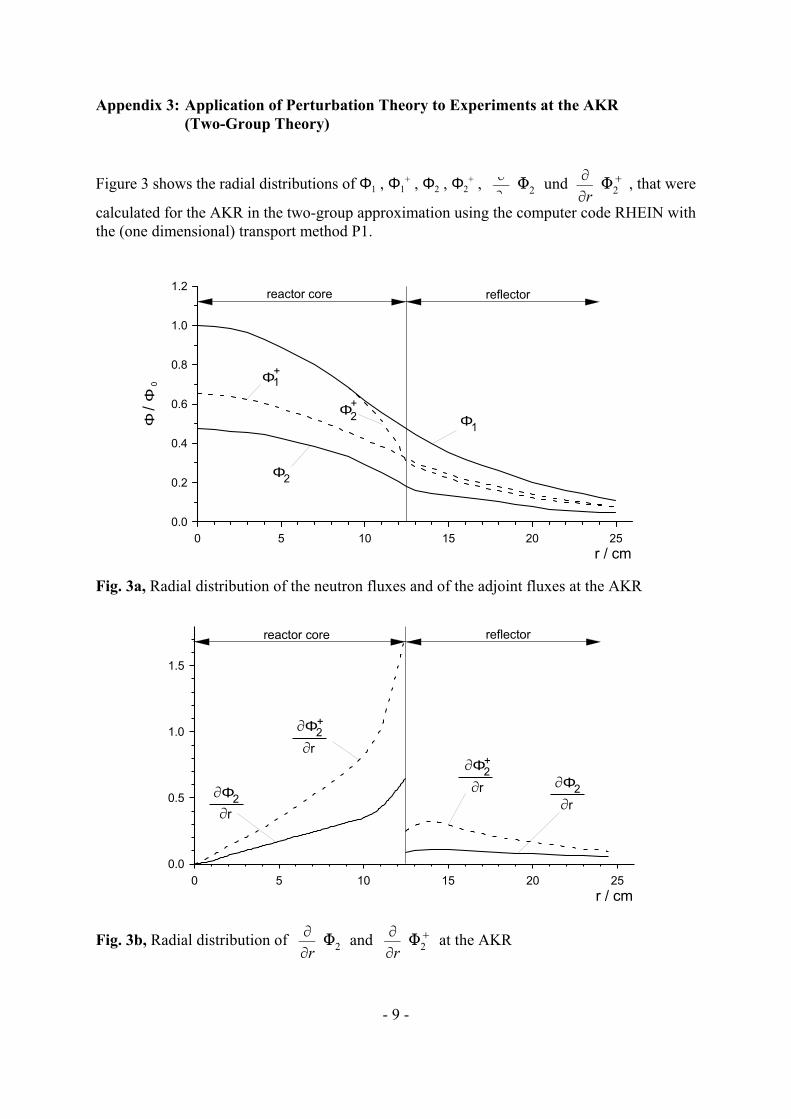
0 5 10 15 20 25
r / cm
0.0
0.2
0.4
0.6
0.8
1.0
1.2
Φ / Φ
0
Φ1
Φ2
reactor core reflector
Φ1+
Φ2
+
0 5 10 15 20 25
r / cm
0.0
0.5
1.0
1.5
reactor core reflector
MΦ2
Mr
+
MΦ2
MrMΦ
2
Mr
MΦ2
+
Mr
M
MrM2
M
MrM%2
M
MrM2
M
MrM%2
- 9 -
Appendix 3: Application of Perturbation Theory to Experiments at the AKR
(Two-Group Theory)
Figure 3 shows the radial distributions of Φ , Φ , Φ , Φ , und , that were1 1 2 2
+ +
calculated for the AKR in the two-group approximation using the computer code RHEIN with
the (one dimensional) transport method P1.
Fig. 3a, Radial distribution of the neutron fluxes and of the adjoint fluxes at the AKR
Fig. 3b, Radial distribution of and at the AKR

-30 -20 -10 0 10 20 30
r / cm
0.2
0.4
0.6
0.8
1.0ρρ max
reactor corereflector reflector
-30 -20 -10 0 10 20 30
r / cm
0.2
0.4
0.6
0.8
1.0ρρ
max
reactor corereflector reflector
- 10 -
On the basis of their shapes, the experimentally determined reactivity characteristics of the AKR
can be explained (see Figs. 4 and 5).
Fig. 4, Typical shape of an absorber characteristic in the AKR
Fig. 5,Typical shape of a scatterer characteristic in the AKR
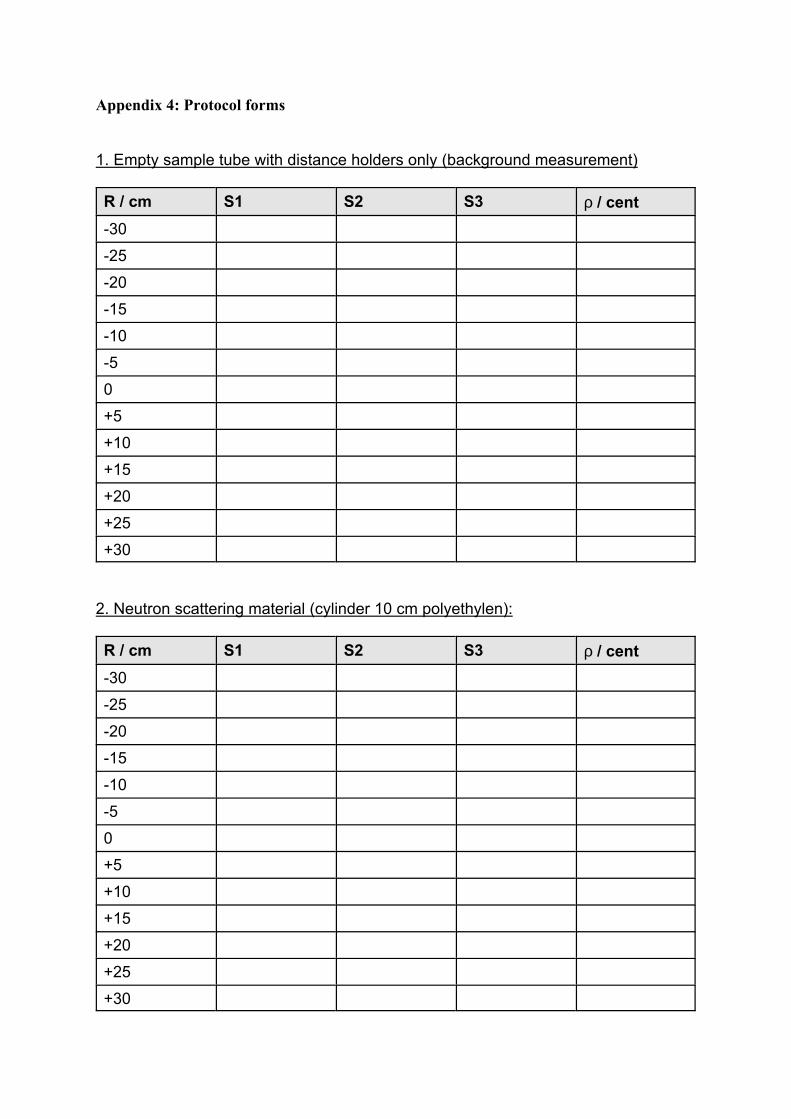
Appendix 4: Protocol forms
1. Empty sample tube with distance holders only (background measurement)
R / cm S1 S2 S3 ρ / cent
-30
-25
-20
-15
-10
-5
0
+5
+10
+15
+20
+25
+30
2. Neutron scattering material (cylinder 10 cm polyethylen):
R / cm S1 S2 S3 ρ / cent
-30
-25
-20
-15
-10
-5
0
+5
+10
+15
+20
+25
+30

3. Neutron absorbing material (cylinder 5 cm PVC):
R / cm S1 S2 S3 ρ / cent
-30
-25
-20
-15
-10
-5
0
+5
+10
+15
+20
+25
+30

-5
-10
-15
-20
-25
-30
-35
+5
+10 +20 +30-10-20
Core Diameter
Radius R / cm
Reactivity ρ / centExperiment"Adjoint Flux Function"
-30

TECHNICAL UNIVERSITY
DRESDEN
Institute of Power Engineering Training Reactor
Reactor Training Course
Experiment
"Neutron Flux Distribution"

- 1 -
Instruction forExperiment “Neutron Flux Distribution”
Content:
1. . . . . Motivation
2 . . . . Introduction
3 . . . . Measurement of the Neutron Flux Density Distribution
4 . . . . Instructions for the Experiment4.1. . . Equipment of the Measurement4.2. . . Irradiation of the Activation Samples4.3 . . . Energy Calibration of the Spectrometer4.4. . . Evaluation and Protocol
Figures:
Fig. 1: Radial flux density in the AKR-2Fig. 2: Decay scheme and gamma energy spectrum of Mn56
Fig. 3: Typical relative radial flux density distribution in the AKR-2Fig. 4: Measurement equipment
(issued: March 2015)

δr
Rk
Distance from Core Center r [cm]
0
-10-20-30 +10 +20 +300
2
1
3
4
5
6
7
Neut
ron F
lux
Den
sity
[10
cm
·s·W
]7
-2-1
-1
Reflector ReflectorReactor Core
Rkδr
calculated with two-group theory
reactor with reflector approximated by J (2,405 r/( + ))0
Rk δ
reactor without reflector approximated by J (2,405 r/ )0
Rk
- 2 -
1. Motivation
For any nuclear reactor, knowledge on the spatial neutron flux density distribution is of major
interest: in research reactors, it is an input variable for many experiments (e.g. as the source
strength for irradiation experiments), in power reactors, it is important for determining the
distribution of heat sources. In the given experiment, the radial flux density distribution of the
thermal neutrons is measured. The used method, i.e. the activation of suitable detector foils, is
one of the most important methods in nuclear technology.
2. Introduction
Figure 1 shows the radial distribution of the thermal neutron flux density. It was calculated by
multi-group diffusion calculations (considering both, thermal and fast neutrons). In the fuel
region, the distribution approximately fits the cylindric BESSEL function J (2.405·r/(R +δ))0 K
that has its first root at R = R +δ. The comparison of its shape with the shape of J (2.405·r/R )K 0 K
for the bare reactor shows that due to the reflector, the reactor behaves like a bare reactor with
a radius that was increased by the distance δ.
Fig. 1, Radial flux density in the AKR-2
For a reactor with a fixed (material) composition, the critical condition gives the reactor
minimum size, which is determined such that the neutron losses by leakage are exactly compen-
sated by the multiplication of the neutron content inside the core.

T 1/2
= 2,58 h
- 3 -
If adding a reflector, this minimum size, which is in the bare reactor R = R +δ, is achieved withK
a much smaller core volume with the radius R . Thus, less of the valuable fuel needs to beK
utilised for a reactor with reflector than for a bare reactor. The parameter δ is called reflector
saving.
Considering the axial neutron flux density, analogous results are found but with the cylinder
function replaced by the trigonometric function cos(π·(z/2)/(Z +δ)). The parameter Z standsK K
for the half of the core height.
The parameters B = 2.405/(R +δ) and B = π·(z/2)/(Z +δ) of the distributions play a major roler K Z K
for determining the geometry. The quantity B = B +B is called geometric buckling because2 2 2
r z
this quantity determines the second spatial derivative in the reactor fundamental equation
∆Φ(r,z) + B ·Φ(r,z) = 02
and, hence, the curvature of the flux.
3. Measurement of the Neutron Flux Density Distribution
Neutron activation samples are used as detectors. These are insensitive to γ-radiation and they
can be kept small enough that they are spatially well-defined and do not disturb the reactor
neutron flux density.
Several samples can be irradiated simultaneously at different positions inside the reactor such
that the measurement of the relative flux density is not influenced by reactor power fluctuations.
For measurements of thermal neutrons, manganese suits well due to the reaction:
Mn(n,γ) Mn Fe + ß + γ55 56 56 -
In the thermal energy region, the capture cross section of manganese (σ = 13.3 b) is well0
proportional to the inverse neutron velocity (i.e. a so-called 1/v-absorber). Resonances exist
only for energies higher than 0.337 keV and contribute to the integral cross section less than
5 %. Of course, this value can vary at different positions in the reactor because of spatial
dependence of the neutron energy spectrum. But using manganese this effect can be neglected,
since it ranges within the achievable error thresholds of the experiment. The half-life of 2.58 h
is from the experimental point of view very convenient: On the one hand, it is large enough that
time corrections are not essential and, on the other hand, it is small enough that also low neutron
flux values give well-measurable activities due to approaching saturation activity. Fig. 2 shows
the decay scheme and the typical gamma energy spectrum of manganese.
For the measurement of the activity of Mn, the emitted γ-radiation is advantageously used,56
since the self-absorption within the sample is very low. Thus, perturbations due to irregularities
due to the thickness of the sample is avoided.

Energy [keV]
Cou
ntr
ate
[1
0 p
uls
es /
min
]3
4
8
12
16
847 keV
20%
50%
30%
56Mn (2,58h)
56
Fe0
0,847
2,652,98 MeV
0 200 400 600 800 1000 1200
ß-
- 4 -
Due to the design of the AKR-2, the activation samples cannot be placed into the reactor core
itself. But the samples can be arranged in the central experiment channel EK1-2, which leads
horizontally through the reactor core centre. If aluminium is used as a sample holder, which
behaves from reactor-physics point of view like air, the activation detectors are surrounded by
materials whose scattering and moderation properties are similar to those of the core and
reflector materials. Thus, the measured neutron flux density distribution Φ(r) is identical to that
of the reactor core which results from the two-group diffusion theory (Fig. 3).
The neutron activation detectors used in the experiment are disks of manganese having a
diameter of about 1 cm. The aluminium sample holder has cuts after every 2 cm for inserting
the disks. The weights of all manganese samples range between (0.048 ... 0.051) g and can be
considered to be identical with regard to the overall accuracy of the experiment.
Fig. 2, Decay scheme and gamma energy spectrum of Mn56

Re
lative
Flu
x D
en
sity
(r)/
(0)
Φ t
h t
hΦ
0,2
0,4
0,6
0,8
0 4 8 12 16 20 24 28
1,0
0
Distance from Core Center r [cm]
measured at front side
measured at rear side
calculated
Reactor Core Reflector
- 5 -
Fig. 3, Typical relative radial flux density distribution in the AKR-2
4. Instructions for the Experiment
4.1. Equipment of the Measurement
The measurement setup is presented in Fig. 4. It consists of the scintillator-photomultiplier-unit,
a preamplifier and a computer for the analysis. The activation samples and the aluminium
sample holder are visible in the foreground of the picture as well. The scintillator is coupled to
a multichannel analyser via a preamplifier and a spectroscopic amplifier. In the preamplifier, the
primary charge pulses are converted into voltage pulses (output-voltage is proportional to the
input charge). In the spectroscopic amplifier, the pulses are amplified up to a range of 1 ... 10V.
The multichannel analyser recognises the incoming pulses, evaluates them with respect to their
height (voltage), which contains the information about the energy, and sorts them into consecu-
tive pulse-height channels. The result is a pulse-height spectrum that contains the energy
information of all recognised gamma quants. Each measured gamma quant is a count in the
corresponding energy channel of the multichannel analyser.
It should be realised that even discrete gamma energies do not cause sharp lines in the spectrum,
because of statistical fluctuations of the elementary processes in the detector and in the
post-processing electronics. This phenomenon creates from theoretically sharp lines GAUSSI-
AN bell-curves (peaks). The mean pulse heights correspond to the energy of the gamma quants.
Using a PC programme, the gamma energy spectrum can either be observed on the screen,
directly evaluated or saved.

- 6 -
Fig. 4, Measurement equipment
Detectors for gamma spectroscopy are usually scintillation detectors (e.g. NaI) or semiconduc-
tor detectors made of Ge(Li) or increasingly high purity germanium (HPGE).
In the given experiment, NaI is used as scintillation detector for the measurements. Scintillation
detectors are relatively easy to handle and have a high efficiency. A disadvantage of scintilla-
tors is the limited energy resolution, i.e. the ability to resolve two gamma peaks that are located
very close to each other.
Scintillation detectors consist of a combination of a luminescent material (scintillator) that is
stimulated by ionising radiation to emit flashes (scintillations) and a photomultiplier that
converts the flashes into electrical pulses.
Within the scintillator, the absorbed energy of a gamma quant is converted into light by excita-
tion of the scintillator material and its subsequent return to the ground state. For spectrometric
purposes, the absorbed gamma energy and the number of emitted light quants and the subse-
quent pulse height at the output of the photomultiplier must be proportional to each other.
Inorganic mono-crystals made from sodium iodide (NaI) doped with Thallium for activating the
light emission has proved a suitable scintillator material in spectroscopy of gamma radiation
(NaI(Tl)-scintillators). Because of their high physical density ρ = 3.67 g/cm³, their high content

- 7 -
of iodine of 85 wt%, and due to the ordinal number of Z = 53, they have a high absorption
capability for gamma radiation. Clear crystals that are homogeneously doped and transmissible
for their own fluorescent light can be produced in dimensions up to a thickness of e.g. 300 mm
or diameter of 400 mm. Also high-energy gamma quants are sufficiently absorbed by these
crystals. Commercially available crystals are hermetically sealed (because NaI is hygroscopic)
e.g. within aluminium cases, having a glass or plastic window for the light emission. In order to
avoid light losses all surfaces of the crystal except for the emission window are not polished but
surrounded with a reflecting material, e.g. MgO.
The energy resolution of NaI(Tl)-scintillators is usually given with regard to the gamma line of
the radionuclide Cs-137 (E = 662 keV). Best energy resolution obtained with selected NaI-γscintillation crystals and photomultiplier combinations are in the order of about 6 %, common
values for commercial scintillator crystals and photomultipliers range between (8...12) %
FWHM.
The scintillations from the crystal need to be transmitted to the photocathode of the photomulti-
plier with only as small as possible losses. Immersion layers (e.g. silicone oil) between scintilla-
tor surface and photomultiplier reduce total reflection.
By the photoelectric effect, a few free electrons are emitted on the photocathode. Between the
photocathode and the anode of the photomultiplier, a graduated high voltage is applied via a
voltage divider and a series of intermediate electrodes (dynodes). In the electric field between
each two of the dynodes, the electrons accelerate and liberate further electrons by collision
ionisation at the next dynode. This effect leads to a low-noise amplification of the initial
number of electrons (factor 10 ...10 ). Thus, scintillation flashes are transformed into ener-5 9
gy-proportional electric current and voltage signals and are amplified in the photomultiplier.
Since ambient light would completely overlap the scintillation effect of the detector and also
stimulate the photocathode of the photomultiplier to emit electrons, the entire scintilla-
tor-photomultiplier system needs to be light-tightly sealed.
4.2. Irradiation of the Activation Samples
The sample holder is filled with the manganese sample disks. For the experiment, 30 samples
are arranged with a spacing of 2 cm each. This allows a full measurement of the neutron flux in
the core and reflector region of the AKR-2.
Afterwards, the experimental channel EK1-2 of the AKR-2 has to be opened, inserted radiation
protection plugs have to be unloaded and wipe test for checking possible contamination inside
the channel have to be carried out. Then, the reactor is started and made critical at 2 W power.
For the further experimental procedure, it is reasonable to use the automatic power control. At
a steady-state power of 2 W, the sample holder is inserted into the experimental channel.
A label at the sample holder simplifies the positioning. The start time of the irradiation has to be
recorded. The irradiation should last about 45 min. During this time, presence in front of
experimental channel should be avoided due to reasons of radiation protection.
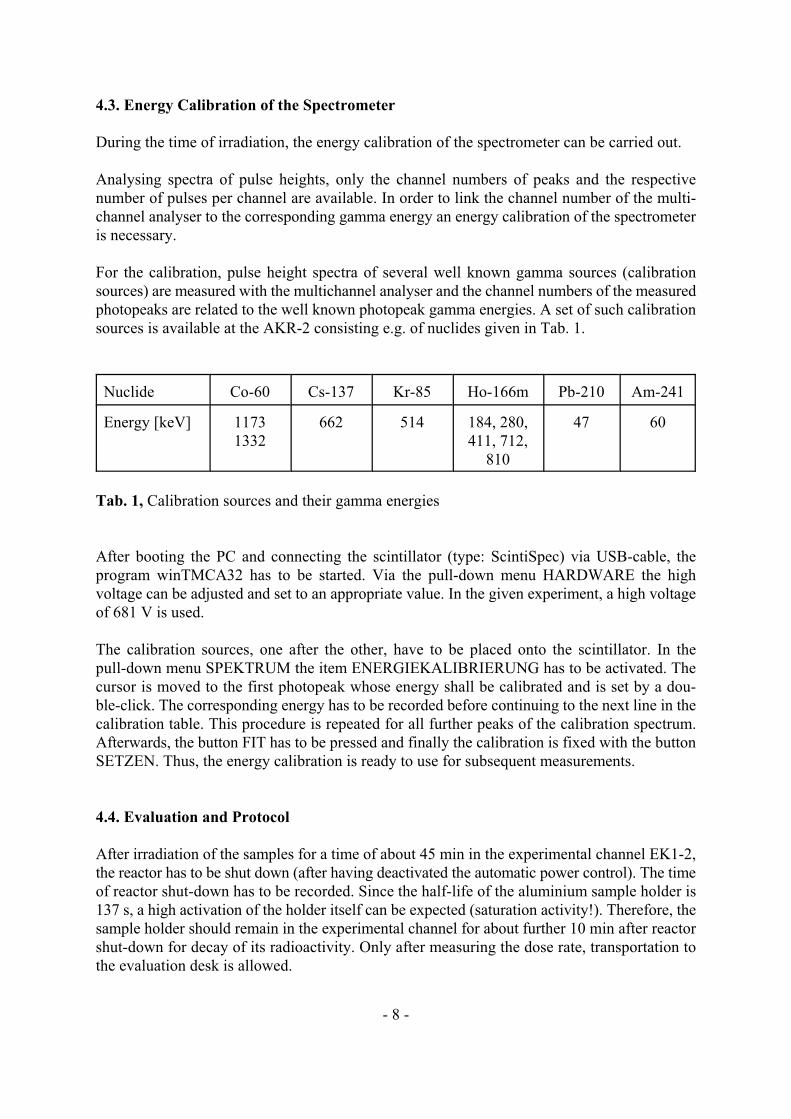
- 8 -
4.3. Energy Calibration of the Spectrometer
During the time of irradiation, the energy calibration of the spectrometer can be carried out.
Analysing spectra of pulse heights, only the channel numbers of peaks and the respective
number of pulses per channel are available. In order to link the channel number of the multi-
channel analyser to the corresponding gamma energy an energy calibration of the spectrometer
is necessary.
For the calibration, pulse height spectra of several well known gamma sources (calibration
sources) are measured with the multichannel analyser and the channel numbers of the measured
photopeaks are related to the well known photopeak gamma energies. A set of such calibration
sources is available at the AKR-2 consisting e.g. of nuclides given in Tab. 1.
Nuclide Co-60 Cs-137 Kr-85 Ho-166m Pb-210 Am-241
Energy [keV] 1173 662 514 184, 280, 47 60
1332 411, 712,
810
Tab. 1, Calibration sources and their gamma energies
After booting the PC and connecting the scintillator (type: ScintiSpec) via USB-cable, the
program winTMCA32 has to be started. Via the pull-down menu HARDWARE the high
voltage can be adjusted and set to an appropriate value. In the given experiment, a high voltage
of 681 V is used.
The calibration sources, one after the other, have to be placed onto the scintillator. In the
pull-down menu SPEKTRUM the item ENERGIEKALIBRIERUNG has to be activated. The
cursor is moved to the first photopeak whose energy shall be calibrated and is set by a dou-
ble-click. The corresponding energy has to be recorded before continuing to the next line in the
calibration table. This procedure is repeated for all further peaks of the calibration spectrum.
Afterwards, the button FIT has to be pressed and finally the calibration is fixed with the button
SETZEN. Thus, the energy calibration is ready to use for subsequent measurements.
4.4. Evaluation and Protocol
After irradiation of the samples for a time of about 45 min in the experimental channel EK1-2,
the reactor has to be shut down (after having deactivated the automatic power control). The time
of reactor shut-down has to be recorded. Since the half-life of the aluminium sample holder is
137 s, a high activation of the holder itself can be expected (saturation activity!). Therefore, the
sample holder should remain in the experimental channel for about further 10 min after reactor
shut-down for decay of its radioactivity. Only after measuring the dose rate, transportation to
the evaluation desk is allowed.

- 9 -
For the evaluation of the activation samples, the photopeak of Mn of 847 keV energy is used.56
In the given experiment, the small mass tolerances of the manganese samples are irrelevant.
Though in an absolute measurement, the tolerances had to be taken into account.
For the measurement of the particular samples, the live-time of the spectrometer has to be set to
60 s. The particular samples are measured one after the other and the start time of each measure-
ment has to be recorded. This enables a correction of the count rate that has been already
decreased since the end of the irradiation. It is reasonable to elaborate a suitable routine to
analyse the data.
The determination of the relative activity is done by measuring the peak areas, i.e. said more
precisely the net peak areas. After the measurement of each sample, the net areas can be
determined by the following functions of the program winTMCA32:
- Open the pull-down menu BERECHNEN
- Mark the peak by using the button PEAKSUCHE
- By repeated use of the pull-down menu BERECHNEN, the spectrum inside the peak limits is
integrated (SPEKTRUM INTEGRIERT) and an additional window appears.
- By activation of the flag ZÄHLRATE the net pulse rate is displayed.
- After having recorded the net pulse rate, the window has to be closed and the spectrum to be
deleted. Afterwards, the spectrometer is ready for the measurement of the next Mn sample.

TECHNICAL UNIVERSITY DRESDEN Institute of Power Engineering Training Reactor
Reactor Training Course
Experiment
"Gamma Dosimetry andDose Rate Determination"

- 1 -
Instruction for
Experiment "Gamma Dosimetry and Dose Rate Determination"
Content:
1 . . . . Motivation
2. . . . . Theoretical Background
2.1 . . . Properties of Ionising Radiation and Interactions of Gamma Radiation
2.2. . . Detection of Ionising Radiation
2.3. . . Quantities and Units of Dosimetry
3. . . . . Procedure of the Experiment
3.1. . . Commissioning and Calibration of the Dosimeter Thermo FH40G
3.2. . . Commissioning and Calibration of the Dosimeter Berthold LB 133-1
3.3. . . Commissioning and Calibration of the Dosimeter STEP RGD 27091
3.4. . . Setup of the Experiment
3.4.1. . Measurement of Dose Rate in Various Distances from the Radiation Source
3.4.2. . Measurement of Dose Rate behind Radiation Shielding
3.5. . . Measurement of Dose Rate at the open Reactor Channel
4. . . . . Evaluation of Measuring Results
Figures:
Fig. 1: Composition of the attenuation coefficient µ of γ-radiation in lead
Fig. 2: Design of an ionisation chamber
Fig. 3: Classification and legal limit values of radiation protection areas
Fig. 4: Setup of the experiment
(issued: January 2019)

- 2 -
1. Motivation
The experiment aims on familiarising with the methods of calibrating different detectors for
determination of the dose and the dose rate. Furthermore, the dose rate and the activity in the
vicinity of an enclosed source of ionising radiation (Cs-137) will be determined taking into
account the background radiation and the measurement accuracy. Additionally, the experiment
focuses on the determination of the dose rate of a shielded source as well as on the calculation
of the required thickness of the shielding protection layer for meeting the permissible maximum
dose rate. The dose rate at the open reactor channel of the AKR-2 will be measured.
2. Theoretical Background
2.1. Properties of Ionising Radiation and Interactions of Gamma Radiation
The radiation emitted along with the transformation of radionuclides is the outward characteri-
stic of radioactivity. The radiation is categorised as α-radiation (He-4 nuclei), ß - and ß -+ -
radiation (positrons and electrons, respectively) and γ-radiation. As a by-product of such
transformations or as a result of them conversion electrons and X-rays can be observed. In some
cases of nuclear reactions, also neutrons are released that will interact with matter, too.
Gamma radiation is high-energy electromagnetic radiation that are emitted in form of photons
with a discrete energy distribution along with a transition of an atomic nucleus from an excited
state into a lower or the ground state. Simply speaking, the origin of gamma radiation corre-
sponds to the origin of visible light, which, in contrast, is the result of transitions between states
of the atomic shell.
The interaction of gamma radiation with matter differs significantly from that of charged
particles with matter. Whereas α- and ß-radiation lose energy by ionisation or radiation slowing-
down processes, γ-rays lose energy mainly by the photo effect, Compton scattering, and pair
production.
The attenuation of gamma radiation, i.e. the intensity I after penetration of a layer with the
thickness x consisting of absorber material relative to the intensity I without any absorber, can0
be described via the attenuation equation I = I · exp(-µx) with µ being the linear attenuation0
coefficient. This coefficient is the arithmetic sum of those coefficients which quantify the three
independently appearing kinds of absorption interactions of gamma radiation, i.e.
µ = µ + µ + µ (Fig. 1).co Ph Pa
The quantity µ represents the Compton scattering (also called: Compton effect), which is theco
transfer of energy from a photon to an electron of the atomic shell by collision. The gamma
quant is redirected, i.e. scattered. This process goes along with a defined loss in energy depen-
dent on the angle (being between 0 ... 180°). The emitted electron is called a Compton electron.
Compton electrons have a continuous energy spectrum.
The quantity µ represents the photo effect, which is the transfer of the entire energy of aPh
photon to an electron of the atomic shell and hence, the photon vanishes. The electron (photo
electron) is emitted out of the atomic shell with the total energy of the extinguished photon
minus the ionisation energy.
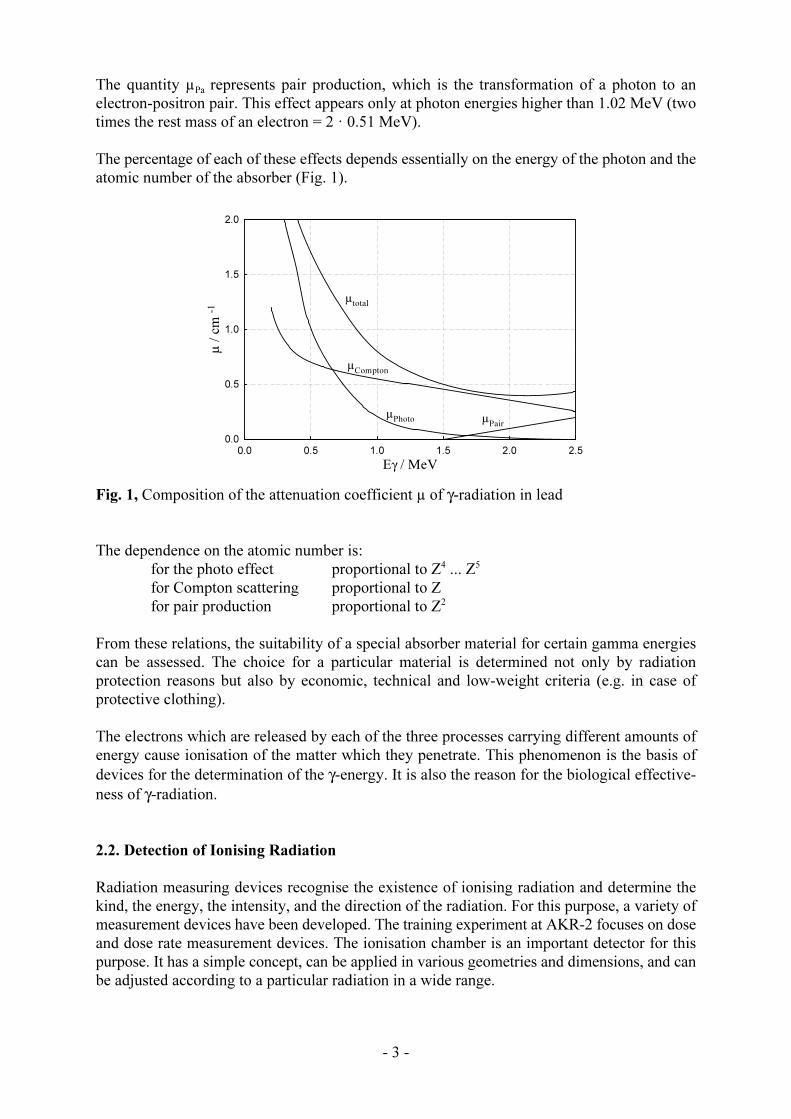
0.0 0.5 1.0 1.5 2.0 2.5
Eγ / MeV
0.0
0.5
1.0
1.5
2.0µ
/ c
m -1
µtotal
µCompton
µPhoto µ
Pair
- 3 -
The quantity µ represents pair production, which is the transformation of a photon to anPa
electron-positron pair. This effect appears only at photon energies higher than 1.02 MeV (two
times the rest mass of an electron = 2 · 0.51 MeV).
The percentage of each of these effects depends essentially on the energy of the photon and the
atomic number of the absorber (Fig. 1).
Fig. 1, Composition of the attenuation coefficient µ of γ-radiation in lead
The dependence on the atomic number is:
for the photo effect proportional to Z ... Z4 5
for Compton scattering proportional to Z
for pair production proportional to Z2
From these relations, the suitability of a special absorber material for certain gamma energies
can be assessed. The choice for a particular material is determined not only by radiation
protection reasons but also by economic, technical and low-weight criteria (e.g. in case of
protective clothing).
The electrons which are released by each of the three processes carrying different amounts of
energy cause ionisation of the matter which they penetrate. This phenomenon is the basis of
devices for the determination of the γ-energy. It is also the reason for the biological effective-
ness of γ-radiation.
2.2. Detection of Ionising Radiation
Radiation measuring devices recognise the existence of ionising radiation and determine the
kind, the energy, the intensity, and the direction of the radiation. For this purpose, a variety of
measurement devices have been developed. The training experiment at AKR-2 focuses on dose
and dose rate measurement devices. The ionisation chamber is an important detector for this
purpose. It has a simple concept, can be applied in various geometries and dimensions, and can
be adjusted according to a particular radiation in a wide range.
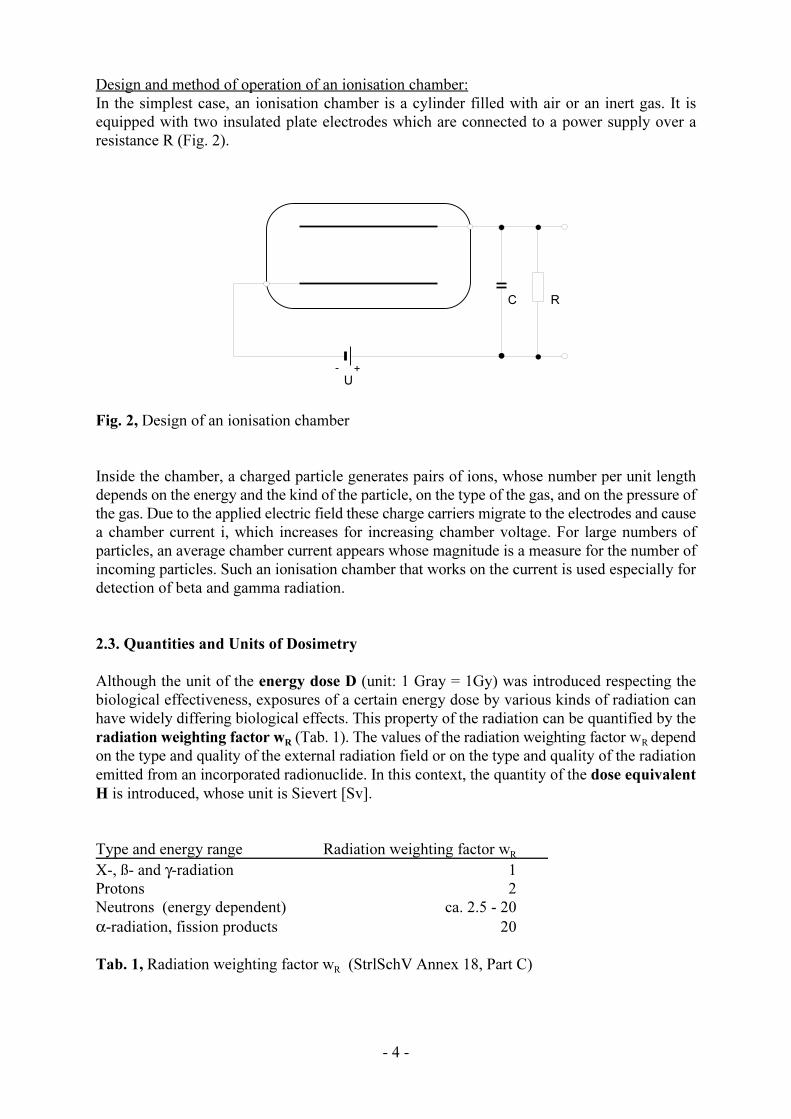
- +
C
U
R
- 4 -
Design and method of operation of an ionisation chamber:
In the simplest case, an ionisation chamber is a cylinder filled with air or an inert gas. It is
equipped with two insulated plate electrodes which are connected to a power supply over a
resistance R (Fig. 2).
Fig. 2, Design of an ionisation chamber
Inside the chamber, a charged particle generates pairs of ions, whose number per unit length
depends on the energy and the kind of the particle, on the type of the gas, and on the pressure of
the gas. Due to the applied electric field these charge carriers migrate to the electrodes and cause
a chamber current i, which increases for increasing chamber voltage. For large numbers of
particles, an average chamber current appears whose magnitude is a measure for the number of
incoming particles. Such an ionisation chamber that works on the current is used especially for
detection of beta and gamma radiation.
2.3. Quantities and Units of Dosimetry
Although the unit of the energy dose D (unit: 1 Gray = 1Gy) was introduced respecting the
biological effectiveness, exposures of a certain energy dose by various kinds of radiation can
have widely differing biological effects. This property of the radiation can be quantified by the
radiation weighting factor w (Tab. 1). The values of the radiation weighting factor w dependR R
on the type and quality of the external radiation field or on the type and quality of the radiation
emitted from an incorporated radionuclide. In this context, the quantity of the dose equivalent
H is introduced, whose unit is Sievert [Sv].
Type and energy range Radiation weighting factor wR
X-, ß- and γ-radiation 1
Protons 2
Neutrons (energy dependent) ca. 2.5 - 20
α-radiation, fission products 20
Tab. 1, Radiation weighting factor w (StrlSchV Annex 18, Part C)R
- 5 -
The dose equivalent H and the energy dose D are related as follows:
H = D · wR
Because for X-, γ- and ß-radiation the radiation weighting factor is w = 1, for these (and onlyR
these!) kinds of radiation is:
1 Gy = 1 Sv
All of these relations are independent on the time of irradiation.
The effective dose E is defined as the sum over all organs T
E = Σ (w · H )T T
with H - organ absorbed equivalent doseT
w - tissue weighting factor for the respective organ or tissue TT
The values of the tissue weighting factors for particular organs or tissues are given in Tab. 2.
tissues or organs tissue weighting factors wT
red bone marrow, colon, lung, stomach, chest each 0.12
gonads 0.08
bladder, oesophagus, liver, thyroid gland each 0.04
skin, bone surface, brain, salivary gland each 0.01
other organs or tissues (together) 0.12
Tab. 2, Tissue weighting factors w (StrlSchV Annex 18, Part C)T
The most important quantities in radiation protection are summarised in Tab. 3.
The application of scientifically reasonable measures in radiation protection requires profound
knowledge about the interaction between radiation and biological tissue. For the handling of
sources of ionising radiation, the Radiation Protection Act (German: Strahlenschutzgesetz,
StrlSchG) and the Radiation Protection Ordinance (German: Strahlenschutzverordnung,
StrlSchV) define maximum doses for certain time periods. The values of these dose limits vary
for various organs, parts of the body, and for whole body, as well as for occupationally radiation
exposed people, particular groups of the population, and the whole population. Moreover, as a
general principle the radiation exposure has to be kept as low as reasonably achievable
(ALARA principle). This principle has to be kept also for radiation exposures below the legal
limits.
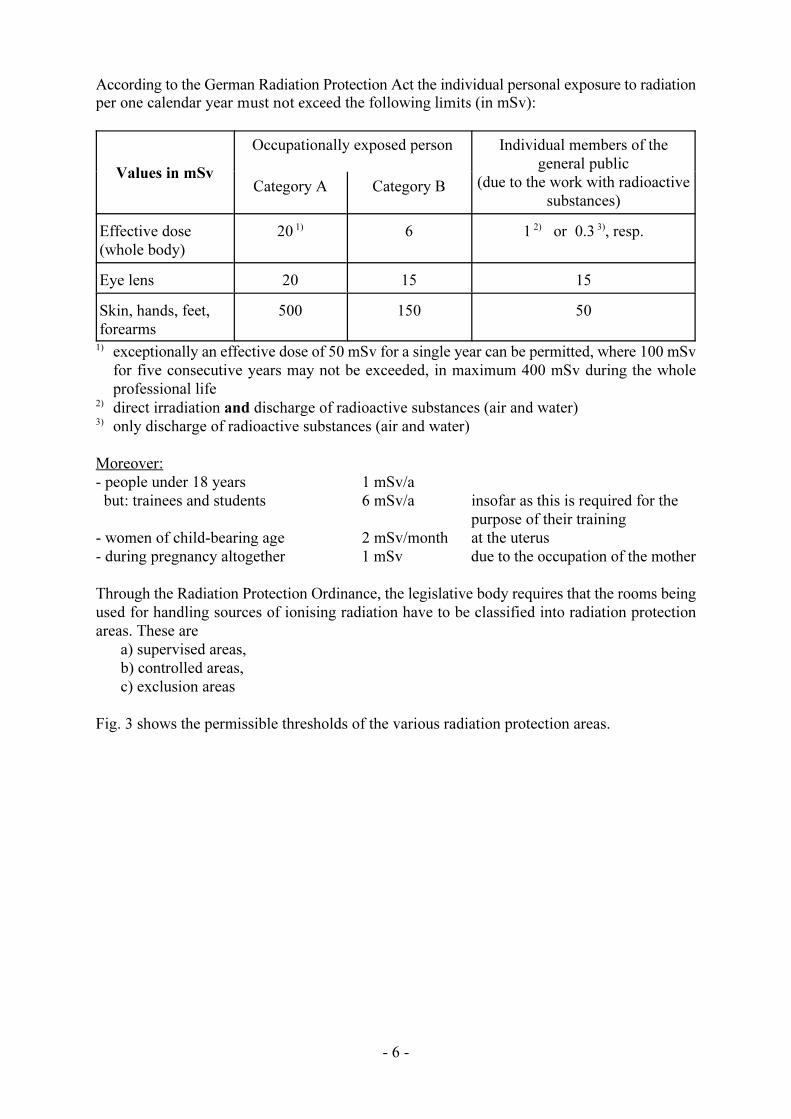
- 6 -
According to the German Radiation Protection Act the individual personal exposure to radiation per one calendar year must not exceed the following limits (in mSv):
Values in mSv
Occupationally exposed person Individual members of the
general public
(due to the work with radioactive
substances)Category A Category B
Effective dose 20 6 1 or 0.3 , resp.
(whole body)
1) 2) 3)
Eye lens 20 15 15
Skin, hands, feet, 500 150 50
forearms
exceptionally an effective dose of 50 mSv for a single year can be permitted, where 100 mSv1)
for five consecutive years may not be exceeded, in maximum 400 mSv during the whole
professional life
direct irradiation and discharge of radioactive substances (air and water)2)
only discharge of radioactive substances (air and water)3)
Moreover:
- people under 18 years 1 mSv/a
but: trainees and students 6 mSv/a insofar as this is required for the
purpose of their training
- women of child-bearing age 2 mSv/month at the uterus
- during pregnancy altogether 1 mSv due to the occupation of the mother
Through the Radiation Protection Ordinance, the legislative body requires that the rooms being
used for handling sources of ionising radiation have to be classified into radiation protection
areas. These are
a) supervised areas,
b) controlled areas,
c) exclusion areas
Fig. 3 shows the permissible thresholds of the various radiation protection areas.
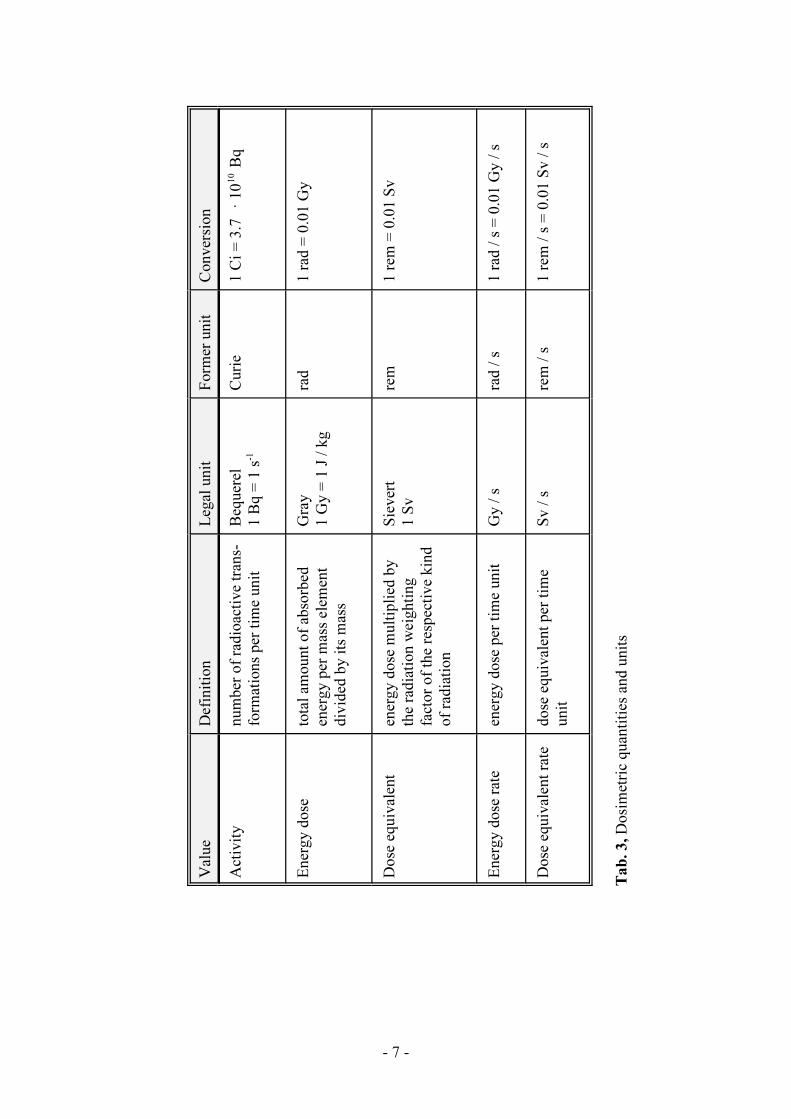
- 7 -
Val
ue
Def
init
ion
Leg
al u
nit
Fo
rmer
un
itC
on
ver
sio
n
Act
ivit
yn
um
ber
of
rad
ioac
tiv
e tr
ans-
form
atio
ns
per
tim
e u
nit
Beq
uer
el
1 B
q =
1 s
-1
Curi
e1 C
i =
3.7
· 10 B
q10
En
erg
y d
ose
tota
l am
ou
nt
of
abso
rbed
ener
gy
per
mas
s el
emen
t
div
ided
by
its
mas
s
Gra
y
1 G
y =
1 J
/ k
g
rad
1 r
ad =
0.0
1 G
y
Do
se e
qu
ival
ent
ener
gy
do
se m
ult
ipli
ed b
y
the
rad
iati
on
wei
gh
tin
g
fact
or
of
the
resp
ecti
ve
kin
d
of
rad
iati
on
Sie
ver
t
1 S
v
rem
1 r
em =
0.0
1 S
v
En
erg
y d
ose
rat
een
erg
y d
ose
per
tim
e u
nit
Gy
/ s
rad
/ s
1 r
ad /
s =
0.0
1 G
y /
s
Do
se e
qu
ival
ent
rate
d
ose
eq
uiv
alen
t p
er t
ime
un
it
Sv
/ s
rem
/ s
1 r
em /
s =
0.0
1 S
v /
s
Tab
. 3, D
osi
met
ric
qu
anti
ties
an
d u
nit
s

- 8 -
exclusion area
(> 3 mSv/h possible)
controlled area
(> 6 mSv/a possible)
supervised area
(> 1 mSv/a possible)
Fig. 3, Classification and legal limit values of radiation protection areas
The definitions of the limits of controlled areas and exclusion areas base on a 40-hours work-
week with 50 workweeks per calendar year, as far as no other causal details about the duration
of stay are given.
3. Procedure of the Experiment
For handling of radioactive substances or of sources of ionising radiation, the following
principles of radiation protection need to be kept with care!
1. No one is allowed to be subject of uncontrolled radiation exposure (personal dosimetry
control).
2. The group of people being exposed to radioactivity needs to be kept as small as possible.
3. The duration of exposure needs be kept as short as possible (work organisation).
4. The distance from the radiation source needs to be kept as large as possible (manipulators,
pincers).
5. Use shieldings as far as possible.
6. Tidiness and cleanness
7. Exceptional events have to be reported to the radiation protection officer.
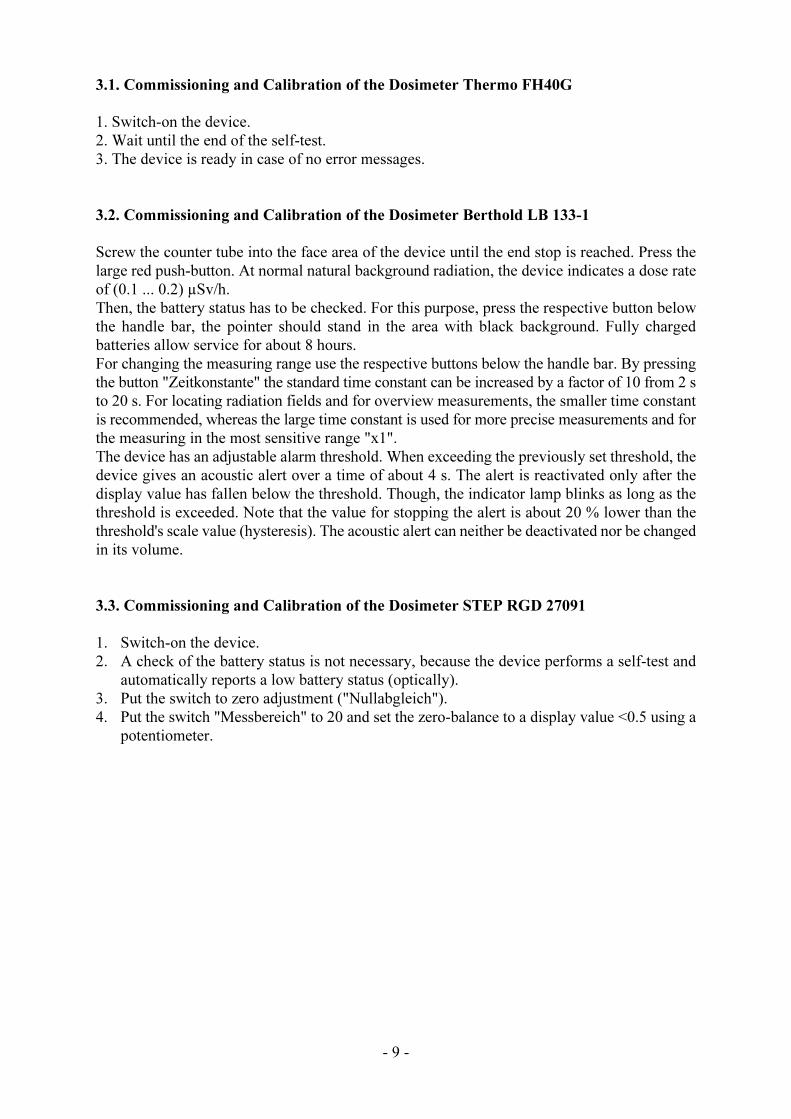
- 9 -
3.1. Commissioning and Calibration of the Dosimeter Thermo FH40G
1. Switch-on the device.
2. Wait until the end of the self-test.
3. The device is ready in case of no error messages.
3.2. Commissioning and Calibration of the Dosimeter Berthold LB 133-1
Screw the counter tube into the face area of the device until the end stop is reached. Press the
large red push-button. At normal natural background radiation, the device indicates a dose rate
of (0.1 ... 0.2) µSv/h.
Then, the battery status has to be checked. For this purpose, press the respective button below
the handle bar, the pointer should stand in the area with black background. Fully charged
batteries allow service for about 8 hours.
For changing the measuring range use the respective buttons below the handle bar. By pressing
the button "Zeitkonstante" the standard time constant can be increased by a factor of 10 from 2 s
to 20 s. For locating radiation fields and for overview measurements, the smaller time constant
is recommended, whereas the large time constant is used for more precise measurements and for
the measuring in the most sensitive range "x1".
The device has an adjustable alarm threshold. When exceeding the previously set threshold, the
device gives an acoustic alert over a time of about 4 s. The alert is reactivated only after the
display value has fallen below the threshold. Though, the indicator lamp blinks as long as the
threshold is exceeded. Note that the value for stopping the alert is about 20 % lower than the
threshold's scale value (hysteresis). The acoustic alert can neither be deactivated nor be changed
in its volume.
3.3. Commissioning and Calibration of the Dosimeter STEP RGD 27091
1. Switch-on the device.
2. A check of the battery status is not necessary, because the device performs a self-test and
automatically reports a low battery status (optically).
3. Put the switch to zero adjustment ("Nullabgleich").
4. Put the switch "Messbereich" to 20 and set the zero-balance to a display value <0.5 using a
potentiometer.

ca. 3 m
Source
Dose RateMeasuringDevice
γ
- 10 -
3.4. Setup of the Experiment
The setup of the experiment is given in Fig. 4.
Fig. 4, Setup of the experiment
After calibrating the devices, the three detectors are placed at the intended spot on the measure-
ment table. Only shortly before the measurement, the source is taken out of the shielded lead
container (use pincers!) and mounted onto the slide (the distance between slide and measure-
ment table is about 3 m).
For the shielding investigations the shielding material has to be placed directly in front of the
source.
3.4.1. Measurement of Dose Rate in Various Distances from the Radiation Source
The measurements are carried out with all three measuring devices. The radiation source has to
be placed in those distances from the detectors that are given in the example protocol (Tab. 4).
The opening of the source has to point into the direction of the detectors.
The measurements start with the largest distance. The whole series of measurements will be
repeated afterwards. For positioning of the measurement devices high accuracy is required.
Getting measured values:
Thermo FH40G: direct reading on the display
LB 133-1: choose the larger time constant and the largest measuring range,
wait until the setting time is over (about 30 s)
STEP RGD 27091: direct reading on the display
3.4.2. Measurement of Dose Rate behind Radiation Shielding
The radiation attenuation coefficient µ has to be determined for the shielding materials heavy
concrete, light concrete, and lead. Its impact has to be discussed with relation to radiation
protection. For this purpose, the shielding of the respective material has to be placed between
the source and the detector. From the measured values, the attenuation coefficient can be
calculated (Tab. 5).
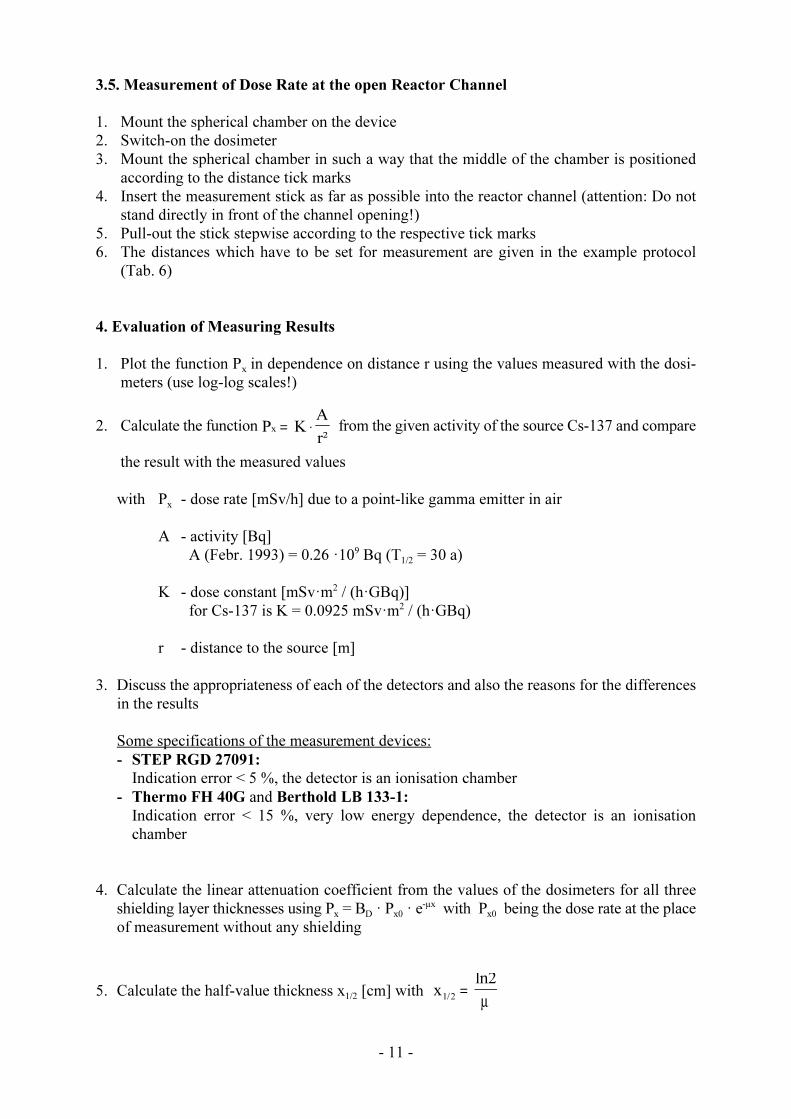
P K A
r²x = ⋅
x ln2
1/2=
μ
- 11 -
3.5. Measurement of Dose Rate at the open Reactor Channel
1. Mount the spherical chamber on the device
2. Switch-on the dosimeter
3. Mount the spherical chamber in such a way that the middle of the chamber is positioned
according to the distance tick marks
4. Insert the measurement stick as far as possible into the reactor channel (attention: Do not
stand directly in front of the channel opening!)
5. Pull-out the stick stepwise according to the respective tick marks
6. The distances which have to be set for measurement are given in the example protocol
(Tab. 6)
4. Evaluation of Measuring Results
1. Plot the function P in dependence on distance r using the values measured with the dosi-x
meters (use log-log scales!)
2. Calculate the function from the given activity of the source Cs-137 and compare
the result with the measured values
with P - dose rate [mSv/h] due to a point-like gamma emitter in airx
A - activity [Bq]
A (Febr. 1993) = 0.26 ·10 Bq (T = 30 a)91/2
K - dose constant [mSv·m / (h·GBq)]2
for Cs-137 is K = 0.0925 mSv·m / (h·GBq)2
r - distance to the source [m]
3. Discuss the appropriateness of each of the detectors and also the reasons for the differences
in the results
Some specifications of the measurement devices:
- STEP RGD 27091:
Indication error < 5 %, the detector is an ionisation chamber
- Thermo FH 40G and Berthold LB 133-1:
Indication error < 15 %, very low energy dependence, the detector is an ionisation
chamber
4. Calculate the linear attenuation coefficient from the values of the dosimeters for all three
shielding layer thicknesses using P = B · P · e with P being the dose rate at the placex D x0 x0-µx
of measurement without any shielding
5. Calculate the half-value thickness x [cm] with 1/2

D D e d
e d
0
air Pb Pb= ⋅ −μ ⋅ ⋅ −μ ⋅air
d d + d ,5 mtotal Pb air
= = 0
25 µSv/h10.000 µSv/h
d Air
AirPb
Pbd
μ =μρ
′
- 12 -
6. Calculate the mass-attenuation coefficient µ´ [cm /g] using2
with ρ = 0.6 g/cm (light concrete)3
ρ = 2.5 g/cm (heavy concrete)3
ρ = 11.7 g/cm (lead)3
Remarks regarding the dose build-up factor B :D
The dose build-up factor is defined as the ratio between the sum of the dose rate of all photons
(scattered and non-scattered) and the non-scattered photons.
It depends on the energy of the photons, the shielding layer thickness, the radiation protection
material, and the measurement geometry. By means of the build-up factor, calculations become
possible also for wide spreaded beams as well as for extended or thick absorbers via the
attenuation factor.
For the shielding measurements in the experiment, the dose build-up factor B can be neglectedD
(i.e. B ≈ 1), because the Compton quants are scattered away (from the detector) and do notD
contribute to the dose rate behind the shielding in the used setup.
7. Calculate the required shielding layer thickness to meet a gamma dose rate of 50 mSv/a (or
more precisely, of about 25 mSv/h) in a distance of half a meter from the source (use the
mean value of µ!). Use lead for the shielding material!
8. Discuss the impact of the shielding material on the design of the radiation protection
facilities
9. Plot the dose rate over the length of the AKR-2 tangential channel

- 13 -
Distance RGD27091 RGD27091 FH40G FH40G LB 133 LB 133
[m] 1. meas. 2. meas. 1. meas. 2.meas. 1.meas. 2.meas.
[µSv/h] [µSv/h] [µSv/h] [µSv/h] [µSv/h] [µSv/h]
0.05
0.1
0.2
0.3
0.4
0.5
0.6
0.8
1.0
1.2
1.5
2.0
Tab. 4, Investigations regarding the distance law for various detectors
RGD27091 RGD27091 FH40G FH40G LB 133 LB 133
1. meas. 2. meas. 1. meas. 2. meas. 1. meas. 2. meas.
[µSv/h] [µSv/h] [µSv/h] [µSv/h] [µSv/h] [µSv/h]
light
concrete
(20 cm)
heavy
concrete
(20 cm)
heavy
concrete
(40 cm)
lead
(5 cm)
Tab. 5, Protocol for the determination of the mass attenuation factor (example)

- 14 -
Distance [m] Gamma dose rate [µSv/h]
1.3
1.25
1.2
1.1
1.0
0.9
0.8
0.7
0.6
0.5
0.4
0.3
0.2
0.1
0.0
Tab. 6, Protocol for the determination of the gamma dose rate at the open reactor channel
(example)

TECHNICAL UNIVERSITY
DRESDEN
Institute of Power Engineering Training Reactor
Reactor Training Course
Experiment
"Activation and Decayof Radioactive Nuclides"

2813
Al6629
Cu
- 1 -
Instruction for
Experiment “Activation and Decay of Radioactive Nuclides”
Content:
1. . . . Introduction
2. . . . Fundamentals of the Experiment
2.1. . Important Terms Regarding Radioactivity
2.2. . Production of Radioactive Nuclides
2.3. . Decay of Radioactive Nuclides
2.4. . Mathematical Description of the Production and Decay of Radionuclides
2.5. . Neutron Self-absorption
3. . . . Experimental Procedure
3.1. . Choice of Materials to be activated
3.2. . Start of the Reactor and Activation of the Samples
3.3. . Evaluation of the Experiment
3.3.1. Description and Configuration of the Measurement Equipment
3.3.2. Measurement of the Radioactive Decay of Activated Samples
3.3.3. Determination of Half-lives
3.3.4. Calculation of the Neutron Flux Density at the Point of Irradiation
4. . . . Radiation Protection
5. . . Question to Answer
Figures:
Fig. 1: Examples of decay schemes ( for and )
Fig. 2: Time dependence of the activation and the decay of a radionuclide
Fig. 3: Decrease of neutron flux density inside of a neutron absorbing material of thickness d
(neutron self-absorption)
Fig. 4: Experimental setup
(issued: March 2015)

- 2 -
1. Introduction
In the year 1896, the French physicist Henry Becquerel noticed an unknown radiation emitted
by uranium salts that resulted in the blackening of a photo plate. Further work by Becquerel, along
with Pierre and Marie Curie found the radioactivity of thorium and eventually lead to the
discovery of the chemical elements polonium and radium. However, only the first artificially
induced nuclear reactions successfully pioneered by Ernest Rutherford by bombardment of
nitrogen nucleons with α-particles, made possible the fabrication of artificial radionuclides with
various properties. Since then, particularly in the second half of the 20th century, the significance
of applied radioactivity methods has risen enormously.
Currently, artificial radioactive isotopes are being produced in any desired quality and quantity,
mostly in nuclear reactors by the irradiation with neutrons originating from nuclear fission.
Furthermore, advanced radiation measurement technologies are now an inherent part of science,
technology and medical applications. Typical examples are the radiation-based measurements
of thickness and of fluid level, as well as radiographic investigations, medical irradiations and
radioactive tracer applications. However, these methods exhibit some characteristic drawbacks
as well. As such, specific safety precautions are necessary and need to be thoroughly applied and
controlled in order to prevent severe radiation damages.
The purpose of the experiment to be conducted in this session is to demonstrate the fundamentals
of the production of radioactive isotopes in nuclear reactors and to show some of their basic
properties as well as their appropriate handling. Therefore, selected materials will be activated
in the reactor and subsequently, the decay of these materials will be measured. In one more part
of the experiment, an unknown material will be irradiated and identified subsequently by
regarding its decay curve and determination of its half-life. The latter experiment exemplifies
one of the many possibilities offered by applied radioactivity.
2.2. Fundamentals of the Experiment
2.1. Important Terms regarding Radioactivity
The chemical elements of the periodic table are characterised by a specific atomic number
(number of protons) and the associated number of electrons in the atomic shell. Additionally to
protons, the atomic nucleus includes neutrons. Both, neutrons and protons are termed nucleons.
For any chemical element with its characteristic numbers of protons, atomic nuclei may exist that
include a varying number of neutrons. These nuclei are called isotopes of this element. They
appear at the same place in the periodic table and exhibit the same chemical properties, but
different atomic masses. For most elements there are several isotopes that can or cannot be
radioactive, respectively.
The term nuclide is used for any arbitrary atomic nucleus, characterised by both, its atomic and
its mass number. If a nuclide is radioactive, it is termed a radionuclide. A radioactive isotope is
termed radioisotope.
To summarise, radionuclides are radioactive nuclei of any chemical element of the periodic table.
On the contrary, radioactive isotopes are invariably associated with a specific chemical element.

2813
Al6629
Cu2813
Al
6629
Cu
42
He
- 3 -
Thus, and are two radionuclides, whereas is a radioisotope of aluminum
and is a radioisotope of copper.
Radioactivity is the feature of particular nuclei which can change their nucleus composition
without any exterior influence. Whether or not this change occurs spontaneously depends on the
stability of the nucleus, which is, among others, a function of the ratio between its number of
protons and its number of neutrons. This is why for different isotopes of one chemical element
some may be radioactive, while others are not. Radioactive nuclei exhibit an energy abundance,
which they may release by emission of radiation and accompanying nucleus transformation
(decay). These nuclei are unstable. Radiation emission cannot be controlled or manipulated by
exterior influences.
The rate of nucleus transformations can be measured and is used as a means to quantify its
radioactivity. According to the SI standard (Système International d’Unités), use of the unit
Becquerel is mandatory:
1 decay / s = 1 Bq
In some cases, the historical unit 1 Ci (Curie) can still be found that was established based on
the decay of 1 g of Radium-226 (1 Ci = 3.7·10 Bq), but is not used anymore.10
The most important radiophysical characteristics of radionuclides, crucial for allocating their
potential application, are the following:
a) type of the emitted radiation:
- α-emitter (emission of nuclei)
- ß -emitter (emission of positrons)+
- ß -emitter (emission of electrons)-
- γ-emitter (emission of electromagnetic radiation)
b) energy of the emitted radiation:
In nuclear physics the measuring unit electron volt (eV) has been established particularly for
radiation energy. 1 eV is the energy gained by an electron traversing an acceleration voltage
of 1V, thus:
1 eV = 1.602·10 As · 1 V = 1.602·10 Ws-19 -19
c) half-life:
The decay of radioactive nuclides results in the production of new nuclides, which can be
either stable or radioactive. The half-life T denotes the time after which exactly half of the1/2
original amount of the radioactive material still exists, while the other half has decayed. The
half-life is constant and characteristic for every radionuclide.

147
N %42" !
189
F ( !178
O %11
p resp. 14N(",p)17O
- 4 -
2.2. Production of Radioactive Nuclides
Radioactive nuclides originate from stable nuclei due to nuclear reactions if the resulting nucleus
exhibit abundant energy, which is released either by radiation emission or emission of a particle.
The material to be irradiated is called the target. Protons, neutrons, deuterons, alpha particles or
gamma quants are commonly used as bombarding species.
Mostly, the following nuclear reactions are used for the production of artificial radioactive
nuclides:
a) Exchange reaction: the bombarding particle x penetrates the target nucleus, leading to the
emission of a different particle y. If x and y are differently charged, a transformation of the
chemical element occurs.
b) Capture reaction: The bombarding particle x is absorbed in the target nucleus. The abundant
energy is being released as electromagnetic γ-irradiation.
c) Fission reaction: By bombardment with neutrons or high-energy charged particles, atomic
nuclei, particularly heavy ones, are being split in two different pieces of similar masses. This
continuously occurs as a chain reaction in nuclear reactors. In this case, the production of
radionuclides (radioactive waste) is not desired.
The mechanism of nuclear reactions can be assessed in two steps: In the first step, the bombarding
particle is being absorbed in the nucleus. The binding energy of the bombarding particle is
released and, additionally, its kinetic energy is transferred to the target nucleus. Thereby, a highly
instable, highly excited temporary nucleus is being generated (compound nucleus). In the second
step, this compound nucleus relaxes within a very short time (<10 s) by emission of either a-17
particle or a γ-quant or by splitting.
Nuclear reactions are represented by the following reaction equation
x + A ! C* ! B + y or shorter A(x,y)B
with the bombarding particle x, the target nucleus A, the temporary compound nucleus C*, the
nucleus B remaining after the reaction and the particle y emitted due to the decay.
An example of such a nuclear reaction is the following.
In a nuclear reactor radioactive nuclides are essentially produced by capture of thermal neutrons.
Thermal neutrons have a mean energy of 0.025 eV, being equivalent to a speed of 2200 m/s at
room temperature.

nth %MZ
A !M%1
ZA ( !
M%1Z
A % ( resp.MZ
A(nth,()M%1
ZA
2713
Al(nth,()2813
Al
6529
Cu6329
Cu
6529
Cu(nth,()6629
Cu resp.6329
Cu(nth,()6429
Cu
- 5 -
The capture reactions with thermal neutrons occur as follows:
with the mass number M and the atomic number Z. The same element A thus remains, but a
different isotope is created which mass number M is by one higher than that of the original
isotope. Since the proton/neutron ratio changes, the created isotopes are usually radioactive.
For the materials used in the experiment, aluminum and copper, the following representations
are applicable:
Natural copper consists of 2 different isotopes, (30.9%) and (69,1%). Both
isotopes are being activated as follows:
2.3. Decay of Radioactive Nuclides
Stability and instability of an atomic nucleus depend on its respective composition, determining
the type and rate of its decay. The most important properties of a radionuclide can be found in
tables for any isotope. These are (as already mentioned): type of emitted radiation, energy of
emitted radiation and half-life.
A graphical decay scheme provides a good overview (Fig. 1). It illustrates the type of radiation,
the respective loss of energy, the change of the atomic number as well as the relative probabilities
of possible decay paths.
In the decay scheme, vertical distances represent changes in energy. Horizontal shifts represent
a change of charge, which are positive in case of a shift to the right (i.e. transformation to a
chemical element with a higher atomic number e.g. by nuclear electron emission), and negative
in case of a shift to the left (i.e. transformation to a chemical element with lower atomic number
e.g. by nuclear emission of a ß -particle). The energy levels of the nuclei are represented by+
horizontal lines. The amount of energy change is indicated at the right of the energy levels either
in units of keV or MeV.

Al (2.31 min)28
13
Si28
14
(< 3·10 s)-14
ß-
4645
1775
0
Cu (5.08 min)66
29
Zn66
30
(< 5·10 s)-9
ß = 90.8 %-1
2630
1094
0
ß = 9.2 %-2
2813
Al6629
Cu
R ' N · F · M
N ' NL
D
AG
- 6 -
Fig. 1, Examples of decay schemes ( for and )
(1)
(2)
2.4. Mathematical Description of the Production and Decay of Radionuclides
Initially, the number of capture reactions per time and volume units occurring in the activation
material need to be quantified. The number of activations per second occurring in a cubic
centimeter of sample material is called the activation rate R and can be determined according
to the following equation
with N being the number of atomic nuclei per cm³ in the activation material. N can be determined
according to:
with the LOSCHMIDT constant N = 6.025 · 10 mol , the density ρ, and the atomic mass AGL
23 -1
of the activation sample.
The microscopic cross section σ is an expression for the probability of the occurrence of a nuclear
capture reaction of a neutron. σ may be understood as the interaction area of a nucleus facing the
incident neutron. However, this area is not equivalent to the geometric cross section of the
nucleus, it can be orders of magnitude bigger or smaller. If a neutron hits this area, a nuclear
reaction occurs. Since σ is related to the facing area of a nucleus, it is measured in units of
10 cm². This unit is called barn and abbreviated with b (1b = 10 cm²). The exact value of σ-24 -24
is determined through evaluation of the probability of the nuclear reaction which is, among others,
a function of the velocity (i.e. the energy) of the incident neutron.

E ' N · F l '1
E
A ' &dK
dt' 8 · K
8 'ln2
T1/2
K(t) ' K0
· exp(&8 · t)
- 7 -
(3)
(4)
(5)
(6)
A cross section exists for any type of nuclear reaction. Thus, in addition to cross sections for
activation (i.e. neutron capture) reactions, cross sections can be defined e.g. also for elastic or
inelastic scattering or fission. Finally, the total cross section is the sum of all partial cross sections
associated with all possible nuclear reactions.
The product N·σ is called macroscopic cross section Σ. In contrary to σ its unit is a reciprocal
length and the reciprocal value of Σ is the mean free path l of a neutron in the sample material.
Φ is the neutron flux density that accounts for the number of neutrons crossing an assumed area
of 1 cm² per second at the place of irradiation, i.e. the measuring unit for the neutron flux density
is thus 1 / (cm² · s).
In the core of a thermal nuclear research reactor, the neutron flux density is on the order of
10 1/(cm² · s) for zero-power reactors and about 10 ... 10 1/(cm² · s) in more powerful7 13 15
research reactors.
In order to calculate the number of radioactive nuclei that exist after the irradiation time t itirr
would be wrong simply to multiply the activation rate R with t , because in the same time whenirr
new activations occur already previously activated nuclei can decay. Thus, it is necessary to take
into account both, creation and decay of radioactive nuclei simultaneously.
First, the pure decay behaviour of an existing activated nuclide will be discussed.
K shall be the number of existing radioactive nuclei in a sample. The activity A is defined as the
number of decays occurring in a time unit, which is thus equivalent to the decrease of existing
radioactive nuclei K per time unit dt. Atomic decay reactions are distributed statistically, and
consequently, the activity is proportional to the number of existing nuclei K:
This is the differential equation of the radioactive decay with the decay constant λ, which is
associated with the half-life T as:1/2
The solution of the differential equation (4) by separation of variables yields the well known
decay law

dK
dt' &8 ·K % E ·M
K(t) 'G ·M
8[1 & exp(&8 · t)]
A(t) ' G ·M · [1 & exp(&8 · t)]
A(t64) ' As' G · M
K(tirr
) 'G ·M
8[1 & exp(&8 · t
irr)]
- 8 -
(7)
(8)
(9)
(10)
with K being the number of radioactive nuclei at the beginning (here: for t = 0 at the end of0 decay
irradiation).
In the next step, it shall be calculated how the production of radioactive nuclides during irra-
diation occurs. For that purpose, the decay law needs to be coupled with the activation reaction
rate. Thus, in the decay differential equation one term has to be added that accounts for the
constant additional supply of radioactive nuclei, which is the activation rate R:
In this case, the initial condition is K(t=0) = 0, which signifies that no radioactive nuclei exist
before irradiation. The solution of this differential equation is:
According to equation (4), A(t) = 8 · K(t), which can be introduced in equation (8), it can also
be written in terms of the activity:
As obvious from this equation, the term in brackets approaches to 1 for continuing irradiation.
Thus, a limiting maximum value for the activity exists, which is called the saturation activity A :S
That means, when the saturation activity A is attained, the rate of nucleus production is equalS
to the rate of nucleus decay. It can easily be shown that after an irradiation time equivalent to 5
half-times of the activation material, the obtained activity already accounts for 97 % of the
saturation activity. In most applications, it is thus not useful to extend irradiation beyond this
duration.
Now, time periods are introduced to label the time regimes during irradiation and activity decay.
t should be the irradiation time and t the time of activity decay after end of irradiation. Theirr decay
number of radioactive nuclei at the end of the irradiation period can be calculated according to
equation (8):
To determine the number of active nuclei during the activity decay period, this expression has
to be inserted as K in equation (6). The number of active nuclei after irradiation is thus0

K(tdecay
) 'G ·M
8[1 & exp(&8 · t
irr)] · exp(&8 · t
decay)
A(tdecay
) ' G ·M · [1 & exp(&8 · tirr
)] · exp(&8 · tdecay
)
A(t)
ttirr tirr + tdecay
Saturation Activity As = Σ • Φ
M(x) ' M0
· exp(&E · x)
- 9 -
(11)
Fig. 2, Time dependence of the activation and the decay of a radionuclide
(12)
and, finally, in terms of the activity
The time behaviour of the activation process and the subsequent radioactive decay after the end
of irradiation is presented in Fig. 2.
2.5. Neutron Self-absorption
For calculation of the reaction rate in the material to be activated, equation (1) can only be applied
accurately, if the neutron flux density does not decrease within the sample. However, this is the
case in most applications as shown schematically in Fig. 3. The figure has to be understood in
a way that the incident neutrons impinge perpendicularly on the plate from the left. If solely
absorption and no scattering reactions take place the following relation for the decrease of neutron
flux density is applicable:
with Σ being the macroscopic cross section for absorption and x the distance from the plate
surface.
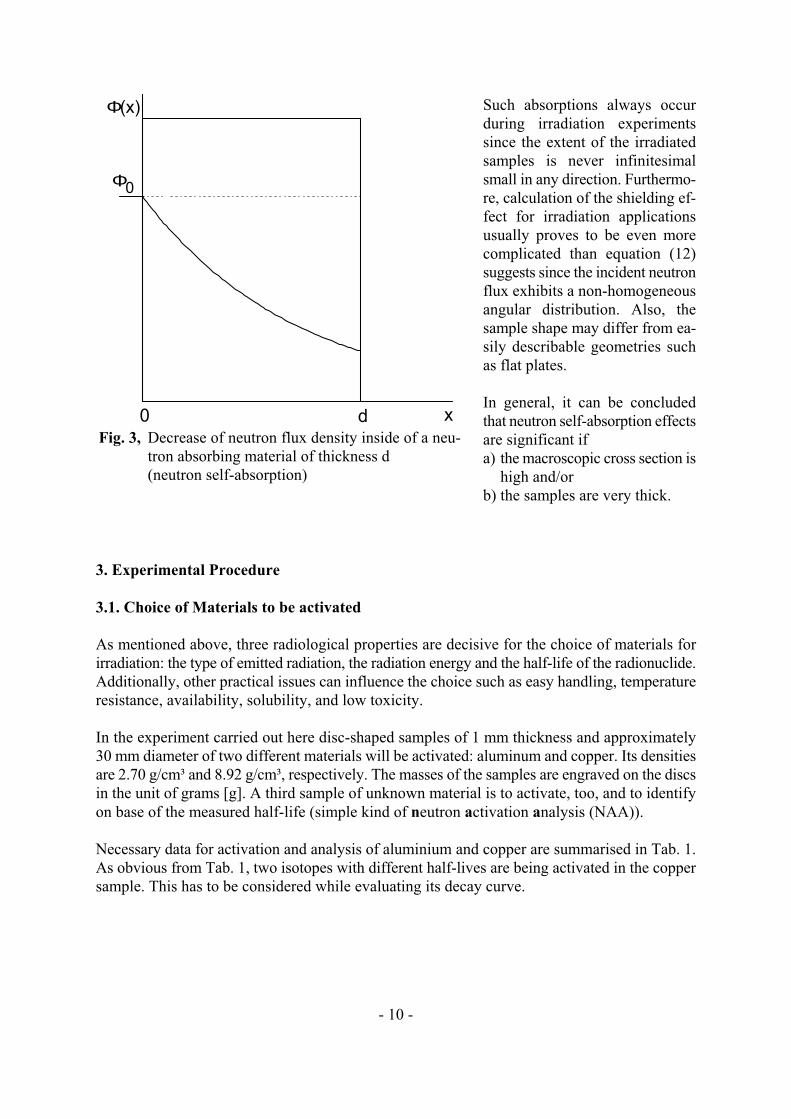
Φ(x)
x0 d
Φ0
- 10 -
Fig. 3, Decrease of neutron flux density inside of a neu-
tron absorbing material of thickness d
(neutron self-absorption)
Such absorptions always occur
during irradiation experiments
since the extent of the irradiated
samples is never infinitesimal
small in any direction. Furthermo-
re, calculation of the shielding ef-
fect for irradiation applications
usually proves to be even more
complicated than equation (12)
suggests since the incident neutron
flux exhibits a non-homogeneous
angular distribution. Also, the
sample shape may differ from ea-
sily describable geometries such
as flat plates.
In general, it can be concluded
that neutron self-absorption effects
are significant if
a) the macroscopic cross section is
high and/or
b) the samples are very thick.
3. Experimental Procedure
3.1. Choice of Materials to be activated
As mentioned above, three radiological properties are decisive for the choice of materials for
irradiation: the type of emitted radiation, the radiation energy and the half-life of the radionuclide.
Additionally, other practical issues can influence the choice such as easy handling, temperature
resistance, availability, solubility, and low toxicity.
In the experiment carried out here disc-shaped samples of 1 mm thickness and approximately
30 mm diameter of two different materials will be activated: aluminum and copper. Its densities
are 2.70 g/cm³ and 8.92 g/cm³, respectively. The masses of the samples are engraved on the discs
in the unit of grams [g]. A third sample of unknown material is to activate, too, and to identify
on base of the measured half-life (simple kind of neutron activation analysis (NAA)).
Necessary data for activation and analysis of aluminium and copper are summarised in Tab. 1.
As obvious from Tab. 1, two isotopes with different half-lives are being activated in the copper
sample. This has to be considered while evaluating its decay curve.
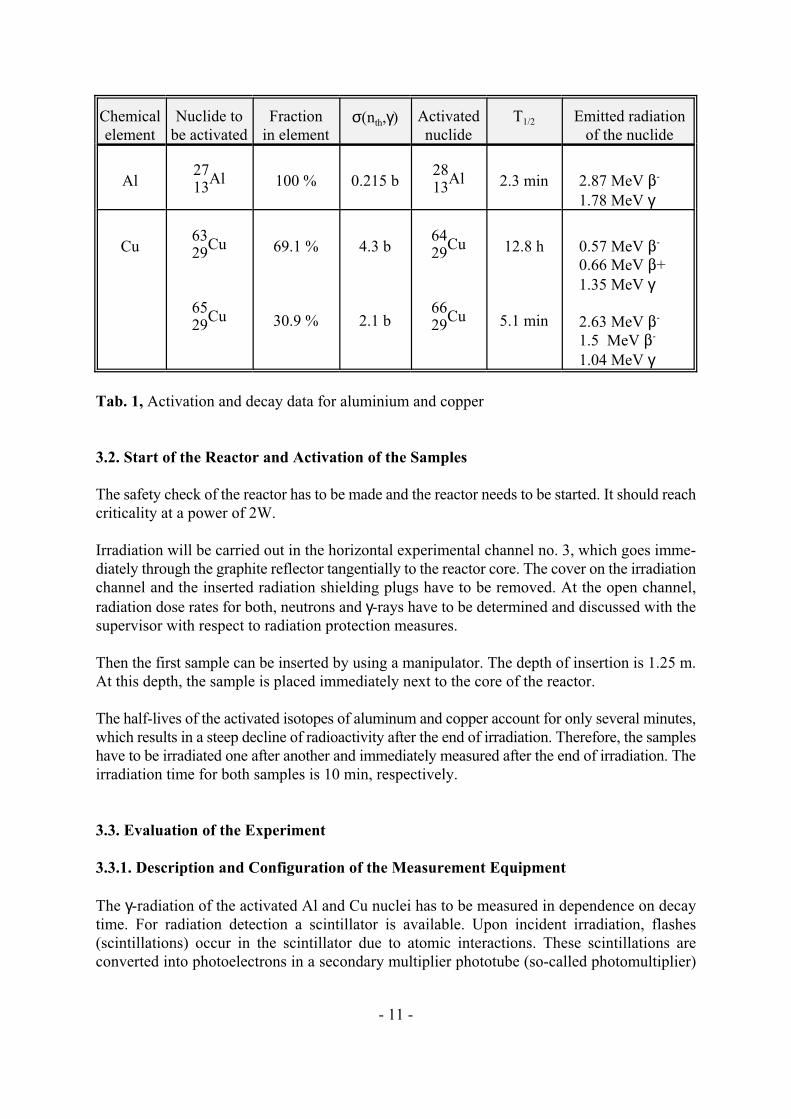
2713
Al2813
Al
6329
Cu
6529
Cu
6429
Cu
6629
Cu
- 11 -
Chemical Nuclide to Fraction Activated T Emitted radiation
element be activated in element nuclide of the nuclideσ(n ,γ)
th 1/2
Al 100 % 0.215 b 2.3 min 2.87 MeV $-
1.78 MeV γ
Cu 69.1 % 4.3 b 12.8 h 0.57 MeV $
30.9 % 2.1 b 5.1 min
-
0.66 MeV $+
1.35 MeV γ
2.63 MeV $-
1.5 MeV $-
1.04 MeV γ
Tab. 1, Activation and decay data for aluminium and copper
3.2. Start of the Reactor and Activation of the Samples
The safety check of the reactor has to be made and the reactor needs to be started. It should reach
criticality at a power of 2W.
Irradiation will be carried out in the horizontal experimental channel no. 3, which goes imme-
diately through the graphite reflector tangentially to the reactor core. The cover on the irradiation
channel and the inserted radiation shielding plugs have to be removed. At the open channel,
radiation dose rates for both, neutrons and γ-rays have to be determined and discussed with the
supervisor with respect to radiation protection measures.
Then the first sample can be inserted by using a manipulator. The depth of insertion is 1.25 m.
At this depth, the sample is placed immediately next to the core of the reactor.
The half-lives of the activated isotopes of aluminum and copper account for only several minutes,
which results in a steep decline of radioactivity after the end of irradiation. Therefore, the samples
have to be irradiated one after another and immediately measured after the end of irradiation. The
irradiation time for both samples is 10 min, respectively.
3.3. Evaluation of the Experiment
3.3.1. Description and Configuration of the Measurement Equipment
The γ-radiation of the activated Al and Cu nuclei has to be measured in dependence on decay
time. For radiation detection a scintillator is available. Upon incident irradiation, flashes
(scintillations) occur in the scintillator due to atomic interactions. These scintillations are
converted into photoelectrons in a secondary multiplier phototube (so-called photomultiplier)

1
2
3
4
5
1 Radioactive sample2 Radiation shielding (lead)3 Measuring head VA-S-50 with fotomultiplier and scintillator4 Cable connection5 Radiation measuring device 20046
- 12 -
Fig. 4, Experimental setup
by the photoelectric effect.
Between the cathode and the anode of the photomultiplier, several intermediate electrodes (so-
called dynodes) are installed. Between each two dynodes, a part of the high-voltage of the
photomultiplier is applied. Therefore, the incident electrons are accelerated in such a way that
they sputter more electrons in the next dynode (collision ionisation). Thus, the photomultiplier
serves to convert scintillations into electric current and voltage signals amplifying them with very
low noise. The voltage pulses are further amplified in a subsequent electronic amplifier and
counted by a pulse counter. The measurement setup is shown schematically in Fig. 4.
The following parameters are set at the radiation measurement device:
Threshold (Pegel): 5.7 V
High-Voltage (Hochspannung): -1140 V (5.70 at the potentiometer)
Amplification (Verstärkung): 22 dB
Measuring time (Messzeit): 6 s = 1·10 min-1
Channel width (Kanalbreite): DIS
The main purpose of the lead shielding around sample and detector is not to shield radiation from
inside the apparatus, but rather to absorb background noise from the exterior surroundings due
to reactor operation. Without shielding, this background would result in a high number of noise
pulses.

)Z ' ± Z
- 13 -
3.3.2. Measurement of the Radioactive Decay of Activated Samples
Before measuring the activated samples, the background radiation has to be measured 5 times
during 6 s each, which of the average is calculated. Background radiation impinging on the
shielded scintillator results in a continuous noise in the measurement signal that needs to be
subtracted for evaluation of the underlying radiation of the activated samples.
The samples irradiated in the reactor are removed from the reactor channel after exactly 10 min
of irradiation time and immediately put on the sample holder beneath the scintillator for radiation
measurement. The time of the end of sample irradiation has to be exactly recorded and will be
taken as the point of origin of the time of decay.
The number of pulses has to be measured for exactly 6s (preset at measuring device), respectively,
after time increments of 0.5 minutes for 10 to 15 min after the end of irradiation. The measured
time dependence of the count rate has to be illustrated in a graph, after background correction,
both, on linear and logarithmic ordinate scale.
3.3.3. Determination of Half-lives
The half-lives of the copper isotope Cu and for Al have to be determined based on the obtained66 28
decay curve. Subsequently, the decay curve and the half-life determined for the unknown
activated material under investigation will help to identify the material and its composition. This
will show the possibility of identifying unknown materials by neutron activation analysis (NAA).
For every half-life calculation the error bars have to be estimated. Every measured count rate is
subject of a statistical error. Statistical analysis based on the POISSON probability distribution
show that the count rate of Z can be measured with a statistical error of . The thereby
determined error bars should be included in the graph of measured values to illustrate the range
of possible decay curves and of the half-lives that can be derived based on the measurements.
3.3.4. Calculation of the Neutron Flux Density at the Point of Irradiation
The relation between neutron flux density Φ at the point of irradiation in the reactor and the
sample activity per volume at the end of irradiation is given through equation (9) if t = t . Forirr
evaluation, the decay curve needs to be extrapolated to the point of origin t = 0, equivalentdecay
to the activity at t . The volumic activity obtained by equation (9) has to be still multiplied byirr
the sample volume to obtain the total activity.
However, this value is not yet equivalent to the activity of the sample, but only proportionally
related. The proportionality factor includes a geometry factor and the counting efficiency of the
scintillator: Part of the emitted radiation from the sample is not counted in the detector because
it is directed to the bottom or the sides without penetrating the scintillator (geometry factor), and
not all of the emitted species that impinge on the scintillator cause a pulse (energy-dependent
counting efficiency). Previously, this proportionality factor has been experimentally determined
as C ≈ 0.01.
Z(tirr
) & n0' C · V · A(t
irr) ' C·V·G ·M · [1 & exp(&8 · t
irr)]
M '(Z(t
b) & n
0) ·AG
C · m · 0.309 · NL
· F · [1 & exp(&8 · tb)]
- 14 -
(13)
(14)
Considering this information, equation (9) can be rewritten as
Z(t ) measured count rate extrapolated for t = 0irr decay
n background noise that has to be substracted from the measured count rate0
Additionally, it has to be considered that in natural copper, the Cu nuclei account for only65
30.9 % of the total. For calculation of the neutron flux density, equation (13) can thus be rewritten
as:
Remark: Of cause, also the activated isotope Cu contributes to the measured count rate as well.64
However, as calculated in question to ask no. 9, the contribution accounts for less than 10 % ofthe total count rate and shall thus be neglected in the calculations performed in this task.
4. Radiation Protection
Handling of radionuclides requires particular protection and safety measures in order to exclude
any danger to the health of the involved personnel and to prevent uncontrolled distribution of
radioactive materials. To ensure strict compliance with radiation protection measures, every
involved person has to get accustomed to the particular working technologies required when
handling radioactive sources. This involves an extensive learning process to which any person
needs to get accustomed to, who is frequently exposed to radionuclides.
For this experiment, the following rules need to be respected in particular:
1. Perform a wipe test in order to confirm that the irradiation channel is free of contamination.
2. Never stand right in front of the open irradiation channel. Approach the channel and insert
the sample from the side.
3. When walking around the reactor, avoid passing the open irradiation channel.
4. Before performing the experiment, thoroughly plan the working steps to minimise the time
of handling the activated samples.
5. Do not touch the activated sample bare-handed, but use a pincer or forceps. Wear gloves
while handling the sample.
- 15 -
5. Questions to Answer
1. What does radioactivity mean ?
2. What do the terms element, isotope, nuclide mean ?
3. What is the difference between natural and artificial radioactivity ?
4. What information is available from a decay scheme ?
5. Which properties are decisive to select a radionuclide for a specific purpose ?
Discuss by using the example of a liquid level measurement of a storage container or the
intake of a radioactive medicament as a tracer.
6. Determine the percentage of the saturation activity reached by a sample irradiated 2, 4, or
7 times its half-life. Derive for how long a nuclide should be irradiated for its activation.
7. Determine the probability for a thermal neutron to reach the center of a 1 mm thick copper
or gold sample if it impinges perpendicular the probe surface.
( σ (n ,γ) for Au-197 = 98.7 b, ρ = 19.3 g/cm³ )th
8. Which peculiarity of natural copper has to be considered when drawing the decay curve
(elemental composition) ?
9. Calculate the activity of both irradiated samples (copper and aluminum) after 10 minutes of
irradiation with an estimated neutron flux density of Φ = 10 n/(cm² · s). Why is the countth
7
rate measured with the measurement equipment lower than the calculated value ?
10. Describe qualitatively the radiation detection process in a scintillator and a photomultiplier.
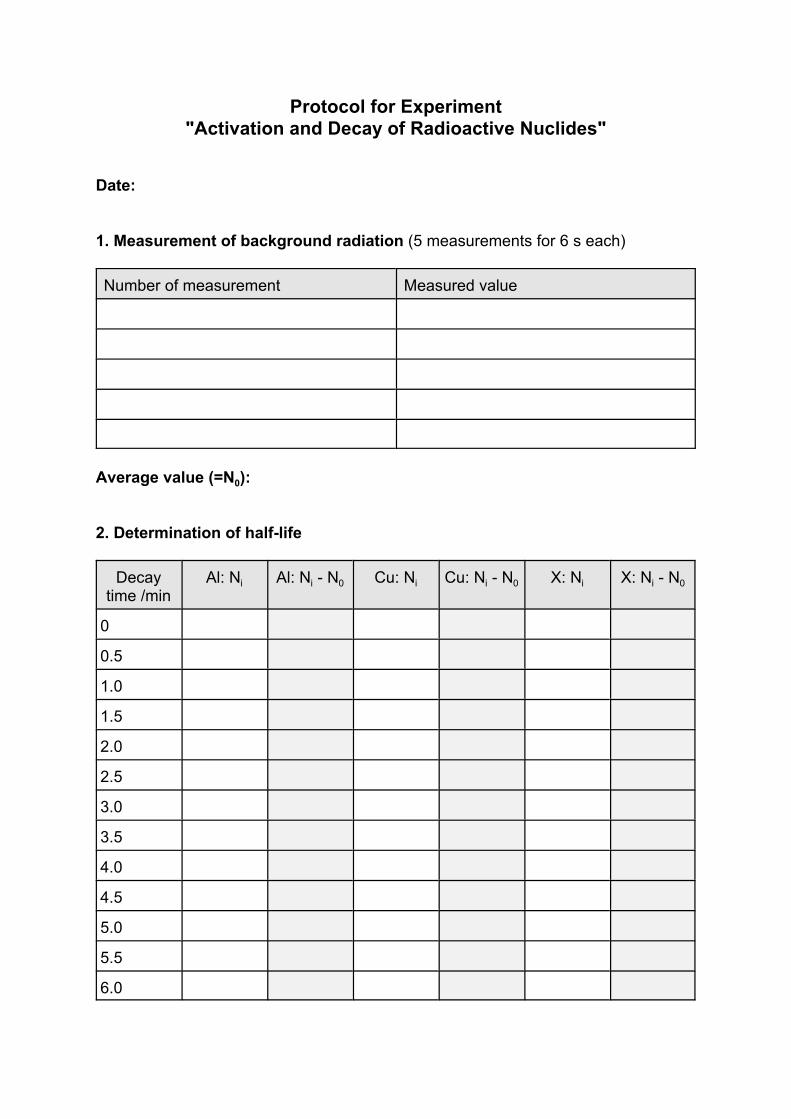
Protocol for Experiment
"Activation and Decay of Radioactive Nuclides"
Date:
1. Measurement of background radiation (5 measurements for 6 s each)
Number of measurement Measured value
Average value (=N ):0
2. Determination of half-life
Decay Al: N Al: N - N Cu: N Cu: N - N X: N X: N - N
time /min
i i 0 i i 0 i i 0
0
0.5
1.0
1.5
2.0
2.5
3.0
3.5
4.0
4.5
5.0
5.5
6.0
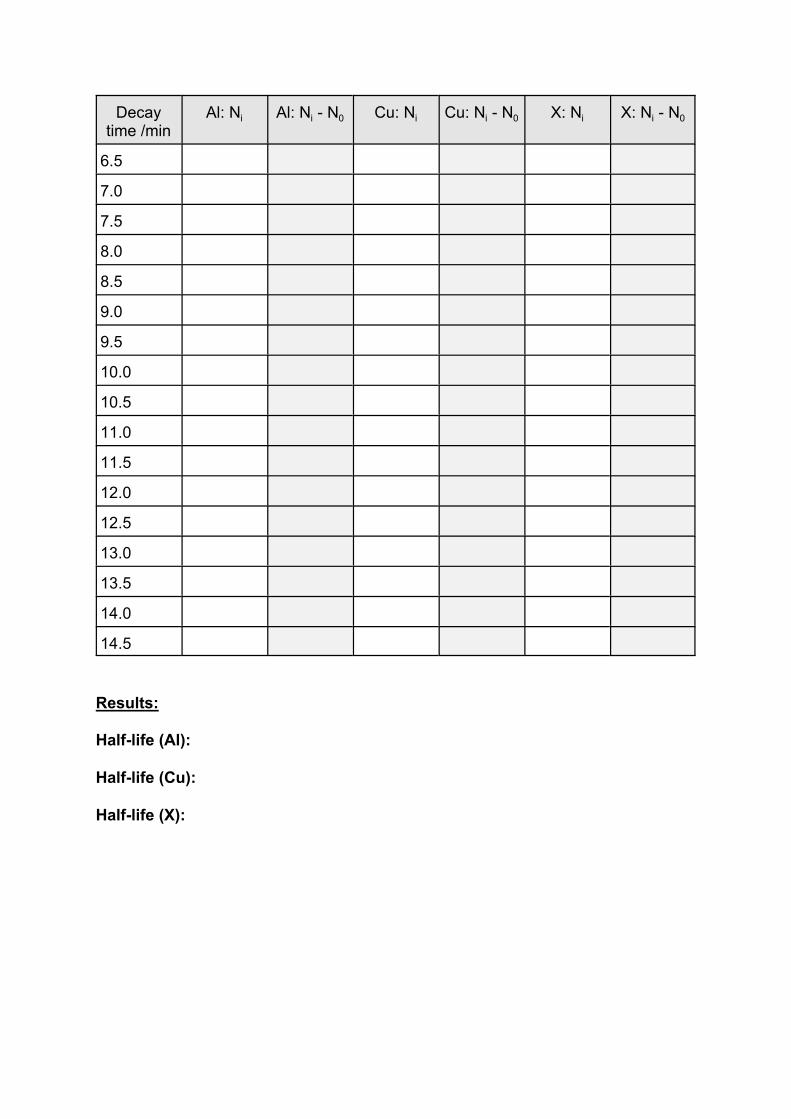
Decay Al: N Al: N - N Cu: N Cu: N - N X: N X: N - N
time /min
i i 0 i i 0 i i 0
6.5
7.0
7.5
8.0
8.5
9.0
9.5
10.0
10.5
11.0
11.5
12.0
12.5
13.0
13.5
14.0
14.5
Results:
Half-life (Al):
Half-life (Cu):
Half-life (X):

21 3 4 5 6 7 98 10 11 12 13 14 15
30.000
20.000
10.000
no. of pulses in 6 s
min0

21 3 4 5 6 7 98 10 11 12 13 14 15 16 min
no. of pulses in 6 s

TECHNICAL UNIVERSITY
DRESDEN
Institute of Power Engineering Training Reactor
Reactor Training Course
Experiment
"Identification of Unknown Radionuclides"
( γ - Spectrometry )
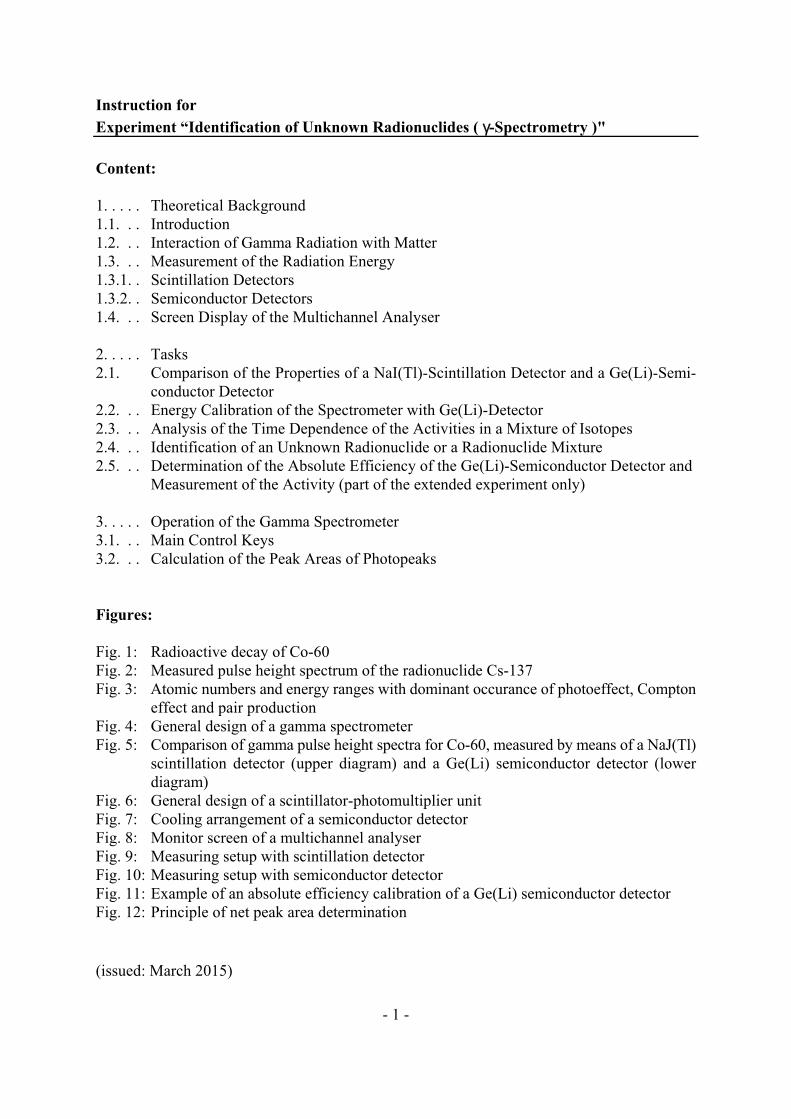
- 1 -
Instruction for
Experiment “Identification of Unknown Radionuclides ( γ-Spectrometry )"
Content:
1. . . . . Theoretical Background
1.1. . . Introduction
1.2. . . Interaction of Gamma Radiation with Matter
1.3. . . Measurement of the Radiation Energy
1.3.1. . Scintillation Detectors
1.3.2. . Semiconductor Detectors
1.4. . . Screen Display of the Multichannel Analyser
2. . . . . Tasks
2.1. Comparison of the Properties of a NaI(Tl)-Scintillation Detector and a Ge(Li)-Semi-
conductor Detector
2.2. . . Energy Calibration of the Spectrometer with Ge(Li)-Detector
2.3. . . Analysis of the Time Dependence of the Activities in a Mixture of Isotopes
2.4. . . Identification of an Unknown Radionuclide or a Radionuclide Mixture
2.5. . . Determination of the Absolute Efficiency of the Ge(Li)-Semiconductor Detector and
Measurement of the Activity (part of the extended experiment only)
3. . . . . Operation of the Gamma Spectrometer
3.1. . . Main Control Keys
3.2. . . Calculation of the Peak Areas of Photopeaks
Figures:
Fig. 1: Radioactive decay of Co-60
Fig. 2: Measured pulse height spectrum of the radionuclide Cs-137
Fig. 3: Atomic numbers and energy ranges with dominant occurance of photoeffect, Compton
effect and pair production
Fig. 4: General design of a gamma spectrometer
Fig. 5: Comparison of gamma pulse height spectra for Co-60, measured by means of a NaJ(Tl)
scintillation detector (upper diagram) and a Ge(Li) semiconductor detector (lower
diagram)
Fig. 6: General design of a scintillator-photomultiplier unit
Fig. 7: Cooling arrangement of a semiconductor detector
Fig. 8: Monitor screen of a multichannel analyser
Fig. 9: Measuring setup with scintillation detector
Fig. 10: Measuring setup with semiconductor detector
Fig. 11: Example of an absolute efficiency calibration of a Ge(Li) semiconductor detector
Fig. 12: Principle of net peak area determination
(issued: March 2015)
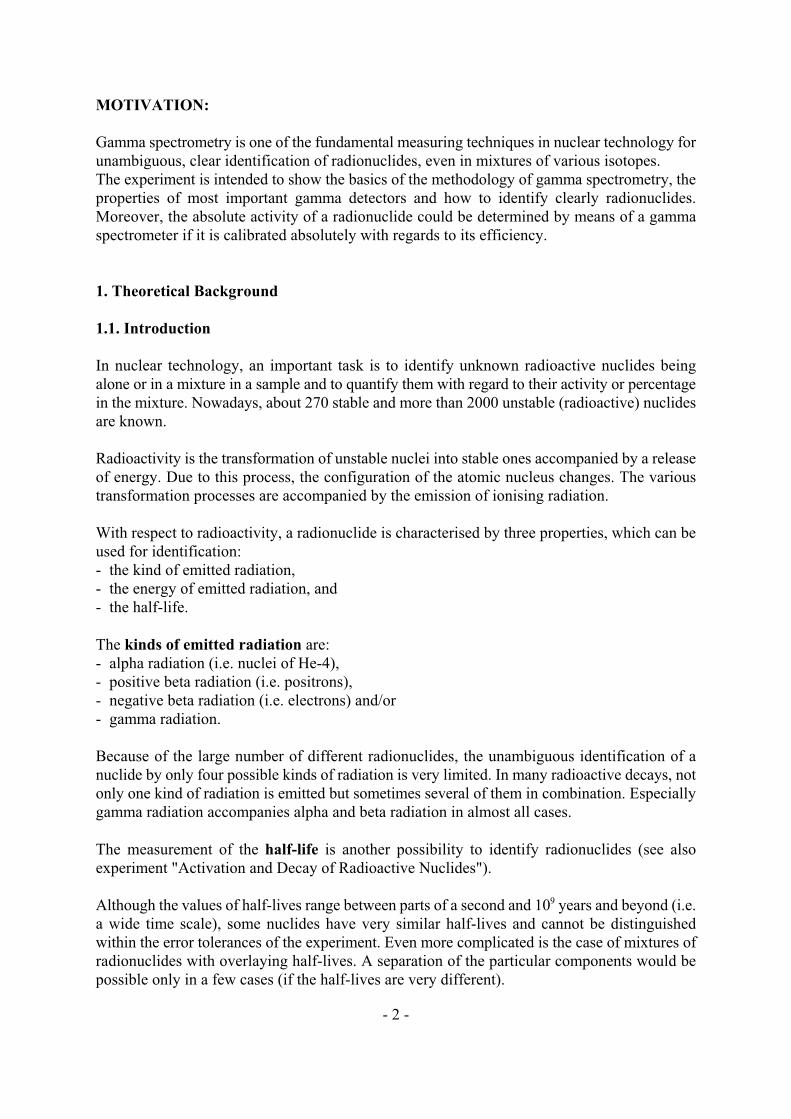
- 2 -
MOTIVATION:
Gamma spectrometry is one of the fundamental measuring techniques in nuclear technology for
unambiguous, clear identification of radionuclides, even in mixtures of various isotopes.
The experiment is intended to show the basics of the methodology of gamma spectrometry, the
properties of most important gamma detectors and how to identify clearly radionuclides.
Moreover, the absolute activity of a radionuclide could be determined by means of a gamma
spectrometer if it is calibrated absolutely with regards to its efficiency.
1. Theoretical Background
1.1. Introduction
In nuclear technology, an important task is to identify unknown radioactive nuclides being
alone or in a mixture in a sample and to quantify them with regard to their activity or percentage
in the mixture. Nowadays, about 270 stable and more than 2000 unstable (radioactive) nuclides
are known.
Radioactivity is the transformation of unstable nuclei into stable ones accompanied by a release
of energy. Due to this process, the configuration of the atomic nucleus changes. The various
transformation processes are accompanied by the emission of ionising radiation.
With respect to radioactivity, a radionuclide is characterised by three properties, which can be
used for identification:
- the kind of emitted radiation,
- the energy of emitted radiation, and
- the half-life.
The kinds of emitted radiation are:
- alpha radiation (i.e. nuclei of He-4),
- positive beta radiation (i.e. positrons),
- negative beta radiation (i.e. electrons) and/or
- gamma radiation.
Because of the large number of different radionuclides, the unambiguous identification of a
nuclide by only four possible kinds of radiation is very limited. In many radioactive decays, not
only one kind of radiation is emitted but sometimes several of them in combination. Especially
gamma radiation accompanies alpha and beta radiation in almost all cases.
The measurement of the half-life is another possibility to identify radionuclides (see also
experiment "Activation and Decay of Radioactive Nuclides").
Although the values of half-lives range between parts of a second and 10 years and beyond (i.e.9
a wide time scale), some nuclides have very similar half-lives and cannot be distinguished
within the error tolerances of the experiment. Even more complicated is the case of mixtures of
radionuclides with overlaying half-lives. A separation of the particular components would be
possible only in a few cases (if the half-lives are very different).

Co60
27
Ni60
28
ß-2
ß-199.92 %0.08 %
0.32 MeV
1.49 MeV γ1
1.173 MeV
1.332 MeV
γ2
- 3 -
Fig. 1, Radioactive decay of Co-60
The measurement of the energy of the emitted radiation, however, allows an unambiguous
identification. In the radioactive decay, the unstable nucleus with its excess of energy gets to the
lower energy state of the daughter nucleus by the emission of particles or gamma quants or by
resting at an excited immediate state of the daughter nucleus that is left for the ground state only
after emission of further radiation. All possible energy levels in an atomic nucleus are pre-
determined, i.e. through a transformation always the same certain amount of energy is released
in form of radiation. As an example Fig. 1 shows the decay scheme of Co-60. The horizontal
lines illustrate the energy states of the nucleus. The arrow lines in between mark the kind of
decay and its energy. Horizontally shifted lines refer to changes in the charge of the nucleus, i.e.
the emission of charged particles.
Non-shifted lines mark the emission
of gamma quants (no charge). Since
energy levels of all existing radionu-
clides have different values and,
consequently, all decay schemes
have individual properties, it is pos-
sible to identify any nuclide by the
measurement of the energy of the
emitted radiation. Since almost any
radioactive decay is accompanied by
gamma emission, spectrometry of
this kind of radiation is possible for
almost all nuclides. Therefore, gam-
ma spectrometry is the most impor-
tant and universal method for the
identification of radionuclides.
1.2. Interaction of Gamma Radiation with Matter
Gamma radiation is an electromagnetic radiation consisting of gamma quants (= photons).
Gamma quants do not carry an electric charge. Therefore, the interaction of gamma radiation
with matter differs from that of charged particles with matter. The energy absorption is possible
by the photo effect, the Compton effect, and pair production. All these effects cause the
production of secondary electrons that are detected (as charged particles) in appropriate measu-
rement devices.
The gamma spectrum is a discrete spectrum. Though, gamma detectors do not only detect
distinct sharp lines. This is due to the different possible interactions mentioned above of the
gamma radiation with the detector material. Fig. 2 shows a typical measured pulse-height
spectrum for a discrete gamma energy (that of the radionuclide Cs-137). At the full photon
energy E , the photopeak appears. The gamma quant is completely absorbed by a shell electronγof the detector material. In this case, the photon vanishes and a free electron that carries the
same energy as the former photon (subtracted by the small ionisation energy of the electron) is
released.
If the photon does not lose its entire energy, only an elastic collision with a shell electron of the
detector material occurs (Compton effect). In this case, the photon transfers only fractions of

0 500 1000 1500 2000
channel number
1E+1
1E+2
1E+3
1E+4
1E+5
puls
es p
er
channel
photopeak(662 keV)
Compton edge(478 keV)
backscattering peak(184 keV)
Compton continuum
EE
m c
E
c =+
⋅
⋅
γ
γ12
0 ²
- 4 -
Fig. 2, Measured pulse height spectrum of the radionuclide Cs-137
(1)
its energy to the shell electron, is scattered carrying still a reduced energy and leaves the
detector or can even have a second interaction. The measured pulse height corresponds to the
energy of the produced free Compton electron. According to conservation of momentum and
energy the maximum energy that can be transferred to an electron is (at an angle of 180°):
(with m ·c² = 511 keV being the energy equivalent of the electron mass (electron rest energy)).0
This maximum energy of the Compton effect corresponds to the Compton edge in the pulse
height spectrum. At lower energies, the spectrum continues with a plateau, the so-called
Compton continuum that results from energy transmission at angles less than 180°.
At photon energies of some MeV, the full-energy peak is caused by pair production. If the
energy of the photon exceeds the amount of twice the rest energy of the electron
(E > 1.02 MeV), then the Coulomb field of the nucleus can transform a photon into an elec-
tron-positron pair. The exceeding energy is almost equally distributed to the electron and the
positron as kinetic energy. The pair production is always followed by annihilation of the
positron, i.e. after its full slow-down, the positron unifies with an electron of the surroundings
under emission of gamma radiation (annihilation radiation).
The ratio of occurrence of the different described effects is determined by the energy of the
photon and the material of the detector (Fig. 3). The photo effect is dominating in case of
low-energy photon radiation in combination with a high atomic number of the detector material.
The Compton effect occurs mainly at intermediate energies at a range of about (0.4 ... 4) MeV.

EE
E
m c
BS =+
⋅
⋅
γ
γ12
0 ²
E / MeV
0
50
100
ato
mic
num
ber
Z
1E-2 1E-1 1E+0 1E+1 1E+2
photo effect pair production
Compton effect
- 5 -
(2)
Fig. 3, Atomic numbers and energy ranges with dominant occu-
rance of photoeffect, Compton effect and pair production
Photons may also pass the detector without any interaction and re-enter the detector with much
reduced energy after being backscattered in the surrounding material. The absorption of back-
scattered photons corresponds to a backscattering maximum at
that overlaps with the Compton continuum.
In case of a gamma decay with emission of multiple gamma energies or in case of a mixture of
various nuclides, the corresponding spectra will overlap. Hence, the identification may be more
difficult.
1.3. Measurement of the Radiation Energy
The measurement setup is presented in Fig. 4. The detector is coupled via a preamplifier and a
spectroscopic amplifier to a multichannel analyser. In the charge-sensitive preamplifier, the
primary charge pulses are converted into voltage pulses (output-voltage is proportional to the
input charge). In the spectroscopic amplifier, the pulses are amplified up to a range of 1 ... 10 V.
The multichannel analyser recognises the incoming pulses, evaluates them with respect to their
height (voltage), which contains the information about the energy, and sorts them into consecu-
tive pulse-height channels. The result is a pulse-height spectrum that contains the energy
information of all recognised gamma quants. Each measured gamma quant is a count in the
corresponding energy channel of the multichannel analyser. It should be realised that even
discrete gamma energies do not cause sharp lines in the spectrum, because of statistical fluctua-
tions of the elementary processes in the detector and in the post-processing electronics. This
phenomenon creates from theoretically sharp lines GAUSSIAN bell-curves (peaks). The mean

PA
D
HU
Amp MCA
display
printer
D detector unitPM preamplifierAmp spectroscopic amplifierMCA multichannel analyserPG pulse generatorU high voltage supplyH
radiation shielding(e.g. lead)
radioactivesample
PG
- 6 -
Fig. 4, General design of a gamma spectrometer
pulse heights correspond to the energy of the gamma quants. Using a PC programme, the
gamma energy spectrum can either be observed on the screen, directly evaluated or saved. The
required high voltage is fed to the γ-detector via the preamplifier.
Because temperature effects and voltage fluctuations can shift the electronic amplification of
the measurement setup and correspondingly also the channel number of the photopeaks during
the measurement, high-quality spectrometers have an automatic amplification control capabili-
ty. This control uses voltage pulses of an exactly constant pulse height provided by a preci-
sion-pulse generator and fed as additional input signal to the preamplifier during the entire
measurement. The electronics of the multichannel analyser automatically controls the internal
amplification such that the generator peak steadily remains at a constant channel number. The
generator pulses are set in such a way that the corresponding peak rises in a region of the
pulse-height spectrum where photo lines of the sample are not expected. Usually this is at the
very upper end of the pulse-height spectrum.
In most cases, the γ-detectors are surrounded by a radiation shielding, e.g. made from lead, to
minimise the influence of the ambient radiation from the environment especially for low gamma
activity measurements.
Gamma spectrometry is usually carried out with scintillation detectors (e.g. NaI(Tl)) or semi-
conductor detectors made from Ge(Li) or more recently made from high purity germanium
(HPGe).
Scintillation detectors are relatively easy to use and have a high detection efficiency. Special
kinds of such scintillators with a tight deep hole in the crystal (where the sample is placed
within the detector at the bottom) enables a measurement with almost 4π-geometry.
A disadvantage of scintillators is the limited energy resolution, i.e. the ability to resolve two
gamma peaks that are located close to each other as two separate lines.

0 1000 2000 3000 4000
1E+1
1E+2
1E+3puls
es p
er
channel
0 1000 2000 3000 4000
channel number
1E+1
1E+2
1E+3
1E+4
1E+5
puls
es p
er
channel
NaJ(Tl) - scintillation detector
Ge(Li) - semiconductor detector
backscatteringpeak
Compton continuum
Comptonedge(s)
photopeaks
- 7 -
Fig. 5, Comparison of gamma pulse height spectra for Co-
60, measured by means of a NaJ(Tl) scintillation de-
tector (upper diagram) and a Ge(Li) semiconductor
detector (lower diagram)
Semiconductor detectors ha-
ve an excellent energy resolu-
tion. Therefore, they are prefe-
rably used for demanding ana-
lyses in laboratories. Though,
the detection efficiency is in
general considerably lower
compared to scintillation de-
tectors. Using higher efficien-
cies corresponds to rapidly
rising detector costs, even
though the efficiency of scin-
tillation detectors cannot be
reached. Furthermore, semi-
conductor detectors have to be
cooled (permanently in case of
Ge(Li) and at least during usa-
ge in case of HPGe) to the
temperature of liquid nitrogen
(77K). This means further phy-
sical and financial efforts.
Fig. 5 shows the pulse-height
spectra of the radionuclide
Co-60 (gamma energies at
1173 keV and 1332 keV mea-
s u r e d w i t h a
NaI(Tl)-scintillation detector
and a Ge(Li)-semiconductor
detector, respectively. The
quality of the semiconductor
detector proves in form of a
clearly better energy resolution
of the photo peaks.
The resolution (of a detector) is defined as the width of a peak at half of its maximum height
(full width at half maximum, FWHM). It is given either as absolute resolution in terms of
channel numbers or energy units or as relative resolution if divided by the channel number or
energy position, respectively, of the peak maximum.
1.3.1. Scintillation Detectors
Scintillation detectors consist of a combination of a luminescent material (scintillator) that is
stimulated by ionising radiation to emit flashes (scintillations) and a photomultiplier that
converts the flashes into electrical pulses (Fig. 6).
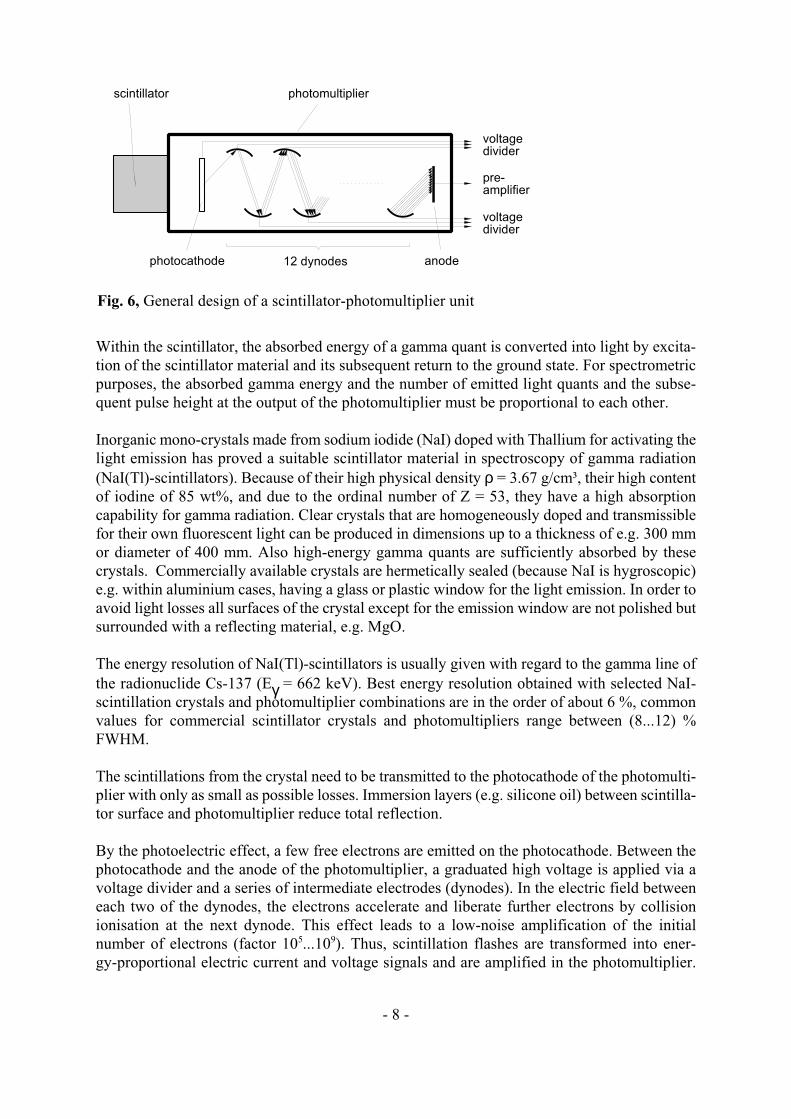
photocathode anode12 dynodes
voltagedivider
voltagedivider
pre-amplifier
scintillator photomultiplier
- 8 -
Fig. 6, General design of a scintillator-photomultiplier unit
Within the scintillator, the absorbed energy of a gamma quant is converted into light by excita-
tion of the scintillator material and its subsequent return to the ground state. For spectrometric
purposes, the absorbed gamma energy and the number of emitted light quants and the subse-
quent pulse height at the output of the photomultiplier must be proportional to each other.
Inorganic mono-crystals made from sodium iodide (NaI) doped with Thallium for activating the
light emission has proved a suitable scintillator material in spectroscopy of gamma radiation
(NaI(Tl)-scintillators). Because of their high physical density ρ = 3.67 g/cm³, their high content
of iodine of 85 wt%, and due to the ordinal number of Z = 53, they have a high absorption
capability for gamma radiation. Clear crystals that are homogeneously doped and transmissible
for their own fluorescent light can be produced in dimensions up to a thickness of e.g. 300 mm
or diameter of 400 mm. Also high-energy gamma quants are sufficiently absorbed by these
crystals. Commercially available crystals are hermetically sealed (because NaI is hygroscopic)
e.g. within aluminium cases, having a glass or plastic window for the light emission. In order to
avoid light losses all surfaces of the crystal except for the emission window are not polished but
surrounded with a reflecting material, e.g. MgO.
The energy resolution of NaI(Tl)-scintillators is usually given with regard to the gamma line of
the radionuclide Cs-137 (E = 662 keV). Best energy resolution obtained with selected NaI-γscintillation crystals and photomultiplier combinations are in the order of about 6 %, common
values for commercial scintillator crystals and photomultipliers range between (8...12) %
FWHM.
The scintillations from the crystal need to be transmitted to the photocathode of the photomulti-
plier with only as small as possible losses. Immersion layers (e.g. silicone oil) between scintilla-
tor surface and photomultiplier reduce total reflection.
By the photoelectric effect, a few free electrons are emitted on the photocathode. Between the
photocathode and the anode of the photomultiplier, a graduated high voltage is applied via a
voltage divider and a series of intermediate electrodes (dynodes). In the electric field between
each two of the dynodes, the electrons accelerate and liberate further electrons by collision
ionisation at the next dynode. This effect leads to a low-noise amplification of the initial
number of electrons (factor 10 ...10 ). Thus, scintillation flashes are transformed into ener-5 9
gy-proportional electric current and voltage signals and are amplified in the photomultiplier.

- 9 -
Since ambient light would completely overlap the scintillation effect of the detector and also
stimulate the photocathode of the photomultiplier to emit electrons, the entire scintilla-
tor-photomultiplier system needs to be light-tightly sealed.
1.3.2. Semiconductor Detectors
In the past, mainly scintillation detectors have been used for the determination of gamma
spectra. Nowadays, almost exclusively semiconductor detectors are applied for laboratory use.
Their main advantage is their high energetic resolution, which is about 10 to 20 times better
than that of a scintillator. The energy resolution of a semiconductor detector exceeds that of all
other radiation detectors because the energy needed to produce a pair of charge carriers is very
low (only about 2.96eV) with the consequence that for a certain amount of absorbed energy a
very high number of charged particles with corresponding excellent statistic accuracy is
produced. There are the older Ge(Li)-semiconductor detectors and the increasingly used
high-purity germanium detectors (HPGe).
Manufacturing of a Ge(Li)-semiconductor detector:
In a p-conducting germanium crystal (doped with boron), at 400 °C, lithium atoms diffuse and
build up a high Li-concentration at the surface of the crystal. The Li-atoms act as donors,
accumulate at inter-lattice positions and form a p-n-junction. Already at room temperature, the
inter-lattice atoms are ionised. Consequently, the crystal contains ionised positive lithium
atoms. When applying inverse voltage, these ions drift from the n-region to the p-region of the
crystal as long as their concentration is higher than that of the acceptors. Due to the formation
of boron and lithium ion pairs in the crystal, a high-resistance intrinsic layer (i-layer) is achie-
ved. In this layer, the impurities are eliminated because the negative ions got compensated.
Such an arrangement is called pin-structure. The i-layer is an effective barrier with a volta-
ge-independent thickness.
Mechanism of Ge(Li)-semiconductor detectors:
High voltage is applied to the contacts (n and p) in inverse direction. As long as no ionising
particle penetrates the crystal no electric current arises, since the i-layer has a large electric
resistance. If a gamma quant enters the crystal, it generates electron-defect-electron pairs along
its trajectory due to photo effect, Compton effect and pair production. These charges are
collected at the respective poles by the applied voltage. At the poles, a temporary gain of
electric charge, i.e. a potential difference, comes up and causes an electric pulse in the detector
circuit (electrical discharge). In a charge-sensitive preamplifier, the charge pulse is converted
into a voltage pulse (with an output signal proportional to the input charge).
Cooling:
One disadvantage of semiconductor detectors is that at room temperature, even lattice vibrations
cause ionisations in the crystal. Therefore, semiconductor detectors need to be cooled during
measurements. The cooling is usually made with liquid nitrogen (boiling temperature 77 K or
-196 °C, respectively) or recently also by electric cooling units based on the Peltier effect.
Ge(Li)-semiconductor detectors need to be cooled even when they are only stored and not in
use because at room temperature, lithium atoms are very mobile and would diffuse out of the
crystal. Thus, the detector would be distroyed.

semiconductordetector
heat conductor (Cu)
Dewar vessel
liquid nitrogen(77 K)
- 10 -
Fig. 7, Cooling arrangement of a semiconductor
detector
The liquid nitrogen is kept by a thermally
well-isolated Dewar vessel (principle of a
thermo, see Fig. 7). The semiconductor
detector is connected to the nitrogen by a
copper finger that removes heat from the
detector via heat conduction. To reduce
heat losses at the detector, the detector is
additionally put into a vacuum vessel.
Because heat losses are not entirely avoi-
dable the nitrogen gradually evaporates
and needs to be refilled regularly.
1.4. Screen Display of the Multichannel Analyser
Fig. 8 shows a screen display of the multichannel analyser computer program for an arbitrary
spectrum. The vertical cursor in the spectrum marks the selection of a certain channel of the
measured spectrum (middle) and the cursor region (left and right). The number of the selected
channel is displayed below the spectrum (marker). If the channel axis of the spectrometer has
been calibrated with respect to energy, also the corresponding energy of the channel is dis-
played. Next to this information, the number of counts in the selected channel is displayed.
Important displays within the column on the right hand side of the screen are:
Display MCR/Buffer Display of the spectrum from the current measurement or from
the buffer of the multichannel analyser
Full/Expand Display of the whole spectrum or only of that part selected in the
cursor region
Vt Scaling of the ordinate axis (vertical)
Hz Number of displayed channels on the abscissa axis (horizontal)
Presets Rl Tm Option for preselecting a RealTime for the measurement
Lv Tm Option for preselecting a LiveTime for the measurement
Time Rl Tm Elapsed RealTime of the measurement
Lv Tm Elapsed LiveTime of the measurement
Dead Tm DeadTime of the multichannel analyser (in %)
The terms RealTime, LifeTime and DeadTime need to be explained. RealTime is the time
period of the measurement according to the clock time. During processing a detector pulse, the
multichannel analyser cannot accept additional pulses (it is "busy"). The gate of the analyser is
said to be closed. Only after processing the pulse, the gate will be re-opened again to enable the
multichannel analyser to accept a next pulse. The time period of an actually open gate is called

- 11 -
Fig. 8, Monitor screen of a multichannel analyser
LifeTime. Consequently, the DeadTime is that time period with the gate closed. The LifeTime
is essential for any absolute measurement of spectra or activity determination. Preferably, the
LifeTime should be close to the RealTime, i.e. the DeadTime should be kept small. This can be
realised by either fast electronics in the multichannel analyser or by adjusting small count rates.
2. Tasks
2.1. Comparison of the Properties of a NaI(Tl)-Scintillation Detector and a Ge(Li)-
Semiconductor Detector
The gamma spectra of a Co-60 source, which is characterised by emission of two gamma
energies, are measured by both the detectors consecutively.
The setup of the scintillation spectrometer is given in Fig. 9 and that of the semiconductor
spectrometer is given in Fig. 10. The parameters of the electronic adjustment are provided by
the supervisor. A description of the most important buttons for operating the spectrometer is
given in Sec. 3.1.
Task: Place the gamma source Co-60 right onto the respective detector. Discuss the shape ofthe measured spectra of both the detectors and determine the resolution of the photopeaks.Compare the results of the measurement with the given literature.

Multichannel analyser MCB 92X(reverse side)
High voltage
Ge(Li) semiconductor detectorwith preamplifier
Dewar vessel
Power supply for preamplifier
Pulses
Pulsgenerator
Computer Printer
NaJ(Tl) scintillation detector
with fotomultiplier and
preamplifier
Radiometer SMG 20046
(spektroscopic amplifier and
high voltage supply)
Multichannel analyser MCB 92X
(reverse side)
Computer Printer
- 12 -
Fig. 10, Measuring setup with semiconductor detector
Fig. 9, Measuring setup with scintillation detector
2.2. Energy Calibration of the Spectrometer with Ge(Li)-Detector
Analysing spectra of pulse heights, only the channel numbers of peaks and the respective
number of pulses per channel are available. In order to link the channel number of the multi-
channel analyser to the corresponding gamma energy an energy calibration of the spectrometer
is necessary.
For the calibration, pulse height spectra of several well known gamma sources (calibration
sources) are measured with the multichannel analyser and the channel numbers of the measured
photopeaks are related to the well known photopeak gamma energies. A set of such calibration
sources is available at the AKR-2 consisting e.g. of nuclides given in Tab. 1.

- 13 -
Nuclide Energy [keV]
Co-60 1173
1332
Cs-137 662
Kr-85 514
Ho-166m 184
(main lines) 411
280
712
810
Tab. 1, Energies of the gamma radiation of some
calibration sources usable in the experiment
Task: For the given gamma sources, determine the relation between channel numbers andenergies of the photopeaks and draw a graphical representation of the function E = f(K). Whatfunctional relation can be found?
It is also possible to let the computer calculate the relation between the channel number and the
energy, and subsequently also to display the energy of each channel directly on the screen.
Therefore, two points (with the channel number and the respective energy each) taken from the
determined function E = f(K) have to be entered in the computer program, which calculates a
linear relation. For achieving the best accuracy, the two most-separated point (the lowest and
the uppermost) should be used.
The required keyboard inputs are as follows:
- Place the cursor onto the channel of the first chosen point (photopeak of the calibration source
with the lowest gamma energy)
- Switch to the pull-down menu "Calculate": Alt-C
- Activate "Calibrate": Alt-C
- Type the energy of the chosen channel: ... <CR>
- Repeat the procedure with the second pair
- Type the unit for the energy (keV): ... <CR>
After these steps, the abscissa is calibrated with respect to the gamma energy as can be seen at
the screen displaying the respective energy value for each channel number (compare Fig. 8).
Task: Calibrate the spectrometer as explained. Check the calibration with the help of thephotopeaks of other calibration sources.

- 14 -
2.3. Analysis of the Time Dependence of the Activities in a Mixture of Isotopes
The element copper comprises the two naturally occurring isotopes Cu-63 and Cu-65 (Tab. 2).
When activating copper (e.g. a copper sheet) in a neutron field, the two radioactive isotopes
Cu-64 and Cu-66 are being generated. These two isotopes decay with considerably differing
half-lives and emit gamma radiation with the energies given in Tab. 2.
Because of the superposition of the two exponential decay curves in the measurement, a simple
integral pulse counting does not allow a clear determination of the half-life (see also reactor
training course experiment “Activation and Decay of Radioactive Isotopes”). Using gamma
spectrometry the measured photopeaks can be related to the respective isotope and their
time-dependent intensity can be analysed isotope-specifically.
Element Nuclide to Abundance Activated T
be activated in element nuclideσ(n ,γ) Eγ
th 1/2
Cu Cu-63 69.1 % 4.3 b Cu-64 12.8 h 511 keV and 1348 keV
Cu-65 30.9 % 2.1 b Cu-66 5.1 min 1039 keV
Tab. 2, Activation data of copper
Task: Activate a copper sample for about 10 min at 2 W reactor power in the tangentialexperimental channel no. 3 of the AKR. The end of the irradiation time marks the start of thedecay time (use a stop watch for the time measurement!). Pre-select an appropriate LifeTime atthe gamma spectrometer (see also Sec. 3.1) and measure a few gamma spectra for severaldecay times each. Relate the measured photopeaks to the two copper isotopes. Determine thenet peak areas (that correspond to the intensities) of the photopeaks (see Sec. 3.2). Write theresults and also the standard deviations into a table according to Tab. 3 and calculate theratios of the peak areas of the photopeaks Cu-64/Cu-66. What are conclusions of the measure-ment?
Decay time peak areas
[ min ]
LiveTime of
measurement
[ s ]
Net peak areas [pulses] Ratio of the
Cu-64 / Cu-66
short-lived isotope long-lived isotope
Cu-66 (5.1 min) Cu-64 (12.8 h)
Eγ = 1039 keV Eγ = 511 keV
Tab. 3, Protocol of the peak areas of the photopeaks of an activated copper sample

- 15 -
2.4. Identification of an Unknown Radionuclide or a Radionuclide Mixture
The nuclide identification of an unknown radioactive sample is the measurement of the gamma
energies of the photopeaks and the comparison of the results with the literature. Because all
radionuclides have a unique decay scheme (example in Fig. 1) a definite identification is
possible. The data of all known radionuclides are available graphically or tabulated in printed
or digital form.
In the case that all photopeaks of a measured spectrum can be related to one single nuclide, a
pure isotope was measured. If additional photopeaks are identified, these are related to other
nuclides and consequently the sample is an isotope mix.
For simple nuclide identification as done in the described reactor training experiment, only the
ingredients of the sample have to be determined. An advanced analysis (see Sec. 2.5) allows to
calculate the quantitative composition of the sample by analysing additionally the photopeak
areas of the spectrum (taking into account the absolute energy-dependent efficiency of the
spectrometer, the gamma-emission probability and, if necessary, the activation parameters).
In the training at the AKR, either an unknown sample gets activated in the reactor or an already
present long-lived nuclide is measured.
Task: Measure the gamma spectrum of a sample that is provided by the supervisor using theGe(Li)-semiconductor detector. If necessary, the sample has to be activated in the experimentalchannels of the AKR before the measurement. The energies of the measured photopeaks have tobe recorded in a table according to Tab. 4 (column 1). Using the provided literature data at theexperimental place also write both, the gamma energies and the possibly matching nuclides intothis table (columns 2 and 3). To account for a slight shift in the energy calibration include alsoneighbouring gamma energies for comparison, i.e. one keV higher and lower of each measuredphotopeak. What is the result of your nuclide identification?
Measured photopeaks
Eγ [keV]
Possibly matching nuclides from the literature
Eγ [keV] Nuclide(s)
Tab. 4, Protocol sheet for nuclide identification

N Aemitted = ⋅γ
NN
tLTdetected =
εγ
= =⋅⋅
N
N
N
t ALT
detected
emitted
- 16 -
(3)
(4)
(5)
2.5. Determination of the Absolute Efficiency of the Ge(Li)-Semiconductor Detector and
Measurement of the Activity (part of the extended experiment only)
The number of gamma quants of a particular energy emitted by the source differs from the
number of detected pulses at this energy in the detector, because
- not all emitted quants penetrate the sensitive volume of the detector (geometry effect),
- not all quants that penetrate the volume of the detector interact within the sensitive volume
(detector efficiency effect), and
- not all interactions lead to a complete release of the quantum energy and consequently the
resulting pulse does not contribute to the photopeak area of the actual gamma energy (i.e.
Compton effect).
The efficiency calibration determines the quantitative relation between the number of gamma
quants emitted by the source and the number of pulses being counted in the corresponding
photopeak by the detector. The detector efficiency is strongly dependent on the photon energy.
At low gamma energies, much more pulses can be registered than at high gamma energies (due
to energy dependence of interaction cross sections). Additionally, the efficiency is influenced
by the material and the dimensions of the detector, by the geometry of the measurement setup
and by the distance between source and detector.
The number of photons that are emitted by the source per time unit is
with A being the activity of the source (i.e. the number of nuclei that decay per time unit) and
γ being the emission probability (or intensity). The emission probability is the fraction of
photons which has a certain energy and which is released by decays of the corresponding
nuclei. These intensities are provided by the decay scheme of the respective nuclide or ap-
propriate tables.
The number of detected pulses per time unit can be calculated from the measured net peak area
and the LiveTime according to
The efficiency at a certain gamma energy is the ratio between the numbers of detected and
emitted photons:
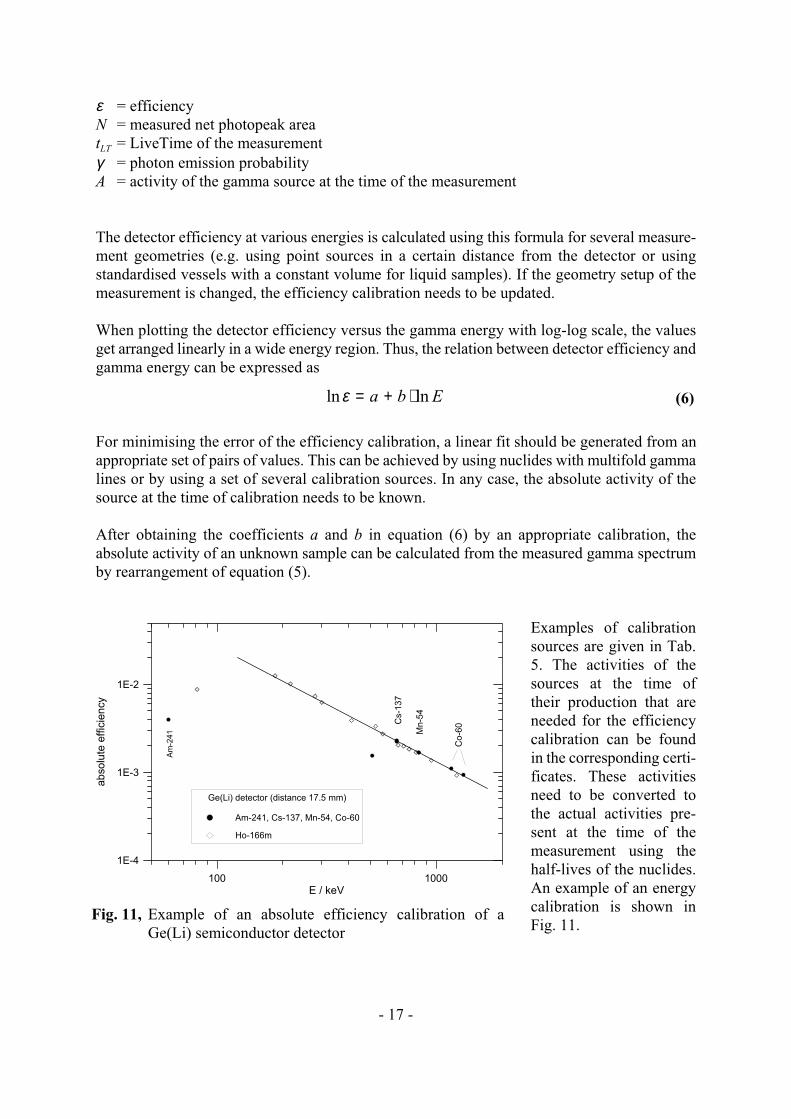
ln lnε = + ⋅a b E
100 1000
E / keV
1E-4
1E-3
1E-2
absolu
te e
ffic
iency
Am-241
Co-6
0Cs-1
37
Mn
-54
Ge(Li) detector (distance 17.5 mm)
Am-241, Cs-137, Mn-54, Co-60
Ho-166m
- 17 -
(6)
Fig. 11, Example of an absolute efficiency calibration of a
Ge(Li) semiconductor detector
ε = efficiency
N = measured net photopeak area
t = LiveTime of the measurementLT
γ = photon emission probability
A = activity of the gamma source at the time of the measurement
The detector efficiency at various energies is calculated using this formula for several measure-
ment geometries (e.g. using point sources in a certain distance from the detector or using
standardised vessels with a constant volume for liquid samples). If the geometry setup of the
measurement is changed, the efficiency calibration needs to be updated.
When plotting the detector efficiency versus the gamma energy with log-log scale, the values
get arranged linearly in a wide energy region. Thus, the relation between detector efficiency and
gamma energy can be expressed as
For minimising the error of the efficiency calibration, a linear fit should be generated from an
appropriate set of pairs of values. This can be achieved by using nuclides with multifold gamma
lines or by using a set of several calibration sources. In any case, the absolute activity of the
source at the time of calibration needs to be known.
After obtaining the coefficients a and b in equation (6) by an appropriate calibration, the
absolute activity of an unknown sample can be calculated from the measured gamma spectrum
by rearrangement of equation (5).
Examples of calibration
sources are given in Tab.
5. The activities of the
sources at the time of
their production that are
needed for the efficiency
calibration can be found
in the corresponding certi-
ficates. These activities
need to be converted to
the actual activities pre-
sent at the time of the
measurement using the
half-lives of the nuclides.
An example of an energy
calibration is shown in
Fig. 11.
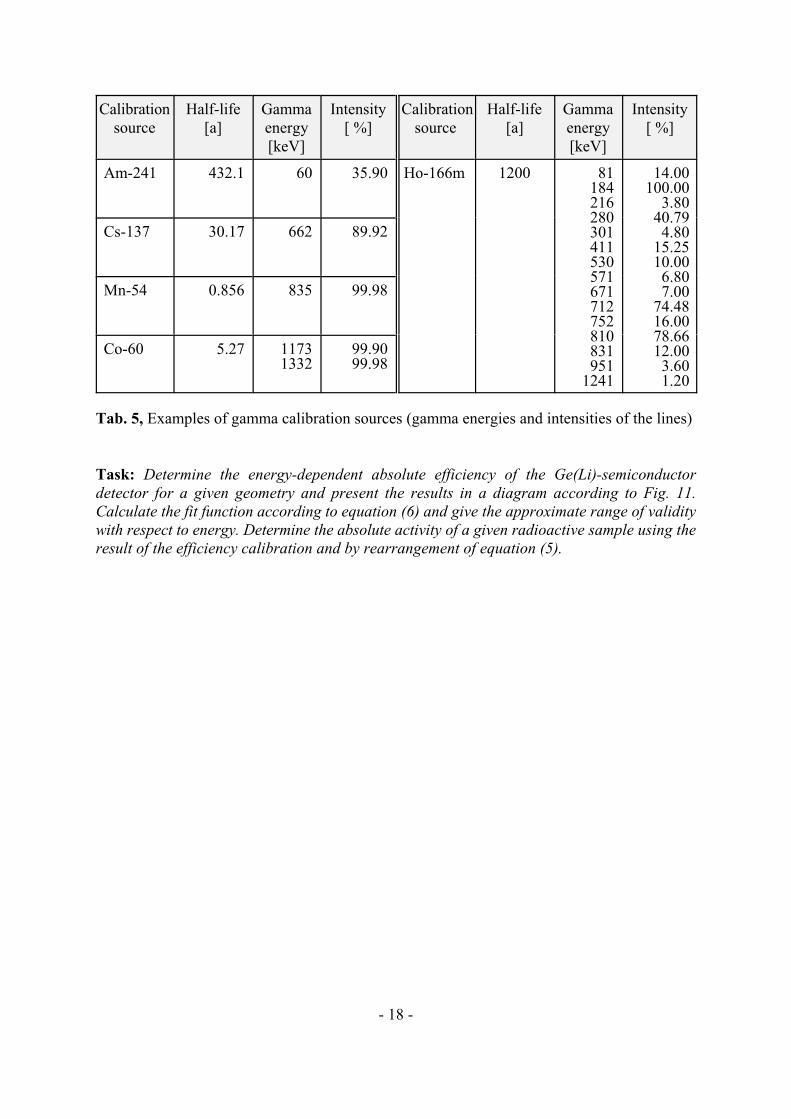
- 18 -
Calibration Half-life Gamma Intensity Calibration Half-life Gamma Intensity
source [a] energy [ %] source [a] energy [ %]
[keV] [keV]
Am-241 432.1 60 35.90 Ho-166m 1200 81 14.00 184 100.00 216 3.80 280 40.79 301 4.80 411 15.25 530 10.00 571 6.80 671 7.00 712 74.48 752 16.00 810 78.66 831 12.00 951 3.60
1241 1.20
Cs-137 30.17 662 89.92
Mn-54 0.856 835 99.98
Co-60 5.27 1173 99.90 1332 99.98
Tab. 5, Examples of gamma calibration sources (gamma energies and intensities of the lines)
Task: Determine the energy-dependent absolute efficiency of the Ge(Li)-semiconductordetector for a given geometry and present the results in a diagram according to Fig. 11.Calculate the fit function according to equation (6) and give the approximate range of validitywith respect to energy. Determine the absolute activity of a given radioactive sample using theresult of the efficiency calibration and by rearrangement of equation (5).

- 19 -
3. Operation of the Gamma Spectrometer
3.1. Main Control Keys
Key
Measurement Start Alt-1
Stop Alt-2
Delete Alt-3
Display Vertical scaling of the spectrum Cursor buttons up/down
View the whole spectrum/cursor region F3
Shift measured spectrum to buffer Alt-5
Switch between measurement display and buffer Alt-6
Cursor Cursor movement slow Cursor buttons left/right
" fast PageUp / PageDown
" to begin/end of spectrum Pos1/End
Cursor region wide + (NumPad)
" narrow - (NumPad)
Save Shift spectrum to buffer Alt-5
Pull-down menu "Files" Alt-F
Save Alt-S
Type in file name (without extension) ...
Write a comment (if needed) ...
Presets Pull-down menu "Presets" Alt-P
(e.g.) LiveTime preset Alt-L
3.2. Calculation of the Peak Areas of Photopeaks
The area of a peak is the difference between its entire area and the respective background. The
background comprises all pulses that do not belong to the photopeak but have been registered
by the multichannel analyser in the channels of the peak. The main reasons for the background
are:
- natural radiation at the place of measurement (e.g. cosmic radiation, terrestrial radiation),
- artificial radiation at the place of measurement (e.g. operation of the reactor, storage of
radiation sources close to the place of measurement),
- background of Compton scattering originating from higher gamma energies of the sample
being analysed.
The first two components of the background can be minimised by shielding the gamma detector
(e.g. with lead) and/or by storing other gamma sources as far as possible from the place of
measurement. If the sample being analysed has more than one gamma line, the third background
component is often dominating and cannot be avoided.

measuredspectrum
background
leftpeak boundary
rightpeak boundary
net peakarea
BC C
nn
=+
⋅
1
2
A Cg i
i
n
==∑1
A A B CC C
nn g i
n
i
n
= − = −+
⋅
=∑ 1
1 2
- 20 -
Fig. 12, Principle of net peak area determination
(7)
(8)
(9)
For correcting the background, the "ceiling" is assumed to have a linear shape (see Fig. 12). In
this case, it can be written
B = area of the background
A = gross peak areag
A = net peak arean
C = content of the channel at the left boundary of the peak1
C = content of the i-th channeli
C = content of the channel at the right boundary of the peakn
n = number of channels between left and right boundaries

B C Ch l
i
i
l
i
i h
h
= +
⋅− +
=
+
= −∑ ∑1
2
2
1
6
A Cb i
i l
h
==∑
A A C Ch l
A Bh l
h ln ib i
i l
l
i
i h
h
b= − +
⋅− −
= − ⋅− −− +=
+
= −∑ ∑2
2
5
6
5
1
- 21 -
(10)
(11)
(12)
The software of the multichannel analyser can calculate automatically the gross and net peak
areas as well as the respective standard deviations, which are due to the counting statistics. For
these calculations, the following keyboard commands are necessary:
1. Shift the measured spectrum to the buffer Alt-5
2. Display the content of the buffer Alt-6
3. Place the cursor at the left boundary of the peak
4. Mark the left boundary of the peak Alt-R, then Alt-B
5. Place the cursor at the right boundary of the peak
6. Mark the right boundary of the peak Alt-R, then Alt-E
(peak sector is in red color, now)
7. Move the cursor inside the peak range
8. Calculate net peak area Alt-C, then Alt-A
The net peak area is calculated by the PC program according to following method. For ba-
lancing statistic errors at the lower and upper limits of the chosen peak range, the calculation of
the background B averages both, the first and the last 3 channels inside the peak range and uses
them for calculating the "ceiling". Hence,
B = area of the background
l = channel number at the left boundary of the ROI (region of interest)
h = channel number at the right boundary of the ROI
C = content of the i-th channeli
A = gross peak areab
A = inner gross area (without both, the first three and the last three channels)ib
A = net peak arean
σ = statistical error of the calculated net peak areaAn

Time-dependent changes in the isotope activities
in an activated copper sample
Decay Measuring
time time
[ min ] (LiveTime)
[ s ]
Peak areas [pulses]Ratios
of peak areas
Cu-64 / Cu-66
short-lived isotope long-lived isotope
Cu-66 (5.1 min) Cu-64 (12.8 h)
E( = 1039 keV E( = 511 keV
Determination of peak areas:
1. Shift measured spectrum into the buffer memory (Alt-5)
2. Show buffer content (Alt-6)
3. Move cursor to left boundary of the peak
4. Fix left boundary of the peak (Alt-R, afterwards Alt-B)
5. Move cursor to right boundary of the peak
6. Fix right boundary of the peak (Alt-R, danach Alt-E)
(channels in peak region are displayed in red color)
7. Move cursor into the peak region
8. Calculate peak area (Alt-C, danach Alt-A)
Results:

Identification of an unknown activated sample
Measured (-peaks
E( [keV]
Possible nuclides
E( [keV] Nuclides
Results:


![AKR 3/(R) A3 - AKR 4/(R) A3 - akarasansor.comR)_A3_20160209_103327.pdf · $ +ó] 5HJ¾ODW¸U¾ AKR 3/(R) A3 - AKR 4/(R) A3 AKR 4/(R) A3 AKR 3/(R) A3 $ * 9(1/ . 67$1'$57 + A3 SAFETY](https://static.fdocuments.in/doc/165x107/5ecc1d0dd33b5279e8267d6d/akr-3r-a3-akr-4r-a3-ra320160209103327pdf-5hjodwu-akr.jpg)