TRAINING EVALUATION TO - Veriobinde1.verio.com/wb_fluency.org/Publications/Lindsley1998a.pdf ·...
24
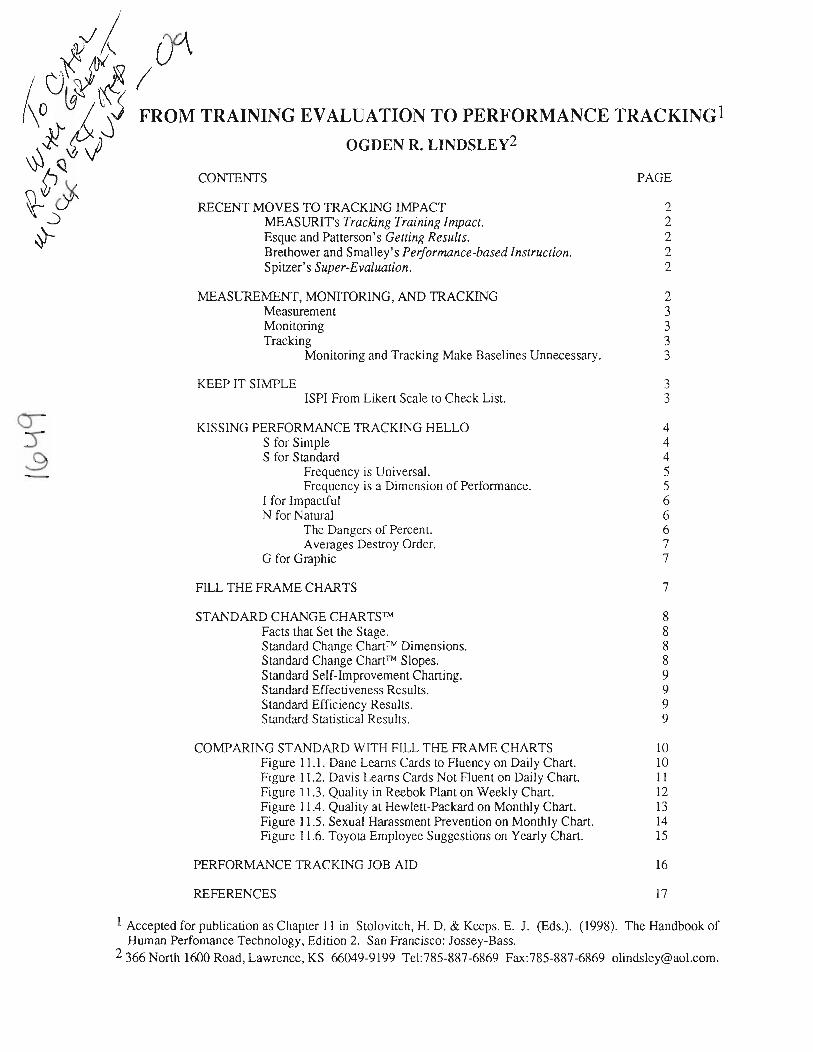
TRAINING EVALUATION TO PERFORMAI\CE OGDEN R. LINDSLEY2 CONTENTS RECENT MOVES TO TRACKING IMPACT MEASURIT s Trackin g Trainin g I mpact. Esque and Patterson's Geuing Results. Brethower and Smalley' s Performance-based I nstruction. Spitzer's Super -Ev aluatio n. MEASUREMENT, MOMTORING, AND TRACKING Measurement Monitoring Tracking Monitoring and Tracking Make Baselines Unnecessary. KEEP IT SIMPLE ISPI From Likert Scale to Check Lisr. KISSING PERFORMANCE TRACKING HELLO S for Simple S for Standard Frequency is Universal. Frequency is a Dimension of Performance. I for Impactful N for Natural The Dangers of Percent. Averages Destroy Order. G for Graphic FILL THE FRAME CHARTS STANDARD CHANGE CHARTSTM Facts that Set the Stage. Standard Change Chartru Dimensions. Standard Change Chartru Slopes. S tandard Self-Improvement Charting. Standard Effectiveness Results. S tandard Efficiency Results. Standard Statistical Results. COMPARING STANDARD WITHFILL TFIE FRAME CHARTS TRACKINGl PAGE 2 2 ) 2 2 2 J J J J J 3 4 4 4 5 5 6 6 6 7 7 7 cr t o 8 8 8 8 9 9 9 9 Figure Figure Figure Figure Figure Figure I .l . Dane Learns Cards to Fluency on Daily Chart. 1.2. Davis Learns Cards Not Fluent on Daily Chart. 1.3. Quality in Reebok Plant on Weekly Chart. 1.4. Quality at Hewlett-Packard on Monthly Chart. 1.5. Sexual Harassment Prevention on Monthly Chart. 1.6. Toyota Employee Suggestions on Yearly Chart. 10 l0 ll t2 13 t4 15 16 PERFORMANCE TRACKING JOB AID REFERENCES 11 1 Accepted for publication as Chapter 11 in Stolovitch, H. D. & Keeps. E. J. (Eds.). (1998). The Handbook of Human Perfomance Technology, Edition 2. San Francisco: Jossey-Bass. 2 366 North 1600 Road, Lawrence, KS 66049-9199 Tel:785-887-6869 Fax:785-887-6869 [email protected].
Transcript of TRAINING EVALUATION TO - Veriobinde1.verio.com/wb_fluency.org/Publications/Lindsley1998a.pdf ·...
TRAINING EVALUATION TO PERFORMAI\CE
OGDEN R. LINDSLEY2
CONTENTS
RECENT MOVES TO TRACKING IMPACTMEASURIT s Trackin g Trainin g I mpact.Esque and Patterson's Geuing Results.Brethower and Smalley' s Performance-based I nstruction.Spitzer's Super -Ev aluatio n.
MEASUREMENT, MOMTORING, AND TRACKINGMeasurementMonitoringTracking
Monitoring and Tracking Make Baselines Unnecessary.
KEEP IT SIMPLEISPI From Likert Scale to Check Lisr.
KISSING PERFORMANCE TRACKING HELLOS for SimpleS for Standard
Frequency is Universal.Frequency is a Dimension of Performance.
I for ImpactfulN for Natural
The Dangers of Percent.Averages Destroy Order.
G for Graphic
FILL THE FRAME CHARTS
STANDARD CHANGE CHARTSTMFacts that Set the Stage.Standard Change Chartru Dimensions.Standard Change Chartru Slopes.S tandard Self-Improvement Charting.Standard Effectiveness Results.S tandard Efficiency Results.Standard Statistical Results.
COMPARING STANDARD WITHFILL TFIE FRAME CHARTS
TRACKINGl
PAGE
22)22
2JJJJ
J3
44455
66677
7
crto
8
888
9999
FigureFigureFigureFigureFigureFigure
I .l . Dane Learns Cards to Fluency on Daily Chart.1.2. Davis Learns Cards Not Fluent on Daily Chart.1.3. Quality in Reebok Plant on Weekly Chart.1.4. Quality at Hewlett-Packard on Monthly Chart.1.5. Sexual Harassment Prevention on Monthly Chart.1.6. Toyota Employee Suggestions on Yearly Chart.
10
l0llt213
t415
16PERFORMANCE TRACKING JOB AID
REFERENCES 11
1 Accepted for publication as Chapter 11 in Stolovitch, H. D. & Keeps. E. J. (Eds.). (1998). The Handbook ofHuman Perfomance Technology, Edition 2. San Francisco: Jossey-Bass.
2 366 North 1600 Road, Lawrence, KS 66049-9199 Tel:785-887-6869 Fax:785-887-6869 [email protected].
FROM TRJA,TNING EVALUATTON TO PERFORMAT.ICE TRACKING
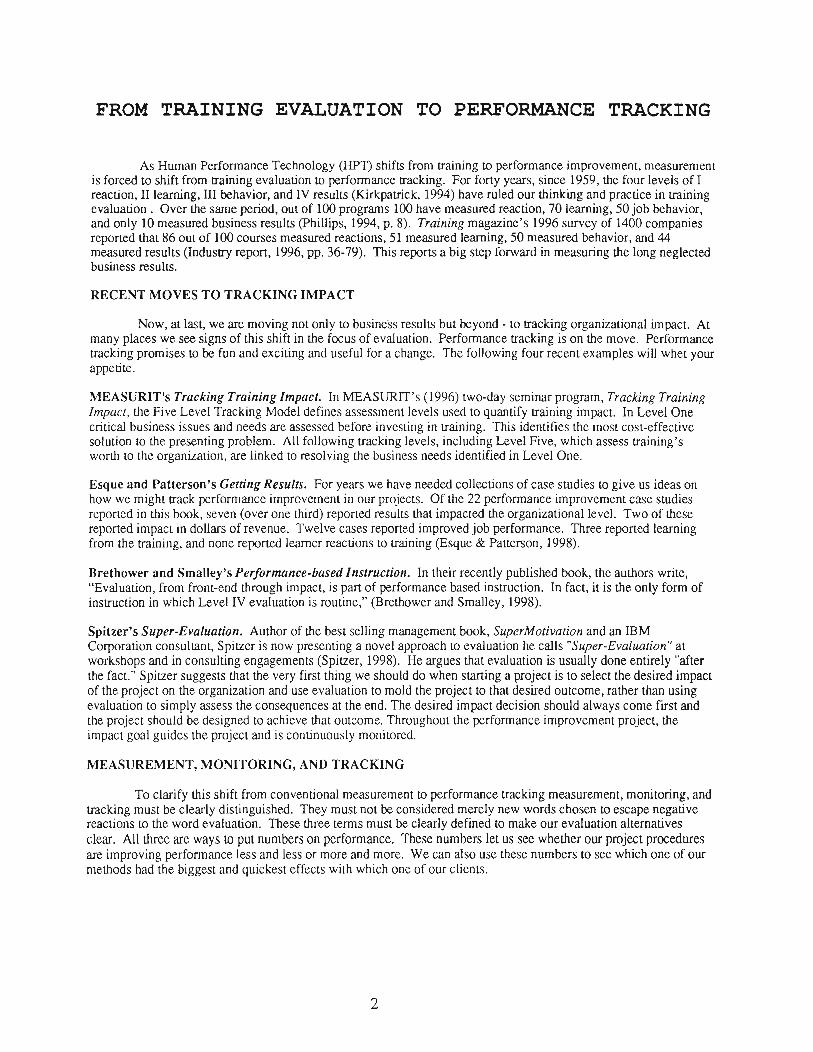
As Human Performance Technology (FIPT) shifts from raining !o performance improvement, measurementis forced to shift from training evaluation to performance tracking. Forlorty years, since tgSg, the four levels of Ireaction, II learning, trI behavior, and IV results (Kirkpatrick, t994) have ruteO our thinking and practice in trainingevaluation . Over tle same period, out of 100 programs 100 have measured reaction, 70 leirning, 50 job behavior,'and only 10 measured.business results @hillips, 1994,p.8). Training magazine's 1996 survey of r+dO companiesreported that 86 out of 100 courses measured reactions, 5l measured learnlng, 50 measured behavior, nd,almeasured results (Industry report, 1996, pp. 36-79). This repors a big step forward in measuring the long neglectedbusiness results.
RECENT MOVES TO TRACKINGIMPACT
Now, at last, we ar9 loving not only to business results but beyond - to tracking organizational impact. Atmany places we see signs of this shift in the focus of evaluation. Performance nacking is oritre move. performancetracking promises !o be fun and exciting and useful for a change. The following four iecent examples will whet yourappetite.
MEASURIT's Tracking f rylniry Irlqagt:.IIMEASLIRIT's (1996) two-day seminar prog ram,Tracking TrainingImpact, the Five Level Tracking Model defines assessment levels used to quantify raining*impact. In Level Onecritical business issues and needs are assessed before investing in training. This identifieJthe most cost-effectivesolution to the presenting problem. All following tracking levels, including Level Five, which assess training'sworth to the organization, ate linked to resolving the business needs identified in Level One.
Esque and Patterson's-Getting Results. For years we have needed collections of case studies to give us ideas onhow we might rack performance improvement in our projects. Of the 22performance improvement case studiesreported in this book, seven (over one third) reported results that impactedthe organizational level. Two of thesereported impact in dollars of revenue. Twelve cases reported improved job performance. Three reported learningfrom the training, and none reported learner reactions to training @sque & Fanerson, 1998).
Brethower and Smalley's Performance-based Instruction. In their recently published book, the authors write,"Evaluation, from front-end through impact, is part of performance based initruction. In fact, it is the only form ofinsnuction in which Level IV evaluation is routine," (Brethower and smalley, 199g).
Spitzer's Super-Evaluation. Althor of the best selling management book, SuperMotivationand an IBMColporation consultant, Spizer is now presenting a novel approach !o evaluation he calls "Super-Evaluation, atworkshops and in consulting engagements (Spitzer, 1998). He argues that evaluation is usuaily done entirely "afterthe fact." Spizer suggests *rat the very first thing we should do when starting a project is to seiect the desired impactof the project on the organization and use evaluation to mold the project to that dested outcome, rather than usingevaluation to simply assess the consequences at the end. The desired impact decision should always come first an"rlthe project should be designed to achieve that outcome. Throughout the performance improvement project, theimpact goal guides the project and is continuously monirored.
MEASUREMENT, MONITORING, AND TRACKING
To clarify this shift from conventional measurement to performance tracking measurement, monitoring, andtracking must be cleady distinguished. They must not be considered merely ne* *oids chosen to escape n"gaiu"reactions to the word evaluation. These three terms must be clearly defined to make our evaluation alternatiiesclear. All three are ways to put numbers on performance. These numbers let us see whether our project proceduresare improving performance less and less or more and more. We can also use these numbers to see *i,ictr one of ourmethods had the biggest and quickest effects with which one of our clients.
Measurement
Measurement is done before, occasionally during, and usually after the performance improvement projecLIt includes a set of actions to take and is always outside the system being measured. Measurement is what is taughtin most conventional measurement and evaluation courses and workshops. Measurement is strong on the *reoreticaland statistical and weak on the practical. A measurement. system is added to the performance being measured.Measurement is not continuous in real, calendar time.
Since measurement is not continuous, but usually is done only a few times during a project, workers neveradjust to it. Workers react to measurement negatively, as if it were a test. In their experience, tests have most oftenbeen followed by punishment rather than reward.
Monitoring
Several years ago the writer described the many differences between measuring and monitoring, but did notseparate monitoring into external monitoring and self monitoring or tmcking (Lindsley, 1997a). Most of ttreexamples listed under monitoring would now be listed as racking examples.
Monitoring systems are always outside the performance being improved. Monitoring differs frommeasurement by being continuous. It records all the time that performance occurs. Monitoring requires an extemalrecording system that is designed and added to the performance change system. Monitoring systems collectperformance numbers as they happen, so that corrections can be made in real time before the performance gets toofar off course.
Because monitoring systems are clearly outside of the performing system, they are often suspect andreacted to negatively. The word monitor itself has negative connotations from school days (hall monitor,playground monitor).
Tracking
Tracking occurs when a counter within the performing system records itself without interfering wittr itsperformance. Ideally, the performance itself leaves a track. Like rabbit tracks in the snow, the performance recordsiself. Tracking gives the most accurate and most sensitive performance numbers. Tracking costs the least anddisturbs the performance the least.
Tracking has face validity and is accepted by all workers and managers as an important indicator ofperformance improvement.
Monitoring and Tracking Make Baselines Unnecessary. Because both monitoring and tracking continuouslyrecord performance, trends are clearly displayed. Clear trend displays make baselines unnecessary becausejumpsand turns in the trend line produced by your performance improvement methods are clearly seen. Baselines still addinformation about the trends before the performance improvement project, but are no longer required to demonsfatemethod results.
KEEP IT SIMPLE
A related shift from academic and statistically sophisticated measurement to simple practical methods easyfor workers to use on the shop floor has occurred. This shift away from the barren, hard-to-learn academic measuresoccurs even in first level pailicipant reaction evaluations. Here is a recent example.
ISPI From Likert Scale to Check List. For decades The International Society for Performance Improvement (AsNSPI, and ISPI) used a naditional standard nine item Session Evaluation with a five point Likert scale. Participantscircled a point for each item to record their reactions to the annual conference presentations. It was simple, it wasstandard, and it got done. The circled numbers on the ordinal Likert scales were averaged. (this botheredsome of us purists because it was mathematically incorrect. - medians would have been more accurate for the ordinaldata). The averaged results were interpreted by ISPI's program committee to make decisions about invitingpresenters to encore or to qualify to present a different topic at the next. year's conference.
For Lhe 1998 convention ISPI changed its Session Evaluation form to a 2l-item check list. The items onthe check list describe pro$am committee interests directly. Simple totals of the number of checks !o each of the 2litems give much more accurate information to the program committee than did the Likert scale averages of ninequestions.
Using the old Likert scales, the ISPI progam committee had to interpret when the overall average of thenine items was 4.67 to determine whether to invite the presenter to encore at the next. convention. Now, when thecommittee reads that 62 out of 68 participants checked the 20th check list item, "I believe rhis session should bepresented next year in t}te Encore track tlrat repeats the best sessions at this conference," interpretation isunnecessary. Simpler is beuer.
KISSING PERFORMANCE TRACKING HELLO
This shift to the new performance tracking involves more than just simplification. In aviation cadet trainingduring World War II, I first heard KISS meant "Keep It Simple, Stupid!" But for performance racking we must add'four otier features to "Simple." KISSING helps us remember the five features required to make performancetracking powerful: KISSING means Keep It Simple, Srandard, Impactful, Natural, and Graphic.
Keep It
S for Simple
Our performance tracking system should be simple enough, so thar if it has to be taught, it only has to betaught once.
In a recent interview, Norman, Head of the Appliance Design Center in the Consumer Products Group ofHewlett-Packard, said, "My goal is not to have zero raining, but !o have one-time training. If I don't quiteunderstand a computer system immediately ... and someone shows me, ... I never have to have it explained again."(Dickelman, 1998, p.37).
Most of us have had to have conventional evaluation methods explained to us over and over and over again.By our new simplicity requirement this is unacceptable.
Job aids and ctrecklists are simpler than flow charts and rating scales. Recent books on performancetechnology (HFI) are full of check lists and case examples. Fuller's (1997) Managing Performaice ImprovementProiects has many realistic case studies, and many assessment tools and checklists to simplify things foi readers.Brethower and Smalley (1998) include in their Performance-based Instruction many examples, job aids, and checklists, and even include a computer disk to make printing the check lists easy by eliminatingreader keyboarding orcopying.
Most of us spent hard years and hard cash in universities learning to write and talk in four and five syllableacademic jargon. Academic talk is the hallmark of the learned professional specialist. With so much invested in ourjargon it is very hard for us to talk and write plain English to our clients and their workers. Behavior analysis termshad to be translated into plain before Precision Teaching could be widespread (Lindsley. l99l). Mager (1986, p. 97)gives his manuscripts to two twelve-year-olds and asks Lhem to draw a circle around any word they do not yet know.He reports that a third of the circled words can be replaced by words that. everyone knows. Mageis books are sobeautifully clear that they are in great demand and have been easily translated into many foreign languages.
Our information explosion has put even greater pressure on using short, clear, plain English words.Evaluation has five syllables: Tracking has two. "sudden shift in level" has six syllables: Jump has one. "Change intrend" has three syllables: Turn has one syllable. Authors are even dropping their middle initials @. M. Brethoierand K. A. Smalley to Dale Brethower and Karolyn Smalley). Other authors are publishing with their one syllablenick names. Al Reis and Jack Trout (1993) authored the best selling The 22 Immutable Laws of Marketing. I amsure that mother Reis named her son Albert and he probably also had a middle name. Aim for one syllable words.
In his presentations on Super Evaluation, Spitzer (1998) quotes Albert Einstein as follows, "Everythingshould be as simple as possible ... but no simpler."
S for Standard
Every minute of every day our lives are govemed and made easier by standards. Our buildings are made ofbeams of standard width and thickness. Our hats, dresses, trousers, shoes, and rings come in standard sizes.Everything we use - hand tools, furniture, utilities, appliances, vehicles, and computers are designed, built, and usedby standards. Standards are vital to our society.
We use standard terms, methods, and analysis procedures in Human HPT. We use the standard seven, plusor minus two, in making our training lists and job aids (Miller, 1956). However, we do not use standard evaluationme:Nures. Much has been written on the need for educational standards, but little real standardization has been done(Dean, 1994).
lmai (1997, p. xviii) tells how the Japanese Gemba Kaizen (workplace guality and production conrol) hasthree ground rules: 1. Housekeeping, 2. Waste elimination and 3. Standardization. Good housekeeping curs rhefailure rate in half. Standardization cuts that failure rate in half again to one quarter of the original failure rate.
The 5 point Likert scale came close to being a standard, and that is why it got done. But it produced verypoor numbers that did little to improve performance. Percent is also very popular and close to being a standard. Butpercent. is also a very crude and weak performance measure. Percent only describes the relationship between twoother things. It ignores the sizes of those two things. The dangers of percent are described in the following sectionlabelled natural.
HINIBUs and Egos Block Standard Measures. HIMBU stands for Honible If Not Invented by Us. It is a diseasefound in universities, small business, and even some large corporations. People infected with HINIBU cannot tryanything new unless they have changed it enough to make it look like they invented it in house. We all know thatwe should put our client's corporate logo on the repors and materials we develop for them. However, we must bevery careful not to let corporate personalization change the nacking system to the point that it is no longer sandard.
Frequency is Universal. Without a doubt the only possible across-the-board performance standard is frequency -how many happened in how much time. Each happening of everything in the world that happens can be counted.All counts cover a counting time. Every count divided by its counting time gives a frequency. Therefore onething's frequency can be used to compare it with other things like it, or things very different from it.
A few examples follow. The average six year old laughs 300 times a day. Adulrs laugh between 15 and100 times a day. Therefore children laugh over three times more than adults. The normal blink rate for someonespeaking on TV is 31 to 50 blinks per minute (bpm). In the presidential TV debates, Clinton averaged 99 bpm, andDole averaged 147 bpm. So, from observing blinking, Clinton appeared twice as nervous, and Dole three timesmore nervous than most TV speakers.
Almost always track quality by counting how many good ones and how many bad ones happened, andseparately charting them.
We should use the natural counting times of our daily life and work. These times are number per minute,per hour, per day, per week, per month, per quarter, and per year.
B. F. Skinner (1950) gave us frequency saying, "Rate (frequency) is a universal datum." By this Skinnermeant that. everything in the universe has a frequency that can be counted and occurs in time. Therefore frequencyprovides a comparison standard.
Frequency is a Dimension of Performance. Research has taken us beyond Skinner in demonstrating thatfrequency is a dimension of performance. This means that changing the frequency changes the performance. Trythis little experiment to convince yourself of this fact. Take a plain piece of paper and write down your startingtime. Now write your signature as slowly as possible. Just barely move your pencil, writing letters as slow as one ortwo a minute. Keep slowly writing your signature. After l0 minutes stop and look at your signature. your secondor third grade signature should be wasritten. It was in you all these years, stored at a very slow frequency. Nowwrite your current signature as many times as possible in one minute. Count up the number of letters written perminute in both conditions. Your third grade signature should be at2 to 4 letters per minute. Your current signatureshould be at 150 to 220 letters per minute.
Change the frequency of writing and change the signature form. Change the frequency of light waves andchange the color of the light. Change ttre frequency of sound waves and change the tone of the sound. Just asfrequency is a dimension of light and sound, frequency is a dimension of performance. To fully describe aperformance, its frequency must be described.
This is why rraining people to high frequencies of performance makes them fluent. The form and control ofthe performance changes at high frequencies. Fluency produces more retention, more application, more stability,and more confidence (Binder, 1990, 1996). The guidelines and demands that fluency places on instructional designhave been recently detailed (Lindsley, 1997b).
In short, when it is srandard it is easier to do right. When it is standard it gets done. The best standard forperformance is frequency.
I for Impactful
The first six paragraphs ofthis chapter describe the shift in the focus in training evaluation fromKirkpatrick's (1994) four levels to organizational impact. I described four recent examples: MEASIIRIT (1996),Esque & Patterson (1998), Brethower & Smalley (1998), and Spizer (1998) to demonstrate this shift to impact.
When we shift to impact we must be careful to choose frequencies that we can use as guides to improve ourproject while we go along. The majority (47 out of 58) of the projects included in three colleclions of impactprojects @hillips, 1994,1997; Esque & Patterson 1998) report only before and after impact measures. These justifythe project to management, but cannot guide performance improvers during tireir project.
Only l1 of these 58 projects (l out of 5) included continuous racking data. Of these 11, 8 tracked montls,I tracked quarters, and 2 tracked years. These times are not short enough to accurately guide project improvement.Weekly frequencies are better and daily frequencies are best for continuous feedback to guide workers. A dailychart appeared in Esque and Patterson but it charted "cumulative percent of quota" which made it impossible toreclaim the original frequencies for comparing or re-charting.
Phillips (1994,1997) advocates using Return On Investment EOD !o measure organizational impact. TheROI Vo equals (net program benefits divided by program costs) times 100. The suggested advantage is that chiefexecutives will have training impact reported !o them using the same financial figures that they used for their otherinvestments. Because most ROI cannot be computed until after the project it cannot guide the project en route.Therefore, it is an impact measure that seldom can be used for tracking.
In summary, only one fifth of our published projects that measure impact track the impact continuouslyenough to guide project improvement. Of those that do, almost none track the weekly and daily frequencies thatmost effectively improve projects.
N for Natural
Original natural numbers that your performance system kicks out should not be "cooked" or transformed.This is the major sFategic enor made by most management. information systems designers. They can not leavenature alone. They cook the original numbers in attempts to focus your attention on relationships between theoriginal numbers. Cooking vegetables loses much of ttreir original flavor and texture. Cooking original performancefrequencies loses the details and sensitivity to change needed to guide performance improvement projects.Examples of cooked data are: Percent rejected, percent or proportion of standard, or product quality index @sque &Patterson, 1998, p. 44). A complete list of data cookings would be very long.
The Dangers of Percent. Of the twenty one data charts in Daniels' (1989) Performance Management nine arepercents. Ofthe seven performance data series in Daniels' (1994) Bringing out the best in people five are percents.Nine of the twenty two cases reported in Esque and Patterson's (1998) Getting Resulrs measured percents.
Percent is often your client's favorite performance measure. However, percent is insensitive to changes inperformance and actually dangerous to use. Skinner was aware of the problems wi*r percent when he wrote "Do notspend time on a{icles in which graphs show changes in the time, or number of errors to reach a criterion, or percentof correctchoicesmade" (1969,p.93). Holzschuh(1966)spenttwoyearsof fulltimepostdoctoralresearchcomparing the sensitivity of percent correct with frequency correct, to classroom curriculum changes. He concluded"Percent is the worst thing that ever happened to education." One of my most successful workshops is titled TlreDangers of Percent and How to AvoidThem (-indsley 1994).
An impact measure that your client has long recorded often will be a percent or a ratio of some standard ora percent of a company aim or quota. When given a percent try !o locate the original numbers from which thepercents were calculated. The original, natural numbers are best to track performance improvement throughout ttreproject. Because clients often love thek percents, do not ask clients to throw their percents away. Just locate theoriginal numbers for tracking performance. Then share both the originals and the percents with your client.
People think they understand and know percents, but they do not. Eight out of ten of the errors in themathematics section of standard achievement tests made by both children and adults are in calculating andinterpreting percents Less ttran halfofpre-service teachers scored higher than 50Va cone*t on a test ofpercentproblems (Parker & Leinhardt, 1995). Percent is hard to use because it uses the add language of more than, lessthan, increased by, and decreased by, which both hides the multiply meanings of percent and suggests a symmetrythat is not really there. Because percent is so hard to use, enors in calculating percents appear in many professionalpublications. There is a percent calculation enor in the data reported in Esque and Patterson's Geuing Results(1998). There is another percent calculation error in Phillips' In Action Vol. I (1994). Try to find them.
6
Averages Destroy Order. Shewhart, who originated Statistical Process Control (SPC) at Bell laboratories, wrore,"It is well to keep in mind that numbers and order are the two aspects of original data that are amenable tomathematical analysis" (1939. p. 90). If the traditional root-mean-square formula for the standard deviation is usedto determine the upper and lower control limits, the control charts are not sensitive to variations. This happensbecause the order in ttre original data series is lost by the averaging process. The formula used to set SPC controllimits retains the order from the original data and is sensitive to variance outliers. Shewhart (1939, p. 90) wenr on tosay, "It was the order that fumished the clue to the presence of assignable causes of variability that were later foundand removed."
This means do not average original dara. Keep original frequencies intact. According to Shewhart,averaging destroys order, which is half the value in your data. This also means that graphs are necessary !o maintainthe order in original data series. This also means that time series graphs display changes more sensitively than tablesand other graphs.
G for Graphic
A picture is worth a thousand words. Research has shown: Charts have higher impact on readers than textbased pages, recall and comprehension are higher with charts, and complex data relationships are more easily shownwith charts. Daniels Q99 ,p. l0l) writes "Employees on production jobs, office jobs, and even crearive jobs insoftware development can easily arrange a system of daily feedback. Once again I am referring to graphicfeedback."
Imai (1997, p.249) reports the power of company wide visual management. He states "Visual management.means displaying ... various graphs and charts on the current status of Kaizen activity on the walls and in everycorner of the factory."
Imai (1997, p. I 14) also describes asaichi (morning market) in which the first thing every morning beforework the rejects from the day before are displayed on a table and countermeasures adopted on the spot. This fitsTosti's (1978) and Lindsley's (1995) ideas of telling workers what to do and what not to do just before their nextchance to perform. Therefore charts displaying yesterday's performance should be shared and discussed by theworker group the first thing at the start of each work day.
Unfortunately graphical power is not yet used by most performance technologiss. They visually displaymany flowcharts and diagrams of their procedures, but. almost no data time series charts of their effects. TheHandbook of Humnn Performance Technology. Vol. 1 (Stolovitch & Keeps ,1992) contained 817 pages, 44 chapters,but only 2 data time series charts. If the 6 charts in this chapter do not get edited out, it alone displays 3 limes moredata than the whole of the earlier handbook.
FILL THE FRAME CHARTS
Just as it is easy to lie with statistics (Huff, 1954), it is easy to lie with chars unless the charts themselvesare standard. Most of us were taught to make charts by stretching our data to fill the frame of a chart. We made arectangle with number up the left side and time across the bottom. No standards were given us for what size therectangle should be, what numbers should be used up the left, or what time (minutes, days, weeks, months, or years)should be across the bottom. Most of us naturally draw a rectangle just big enough to contain our data points. Mostof us also made the numbers add up the left and across the bottom.
These fill the frame charts are what. almost all computer graphing programs make for us. The user has nocontrol over the exact. size of the chart frame, so the horizontal and vertical frame proportions cannot be set. Therange of the data values controls ttre size of the horizontal and vertical scales of the frame.
These fill the frame charts maximize seeing your data details, but make small changes in one chart look justas big as large changes in another chart. Stretching content to fill the frame makes a mouse look like just as big andmore formidable than an elephant,
A fill the frame chart with an add scale up the lefi and a fill the frame chart with a multiply scale (log tobase l0) up the left for each of six different data sets appear below. Look at them to see how the data are srerchedto fill ttre frames.
STANDARD CHANGE CHARTSTM
Ideally, performance improvement in industry should be tracked on standard charts just as our students inPrecision Teaching classrooms have done for thirty years. Some of the facts that set the stage, the features, and thebenefits of tiese standard charts follow.
Facts That Set the Stage. Five facts from three different sources set the stage for desigring sundard charts to trackperformance change.
1. Frequency can be used to track any and all performances.(Skinner, 1950).2.Every performance changes by multiplying or dividing.(Meadows. er al., I97 2).3. Ratio charts best show rate of change and percenmges.(Schmid, 1954, p. 109).4. Standard chart slopes make reading change easy.(Skinner i938).5. Self charting makes performance tracking affordable.(Skinner 1938).These five performance and charting facts were combined in designing a standard slope chart in 1965.Although committed to education, but still not entirely free from an experimental psychology background
the standard chart was first named for what we charted on it - the Standard Behavior Chart @ennypacker, Koenig, &Lindsley, 1972). Later, it becane clear that it was the slope of the chart that was standard, not the use of it. Also,users started charting many other things than behavior. Then the writer changed the name to Standard CelerationChart which is still its technical term. Frequency is up the left of the chart and the standard slope is change infrequency or celeration. Upward slopes show acceleration. Downward slopes show deceleration. Celeration had tobe coined.
Standard Change ChartrM and the Change Factor FansrM are copyrighted and are trademarks of BehaviorResearch Company for commercial use. Paper Standard Change Charts, overhead transparencies, computertemplates, and on site workshops are available fiom Behavior Research Company, PO Box 3351 , Kansas City, KS66103, Fax913-362-5900. Price lists are available at www.onlearn.com/brco.html.
Standard Change Chart Dimensions. To fit on slides, overhead screens, and standard 8 ULby l1 inch notebookpaper, the full size paper chart frame was made 8 inches wide and 5.3 inches high. To put most of a school semesteron one sheet the horizontal time add scale covered 140 days or 20 weeks. To include the full range of human dailyperformance frequency a vertical, times l0 multiply scale (base 10 log) spread from one per day (.001 per minute) to1,000,000 per day (1000 per minute).
Standard Change Chart Slopes. The chart dimension proportions also were carefully selected so that a line drawnfrom the lower left corner to the upper right corner indicates a doubling (times 2 or x2) in performance each week.This is an angle of 34 degrees. A line drawn from upper left to lower right corner of the frame shows a halving(divide by 2 or 2) of performance each week. The angles and meanings are symmetrical. Performance changinghalf as steep, going only half way up the chart in 20 weeks shows times 1.4 growth per week (an angle of 19
degrees). Performance changing twice as steep as times 2 would go all the way to the top of the chart in only l0weeks, multiplying by times 4 each week (an angle of 53 degrees). Performance changing even steeper would go allthe way up the chafi in only 5 weeks, multiplying by times 16 each week (an angle of 69 degrees).
If the proportions of these dimensions are kept standard, the SCC can be enlarged or reproduced to any sizefor presentation and publication without changing the angle and meaning of the slopes and change factors, What isstandard is the slopes and their meanings, not the physical size of the chart frames.
These chart frame dimensions and change factor angles are maintained for charts covering the differentlevels of time. The daily chart, weekly chart, monthly chart, and yearly chart all have the same proportions andsame change factor angles. This means that leaming one set of performance change factors works with any and alllevels of time and co{porate organization. The worker who has learned her daily chart easily reads and understandsher supervisor's weekly chart, her manager's monthly chart, and the yearly financials in the company annual report.
The performance decay factors are the same except they go down the chart. rather than up. This symmetrymakes it very easy to learn both growth and decay factors at once. These bench mark change factors are easilylearned by aduls in a one-day standard charting workshop. Having learners stand in the room and hold their armsout at the correct angle while repeating the factor as a leader calls out change factors at a pace of 30 per minute,
helps them rapidly feel and leam these chart slopes. First grade school children learn them in a few weeks ofcharting ten minutes a day.
Standard Self-Improvement Charting. Skinner (1938) taught his rats to produce their own standard performancefrequencies on his cumulative response recorders. The standard slopes of these records displayed performanca rateor frequency. Following this lead, precision teachers taught school children to chart their own daily performance onStandard Change Chartsru (Lindsley, 1971). The standard slopes of these charts displayed performance change orweekly learning. Plotting hits and misses on their srandard chart let each child not only rack their own dailyperformance and accuracy, but also nack their own weekly hit and miss learning @ennypacker, Koenig, & Lindsley,1972). Hit learning is independent from miss learning. When their learning slopes were shallow, the child changedsomething, or asked help from anottrer student. If nothing helped, the child called on the teacher for learning advice.
Standard Effectiveness Results. At the Morningside Academy in Seattle, and at Malcolm X College in Chicago,students chart their own performance and aim at doubling their performance each week. The results of these x2leaming aims combined with a curriculum designed to support such rapid learning permit the school to give a moneyback guarantee if students do not gain two grade levels in tieir subject matter each year (Johnson &Layng, 1992).
Standard Efficiency Results. Standard Change Charts permit comparing effects across departments and years.Workers do not have to stop and figure out each new chart. Precision Teachers have used Standard Change Charts(SCC) since 1970. A 1998 precision teacher or child in her regular elementary classroom can instantly read an SCCchart from a special education Montesori student that was made in 1970.
Standard Change Charts save precious time because they can be read in one minute. Regular standard chartsharings are held every year at the annual conference of the Association for Behavior Analysis (ABA). For over tenyears each chart. sharer was given two minutes at the overhead projector to present their chart. In 1998 the time wasreduced to one minute each with no real loss in audience comprehension. One minute is enough time to read a chartbecause all in the room are familiar with the standard chart slopes and conventions.
Standard Statistical Results. Standard Change Charts make the up bounces in data equal ttre down bounces,because frequencies bounce proportionally. Sratisticians call this "normalizing the variance." Standard ChangeCharts also make the total bounce the same size at low frequencies as at high frequencies. Statisticians call this,"equalizing the variance."
Sundard Change Charts straighten out the concave upward performance change curves that are always seenwith performance changes on add scale charts. These straight lines make it easy to project and see where theperformance will end up.
COMPARING STANDARD WITH FILL THE FRAME CHARTS
Many statisticians and managers of management information systems think when they see a Standard
Change Charr ttrat it is merely a logarithmic chart of ttre data. This is not true. To make this difference clear I have
prepa.ea six standard charts iogether with a fill the frame add chart and a fill ttre frame multiply (Log10) chart of the-same
performance data time series. Comparing these different chart views shows how Standard Change Chartsrumake it easy to read changes from performance improvement charts.
The StatViewru statistical program for both Mac and PC permits setting the exact chart frame size and
selecting the axis type and r:rnges. StatViewru is a trade mark of Abacus Concepts, Inc., Berkeley CA. Obtain
further information about StatViewru from www.s:ls.com. This program also permis making many different charts
and views of a data set without having to reenter the data. Therefore, a Standard Change Chart, a fill the frame add
scale, and a hll the frame multiply scale chart for each data set can be made. StaNiewru was used to make the
following figures. Zero Brotlers Software at [email protected] has an online course that teaches how to make
standard change charts using SntViewru for both PC and Mac platforms.
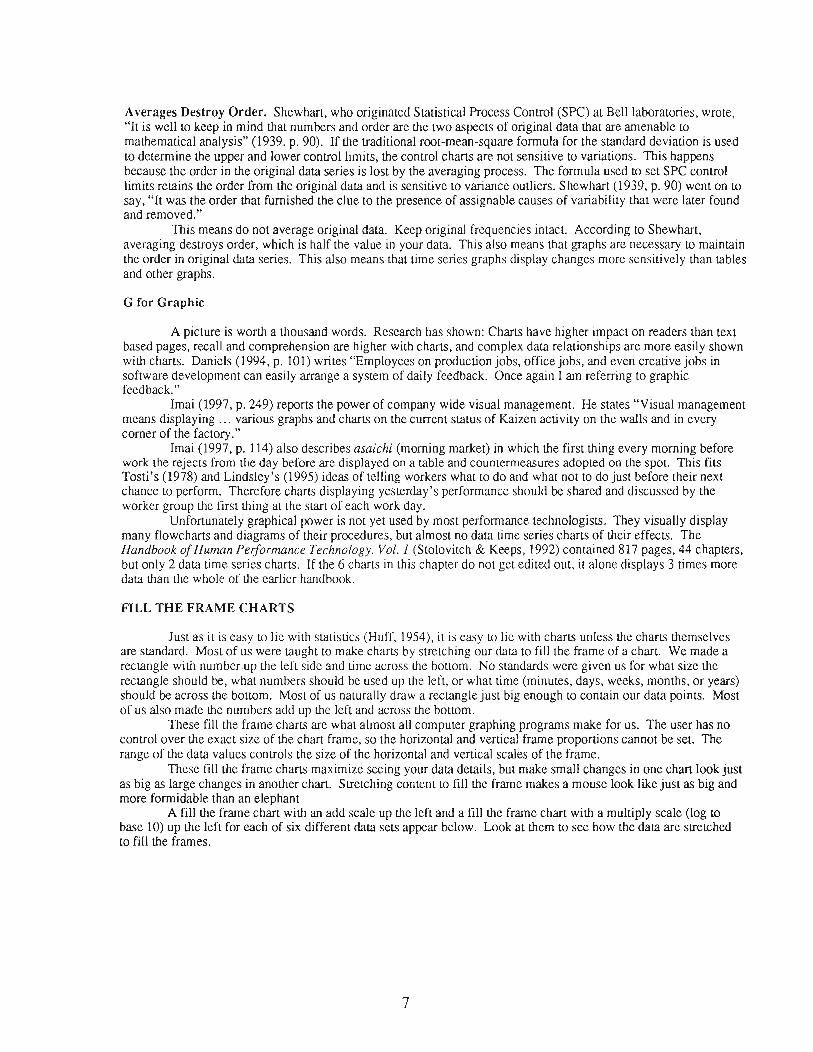
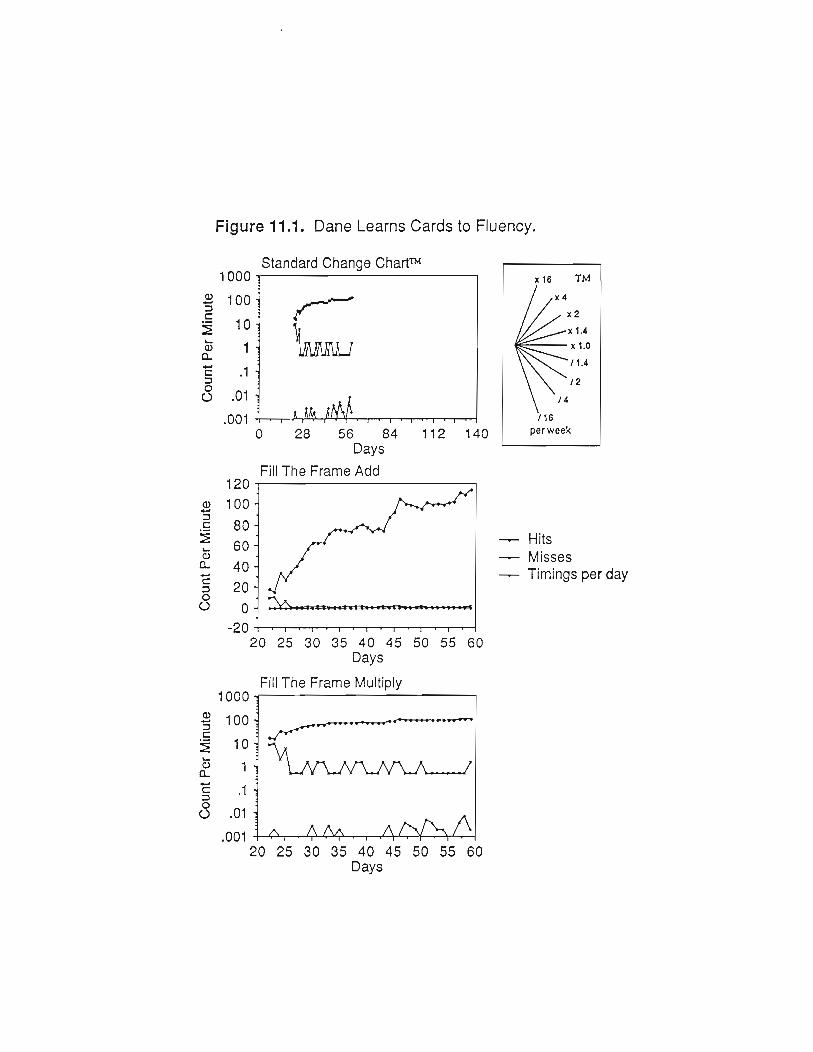
Figure 11.1. Dane Learns Cards to Fluency on Daily Chart. Here appear threecharts of Dane learning
SAfpmOS cards by practicing at least one minute each day, SAFMEDS means, "Say All Fast a Minute Each Day
Shuffled." This name was coined to make sure learners practiced saying the whole stack of 70 to 100 cards,
practiced at 50 per minute, practiced daily, and shuffled the deck after each practice (Graf, 1994).- The top view shows a Standard Change Chart with its fan of nine easy to recall change faclors in the box to
is righr To judge the amount of change in a plotted line of data, esfimate the change factor using the fan blade as
guides. Note that Dane's hits accelerated atx2 per week up to about 80 per minute. Then his his multiplied at less
ihan x1.4 per week up to his fluency of over 110 per minute. Dane's misses divided at about 16 per week going
from 1l to 0 in one week. The misses ttren bounced from 1 to 0 per minute. About 15 days he practiced more than
one one-minute timing each day in his attempts to get over 100 hits per minute. For a discussion of fluency and its
advantages read Binder 1990, 1996.Look at the fill the frame add chart in the middle frame. The counts per minute can be read clearly. But,
the leaming slope factors can not be read without calculating from ttre counts because there is no change factor fan
and the one at the top right only applies to standard change charts'
tnoking at the fill the frame multiply chart in the bottom frame does not help either.
10
Standard Change ChartN
rf\-r.t
Figure 11.1. Dane Learns Cards to Fluency.
0)f
=0)(L
LJoo
0):f
._c
a)o-C:to
C)
0)J
=c)L
5oo
1 000
100
10
1
.1
.01
.001
120100
80
60
40
20
0
-20
1 000
100
10
1
.1
.01
.001
0285684Days
FillThe Frame Add
112 140
HitsMissesTimings per day
20 25 30 3s 4A 45Days
FillThe Frame MultiplY
40 45Days
50 55 60
x2
x 1.4
x .l,0
t 1.4
t2
l4
per week
20 25 30 35 50 55 60

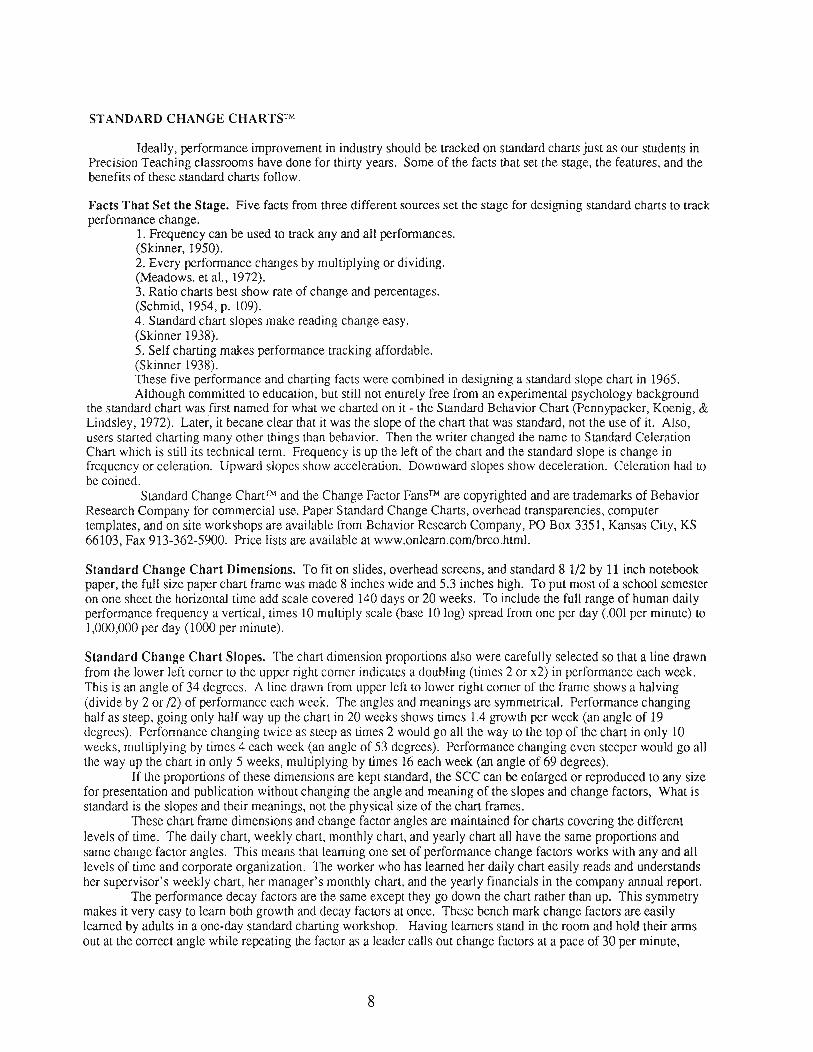
Figure 11.2. Davis Learns Cards Not Fluent on Daily Chart Here appear the three chars of Davis leamingSAFMEDS cards using the same cards and following the same instructions as Dane had received. Both Dane andDavis were students in Graf's 1997 Psychology Class at Youngstown State University. Note from the top StandardChange Chart that Davis' hits accelerated at a little less than xl.4 per week for about 75 days, Then for about 20days they leveled off at 25 to 28 per minute with no acceleration (xl per week). Note also that Davis' missesbounced along at I to 4 per minute. He only practiced one one-minute timing a day throughout. Perhaps Davis didnot practice more because he was happy with the C grade this frequency would earn him.
Note that in comparing Dane's and Davis' fill the frame add charts not much difference is seen withoutreading the numbers on the charts vertical axes. Their fill the frame multiply charts also do not look very differentwithout reading the axis numbers.
11
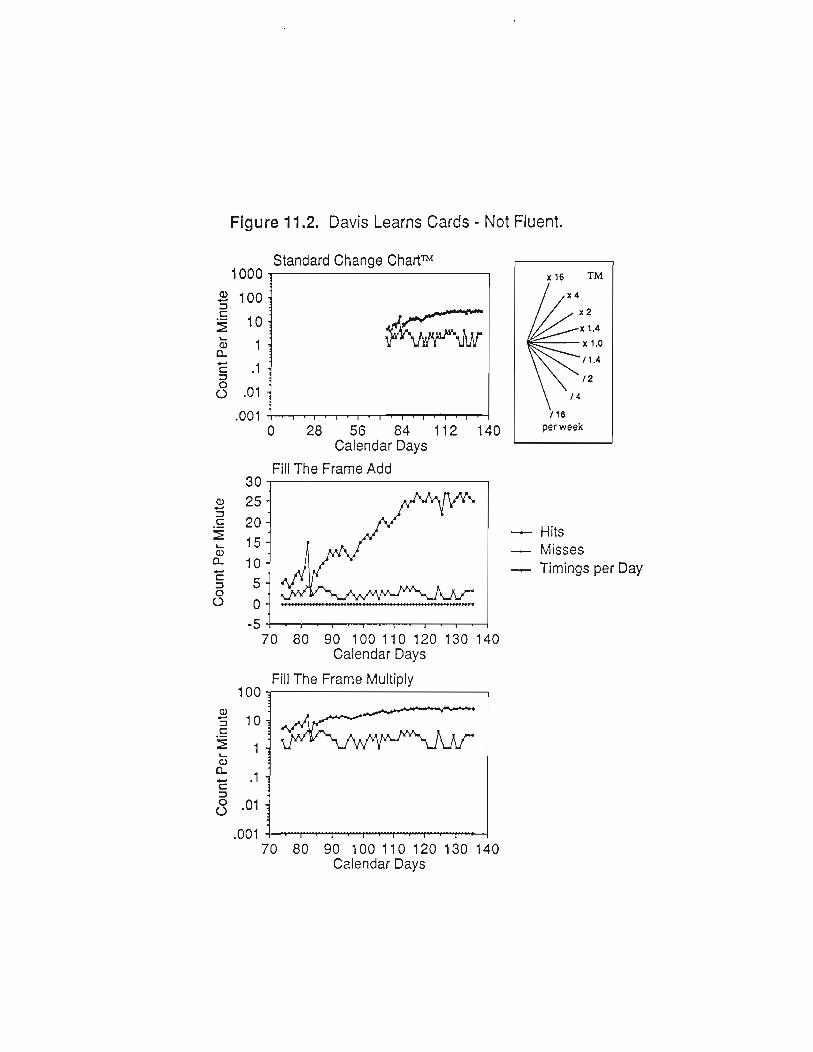
Figure 11.2. Davis Learns Cards - Not Fluent.
oJ
.E
0)o-Lfo()
6)J
.g
0)o-c5oO
c)f
=0)o-gJoO
1 000
100
10
1
.1
.01
.001
3025
20
15
10
5
0
-5
100
10
1
.1
.01
.001
Standard Change ChartN
0 28 56 84 112 140Calendar Days
FillThe Frame Add
HitsMissesTimings per Day
70 80 90 100 110 120 130 140Calendar Days
FillThe Frame Multiply
70 80 90 100 110 120 130Calendar Days
140
x4
x21.4
x 1,0
t 1.1
t2
per week
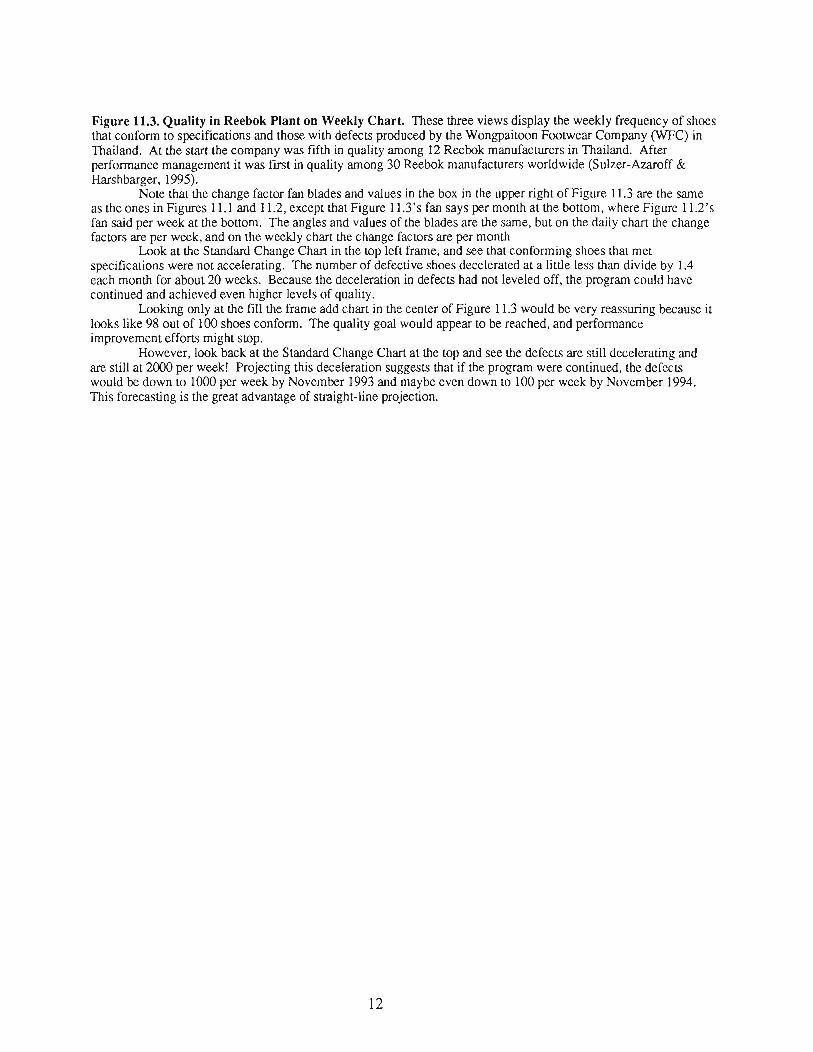
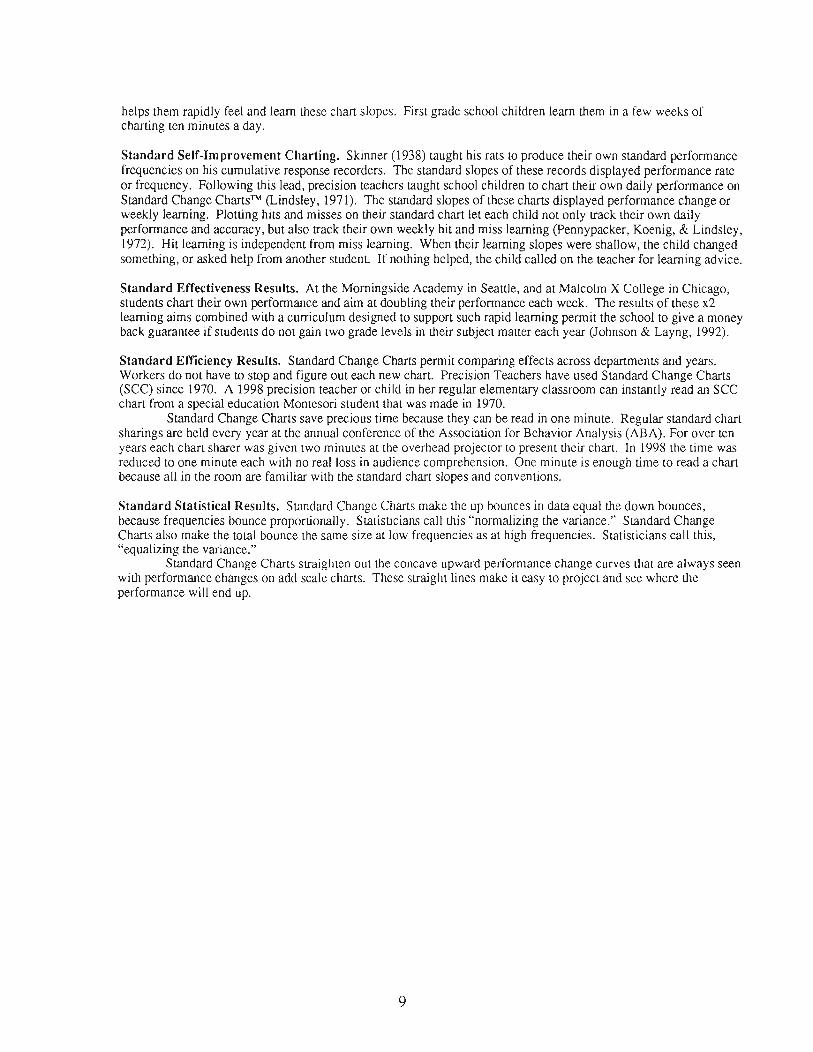
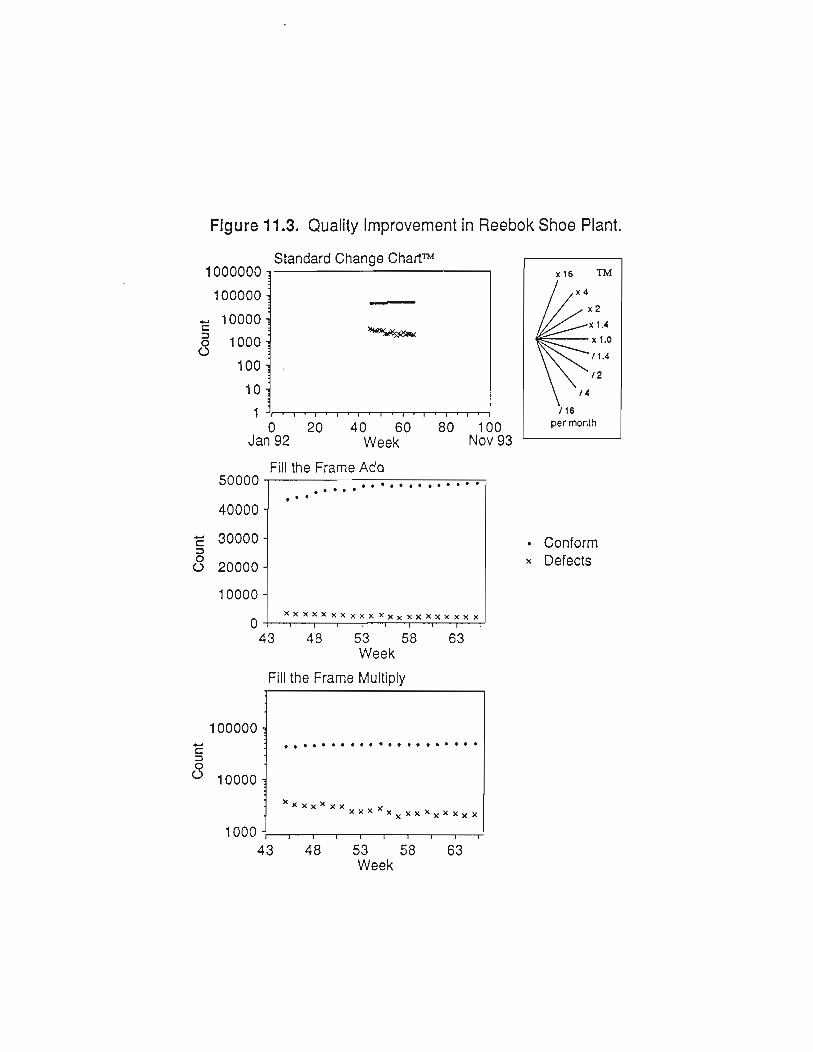
Figure 11.3. Quatity in Reebok Plant on Weekly Chart. These three views display the weekly frequency of shoes
that conform to specifications and those with defects produced by the Wongpaitoon Foonvear Company (WFC) inThailand. At the srart the company was fifth in quality among 12 Reebok manufacturers in Thailand. Afterperformance management it was first in quality among 30 Reebok manufacturers worldwide (Sulzer-Azaroff &Harshbarger, 1995).
Note that the change factor fan blades and values in the box in the upper right of Figure I 1.3 are the same
as the ones in Figures I1.1 and 11.2, except that Figure I 1.3's fan says per month at the bottom, where Figure 11.2's
fan said per week at the bottom. The angles and values of the blades are the same, but on the daily chart the changefactors are per week, and on the weekly chart the change faclors are per month
look at ttre Standard Change Chart in the top left frame, and see that conforming shoes that met
specifications were not accelerating. The number of defective shoes decelerated at a little less than divide by 1.4
each month for about 20 weeks. Because the deceleration in defects had not leveled off, the program could havecontinued and achieved even higher levels of quality.
Looking only at the fill the frame add chart in the center of Figure 11.3 would be very reassuring because itlooks like 98 out of 100 shoes conform. The quality goal would appear to be reached, and performanceimprovement efforts might sop.
However, look back at the Standard Change Chart at the top and see the defects are still decelerating andare still at 2000 per week! Projecting this deceleration suggests that if the program were continued, the defectswould be down to 1000 per week by November 1993 and maybe even down to 100 per week by November 1994.
This forecasting is the great advantage of straight-line projection.
12
Standard Change Chartnt
Figure 11.3. Quality lmprovement in Fleebok Shoe Plant.
coo
1 000000
1 00000
1 0000
1 000
100
10
1
0204060Week
80 100Nov 93Jan 92
50000
40000
30000
20000
1 0000
0
1 00000
1 0000
1 000
Fillthe Frame Add
xx xXX xx XxX XXr XX XXX XX X
43 48 53 58Week
53 58 63Week
. Conformx Defects
cJoo
48
Fillthe Frame Multiply
43
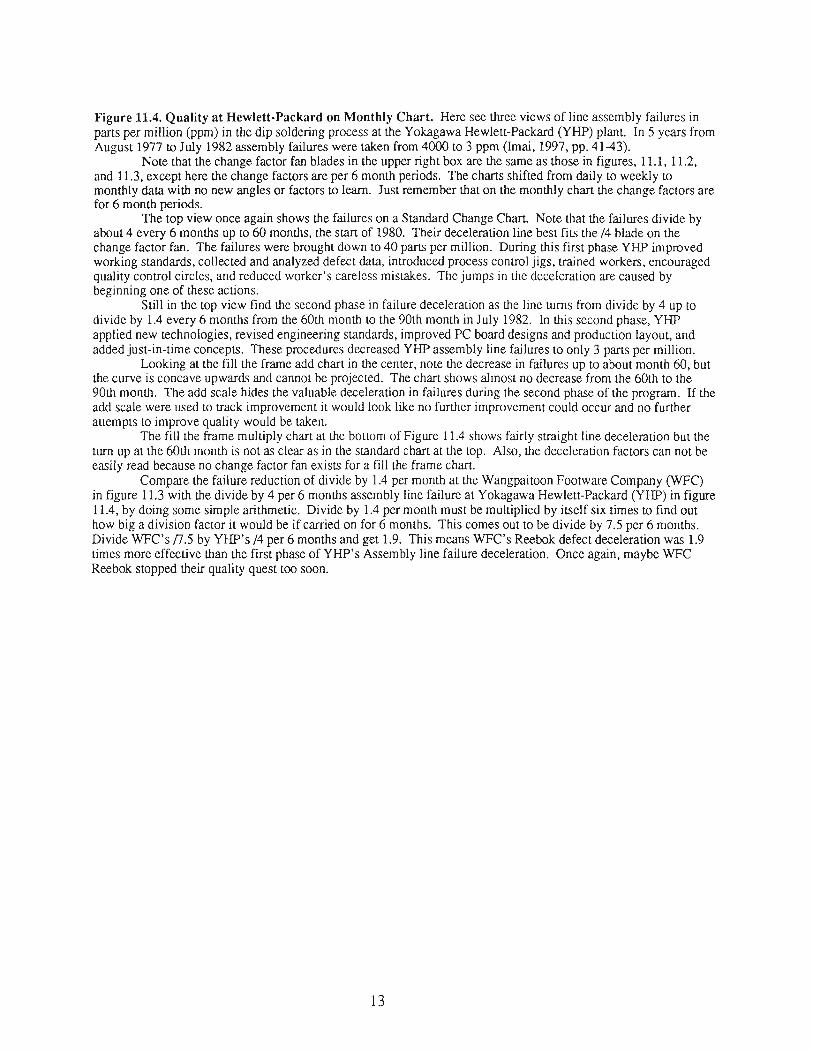
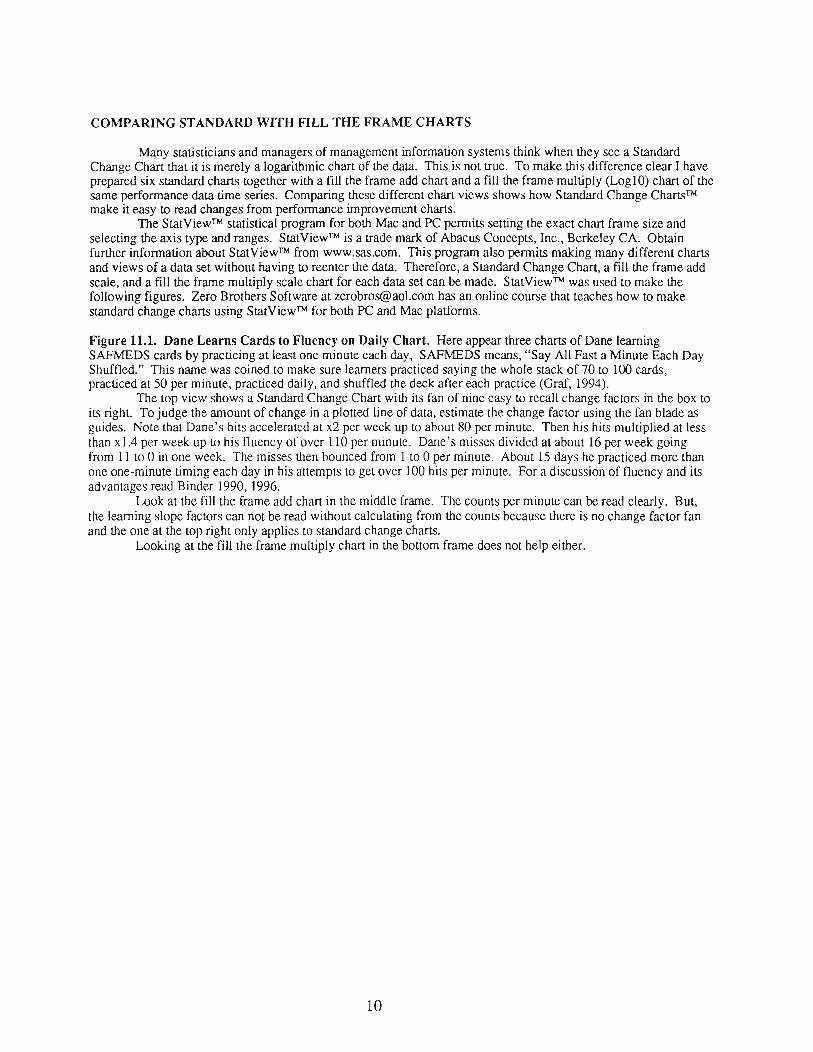
Figure 11.4. Quality at Hewlett-Packard on Monthly Chart. Here see tJree views of line assembly tailures inpans per million (ppm) in the dip soldering process at the Yokagawa Hewlett-Packard (YHP) plant. In 5 years fromAugust 1977 tn July 1982 assembly failures were taken from 4000 to 3 ppm (Imai, 1997, pp.4143).
Note that the change factor fan blades in the upper right box are t}te same as those in figures, 11.1, 11.2,and I 1.3, except here the change factors are per 6 month periods. The charts shifted from daily to weekly omonthly daa with no new angles or factors to learn. Just remember that on the montlrly chart the change factors arefor 6 month periods.
The top view once again shows the failures on a Standard Change Chart. Note that the failures divide byabout 4 every 6 monlhs up !o 60 months, the start of 1980. Their deceleration line best fits the /4 blade on thechange factor fan. The failures were brought down to 40 parts per million. During this fint phase YHP improvedworking standards, collected and analyzed defect data, introduced process control jigs, trained workers, encouragedquality control circles, and reduced worker's careless mistakes. The jumps in the deceleration are caused bybeginning one of these actions.
Still in Ore top view find the second phase in failure deceleration as the line turns from divide by 4 up todivide by 1.4 every 6 months from the 60th month to the 90th month in July 1982. In this second phase, YHPapplied new technologies, revised engineering standards, improved PC board designs and production layout, andadded just-in-time concepts. These procedures decreased YHP assembly line failures to only 3 parts per million.
Looking at the fill the frame add chart in the center, note the decrease in failures up to about month 60, butthe curve is concave upwards and cannot be projected. The chart shows almost no decrease from the 60th to the90th month. The add scale hides the valuable deceleration in failures during the second phase of the program. If theadd scale were used to track improvement it would look like no further improvement could occur and no furttrerattempts !o improve quality would be taken.
The fill the frame multiply chart at the bottom of Figure I 1.4 shows fairly straight line deceleration but theturn up at the 60th month is not as clear as in the standard chart at the top. Also, the deceleration factors can not beeasily read because no change factor fan exists for a fill the frame chart.
Compare the failure reduction of divide by 1.4 per month at the Wangpaitoon Footware Company (WFC)in figure 11.3 with ttre divide by 4 per 6 months assembly line failure at Yokagawa Hewlett-Packard (YHP) in figure11.4, by doing some simple arithmetic. Divide by 1.4 per month must be multiplied by iself six times to find outhow big a division factor it would be if canied on for 6 months. This comes out to be divide by 7.5 per 6 months.DivideWFC's 17.5by YHP's 14per6monthsandget 1.9. ThismeansWFC'sReebokdefectdecelerationwas 1.9times more effective than the first phase of YHP's Assembly line failure deceleration. Once again, maybe WFCReebok stopped tireir quality quest too soon.
13
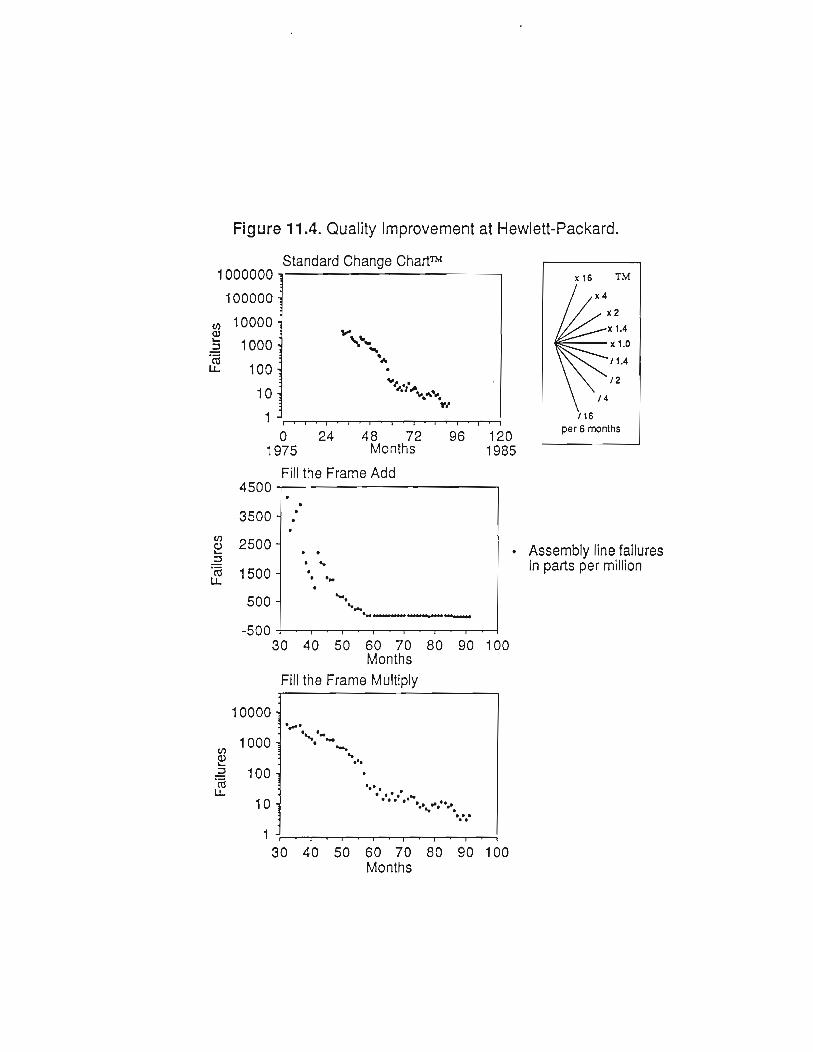
Figure 11.4. Quality lmprovement at Hewlett-Packard.
Standard Change Chartft
u,o_='6TL
1 000000
1 00000
1 0000
1 000
100
10
1
4500
3500
2500
1 500
500
-500
1 0000
1 000
100
10
1
96 1201 985
x2
x 1.4
x 1.0
t 1.1
t2
/ 16
per 6 months
-\r-
'1
Atfr".^r,it
02448721975 Months
oo)L5'6tL
Assembly line failuresin parts per million
30 40 50 60 70Months
Fillthe Frame MultiplY
30 40 50 60 70 80 90 100Months
B0 90 100
th0)f'6LL
ttttttttt
-... .. .r*rr,aaaaa
Fillths Frame Add
aa
a
.rsry*
Figure 11.5. Sexual Harassment Prevention on Monthly Chart. These three views show the number of formalinternal complaints of sexual harassment in Healthcare, Inc., a large hospitai chain (Hill & Phillips, 1997). A sexual
harassment prevention workshop conducted during the month of October is indicated by the arrow on each chartview.
The standard change factor fan for monthly charts is in tlre upper right box. The Standard Change Chart at
the top shows the formal internal complaints multiplying by less than the xl.4 fan blade and more than the x1.0blade at an estimated facmr of about times 1.1 every 6 months. After the prevention workshop the complaintsdecelerated at divide by 2 with a slight turn up at the end. The turn up means the effect may have worn off in one
year and ttrey should probably have conducted another prevention workshop. Also, the high turnover in healthcare
staff gives another reason to repeat this effective workshop. Although not as steep as ttre divide by 4 per 6 months
of failures by Yokagawa Hewlett-Packard shown in Figure i 1.4, this harassment deceleration of divide by 2 is halfas big and not so bad for a single prevention workshop.
The deceleration in formal intemal harassment complaints shown in the fill the frame add chart in the
middle, and the fitl ttre frame multiply chart at the bottom show more detail and exaggerate the workshop effect, butmake it almost impossible to compute ttre change factors. The fill the frame charts also make it look like the
harassment deceleration was as steep as the assembly line failure deceleration in Figure I 1.4.
14
Figure 11.5. Sexual Harassment - Formal Complaints.
Standard Change Chartru
oo
1 000000
1 00000
1 0000
1 000
100
10
1
65
55
45
35
25
15
?96 120
2000
16
02448721991 Months
Fillthe Frame Add
c=oO
aaa ttt '
ll
II
55 60 65 70 75 80 8sMonths
55 60 65 70 75 80 85Months
. Formalcomplaints
tPreventionworkshop
Fillthe Frame Multiply
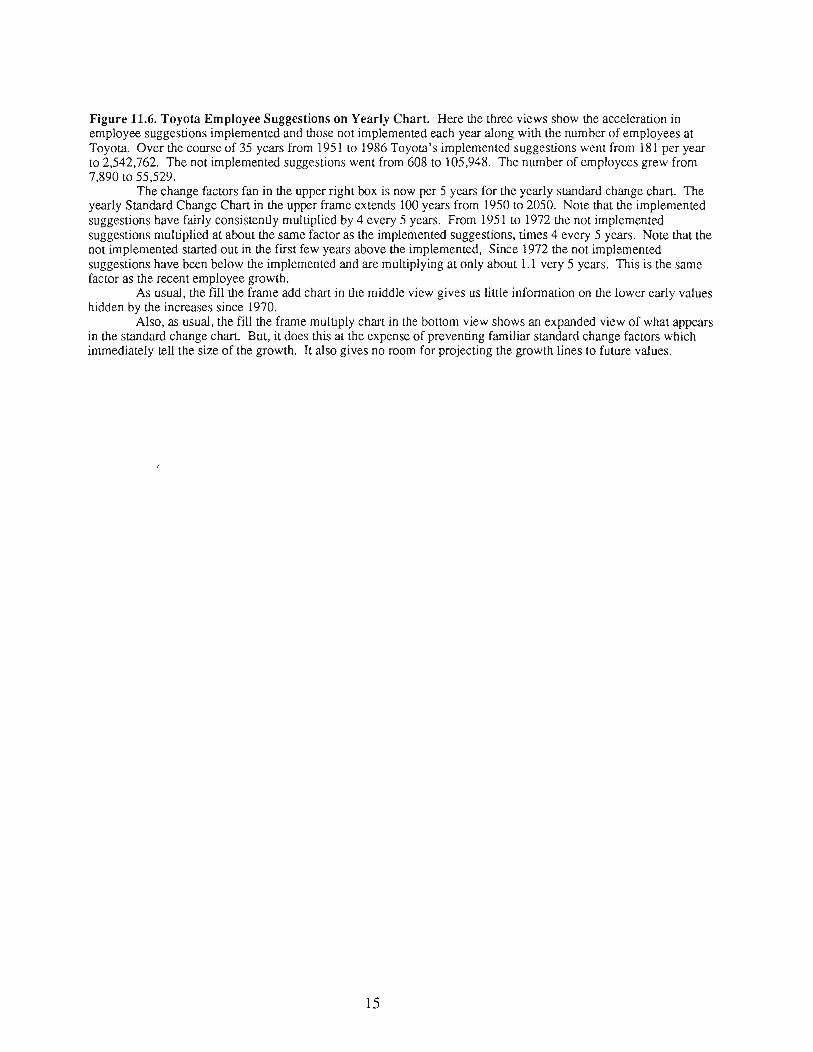
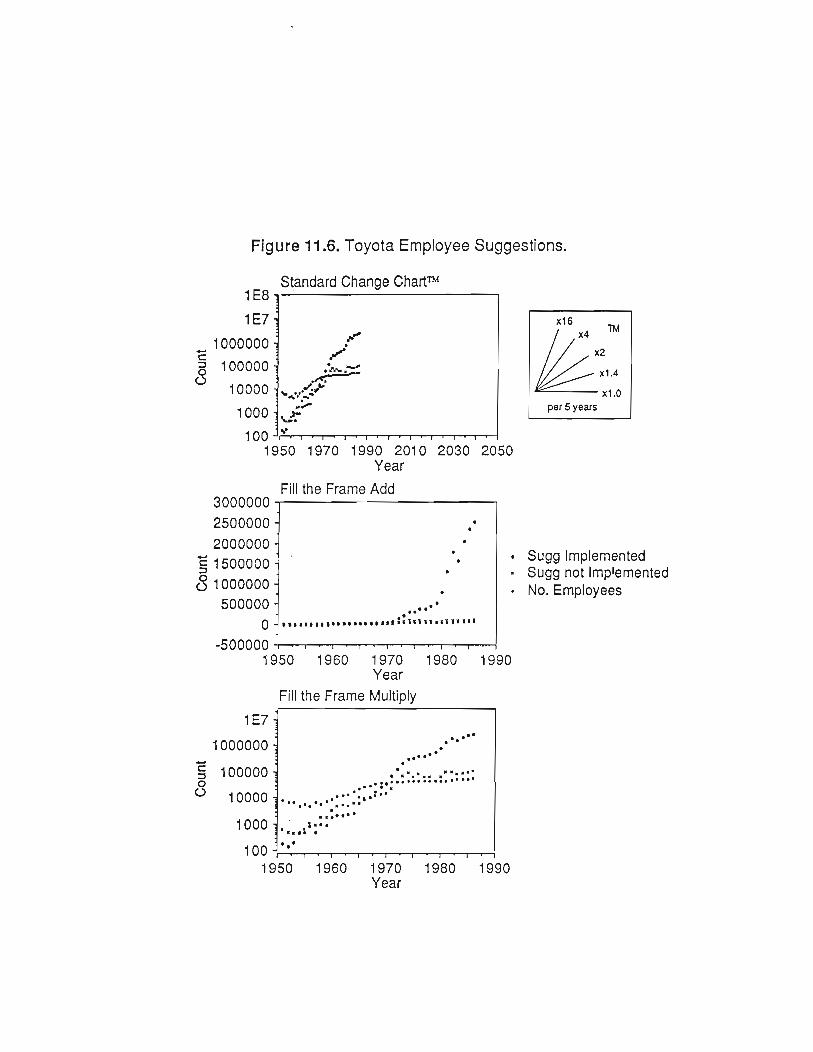
Figure 11.6. Toyota Employee Suggestions on Yearly Chart. Here the three views show the acceleration inemployee suggestions implemented and those not implemented each year along with the number of employees atToyota. Over the course of 35 years from 1951 to 1986 Toyota's implemented suggestions went from 18l per year
to2,542,762. The not implemented suggestions went from 608 to 105,948. The number of employees grew from7,890 to 55,529.
The change factors fan in the upper right box is now per 5 years for the yearly standard change chart. Theyearly Standard Change Chart in the upper frame extends 100 years from 1950 to 2050. Note that the implementedsuggestions have fairly consistently multiplied by 4 every 5 years. From 1951 to 1972 the not implementedsuggestions multiplied at about tle same factor as the implemented suggestions, times 4 every 5 years. Note that thenot implemented started out in the first few years above the implemented, Since 19'12 he not implementedsuggestions have been below the implemented and are multiplying at only about 1. I very 5 years. This is the same
factor as the recent employee gowth.As usual, the fill t}re frame add chart in the middle view gives us little information on the lower early values
hidden by the increases since 1970.Also, as usual, the fill the frame multiply chart in the bottom view shows an expanded view of what appears
in the standard change chart. But, it does this at the expense of preventing familiar standard change facton whichimmediately tell the size of the growth. It also gives no room for projecting the growth lines to future values.
15
Standard Change Chartru
Figure 11.6. Toyota Employee Suggestions.
1E8
1E7
1 000000
3000000
2500000
2000000
! rsooooo
6 roooooo500000
0
-500000
itu ,o TM
h':r"per 5 years
19s0 1970 1990 2010 2030 2050Year
Fillthe Frame Add
aattt'
I tt ara rr 1...r t..,, t'r !i ttl rr trl tl rrl
Sugg lmplementedSugg not lmplementedNo. Employees
1 950 1 960
1950 1960 1970Year
1 970 1 980Year
1 980
1 990
Fillthe Frame MultiplY
1 990
PERFORMANCE TRACKING JOB AID
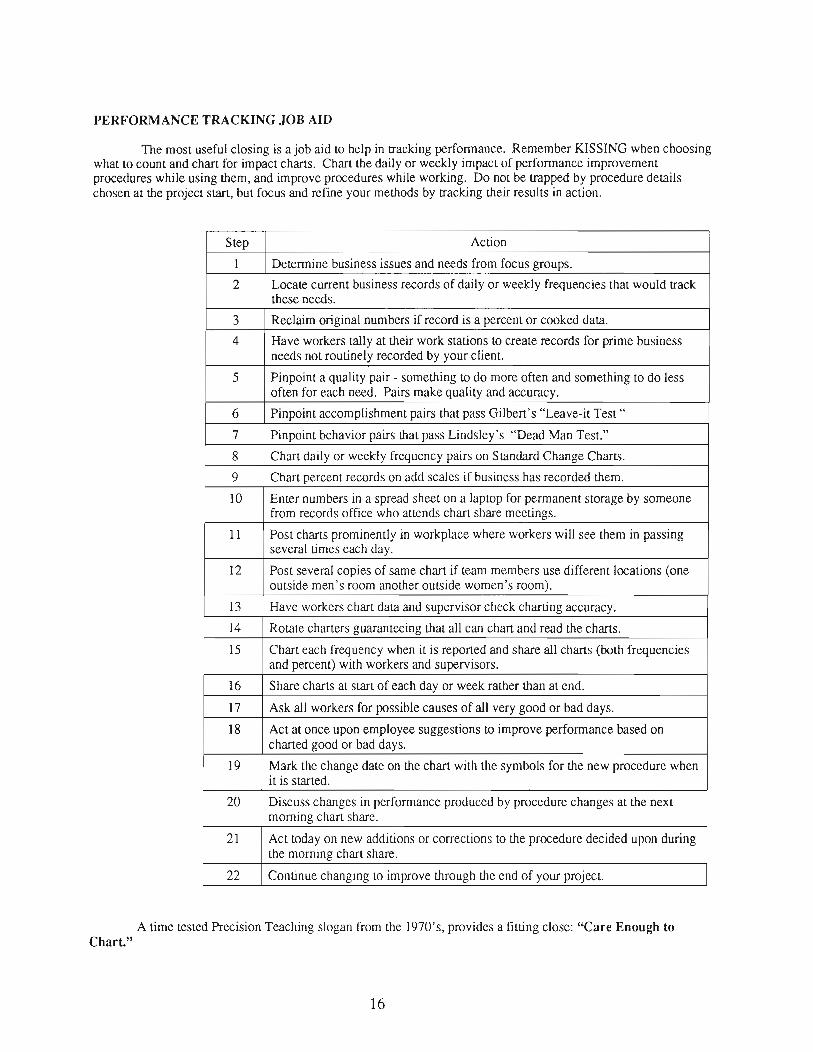
The most useful closing is a job aid to help in racking performance. Remember KISSING when choosingwhat to count and chart for impact charts. Chart the daily or weekly impact of performance improvementprocedures while using them, and improve procedures while working. Do not be trapped by procedure detailschosen at the project start, but focus and refine your metiods by nacking their results in action.
Step Action
Determine business issues and needs from focus groups.
2 Locate current business records of daily or weekly frequencies that would rackthese needs.
J Reclaim original numbers if record is a percent. or cooked data.
4 Have workers tally at their work stations to create records for prime businessneeds not routinely recorded by your client.
5 Pinpoint a quality pair - something to do more often and something to do lessoften for each need. Pairs make quality and accuracy.
6 Pinpoint accomplishment pairs that pass Gilbert's "Leave-it Test "
Pinpoint behavior pairs that pass Lindsley's "Dead Man Test."
8 Chart daily or weekly frequency pairs on Standard Change Charts.
9 Chart percent records on add scales if business has recorded them.
10 Enter numbers in a spread sheet on a laptop for permanent storage by someonefrom records office who attends chart share meetings.
1l Post charts prominently in workplace where workers will see them in passingseveral times each day.
t2 Post several copies of same chart if team members use different locations (oneoutside men's room another outside women's room).
l3 Have workers chart data and supervisor check charting accuracy.
t4 Rolate charters guaranteeing that all can chart and read the charts.
l5 Chart each frequency when it is reported and share all charts (both frequenciesand percent) with workers and supervisors.
L6 Share charts at stail of each day or week rather than at end.
T7 Ask all workers for possible causes of all very good or bad days.
18 Act at once upon employee suggestions to improve performance based oncharted good or bad days,
l9 Mark the change date on the chart with the symbols for the new procedure whenit is srarted.
20 Discuss changes in performance produced by procedure changes at the nextmoming chart share.
21 Act today on new additions or corrections to the procedure decided upon duringthe morning chart. share.
22 Continue changing to improve through the end of your project.
A time tested hecision Teaching slogan from the 1970's, provides a fitting close: "Care Enough toChart."
I6
REFERENCES
Binder, C. V. (1990, September). Closing the confidence gap. Training,49-56.Binder, C. (1996) Behavioral fluency: Evolution of a new paradigm. The Behavior Analyst, 19(2),163-198.Brethower, D., & Smalley, K. (1998). Performnnce-based instruction: Linking taining to business reszlts. San
Francisco: Jossey-Bass PfeifferDaniels, A. C. (1994). Bringing out the best in people. New York, N.Y. McGraw-Hill, Inc. 208 Pages.Dean, P. J. (Ed.). (1994). Performance engineering at work. Batavia, IL: International Board of Standards for
Training, Performance, & Instruction.Dickelman, G. J. (1998). Defending human atributes in the pursuit of performance-centered design: An interview
with Donald A. Norman. P e rfo rmanc e I mpr oveme nt, 3 7 (4), 34 -3'7 .
Esque, T. J., & Patterson. P. A. (Eds.). (1998). Getting results: Case studies in performance imnprovement.Amherst, MA: HRD Press. Inc. & International Society for Performance Improvement.
Fuller, J. (1991). Managing performance improvement projects. Washington, D. C.: Intemational Society forPerformance Improvem ent: San Franc isco: Jossey-B ass/Pfeiffer.
Graf,S. A. (L994). Howtodevelop,produce,anduseSAFMEDSineducationandtraining. Poland,OH:ZeroBrothers Software.
Hill, D., & Phillips, J. J. (1997). Healthcare, Inc. In J. J. Phillips (Ed.), /n action: Measuring return on investment,Vol.2 Alexandria, VA: American Society for Training and Development.
Holzschuh, R. D. (1965) . Superioriry of rate correct over percent correct Unpublished manuscript, EducationalResearch, University of Kansas Medical Center.
Huff, D. (1954). How to lie with statistics. New York: W. W. Norton.Imai, M. (1997). Gemba Kaizen: A commonsense,low cost approach to management. New York: McGraw-Hill.Indusry Report. (1996). Training,33(10).Johnson, K. R., & Layng, T. V. J. (1992). Breaking the structualist barrier: Literacy and numeracy with fluency.
Americ an P sy c hol o gist, 47 (l l), 147 5 - 1490.Kirkpatrick, D. L. (1994) . Evaluating training programs: The four levels. San Francisco: Berrett-Koehler
Publishers.Lindsley, O. R. (1971). Precision Teaching in perspective: An interview with Ogden R. Lindsley, Ann Duncan
interviewer. Teaching Exceptional Children, 3(3), I 14-l 19.Lindsley, O. R. (1991). From technical jargon to plain English for application. Journal of Applied Behavior
Analysis, 24,449-458.Lindsley, O. R. (1994). Dangers of percent and how to avoid them. Lawrence, KS: Behavior Research Company.Lindsley, O. R. (1995). Do, Don't, How; and Did, Didnt, Why? Perfornwnce & Instruction,34(2),23-27.Lindsley, O. R. (1997a). Performance is easy to monitor and hard to measure. In R. Kaufman, S. Thiagarajan, & P.
MacGillis (Eds.). The guidebook for performance improvement: Working with individuals and organizations.(pp.5l9-559). San Franciso, CA: Pfeiffer, Jossey-Bass.
Lindsley, O. R. (1997b). hecise instructional design.: Guidelines from Precision Teaching. In C. R. Dills & A J.Romiszowski (Eds), Instructional development paradigms (pp.537-55a). Englewood Cliffs, NJ: EducationalTechnology Publications.
Meadows, D. H., Meadows, D. L., Randers, J., & Behrens, W. W. (1972). The limits to growth. New York:Universe Books.
MEASURIT. (i996) Tracking training impact. Shawnee Mission, KS: MEASURIT.Mager, R. F. (1986). The how to write a book book. Carefree, AZ: Mager Associares, Inc.Miller, G. A. (1956). The magical number seven plus or minus two: Some limits on our capacity for processing
information. P sy c ho lo gical Review, 6 3, 8l -97 .
Parker, M., & Leinhardt, G. (1995). Percent: A privileged proportion. Review of Educational Research,65(4),42I-481.
Pennypacker, H. S., Koenig, C. H., & Lindsley, O. R. (1972). Handbook of the standard behavior chart.KansasCity, KS: Precision Media.
Phlllips, J. J. (Ed.). (1994) In action: Measuring return on investment, Vol.l . Alexandria, VA: American Societyfor Training and Development.
Phlllips, J. J. (Ed.). (1997) In action: Measuring return on inveslment,Vol.2. Alexandria, VA: American Societyfor Training and Development.
Ries, A. & Trout, J. (1993). The 22 immutable laws of change: Violate them at your own risk! New York:HarperCollins Publishers.
Schmid, C. F. (1954). Handbook of graphic presentation. New York: Ronald Press.
t7
Shewhart. W. A. (1939). Statistical nnthodsfrom the viewpoint of qualiry control. Washngrton, DC: GraduateSchool, Department of Agriculture; reprint edition, 1986, New York: Dover.
Skinner, B. F. (1938) . The behavior of organisms. New York: Appleton-Century-Crofts.Skinner, B. F. (1950). Lecture in Pro-Seminar in General Psychology, Psychology 201a, Harvard University, 27
November,4 and I I December 1950Skinner, B. F. (1969) . Contingencies of reinforcement: A theoretical analysis. New York: Appleton-Century-
Crofts.Spitzer, D. R. (1998, May). Super-Evaluation: A new paradigmfor increasing the results you get from taining.
Paper presented at the meeting of the Kansas City Chapter of The International Society for PerformanceImprovement.
Stolovitch, H. D. &, Keeps, E. J. (1992). @ds). Handbook of human performance technology. San Francisco,Jossey-Bass.
Sulzer-Azarofl B., & Harshbarger, D. (1995). Putting fear to flight. Qualiry Progress,2S(I2),61-65.Tosti, D. T. (1978). Formative feedback. NSPI Journal, 19,19-21.
BRIEF BIOGRAPHY OF AUTHOR
Ogden R. Lindsley is President and Founder of Behavior Research Company, provider ofperformance tracking and change charting materials and systems to schools and corporationssince 1960. A 1957 Skinner Ph.D. from Harvard, he founded the first human operant laboratory,coined "Behavior Therapy," was President of the Association for Behavior Analysis, and is aKansas University Professor Emeritus. He developed Precision Teaching and Standard ChangeCharting. Ogden received the Thomas F. Gilbert Distinguished Professional AchievementAward from the International Society for Performance Improvement in 1998. Website atWWW.onlearn. com,/lindsleybio.html Reach Og at Olindsley@ aol.com.
18