Traffic-Related Air Pollution: A Moving Target...Traffic-Related Air Pollution: A Moving Target...
26
Traffic-Related Air Pollution: A Moving Target Jeffrey R. Brook Environment and Climate Change Canada University of Toronto Health Effects Institute 2018 Annual Conference Chicago
Transcript of Traffic-Related Air Pollution: A Moving Target...Traffic-Related Air Pollution: A Moving Target...

Traffic-Related Air Pollution: A Moving Target
Jeffrey R. Brook Environment and Climate Change Canada
University of Toronto
Health Effects Institute 2018 Annual Conference
Chicago

Page 2 – 9 mai 2018
A Target that moves in time and space
On multiple scales

Black carbon trend – last half century 1950s
2000s
1963 Clean Air Act
1965 Motor Vehicle Air Pollution Control Control Act (1968)
1970 Clean Air Act
Kirchstetter et al, Atmos Environ (AE), 2017
Page 4 – 9 mai 2018
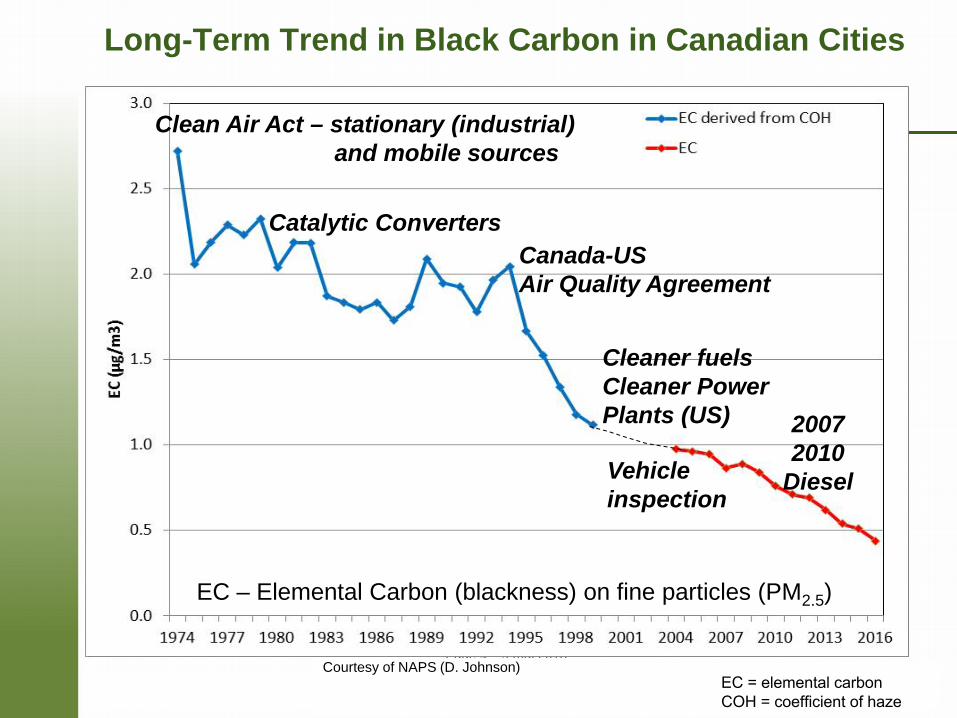
Long-Term Trend in Black Carbon in Canadian Cities
Clean Air Act – stationary (industrial) and mobile sources
Canada-US Air Quality Agreement
Catalytic Converters
Cleaner fuels Cleaner Power Plants (US) 2007
2010 Diesel
EC – Elemental Carbon (blackness) on fine particles (PM2.5)
Vehicle inspection
Courtesy of NAPS (D. Johnson) EC = elemental carbonCOH = coefficient of haze

Page 5 – 9 mai 2018
Mobile labs can bring much detail
• Resolve the spatial pattern in the urban background concentrations• Within and between neighborhood/grid variations• Isolate local hotspots, survey unmonitored areas
Long-range transportContribution from surrounding region
Contribution from the urban area
local hot spots (traffic, industrial, burning, etc.)
CRUISER

Page 6 – 9 mai 2018
Recent Mixtures (Montréal 2009) NO2 PNC BC
Summer Winter
Levy et al. Environ Health Perspect 2014 NO2 = nitrogen dioxidePNC = Particle number concentrationBC = black carbonUFP = ultrafine particles
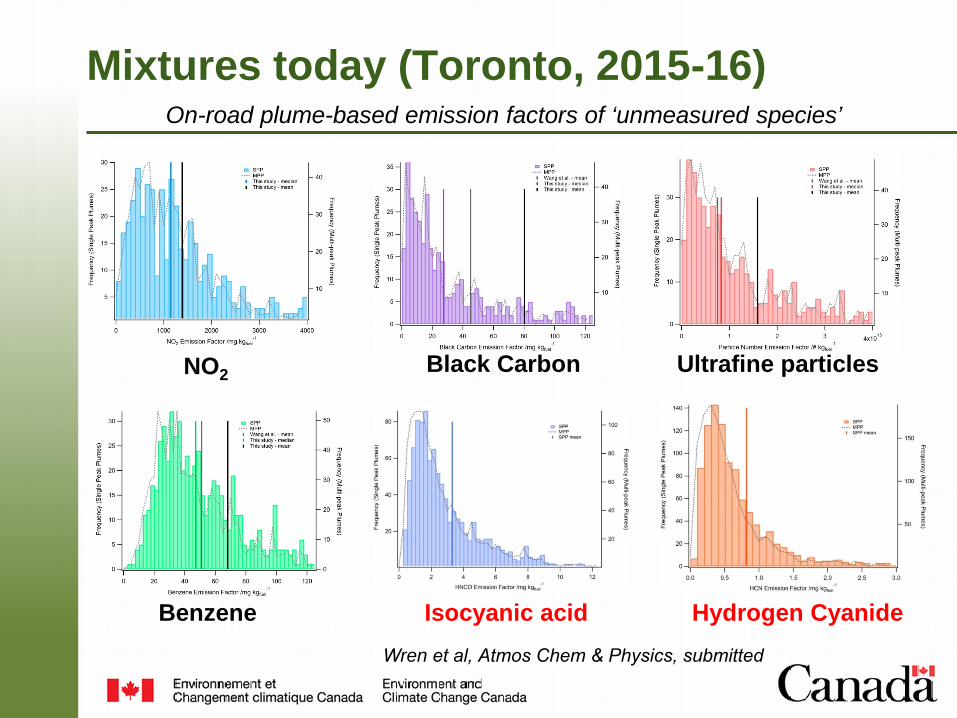
Mixtures today (Toronto, 2015-16)
NO2 Black Carbon Ultrafine particles
Benzene Isocyanic acid Hydrogen Cyanide
On-road plume-based emission factors of ‘unmeasured species’
Wren et al, Atmos Chem & Physics, submitted

Page 8 – 9 mai 2018
region covered by CRUISER
Toronto and
Lake Ontario
Benzene at Intermodal Freight Hubs
-0.1
0.1
0.3
0.5
0.7
0.9
1.1
1.3
1.5
123456789101112131415161718192021
95th Percentile50th PercentileMean5th Percentile
A local hotspot
Air pollution coming in
W E
Ben
zene
(ppb
)
Joe et al., Bul Am. Met Soc., 2018

Page 9 – 9 mai 2018
California Goods Movement Policy
Su et al. ES&T 2017
21 ppb
12 ppb 10 ppb
4 ppb
5 ppb
5 ppb
NO2:1.3 ppb
NOx:10.2 ppb
vs. control areas

Page 10 – 9 mai 2018
Effect of DPF on Vascular Function
Lucking et al., Circulation, 2011 DPF = diesel particulate filter

Page 11 – 9 mai 2018
Toronto and Vancouver Near Road Network
NAPS 60430: 167 m 401 NR Station <10 m
400,000 AADT
Port
AADT = annual average daily trafficNR = near-roadNAPS = National Air Pollution Surveillance

Page 12 – 9 mai 2018
Vancouver – Toronto NO and NO2 Near Road Site Comparisons
Data courtesy of NAPs (D. Herod et al.)

Page 13 – 9 mai 2018
Vancouver – Toronto Black Carbon Near Road Site Comparisons
NR-TOR-1 WeekendNR-VAN Weekend
0.0
0.5
1.0
1.5
2.0
2.5
3.0
3.5
4.0
0.0
0.5
1.0
1.5
2.0
2.5
3.0
3.5
4.0
1 3 5 7 9 11 13 15 17 19 21 23
BC
(µg/
m3 )
Clark (Vancouver)
401 (Toronto)
Near road
Local background
NR-TOR-1 WeekdayNR-VAN Weekday
Data courtesy of NAPs (D. Herod et al.)

Page 14 – 9 mai 2018
Toronto and Vancouver Near Rd Network
400,000 AADT
Port
NAPS 60430: 167 m 401 NR Station <10 m
AADT = annual average daily trafficNR = near-roadNAPS = National Air Pollution Surveillance

Page 15 – 9 mai 2018
U.S. Near-road network observations
DeWinter et al. Atmos. Env. 2018
AADT Range of traffic counts 75-320 (x103)
Range of monitoring site distances to road 2-50 m
2014-15
AADT = annual average daily traffic

Page 16 – 9 mai 2018
Exposure vs. fleet characteristics
Jon Wang, U Toronto PhD Thesis 2018
Page 17 – 9 mai 2018
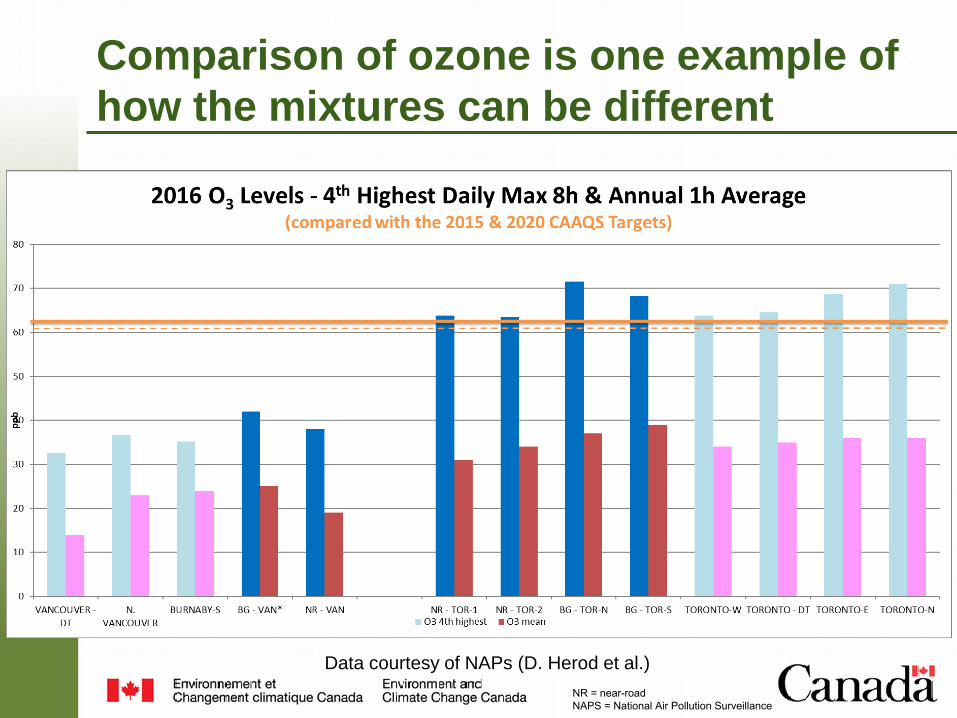
Comparison of ozone is one example of how the mixtures can be different
Data courtesy of NAPs (D. Herod et al.) NR = near-roadNAPS = National Air Pollution Surveillance

Page 18 – 9 mai 2018
Near-road changes PM2.5 composition
Zhang et al., Atmos. Env. 2016
Page 19 – 9 mai 2018
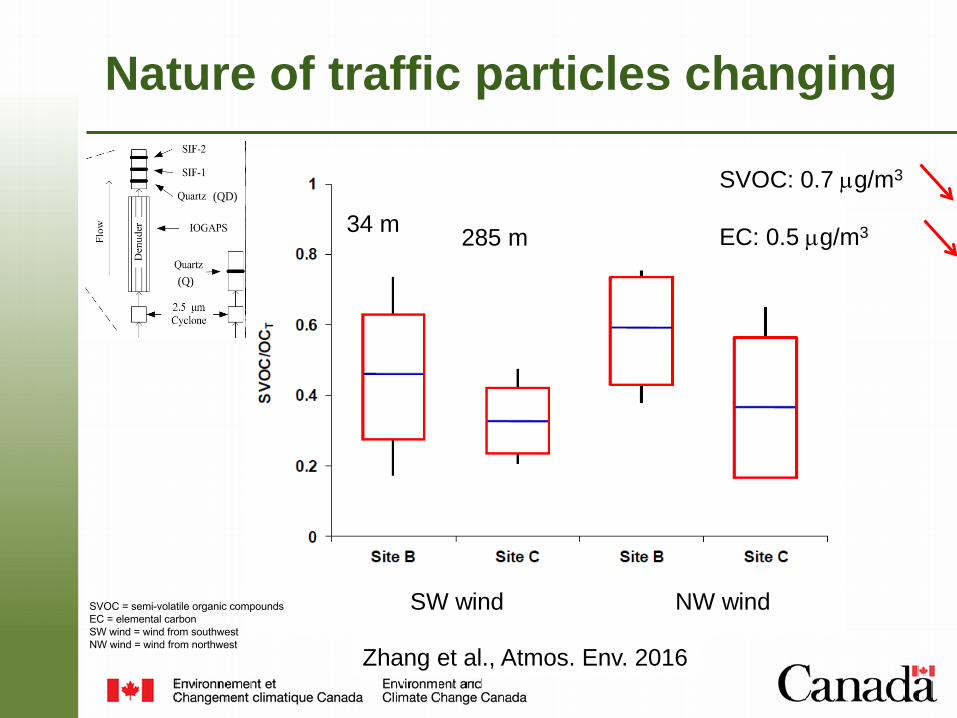
Nature of traffic particles changing
34 m 285 m
SW wind NW wind
SVOC: 0.7 µg/m3
EC: 0.5 µg/m3
Zhang et al., Atmos. Env. 2016
(Q)
(QD)
SVOC = semi-volatile organic compoundsEC = elemental carbonSW wind = wind from southwestNW wind = wind from northwest

Page 20 – 9 mai 2018
Tailpipe PM2.5 and NO2
Levy et al. ACP 2014
% increase in BC same as HOA
NO2 = nitrogen dioxideCO = carbon monoxideHOA = hydrocarbon-like organic aerosolPM25 = PM2.5 = particulate matter <2.5 micrometers in diameterBC = black carbon

Page 21 – 9 mai 2018
Changing Gasoline Engine (GDI) Technology – near term
0
1000
2000
3000
4000
5000
6000
Emis
sion
fact
or (μ
g C/
km)
EC OC
IM NI En IM NI En IM NI En0FTP-75 FTP-72 US06
0
1000
2000
3000
4000
5000
Emis
sion
fact
or (μ
g C/
km)
EC OC
IM NI En IM NI En IM NI En0FTP-75 FTP-72 US06
0
200
400
600
800
Emis
sion
fact
or (μ
g C/
km) EC OC
IM NI En IM NI En IM NI En0FTP-75 FTP-72 US06
Port-fuel Injected Volvo S40
GDI Hyundai Sonata
GDI+GPF Hyundai Sonata
Zhang et al. (in prep.)
GDI = Gasoline direct injectionGPF = Gasoline particulate filter

Page 22 – 9 mai 2018
Very Near Road Evolution in Particles
GDI – Ford Focus
Zimmerman et al. ES&T 2016 GDI = Gasoline direct injection

Page 23 – 9 mai 2018
Changing nature of the mixture with Gasoline Direct Injection (GDI)
Zimmerman et al. ES&T 2016

Page 24 – 9 mai 2018
Longer term changes in the mixture
Years
0 5 10 15 20 25 30 40
[X]

Page 25 – 9 mai 2018
Closing Remarks
• Although considerable similarity in the major pollutants inTRAP there is potential for large diversity in the details inthe exposures attributed to simple indicators
• Given the inherent limitations in epidemiological studies,especially variations in precision in determining individualexposures, are there novel study designs remaining to beattempted to capitalize on TRAP mixture variability togain new insight?
• What types of insight are most-needed to inform policyand other measures to reduce risk?
– In light of the fleet on/off roads todayTRAP = traffic-related air pollution

Page 26 – 9 mai 2018
Acknowledgements
S. Wren, D. Herod, D. Johnson, J. Liggio, J. Wentzell, R. L. Mittermeier, K. Hayden, G. Lu, E. Seed
THANK YOU
NO2