Ground Moving Target Indication (GMTI) with Synthetic...
45
© The Aerospace Corporation 2009 Ground Moving Target Indication (GMTI) with Synthetic Aperture Radar (SAR) Nick Marechal The Aerospace Corp. February 6, 2012 Material from May 2009 IEEE Presentation Approved by Office of Technical Relations OTR20090227100430
Transcript of Ground Moving Target Indication (GMTI) with Synthetic...
© The Aerospace Corporation 2009
Ground Moving Target Indication (GMTI) with Synthetic Aperture Radar (SAR)
Nick Marechal The Aerospace Corp. February 6, 2012
Material from May 2009 IEEE Presentation Approved by Office of Technical Relations OTR20090227100430
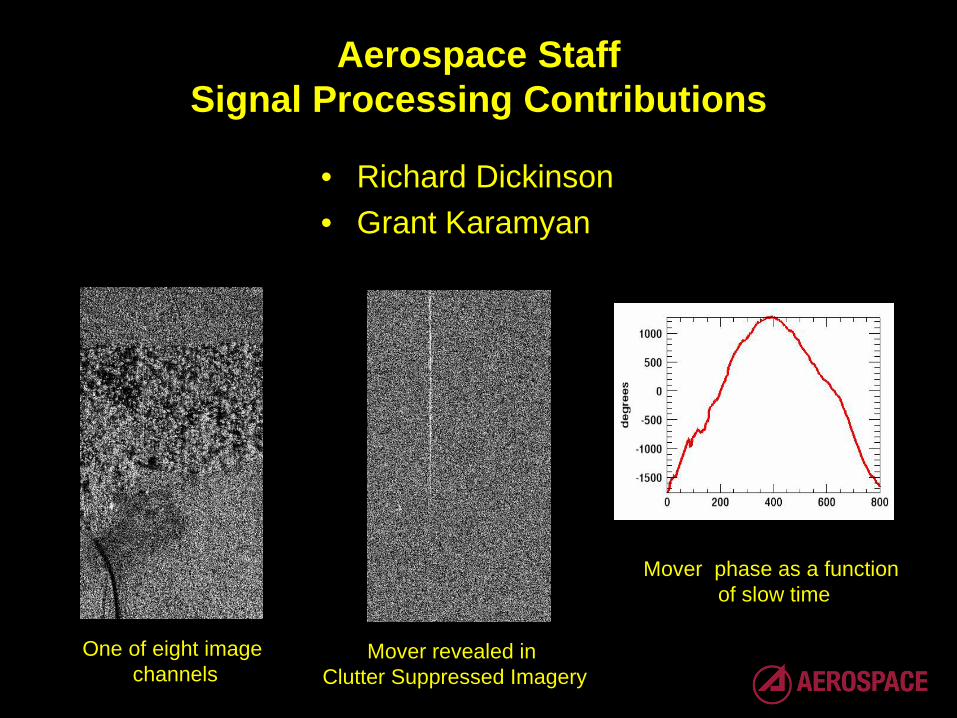
Aerospace Staff Signal Processing Contributions
• Richard Dickinson • Grant Karamyan
One of eight image channels
Mover revealed in Clutter Suppressed Imagery
Mover phase as a function of slow time

Ground Moving Targets in SAR Imagery Outline
• Nominal Moving Target Phase Equations
• Measured Moving Target Phase Examples
• Space Time Adaptive Processing (STAP) Review
• STAP applied to 8 channel SAR image data (element space, phase centers) – Single 3 sec coherent integration full azimuth resolution – Ten 0.3 second coherent integration times, results in SAR
movie of moving vehicle

• Image of corner reflector (single look)
Corner Reflector Azimuth-Doppler IPR
Corner Reflector Azimuth Phase
(unwrap phase of FFT of IPR)
Corner Reflector Azimuth-Amplitude (amp of FFT of IPR)
Airborne X-band Image Example Azimuth Impulse Response (IPR) and Residual Phase Error Shown
aircraft data

Ground Moving Target Indication (GMTI)
Moving Point Target Phase Characteristics
Go To Paper on Moving Target Phase

band midat h wavelengt λresolutionazimuth nominal y
period dwellcoherent Trunit vectoazimuth planeslant
runit vecto range planeslant on vectoraccelerati target
torlocity vec target ve
(degrees) λ
T y
T 90 Q
2
==∆=
====
⋅+
∆
⋅=
yuuav
uauv
x
xy
Quadratic Phase (polar format processing)
azimuth samples
degr
ees
Phase Target 1 Phase Target 5
azimuth samples
Phase Target 6
azimuth samples
Q = - 4563 deg GPS prediction
Q ~ - 4000 deg observed above
No GPS data for prediction
Q ~ 8000 deg observed above
Q = 1627 deg GPS prediction*
Q ~ 1500 deg observed above *GPS derived acceleration set = 0
Quadratic Phase & Nonzero Doppler Rate
• Quadratic phase defocuses Doppler/azimuth IPR
• Formula for quadratic expressed for polar format processed data
• Target energy can be focused by phase compensation
• Stationary Targets do not exhibit 1000’s deg of phase Note: CDP = 2.71 sec.
aircraft data
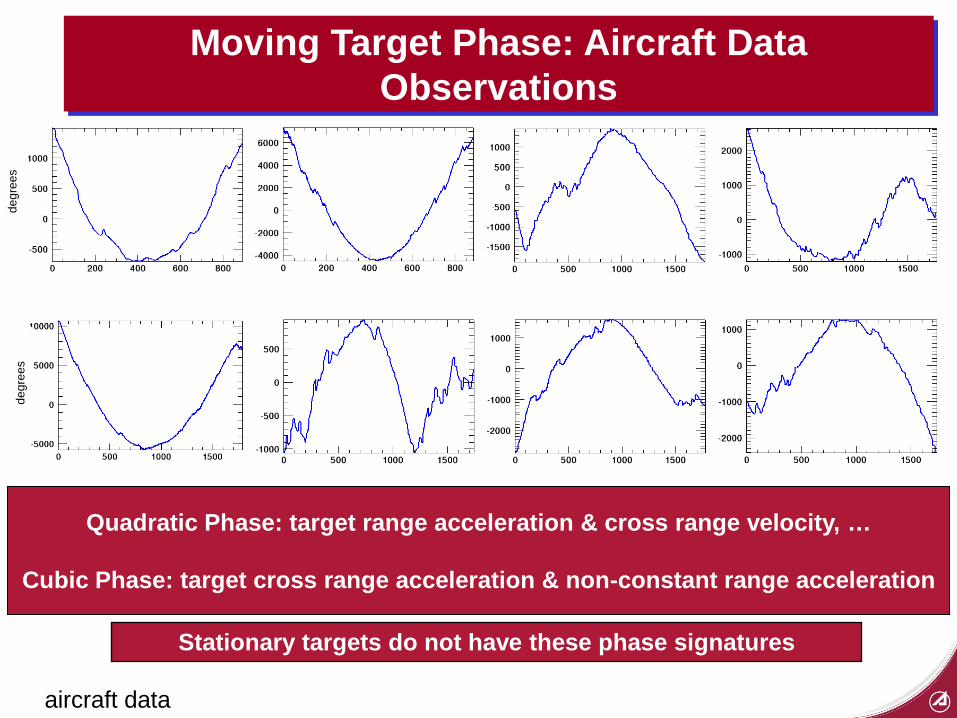
Quadratic Phase: target range acceleration & cross range velocity, …
Cubic Phase: target cross range acceleration & non-constant range acceleration
degr
ees
degr
ees
Moving Target Phase: Aircraft Data Observations
Stationary targets do not have these phase signatures
aircraft data
GMTI
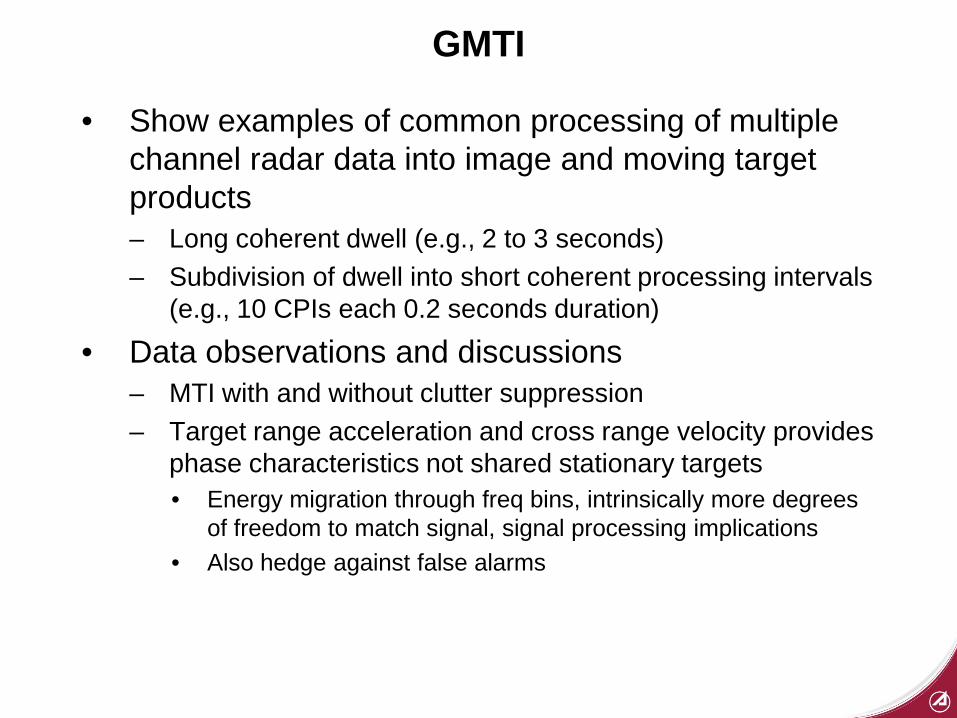
• Show examples of common processing of multiple channel radar data into image and moving target products – Long coherent dwell (e.g., 2 to 3 seconds) – Subdivision of dwell into short coherent processing intervals
(e.g., 10 CPIs each 0.2 seconds duration)
• Data observations and discussions – MTI with and without clutter suppression – Target range acceleration and cross range velocity provides
phase characteristics not shared stationary targets • Energy migration through freq bins, intrinsically more degrees
of freedom to match signal, signal processing implications • Also hedge against false alarms

Space-Time Adaptive Processing (STAP) Formulated for SAR Imagery
vectors)steering of space hypothesisapply now analysis,(for y),)(x,( stack image suppressedclutter clutter suppresses apparentlystack image matrix to covariance inverse ofn applicatio
)hypothesis vector steeringet given targ a(for )( output filter STAP
)inequality Schwarz-Cauchy ofn applicatio SINR,(max ) ( ) SINR( )SINR(max
movers) exclude data, from estimate SINR, maximumfor ctor weight ve(STAP optimal
power)clutter ion toconsiderat include ratio, ceinterferen-to-(signal
)SINR(
3Din located are elements which thealongdirection definesr unit vecto range, r
elements, antennabetween dist drelated) arrival of angle tion,representa spaceelement antenna (nominal ) ) ( r) / (d 1)-)(n λ / π(2 i exp( s
weights)beamazimuth or phaselinear of lexponentiacomplex vector,steering(target ] s , ... ,s ,s [ weights)summation (channel ] w, ,... w, w[
matrix) covariance noisereceiver plusclutter Nby (N
channel)each from one images, ofor vector (stack ] y)(x,σ , ... y),(x,σ y),(x,σ [ y)(x,
channels) N ( beamsazimuth Nor elements antenna track along displaced N with system a Assume
1
1HH1H
H11
1
H
2H
d
dn
N21
N21
nc
TN21
σR
σRsσsRσw
ssRsRw
RsRwRwwsw
w
u
xu s
wRRR
σσ
−
−−
−−
−
=
===
==
=
=
===
⋅===
+=
==
Note: Missing wavelength factor in steering vector definition corrected above on February 10, 2012.

Element Space: 1 and 2 of 8 Clutter Images 1 and 2 of 8 channels/images shown
single look complex
image 1 image 2
aircraft data

R-1 Applied - Clutter Suppression Apparent 1 and 2 of 8 channels/images shown
steering vector not applied
image 1 image 2
aircraft data

R-1 Applied - Clutter Suppression Apparent 1 and 2 of 8 channels/images shown
steering vector not (yet) applied
moving target energy
observed
image 1 image 2
aircraft data

Digital Beam Steer to Upper Part of Image
azim
uth
range
Application of beam steering vector shown Complex-valued beam steering vector components are complex sinusoids a phase which is linear with antenna element index
Analogous to discrete Fourier transform
) ) ( r) / (d 1)-(n λ) / π(2 i exp( s ] s , ... ,s ,s [
dn
N21
xu s
⋅==
aircraft data
Note: Missing wavelength factor in steering vector definition corrected above on February 10, 2012.

Digital Beam Steer to Center Part of Image
azim
uth
range
Application of beam steering vector shown Complex-valued beam steering vector components are complex sinusoids a phase which is linear with antenna element index
Analogous to discrete Fourier transform
aircraft data
) ) ( r) / (d 1)-(n λ) / π(2 i exp( s ] s , ... ,s ,s [
dn
N21
xu s
⋅==
Note: Missing wavelength factor in steering vector definition corrected above on February 10, 2012.

Digital Beam Steer to Lower Part of Image
azim
uth
range
Application of beam steering vector shown Complex-valued beam steering vector components are complex sinusoids a phase which is linear with antenna element index
Analogous to discrete Fourier transform
aircraft data
) ) ( r) / (d 1)-(n λ) / π(2 i exp( s ] s , ... ,s ,s [
dn
N21
xu s
⋅==
Note: Missing wavelength factor in steering vector definition corrected above on February 10, 2012.

Left image shows area of interest outlined in green.
Right image is a zoom into region of interest.
Image formed with 2.7 seconds of radar dwell time.
range
Dop
pler
clutter image
aircraft data

Left image shows area of interest outlined in green.
Right image results from clutter. suppression processing (STAP) reveals two movers. Note energy is spread over many Doppler cells.
Multiple channels necessary for clutter suppression.
range
Dop
pler
clutter suppressed
aircraft data

Left image shows area of interest outlined in green.
Yellow arrows point to Doppler shifted location of targets.
Red arrows point to actual target location as determined by radar processing algorithm (STAP).
range
Dop
pler
Target actual locations
Target Doppler positions
clutter suppressed
aircraft data

Phase Characteristics Clutter Suppressed Output
Nominal Element Space Adaptive Processing (STAP)
8 channels
No quadratic phase compensation
Quadratic Phase Frequently Observed in Aircraft Data
clutter suppressed - channels combined time 2.7 sec.
aircraft data

Space-Time Adaptive Processing (STAP) Target Signal Loss
SNR) torelative defined loss (SINR SNR L ) SINR(
power)clutter ion toconsiderat no gives ( ) -( SNRmax
)hypothesis vector steeringet given targ a(for )( output filter STAP
)inequality Schwarz-Cauchy ofn applicatio SINR,(max ) ( ) SINR( )SINR(max
movers) exclude data, from estimate SINR, maximumfor ctor weight ve(STAP optimal
power)clutter ion toconsiderat include ratio, ceinterferen-to-(signal
)SINR(
sinr1
H1n
1HH1H
H11
1
H
2H
=
=
===
==
=
=
−
−−
−−
−
sR
ssR
σRsσsRσw
ssRsRw
RsRwRww
sww
steering vector phase change per channel (deg)
STAP SINR Loss 8 antenna element aircraft data CNR per channel approx 18 dB

Space-Time Adaptive Processing (STAP) Clutter Loss (Suppression)
CNR)max torelative summation, channelpost n,suppressioclutter the(defines ) CNR( L ) CNR(
weights)summation channel as eigenvaluemax r with eigenvecto using CNR(max ) CNR( )CNR() seigenvalue and rseigenvecto ( N ...., 2, 1, k
1 -
) (
)CNR(
SNR) torelative defined loss (SINR SNR L ) SINR(movers) exclude data, from estimate SINR, maximumfor ctor weight ve(STAP optimal
power)clutter ion toconsiderat include ratio, ceinterferen-to-(signal
)SINR(
1c1
1
k kk
nH
H
nH
nH
nH
cH
sinr1
1
H
2H
λ
esRew
eeRwRw
wRwwRw
wRRwwRwwRw
w
sRRsRw
Rww
sww
=
≤==
=−
==
=
=
=
−
−
−
steering vector phase change per channel (deg)
STAP Clutter Suppression 8 element aircraft data
CNR per channel approx 18 dB
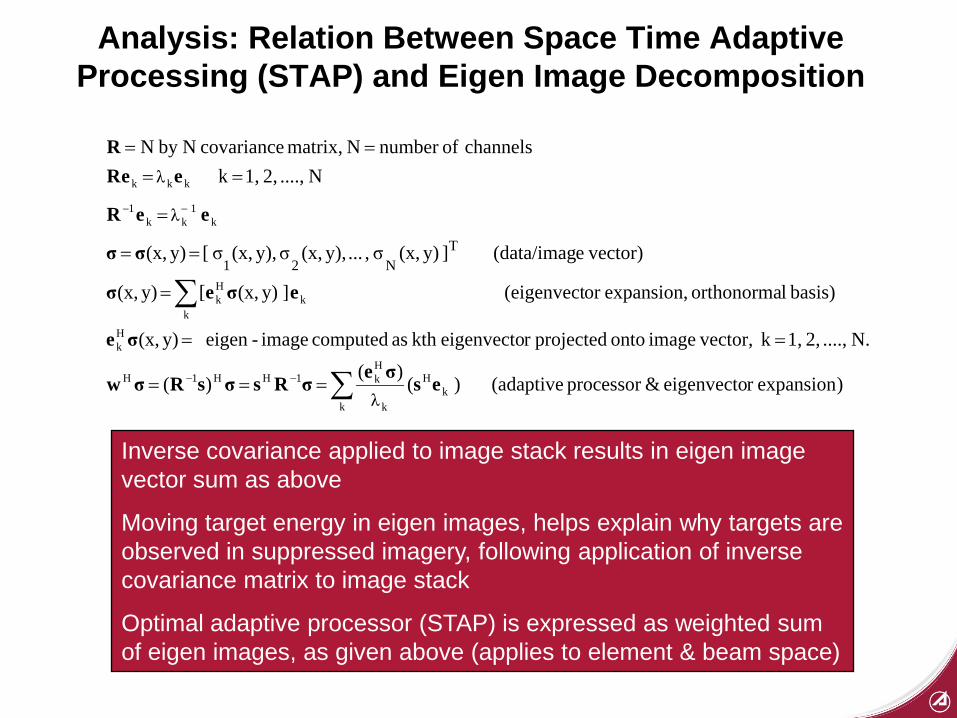
Analysis: Relation Between Space Time Adaptive Processing (STAP) and Eigen Image Decomposition
)expansionr eigenvecto &processor (adaptive)()( )(
N. ...., 2, 1, k vector,image onto projectedr eigenvectokth as computed image-eigen y)(x,
basis) lorthonorma expansion,or (eigenvect] y)(x,[ y)(x,
vector)e(data/imag ] y)(x,σ , ... y),(x,σ y),(x,σ [ y)(x,
N ...., 2, 1, k channels ofnumber N matrix, covariance Nby N
kk
H
k
Hk1HH1H
Hk
kk
Hk
k 1
kk1
k kk
λ
λ
λ
TN21
∑
∑
===
==
=
==
=
====
−−
−−
esσeσRsσsRσw
σe
eσeσ
σσ
eeR
eeRR
Inverse covariance applied to image stack results in eigen image vector sum as above
Moving target energy in eigen images, helps explain why targets are observed in suppressed imagery, following application of inverse covariance matrix to image stack
Optimal adaptive processor (STAP) is expressed as weighted sum of eigen images, as given above (applies to element & beam space)

Analysis: Optimal Adaptive Processor is Weighted Sum of Eigen-Images
∑=== −−
kk
H
k
Hk1HH1H )()( )( λ
esσeσRsσsRσw
= 0.0266
λ = 7.6169 = 0.1220 = 0.0818 = 0.0518
= 0.0427 = 0.0306 = 0.0273
y)(x,H1 σe y)(x,H
2 σe y)(x,H3 σe y)(x,H
4 σe
y)(x,H5 σe y)(x,H
6 σe y)(x,H7 σe y)(x,H
8 σe
λ λ
λ λ λ λ
λ
Relation Between Space Time Adaptive Processing (STAP) and Eigen Image Decomposition
aircraft data

Eigenvalues of R 5.9598164 0.46193165 0.31020248 0.28341122 0.26182939 0.25569636 0.24116470 0.22594751
Eigenvalues of R 7.6169138 0.12200656 0.081824081 0.051896852 0.042732919 0.030645195 0.027344463 0.026636630
Bright Uniform Clutter Beam Edge
ratio largest/smallest eigenvalues = 286
ratio largest/smallest eigenvalues = 26
Greater range of variability of eigenvalues observed for bright clutter
Observation: Variability of Eigenvalues with CNR
aircraft data
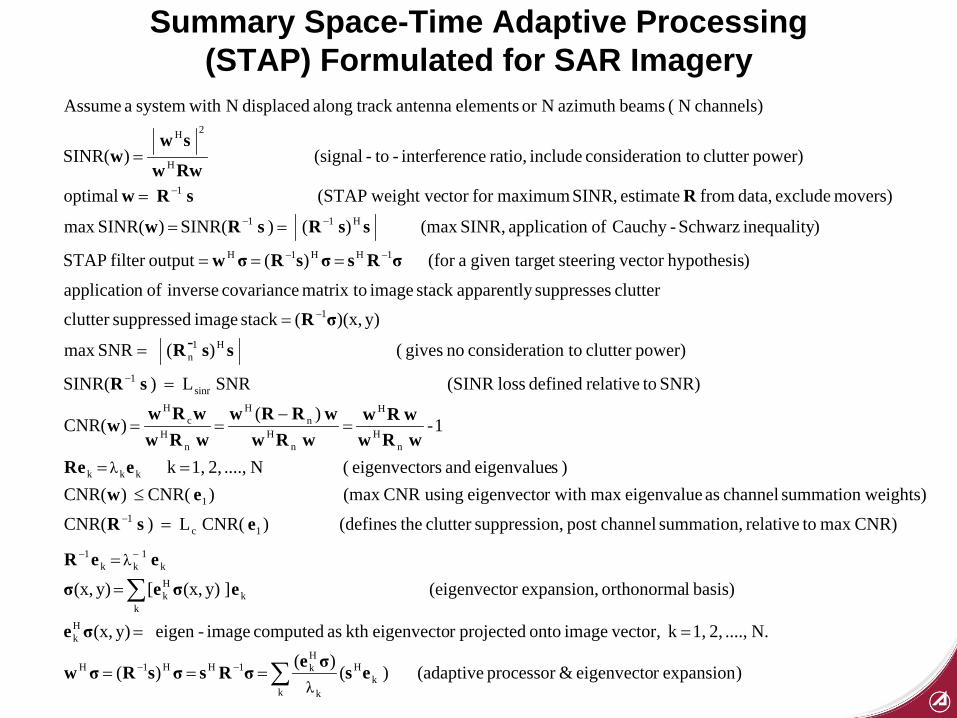
Summary Space-Time Adaptive Processing (STAP) Formulated for SAR Imagery
)expansionr eigenvecto &processor (adaptive)()( )(
N. ...., 2, 1, k vector,image onto projectedr eigenvectokth as computed image-eigen y)(x,
basis) lorthonorma expansion,or (eigenvect] y)(x,[ y)(x,
CNR)max torelative summation, channelpost n,suppressioclutter the(defines ) CNR( L ) CNR(
weights)summation channel as eigenvaluemax r with eigenvecto using CNR(max ) CNR( )CNR() seigenvalue and rseigenvecto ( N ...., 2, 1, k
1 -
) (
)CNR(
SNR) torelative defined loss (SINR SNR L ) SINR(
power)clutter ion toconsiderat no gives ( ) -( SNRmax
y))(x,( stack image suppressedclutter clutter suppresses apparentlystack image matrix to covariance inverse ofn applicatio
)hypothesis vector steeringet given targ a(for )( output filter STAP
)inequality Schwarz-Cauchy ofn applicatio SINR,(max ) ( ) SINR( )SINR(max
movers) exclude data, from estimate SINR, maximumfor ctor weight ve(STAP optimal
power)clutter ion toconsiderat include ratio, ceinterferen-to-(signal
)SINR(
channels) N ( beamsazimuth Nor elements antenna track along displaced N with system a Assume
kk
H
k
Hk1HH1H
Hk
kk
Hk
k 1
kk1
1c1
1
k kk
nH
H
nH
nH
nH
cH
sinr1
H1n
1
1HH1H
H11
1
H
2H
λ
λ
λ
∑
∑
===
==
=
=
=
≤==
=−
==
=
=
=
===
==
=
=
−−
−−
−
−
−
−−
−−
−
esσeσRsσsRσw
σe
eσeσeeR
esRew
eeRwRw
wRwwRw
wRRwwRwwRw
w
sR
ssR
σR
σRsσsRσw
ssRsRw
RsRwRww
sww

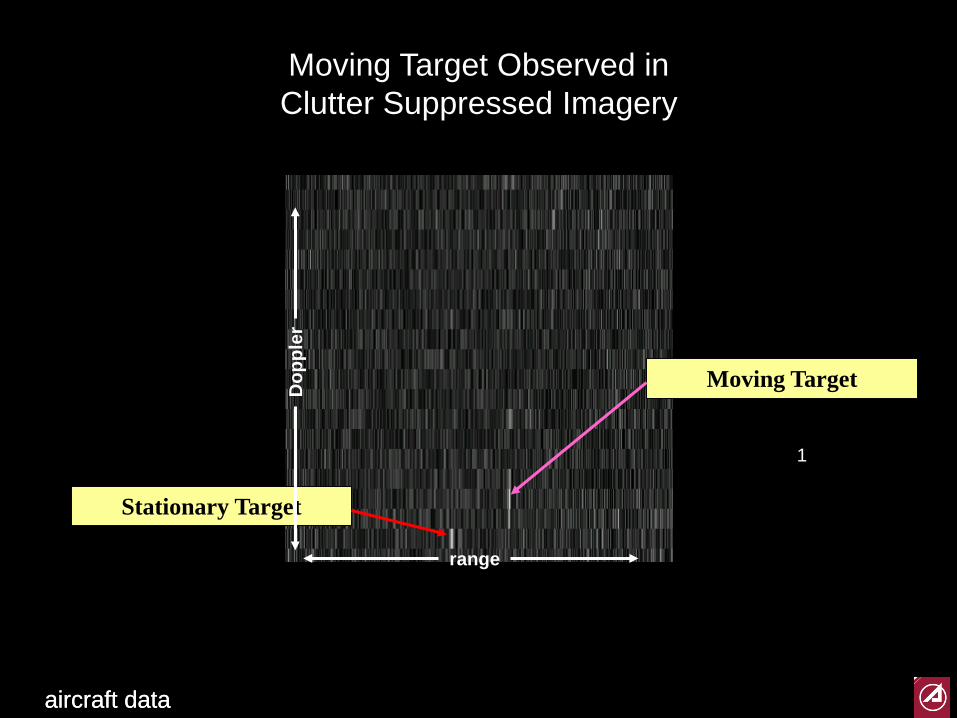
Last Example: Show Moving Target Quadratic Phase Causes Target Energy to Migrate Through Doppler/Azimuth Cells Single Coherent Data Collection Period (2.7 sec.) Divided into 13 Time Intervals For each time interval 8 channels are processed via STAP and Displayed as a Time Sequenced Movie of 13 Images (azimuth resolution more coarse by factor of 13) Note that SAR image formation applied to the full data collection period, then subdividing the data, mitigates moving target migration through range bins
Stationary Target
Moving Target Dop
pler
range
aircraft data aircraft data
1
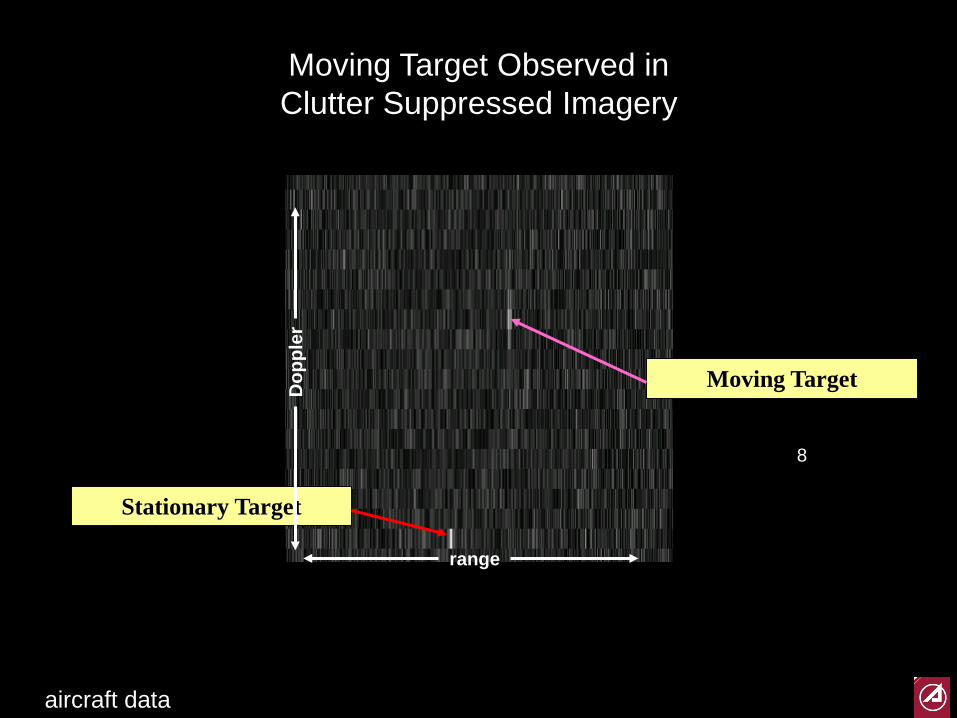
Moving Target Observed in Clutter Suppressed Imagery

Stationary Target
Moving Target Dop
pler
range
aircraft data
2
Moving Target Observed in Clutter Suppressed Imagery

Stationary Target
Moving Target Dop
pler
range
aircraft data
3
Moving Target Observed in Clutter Suppressed Imagery

Stationary Target
Moving Target Dop
pler
range
aircraft data
4
Moving Target Observed in Clutter Suppressed Imagery
Stationary Target
Moving Target Dop
pler
range
aircraft data
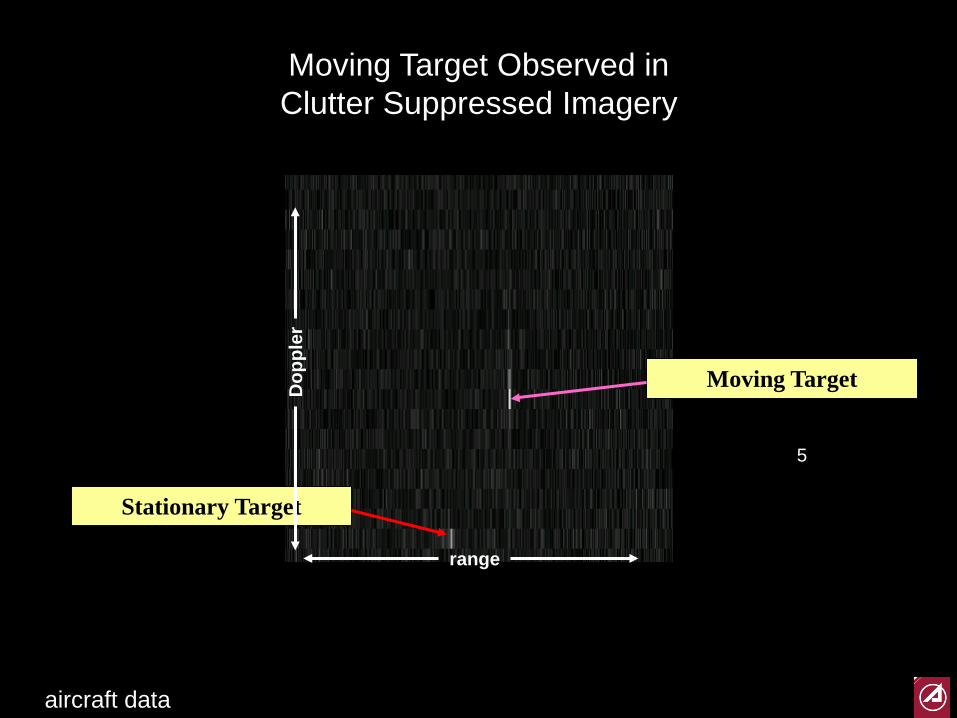
5
Moving Target Observed in Clutter Suppressed Imagery

Stationary Target
Moving Target Dop
pler
range
aircraft data
6
Moving Target Observed in Clutter Suppressed Imagery

Stationary Target
Moving Target Dop
pler
range
aircraft data
7
Moving Target Observed in Clutter Suppressed Imagery
Stationary Target
Moving Target Dop
pler
range
aircraft data
8
Moving Target Observed in Clutter Suppressed Imagery

Stationary Target
Moving Target Dop
pler
range
aircraft data
9
Moving Target Observed in Clutter Suppressed Imagery

Stationary Target
Moving Target Dop
pler
range
aircraft data
10
Moving Target Observed in Clutter Suppressed Imagery

Stationary Target
Moving Target Dop
pler
range
aircraft data
11
Moving Target Observed in Clutter Suppressed Imagery

Stationary Target
Moving Target Dop
pler
range
aircraft data
12
Moving Target Observed in Clutter Suppressed Imagery

Stationary Target
Moving Target Dop
pler
range
aircraft data
13
Moving Target Observed in Clutter Suppressed Imagery

Ground Moving Targets in SAR Imagery Summary
• Nominal Moving Target Phase Equations – Uncompensated motion leads to quadratic, cubic, .. phase
• Measured Moving Target Phase Examples – Cross range motion causes phase characteristics not
displayed by stationary targets
• Space Time Adaptive Processing (STAP) Review – SINR, SINR loss, clutter suppression
• STAP applied to 8 channel SAR image data (element space, phase centers) – Single 2.7 sec coherent processing interval (CPI) – Thirteen, 2.7/13 = 0.2077 sec. CPIs, results in SAR movie of
moving vehicle, target migration through Doppler cells observed

Appreciation
• UCLA’s Institute for Pure and Applied Mathematics • Margaret Cheney • The Aerospace Corporation

References Rudge, A. W., Milne, K., Olver, A. D., Knight, P., The Handbook of Antenna Design, Vol. 1, Editors, copyright 1980.
Skolnik, M. I., Editor, Radar Handbook, McGraw-Hill Book Co., New York, ISBN 07-057908-3, Chap. 9 Aperture-antenna Analysis, by J. W. Sherman, pp 9-2 to 9-9, 1970. Walker, J. L., “Range Doppler Imaging of Rotating Objects,” IEEE Trans. Aerospace Electronic Systems, Vol. AES-16, pp. 23-52, Jan. 1980. Brown, W. M., “Walker Model for Radar Sensing of Rigid Target Fields,” IEEE Trans. Aerospace Electronic Systems, Vol. AES-16, pp. 104-107, Jan. 1980. Munson, D. C., O’Brien, J. D., Jenkins, W. K., “A Tomographic Formulation of Spotlight-Mode Synthetic Aperture Radar,” Proc. IEEE, Vol. 71, pp. 917-925, Aug. 1983. Ausherman, D. A., et al, “Developments in Radar Imaging,” IEEE Trans. Aerospace Electronic Systems, Vol. AES-20, No. 4, pp. 363-399, July 1984. This paper includes the Fourier transform result in the bistatic SAR case. Jakowatz, C. V., Thompson, P. A.,” A New Look at Spotlight-Mode Synthetic Aperture Radar as Tomography: Imaging Three-Dimensional Targets,” IEEE Trans. Aerospace Electronic Systems, Vol. AES-4, No. 5, pp. 699-703, May 1995. Carrara, W. G., Goodman, R. S., Majewski, R. M., Spotlight Synthetic Aperture Radar Signal Processing Algorithms, Artech House, Boston, ISBN 0-89006-728-7, pp. 501-506 (range deskew), 1995. Jakowatz, C. V., Thompson, P. A.,” A New Look at Spotlight-Mode Synthetic Aperture Radar as Tomography: Imaging Three-Dimensional Targets,” IEEE Trans. Aerospace Electronic Systems, Vol. AES-4, No. 5, pp. 699-703, May 1995. Jakowatz, C. V., Wahl, D. E., Eichel, P. H., Ghiglia, D. C., Thompson, P. A., Spotlight-Mode Synthetic Aperture Radar: A Signal Processing Approach, pp. 62-103, pp. 187-191, and Appendix C, Kluwer Academic Publishers, Boston, 1996.

References Wehner, D. R., High Resolution Radar, Artech House, Boston, ISBN 0-89006-194-7, pp. 211-214, 1987. Curlander, J. C., McDonough, R. N., Synthetic Aperture Radar Systems and Signal Processing, John Wiley & Sons, Inc., New York, ISBN 0-471-85770-X, pp. 120-124, 1991. Brennan, L.E. Reed, I. S., Theory of Adaptive Radar, IEEE Trans. Aerospace and Electronic Systems, Vol. AES-9, No. 2, March 1973. Ward, J., “Space-Time Adaptive Processing fir Airborne Radar,” MIT Lincoln Laboratory Technical Report 1015, December 13, 1994, Lexington, MA. Guerci, J. R., Goldstein, J. S., Reed, I. S., “Optimal and Adaptive Reduced-Rank STAP,” IEEE Transactions on Aerospace and Electronic Systems, Vol. 36, No. 2, pp. 647-663, April 2000. Melvin, W. L., “A STAP Overview,” IEEE A&E Systems Magazine, Vol. 19, No. 1, January 2004, Part 2: Tutorials-Melvin.

Backup Charts

azimuth index
dB
Single element beam pattern Beam pattern 8 element sum
PRF span PRF span dB
( ) discretes large excluding computedmax max(b), b
bb(y)log 10 B(y)
azimuth y range, x ,y)(x, b(y)
using estimatedpattern BeamAzimuth
max
max10
2
x
==
==Σ= σ
Antenna Patterns: Aircraft Data
Observe: azimuth beamwidth narrows following summation of data from each
azimuth element (channel)