
Noise Modeling and Reduction in Gravitational Wave Detection ...

TRAFFIC NOISE MODELING
AND ANALYSIS
PRACTITIONERS HANDBOOK
Florida Department of Transportation
Environmental Management Office
May 5, 2015

THIS PAGE LEFT BLANK INTENTIONALLY
FDOT Traffic Noise Modeling & Analysis Practitioners Handbook
May 5, 2015 Page 3
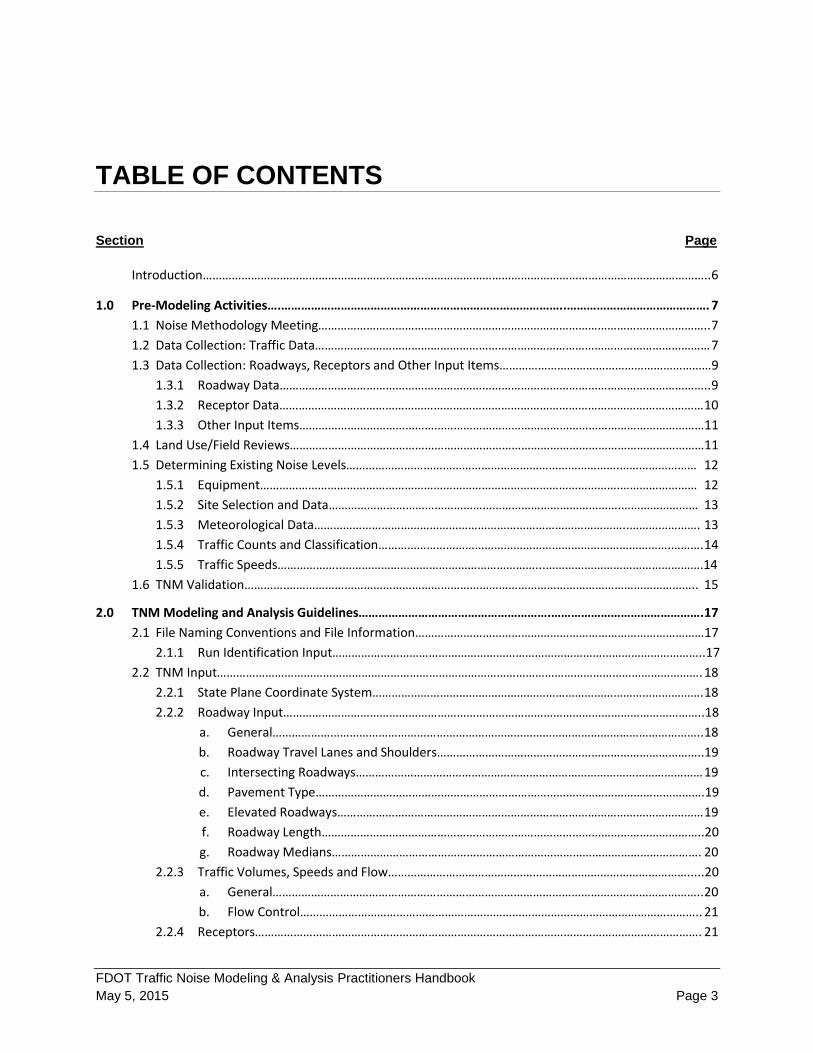
TABLE OF CONTENTS
Section Page
Introduction…………………………………………………………………………………………………………………………………………..6
1.0 Pre-Modeling Activities….…………………………………………………………………………..……………………………………. 7
1.1 Noise Methodology Meeting………………………………………………………………………………………………………….. 7
1.2 Data Collection: Traffic Data…………………………………………………………………………………………………………… 7
1.3 Data Collection: Roadways, Receptors and Other Input Items…………………………………………………………9
1.3.1 Roadway Data…………………………………………………………………………………………………………………….. 9
1.3.2 Receptor Data…………………………………………………………………………………………………………………… 10
1.3.3 Other Input Items………………………………………………………………………………………………………………11
1.4 Land Use/Field Reviews…………………………………………………………………………………………………………………11
1.5 Determining Existing Noise Levels………………………………………………………………………….…………………… 12
1.5.1 Equipment………………………………………………………………………………………………….…………………… 12
1.5.2 Site Selection and Data……………………………………………………………………………….…………………… 13
1.5.3 Meteorological Data……………………………………………………………………………………..…………………. 13
1.5.4 Traffic Counts and Classification……………………………………………………………………………….………. 14
1.5.5 Traffic Speeds………………..……………………………………………………...………………………………………….14
1.6 TNM Validation………….……………………………………………………………………………………………………………….. 15
2.0 TNM Modeling and Analysis Guidelines………………………………………………….………………………………………. 17
2.1 File Naming Conventions and File Information………………………………………………………………………………17
2.1.1 Run Identification Input……………………………………………………………………………………………………..17
2.2 TNM Input……………………………………………………………………………………………………………………………………. 18
2.2.1 State Plane Coordinate System…………………………………………………………………………………………. 18
2.2.2 Roadway Input…………………………………………………………………………………………………………………..18
a. General…………………………………………………………………………………………………………………….. 18
b. Roadway Travel Lanes and Shoulders………………………………………………………………………..19
c. Intersecting Roadways……………………………………………………………………………………………… 19
d. Pavement Type………………………………………………………………………………………………………….19
e. Elevated Roadways…………………………………………………………………………………………………… 19
f. Roadway Length………………………………………………………………………………………………………..20
g. Roadway Medians……………………………………………………………………………………………………. 20
2.2.3 Traffic Volumes, Speeds and Flow………………………………………………………………………………….....20
a. General…………………………………………………………………………………………………………………….. 20
b. Flow Control…………………………………………………………………………………………………………….. 21
2.2.4 Receptors…………………………………………………………………………………………………………………………. 21

FDOT Traffic Noise Modeling & Analysis Practitioners Handbook
May 5, 2015 Page 4
Table of Contents (Continued)
Section Page
a. General…………………………………………………………………………………………………………………….. 21
b. Multi-Story Receptor Height……………………………………………………………………………………...23
c. Receptor Locations for Non-Residential Receptors……………………………………………….……23
2.2.5 Noise Barriers…………………………………………………………………………………………………………………….25
a. General…………………………………………………………………………………………………………………….. 25
b. Basic Noise Barrier Input……………………………………………………………………………………………25
c. Initial Noise Barrier Length and Height………………………………………………………………………26
d. Noise Barrier Optimization…………………………………….……………………………………………….. 27
e. Noise Barrier Results and Recommendations………………………………………………..………… 28
f. Parallel Noise Barriers………………………………………………………………………………….…………. 29
2.2.6 Building Rows……………………………………………………………………………………………………….…………. 29
2.2.7 Terrain Lines……………………………………………………………………………………………………………..……… 29
2.2.8 Ground Zones…………………………………………………………………………………………………………………….29
2.2.9 Tree Zones………………………………………………………………………………………………………………………… 30
2.2.10 Noise Contours…………………………………………………………………………………………………………………. 30
3.0 Noise Study Documentation………………………………………………………………………………………………………….. 31
3.1 General………………………………………………………………………………………………………………………………………….31
3.2 Validation Analyses………………………………………………………………………………………………………………………. 31
3.3 Impact Assessment………………………………………………………………………………………………………………………. 31
3.4 Noise Barrier Analysis…………………………………………………………………………………………………………………… 32
3.5 Statement of Likelihood……………………………………………………………………………………………………………….. 32
3.6 Noise Contour Analyses for Local Officials……………………………………………………………………………………. 32
3.7 Construction Noise and Vibration………………………………………………………………………………………………….32
3.8 Public Involvement………………………………………………………………………………………………………………………. 33
4.0 Noise Specific Public Involvement………………………………………………………………………………………………….. 34
4.1 PD&E Study Public Involvement…………………………………………………………………………………………………….34
4.2 Noise Barrier Specific Public Involvement in the Design Phase………………………………………………………34
5.0 Conclusions……………………………………………………………………………………………………………………………………. 35
6.0 References……………………………………………………………………………………………………………………………………… 36

FDOT Traffic Noise Modeling & Analysis Practitioners Handbook
May 5, 2015 Page 5
List of Tables
Number Page
1 Vehicle Classification for Traffic Noise Studies……………………………………………………………………………………..14
2 Noise Barrier Analysis Results……………………….……………………………………………………………………………………..28
List of Figures
Number Page
1 Run Identificaton…………………………………………..………………………….…………….…………………………………………..18
2 Receptor Placement……………………………………..……………………………………………………………………………………..22
Appendices
Appendix A: …………………………………………………………..…………………………….Example Noise Study Traffic Data Form
Appendix B: ………………………………………………………………………………………Example Noise Measurement Data Sheet
Appendix C: …………………………………………………………………………………………… Example TNM Input File QC Checklist
Appendix D:…………………………………………………………………………………………… Example Noise Study Report Outlines

FDOT Traffic Noise Modeling & Analysis Practitioners Handbook
May 5, 2015 Page 6
INTRODUCTION
The Florida Department of Transportation (FDOT) has prepared this Traffic Noise Modeling and Analysis
Practitioners Handbook to assist analysts in the prediction of existing and future traffic noise levels and
the evaluation of the effectiveness of noise barriers while providing consistent, predictable, and
repeatable noise studies. The contents of this handbook provide a compilation of practical approaches
and examples which are to be applied in conducting FDOT traffic noise impact evaluations.
The Federal Highway Administration (FHWA) Traffic Noise Model (TNM) Version 2.5 or later is the only
FDOT approved model that can be used to predict traffic noise levels and evaluate the effectiveness of
noise barriers.1 When analysis is required, all traffic noise analyses, traffic noise level assessments, and
evaluations of potential mitigation effectiveness shall be performed using the TNM software.
The FDOT Noise Policy (Part 2, Chapter 17 (Noise) of the FDOT Project Development and Environment
(PD&E) Manual) constitutes the official traffic noise policy of the FDOT for the purpose of meeting the
requirements of Title 23 Code of Federal Regulations (CFR) Part 772 “Procedures for Abatement of
Highway Traffic Noise and Construction Noise.”
This Handbook is designed for use by FDOT staff and its consultants that perform or review noise
studies. It is expected that the users of this document are trained (or working under the guidance of
someone who is trained) in the modeling and analysis of traffic noise impacts and abatement using the
TNM. This Handbook is not to be considered the sole resource for conducting traffic noise studies using
the TNM, but rather as a tool for producing consistent, predictable, and repeatable traffic noise studies.
In addition to this Handbook, the analyst is also expected to follow the guidance provided in the
documents text shown in the reference section of this document.
This document is divided into two primary sections. Section 1 provides information and guidance for
“pre-modeling” activities including data collection, land use/field reviews, and sound level monitoring.
Section 2 provides information and guidance for the computer modeling and analysis of traffic noise
including the evaluation of abatement alternatives. The remaining sections of this document provide
information regarding the requirements for the documentation of both modeling input and results and
information regarding public involvement as it relates to traffic noise studies.
________________________ 1
For additional information regarding the TNM, analysts are referred to Traffic Noise Model: Frequently Asked Questions (FAQ’s) at: http://www.fhwa.dot.gov/environment/noise/traffic_noise_model/tnm_faqs/faq00.cfm

FDOT Traffic Noise Modeling & Analysis Practitioners Handbook
May 5, 2015 Page 7
1.0 PRE-MODELING ACTIVITIES
This section provides information and guidance for activities that take place prior to undertaking
computer modeling.
1.1 Noise Methodology Meeting
Prior to performing the project traffic noise analysis, a methodology meeting or teleconference should
be held with the District Noise Specialist. This meeting establishes an agreed upon methodology and
provides for sharing of necessary information and direction for the noise analysis (i.e., modeling
parameters, developed lands, undeveloped lands, special land uses, available survey data, field
measurement locations for model validation, etc). Any required noise-specific public involvement
efforts and expectations should also be discussed. A set of project aerials and photos of project specific
issues, such as advertising or community signs help to clarify discussion. The noise methodology
meeting will be documented with meeting minutes that are part of the official project file.
1.2 Data Collection: Traffic Data
The Project Traffic used for traffic data in the TNM will be developed in accordance with FDOT Topic
525-030-120-h (dated April 17, 2012 or latest version) and the Project Traffic Forecasting Handbook
(latest version). Each of these documents is available online from the Department. All preparers of
traffic data used in the TNM shall ensure that the latest FDOT Topic and procedures are followed. To
assist in the gathering of the traffic data, a sample traffic data form is included in Appendix A. Traffic
data should be in a format similar to the example form in Appendix A and be provided in the Noise Study
Report (NSR) or NSR Addendum. Traffic forecasts are developed during the PD&E study of a project. The
resulting traffic data is typically reported in a Traffic Report. Traffic data used in noise studies should be
reported in a format similar to that provided in Appendix A.
In some cases, traffic data will need to be obtained for both the roadway which improvements are
proposed and other major/minor roadways (cross streets) in the project area that influence traffic noise
levels at nearby receptors. For example, if there are noise sensitive receptors for a widening project in
close proximity to an interchange for an interstate or other limited access facility, traffic data will have
to be prepared for the cross street because vehicular traffic on both roadways may contribute to the
total noise level at the receptors, and one or the other roadway could cause abatement measures to be
ineffective. Information for any roadways that may influence the results of the TNM should be provided
by the traffic engineer preparing the project traffic forecasts. Required data should be properly vetted
during the project’s scoping efforts or during contract negotiations to ensure that all sources of
potential noise impacts are included within the traffic data development stages for the project. This
would include any and all potential noise sensitive receptors that are in close proximity to the project
and shall include arterial roadways, collector-distributor (CD) roads, frontage roads, and other
roadways.
FDOT Traffic Noise Modeling & Analysis Practitioners Handbook
May 5, 2015 Page 8
As stipulated in the FDOT Noise Policy (Part 2, Chapter 17, Section 17-4.2 of the PD&E Manual), to
ensure that “worst case” traffic noise conditions are used in the analysis, the following traffic volume
and speed conditions shall be applied:
For roadways (interstate mainline, CD roads, frontage roads, arterial roads, ramps, etc.), the
traffic volumes will represent the directional planning analysis hour Level-of-Service (LOS) “C”
peak hour, peak direction volume as specified by the most recent FDOT Quality/Level of Service
Handbook Tables for Project Traffic volumes operating less than LOS C or the Project Traffic
peak hour directional demand volume if the facility operates at LOS A, B or C. This will ensure
that the worst case (higher noise generating speed conditions) is represented.
The Level of Service “C” peak hour, peak direction volume for project specific conditions shall be
determined from Table 7, 8 or 9 (as appropriate) of the current FDOT Quality/LOS Handbook
Tables2. Of note, the same LOS C volume shall be applied to both directions of travel to ensure
the highest noise generating speed conditions are represented. This is different than the
procedure to generate traffic data when using the Project Traffic peak hour directional volumes
as noted above.
For interchange ramps, the traffic volume is the peak hour demand volume for the specific ramp
being analyzed.
The vehicle speed to be used in the TNM is the posted speed for existing/no-build conditions,
and the proposed posted speed for the future build condition. If the proposed posted speed is
unknown, then the design speed is to be used. The motor vehicle speed used for ramps will be
the posted speed and that speed is applied along the entire ramp unless modified by the flow
condition (e.g., the speed along a loop ramp may vary from the time a vehicle leaves the
mainline until it reaches the end of the ramp).
If FDOT Quality/LOS Handbook LOS C threshold directional volumes are used in the analysis (i.e., LOS C
volumes are lower than Project Traffic volumes), the analyst should proceed to Step 3 below to obtain
the volumes for each of the five vehicle types to be input into the TNM.
If Project Traffic peak hour demand volumes are to be used, the analyst should proceed to Step 2 below
unless Directional Demand Hourly Volumes (DDHV) are provided. Occasionally, demand traffic data may
be provided in the form of an Annual Average Daily Traffic (AADT) volume. In this case, the analyst will
proceed with the following process, beginning with Step 1.
AADT volumes are reduced to demand hourly volumes (DHV) as follows (again, if FDOT Quality/LOS
Handbook LOS directional volumes are to be used, Step 1 below can be skipped):
1. DHV = AADT volume x K(standard)
Example: AADT of 50,000 vehicles x K (standard) of 9% (or 0.09) = 50,000 x 0.09 = 4,500.
________________________ 2
The FDOT LOS Tables can be accessed at: http://www.dot.state.fl.us/planning/systems/programs/sm/los/pdfs/fdot%202012%20generalized%20service%20volume%20tables.pdf

FDOT Traffic Noise Modeling & Analysis Practitioners Handbook
May 5, 2015 Page 9
2. Directional Demand Hourly Volumes (DDHV) are calculated using the Directional Factor (D) to obtain
the peak and non-peak directional volumes. If the D factor is 55% on a bi-directional roadway or
one-way pair, the directional volumes are calculated as follows:
4,500 x 55% = 2,475 vehicles for peak direction, which leaves a balance of 2,025 vehicles (or
DHV * (1 – D)) for the non-peak direction demand hourly volume.
3. The number of heavy trucks (HT), medium trucks (MT), buses, and motorcycles used in the TNM is
obtained by applying the respective percentages for those vehicle types to the calculated directional
volume (rounding up to the nearest whole number) for the peak hour.
4. Notably, if the percentage of automobiles is not provided by a traffic engineer, it is calculated by
subtracting the number of HT, MT, buses and motorcycles from the total directional volume being
used.
Example: Assuming HT, MT, bus, and motorcycle peak hour factors of 3%, 2%, 1%, and 0.5%,
respectively, and a Directional Design Hourly Volume of 2,475, the number of automobiles,
HT, MT, buses and motorcycles in the peak direction of travel would be 2,314, 74, 50, 25 and
12, respectively.
Example: Assuming HT, MT, bus, and motorcycle factors of 3%, 2%, 1%, and 0.5%,
respectively, and a peak directional volume (PDV) of 2,475, the number of automobiles, HT,
MT, buses and motorcycles in the peak direction of travel would be 2,314, 74, 50, 25 and 12,
respectively.
1.3 Data Collection: Roadways, Receptors, and Other Input Items
The “Z” coordinate input to the TNM establishes the elevation of the modeled objects. It is important to
use the most accurate elevation data available for all components of the modeling input, especially for
roadways, receptors, and barriers (existing and proposed). In order of preference, the following is a list
of acceptable sources of elevation data:
1. For receptor points, project specific survey data (i.e., spot elevations). The number will vary depending on the length/scope of the project;
2. Cross sections from roadway design plans;
3. Digital terrain model (DTM);
4. LIDAR (Light Detection and Ranging), an aerial method of mapping and survey;
5. As built plans for an existing roadway; and
6. United States Geological Survey (USGS) quadrangle maps.
1.3.1 Roadway Data
The FDOT or a project’s prime consultant provides the plans necessary to obtain data for the horizontal
roadway alignment for existing roadways, and the proposed improvements for a roadway and new
alignments. This data shall be obtained for all roadways included in the analysis. For a PD&E study,

FDOT Traffic Noise Modeling & Analysis Practitioners Handbook
May 5, 2015 Page 10
vertical data for a proposed roadway alignment/alternative may not be available. In this case, the
analyst consults with the District Noise Specialist or District Project Manager to determine the source of
elevation data to be used in the TNM. In most cases, as-built roadway plans (or the best available data)
are appropriate for use.
During the design phase of a project, vertical alignment data for a roadway is obtained from the
project’s design plans. Vertical alignment data for cross streets may have to be obtained from other
sources (such as those listed in Section 1.3) if insufficient coverage is available in a project’s plan set.
For projects with a new alignment, consult with the District Noise Specialist and the prime consultant to
determine the best available data to use in the analysis.
The source for the horizontal and vertical roadway alignment data that are used in the modeling efforts
shall be documented in the NSR or NSR Addendum for the project.
1.3.2 Receptor Data
Elevation data for the modeled receptors is just as critical as that for the roadway. However, this data
typically cannot be obtained from roadway plans since the receptors in the analysis are outside the
right-of-way.
As listed in Section 1.3, the United States Geological Survey (USGS) is a common source for elevation
data, with the data being available on topographic (topo) maps on the USGS website. The USGS website
provides a “National Map Viewer”3 which is a Geographic Information System (GIS) based interface
containing various datasets. One of the available tools of this GIS provides spot elevations for nearly any
location within the United States.
LIDAR and DTM are other sources of elevation data. Both may be available in a GIS based format from
the Florida Geographic Data Library (FGDL).4
In the case of planned and permitted developments, it may be possible to obtain elevation data from
the developer or the site plan for the community.
Regardless of the source of elevation data, it is important to recognize the vertical datum that is being
used for the project, and ensure its consistency with the sources of elevation data used for TNM input
objects. There are two types of vertical datum commonly used; the National Geodetic Vertical Datum of
1929 (NGVD 29) and the North American Vertical Datum of 1988 (NAVD 88). The vertical datum being
referenced on a project should be documented in the roadway plans, or available from the prime
engineering firm or FDOT if plans are not being prepared. Additionally, the source(s) of elevation data
should be referenced in the NSR or NSR Addendum.
________________________ 3 The National Map Viewer can be accessed at: http://viewer.nationalmap.gov/viewer/
4 The Florida Geographic Data Library can be accessed at: http://www.fgdl.org

FDOT Traffic Noise Modeling & Analysis Practitioners Handbook
May 5, 2015 Page 11
1.3.3 Other Input Items
Elevation data, including the height and bottom (ground) elevation of privacy walls and/or earth berms
that exist or are planned to be located between a roadway and noise sensitive sites are required, as
these features may have an acoustic effect on predicted noise levels. For this reason, all existing walls
and earth berms should be surveyed if possible, for use as input into the TNM. It is also important to
note the material used to construct existing privacy walls during the field review of the project
(discussed in Section 1.4 below). Open-weave walls, open-board fences, wooden privacy fences, chain
link fences, and similar privacy features are typically not dense enough to provide meaningful
attenuation, and are not included in a traffic noise analysis.
1.4 Land Use/Field Reviews
Regardless of the size, scope, or general nature of a project, land use and field reviews of the project
area are an essential part of an analysis. The size and scope of a project determines the number of land
use/field reviews to be performed, with a minimum of two preferred.
The primary goal of the field review is to identify existing land uses adjacent to the project corridor for
which there are noise abatement criteria. These properties are included in the modeling/analysis.
While technology (Google Earth, etc.) makes it simple to perform a “desktop” review of the project area,
there are some land uses that cannot be identified without a field visit. One example would be the
number of dwelling units in a multi-family building, or a duplex that from an aerial photograph appears
to be a single-family residence when in fact it contains more than one dwelling unit.
When conducting the land use/field review for a project, it is important to note the “exterior area of
frequent human use” for multi-family (MF) buildings (e.g., apartments and condominiums). When an
evaluation includes Activity Category “D” sites (the interiors of schools, libraries, places of worship, etc.),
it is also important to note the construction material used for the buildings (wood frame, masonry, etc.).
In the absence of exterior areas of frequent human use, this information will be used to determine the
sound level reduction factor that should be applied to the modeling results to predict interior traffic
noise levels (for those Activity Categories for which an interior criteria apply). Additional information
regarding sound level reduction factors to be used can be found in the FHWA’s “Highway Traffic Noise:
Analysis and Abatement Guidance” document.
Another goal of the land use review is to note any potential conflicts that could arise in areas of
potential noise abatement. For engineering issues, conflicts should be further verified/discussed with
the engineers developing the conceptual or final design. These include utilities (both overhead and sub-
surface), drainage features, access requirements (driveways, cross streets, etc.), outdoor advertising, or
any other factors that may impact the placement or routine construction of a noise barrier. The earlier
in the process that these types of potential conflicts are identified, the less likely they are to create an
issue later in the project. The FDOT or the prime consultant will provide detailed utility data to the
extent practical and called for in the project scope.

FDOT Traffic Noise Modeling & Analysis Practitioners Handbook
May 5, 2015 Page 12
It is also important to note any signs of new development or zoning changes on undeveloped lands.
Local government property records should be reviewed to ensure that new building permits have not
been issued for undeveloped lands. A review of property records is needed during the design phase to
ensure no new building permits were issued prior to the Date of Public Knowledge, but after the PD&E
noise study was completed.
At least one, if not more, additional land use review(s) should be conducted throughout the life of the
project to verify if any land use changes have occurred, and also to review potential noise abatement
locations for conflicts as detailed above.
1.5 Determining Existing Noise Levels
Noise measurements are taken in the project study area to determine existing noise levels for projects
on new alignment (in this case existing traffic noise levels cannot be modeled using the TNM). A
combination of measurements and modeling is performed to validate the TNM for use on a project,
where an existing roadway is being improved. Regardless of the intent, all measurements shall be
conducted in accordance with the requirements detailed in FHWA’s publication “Measurement of
Highway Related Noise”4 (MHRN)5 and the applicable sections of the FDOT Noise Policy (Part 2, Chapter
17 of the FDOT PD&E Manual). An example noise level measurement data sheet is provided in
Appendix B.
1.5.1 Equipment
A sound level meter (SLM) plays a key part in model validation since the results of the monitoring efforts
are used to validate the TNM and/or determine existing noise levels. It is important to use equipment
that is accurate and well maintained. At a minimum, the SLM shall be calibrated following the suggested
frequency recommended by its’ manufacturer. The calibrator emits a pure tone that matches the
calibration requirement of the SLM manufacturer. Additional information regarding the noise level
measurement equipment is available in the MHRN document.
All noise level readings shall be taken using the “A” weighting scale and on the “slow” response setting.
The SLM shall be mounted so that the microphone is oriented in the direction of the traffic noise source
consistent with the manufacturer’s recommendations.
The microphone shall be located five feet above ground level or five feet above the base level of the
noise sensitive receptor of interest. A windscreen designed for use on the SLM shall be used at all times
during the field measurement period. Prior to the field measurement period, the SLM shall be
calibrated and the results noted on the field data sheet. The SLM shall also be calibrated at the end of
the field measurement period. If the difference between the two calibrations is greater than one dB,
the measurement period shall be repeated.
_________________________ 5
http://www.fhwa.dot.gov/environment/noise/measurement/measure.cfm
FDOT Traffic Noise Modeling & Analysis Practitioners Handbook
May 5, 2015 Page 13
1.5.2 Site Selection and Data
The number of validation sites to be used is project specific and shall be coordinated with the District
Noise Specialist. If practical and possible, validation sites should coincide with potentially impacted
locations. Residential communities are of particular interest, especially communities that have
expressed traffic noise concerns. Additionally, validation sites shall be selected in an area that is
representative of free-flow conditions (i.e., there are no traffic control devices such as traffic signals or
stop signs nearby). Monitoring shall be performed for a minimum of 30 minutes (3 repetitions of 10
minutes each) at each selected monitoring site.
Validation studies require that accurate field data be obtained for the locations where field
measurements are obtained. One way to obtain the location of the SLM is to use a global positioning
system (GPS) unit that has an accuracy of 0.5 meters or better. If using a GPS unit isn’t practical, aerial
photography or a set of plans for the project can be used to establish the location of the validation site.
A measuring wheel or measuring tape can be used to obtain the distance from the edge of pavement of
the roadway and at least two other points (an intersecting street, drainage feature, power pole, home,
etc).
Analysts also locate and identify features that may influence the measured noise levels, including
ditches, berms, privacy walls, canals, streets, parking lots, buildings, billboards, etc. The location and any
details of these features are to be noted on the site sketch or plan set. Taking photographs of the site is
recommended.
If the pavement condition does not reflect an average pavement type, one of the alternative pavement
types that more accurately reflects the actual pavement condition may be applied. Note – Use of this
alternative pavement type in the TNM is only applicable to validation efforts and the prediction of
existing traffic noise levels, and is not to be used for the prediction of future traffic noise impacts, and
must be approved by the District Noise Specialist. While in the field, note if the roadway is an urban
curb and gutter configuration or if it has paved shoulders and grass swales. The dimensions of all of
these features, including traffic safety devices such as “Jersey” barriers at the shoulder or in the median,
and the height above the roadway shall also be obtained. Analysts should not rely on the construction
plans to provide all of the information regarding site details, geometry, etc. for the modeling effort.
Since the TNM cannot account for noise other than traffic, analysts must be certain that traffic noise is
the dominant noise source. Activities such as lawn mowing, children playing, air conditioning units, and
aircraft flyovers can dominate the background noise levels to an extent that the traffic source is
relegated to a lesser impact. If this is the case, the noise level monitoring equipment should be relocated
to a more suitable site. During each measurement period, the sources of the sounds other than those
resulting from traffic on a roadway are noted on field measurement data sheets.
1.5.3 Meteorological Data
While the meteorological data (other than the default values for relative humidity, temperature, and
wind) are not used in TNM, it is important to note the actual field conditions prior to and during the field

FDOT Traffic Noise Modeling & Analysis Practitioners Handbook
May 5, 2015 Page 14
measurements. This will document the appropriateness of the weather conditions for taking field
measurements. Temperature and humidity can affect the sensitivity of SLM’s and may result in the SLM
not recording the noise accurately or, in some cases, not at all. To ensure that this does not happen, it is
important to know and adhere to the manufacturer’s operating conditions for the SLM and calibrator in
use. The temperature and humidity can easily be determined by the use of a hand-held or mounted
thermometer and hygrometer. The wind speed and direction can also be determined through the use of
a hand held or mounted anemometer and compass. If the observed wind speed exceeds the
recommended limits in the MHRN document, measurements shall be suspended until conditions
improve or postponed until a later date. Rain and/or wet roads could result in higher noise and shall be
avoided during monitoring.
1.5.4 Traffic Counts and Classification
Obtaining traffic data in the field is the key to successful model validation. At a minimum, analysts must
separate traffic counts by direction and vehicle type consistent with the FHWA/TNM vehicle
classification system for use in traffic noise studies (shown in Table 1 below).
Table 1: Vehicle Classification for Traffic Noise Studies
Autos
Medium
Trucks Heavy Trucks Buses Motorcycles
Description 2 axles and 4
tires
2 axles and 6
tires, and
designed to
haul cargo
Cargo vehicles
with 3 or more
axles
All vehicles
designed to
carry more than
9 passengers
All vehicles
having 2 or 3
tires with an
open-air driver
and/or
passenger
compartment
Examples
Passenger
cars, pick-up
trucks
Large pickup
with dual rear
tires, delivery
vans, local
moving vans,
dump trucks,
service trucks,
motor-homes
Tractor-trailer
units, including
dual rear tire
pickups pulling
a trailer, large
motor-homes
with 3 axles,
large dump
trucks
Local and long
distance buses,
hotel/airport
vans, school
buses
Harley
Davidson,
Honda Gold
Wing, Yamaha
and other
makes of
motorcycles
Source: FHA Report FWHA-PD-96-046 – Measurement of Highway-Related Noise, May 1996.
1.5.5 Traffic Speeds
Since traffic noise levels are, in part, speed dependent, every effort should be made to accurately depict
the traffic speed for each vehicle type during the measurement period. Traffic speeds are best obtained
through the use of a hand-held radar gun or similar device. Some roadways may have higher or lower
volumes of one vehicle class versus another, and it is very important to obtain the speed of each vehicle
class, especially the low volume variety, which are most often buses and motorcycles. Capturing speeds

FDOT Traffic Noise Modeling & Analysis Practitioners Handbook
May 5, 2015 Page 15
for as many vehicles in each vehicle class is recommended. The overall goal of measuring traffic speeds
is not to get the fastest speeds, but rather an accurate representation of the speeds for all vehicle types
observed during each measurement period.
1.6 TNM VALIDATION
This section describes the process that shall be used to validate noise levels obtained in the field. The
primary purpose of the field measurements are to determine if traffic is the primary noise source in the
area and to validate the computer model using the conditions observed in the field. As required by the
FHWA (23 CFR 772.11(d)) (2) and the FDOT Noise Policy (PD&E Manual Part 2, Chapter 17, Section 17-
5.2), field measured traffic noise levels must be compared to the predicted results under the same
conditions. To do this with a consistent degree of accuracy, the information gathered in the field during
the time of the sound level measurements is key.
Since the TNM predicts traffic noise levels that represent steady-state noise for a period of one hour,
field samples that are collected for periods of less than one hour must be converted so they reflect an
hourly condition. For example, if the monitoring is conducted for 10 minutes and during that 10
minutes 100 autos, four medium trucks, 10 heavy trucks, zero buses and one motorcycle were counted,
each value shall be multiplied by six to obtain hourly values (if the measurement period was 15 minutes,
the volumes shall be multiplied by four). The measured speeds would be applied to all vehicle types
based on the average readings taken for each vehicle type. If no speed was recorded for a particular
vehicle type, the analyst should use the average speed of all other vehicle types during that
measurement period.
For the purpose of model validation, the actual pavement type may be used in the TNM as long as the
pavement type is verified by FDOT.
Next input any barriers, building rows, terrain lines, or ground zones that existed at the measurement
site. Privacy walls are to be included in the modeling if the density of the construction material is
enough to provide reasonable noise attenuation. See FHWA’s Noise Barrier Design Handbook for further
discussion on noise transmission loss. Open-weave walls, open-board fences, wooden fences, chain link
fences, and similar privacy structures shall not be included in the modeling effort since they may have
little or no noise reduction impact on the measured noise levels. The District Noise Specialist shall be
consulted for any questions regarding features to be included in the TNM.
TNM results shall be reviewed for consistency with the field measured data. If the results are within the
accepted FHWA and FDOT limit of +/- 3 dB(A), the validation effort will be considered complete. If this is
not the case, then the modeled results must be reviewed in detail to determine if a site feature was not
correctly accounted for within the modeling input, or if sources of sound other than motor vehicle traffic
during the measurement period had too great an influence. If the difference between the measured
and modeled noise cannot be reconciled, the measurement period (or site if all measurement periods
fail) cannot be used for the purpose of validating the model. If validation measurements were not
obtained at any other site, the field measurements must be repeated until at least one measurement

FDOT Traffic Noise Modeling & Analysis Practitioners Handbook
May 5, 2015 Page 16
period is validated. If the results indicate that the measured noise levels are higher than those predicted
by the TNM, an explanation should be provided as to why the measured levels were higher (i.e., other
sound sources were present during the monitoring that cannot be accounted for using the TNM).
The results of the model validation effort shall be documented in the appropriate NSR or NSR
Addendum. Documentation shall include a table within the report that shows the field measured value,
the modeled value, and the difference between the two. Copies of the field measurement data sheets
must be provided in the appendix of an NSR. The location of each validation site shall also be illustrated
on the same plan sheets/aerials as the modeled receptors.
FDOT Traffic Noise Modeling & Analysis Practitioners Handbook
May 5, 2015 Page 17
2.0 TNM Modeling & Analysis Guidelines
This section provides guidance for the TNM input that is typically used in the analysis of projects by and
for the FDOT. Specific questions or concerns not addressed here should be directed to the appropriate
District Noise Specialist.
Quality assurance (QA) and quality control (QC) are essential to ensure a high quality report with
consistent, predictable, and repeatable results. A checklist provides assurance that the QA/QC review
efforts have occurred. An example modeling QC checklist is provided in Appendix C.
2.1 File Naming Conventions and File Information
This section provides guidance for setting up a TNM file using a logical naming convention and the type
of information to be included in the model run, roadway, and receptor and barrier identification. The
FHWA Traffic Noise Model User’s Guide recognizes that use of the term “File” is a misnomer. The term
“File” is used for consistency with most window-based programs. A TNM run is saved in a subdirectory
(i.e. folder) and the logical naming convention is applied to the folders. Sharing a TNM run with
someone else requires that you transfer the entire folder.
The names of input files should be simple, short, and descriptive (significant extensions may cause the
TNM file to be deemed inaccessible). Due to limitations on the total number of characters in a file
name, input files should also not be saved inside a long string of folders. The file name should be
descriptive enough to clearly let the user know what project and scenario is being evaluated.
Standardizing the naming of input files will make it easier for an analyst (and others that might need to
use a TNM file) to locate and open each file as needed. The following provides example input file names
for a project on US 27 for which the existing, future no-build, future build, and abatement scenarios are
being evaluated:
US27EX (i.e., existing)
US27NB (i.e., no-build)
US27B (i.e., build)
US 27BAR1 (i.e., barrier 1)
2.1.1 Run Identification Input
Analysts shall use the TNM’s run identification input to document additional information about the
project and scenario being evaluated. Run titles should essentially mirror the input file name. For
example, if the input file name is “US27EX”, the run title would be “US 27 – Existing”. If a project is
divided into segments, the project segment being evaluated shall also be identified (e.g., US 27 –
Existing - Elden to Pace). If a project is segmented for other reasons, such as the typical section, the
segment identification can also be included in the title (e.g., US 27 – Existing - Segment 1). Where
segment numbers are used the limits of each segment shall be defined in the NSR. If stationing is
available, analysts could also use the beginning and end station for each segment.

FDOT Traffic Noise Modeling & Analysis Practitioners Handbook
May 5, 2015 Page 18
When identifying the organization in the run identification input, analysts shall identify either the FDOT
District or company that is preparing the analysis (e.g., District One, Central Office, XYZ Consulting
Company). Under the Project/Contract heading, provide the FDOT Financial Project Identification
Number (FPID) or, if unavailable, the contract number. Finally, the individual performing the analysis
shall be identified by their initials. This will allow any future modeling questions to be directed to the
appropriate person within the FDOT or the consulting firm responsible for the modeling input.
Figure 1 illustrates how this information would appear for an example project, assuming the analysts’
name is Michelle Miller and she is an employee of the FDOT District One.
Figure 1: Run Identification
2.2 TNM INPUT
2.2.1 State Plane Coordinate System
The state plane coordinate system shall be used to define the X and Y coordinates of all roadways,
receptors, barriers, and other features input to the TNM. The use of the state plane system allows for
consistent replication of project information (unlike the use of an aerial or roadway plan sheet with a
user-drawn coordinate system).
2.2.2 Roadway Input
a. General
The first input you will provide related to roadways (including ramps and roadways on structure) is the
name of the roadway. Roadways should be identified consistently throughout the modeling process.
Naming roadways is best done by identifying both the roadway and the direction. For example, I-95 NB
FDOT Traffic Noise Modeling & Analysis Practitioners Handbook
May 5, 2015 Page 19
could be used to identify northbound I-95. The use of stationing is recommended for segment or point
identification as well.
b. Roadway Travel Lanes and Shoulders
Consistent with the TNM Manual/FAQ guidance, individual roadway lanes should be modeled and the
lanes shall overlap. The input for paved shoulders shall be such that the shoulder overlaps the travel
lane adjacent to the shoulder. Both can be accomplished by inputting the X, Y, and Z coordinates of the
centerline of each lane or shoulder and adding 0.2 feet to the width of the travel lane or shoulder (e.g., a
travel lane with a width of 12 feet shall be input as 12.2 feet). The pavement width used shall represent
either the existing or planned roadway width, depending on the scenario being evaluated.
It should be noted that the use of lane by lane modeling will greatly increase the model calculation or
“run” time. For this reason, analysts shall use the lane by lane modeling for the project roadway being
evaluated but not necessarily for all roadways included in the TNM input file. For example, on an
interstate widening project, analysts shall model all travel lanes on the interstate individually, while it is
acceptable to “group” travel lanes together for other roadways such as arterials, interchange ramps and
CD roads.
As with all TNM input items, the naming convention used is important. When using lane-by-lane
modeling, analysts shall identify each lane being modeled (e.g., inside, center, outside, etc). The
locations of shoulders shall also be identified (e.g., inside and outside).
Modeled roadways shall extend at least eight times the distance between the roadway and the most
distant receptor, with the receptor centered along the roadway. For instance, a modeled roadway
segment should extend at least 4,000 feet in either direction beyond a receptor that is located 500 feet
from the center of the road.
c. Intersecting Roadways
Model any intersecting roadway that carries a substantial volume of traffic, if this information is
available, and the traffic noise from the intersecting roadway would likely influence the predicted traffic
noise level at nearby noise sensitive receptors. Minor cross streets or other roadways in the vicinity of a
project usually do not require modeling.
d. Pavement Type
The pavement type default is “average” and must be used in the prediction of future traffic noise levels.
For existing noise level prediction or for model validation studies, the actual pavement type may be
used, but only if the pavement type can be verified by the FDOT.
e. Elevated Roadways
The “Z” coordinate of roadway segments is an important TNM input. If a roadway is elevated and on fill
the roadway itself becomes a barrier if it lies between a receptor and some or all of the roadway lanes
FDOT Traffic Noise Modeling & Analysis Practitioners Handbook
May 5, 2015 Page 20
being evaluated (or other roadways). This is not the case for roadway segments on structure, when
sound can pass under the structure.
It is important to locate and identify all roadway segments on structure (bridge). Doing so ensures, (1)
intersecting roadways will not cause a TNM-generated error message, and (2) that sound from other
roadways is allowed to pass through/underneath the structure (i.e., the elevated roadway does not act
like a barrier as discussed above). Please refer to the TNM User’s Manual for additional information
regarding the modeling of roadways on structure.
f. Roadway Length
Since roadways rarely run in a straight line and on a flat plane, most roadways have to be segmented to
allow the accurate depiction of real-world conditions. To accomplish this, segments of varying length
must be used to reflect changes in gradient or curvature. The more curvature you have, the greater
number of segments you will be required to input.
g. Roadway Medians
Paved roadway medians shall be modeled either as a zero-traffic roadway, or as a “pavement” ground
zone. Regardless of the method used, the analyst shall ensure that the width is enough so that the TNM
doesn’t “assume” default ground type on either side of the median. If using a zero-traffic roadway, 0.2
feet can be added to the width of the median roadway input to ensure sufficient overlap (as with
ensuring overlap of individually modeled roadway travel lanes and shoulders). If the roadway median
ground type is something other than TNM’s default ground type (i.e., lawn), then a ground zone of the
appropriate type shall be modeled.
2.2.3 Traffic Volumes, Speeds and Flow
a. General
As stated in Section 1.2, when peak hour demand volumes are used in an analysis, traffic volumes are
calculated for the peak and off peak directions of roadway travel. When receptors are located on both
sides of the roadway of interest, the analyst should create two TNM files to represent worst-case
conditions. Concurrence on the application of directional traffic splits should be obtained from the
District Noise Specialist.
One TNM input file would have the peak traffic on the northbound travel lanes (off peak traffic on the
southbound travel lanes), and receptors on the east side of the roadway. The second TNM input file
would have the peak traffic on the southbound travel lanes, off peak traffic on the northbound lanes,
and receptors on the west side of the roadway. Use of this method ensures that the “worst-case”
conditions are evaluated for all receptors, regardless of which side of the roadway they are located on.
The assignment/division of traffic amongst individual travel lanes depends on the circumstances
surrounding the roadway. If there are no known restrictions (high occupancy vehicle (HOV) lanes, truck
lanes, etc.) then the peak directional traffic is divided evenly by the number of travel lanes being
modeled. This division of traffic typically results in something other than a whole number. In this case,

FDOT Traffic Noise Modeling & Analysis Practitioners Handbook
May 5, 2015 Page 21
round up to the next whole number (e.g., a derived value of 947.6 autos per lane would be rounded up
to 948 autos per lane).
When a roadway project involves HOV lanes or designated lanes for certain vehicle types, the analyst
assigns the appropriate type and volume of vehicle to the appropriate travel lane.
b. Flow Control
Flow control allows you to address the impact of vehicle acceleration away from selected traffic control
devices such as stop signs, toll booths, traffic signals, and on-ramp start points. The speed constraint
used should be obtained from the TNM Manual. In general, 100 percent of vehicles are affected by all
devices except traffic signals, which typically catch only a portion of vehicles on their red phase. The
percentage of the vehicles affected is 100 percent unless a traffic study or signal timing indicates
otherwise.
2.2.4 Receptors
a. General
Receptors should be located so that they are consistent with the guidance found in Part 2, Chapter 17,
Section 17-4.3 of the PD&E Manual. Like roadways, receptor points should be labeled in a manner that
is logical and consistent. Typically, alpha/numeric systems are used, starting on one side of the roadway
and working south to north or west to east, consistent with the survey stationing. This process is then
repeated on the opposite side of the roadway as well. If a project has been segmented or there are
distinct noise study areas (NSA’s), an analyst may want to use a receptor identification system that
includes NSA identification (e.g., letters or numbers). For example, the 23rd receptor on the west side of
I-95 within the third NSA could be identified as “3-W-23”. (Caution – ID’s can clutter the aerial display
so they should be as simple and brief as possible with the requirement that aerials be completely
legible).
To distinguish receptors located on the first and second floors, additional letters shall be assigned to the
receptor ID. In the example above, the ID’s for receptors on the first and second floor would be “3-W-
23A” and “3-W-23B”, respectively. Regardless of the specific labeling convention that is used, be sure to
describe what convention was used in the NSR, and use it consistently.
Receptor placement is important as it can determine if a property is impacted and affect the results of
noise barrier analyses and optimization. Analysts may have to develop two sets of receptors for the
same property depending on the purpose of the modeling effort. If the purpose is to determine
whether a property is impacted, the placement of the receptor should be as stipulated in Part 2,
Chapter 17, Section 17-4.3 of the PD&E Manual (i.e., the area of frequent exterior use).5
If the purpose is to determine whether a noise abatement measure, especially a noise barrier, would
benefit a property, additional receptors may be required.

FDOT Traffic Noise Modeling & Analysis Practitioners Handbook
May 5, 2015 Page 22
Figure 2 illustrates a situation where additional receptors, for the same property, should be considered
in a noise barrier evaluation. As shown, only considering abatement for the first scenario would be
inappropriate since more of the property is impacted and requires abatement consideration. The
second scenario depicts the correct receptor placement for the purpose of determining noise barrier
effectiveness.
Figure 2: Receptor Placement
Assuming uniform characteristics (distance from roadway, land use, topography, etc.), it is acceptable to
combine receptor points that may be located more toward the “middle” of the community.
Modeling of special use locations such as parks, playgrounds, trails, and non-standard sites like schools
and places of worship will require extra attention to receptor placement and shall be done by applying
the principles illustrated in the FDOT research report: “A Method to Determine Reasonableness and
Feasibility of Noise Abatement at Special Use Locations” (“Special Use” methodology).
__________________________________________ 5
Unless the area of frequent human use is identified elsewhere, residential receptor sites should be placed at the edge of the dwelling unit closest to the major traffic noise source or as dictated by professional judgment.
FDOT Traffic Noise Modeling & Analysis Practitioners Handbook
May 5, 2015 Page 23
Due to the various types of special use locations, any questions regarding the application of this
methodology to site specific conditions are to be directed to the District Noise Specialist.
Documentation of decisions and rationale is of extreme importance.
TNM’s default receptor height is 4.92 feet above ground, and this value shall be changed to 5.0 feet.
When selecting receptor sites, receptors shall be included such that all potentially impacted sites are
either specifically modeled or are represented. The number of receptors modeled will vary depending
on the location of the receptors in proximity to one another and their distance from the roadway(s) in
the TNM input.
For an arterial roadway in an urban area that has a uniform distance from the roadway to numerous
noise sensitive sites, a single receptor may be used to represent the sites for the purpose of the noise
impact assessment as long as the roadway and traffic characteristics are consistent within the area of
concern. For roadways that vary in alignment and elevation (i.e., an urban highway that has frequent
overpasses, underpasses, interchanges and ramps), numerous receptors will need to be modeled as
these features can significantly affect motor vehicle acoustics.
The Receiver “Adjustment Factors” tab provides the analyst the ability to manually adjust the predicted
noise level from a roadway segment to a receiver to account for things that cannot be modeled by the
TNM (background noise, other transportation noise sources, etc.). Do not use this function unless the
expected change to the predicted traffic noise level is three or more dB(A) consistent with FHWA
guidance found in Appendix A of the TNM User’s Manual. If you do use an adjustment factor, the
feature that causes the need for an adjustment and the reasons for applying the adjustment must be
fully quantified/validated and documented prior to finalizing the TNM results.
b. Multi-Story Receptor Height
Unless more accurate data are available, for receptors located on the second floor of a building analysts
shall add 10 feet to the “height above ground” for receptors on the first floor. The elevation of all
additional floors shall increase at the same 10 foot interval. Application of the guidance found in Section
17-4.3 of the PD&E Manual is acceptable, especially during the PD&E phase.
c. Receptor Locations for Non-Residential Receptors
The following is guidance for consideration of special situations.
For Activity Category A sites (lands on which serenity and quiet are of extraordinary
significance), the receptor point(s) are to be located at a point(s) representing an area of
frequent human use and at a point(s) closest to the roadway that is anticipated to generate the
greatest noise impact. The FHWA must approve of the use of Activity Category A receptors.
Sites at Recreational Vehicle (RV) parks are to be treated as Activity Category B of the NAC. Each
location within an RV park that has a “hookup” (i.e., connection for electrical, water, sewer, etc.)
is treated as one (1) residential receptor.
FDOT Traffic Noise Modeling & Analysis Practitioners Handbook
May 5, 2015 Page 24
For Activity Category C sites, (i.e., active sport areas, amphitheaters, cemeteries, hospitals, etc.)
the placement of the receptor point(s) will depend on the type of site.
o For active sport areas, the locations of receptors need to be consistent with the
guidance provided in the “Special Use” methodology. An array/grid of receptors is
placed in areas of use and where impacts are expected to be predicted. If an impact is
identified, the same receptor array/grid is used to determine the feasibility and cost
reasonableness of abatement.
o For amphitheaters, the outdoor seating areas and/or the performance stage are
typically the primary areas of concern. The application of the “Special Use” methodology
receptor array/grid as noted above is used to assess the extent of impacts and
abatement.
o For auditoriums, appropriate exterior receptor locations are placed at features that
attract frequent human use (e.g., gazebos). If no exterior use area(s) exist, then the
receptor is considered Activity Category D and is located at an interior point that would
be a site of frequent human use, such as a stage, seating area, etc. As stated in the
FDOT Noise Policy (Part 2, Chapter 17 of the PD&E Manual), the prediction of interior
traffic noise levels will be coordinated with the District Noise Specialist. If interior levels
are to be predicted, the analyst refers to Table 17.2 in the FDOT Noise Policy (Part 2,
Chapter 17 of the PD&E Manual) that provides the appropriate reduction factor to be
applied to the predicted exterior noise.
o Campgrounds have receptors placed at points where camping facilities (e.g., grills,
patios) are designated (regardless of whether there is an active occupant).
o At cemeteries, receptors are placed in an array/grid and follow the same analysis
procedure noted above for active sport areas.
There are several types of Activity Category E sites for which the following guidance is provided.
o Hotels and motels that have an outdoor pool or other gathering areas (e.g.,
shuffleboard court, grill, etc.) that can be considered a frequent exterior use area.
These locations are modeled to identify potential impacts. In such cases, if the
pool/outdoor use area is located in an area protected by the building, the building itself
is modeled as a barrier to accurately reflect the nature of the site.
o Offices that have outdoor features that are a gathering area (e.g., table(s), awning(s),
etc.) used by employees and others. The FHWA considers these areas to be exterior
areas of frequent human use and they are modeled if potentially impacted by traffic
noise.
o Restaurants/bars that have outdoor seating areas at which customers are served are
considered noise sensitive. Receptor point(s) are placed at the point of frequent human
use within these areas that is closest to the traffic noise source.

FDOT Traffic Noise Modeling & Analysis Practitioners Handbook
May 5, 2015 Page 25
Since there are no Noise Abatement Criteria established for such properties, it is not necessary
to model Activity Category F and G properties.
As previously noted, the placement of receptors for the establishment of traffic noise impacts may not
be consistent with the placement of receptors for the purpose of determining the effectiveness of noise
abatement efforts, especially for larger use areas like campgrounds, parks, trails, school grounds, and
similar uses. In these cases, the placement of additional receptors is established following the guidance
found in the “Special Use” methodology.
2.2.5 Noise Barriers
a. General
To achieve consistency in the modeling and analysis of noise barriers, it is recommended that the
following step-by-step noise barrier evaluation process be adhered to. The evaluation process focuses
on selecting an optimized noise barrier configuration with consideration given to barrier aesthetics. The
optimization process considers the amount of noise reduction provided by a barrier, the number of
impacted and benefitted receptors, and the cost reasonableness of constructing a barrier.
Prior to initiating the noise barrier modeling process, consideration is given to the grouping of impacted
receptors into a single NSA depending on the proximity of receptors and the roadway characteristics.
The density of residences within a community also is to be considered. When considering how to group
one or more communities, groups should be defined as such that they are consistent with the FDOT
Policy (Part 2, Chapter 17 of the PD&E Manual) definition of “Common Noise Environment” (a group of
impacted receptors of the same NAC must benefit from the same continuous noise barrier or noise
barrier system (i.e., overlapping/continuous noise barrier)).
b. Basic Noise Barrier Input
The title of the barrier should be descriptive enough to clearly identify whether the barrier is a berm or
wall, whether it is located on or within the right of way (ROW) line, on or near the shoulder, on
structure, or a combination of these locations. Currently, it is the FDOT’s preference to place noise
barriers at or near the ROW. However it may be necessary to consider a shoulder or structure barrier if
a ROW barrier is determined to be acoustically ineffective or not cost reasonable. Chapter 32 “Noise
Barriers” of the FDOT Plan Preparation Manual (PPM) and/or the PD&E Manual are consulted to
determine the current FDOT height restrictions for noise barriers on structure and if there are any safety
offsets required for barriers at or near the roadway shoulder. The noise analyst consults with the District
Noise Specialist concerning the preferred placement of noise barriers.
Within the FDOT ROW, consideration should be given to “wrapping” barrier ends at roadway
intersections. Doing so may improve barrier performance by reducing the amount of sound flanking
around the ends of the barrier.
If placement of a noise barrier at the ROW (or other location outside the clear zone) is not possible due
to engineering constraints or other limitations, ground mounted noise barriers can also be placed within
FDOT Traffic Noise Modeling & Analysis Practitioners Handbook
May 5, 2015 Page 26
the clear zone at a distance of no less than 16 feet from the edge of the nearest travel lane (four feet
behind a guardrail or other crash tested device that is located 12 feet from the edge of the nearest
travel lane).
The “Z” coordinate at the bottom of the barrier is the actual ground level and can be expected to vary
along the length of the wall, sometimes dramatically. Analysts should ensure that any variation is
accounted for in the TNM input file. Sources of this information are discussed in Section 1.2 of this
document. A field review can help you decide what level of accuracy is needed for PD&E efforts, but
when noise barriers are being considered for a project’s design phase, only cross sections should be
used for establishing ground level along a noise barrier within the right-of-way (to an accuracy level of
1.0 foot or better).
Existing barriers (berms, noise barriers, privacy walls) shall be included in a TNM input file as a fixed
barrier if the material and thickness of the barrier would provide a sound level reduction. This would
include a median or shoulder barrier (e.g. a solid traffic “Jersey” barrier). Privacy walls with slatted
openings or similar patterns, regardless of their composition, typically do not provide significant noise
reduction to be considered in the modeling effort. If there is any question regarding the
appropriateness of modeling an existing wall, consult with the District Noise Specialist to determine the
appropriate input.
c. Initial Noise Barrier Length and Height
A noise barrier is to be input into the TNM at a length that is considerably greater than what one might
anticipate would be needed to maximize noise reduction so that traffic noise flanking the ends of the
noise barrier is considered in the analysis. In this document, this is referred to as the “unadjusted noise
barrier length”. A good starting point is to have the barrier extend beyond the end/last receptor at least
approximately four times the perpendicular distance between the receptor and the noise barrier. The
unadjusted barrier length can also be influenced by other features, such as intersecting cross streets and
driveways. In these cases, land use or geographic features may dictate the unadjusted barrier length.
When modeling noise barriers as abatement features, the unadjusted barrier length is subdivided,
typically into 20-foot to 100-foot increments (with the 20-foot segments at the ends and the 100-foot
segments in the middle of a barrier), so that small portions of the noise barrier at either end can be
raised or lowered as needed during the optimization process.
During PD&E and unless there are significant increases/decreases in ground elevation, noise barriers are
typically modeled at constant heights from 8 to 22 feet in two-foot increments to the maximum height
as dictated by the FDOT Plans Preparation Manual (PPM), Volume 1, Chapter 32 (currently 22 feet). If,
at these heights, the cost of a noise barrier is close to, but exceeds the cost reasonableness guideline,
the incremental height of the barrier is reduced by one foot.

FDOT Traffic Noise Modeling & Analysis Practitioners Handbook
May 5, 2015 Page 27
d. Noise Barrier Optimization
A final recommendation for a noise barrier should be for a barrier that benefits the most impacted
receptors (i.e., a 5 dB(A) reduction) while achieving the noise reduction design goal (7 dB(A)) for at least
one impacted receptor) and the cost of the barrier is at or below the cost reasonable limit. Every
attempt should be made to maximize the noise level reduction while maintaining a cost per benefited
receptor at or below the reasonable limit. It is important to note that analysts should not “stop”
optimizing a barrier once the noise reduction design goal is achieved or a benefit is provided to
impacted receptors (i.e., do not just design the barrier to meet the minimum noise reduction criteria).
Noise reduction results for the unadjusted barrier length at a particular height are reviewed to
determine which impacted receptors would benefit from a noise barrier at that particular height.
Impacted receptors that cannot be provided at least a 5 dB(A) reduction at a particular height for the
unadjusted barrier length are dropped from consideration when evaluating that particular height. The
height for the 20-foot to 100-foot segments at either end of the noise barrier should be lowered to zero
feet while evaluating the amount of noise reduction achieved to maintain the same number of impacted
and benefited receptors as the unadjusted barrier length for that particular height, while also achieving
the noise reduction design goal. In other words, at each evaluated barrier height, the length of the
barrier should be optimized such that only those impacted receptors benefiting from the barrier are
considered. The objective of this process is to achieve noise reduction requirements while also
minimizing excess barrier length and thus reducing the overall cost (and the cost per benefited receptor)
of the noise barrier. Although benefiting the maximum amount of impacted receptors is preferable,
receptors that require excessive amounts of barrier length to be benefited may be dropped from
consideration if the result is a cost reasonable noise barrier for other impacted receptors that are
benefited.
In the design phase analysis, the barrier length and height that maximizes the number of impacted
receptors that can be benefited at a cost below the reasonable limit should be identified. For this barrier
configuration, the barrier length that will maximize the number of receptors that are provided the noise
reduction design goal (7 dB(A)) while maintaining cost reasonableness should also be determined. This
assists the District Noise Specialist in determining a recommended barrier configuration that maximizes
noise reduction while still considering cost.
When optimizing a noise barrier, consideration should be given to minimizing the number of “steps”
along the top of the noise barrier due to fluctuations in the ground elevation at the base of the noise
barrier. If “steps” along the top profile of the noise barrier are necessary due to changing ground
elevations, every attempt should be made to minimize the size of the steps to 0.5 feet or less. It is also
important to report the noise barrier height as the “height above finished grade” so that a portion of the
bottom panels of the noise barrier are not buried, which may result in a lower overall noise barrier
height than what was recommended.
FDOT Traffic Noise Modeling & Analysis Practitioners Handbook
May 5, 2015 Page 28
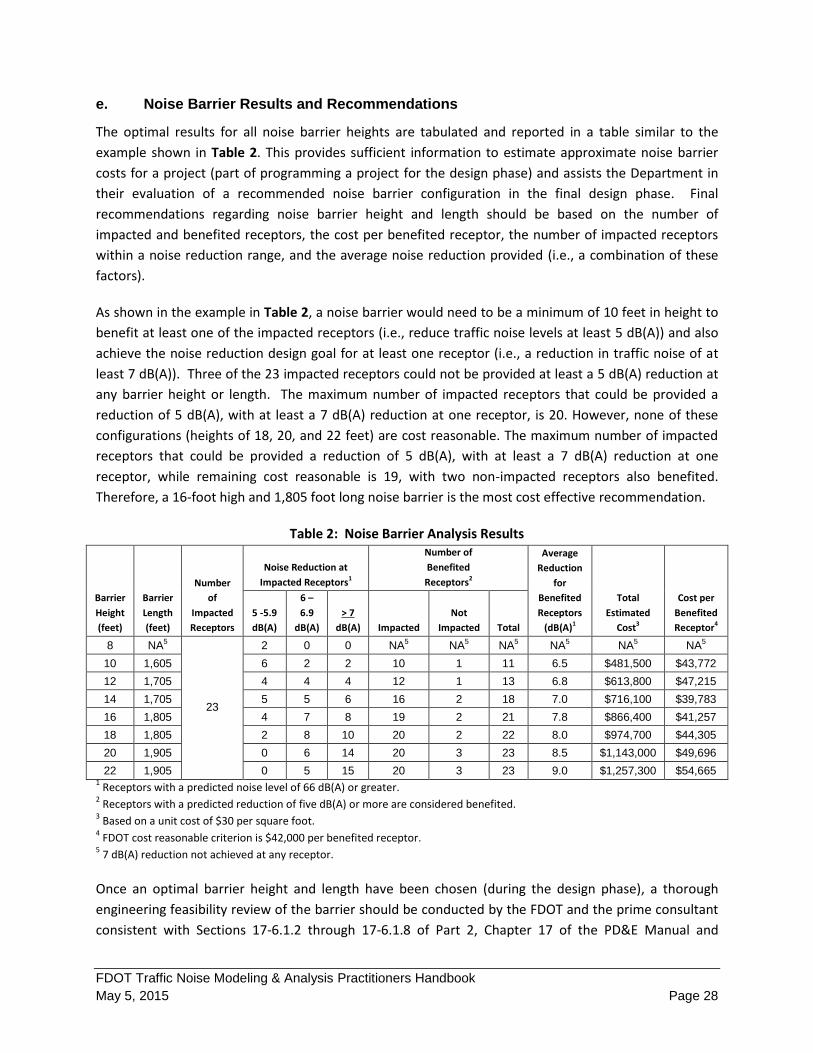
e. Noise Barrier Results and Recommendations
The optimal results for all noise barrier heights are tabulated and reported in a table similar to the
example shown in Table 2. This provides sufficient information to estimate approximate noise barrier
costs for a project (part of programming a project for the design phase) and assists the Department in
their evaluation of a recommended noise barrier configuration in the final design phase. Final
recommendations regarding noise barrier height and length should be based on the number of
impacted and benefited receptors, the cost per benefited receptor, the number of impacted receptors
within a noise reduction range, and the average noise reduction provided (i.e., a combination of these
factors).
As shown in the example in Table 2, a noise barrier would need to be a minimum of 10 feet in height to
benefit at least one of the impacted receptors (i.e., reduce traffic noise levels at least 5 dB(A)) and also
achieve the noise reduction design goal for at least one receptor (i.e., a reduction in traffic noise of at
least 7 dB(A)). Three of the 23 impacted receptors could not be provided at least a 5 dB(A) reduction at
any barrier height or length. The maximum number of impacted receptors that could be provided a
reduction of 5 dB(A), with at least a 7 dB(A) reduction at one receptor, is 20. However, none of these
configurations (heights of 18, 20, and 22 feet) are cost reasonable. The maximum number of impacted
receptors that could be provided a reduction of 5 dB(A), with at least a 7 dB(A) reduction at one
receptor, while remaining cost reasonable is 19, with two non-impacted receptors also benefited.
Therefore, a 16-foot high and 1,805 foot long noise barrier is the most cost effective recommendation.
Table 2: Noise Barrier Analysis Results
Barrier
Height
(feet)
Barrier
Length
(feet)
Number
of
Impacted
Receptors
Noise Reduction at
Impacted Receptors1
Number of
Benefited
Receptors2
Average
Reduction
for
Benefited
Receptors
(dB(A)1
Total
Estimated
Cost3
Cost per
Benefited
Receptor4
5 -5.9
dB(A)
6 –
6.9
dB(A)
> 7
dB(A) Impacted
Not
Impacted Total
8 NA5
23
2 0 0 NA5 NA5 NA5 NA5 NA5 NA5
10 1,605 6 2 2 10 1 11 6.5 $481,500 $43,772
12 1,705 4 4 4 12 1 13 6.8 $613,800 $47,215
14 1,705 5 5 6 16 2 18 7.0 $716,100 $39,783
16 1,805 4 7 8 19 2 21 7.8 $866,400 $41,257
18 1,805 2 8 10 20 2 22 8.0 $974,700 $44,305
20 1,905 0 6 14 20 3 23 8.5 $1,143,000 $49,696
22 1,905 0 5 15 20 3 23 9.0 $1,257,300 $54,665 1 Receptors with a predicted noise level of 66 dB(A) or greater.
2 Receptors with a predicted reduction of five dB(A) or more are considered benefited.
3 Based on a unit cost of $30 per square foot.
4 FDOT cost reasonable criterion is $42,000 per benefited receptor.
5 7 dB(A) reduction not achieved at any receptor.
Once an optimal barrier height and length have been chosen (during the design phase), a thorough
engineering feasibility review of the barrier should be conducted by the FDOT and the prime consultant
consistent with Sections 17-6.1.2 through 17-6.1.8 of Part 2, Chapter 17 of the PD&E Manual and

FDOT Traffic Noise Modeling & Analysis Practitioners Handbook
May 5, 2015 Page 29
Chapter 32 of the FDOT PPM to ensure the recommended barrier can be constructed as planned, or if
further refinements are necessary before proceeding with the noise barrier specific public involvement.
f. Parallel Noise Barriers
A parallel barrier situation rarely occurs. Should this be the case, the determination of how to model this
condition will be determined by the width to height ratio, which is the ratio of the separation between
two parallel barriers (W), their average height (HAVG), and the amount of insertion loss degradation. As a
rule, if the W / HAVG ratio is 10:1 or more, the insertion loss degradation is negligible and the modeling of
the parallel barrier condition is not required. If the ratio is less than 10:1, contact the District Noise
Specialist for guidance on how to model this condition.
2.2.6 Building Rows
If a large building or series of buildings exist between a roadway and modeled noise sensitive sites,
analysts shall include the building(s) as building rows in the TNM input file. The average height of the
building row and the percentage of the row that provides noise reduction to receptors behind the row is
a necessary part of the input. The maximum percentage of coverage allowed by TNM for a building row
is 80%. If a row of buildings occupies more than 80% of the entire length of the row, then model the
building row as a barrier.
In some cases, such as where a building is a large apartment or office building, it is best to model those
structures as barriers. The name of the building row should reflect the nature of the row and its relative
location if warranted. If data regarding the height of a structure is not readily available, assume 10 feet
for each story of a building or mobile home, 12 feet for a single-story home, and 22 feet for a two-story
building. For each additional floor of a building or residence, add 10 feet. The Z coordinate of a building
row shall always be the ground elevation at the face of the building.
2.2.7 Terrain Lines
A terrain line should be used in areas where topographic features alter the propagation path for traffic
noise. For example, terrain lines shall be used to define the bottom of the slope for roadways on
fill/embankment, and also for roadways constructed on mechanically stabilized earth (MSE) or retaining
walls. If a particular roadway segment is on fill/embankment or MSE wall, and a terrain line is not used
to represent the bottom of the slope or the bottom of the MSE wall, TNM will assume the ground line
extends from the roadway edge out to the next closest object, which may be a receptor, which would be
an inaccurate representation of the conditions. The use and modeling of terrain lines should follow the
guidance provided in the TNM/FAQ. Remember to use care in the placement and application of terrain
lines since they may have a significant impact on the predicted noise and model run times.
2.2.8 Ground Zones
Ground zones are used when you have a large area of ground that is different than the default ground
type used in your project setup information. With the exception of dry ponds that are designed to hold

FDOT Traffic Noise Modeling & Analysis Practitioners Handbook
May 5, 2015 Page 30
runoff and will not contain water all the time, all water features shall be included in the TNM input file if
they are located between the roadway and modeled receptors.
2.2.9 Tree Zones
FHWA guidance contained in the TNM User’s Manual suggests that for tree zones to be included in an
input file they should consist of long, wide regions of heavy, non-deciduous woods and undergrowth,
not just individual trees or a row of trees. The vegetation must be sufficiently dense to completely block
the view along the propagation path. Since this condition is rarely possible, tree zones shall not be used
in a TNM input file unless otherwise directed by the District Noise Specialist.
2.2.10 Noise Contours
Currently, the TNM contouring program shall not be used. Instead, contours shall be developed by using
a receptor grid, the roadway’s typical section and approved traffic data. The resultant impact zone is
determined by using the edge of pavement of the roadway as the reference point.
Remember that contours are generalized and cannot be used to determine traffic noise impacts.
Instead, contours are used as a tool to assess the potential impacts of a variety of corridors or alignment
alternatives. They may also be used as land use planning tools when they are provided to local
government. In this case, the contours aid in future noise impact reduction as part of a local
government’s planning and zoning efforts.

FDOT Traffic Noise Modeling & Analysis Practitioners Handbook
May 5, 2015 Page 31
3.0 NOISE STUDY DOCUMENTATION
3.1 General
This section discusses the requirements for documenting the analyses that have been conducted for a
project including the validation of the TNM, the assessment of impacts, barrier analysis, and any noise
contour analysis. Example NSR outlines for both PD&E studies and design-phase reevaluations are
provided in Appendix D.
3.2 Validation Analyses
The efforts used to validate the TNM are documented in the project files in both hard copy and
electronic format. For the efforts related to model validation, analysts include the following information
in the files and within the appendices of the appropriate report (NSR or NSR Addendum):
A listing of all measurement equipment used, and the results of the field calibrations;
A listing of all traffic data (volume, speed, and classification) obtained and a source of the data;
A table summarizing the measured and predicted sound level differences for each validation
site;
The TNM files used in the validation effort placed on a CD with the appropriate Read Me file.
3.3 Impact Assessment
The following items are included in the NSR or NSR Addendum to support the analyses that were
conducted to ascertain the impact of traffic noise within the project corridor:
A table or appendix documenting traffic volumes, classification, and speeds used in the analyses
for existing, future no-build, and future build conditions that were modeled;
For a PD&E study, a table showing the predicted modeling results for existing, future no-build,
and future build conditions. This table may be included in the body of the text (as a summary
table if desired) or as an appendix to the report depending upon the number of receptors that
were modeled. For a project’s design phase, tables should be provided for the future build
condition only unless otherwise directed by the District Noise Specialist;
Typical sections of both existing and future roadways that were modeled;
A plan view or aerial overlay that shows the validation measurement sites, the modeled
receptors, potentially feasible/cost reasonable noise barriers (in the PD&E phase),
recommended noise barriers (in the design phase), and any related information. Cross streets,
neighborhoods of interest and key cultural features (e.g., schools, places of worship) as
referenced in the text shall also be identified.
FDOT Traffic Noise Modeling & Analysis Practitioners Handbook
May 5, 2015 Page 32
3.4 Noise Barrier Analyses
To document efforts related to the noise barrier evaluation, the following are included in the NSR or NSR
Addendum as appropriate:
A table showing the overall benefits and related costs of various barrier options considered (see
Table 2 in Section 2.2.5);
Figures or aerials that illustrate the location of all modeled noise sensitive receptors, noise
monitoring locations (if applicable), and noise barriers considered as being potentially feasible
and cost reasonable if the study is prepared during PD&E, or the final recommended barriers if
the study is prepared in a project’s design phase; and
In the appendix, all TNM input files on a CD with the appropriate Read Me file that describes
what area of a project is evaluated in each input file and the naming convention that was used.
3.5 Statement of Likelihood
During a PD&E study, the FDOT commits to construct noise barriers contingent upon their being
determined feasible, cost reasonable and supported by the adjacent community/communities during a
project’s design phase when detailed engineering data is available. Consistent with the requirements of
23 CFR Part 772, NSR’s produced during the PD&E study must contain a “Statement of Likelihood”. A
sample statement is provided in the FDOT Noise Policy (Part 2, Chapter 17, Section 8-5 of the PD&E
Manual).
For those locations where noise barriers were determined to not be potentially feasible and reasonable,
it is also important to explain why this is the case (i.e. too many cross streets or driveway openings,
residences are located too far from the roadway to be benefited, etc.).
3.6 Noise Contour Analyses for Local Officials
Noise contours (i.e., areas of traffic noise impacts) shall be documented in the NSR in the form of a table
and/or figure consistent with the guidance found in Part 2, Chapter 17, Section 17-8.4 of the PD&E
Manual. On completion of a PD&E Study, the District office shall transmit the NSR with the contour
information to the appropriate local officials for use in future land use planning. A statement is included
in the NSR documenting this transmittal.
3.7 Construction Noise and Vibration
At a minimum, land uses or activities that have the potential to be affected by construction noise and/or
vibration are noted and included in the NSR or NSR Addendum. Table 17.3 in Chapter 17 of the FDOT
PD&E Manual provides a partial listing of those locations/land uses that have the potential to be
affected by construction noise and/or vibration.
If noise sensitive land uses adjacent to the project corridor are identified as having the potential to be
affected by construction noise and/or vibration, the FHWA desires that additional information (other
than referring to the FDOT “Standard Specifications for Road and Bridge Construction”) be provided in

FDOT Traffic Noise Modeling & Analysis Practitioners Handbook
May 5, 2015 Page 33
the NSR or NSR Addendum, including potential abatement alternatives (alternative construction
methods, temporary noise barriers, equipment shielding, etc.) to be considered.
3.8 Public Involvement
Public involvement is an important aspect of any transportation improvement project. Any public
involvement activities that take place as part of the project should be documented in the NSR or NSR
Addendum. At a minimum, describe the nature of the events that took place (workshop or hearing,
date, location, time, etc.) and note whether any traffic noise related issues were raised by the public
that were related to the project in question. If written comments are received regarding noise or
vibration issues, it is suggested they be included as an appendix to the NSR or NSR Addendum.
As discussed in the following section, the details of noise barrier specific public involvement with
individual communities should be documented, including an appendix containing copies of materials
sent to property owners when gathering a community consensus regarding potential noise abatement
options.

FDOT Traffic Noise Modeling & Analysis Practitioners Handbook
May 5, 2015 Page 34
4.0 NOISE SPECIFIC PUBLIC INVOLVEMENT
4.1 PD&E Study Public Involvement
Public involvement during a PD&E study typically contains two major events; a public workshop
(sometimes also referred to as an “alternatives public workshop”), and a public hearing for the project.
For the initial public workshop, the noise analyst should be prepared to discuss noise sensitive sites
within the project corridor, analysis procedures and the potential for traffic noise impacts utilizing
generalized noise contours.
At the public hearing for the project, the noise analyst should be prepared to discuss site specific results
of the noise study, including the location of impacted receptors and the potential for further noise
abatement consideration during the design phase, if applicable. A draft NSR should be available at the
public hearing.
4.2 Noise Barrier Specific Public Involvement in the Design Phase
It is important that prior to initiating noise barrier related public involvement during the design phase,
an optimal barrier length and height have been established and any engineering/constructability issues
related to the barrier have been identified and resolved.
Noise barrier specific public involvement includes informational meetings and written surveys to
affected property owners and tenants. In some cases, door-to-door and telephone solicitations are
necessary if insufficient responses are received on a written survey. As stipulated in the PD&E Manual,
it is the FDOT’s desire to obtain a response for or against a noise barrier from the majority of the
benefitted property owners and tenants that respond to the survey.
The following provides examples of the type of written correspondence prepared by the FDOT and
provided to property owners and tenants in connection with a noise barrier survey:
Notification Letter: This letter is mailed using regular (non-certified) mail services. The letters
are mailed to the address of the property of interest and to the property owner’s address, if
different than the property of interest. Property ownership information can be attained from
the property appraiser’s office/website for the county in which the project is located. The
notification letter alerts the property owner(s)/tenants of the FDOT’s intent and also informs
them that further information is forthcoming. If a noise barrier specific informational meeting is
being held; date, time, and location details are also provided in this letter.
Noise Barrier Survey Package: This package should include a certified letter from the FDOT
describing the roadway improvement project and the noise barrier(s) of interest, an exhibit
illustrating the proposed location of a barrier(s), information regarding the advantages and
disadvantages of noise barriers, available color and texture options (if applicable), and a noise
barrier survey form. The address of the property being surveyed and the registered property
owner’s name(s) should be shown on this form. It is recommended that each survey be
individually numbered for easier tracking once they are returned.
Copies of all design-phase traffic noise related public involvement materials should be provided as an
Appendix in the NSR Addendum to properly document survey efforts.

FDOT Traffic Noise Modeling & Analysis Practitioners Handbook
May 5, 2015 Page 35
5.0 CONCLUSIONS
Traffic noise studies are an important aspect of any roadway improvement project, beginning with the
planning level analysis in the PD&E phase and continuing into the design and/or design-build phases.
Analysts conducting traffic noise studies for the FDOT should be trained (or working under the direct
guidance of someone who is trained) in both traffic noise analysis and the use of the FHWA’s TNM.
From the beginning of the noise study, close coordination between the analyst, the District Noise
Specialist and both the consultant and FDOT project managers is of paramount importance. All
decisions made regarding the methodology used in the analysis should be discussed and clarified with
the District Noise Specialist prior to implementation and properly documented in the project file.
Data collection and the generation of TNM input will have a direct influence on the results and
recommendations produced at the conclusion of the study. Field reviews during the course of the study
can provide assurance that project conditions are being accurately represented in the TNM. Noise
barriers being considered for inclusion in the roadway construction plans should be thoroughly reviewed
for any engineering or geographic constraints that may preclude the construction of the noise barrier.
The methodology, results and recommendations of the noise study should be clearly documented in the
NSR or NSR Addendum for the project. Doing so ensures the reader (whether technical or layperson)
will have a clear understanding of the approach and outcome of the noise study.
Public involvement is vital to any transportation improvement project. Traffic noise concerns raised by
the public should be documented in the NSR or NSR Addendum as appropriate. Noise barrier specific
public involvement is just as important as it can dictate whether or not a noise barrier is to be
constructed as part of the project. Clearly conveying the results of the noise study and the advantages
and disadvantages of noise barriers can aid in the public’s decision making process.
Following the requirements stated in 23 CFR Part 772, the FDOT Noise Policy (Part 2 Chapter 17 of the
PD&E Manual), and the contents of this handbook will result in consistent, predictable and repeatable
traffic noise studies statewide.

FDOT Traffic Noise Modeling & Analysis Practitioners Handbook
May 5, 2015 Page 36
6.0 REFERENCES
FHWA Regulation and Guidance
1. Procedures for Abatement of Highway Traffic Noise and Construction Noise. 23 CFR Part 772.
Federal Highway Administration. Final Rule; Published in the Federal Register July 13, 2010;
Pages 39820 – 39839.
http://www.gpo.gov/fdsys/pkg/FR-2010-07-13/html/2010-15848.htm
2. Highway Traffic Noise: Analysis and Abatement Guidance. Federal Highway Administration. June
2010 (Revised December 2010); 76 pages.
http://www.fhwa.dot.gov/environment/noise/regulations_and_guidance/analysis_and_abatem
ent_guidance/
3. FHWA Traffic Noise Model Technical Manual. Federal Highway Administration. Final Report,
February 1998; FHWA-PD-96-010; 157 pages.
http://www.fhwa.dot.gov/environment/noise/traffic_noise_model/tnm_v25/tech_manual/inde
x.cfm
4. FHWA Traffic Noise Model Version 1.0 User’s Manual. Federal Highway Administration. Final
Report, January 1998; FHWA-PD-96-009; 171 pages.
http://www.fhwa.dot.gov/environment/noise/traffic_noise_model/old_versions/tnm_version_
10/users_guide/index.cfm
5. FHWA Traffic Noise Model User’s Guide (Version 2.0 Addendum). Federal Highway
Administration. Final Report, May 2002; HW266/H2008; 37pages.
http://www.fhwa.dot.gov/environment/noise/traffic_noise_model/old_versions/tnm_version_
20/tnm20cover.cfm
6. FHWA Traffic Noise Model User’s Guide (Version 2.5 Addendum). Federal Highway
Administration. Final Report, April 2004; HW-66/AS036; 36pages.
http://www.fhwa.dot.gov/environment/noise/traffic_noise_model/tnm_v25/users_manual/ind
ex.cfm
7. Traffic Noise Model: Frequently Asked Questions FAQs. Federal Highway Administration
Website.
http://www.fhwa.dot.gov/environment/noise/traffic_noise_model/tnm_faqs/faq00.cfm

FDOT Traffic Noise Modeling & Analysis Practitioners Handbook
May 5, 2015 Page 37
8. Measurement of Highway-Related Noise. Federal Highway Administration. Final Report, May
1996; FHWA-PD-96-046; 206 pages.
http://www.fhwa.dot.gov/environment/noise/measurement/measure.cfm
9. FHWA Construction Noise Handbook. Federal Highway Administration. Final Report, August
2006; FHWA-HEP-06-015; 185 pages.
http://www.fhwa.dot.gov/environment/noise/construction_noise/handbook/
FDOT Statute, Policy and Guidance
1. Florida Statute 335.17: State Highway Construction; Means of Noise Abatement. 2013 Florida Statutes, Title XXVI, Chapter 335, Section 17.
http://www.flsenate.gov/Laws/Statutes/2013/335.17
2. Noise. Florida Department of Transportation Project Development and Environment Manual,
Part 2, Chapter 17. May 24, 2011; 40 pages.
http://www.dot.state.fl.us/emo/pubs/pdeman/pdeman1.shtm
3. Noise Barriers. Florida Department of Transportation Plans Preparation Manual, Volume 1,
Chapter 32. July 2013; 18 pages.
http://www.dot.state.fl.us/rddesign/PPMManual/2013PPM.shtm
4. A Method to Determine Reasonableness and Feasibility of Noise Abatement at Special Use
Locations. Florida Department of Transportation Environmental Research Report FL-ER-65-97;
Updated July 22, 2009; 64 pages.
http://www.fhwa.dot.gov/environment/noise/noise_barriers/abatement/reasonableness/
5. Florida Department of Transportation Standard Specifications for Road and Bridge Construction; 2011; 996 pages.
http://www.dot.state.fl.us/specificationsoffice/Specs.shtm
6. 2013 FDOT Quality/Level of Service Handbook; http://www.dot.state.fl.us/planning/systems/programs/sm/los/pdfs/fdot%202012%20generalized%20service%20volume%20tables.pdf
APPENDIX A
Example Noise Study Traffic Data Form


APPENDIX B
Example Noise Measurement Data Sheet


APPENDIX C
Example TNM Input File QC Checklist

TRAFFIC NOISE MODEL (TNM) INPUT FILE CHECK LIST
Project Name and Limits:
County:
FPID Number:
FDOT District:
Analyst/Organization:
PROJECT ALTERNATIVE
Existing Conditions (Year ____)
No Build Conditions (Design Year ____)
Build Alternative (Design Year ____) Location: _____________________________
TNM INPUT
File Name: _________________________
Run Identification Correct
Units in file - English or Metric
Pavement type – Average & Default Ground Type – Lawn
Traffic volumes & posted speeds match Noise Study Report & Approved Traffic Volumes
Roadway and Ground Zones named correctly
Receiver heights (5 ft), Criteria (66 dBA), and Substantial Increase (15 dBA)
All noise sensitive areas/sites represented
Tree Zone heights and locations correct
Building Row heights and locations correct
Terrain Line heights and limits correct
Ground Zone designations and limits correct
Roadway width, elevations, and directions correct
Ground elevations at proposed barrier locations and receivers correct
Input file includes all appropriate Roadways, Ground Zones, Existing barriers/berms, Tree Zones,
Bridges, and Building Rows
Cross section data along roadway verified using skew view in TNM
TNM print outs checked for missing data and data consistent within each category
Name of Reviewer: _________________________
Date of Review: ____________________________
APPENDIX D
Example Noise Study Report Outlines

EXAMPLE PD&E NOISE STUDY REPORT (NSR) TABLE OF CONTENTS
EXECUTIVE SUMMARY
TABLE OF CONTENTS
List of Tables List of Figures List of Appendices
1.0 INTRODUCTION
1.1 Project Description (includes Project Location Map) 1.2 Proposed Improvements (includes conceptual typical section(s))
2.0 METHODOLOGY (opening paragraph references regulation, policy and TNM version)
2.1 Noise Metrics 2.2 Traffic Data 2.3 Noise Abatement Criteria (includes general discussion and application specific to the project) 2.4 Noise Abatement Measures (General Discussion)
2.4.1 Traffic Management 2.4.2 Alignment Modifications 2.4.3 Buffer Zones (includes noise contours and intended application of contours 2.4.4 Noise Barriers (includes discussion of minimum reduction requirements and cost reasonable
limit)
3.0 TRAFFIC NOISE ANALYSIS
3.1 Model Validation 3.2 Existing Noise Levels (documents noise monitoring to establish existing noise levels; usually only included
for new alignment projects) 3.3 Predicted Noise Levels and Abatement Analysis (includes discussion of impacts and noise barrier analysis
with each noise sensitive area addressed as a separate report section)
4.0 CONCLUSIONS (includes Statement of Likelihood)
5.0 CONSTRUCTION NOISE AND VIBRATION
6.0 COMMUNITY COORDINATION (documents any public comments specific to traffic noise, transmittal of
the Noise Study Report to local officials and references noise contours discussed above)
7.0 REFERENCES
APPENDICES
Appendix A Traffic Data
Appendix B Predicted Noise Levels
Appendix C Aerials (showing receptor points)
Appendix D TNM Modeling Files and PDF of the NSR (on disc, including “Read Me” file)

EXAMPLE DESIGN NOISE STUDY REPORT (NSR) ADDENDUM TABLE OF CONTENTS
EXECUTIVE SUMMARY
TABLE OF CONTENTS
List of Tables List of Figures List of Appendices
1.0 INTRODUCTION
1.1 Project Description (includes Project Location Map) 1.2 Summary of PD&E Results and Commitments 1.3 Design Improvements (includes comparison to PD&E conceptual design and design typical section(s))
2.0 METHODOLOGY (opening paragraph references regulation, policy and TNM version)
2.1 Noise Metrics 2.1.1.1 Traffic Data
2.2 Noise Abatement Criteria (includes general discussion and application specific to the project; includes discussion that the PD&E noise analysis determined no substantial increase)
2.3 Noise Abatement Measures (General discussion identifying noise barriers as only viable abatement measure based on PD&E noise study; includes discussion of minimum reduction requirements and cost reasonable limit)
3.0 TRAFFIC NOISE ANALYSIS
3.1 Model Validation (Only if validation update from PD&E noise study is needed) 3.2 Predicted Noise Levels and Abatement Analysis (includes discussion of impacts and noise barrier analysis
with each noise sensitive area addressed as a separate report section; includes selection of recommended noise barrier length and height)
3.3 Engineering Feasibility Review (includes discussion on noise barrier modifications to resolve construction conflicts
4.0 Outdoor Advertising (if applicable, discusses conflicts with outdoor advertising, resolution of conflicts and
fulfillment of FDOT responsibilities in accordance with F.S. 479.25)
4.0 CONCLUSIONS (includes discussion on fulfillment of PD&E commitments and tabulates specifics for each
recommended noise barrier to be included in the design plans and constructed with the project)
5.0 CONSTRUCTION NOISE AND VIBRATION
6.0 COMMUNITY COORDINATION (includes results of noise barrier survey specific to each noise barrier or
noise barrier system)
7.0 REFERENCES
APPENDICES
Appendix A Traffic Data
Appendix B Predicted Noise Levels
Appendix C Aerials (showing receptor points and noise barriers to be included in design plans)
Appendix D Noise Barrier Survey Package
Appendix E TNM Modeling Files and PDF of the NSR Addendum (on disc, including “Read Me” file)


