
Freshwater Fishing - The Official Web Site for The State of New Jersey

New Jersey Traffic Monitoring Program Last Updated: June 5, 2014
New Jersey
Traffic Monitoring Program
Prepared by:
Traffic & Technology Section
Bureau of Transportation Data and Safety
Capital Investment Planning & Grant Administration
In cooperation with:
Federal Highway Administration
New Jersey Division

New Jersey Traffic Monitoring Program
Last Updated: June 5, 2014 Page | 1
TABLE OF CONTENTS
Chapter 1: Introduction ...................................................................................................................2
I. Responsibility ..........................................................................................................2
Chapter 2: Permanent (Continuous) Monitoring Program ..............................................................3
I. Background ..............................................................................................................3
II. TVS Sites .................................................................................................................3
III. Major Station Sites ...................................................................................................4
IV. WIM Sites ................................................................................................................4
A. WIM Configuration and Installation ..................................................................4
B. System Maintenance ..........................................................................................6
C. Data Downloading .............................................................................................6
D. Data Processing ..................................................................................................7
E. System Calibration .............................................................................................9
Chapter 3: Short-Term Monitoring Program ................................................................................11
I. Background ............................................................................................................11
II. Standard Procedures...............................................................................................11
III. Geographic Information Systems (GIS) ................................................................13
Chapter 4: Traffic Data Formats ..................................................................................................16
I. Station Description Data Format ..........................................................................16
II. Traffic Volume Data Format .................................................................................17
III. Speed Data Format .................................................................................................19
IV. Vehicle Classification Data Format .......................................................................20
V. Weigh Data Format ................................................................................................21
Chapter 5: Database Maintenance ................................................................................................23
Chapter 6: Truth-in-Data Narrative ..............................................................................................23
Chapter 7: Regional Pattern Groups .............................................................................................26
Chapter 8: Infrastructure Renewal Program .................................................................................28
Appendices
Appendix A: FHWA 13 Class Scheme Graphic ...........................................................................29
Appendix B1: NJ Classification Scheme by Axle Spacing ..........................................................30
Appendix B2: NJ Classification Scheme by Axle Weight ...........................................................31
Contact Info ..................................................................................................................................32

New Jersey Traffic Monitoring Program
Last Updated: June 5, 2014 Page | 2
CHAPTER 1: INTRODUCTION
The Federal Highway Administration (FHWA) requires every state to submit a Highway
Performance Monitoring System (HPMS) report annually that contains roadway characteristics
and traffic data. This information is used in determining the funding for state highway projects.
New Jersey Department of Transportation’s (NJDOT) Traffic Monitoring Program supports the
HPMS and internal sections such as Pavement Design, Operations, and Planning.
The Bureau of Transportation Data and Safety (BTDS) is responsible for administering
NJDOT’s Traffic Monitoring Program, which is in compliance with Federal regulations and
guidelines. The program includes the collection, processing, summarization, and reporting of
traffic count data along New Jersey’s roadways.
NJDOT maintains a traffic monitoring program consisting of continuous and short-term
elements. Both of these elements are conducted by BTDS in accordance with the FHWA Traffic
Monitoring Guide (TMG) and the American Association of State Highway and Transportation
Officials (AASHTO) Guidelines for Traffic Data Programs. The traffic counting program is
designed to utilize, at a minimum, 48-hour short-term counts to produce estimates of Annual
Average Daily Traffic (AADT).
The permanent or continuous site elements consist of approximately 95 Traffic Volume/Speed
Stations (TVS), 90 permanent Weigh-in-Motion (WIM) System sites and 50 Major Stations of
Volume and Classification data collected monthly on seven (7) days duration.
The Short-Term Count Program includes about 5,500 Volume (48-hour) sites counted in a three-
year cycle and about 4,000 ramps counted in a six-year cycle. In addition, approximately 400
“special” counts are performed each year as needed. These special counts are normally
requested by NJDOT Engineers for projects and/or investigations. These counts include volume,
classification, or turning movement counts at intersections.
The traffic count data that is processed by the BTDS is provided to customers outside of NJDOT
if requested. These customers include engineering consultants, educational research facilities,
transportation planners, and other government agencies to name a few.
All processed traffic count data is available using an interactive map on the NJDOT’s website:
http://www.state.nj.us/transportation/refdata/roadway/
I. Responsibility
BTDS is the central clearing point for maintenance and dissemination of traffic volume,
classification counts and AADTs. All traffic count requests must be directed to BTDS to check
availability of data before requesting new counts or hiring consultants.
Current traffic counts are available through NJDOT intranet network only and by using “Data
Viewer 2” program. Prior year data are available to the public on the NJDOT webpage:
http://www.state.nj.us/transportation/refdata/roadway/
This document shall be periodically reviewed and/or revised as deemed necessary by BTDS.

New Jersey Traffic Monitoring Program
Last Updated: June 5, 2014 Page | 3
CHAPTER 2: PERMANENT (CONTINUOUS) MONITORING PROGRAM
I. Background
NJDOT’s traffic monitoring program includes TMS sites along the roadway where traffic data is
collected continuously 24 hours a day throughout the year, except during times of equipment
failure or maintenance. The permanent locations are installed on all types of roadways ranging
from Interstates to Minor Arterial Roads. The primary goal of the continuous count program is
to assist in understanding the time-of-day, day-of-week, and seasonal travel patterns and to
facilitate the development of seasonal expansion factors required to convert short-term counts to
accurate estimates of AADT.
The BTDS currently maintains approximately 95 permanent TVS, 90 permanent WIM System
sites and 50 Major Stations. These numbers increases and decreases based on construction
projects and/or equipment failures.
II. Traffic Volume Station (TVS) Sites
Each TVS location consists of two (2) vehicle detection loops imbedded in the pavement for
each travel lane and a cabinet that houses the Automatic Traffic Recorder (ATR), modem,
suppressors, and phone line/wireless hardware. Most of the ATRs that are being used throughout
the state of New Jersey are Peek ADR models. All components of each counting site (loops,
sensors, cabinet, ATRs, etc.) are tested and maintained by a consultant of the BTDS to ensure
that the system is working properly and accurate traffic data is being collected.
The permanent sites are polled daily via modem and TOPS software by Peek. The wireless sites
are polled using the TCP-Com software by TAL Technologies. The volume, speed, and
classification data is reviewed by the BTDS for irregularities and missing data. This quality
control check further ensures that accurate traffic data is being collected.
When problems in data are detected, an in-house technician will attempt to restore the site. If the
technician cannot resolve the problem, the consultant to the BTDS is contacted for a service call.
A technician from the consultant is then deployed to the site to troubleshoot the problem. If the
problem cannot be resolved then the site is shut down until a permanent fix can be incorporated.
For example, if the loops in one lane fail then the site will be put on the list for the BTDS’s
upcoming TMS Infrastructure Renewal Project for loop replacement. The TMS Infrastructure
Renewal Project is a heavy maintenance project that will be explained later in this document.
Once the monthly traffic data has been checked and considered good, it is entered into the
Traffic Data System (TRADAS) software for further processing. TRADAS is a traffic data
analysis system that provides data warehousing toolkit for managing our traffic count data.

New Jersey Traffic Monitoring Program
Last Updated: June 5, 2014 Page | 4
III. Major Station Sites
Major Station Sites are monitored monthly for seven (7) days using portable ATRs. Major
stations supplement our permanent volume and classification stations and are mostly located on
local system and collector roads. The BTDS monitors about 50 major station sites.
IV. Weigh-in-Motion (WIM) System Sites
The WIM program for NJDOT is maintained by the BTDS. Most of the WIM controllers used
are iSINC Systems Electronics by International Road Dynamics, Inc. (IRD). The WIM sites are
set up to collect traffic data such as volume, classification, speed, and weight using a loop-piezo-
loop-piezo-loop configuration. Vehicular classifications follow the 13-vehicle type guidelines
outlined in FHWA’s TMG. These sites are not polled like TVS sites; rather data is retrieved via
modem and/or direct IP access daily. Traffic data gathered from WIM sites are used for
pavement studies, capacity studies, freight studies, and enforcement. Classification and truck
weight data is processed and submitted to FHWA each month and summarized annually through
FHWA’s VTRIS software. The BTDS also supports the Long Term Pavement Performance
(LTPP) program providing data from the 10 Strategic Highway Research Program (SHRP) WIM
sites. The traffic data for these 10 WIM sites are submitted to a FHWA consultant each month.
A. WIM Configuration and Installation
NJDOT’s standard WIM configuration consists of a loop-piezo-loop-piezo-loop installation in
each travel lane. Although a standard WIM configuration includes two (2) loops, NJDOT
installs a third loop to ensure that the system can function properly in the event of a single loop
or sensor failure. NJDOT requires that loops and sensors have a warranty of 18 months and
WIM controllers have a warranty of three (3) years from the vendor from the time of acceptance.
There are two (2) types of piezo sensors that NJDOT uses for the WIM systems. For most sites,
the Roadtrax® Brass Linguini® (BL) class I axle polarized polyvinylidene fluoride (PVDF)
WIM sensor made by Measurement Specialties, Inc. (MSI) are used. The Roadtrax® BL Sensor
uses spiral-wrapped PVDF Piezoelectric film as the piezoelectric material. It can be installed
directly into a slot cut into the road with a relatively small cross section for permanent
applications. Its physical flexibility makes it easily conformable to any road transverse profile.
According to its vendors, “the BL sensors' unique flat design results in a more accurate count by
excellent signal to noise ratio (SNR) which has an inherent 10:1 rejection of road noise and
reduction of "ghost axles" due to road bending, adjacent lanes and bow waves of approaching
vehicles, conforming to the road profile giving a clean easy-to-read signal that translates into
accurate vehicle count, speed and WIM data”.
The other type of sensor is the Lineas® quartz piezoelectric Type 9195E WIM sensor made by
Kistler Instrumente AG (Kistler). The Kistler sensor utilizes quartz crystal force sensing
technology. It consists of an aluminum alloy profile in the middle of which quartz discs are
fitted every 5 cm under pre-loading. This structure allows the measurement of vertical forces,
such as wheel loads. The sensor is isolated from side forces by a special elastic material. It is
decoupled from lateral forces and measures only vertical forces, so no ghost axles appear. On

New Jersey Traffic Monitoring Program
Last Updated: June 5, 2014 Page | 5
the other hand, 100% of the forces on the top of the sensor are measured, so there is no lost
information. These sensors must be installed flush with the surface of any existing or new
asphalt or concrete pavement surface with epoxy adhesive. Unlike the BL sensor, the Kistler
sensor calibrations are not affected by temperature.
WIM installations must be performed in good weather (dry conditions during normal
construction months) and the pavement must be in new or good condition. For install locations
with poor pavement conditions, NJDOT requires a 2” mill/pave operation for a distance of 500’
in the vicinity of the WIM system. The following are important requirements for WIM
installations:
a. Saw-cuts should be cleaned by pressure wash and dried prior to installation and grouting.
b. Adjacent lane sensors shall be staggered.
c. Ensure that the grout cures and is capable of supporting traffic within a maximum of 60
minutes from installation.
d. Piezo sensors must be installed at a minimum of two (2) feet from cracks, joints, or saw-
cuts if possible.
e. Ensure that all loop detector, sensor, and lead in cable wiring are not spliced in the
roadway and have sufficient length for termination at the controller in the cabinet.
f. When the sensor grout is cured, grind it flush to the roadway surface using an angle
grinder.
In areas of new pavement operations, the loop detectors shall be installed in the base course and
sealed before the installation of the surface course. In areas of existing pavement, the pavement
shall be saw-cut in the surface course. Loop detectors are 6’x6’ in size and consist of four (4)
turns of wire in each location.
All roadway sensors are installed in a saw-cut in the surface course. The sensors must be long
enough to cross the entire length of each travel lane and be active across that distance.
Temperature sensors (for BL sensors) are installed with a saw-cut in the shoulder area adjacent
to the cabinet. The temperature range for the temperature sensor should be between -40 °C to
+110 °C.
All equipment needed to operate a WIM site shall be housed in a controller cabinet adjacent to
the roadway or in the median where applicable. Housed inside the cabinet include the following
components:
a. WIM controller.
b. Communication equipment (dial-up modem or NJDOT Ethernet set-up).
c. Power and communication surge protection.
d. Backup power supply.
e. Operating software.
f. All necessary interconnecting cables and miscellaneous materials to make an operational
system.
New Jersey Traffic Monitoring Program
Last Updated: June 5, 2014 Page | 6
Once the system has been installed and is up and running, NJDOT requires that a calibration be
performed before acceptance. Calibration procedures will be discussed later in the chapter.
B. System Maintenance
The BTDS has a consultant under contract that provides labor and materials to perform routine
preventative maintenance/inspection and on-call repairs for all WIM and TVS sites. WIM and
TVS preventative maintenance and inspections should be done at least once a year and include
the following procedures:
a. Electronic testing of in-road loops and sensors.
b. Maintain and clean system components.
c. Visual inspections of the infrastructure including:
- Loops and Sensors (cracking, missing grout/epoxy, etc.)
- Junction Boxes
- Roadway condition
d. Vegetation control around the cabinet.
e. Maintain controller and meter cabinets (vacuum clean, replace filter, etc.).
f. Maintain a log of visits and what was performed.
g. Maintain software (provide upgrades and support as necessary).
On-Call repairs are performed when the BTDS notifies the consultant that TMS equipment is
malfunctioning after an in-house technician has identified the problem. The consultant shall
begin on-site repairs within seven (7) working days for non-emergency repairs and within 48
hours for emergency repairs. Examples of non-emergency repairs include replacement of
backup batteries and fuses. Examples of emergency repairs include nonresponsive
communications, lane(s) not collecting data, and nonresponsive sensors/loops.
C. Data Downloading
Raw data is downloaded on a daily basis remotely from the BTDS office. In cases where
communications have been temporarily lost due to modem/telephone failures, data can be
retrieved from on-site using a laptop connection. Although data is downloaded remotely every
day, not every site is downloaded every day. This is because of the number of WIM sites and the
time it takes to download data. On average, one site is downloaded at least once a week each
month. The raw data files are stored, by day of the month and site, on the BTDS’ network drive.
Before any data is downloaded on each site, BTDS staff views live traffic to ensure all lanes are
working and classifying properly. If problems are found, corrective action is taken to fix the
problems. If the problems cannot be resolved then a service call is provided to the maintenance
consultant.
The data is downloaded different ways depending on how the site is set up to communicate.
These ways are through a dial-up connection via 56k modem, Verizon wireless 3G/4G/LTE data
plan or though the NJDOT’s fiber optic network.

New Jersey Traffic Monitoring Program
Last Updated: June 5, 2014 Page | 7
D. Data Processing
Once a whole month’s of data is downloaded, the monthly processing procedure begins. The
processing procedure includes a number of checks in regards to volume, classification, truck
weights, and speed. The primary software programs used by the BTDS are IRD’s iSINC office
and iANALYZE.
A monthly report and FHWA TMG records are produced each month for each site. The monthly
report includes a class by day of the month summary, class by front axle weight summary, class
by gross vehicle weight (GVW) summary, and a site summary. IRD’s iSINC office is the
primary software used to create the reports and records. In select instances for special reports,
volume by direction for example, IRD’s iANALYZE is used. iANALYZE is also used to create
special reports requested by NJDOT engineers, planners, or outside customers.
The class by day of the month summary is reviewed for irregularities in volumes and
classifications for each lane of travel. Volumes are checked for consistency throughout the
week. Normally, weekends and holidays include less traffic than a typical weekday. The
exception is on routes that motorists use to commute to the New Jersey shore for weekend and
holiday getaways during summer months. These routes may experience higher volumes on the
weekends and/or holidays. In cases where there is irregularities in volume data (no data for the
day or inconsistent data), these days are considered “bad” and they are removed from the
classification and weight cards. Classification data is also checked in this summary report.
NJDOT uses the FHWA 13 Class Scheme (Class 1-13 with Class 14 being unclassified
vehicles). Quality checks for classification include checking for a high percentage Class 3
vehicles (near equal, equal to, or greater than Class 2), Class 5 vehicles greater than 5%, and
Class 14 vehicles greater than 2%. When Class 3 vehicles are irregular for certain days, those
“bad” days are removed from the classification and weight cards. In the event that the Class 5
and/or Class 14 thresholds are exceeded for a lane, that direction is considered “bad” for
classification and weight. Therefore, the direction in question is used for volume only.
Appendix A includes a graphic illustrating the FHWA 13 classification scheme.
Front axle weights for Class 9 trucks are verified for each travel lane. Whether a truck is empty
or loaded, its front axle weight should range from 8,000 to 12,000 pounds. The front axle weight
summary table for each lane is reviewed to ensure that the majority of Class 9 trucks fall within
this range. If the range is shifted below 8,000 pounds, then the lane is considered to be under
calibrated. Lanes that are over calibrated see a shift in range that is over 12,000 pounds. Lanes
that are under or over calibrated are noted not to be used in VITRIS processing. In addition, the
calibration and auto calibration factors for these lanes are reviewed via remote connection to the
WIM controller. Adjustments are made to auto calibration and/or calibration factors based on
the front axle weight ranges. Once adjustments have been made, the live traffic is viewed to
ensure that the vehicles are weighing and classifying properly.
Next the GVW summary for Class 9 trucks is reviewed for each travel lane. Most sites have two
(2) peaks in the GVW distribution. The first peak represents unloaded trucks, which should fall
in the range from 25,000 to 35,000 pounds. The second peak, which ranges from 70,000 to
80,000 pounds, represents a typical loaded Class 9 truck. If the summary shows that the peaks

New Jersey Traffic Monitoring Program
Last Updated: June 5, 2014 Page | 8
are shifted from these ranges it is most likely due to the site being out of calibration. A second
check performed with the Class 9 GVW is an examination of the number (and/or percentage) of
vehicles that are heavier than 80,000 pounds. It is particularly important to look at the number
and percentage of Class 9 vehicles that weigh more than 95,000 pounds. If the percentage of
overweight vehicles, particularly vehicles that weigh more than 95,000 pounds, is high, the
controller’s calibration is questionable. This check is performed partly because when many
Piezo sensors begin to fail, they generate an almost flat GVW distribution. This results in an
extremely large (and inaccurate) ESAL computation for a given number of trucks. It is unusual
for Class 9 trucks to carry such heavy loads. In most cases, trucks legally carrying these heavy
weights are required to use additional axles, and they are classified as Class 10 or higher and do
not appear in the Class 9 GVW summary. While illegally loaded five-axle trucks may be
operating at the site in question, most illegally loaded trucks do not exceed the legal weight limit
by more than several thousand pounds, and the number (or percentage) of these extremely high
weights is usually fairly low. Thus, it is assumed that high percentages of extremely heavy Class
9 trucks are a sign of calibration or operational problems. Troubleshooting for GVW
irregularities is similar to the troubleshooting for front axle weights. The auto calibration and
calibration factors are reviewed for inconsistencies for lane in question and adjustments are made
remotely if applicable.
The site summary is reviewed for average GVW and average ESAL factors for each lane. These
numbers are tabulated and entered into a spreadsheet on a monthly basis. Each month is
compared to the previous month to ensure that the weights and factors have not shifted
significantly. If they have shifted significantly, it could be an indication of the site being out of
calibration.
FHWA TMG records produced each site include “C” cards for classification data, “W” cards for
weight data and a “V” for volume count. “C” cards summarize classification data by hour for
each lane. These cards are checked to ensure that there are no continuous rows of zeros (“0”
rows). If rows of zeros are found during a certain day for a lane and cannot be explained then
that day is considered “bad” and must be removed from the card for that direction of travel. The
“W” cards summarize the weight data for vehicle Class 4 to Class 13. Checks for “W” cards
include cutting out GVW weights ranging from 0 to 4,999 pounds. Once the “C” and “W” cards
have been checked then it is sorted by lane and loaded to the VTRIS data base for further check
and processing. In cases where classification for a certain direction was considered “bad”, “V”
cards are created for that direction. “V” cards summarize the volume by day for each lane.
Similar to classification checks, “V” cards are reviewed to ensure that there are no “0” rows. If
rows of zeros are found during a certain day for a lane then that day is considered “bad” and
must be removed from the card. Once the “V” card has been checked then it is sorted by lane
and loaded to TRADAS.
The BTDS participates in the Long Term Pavement Performance (LTPP) program. The LTPP
program was established to collect pavement performance data as one of the major research areas
of the Strategic Highway Research Program (SHRP). BTDS’s participation includes 10 LTPP
locations at eight (8) current WIM sites. Classification, weight, and volume data is processed for
these sites in the same manner as described above and then submitted to the LTPP’s regional

New Jersey Traffic Monitoring Program
Last Updated: June 5, 2014 Page | 9
consultant each month. Since 1991, the Federal Highway Administration (FHWA) has
continued the management and funding of the program.
E. System Calibration
Before a site is calibrated, it must be tested to show that the WIM components have passed
testing requirements. These tests include:
a. Measuring the inductance of each loop. Ensure that inductance is within a range
consistent with four turns of loop detector wire. The ratio of loop detector inductance to
detector lead inductance must meet controller system vendor requirements.
b. Measuring and ensure that each piezo axle sensor produces a signal in conformance with
manufacturer and controller system vendor specifications.
c. Ensure that roadway sensors send signals to the on-site controller and the on-site
controller converts those signals into useable data. Verify data through site observation
using the real time review capabilities of the system. Ensure the loops and weight sensor
combination record correct vehicle classification and axle counts.
d. Ensure that signal from in-pavement temperature sensor are accurately received by the
system electronics in accordance with electronics system vendor specifications.
After the testing procedure is completed then the initial calibration can be performed. A Class 9
vehicle (three-axle tractor and two-axle semi-trailer) is used for the calibration. The truck must
have an air-ride suspension and is in good mechanical condition. It is loaded with a non-shifting
load so that the gross weight of the tractor-trailer combination is between 75,000 and 80,000
pounds.
The calibration truck is weighed on a certified, multi-draft public scale. the weights of the
steering axle, drive tandem axles and trailer tandem axles as well as the total gross weight of the
combination is recorded.
The calibration truck shall be driven over each lane for minimum of five (5) times and the axle
and GVW illustrated by the WIM system is recorded by each working sensor for each pass. The
average values among the five (5) passes are used to calculate the new calibration factor for each
working sensor.
Following the adjustment to the system by entering the new calibration factors for each working
sensor, the calibration truck shall be driven over each lane a minimum of another (3) times and
the axle and GVW as determined by the WIM system is recorded by each working sensor for
each pass. Average values among these three (3) passes are used to confirm the calibration
factor for each working sensor. After calibration, the average values recorded by the WIM
system should be within 10 percent of each axle weight (average axle weight of each axle
group); and within five (5) percent of the GVW of the combination of the weights recorded at the
public scale. If either value is not within these tolerances, the calibration factors are calculated,
entered into the WIM system, and the validation procedure as described above is repeated.

New Jersey Traffic Monitoring Program
Last Updated: June 5, 2014 Page | 10
If the system cannot be properly calibrated after two iterations of calibration factor updates, it
could be an indication of defective sensors, WIM electronics, of pavement condition. The
calibration process is then repeated once corrective actions have taken place.
The WIM system is then monitored for 14 consecutive days. The data produced during this
period is reviewed in accordance with the LTPP QA program. Once it has been determined that
the data has been recorded properly and the system components are working on a continuous
basis within the required specifications, then the system is accepted.

New Jersey Traffic Monitoring Program
Last Updated: June 5, 2014 Page | 11
CHAPTER 3: SHORT-TERM MONITORING PROGRAM
I. Background
The short-term traffic monitoring program for NJDOT is maintained by the BTDS. Short-term
coverage counts are conducted on roadways throughout the state to provide the geographic
coverage needed to understand the traffic characteristics of the state roadway system. The traffic
counting efforts associated with this program are conducted by three (3) different consultants in
accordance with the HPMS, TMG and NJDOT Guidelines for Data Programs. Currently, the
short-term monitoring program includes approximately 5,430 48-hour sites that are counted in a
three-year cycle period. In addition, approximately 400 “special” counts requested by NJDOT
engineers are performed each year as needed. Special counts can include volume, classification,
or turning movement counts at intersections. Seasonal adjustment factors derived from the
permanent continuous counts are used to adjust the short-term counts to arrive at AADT
estimates.
II. Standard Procedures
These standards shall apply to all short-term traffic monitoring activities conducted by or for the
NJDOT and/or its agents with the intent of guaranteeing the raw data gathered from traffic
monitoring activities undertaken by NJDOT and those undertaken as part of any contractual
agreement involving funds administered and/or provided by or through the FHWA and/or
NJDOT is in conformance with these standards established for traffic data collection.
Equipment Calibration/Testing of ATR and Automatic Vehicle Classification (AVC) equipment
must be conducted to ensure that the equipment is recording data accurately. Each machine
(ATR and AVC units) shall be tested at least once every three (3) years. The equipment test
site(s) shall have the following characteristics:
a. Traffic volume shall be greater than 5,000 vehicles per day per lane.
b. Roadway shall be straight with a grade less than three (3) percent.
c. Road surface shall have no ruts greater than ¾” with no severe potholes or other serious
surface distress.
There shall be no traffic signals, stop signs, or any impediment to continuous traffic flow.
ATR and AVC equipment using axle detectors (road tubes) for volume counting and vehicle
classification shall be installed and hourly data shall be collected for a continuous two (2) hour
period. A manual classification count will be conducted at the same time and the results will be
compared. A maximum error of 10 percent for axle detections, and an accurate classification of
90 percent of each class of vehicles are required for acceptable performance of each unit of
equipment.
Maintenance records shall be maintained and provided upon request.

New Jersey Traffic Monitoring Program
Last Updated: June 5, 2014 Page | 12
The following test documentation shall be supplied prior to the collection of any data:
a. Test site location and characteristics.
b. Testing procedure.
c. List of equipment by device type, manufacturer, model, serial number, achieved accuracy
(volume and/or classification), and dates of current and last tests.
d. Installation and operating procedures.
The duration of all ATR and AVC volume and classification counts shall be a minimum of 48
continuous hours. The entire 48-hour period shall fall within a normal workweek (12:01 PM
Monday through 12:00 Noon Friday) or a normal weekend (12:01 PM Friday through 12:00
Noon Monday). The weekend period is acceptable only for the purpose of identifying or
monitoring recreational or retail traffic. Weekend data shall not be used to estimate AADTs. No
part of any 48-hour count used for AADT estimation shall contain data collected within 36 hours
of any extended weekend resulting from a Federal, State, or local holiday unless the purpose is to
study holiday traffic. All non-typical conditions shall be avoided.
All data shall be collected by direction with a 15-minute recording interval. Recording shall
begin on the hour and end on the hour so that data files do not contain partial data for any hourly
subtotal. In the event that intervals less than one (1) hour are collected, summaries in that
interval shall not be submitted to BTDS and they shall not be considered as part of the 48-hour
count duration.
To ensure consistency in automatic traffic data collection, installation procedures shall be
defined, documented, and provided by all traffic monitoring agencies, firms, and agents.
Pneumatic road tubes shall be installed at a right angle to traffic across a lane or lanes. The outer
end shall be plugged. Clamps shall be affixed at the outer end, at the outside edge of pavement,
at the inner edge of pavement, and at the outer edge of a paved shoulder. Tubes shall be affixed
taut enough to guarantee minimum motion when crossed by vehicles. BTDS strongly
recommends mastic tape spaced at 12 to 24-inch intervals to minimize motion of tubes.
When utilizing two (2) tubes in the classification mode, both tubes shall be of the same age, type,
length, and tension. The tubes shall be spaced according to the specific roadside unit
requirements. Free-flow conditions are required for effective automatic vehicle classification.
Where conditions are not free-flow, or speeds are lower than 25 miles per hour, manual vehicle
classification counts (see below) are required to verify the accuracy of the electronic AVC
monitoring.
On multi-lane roadways with one-way volumes greater than 10,000 AADT, portable loops and
electronic axle sensors must be employed to collect classification data. On each side of the
roadway, no more than one lane shall be monitored for vehicle type classification per AVC
recorder and pair of tubes. On two-lane roads, one AVC recorder and pair of tubes shall be
installed on each side of the roadway. On four-lane roads with a suitable median, one (1)
additional four-channel AVC recorder or two (2) additional two-channel AVC recorders shall be
installed in the median to classify traffic in the lanes adjacent to that median.
New Jersey Traffic Monitoring Program
Last Updated: June 5, 2014 Page | 13
Pneumatic road tubes shall conform to the American Society for Testing and Materials (ASTM)
“Standard Specifications for Pneumatic Tubing for Roadway Traffic Counters and Classifiers”.
Recording units may be located on either side of the lane being monitored. The units shall be
chained to secure objects and be relatively free of risk from damage by vehicles, flooding, or
other hazards. In no case shall recording units be attached to or set on barrier curbs. Excess
tubing shall be routed away from the roadway, coiled, tied, and kept clear of potential snagging
or damage.
Whether the sensor is pneumatic or electronic, the installation site shall be carefully selected. No
sensor shall be placed in proximity to an intersection, driveway, or other vehicle maneuvering
location where travel is not at a right angle to the sensor.
No sensor shall be installed where the roadway surface has ruts greater than ¾” or severe
potholes.
When monitoring sites in residential neighborhoods, particular attention must be paid to
minimizing the effect of noise from traffic traveling over pneumatic tubes. Tubes should be
placed as far as possible from dwellings and securely fastened to avoid “bounce”. Mini-tubes
may be used if accurate counts can be obtained. If the site must be relocated to another block,
the Project Manager must be notified.
Upon completion of each monitoring session, and when the recorder is removed, all sensors,
clamps, nails, and other installation devices shall be removed from the site and reused or
properly discarded. Mastic or other adhesive tape may be cut and left affixed to the roadway.
However, pneumatic tubes and other sensor devices must be removed from the roadway
(including the roadside area) and taken away from the monitoring site.
All traffic monitoring locations shall be identified by unique traffic station identification
numbers. Prior to undertaking any traffic counts, BTDS shall be contacted to coordinate
activities and to obtain traffic station identification numbers.
Each count shall be described through the use of the NJDOT Standard Route Identifier (SRI)
including route number and name, link limits, milepost, direction of travel, functional
classification, municipality, and county.
All short-term count data, regardless of the equipment being used, shall be reported to BTDS
Project Manager in the standard FHWA Record Format; Type “S” for Station Description
Record, Type “3” format for Traffic Volume and Record Type “C” for Vehicle Classification
Records. Classification counts shall be based on the “Scheme F” vehicle classification categories
as defined in the TMG with Class 14 for unclassified vehicles. Transmittal shall be confirmed
through the NJDOT Project Manager and/or his/her designee. Count acceptance shall be
determined based upon the successful processing and editing of the raw count data. Counts that
are not acceptable for any reason shall be redone and resubmitted to NJDOT.

New Jersey Traffic Monitoring Program
Last Updated: June 5, 2014 Page | 14
Manual volume counts shall be employed for intersection turning movement data collection and
collection of classification data when vehicle speeds restrict the use of AVC equipment.
For counts that are to be used to develop 24-hour volumes, AADTs and Design Hourly Volumes
(DHVs), a minimum of eight (8) hours of data shall be collected between 10:00 AM and 6:00
PM. One hundred percent of every hour shall be counted except for two (2) 15-minute breaks
and one 30-minute lunch period. These breaks shall not be taken during the peak periods, at the
beginning of the first hour, or at the end of the last hour, and shall be noted on the data recording
sheet.
Counts are to be completed during a regular work week (12:01 PM Monday through 12:00 Noon
Friday). Counts completed during a weekend period (12:01 PM Friday through 12:00 Noon
Monday) are acceptable only for the purpose of identifying or monitoring recreational or retail
traffic.
Counts used for AADT or DHV estimation shall not contain data collected within 36 hours of
any extended weekend resulting from a Federal, State, or local holiday unless the purpose is to
study holiday traffic. All known or observed non-typical conditions shall be avoided.
Data shall be collected in 15-minute intervals. Recording shall begin on the hour and end on the
hour so that data files do not contain partial data for any hourly subtotal. No enumerator shall be
responsible to observe and record more than 12 separate data items when performing an
intersection turning movement count.
Manual classification counts, as with automatic equipment, shall be based on the “Scheme F”
vehicle classification categories.
All count and classification data shall be submitted to BTDS. Count summaries shall be
provided in 15-minute intervals as well as one (1) hour totals. Classified intersection counts
shall report volumes by classification plus total vehicles per interval. Intersection turning
movement counts shall be in an EXCEL spreadsheet format.
Counts shall indicate the project number, SRI including route number and street name,
municipality, county, date of count, day of week, start time, weather, times of breaks, and the
name of the enumerator(s). If NJDOT has pre-assigned a station identification number, it shall
also be indicated on the count record.
III. Geographic Information Systems (GIS)
GIS plays an important role in the location and date of each short-term count. Prior to using GIS
software, all short-term counts are entered into a Relationship Database Management System
(RDBMS). This database stores information on each count including such attributes as location
(milepost and latitude/longitude), type of count, functional class of roadway, latest AADT (by
direction if applicable), and date of last count. Based on which County or region will be studied,
the BTDS can extract information from the RDBMS and plot the short-term count locations on a
map using ArcGIS software.

New Jersey Traffic Monitoring Program
Last Updated: June 5, 2014 Page | 15
The GIS software is then used to visually review the locations of the short-term counts along the
roadways. Mapping count locations is a critical step in determining when each location should be
counted, as well as, determining the coverage of different road functional classes. For example,
the GIS can be used to illustrate what locations within a selected period of years are located in a
1-mile buffer. If a count location in question is adjacent to another count on the same road or
same functional class within this buffer, it can be determined that the location is considered
“covered” for that cycle year and can be counted in the next cycle year.

New Jersey Traffic Monitoring Program
Last Updated: June 5, 2014 Page | 16
CHAPTER 4: TRAFFIC DATA FORMATS
The data records for motorized data are divided into six types: station description data, traffic
volume data, speed data, vehicle classification data, weight data, and the per vehicle data format.
Each type of data has its own individualized record format. These formats have been developed
to provide input to national databases maintained by FHWA, including the Travel Monitoring
Analysis System (TMAS). Each record format has a specific length.
I. Station Description Data Format. The Station Description record format is needed for
reporting all data. The Station Description file contains one record per traffic monitoring
station, per direction, per lane (unless lanes are combined by the data collection device), per
year.
Example of Record Type “S” (Station Description Record) 213 card column ASCII format as
described below and Table 7-1 of the TMG, September 2013 edition.
S3400070B3113141T23H23F14T25C2QLL000000700000010610398940390748912330000
0000000000000Y000000000000Y300000070000000000NJ-70, MP 10.3, Evesham Twp.,
Burlington Co.
Field Columns Width Description Type
1 1 1 Record Type C
2 2-3 2 FIPS State Code C
3 4-9 6 Station ID C
4 10 1 Direction of Travel Code C
5 11 1 Lane of Travel C
6 12-15 4 Year of Data C
7 16-17 2 Functional Classification Code C
8 18 1 Number of Lanes in Direction Indicated C
9 19 1 Sample Type for TMAS C
10 20 1 Number of Lanes Monitored for Traffic Volume C
11 21 1 Method of Traffic Volume Counting C
12 22 1 Number of Lanes Monitored for Vehicle Class C
13 23 1 Method of Vehicle Classification C/O
14 24 1 Algorithm for Vehicle Classification C/O
15 25-26 2 Vehicle Classification Groupings C/O
16 27 1 Number of Lanes Monitored for Truck Weight C
17 28 1 Method of Truck Weighing C/O

New Jersey Traffic Monitoring Program
Last Updated: June 5, 2014 Page | 17
Field Columns Width Description Type
18 29 1 Calibration of Weighing System C/O
19 30 1 Method of Data Retrieval C
20 31 1 Type of Sensor C
21 32 1 Second Type of Sensor O
22 33 1 Primary Purpose C
23 34-93 60 LRS Identification C
24 94-101 8 LRS Location Point C
25 102-109 8 Latitude C
26 110-118 9 Longitude C
27 119-122 4 LTPP Site Identification O
28 123-128 6 Previous Station ID O
29 129-132 4 Year Station Established C
30 133-136 4 Year Station Discontinued O
31 137-139 3 FIPS County Code C
32 140 1 HPMS Sample Type C
33 141-152 12 HPMS Sample Identifier C/O
34 153 1 National Highway System C
35 154-155 2 Posted Route Signing C
36 156-163 8 Posted Signed Route Number C
37 164-213 50 Station Location O
Note: C=Critical, C/O=Critical/Optional, O=Optional Source: FHWA September 2013 TMG
II. Hourly Traffic Volume Data Format. The Hourly Traffic Volume Record format is a
fixed length, fixed field record. Each record contains a field for traffic volume occurring
during each of the 24 hours of that day. Blank fill the columns used for any hours during
which no data is being reported.
Example of Record Type “3” (Hourly Traffic Volume Record) 143 card column ASCII format as
described below and Table 7-9 of the TMG, September 2013 edition.
3341400070B311010111001780027300140000890004900038000600007400131002790044400
5730077300738008540084100854007780071700571004880033500258001980

New Jersey Traffic Monitoring Program
Last Updated: June 5, 2014 Page | 18
Field Columns Width Description Type
1 1 1 Record Type C
2 2-3 2 FIPS State Code C
3 4-5 2 Functional Classification C
4 6-11 6 Station Identification C
5 12 1 Direction of Travel C
6 13 1 Lane of Travel C
7 14-17 4 Year of Data C
8 18-19 2 Month of Data C
9 20-21 2 Day of Data C
10 22 1 Day of Week C
11 23-27 5 Traffic Volume Counted, after 00:00 – to
01:00
O
12 28-32 5 Traffic Volume Counted, after 01:00 – to
02:00
O
13 33-37 5 Traffic Volume Counted, after 02:00 – to
03:00
O
14 38-42 5 Traffic Volume Counted, after 03:00 – to
04:00
O
15 43-47 5 Traffic Volume Counted, after 04:00 – to
05:00
O
16 48-52 5 Traffic Volume Counted, after 05:00 - to 06:00 O
17 53-57 5 Traffic Volume Counted, after 06:00 – to
07:00
O
18 58-62 5 Traffic Volume Counted, after 07:00 – to
08:00
O
19 63-67 5 Traffic Volume Counted, after 08:00 – to
09:00
O
20 68-72 5 Traffic Volume Counted, after 09:00 – to
10:00
O
21 73-77 5 Traffic Volume Counted, after 10:00 – to
11:00
O
22 78-82 5 Traffic Volume Counted, after 11:00 – to
12:00
O
23 83-87 5 Traffic Volume Counted, after 12:00 - to 13:00 O

New Jersey Traffic Monitoring Program
Last Updated: June 5, 2014 Page | 19
Field Columns Width Description Type
24 88-92 5 Traffic Volume Counted, after 13:00 – to
14:00
O
25 93-97 5 Traffic Volume Counted, after 14:00 – to
15:00
O
26 98-102 5 Traffic Volume Counted, after 15:00 - to 16:00 O
27 103-107 5 Traffic Volume Counted, after 16:00 – to
17:00
O
28 108-112 5 Traffic Volume Counted, after 17:00 – to
18:00
O
29 113-117 5 Traffic Volume Counted, after 18:00 - to 19:00 O
30 118-122 5 Traffic Volume Counted, after 19:00 – to
20:00
O
31 123-127 5 Traffic Volume Counted, after 20:00 – to
21:00
O
32 128-132 5 Traffic Volume Counted, after 21:00 – to
22:00
O
33 133-137 5 Traffic Volume Counted, after 22:00 – to
23:00
O
34 138-142 5 Traffic Volume Counted, after 23:00 – to
24:00
O
35 143 1 Restrictions C
Note: C=Critical, C/O=Critical/Optional, O=Optional Source: FHWA September 2013 TMG
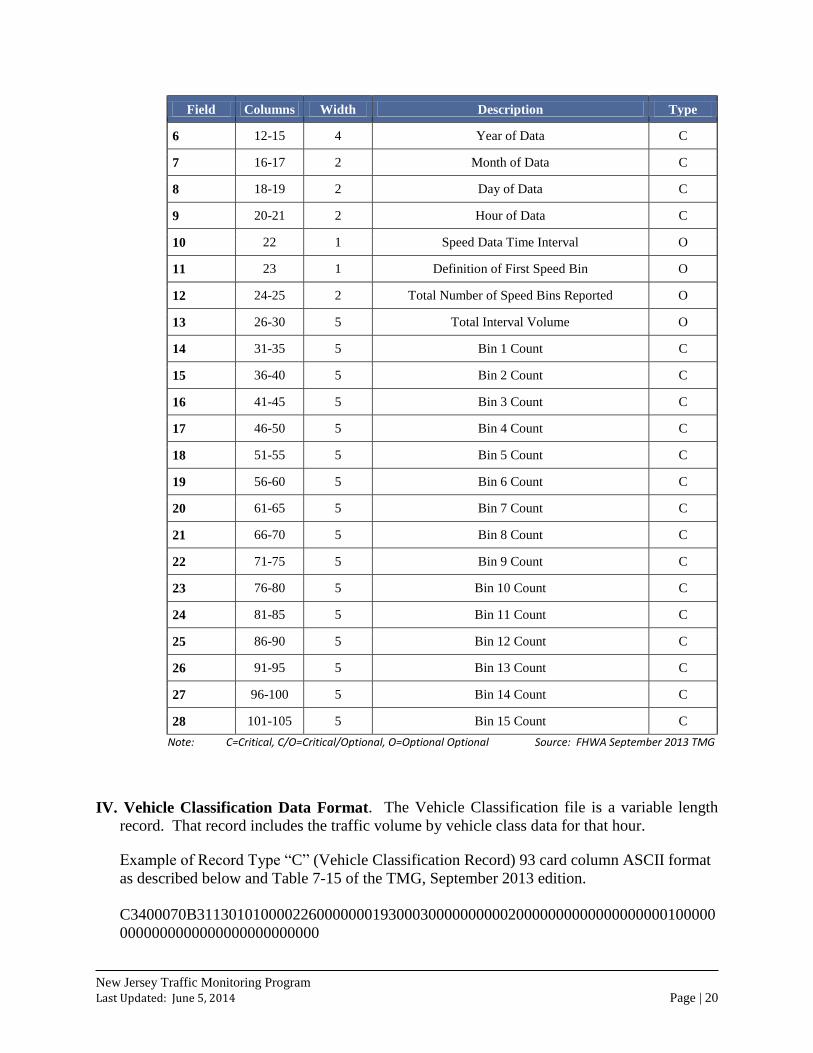
III. Speed Data Format. The speed data file format is a variable length record used to report
the number of vehicles traveling in specified 5 mph speed bins during specified time periods.
The speed data format must have a minimum of 15 bins up to a maximum of 25 bins. The
first speed bin includes all vehicles traveling 20 mph or slower. The second speed bin is then
defined as all vehicles traveling faster than 20 mph but less than or equal to 25 mph. The last
of the fifteen speed bins is defined as all vehicles traveling faster than 85 mph.
Field Columns Width Description Type
1 1 1 Record Type C
2 2-3 2 FIPS State Code C
3 4-9 6 Station ID C
4 10 1 Direction of Travel Code C
5 11 1 Lane of Travel C
New Jersey Traffic Monitoring Program
Last Updated: June 5, 2014 Page | 20
Field Columns Width Description Type
6 12-15 4 Year of Data C
7 16-17 2 Month of Data C
8 18-19 2 Day of Data C
9 20-21 2 Hour of Data C
10 22 1 Speed Data Time Interval O
11 23 1 Definition of First Speed Bin O
12 24-25 2 Total Number of Speed Bins Reported O
13 26-30 5 Total Interval Volume O
14 31-35 5 Bin 1 Count C
15 36-40 5 Bin 2 Count C
16 41-45 5 Bin 3 Count C
17 46-50 5 Bin 4 Count C
18 51-55 5 Bin 5 Count C
19 56-60 5 Bin 6 Count C
20 61-65 5 Bin 7 Count C
21 66-70 5 Bin 8 Count C
22 71-75 5 Bin 9 Count C
23 76-80 5 Bin 10 Count C
24 81-85 5 Bin 11 Count C
25 86-90 5 Bin 12 Count C
26 91-95 5 Bin 13 Count C
27 96-100 5 Bin 14 Count C
28 101-105 5 Bin 15 Count C
Note: C=Critical, C/O=Critical/Optional, O=Optional Optional Source: FHWA September 2013 TMG
IV. Vehicle Classification Data Format. The Vehicle Classification file is a variable length
record. That record includes the traffic volume by vehicle class data for that hour.
Example of Record Type “C” (Vehicle Classification Record) 93 card column ASCII format
as described below and Table 7-15 of the TMG, September 2013 edition.
C3400070B31130101000022600000001930003000000000020000000000000000000100000
0000000000000000000000000

New Jersey Traffic Monitoring Program
Last Updated: June 5, 2014 Page | 21
Field Columns Width Description Type
1 1 1 Record Type C
2 2-3 2 FIPS State Code C
3 4-9 6 Station ID C
4 10 1 Direction of Travel Code C
5 11 1 Lane of Travel C
6 12-15 4 Year of Data C
7 16-17 2 Month of Data C
8 18-19 2 Day of Data C
9 20-21 2 Hour of Data C
10 22 1 Classification Data Time Interval O
11 23-27 5 Total Interval Volume C
12 28 1 Restrictions C
13 29-33 5 Class 1 Count C
14 34-38 5 Class 2 Count C
15 39-43 5 Class 3 Count C/O
16 44-48 5 Class 4 Count C/O
17 49-53 5 Class 5 Count C/O
18 54-58 5 Class 6 Count C/O
19 59-63 5 Class 7 Count C/O
20 64-68 5 Class 8 Count C/O
21 69-73 5 Class 9 Count C/O
22 74-78 5 Class 10 Count C/O
23 79-83 5 Class 11 Count C/O
24 84-88 5 Class 12 Count C/O
25 89-93 5 Class 13 Count C/O
Note: C=Critical, C/O=Critical/Optional, O=Optional Optional Source: FHWA September 2013 TMG
V. Weight Data Format. Each file submitted in this format contains one record for each
vehicle. Each record describes the vehicle’s axle weights and axle spacings. As a reminder,
all weight data is to use English units.
Example of Record Type “W” (Weight Record) 147 card column ASCII format as described
below and Table 7-17 of the TMG, September 2013 edition.
W3400070B311301010009 039905060040087013084094082012084
Field Columns Width Description Type
1 1 1 Record Type C
2 2-3 2 FIPS State Code C
3 4-9 6 Station ID C
4 10 1 Direction of Travel Code C
5 11 1 Lane of Travel C

New Jersey Traffic Monitoring Program
Last Updated: June 5, 2014 Page | 22
Field Columns Width Description Type
6 12-15 4 Year of Data C
7 16-17 2 Month of Data C
8 18-19 2 Day of Data C
9 20-21 2 Hour of Data C
10 22-23 2 Vehicle Class C
11 24-26 3 Open O
12 27-32 6 Total Weight of Vehicle C
13 33-34 2 Number of Axles C
14 35-39 5 Axle Weight 1 C
15 40-43 4 Axles 1-2 Spacing C
16 44-48 5 Axle Weight 2 C
17 49-52 4 Axles 2-3 Spacing C/O
18 53-57 5 Axle Weight 3 C/O
19 58-61 4 Axles 3-4 Spacing C/O
20 62-66 5 Axle Weight 4 C/O
21 67-70 4 Axles 4-5 Spacing C/O
22 71-75 5 Axle Weight 5 C/O
23 76-79 4 Axles 5-6 Spacing C/O
24 80-84 5 Axle Weight 6 C/O
25 85-88 4 Axles 6-7 Spacing C/O
26 89-93 5 Axle Weight 7 C/O
27 94-97 4 Axles 7-8 Spacing C/O
28 98-102 5 Axle Weight 8 C/O
29 103-106 4 Axles 8-9 Spacing C/O
30 107-111 5 Axle Weight 9 C/O
31 112-115 4 Axles 9-10 Spacing C/O
32 116-120 5 Axle Weight 10 C/O
33 121-124 4 Axles 10-11 Spacing C/O
34 125-129 5 Axle Weight 11 C/O
35 130-133 4 Axles 11-12 Spacing C/O
36 134-138 5 Axle Weight 12 C/O
37 139-142 4 Axles 12-13 Spacing C/O
38 143-147 5 Axle Weight 13 C/O
Note: C=Critical, C/O=Critical/Optional, O=Optional Optional Source: FHWA September 2013 TMG

New Jersey Traffic Monitoring Program
Last Updated: June 5, 2014 Page | 23
CHAPTER 5: DATABASE MAINTENANCE
Traffic Volume and Classification data from TVS, WIM and short-term coverage counts are
processed with TRADAS (Traffic data system) software from High Desert Traffic LLC.
TRADAS is used in processing, editing, summarizing, storing and reporting traffic data. The
software analyzes and generates monthly and annual statistics of classification and volume data.
It is a self-contained package consisting of an Oracle database and a processing application.
A second database called TMSCENTRAL is used as the backbone for the bureau’s Intranet and
Internet applications. TMSCENTRAL is an in-house designed program that supports our
internet search engine “Data Viewer” and raw data upload. TMSCENTRAL stores directional
AADTs, Hourly Peak Volumes (short term counts only), and hourly per lane vehicle
classification data from continuous (permanent) stations. TMSCENTRAL contains location
details including linear (Standard Road Identifier SRI and Mile Post) and spatial (longitude and
latitude) coordinates. In addition, every location is linked with a set of images.
CHAPTER 6: TRUTH-IN-DATA NARRATIVE
The "Truth-in-Data" narrative describes the basis of the derivation of AADT, K-factors, D-
factors, percent single unit commercial vehicles, and percent combination commercial vehicles.
AADT – is the Annual Average Daily Traffic and represents all days of the reporting year for
traffic on a section of road.
AADT_Single_Unit – is the Annual Average Daily Traffic for single-unit trucks and buses. This
item requires detailed vehicle classification data and includes FHWA vehicle classes 4-7. It is
reported as the volume for all single-unit activity over all days of the week and seasons of the
year in terms of the annual average daily traffic.
Pct_Peak_Single – is the number of single-unit trucks and buses traveling on a section of road
during the peak hour, divided by the AADT. This item requires hourly directional detailed
vehicle classification data and includes FHWA vehicle classes 4-7.
AADT_Combination – is the Annual Average Daily Traffic for Combination Trucks. This item
requires detailed vehicle classification data and includes FHWA vehicle classes 8-13.
Pct_Peak_Combination – is the percent of peak combination trucks traveling on a section of road
during the peak hour. This item requires hourly directional detailed vehicle classification data
and includes FHWA vehicle classes 8-13.
K_Factor – is the peak hour volume (i.e., 30th highest hourly volume) expressed as a percentage
of total AADT developed from hourly ATR data.
Dir_Factor – is the percent of peak hour volume flowing in the peak direction.

New Jersey Traffic Monitoring Program
Last Updated: June 5, 2014 Page | 24
The duration of coverage volume and classification counts shall be a minimum of 48 continuous
hours. The entire 48-hour period shall fall within a normal workweek (12:01 PM Monday
through 12:00 Noon Friday) or a normal weekend (12:01 PM Friday through 12:00 Noon
Monday). As each 48-hour short-term count file is processed, the highest hourly volume
(averaged over the weekdays included in the count) is identified. The K & D (directional)
factors are calculated after application of the monthly pattern factor and the axle correction factor
that produce the AADT estimate. The percentage of that high hourly volume traveling in the
higher direction is the D-factor.
Daily adjustment factors from continuous count data are calculated for each day of the week
during annual processing in order to estimate the AADT for short-term counts. For a given
month, the daily adjustment factor for a given day of the week is calculated as:
where i ranges from 1 to 7
MADT is the Monthly Average Daily Traffic which is the average of the resulting day-of-week averages.
MAWDT is the Monthly Average Weekday Traffic which is the average of Monday through Thursday.
MAWET is the Monthly Average Weekend Traffic which is the average of Saturday and Sunday.
Seasonal adjustment factors from continuous count data are used to adjust short-term count
volumes for seasonal variation. At present, seasonal adjustment factors are calculated on a
month-by-month basis, and the term “monthly adjustment factor” is synonymous with “seasonal
adjustment factor,” and the acronym MAF is used in both cases. The seasonal adjustment factor
for each of the four (4) regional pattern groups for a given month is calculated as:
For Short-term counts, the calculated AADT estimate is derived in the following manner: Each
24-hour volume (complete day, 0:00-24:00 hours) recorded in each direction over the minimum
48-hour period is multiplied to the day-of-week and axle correction (if appropriate) factors
associated with the month and day of week of the count.
Axle correction factors are developed from the classification data. Individual factors are
developed for each functional in each region classification. Classification data is collected from
continuous WIM, AVC and Major stations throughout the state.
The continuous counting stations and Major Stations in each of the New Jersey’s four (4) regions
group is used in calculating seasonal and axle correction factors. Instead of one table using
statewide factors, each region has a table of factors to use. Adjustment factors are developed for
data collection sites within each group and used to adjust short-term data that are collected at
locations within the group.

New Jersey Traffic Monitoring Program
Last Updated: June 5, 2014 Page | 25
Average truck percentages are determined from continuous WIM, AVC and Major Station sites
for each functional class of roadway in each of the four (4) regions. FHWA vehicle classes 4 to
7 are considered as Single Unit Trucks and classes 8 to 13 are Combination Trucks.
Validity- Quality Checks (QC)
Volume Count:
Axle Factor Threshold- created from the classification data, applied to volume data.
Typical values for this parameter to be .38 to .48.
QC if the peak hour volume is greater than 20% (1/5 P
thP) of the daily volume.
QC if difference of 20% between the current ADT generated and the prior ADT for short-
term data.
Dir_Factor:
Dir_Factor is 100% for only one-way roads;
Dir_Factors are over 80% for two-way roadways
Classification Data:
QC if there are more class 3s than class 2s.
QC if there are more class 8s than class 9s.
QC if percentage of class 5 count is more than 5% of the ADT.
AADT_Single_Unit:
AADT_Single_Unit > 50% of AADT
AADT_Single_Unit + AADT_Combination > AADT
Pct_Peak_Single Unit:
If (Pct_Peak_Single/100) × AADT > AADT_Single_Unit, there is an error.
AADT_Combination:
AADT_Combination > 50% of AADT
Pct_Peak_Combination:
If (Pct_Peak_Combination/100) > AADT_Combination, there is an error
Truck Weight Data (Weigh-in-Motion) systems and applied only to class 9 vehicles:
Average Steering Axle Weight at a daily level to be 8,000 lbs to 12,000 lbs.
Gross vehicle peaks at 1st, 25,000 lbs to 35,000 lbs and 2nd at 70,000 to 80,000 lbs.

New Jersey Traffic Monitoring Program
Last Updated: June 5, 2014 Page | 26
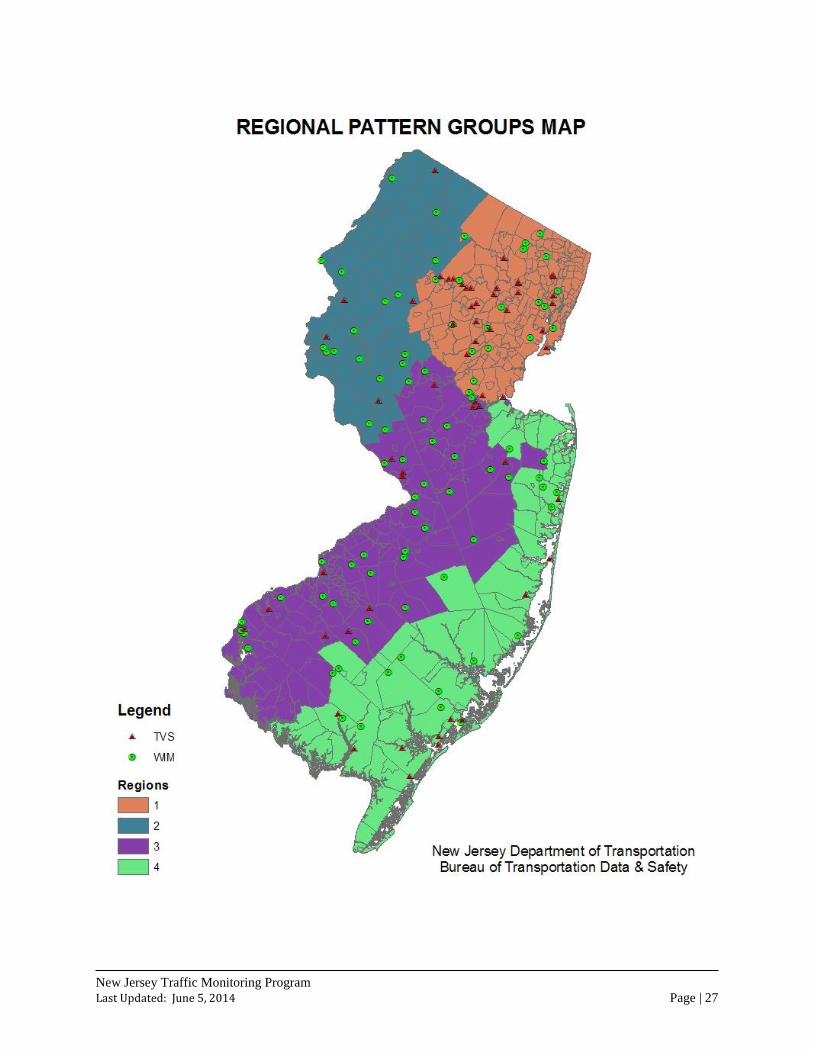
CHAPTER 7: REGIONAL PATTERN GROUPS
There are four (4) regional pattern groups used in New Jersey based on the similarity of traffic
conditions.
Region 1: Traffic in urban Northeastern New Jersey- New York area that serve major
industries, warehousing, trucking, logistics and through–truck movements.
Region 2: Traffic in rural Northwestern section of New Jersey – Pennsylvania – New York area
that serve local truck traffic, agricultural, retail and manufacturing with winter
season recreational activities and various camping sites during summer.
Region 3: Traffic in Central and Southern New Jersey that serve pharmaceutical companies,
retail, warehousing, agricultural and through–truck movements.
Region 4: Traffic serving the NJ shore, recreational and beach activities including fishing,
boating and Atlantic City casinos. This region experiences high traffic during
summer time and on summer weekends only.
Each of the four (4) Regions have seven (7) factor groups based on the new standard roadway
functional classification used in HPMS. Functional classification is the grouping of highways,
roads and streets by the character of service they provide and as follows.
Code Functional Classification
1 Interstate
2 Principal Arterial – Other Freeways and Expressways
3 Principal Arterial – Other
4 Minor Arterial
5 Major Collector
6 Minor Collector
7 Local
New Jersey Traffic Monitoring Program
Last Updated: June 5, 2014 Page | 27

New Jersey Traffic Monitoring Program
Last Updated: June 5, 2014 Page | 28
CHAPTER 8: INFRASTRUCTURE RENEWAL PROGRAM
Continuous truck weight and vehicle-type classification data collection are fundamental
components of the congressionally mandated Traffic Monitoring System. Data obtained through
these systems is also essential to the Pavement Management System, particularly with the
implementation of the new Mechanistic Empirical Pavement Design Guide. To ensure all WIM
and TVS systems are working properly, the BTDS manages a federally funded construction
contract called the TMS Infrastructure Renewal Program. This program is used to maintain,
upgrade, and install new WIM and TVS sites.
Repairs to existing sites performed by the selected contractor normally consist of, but are not
limited to, replacement of defective piezo sensors, loop detectors, defective temperature sensors,
or installing non-invasive traffic monitoring technology. Complete installations consist of
installing piezo sensors, loop detectors, foundations, junction boxes, conduits, electrical service,
telephone service, cabinets, and other related construction activities as may be required to install
a completely functional Traffic Monitoring System, WIM, TVS and Virtual Weigh Station
(VWS).
A Virtual Weigh Station is a sub-system of a WIM System that weighs and measures vehicles
automatically and provides vehicle record information to an authorized user either locally or
remotely for enforcement of commercial vehicle and traffic data analysis. The vehicle record
information is provided via a wireless network communication service. There are 20 WIM sites
that were upgraded to VWS used in conjunction by state police for truck weight enforcement.
VWS operates with other components of a WIM including the WIM axle weight sensors,
inductive loops, controller electronics and cabinet.
Installation and maintenance contract for WIM and TVS sites is done in accordance with the
provisions of the NJDOT Specification for Road and Bridge Construction and available on the
NJDOT webpage:
http://www.state.nj.us/transportation/eng/elec/ITS/itsenglishjuly2001/

New Jersey Traffic Monitoring Program
Last Updated: June 5, 2014 Page | 29
APPENDIX A: FHWA 13 CLASS SCHEME GRAPHIC
Source: Federal Highway Administration (TMG 2013).
New Jersey Traffic Monitoring Program
Last Updated: June 5, 2014 Page | 30
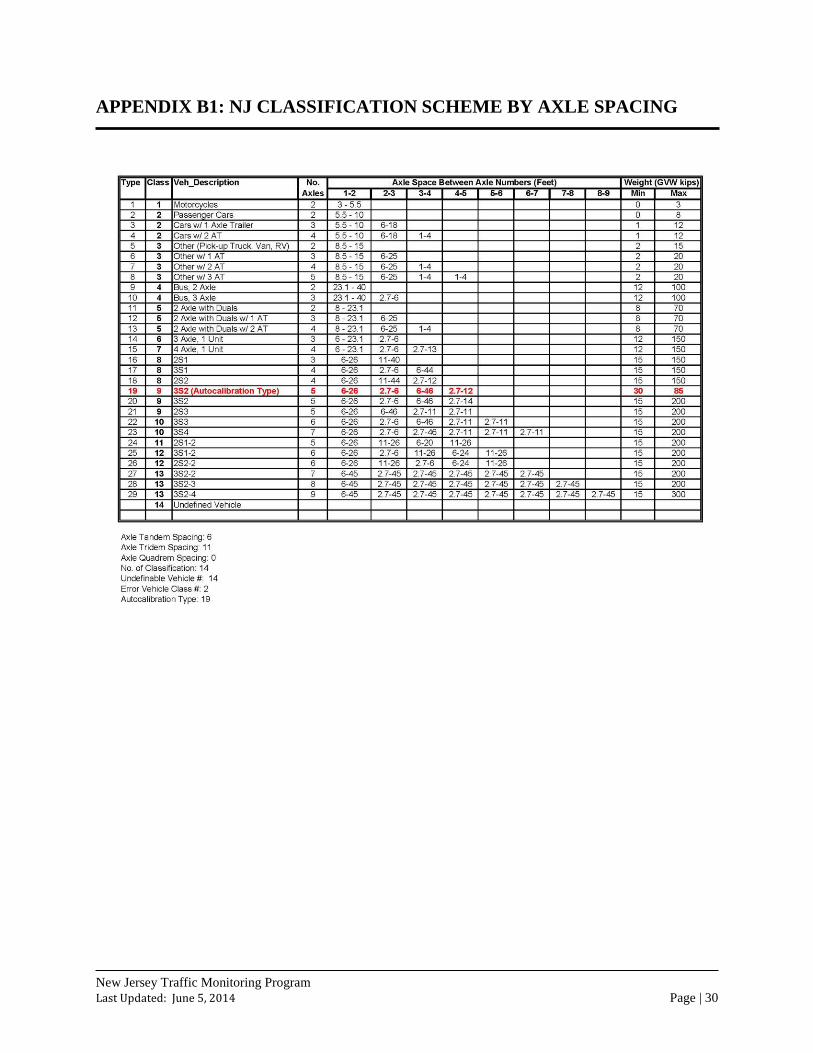
APPENDIX B1: NJ CLASSIFICATION SCHEME BY AXLE SPACING
New Jersey Traffic Monitoring Program
Last Updated: June 5, 2014 Page | 31
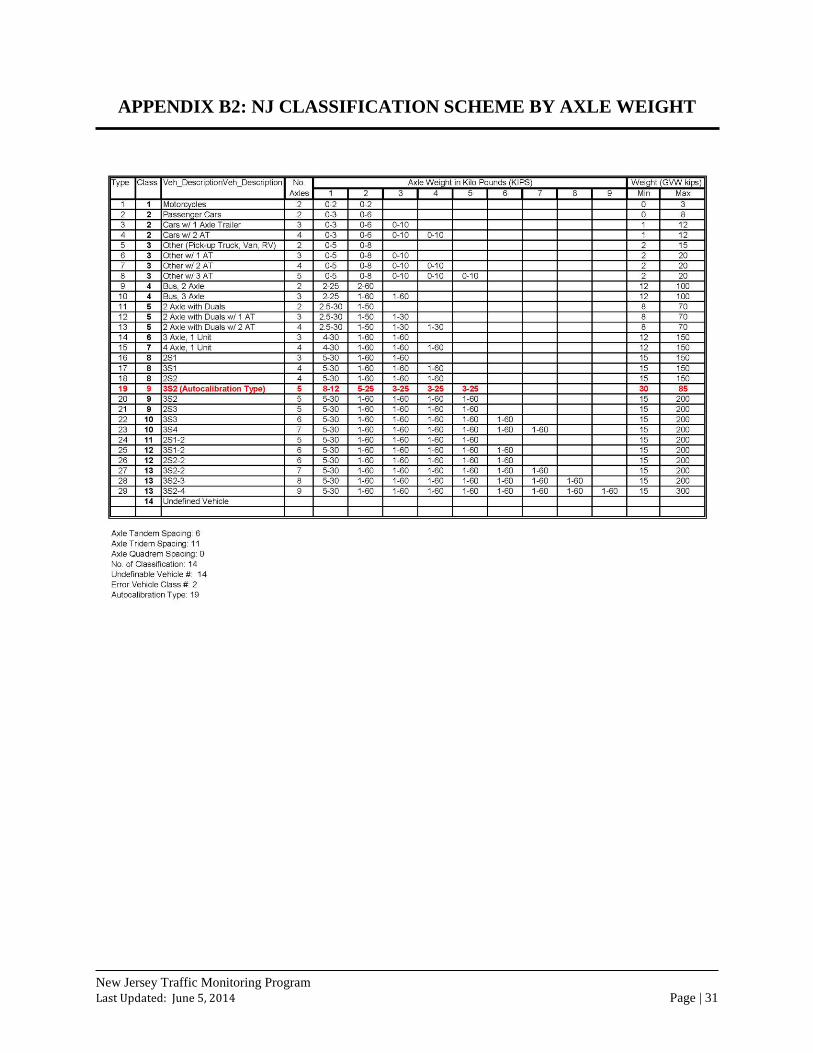
APPENDIX B2: NJ CLASSIFICATION SCHEME BY AXLE WEIGHT

New Jersey Traffic Monitoring Program
Last Updated: June 5, 2014 Page | 32
If you have questions or concerns please contact us at:
New Jersey Department of Transportation
Bureau of Transportation Data & Safety
7th Floor, E&O Bldg.
1035 Parkway Avenue, Trenton, NJ 08625
Phone: (609) 530-3508
E-Mail: [email protected]


